Embed Size (px)
Citation preview

J Glob Bus Trade Vol 9 No 2 (November 2013) 1-9
1
ISSN 1946-5130
Journal of Global Business and Trade
wwwiagbtcom
Negotiation Factors and Culture in Trade Negotiations
Shin-Kyuo Lee Department of International Trade Paichai University South Korea
Received 30 July 2013 Revised 19 September 2013 Accepted 24 October 2013
ABSTRACT
This study specially explored perceived importance of factors affecting international trade negotiations such
as environmental factors process measures and outcome measures and compared the cultural differences in
non-verbal factors in international trade negotiations In order to find out cultural differences in negotiations
three different culture groups of Korean Chinese and European negotiators participated in international trade
negotiation experiments Results demonstrated that Korean negotiators interrupted more than Chinese and
European negotiators European negotiators used more facial gazing and touching strategies in trade
negotiations
Keywords environmental factors outcome measures process measures trade negotiation
Ⅰ Introduction1
Negotiation across cultures is occurring more often
today than ever before In whatever else goes on
during a negotiation parties attempt to manage their
differences and reach agreements through exchanges
of messages that make up sequences of moves and
counter-moves Negotiation is a critical business process
as it is necessary whenever people are dependent on
one another for accomplishing objectives National
cultural differences in negotiation behavior have been
catalogued
In international business negotiations cultural
differences are inevitable between negotiators from
different countries Cultural values can influence
international business negotiations in significant and
unexpected ways from the first to the last stage of a
2013 International Academy of Global Business and Trade
All rights reserved
negotiation The diversity of values of partners results
in different approaches used in the negotiation process
and variable expected outcomes Successful interna-
tional business negotiation is not guaranteed by
practical negotiation tips only In fact it would be
more useful for negotiators if the most critical success
factors of international business negotiations in a
particular culture could be identified in advance
Increasing globalization has resulted in an
increased volume of face-to-face negotiations between
members of different cultures Expatriate managers are
often required to negotiate with host country residents
on a variety of issues such as securing resources
arranging for transportation of goods and securing and
maintaining an effective workforce
Culture has a profound impact on how people in
the marketplace perceive and behave The level of
aggregation of this conduct however has always been
somewhat problematic In the realm of international
Negotiation Factors and Culture in Trade Negotiations
2
marketing culture has been typically visualized at the
national level However operationalization within the
national context has been difficult because of a wide
divergence of definitions each reflecting different
paradigms from varying disciplines
Many studies on international business negotiations
conclude that people of different cultures use signify-
cantly different negotiation approaches These different
approaches include communication style used persuasion
strategies employed and protocols followed While
negotiation studies emphasize possible differences in
the way conflict is viewed and managed little attention
had been paid to differences in reacting to cross-
cultural conflicts in negotiations Yet the handling of
conflict is critical to any effective cross-cultural
negotiations How the parties respond to conflict also
depends on a number of factors including the nature of
the conflict the cultural orientation of the individuals
and the affiliation of the parties It is clear that how the
parties perceive respond to and choose to resolve
conflicts is critical to the success of any long-term
business relationship The purpose of this study is to
present some factors affecting international trade
negotiations and to compare cultural differences
among Korean Chinese and European business nego-
tiators by analyzing their negotiation behaviors
Ⅱ Negotiation Variables
21 Environmental Factors
Grumperz (1979) suggests that humans while
interacting also provide stylistic signals for interpret-
tation of verbal communications through the use of
what he calls contextualization cues An example of a
contextualization cue might be a rise in tone of voice to
indicate or underline an important point Grumperz and
his associates have also found that contextualization
cues vary across cultures They are behaviors learned
in the course of the individualrsquos socialization Further
he suggests that differences in these cues are often the
cause of misunderstandings which can have serious
consequences in cross-cultural interactions
Elements of conversational form that have been
found to vary across cultures are legion For example
Graham (1985) reports Brazilian negotiators appear to
have more aggressive conversation than Japanese or
American negotiators In simulated negotiations
Brazilians used the words lsquonorsquo and lsquoyoursquo more
frequently the former providing a negative tone the
latter providing a presumptuous tone vis-a-vis the
Japanese and American behaviors The Brazilian
nonverbal behaviors also differed from the Japanese
and Americans no silent periods and far more
interruptions and facial gazing occurred
A variety of situational factors might act as
determinants of outcomes of business negotiations for
example company goals location and number of
parties Culture has been a difficult concept to deal
with in any consistent scientific way A culture is a
configuration of learned behaviors and results of
behavior whose component parts are shared and
transmitted by the members of a particular society
(Linton 1945) The important part of the definition for
present research is the idea that behaviors are shared by
members of a particular culture According to Spiro
(1950) members of a given society behave in uniform
and predictable ways In addition to bargaining
behaviors being consistent within cultures several
authors have suggested that negotiations processes
differ across cultures
22 Process Measures
Representational communications involve the
transmission of information whereas instrumental
communications involve influencing another party
Representational communications can be regarded as a
problem-solving approach It involves an emphasis on
questions and getting information from a counterpart
about needs and preferences The focus is on
cooperation and an integrative approach whereby the
needs of both parties are honestly discussed and
eventually satisfied Therefore it can be defined
concisely as a set of negotiation behaviors that are
cooperative integrative and information-exchange-
oriented
J Glob Bus Trade Vol 9 No 2 (November 2013) 1-9
3
Attractiveness Power and Credibility might also
be conceived of as the three classic source charac-
teristics in communication models Some researchers
suggest ldquothe relationship between attraction to a source
(like dislike friendly feelings etc) and attitude change
has received scant attention Rubin and Brown (1975)
conclude that interpersonal attraction enhances nego-
tiating outcomes Therefore to the extent that a person
receives rewards from a relationship with someone a
negotiator perceives as attractive that person will be
more satisfied with the negotiation outcome In this
study rather than characteristics ascribed to sources of
communication these variables are considered descrip-
tors of negotiation strategies These variables are
measured through ratings of both participants in the
negotiation games
Impression Formation Accuracy has also been
conceived as an individual characteristic or ability It is
believed that a strong relationship between salesperson
performance and abilities to perceive both a customerrsquos
beliefs about products and importance weights for
product attributes Impression formation accuracy is
treated as a measure of the efficiency of the interaction
rather than an individual characteristic
The problem-solving approach (PSA) for business
negotiation is defined as a set of negotiation behaviors
that are cooperative integrative and information
exchange-oriented PSA involves an emphasis on
questions and getting information from clients about
their needs and preferences The problem solving
approach in negotiations involves first an emphasis on
questions and getting information from clients about
their needs and preferences Second once the clientrsquos
requirements and circumstances are fully understood
then the negotiator accommodates the offering to the
clientrsquos needs The focus is on cooperation and an
integrative approach wherein the needs of both parties
are honestly discussed and eventually satisfied A PSA
can be concisely defined as a set of negotiation
behaviors which are cooperative integrative and
information-exchange oriented Such strategies tend to
maximize the number of alternative solutions consi-
dered thus allowing negotiators to optimize outcomes
The relationship between a problem-solving approach
and negotiation outcome has been frequently investi-
gated during the last twenty years Different resear-
chers have used various labels for the PSA concept
(eg integrative bargaining strategies-Walton amp
McKersie (1965) cooperative orientation -Rubin amp
Brown (1975) Williams (1983) Problem-solving
orientation-Pruitt amp Lewis (1975) Murray (1986))
Most of findings have been relatively consistent
Generally the PSA has been found to positively
influence negotiation outcomes Graham (1986)
investigated relationships between the PSA and a
negotiatorrsquos individual profit and their bargaining
partnerrsquos satisfaction Consistent with several studies
reviewed by Rubin and Brown (1975) statistically
significant relationships were discovered between a
negotiatorrsquos PSA and the negotiatorrsquos individual profit
Negotiators who encourage partners to provide
information about themselves and their needs and
preferences can be expected to achieve more favorable
negotiation outcomes Rubin and Brown (1975) and
Weitz (1979) suggest the importance of adjusting
onersquos negotiating tactics according to onersquos impre-
ssions of the opponentrsquos negotiation style Specially
Weitz suggests that adaptive behavior will enhance
negotia-ting effectiveness Rubin and Brown posit high
adaptability coupled with cooperativeness will favor
higher negotiation outcomes
In addition to the negotiating strategies inter-
personal attractions such as like or dislike and friendly
or unfriendly feelings can strongly influence current
negotiation outcomes and the success of future
transactions Simons Berkowitz and Moyer (1970)
suggest the relationship between attraction to a source
such as like or dislike friendly or unfriendly feeling
and attitude change has received scant attention Rubin
and Brown (1975) conclude in their review of the
negotiation literature that generally interpersonal attrac-
tion enhances negotiating outcomes A negotiating
partnerrsquos satisfaction has been found to be positively
related to a negotiatorrsquos attractiveness for business
people from France and Germany (Campbell et al
Negotiation Factors and Culture in Trade Negotiations
4
1988) from America Taiwan Japan and Korea
(Grahametal 1988)
In the very relevant field of buyerseller interact-
tions Evansrsquo (1963) similarity hypothesis posits that
the more similar individuals are in buyerseller
relationships the more favorable will be the outcome
and the more likely a sale Mathews Wilson and
Monoky (1972) argue that perceived similarity results
in more cooperation between the buyer and seller
Attraction is the mechanism through which similarity
affects these outcomes
It should be noted that interpersonal attraction
might be conceived as an exogenous construct-
determined before negotiations begin as a part of the
combination of the negotiatorrsquos characteristics It may
also be argued that attraction is a consequence of the
negotiation However attraction is regarded as a
process-related construct
There is an abundance of studies in the negotiation
literature that focuses on the fundamental assumption
that personal parameters or negotiatorsrsquo characteristics
are relevant to negotiation processes and outcomes
(Barry amp Friedman 1998) Someone with a trusting
nature tends to give credence to the honesty of
statements of others until or unless reasons are
provided for disbelief In negotiation trust relates to
how they expect their partners to behave and respond
(Fells 1983)
In the cross-cultural negotiation literature duration
of the negotiation is described as a key aspect of the
process For example Tung (1982) and Van Zandt
(1970) report that negotiations with the Chinese and
Japanese are exasperatingly long from the perspective
of most American negotiators Pruitt (1981) discusses
at great length the pervasive influence of time on
negotiations That is a time limit affects the qualities of
the aspirations concession making and negotiation
satisfaction Although time limits per se are not varied
in this study negotiators from different cultures may
have different expectations about appropriate durations
which may in turn influence behaviors
Silent periods are operationally defined as gaps in
conversations lasting 10 seconds or more in duration
The time period of ten seconds was selected somewhat
arbitrarily but it is a long enough period of silence to
appear unnatural to most observers The tapes were
searched for gaps in conversations of ten seconds or
more The ten seconds time period while somewhat
arbitrary is a long enough silence to appear unnatural
to most American observers
The concept of interactional synchrony the
unconscious coordination of verbal and nonverbal
behaviors of 2 or more participants in a conversation
was discussed at length by Graham (1980) It is the
number of conversational overlaps or interruptions
during a conversation Conversational overlaps are
defined as periods when both speakers are talking at
the same time or when the conversational contribution
of one speaker overlaps that of the other speaker One
possible measure of this construct is the number of
conversational overlaps or interruptions during a
conversation Identification of such overlaps is
independent of the verbal content of the interactions
Facial gazing is defined as the percentage of time a
negotiator gazes at the face of partner Many resear-
chers have found significant relationships between
facial gazing and outcomes of negotiations (Lewis amp
Fry 1977) Moreover several authors have suggested
differences in facial gazing behaviors across cultures
(Argyle amp Cook 1976)
Touching means that a negotiator touches another
negotiation partner with the exception of beginning
and ending handshakes It is the number of times
negotiators touch their partners (excluding beginning
and ending handshakes) Graham (1985) reports
Brazilian businesspeople touch one another during
simulated negotiations while Japanese and American
negotiators do not
23 Outcome Measures
Researchers often find outcomes of business
negotiations difficult to measure and to compare
Various studies have used sale versus no sale an
obvious measure of negotiating effectiveness (eg
Pennington 1968) profits obtained by negotiators (eg
J Glob Bus Trade Vol 9 No 2 (November 2013) 1-9
5
Rubun amp Brown 1975) and a combination of
individual and joint profits (Clopton 1984) Beyond
profits negotiatorrsquos satisfaction is an important
measure of success especially if partners desire a
continued relationship Given the dual importance of
task accomplishment (profit) and relationship building
(satisfaction) especially in international negotiations
the present study uses both as outcomes
Ⅲ Cultural Difference in Nonverbal
Behavior
The participants in the experiment were 10
Chinese 10 Korean and 10 European Students who
are majoring in international business and Korean
businessmen are undergraduate students majoring
international commerce at Paichai University in Korea
This section deals with nonverbal aspects of
videotaped interactions The rhythms of the
conversations are discussed examining silent periods
and conversational overlaps Next facial gazing and
touching during negotiations are presented
31 Silent Periods
Silent periods are operationally defined as gaps in
conversations 10 seconds or more in duration The
time period of 10 seconds was selected somewhat
arbitrarily but it is long enough period of silence to
appear unnatural to most observers The tapes were
searched for gaps in conversations of 10 seconds or
more Silent periods occurred more frequently in the
Korean negotiatorsrsquo interactions (51 per 30minutes)
than either the Chinese or European negotiators
Negotiators from a low context culture such as Europe
tend to regard the silence of a high context culture such
as Korea as a rejection which is not a rejection in a
real sense by their standards
32 Conversational Overlaps
The concept of interactional synchrony the uncon-
scious coordination of verbal and nonverbal behaviors
of 2 or more participants in a conversation was
discussed at length by Graham (1980) It is the number
of conversational overlaps or interruptions during a
conversation Conversational overlaps are defined as
periods when both speakers are talking at the same
time or when the conversational contribution of one
speaker overlaps that of the other speaker The number
of overlaps (interruptions) by each participant was
totaled and divided by the time of negotiation to arrive
at values which may be compared across interactions
According to Table 1 Korean negotiators interrupted
more than Chinese or European negotiators
33 Facial Gazing
Facial gazing is defined as the percentage of time a
negotiator gazes at the face of partner Randomly
selected 10-minute videotape excerpts of each of the
interactions served as data here The author recoded
the time each participant spent gazing at hisher
partnerrsquos face during 10 minutes According to Table 1
European negotiators spent considerably more time
gazing at negotiation partners than either Korean or
Chinese negotiators
Table 1 Comparison of Patterns of Nonverbal Negotiation Behavior
Nonverbal Negotiation Behavior Korean Chinese European Silent Periods(average number of silence for more than 10
seconds during 30 minutes)
Conversational Overlaps(average number of conversational
overlaps during 30 minutes)
Facial gazing(average number of gazing)
Touch(number of touch)
51
308
11 25
35
264
11 30
28
58
76 00
Negotiation Factors and Culture in Trade Negotiations
6
34 Touching
Touching means that negotiator touches another
negotiation partner except for beginning and ending
handshakes Except for European negotiators Korean
and Chinese negotiators seldom touch their partners
except for handshakes
Ⅳ Conclusions
The purpose of this study has been to find out basic
factors affecting international business negotiations
and to suggest some strategic implications for business
negotiators With the advancement of globalization
intercultural business negotiations become more and
more important as a marketing strategy The role of
business negotiators is extremely important in order to
achieve successful international business negotiations
In order to achieve agreement in international
business negotiations negotiators are required to
manage cultural differences between the parties
concerned in addition to the complexity of domestic
negotiations Because such a large variety of cultural
factors exist among nations it is critical for negotiators
to identify the kind of problem-solving approaches that
are most appropriate for each intercultural negotiator
Understanding cultural differences is vital for successful
intercultural negotiations An objective measurement
of culture is important to overcome misunderstanding
caused by stereotyping and prejudice about other
cultures
As for nonverbal negotiation behaviors Korean
negotiators tend to use more silent periods than the rest
of two groups Also Korean negotiators interrupted
more than Chinese and European negotiators
European negotiators used more lsquofacial gazingrsquo and
lsquotouchingrsquo strategies in negotiation However there are
study limitations as follows the most important
consideration is the validity of the principal outcome
measure individual profit Kellyrsquos negotiation game
and such measures have been used in other studies but
how well the game represents actual business
negotiations is problematic Much of the evidence
supplied for accepting and rejecting hypotheses is
based on self-reports and judgements of participants
Also small sample sizes do not allow for tests of
statistical significance The negotiator should understand
the cultural background specifically regarding business
negotiation Negotiators can ask more questions in
their negotiations Sometimes itrsquos smart to be a little
bit dumb in business negotiations
The more the negotiators ask questions the more
information they can get and they can exchange more
information Also using a silent strategy can be
necessary and aggressive influence tactics such as
warnings and threats particularly those emphasized
with expressions of emotions may be used in
negotiations in a very restrictive way
Cooperatives and educational institutions should
take advantage of current research to develop training
programs on cultural differences in not only verbal
communication but non-verbal communication for
better trade negotiation results
References
Achrol R S (1997) Changes in the theory of
interorganizational relations in marketing Toward
a network paradigm Journal of the Academy of
Marketing Science 25(1) 56-71
Adler N J amp Graham J L (1989) Cross-cultural
interaction the international comparison fallacy
Journal of International Business Studies 20(3)
515-537
Allred K G Mallozzi J S Matsui F amp Raia C P
(1997) The influence of anger and compassion on
negotiation performance Organizational Behavior
and Human Decision Processes 70(3) 175-187
Argyle M amp Cook M (1976) Gaze and mutual
gaze Cambridge England Cambridge University
Press
Atkinson J M amp Heritage J (1984) Structures of
social action Studies in conversation analysis
Cambridge England Cambridge University Press
Barry B Fulmer I S amp Van Kleef G A (2004) I
laughed I cried I settled The role of emotion in
J Glob Bus Trade Vol 9 No 2 (November 2013) 1-9
7
negotiation The Handbook of Negotiation and
Culture 71-94
Barry B amp Friedman R A (1998) Bargainer
characteristics in distributive and integrative
negotiation Journal of Personality and Social
Psychology 74(2) 345
Barry B amp Oliver R L (1996) Affect in dyadic
negotiation A model and propositions Organiza-
tional Behavior and Human Decision Processes
67(2) 127-143
Blackman C (1977) Negotiating China Case studies
and strategies St Leonards Australia Allen amp
Unwin
Brenkert G G (1998) Trust morality and interna-
tional business Business Ethics Quarterly 8(02)
293-317
Brunner J A amp Taoka G M (1977) Marketing and
negotiating in the peoplersquos republic of China
Perceptions of American businessmen who atten-
ded the 1975 Canton Fair Journal of International
Business Studies 69-82
Butler J K (1995) Behaviors trust and goal
achievement in a win-win negotiating role play
Group amp Organization Management 20(4) 486-
501
Campbell N C Graham J L Jolibert A amp
Meissner H G (1988) Marketing negotiations in
France Germany the United Kingdom and the
United States The Journal of Marketing 52 49-62
Casse P (1981) Training for the Cross-Cultural Mind
(2nd ed) Washington DC Society for
Intercultural Education Training and Research
Cellich C (1995 January) Negotiations for export
business Elements for success In International
Trade Centre (ED) International Trade Forum
(No 4 p 20) Geneva Author
Clopton S W (1984) Seller and buying firm factors
affecting industrial buyersrsquo negotiation behavior
and outcomes Journal of Marketing Research 21
39-53
Coates A (1968) Myself a Mandarin Oxford UK
Oxford University Press
Davidson W H (1987) Creating and managing joint
ventures in China California Management Review
29(4) 75-95
Deutsch M Kelley H H amp Rapoport A (1964)
Strategic interaction and conflict Berkeley CA
Berkeley Institute of International Studies
University of California
Evans F B (1963) Selling as a dyadic relationship A
new approach American Behavioral Scientist 6
76-79
Fang T (1997) Chinese business negotiating style A
socio-cultural approach (Licentiate thesis)
Linkoping Sweden Inter-national Graduate School
of Management and International Engineering
(IMIE)
Fisher R Ury W amp Patton B (1991) Getting to
Yes (2nd ed) New York NY Penguin Books
Ganesan S (1994) Determinants of long-term
orientation in buyer-seller relationships The
Journal of Marketing 19(4) 1-19
Gardner L amp Aronson G (Eds) (1968) Handbook
of Social Psychology Reading MA Addison-
Wesley
George J M Jones G R amp Gonzalez J A (1998)
The role of affect in cross-cultural negotiations
Journal of International Business Studies 29(4)
749-772
Gilsdorf J W (1997) Metacommunication effects on
international business negotiating in China
Business Communication Quarterly 60(2) 20-37
Goh B C (1996) Negotiating with the Chinese
Euro-Asia Business Review 5(1) 34-36
Graham J L (1985) The influence of culture on the
process of business negotiations An exploratory
study Journal of International Business Studies
81-96
Graham J L (1986) The problem-solving approach
to negotiations in industrial marketing Journal of
Business Research 14(6) 549-566
Graham J L (1990) An exploratory study of the
process of marketing negotiations using a cross-
cultural perspective In E A Scarcella amp S
Krashen (Eds) Developing communicative
Negotiation Factors and Culture in Trade Negotiations
8
competence in a second language (pp 239-279)
Rowley MA Newbury House
Greenhalgh L amp Gilkey R W (1993) The effect of
relationship orientation on negotiatorsrsquo cognitions
and tactics Group Decision and Negotiation 2(2)
167-183
Gumperz J J (1982) Discourse strategies Cambridge
UK Cambridge University Press
Hall E T (1976) Beyond culture Garden City NY
Anchor Press
Hall E T (1989) The silent language New York
NY Bentam-Doubleday
Hofstede G (1991) Cultural and organization amp
software of the mind Berkshire England
McGraw-Hill
Hofstede G (2001) Culturersquos consequences (2nd ed)
Thousand Oaks CA Sage
Jones G R amp George J M (1998) The experience
and evolution of trust Implications for cooperation
and teamwork Academy of Management Review
23(3) 531-546
Kumar R (1997) The Role of affect in negotiations
an integrative overview The Journal of Applied
Behavioral Science 33(1) 84-100
Kumar R (2004) Culture and emotions in
international negotiations An overview In M J
Gelfand amp J M Brett (Eds) The handbook of
negotiation and culture (pp 95-113) Stanford CA
Stanford Business Books
Lewicki R J amp Stark N (1996) What is ethically
appropriate in negotiations An empirical examina-
tion of bargaining tactics Social Justice Research
9(1) 69-95
Lewis S A amp Fry W R (1977) Effects of visual
access and orientation on the discovery of
integrative bargaining alternatives Organizational
Behavior and Human Performance 20(1) 75-92
Linton R (1945) The cultural background of personality
New York NY Appleton-Century Crofits
McAllister D J (1995) Affect-and cognition-based
trust as foundations for interpersonal cooperation
in organizations Academy of Management
Journal 38(1) 24-59
Min H amp Galle W (1993) International negotiation
strategies of US purchasing professionals Interna-
tional Journal of Purchasing and Materials
Management 29(2) 40-50
Pennington A L (1968) Customer-salesman bargain-
ing behavior in retail transactions Journal of
Marketing Research 255-262
Pruitt D G (1981) Bargaining Behavior New York
NY Academic Press
Reardon K K amp Spekman R E (1994) Starting out
right Negotiation lessons for domestic and cross-
cultural business alliances Business Horizons
37(1) 71-79
Rempel J K Holmes J G amp Zanna M P (1985)
Trust in close relationships Journal of Personality
and Social Psychology 49(1) 95
Rubin J Z amp Brown B R (1975) The social
psychology of bargaining and negotiation New
York NY Academic Press
Salacuse J W (1991) Making global deals negotia-
ting in the international marketplace Boston MA
Houghton Mifflin
Sawyer J amp Guetzkow H (1965) Bargaining and
Negotiation in International Relations In H C
Kelman (Ed) International behavior A social-
psychological analysis (pp 464-520) New York
NY Holt Rinehart and Winston
Sebenius J K (2002) The hidden challenge of cross-
border negotiations Harvard Business Review
80(3) 76-85
Shenkar O amp Ronen S (1987) The cultural context
of negotiations The implications of Chinese
interpersonal norms The Journal of Applied
Behavioral Science 23(2) 263-275
SRI International (1979) Doing Business in Taiwan
and Doing Business in Japan [Pamphlet] Menlo
Park CA Schmidt K D
Stewart S amp Charles F K (1989) Talking with
dragon Negotiating in the peoplersquos republic of
China Columbia Journal of World Business 23(3)
68-72
J Glob Bus Trade Vol 9 No 2 (November 2013) 1-9
9
Strong K amp Weber J (1998) The myth of the
trusting culture a global empirical assessment
Business amp Society 37(2) 157-183
Thibaut J W amp Kelly W H (1959) The social
psychology of groups New York NY McGraw-
Hill
Triandis H C Kurowski L L amp Gelfand M J
(1994) Workplace diversity In H C Triandis M
D Dunnette amp L M Hough (Eds) Handbook of
industrial and organizational psychology (pp 769-
827) Palo Alto CA Consulting Psychologists
Tung R L (1982) US-China trade negotiations
practices procedures and outcomes Journal
of International Business Studies 25-37
Weiss S E (1993) Analysis of complex negotiations
in international business The RBC perspective
Organization Science 4(2) 269-300
Weitz B (1979) A critical review of personal selling
research The need for contingency approaches In
G Albaum amp G A Churchill (Eds) Critical
issues in sales management State of the art and
future research needs Eugene OR University of
Oregon
Yoshimatsu H (2005) Japanrsquos keidanren and free
trade agreements Societal interests and trade
policy Asian Survey 45(2) 258-278
Zandt V (1970) How to negotiate in Japan Harvard
Business Review 25-38
J Glob Bus Trade Vol 9 No 2 (November 2013) 11-21
11
ISSN 1946-5130
Journal of Global Business and Trade
wwwiagbtcom
Is the Agrochemical Industry Traversing the Organic Route
Insights and Directions for a Philippine Agrochemical
Trading Company
Jane Keneth M Mampustia Jeanette Angeline B Madamba
b Agnes T Banzon
c and
Loida E Mojicad
abcd College of Economics and Management University of the Philippines Los Bantildeos Philippines
Received 12 August 2013 Revised 22 September 2013 Accepted 25 October 2013
ABSTRACT
This paper explores the strengths weaknesses challenges and opportunities of a Philippine agrochemical
trading company as it thrives within its broader macro-environment In an era of climate change adaptation
and ailing global economies agrochemical companies within the food chain face even greater barriers to
survival and competitiveness The study revealed that the agrochemical industry has made baby steps in
encouraging farmers to adopt the natural or organic way of farming through the use of biopesticides and
biofertilizers as a response to climate change but price-sensitive farmers appear indifferent to the use of
biopesticides and biofertilizer and readily switch suppliers depending on product prices as well as the
promotional activities done by agrochemical trading companies These suggest that agrochemical usage will
continue to dominate global agriculture in the next couple of years while biologicals in organic agriculture
will account for a minimal percentage despite the trend toward sustainable agriculture To be sustainable it is
suggested that agrochemical trading companies introduce new brands for each product type formulate a
customer retention strategy for its dealers and independent business partners and pursue a market penetration
strategy to widen the customer base as they track their moves against a changing global agrochemical
industry
Keywords agrochemical industry biopesticides climate change adaptation organic agriculture sustainability
Ⅰ Introduction2
Agrochemicals also known as crop protection
products are those products or substances which are
used to effectively and actively manage the agricultural
ecosystem Agrochemical products include pesticides
herbicides insecticides and fungicides Synthetic
fertilizers hormones and other chemical growth agents
2013 International Academy of Global Business and Trade
All rights reserved
as well as concentrated stores of raw animal manure
may also be included in the list of agrochemical
products These products can be classified into four
categories inorganic pesticides organic pesticides and
pre-emergent and post-emergent herbicides These
chemicals play a vital role in controlling and restrain-
ing the damaging attacks of pests weeds fungi
diseases and other undesirable pests which pose
serious threats to global crop production The benefits
offered by agrochemical products are two-fold the
Is the Agrochemical Industry Traversing the Organic Route Insights and Directions for a Philippine
Agrochemical Trading Company
12
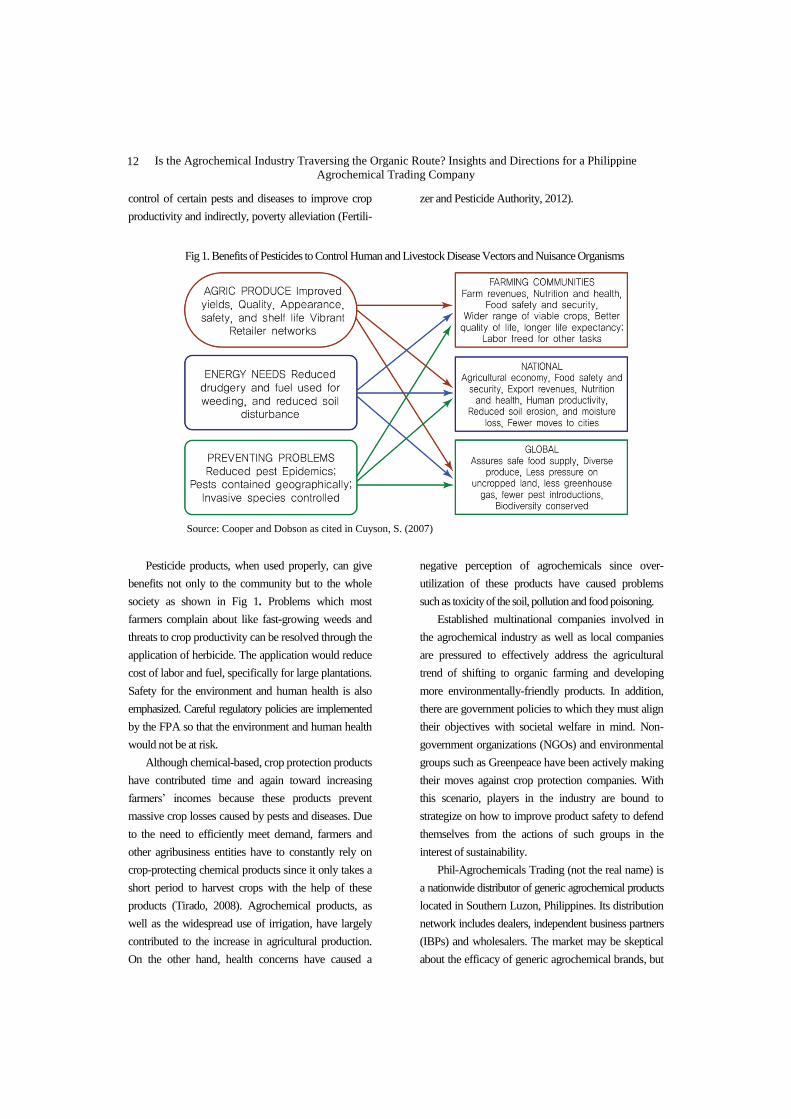
control of certain pests and diseases to improve crop
productivity and indirectly poverty alleviation (Fertili-
zer and Pesticide Authority 2012)
Fig 1 Benefits of Pesticides to Control Human and Livestock Disease Vectors and Nuisance Organisms
Source Cooper and Dobson as cited in Cuyson S (2007)
Pesticide products when used properly can give
benefits not only to the community but to the whole
society as shown in Fig 1 Problems which most
farmers complain about like fast-growing weeds and
threats to crop productivity can be resolved through the
application of herbicide The application would reduce
cost of labor and fuel specifically for large plantations
Safety for the environment and human health is also
emphasized Careful regulatory policies are implemented
by the FPA so that the environment and human health
would not be at risk Although chemical-based crop protection products
have contributed time and again toward increasing
farmersrsquo incomes because these products prevent
massive crop losses caused by pests and diseases Due
to the need to efficiently meet demand farmers and
other agribusiness entities have to constantly rely on
crop-protecting chemical products since it only takes a
short period to harvest crops with the help of these
products (Tirado 2008) Agrochemical products as
well as the widespread use of irrigation have largely
contributed to the increase in agricultural production
On the other hand health concerns have caused a
negative perception of agrochemicals since over-
utilization of these products have caused problems
such as toxicity of the soil pollution and food poisoning
Established multinational companies involved in
the agrochemical industry as well as local companies
are pressured to effectively address the agricultural
trend of shifting to organic farming and developing
more environmentally-friendly products In addition
there are government policies to which they must align
their objectives with societal welfare in mind Non-
government organizations (NGOs) and environmental
groups such as Greenpeace have been actively making
their moves against crop protection companies With
this scenario players in the industry are bound to
strategize on how to improve product safety to defend
themselves from the actions of such groups in the
interest of sustainability
Phil-Agrochemicals Trading (not the real name) is
a nationwide distributor of generic agrochemical products
located in Southern Luzon Philippines Its distribution
network includes dealers independent business partners
(IBPs) and wholesalers The market may be skeptical
about the efficacy of generic agrochemical brands but
J Glob Bus Trade Vol 9 No 2 (November 2013) 11-21
13
this small company strives to be more responsible for
their products through continuous research on ways to
improve their products and demonstrate such efficacy
in crop protection Knowing their products may have
detrimental effects for the farmers if not properly used
the company conducts seminars or farmersrsquo group
meetings on the safe use of their products They also
give protective gear such as masks and gloves to the
farmer participants Products which are traded by this
company are manufactured by several suppliers in the
Philippines such as AgChem Manufacturing Corpora-
tion Radisson Agrochemical Corporation and Kemistar
Corporation These manufacturing compa-nies are
members of the Crop Protection Association of the
Philippines (CPAP) one of the leading crop protection
chemical associations in the country Phil-Agroche-
micals Trading also imports agrochemicals (speci-
fically insecticides) from Bharat Agro Chemicals in
India and China Xiamen Top using Import amp Export
Co Ltd from China About 10 of their total
inventory comes from imported insecticides Currently
Phil-Agrochemicals Trading which also distributes
products of its sister company has fifteen pesticide
products and two plant nutrition products in its
inventory pipeline
With the stiff competition in the Philippine agro-
chemical industry brought about even more by the
institution of Republic Act No 10068 (also known as
the Organic Act of 2010) the company has to find
ways to better strategize so as to gain customer trust
encourage continued patronage and improve overall
company performance The company has about eight
direct competitors
This paper aims to present an overview of the
agrochemical industry compare the firmrsquos operational
and functional strategies with the practices in the
industry identify and assess the problems and oppor-
tunities pertaining to these strategies and compare
these with its competitorsrsquo strategies and suggest
solutions to the problems or strategies to take
advantage of opportunities in view of the challenges of
going organic and the overall demand for the greening
of agriculture
II Methodology
Primary data for this exploratory research were
gathered from surveys and interviews with four
company officerspersonnel 60 farmers five indepen-
dent business partners and five dealers as well as an
actual apprenticeship at Phil-Agrochemical Trading
over a two-month period by the major author
Secondary data were obtained from printed sources
found at several government institutions such as the
Crop Protection Association of the Philippines (CPAP)
and the Fertilizer and Pesticide Authority (FPA)
company files and other printed or online publications
and unpublished special problem reports at the College
of Economics and Management library Descriptive
analysis combined with a comparative competitor analysis
and a SWOT analysis was used in this research
Ⅲ Review of Literature
Zhang et al (2011) identified three phases in the
history of pesticides and its application (1) the first
phase which covered the period before the 1870s saw
the use of natural pesticides (such as sulfur in ancient
Greece) as a pest control measure (2) the second phase
from the 1870s to 1945 saw the advent of inorganic
synthetic pesticides and the use of natural materials
and inorganic compounds and (3) the third phase
(from 1945 onwards) marked the era of organic
synthetic pesticides (eg DDT 24-D and later HCH
dieldrin) Since then humans synthesized most
pesticides which were later referred to as chemical
pesticides It was during the third phase (the era of
organic synthetic pesticides) when there was a boost in
agricultural productivity which became a moving force
for the advancement of human civilization
During the earlier portion of the third phase three
kinds of insecticides were used carbamated insecticides
organophosphorus insecticides and organochlorined
insecticides This was soon followed by the develop-
ment of herbicides and fungicides As seen in Table 1
herbicide use increased from 20 in 1960 to 48 in
2005 Herbicides comprised almost half of total
pesticide consumption in 2005 (Zhang et al 2011)
Is the Agrochemical Industry Traversing the Organic Route Insights and Directions for a Philippine
Agrochemical Trading Company
14
Table 1 Changes of Pesticide Consumption Worldwide
CATEGORY 1960 1970 1980 1990 2000 2005
Sales Sales Sales Sales Sales Sales
Insecticides 310 365 1002 371 4025 347 7655 29 7559 279 7798 25
Herbicides 170 20 939 348 4756 14 1162
5
44 1288
5
475 1497
1
48
Fungicides amp Bactericides
340 40 599 222 2181 188 5545 21 5306 196 7486 24
Others 30 35 159 59 638 55 1575 6 1354 5 936 3
Total 850 100 2700 100 11600
100 26400
100 27104
100 31191
100
Note Sales in millions USD
Source Xu (1997) httpwwwdocincomp-55305172html as cited in Zhang et al (2011)
According to the Food and Agriculture Organi-
zation of the United Nations (FAO) fertilizer and
pesticide use in the Philippines between 1961 and
2005 increased by 1000 and 325 respectively
This was caused by the widespread use of irrigation
agrochemicals and new seeds in the country However
crop yield only increased by a small amount even
though agrochemical products were used This was
mainly attributed to excessive and inappropriate use of
chemical-based products in farming causing land
degradation and losses in soil fertility
Ⅳ Overview of the Industry
41 Global Agrochemical Industry
Dussal (2011) stated that the world agrochemical
industry was valued at USD 134 billion in 2010 It is
expected to grow at a CAGR of 11 to reach USD
225 billion by 2015 The Asia Pacific region led the
global agrochemical and fertilizer consumption
accounting for 40 followed by North America with
32 The top ten global players include Bayer
Syngenta Potash Corp Agrium and Mosaic which
constitute around 90 of the world market share
Pesticide sales remained relatively constant over
the 1990s between USD 270 to 300 billion From 2007
to 2008 herbicides ranked first in the three major
categories of pesticides (insecticides fungicides
bactericides and herbicides) in terms of sales The
fungicidesbactericides ranked second Europe is now
the top consumer of pesticides in the world followed
by Asia Specific countries which largely use
pesticides are China the United States France Brazil
and Japan Most of the pesticides worldwide are used
for fruit and vegetable crops In developed countries
pesticides mainly herbicides are primarily used for
maize Since the 1980s there have been hundreds of
thousands of pesticides developed worldwide inclu-
ding biopesticides (Zhang et al 2011)
According to the US Environmental Agency
ldquobiopesticides are certain types of pesticides derived
from such natural materials as animals plants bacteria
and certain minerals For example canola oil and
baking soda have pesticide applications and are
considered biopesticides At the end of 2001 there
were approximately 195 registered biopesticide active
ingredients and 780 products Biopesticides fall into
three major classes
a Microbial pesticides consist of a micro-
organism (eg a bacterium fungus virus or
protozoan) as the active ingredient Microbial
pesticides can control many different kinds of
pests although each separate active ingre-
dient is relatively specific for its target pest(s)
For example there are fungi that control
certain weeds and other fungi that kill
specific insects
b The most widely used microbial pesticides
are subspecies and strains of Bacillus
thuringiensis or Bt Each strain of this
bacterium produces a different mix of
proteins and specifically kills one or a few
J Glob Bus Trade Vol 9 No 2 (November 2013) 11-21
15
related species of insect larvae While some
Btrsquos control moth larvae found on plants
other Btrsquos are specific for larvae of flies and
mosquitoes The target insect species are
determined by whether the particular Bt
produces a protein that can bind to a larval
gut receptor thereby causing the insect larvae
to starve
c Plant-Incorporated-Protectants (PIPs) are
pesticide substances that plants produce from
genetic material that has been added to the
plant For example scientists can take the
gene from the Bt pesticide protein and
introduce the gene into the plantrsquos own
genetic material Then the plant instead of
the Bt bacterium manufactures the substance
that destroys the pest The protein and its
genetic material but not the plant itself are
regulated by EPA
Fig 2 Distinguishing Factors for the Paradigm Shift in the Crop Protection Industry
Source Balayan (2010)
d Biochemical pesticides are naturally occurring
substances that control pests by non-toxic
mechanisms Conventional pesticides by
contrast are generally synthetic materials that
directly kill or disable the pest Biochemical
pesticides include substances such as insect
sex pheromones which interfere with mating
as well as various scented plant extracts that
attract insect pests to traps Because it is
sometimes difficult to determine whether a
substance meets the criteria for classification
as a biochemical pesticide the EPA has
established a special committee to make such
decisions
42 The Philippine Crop Protection Industry
According to the Samahan sa Pilipinas ng mga
Industriyang Kimika (SPIK) or Chemical Industries
Association of the Philippines in 2008 the utilization
of crop-protecting chemicals is still prevalent among
Filipino farmers In the country the most extensively
used pesticides are insecticides which account for 51
of the total market herbicides comprise 21
fungicides 14 and the remaining other types of
pesticides 14 These chemicals are used for crops
such as rice (about 33 million hectares of plantation
area) corn (32 million hectares) pineapple (67000
hectares) and banana (25000 hectares)
Is the Agrochemical Industry Traversing the Organic Route Insights and Directions for a Philippine
Agrochemical Trading Company
16
Because of the greater challenge faced by the
players there has been a progressive shift in the
industry from what is commonly known as an
agrochemical industry to a crop protection industry and
now to a plant science industry as shown in Fig 2 The
shift to a plant science industry is believed to deliver
products that would give better solutions to crop
problems and technologies that would lead to
sustainability As of now the multinational companies
or the CropLife members are the ones which are
already in the third phase (Balayan 2010) The generic
companies are still in phase 2 (crop protection) but on
their way to shift to phase 3 (plant science)
The Philippine crop protection industry is
comprised of firms engaged in the formulation
manufacture distribution repackaging importation
and exportation of chemical pesticides It has always
been dominated by transnational agrochemical com-
panies which are members of CropLife International
such as Bayer CropScience Syngenta Philippines Du
Pont Dow Agro These companies operate and manu-
facture their own agrochemical products These
companies focus more on the assurance of the safety of
their products Moreover they are now more respon-
sible about the flow of their products up through the
disposal phase Hence they practice product steward-
ship In 2008 the FPA has listed about 300 firms
operating in the country Other players in the industry
would include local companies such as the members of
the Crop Protection Association of the Philippines
(CPAP) and other generic product-making companies
As shown in Table 2 there has been an increasing
demand for pesticides in the country although a
continuous campaign against these products is done by
the NGOs An increase in Philippine importation of
pesticides is due to the fact that perceived sustainability
cannot be achieved without the help of these
agrochemical products The country is highly
dependent on importation due to the limited resources
available in the country for formulators and manufac-
turers Active ingredients are also imported by the
major industry players Local production is limited to
formulation of imported technical materials except for
24-D
Table 2 Value of Imports of Pesticides in the Philippines (in USD 1000rsquos)
Item 2006 2007 2008 2009 2010
Insecticides 39658 49152 65022 68873 51371
Fungicides 46751 40741 32109 26914 28648
Herbicides 22236 22793 21954 11715 5031
Disinfectants etc 10388 13033 30741 53249 85043
Total 119033 125719 149826 160751 170093
Source FAO (2010)
On the other hand exports of pesticides by the Philippines show minimal levels making the country a net importer of
pesticides (Table 3)
Table 3 Value of Exports of Pesticides in the Philippines (in USD 1000rsquos)
Item 2006 2007 2008 2009 2010
Insecticides 1335 2938 1547 1508 1928
Fungicides - - 1 15 132
Herbicides 1 262 400 81 27
Disinfectants etc 312 1199 915 1256 740
Total 1649 4399 2863 2859 2826
Source FAO (2010)
J Glob Bus Trade Vol 9 No 2 (November 2013) 11-21
17
43 Foreseen Trends in Global Pesticide
Production and Consumption
The trend nowadays is organic agriculture which is
seen also as sustainable agriculture Thus the ongoing
deterioration in the natural environment had Zhang et
al (2011) saying that biopesticides are the wave of the
future Such pesticides must be highly efficient non-
toxic and environment-friendly Biopesticides according
to Yang (2001) have the following advantages
a a positive control effect on pests safe to humans
and animals and no pollution
b no residuals
c strong specificity to target pests safe to natural
enemies and beneficial organisms
d raw materials and active ingredients are natural
products which helps to ensure sustainable
development
e they can be modified by means of modern
biotechnology and fermentation processes to
improve performance and enhance quality
f pest resistance is difficult to generate
Over 100 kinds of biopesticides exist at present
worldwide with about 30 types of biopesticides
commercially produced (Xu 2008) Countries such as
Mexico the United States and Canada dominate global
biopesticide usage accounting for 44 The total
world biopesticide consumption can be broken down
into 20 (Europe) 13 (Asia) 11 (Oceania) 9
(Latin America) and 3 (Carribean and Africa) (Qin
amp Kong 2006) As for China the biopesticide industry
has been expanding since the 1990s from 10 to 20
annually such that by 2006 total biopesticides
consumption reached 145000 tons accounting for 10
of total sales It is anticipated that biopesticides will
replace up to 20 of chemical pesticide consumption
in China in the years ahead
Since safer products are what consumers are
demanding companies such as United Farm Tech-
nologies Nuso Agro Science and Dow Agro started
selling and manufacturing safer pesticides called
biopesticides These products are derived from natural
materials Biopesticides constitute about 2 of the
global agrochemical market (Dussal 2011) In
Monsantorsquos pipeline are agricultural biological or
biopesticides produced using what they call the Bio-
Direct Technology which involves using molecules
found in nature expected to be developed for use in
topically applied crop protection and other products
(Monsanto 2012) Moreover Bayer CropScience
recently acquired AquaQuest a US-based supplier of
innovative biological pest management solutions based
on natural microorganisms for USD 500 million in its
bid to build a leading technology platform for green
products (Bayer 2012)
Ⅴ Results and Discussion
51 Compliance by Phil-Agrochemical
Trading with FPA Requirements
The FPA requirements relative to product labeling
were all met by the Phil-Agrochemical Trading These
include a statement of composition registration or
provisional permit number name and address of
company the productrsquos common name net contents
directions for use suitable indication of hazards
instructions on decontamination and safe disposal of
used containers the lot number and date of formulation
the FPA registration number re-entry period after
application triple rinse logo a person to contact in case
of emergency and safety instructions
52 Comparison of Phil-Agrochemical
Tradingrsquos Activities with CPAP
Activities
Four types of activities are carried out by CPAP
members product stewardship agromedical training
information education campaign aerial spraying semi-
nars and farmersrsquo meetings Phil-Agrochemical
Trading has yet to apply for CPAP membership A
comparison of its activities with CPAP activities
revealed that only farmersrsquo meetings are done by the
firm
Is the Agrochemical Industry Traversing the Organic Route Insights and Directions for a Philippine
Agrochemical Trading Company
18
53 Comparison of Phil-Agrochemical
Tradingrsquos Operations with Top
Competitors
Table 4 presents a summary comparison of Phil-
Agrochemical Tradingrsquos operations with two of its
top competitors CyBERTH Philippines Inc and
PhilAgrow Inc
CyBERTH Philippines Inc was established in
1999 and is engaged in trading pesticides and
fertilizers in the country However they trade more
pesticide products as fertilizer is more expensive The
companyrsquos product portfolio includes 24 registered
products categorized as insecticides herbicides
fungicides molluscicides or plant growth regulators
The major crops where these products can be used are
rice corn vegetables and mangos The companyrsquos
operations cover the research and development of new
products importation and local purchase of the
technical and inert materials of a particular product
formulation warehousing and supply of finished
products to its distributors This company continuously
searches for better products
PhilAgrow Inc started operations in 2006 and is an
importerdistributor of chemical pesticides such as
insecticides molluscicides fungicides herbicides
nematicides and specialties It has 18 FPA-registered
products
Table 4 Summary Comparison of Phil-Agrochemical Trading with Two Top Competitors
Points for Comparison Phil-Agrochemical
Trading CyBERTH Philippines Inc PhilAgrow Inc
Product Lines 14 FPA registered products 24 FPA registered products 18 FPA registered products
Product Variety
Herbicidesinsecticides
molluscicides fungicides fertilizer
Herbicides insecticides
molluscicides fungicides fertilizer
Insecticides molluscicides
fungicide herbicides nematicides specialties
Promotional Activities
Farmers meetings caravans
raffle promos provision of protective gears
Farmers meetings raffle
promos provision of protective gears
Farmers meetings raffle
promos provision of protective gears
Target Market
General trade market
plantation businesses small farmers (below 2ha and 2ha
and above)
General trade market
plantation businesses small farmers below 2 ha
and 2 ha and above)
General trade market
plantation businesses small farmers below 2 ha and 2 ha
and above)
Location Scope Domestic Domestic Domestic
Facilities (eg warehouse
transportation)
Rented (Outsourced
production) Owned Research facility
Provision of training to employees
- Yes Yes
Note Firm name was disguised upon firmrsquos request
Among the points for comparison it can be seen
that Phil-Agrochemical Trading has the least number
of product lines at 14 FPA-registered products vis-agrave-
vis CyBERTH Philippines Inc with 24 FPA-
registered products and PhilAgro Inc with 18 FPA-
registered products In terms of product variety Phil-
Agrochemical Trading and CyBERTH Philippines
Inc have 5 types of products while PhilAgrow has 6
types All firms carry out the same promotional
activities have the same target market and location
scopecoverage Facilities of Phil-Agrochemical
Trading are rented while those for CyBERTH
Philippines Inc are owned PhilAgrow Inc has its
own research facility Only CyBERTH Philippines
Inc and Phil-Agrow Inc provide training to
employees
54 Farmer Survey Results
Sixty farmers surveyed had about 11-15 years of
farming experience primarily grew rice operated
small farms (1-5 hectares) and were customers of Phil-
J Glob Bus Trade Vol 9 No 2 (November 2013) 11-21
19
Agrochemical Trading for five years or less The
majority (over 91) bought pesticides from other
distributors because of lower prices and availability of
preferred agrochemicals On a scale of 1 to 7 with 7
being the highest rating most farmers rated Phil-
Agrochemical Trading a ldquo4rdquo Suggestions given by the
farmers to the firm included lowering the product
prices and increasing promotional activities to
encourage customer retention and continued patronage
55 Assessment of Strengths Weaknesses
Opportunities and Threats
Fig 3 shows a SWOT Matrix where Phil-Agro-
chemical Tradingrsquos strengths are matched with its
opportunities and then with its threats while its
weaknesses are matched with its opportunities and
then with its threats to generate possible strategy
alternatives for the firm to become sustainable Such
strategies include the introduction of new brands per
product type creation of a customer retention strategy
for its dealers and IBPs and pursuing market
penetration
Fig 3 SWOT Matrix
External
Internal
Opportunities Threats
(1) Training programs and seminars are conducted by institutions
such as FPA and CPAP
(2) The openness of farmers to new knowledge in crop production
(3) The bright prospects for the plant
science industry towards the attainment of food security
(4) Increasing trend towards the
production of biopesticides (5) Availability of funding agencies
(6) The support of government and
NGOs for organic farming
(7) The negative perception on the use of chemical pesticides and fertilizers
(8) Small farmers are highly sensitive to
pesticide prices (9) Increasing competition in the industry
due to increasing number of new
entrants (10) The effects of climate change on the
industry
(11) Products of the industry are not highly differentiated
(12) Prices of inputs for the manufacture
of pesticides are volatile
Strengths
Introduction of different brands for
each type of pesticide
(S1 S2 and O1 O5)
Market Penetration
(S1 S3 and T1 T3 T6)
1 The firm has suppliers which are
members of CPAP
2 The firm has its BOD as distributors
3 They do not distribute Category I
pesticide 4 The company has developed
partnership with the dealers of
organic fertilizers
Weaknesses
Creation of customer retention
strategy for the dealers and IBPs
(W2 W3 W5 and O1 O2 O3)
Creation of customer retention strategy for the dealers and IBPs
(W2 W3 W4 and T1 T2 T3 T6)
1 Lack of warehousing facilities
2 Weak brand recognition
3 Non-commitment of dealers and
IBPs
4 Experiences stock-outs of products
5 The company does not have well-
established customer relationships
56 Insights and Directions It is apparent that though the agrochemical industry
has taken action in traversing the organic route toward
Is the Agrochemical Industry Traversing the Organic Route Insights and Directions for a Philippine
Agrochemical Trading Company
20
sustainability it has only taken small steps in that
direction Even if customers are clamoring for safe
food and in spite of the trend towards organic
agriculture and sustainability most farmers remain
indifferent toward using biopesticides and other
biologicals in farming on account of their sensitivity to
input prices and demand for more promotional
activities Thus in the next couple of years it is
expected that agrochemicals of a synthetic nature will
continue to dominate the global agrochemical industry
in terms of usage and market share Such a trend is
expected to spill over to Asia including the Philippines
as transnational companies take in a sizeable share of
the market
To survive and compete in the industry agroche-
mical trading companies must employ a number of
strategies such as introduce new brands for each
product type formulate a customer retention strategy
for its dealers and IBPs and pursue market penetration
Lastly in the case of Phil-Agrochemical Trading the
firm should consider CPAP membership and carry out
product stewardship agromedical traininginformation
education campaign and aerial spraying seminars to
enhance its competitiveness in the agrochemical
industry
References
Balayan L M A (2010) An apprenticeship study on
Bayer cropscience Gocus on its thrust towards
sustainable development through its quality health
safety and environment (QHSE) system (Under-
graduate Special Problem Report) Los Banos
Philippines University of the Philippines Los
Bantildeos
Castillo A (2000) A special problem report on Bayer
Philippines Inc (Undergraduate Special Problem
Report) Los Banos Philippines University of
the Philippines Los Bantildeos
Cuyson S (2007 March) Pesticides in sustainable
agriculture and the environment Paper presented
at the 38th annual scientific conference Tagbilaran
Philippines
David F R (2009) Strategic Management Concepts
and Cases (12th ed) Upper Saddle River NJ
Pearson Education
Dussal M (2011) Agrochemicals Retrieved from
httpwwwAgrochemicalInformationand Resour-
ceshtm
Lu J L (2009) Total pesticide exposure calculation
among vegetable farmers in Benguet Philippines
Journal of Environmental and Public Health 2009
Retrieved from httpwwwhindawicomjournals
jeph2009412054
Lum KY Mamat M J Cheah UB Castaneda
CP Rola AC amp Sinhaseni P (1993) Pesticide
research for public health and safety in Malaysia
the Philippines and Thailand Retrieved from
httpwwwnzdlorggsdlmode=d-00000-00-off-
0envl000010000direct-10401l11-en-5020-about-
00010004001110-0utfZz800ampcl=CL13ampd=HAS
H 016be195f7a6257ed84a093544ampgt=1
Palacio E B (2004) An apprenticeship study on the
crop protection division of syngenta corporation
(Undergraduate Special Problem Report) Los
Banos Philippines University of the Philippines
Los Bantildeos
Qin X F amp Kong F B (2006) Prospect and
situation of biopesticides Journal of Anhui Agri-
cultural Sciences 34(16) 4024 4057
The Philippines (1996) Philippine case study a
developing countryrsquos perspective on POPs Paper
presented at the IFCS Meeting on POPs Manila
Philippines Retreived from httpwwwchem
unepchpopsindxhtmsmanexp7html
Tirado R amp Bedoya D (2008) Agrochemical use in
the Philippines and its consequences to the environ-
ment Quezon Philippines Greenpeace Southeast
Asia Retrieved from httpwwwgreenpeacetopu
bliccationsGPSEA_agrochemical-use-in-the-phili
ppdf
Varca L M (2002) Impact of agrochemicals on soil
and water quality Food and Fertilizer Technology
J Glob Bus Trade Vol 9 No 2 (November 2013) 11-21
21
Center Retrieved from httpwwwagnetorg
libraryphpfunc=viewampid=20110804160130
Xu Y Z (2008) The application of biological
pesticides and industrial development measures
Chinese Agricultural Science Bulletin 24(8) 402-
404
Yang J L (2001) Green chemistry and technology
Beijing Beijing University of Posts and Teleco-
mmunications 176-180
Zhang W Jiang F amp Ou J (2011) Global pesticide
consumption and pollution with China as a focus
Proceedings of the International Academy of Ecol-
ogy and Environmental Sciences 1(2) 125-144
J Glob Bus Trade Vol 9 No 2 (November 2013) 23-27
23
ISSN 1946-5130
Journal of Global Business and Trade
wwwiagbtcom
A Study on the Dependency on Japan and the
Competitiveness of Gear Boxes
Kwang Hee Kim
Department of Business Administration Hyupsung University Korea
Received 15 August 2013 Revised 20 September 2013 Accepted 28 October 2013
ABSTRACT
From the trade deficit with Japan in 2012 of 2557 billion USD the trade surplus of material and components
industry was 2223 billion USD in deficit 87 of such trade deficit with Japan came from the material and
components industry
This study is to focus on the competitiveness index of absolute inferiority in automobile components as of
2012 and lsquogear box and other componentsrsquo that are over the trade for each amount of the automobile
components with Japan
Keywords competitiveness index(CI) dependence on Japan gear box industry trade deficit against Japan
Ⅰ Introduction3
As of 2012 Korea accomplished overall exports of
54787 billion USD and imports of 51958 billion USD
and as a result the trade surplus accomplished a
surplus of 2829 billion USD If this is limited to the
material and components industry the global exports
and imports were 25341 billion USD and 16249
billion USD respectively and as a result the trade
surplus recorded a surplus of 9092 billion USD that
the trade surplus exceeded 60 billion USD To put it
differently the present vast trade surplus mainly came
from the trade surplus of the material and components
industry
In the meantime the trade surplus with Japan
(2012) recorded a deficit of 2557 billion USD It was
less than the trade deficit with Japan for the previous
2013 International Academy of Global Business and Trade
All rights reserved
year 2011 (2864 billion USD) but it was attributable
to the decreasing imports from Japan from the
exchange rate with strong Yen and weak Won
currency The vast scale of the trade deficit with Japan
did not happen overnight
For this background the vulnerability of the
domestic material and components industry was the
greatest cause for the aforementioned From the trade
deficit with Japan in 2012 of 2557 billion USD the
trade surplus of material and components industry was
2223 billion USD in deficit 87 of such trade deficit
with Japan came from the material and components
industry
This study is to focus on the competitiveness index
(-091) of absolute inferiority in automobile compo-
nents as of 2012 and lsquogear box and other components
(8708-40-0000)rsquo that are over the trade for each
amount of automobile components with Japan
Through the foregoing the purpose is to analyze the
A Study on the Dependency on Japan and the Competitiveness of Gear Boxes
24
trend of export and import competitiveness on the
material and components industry with Japan and lead
a responsible strategy for improving the trade deficit
with Japan
Ⅱ Trade Surplus and Status
Looking into the global export and import scale of
lsquogear box and other componentsrsquo (2012) exports reached
2528801000 Dollars and imports 1568670000
Dollars as a result the trade surplus reached
1471934000 Dollars Looking into the export and
import scale with Japan on this item for the same year
it recorded the export of 2379 billion USD and import
of 491028 million USD as a result the trade deficit
recorded 467238 million USD
On the other hand the scale of trade deficit (-470
million USD) with Japan for lsquogear box and other
componentsrsquo was applicable for 18 of the entire
trade deficit with Japan (-2557 billion USD) and 21
of trade deficit with Japan for material and components
(-2233 billion USD)
Also looking only at the trade surplus with Japan
for automobile components (-430 million USD) the
trade deficit of lsquogear box and other componentsrsquo took a
high ratio applicable for 1159 that the status of these
item could be shown
Therefore relief from the trade deficit with Japan
by domestic automobile components industry could be
concluded as impossible without an improvement in
the trade deficit of the lsquogear box and other componentsrsquo
For reference from the costs of a completed car
the ratio for the gear box is known to be around 7-8
As such a gear box with a high ratio of production cost
also has the longest quality assurance limit in that it is
the core item for a high added-value to measure the
competitiveness of a complete car
As shown through the comparison with other
indices under the following Fig 1 the import scale
with Japan for the lsquogear box and other componentsrsquo is
very high Furthermore the import dependence of
Japan has declined from 801 in 1988 770 in
1998 597 in 2008 and 465 as of 2012 but the
import dependency on Japan may be assessed as high
Fig 1 Ratio of Gear Box in the Trade Deficit with
Japan (2012)
Source Prepared by the author by facilitating the Korea International Trade Association (2013)
The global export of this item has clear trend of
increase in recent days The trend of increase has been
significantly moderated from 252 million USD in
1988 to 9 million USD in 2000 However it began
with 2865 million USD in 2002 to leap to 6704
million USD in 2004 918 million USD in 2006
27079 million USD in 2008 and 75942 million USD
in 2010 and it increased to 1 billion 4234 million
USD in 2011 twice that of the previous year As of
2012 it has drastically increased to 2528801000
Dollars over 1 billion USD from the previous year that
exports has shown dramatic increase since 2009
In spite of that the exports to Japan of this item
were USD 970000 in 1988 USD 910000 in 1998
942 million USD in 2008 and 2379 million USD as
of 2012 it has seen very little increase for a quarter of
a century
On the other hand imports from Japan were
15506 million USD in 1988 19402 million USD in
1998 72344 million USD in 2008 and 965669
million USD in 2010 but it has plummeted to record
491028 million USD as of 2012 Compared to 2010
imports from Japan dropped less than a half
J Glob Bus Trade Vol 9 No 2 (November 2013) 23-27
25
Fig 2 Trend of Exports and Imports (1988~2012) of Gear Boxes (8708-40-0000)
Source Prepared by the author by facilitating the Korea International Trade Association (2013)
The trade deficit in automobile components with
Japan to this point has been pointed out with a cause of
importation in highly functional and high-tech
components impossible for domestic development
However according to the interview survey result on
the recent domestic automobile industry gear boxes
imported from Japan are mainly for large commercial
vehicles that are made for productivity purposes in
Korea
Ⅲ Price per Weight on Export and
Import Items
In order to consider the problems in lsquogear box and
other componentsrsquo in detail the price per weight price
of export and import items are analyzed for each price
Following is a brief summary of the export and
import scales and the status of gear boxes to Japan As
is well known in the case of Japan the status of gear
box exports and imports were an item with
overwhelmingly excessive exports Based on 2011
exports were 133 trillion Yen (approximately 18
trillion won) with 128 export countries On the other
hand the imports were only 606 billion Yen
(approximately 800 billion won)
The weight price of Japan for gear boxes is
approximately 1880 Yenkg for the gear boxes with a
high price imported as compared to the export product
price of 1500 Yenkg In particular the weight price
for the import item from the first import subject
country the Netherlands was 7380 Yenkg which
was overwhelmingly higher than the second country
the US of 1270 Yenkg Also the weight price of
export items from the US and Europe was around
1500 Yenkg but the import item price was 2000
Yenkg or higher
A Study on the Dependency on Japan and the Competitiveness of Gear Boxes
26
Table 1 Amount per Kg for Global Export and Import of Gear Boxes
Year Export Import
Amount (USD 1000) Weight (kg) USDkg mount (USD 1000) Weight (kg) USDkg
2005 119947 9259951 130 714512 45342883 158
2006 91804 8512492 108 778889 52223376 149
2007 127074 12051377 105 1066938 72512561 147 2008 270795 21068540 129 1212621 72940221 166
2009 307779 25239366 122 900597 53010625 170
2010 759422 58236825 130 1362034 81828230 166 2011 1423403 106723042 133 1405309 78567171 179
2012 2528801 180077148 140 1056867 59809776 177
A total of 8
years Average weight price 1246 Average weight price 1640
Source Prepared by the author by facilitating the Korea International Trade Association (2013)
On the other hand the weight price of imported
items from Korea was less than 1000 Yenkg for the
gear box an affordable price This fact could be
affirmed by the result calculated through facilitation of
the statistical data of Korea International Trade
Association by the author
In 2010 and 2012 the global weight price of export
items of Korearsquos lsquogear box and other components
(8708-40-0000)rsquo was 130 Dollarkg and 140 Dollarkg
respectively the import item price for the same year
was 166 Dollarkg and 177 Dollarkg respectively
There was a difference in weight price of 3 Dollarkg
or more between items of export and import (Table 1)
Looking into the trend of the 8-year period from
2005 to 2012 the weight price of import items was
higher than the export items The average weight price
of global export items for this item for the 8-year
period was 1246 Dollarkg while the average weight
price for the import item was 1640 Dollarkg there
was a unit price difference of 4 Dollarkg
Thereafter the weight price of the export item to
Japan for the above items in 2010 and 2012 was 81
Dollarkg and 74 Dollarkg respectively while the
import item price was 158 Dollarkg and 160
Dollarkg respectively there was a two times weight
price difference between the export and import items
(Table 2) Looking into the period of 2005 - 2012 for
the above the import items to Japan had a higher
weight price than the export items In addition the
average weight price of the export items for 8 years
was 1105 Dollarkg while the average weight price of
the import item was 1509 Dollarkg there was
approximately 4 Dollarkg or more of price difference
In addition the export amounts to Japan for 2010
and 2012 were 81 Dollarkg and 74 Dollarkg It
declined 4 Dollarkg or more compared to 2009 which
is considered as attributable to diverse types of gear
boxes exported with a drastic increase of exports to
Japan in these two periods
Characteristics of export and import items to the
world and Japan on the gear box and other components
(8708-40-0000) have a higher average weight price in
export and import to Japan than the export and import
items to the world have a higher average weight price
than the import items to Japan
Furthermore when comparing the weight price for
exports and imports to the world and Japan on this
item the import items were higher than the export
items To interpret it differently it is proof that the
export of the gear box had lower added value than the
imported items
J Glob Bus Trade Vol 9 No 2 (November 2013) 23-27
27
Table 2 Amount per Kg for Exports and Imports of Gear Boxes with Japan
Year Export Import
Amount (USD 1000) Weight (kg) USDkg mount (USD 1000) Weight (kg) USDkg
2005 14004 1010821 139 444022 29443945 151
2006 10124 805067 126 531454 38286910 139
2007 10180 845554 120 725042 55581305 130 2008 9420 708144 133 723444 49337793 147
2009 9235 743895 124 628173 39923189 157
2010 11075 1361065 81 965669 61103817 158 2011 19866 2284696 87 812394 49161068 165
2012 23790 3225976 74 491028 30683013 160
A total of 8
years Average weight price 1105 Average weight price 1509
Source Prepared by the author by facilitating the Korea International Trade Association (2013)
Ⅳ Conclusions
The following is the summary of contents shown
through the analysis of the lsquogear box and other
componentsrsquo
First the above items have shown a drastic
increasing trend for global export after 2009 but
export to Japan was still in a minimal increasing trend
close to horizontal line even as of 2012
Second characteristics of export and import items
to the world and Japan showed a higher average
weight price of export items to Japan than the export
items to the world and the import items from the
world had a higher average weight price than the
import items from Japan Also when comparing the
export and import weight prices with the world and
Japan for the above item the import items had a higher
rate than the export items To put it differently the
export of gear boxes was proven to have lower added
value than the import items
Lastly a brief mention was made on the direction
of the lsquogear box and other componentsrsquo
The recent assembly processing technology has
become standardized globally while the material and
components technology have been monopolized by
some advanced countries including Japan Because of
the foregoing the foreign currency earned from the
global market was turned over to Japan and the added
value for Korean industry has not been significant at all
Furthermore if the import of core material and
components such as lsquogear box and other componentsrsquo
is dependent on a specific country there is possible
subordination in the industrial structure with a high
possibility of losing the initiative in production and
price
Purchasing core material and components from
Japan was inevitable in the economic growth process
of Korea in the past but the time has come to make a
great change in the domestic industry
References
Grubel He G amp Peter L (1975) Intra-industry
trade The theory and measurement of interna-
tional trade in differentiated products London
UK MacMillan
Kim Kwang-Hee (2008) The competitiveness of
domestic auto parts industry against Japan The
Korean-Japan Journal of Economics amp Manage-
ments Studies 41
Kim Kwang-Hee (2013 June) A study on the
dependency on Japan and competitiveness of gear
box Paper presented at the 10th annual conference
and research symposium Mongolia National
University Mongolia
Korea International Trade Association (2013) Trade
statistics data Retrieved from httpwwwkitanet
J Glob Bus Trade Vol 9 No 2 (November 2013) 29-34
29
ISSN 1946-5130
Journal of Global Business and Trade
wwwiagbtcom
The Nature of Competition in an Indian Market Focusing on
the Volume Zone
Tirtha Bahadur Karki
Graduate school of Asian and International Business Strategy Japan
Received 14 June 2013 Revised 12 September 2013 Accepted 2 October 2013
ABSTRACT
Emerging countries are playing a growing role in the world economy It is a role that is expected to be even
greater in the future The recent global financial and economic crisis has further emphasized the stagnation of
most developed economics and taken prominence in emerging economics In particular China and India play
a significant role as global markets Henceforth it is estimated that the Indian volume zone will expand
rapidly and steadily On the other hand Japan and other developed economies tend to be sluggish Therefore
Japanese multinational corporations may have to target Indian volume zone consumers To do so they are
required to change their strategy management and production systems to compete with local and international
rivals in the market because the nature of the competition is totally different in an Indian market than other
developed country However definitions of the volume zone differ among research institutions researchers
countries and urban and local areas which creates considerable differences in the size of markets Thus in
this paper the literature review summaries and compares the definitions of the volume zone first Second this
paper tries to Fig out the most important part of the volume zone which has a key role in making a business
strategy Third differences between developed markets and the Indian market are examined and the nature of
competition in the Indian market is argued Finally the main argument and implication are stated
Keywords competition developed market emerging market Indian market strategy volume zone
Ⅰ Introduction4
There is very significant global interest in the
Indian economy Along with China Brazil Indonesia
and a few other countries India promises great potential
of growth in the next few years and decades The
future of the Indian economy is thus a significant
concern among the global financial and business
community economic policy-makers and managers
multilateral financial institutions economists and
2013 International Academy of Global Business and Trade
All rights reserved
other academics as well as investors and consumers in
India The significant global interest in India is not
surprising It is well known that - on a purchasing
power parity basis ndash India is already at over USD
four trillion of GDP the fourth largest economy in the
world very close to the size of the Japanese economy
the third largest In the next 15 to 18 years this size is
expected to grow as per various studies and estimates
four to five times As a result many foreign investors
and a majority of global companies and businesses are
making a beeline for the Indian market which
The Nature of Competition in an Indian Market Focusing on the Volume Zone
30
promises a booming volume zone5 of a few hundred
million consumers (Fig 1) expanding steadily in the
next few decades
Fig 1 Shares of Global Middle Consumption
2000-2050
Source Kharas (2010)
On the other hand advanced economies including
Japan are slowing down Japan has been in a long
recession with a real GDP growth rate of 39 in 2010
It underlines the world economy shift from developed
nations with their huge populations rising household
incomes and expansion of consumer goods and
service markets toward the emerging economies6
From these perspectives the expansion of the
Indian volume zone has attracted considerable
attention Many Japanese firms have already adjusted
their strategy management and production systems in
order to compete with the Indian volume zone
However there are no official definitions of volume
zone7 and these definitions differ among research
institutions researchers countries and urban and local
areas This creates considerable differences in the size
of volume zone markets Thus the literature review
summarizes and compares the definitions of volume
zone arguements After identifying the important part
of the volume zone (what is the volume zone what is
the trend of the volume zone etc) this paper argues the
differences between developed markets and the Indian
5 It is also called middle class middle income class and
middle income In this paper the middle class is identified as volume zone
6 The countries and consumers team 2010
7 Eric D et al (2007) Kharas (2011)
market which is very useful in knowing the nature of
competition in the Indian market Finally the main
argument and implications are stated
11 Definitions of Volume Zone
There are various definitions of volume zone based
on annual household disposal income annual
household income and expenditure Since the
definition of volume zone is not standardized with
each countryrsquos factors it remains uncertain Thus we
need to define and examine the Indian volume zone
which is most important in order to Fig out a business
strategy
12 Annual Household Disposable Income
The Ministry of Economy Trade and Industry
(2010) Aoshima Kubota and Sakamoto (2009) Japan
research institute (2010) Mizuho Research Institute
(2010) and Yanagawa and Mori (2010) defined the
Asian volume zone including that of India as
comprising people whose annual household disposa-
ble incomes range between $5000 and $35000 (upper
middle class $15001-35000 lower middle class
$5001-$15000 lower class $1000-$5000 the poor
up to $1000) and the rich as those whose annual
household disposable incomes exceed $35000 On the
other hand Indiarsquos National Council of Applied
Economic Research (NCAER report 20052006)
defined the Indian volume zone as comprising people
whose annual household disposable incomes range
between $22320 and $4444 (Rs1000000-Rs200000
at 20012002 price)
Comparing these two definitions of volume zone
(Fig 2) the former defines that the annual household
disposal incomes of people in the volume zone tends to
be higher at $5001 to $35000 and the latter defines
that the incomes of people in the volume zone tends to
be lower at $4444 to $22320
J Glob Bus Trade Vol 9 No 2 (November 2013) 29-34
31
Fig 2 Definitions of Volume Zone by Annual
Household Disposable Income
13 Annual Household Incomes
First the World Bank (2007) and Milanovic and
Yitzhaki (2002) defined the global volume zone as
those with annual household incomes between the
mean incomes of Brazil and Italy that is an annual per
capita income of approximately $4000-$17000 (at
2000 purchasing power parity (PPP)) Second Bhala
(2009) adopted an absolute approach definition with
an annual per capita income of $3900-$113000 in
PPP terms Third Court and Narasimhan (2010)
divided the consumers of developing countries
including India into the following classes on the basis
of their annual household incomes global class
$113000 and above upper middle class $56500-
$113000 middle class $22500-$56499 lower
middle class $13500-$22499 and deprived class
below $13500 From this distribution the middle class
is defined as those with an annual household income of
$13500-$113000 in PPP terms
In order to compare these definitions Fig 3
presents the minimum and maximum annual incomes
that were specified by various researchers Bhala (2009)
specified the minimum annual income as $3900
which is much lower than that specified in other
definitions
Fig 3 Definitions of Volume Zone by Annual
Household Income
14 Expenditure
Some researchers defined the volume zone on the
basis of expenditures In 2007 Banerjee and Duflo
(2007) defined it on the basis of per capita expenditure
between $2-$4day In 2008 they defined the global
volume zone on the basis of per capita expenditure of
$2-$10day in 1993 PPP (Banerjee amp Duflo 2008) On
the other hand Ravallion (2010) defined it on the basis
of per capita expenditure between $2-$13 day Both of
these expenditure based definitions are used only in
emerging economies
Fig 4 Definitions of Volume Zone by Expenditure
These two definitions also show differences since
the higher bound is $10day and $13day In summary
the volume zone is defined differently on the basis of
various standards locations and economies Owing to
its complexity and variety the volume zone consumersrsquo
jobs incomes consumptions lifestyles and subjective
The Nature of Competition in an Indian Market Focusing on the Volume Zone
32
consciousness of the levels of society must also be
considered for defining the Indian volume zone
Ⅱ Catching the Trend
In order to consider the differences between the
definitions of volume zone this paper argues about
most important part of the volume zone to make a
better strategy in business The management team in
business must know about the volume zone but
$3900 or $4000 (Fig 3) in annual household income
does not make a vast difference in its strategy and
consumers lifestyle In relation to the poor by
associating it with an ability to choose to spend time
and money on something other than survival consider
the volume zone in the case of Indian markets where
estimates range from 30 million to approximately 300
million people
The volume zone is not (yet) the biggest segment
of Indiarsquos overall population Given all the attention
focused on Indiarsquos middle class in recent years it is
important to keep a proper perspective on its size and
potential purchasing power Even using the most
generous estimates of the grouprsquos size the volume
zone comprises less than 30 percent of the population
Thus the rich and the poor combined far outweigh the
Indian middle class The importance of the middle
class lies in the fact that it is the fastest growing
segment of the population Evidence shows that as
income increases the amount and variety of this
discretionary spending increases For corporations the
middle class in India thus presents significant business
opportunities The sales growth of consumer goods
such as televisions and mobile phones to the middle
class has already been established Given the
tremendous growth potential an increasing number of
products are being geared towards the volume zone
population In the transport industry which has
traditionally been dominated by rail travel newer cars
like the Tata Nano (which retails for a little over USD
3000) and low-cost airlines have enabled the volume
zone population to be increasingly mobile The growth
of the volume zone and the economic growth of India
are in a virtuous cycle Rising incomes lead to more
consumption which in turn leads to higher economic
growth then more employment opportunities and
subsequently higher wages and the circle starts again
Thus as the volume zone grows and continues to
increase domestic demand the economy will also
continue to grow Regardless of which definition is
correct and certain it is important to keep a proper
perspective on the potential of the volume zone The
volume zone in India has generated tremendous
interest from the media and multinational corporations
are looking for a new market demographic
Ⅲ Developed Markets and the Indian
Market
In recent years Indiarsquos market growth has
outstripped the developed markets In the 80s GDP
growth in developed nations and India was essentially
the same Between 2000 and 2010 average growth in
the Indian market rose to the point where it was three
times higher Besides this India has corruption less
infrastructure fare of terrorism and etc which are
abnormal in a developed country
Consumers in India tend to be more ethnocentric
than those in developed ones Products from the
western hemisphere are seen by Indian cultures as
carrying western values that might harm their society
as well as the local workforce In developed countries
price quality durability and other product-related
aspects are the major factors that influence buying
decisions Consumers in India tend to be less indivi-
dualistic than in developed ones They care more for a
larger local community and like to be identified as part
of it Advertising which exhibits local values and
traditions has a greater impact on consumers of India
whereas the more individualistic consumers from
developed countries are more influenced by adverti-
sing where the product differentiates itself specifically
from other products in the market
J Glob Bus Trade Vol 9 No 2 (November 2013) 29-34
33
These are the common differences between the
Indian market and developed markets Besides these
there are lots of differences between Indian markets
and developed markets
A survey held by the Graduate School of Asian
and International Business strategy8 in October 2011
on the title of ldquoEntry Strategy of the Japanese Firms in
India and Chinardquo shows that Japanese firms in India
are going to change their target from the upper
(wealthy) class to the Volume Zone (Fig 5) In 2011
581 percent of the Japanese firms replied that they are
targeting upper class customers in India By the way
the survey shows only 274 percent of firms were
targeting the upper class after 3 years (2014) and more
firms targeted the middle class Thus we can
understand the Japanese strategies are shifting from the
upper class to the Volume Zone
Fig 5 Shifting Strategy in India
Ⅳ Conclusion
Thus it is clear that the Indian volume zone is
expanding and Japanese companies are shifting their
strategy from the upper class to the volume zone The
problem is the presence of Japanese companies in the
Indian market where Japanese companies are domi-
nated by Korean and European-American companies
8 Principle of Asia University DrIkejima Masahiro
leads the survey
According to Shintaku and Amano (2009) develo-
ped countriesrsquo firms have more strong technology and
find it more difficult to target the volume zone of
emerging markets and to adopt the strategy locally
There is no room to think about if the strong tech-
nology of a company is harmful for its strategy in
emerging markets The problem is how to approach
the volume zone and this is important Specially the
volume zone comes from the lower class and
companies should know their lifestyle and behavior If
firms understand the value of money for the volume
zone they can easily shift their strategy too This helps
them succeed in the Indian volume zone
Finally the conclusion of this paper presents the
hypothesis for further research about how to approach
the volume zone of India The hypothesis is (Fig 6)
ldquoTo compete successfully in the Indian volume zone
firms need to catch the trend of the volume zone and
educate customers construct market infrastructure
train management personnel and understand the
abilities of the supply side are essential This is why
they need to cultivate their resources at a lower level
than they are targeted (volume zone)
This paper cannot include the case study and
cannot examine the strategy That will be further
researched by this author in the future
Fig 6 Possible Way to Succeed in the Volume
Zone of India
The Nature of Competition in an Indian Market Focusing on the Volume Zone
34
References
Akihisa Yahata (2012) IndiaASEAN business guide
Two challenges of market creation in emerging
countries Tokyo Japan Research Institute
Retrieved from httpwwwjricojppagejspid=
22012
Aoshima Minoru Kubota Yosuke amp Sakamoto
Ryohei (2009) Manufacturing for emerging eco-
nomics that has entered the second stage Learning
to emerging economics strategy of electronics
industry focused on the middle of the economic
pyramid Knowledge Creation and Integration
17(12) Nomura Research Institute Retrieved from
httpswwwnricomjpopinionchitekishisan2009
pdfcs20091208pdf
Banerjee A V amp Duflo E (2008) What is middle
class about the middle classes around the world
The journal of economic perspectives a journal of
the American Economic Association 22(2) 3
Bhalla S (2009) The middle class kingdom of India
and China Wasington DC Peterson Institute for
International Economics
Court D amp Narasimhan L (2010) Capturing the
worldrsquos emerging middle class The McKinsey
Quarterly 1-6
Dyck S Hansakul S amp Saxena R (2009)
Emerging Asiarsquos middle class-A force to be
reckoned with (eSocialSciences Working Paper
No 2232) Retrieved from httpeconpapersrepec
orgRePEcesswpaperid2232
Eric D B Diana F amp Adil S Z (2007) Tracking
the growth of Indiarsquos middle class The McKinsey
Quarterly 51-61
Japan Research Institute (2010 October) Chinarsquos eco-
nomic policy debate heats up in run up to party
congress Asia Monthly 10(115) 1-15
Kharas H (2011 June 13) India China middle class
boom faces many challenges FIRSTPOST
Retrieved from httpwwwfirstpostcomworld
china-india-middle-class-boom-24637html
Milanovic B amp Yitzhaki S (2002) Decomposing
world income distribution Does the world have a
middle class Review of Income and Wealth
48(2) 155-178
Ministry of Economy Trade and Industry (2010)
White paper on international economy and trade
2010 Tokyo Author
Mizuho Research Institute (2010) Japan companies
deviating from volume zone market of China and
India (Mizuho Report) Tokyo Author Retrieved
from httpwwwmizuho-ricojppublicationresearch
pdfreportreport10-0407pdf
National Council of Applied Economic Research
(2005) Annual resport 2005 Retrieved from
httpwwwncaerorgdownloadsannualreportsan
nualreport_2005pdf
Shintaku Junjiro amp Amano Tomo (2009) Emerging
market strategies changes in market and resource
strategies The Journal of Economics 75(3) 40-62
Syusuke Watanabe Tokutaro Hiramoto amp Naoya
Tsuaaki (2012) Developing BoP business as the
principal strategy in 70 trillion of emerging and
developing economics Paying the road to a new
market that is expected to reach 55 billion people
Knowledge Creation and Integration 20(1)
Nomura Research Institute Retrieved from
httpswwwnricomjpopinionchitekishisan2012
pdfcs20120103pdf
Shukla R (2010) How India earns spends and saves
unmasking the real India New Delhi India
SAGE Publications India
Ravallion M (2009) The developing worldrsquos bulging
(but vulnerable) ldquomiddle classrdquo World Development
38(4) 445-454
Sridharan E (2004) The growth and sectoral
composition of Indiarsquos middle class Its impact on
the politics of economic liberalization India
Review 3(4) 405-428
Yanagawa Noriyuki amp Mori Naoko (2010) Income
bracket towing Asiarsquos domestic demand (NIRA
Monograph Series No 31) Tokyo National
Institute for Research Advancement Retrieved
from httpwwwniraorjppdfmonograph31pdf
J Glob Bus Trade Vol 9 No 2 (November 2013) 35-44
35
ISSN 1946-5130
Journal of Global Business and Trade
wwwiagbtcom
Analysis of Public Health Expenditures on Leading Causes of
Morbidity in the Philippines
Paul Joseph B Ramireza and
Earl Joanne S Santos
b
b College of Economics and Management University of the Philippines Los Bantildeos Philippines b Corresponding Author College of Economics and Management University of the Philippines Los Bantildeos Philippines
Received 21 August 2013 Revised 25 September 2013 Accepted 29 October 2013
ABSTRACT
Provision of public goods and services is one of the major roles of the government in an economy Some of
the public goods and services that are being provided cause negative effects while others create positive
externalities One evident case of such is the market for health care Aware of its role to provide health care to
the people governments are even more challenged with the remarkable growth of the demand for health care
Furthermore there are market failures existing in the health care sector Given that the paper examined the
effects of public spending on health care specifically on the principal causes of morbidity in the Philippines
Aside from public spending the paper also took into account private health spending in the analysis The
study employed a pooled ordinary least squares regression model Results showed that the increase in
government spending significantly reduce the number of tuberculosis cases in the Philippines On the other
hand results for diarrhea indicated that public spending and number of diarrhea cases are positively related
The findings imply that although an increase in public health expenditures can have a significant impact on
the number of cases of diseases lowering tuberculosis cases for instance the study can be further extended by
valuing as well the other benefits that can be derived from a prevented sickness resulting from an increase in
public health expenditures
Keywords health care morbidity positive externalities public goods public health expenditures
Ⅰ Introduction9
Economics texts suggest different extents to which
the government can intervene in market activities
Classical economists advocate that the main and in
some instances only role of the government is to
ensure peace and order in the economy ie ensuring
property rights are properly defined and laws and
policies are well-enforced Keynesian economists on
the other hand believe that the government has a
2013 International Academy of Global Business and Trade
All rights reserved
significant role as Keynes demonstrated during the
Great Depression At present different economies adopt
different blends of the two extreme cases However
common to all economies is the need for government
intervention in the presence of market failures and
missing markets given that the government can do
better than the market ie such intervention will not
lead to government failures resulting in further
inefficiencies
It is a known fact that one of the major roles of the
government in an economy is the provision of public
goods Paying no attention to it would result in under-
Analysis of Public Health Expenditures on Leading Causes of Morbidity in the Philippines
36
provision of such goods or worse not being provided
at all due to the free-rider problem Another widely
acceptable role of the government is to provide goods
or services that create a positive externality to the
society These goods or services are usually socially
underprovided since the individual in hisher own
private desire to maximize utility doesnrsquot consider the
beneficial effects to the society of such activities
Examples of such services are education and health
care This paper will provide a general overview of the
global demand for health care then focus on the role of
the government in health care provision in the
Philippines
Ⅱ Global Demand for Health Care
The concern for health is a global phenomenon
Despite the costs of health care services the demand
for health care is growing everywhere in the world
The surge of aging and chronic illnesses in the
developed countries and the shooting requirements of
the rising middle class accompanied by the lsquodiseases
of prosperityrsquo in the developing countries are all
driving demand Global pandemics that threaten the
world as well as environmental changes that cause
dramatic health care challenges are also adding up in
the demand for health care services
The rising demand for health care is evidenced by
the increased spending on health services The worldrsquos
total health expenditure as a percentage of Gross
Domestic Product (GDP) grew by 15 from 82 in
2000 to 94 in 2009 (Table 1) The American region
posted the highest growth in health expenditure as a
percentage of GDP at 26 while the South East
Asian region showed the least at 2 The growing
expenditure on health services are born from both the
public and private Public spending on health care is at
least about 50 for most of the countries The
spending has likewise grown by two percentage points
in excess of GDP growth across all Organization for
Economic Co-operation and Development (OECD)
countries for almost 50 years and is expected to be
more than a fifth of GDP by 2050 if the current trend
persists (Drouin et al 2008) As a result government
health agencies together with patients and health care
companies particularly in developing economies are
alarmed with the growth of health care spending
Given its current share of health care expenditures the
government is confronted with other increasing
demands of its people such as education defense and
pensions aside from demand for health care and the
escalating prices of health services
Table 1 Health Expenditure Ratios 2000 and 2009
Region
Total
expenditure on health
as of gross
domestic product
General government
expenditure
on health as of total
expenditure
on health
Private
expenditure on health
as of total
expenditure on health
General government
expenditure
on health as of total
government
expenditure
External
resources for health as
of total
expenditure on health
Social security expenditure on
health as of
general government
expenditure on
health
2000 2009 2000 2009 2000 2009 2000 2009 2000 2009 2000 2009
African Region 55 65 439 493 561 507 82 96 65 102 79 70
Region of the Americas 114 144 451 493 549 507 145 169 01 01 317 720
South-East Asia Region 37 38 319 371 689 629 44 49 09 16 133 144 European Region 80 93 739 749 261 248 140 146 01 01 522 495
Eastern Mediterranean
Region 42 47 472 509 528 491 69 71 10 11 184 194
Western Pacific Region 60 65 639 644 361 356 138 144 02 02 681 686
Global 82 94 563 591 437 408 133 143 03 04 451 595
Source World Health Organization (2012)
J Glob Bus Trade Vol 9 No2 (November 2013) 35-44
37
Moreover health care expenditures are signify-
cantly associated with improved health outcomes with
public health care expenditure having a larger impact
(Navignon et al 2012) Hence health care expendi-
tures are vital to improving the health status of the
society Relatedly Hurley (2000) stated that ldquothe
market failures that pervade the health care sector
create an important role both for non-market
institutions and for normative economic analysis to
help sort the ldquogoodrdquo policies from the ldquobadrdquo Thus
from a public policy perspective it is valuable to know
how a policy variable like public expenditures on
health care affects the principal causes of morbidity
rates
Ⅲ Status of Public Health
Expenditures in the Philippines
Public health expenditures include current and
capital spending from government budgets external
borrowing and grants and social health insurance
funds (HDR 2007) Although Fig 1 shows that the
budget allocated for public health care in the
Philippines is increasing in the past few years Fig 2
shows that compared to other Southeast Asian
countries the Philippines is actually way behind in
terms of public health care spending as percent of GDP
As a matter of fact according to the Human
Development Report (2007) the Philippines is one of
the countries around the world with the lowest
percentage ( of GDP) spent on public health
expenditure at 14 This current condition would
have a significant impact on the health and ultimately
the over-all productivity of the members of society
For instance the results of the study of Granlund (2006)
indicated that public expenditures on health care have
an effect on the number of absence days of individuals
Furthermore the results showed a positive causality
between health care expenditures and the health of the
society (Granlund 2006)
Sources Department of Budget and Management (2001-
2009)
Source Asian Development Bank (2008)
Since the budget for health is much less in the
Philippines as compared to most countries (and can be
safely assumed to be inadequate) the paper would
want to look at the impact on morbidity incidences
from increasing the current public spending on health
Though the study will just be limited to measuring the
impact on morbidity the results can then be used to
derive the value to society of higher public
expenditures in terms of less people afflicted or
infected by various diseases Unlike in the situation
where the public health care expenditure is already
sufficient (or optimal) it will be much easier to
estimate the external cost of inadequate public health
expenditure by measuring the forgone benefits (say it
resulted to an absence) from those people who were
infected In addition the results of the study could be
used to measure the externalities valued in terms of
cost savings if the spread of the disease was prevented
Analysis of Public Health Expenditures on Leading Causes of Morbidity in the Philippines
38
Ⅳ Leading Causes of Morbidity in the
Philippines
Morbidity may be referred as the state of poor
health the degree or severity of a health condition or
an incidence of a disease In the case of the Philippines
the leading cause of morbidity is pneumonia with an
incidence rate of 718 (per 100000 population) Table 2
shows the top ten leading causes of morbidity in 2007
while Fig 3 shows the trend in the number of cases in
the past few years for the major causes of morbidity
Table 2 Ten Leading Causes of Morbidity
Philippines 2007
Disease Number
of cases
Rate per
100000 population
ALRI and Pneumonia 605471 718
Acute Watery Diarrhea 539701 640 BronchitisBronchiolitis 487302 5778
Hypertension 398538 4726
Influenza 349609 4146 TB Respiratory 114714 136
Diseases of the Heart 31331 372
Dengue Fever 23773 282 Malaria 23207 275
Chickenpox 23090 274
Source Department of Health (2002)
Source Department of Health (2002-2007)
From Fig 1 and Fig 3 it seems that the increasing
public health care expenditures didnrsquot lead to a
significant decrease in the leading causes of morbidity
in the past few years However we cannot conclude
this immediately since there are other factors affecting
the number of cases like private health care
expenditures and population growth These other
variables would be considered later in analyzing the
impact of public health care expenditures on the
number of cases
Ⅴ Characteristics of Health Care
According to Hurley (2000) health care is distinct
from other commodities because of health care having
a combination of features that is only present
individually in other commodities Most of these
characteristics result in market failure or missing
markets causing inefficiencies like in the presence of
externalities information asymmetry and uncertainty
In each of these characteristics the government may be
able to minimize the inefficiencies resulting from these
market failures through public expenditures on health
care (which can be looked at as the policy variable of
the government) This somehow justifies the need for
government intervention on health care as a response
to these characteristics of health care
Though it is desirable to be able to disaggregate
public health expenditure as an answer to each of these
characteristics of health care it will not be easy as
policies on public health care usually answer the
inefficiency problem as a whole Thus the study
would focus on the rationale for public health care
expenditure as it provides a positive externality to the
society
51 Health as a Merit Good
A merit good is a good or service that is regarded
as desirable by the society such that the government
intervenes in its provision The idea is that these goods
and services provide positive externality to the society
and if left to individuals would tend to be under-
provided Thus the government can intervene to
correct this under-provision Common examples of
these merit goods are spending on public services such
as public education and public health care
In general the external benefits from health care
can be looked at in various ways According to Hurley
(2000) people may derive external benefit from
knowing that others receive the needed health care
J Glob Bus Trade Vol 9 No2 (November 2013) 35-44
39
services and not just any health care that a person can
afford In addition the externality from health care can
be looked at as the measure of joy (or prevention of
pity) caused by seeing a healthy person rather than a
sick one The problem however with this valuation of
the externality is that such joy or pity cannot be easily
quantified
An alternative way of looking at the positive
externality provided by the adequate (optimal) amount
of spending on public health would be the cost savings
from those who would have been affected if such
public health expenditures were not adequate (optimal)
The obstacle though is finding these cost savings if the
optimal amount of health expenditures is already in
place This is because one cannot predict who among
the millions or billions of people would have been
externally affected if the existing public health
expenditures were not in place In the case of countries
where public health expenditure is still inadequate we
can analyze the cost savings by looking at the effect of
an increase in public health expenditures on the people
who are currently experiencing diseases which may
have been prevented if the optimal level of expenditure
was in place
52 Prevention versus Cure
It is important to consider that the positive exter-
nalities from having optimal health expenditures can
be realized if such expenditures may have prevented
the spread of a communicable disease Thus if most of
the health expenditures were rather used for cures then
these positive externalities as we defined earlier
would not be realized to the fullest It is still important
to take note that cures also result in a positive
externality since it prevents the further spreading of the
disease given the carrier of the disease is cured as soon
as possible The government expenditures on disease
prevention and control and for infectious disease
prevention and control are exhibited in Fig 4 and Fig
5
Sources Department of Budget and Management (2002-
2009)
Sources Department of Budget and Management (2002-
2009)
Note that the sudden increase in the budget
allocated in both Figs during the 2008 and 2009 was
due to the Intensified Disease Prevention and Control
program introduced during 2008 This almost doubled
or tripled the budget allocation to these items as
compared to years before 2008 It is then desirable to
be able to see the impact of this significant increase in
the public health expenditures on the number of cases
however the data on the number of cases for 2008 is
not yet available
53 Communicable versus Non-
communicable Diseases
Externalities provided by the adequate amount of
spending needed for health care is more apparent in the
presence of communicable diseases In addition to the
general external effects discussed earlier communi-
cable diseases have additional external effects via the
probability of a healthy person being infected by the
Analysis of Public Health Expenditures on Leading Causes of Morbidity in the Philippines
40
person carrying a communicable disease Public
health expenditure may then lower this possibility of
infection to healthy people by providing health care for
people who cannot afford the needed medication
The situation under communicable diseases some-
how distorts the utility maximization problem of
individuals since the presence of a sick person implies
a higher chance of being sick also and thus lowers the
utility of the individual This external effect as pointed
out earlier would cause inefficiency if not recognized
Even though the benefits from societal prevention and
cure of communicable diseases are known the
problem changes to what we know as the free-rider
problem if individuals are left alone to solve the
problem
As we all know voluntary contribution would not
solve the problem due to the free-rider problem Free-
riding would be evident since contribution to
prevention doesnrsquot assure the contributor that he will
be the one that will be saved from the disease ie with
the prevention measures we assume that the infected
individuals will be much less but this doesnrsquot
specifically tell who these individuals are Since this is
the case a person may claim that he doesnrsquot need
prevention measures anyway since with or without the
prevention measure his final state will just be the same
(ie two extreme cases very healthy that in the end he
will be healthy or very vulnerable that heshe will
always be affected anyway) It is likewise possible that
people rather than donate may just choose to put this
prevention contribution into private health expendi-
tures by buying vitamins that give additional protection
or immunity This is the reason why public health
expenditure is essential in the case of communicable
diseases
We can then expect a more significant impact of
higher public expenditures on health care on the
number of communicable diseases as compared to
non-communicable diseases because of the additional
benefits from prevented infection Also we can expect
that public expenditures on health will have a lower
impact as compared to private health expenditures on
non-communicable diseases The paper would then
verify these hypotheses
Ⅵ Sources of Data and Analytical
Procedure
61 Sources of Data
The data used in the study were from various
national survey results gathered by various depart-
ments and agencies of the government Data for the
leading causes of morbidity and the number of cases
every year were taken from the Field Health Service
Information System (FHSIS) Annual Report The
FHSIS Annual Report reflects the activities and health
program accomplishments of the Department of
Health in the Philippines for a given year and serves as
a reference for planning and decision-making at the
local and national levels (FHSIS 2004) The FHSIS
also contains statistics on health systems health status
health services coverage and notifiable diseases in the
Philippines For the purposes of this study the data
utilized were the number of cases per region and per
year of the leading causes of morbidity in the
Philippines such as bronchitis tuberculosis influenza
hypertension and diarrhea
Data on Philippine government health care expen-
ditures were taken from the National Expenditure
Program (NEP) The NEP is an annual publication by
the Department of Budget and Management that
contains the details of the governmentrsquos proposed
program and intended to assist Congress in the review
and deliberation of the proposed national budget for
the legislation of the annual appropriations measures
for the succeeding fiscal year (NEP 2003) Annual and
per region data on public health expenditures were
elicited from the national government budget allocated
to the Department of Health Though it is desirable to
be able to split the expenditures into preventive and
curative measures the available data did not have such
information at the regional level
Data on household (private) expenditures for
health care were obtained from the Family Income and
J Glob Bus Trade Vol 9 No2 (November 2013) 35-44
41
Expenditure Survey (FIES) The FIES is a nationwide
survey of households undertaken every three years by
the National Statistics Office that contains data on
family income and expenditure such as levels of
consumption by item of expenditure as well as sources
of income in cash and in kind and provides
information on the levels of living and disparities in
income of Filipino families (FIES 2006) The study
utilized regional data on the average household
expenditure on medical care Data on the population
per region were also taken from the FHSIS Annual
Report while data on the number of households were
taken from the FIES
62 Analytical Procedure
As stated above it is not enough to just look at the
trends of morbidity cases and public expenditure to be
able to assess the impact of the latter to the former
There are other variables such as private health
expenditures and population at that period of time that
may also significantly affect the number of cases The
paper used a pooled ordinary least squares regression
model to analyze the impact of public health care
expenditures on the number of cases for the major
causes of morbidity in the Philippines from 2002-2006
across regions The model is given by
cases = f(pop privexp pubexp) where pop ndash regional population
privexp ndash average household expenditures
on health
pubexp ndash public health expenditures (lsquo000)
It is hypothesized that there is a positive relation-
ship between the number of cases and population On
the other hand a negative relationship between both
private and public expenditures and the number of
cases is expected
Ⅶ Results and Implications
71 Results and Discussion
Results from the empirical models of the different
morbidity causes are reported in Tables 3 and 4 Notice
that only the results for tuberculosis and diarrhea were
reported since neither public nor private expenditures
on health were able to explain the variation in the
number of cases for bronchitis pneumonia influenza
and hypertension
Table 3 Regression Results for Tuberculosis Cases
variable Coefficient standard error p-value
pop 00018028 00001077 0000
privexp -06158907 02659049 0023 pubexp -00059089 00024357 0018
constant 2103315 8129887 0012
Note highly significant at 1 significant at 5
711 Tuberculosis
The regression result showed that the model is
significant and was able to explain 87 of the
variation in tuberculosis cases based on the computed
adjusted R-squared Public and private expenditures on
health care were found to be significant (at 5) in
explaining the variation in the number of tuberculosis
cases while population was found to be highly
significant (at 1) The results conform to the
hypotheses that an increase in both public and private
spending on health care would result to a decline in the
number of tuberculosis cases Also an increase in the
population results in an increase in the number of cases
which was also expected
Estimates showed that on the average an increase
in the population by 555 increases the number of
tuberculosis cases by one Results also showed that an
increase in public health expenditures decreases the
number of tuberculosis cases Specifically the
estimated coefficient implies that on the average an
increase in public health expenditures by PhP169236
would lead to a one unit decrease in the number of
tuberculosis cases With the PhP16 billion total budget
for health in 2006 (PhP154 million of which was
allocated for tuberculosis prevention and control) an
additional 1 increase in government health expendi-
tures would approximately reduce the number of
tuberculosis cases also by 1 for the same year at the
Analysis of Public Health Expenditures on Leading Causes of Morbidity in the Philippines
42
country level In addition estimates showed that an
increase in the average household private expenditure
on health by PhP162 would result in a unit decline of
tuberculosis cases The value seems low at first glance
but this translates to a total of PhP166 million
spending on health for the household sector from the
174 million Filipino families across 17 regions in
2006 necessary to reduce tuberculosis cases by one
Interestingly public health expenditure seems to be
less costly in terms of preventing tuberculosis cases in
the country This is due to the fact that majority of
tuberculosis cases are experienced by poorer
households that rely more on public health care rather
than private health care which they cannot afford
Public health expenditures are also ideal for
tuberculosis cases because of the ancillary benefits
these provide by preventing the spread of this
communicable disease among the population
Table 4 Regression Results for Diarrhea Cases
variable coefficient standard error p-value
pop 00073148 00007181 0000
privexp -5919509 1773756 0001
pubexp 00385644 00162475 0020 constant 9123934 5423155 0097
Note highly significant at 1 significant at 5
712 Diarrhea
The regression result showed that the model is
significant and was able to explain 70 of the varia-
tion in diarrhea cases based on the computed adjusted
R-squared Public expenditures on health care were
found to be significant (at 5) in explaining the
variation in the number of diarrhea cases while
population and private expenditures on health care
were found to be highly significant (at 1) The results
conform to the hypothesis that an increase private
spending on health care would result in a decline in the
number of diarrhea cases while an increase in the
population results to an increase in the number of cases
However public health care expenditure and the
number of diarrhea cases were found to be positively
related One possible explanation for this result is that
public expenditure on health may be more oriented to
communicable diseases than non-communicable
diseases ie compared with the results of tuberculosis
In addition there are other significant factors that may
be affecting the prevalence of diarrhea which are not
incorporated in the public health care expenditures say
the availability of or access to safe drinking water
among others
Nevertheless results showed that an increase in the
average household private expenditure on health by
PhP017 or equivalently a total of PhP0174 million
spending on health for the household sector would
result in a unit decrease in the number of diarrhea cases
Estimates also showed that on the average an increase
in the population by 137 increases the number of
diarrhea cases by one in the country Results also
showed that an increase in public health expenditures
decreases the number of tuberculosis cases
72 Conclusions Implications and Further
Studies
The result of the study showed that public
expenditures on health care have a significant effect on
the number of tuberculosis cases in the Philippines
Although results for the other cases show that public
expenditure failed to explain the variation in the
number of cases it may be attributed to the unavaila-
bility of disaggregated data allocated for specific
diseases in each region This then can be considered as
the limitation of the study Nonetheless the results of
the study can be used to provide a rationale for the
abrupt increase in the spending for disease prevention
and control for 2008 and 2009
As pointed out earlier the result of the study can be
further extended by valuing the benefits that can be
derived from a prevented sickness resulting from an
increase in public health expenditures The benefits
may include the loss income from being absent
because of the disease and the prevented private
expenditures to prevent the disease Of course the
general external effects of being healthy or seeing a
healthy person may also be included as part of these
benefits These non-marketed goods which are
J Glob Bus Trade Vol 9 No2 (November 2013) 35-44
43
common to the health sector can be measured using
contingent valuation methods such as willingness-to-
pay (Hurley 2000) Knowing these benefits one can
then do a cost-benefit analysis of an increase in public
expenditure on health care Thus if the net benefits
that can be derived from a prevention of a tuberculosis
case is higher than PhP169236 which is the cost of
preventing it then it is rational for the government to
pursue an increase in public health care expenditure
References
Asian Development Bank (2008) Key indicators for
Asia and the Pacific 2008 Manila Author
Retrieved from httpwwwadborgsitesdefault
filespublication27728key-indicators-2008pdf
Connelly L B (2004) Economics and health
promotion The European Journal of Health
Economics (Formerly HEPAC) 5(3) 236-242
Chicago
Department of Budget and Management (nd)
Budget of expenditures and sources of financing
2000-2008 [Webpage] Retrieved from www
dbmgovph
Department of Budget and Management (2001)
Republic of the Philippines national expenditure
program 2001 Manila Author Retrieved from
httpwwwdbmgovph
Department of Budget and Management (2002)
Republic of the Philippines national expenditure
program 2002 Manila Author Retrieved from
httpwwwdbmgovph
Department of Budget and Management (2003)
Republic of the Philippines national expenditure
program 2003 Manila Author Retrieved from
httpwwwdbmgovph
Department of Budget and Management (2004)
Republic of the Philippines national expenditure
program 2004 Manila Author Retrieved from
httpwwwdbmgovph
Department of Budget and Management (2005)
Republic of the Philippines national expenditure
program 2005 Manila Author Retrieved from
httpwwwdbmgovph
Department of Budget and Management (2006)
Republic of the Philippines national expenditure
program 2006 Manila Author Retrieved from
httpwwwdbmgovph
Department of Budget and Management (2007)
Republic of the Philippines national expenditure
program 2007 Manila Author Retrieved from
httpwwwdbmgovph
Department of Budget and Management (2008)
Republic of the Philippines national expenditure
program 2008 Manila Author Retrieved from
httpwwwdbmgovph
Department of Budget and Management (2009)
Republic of the Philippines national expenditure
program 2009 Manila Author Retrieved from
httpwwwdbmgovph
Department of Health (2002) Field health service
information system annual report 2002 Manila
Author Retrieved from httpwwwdohgovph
sitesdefaultfilespublicationsFIELD20HEALT
H20SERVICE20INFORMATION20SYST
EM20ANNUAL20REPORT202002pdf
Department of Health (2003) Field health service
information system annual report 2003 Manila
Author Retrieved from httpwwwdohgovph
sitesdefaultfilespublicationsFIELD20HEALT
H20SERVICE20INFORMATION20SYST
EM20ANNUAL20REPORT202003_0pdf
Department of Health (2004) Field health service
information system annual report 2004 Manila
Author Retrieved from httpwwwdohgovph
sitesdefaultfilespublicationsFIELD20HEALT
H20SERVICE20INFORMATION20SYST
EM20ANNUAL20REPORT202004pdf
Department of Health (2005) Field health service
information system annual report 2005 Manila
Author Retrieved from httpwwwdohgovph
sitesdefaultfilespublicationsFIELD20HEALT
H20SERVICE20INFORMATION20SYST
EM20ANNUAL20REPORT202005_0pdf
Analysis of Public Health Expenditures on Leading Causes of Morbidity in the Philippines
44
Department of Health (2006) Field health service
information system annual report 2006 Manila
Author Retrieved from httpwwwdohgovph
sitesdefaultfilespublicationsFIELD20HEALT
H20SERVICE20INFORMATION20SYST
EM20ANNUAL20REPORT202006pdf
Department of Health (2007) Field health service
information system annual report 2007 Manila
Author Retrieved from httpwwwdohgovph
sitesdefaultfilespublicationsFIELD20HEALT
H20SERVICE20INFORMATION20SYST
EM20ANNUAL20REPORT202007_1pdf
Drouin J P Hediger V Henke N Kanzler L
Leydon E F amp De Santis P (2008) The Health
Care Century Health International 7 6-17
Granlund D (2006) The effect of health care expen-
ditures on sickness absence Paper Presented at the
Inaugural Biennial Conference of American Society
of Health Economists 2006 Madison WI
University of Wisconsin
Hurley J (2000) An overview of the normative
economics of the health sector Handbook of
Health Economics 1 55-118
Novignon J Olakojo S A amp Nonvignon J (2012)
The effects of public and private health care
expenditure on health status in sub-Saharan Africa
New evidence from panel data analysis Health
Economics Review 2(1) 1-8
Philippine Statistics Authority (nd) Family income
and expenditures survey 2000 2003 2006
[Webpage] Retrieved from wwwcensusgovph
United Nations (2007) Human development report
Retrieved from wwwhdrundporg
World Health Organization (2007) National health
accounts 2007 Geneva Author Retrieved from
httpwwwwhointen
World Health Organization (2012) World health
statistics 2012 Geneva Author Retrieved from
httpwwwwhointen
J Glob Bus Trade Vol 9 No 2 (November 2013) 45-60
45
ISSN 1946-5130
Journal of Global Business and Trade
wwwiagbtcom
Analysis of the Interests of Conceiving a Free Trade
Agreement between China and South Korea
Liu Zuankuoa and Zhan Baiming
b
a Shandong Normal University China b South-Central University for Nationalities China
Received 25 August 2013 Revised 22 September 2013 Accepted 28 October 2013
ABSTRACT
Based on the ldquoStarting Joint Minister Statement on free trade agreement between China and South Koreardquo
the article explains the basic ideas of this agreement It shows that there are some distinctive differences
between the statement and the theoretical study on interests China pays more attention to the diplomatic
significance rather than in trade While South Korea aims to guarantee its investment benefits by this
agreement both stations try to protect their producersrsquo benefits Finally this paper using the model GTAP
(Global Trade Analysis Project) puts forward two sets of simulation schemes and forecasts the economic
effects of the Free Trade Zones from the macroeconomics and welfare effects trade effects and industry
effects
Keywords analysis of benefits China-South Korea free trade agreement construction
Ⅰ Introduction10
Minister of Commerce Chen Deming and South
Korean Trade Minister Park Tae-ho attended the
China-ROK Trade Ministers Meeting in Beijing on
May 2nd 2012 and announced the official initiation of
China-ROK Free Trade Agreement negotiations on the
Ministersrsquo Joint Statement (referred to as ldquoStatementrdquo
as following) From the Free Trade Agreement (FTA)
we can see the basic ideas of the interest demands of
the Statement
The statement explains the basic ideas of the FTA
which includes trade in goods services investment
and other fields The interest demands reflected in the
2013 International Academy of Global Business and Trade
All rights reserved
Statement includes two aspects trade and investment
From the perspective of trade benefits the two
countries agreed that levels of trade liberalization in
good and service trades should go beyond those
promised levels in the WTO However there are some
sensitive product issues in the goods trade which
include lists of generally sensitive and highly sensitive
products From the perspective of investment benefits
the level and scope of liberalization were defined
according to both countriesrsquo investment arrangement at
present and in future Meanwhile the overseas
processing zones should be involved in China-ROK
FTA
Analysis of the Interests of Conceiving a Free Trade Agreement between China and South Korea
46
Table 1 MFN Tariff Levels of China and South Korea in Product Category ()
Category of products
China Korea
Average tax rate
Free tax rate Maximum Tax rate
Average tax rate
Free tax rate Maximum Tax rate
Livestock products 148 101 25 221 24 89 Milk products 120 0 20 675 0 176
Fruit Vegetable 148 59 30 574 02 887 Coffee Green tea 147 0 32 539 0 514 Grain 243 34 65 1345 03 800 Oilseed animal fat oil 110 53 30 370 41 630
Sugar Sweet 274 0 50 168 125 243
Drinks Cigarette 223 22 65 317 0 270 Cotton 152 0 40 00 1000 0 Other agricultural products 114 94 38 161 183 754 Fish and its products 109 63 23 161 07 50 Minerals Metals 74 87 50 46 269 8 Petro 48 200 9 41 107 8 Chemistry 66 16 47 57 67 321 Wood Paper 44 353 20 22 675 10 Textile 96 0 38 91 15 13 Cloth 160 0 25 126 0 13
Leather Shoes 132 06 25 79 26 16 Non-electrical machinery 80 90 35 60 226 13 Electronic machinery 83 240 35 62 214 13 Transportation equipment 115 08 45 55 268 10 Other products 119 96 35 67 160 13
Source World Trade Organization (nd)
The level of goods liberalization of the two
countries can be judged from WTO World Customs
Data 2011 In 2010 the simple average MFN tariffs
on agricultural and non-agricultural product imports
were 156 and 87 respectively while the simple
average MFN rates applied to Korea on agricultural
and non-agricultural products exports were 164 and
88 The simple average MFN tariffs on Korean
agricultural products and non-agricultural products
import were 485 and 66 while the MFN rates applied
to China on its agricultural products and non-
agricultural products export were 521 and 66 The
MFN import tariff rate of China and Korea divided by
product category is given via Table 1
Via Table 1 we can see that South Korea paid
more attention to protecting agricultural products (tax
rate 485) than industrial products (tax rate 66)
Therersquos a more than 40 percent difference in the simple
average MFN tariff On Chinarsquos part therersquos no big
difference between agricultural product protection
(156) and industrial product protection (87) the
gap of the simple average MFN tariff between these is
less than 10 percent Meanwhile South Korearsquos
protection on agricultural products (485) is much
higher than Chinarsquos (164) As for industrial product
protection there is a gap between China (156) and
South Korea (66) but the gap in industrial (9 or
so) is not as big as that shown in agricultural products
with a tax rate gap 42
From above it shows that the profit that China
benefits from the FTA mainly depends on the degree of
liberalization of agricultural products of South Korea
If this is the important part of South Korearsquos sensitive
products then the attitude expressed in the joint
statement ldquobeyond goods liberalization level of WTO
commitmentsrdquo has not displayed real significant trade
interests
In other words the previous various theoretical
insights on the China-Korea FTA are not the same as
the benefit idea implied in the statement
J Glob Bus Trade Vol 9 No 2 (November 2013) 45-60
47
Ⅱ Literature Review
With regard to the interests in the FTA negotiations
between China and South Korea Chinese scholars are
generally optimistic about the economic and trade
effects of the bilateral free trade agreement Xue Jing-
xiao and Zhang Bo-wei (2004) believed that Chinarsquos
GDP would grow if China and South Korea were to
establish a free trade area Huang Peng and Wang Jian-
xin (2010) analyze the potential effect of applying
GTAP in constructing a free trade zone between China
and South Korea which indicates that after the
fulfillment of the China-ROK FTA the two countriesrsquo
GDP and components such as consumption
investment government expenditure and so on
compared to the base period all experienced positive
growth South Korea obtains a greater benefit with a
growth rate of 207 while Chinarsquos only 018 Song
Jingen (2011) on the basis of a traditional trade gravity
model studied the effects on trade after the two
countries signed the free trade agreement The results
show that China and South Korearsquos agreement played
a strong role in promoting the trade of both countries
and the total volume of trade would increase nearly
60 He suggests that both countries should pay
attention to the opportunities brought by the agreement
when they are protecting their sensitive sectors Li
Xiao-feng and Gui Jia-yue (2009) based on partial
equilibrium estimates the effects of the establishment
of the China-ROK Free Trade Zone on bilateral trade
flows from the industrial level The simulated results
show that if China and Korea do not established a free
trade zone to a larger extent trade between China and
South Korea would be heavily influenced by the trade
diversion from the Korea-US Free Trade Zone If the
two countries establish a free trade zone it will be
more conducive to the development of comparative
advantages of both countries
Analysis of academic research on China-ROK free
trade agreements has a more rigorous theoretical
condition namely the import tariffs of all goods should
be canceled in the China-ROK FTZ Before the
implementation of the FTZ the higher the tariff is the
greater the increase of imports caused by the tariff
reductions will be From the perspective of exports
before the completion of a bilateral free trade zone the
higher the tariff of partner country is the greater the
exporterrsquos export growth will be after establishment
The joint statement announced by the ministers of
China and the ROK showed that on the one hand the
level of liberalization of trade in goods should
transcend their level of commitment in the WTO On
the other hand the problems of sensitive products
should be a concern A longer transitional period
partial concessions and exceptions should be used to
handle sensitive product issues It is not known which
products are arranged for a longer transition period
partial concessions or exceptions but it will greatly
reduce the expected trade benefits by theoretical study
because the theoretical results used free trade and tariff
barrier elimination as a precondition Meanwhile
when both countries regard their disadvantaged
industries as sensitive products to go beyond the
commitment level in the WTO as agreed in the joint
statement will be quite limited in the scope Thus the
domains of free trade will be relatively small
Professor Yorizumi Watanabe (2009) of Keio
University in Japan analyzed the historical significance
of the FTA among China Japan and South Korea and
pointed out that China makes free trade agreement
policies for three reasons on foreign affairs and
commercial intercourse First in maintaining the
double-digit rapid development in economy China has
become the ldquoworld factoryrdquo and it is imperative to
ensure the market of related industries Second China
has become a world power so it needs to show
Southeast Asian countries an image of a ldquogood
partnerrdquo so as to avoid being seen as a threat Third by
means of drawing those overseas Chinese who have
engaged in long-term economic activities in the
neighboring countries China formed the ldquoGreater
China Rimrdquo and turned it into Chinarsquos powerful
ldquoperipheryrdquo
The interpretation of the motives of Chinarsquos
making of free trade agreement policies by Professor
Watanabe made people feel that Chinarsquos interest
Analysis of the Interests of Conceiving a Free Trade Agreement between China and South Korea
48
demand consists of two aspects commercial inter-
course and diplomacy However regardless of the
relationship of bilabial trade between China and Japan
or between China and South Korea Chinarsquos
advantages in industry are mainly on textiles clothing
leather shoes and other products but the tariff rates of
Chinarsquos MFN of such goods are higher than those of
South Korea and Japan Meanwhile the Chinese
mainlandrsquos ldquoworld factoryrdquo status is a product of the
processing trade China has been acting the role of
assembling and integration in the East Asian labor
division system and the commodities in bilateral trade
between Sino-Korea and Sino-Japan are mainly
constituted by the intermediate input products This
means that Chinarsquos participation in the construction of
the FTZ with Japan and South Korea is not to ensure
the market of related industry and thus its trade
interests are far less than the diplomatic interests which
Professor Watanabe referred to Economists of South
Korea predict that the FTZ has a very large impact on
the Korean economy while there is a relatively small
impact on China For China the strategic goal of the
China and South Korea FTZ is greater than economic
significance while for South Korea the motivation of
getting economic interests is stronger China promoted
the China-ROK FTZ in order to ensure a dominant
position within the East Asian region which cannot
only impact America who took advantage of allies in
Asia to constrain China but also rely on the regional
group to enhance Chinarsquos status in the international
political situation and the multilateral system (Zheng
Zhi-shu 2009)
The interest that South Korea obtained from the
China-ROK FTA depends on the degree of liberali-
zation of Chinese industrial products If Chinese
industrial products constitute a major part of the
sensitive products in China the trade interest of South
Korea would not be significant So the motives of
South Korea negotiating bilateral free trade agreements
with China does not come from trade but from the
following that will be discussed in the third part of the
international investment interests
Ⅲ The Benefit Analysis
31 The balance of Investment Interests and
Trade Interests
Before China and the ROK passed the ldquothe
Associate Ministerial Statement of Starting China-
Korea Free Trade Agreement Negotiationsrdquo China
Japan and the ROK held investment agreement
negotiations in Beijing reached an agreement on all
the remaining issues in the investment agreement and
drafted the agreement on March 21st 2012 Three
parties said they would soon complete their internal
procedures so as to sign the agreement as soon as
possible
From the view of the sequence of time the
successful termination of negotiations on investment
agreements among China Japan and ROK preceded
the starting of negotiations on a bilateral FTA between
China and ROK This indicates that relative to the free
trade agreement the three countries are more
concerned about investment agreements or that South
Korea is keener on the investment issues among the
three countries or between the two countries South
Korean President Lee Myung-bak said that in the
investment agreements among the three countries the
dispute settlement mechanism was included between
the investors and the host country which can provide
legal protection for investors if they suffer a loss on
investment in the host country
Meanwhile the joint statements of two countries
also made clear the important position of investment in
the FTA In the area of investment for proper handling
of issues related to bilateral investment between the
two countries they will confirm the level and scope of
liberalization and take the current and future bilateral
investment-related arrangements into account
When the international economic integration has
developed both in scope and in depth from trade to
international production many bilateral and regional
free trade agreements reflected the feature of the trade
and investment integration such as the North
American Free Trade Agreement In most cases the
J Glob Bus Trade Vol 9 No 2 (November 2013) 45-60
49
countries that are dominant in international investment
will make use of the form of the FTZ to protect its
interests of overseas investments from losses
In terms of the structure of bilateral trade in goods
between China and ROK Korearsquos exports to China
mainly consist of productive goods Table 2 shows
classified by BEC the imports and exports of Chinarsquos
trade in goods to the ROK
Table 2 shows that during the 13 years from 1998
to 2010 among the types of Chinese and South
Korean BEC commodities the following conclusions
can be made according to the changing of exports and
imports of capital goods intermediate goods and
consumer goods
First the imports and exports of intermediate
goods in the cargo trade between China and the ROK
come in on top According to the SNArsquos three basic
categories of goods the annual average import and
export composition ratio of intermediate goods capital
goods and consumer goods trade between China and
Korea were respectively 722 164 and 112
Relative to capital goods and consumer goods the
exceeding ratio balances of intermediate goods trade
value are respectively 56 and 60 percentage points
Table 2 China amp South Korea Goods Trade Structure 1995-2010 (Classified by BEC)
(Unit Hundred Million Dollars)
Intermediate
Goods
Exports
Intermediate
Goods
Imports
Consumer
Goods
Exports
Consumer
Goods
Imports
Capital
Goods
Exports
Capital
Goods
Imports
1995 50 85 14 4 3 13
1998 43 134 12 5 8 11
1999 51 154 17 5 10 13
2000 73 204 25 6 15 22
2001 72 200 33 6 19 28
2002 90 217 43 7 22 61
2003 118 311 51 7 31 108
2004 167 455 61 11 49 153
2005 226 590 66 13 58 161
2006 296 702 83 15 65 173
2007 388 797 94 18 81 213
2008 508 869 96 19 132 223
2009 321 784 76 15 135 212
2010 421 1051 97 24 166 289
Source United Nations Statistics Division (nd)
From the composition of exports and imports
among all of Chinarsquos exports to South Korea the
annual average rates of intermediate goods capital
goods and consumer goods were respectively 642
202 and 155 The rates of these three types of
goods in Chinarsquos annual imports from South Korea
were respectively 803 174 and 22 For
intermediate goods the proportion of Chinarsquos exports
to South Korea is less than that of imports from South
Korea and the balance is up more than ten percentage
points
Second the proportion of the goods used for
production in the cargo trade is much higher than that
of the consumption part In Economics capital is
defined as the products that are produced by the
economic system itself and used as input factors so as
to further produce more products and labor service
According to the basic principles of economics
capital goods and intermediate goods with the
characteristics of production can be considered inputs
for the production of capital goods Statistics show that
the sum of annual import and export proportion is
nearly 886 leaving less than 12 to consumer
goods The very low proportion of consumer goods
trade between China and South Korea shows us the
Analysis of the Interests of Conceiving a Free Trade Agreement between China and South Korea
50
basic characteristics of the internationalization of
production behind the commodity trade structure
Regarding Chinese goods exported to South
Korea the annual average proportion of goods which
had entered the production process was 798 and
continued to rise from 784 in 1995 to 811 in
2005 and to 857 in 2010
Meanwhile the goods that China imported from
South Korea have a higher proportion for production
use and the annual average is almost up to 979 In
1995 the share was 956 and since 2003 its share
has always remained above 98
The proportion (approximately 98) of Chinarsquos
imports of productive goods from Korea is 18 higher
than that (about 80) of Chinarsquos exports indicating
that the degree of Chinarsquos dependence on South Korea
is higher than South Korea on China
Central Bank of Korea (June 14 2011 ) released
the ldquo2010 South Korean Current Account Balancerdquo
which said that the export growth of semiconductors
machinery precision machinery and other goods are
increasing significantly and the trade surplus to China
of such goods is increasing from $3697 billion to
$5104 billion
The formation of this kind of trade structure to a
large extent can be explained reasonably by South
Korearsquos direct investment in China From the
perspective of the trade of intermediate goods Li
Xian-zhu (2010) Ye Jing-yi and Wang Pei (2005)
explained the trade imbalance between China and
South Korea When analyzing the Korean chronic
surplus phenomenon in long term they pointed out
that one of the reasons is that there are many Korean
investment enterprises in China and most are
processing companies required to purchase a large
number of Korean raw materials and accessories for
processing The import of the raw materials and
accessories required by Chinarsquos processing trade is
mentioned above that is Chinese importation of
intermediate goods by BEC classification Some
scholars explained the trade imbalance from the point
of capital goods trade that South Korea has a
competitive advantage in the production of capital
goods that when coupled with the adjacent location is
conducive to reduce transportation costs and thus
South Korea has become one of the main countries for
China to get capital goods from for processing trade
which expanded the size of imports from Korea (Zhao
Fang amp Li Ji 2010)
Statistics show that from 1998 to 2010 among the
foreign direct investments divided by countries and
geographical areas Japan and South Korea have
always been Chinarsquos major source countries for foreign
investment Except those years of the financial crisis
(1998 2008-2009) the proportion of Japan and South
Korearsquos direct investment in China accounted for 13 -
20 For example in 2005 South Korearsquos direct invest-
ment was up to 5168340000 US dollars accounting
for 86 of Chinarsquos total $60324590000rsquos absorption
of foreign investment Japanrsquos direct investments were
6529770000 US dollars accounting for 1082
South Korearsquos direct investment is mainly in the
manufacturing industry By 2005 South Korean
investment in China is mainly focused on the
manufacturing and assembly of electronic appliances
textiles and clothing leasing and business services
food and beverage and retail industries among which
manufacturing accounted for dominance (Yang Li amp
Zhou Wenfeng 2008 ) However in the manufacturing
sector the investment structure of South Korea has a
tendency of changing from the consumer goods
industry including fiber clothing food manufacturing
leather footwear and others to capital goods industries
including electronic communications petrochemical
alloy machinery and equipment and others (Zang Xin
Dong Rongrong amp Cui Yan 2006)
In order to protect the interests of foreign invest-
ment one of the conditions that Japan and South
Korea agreed to in the China-Japan-Korea FTZ nego-
tiation was the signing of ldquoCJK investment agree-
mentsrdquo The tripartite negotiations started in 2007 with
content that included all the important aspects
contained in the international investment agreements
including such clauses as the definition of investment
scope of application MFNT national treatment
J Glob Bus Trade Vol 9 No 2 (November 2013) 45-60
51
expropriation transfer subrogation taxes general
exceptions and dispute resolution
32 The Balance of the Interests of Producers
and Consumers
According to the Yonhap News Agency on
January 12th 2012 the foreign minister of South
Korean Park Taeho said at a press conference held in
the central government office that China as a big
country made a lot of people worried that Korearsquos
agriculture might be pounded South Korea was not
going to allow massive Chinese agricultural products
into South Korea Before starting the China-ROK FTA
negotiations the Korean Government would fully
listen to the views of different fields
Table 3 The Share of South Korearsquos Agriculture in the National Economy 1998-2010
()
Agricultural Labor
Manufacturing Labor
Labor Services Agricultural
Output Manufacturing
Output Services Output
1998 019 2405 4081 336 4511 4044
1999 019 2406 4081 328 4645 4015 2000 017 2453 4087 297 4736 4015
2001 017 2421 4079 287 4557 4182
2002 016 2323 4103 262 4490 4282 2003 016 2316 3989 243 4480 4241
2004 014 2306 3884 239 4727 4034
2005 015 2278 3795 219 4794 4013 2006 014 2165 3468 209 4801 4032
2007 014 2092 345 195 4818 4033
2008 012 2012 3444 184 5064 3833 2009 013 1944 3484 194 4960 3912
2010 013 1909 3484 178 5211 3739
Source Database provided by Korearsquos Banks
Compared with the manufacturing and service
industries the proportion of South Korearsquos agriculture
is not so significant in the national economy The
proportion of employees in the total economic activity
decreased from 019 in 1998 down to 013 in 2010
and the proportion of the total value of agricultural
production in GDP decreased from 336 in 1998
down to 178 in 2010 If the China-ROK FTA finally
regarded the South Korearsquos agriculture as sensitive
products and put it outside the free trade it is no doubt
that this is only to protect the benefits of very few
agricultural producers by sacrificing the interests of
many other consumers
Let us observe the issues of Chinese sensitive
products Chinese Commerce Minister Chen Deming
said that the sensitive products taken into account in
the process of negotiation were related to agriculture in
Korea and Chinarsquos petrochemical electronics
machinery and other fields
Not completely identical to the situation of South
Korearsquos agriculture in the national economy from 1998
to 2010 the ratio of employees in Chinese petroche-
mical electronics and mechanical industries among the
countryrsquos total employment is not high but there is a
rising trend In 1998 Chinese petrochemical and
machinery industry employment accounted for 088
and 157 respectively of the countryrsquos total
employment In 2010 this proportion respectively rose
to 154 and 388
Similarly the ratio of the petrochemical and
mechanical fields in GDP also showed an increasing
trend and its share enlarged In 1998 the ratios were
135 and 213 In 2010 the ratios respectively
increased to 614 and 1173
Table 4 shows that Chinarsquos petrochemical and
machinery industries are growing and developing
rapidly From the production valuersquos movements of
ratio in GDP we can see that from 1998 to 2010 these
Analysis of the Interests of Conceiving a Free Trade Agreement between China and South Korea
52
two sectors in initial stages accounted for 348 of
GDP and by 2005 641
Chinese petrochemical products cover a wide
range of sectors In Chinarsquos Statistical Yearbook they
included the petroleum processing and coking industry
chemical materials and products manufacturing
chemical fiber manufacturing rubber and plastic
products industry Electronic and mechanical fields are
statistically included in machinery and equipment
involving manufacturing industries in common
equipment special equipment transportation
equipment electrical machinery and equipment
electronic and communications equipment instrument
and apparatus and office machinery
Table 4 The Share of Chinese Petrochemical and Machinery Industriesrsquo in the National Economy 1998-2010
()
Petrochemical Industry
Labor Proportion Machinery Industry Labor Proportion
Petrochemical IndustrialGDP
Machinery IndustrialGDP
1998 088 157 135 213
1999 081 145 139 222 2000 074 133 160 240
2001 068 124 155 253
2002 065 121 158 282 2003 098 191 178 340
2004 101 209 224 423
2005 113 244 230 411 2006 119 266 483 883
2007 127 296 554 1028
2008 141 344 608 1119 2009 143 344 547 1059
2010 154 388 614 1173
Source ChinaStatistics (2011)
Chinarsquos petrochemical and machinery accounted
for a high ratio in GDP The number of the labor force
in these two industries was not big and their sum share
is no more than 6 (542 in 2005) in the whole
national economy Thinking about it another way from
the perspective of proportion of factors Zhan Boming
and others (2010) observed and analyzed Chinarsquos
industrial enterprisesrsquo inclination in investment They
found that investment made by state-owned
petrochemical and machinery enterprises have capital
intensive investment tendencies and the investment of
the three-kind investment enterprises in these two
industries are petrochemical capital intensive while
labor-intensive industries including machinery and
transportation equipment manufacturing electronic
and communication equipment manufacturing The
fact means that the idea of separating the Chinese
petrochemical and machinery from the China - Korea
Free Trade Agreement negotiations are to protect those
investorsrsquo interests at the expense of the interests of
numerous consumers
If the Chinese petrochemical products and
machinery products are to be put outside the China-
Korea Free Trade Agreement as sensitive products and
South Korearsquos agricultural sector is also separated
from China-Korea free trade agreement then we can
say such a bilateral free trade agreement almost has no
sense of free trade
Ⅳ Simulation Analysis of the
Economic Effects of China-Korea
FTA
A GTAP model is used in this part to predict the
economic effects if the China-Korea free trade zone is
established
41 Basic Structure of the Model
The GTAP model was developed by Professor
Tomas W Hertel of Purdue University as a multi-
J Glob Bus Trade Vol 9 No 2 (November 2013) 45-60
53
national and multi-sector general equilibrium model
and it has been widely used in trade policy analysis In
the GTAP model framework first sub-models that can
detail description of each countryrsquos (or regionrsquos)
production consumption government spending and so
on are created and then the various sub-models are
combined into a multi-national and multi-sector
general equilibrium model through international
merchandise trade relations When using this model
framework for policy simulation it can also be used to
explore the changes that the policy brings in each
nation and sectorrsquos production import and export
commodity prices supply and demand factors
elements of remuneration GDP and the level of social
welfare
42 Basic Assumptions
421 Conditions of Factors
There are five different types of elements in the
model land capital skilled labor unskilled labor and
natural resources A GTAP model assumes that the
market is perfectly competitive the scale of production
unchanged and each product produced by using
nested constant coefficient to replace elasticity equa-
tion The intermediate inputs consist of domestic and
foreign products through constant coefficient instead of
elasticity equation The products (domestic and import
goods) of different regions are non-homogeneous and
therefore cannot be replaced with each other In the
factor market land among departments is not
completely mobile so the price of land for different
uses is different while the labor in the country is
allowed to flow freely Each country has only one
account to which all the income tax and endowments
are accumulated Then through the Cobb-Douglas
Utility Function income is divided into private
consumption savings and government consumption
by a fixed proportion In a GTAP model there are two
imaginary international departments which are
International Bank and International Traffic Each
countryrsquos savings are accumulated to an International
Bank being allocated among countries according to
the rate of capital return The International Traffic
Department can balance the differences between CIF
and FOB and link the world through bilateral trade
422 Conditions of Behavioral Agents
There are three kinds of typical behavior agents in
the model private departments government
departments and firms
4221 Behavior of Private Department
In private expenditure the private sector consump-
tion expenditure has the nature of non-homothetic
order and should include the impact of population
growth the private department sets levels by using a
CDE Utility Function on a per capita basis Private
department behavior equation
① Private Household Utility
② CompoSITC Demand
③ CompoSITC Tradeable
In these equations yp (r) stands for the regional
units of the private sector household expenditure of r
region ppriv (r) stands for the price index of private
sector household unit consumption expenditure of r
region UELAS stands for the relative utility costs and
elasticity pop (r) stands for the population of r region
qp (i r) stands for the demands of i product in r
regional private department unit EP (i k r) stands for
the cross-price flexibility between irsquos demands and krsquos
price in r regional household unit EY (i r) stands for
the demand of composite commodity i in r regional
household unit pp (i s) stands for the demand price of
integrated trade commodity i in a private household
unit of s region PMSHR (i s) stands for the share that
Analysis of the Interests of Conceiving a Free Trade Agreement between China and South Korea
54
the total imports in the private sector demand for
domestic products of s region ESUBD (i) stands for
the elasticity of substitution between domestic and
imported good i ppd (i s) stands for the demand price
of commodity i in s regional private department unit
qpd (i s) stands for the demand of the national product
i in s regional private department unit ppm (i s) stands
for the demand price for import integrated trade
commodity i in s regional private department unit
qpm (i s) stands for the import demand of product i in
s regional private department unit
4222 Behavior of Government Department
The total government expenditure allocates
between the various commodities via using a Cobb-
Douglas Utility Function This makes the government
expenditure on various commodities of their total
remains constant In an open system the governmentrsquos
demands can be divided into domestic products and
imported products and both of the products form an
integrated product through the CES Function
Government department action equation
① Government Utility
② Demand for CompoSITC Goods
③ CompoSITC Tradeable
In these equations yg (r) stands for the regional
government expenditure of r region pop (r) stands for
population of r region pgov (r) stands for the
consumption expenditures price index of government
departments in r region ug (r) stands for the average
capital expenditure utility level per people from the
government spending in r region VGA (i r) stands for
the expenditure buying i goods in r regional
government departments GOVEXP (r) stands for the
consumer spending in r regional government
departments pg (i r) stands for the demand price of
comprehensive trade i product in r regional
government departments qg (i r) stands for the
demand of i goods in r regional government
departments GMSHR (i s) stands for the government
departmentrsquos share of demand for national products in
total imports in s region pgd (i s) stands for the
demand price of domestic integrated i good in s
regional government departments qgd (i s) stands for
the demand of domestic i product in s regional
government departments pgm (i s) stands for the
demand price of imported comprehensive trade i good
in s regional government departments qgm (i s)
stands for the imported demands of i product in s
regional government departments ESUBD (i) stands
for the elasticity of substitution between domestic
goods and imported goods
4223 Behavior of the Firm
GTAP model assumes that manufacturers use Tree
Structure in the production function Firmsrsquo main
inputs can be divided into the original inputs and
intermediate inputs Suppose the production function
has the characteristics of divisibility and fixed scale
compensation Under the divisibility assumption
firmsrsquo decisions on the most appropriate volume of
original input is not influenced by the changing of
intermediate input price and quite reverse is true
Meanwhile under the assumption of fixed scale
compensation the proportion of factor input of firms
will not be influenced by the changes in production
volume either
On the top of Tree Structure it shows firmsrsquo
decisions of demand between intermediate inputs and
integrated original inputs Under the assumption of the
Leontief Function it shows a fixed proportional rela-
tionship between the intermediate input and original
comprehensive input and total output This is common
in general design of CGE model of which the main
advantage is that it can reduce the number of para-
meters needed to estimate in the model significantly
The bottom left part of the Tree describes the
J Glob Bus Trade Vol 9 No 2 (November 2013) 45-60
55
relationship between the original investment and
production
Assume that the relationship between the original
input and the production is CES Function and the
elasticity of substitution between different original
elements is equal Accordingly sum up the original
inputs in order to obtain the Aggregate Primary Input
At the bottom right part of the Tree Structure it shows
the relationship between the intermediate input and
production which consists of two sides First is the
substitution relationship between the domestic
products and comprehensive imported products
assuming both compose into integrated intermediate
goods through CES Function Second is the
substitution relationship among different sources of
imported intermediate goods assuming which are also
integrated through the CES Function Behavior of
Firm equation
① CompoSITC Intermediate Nest
② Valuemdashadded Nest
③ Total Output Nest
In these equations pf (i j r) and qf (i j r) stands
for the price and demand of i product while producing
j good in r region af (i j r) stands for the technological
change of original feature i in j industry of r region
FMSHR (i j r) stands for the share that r regionrsquos total
imports among the demand for domestic compre-
hensive products pfm (i j s) stands for the demand
price of integrated commodity i in j industry of s
region qfm (i j s) stands for the firmsrsquo total demands
of imports pfd (i j r) stands for the demand price of
domestic comprehensive commodity i in j industry of r
region qfd (i j s) stands for the firmsrsquo demand for
domestic products ESUBD (i) stands for the elasticity
of substitution between domestic and imported goods
pva (j r) stands for the added-value price of producing
j good in r region qva (j r ) stands for the added-value
of j industry in r region ava (j r) stands for the
technological changes of the added-value in j industry
of r region SVA (k j r) stands for the share of added-
value product i in j industry of r region pfe (i j r)
stands for the price of original element i which needed
to produce j product of r region qfe (i j r) stands for
the demand of original element i which needed to
produce j product of r region afe (i j r) stands for the
technological changes of original element i in j
industry of r region ESUBVA (j) stands for the
elasticity of substitution between original elements
during the added-value production in j industry qo (j r)
stands for the output of j department of r region ao (j r)
stands for the technological changes of output in j
department of r region ps (j r) stands for the supply
price of j product in r region ESUBT (j) stands for the
elasticity of substitution of intermediate inputs while
producing j product
423 Equilibrium Condition
A GTAP model assumes a regional household unit
includes a private department and government
department to determine the consumer behavior and
savings behavior of the private department and
government department in the country or region The
Model can be divided into a Closed System and an
Open System Without the government intervention in
a Closed System the income of regional household
unit comes from the reward of selling its own elements
to the firm Firmrsquos incomes come from the purchase of
each householdrsquos expenditure and every manufacturer
also makes money by selling their intermediate goods
All economic behavior expenditures and incomes are
equal Balance of a single country Closed System is
established by the accounting identities and market
equilibrium formula In an Open System due to the
Analysis of the Interests of Conceiving a Free Trade Agreement between China and South Korea
56
joining of foreign departments the government
expenditure and the private spending in local regional
department will be divided into two parts buying
domestic products and imported products
Furthermore some parts of firmrsquos intermediate raw
materials may also be imported and its products are
sold both domestically and abroad
Regional household unitsrsquo behaviors are basically
determined by Aggregate Utility Function which
consists of government expenditure private spending
and savings It is assumed the per capita Cobb-
Douglas Utility Function is adopted and this regional
household unit pursues the utility maximum of a
household unit As a result of using the Cobb-Douglas
Utility Function the proportion of three kinds of
current consumptions that were mentioned above is
fixed
43 The Analysis Method and the Simulation
Program
This article uses the seventh edition GTAP model
which includes 113 countries and 57 sectors In the
model the author combines 113 countries or regions
into three regions China Korea and other parts of the
world 57 industry sectors will be divided into 10 kinds
of product groups 1) food and crops 2) livestock and
meat products 3) forest rivers coal natural gas and
other minerals 4) processed foods 5) Textiles and
clothing 6) light manufacturing 7) heavy industry 8)
Utilities and construction 9) Transportation and
communication 10) other services
In order to fully investigate the effects of trade
liberalization this paper intends to respectively
measure the economic effects of a free trade zone
under two kinds of tax reductions program one
simulates a ldquozero tariff base scenariordquo under the
condition that both China and Korea have a full range
cancellation of goods trade tariffs In program 2
considering the protection of its sensitive industry with
the exceptions of Korearsquos high tariffs on food and crop
departments and the exception of Chinarsquos industrial
sector (light manufacturing and heavy industry) other
department tariff reductions will be by half
44 Simulation and Results of Analysis
441 Economic and Welfare Effects
According to model calculation results (shown in
table 5) we can see from the aspects of GDP growth
In program one after the completion of the China-
Korea free trade zone GDP in both China and Korea
show growth compared to the base period Korea
benefits more with a GDP increase of 139 billion
dollars and a growth rate of 206 China only
increases 25 billion dollars and the growth rate is
015 In program two the GDP of both China and
Korea shows growth compared with the base period
too respectively rising 74 and $540 million
considerably less than the GDP growth in program one
with full exemption of import tariffs This is because
program two still has different levels of trade
protection which leads to inefficient allocation of
resources After the establishment of a free trade zone
in the program one and program two countries with
larger benefits are different Korea benefits more in
program one China benefits more in program two
This is because the two countries have the same tax
reduction in program one Because the trade barriers
between Korea and the other countries in the world are
lower and according to the customs alliance theory
the lower the trade barriers between the Customs
Alliance member countries and other countries in the
world are the establishment of a customs alliance is
less likely to cause more costly trade transfers Under
the condition of full reduction and exemption of tariffs
and zero tariffs China may show a bigger trade
transfer effect thus Korea benefits more In program
two because of the protection for the sensitive food
and crop industry the allocation of resources is less
efficient in Korea
From the point of changes in the countryrsquos welfare
total welfare increases 4964 billion dollars in Korea in
program one while China reduces 653 million dollars
Korearsquos welfare increase is mainly caused by the
improved resource distribution efficiency and trade
conditions Chinarsquos entire welfare reduction is because
of the larger trade diversion effect In program two
J Glob Bus Trade Vol 9 No 2 (November 2013) 45-60
57
both two countriesrsquo welfare increases with Chinarsquos
growth of 189 million dollars and Korearsquos 65 million
dollars Compared to program one the increasing
volume of Korearsquos welfare significantly drops largely
because of Korearsquos high tariffs on food and crop
protection which results in a lower efficiency of
resource allocation
From the view of other regions in the world either
in program one or program two the GDP and welfare
decline at different degrees This means establishing a
free trade zone no matter what level of tax reduction
is conducive to economic growth for member
countries but this will bring adverse changes for those
regions excluded in the free trade zone
From the above analysis the establishment of
China-Korean free trade zone will promote the growth
of the national economy and social welfare regardless
of what level of tax reduction but for other regions in
the world it will bring a negative adverse change
Table 5 Changes of the Economy and Welfare in Different Programs ()
Program One Program Two
Change of GDP
Change Rate of
GDP
Welfare (million of
US dollars)
Change of GDP
Change Rate of
GDP
Welfare (million of US
dollars)
China Korea
Other regions in the world
25051 139023
-277225
015 206
-007
-65303 496385
-42123
74118 54328
-380194
005 008
-001
18941 16497
-15370
Source Compiled according to the result of Rung TAP operation
442 Trade Effects
According to the results of the model calculation
(shown in Table 6) it shows whether canceling all
import tariffs on goods or protecting part of industry by
cancellation of part of tariffs the bilateral trade has an
increase The exports and imports of other regions in
the world experienced varying degrees of reduction
Chinarsquos total economic output is larger so the
establishment of a China-Korea FTZ has less impact
on Chinarsquos import and export level as on Korearsquos The
tax reduction level in program two is not as large as in
program one and in program two some industries are
protected So compared to the program one trade
barriers cause lower efficiency in resource distribution
and the impact on imports and exports is smaller than
in program one
From the terms of the changes in trade either in
program one or program two the China-Korea free
trade zone improves the membersrsquo trade condition to
some degree Specifically Korea benefits more This is
because Korea has more open trade liberalization
whose tariffs on main trade products have been
reduced to a very low level According to the customs
alliance theory the lower the trade barriers between the
Customs Alliance member countries and other regions
in the world is the establishment of a customs alliance
is less likely to cause more costly trade transfers so the
establishment of a China-Korea free trade zone has
little impact on Korearsquos trade transfer and Korea
benefits more from the changes in trade condition than
China
For the other regions in the world under both
kinds of tax reduction and exemption programs there
are different degrees of reduction in import and export
trade conditions indicating that although the establi-
shment of a free trade zone can increase imports and
exports and improve trade conditions for member
countries it can cause an adverse trade effect for the
non-member countries elsewhere in the world
Through the above analysis we can see that after
the establishment of China-Korea free trade zone
regardless of the extent of tax reduction and exemption
it will promote the imports and exports and foreign
trade conditions within the zone but may cause
adverse trade effects on other regions outside it
Analysis of the Interests of Conceiving a Free Trade Agreement between China and South Korea
58
Table 6 Changes of Trade Effects in Different Program ()
Program one Program two
Export Import Trade Condition Export Import Trade Condition
China
Korea The rest of the world
181
244 -002
229
564 -01
005
14 -004
016
028 -00018
021
046 -0006
002
005 -0003
Source compiled according to the result of Rung TAP operation
443 Industry Effects
According to the model calculation results (shown
in Table 7) shown in program one establishing the
free trade zone has a great impact on specific industry
sectors in China and Korea Chinarsquos sectors with
increased output mainly concentrate in the primary
sector products among which the agricultural sector
takes the largest increase reaching 268 while the
industrial sectors (light manufacturing and heavy
industries) decrease slightly In general Chinarsquos sector
output changes but the rate of change is not large In
contrast there is a big difference in sector output
changes between departments in Korea Because of the
restriction of resources geography population and
other natural endowments sectors with reduced output
in Korea are concentrated in the primary sector
particularly in the agricultural sector with a significant
reduction of 2009 much greater than the changes in
other sectors Sectors with output increases concentrate
in the industrial product sectors among which textiles
and clothing sector are the most outstanding with a
927 increase The other regions in the world have a
slight growth in light manufacturing but the outputs of
other sectors experience different degrees of decline
In program two every country protects its weak
industries and the tax reductions are less than in
program one The change rates in industry output of
the two countries is not big except for Chinarsquos textile
and clothing industry which has a slight rise other
changes all decline compared to program one
Although in program two Chinarsquos protection of light
manufacturing and heavy industry help to slow the
decrease of industrial output we can see from Table 7
that China rsquos output of these two industries still
declines indicating that to enhance the level of
industrial development trade protection is not always
feasible It is fundamental to work hard on solving
problems such as low-end industrial structure low
technology in production lack of innovation and etc
Korearsquos protection of agriculture shows a better effect
the output change rate of Korearsquos food and crop
industry decreased from 2009 to 004 Due to
Korearsquos protection of agricultural products Chinarsquos
increased output in food and crop industry changes
from 268 up to 0161
Through the above analysis it can be concluded
that after the establishment of a China-Korea free trade
zone regardless the degrees of tax reduction and
exemption the output will be improved with the
optimization and upgrading of industries For the other
regions in the world it brings adverse impacts
Table7 The Output Changes of Sub-sectors in Program One and Program Two ()
Program one Program two
China Korea Other regions China Korea Other regions
Food and Crop
Livestock and meat products Forest rivers and coal
Natural gas and other minerals
Processed foods Textile and clothing
Light manufacturing
Heavy industries
268
056 031
114 004
-036
-025
-2009
-012 -144
-095 927
034
162
-035
-009 -004
-011 -032
001
-003
0161
0114 0137
0479 0274
-005
-008
-004
-015 -027
-082 534
-017
-018
-0008
-0009 -0027
-0019 -0233
0007
0015
J Glob Bus Trade Vol 9 No 2 (November 2013) 45-60
59
Public utilities construction
Transport and communications Other services
038
009 01
412
155 247
-009
-004 -006
0042
002 0037
023
006 011
-0006
-0005 -0005
Source compiled according to the result of Rung TAP operation
Ⅴ Conclusions
Based on the ldquoStarting Joint Minister Statement on
free trade agreement between China and South Koreardquo
the article explains the basic ideas of this agreement
Through the analysis of the investment interests and
trade interests of China and Korea it finds that
intermediate import and export products in China and
Korea trade rank first and the goods trade in
production is considerably higher than that in
consumption This formation of structure of goods
trade can be reasonably explained by Korearsquos direct
investment in China Through the analysis of
producersrsquo interests and the consumers in China and
Korea it finds that if China and Korea reach a free
trade agreement that excludes Korearsquos agriculture from
free trade as a sensitive product it will sacrifice the
majority of consumersrsquo interests and only protects the
interests of minor agricultural producers If Chinarsquos
petrochemical and machinery are separated from
China-Korea free trade agreement negotiations it will
also sacrifice the majority of consumersrsquo interests and
only protect the investorsrsquo interests Therefore it
shows firstly the insight on interests is significantly
different between the declaration and theoretical
research Secondly Chinarsquos diplomatic interests are
bigger than its trade significance and Korea protects its
investment interests in China through trade agreements
Thirdly both countries are trying to protect their
producersrsquo interests through trade agreements
Finally this paper uses the global trade analysis
project (Global Trade Analysis Project GTAP) model
and proposes ldquofull abolition of trade in goods tariffs
between China and Koreardquo and ldquoKorearsquos exceptions
on its high tariff food and crop sectors Chinarsquos
exceptions on industrial sector (light manufacturing
and heavy industry) and tariffs on other sectors
reduced by halfrdquo It predicts the economic benefits of
China-Korean free trade zone by two sets of simulation
programs from three aspects macroeconomic and
welfare effects trade effects as well as industry effects
It finds that after the establishment of a China-Korean
free trade zone regardless the level of tax reduction it
will promote the growth of the national economy and
improve the social welfare and import and export
Trade conditions and output will be improved with
industrial optimization and upgrading of industries in
two countries For the other regions in the world it will
bring negative and adverse changes
References
Baiming Z Jiang Y amp Maohong L (2010) Biased
investment by state-owned and foreign enterprises
and its production-trade effect Wuhan University
Journal (Philosophy amp Social Sciences) 2010(1)
117-124
ChinaStatistics (2011) China Statistical Yearbook
of 2011 Central Hong Kong Author Retrieved
from httpwwwchinastatisticsnetchina-
statistical-yearbook-2011-m-23html
Fang Z H A O amp Ji L I (2010) A research on
trade status and intra-industry trade between China
and South Korea Journal of Jilin Normal Uni-
versity (Humanities amp Social Science Edition)
2010(4) 52-56
Jianxin H P W (2010) The design of FTA nego-
tiation strategy between China and Korea based on
GTAP simulation World Economy Study 2010(6)
81-86
Li Y amp Zhou W F (2008) The investment from
Korea to China The present situation trend and
Chinarsquos policies Economic Research Guide
2008(3) 158-160
Analysis of the Interests of Conceiving a Free Trade Agreement between China and South Korea
60
Li X F amp Gui J X (2009) An empirical analysis of
the impact of the establishment of China-Korea
FTA on bilateral trade International Economics
and Trade Research 2009(5) 4-8
Li X Z (2010) The trade between China and Korea
and its structure change International Studies
2010(6) 48-52
Song J G (2011) The study of free trade agreement
between China and South Korea based on the
gravity model Contemporary Economic Research
2011(5) 81-85
United Nations Statistics Division (nd) Commodity
Trade statistics database New York NY Author
Retrieved from httpcomtradeunorgdata
Watanabe (2009) The possibility about the FTA
among Japan Korea and China The Economist
2009(12) 5-12
World Trade Organization (nd) World Customs
Data 2011 Retrieved from httpwwwwtoorg
statistics
Xin Z Rong R D amp Yan C (2006) An empirical
analysis of the influence about the direct
investment from Japanese South Korean to China
on the scale and industry Journal of International
Trade 2006(10) 44-50
Xue J X amp Zhang B (2004) The economic coope-
ration arrangements in East Asia A comparative
study based on the general equilibrium model The
Journal of World Economy 2004(6) 51-59
Ye J Y amp Wang P (2005) The analysis of the trade
deficit between China and Korea Economic
Science 2005(1) 115-126
Zheng Z S (2009) The strategic motivation com-
parison of FTA promotion between China and
Korea Commercial Times 2009(33) 35-36
J Glob Bus Trade Vol 9 No 2 (November 2013) 61-71
61
ISSN 1946-5130
Journal of Global Business and Trade
wwwiagbtcom
Stock Market Development and Economic Growth the Case
of the Philippine Stock Market
Princess Jace N Sta Mariaa and Agham C Cuevas
b
ab College of Economics and Management University of the Philippines Los Bantildeos Philippines
Received 25 August 2013 Revised 27 September 2013 Accepted 30 October 2013
ABSTRACT
The general objective of this study is to analyze the level of stock market development of the Philippine Stock
Exchange as reflected by its liquidity position and its implications to economic growth in the Philippines
Stock market liquidity was analyzed through its three liquidity measurements turnover ratio total value of
traded shares ratio and the market size ratio This study used Ordinary Least Squares (OLS) in analyzing the
relationship between stock market liquidity and economic growth using quarterly data from 1996 to 2012
Stock market liquidity as measured by the growth in value of traded shares and the growth in market size is
significantly related to the growth of the economy after controlling for variables such as inflation which
lagged by one period growth in foreign direct investment and openness to trade Further analysis showed that
the growth in market size causes economic growth However the determinant of the growth in value of traded
shares does not exhibit Granger causality but is proven to have a long run relationship as shown from the
results of the Error Correction Model
Keywords economic growth Philippine stock exchange stock market development stock market liquidity
Ⅰ Introduction11
Financial markets and intermediaries play a
significant role in the growth of the economy by
improving financial efficiency that would in turn
provide better allocation of resources As savers or
lenders hold current consumption for future expendi-
ture borrowers desire current consumption or invest-
ment that would eventually yield higher returns in the
future These institutions are responsible for main-
taining a healthy monetary economy in the country as
they mobilize and convert savings into funds and
channel them to borrowers or investors to further
2013 International Academy of Global Business and Trade
All rights reserved
allocate them to more productive investments
(Mishkin 2006) An efficient stable and vibrant stock
market is essential to the development of the financial
sector Stock markets are responsible for the expansion
of a companyrsquos capital by allowing stocks or shares to
be sold or traded in public
Kanasro Jalbani and Junejo (2009) stated that
stock markets play a crucial role in capital mobilization
and provide secondary markets for the investors and
financial institutions to buy and sell securities A stock
market is considered to be liquid when large
transactions are executed with only a small impact on
prices of securities Stock market liquidity is thus
considered a good tool to measure the efficiency of a
stock market A marketrsquos stability is also determined
Stock Market Development and Economic Growth the Case of the Philippine Stock Market
62
through the liquidity of its securities or the ease at
which these securities are bought or sold in the market
The Philippine Stock Exchange (PSE) the sole
stock market of the Philippines was established on
December 23 1993 when the respective founders of
both the Manila Stock Exchange (MSE) and the
Makati Stock Exchange (MKSE) decided to combine
the two exchanges to further develop a more efficient
capital market During the past decade the PSE has
been robust in terms of the daily value traded Both
foreign and domestic market capitalization which is
the measure of the size of listed companies in the stock
market has been increasing since 2002 In January
2013 the Philippine Stock Exchange index (PSEi) the
indicator used to measure the performance of active
and highly capitalized listed Philippine companies in
the PSE breached the 6000 level an all-time high in
Philippine stock market history
The general objective of the study is to analyze the
liquidity of the Philippine stock market and its
implications for economic growth Liquidity is
important as it is an aspect of a stock market that is
necessary for the traders to interact Specifically the
study aims to measure the liquidity of the Philippine
stock market and evaluate its trends for the given
period determine the linkages between stock market
liquidity and growth of the economy and determine the
causality between stock market development and
economic growth in the Philippines
The paper is organized as follows The next two
sections review the related literature followed by the
analytical and empirical framework The fourth section
discusses the results while the last section provides the
conclusion
Ⅱ Review of Related Literature
21 Stock Market Development as a
Determinant of Economic Growth
Several studies have been conducted on the
relevance of stock market development to economic
growth As cited by Petros (nd) the stock market
provides the fulcrum for capital market activities and it
is often cited as a barometer of business direction An
active stock market may be relied upon to measure
changes in general economic activities using the stock
market index (Obadan 1995) According to Petros
(nd) directly or indirectly a stock market through its
specific services can contribute to economic growth
Mobilization of savings creation of liquidity risk
diversification improved dissemination and acquisi-
tion of information and enhanced incentive for cor-
porate control are functions that are notably significant
thus by improving the efficiency and effectiveness of
these functions it can amplify the economic growth
rate
Tapitan (2012) highlighted the role of financial
intermediaries as a prerequisite for economic growth as
they play an important role in technological progress
The financial system affects capital accumulation by
altering the saving or by reallocating savings among
different capital producing technologies The key
assumption is that better technology is produced as a
by-product of capital investment
Capital investments are important in boosting the
growth of the countryrsquos economy As cited by Nagai-
shi (1999) Levine (1997) identified two channels in
which financial markets or intermediaries affect
economic growth through capital accumulation and
technological innovation In 1999 Garcia and Liu
(1999) identified three main channels through which
financial markets and intermediaries may affect
economic growth The first is by stimulating savings
Financial markets or intermediaries provide savers
with a relatively higher yield McKinnon (1973) and
Shaw (1973) (as cited by Garcia amp Liu 1999) claimed
that financial deepening improves not only produc-
tivity of capital but also the saving rate and therefore
investment and growth Second this can be done by
reducing information and transactions costs because
we know that high transaction costs would definitely
have a negative effect on trading for these discourage
people from transacting thus affecting onersquos profit
Lastly by promoting an efficient allocation of invest-
ment the allocation of resources is improved
J Glob Bus Trade Vol 9 No 2 (November 2013) 61-71
63
22 Stock Market Liquidity
Stahel (2004) (as cited by Benić amp Frani 2008)
argues that due to stock market integration investors
would tend to move their capital to where they expect
higher returns on their investments Von Wyss (2004)
(as cited by Benić amp Frani) defined four aspects or
dimensions of financial market liquidity the trading
time tightness depth and resiliency These dimen-
sions of liquidity may be presented with five different
levels of liquidity 1) the ability to trade at all 2) the
ability to buy or to sell a certain amount of an asset
with an influence on the quoted price 3) the ability to
buy or to sell a certain amount of an asset without any
influence on the quoted price 4) the ability to buy and
to sell an asset at about the same price at the same time
and 5) the ability to execute a transaction from points
two to four immediately
Sarr and Lybek (2002) claim that illiquid markets
are more of a symptom rather than a cause of
inadequate market functioning They posit that in order
to foster liquid financial markets sound and
transparent economic policies with appropriately
designed trading clearing and settlement systems as
well as appropriate intervention policies of the central
bank which can help contain systematic risk are the
only sustainable solution
Levine and Zervos (1998) investigated whether
measures of stock market liquidity size volatility and
integration with world capital markets are robustly
correlated with current and future rates of economic
growth capital accumulation productivity improve-
ments and saving rates They used data on 49
countries from the period 1976 to 1993 They
evaluated whether the stock market indicators together
with banking development are correlated with the
growth indicators Stock market development
indicators include the size in which capitalization is
measured by the value of listed domestic shares on
domestic exchanges divided by GDP the liquidity
which is measured by the turnover ratio and the value
traded ratio Using the international capital asset
pricing model (CAPM) and international arbitrage
pricing theory (APT) they concluded that stock market
liquidity and banking development are both positively
and robustly correlated with contemporaneous and
future rates of economic growth capital accumulation
and productivity growth Also both a stock market and
banks provide different financial services that could
actually help the economy as a whole On the other
hand based on their study they find no support that
these indicators reduce private savings rate or hinder
long run growth
Levine (1996) tested the liquidity of stock markets
for 38 countries (1976-1993) that include both Indus-
trial and developing countries Three measurements for
liquidity were used the total value of shares traded on
a countryrsquos stock exchanges as a share of GDP the
value of traded shares as a percentage of total market
capitalization or the turnover ratio and the value-
traded-ratio divided by stock price volatility He
claimed that a liquid market should be able to handle
heavy trading without large price swings Thus
empirically stock market size and volatility do not
matter but the ease of which shares can be traded The
results suggest that stock market liquidity helps
forecast economic growth even after accounting for a
variety of nonfinancial factors that influence economic
growth Stock market liquidity is still a reliable
indicator of future long term growth after controlling
for inflation fiscal policy political stability education
the efficiency of the legal system exchange rate policy
and openness to international trade
Ⅲ Analytical and Empirical
Framework
Stock markets contribute in easing financial
activities as well as guiding the countryrsquos firms and
investors to allocate their funds efficiently Levine
(1996) showed that countries that had more liquid
stock markets enjoyed both faster rates of capital
accumulation and greater productivity gains Stock
markets through creation of liquidity affect economic
activity by less risky investment in equity markets
which allows savers to acquire assets and quickly sell
Stock Market Development and Economic Growth the Case of the Philippine Stock Market
64
them As Fig 1 shows liquid markets improve capital
allocation that would in turn enhance growth in the
economy
Levine (2003) identified three core sources of
theoretically ambiguous relationships between econo-
mic growth and stock market liquidity He first stated
that stock market liquidity lowers the risk of investing
in longer-run higher return projects and in
consequence fosters a growth-accelerating reallocation
of capital The lower risk however affects savings and
capital accumulation rates ambiguously so that
aggregate growth will slow if savings rate fall enough
Second the cost of investing in the long run is lower
Higher rate of return on savings affects savings and
capital accumulation rates ambiguously so that growth
will fall if capital accumulation rates fall enough
Finally stock market liquidity affects incentives for
investors to undertake the costly processes of
researching and monitoring firms and managers
ambiguously Liquidity will affect growth positively if
stock market liquidity encourages agents to evaluate
and exert corporate control
31 Measures of Stock Market Liquidity
The study adopted two measurements of liquidity
used by Kanasro et al (2009) to determine the
efficiency of the Philippine stock market through
liquidity of its shares Stock market liquidity is
hypothesized to be
SML = f (TVTS MSIZE) (1)
Where
SML -- Stock Market Liquidity
TVTS -- Total Value of Traded Shares Ratio
MSIZE -- Market Size Ratio
The Total Value of Traded Shares Ratio (TVTS)
measures the value of equity transactions relative to the
size of the economy The formula for computing the
total value of traded shares ratio is as follows
TVTS = Total Value of Traded Shares
Gross Domestic Product (2)
The Market Size Ratio (MSIZE) measures the size
of the Philippine Stock Exchange in accordance with
the market capitalization as the ratio of GDP of the
Philippines during the sample period
MSIZE = Gross Domestic Product (3)
Market Capitalization
Fig 1 Schematic Diagram for Stock Market
Liquidity and Economic Growth (Levine
1996)
32 Empirical Model
To analyze the relationship between the liquidity of
the Philippine Stock Exchange (PSE) and economic
growth in the Philippines the two measures for stock
market liquidity in logarithm form were regressed to
the logarithm of Gross Domestic Product (LNGDP)
together with the other factors that influence economic
J Glob Bus Trade Vol 9 No 2 (November 2013) 61-71
65
growth using Ordinary Least Squares (OLS) This
study also adopted the regression model of Levine
(2003) Nurudeen (2009) and Mohtadi and Agarwal
(nd) The model directly examined the relationship
between stock market liquidity and economic growth
The regression model is as follows
LNGDP = β0 + β1 LN (TVTS) + β 2 LN (MSIZE)
+ β3 LN (OPEN) + β4 LN (FDI)
+ β4 (INFLAG) + μ (4)
Where
LNGDP -growth in Gross Domestic Product
LNTVTS-growth in Total Value of Traded
Shares Ratio
LNMSIZE-growth in Market Size Ratio
LNOPEN -growth in Openness to Trade
LNFDI-growth in Foreign Direct Investment
INFLAG-Inflation Rate lagged by one period
β-parameter of the indicators
micro-the error term
The variables in the model above are defined as
follows LNGDP refers to economic growth and it is
measured as the logarithm of the real GDP The
LNTVTS is the growth in Total Value of Traded
Shares Ratio and it is measured by dividing the total
value of traded shares with the gross domestic product
and transformed to its natural logarithm The
LNMSIZE is the growth in Market Size Ratio
measured by dividing the gross domestic product to
the market capitalization and transformed to its natural
logarithm LNOPEN refers to the growth in openness
to trade and it is measured by tariff revenues which is
measured by tariff rate multiplied by imports divided
by the sum of imports and exports and transformed to
its natural logarithm LNFDI refers to growth in
foreign direct investment INFLAG is the inflation rate
lagged by one period and μ is the error term
It is hypothesized that an increase in the growth in
total value of traded shares and market size should
increase the growth of the economy The variables
LNOPEN LNFDI INFLAG were used as control
variables to gauge the strength of the correlation
between stock market liquidity and economic growth
for the given period The inflation rate lagged by one
period (INFLAG) is the percentage rate of the change
in the general changes in the price level thus it
measures the monetary instability that negatively
affects economic performance Its lagged effect was
assigned to serve as a proxy for expected future
inflation Foreign direct investment (FDI) was
expected to augment savings and increase the rates of
capital accumulation giving a positive relationship to
economic growth Openness to trade (OPEN) refers to
the openness to international trade of the economy as
trade openness fosters competition in global markets it
was expected that its growth will have a positive
relationship with economic growth
Ⅳ Results and Discussion
This study used a simple Ordinary Least Squares
(OLS) method to determine and further analyze the
relationship between the level of stock market
development as proxied by liquidity position of the
Philippine stock market and economic growth It also
attempted to provide evidence on the existence of a
long run relationship between stock market
development and economic growth through the use of
the Granger Causality test
41 Liquidity of the Philippine Stock
Exchange
The Turnover Ratio measures the value of equity
transactions relative to the market size A high turnover
is an indicator of low transaction cost (Levine amp
Zervos 1998) The turnover position of the Philippine
Stock Exchange has experienced fluctuations The
Ramos administration (1992-1998) experienced a
steady growth in the economy during which the
Philippines Stock Exchange (PSE) was unified
However due to the 1997 Asian financial crisis its
performance declined Under the administration of
Stock Market Development and Economic Growth the Case of the Philippine Stock Market
66
Estrada a decline in the performance in the PSE can be
seen From a 1262 turnover ratio in 1999 it declined
to 218 in 2000 due to poor governance and
economic policies that affected the confidence among
potential investors The economic reforms and policies
under the Arroyo administration improved growth in
the economy giving stock market significant inflows
gaining back investorsrsquo confidence Due to different
problems that the economy experienced coupled with
the global crisis as shown in Fig 2 the trend continued
to be volatile The average turnover ratio of PSE is
380 during the sample period
The Total Value of Traded Shares Ratio (TVTS)
measures the value of equity transactions relative to the
size of the economy There are significant jumps in the
liquidity (total value of shares traded to GDP) in the
last six years Its TVTS ratio has grown to almost 28
The overall average liquidity during the sample period
is 65
Fig 2 Liquidity at Philippine Stock Exchange
(PSE) using Turnover Ratio (TOR) and
Total Value of Traded Shares (TVTS)
The Market Size (MSIZE) measures the size of the
Philippine Stock Exchange in accordance with the
market capitalization as the ratio of GDP of the
Philippines during the sample period As shown in Fig
3 the size of the PSE remained very small from the
year 1996-1999 which had about 3-5 until 2000
when it increased to almost 40 The 1997 Asian
financial crisis caused instability in the financial sector
and only a few companiesrsquo securities were listed The
overall average size of the market has remained only
254 of GDP which seemed to be low in comparison
with other developing markets Since the unification of
the Makati Stock Exchange and the Manila Stock
Exchange in 1993 the Philippine Stock Exchange has
remained relatively small As of May 2012 there are
344 listed companies in the PSE
Fig 3 Liquidity at the Philippine Stock Exchange
using Market Size (MSIZE)
42 Regression Results
The study used 67 observations from the first
quarter of 1996 to the third quarter of 2012 Three
variables were found to be significant using the
Ordinary Least Squares (OLS) method These
variables were the growth in total value of traded
shares (LNTVTS) growth in market size (LNMSIZE)
growth in openness to trade (LNOPEN) The turnover
ratio was not used as a determinant of liquidity as
Levine and Zervos (1996) states that the turnover ratio
measures trading of firmrsquos equities relative to the size
of the market and does not satisfy the degree in which
liquidity services on a macroeconomic scale Thus it
would not be providing significant liquidity to the
economy as a whole Therefore a large stock market is
not necessarily a liquid market
The Durbin-Watson and Breusch-Godfrey tests
were used to test for the presence of autocorrelation
Having found to have positive autocorrelation the
Cochrane-Orcutt Transformation was used as a
remedy to minimize the autocorrelation problem Table
1 shows the regression results after the Cochrane-
Orcutt Transformation
J Glob Bus Trade Vol 9 No 2 (November 2013) 61-71
67
From Table 1 results show that the effect of
growth on the total value of traded shares and the
growth of the market size on economic growth is
positive and statistically significant at the 1 level
The control variables which are the growth of
openness to trade and growth of foreign direct
investment also have the expected signs which are
positive however these variables are not significant
even at the 10 level The results also show that the
variable of inflation lagged by one period is negatively
related to economic growth and significant at the 10
level
Table 1 Cochrane-Orcutt Transformation Regression
Results
Variable Coefficient Std Error t-statistic Probability
LNTVTS 0134 0037 362 0001
LNMSIZE 0826 0046 1800 0000
INFLAG -0025 0013 -196 0055
LNOPEN 0269NS 0240 112 0268
LNFDI 0009NS 0009 100 0322
_cons 8062 0646 1248 0000
R2 = 09488 Prob gt F = 0000
Adjusted R2 =09445 DW Statistic
(transformed) = 2005368
Notes 1 significant at 1 level of significance
2 significant at 5 level of significance
3 significant at 10 level of significance 4 Values were rounded off to three decimal
places
Stock markets contribute to economic develop-
ment by enhancing the liquidity of capital investments
(Levine 1997) Moreover by increasing the quantity
and productivity through improved allocation of
capital as well as reducing the need to hold liquid
balances a liquid stock market would augment econo-
mic growth The results showed that the relationship
between the growth of market size (MSIZE) and
economic growth is positive and significant in
explaining economic growth in the Philippines as it
was used as a proxy for liquidity The coefficient 0826
implies that a 1 increase in growth of market size
would lead to an increase of 0826 in the growth of
GDP The result provides proof that the size of the
Philippine Stock Exchange (PSE) during the given
period determines the ability of the market to mobilize
savings improve the quality and quantity of invest-
ment and accelerate economic growth since the role of
the PSE is to bring companies together to raise capital
through securities
The other measure for liquidity has a positive and
significant effect on economic growth The growth in
total value of traded shares (LNTVTS) has a coeffi-
cient of 0134 implying that a 1 increase in the
growth of total value of traded shares will increase
economic growth by 0134 Since the growth of
TVTS measures the trading of firmrsquos equity as a share
of GDP its liquidity therefore positively reflects on an
economy-wide basis (Levine amp Zervos 1996)
Inflation (INFLAG) which was lagged by one
period conforms to economic theory by having a
negative relationship with economic growth since it
affects economic performance through monetary
instability It has a coefficient of -0025 which is
statistically significant at 10 level This means that a
1 increase in the inflation rate leads to a decrease in
the growth of GDP by 0025
The coefficient of the growth in openness to trade
(OPEN) conforms to the standard economic theory
since it is positively related to economic growth even
if it was used as a control variable The coefficient of
0269 implies that over the study period a 1 increase
in the degree of trade openness leads to approximately
0269 increase in growth of GDP Also there is a
positive relationship between the growth of foreign
direct investment (FDI) and economic growth since
FDI helps to supply long-term capital with new
technologies managerial and marketing capabilities
that would in turn augment economic growth through
employment increasing managerial skills diffusing
technologies and fostering innovations (Asiedu 2002
as cited by Adhikary 2011) The coefficient of 0009
implies that over the study period a 1 increase in the
degree foreign direct investment would lead to 0009
increase in growth of GDP
However results for openness to trade and foreign
direct investment in the model proved to be statistically
Stock Market Development and Economic Growth the Case of the Philippine Stock Market
68
insignificant after using these as control variables
along with the stock market liquidity measurements
The explanatory power or the goodness of fit of the
model as measured by the R-squared is at 09488
which means that 95 can be explained by the model
and it has a very strong fit The value indicates that
economic growth in the Philippines is adequately
explained by the model for the period between the first
quarter of 1996 to the third quarter of 2012 or that 95
of the variation in the growth of economic activities is
explained by the independent variables Moreover the
relationship between liquidity and growth remains
strong even after controlling for inflation foreign direct
investment and openness to trade Thus raising stock
market liquidity may independently produce
substantial growth
43 Long Run Relationship and Causality
431Test for Stationarity
One of the conditions in order to test Granger
Causality between the two variables is through its
stationarity It is important to know if the variable is
stationary or does not have a unit root or if the variable
is nonstationary or the variable contains a unit root
The variables LNTVTS LNMSIZE and LNGDP
were not stationary in their respective level forms
Thus for testing of the unit roots the Augmented
Dickey Fuller (ADF) test was used for the two
measurements of stock market liquidity which are the
LNTVTS and LNMSIZE and the proxy for economic
growth LNGDP The ADF includes the additional
lagged terms which can be examined by the Akaike
Information Criterion (AIC) to ensure that the errors
are uncorrelated If the variable is nonstationary at
level form but stationary after first differencing the
variable is integrated of order 1 and has a unit root
Using the said test variables LNTVTS LNMSIZE
and LNGDP are stationary after first differencing The
results for stationarity are shown in Table 2
Table 2 Stationarity Test Results
Variables Level Form P-value First Difference P-value
LNGDP 05891 lags (4) 00015 lags (4)
LNTVTS 06311 lags (4) 0000 lags (3)
LNMSIZE 03335 lags (4) 00039 lags (4)
Notes 1 significant at 1 level of significance
2 significant at 5 level of significance
432 Test for Cointegration
Since the stationarity of the variables have been
established the cointegration of the indicators of stock
market development and economic growth were tested
The results for the Cointegrating Regression Dickey
Fuller Test are shown in Table 3
Table 3 Cointegrating Regression Dickey Fuller
Test Results
Regressed Variables P-value
LNTVTS and LNGDP 00250
LNMSIZE and LNGDP 00545
Note significant at 5 level of significance
The regression results suggest that LNTVTS is
cointegrated with LNGDP Thus LNTVTS has a
long-run relationship with LNGDP which means
LNTVTS share a common stochastic drift or a
common trend with LNGDP The results also suggest
that LNMSIZE is also cointegrated with LNGDP
because the error term is stationary
433 Granger Causality
Granger Causality can only be tested if variables
are stationary and variables are cointegrated It is used
to establish whether a uni-directional or bi-directional
relationship exists between stock market development
and economic growth Results showed that LNTVTS
and LNMSIZE are both stationary and cointegrated
with LNGDP Table 4 shows the optimal number of
lags used in each determinant through Akaike
Information Criterion Table 5 shows the result of the
Granger Causality test
J Glob Bus Trade Vol 9 No 2 (November 2013) 61-71
69
Table 4 Akaike Information Criterion
LNGDP LNTVTS LNMSIZE
Lags AIC AIC AIC
0 212598 237417 215782
1 168524 222582 181308
2 164703 223876 179562
3 14775 214879 172127
4 14659 216273 167974
Note indicates the optimal number of lags
The results of the Granger Causality tests indicated
that there is a unidirectional causality between stock
market liquidity using the growth in the market size as
proxy and economic growth However results show
that there is no causality between growth in total value
of traded shares and economic growth Growth in total
value of traded shares and economic growth may have
a long-run relationship since they are cointegrated but
they do not exhibit Granger causality
Table 5 Granger Causality Test Results
Variable Computed
Statistic
F Tabular
Value
Granger
Causality
LNTVTS to
LNGDP 093NS 04532 No
LNGDP to
LNTVTS 038NS 07660 No
LNMSIZE to
LNGDP 347 00136 Yes
LNGDP to
LNMSIZE 037NS 08293 No
Notes 1 significant at 5 level of significance
2 NS - indicates insignificance
Since the variables LNTVTS and LNGDP were
found to be cointegrated an Error Correction Model
(ECM) was specified to test for the speed of
adjustment in the said determinants when one of these
variables experiences a shock Table 6 shows the Error
Correction Method results for LNTVTS and LNGDP
Table 6 Error Correction Method Results
Variables Speed of Adjustment
LNTVTS and LNGDP -0143817
Note significant at 5 level of significance
It can be observed from the results that LNTVTS
as the measure of stock market liquidity and LNGDP
for economic growth have the coefficient of the error
correction term with a negative sign and it is
statistically significant at the 5 level of significance
Thus the significance of the error correction mecha-
nism supports cointegration and suggests the existence
of a long-run equilibrium relationship between economic
growth and stock market development determinant
LNTVTS In other words the coefficient of the error
correction term which measures the speed of adjust-
ment back to equilibrium whenever the system is
experiencing a shock indicates that it would take 6953
asymp 7 quarters for a variable to adjust whenever one
experiences a shock
Ⅴ Summary and Conclusion
This research work studies stock market develop-
ment and its implications to economic growth by
analyzing the relationship between the stock market
measurements for liquidity and GDP growth in the
Philippines The specific objectives of the study were
to measure the liquidity of the Philippine stock market
and evaluate its trends for the given period determine
the linkages between stock market liquidity and
growth of the economy and to determine the causality
between stock market development and economic
growth
Using Ordinary Least Squares (OLS) method for
the time series data covering the period of the first
quarter of 1996 to the third quarter of 2012 it was
shown that the role of the stock market is essential to
economic growth in a developing country like the
Philippines The two measures used for liquidity the
growth in total value of traded shares and the growth in
market size were both positively related to economic
growth and statistically significant However results
for the growth in openness to trade and foreign direct
investment in the model proved to be statistically
insignificant after using it as control variables along
with the stock market liquidity measures Inflation on
Stock Market Development and Economic Growth the Case of the Philippine Stock Market
70
the other hand which was lagged by one period
conforms to theoretical conventions by having a
negative relationship to economic growth since it
affects economic performance because of monetary
instability About 95 of the variation in economic
growth is explained by the independent variables
Moreover the relationship between liquidity and
growth remains strong even after controlling for
inflation foreign direct investment and openness to
trade Thus raising stock market liquidity may
independently produce substantial growth
In assessing the relationship between stock market
development and economic growth it empirically
proved that the measure of economic growth (LNGDP)
and all of the determinants for stock market liquidity ndash
LNTVTS and LNMSIZE were both stationary and
cointegrated For the case of the Philippines there is a
unidirectional causality between stock market liquidity
using the growth in the market size as proxy and
economic growth For LNTVTS stock market
liquidity does not ldquoGranger causerdquo economic growth
and vice versa Since the two indicators have a long
run relationship the results of the Error Correction
Model suggest that there is an adjustment in stock
market liquidity as proxied by growth in total value of
traded shares and economic growth whenever one of
the indicators experiences a shock
Admittedly the study only tested a portion of the
financial side the stock marketrsquos liquidity Other
important determinants of stock market development
such as price volatility elasticity in trading corporate
governance could also be incorporated to give more
robust results There are a wide variety of factors that
can affect economic growth both on the financial and
real sectors of the economy which needs to be taken
into consideration The empirical results indicate that
the potential of the Philippines Stock Exchange in
fostering growth in the country should further be
explored
References
Adhikary B K (2010) FDI trade openness capital
formation and economic growth in Bangladesh A
linkage analysis International Journal of Business
and Management 6(1) 16-28
Benić V amp Franić I (2009) Stock market liquidity
comparative analysis of Croatian and regional
markets Financial Theory and Practice 32(4)
477-498
Garcia V F amp Liu L (1999) Macroeconomic
determinants of stock market development Journal
of Applied Economics 2(1) 29-59
Kanasro H A Jalbani A A amp Junejo M A (2009)
Stock Market Liquidity A Case Study of Karachi
Stock Exchange Pakistan Journal of Commerce
Social Science 3 25-34
Levine R amp Zervos S (1996) Stock market
development and long-run growth The World
Bank Economic Review 10(2) 323-339
Levine R amp Zervos S (1998) Stock markets banks
and economic growth American Economic Review
537-558
Levine R (1996) Stock markets A spur to economic
growth Finance and Development 33 7-10
Levine R (1996) Stock market liquidity and economic
growth Theory and evidence Retrieved from
httpfacultyhaasberkeleyeduross_levinepapers
0845_001pdf
Levine R (1997) Stock markets economic develop-
ment and capital control liberalization Perspec-
tive 3(5) 1-8
Mishkin F (2006) The economics of money banking
and financial markets (10th ed) Upper Saddle
River NJ Prentice Hall
Mohtadi H amp Agarwal S (2001) Stock market
development and economic growth Evidence
from developing countries Available at http
www uwm edumohadiPA-4-01pdf
Nagaishi M (1999) Stock market development and
economic growth Dubious relationship Economic
and Political Weekly 2004-2012
J Glob Bus Trade Vol 9 No 2 (November 2013) 61-71
71
Nurudeen A (2009) Does stock market development
raise economic growth Evidence from Nigeria
The Review of Finance and Banking 1(1) 015-
026
Petros J (2012) The effect of the stock exchange on
economic growth A case of the Zimbabwe stock
exchange Research of Business Economics 6 1-
17
Sarr A amp Lybek T (2002) Measuring liquidity in
financial markets (Working Paper No 02232)
Washington DC IMF
Tapitan J P (2012) Measuring link between financial
development and economic growth using a sample
of selected ASEAN countries (Unpublished under-
graduate thesis) Los Banos Philippines Univer-
sity of the Philippines Los Bantildeos
Von W R (2004) Measuring and predicting liquidity
in the stock market (Doctoral dissertation) Retrie-
ved from httpwww1 unisgchwwwedisnsf
SysLkpByIdentifier2899$FILEdis2899pdf
Xiao X amp Kong L L (2012) An Empirical Study
on the Relationship between Turnover Rate and
Stock Returns in Chinese Stock Market Advances
in Information Technology and Management 2(1)
239-245
Yartey C A (2008) The determinants of stock market
development in emerging economies Is South
Africa different (Working Paper No 0832)
Washington DC IMF
J Glob Bus Trade Vol 9 No 2 (November 2013) 61-71
73

Negotiation Factors and Culture in Trade Negotiations
2
marketing culture has been typically visualized at the
national level However operationalization within the
national context has been difficult because of a wide
divergence of definitions each reflecting different
paradigms from varying disciplines
Many studies on international business negotiations
conclude that people of different cultures use signify-
cantly different negotiation approaches These different
approaches include communication style used persuasion
strategies employed and protocols followed While
negotiation studies emphasize possible differences in
the way conflict is viewed and managed little attention
had been paid to differences in reacting to cross-
cultural conflicts in negotiations Yet the handling of
conflict is critical to any effective cross-cultural
negotiations How the parties respond to conflict also
depends on a number of factors including the nature of
the conflict the cultural orientation of the individuals
and the affiliation of the parties It is clear that how the
parties perceive respond to and choose to resolve
conflicts is critical to the success of any long-term
business relationship The purpose of this study is to
present some factors affecting international trade
negotiations and to compare cultural differences
among Korean Chinese and European business nego-
tiators by analyzing their negotiation behaviors
Ⅱ Negotiation Variables
21 Environmental Factors
Grumperz (1979) suggests that humans while
interacting also provide stylistic signals for interpret-
tation of verbal communications through the use of
what he calls contextualization cues An example of a
contextualization cue might be a rise in tone of voice to
indicate or underline an important point Grumperz and
his associates have also found that contextualization
cues vary across cultures They are behaviors learned
in the course of the individualrsquos socialization Further
he suggests that differences in these cues are often the
cause of misunderstandings which can have serious
consequences in cross-cultural interactions
Elements of conversational form that have been
found to vary across cultures are legion For example
Graham (1985) reports Brazilian negotiators appear to
have more aggressive conversation than Japanese or
American negotiators In simulated negotiations
Brazilians used the words lsquonorsquo and lsquoyoursquo more
frequently the former providing a negative tone the
latter providing a presumptuous tone vis-a-vis the
Japanese and American behaviors The Brazilian
nonverbal behaviors also differed from the Japanese
and Americans no silent periods and far more
interruptions and facial gazing occurred
A variety of situational factors might act as
determinants of outcomes of business negotiations for
example company goals location and number of
parties Culture has been a difficult concept to deal
with in any consistent scientific way A culture is a
configuration of learned behaviors and results of
behavior whose component parts are shared and
transmitted by the members of a particular society
(Linton 1945) The important part of the definition for
present research is the idea that behaviors are shared by
members of a particular culture According to Spiro
(1950) members of a given society behave in uniform
and predictable ways In addition to bargaining
behaviors being consistent within cultures several
authors have suggested that negotiations processes
differ across cultures
22 Process Measures
Representational communications involve the
transmission of information whereas instrumental
communications involve influencing another party
Representational communications can be regarded as a
problem-solving approach It involves an emphasis on
questions and getting information from a counterpart
about needs and preferences The focus is on
cooperation and an integrative approach whereby the
needs of both parties are honestly discussed and
eventually satisfied Therefore it can be defined
concisely as a set of negotiation behaviors that are
cooperative integrative and information-exchange-
oriented
J Glob Bus Trade Vol 9 No 2 (November 2013) 1-9
3
Attractiveness Power and Credibility might also
be conceived of as the three classic source charac-
teristics in communication models Some researchers
suggest ldquothe relationship between attraction to a source
(like dislike friendly feelings etc) and attitude change
has received scant attention Rubin and Brown (1975)
conclude that interpersonal attraction enhances nego-
tiating outcomes Therefore to the extent that a person
receives rewards from a relationship with someone a
negotiator perceives as attractive that person will be
more satisfied with the negotiation outcome In this
study rather than characteristics ascribed to sources of
communication these variables are considered descrip-
tors of negotiation strategies These variables are
measured through ratings of both participants in the
negotiation games
Impression Formation Accuracy has also been
conceived as an individual characteristic or ability It is
believed that a strong relationship between salesperson
performance and abilities to perceive both a customerrsquos
beliefs about products and importance weights for
product attributes Impression formation accuracy is
treated as a measure of the efficiency of the interaction
rather than an individual characteristic
The problem-solving approach (PSA) for business
negotiation is defined as a set of negotiation behaviors
that are cooperative integrative and information
exchange-oriented PSA involves an emphasis on
questions and getting information from clients about
their needs and preferences The problem solving
approach in negotiations involves first an emphasis on
questions and getting information from clients about
their needs and preferences Second once the clientrsquos
requirements and circumstances are fully understood
then the negotiator accommodates the offering to the
clientrsquos needs The focus is on cooperation and an
integrative approach wherein the needs of both parties
are honestly discussed and eventually satisfied A PSA
can be concisely defined as a set of negotiation
behaviors which are cooperative integrative and
information-exchange oriented Such strategies tend to
maximize the number of alternative solutions consi-
dered thus allowing negotiators to optimize outcomes
The relationship between a problem-solving approach
and negotiation outcome has been frequently investi-
gated during the last twenty years Different resear-
chers have used various labels for the PSA concept
(eg integrative bargaining strategies-Walton amp
McKersie (1965) cooperative orientation -Rubin amp
Brown (1975) Williams (1983) Problem-solving
orientation-Pruitt amp Lewis (1975) Murray (1986))
Most of findings have been relatively consistent
Generally the PSA has been found to positively
influence negotiation outcomes Graham (1986)
investigated relationships between the PSA and a
negotiatorrsquos individual profit and their bargaining
partnerrsquos satisfaction Consistent with several studies
reviewed by Rubin and Brown (1975) statistically
significant relationships were discovered between a
negotiatorrsquos PSA and the negotiatorrsquos individual profit
Negotiators who encourage partners to provide
information about themselves and their needs and
preferences can be expected to achieve more favorable
negotiation outcomes Rubin and Brown (1975) and
Weitz (1979) suggest the importance of adjusting
onersquos negotiating tactics according to onersquos impre-
ssions of the opponentrsquos negotiation style Specially
Weitz suggests that adaptive behavior will enhance
negotia-ting effectiveness Rubin and Brown posit high
adaptability coupled with cooperativeness will favor
higher negotiation outcomes
In addition to the negotiating strategies inter-
personal attractions such as like or dislike and friendly
or unfriendly feelings can strongly influence current
negotiation outcomes and the success of future
transactions Simons Berkowitz and Moyer (1970)
suggest the relationship between attraction to a source
such as like or dislike friendly or unfriendly feeling
and attitude change has received scant attention Rubin
and Brown (1975) conclude in their review of the
negotiation literature that generally interpersonal attrac-
tion enhances negotiating outcomes A negotiating
partnerrsquos satisfaction has been found to be positively
related to a negotiatorrsquos attractiveness for business
people from France and Germany (Campbell et al
Negotiation Factors and Culture in Trade Negotiations
4
1988) from America Taiwan Japan and Korea
(Grahametal 1988)
In the very relevant field of buyerseller interact-
tions Evansrsquo (1963) similarity hypothesis posits that
the more similar individuals are in buyerseller
relationships the more favorable will be the outcome
and the more likely a sale Mathews Wilson and
Monoky (1972) argue that perceived similarity results
in more cooperation between the buyer and seller
Attraction is the mechanism through which similarity
affects these outcomes
It should be noted that interpersonal attraction
might be conceived as an exogenous construct-
determined before negotiations begin as a part of the
combination of the negotiatorrsquos characteristics It may
also be argued that attraction is a consequence of the
negotiation However attraction is regarded as a
process-related construct
There is an abundance of studies in the negotiation
literature that focuses on the fundamental assumption
that personal parameters or negotiatorsrsquo characteristics
are relevant to negotiation processes and outcomes
(Barry amp Friedman 1998) Someone with a trusting
nature tends to give credence to the honesty of
statements of others until or unless reasons are
provided for disbelief In negotiation trust relates to
how they expect their partners to behave and respond
(Fells 1983)
In the cross-cultural negotiation literature duration
of the negotiation is described as a key aspect of the
process For example Tung (1982) and Van Zandt
(1970) report that negotiations with the Chinese and
Japanese are exasperatingly long from the perspective
of most American negotiators Pruitt (1981) discusses
at great length the pervasive influence of time on
negotiations That is a time limit affects the qualities of
the aspirations concession making and negotiation
satisfaction Although time limits per se are not varied
in this study negotiators from different cultures may
have different expectations about appropriate durations
which may in turn influence behaviors
Silent periods are operationally defined as gaps in
conversations lasting 10 seconds or more in duration
The time period of ten seconds was selected somewhat
arbitrarily but it is a long enough period of silence to
appear unnatural to most observers The tapes were
searched for gaps in conversations of ten seconds or
more The ten seconds time period while somewhat
arbitrary is a long enough silence to appear unnatural
to most American observers
The concept of interactional synchrony the
unconscious coordination of verbal and nonverbal
behaviors of 2 or more participants in a conversation
was discussed at length by Graham (1980) It is the
number of conversational overlaps or interruptions
during a conversation Conversational overlaps are
defined as periods when both speakers are talking at
the same time or when the conversational contribution
of one speaker overlaps that of the other speaker One
possible measure of this construct is the number of
conversational overlaps or interruptions during a
conversation Identification of such overlaps is
independent of the verbal content of the interactions
Facial gazing is defined as the percentage of time a
negotiator gazes at the face of partner Many resear-
chers have found significant relationships between
facial gazing and outcomes of negotiations (Lewis amp
Fry 1977) Moreover several authors have suggested
differences in facial gazing behaviors across cultures
(Argyle amp Cook 1976)
Touching means that a negotiator touches another
negotiation partner with the exception of beginning
and ending handshakes It is the number of times
negotiators touch their partners (excluding beginning
and ending handshakes) Graham (1985) reports
Brazilian businesspeople touch one another during
simulated negotiations while Japanese and American
negotiators do not
23 Outcome Measures
Researchers often find outcomes of business
negotiations difficult to measure and to compare
Various studies have used sale versus no sale an
obvious measure of negotiating effectiveness (eg
Pennington 1968) profits obtained by negotiators (eg
J Glob Bus Trade Vol 9 No 2 (November 2013) 1-9
5
Rubun amp Brown 1975) and a combination of
individual and joint profits (Clopton 1984) Beyond
profits negotiatorrsquos satisfaction is an important
measure of success especially if partners desire a
continued relationship Given the dual importance of
task accomplishment (profit) and relationship building
(satisfaction) especially in international negotiations
the present study uses both as outcomes
Ⅲ Cultural Difference in Nonverbal
Behavior
The participants in the experiment were 10
Chinese 10 Korean and 10 European Students who
are majoring in international business and Korean
businessmen are undergraduate students majoring
international commerce at Paichai University in Korea
This section deals with nonverbal aspects of
videotaped interactions The rhythms of the
conversations are discussed examining silent periods
and conversational overlaps Next facial gazing and
touching during negotiations are presented
31 Silent Periods
Silent periods are operationally defined as gaps in
conversations 10 seconds or more in duration The
time period of 10 seconds was selected somewhat
arbitrarily but it is long enough period of silence to
appear unnatural to most observers The tapes were
searched for gaps in conversations of 10 seconds or
more Silent periods occurred more frequently in the
Korean negotiatorsrsquo interactions (51 per 30minutes)
than either the Chinese or European negotiators
Negotiators from a low context culture such as Europe
tend to regard the silence of a high context culture such
as Korea as a rejection which is not a rejection in a
real sense by their standards
32 Conversational Overlaps
The concept of interactional synchrony the uncon-
scious coordination of verbal and nonverbal behaviors
of 2 or more participants in a conversation was
discussed at length by Graham (1980) It is the number
of conversational overlaps or interruptions during a
conversation Conversational overlaps are defined as
periods when both speakers are talking at the same
time or when the conversational contribution of one
speaker overlaps that of the other speaker The number
of overlaps (interruptions) by each participant was
totaled and divided by the time of negotiation to arrive
at values which may be compared across interactions
According to Table 1 Korean negotiators interrupted
more than Chinese or European negotiators
33 Facial Gazing
Facial gazing is defined as the percentage of time a
negotiator gazes at the face of partner Randomly
selected 10-minute videotape excerpts of each of the
interactions served as data here The author recoded
the time each participant spent gazing at hisher
partnerrsquos face during 10 minutes According to Table 1
European negotiators spent considerably more time
gazing at negotiation partners than either Korean or
Chinese negotiators
Table 1 Comparison of Patterns of Nonverbal Negotiation Behavior
Nonverbal Negotiation Behavior Korean Chinese European Silent Periods(average number of silence for more than 10
seconds during 30 minutes)
Conversational Overlaps(average number of conversational
overlaps during 30 minutes)
Facial gazing(average number of gazing)
Touch(number of touch)
51
308
11 25
35
264
11 30
28
58
76 00
Negotiation Factors and Culture in Trade Negotiations
6
34 Touching
Touching means that negotiator touches another
negotiation partner except for beginning and ending
handshakes Except for European negotiators Korean
and Chinese negotiators seldom touch their partners
except for handshakes
Ⅳ Conclusions
The purpose of this study has been to find out basic
factors affecting international business negotiations
and to suggest some strategic implications for business
negotiators With the advancement of globalization
intercultural business negotiations become more and
more important as a marketing strategy The role of
business negotiators is extremely important in order to
achieve successful international business negotiations
In order to achieve agreement in international
business negotiations negotiators are required to
manage cultural differences between the parties
concerned in addition to the complexity of domestic
negotiations Because such a large variety of cultural
factors exist among nations it is critical for negotiators
to identify the kind of problem-solving approaches that
are most appropriate for each intercultural negotiator
Understanding cultural differences is vital for successful
intercultural negotiations An objective measurement
of culture is important to overcome misunderstanding
caused by stereotyping and prejudice about other
cultures
As for nonverbal negotiation behaviors Korean
negotiators tend to use more silent periods than the rest
of two groups Also Korean negotiators interrupted
more than Chinese and European negotiators
European negotiators used more lsquofacial gazingrsquo and
lsquotouchingrsquo strategies in negotiation However there are
study limitations as follows the most important
consideration is the validity of the principal outcome
measure individual profit Kellyrsquos negotiation game
and such measures have been used in other studies but
how well the game represents actual business
negotiations is problematic Much of the evidence
supplied for accepting and rejecting hypotheses is
based on self-reports and judgements of participants
Also small sample sizes do not allow for tests of
statistical significance The negotiator should understand
the cultural background specifically regarding business
negotiation Negotiators can ask more questions in
their negotiations Sometimes itrsquos smart to be a little
bit dumb in business negotiations
The more the negotiators ask questions the more
information they can get and they can exchange more
information Also using a silent strategy can be
necessary and aggressive influence tactics such as
warnings and threats particularly those emphasized
with expressions of emotions may be used in
negotiations in a very restrictive way
Cooperatives and educational institutions should
take advantage of current research to develop training
programs on cultural differences in not only verbal
communication but non-verbal communication for
better trade negotiation results
References
Achrol R S (1997) Changes in the theory of
interorganizational relations in marketing Toward
a network paradigm Journal of the Academy of
Marketing Science 25(1) 56-71
Adler N J amp Graham J L (1989) Cross-cultural
interaction the international comparison fallacy
Journal of International Business Studies 20(3)
515-537
Allred K G Mallozzi J S Matsui F amp Raia C P
(1997) The influence of anger and compassion on
negotiation performance Organizational Behavior
and Human Decision Processes 70(3) 175-187
Argyle M amp Cook M (1976) Gaze and mutual
gaze Cambridge England Cambridge University
Press
Atkinson J M amp Heritage J (1984) Structures of
social action Studies in conversation analysis
Cambridge England Cambridge University Press
Barry B Fulmer I S amp Van Kleef G A (2004) I
laughed I cried I settled The role of emotion in
J Glob Bus Trade Vol 9 No 2 (November 2013) 1-9
7
negotiation The Handbook of Negotiation and
Culture 71-94
Barry B amp Friedman R A (1998) Bargainer
characteristics in distributive and integrative
negotiation Journal of Personality and Social
Psychology 74(2) 345
Barry B amp Oliver R L (1996) Affect in dyadic
negotiation A model and propositions Organiza-
tional Behavior and Human Decision Processes
67(2) 127-143
Blackman C (1977) Negotiating China Case studies
and strategies St Leonards Australia Allen amp
Unwin
Brenkert G G (1998) Trust morality and interna-
tional business Business Ethics Quarterly 8(02)
293-317
Brunner J A amp Taoka G M (1977) Marketing and
negotiating in the peoplersquos republic of China
Perceptions of American businessmen who atten-
ded the 1975 Canton Fair Journal of International
Business Studies 69-82
Butler J K (1995) Behaviors trust and goal
achievement in a win-win negotiating role play
Group amp Organization Management 20(4) 486-
501
Campbell N C Graham J L Jolibert A amp
Meissner H G (1988) Marketing negotiations in
France Germany the United Kingdom and the
United States The Journal of Marketing 52 49-62
Casse P (1981) Training for the Cross-Cultural Mind
(2nd ed) Washington DC Society for
Intercultural Education Training and Research
Cellich C (1995 January) Negotiations for export
business Elements for success In International
Trade Centre (ED) International Trade Forum
(No 4 p 20) Geneva Author
Clopton S W (1984) Seller and buying firm factors
affecting industrial buyersrsquo negotiation behavior
and outcomes Journal of Marketing Research 21
39-53
Coates A (1968) Myself a Mandarin Oxford UK
Oxford University Press
Davidson W H (1987) Creating and managing joint
ventures in China California Management Review
29(4) 75-95
Deutsch M Kelley H H amp Rapoport A (1964)
Strategic interaction and conflict Berkeley CA
Berkeley Institute of International Studies
University of California
Evans F B (1963) Selling as a dyadic relationship A
new approach American Behavioral Scientist 6
76-79
Fang T (1997) Chinese business negotiating style A
socio-cultural approach (Licentiate thesis)
Linkoping Sweden Inter-national Graduate School
of Management and International Engineering
(IMIE)
Fisher R Ury W amp Patton B (1991) Getting to
Yes (2nd ed) New York NY Penguin Books
Ganesan S (1994) Determinants of long-term
orientation in buyer-seller relationships The
Journal of Marketing 19(4) 1-19
Gardner L amp Aronson G (Eds) (1968) Handbook
of Social Psychology Reading MA Addison-
Wesley
George J M Jones G R amp Gonzalez J A (1998)
The role of affect in cross-cultural negotiations
Journal of International Business Studies 29(4)
749-772
Gilsdorf J W (1997) Metacommunication effects on
international business negotiating in China
Business Communication Quarterly 60(2) 20-37
Goh B C (1996) Negotiating with the Chinese
Euro-Asia Business Review 5(1) 34-36
Graham J L (1985) The influence of culture on the
process of business negotiations An exploratory
study Journal of International Business Studies
81-96
Graham J L (1986) The problem-solving approach
to negotiations in industrial marketing Journal of
Business Research 14(6) 549-566
Graham J L (1990) An exploratory study of the
process of marketing negotiations using a cross-
cultural perspective In E A Scarcella amp S
Krashen (Eds) Developing communicative
Negotiation Factors and Culture in Trade Negotiations
8
competence in a second language (pp 239-279)
Rowley MA Newbury House
Greenhalgh L amp Gilkey R W (1993) The effect of
relationship orientation on negotiatorsrsquo cognitions
and tactics Group Decision and Negotiation 2(2)
167-183
Gumperz J J (1982) Discourse strategies Cambridge
UK Cambridge University Press
Hall E T (1976) Beyond culture Garden City NY
Anchor Press
Hall E T (1989) The silent language New York
NY Bentam-Doubleday
Hofstede G (1991) Cultural and organization amp
software of the mind Berkshire England
McGraw-Hill
Hofstede G (2001) Culturersquos consequences (2nd ed)
Thousand Oaks CA Sage
Jones G R amp George J M (1998) The experience
and evolution of trust Implications for cooperation
and teamwork Academy of Management Review
23(3) 531-546
Kumar R (1997) The Role of affect in negotiations
an integrative overview The Journal of Applied
Behavioral Science 33(1) 84-100
Kumar R (2004) Culture and emotions in
international negotiations An overview In M J
Gelfand amp J M Brett (Eds) The handbook of
negotiation and culture (pp 95-113) Stanford CA
Stanford Business Books
Lewicki R J amp Stark N (1996) What is ethically
appropriate in negotiations An empirical examina-
tion of bargaining tactics Social Justice Research
9(1) 69-95
Lewis S A amp Fry W R (1977) Effects of visual
access and orientation on the discovery of
integrative bargaining alternatives Organizational
Behavior and Human Performance 20(1) 75-92
Linton R (1945) The cultural background of personality
New York NY Appleton-Century Crofits
McAllister D J (1995) Affect-and cognition-based
trust as foundations for interpersonal cooperation
in organizations Academy of Management
Journal 38(1) 24-59
Min H amp Galle W (1993) International negotiation
strategies of US purchasing professionals Interna-
tional Journal of Purchasing and Materials
Management 29(2) 40-50
Pennington A L (1968) Customer-salesman bargain-
ing behavior in retail transactions Journal of
Marketing Research 255-262
Pruitt D G (1981) Bargaining Behavior New York
NY Academic Press
Reardon K K amp Spekman R E (1994) Starting out
right Negotiation lessons for domestic and cross-
cultural business alliances Business Horizons
37(1) 71-79
Rempel J K Holmes J G amp Zanna M P (1985)
Trust in close relationships Journal of Personality
and Social Psychology 49(1) 95
Rubin J Z amp Brown B R (1975) The social
psychology of bargaining and negotiation New
York NY Academic Press
Salacuse J W (1991) Making global deals negotia-
ting in the international marketplace Boston MA
Houghton Mifflin
Sawyer J amp Guetzkow H (1965) Bargaining and
Negotiation in International Relations In H C
Kelman (Ed) International behavior A social-
psychological analysis (pp 464-520) New York
NY Holt Rinehart and Winston
Sebenius J K (2002) The hidden challenge of cross-
border negotiations Harvard Business Review
80(3) 76-85
Shenkar O amp Ronen S (1987) The cultural context
of negotiations The implications of Chinese
interpersonal norms The Journal of Applied
Behavioral Science 23(2) 263-275
SRI International (1979) Doing Business in Taiwan
and Doing Business in Japan [Pamphlet] Menlo
Park CA Schmidt K D
Stewart S amp Charles F K (1989) Talking with
dragon Negotiating in the peoplersquos republic of
China Columbia Journal of World Business 23(3)
68-72
J Glob Bus Trade Vol 9 No 2 (November 2013) 1-9
9
Strong K amp Weber J (1998) The myth of the
trusting culture a global empirical assessment
Business amp Society 37(2) 157-183
Thibaut J W amp Kelly W H (1959) The social
psychology of groups New York NY McGraw-
Hill
Triandis H C Kurowski L L amp Gelfand M J
(1994) Workplace diversity In H C Triandis M
D Dunnette amp L M Hough (Eds) Handbook of
industrial and organizational psychology (pp 769-
827) Palo Alto CA Consulting Psychologists
Tung R L (1982) US-China trade negotiations
practices procedures and outcomes Journal
of International Business Studies 25-37
Weiss S E (1993) Analysis of complex negotiations
in international business The RBC perspective
Organization Science 4(2) 269-300
Weitz B (1979) A critical review of personal selling
research The need for contingency approaches In
G Albaum amp G A Churchill (Eds) Critical
issues in sales management State of the art and
future research needs Eugene OR University of
Oregon
Yoshimatsu H (2005) Japanrsquos keidanren and free
trade agreements Societal interests and trade
policy Asian Survey 45(2) 258-278
Zandt V (1970) How to negotiate in Japan Harvard
Business Review 25-38
J Glob Bus Trade Vol 9 No 2 (November 2013) 11-21
11
ISSN 1946-5130
Journal of Global Business and Trade
wwwiagbtcom
Is the Agrochemical Industry Traversing the Organic Route
Insights and Directions for a Philippine Agrochemical
Trading Company
Jane Keneth M Mampustia Jeanette Angeline B Madamba
b Agnes T Banzon
c and
Loida E Mojicad
abcd College of Economics and Management University of the Philippines Los Bantildeos Philippines
Received 12 August 2013 Revised 22 September 2013 Accepted 25 October 2013
ABSTRACT
This paper explores the strengths weaknesses challenges and opportunities of a Philippine agrochemical
trading company as it thrives within its broader macro-environment In an era of climate change adaptation
and ailing global economies agrochemical companies within the food chain face even greater barriers to
survival and competitiveness The study revealed that the agrochemical industry has made baby steps in
encouraging farmers to adopt the natural or organic way of farming through the use of biopesticides and
biofertilizers as a response to climate change but price-sensitive farmers appear indifferent to the use of
biopesticides and biofertilizer and readily switch suppliers depending on product prices as well as the
promotional activities done by agrochemical trading companies These suggest that agrochemical usage will
continue to dominate global agriculture in the next couple of years while biologicals in organic agriculture
will account for a minimal percentage despite the trend toward sustainable agriculture To be sustainable it is
suggested that agrochemical trading companies introduce new brands for each product type formulate a
customer retention strategy for its dealers and independent business partners and pursue a market penetration
strategy to widen the customer base as they track their moves against a changing global agrochemical
industry
Keywords agrochemical industry biopesticides climate change adaptation organic agriculture sustainability
Ⅰ Introduction2
Agrochemicals also known as crop protection
products are those products or substances which are
used to effectively and actively manage the agricultural
ecosystem Agrochemical products include pesticides
herbicides insecticides and fungicides Synthetic
fertilizers hormones and other chemical growth agents
2013 International Academy of Global Business and Trade
All rights reserved
as well as concentrated stores of raw animal manure
may also be included in the list of agrochemical
products These products can be classified into four
categories inorganic pesticides organic pesticides and
pre-emergent and post-emergent herbicides These
chemicals play a vital role in controlling and restrain-
ing the damaging attacks of pests weeds fungi
diseases and other undesirable pests which pose
serious threats to global crop production The benefits
offered by agrochemical products are two-fold the
Is the Agrochemical Industry Traversing the Organic Route Insights and Directions for a Philippine
Agrochemical Trading Company
12
control of certain pests and diseases to improve crop
productivity and indirectly poverty alleviation (Fertili-
zer and Pesticide Authority 2012)
Fig 1 Benefits of Pesticides to Control Human and Livestock Disease Vectors and Nuisance Organisms
Source Cooper and Dobson as cited in Cuyson S (2007)
Pesticide products when used properly can give
benefits not only to the community but to the whole
society as shown in Fig 1 Problems which most
farmers complain about like fast-growing weeds and
threats to crop productivity can be resolved through the
application of herbicide The application would reduce
cost of labor and fuel specifically for large plantations
Safety for the environment and human health is also
emphasized Careful regulatory policies are implemented
by the FPA so that the environment and human health
would not be at risk Although chemical-based crop protection products
have contributed time and again toward increasing
farmersrsquo incomes because these products prevent
massive crop losses caused by pests and diseases Due
to the need to efficiently meet demand farmers and
other agribusiness entities have to constantly rely on
crop-protecting chemical products since it only takes a
short period to harvest crops with the help of these
products (Tirado 2008) Agrochemical products as
well as the widespread use of irrigation have largely
contributed to the increase in agricultural production
On the other hand health concerns have caused a
negative perception of agrochemicals since over-
utilization of these products have caused problems
such as toxicity of the soil pollution and food poisoning
Established multinational companies involved in
the agrochemical industry as well as local companies
are pressured to effectively address the agricultural
trend of shifting to organic farming and developing
more environmentally-friendly products In addition
there are government policies to which they must align
their objectives with societal welfare in mind Non-
government organizations (NGOs) and environmental
groups such as Greenpeace have been actively making
their moves against crop protection companies With
this scenario players in the industry are bound to
strategize on how to improve product safety to defend
themselves from the actions of such groups in the
interest of sustainability
Phil-Agrochemicals Trading (not the real name) is
a nationwide distributor of generic agrochemical products
located in Southern Luzon Philippines Its distribution
network includes dealers independent business partners
(IBPs) and wholesalers The market may be skeptical
about the efficacy of generic agrochemical brands but
J Glob Bus Trade Vol 9 No 2 (November 2013) 11-21
13
this small company strives to be more responsible for
their products through continuous research on ways to
improve their products and demonstrate such efficacy
in crop protection Knowing their products may have
detrimental effects for the farmers if not properly used
the company conducts seminars or farmersrsquo group
meetings on the safe use of their products They also
give protective gear such as masks and gloves to the
farmer participants Products which are traded by this
company are manufactured by several suppliers in the
Philippines such as AgChem Manufacturing Corpora-
tion Radisson Agrochemical Corporation and Kemistar
Corporation These manufacturing compa-nies are
members of the Crop Protection Association of the
Philippines (CPAP) one of the leading crop protection
chemical associations in the country Phil-Agroche-
micals Trading also imports agrochemicals (speci-
fically insecticides) from Bharat Agro Chemicals in
India and China Xiamen Top using Import amp Export
Co Ltd from China About 10 of their total
inventory comes from imported insecticides Currently
Phil-Agrochemicals Trading which also distributes
products of its sister company has fifteen pesticide
products and two plant nutrition products in its
inventory pipeline
With the stiff competition in the Philippine agro-
chemical industry brought about even more by the
institution of Republic Act No 10068 (also known as
the Organic Act of 2010) the company has to find
ways to better strategize so as to gain customer trust
encourage continued patronage and improve overall
company performance The company has about eight
direct competitors
This paper aims to present an overview of the
agrochemical industry compare the firmrsquos operational
and functional strategies with the practices in the
industry identify and assess the problems and oppor-
tunities pertaining to these strategies and compare
these with its competitorsrsquo strategies and suggest
solutions to the problems or strategies to take
advantage of opportunities in view of the challenges of
going organic and the overall demand for the greening
of agriculture
II Methodology
Primary data for this exploratory research were
gathered from surveys and interviews with four
company officerspersonnel 60 farmers five indepen-
dent business partners and five dealers as well as an
actual apprenticeship at Phil-Agrochemical Trading
over a two-month period by the major author
Secondary data were obtained from printed sources
found at several government institutions such as the
Crop Protection Association of the Philippines (CPAP)
and the Fertilizer and Pesticide Authority (FPA)
company files and other printed or online publications
and unpublished special problem reports at the College
of Economics and Management library Descriptive
analysis combined with a comparative competitor analysis
and a SWOT analysis was used in this research
Ⅲ Review of Literature
Zhang et al (2011) identified three phases in the
history of pesticides and its application (1) the first
phase which covered the period before the 1870s saw
the use of natural pesticides (such as sulfur in ancient
Greece) as a pest control measure (2) the second phase
from the 1870s to 1945 saw the advent of inorganic
synthetic pesticides and the use of natural materials
and inorganic compounds and (3) the third phase
(from 1945 onwards) marked the era of organic
synthetic pesticides (eg DDT 24-D and later HCH
dieldrin) Since then humans synthesized most
pesticides which were later referred to as chemical
pesticides It was during the third phase (the era of
organic synthetic pesticides) when there was a boost in
agricultural productivity which became a moving force
for the advancement of human civilization
During the earlier portion of the third phase three
kinds of insecticides were used carbamated insecticides
organophosphorus insecticides and organochlorined
insecticides This was soon followed by the develop-
ment of herbicides and fungicides As seen in Table 1
herbicide use increased from 20 in 1960 to 48 in
2005 Herbicides comprised almost half of total
pesticide consumption in 2005 (Zhang et al 2011)
Is the Agrochemical Industry Traversing the Organic Route Insights and Directions for a Philippine
Agrochemical Trading Company
14
Table 1 Changes of Pesticide Consumption Worldwide
CATEGORY 1960 1970 1980 1990 2000 2005
Sales Sales Sales Sales Sales Sales
Insecticides 310 365 1002 371 4025 347 7655 29 7559 279 7798 25
Herbicides 170 20 939 348 4756 14 1162
5
44 1288
5
475 1497
1
48
Fungicides amp Bactericides
340 40 599 222 2181 188 5545 21 5306 196 7486 24
Others 30 35 159 59 638 55 1575 6 1354 5 936 3
Total 850 100 2700 100 11600
100 26400
100 27104
100 31191
100
Note Sales in millions USD
Source Xu (1997) httpwwwdocincomp-55305172html as cited in Zhang et al (2011)
According to the Food and Agriculture Organi-
zation of the United Nations (FAO) fertilizer and
pesticide use in the Philippines between 1961 and
2005 increased by 1000 and 325 respectively
This was caused by the widespread use of irrigation
agrochemicals and new seeds in the country However
crop yield only increased by a small amount even
though agrochemical products were used This was
mainly attributed to excessive and inappropriate use of
chemical-based products in farming causing land
degradation and losses in soil fertility
Ⅳ Overview of the Industry
41 Global Agrochemical Industry
Dussal (2011) stated that the world agrochemical
industry was valued at USD 134 billion in 2010 It is
expected to grow at a CAGR of 11 to reach USD
225 billion by 2015 The Asia Pacific region led the
global agrochemical and fertilizer consumption
accounting for 40 followed by North America with
32 The top ten global players include Bayer
Syngenta Potash Corp Agrium and Mosaic which
constitute around 90 of the world market share
Pesticide sales remained relatively constant over
the 1990s between USD 270 to 300 billion From 2007
to 2008 herbicides ranked first in the three major
categories of pesticides (insecticides fungicides
bactericides and herbicides) in terms of sales The
fungicidesbactericides ranked second Europe is now
the top consumer of pesticides in the world followed
by Asia Specific countries which largely use
pesticides are China the United States France Brazil
and Japan Most of the pesticides worldwide are used
for fruit and vegetable crops In developed countries
pesticides mainly herbicides are primarily used for
maize Since the 1980s there have been hundreds of
thousands of pesticides developed worldwide inclu-
ding biopesticides (Zhang et al 2011)
According to the US Environmental Agency
ldquobiopesticides are certain types of pesticides derived
from such natural materials as animals plants bacteria
and certain minerals For example canola oil and
baking soda have pesticide applications and are
considered biopesticides At the end of 2001 there
were approximately 195 registered biopesticide active
ingredients and 780 products Biopesticides fall into
three major classes
a Microbial pesticides consist of a micro-
organism (eg a bacterium fungus virus or
protozoan) as the active ingredient Microbial
pesticides can control many different kinds of
pests although each separate active ingre-
dient is relatively specific for its target pest(s)
For example there are fungi that control
certain weeds and other fungi that kill
specific insects
b The most widely used microbial pesticides
are subspecies and strains of Bacillus
thuringiensis or Bt Each strain of this
bacterium produces a different mix of
proteins and specifically kills one or a few
J Glob Bus Trade Vol 9 No 2 (November 2013) 11-21
15
related species of insect larvae While some
Btrsquos control moth larvae found on plants
other Btrsquos are specific for larvae of flies and
mosquitoes The target insect species are
determined by whether the particular Bt
produces a protein that can bind to a larval
gut receptor thereby causing the insect larvae
to starve
c Plant-Incorporated-Protectants (PIPs) are
pesticide substances that plants produce from
genetic material that has been added to the
plant For example scientists can take the
gene from the Bt pesticide protein and
introduce the gene into the plantrsquos own
genetic material Then the plant instead of
the Bt bacterium manufactures the substance
that destroys the pest The protein and its
genetic material but not the plant itself are
regulated by EPA
Fig 2 Distinguishing Factors for the Paradigm Shift in the Crop Protection Industry
Source Balayan (2010)
d Biochemical pesticides are naturally occurring
substances that control pests by non-toxic
mechanisms Conventional pesticides by
contrast are generally synthetic materials that
directly kill or disable the pest Biochemical
pesticides include substances such as insect
sex pheromones which interfere with mating
as well as various scented plant extracts that
attract insect pests to traps Because it is
sometimes difficult to determine whether a
substance meets the criteria for classification
as a biochemical pesticide the EPA has
established a special committee to make such
decisions
42 The Philippine Crop Protection Industry
According to the Samahan sa Pilipinas ng mga
Industriyang Kimika (SPIK) or Chemical Industries
Association of the Philippines in 2008 the utilization
of crop-protecting chemicals is still prevalent among
Filipino farmers In the country the most extensively
used pesticides are insecticides which account for 51
of the total market herbicides comprise 21
fungicides 14 and the remaining other types of
pesticides 14 These chemicals are used for crops
such as rice (about 33 million hectares of plantation
area) corn (32 million hectares) pineapple (67000
hectares) and banana (25000 hectares)
Is the Agrochemical Industry Traversing the Organic Route Insights and Directions for a Philippine
Agrochemical Trading Company
16
Because of the greater challenge faced by the
players there has been a progressive shift in the
industry from what is commonly known as an
agrochemical industry to a crop protection industry and
now to a plant science industry as shown in Fig 2 The
shift to a plant science industry is believed to deliver
products that would give better solutions to crop
problems and technologies that would lead to
sustainability As of now the multinational companies
or the CropLife members are the ones which are
already in the third phase (Balayan 2010) The generic
companies are still in phase 2 (crop protection) but on
their way to shift to phase 3 (plant science)
The Philippine crop protection industry is
comprised of firms engaged in the formulation
manufacture distribution repackaging importation
and exportation of chemical pesticides It has always
been dominated by transnational agrochemical com-
panies which are members of CropLife International
such as Bayer CropScience Syngenta Philippines Du
Pont Dow Agro These companies operate and manu-
facture their own agrochemical products These
companies focus more on the assurance of the safety of
their products Moreover they are now more respon-
sible about the flow of their products up through the
disposal phase Hence they practice product steward-
ship In 2008 the FPA has listed about 300 firms
operating in the country Other players in the industry
would include local companies such as the members of
the Crop Protection Association of the Philippines
(CPAP) and other generic product-making companies
As shown in Table 2 there has been an increasing
demand for pesticides in the country although a
continuous campaign against these products is done by
the NGOs An increase in Philippine importation of
pesticides is due to the fact that perceived sustainability
cannot be achieved without the help of these
agrochemical products The country is highly
dependent on importation due to the limited resources
available in the country for formulators and manufac-
turers Active ingredients are also imported by the
major industry players Local production is limited to
formulation of imported technical materials except for
24-D
Table 2 Value of Imports of Pesticides in the Philippines (in USD 1000rsquos)
Item 2006 2007 2008 2009 2010
Insecticides 39658 49152 65022 68873 51371
Fungicides 46751 40741 32109 26914 28648
Herbicides 22236 22793 21954 11715 5031
Disinfectants etc 10388 13033 30741 53249 85043
Total 119033 125719 149826 160751 170093
Source FAO (2010)
On the other hand exports of pesticides by the Philippines show minimal levels making the country a net importer of
pesticides (Table 3)
Table 3 Value of Exports of Pesticides in the Philippines (in USD 1000rsquos)
Item 2006 2007 2008 2009 2010
Insecticides 1335 2938 1547 1508 1928
Fungicides - - 1 15 132
Herbicides 1 262 400 81 27
Disinfectants etc 312 1199 915 1256 740
Total 1649 4399 2863 2859 2826
Source FAO (2010)
J Glob Bus Trade Vol 9 No 2 (November 2013) 11-21
17
43 Foreseen Trends in Global Pesticide
Production and Consumption
The trend nowadays is organic agriculture which is
seen also as sustainable agriculture Thus the ongoing
deterioration in the natural environment had Zhang et
al (2011) saying that biopesticides are the wave of the
future Such pesticides must be highly efficient non-
toxic and environment-friendly Biopesticides according
to Yang (2001) have the following advantages
a a positive control effect on pests safe to humans
and animals and no pollution
b no residuals
c strong specificity to target pests safe to natural
enemies and beneficial organisms
d raw materials and active ingredients are natural
products which helps to ensure sustainable
development
e they can be modified by means of modern
biotechnology and fermentation processes to
improve performance and enhance quality
f pest resistance is difficult to generate
Over 100 kinds of biopesticides exist at present
worldwide with about 30 types of biopesticides
commercially produced (Xu 2008) Countries such as
Mexico the United States and Canada dominate global
biopesticide usage accounting for 44 The total
world biopesticide consumption can be broken down
into 20 (Europe) 13 (Asia) 11 (Oceania) 9
(Latin America) and 3 (Carribean and Africa) (Qin
amp Kong 2006) As for China the biopesticide industry
has been expanding since the 1990s from 10 to 20
annually such that by 2006 total biopesticides
consumption reached 145000 tons accounting for 10
of total sales It is anticipated that biopesticides will
replace up to 20 of chemical pesticide consumption
in China in the years ahead
Since safer products are what consumers are
demanding companies such as United Farm Tech-
nologies Nuso Agro Science and Dow Agro started
selling and manufacturing safer pesticides called
biopesticides These products are derived from natural
materials Biopesticides constitute about 2 of the
global agrochemical market (Dussal 2011) In
Monsantorsquos pipeline are agricultural biological or
biopesticides produced using what they call the Bio-
Direct Technology which involves using molecules
found in nature expected to be developed for use in
topically applied crop protection and other products
(Monsanto 2012) Moreover Bayer CropScience
recently acquired AquaQuest a US-based supplier of
innovative biological pest management solutions based
on natural microorganisms for USD 500 million in its
bid to build a leading technology platform for green
products (Bayer 2012)
Ⅴ Results and Discussion
51 Compliance by Phil-Agrochemical
Trading with FPA Requirements
The FPA requirements relative to product labeling
were all met by the Phil-Agrochemical Trading These
include a statement of composition registration or
provisional permit number name and address of
company the productrsquos common name net contents
directions for use suitable indication of hazards
instructions on decontamination and safe disposal of
used containers the lot number and date of formulation
the FPA registration number re-entry period after
application triple rinse logo a person to contact in case
of emergency and safety instructions
52 Comparison of Phil-Agrochemical
Tradingrsquos Activities with CPAP
Activities
Four types of activities are carried out by CPAP
members product stewardship agromedical training
information education campaign aerial spraying semi-
nars and farmersrsquo meetings Phil-Agrochemical
Trading has yet to apply for CPAP membership A
comparison of its activities with CPAP activities
revealed that only farmersrsquo meetings are done by the
firm
Is the Agrochemical Industry Traversing the Organic Route Insights and Directions for a Philippine
Agrochemical Trading Company
18
53 Comparison of Phil-Agrochemical
Tradingrsquos Operations with Top
Competitors
Table 4 presents a summary comparison of Phil-
Agrochemical Tradingrsquos operations with two of its
top competitors CyBERTH Philippines Inc and
PhilAgrow Inc
CyBERTH Philippines Inc was established in
1999 and is engaged in trading pesticides and
fertilizers in the country However they trade more
pesticide products as fertilizer is more expensive The
companyrsquos product portfolio includes 24 registered
products categorized as insecticides herbicides
fungicides molluscicides or plant growth regulators
The major crops where these products can be used are
rice corn vegetables and mangos The companyrsquos
operations cover the research and development of new
products importation and local purchase of the
technical and inert materials of a particular product
formulation warehousing and supply of finished
products to its distributors This company continuously
searches for better products
PhilAgrow Inc started operations in 2006 and is an
importerdistributor of chemical pesticides such as
insecticides molluscicides fungicides herbicides
nematicides and specialties It has 18 FPA-registered
products
Table 4 Summary Comparison of Phil-Agrochemical Trading with Two Top Competitors
Points for Comparison Phil-Agrochemical
Trading CyBERTH Philippines Inc PhilAgrow Inc
Product Lines 14 FPA registered products 24 FPA registered products 18 FPA registered products
Product Variety
Herbicidesinsecticides
molluscicides fungicides fertilizer
Herbicides insecticides
molluscicides fungicides fertilizer
Insecticides molluscicides
fungicide herbicides nematicides specialties
Promotional Activities
Farmers meetings caravans
raffle promos provision of protective gears
Farmers meetings raffle
promos provision of protective gears
Farmers meetings raffle
promos provision of protective gears
Target Market
General trade market
plantation businesses small farmers (below 2ha and 2ha
and above)
General trade market
plantation businesses small farmers below 2 ha
and 2 ha and above)
General trade market
plantation businesses small farmers below 2 ha and 2 ha
and above)
Location Scope Domestic Domestic Domestic
Facilities (eg warehouse
transportation)
Rented (Outsourced
production) Owned Research facility
Provision of training to employees
- Yes Yes
Note Firm name was disguised upon firmrsquos request
Among the points for comparison it can be seen
that Phil-Agrochemical Trading has the least number
of product lines at 14 FPA-registered products vis-agrave-
vis CyBERTH Philippines Inc with 24 FPA-
registered products and PhilAgro Inc with 18 FPA-
registered products In terms of product variety Phil-
Agrochemical Trading and CyBERTH Philippines
Inc have 5 types of products while PhilAgrow has 6
types All firms carry out the same promotional
activities have the same target market and location
scopecoverage Facilities of Phil-Agrochemical
Trading are rented while those for CyBERTH
Philippines Inc are owned PhilAgrow Inc has its
own research facility Only CyBERTH Philippines
Inc and Phil-Agrow Inc provide training to
employees
54 Farmer Survey Results
Sixty farmers surveyed had about 11-15 years of
farming experience primarily grew rice operated
small farms (1-5 hectares) and were customers of Phil-
J Glob Bus Trade Vol 9 No 2 (November 2013) 11-21
19
Agrochemical Trading for five years or less The
majority (over 91) bought pesticides from other
distributors because of lower prices and availability of
preferred agrochemicals On a scale of 1 to 7 with 7
being the highest rating most farmers rated Phil-
Agrochemical Trading a ldquo4rdquo Suggestions given by the
farmers to the firm included lowering the product
prices and increasing promotional activities to
encourage customer retention and continued patronage
55 Assessment of Strengths Weaknesses
Opportunities and Threats
Fig 3 shows a SWOT Matrix where Phil-Agro-
chemical Tradingrsquos strengths are matched with its
opportunities and then with its threats while its
weaknesses are matched with its opportunities and
then with its threats to generate possible strategy
alternatives for the firm to become sustainable Such
strategies include the introduction of new brands per
product type creation of a customer retention strategy
for its dealers and IBPs and pursuing market
penetration
Fig 3 SWOT Matrix
External
Internal
Opportunities Threats
(1) Training programs and seminars are conducted by institutions
such as FPA and CPAP
(2) The openness of farmers to new knowledge in crop production
(3) The bright prospects for the plant
science industry towards the attainment of food security
(4) Increasing trend towards the
production of biopesticides (5) Availability of funding agencies
(6) The support of government and
NGOs for organic farming
(7) The negative perception on the use of chemical pesticides and fertilizers
(8) Small farmers are highly sensitive to
pesticide prices (9) Increasing competition in the industry
due to increasing number of new
entrants (10) The effects of climate change on the
industry
(11) Products of the industry are not highly differentiated
(12) Prices of inputs for the manufacture
of pesticides are volatile
Strengths
Introduction of different brands for
each type of pesticide
(S1 S2 and O1 O5)
Market Penetration
(S1 S3 and T1 T3 T6)
1 The firm has suppliers which are
members of CPAP
2 The firm has its BOD as distributors
3 They do not distribute Category I
pesticide 4 The company has developed
partnership with the dealers of
organic fertilizers
Weaknesses
Creation of customer retention
strategy for the dealers and IBPs
(W2 W3 W5 and O1 O2 O3)
Creation of customer retention strategy for the dealers and IBPs
(W2 W3 W4 and T1 T2 T3 T6)
1 Lack of warehousing facilities
2 Weak brand recognition
3 Non-commitment of dealers and
IBPs
4 Experiences stock-outs of products
5 The company does not have well-
established customer relationships
56 Insights and Directions It is apparent that though the agrochemical industry
has taken action in traversing the organic route toward
Is the Agrochemical Industry Traversing the Organic Route Insights and Directions for a Philippine
Agrochemical Trading Company
20
sustainability it has only taken small steps in that
direction Even if customers are clamoring for safe
food and in spite of the trend towards organic
agriculture and sustainability most farmers remain
indifferent toward using biopesticides and other
biologicals in farming on account of their sensitivity to
input prices and demand for more promotional
activities Thus in the next couple of years it is
expected that agrochemicals of a synthetic nature will
continue to dominate the global agrochemical industry
in terms of usage and market share Such a trend is
expected to spill over to Asia including the Philippines
as transnational companies take in a sizeable share of
the market
To survive and compete in the industry agroche-
mical trading companies must employ a number of
strategies such as introduce new brands for each
product type formulate a customer retention strategy
for its dealers and IBPs and pursue market penetration
Lastly in the case of Phil-Agrochemical Trading the
firm should consider CPAP membership and carry out
product stewardship agromedical traininginformation
education campaign and aerial spraying seminars to
enhance its competitiveness in the agrochemical
industry
References
Balayan L M A (2010) An apprenticeship study on
Bayer cropscience Gocus on its thrust towards
sustainable development through its quality health
safety and environment (QHSE) system (Under-
graduate Special Problem Report) Los Banos
Philippines University of the Philippines Los
Bantildeos
Castillo A (2000) A special problem report on Bayer
Philippines Inc (Undergraduate Special Problem
Report) Los Banos Philippines University of
the Philippines Los Bantildeos
Cuyson S (2007 March) Pesticides in sustainable
agriculture and the environment Paper presented
at the 38th annual scientific conference Tagbilaran
Philippines
David F R (2009) Strategic Management Concepts
and Cases (12th ed) Upper Saddle River NJ
Pearson Education
Dussal M (2011) Agrochemicals Retrieved from
httpwwwAgrochemicalInformationand Resour-
ceshtm
Lu J L (2009) Total pesticide exposure calculation
among vegetable farmers in Benguet Philippines
Journal of Environmental and Public Health 2009
Retrieved from httpwwwhindawicomjournals
jeph2009412054
Lum KY Mamat M J Cheah UB Castaneda
CP Rola AC amp Sinhaseni P (1993) Pesticide
research for public health and safety in Malaysia
the Philippines and Thailand Retrieved from
httpwwwnzdlorggsdlmode=d-00000-00-off-
0envl000010000direct-10401l11-en-5020-about-
00010004001110-0utfZz800ampcl=CL13ampd=HAS
H 016be195f7a6257ed84a093544ampgt=1
Palacio E B (2004) An apprenticeship study on the
crop protection division of syngenta corporation
(Undergraduate Special Problem Report) Los
Banos Philippines University of the Philippines
Los Bantildeos
Qin X F amp Kong F B (2006) Prospect and
situation of biopesticides Journal of Anhui Agri-
cultural Sciences 34(16) 4024 4057
The Philippines (1996) Philippine case study a
developing countryrsquos perspective on POPs Paper
presented at the IFCS Meeting on POPs Manila
Philippines Retreived from httpwwwchem
unepchpopsindxhtmsmanexp7html
Tirado R amp Bedoya D (2008) Agrochemical use in
the Philippines and its consequences to the environ-
ment Quezon Philippines Greenpeace Southeast
Asia Retrieved from httpwwwgreenpeacetopu
bliccationsGPSEA_agrochemical-use-in-the-phili
ppdf
Varca L M (2002) Impact of agrochemicals on soil
and water quality Food and Fertilizer Technology
J Glob Bus Trade Vol 9 No 2 (November 2013) 11-21
21
Center Retrieved from httpwwwagnetorg
libraryphpfunc=viewampid=20110804160130
Xu Y Z (2008) The application of biological
pesticides and industrial development measures
Chinese Agricultural Science Bulletin 24(8) 402-
404
Yang J L (2001) Green chemistry and technology
Beijing Beijing University of Posts and Teleco-
mmunications 176-180
Zhang W Jiang F amp Ou J (2011) Global pesticide
consumption and pollution with China as a focus
Proceedings of the International Academy of Ecol-
ogy and Environmental Sciences 1(2) 125-144
J Glob Bus Trade Vol 9 No 2 (November 2013) 23-27
23
ISSN 1946-5130
Journal of Global Business and Trade
wwwiagbtcom
A Study on the Dependency on Japan and the
Competitiveness of Gear Boxes
Kwang Hee Kim
Department of Business Administration Hyupsung University Korea
Received 15 August 2013 Revised 20 September 2013 Accepted 28 October 2013
ABSTRACT
From the trade deficit with Japan in 2012 of 2557 billion USD the trade surplus of material and components
industry was 2223 billion USD in deficit 87 of such trade deficit with Japan came from the material and
components industry
This study is to focus on the competitiveness index of absolute inferiority in automobile components as of
2012 and lsquogear box and other componentsrsquo that are over the trade for each amount of the automobile
components with Japan
Keywords competitiveness index(CI) dependence on Japan gear box industry trade deficit against Japan
Ⅰ Introduction3
As of 2012 Korea accomplished overall exports of
54787 billion USD and imports of 51958 billion USD
and as a result the trade surplus accomplished a
surplus of 2829 billion USD If this is limited to the
material and components industry the global exports
and imports were 25341 billion USD and 16249
billion USD respectively and as a result the trade
surplus recorded a surplus of 9092 billion USD that
the trade surplus exceeded 60 billion USD To put it
differently the present vast trade surplus mainly came
from the trade surplus of the material and components
industry
In the meantime the trade surplus with Japan
(2012) recorded a deficit of 2557 billion USD It was
less than the trade deficit with Japan for the previous
2013 International Academy of Global Business and Trade
All rights reserved
year 2011 (2864 billion USD) but it was attributable
to the decreasing imports from Japan from the
exchange rate with strong Yen and weak Won
currency The vast scale of the trade deficit with Japan
did not happen overnight
For this background the vulnerability of the
domestic material and components industry was the
greatest cause for the aforementioned From the trade
deficit with Japan in 2012 of 2557 billion USD the
trade surplus of material and components industry was
2223 billion USD in deficit 87 of such trade deficit
with Japan came from the material and components
industry
This study is to focus on the competitiveness index
(-091) of absolute inferiority in automobile compo-
nents as of 2012 and lsquogear box and other components
(8708-40-0000)rsquo that are over the trade for each
amount of automobile components with Japan
Through the foregoing the purpose is to analyze the
A Study on the Dependency on Japan and the Competitiveness of Gear Boxes
24
trend of export and import competitiveness on the
material and components industry with Japan and lead
a responsible strategy for improving the trade deficit
with Japan
Ⅱ Trade Surplus and Status
Looking into the global export and import scale of
lsquogear box and other componentsrsquo (2012) exports reached
2528801000 Dollars and imports 1568670000
Dollars as a result the trade surplus reached
1471934000 Dollars Looking into the export and
import scale with Japan on this item for the same year
it recorded the export of 2379 billion USD and import
of 491028 million USD as a result the trade deficit
recorded 467238 million USD
On the other hand the scale of trade deficit (-470
million USD) with Japan for lsquogear box and other
componentsrsquo was applicable for 18 of the entire
trade deficit with Japan (-2557 billion USD) and 21
of trade deficit with Japan for material and components
(-2233 billion USD)
Also looking only at the trade surplus with Japan
for automobile components (-430 million USD) the
trade deficit of lsquogear box and other componentsrsquo took a
high ratio applicable for 1159 that the status of these
item could be shown
Therefore relief from the trade deficit with Japan
by domestic automobile components industry could be
concluded as impossible without an improvement in
the trade deficit of the lsquogear box and other componentsrsquo
For reference from the costs of a completed car
the ratio for the gear box is known to be around 7-8
As such a gear box with a high ratio of production cost
also has the longest quality assurance limit in that it is
the core item for a high added-value to measure the
competitiveness of a complete car
As shown through the comparison with other
indices under the following Fig 1 the import scale
with Japan for the lsquogear box and other componentsrsquo is
very high Furthermore the import dependence of
Japan has declined from 801 in 1988 770 in
1998 597 in 2008 and 465 as of 2012 but the
import dependency on Japan may be assessed as high
Fig 1 Ratio of Gear Box in the Trade Deficit with
Japan (2012)
Source Prepared by the author by facilitating the Korea International Trade Association (2013)
The global export of this item has clear trend of
increase in recent days The trend of increase has been
significantly moderated from 252 million USD in
1988 to 9 million USD in 2000 However it began
with 2865 million USD in 2002 to leap to 6704
million USD in 2004 918 million USD in 2006
27079 million USD in 2008 and 75942 million USD
in 2010 and it increased to 1 billion 4234 million
USD in 2011 twice that of the previous year As of
2012 it has drastically increased to 2528801000
Dollars over 1 billion USD from the previous year that
exports has shown dramatic increase since 2009
In spite of that the exports to Japan of this item
were USD 970000 in 1988 USD 910000 in 1998
942 million USD in 2008 and 2379 million USD as
of 2012 it has seen very little increase for a quarter of
a century
On the other hand imports from Japan were
15506 million USD in 1988 19402 million USD in
1998 72344 million USD in 2008 and 965669
million USD in 2010 but it has plummeted to record
491028 million USD as of 2012 Compared to 2010
imports from Japan dropped less than a half
J Glob Bus Trade Vol 9 No 2 (November 2013) 23-27
25
Fig 2 Trend of Exports and Imports (1988~2012) of Gear Boxes (8708-40-0000)
Source Prepared by the author by facilitating the Korea International Trade Association (2013)
The trade deficit in automobile components with
Japan to this point has been pointed out with a cause of
importation in highly functional and high-tech
components impossible for domestic development
However according to the interview survey result on
the recent domestic automobile industry gear boxes
imported from Japan are mainly for large commercial
vehicles that are made for productivity purposes in
Korea
Ⅲ Price per Weight on Export and
Import Items
In order to consider the problems in lsquogear box and
other componentsrsquo in detail the price per weight price
of export and import items are analyzed for each price
Following is a brief summary of the export and
import scales and the status of gear boxes to Japan As
is well known in the case of Japan the status of gear
box exports and imports were an item with
overwhelmingly excessive exports Based on 2011
exports were 133 trillion Yen (approximately 18
trillion won) with 128 export countries On the other
hand the imports were only 606 billion Yen
(approximately 800 billion won)
The weight price of Japan for gear boxes is
approximately 1880 Yenkg for the gear boxes with a
high price imported as compared to the export product
price of 1500 Yenkg In particular the weight price
for the import item from the first import subject
country the Netherlands was 7380 Yenkg which
was overwhelmingly higher than the second country
the US of 1270 Yenkg Also the weight price of
export items from the US and Europe was around
1500 Yenkg but the import item price was 2000
Yenkg or higher
A Study on the Dependency on Japan and the Competitiveness of Gear Boxes
26
Table 1 Amount per Kg for Global Export and Import of Gear Boxes
Year Export Import
Amount (USD 1000) Weight (kg) USDkg mount (USD 1000) Weight (kg) USDkg
2005 119947 9259951 130 714512 45342883 158
2006 91804 8512492 108 778889 52223376 149
2007 127074 12051377 105 1066938 72512561 147 2008 270795 21068540 129 1212621 72940221 166
2009 307779 25239366 122 900597 53010625 170
2010 759422 58236825 130 1362034 81828230 166 2011 1423403 106723042 133 1405309 78567171 179
2012 2528801 180077148 140 1056867 59809776 177
A total of 8
years Average weight price 1246 Average weight price 1640
Source Prepared by the author by facilitating the Korea International Trade Association (2013)
On the other hand the weight price of imported
items from Korea was less than 1000 Yenkg for the
gear box an affordable price This fact could be
affirmed by the result calculated through facilitation of
the statistical data of Korea International Trade
Association by the author
In 2010 and 2012 the global weight price of export
items of Korearsquos lsquogear box and other components
(8708-40-0000)rsquo was 130 Dollarkg and 140 Dollarkg
respectively the import item price for the same year
was 166 Dollarkg and 177 Dollarkg respectively
There was a difference in weight price of 3 Dollarkg
or more between items of export and import (Table 1)
Looking into the trend of the 8-year period from
2005 to 2012 the weight price of import items was
higher than the export items The average weight price
of global export items for this item for the 8-year
period was 1246 Dollarkg while the average weight
price for the import item was 1640 Dollarkg there
was a unit price difference of 4 Dollarkg
Thereafter the weight price of the export item to
Japan for the above items in 2010 and 2012 was 81
Dollarkg and 74 Dollarkg respectively while the
import item price was 158 Dollarkg and 160
Dollarkg respectively there was a two times weight
price difference between the export and import items
(Table 2) Looking into the period of 2005 - 2012 for
the above the import items to Japan had a higher
weight price than the export items In addition the
average weight price of the export items for 8 years
was 1105 Dollarkg while the average weight price of
the import item was 1509 Dollarkg there was
approximately 4 Dollarkg or more of price difference
In addition the export amounts to Japan for 2010
and 2012 were 81 Dollarkg and 74 Dollarkg It
declined 4 Dollarkg or more compared to 2009 which
is considered as attributable to diverse types of gear
boxes exported with a drastic increase of exports to
Japan in these two periods
Characteristics of export and import items to the
world and Japan on the gear box and other components
(8708-40-0000) have a higher average weight price in
export and import to Japan than the export and import
items to the world have a higher average weight price
than the import items to Japan
Furthermore when comparing the weight price for
exports and imports to the world and Japan on this
item the import items were higher than the export
items To interpret it differently it is proof that the
export of the gear box had lower added value than the
imported items
J Glob Bus Trade Vol 9 No 2 (November 2013) 23-27
27
Table 2 Amount per Kg for Exports and Imports of Gear Boxes with Japan
Year Export Import
Amount (USD 1000) Weight (kg) USDkg mount (USD 1000) Weight (kg) USDkg
2005 14004 1010821 139 444022 29443945 151
2006 10124 805067 126 531454 38286910 139
2007 10180 845554 120 725042 55581305 130 2008 9420 708144 133 723444 49337793 147
2009 9235 743895 124 628173 39923189 157
2010 11075 1361065 81 965669 61103817 158 2011 19866 2284696 87 812394 49161068 165
2012 23790 3225976 74 491028 30683013 160
A total of 8
years Average weight price 1105 Average weight price 1509
Source Prepared by the author by facilitating the Korea International Trade Association (2013)
Ⅳ Conclusions
The following is the summary of contents shown
through the analysis of the lsquogear box and other
componentsrsquo
First the above items have shown a drastic
increasing trend for global export after 2009 but
export to Japan was still in a minimal increasing trend
close to horizontal line even as of 2012
Second characteristics of export and import items
to the world and Japan showed a higher average
weight price of export items to Japan than the export
items to the world and the import items from the
world had a higher average weight price than the
import items from Japan Also when comparing the
export and import weight prices with the world and
Japan for the above item the import items had a higher
rate than the export items To put it differently the
export of gear boxes was proven to have lower added
value than the import items
Lastly a brief mention was made on the direction
of the lsquogear box and other componentsrsquo
The recent assembly processing technology has
become standardized globally while the material and
components technology have been monopolized by
some advanced countries including Japan Because of
the foregoing the foreign currency earned from the
global market was turned over to Japan and the added
value for Korean industry has not been significant at all
Furthermore if the import of core material and
components such as lsquogear box and other componentsrsquo
is dependent on a specific country there is possible
subordination in the industrial structure with a high
possibility of losing the initiative in production and
price
Purchasing core material and components from
Japan was inevitable in the economic growth process
of Korea in the past but the time has come to make a
great change in the domestic industry
References
Grubel He G amp Peter L (1975) Intra-industry
trade The theory and measurement of interna-
tional trade in differentiated products London
UK MacMillan
Kim Kwang-Hee (2008) The competitiveness of
domestic auto parts industry against Japan The
Korean-Japan Journal of Economics amp Manage-
ments Studies 41
Kim Kwang-Hee (2013 June) A study on the
dependency on Japan and competitiveness of gear
box Paper presented at the 10th annual conference
and research symposium Mongolia National
University Mongolia
Korea International Trade Association (2013) Trade
statistics data Retrieved from httpwwwkitanet
J Glob Bus Trade Vol 9 No 2 (November 2013) 29-34
29
ISSN 1946-5130
Journal of Global Business and Trade
wwwiagbtcom
The Nature of Competition in an Indian Market Focusing on
the Volume Zone
Tirtha Bahadur Karki
Graduate school of Asian and International Business Strategy Japan
Received 14 June 2013 Revised 12 September 2013 Accepted 2 October 2013
ABSTRACT
Emerging countries are playing a growing role in the world economy It is a role that is expected to be even
greater in the future The recent global financial and economic crisis has further emphasized the stagnation of
most developed economics and taken prominence in emerging economics In particular China and India play
a significant role as global markets Henceforth it is estimated that the Indian volume zone will expand
rapidly and steadily On the other hand Japan and other developed economies tend to be sluggish Therefore
Japanese multinational corporations may have to target Indian volume zone consumers To do so they are
required to change their strategy management and production systems to compete with local and international
rivals in the market because the nature of the competition is totally different in an Indian market than other
developed country However definitions of the volume zone differ among research institutions researchers
countries and urban and local areas which creates considerable differences in the size of markets Thus in
this paper the literature review summaries and compares the definitions of the volume zone first Second this
paper tries to Fig out the most important part of the volume zone which has a key role in making a business
strategy Third differences between developed markets and the Indian market are examined and the nature of
competition in the Indian market is argued Finally the main argument and implication are stated
Keywords competition developed market emerging market Indian market strategy volume zone
Ⅰ Introduction4
There is very significant global interest in the
Indian economy Along with China Brazil Indonesia
and a few other countries India promises great potential
of growth in the next few years and decades The
future of the Indian economy is thus a significant
concern among the global financial and business
community economic policy-makers and managers
multilateral financial institutions economists and
2013 International Academy of Global Business and Trade
All rights reserved
other academics as well as investors and consumers in
India The significant global interest in India is not
surprising It is well known that - on a purchasing
power parity basis ndash India is already at over USD
four trillion of GDP the fourth largest economy in the
world very close to the size of the Japanese economy
the third largest In the next 15 to 18 years this size is
expected to grow as per various studies and estimates
four to five times As a result many foreign investors
and a majority of global companies and businesses are
making a beeline for the Indian market which
The Nature of Competition in an Indian Market Focusing on the Volume Zone
30
promises a booming volume zone5 of a few hundred
million consumers (Fig 1) expanding steadily in the
next few decades
Fig 1 Shares of Global Middle Consumption
2000-2050
Source Kharas (2010)
On the other hand advanced economies including
Japan are slowing down Japan has been in a long
recession with a real GDP growth rate of 39 in 2010
It underlines the world economy shift from developed
nations with their huge populations rising household
incomes and expansion of consumer goods and
service markets toward the emerging economies6
From these perspectives the expansion of the
Indian volume zone has attracted considerable
attention Many Japanese firms have already adjusted
their strategy management and production systems in
order to compete with the Indian volume zone
However there are no official definitions of volume
zone7 and these definitions differ among research
institutions researchers countries and urban and local
areas This creates considerable differences in the size
of volume zone markets Thus the literature review
summarizes and compares the definitions of volume
zone arguements After identifying the important part
of the volume zone (what is the volume zone what is
the trend of the volume zone etc) this paper argues the
differences between developed markets and the Indian
5 It is also called middle class middle income class and
middle income In this paper the middle class is identified as volume zone
6 The countries and consumers team 2010
7 Eric D et al (2007) Kharas (2011)
market which is very useful in knowing the nature of
competition in the Indian market Finally the main
argument and implications are stated
11 Definitions of Volume Zone
There are various definitions of volume zone based
on annual household disposal income annual
household income and expenditure Since the
definition of volume zone is not standardized with
each countryrsquos factors it remains uncertain Thus we
need to define and examine the Indian volume zone
which is most important in order to Fig out a business
strategy
12 Annual Household Disposable Income
The Ministry of Economy Trade and Industry
(2010) Aoshima Kubota and Sakamoto (2009) Japan
research institute (2010) Mizuho Research Institute
(2010) and Yanagawa and Mori (2010) defined the
Asian volume zone including that of India as
comprising people whose annual household disposa-
ble incomes range between $5000 and $35000 (upper
middle class $15001-35000 lower middle class
$5001-$15000 lower class $1000-$5000 the poor
up to $1000) and the rich as those whose annual
household disposable incomes exceed $35000 On the
other hand Indiarsquos National Council of Applied
Economic Research (NCAER report 20052006)
defined the Indian volume zone as comprising people
whose annual household disposable incomes range
between $22320 and $4444 (Rs1000000-Rs200000
at 20012002 price)
Comparing these two definitions of volume zone
(Fig 2) the former defines that the annual household
disposal incomes of people in the volume zone tends to
be higher at $5001 to $35000 and the latter defines
that the incomes of people in the volume zone tends to
be lower at $4444 to $22320
J Glob Bus Trade Vol 9 No 2 (November 2013) 29-34
31
Fig 2 Definitions of Volume Zone by Annual
Household Disposable Income
13 Annual Household Incomes
First the World Bank (2007) and Milanovic and
Yitzhaki (2002) defined the global volume zone as
those with annual household incomes between the
mean incomes of Brazil and Italy that is an annual per
capita income of approximately $4000-$17000 (at
2000 purchasing power parity (PPP)) Second Bhala
(2009) adopted an absolute approach definition with
an annual per capita income of $3900-$113000 in
PPP terms Third Court and Narasimhan (2010)
divided the consumers of developing countries
including India into the following classes on the basis
of their annual household incomes global class
$113000 and above upper middle class $56500-
$113000 middle class $22500-$56499 lower
middle class $13500-$22499 and deprived class
below $13500 From this distribution the middle class
is defined as those with an annual household income of
$13500-$113000 in PPP terms
In order to compare these definitions Fig 3
presents the minimum and maximum annual incomes
that were specified by various researchers Bhala (2009)
specified the minimum annual income as $3900
which is much lower than that specified in other
definitions
Fig 3 Definitions of Volume Zone by Annual
Household Income
14 Expenditure
Some researchers defined the volume zone on the
basis of expenditures In 2007 Banerjee and Duflo
(2007) defined it on the basis of per capita expenditure
between $2-$4day In 2008 they defined the global
volume zone on the basis of per capita expenditure of
$2-$10day in 1993 PPP (Banerjee amp Duflo 2008) On
the other hand Ravallion (2010) defined it on the basis
of per capita expenditure between $2-$13 day Both of
these expenditure based definitions are used only in
emerging economies
Fig 4 Definitions of Volume Zone by Expenditure
These two definitions also show differences since
the higher bound is $10day and $13day In summary
the volume zone is defined differently on the basis of
various standards locations and economies Owing to
its complexity and variety the volume zone consumersrsquo
jobs incomes consumptions lifestyles and subjective
The Nature of Competition in an Indian Market Focusing on the Volume Zone
32
consciousness of the levels of society must also be
considered for defining the Indian volume zone
Ⅱ Catching the Trend
In order to consider the differences between the
definitions of volume zone this paper argues about
most important part of the volume zone to make a
better strategy in business The management team in
business must know about the volume zone but
$3900 or $4000 (Fig 3) in annual household income
does not make a vast difference in its strategy and
consumers lifestyle In relation to the poor by
associating it with an ability to choose to spend time
and money on something other than survival consider
the volume zone in the case of Indian markets where
estimates range from 30 million to approximately 300
million people
The volume zone is not (yet) the biggest segment
of Indiarsquos overall population Given all the attention
focused on Indiarsquos middle class in recent years it is
important to keep a proper perspective on its size and
potential purchasing power Even using the most
generous estimates of the grouprsquos size the volume
zone comprises less than 30 percent of the population
Thus the rich and the poor combined far outweigh the
Indian middle class The importance of the middle
class lies in the fact that it is the fastest growing
segment of the population Evidence shows that as
income increases the amount and variety of this
discretionary spending increases For corporations the
middle class in India thus presents significant business
opportunities The sales growth of consumer goods
such as televisions and mobile phones to the middle
class has already been established Given the
tremendous growth potential an increasing number of
products are being geared towards the volume zone
population In the transport industry which has
traditionally been dominated by rail travel newer cars
like the Tata Nano (which retails for a little over USD
3000) and low-cost airlines have enabled the volume
zone population to be increasingly mobile The growth
of the volume zone and the economic growth of India
are in a virtuous cycle Rising incomes lead to more
consumption which in turn leads to higher economic
growth then more employment opportunities and
subsequently higher wages and the circle starts again
Thus as the volume zone grows and continues to
increase domestic demand the economy will also
continue to grow Regardless of which definition is
correct and certain it is important to keep a proper
perspective on the potential of the volume zone The
volume zone in India has generated tremendous
interest from the media and multinational corporations
are looking for a new market demographic
Ⅲ Developed Markets and the Indian
Market
In recent years Indiarsquos market growth has
outstripped the developed markets In the 80s GDP
growth in developed nations and India was essentially
the same Between 2000 and 2010 average growth in
the Indian market rose to the point where it was three
times higher Besides this India has corruption less
infrastructure fare of terrorism and etc which are
abnormal in a developed country
Consumers in India tend to be more ethnocentric
than those in developed ones Products from the
western hemisphere are seen by Indian cultures as
carrying western values that might harm their society
as well as the local workforce In developed countries
price quality durability and other product-related
aspects are the major factors that influence buying
decisions Consumers in India tend to be less indivi-
dualistic than in developed ones They care more for a
larger local community and like to be identified as part
of it Advertising which exhibits local values and
traditions has a greater impact on consumers of India
whereas the more individualistic consumers from
developed countries are more influenced by adverti-
sing where the product differentiates itself specifically
from other products in the market
J Glob Bus Trade Vol 9 No 2 (November 2013) 29-34
33
These are the common differences between the
Indian market and developed markets Besides these
there are lots of differences between Indian markets
and developed markets
A survey held by the Graduate School of Asian
and International Business strategy8 in October 2011
on the title of ldquoEntry Strategy of the Japanese Firms in
India and Chinardquo shows that Japanese firms in India
are going to change their target from the upper
(wealthy) class to the Volume Zone (Fig 5) In 2011
581 percent of the Japanese firms replied that they are
targeting upper class customers in India By the way
the survey shows only 274 percent of firms were
targeting the upper class after 3 years (2014) and more
firms targeted the middle class Thus we can
understand the Japanese strategies are shifting from the
upper class to the Volume Zone
Fig 5 Shifting Strategy in India
Ⅳ Conclusion
Thus it is clear that the Indian volume zone is
expanding and Japanese companies are shifting their
strategy from the upper class to the volume zone The
problem is the presence of Japanese companies in the
Indian market where Japanese companies are domi-
nated by Korean and European-American companies
8 Principle of Asia University DrIkejima Masahiro
leads the survey
According to Shintaku and Amano (2009) develo-
ped countriesrsquo firms have more strong technology and
find it more difficult to target the volume zone of
emerging markets and to adopt the strategy locally
There is no room to think about if the strong tech-
nology of a company is harmful for its strategy in
emerging markets The problem is how to approach
the volume zone and this is important Specially the
volume zone comes from the lower class and
companies should know their lifestyle and behavior If
firms understand the value of money for the volume
zone they can easily shift their strategy too This helps
them succeed in the Indian volume zone
Finally the conclusion of this paper presents the
hypothesis for further research about how to approach
the volume zone of India The hypothesis is (Fig 6)
ldquoTo compete successfully in the Indian volume zone
firms need to catch the trend of the volume zone and
educate customers construct market infrastructure
train management personnel and understand the
abilities of the supply side are essential This is why
they need to cultivate their resources at a lower level
than they are targeted (volume zone)
This paper cannot include the case study and
cannot examine the strategy That will be further
researched by this author in the future
Fig 6 Possible Way to Succeed in the Volume
Zone of India
The Nature of Competition in an Indian Market Focusing on the Volume Zone
34
References
Akihisa Yahata (2012) IndiaASEAN business guide
Two challenges of market creation in emerging
countries Tokyo Japan Research Institute
Retrieved from httpwwwjricojppagejspid=
22012
Aoshima Minoru Kubota Yosuke amp Sakamoto
Ryohei (2009) Manufacturing for emerging eco-
nomics that has entered the second stage Learning
to emerging economics strategy of electronics
industry focused on the middle of the economic
pyramid Knowledge Creation and Integration
17(12) Nomura Research Institute Retrieved from
httpswwwnricomjpopinionchitekishisan2009
pdfcs20091208pdf
Banerjee A V amp Duflo E (2008) What is middle
class about the middle classes around the world
The journal of economic perspectives a journal of
the American Economic Association 22(2) 3
Bhalla S (2009) The middle class kingdom of India
and China Wasington DC Peterson Institute for
International Economics
Court D amp Narasimhan L (2010) Capturing the
worldrsquos emerging middle class The McKinsey
Quarterly 1-6
Dyck S Hansakul S amp Saxena R (2009)
Emerging Asiarsquos middle class-A force to be
reckoned with (eSocialSciences Working Paper
No 2232) Retrieved from httpeconpapersrepec
orgRePEcesswpaperid2232
Eric D B Diana F amp Adil S Z (2007) Tracking
the growth of Indiarsquos middle class The McKinsey
Quarterly 51-61
Japan Research Institute (2010 October) Chinarsquos eco-
nomic policy debate heats up in run up to party
congress Asia Monthly 10(115) 1-15
Kharas H (2011 June 13) India China middle class
boom faces many challenges FIRSTPOST
Retrieved from httpwwwfirstpostcomworld
china-india-middle-class-boom-24637html
Milanovic B amp Yitzhaki S (2002) Decomposing
world income distribution Does the world have a
middle class Review of Income and Wealth
48(2) 155-178
Ministry of Economy Trade and Industry (2010)
White paper on international economy and trade
2010 Tokyo Author
Mizuho Research Institute (2010) Japan companies
deviating from volume zone market of China and
India (Mizuho Report) Tokyo Author Retrieved
from httpwwwmizuho-ricojppublicationresearch
pdfreportreport10-0407pdf
National Council of Applied Economic Research
(2005) Annual resport 2005 Retrieved from
httpwwwncaerorgdownloadsannualreportsan
nualreport_2005pdf
Shintaku Junjiro amp Amano Tomo (2009) Emerging
market strategies changes in market and resource
strategies The Journal of Economics 75(3) 40-62
Syusuke Watanabe Tokutaro Hiramoto amp Naoya
Tsuaaki (2012) Developing BoP business as the
principal strategy in 70 trillion of emerging and
developing economics Paying the road to a new
market that is expected to reach 55 billion people
Knowledge Creation and Integration 20(1)
Nomura Research Institute Retrieved from
httpswwwnricomjpopinionchitekishisan2012
pdfcs20120103pdf
Shukla R (2010) How India earns spends and saves
unmasking the real India New Delhi India
SAGE Publications India
Ravallion M (2009) The developing worldrsquos bulging
(but vulnerable) ldquomiddle classrdquo World Development
38(4) 445-454
Sridharan E (2004) The growth and sectoral
composition of Indiarsquos middle class Its impact on
the politics of economic liberalization India
Review 3(4) 405-428
Yanagawa Noriyuki amp Mori Naoko (2010) Income
bracket towing Asiarsquos domestic demand (NIRA
Monograph Series No 31) Tokyo National
Institute for Research Advancement Retrieved
from httpwwwniraorjppdfmonograph31pdf
J Glob Bus Trade Vol 9 No 2 (November 2013) 35-44
35
ISSN 1946-5130
Journal of Global Business and Trade
wwwiagbtcom
Analysis of Public Health Expenditures on Leading Causes of
Morbidity in the Philippines
Paul Joseph B Ramireza and
Earl Joanne S Santos
b
b College of Economics and Management University of the Philippines Los Bantildeos Philippines b Corresponding Author College of Economics and Management University of the Philippines Los Bantildeos Philippines
Received 21 August 2013 Revised 25 September 2013 Accepted 29 October 2013
ABSTRACT
Provision of public goods and services is one of the major roles of the government in an economy Some of
the public goods and services that are being provided cause negative effects while others create positive
externalities One evident case of such is the market for health care Aware of its role to provide health care to
the people governments are even more challenged with the remarkable growth of the demand for health care
Furthermore there are market failures existing in the health care sector Given that the paper examined the
effects of public spending on health care specifically on the principal causes of morbidity in the Philippines
Aside from public spending the paper also took into account private health spending in the analysis The
study employed a pooled ordinary least squares regression model Results showed that the increase in
government spending significantly reduce the number of tuberculosis cases in the Philippines On the other
hand results for diarrhea indicated that public spending and number of diarrhea cases are positively related
The findings imply that although an increase in public health expenditures can have a significant impact on
the number of cases of diseases lowering tuberculosis cases for instance the study can be further extended by
valuing as well the other benefits that can be derived from a prevented sickness resulting from an increase in
public health expenditures
Keywords health care morbidity positive externalities public goods public health expenditures
Ⅰ Introduction9
Economics texts suggest different extents to which
the government can intervene in market activities
Classical economists advocate that the main and in
some instances only role of the government is to
ensure peace and order in the economy ie ensuring
property rights are properly defined and laws and
policies are well-enforced Keynesian economists on
the other hand believe that the government has a
2013 International Academy of Global Business and Trade
All rights reserved
significant role as Keynes demonstrated during the
Great Depression At present different economies adopt
different blends of the two extreme cases However
common to all economies is the need for government
intervention in the presence of market failures and
missing markets given that the government can do
better than the market ie such intervention will not
lead to government failures resulting in further
inefficiencies
It is a known fact that one of the major roles of the
government in an economy is the provision of public
goods Paying no attention to it would result in under-
Analysis of Public Health Expenditures on Leading Causes of Morbidity in the Philippines
36
provision of such goods or worse not being provided
at all due to the free-rider problem Another widely
acceptable role of the government is to provide goods
or services that create a positive externality to the
society These goods or services are usually socially
underprovided since the individual in hisher own
private desire to maximize utility doesnrsquot consider the
beneficial effects to the society of such activities
Examples of such services are education and health
care This paper will provide a general overview of the
global demand for health care then focus on the role of
the government in health care provision in the
Philippines
Ⅱ Global Demand for Health Care
The concern for health is a global phenomenon
Despite the costs of health care services the demand
for health care is growing everywhere in the world
The surge of aging and chronic illnesses in the
developed countries and the shooting requirements of
the rising middle class accompanied by the lsquodiseases
of prosperityrsquo in the developing countries are all
driving demand Global pandemics that threaten the
world as well as environmental changes that cause
dramatic health care challenges are also adding up in
the demand for health care services
The rising demand for health care is evidenced by
the increased spending on health services The worldrsquos
total health expenditure as a percentage of Gross
Domestic Product (GDP) grew by 15 from 82 in
2000 to 94 in 2009 (Table 1) The American region
posted the highest growth in health expenditure as a
percentage of GDP at 26 while the South East
Asian region showed the least at 2 The growing
expenditure on health services are born from both the
public and private Public spending on health care is at
least about 50 for most of the countries The
spending has likewise grown by two percentage points
in excess of GDP growth across all Organization for
Economic Co-operation and Development (OECD)
countries for almost 50 years and is expected to be
more than a fifth of GDP by 2050 if the current trend
persists (Drouin et al 2008) As a result government
health agencies together with patients and health care
companies particularly in developing economies are
alarmed with the growth of health care spending
Given its current share of health care expenditures the
government is confronted with other increasing
demands of its people such as education defense and
pensions aside from demand for health care and the
escalating prices of health services
Table 1 Health Expenditure Ratios 2000 and 2009
Region
Total
expenditure on health
as of gross
domestic product
General government
expenditure
on health as of total
expenditure
on health
Private
expenditure on health
as of total
expenditure on health
General government
expenditure
on health as of total
government
expenditure
External
resources for health as
of total
expenditure on health
Social security expenditure on
health as of
general government
expenditure on
health
2000 2009 2000 2009 2000 2009 2000 2009 2000 2009 2000 2009
African Region 55 65 439 493 561 507 82 96 65 102 79 70
Region of the Americas 114 144 451 493 549 507 145 169 01 01 317 720
South-East Asia Region 37 38 319 371 689 629 44 49 09 16 133 144 European Region 80 93 739 749 261 248 140 146 01 01 522 495
Eastern Mediterranean
Region 42 47 472 509 528 491 69 71 10 11 184 194
Western Pacific Region 60 65 639 644 361 356 138 144 02 02 681 686
Global 82 94 563 591 437 408 133 143 03 04 451 595
Source World Health Organization (2012)
J Glob Bus Trade Vol 9 No2 (November 2013) 35-44
37
Moreover health care expenditures are signify-
cantly associated with improved health outcomes with
public health care expenditure having a larger impact
(Navignon et al 2012) Hence health care expendi-
tures are vital to improving the health status of the
society Relatedly Hurley (2000) stated that ldquothe
market failures that pervade the health care sector
create an important role both for non-market
institutions and for normative economic analysis to
help sort the ldquogoodrdquo policies from the ldquobadrdquo Thus
from a public policy perspective it is valuable to know
how a policy variable like public expenditures on
health care affects the principal causes of morbidity
rates
Ⅲ Status of Public Health
Expenditures in the Philippines
Public health expenditures include current and
capital spending from government budgets external
borrowing and grants and social health insurance
funds (HDR 2007) Although Fig 1 shows that the
budget allocated for public health care in the
Philippines is increasing in the past few years Fig 2
shows that compared to other Southeast Asian
countries the Philippines is actually way behind in
terms of public health care spending as percent of GDP
As a matter of fact according to the Human
Development Report (2007) the Philippines is one of
the countries around the world with the lowest
percentage ( of GDP) spent on public health
expenditure at 14 This current condition would
have a significant impact on the health and ultimately
the over-all productivity of the members of society
For instance the results of the study of Granlund (2006)
indicated that public expenditures on health care have
an effect on the number of absence days of individuals
Furthermore the results showed a positive causality
between health care expenditures and the health of the
society (Granlund 2006)
Sources Department of Budget and Management (2001-
2009)
Source Asian Development Bank (2008)
Since the budget for health is much less in the
Philippines as compared to most countries (and can be
safely assumed to be inadequate) the paper would
want to look at the impact on morbidity incidences
from increasing the current public spending on health
Though the study will just be limited to measuring the
impact on morbidity the results can then be used to
derive the value to society of higher public
expenditures in terms of less people afflicted or
infected by various diseases Unlike in the situation
where the public health care expenditure is already
sufficient (or optimal) it will be much easier to
estimate the external cost of inadequate public health
expenditure by measuring the forgone benefits (say it
resulted to an absence) from those people who were
infected In addition the results of the study could be
used to measure the externalities valued in terms of
cost savings if the spread of the disease was prevented
Analysis of Public Health Expenditures on Leading Causes of Morbidity in the Philippines
38
Ⅳ Leading Causes of Morbidity in the
Philippines
Morbidity may be referred as the state of poor
health the degree or severity of a health condition or
an incidence of a disease In the case of the Philippines
the leading cause of morbidity is pneumonia with an
incidence rate of 718 (per 100000 population) Table 2
shows the top ten leading causes of morbidity in 2007
while Fig 3 shows the trend in the number of cases in
the past few years for the major causes of morbidity
Table 2 Ten Leading Causes of Morbidity
Philippines 2007
Disease Number
of cases
Rate per
100000 population
ALRI and Pneumonia 605471 718
Acute Watery Diarrhea 539701 640 BronchitisBronchiolitis 487302 5778
Hypertension 398538 4726
Influenza 349609 4146 TB Respiratory 114714 136
Diseases of the Heart 31331 372
Dengue Fever 23773 282 Malaria 23207 275
Chickenpox 23090 274
Source Department of Health (2002)
Source Department of Health (2002-2007)
From Fig 1 and Fig 3 it seems that the increasing
public health care expenditures didnrsquot lead to a
significant decrease in the leading causes of morbidity
in the past few years However we cannot conclude
this immediately since there are other factors affecting
the number of cases like private health care
expenditures and population growth These other
variables would be considered later in analyzing the
impact of public health care expenditures on the
number of cases
Ⅴ Characteristics of Health Care
According to Hurley (2000) health care is distinct
from other commodities because of health care having
a combination of features that is only present
individually in other commodities Most of these
characteristics result in market failure or missing
markets causing inefficiencies like in the presence of
externalities information asymmetry and uncertainty
In each of these characteristics the government may be
able to minimize the inefficiencies resulting from these
market failures through public expenditures on health
care (which can be looked at as the policy variable of
the government) This somehow justifies the need for
government intervention on health care as a response
to these characteristics of health care
Though it is desirable to be able to disaggregate
public health expenditure as an answer to each of these
characteristics of health care it will not be easy as
policies on public health care usually answer the
inefficiency problem as a whole Thus the study
would focus on the rationale for public health care
expenditure as it provides a positive externality to the
society
51 Health as a Merit Good
A merit good is a good or service that is regarded
as desirable by the society such that the government
intervenes in its provision The idea is that these goods
and services provide positive externality to the society
and if left to individuals would tend to be under-
provided Thus the government can intervene to
correct this under-provision Common examples of
these merit goods are spending on public services such
as public education and public health care
In general the external benefits from health care
can be looked at in various ways According to Hurley
(2000) people may derive external benefit from
knowing that others receive the needed health care
J Glob Bus Trade Vol 9 No2 (November 2013) 35-44
39
services and not just any health care that a person can
afford In addition the externality from health care can
be looked at as the measure of joy (or prevention of
pity) caused by seeing a healthy person rather than a
sick one The problem however with this valuation of
the externality is that such joy or pity cannot be easily
quantified
An alternative way of looking at the positive
externality provided by the adequate (optimal) amount
of spending on public health would be the cost savings
from those who would have been affected if such
public health expenditures were not adequate (optimal)
The obstacle though is finding these cost savings if the
optimal amount of health expenditures is already in
place This is because one cannot predict who among
the millions or billions of people would have been
externally affected if the existing public health
expenditures were not in place In the case of countries
where public health expenditure is still inadequate we
can analyze the cost savings by looking at the effect of
an increase in public health expenditures on the people
who are currently experiencing diseases which may
have been prevented if the optimal level of expenditure
was in place
52 Prevention versus Cure
It is important to consider that the positive exter-
nalities from having optimal health expenditures can
be realized if such expenditures may have prevented
the spread of a communicable disease Thus if most of
the health expenditures were rather used for cures then
these positive externalities as we defined earlier
would not be realized to the fullest It is still important
to take note that cures also result in a positive
externality since it prevents the further spreading of the
disease given the carrier of the disease is cured as soon
as possible The government expenditures on disease
prevention and control and for infectious disease
prevention and control are exhibited in Fig 4 and Fig
5
Sources Department of Budget and Management (2002-
2009)
Sources Department of Budget and Management (2002-
2009)
Note that the sudden increase in the budget
allocated in both Figs during the 2008 and 2009 was
due to the Intensified Disease Prevention and Control
program introduced during 2008 This almost doubled
or tripled the budget allocation to these items as
compared to years before 2008 It is then desirable to
be able to see the impact of this significant increase in
the public health expenditures on the number of cases
however the data on the number of cases for 2008 is
not yet available
53 Communicable versus Non-
communicable Diseases
Externalities provided by the adequate amount of
spending needed for health care is more apparent in the
presence of communicable diseases In addition to the
general external effects discussed earlier communi-
cable diseases have additional external effects via the
probability of a healthy person being infected by the
Analysis of Public Health Expenditures on Leading Causes of Morbidity in the Philippines
40
person carrying a communicable disease Public
health expenditure may then lower this possibility of
infection to healthy people by providing health care for
people who cannot afford the needed medication
The situation under communicable diseases some-
how distorts the utility maximization problem of
individuals since the presence of a sick person implies
a higher chance of being sick also and thus lowers the
utility of the individual This external effect as pointed
out earlier would cause inefficiency if not recognized
Even though the benefits from societal prevention and
cure of communicable diseases are known the
problem changes to what we know as the free-rider
problem if individuals are left alone to solve the
problem
As we all know voluntary contribution would not
solve the problem due to the free-rider problem Free-
riding would be evident since contribution to
prevention doesnrsquot assure the contributor that he will
be the one that will be saved from the disease ie with
the prevention measures we assume that the infected
individuals will be much less but this doesnrsquot
specifically tell who these individuals are Since this is
the case a person may claim that he doesnrsquot need
prevention measures anyway since with or without the
prevention measure his final state will just be the same
(ie two extreme cases very healthy that in the end he
will be healthy or very vulnerable that heshe will
always be affected anyway) It is likewise possible that
people rather than donate may just choose to put this
prevention contribution into private health expendi-
tures by buying vitamins that give additional protection
or immunity This is the reason why public health
expenditure is essential in the case of communicable
diseases
We can then expect a more significant impact of
higher public expenditures on health care on the
number of communicable diseases as compared to
non-communicable diseases because of the additional
benefits from prevented infection Also we can expect
that public expenditures on health will have a lower
impact as compared to private health expenditures on
non-communicable diseases The paper would then
verify these hypotheses
Ⅵ Sources of Data and Analytical
Procedure
61 Sources of Data
The data used in the study were from various
national survey results gathered by various depart-
ments and agencies of the government Data for the
leading causes of morbidity and the number of cases
every year were taken from the Field Health Service
Information System (FHSIS) Annual Report The
FHSIS Annual Report reflects the activities and health
program accomplishments of the Department of
Health in the Philippines for a given year and serves as
a reference for planning and decision-making at the
local and national levels (FHSIS 2004) The FHSIS
also contains statistics on health systems health status
health services coverage and notifiable diseases in the
Philippines For the purposes of this study the data
utilized were the number of cases per region and per
year of the leading causes of morbidity in the
Philippines such as bronchitis tuberculosis influenza
hypertension and diarrhea
Data on Philippine government health care expen-
ditures were taken from the National Expenditure
Program (NEP) The NEP is an annual publication by
the Department of Budget and Management that
contains the details of the governmentrsquos proposed
program and intended to assist Congress in the review
and deliberation of the proposed national budget for
the legislation of the annual appropriations measures
for the succeeding fiscal year (NEP 2003) Annual and
per region data on public health expenditures were
elicited from the national government budget allocated
to the Department of Health Though it is desirable to
be able to split the expenditures into preventive and
curative measures the available data did not have such
information at the regional level
Data on household (private) expenditures for
health care were obtained from the Family Income and
J Glob Bus Trade Vol 9 No2 (November 2013) 35-44
41
Expenditure Survey (FIES) The FIES is a nationwide
survey of households undertaken every three years by
the National Statistics Office that contains data on
family income and expenditure such as levels of
consumption by item of expenditure as well as sources
of income in cash and in kind and provides
information on the levels of living and disparities in
income of Filipino families (FIES 2006) The study
utilized regional data on the average household
expenditure on medical care Data on the population
per region were also taken from the FHSIS Annual
Report while data on the number of households were
taken from the FIES
62 Analytical Procedure
As stated above it is not enough to just look at the
trends of morbidity cases and public expenditure to be
able to assess the impact of the latter to the former
There are other variables such as private health
expenditures and population at that period of time that
may also significantly affect the number of cases The
paper used a pooled ordinary least squares regression
model to analyze the impact of public health care
expenditures on the number of cases for the major
causes of morbidity in the Philippines from 2002-2006
across regions The model is given by
cases = f(pop privexp pubexp) where pop ndash regional population
privexp ndash average household expenditures
on health
pubexp ndash public health expenditures (lsquo000)
It is hypothesized that there is a positive relation-
ship between the number of cases and population On
the other hand a negative relationship between both
private and public expenditures and the number of
cases is expected
Ⅶ Results and Implications
71 Results and Discussion
Results from the empirical models of the different
morbidity causes are reported in Tables 3 and 4 Notice
that only the results for tuberculosis and diarrhea were
reported since neither public nor private expenditures
on health were able to explain the variation in the
number of cases for bronchitis pneumonia influenza
and hypertension
Table 3 Regression Results for Tuberculosis Cases
variable Coefficient standard error p-value
pop 00018028 00001077 0000
privexp -06158907 02659049 0023 pubexp -00059089 00024357 0018
constant 2103315 8129887 0012
Note highly significant at 1 significant at 5
711 Tuberculosis
The regression result showed that the model is
significant and was able to explain 87 of the
variation in tuberculosis cases based on the computed
adjusted R-squared Public and private expenditures on
health care were found to be significant (at 5) in
explaining the variation in the number of tuberculosis
cases while population was found to be highly
significant (at 1) The results conform to the
hypotheses that an increase in both public and private
spending on health care would result to a decline in the
number of tuberculosis cases Also an increase in the
population results in an increase in the number of cases
which was also expected
Estimates showed that on the average an increase
in the population by 555 increases the number of
tuberculosis cases by one Results also showed that an
increase in public health expenditures decreases the
number of tuberculosis cases Specifically the
estimated coefficient implies that on the average an
increase in public health expenditures by PhP169236
would lead to a one unit decrease in the number of
tuberculosis cases With the PhP16 billion total budget
for health in 2006 (PhP154 million of which was
allocated for tuberculosis prevention and control) an
additional 1 increase in government health expendi-
tures would approximately reduce the number of
tuberculosis cases also by 1 for the same year at the
Analysis of Public Health Expenditures on Leading Causes of Morbidity in the Philippines
42
country level In addition estimates showed that an
increase in the average household private expenditure
on health by PhP162 would result in a unit decline of
tuberculosis cases The value seems low at first glance
but this translates to a total of PhP166 million
spending on health for the household sector from the
174 million Filipino families across 17 regions in
2006 necessary to reduce tuberculosis cases by one
Interestingly public health expenditure seems to be
less costly in terms of preventing tuberculosis cases in
the country This is due to the fact that majority of
tuberculosis cases are experienced by poorer
households that rely more on public health care rather
than private health care which they cannot afford
Public health expenditures are also ideal for
tuberculosis cases because of the ancillary benefits
these provide by preventing the spread of this
communicable disease among the population
Table 4 Regression Results for Diarrhea Cases
variable coefficient standard error p-value
pop 00073148 00007181 0000
privexp -5919509 1773756 0001
pubexp 00385644 00162475 0020 constant 9123934 5423155 0097
Note highly significant at 1 significant at 5
712 Diarrhea
The regression result showed that the model is
significant and was able to explain 70 of the varia-
tion in diarrhea cases based on the computed adjusted
R-squared Public expenditures on health care were
found to be significant (at 5) in explaining the
variation in the number of diarrhea cases while
population and private expenditures on health care
were found to be highly significant (at 1) The results
conform to the hypothesis that an increase private
spending on health care would result in a decline in the
number of diarrhea cases while an increase in the
population results to an increase in the number of cases
However public health care expenditure and the
number of diarrhea cases were found to be positively
related One possible explanation for this result is that
public expenditure on health may be more oriented to
communicable diseases than non-communicable
diseases ie compared with the results of tuberculosis
In addition there are other significant factors that may
be affecting the prevalence of diarrhea which are not
incorporated in the public health care expenditures say
the availability of or access to safe drinking water
among others
Nevertheless results showed that an increase in the
average household private expenditure on health by
PhP017 or equivalently a total of PhP0174 million
spending on health for the household sector would
result in a unit decrease in the number of diarrhea cases
Estimates also showed that on the average an increase
in the population by 137 increases the number of
diarrhea cases by one in the country Results also
showed that an increase in public health expenditures
decreases the number of tuberculosis cases
72 Conclusions Implications and Further
Studies
The result of the study showed that public
expenditures on health care have a significant effect on
the number of tuberculosis cases in the Philippines
Although results for the other cases show that public
expenditure failed to explain the variation in the
number of cases it may be attributed to the unavaila-
bility of disaggregated data allocated for specific
diseases in each region This then can be considered as
the limitation of the study Nonetheless the results of
the study can be used to provide a rationale for the
abrupt increase in the spending for disease prevention
and control for 2008 and 2009
As pointed out earlier the result of the study can be
further extended by valuing the benefits that can be
derived from a prevented sickness resulting from an
increase in public health expenditures The benefits
may include the loss income from being absent
because of the disease and the prevented private
expenditures to prevent the disease Of course the
general external effects of being healthy or seeing a
healthy person may also be included as part of these
benefits These non-marketed goods which are
J Glob Bus Trade Vol 9 No2 (November 2013) 35-44
43
common to the health sector can be measured using
contingent valuation methods such as willingness-to-
pay (Hurley 2000) Knowing these benefits one can
then do a cost-benefit analysis of an increase in public
expenditure on health care Thus if the net benefits
that can be derived from a prevention of a tuberculosis
case is higher than PhP169236 which is the cost of
preventing it then it is rational for the government to
pursue an increase in public health care expenditure
References
Asian Development Bank (2008) Key indicators for
Asia and the Pacific 2008 Manila Author
Retrieved from httpwwwadborgsitesdefault
filespublication27728key-indicators-2008pdf
Connelly L B (2004) Economics and health
promotion The European Journal of Health
Economics (Formerly HEPAC) 5(3) 236-242
Chicago
Department of Budget and Management (nd)
Budget of expenditures and sources of financing
2000-2008 [Webpage] Retrieved from www
dbmgovph
Department of Budget and Management (2001)
Republic of the Philippines national expenditure
program 2001 Manila Author Retrieved from
httpwwwdbmgovph
Department of Budget and Management (2002)
Republic of the Philippines national expenditure
program 2002 Manila Author Retrieved from
httpwwwdbmgovph
Department of Budget and Management (2003)
Republic of the Philippines national expenditure
program 2003 Manila Author Retrieved from
httpwwwdbmgovph
Department of Budget and Management (2004)
Republic of the Philippines national expenditure
program 2004 Manila Author Retrieved from
httpwwwdbmgovph
Department of Budget and Management (2005)
Republic of the Philippines national expenditure
program 2005 Manila Author Retrieved from
httpwwwdbmgovph
Department of Budget and Management (2006)
Republic of the Philippines national expenditure
program 2006 Manila Author Retrieved from
httpwwwdbmgovph
Department of Budget and Management (2007)
Republic of the Philippines national expenditure
program 2007 Manila Author Retrieved from
httpwwwdbmgovph
Department of Budget and Management (2008)
Republic of the Philippines national expenditure
program 2008 Manila Author Retrieved from
httpwwwdbmgovph
Department of Budget and Management (2009)
Republic of the Philippines national expenditure
program 2009 Manila Author Retrieved from
httpwwwdbmgovph
Department of Health (2002) Field health service
information system annual report 2002 Manila
Author Retrieved from httpwwwdohgovph
sitesdefaultfilespublicationsFIELD20HEALT
H20SERVICE20INFORMATION20SYST
EM20ANNUAL20REPORT202002pdf
Department of Health (2003) Field health service
information system annual report 2003 Manila
Author Retrieved from httpwwwdohgovph
sitesdefaultfilespublicationsFIELD20HEALT
H20SERVICE20INFORMATION20SYST
EM20ANNUAL20REPORT202003_0pdf
Department of Health (2004) Field health service
information system annual report 2004 Manila
Author Retrieved from httpwwwdohgovph
sitesdefaultfilespublicationsFIELD20HEALT
H20SERVICE20INFORMATION20SYST
EM20ANNUAL20REPORT202004pdf
Department of Health (2005) Field health service
information system annual report 2005 Manila
Author Retrieved from httpwwwdohgovph
sitesdefaultfilespublicationsFIELD20HEALT
H20SERVICE20INFORMATION20SYST
EM20ANNUAL20REPORT202005_0pdf
Analysis of Public Health Expenditures on Leading Causes of Morbidity in the Philippines
44
Department of Health (2006) Field health service
information system annual report 2006 Manila
Author Retrieved from httpwwwdohgovph
sitesdefaultfilespublicationsFIELD20HEALT
H20SERVICE20INFORMATION20SYST
EM20ANNUAL20REPORT202006pdf
Department of Health (2007) Field health service
information system annual report 2007 Manila
Author Retrieved from httpwwwdohgovph
sitesdefaultfilespublicationsFIELD20HEALT
H20SERVICE20INFORMATION20SYST
EM20ANNUAL20REPORT202007_1pdf
Drouin J P Hediger V Henke N Kanzler L
Leydon E F amp De Santis P (2008) The Health
Care Century Health International 7 6-17
Granlund D (2006) The effect of health care expen-
ditures on sickness absence Paper Presented at the
Inaugural Biennial Conference of American Society
of Health Economists 2006 Madison WI
University of Wisconsin
Hurley J (2000) An overview of the normative
economics of the health sector Handbook of
Health Economics 1 55-118
Novignon J Olakojo S A amp Nonvignon J (2012)
The effects of public and private health care
expenditure on health status in sub-Saharan Africa
New evidence from panel data analysis Health
Economics Review 2(1) 1-8
Philippine Statistics Authority (nd) Family income
and expenditures survey 2000 2003 2006
[Webpage] Retrieved from wwwcensusgovph
United Nations (2007) Human development report
Retrieved from wwwhdrundporg
World Health Organization (2007) National health
accounts 2007 Geneva Author Retrieved from
httpwwwwhointen
World Health Organization (2012) World health
statistics 2012 Geneva Author Retrieved from
httpwwwwhointen
J Glob Bus Trade Vol 9 No 2 (November 2013) 45-60
45
ISSN 1946-5130
Journal of Global Business and Trade
wwwiagbtcom
Analysis of the Interests of Conceiving a Free Trade
Agreement between China and South Korea
Liu Zuankuoa and Zhan Baiming
b
a Shandong Normal University China b South-Central University for Nationalities China
Received 25 August 2013 Revised 22 September 2013 Accepted 28 October 2013
ABSTRACT
Based on the ldquoStarting Joint Minister Statement on free trade agreement between China and South Koreardquo
the article explains the basic ideas of this agreement It shows that there are some distinctive differences
between the statement and the theoretical study on interests China pays more attention to the diplomatic
significance rather than in trade While South Korea aims to guarantee its investment benefits by this
agreement both stations try to protect their producersrsquo benefits Finally this paper using the model GTAP
(Global Trade Analysis Project) puts forward two sets of simulation schemes and forecasts the economic
effects of the Free Trade Zones from the macroeconomics and welfare effects trade effects and industry
effects
Keywords analysis of benefits China-South Korea free trade agreement construction
Ⅰ Introduction10
Minister of Commerce Chen Deming and South
Korean Trade Minister Park Tae-ho attended the
China-ROK Trade Ministers Meeting in Beijing on
May 2nd 2012 and announced the official initiation of
China-ROK Free Trade Agreement negotiations on the
Ministersrsquo Joint Statement (referred to as ldquoStatementrdquo
as following) From the Free Trade Agreement (FTA)
we can see the basic ideas of the interest demands of
the Statement
The statement explains the basic ideas of the FTA
which includes trade in goods services investment
and other fields The interest demands reflected in the
2013 International Academy of Global Business and Trade
All rights reserved
Statement includes two aspects trade and investment
From the perspective of trade benefits the two
countries agreed that levels of trade liberalization in
good and service trades should go beyond those
promised levels in the WTO However there are some
sensitive product issues in the goods trade which
include lists of generally sensitive and highly sensitive
products From the perspective of investment benefits
the level and scope of liberalization were defined
according to both countriesrsquo investment arrangement at
present and in future Meanwhile the overseas
processing zones should be involved in China-ROK
FTA
Analysis of the Interests of Conceiving a Free Trade Agreement between China and South Korea
46
Table 1 MFN Tariff Levels of China and South Korea in Product Category ()
Category of products
China Korea
Average tax rate
Free tax rate Maximum Tax rate
Average tax rate
Free tax rate Maximum Tax rate
Livestock products 148 101 25 221 24 89 Milk products 120 0 20 675 0 176
Fruit Vegetable 148 59 30 574 02 887 Coffee Green tea 147 0 32 539 0 514 Grain 243 34 65 1345 03 800 Oilseed animal fat oil 110 53 30 370 41 630
Sugar Sweet 274 0 50 168 125 243
Drinks Cigarette 223 22 65 317 0 270 Cotton 152 0 40 00 1000 0 Other agricultural products 114 94 38 161 183 754 Fish and its products 109 63 23 161 07 50 Minerals Metals 74 87 50 46 269 8 Petro 48 200 9 41 107 8 Chemistry 66 16 47 57 67 321 Wood Paper 44 353 20 22 675 10 Textile 96 0 38 91 15 13 Cloth 160 0 25 126 0 13
Leather Shoes 132 06 25 79 26 16 Non-electrical machinery 80 90 35 60 226 13 Electronic machinery 83 240 35 62 214 13 Transportation equipment 115 08 45 55 268 10 Other products 119 96 35 67 160 13
Source World Trade Organization (nd)
The level of goods liberalization of the two
countries can be judged from WTO World Customs
Data 2011 In 2010 the simple average MFN tariffs
on agricultural and non-agricultural product imports
were 156 and 87 respectively while the simple
average MFN rates applied to Korea on agricultural
and non-agricultural products exports were 164 and
88 The simple average MFN tariffs on Korean
agricultural products and non-agricultural products
import were 485 and 66 while the MFN rates applied
to China on its agricultural products and non-
agricultural products export were 521 and 66 The
MFN import tariff rate of China and Korea divided by
product category is given via Table 1
Via Table 1 we can see that South Korea paid
more attention to protecting agricultural products (tax
rate 485) than industrial products (tax rate 66)
Therersquos a more than 40 percent difference in the simple
average MFN tariff On Chinarsquos part therersquos no big
difference between agricultural product protection
(156) and industrial product protection (87) the
gap of the simple average MFN tariff between these is
less than 10 percent Meanwhile South Korearsquos
protection on agricultural products (485) is much
higher than Chinarsquos (164) As for industrial product
protection there is a gap between China (156) and
South Korea (66) but the gap in industrial (9 or
so) is not as big as that shown in agricultural products
with a tax rate gap 42
From above it shows that the profit that China
benefits from the FTA mainly depends on the degree of
liberalization of agricultural products of South Korea
If this is the important part of South Korearsquos sensitive
products then the attitude expressed in the joint
statement ldquobeyond goods liberalization level of WTO
commitmentsrdquo has not displayed real significant trade
interests
In other words the previous various theoretical
insights on the China-Korea FTA are not the same as
the benefit idea implied in the statement
J Glob Bus Trade Vol 9 No 2 (November 2013) 45-60
47
Ⅱ Literature Review
With regard to the interests in the FTA negotiations
between China and South Korea Chinese scholars are
generally optimistic about the economic and trade
effects of the bilateral free trade agreement Xue Jing-
xiao and Zhang Bo-wei (2004) believed that Chinarsquos
GDP would grow if China and South Korea were to
establish a free trade area Huang Peng and Wang Jian-
xin (2010) analyze the potential effect of applying
GTAP in constructing a free trade zone between China
and South Korea which indicates that after the
fulfillment of the China-ROK FTA the two countriesrsquo
GDP and components such as consumption
investment government expenditure and so on
compared to the base period all experienced positive
growth South Korea obtains a greater benefit with a
growth rate of 207 while Chinarsquos only 018 Song
Jingen (2011) on the basis of a traditional trade gravity
model studied the effects on trade after the two
countries signed the free trade agreement The results
show that China and South Korearsquos agreement played
a strong role in promoting the trade of both countries
and the total volume of trade would increase nearly
60 He suggests that both countries should pay
attention to the opportunities brought by the agreement
when they are protecting their sensitive sectors Li
Xiao-feng and Gui Jia-yue (2009) based on partial
equilibrium estimates the effects of the establishment
of the China-ROK Free Trade Zone on bilateral trade
flows from the industrial level The simulated results
show that if China and Korea do not established a free
trade zone to a larger extent trade between China and
South Korea would be heavily influenced by the trade
diversion from the Korea-US Free Trade Zone If the
two countries establish a free trade zone it will be
more conducive to the development of comparative
advantages of both countries
Analysis of academic research on China-ROK free
trade agreements has a more rigorous theoretical
condition namely the import tariffs of all goods should
be canceled in the China-ROK FTZ Before the
implementation of the FTZ the higher the tariff is the
greater the increase of imports caused by the tariff
reductions will be From the perspective of exports
before the completion of a bilateral free trade zone the
higher the tariff of partner country is the greater the
exporterrsquos export growth will be after establishment
The joint statement announced by the ministers of
China and the ROK showed that on the one hand the
level of liberalization of trade in goods should
transcend their level of commitment in the WTO On
the other hand the problems of sensitive products
should be a concern A longer transitional period
partial concessions and exceptions should be used to
handle sensitive product issues It is not known which
products are arranged for a longer transition period
partial concessions or exceptions but it will greatly
reduce the expected trade benefits by theoretical study
because the theoretical results used free trade and tariff
barrier elimination as a precondition Meanwhile
when both countries regard their disadvantaged
industries as sensitive products to go beyond the
commitment level in the WTO as agreed in the joint
statement will be quite limited in the scope Thus the
domains of free trade will be relatively small
Professor Yorizumi Watanabe (2009) of Keio
University in Japan analyzed the historical significance
of the FTA among China Japan and South Korea and
pointed out that China makes free trade agreement
policies for three reasons on foreign affairs and
commercial intercourse First in maintaining the
double-digit rapid development in economy China has
become the ldquoworld factoryrdquo and it is imperative to
ensure the market of related industries Second China
has become a world power so it needs to show
Southeast Asian countries an image of a ldquogood
partnerrdquo so as to avoid being seen as a threat Third by
means of drawing those overseas Chinese who have
engaged in long-term economic activities in the
neighboring countries China formed the ldquoGreater
China Rimrdquo and turned it into Chinarsquos powerful
ldquoperipheryrdquo
The interpretation of the motives of Chinarsquos
making of free trade agreement policies by Professor
Watanabe made people feel that Chinarsquos interest
Analysis of the Interests of Conceiving a Free Trade Agreement between China and South Korea
48
demand consists of two aspects commercial inter-
course and diplomacy However regardless of the
relationship of bilabial trade between China and Japan
or between China and South Korea Chinarsquos
advantages in industry are mainly on textiles clothing
leather shoes and other products but the tariff rates of
Chinarsquos MFN of such goods are higher than those of
South Korea and Japan Meanwhile the Chinese
mainlandrsquos ldquoworld factoryrdquo status is a product of the
processing trade China has been acting the role of
assembling and integration in the East Asian labor
division system and the commodities in bilateral trade
between Sino-Korea and Sino-Japan are mainly
constituted by the intermediate input products This
means that Chinarsquos participation in the construction of
the FTZ with Japan and South Korea is not to ensure
the market of related industry and thus its trade
interests are far less than the diplomatic interests which
Professor Watanabe referred to Economists of South
Korea predict that the FTZ has a very large impact on
the Korean economy while there is a relatively small
impact on China For China the strategic goal of the
China and South Korea FTZ is greater than economic
significance while for South Korea the motivation of
getting economic interests is stronger China promoted
the China-ROK FTZ in order to ensure a dominant
position within the East Asian region which cannot
only impact America who took advantage of allies in
Asia to constrain China but also rely on the regional
group to enhance Chinarsquos status in the international
political situation and the multilateral system (Zheng
Zhi-shu 2009)
The interest that South Korea obtained from the
China-ROK FTA depends on the degree of liberali-
zation of Chinese industrial products If Chinese
industrial products constitute a major part of the
sensitive products in China the trade interest of South
Korea would not be significant So the motives of
South Korea negotiating bilateral free trade agreements
with China does not come from trade but from the
following that will be discussed in the third part of the
international investment interests
Ⅲ The Benefit Analysis
31 The balance of Investment Interests and
Trade Interests
Before China and the ROK passed the ldquothe
Associate Ministerial Statement of Starting China-
Korea Free Trade Agreement Negotiationsrdquo China
Japan and the ROK held investment agreement
negotiations in Beijing reached an agreement on all
the remaining issues in the investment agreement and
drafted the agreement on March 21st 2012 Three
parties said they would soon complete their internal
procedures so as to sign the agreement as soon as
possible
From the view of the sequence of time the
successful termination of negotiations on investment
agreements among China Japan and ROK preceded
the starting of negotiations on a bilateral FTA between
China and ROK This indicates that relative to the free
trade agreement the three countries are more
concerned about investment agreements or that South
Korea is keener on the investment issues among the
three countries or between the two countries South
Korean President Lee Myung-bak said that in the
investment agreements among the three countries the
dispute settlement mechanism was included between
the investors and the host country which can provide
legal protection for investors if they suffer a loss on
investment in the host country
Meanwhile the joint statements of two countries
also made clear the important position of investment in
the FTA In the area of investment for proper handling
of issues related to bilateral investment between the
two countries they will confirm the level and scope of
liberalization and take the current and future bilateral
investment-related arrangements into account
When the international economic integration has
developed both in scope and in depth from trade to
international production many bilateral and regional
free trade agreements reflected the feature of the trade
and investment integration such as the North
American Free Trade Agreement In most cases the
J Glob Bus Trade Vol 9 No 2 (November 2013) 45-60
49
countries that are dominant in international investment
will make use of the form of the FTZ to protect its
interests of overseas investments from losses
In terms of the structure of bilateral trade in goods
between China and ROK Korearsquos exports to China
mainly consist of productive goods Table 2 shows
classified by BEC the imports and exports of Chinarsquos
trade in goods to the ROK
Table 2 shows that during the 13 years from 1998
to 2010 among the types of Chinese and South
Korean BEC commodities the following conclusions
can be made according to the changing of exports and
imports of capital goods intermediate goods and
consumer goods
First the imports and exports of intermediate
goods in the cargo trade between China and the ROK
come in on top According to the SNArsquos three basic
categories of goods the annual average import and
export composition ratio of intermediate goods capital
goods and consumer goods trade between China and
Korea were respectively 722 164 and 112
Relative to capital goods and consumer goods the
exceeding ratio balances of intermediate goods trade
value are respectively 56 and 60 percentage points
Table 2 China amp South Korea Goods Trade Structure 1995-2010 (Classified by BEC)
(Unit Hundred Million Dollars)
Intermediate
Goods
Exports
Intermediate
Goods
Imports
Consumer
Goods
Exports
Consumer
Goods
Imports
Capital
Goods
Exports
Capital
Goods
Imports
1995 50 85 14 4 3 13
1998 43 134 12 5 8 11
1999 51 154 17 5 10 13
2000 73 204 25 6 15 22
2001 72 200 33 6 19 28
2002 90 217 43 7 22 61
2003 118 311 51 7 31 108
2004 167 455 61 11 49 153
2005 226 590 66 13 58 161
2006 296 702 83 15 65 173
2007 388 797 94 18 81 213
2008 508 869 96 19 132 223
2009 321 784 76 15 135 212
2010 421 1051 97 24 166 289
Source United Nations Statistics Division (nd)
From the composition of exports and imports
among all of Chinarsquos exports to South Korea the
annual average rates of intermediate goods capital
goods and consumer goods were respectively 642
202 and 155 The rates of these three types of
goods in Chinarsquos annual imports from South Korea
were respectively 803 174 and 22 For
intermediate goods the proportion of Chinarsquos exports
to South Korea is less than that of imports from South
Korea and the balance is up more than ten percentage
points
Second the proportion of the goods used for
production in the cargo trade is much higher than that
of the consumption part In Economics capital is
defined as the products that are produced by the
economic system itself and used as input factors so as
to further produce more products and labor service
According to the basic principles of economics
capital goods and intermediate goods with the
characteristics of production can be considered inputs
for the production of capital goods Statistics show that
the sum of annual import and export proportion is
nearly 886 leaving less than 12 to consumer
goods The very low proportion of consumer goods
trade between China and South Korea shows us the
Analysis of the Interests of Conceiving a Free Trade Agreement between China and South Korea
50
basic characteristics of the internationalization of
production behind the commodity trade structure
Regarding Chinese goods exported to South
Korea the annual average proportion of goods which
had entered the production process was 798 and
continued to rise from 784 in 1995 to 811 in
2005 and to 857 in 2010
Meanwhile the goods that China imported from
South Korea have a higher proportion for production
use and the annual average is almost up to 979 In
1995 the share was 956 and since 2003 its share
has always remained above 98
The proportion (approximately 98) of Chinarsquos
imports of productive goods from Korea is 18 higher
than that (about 80) of Chinarsquos exports indicating
that the degree of Chinarsquos dependence on South Korea
is higher than South Korea on China
Central Bank of Korea (June 14 2011 ) released
the ldquo2010 South Korean Current Account Balancerdquo
which said that the export growth of semiconductors
machinery precision machinery and other goods are
increasing significantly and the trade surplus to China
of such goods is increasing from $3697 billion to
$5104 billion
The formation of this kind of trade structure to a
large extent can be explained reasonably by South
Korearsquos direct investment in China From the
perspective of the trade of intermediate goods Li
Xian-zhu (2010) Ye Jing-yi and Wang Pei (2005)
explained the trade imbalance between China and
South Korea When analyzing the Korean chronic
surplus phenomenon in long term they pointed out
that one of the reasons is that there are many Korean
investment enterprises in China and most are
processing companies required to purchase a large
number of Korean raw materials and accessories for
processing The import of the raw materials and
accessories required by Chinarsquos processing trade is
mentioned above that is Chinese importation of
intermediate goods by BEC classification Some
scholars explained the trade imbalance from the point
of capital goods trade that South Korea has a
competitive advantage in the production of capital
goods that when coupled with the adjacent location is
conducive to reduce transportation costs and thus
South Korea has become one of the main countries for
China to get capital goods from for processing trade
which expanded the size of imports from Korea (Zhao
Fang amp Li Ji 2010)
Statistics show that from 1998 to 2010 among the
foreign direct investments divided by countries and
geographical areas Japan and South Korea have
always been Chinarsquos major source countries for foreign
investment Except those years of the financial crisis
(1998 2008-2009) the proportion of Japan and South
Korearsquos direct investment in China accounted for 13 -
20 For example in 2005 South Korearsquos direct invest-
ment was up to 5168340000 US dollars accounting
for 86 of Chinarsquos total $60324590000rsquos absorption
of foreign investment Japanrsquos direct investments were
6529770000 US dollars accounting for 1082
South Korearsquos direct investment is mainly in the
manufacturing industry By 2005 South Korean
investment in China is mainly focused on the
manufacturing and assembly of electronic appliances
textiles and clothing leasing and business services
food and beverage and retail industries among which
manufacturing accounted for dominance (Yang Li amp
Zhou Wenfeng 2008 ) However in the manufacturing
sector the investment structure of South Korea has a
tendency of changing from the consumer goods
industry including fiber clothing food manufacturing
leather footwear and others to capital goods industries
including electronic communications petrochemical
alloy machinery and equipment and others (Zang Xin
Dong Rongrong amp Cui Yan 2006)
In order to protect the interests of foreign invest-
ment one of the conditions that Japan and South
Korea agreed to in the China-Japan-Korea FTZ nego-
tiation was the signing of ldquoCJK investment agree-
mentsrdquo The tripartite negotiations started in 2007 with
content that included all the important aspects
contained in the international investment agreements
including such clauses as the definition of investment
scope of application MFNT national treatment
J Glob Bus Trade Vol 9 No 2 (November 2013) 45-60
51
expropriation transfer subrogation taxes general
exceptions and dispute resolution
32 The Balance of the Interests of Producers
and Consumers
According to the Yonhap News Agency on
January 12th 2012 the foreign minister of South
Korean Park Taeho said at a press conference held in
the central government office that China as a big
country made a lot of people worried that Korearsquos
agriculture might be pounded South Korea was not
going to allow massive Chinese agricultural products
into South Korea Before starting the China-ROK FTA
negotiations the Korean Government would fully
listen to the views of different fields
Table 3 The Share of South Korearsquos Agriculture in the National Economy 1998-2010
()
Agricultural Labor
Manufacturing Labor
Labor Services Agricultural
Output Manufacturing
Output Services Output
1998 019 2405 4081 336 4511 4044
1999 019 2406 4081 328 4645 4015 2000 017 2453 4087 297 4736 4015
2001 017 2421 4079 287 4557 4182
2002 016 2323 4103 262 4490 4282 2003 016 2316 3989 243 4480 4241
2004 014 2306 3884 239 4727 4034
2005 015 2278 3795 219 4794 4013 2006 014 2165 3468 209 4801 4032
2007 014 2092 345 195 4818 4033
2008 012 2012 3444 184 5064 3833 2009 013 1944 3484 194 4960 3912
2010 013 1909 3484 178 5211 3739
Source Database provided by Korearsquos Banks
Compared with the manufacturing and service
industries the proportion of South Korearsquos agriculture
is not so significant in the national economy The
proportion of employees in the total economic activity
decreased from 019 in 1998 down to 013 in 2010
and the proportion of the total value of agricultural
production in GDP decreased from 336 in 1998
down to 178 in 2010 If the China-ROK FTA finally
regarded the South Korearsquos agriculture as sensitive
products and put it outside the free trade it is no doubt
that this is only to protect the benefits of very few
agricultural producers by sacrificing the interests of
many other consumers
Let us observe the issues of Chinese sensitive
products Chinese Commerce Minister Chen Deming
said that the sensitive products taken into account in
the process of negotiation were related to agriculture in
Korea and Chinarsquos petrochemical electronics
machinery and other fields
Not completely identical to the situation of South
Korearsquos agriculture in the national economy from 1998
to 2010 the ratio of employees in Chinese petroche-
mical electronics and mechanical industries among the
countryrsquos total employment is not high but there is a
rising trend In 1998 Chinese petrochemical and
machinery industry employment accounted for 088
and 157 respectively of the countryrsquos total
employment In 2010 this proportion respectively rose
to 154 and 388
Similarly the ratio of the petrochemical and
mechanical fields in GDP also showed an increasing
trend and its share enlarged In 1998 the ratios were
135 and 213 In 2010 the ratios respectively
increased to 614 and 1173
Table 4 shows that Chinarsquos petrochemical and
machinery industries are growing and developing
rapidly From the production valuersquos movements of
ratio in GDP we can see that from 1998 to 2010 these
Analysis of the Interests of Conceiving a Free Trade Agreement between China and South Korea
52
two sectors in initial stages accounted for 348 of
GDP and by 2005 641
Chinese petrochemical products cover a wide
range of sectors In Chinarsquos Statistical Yearbook they
included the petroleum processing and coking industry
chemical materials and products manufacturing
chemical fiber manufacturing rubber and plastic
products industry Electronic and mechanical fields are
statistically included in machinery and equipment
involving manufacturing industries in common
equipment special equipment transportation
equipment electrical machinery and equipment
electronic and communications equipment instrument
and apparatus and office machinery
Table 4 The Share of Chinese Petrochemical and Machinery Industriesrsquo in the National Economy 1998-2010
()
Petrochemical Industry
Labor Proportion Machinery Industry Labor Proportion
Petrochemical IndustrialGDP
Machinery IndustrialGDP
1998 088 157 135 213
1999 081 145 139 222 2000 074 133 160 240
2001 068 124 155 253
2002 065 121 158 282 2003 098 191 178 340
2004 101 209 224 423
2005 113 244 230 411 2006 119 266 483 883
2007 127 296 554 1028
2008 141 344 608 1119 2009 143 344 547 1059
2010 154 388 614 1173
Source ChinaStatistics (2011)
Chinarsquos petrochemical and machinery accounted
for a high ratio in GDP The number of the labor force
in these two industries was not big and their sum share
is no more than 6 (542 in 2005) in the whole
national economy Thinking about it another way from
the perspective of proportion of factors Zhan Boming
and others (2010) observed and analyzed Chinarsquos
industrial enterprisesrsquo inclination in investment They
found that investment made by state-owned
petrochemical and machinery enterprises have capital
intensive investment tendencies and the investment of
the three-kind investment enterprises in these two
industries are petrochemical capital intensive while
labor-intensive industries including machinery and
transportation equipment manufacturing electronic
and communication equipment manufacturing The
fact means that the idea of separating the Chinese
petrochemical and machinery from the China - Korea
Free Trade Agreement negotiations are to protect those
investorsrsquo interests at the expense of the interests of
numerous consumers
If the Chinese petrochemical products and
machinery products are to be put outside the China-
Korea Free Trade Agreement as sensitive products and
South Korearsquos agricultural sector is also separated
from China-Korea free trade agreement then we can
say such a bilateral free trade agreement almost has no
sense of free trade
Ⅳ Simulation Analysis of the
Economic Effects of China-Korea
FTA
A GTAP model is used in this part to predict the
economic effects if the China-Korea free trade zone is
established
41 Basic Structure of the Model
The GTAP model was developed by Professor
Tomas W Hertel of Purdue University as a multi-
J Glob Bus Trade Vol 9 No 2 (November 2013) 45-60
53
national and multi-sector general equilibrium model
and it has been widely used in trade policy analysis In
the GTAP model framework first sub-models that can
detail description of each countryrsquos (or regionrsquos)
production consumption government spending and so
on are created and then the various sub-models are
combined into a multi-national and multi-sector
general equilibrium model through international
merchandise trade relations When using this model
framework for policy simulation it can also be used to
explore the changes that the policy brings in each
nation and sectorrsquos production import and export
commodity prices supply and demand factors
elements of remuneration GDP and the level of social
welfare
42 Basic Assumptions
421 Conditions of Factors
There are five different types of elements in the
model land capital skilled labor unskilled labor and
natural resources A GTAP model assumes that the
market is perfectly competitive the scale of production
unchanged and each product produced by using
nested constant coefficient to replace elasticity equa-
tion The intermediate inputs consist of domestic and
foreign products through constant coefficient instead of
elasticity equation The products (domestic and import
goods) of different regions are non-homogeneous and
therefore cannot be replaced with each other In the
factor market land among departments is not
completely mobile so the price of land for different
uses is different while the labor in the country is
allowed to flow freely Each country has only one
account to which all the income tax and endowments
are accumulated Then through the Cobb-Douglas
Utility Function income is divided into private
consumption savings and government consumption
by a fixed proportion In a GTAP model there are two
imaginary international departments which are
International Bank and International Traffic Each
countryrsquos savings are accumulated to an International
Bank being allocated among countries according to
the rate of capital return The International Traffic
Department can balance the differences between CIF
and FOB and link the world through bilateral trade
422 Conditions of Behavioral Agents
There are three kinds of typical behavior agents in
the model private departments government
departments and firms
4221 Behavior of Private Department
In private expenditure the private sector consump-
tion expenditure has the nature of non-homothetic
order and should include the impact of population
growth the private department sets levels by using a
CDE Utility Function on a per capita basis Private
department behavior equation
① Private Household Utility
② CompoSITC Demand
③ CompoSITC Tradeable
In these equations yp (r) stands for the regional
units of the private sector household expenditure of r
region ppriv (r) stands for the price index of private
sector household unit consumption expenditure of r
region UELAS stands for the relative utility costs and
elasticity pop (r) stands for the population of r region
qp (i r) stands for the demands of i product in r
regional private department unit EP (i k r) stands for
the cross-price flexibility between irsquos demands and krsquos
price in r regional household unit EY (i r) stands for
the demand of composite commodity i in r regional
household unit pp (i s) stands for the demand price of
integrated trade commodity i in a private household
unit of s region PMSHR (i s) stands for the share that
Analysis of the Interests of Conceiving a Free Trade Agreement between China and South Korea
54
the total imports in the private sector demand for
domestic products of s region ESUBD (i) stands for
the elasticity of substitution between domestic and
imported good i ppd (i s) stands for the demand price
of commodity i in s regional private department unit
qpd (i s) stands for the demand of the national product
i in s regional private department unit ppm (i s) stands
for the demand price for import integrated trade
commodity i in s regional private department unit
qpm (i s) stands for the import demand of product i in
s regional private department unit
4222 Behavior of Government Department
The total government expenditure allocates
between the various commodities via using a Cobb-
Douglas Utility Function This makes the government
expenditure on various commodities of their total
remains constant In an open system the governmentrsquos
demands can be divided into domestic products and
imported products and both of the products form an
integrated product through the CES Function
Government department action equation
① Government Utility
② Demand for CompoSITC Goods
③ CompoSITC Tradeable
In these equations yg (r) stands for the regional
government expenditure of r region pop (r) stands for
population of r region pgov (r) stands for the
consumption expenditures price index of government
departments in r region ug (r) stands for the average
capital expenditure utility level per people from the
government spending in r region VGA (i r) stands for
the expenditure buying i goods in r regional
government departments GOVEXP (r) stands for the
consumer spending in r regional government
departments pg (i r) stands for the demand price of
comprehensive trade i product in r regional
government departments qg (i r) stands for the
demand of i goods in r regional government
departments GMSHR (i s) stands for the government
departmentrsquos share of demand for national products in
total imports in s region pgd (i s) stands for the
demand price of domestic integrated i good in s
regional government departments qgd (i s) stands for
the demand of domestic i product in s regional
government departments pgm (i s) stands for the
demand price of imported comprehensive trade i good
in s regional government departments qgm (i s)
stands for the imported demands of i product in s
regional government departments ESUBD (i) stands
for the elasticity of substitution between domestic
goods and imported goods
4223 Behavior of the Firm
GTAP model assumes that manufacturers use Tree
Structure in the production function Firmsrsquo main
inputs can be divided into the original inputs and
intermediate inputs Suppose the production function
has the characteristics of divisibility and fixed scale
compensation Under the divisibility assumption
firmsrsquo decisions on the most appropriate volume of
original input is not influenced by the changing of
intermediate input price and quite reverse is true
Meanwhile under the assumption of fixed scale
compensation the proportion of factor input of firms
will not be influenced by the changes in production
volume either
On the top of Tree Structure it shows firmsrsquo
decisions of demand between intermediate inputs and
integrated original inputs Under the assumption of the
Leontief Function it shows a fixed proportional rela-
tionship between the intermediate input and original
comprehensive input and total output This is common
in general design of CGE model of which the main
advantage is that it can reduce the number of para-
meters needed to estimate in the model significantly
The bottom left part of the Tree describes the
J Glob Bus Trade Vol 9 No 2 (November 2013) 45-60
55
relationship between the original investment and
production
Assume that the relationship between the original
input and the production is CES Function and the
elasticity of substitution between different original
elements is equal Accordingly sum up the original
inputs in order to obtain the Aggregate Primary Input
At the bottom right part of the Tree Structure it shows
the relationship between the intermediate input and
production which consists of two sides First is the
substitution relationship between the domestic
products and comprehensive imported products
assuming both compose into integrated intermediate
goods through CES Function Second is the
substitution relationship among different sources of
imported intermediate goods assuming which are also
integrated through the CES Function Behavior of
Firm equation
① CompoSITC Intermediate Nest
② Valuemdashadded Nest
③ Total Output Nest
In these equations pf (i j r) and qf (i j r) stands
for the price and demand of i product while producing
j good in r region af (i j r) stands for the technological
change of original feature i in j industry of r region
FMSHR (i j r) stands for the share that r regionrsquos total
imports among the demand for domestic compre-
hensive products pfm (i j s) stands for the demand
price of integrated commodity i in j industry of s
region qfm (i j s) stands for the firmsrsquo total demands
of imports pfd (i j r) stands for the demand price of
domestic comprehensive commodity i in j industry of r
region qfd (i j s) stands for the firmsrsquo demand for
domestic products ESUBD (i) stands for the elasticity
of substitution between domestic and imported goods
pva (j r) stands for the added-value price of producing
j good in r region qva (j r ) stands for the added-value
of j industry in r region ava (j r) stands for the
technological changes of the added-value in j industry
of r region SVA (k j r) stands for the share of added-
value product i in j industry of r region pfe (i j r)
stands for the price of original element i which needed
to produce j product of r region qfe (i j r) stands for
the demand of original element i which needed to
produce j product of r region afe (i j r) stands for the
technological changes of original element i in j
industry of r region ESUBVA (j) stands for the
elasticity of substitution between original elements
during the added-value production in j industry qo (j r)
stands for the output of j department of r region ao (j r)
stands for the technological changes of output in j
department of r region ps (j r) stands for the supply
price of j product in r region ESUBT (j) stands for the
elasticity of substitution of intermediate inputs while
producing j product
423 Equilibrium Condition
A GTAP model assumes a regional household unit
includes a private department and government
department to determine the consumer behavior and
savings behavior of the private department and
government department in the country or region The
Model can be divided into a Closed System and an
Open System Without the government intervention in
a Closed System the income of regional household
unit comes from the reward of selling its own elements
to the firm Firmrsquos incomes come from the purchase of
each householdrsquos expenditure and every manufacturer
also makes money by selling their intermediate goods
All economic behavior expenditures and incomes are
equal Balance of a single country Closed System is
established by the accounting identities and market
equilibrium formula In an Open System due to the
Analysis of the Interests of Conceiving a Free Trade Agreement between China and South Korea
56
joining of foreign departments the government
expenditure and the private spending in local regional
department will be divided into two parts buying
domestic products and imported products
Furthermore some parts of firmrsquos intermediate raw
materials may also be imported and its products are
sold both domestically and abroad
Regional household unitsrsquo behaviors are basically
determined by Aggregate Utility Function which
consists of government expenditure private spending
and savings It is assumed the per capita Cobb-
Douglas Utility Function is adopted and this regional
household unit pursues the utility maximum of a
household unit As a result of using the Cobb-Douglas
Utility Function the proportion of three kinds of
current consumptions that were mentioned above is
fixed
43 The Analysis Method and the Simulation
Program
This article uses the seventh edition GTAP model
which includes 113 countries and 57 sectors In the
model the author combines 113 countries or regions
into three regions China Korea and other parts of the
world 57 industry sectors will be divided into 10 kinds
of product groups 1) food and crops 2) livestock and
meat products 3) forest rivers coal natural gas and
other minerals 4) processed foods 5) Textiles and
clothing 6) light manufacturing 7) heavy industry 8)
Utilities and construction 9) Transportation and
communication 10) other services
In order to fully investigate the effects of trade
liberalization this paper intends to respectively
measure the economic effects of a free trade zone
under two kinds of tax reductions program one
simulates a ldquozero tariff base scenariordquo under the
condition that both China and Korea have a full range
cancellation of goods trade tariffs In program 2
considering the protection of its sensitive industry with
the exceptions of Korearsquos high tariffs on food and crop
departments and the exception of Chinarsquos industrial
sector (light manufacturing and heavy industry) other
department tariff reductions will be by half
44 Simulation and Results of Analysis
441 Economic and Welfare Effects
According to model calculation results (shown in
table 5) we can see from the aspects of GDP growth
In program one after the completion of the China-
Korea free trade zone GDP in both China and Korea
show growth compared to the base period Korea
benefits more with a GDP increase of 139 billion
dollars and a growth rate of 206 China only
increases 25 billion dollars and the growth rate is
015 In program two the GDP of both China and
Korea shows growth compared with the base period
too respectively rising 74 and $540 million
considerably less than the GDP growth in program one
with full exemption of import tariffs This is because
program two still has different levels of trade
protection which leads to inefficient allocation of
resources After the establishment of a free trade zone
in the program one and program two countries with
larger benefits are different Korea benefits more in
program one China benefits more in program two
This is because the two countries have the same tax
reduction in program one Because the trade barriers
between Korea and the other countries in the world are
lower and according to the customs alliance theory
the lower the trade barriers between the Customs
Alliance member countries and other countries in the
world are the establishment of a customs alliance is
less likely to cause more costly trade transfers Under
the condition of full reduction and exemption of tariffs
and zero tariffs China may show a bigger trade
transfer effect thus Korea benefits more In program
two because of the protection for the sensitive food
and crop industry the allocation of resources is less
efficient in Korea
From the point of changes in the countryrsquos welfare
total welfare increases 4964 billion dollars in Korea in
program one while China reduces 653 million dollars
Korearsquos welfare increase is mainly caused by the
improved resource distribution efficiency and trade
conditions Chinarsquos entire welfare reduction is because
of the larger trade diversion effect In program two
J Glob Bus Trade Vol 9 No 2 (November 2013) 45-60
57
both two countriesrsquo welfare increases with Chinarsquos
growth of 189 million dollars and Korearsquos 65 million
dollars Compared to program one the increasing
volume of Korearsquos welfare significantly drops largely
because of Korearsquos high tariffs on food and crop
protection which results in a lower efficiency of
resource allocation
From the view of other regions in the world either
in program one or program two the GDP and welfare
decline at different degrees This means establishing a
free trade zone no matter what level of tax reduction
is conducive to economic growth for member
countries but this will bring adverse changes for those
regions excluded in the free trade zone
From the above analysis the establishment of
China-Korean free trade zone will promote the growth
of the national economy and social welfare regardless
of what level of tax reduction but for other regions in
the world it will bring a negative adverse change
Table 5 Changes of the Economy and Welfare in Different Programs ()
Program One Program Two
Change of GDP
Change Rate of
GDP
Welfare (million of
US dollars)
Change of GDP
Change Rate of
GDP
Welfare (million of US
dollars)
China Korea
Other regions in the world
25051 139023
-277225
015 206
-007
-65303 496385
-42123
74118 54328
-380194
005 008
-001
18941 16497
-15370
Source Compiled according to the result of Rung TAP operation
442 Trade Effects
According to the results of the model calculation
(shown in Table 6) it shows whether canceling all
import tariffs on goods or protecting part of industry by
cancellation of part of tariffs the bilateral trade has an
increase The exports and imports of other regions in
the world experienced varying degrees of reduction
Chinarsquos total economic output is larger so the
establishment of a China-Korea FTZ has less impact
on Chinarsquos import and export level as on Korearsquos The
tax reduction level in program two is not as large as in
program one and in program two some industries are
protected So compared to the program one trade
barriers cause lower efficiency in resource distribution
and the impact on imports and exports is smaller than
in program one
From the terms of the changes in trade either in
program one or program two the China-Korea free
trade zone improves the membersrsquo trade condition to
some degree Specifically Korea benefits more This is
because Korea has more open trade liberalization
whose tariffs on main trade products have been
reduced to a very low level According to the customs
alliance theory the lower the trade barriers between the
Customs Alliance member countries and other regions
in the world is the establishment of a customs alliance
is less likely to cause more costly trade transfers so the
establishment of a China-Korea free trade zone has
little impact on Korearsquos trade transfer and Korea
benefits more from the changes in trade condition than
China
For the other regions in the world under both
kinds of tax reduction and exemption programs there
are different degrees of reduction in import and export
trade conditions indicating that although the establi-
shment of a free trade zone can increase imports and
exports and improve trade conditions for member
countries it can cause an adverse trade effect for the
non-member countries elsewhere in the world
Through the above analysis we can see that after
the establishment of China-Korea free trade zone
regardless of the extent of tax reduction and exemption
it will promote the imports and exports and foreign
trade conditions within the zone but may cause
adverse trade effects on other regions outside it
Analysis of the Interests of Conceiving a Free Trade Agreement between China and South Korea
58
Table 6 Changes of Trade Effects in Different Program ()
Program one Program two
Export Import Trade Condition Export Import Trade Condition
China
Korea The rest of the world
181
244 -002
229
564 -01
005
14 -004
016
028 -00018
021
046 -0006
002
005 -0003
Source compiled according to the result of Rung TAP operation
443 Industry Effects
According to the model calculation results (shown
in Table 7) shown in program one establishing the
free trade zone has a great impact on specific industry
sectors in China and Korea Chinarsquos sectors with
increased output mainly concentrate in the primary
sector products among which the agricultural sector
takes the largest increase reaching 268 while the
industrial sectors (light manufacturing and heavy
industries) decrease slightly In general Chinarsquos sector
output changes but the rate of change is not large In
contrast there is a big difference in sector output
changes between departments in Korea Because of the
restriction of resources geography population and
other natural endowments sectors with reduced output
in Korea are concentrated in the primary sector
particularly in the agricultural sector with a significant
reduction of 2009 much greater than the changes in
other sectors Sectors with output increases concentrate
in the industrial product sectors among which textiles
and clothing sector are the most outstanding with a
927 increase The other regions in the world have a
slight growth in light manufacturing but the outputs of
other sectors experience different degrees of decline
In program two every country protects its weak
industries and the tax reductions are less than in
program one The change rates in industry output of
the two countries is not big except for Chinarsquos textile
and clothing industry which has a slight rise other
changes all decline compared to program one
Although in program two Chinarsquos protection of light
manufacturing and heavy industry help to slow the
decrease of industrial output we can see from Table 7
that China rsquos output of these two industries still
declines indicating that to enhance the level of
industrial development trade protection is not always
feasible It is fundamental to work hard on solving
problems such as low-end industrial structure low
technology in production lack of innovation and etc
Korearsquos protection of agriculture shows a better effect
the output change rate of Korearsquos food and crop
industry decreased from 2009 to 004 Due to
Korearsquos protection of agricultural products Chinarsquos
increased output in food and crop industry changes
from 268 up to 0161
Through the above analysis it can be concluded
that after the establishment of a China-Korea free trade
zone regardless the degrees of tax reduction and
exemption the output will be improved with the
optimization and upgrading of industries For the other
regions in the world it brings adverse impacts
Table7 The Output Changes of Sub-sectors in Program One and Program Two ()
Program one Program two
China Korea Other regions China Korea Other regions
Food and Crop
Livestock and meat products Forest rivers and coal
Natural gas and other minerals
Processed foods Textile and clothing
Light manufacturing
Heavy industries
268
056 031
114 004
-036
-025
-2009
-012 -144
-095 927
034
162
-035
-009 -004
-011 -032
001
-003
0161
0114 0137
0479 0274
-005
-008
-004
-015 -027
-082 534
-017
-018
-0008
-0009 -0027
-0019 -0233
0007
0015
J Glob Bus Trade Vol 9 No 2 (November 2013) 45-60
59
Public utilities construction
Transport and communications Other services
038
009 01
412
155 247
-009
-004 -006
0042
002 0037
023
006 011
-0006
-0005 -0005
Source compiled according to the result of Rung TAP operation
Ⅴ Conclusions
Based on the ldquoStarting Joint Minister Statement on
free trade agreement between China and South Koreardquo
the article explains the basic ideas of this agreement
Through the analysis of the investment interests and
trade interests of China and Korea it finds that
intermediate import and export products in China and
Korea trade rank first and the goods trade in
production is considerably higher than that in
consumption This formation of structure of goods
trade can be reasonably explained by Korearsquos direct
investment in China Through the analysis of
producersrsquo interests and the consumers in China and
Korea it finds that if China and Korea reach a free
trade agreement that excludes Korearsquos agriculture from
free trade as a sensitive product it will sacrifice the
majority of consumersrsquo interests and only protects the
interests of minor agricultural producers If Chinarsquos
petrochemical and machinery are separated from
China-Korea free trade agreement negotiations it will
also sacrifice the majority of consumersrsquo interests and
only protect the investorsrsquo interests Therefore it
shows firstly the insight on interests is significantly
different between the declaration and theoretical
research Secondly Chinarsquos diplomatic interests are
bigger than its trade significance and Korea protects its
investment interests in China through trade agreements
Thirdly both countries are trying to protect their
producersrsquo interests through trade agreements
Finally this paper uses the global trade analysis
project (Global Trade Analysis Project GTAP) model
and proposes ldquofull abolition of trade in goods tariffs
between China and Koreardquo and ldquoKorearsquos exceptions
on its high tariff food and crop sectors Chinarsquos
exceptions on industrial sector (light manufacturing
and heavy industry) and tariffs on other sectors
reduced by halfrdquo It predicts the economic benefits of
China-Korean free trade zone by two sets of simulation
programs from three aspects macroeconomic and
welfare effects trade effects as well as industry effects
It finds that after the establishment of a China-Korean
free trade zone regardless the level of tax reduction it
will promote the growth of the national economy and
improve the social welfare and import and export
Trade conditions and output will be improved with
industrial optimization and upgrading of industries in
two countries For the other regions in the world it will
bring negative and adverse changes
References
Baiming Z Jiang Y amp Maohong L (2010) Biased
investment by state-owned and foreign enterprises
and its production-trade effect Wuhan University
Journal (Philosophy amp Social Sciences) 2010(1)
117-124
ChinaStatistics (2011) China Statistical Yearbook
of 2011 Central Hong Kong Author Retrieved
from httpwwwchinastatisticsnetchina-
statistical-yearbook-2011-m-23html
Fang Z H A O amp Ji L I (2010) A research on
trade status and intra-industry trade between China
and South Korea Journal of Jilin Normal Uni-
versity (Humanities amp Social Science Edition)
2010(4) 52-56
Jianxin H P W (2010) The design of FTA nego-
tiation strategy between China and Korea based on
GTAP simulation World Economy Study 2010(6)
81-86
Li Y amp Zhou W F (2008) The investment from
Korea to China The present situation trend and
Chinarsquos policies Economic Research Guide
2008(3) 158-160
Analysis of the Interests of Conceiving a Free Trade Agreement between China and South Korea
60
Li X F amp Gui J X (2009) An empirical analysis of
the impact of the establishment of China-Korea
FTA on bilateral trade International Economics
and Trade Research 2009(5) 4-8
Li X Z (2010) The trade between China and Korea
and its structure change International Studies
2010(6) 48-52
Song J G (2011) The study of free trade agreement
between China and South Korea based on the
gravity model Contemporary Economic Research
2011(5) 81-85
United Nations Statistics Division (nd) Commodity
Trade statistics database New York NY Author
Retrieved from httpcomtradeunorgdata
Watanabe (2009) The possibility about the FTA
among Japan Korea and China The Economist
2009(12) 5-12
World Trade Organization (nd) World Customs
Data 2011 Retrieved from httpwwwwtoorg
statistics
Xin Z Rong R D amp Yan C (2006) An empirical
analysis of the influence about the direct
investment from Japanese South Korean to China
on the scale and industry Journal of International
Trade 2006(10) 44-50
Xue J X amp Zhang B (2004) The economic coope-
ration arrangements in East Asia A comparative
study based on the general equilibrium model The
Journal of World Economy 2004(6) 51-59
Ye J Y amp Wang P (2005) The analysis of the trade
deficit between China and Korea Economic
Science 2005(1) 115-126
Zheng Z S (2009) The strategic motivation com-
parison of FTA promotion between China and
Korea Commercial Times 2009(33) 35-36
J Glob Bus Trade Vol 9 No 2 (November 2013) 61-71
61
ISSN 1946-5130
Journal of Global Business and Trade
wwwiagbtcom
Stock Market Development and Economic Growth the Case
of the Philippine Stock Market
Princess Jace N Sta Mariaa and Agham C Cuevas
b
ab College of Economics and Management University of the Philippines Los Bantildeos Philippines
Received 25 August 2013 Revised 27 September 2013 Accepted 30 October 2013
ABSTRACT
The general objective of this study is to analyze the level of stock market development of the Philippine Stock
Exchange as reflected by its liquidity position and its implications to economic growth in the Philippines
Stock market liquidity was analyzed through its three liquidity measurements turnover ratio total value of
traded shares ratio and the market size ratio This study used Ordinary Least Squares (OLS) in analyzing the
relationship between stock market liquidity and economic growth using quarterly data from 1996 to 2012
Stock market liquidity as measured by the growth in value of traded shares and the growth in market size is
significantly related to the growth of the economy after controlling for variables such as inflation which
lagged by one period growth in foreign direct investment and openness to trade Further analysis showed that
the growth in market size causes economic growth However the determinant of the growth in value of traded
shares does not exhibit Granger causality but is proven to have a long run relationship as shown from the
results of the Error Correction Model
Keywords economic growth Philippine stock exchange stock market development stock market liquidity
Ⅰ Introduction11
Financial markets and intermediaries play a
significant role in the growth of the economy by
improving financial efficiency that would in turn
provide better allocation of resources As savers or
lenders hold current consumption for future expendi-
ture borrowers desire current consumption or invest-
ment that would eventually yield higher returns in the
future These institutions are responsible for main-
taining a healthy monetary economy in the country as
they mobilize and convert savings into funds and
channel them to borrowers or investors to further
2013 International Academy of Global Business and Trade
All rights reserved
allocate them to more productive investments
(Mishkin 2006) An efficient stable and vibrant stock
market is essential to the development of the financial
sector Stock markets are responsible for the expansion
of a companyrsquos capital by allowing stocks or shares to
be sold or traded in public
Kanasro Jalbani and Junejo (2009) stated that
stock markets play a crucial role in capital mobilization
and provide secondary markets for the investors and
financial institutions to buy and sell securities A stock
market is considered to be liquid when large
transactions are executed with only a small impact on
prices of securities Stock market liquidity is thus
considered a good tool to measure the efficiency of a
stock market A marketrsquos stability is also determined
Stock Market Development and Economic Growth the Case of the Philippine Stock Market
62
through the liquidity of its securities or the ease at
which these securities are bought or sold in the market
The Philippine Stock Exchange (PSE) the sole
stock market of the Philippines was established on
December 23 1993 when the respective founders of
both the Manila Stock Exchange (MSE) and the
Makati Stock Exchange (MKSE) decided to combine
the two exchanges to further develop a more efficient
capital market During the past decade the PSE has
been robust in terms of the daily value traded Both
foreign and domestic market capitalization which is
the measure of the size of listed companies in the stock
market has been increasing since 2002 In January
2013 the Philippine Stock Exchange index (PSEi) the
indicator used to measure the performance of active
and highly capitalized listed Philippine companies in
the PSE breached the 6000 level an all-time high in
Philippine stock market history
The general objective of the study is to analyze the
liquidity of the Philippine stock market and its
implications for economic growth Liquidity is
important as it is an aspect of a stock market that is
necessary for the traders to interact Specifically the
study aims to measure the liquidity of the Philippine
stock market and evaluate its trends for the given
period determine the linkages between stock market
liquidity and growth of the economy and determine the
causality between stock market development and
economic growth in the Philippines
The paper is organized as follows The next two
sections review the related literature followed by the
analytical and empirical framework The fourth section
discusses the results while the last section provides the
conclusion
Ⅱ Review of Related Literature
21 Stock Market Development as a
Determinant of Economic Growth
Several studies have been conducted on the
relevance of stock market development to economic
growth As cited by Petros (nd) the stock market
provides the fulcrum for capital market activities and it
is often cited as a barometer of business direction An
active stock market may be relied upon to measure
changes in general economic activities using the stock
market index (Obadan 1995) According to Petros
(nd) directly or indirectly a stock market through its
specific services can contribute to economic growth
Mobilization of savings creation of liquidity risk
diversification improved dissemination and acquisi-
tion of information and enhanced incentive for cor-
porate control are functions that are notably significant
thus by improving the efficiency and effectiveness of
these functions it can amplify the economic growth
rate
Tapitan (2012) highlighted the role of financial
intermediaries as a prerequisite for economic growth as
they play an important role in technological progress
The financial system affects capital accumulation by
altering the saving or by reallocating savings among
different capital producing technologies The key
assumption is that better technology is produced as a
by-product of capital investment
Capital investments are important in boosting the
growth of the countryrsquos economy As cited by Nagai-
shi (1999) Levine (1997) identified two channels in
which financial markets or intermediaries affect
economic growth through capital accumulation and
technological innovation In 1999 Garcia and Liu
(1999) identified three main channels through which
financial markets and intermediaries may affect
economic growth The first is by stimulating savings
Financial markets or intermediaries provide savers
with a relatively higher yield McKinnon (1973) and
Shaw (1973) (as cited by Garcia amp Liu 1999) claimed
that financial deepening improves not only produc-
tivity of capital but also the saving rate and therefore
investment and growth Second this can be done by
reducing information and transactions costs because
we know that high transaction costs would definitely
have a negative effect on trading for these discourage
people from transacting thus affecting onersquos profit
Lastly by promoting an efficient allocation of invest-
ment the allocation of resources is improved
J Glob Bus Trade Vol 9 No 2 (November 2013) 61-71
63
22 Stock Market Liquidity
Stahel (2004) (as cited by Benić amp Frani 2008)
argues that due to stock market integration investors
would tend to move their capital to where they expect
higher returns on their investments Von Wyss (2004)
(as cited by Benić amp Frani) defined four aspects or
dimensions of financial market liquidity the trading
time tightness depth and resiliency These dimen-
sions of liquidity may be presented with five different
levels of liquidity 1) the ability to trade at all 2) the
ability to buy or to sell a certain amount of an asset
with an influence on the quoted price 3) the ability to
buy or to sell a certain amount of an asset without any
influence on the quoted price 4) the ability to buy and
to sell an asset at about the same price at the same time
and 5) the ability to execute a transaction from points
two to four immediately
Sarr and Lybek (2002) claim that illiquid markets
are more of a symptom rather than a cause of
inadequate market functioning They posit that in order
to foster liquid financial markets sound and
transparent economic policies with appropriately
designed trading clearing and settlement systems as
well as appropriate intervention policies of the central
bank which can help contain systematic risk are the
only sustainable solution
Levine and Zervos (1998) investigated whether
measures of stock market liquidity size volatility and
integration with world capital markets are robustly
correlated with current and future rates of economic
growth capital accumulation productivity improve-
ments and saving rates They used data on 49
countries from the period 1976 to 1993 They
evaluated whether the stock market indicators together
with banking development are correlated with the
growth indicators Stock market development
indicators include the size in which capitalization is
measured by the value of listed domestic shares on
domestic exchanges divided by GDP the liquidity
which is measured by the turnover ratio and the value
traded ratio Using the international capital asset
pricing model (CAPM) and international arbitrage
pricing theory (APT) they concluded that stock market
liquidity and banking development are both positively
and robustly correlated with contemporaneous and
future rates of economic growth capital accumulation
and productivity growth Also both a stock market and
banks provide different financial services that could
actually help the economy as a whole On the other
hand based on their study they find no support that
these indicators reduce private savings rate or hinder
long run growth
Levine (1996) tested the liquidity of stock markets
for 38 countries (1976-1993) that include both Indus-
trial and developing countries Three measurements for
liquidity were used the total value of shares traded on
a countryrsquos stock exchanges as a share of GDP the
value of traded shares as a percentage of total market
capitalization or the turnover ratio and the value-
traded-ratio divided by stock price volatility He
claimed that a liquid market should be able to handle
heavy trading without large price swings Thus
empirically stock market size and volatility do not
matter but the ease of which shares can be traded The
results suggest that stock market liquidity helps
forecast economic growth even after accounting for a
variety of nonfinancial factors that influence economic
growth Stock market liquidity is still a reliable
indicator of future long term growth after controlling
for inflation fiscal policy political stability education
the efficiency of the legal system exchange rate policy
and openness to international trade
Ⅲ Analytical and Empirical
Framework
Stock markets contribute in easing financial
activities as well as guiding the countryrsquos firms and
investors to allocate their funds efficiently Levine
(1996) showed that countries that had more liquid
stock markets enjoyed both faster rates of capital
accumulation and greater productivity gains Stock
markets through creation of liquidity affect economic
activity by less risky investment in equity markets
which allows savers to acquire assets and quickly sell
Stock Market Development and Economic Growth the Case of the Philippine Stock Market
64
them As Fig 1 shows liquid markets improve capital
allocation that would in turn enhance growth in the
economy
Levine (2003) identified three core sources of
theoretically ambiguous relationships between econo-
mic growth and stock market liquidity He first stated
that stock market liquidity lowers the risk of investing
in longer-run higher return projects and in
consequence fosters a growth-accelerating reallocation
of capital The lower risk however affects savings and
capital accumulation rates ambiguously so that
aggregate growth will slow if savings rate fall enough
Second the cost of investing in the long run is lower
Higher rate of return on savings affects savings and
capital accumulation rates ambiguously so that growth
will fall if capital accumulation rates fall enough
Finally stock market liquidity affects incentives for
investors to undertake the costly processes of
researching and monitoring firms and managers
ambiguously Liquidity will affect growth positively if
stock market liquidity encourages agents to evaluate
and exert corporate control
31 Measures of Stock Market Liquidity
The study adopted two measurements of liquidity
used by Kanasro et al (2009) to determine the
efficiency of the Philippine stock market through
liquidity of its shares Stock market liquidity is
hypothesized to be
SML = f (TVTS MSIZE) (1)
Where
SML -- Stock Market Liquidity
TVTS -- Total Value of Traded Shares Ratio
MSIZE -- Market Size Ratio
The Total Value of Traded Shares Ratio (TVTS)
measures the value of equity transactions relative to the
size of the economy The formula for computing the
total value of traded shares ratio is as follows
TVTS = Total Value of Traded Shares
Gross Domestic Product (2)
The Market Size Ratio (MSIZE) measures the size
of the Philippine Stock Exchange in accordance with
the market capitalization as the ratio of GDP of the
Philippines during the sample period
MSIZE = Gross Domestic Product (3)
Market Capitalization
Fig 1 Schematic Diagram for Stock Market
Liquidity and Economic Growth (Levine
1996)
32 Empirical Model
To analyze the relationship between the liquidity of
the Philippine Stock Exchange (PSE) and economic
growth in the Philippines the two measures for stock
market liquidity in logarithm form were regressed to
the logarithm of Gross Domestic Product (LNGDP)
together with the other factors that influence economic
J Glob Bus Trade Vol 9 No 2 (November 2013) 61-71
65
growth using Ordinary Least Squares (OLS) This
study also adopted the regression model of Levine
(2003) Nurudeen (2009) and Mohtadi and Agarwal
(nd) The model directly examined the relationship
between stock market liquidity and economic growth
The regression model is as follows
LNGDP = β0 + β1 LN (TVTS) + β 2 LN (MSIZE)
+ β3 LN (OPEN) + β4 LN (FDI)
+ β4 (INFLAG) + μ (4)
Where
LNGDP -growth in Gross Domestic Product
LNTVTS-growth in Total Value of Traded
Shares Ratio
LNMSIZE-growth in Market Size Ratio
LNOPEN -growth in Openness to Trade
LNFDI-growth in Foreign Direct Investment
INFLAG-Inflation Rate lagged by one period
β-parameter of the indicators
micro-the error term
The variables in the model above are defined as
follows LNGDP refers to economic growth and it is
measured as the logarithm of the real GDP The
LNTVTS is the growth in Total Value of Traded
Shares Ratio and it is measured by dividing the total
value of traded shares with the gross domestic product
and transformed to its natural logarithm The
LNMSIZE is the growth in Market Size Ratio
measured by dividing the gross domestic product to
the market capitalization and transformed to its natural
logarithm LNOPEN refers to the growth in openness
to trade and it is measured by tariff revenues which is
measured by tariff rate multiplied by imports divided
by the sum of imports and exports and transformed to
its natural logarithm LNFDI refers to growth in
foreign direct investment INFLAG is the inflation rate
lagged by one period and μ is the error term
It is hypothesized that an increase in the growth in
total value of traded shares and market size should
increase the growth of the economy The variables
LNOPEN LNFDI INFLAG were used as control
variables to gauge the strength of the correlation
between stock market liquidity and economic growth
for the given period The inflation rate lagged by one
period (INFLAG) is the percentage rate of the change
in the general changes in the price level thus it
measures the monetary instability that negatively
affects economic performance Its lagged effect was
assigned to serve as a proxy for expected future
inflation Foreign direct investment (FDI) was
expected to augment savings and increase the rates of
capital accumulation giving a positive relationship to
economic growth Openness to trade (OPEN) refers to
the openness to international trade of the economy as
trade openness fosters competition in global markets it
was expected that its growth will have a positive
relationship with economic growth
Ⅳ Results and Discussion
This study used a simple Ordinary Least Squares
(OLS) method to determine and further analyze the
relationship between the level of stock market
development as proxied by liquidity position of the
Philippine stock market and economic growth It also
attempted to provide evidence on the existence of a
long run relationship between stock market
development and economic growth through the use of
the Granger Causality test
41 Liquidity of the Philippine Stock
Exchange
The Turnover Ratio measures the value of equity
transactions relative to the market size A high turnover
is an indicator of low transaction cost (Levine amp
Zervos 1998) The turnover position of the Philippine
Stock Exchange has experienced fluctuations The
Ramos administration (1992-1998) experienced a
steady growth in the economy during which the
Philippines Stock Exchange (PSE) was unified
However due to the 1997 Asian financial crisis its
performance declined Under the administration of
Stock Market Development and Economic Growth the Case of the Philippine Stock Market
66
Estrada a decline in the performance in the PSE can be
seen From a 1262 turnover ratio in 1999 it declined
to 218 in 2000 due to poor governance and
economic policies that affected the confidence among
potential investors The economic reforms and policies
under the Arroyo administration improved growth in
the economy giving stock market significant inflows
gaining back investorsrsquo confidence Due to different
problems that the economy experienced coupled with
the global crisis as shown in Fig 2 the trend continued
to be volatile The average turnover ratio of PSE is
380 during the sample period
The Total Value of Traded Shares Ratio (TVTS)
measures the value of equity transactions relative to the
size of the economy There are significant jumps in the
liquidity (total value of shares traded to GDP) in the
last six years Its TVTS ratio has grown to almost 28
The overall average liquidity during the sample period
is 65
Fig 2 Liquidity at Philippine Stock Exchange
(PSE) using Turnover Ratio (TOR) and
Total Value of Traded Shares (TVTS)
The Market Size (MSIZE) measures the size of the
Philippine Stock Exchange in accordance with the
market capitalization as the ratio of GDP of the
Philippines during the sample period As shown in Fig
3 the size of the PSE remained very small from the
year 1996-1999 which had about 3-5 until 2000
when it increased to almost 40 The 1997 Asian
financial crisis caused instability in the financial sector
and only a few companiesrsquo securities were listed The
overall average size of the market has remained only
254 of GDP which seemed to be low in comparison
with other developing markets Since the unification of
the Makati Stock Exchange and the Manila Stock
Exchange in 1993 the Philippine Stock Exchange has
remained relatively small As of May 2012 there are
344 listed companies in the PSE
Fig 3 Liquidity at the Philippine Stock Exchange
using Market Size (MSIZE)
42 Regression Results
The study used 67 observations from the first
quarter of 1996 to the third quarter of 2012 Three
variables were found to be significant using the
Ordinary Least Squares (OLS) method These
variables were the growth in total value of traded
shares (LNTVTS) growth in market size (LNMSIZE)
growth in openness to trade (LNOPEN) The turnover
ratio was not used as a determinant of liquidity as
Levine and Zervos (1996) states that the turnover ratio
measures trading of firmrsquos equities relative to the size
of the market and does not satisfy the degree in which
liquidity services on a macroeconomic scale Thus it
would not be providing significant liquidity to the
economy as a whole Therefore a large stock market is
not necessarily a liquid market
The Durbin-Watson and Breusch-Godfrey tests
were used to test for the presence of autocorrelation
Having found to have positive autocorrelation the
Cochrane-Orcutt Transformation was used as a
remedy to minimize the autocorrelation problem Table
1 shows the regression results after the Cochrane-
Orcutt Transformation
J Glob Bus Trade Vol 9 No 2 (November 2013) 61-71
67
From Table 1 results show that the effect of
growth on the total value of traded shares and the
growth of the market size on economic growth is
positive and statistically significant at the 1 level
The control variables which are the growth of
openness to trade and growth of foreign direct
investment also have the expected signs which are
positive however these variables are not significant
even at the 10 level The results also show that the
variable of inflation lagged by one period is negatively
related to economic growth and significant at the 10
level
Table 1 Cochrane-Orcutt Transformation Regression
Results
Variable Coefficient Std Error t-statistic Probability
LNTVTS 0134 0037 362 0001
LNMSIZE 0826 0046 1800 0000
INFLAG -0025 0013 -196 0055
LNOPEN 0269NS 0240 112 0268
LNFDI 0009NS 0009 100 0322
_cons 8062 0646 1248 0000
R2 = 09488 Prob gt F = 0000
Adjusted R2 =09445 DW Statistic
(transformed) = 2005368
Notes 1 significant at 1 level of significance
2 significant at 5 level of significance
3 significant at 10 level of significance 4 Values were rounded off to three decimal
places
Stock markets contribute to economic develop-
ment by enhancing the liquidity of capital investments
(Levine 1997) Moreover by increasing the quantity
and productivity through improved allocation of
capital as well as reducing the need to hold liquid
balances a liquid stock market would augment econo-
mic growth The results showed that the relationship
between the growth of market size (MSIZE) and
economic growth is positive and significant in
explaining economic growth in the Philippines as it
was used as a proxy for liquidity The coefficient 0826
implies that a 1 increase in growth of market size
would lead to an increase of 0826 in the growth of
GDP The result provides proof that the size of the
Philippine Stock Exchange (PSE) during the given
period determines the ability of the market to mobilize
savings improve the quality and quantity of invest-
ment and accelerate economic growth since the role of
the PSE is to bring companies together to raise capital
through securities
The other measure for liquidity has a positive and
significant effect on economic growth The growth in
total value of traded shares (LNTVTS) has a coeffi-
cient of 0134 implying that a 1 increase in the
growth of total value of traded shares will increase
economic growth by 0134 Since the growth of
TVTS measures the trading of firmrsquos equity as a share
of GDP its liquidity therefore positively reflects on an
economy-wide basis (Levine amp Zervos 1996)
Inflation (INFLAG) which was lagged by one
period conforms to economic theory by having a
negative relationship with economic growth since it
affects economic performance through monetary
instability It has a coefficient of -0025 which is
statistically significant at 10 level This means that a
1 increase in the inflation rate leads to a decrease in
the growth of GDP by 0025
The coefficient of the growth in openness to trade
(OPEN) conforms to the standard economic theory
since it is positively related to economic growth even
if it was used as a control variable The coefficient of
0269 implies that over the study period a 1 increase
in the degree of trade openness leads to approximately
0269 increase in growth of GDP Also there is a
positive relationship between the growth of foreign
direct investment (FDI) and economic growth since
FDI helps to supply long-term capital with new
technologies managerial and marketing capabilities
that would in turn augment economic growth through
employment increasing managerial skills diffusing
technologies and fostering innovations (Asiedu 2002
as cited by Adhikary 2011) The coefficient of 0009
implies that over the study period a 1 increase in the
degree foreign direct investment would lead to 0009
increase in growth of GDP
However results for openness to trade and foreign
direct investment in the model proved to be statistically
Stock Market Development and Economic Growth the Case of the Philippine Stock Market
68
insignificant after using these as control variables
along with the stock market liquidity measurements
The explanatory power or the goodness of fit of the
model as measured by the R-squared is at 09488
which means that 95 can be explained by the model
and it has a very strong fit The value indicates that
economic growth in the Philippines is adequately
explained by the model for the period between the first
quarter of 1996 to the third quarter of 2012 or that 95
of the variation in the growth of economic activities is
explained by the independent variables Moreover the
relationship between liquidity and growth remains
strong even after controlling for inflation foreign direct
investment and openness to trade Thus raising stock
market liquidity may independently produce
substantial growth
43 Long Run Relationship and Causality
431Test for Stationarity
One of the conditions in order to test Granger
Causality between the two variables is through its
stationarity It is important to know if the variable is
stationary or does not have a unit root or if the variable
is nonstationary or the variable contains a unit root
The variables LNTVTS LNMSIZE and LNGDP
were not stationary in their respective level forms
Thus for testing of the unit roots the Augmented
Dickey Fuller (ADF) test was used for the two
measurements of stock market liquidity which are the
LNTVTS and LNMSIZE and the proxy for economic
growth LNGDP The ADF includes the additional
lagged terms which can be examined by the Akaike
Information Criterion (AIC) to ensure that the errors
are uncorrelated If the variable is nonstationary at
level form but stationary after first differencing the
variable is integrated of order 1 and has a unit root
Using the said test variables LNTVTS LNMSIZE
and LNGDP are stationary after first differencing The
results for stationarity are shown in Table 2
Table 2 Stationarity Test Results
Variables Level Form P-value First Difference P-value
LNGDP 05891 lags (4) 00015 lags (4)
LNTVTS 06311 lags (4) 0000 lags (3)
LNMSIZE 03335 lags (4) 00039 lags (4)
Notes 1 significant at 1 level of significance
2 significant at 5 level of significance
432 Test for Cointegration
Since the stationarity of the variables have been
established the cointegration of the indicators of stock
market development and economic growth were tested
The results for the Cointegrating Regression Dickey
Fuller Test are shown in Table 3
Table 3 Cointegrating Regression Dickey Fuller
Test Results
Regressed Variables P-value
LNTVTS and LNGDP 00250
LNMSIZE and LNGDP 00545
Note significant at 5 level of significance
The regression results suggest that LNTVTS is
cointegrated with LNGDP Thus LNTVTS has a
long-run relationship with LNGDP which means
LNTVTS share a common stochastic drift or a
common trend with LNGDP The results also suggest
that LNMSIZE is also cointegrated with LNGDP
because the error term is stationary
433 Granger Causality
Granger Causality can only be tested if variables
are stationary and variables are cointegrated It is used
to establish whether a uni-directional or bi-directional
relationship exists between stock market development
and economic growth Results showed that LNTVTS
and LNMSIZE are both stationary and cointegrated
with LNGDP Table 4 shows the optimal number of
lags used in each determinant through Akaike
Information Criterion Table 5 shows the result of the
Granger Causality test
J Glob Bus Trade Vol 9 No 2 (November 2013) 61-71
69
Table 4 Akaike Information Criterion
LNGDP LNTVTS LNMSIZE
Lags AIC AIC AIC
0 212598 237417 215782
1 168524 222582 181308
2 164703 223876 179562
3 14775 214879 172127
4 14659 216273 167974
Note indicates the optimal number of lags
The results of the Granger Causality tests indicated
that there is a unidirectional causality between stock
market liquidity using the growth in the market size as
proxy and economic growth However results show
that there is no causality between growth in total value
of traded shares and economic growth Growth in total
value of traded shares and economic growth may have
a long-run relationship since they are cointegrated but
they do not exhibit Granger causality
Table 5 Granger Causality Test Results
Variable Computed
Statistic
F Tabular
Value
Granger
Causality
LNTVTS to
LNGDP 093NS 04532 No
LNGDP to
LNTVTS 038NS 07660 No
LNMSIZE to
LNGDP 347 00136 Yes
LNGDP to
LNMSIZE 037NS 08293 No
Notes 1 significant at 5 level of significance
2 NS - indicates insignificance
Since the variables LNTVTS and LNGDP were
found to be cointegrated an Error Correction Model
(ECM) was specified to test for the speed of
adjustment in the said determinants when one of these
variables experiences a shock Table 6 shows the Error
Correction Method results for LNTVTS and LNGDP
Table 6 Error Correction Method Results
Variables Speed of Adjustment
LNTVTS and LNGDP -0143817
Note significant at 5 level of significance
It can be observed from the results that LNTVTS
as the measure of stock market liquidity and LNGDP
for economic growth have the coefficient of the error
correction term with a negative sign and it is
statistically significant at the 5 level of significance
Thus the significance of the error correction mecha-
nism supports cointegration and suggests the existence
of a long-run equilibrium relationship between economic
growth and stock market development determinant
LNTVTS In other words the coefficient of the error
correction term which measures the speed of adjust-
ment back to equilibrium whenever the system is
experiencing a shock indicates that it would take 6953
asymp 7 quarters for a variable to adjust whenever one
experiences a shock
Ⅴ Summary and Conclusion
This research work studies stock market develop-
ment and its implications to economic growth by
analyzing the relationship between the stock market
measurements for liquidity and GDP growth in the
Philippines The specific objectives of the study were
to measure the liquidity of the Philippine stock market
and evaluate its trends for the given period determine
the linkages between stock market liquidity and
growth of the economy and to determine the causality
between stock market development and economic
growth
Using Ordinary Least Squares (OLS) method for
the time series data covering the period of the first
quarter of 1996 to the third quarter of 2012 it was
shown that the role of the stock market is essential to
economic growth in a developing country like the
Philippines The two measures used for liquidity the
growth in total value of traded shares and the growth in
market size were both positively related to economic
growth and statistically significant However results
for the growth in openness to trade and foreign direct
investment in the model proved to be statistically
insignificant after using it as control variables along
with the stock market liquidity measures Inflation on
Stock Market Development and Economic Growth the Case of the Philippine Stock Market
70
the other hand which was lagged by one period
conforms to theoretical conventions by having a
negative relationship to economic growth since it
affects economic performance because of monetary
instability About 95 of the variation in economic
growth is explained by the independent variables
Moreover the relationship between liquidity and
growth remains strong even after controlling for
inflation foreign direct investment and openness to
trade Thus raising stock market liquidity may
independently produce substantial growth
In assessing the relationship between stock market
development and economic growth it empirically
proved that the measure of economic growth (LNGDP)
and all of the determinants for stock market liquidity ndash
LNTVTS and LNMSIZE were both stationary and
cointegrated For the case of the Philippines there is a
unidirectional causality between stock market liquidity
using the growth in the market size as proxy and
economic growth For LNTVTS stock market
liquidity does not ldquoGranger causerdquo economic growth
and vice versa Since the two indicators have a long
run relationship the results of the Error Correction
Model suggest that there is an adjustment in stock
market liquidity as proxied by growth in total value of
traded shares and economic growth whenever one of
the indicators experiences a shock
Admittedly the study only tested a portion of the
financial side the stock marketrsquos liquidity Other
important determinants of stock market development
such as price volatility elasticity in trading corporate
governance could also be incorporated to give more
robust results There are a wide variety of factors that
can affect economic growth both on the financial and
real sectors of the economy which needs to be taken
into consideration The empirical results indicate that
the potential of the Philippines Stock Exchange in
fostering growth in the country should further be
explored
References
Adhikary B K (2010) FDI trade openness capital
formation and economic growth in Bangladesh A
linkage analysis International Journal of Business
and Management 6(1) 16-28
Benić V amp Franić I (2009) Stock market liquidity
comparative analysis of Croatian and regional
markets Financial Theory and Practice 32(4)
477-498
Garcia V F amp Liu L (1999) Macroeconomic
determinants of stock market development Journal
of Applied Economics 2(1) 29-59
Kanasro H A Jalbani A A amp Junejo M A (2009)
Stock Market Liquidity A Case Study of Karachi
Stock Exchange Pakistan Journal of Commerce
Social Science 3 25-34
Levine R amp Zervos S (1996) Stock market
development and long-run growth The World
Bank Economic Review 10(2) 323-339
Levine R amp Zervos S (1998) Stock markets banks
and economic growth American Economic Review
537-558
Levine R (1996) Stock markets A spur to economic
growth Finance and Development 33 7-10
Levine R (1996) Stock market liquidity and economic
growth Theory and evidence Retrieved from
httpfacultyhaasberkeleyeduross_levinepapers
0845_001pdf
Levine R (1997) Stock markets economic develop-
ment and capital control liberalization Perspec-
tive 3(5) 1-8
Mishkin F (2006) The economics of money banking
and financial markets (10th ed) Upper Saddle
River NJ Prentice Hall
Mohtadi H amp Agarwal S (2001) Stock market
development and economic growth Evidence
from developing countries Available at http
www uwm edumohadiPA-4-01pdf
Nagaishi M (1999) Stock market development and
economic growth Dubious relationship Economic
and Political Weekly 2004-2012
J Glob Bus Trade Vol 9 No 2 (November 2013) 61-71
71
Nurudeen A (2009) Does stock market development
raise economic growth Evidence from Nigeria
The Review of Finance and Banking 1(1) 015-
026
Petros J (2012) The effect of the stock exchange on
economic growth A case of the Zimbabwe stock
exchange Research of Business Economics 6 1-
17
Sarr A amp Lybek T (2002) Measuring liquidity in
financial markets (Working Paper No 02232)
Washington DC IMF
Tapitan J P (2012) Measuring link between financial
development and economic growth using a sample
of selected ASEAN countries (Unpublished under-
graduate thesis) Los Banos Philippines Univer-
sity of the Philippines Los Bantildeos
Von W R (2004) Measuring and predicting liquidity
in the stock market (Doctoral dissertation) Retrie-
ved from httpwww1 unisgchwwwedisnsf
SysLkpByIdentifier2899$FILEdis2899pdf
Xiao X amp Kong L L (2012) An Empirical Study
on the Relationship between Turnover Rate and
Stock Returns in Chinese Stock Market Advances
in Information Technology and Management 2(1)
239-245
Yartey C A (2008) The determinants of stock market
development in emerging economies Is South
Africa different (Working Paper No 0832)
Washington DC IMF
J Glob Bus Trade Vol 9 No 2 (November 2013) 61-71
73

J Glob Bus Trade Vol 9 No 2 (November 2013) 1-9
3
Attractiveness Power and Credibility might also
be conceived of as the three classic source charac-
teristics in communication models Some researchers
suggest ldquothe relationship between attraction to a source
(like dislike friendly feelings etc) and attitude change
has received scant attention Rubin and Brown (1975)
conclude that interpersonal attraction enhances nego-
tiating outcomes Therefore to the extent that a person
receives rewards from a relationship with someone a
negotiator perceives as attractive that person will be
more satisfied with the negotiation outcome In this
study rather than characteristics ascribed to sources of
communication these variables are considered descrip-
tors of negotiation strategies These variables are
measured through ratings of both participants in the
negotiation games
Impression Formation Accuracy has also been
conceived as an individual characteristic or ability It is
believed that a strong relationship between salesperson
performance and abilities to perceive both a customerrsquos
beliefs about products and importance weights for
product attributes Impression formation accuracy is
treated as a measure of the efficiency of the interaction
rather than an individual characteristic
The problem-solving approach (PSA) for business
negotiation is defined as a set of negotiation behaviors
that are cooperative integrative and information
exchange-oriented PSA involves an emphasis on
questions and getting information from clients about
their needs and preferences The problem solving
approach in negotiations involves first an emphasis on
questions and getting information from clients about
their needs and preferences Second once the clientrsquos
requirements and circumstances are fully understood
then the negotiator accommodates the offering to the
clientrsquos needs The focus is on cooperation and an
integrative approach wherein the needs of both parties
are honestly discussed and eventually satisfied A PSA
can be concisely defined as a set of negotiation
behaviors which are cooperative integrative and
information-exchange oriented Such strategies tend to
maximize the number of alternative solutions consi-
dered thus allowing negotiators to optimize outcomes
The relationship between a problem-solving approach
and negotiation outcome has been frequently investi-
gated during the last twenty years Different resear-
chers have used various labels for the PSA concept
(eg integrative bargaining strategies-Walton amp
McKersie (1965) cooperative orientation -Rubin amp
Brown (1975) Williams (1983) Problem-solving
orientation-Pruitt amp Lewis (1975) Murray (1986))
Most of findings have been relatively consistent
Generally the PSA has been found to positively
influence negotiation outcomes Graham (1986)
investigated relationships between the PSA and a
negotiatorrsquos individual profit and their bargaining
partnerrsquos satisfaction Consistent with several studies
reviewed by Rubin and Brown (1975) statistically
significant relationships were discovered between a
negotiatorrsquos PSA and the negotiatorrsquos individual profit
Negotiators who encourage partners to provide
information about themselves and their needs and
preferences can be expected to achieve more favorable
negotiation outcomes Rubin and Brown (1975) and
Weitz (1979) suggest the importance of adjusting
onersquos negotiating tactics according to onersquos impre-
ssions of the opponentrsquos negotiation style Specially
Weitz suggests that adaptive behavior will enhance
negotia-ting effectiveness Rubin and Brown posit high
adaptability coupled with cooperativeness will favor
higher negotiation outcomes
In addition to the negotiating strategies inter-
personal attractions such as like or dislike and friendly
or unfriendly feelings can strongly influence current
negotiation outcomes and the success of future
transactions Simons Berkowitz and Moyer (1970)
suggest the relationship between attraction to a source
such as like or dislike friendly or unfriendly feeling
and attitude change has received scant attention Rubin
and Brown (1975) conclude in their review of the
negotiation literature that generally interpersonal attrac-
tion enhances negotiating outcomes A negotiating
partnerrsquos satisfaction has been found to be positively
related to a negotiatorrsquos attractiveness for business
people from France and Germany (Campbell et al
Negotiation Factors and Culture in Trade Negotiations
4
1988) from America Taiwan Japan and Korea
(Grahametal 1988)
In the very relevant field of buyerseller interact-
tions Evansrsquo (1963) similarity hypothesis posits that
the more similar individuals are in buyerseller
relationships the more favorable will be the outcome
and the more likely a sale Mathews Wilson and
Monoky (1972) argue that perceived similarity results
in more cooperation between the buyer and seller
Attraction is the mechanism through which similarity
affects these outcomes
It should be noted that interpersonal attraction
might be conceived as an exogenous construct-
determined before negotiations begin as a part of the
combination of the negotiatorrsquos characteristics It may
also be argued that attraction is a consequence of the
negotiation However attraction is regarded as a
process-related construct
There is an abundance of studies in the negotiation
literature that focuses on the fundamental assumption
that personal parameters or negotiatorsrsquo characteristics
are relevant to negotiation processes and outcomes
(Barry amp Friedman 1998) Someone with a trusting
nature tends to give credence to the honesty of
statements of others until or unless reasons are
provided for disbelief In negotiation trust relates to
how they expect their partners to behave and respond
(Fells 1983)
In the cross-cultural negotiation literature duration
of the negotiation is described as a key aspect of the
process For example Tung (1982) and Van Zandt
(1970) report that negotiations with the Chinese and
Japanese are exasperatingly long from the perspective
of most American negotiators Pruitt (1981) discusses
at great length the pervasive influence of time on
negotiations That is a time limit affects the qualities of
the aspirations concession making and negotiation
satisfaction Although time limits per se are not varied
in this study negotiators from different cultures may
have different expectations about appropriate durations
which may in turn influence behaviors
Silent periods are operationally defined as gaps in
conversations lasting 10 seconds or more in duration
The time period of ten seconds was selected somewhat
arbitrarily but it is a long enough period of silence to
appear unnatural to most observers The tapes were
searched for gaps in conversations of ten seconds or
more The ten seconds time period while somewhat
arbitrary is a long enough silence to appear unnatural
to most American observers
The concept of interactional synchrony the
unconscious coordination of verbal and nonverbal
behaviors of 2 or more participants in a conversation
was discussed at length by Graham (1980) It is the
number of conversational overlaps or interruptions
during a conversation Conversational overlaps are
defined as periods when both speakers are talking at
the same time or when the conversational contribution
of one speaker overlaps that of the other speaker One
possible measure of this construct is the number of
conversational overlaps or interruptions during a
conversation Identification of such overlaps is
independent of the verbal content of the interactions
Facial gazing is defined as the percentage of time a
negotiator gazes at the face of partner Many resear-
chers have found significant relationships between
facial gazing and outcomes of negotiations (Lewis amp
Fry 1977) Moreover several authors have suggested
differences in facial gazing behaviors across cultures
(Argyle amp Cook 1976)
Touching means that a negotiator touches another
negotiation partner with the exception of beginning
and ending handshakes It is the number of times
negotiators touch their partners (excluding beginning
and ending handshakes) Graham (1985) reports
Brazilian businesspeople touch one another during
simulated negotiations while Japanese and American
negotiators do not
23 Outcome Measures
Researchers often find outcomes of business
negotiations difficult to measure and to compare
Various studies have used sale versus no sale an
obvious measure of negotiating effectiveness (eg
Pennington 1968) profits obtained by negotiators (eg
J Glob Bus Trade Vol 9 No 2 (November 2013) 1-9
5
Rubun amp Brown 1975) and a combination of
individual and joint profits (Clopton 1984) Beyond
profits negotiatorrsquos satisfaction is an important
measure of success especially if partners desire a
continued relationship Given the dual importance of
task accomplishment (profit) and relationship building
(satisfaction) especially in international negotiations
the present study uses both as outcomes
Ⅲ Cultural Difference in Nonverbal
Behavior
The participants in the experiment were 10
Chinese 10 Korean and 10 European Students who
are majoring in international business and Korean
businessmen are undergraduate students majoring
international commerce at Paichai University in Korea
This section deals with nonverbal aspects of
videotaped interactions The rhythms of the
conversations are discussed examining silent periods
and conversational overlaps Next facial gazing and
touching during negotiations are presented
31 Silent Periods
Silent periods are operationally defined as gaps in
conversations 10 seconds or more in duration The
time period of 10 seconds was selected somewhat
arbitrarily but it is long enough period of silence to
appear unnatural to most observers The tapes were
searched for gaps in conversations of 10 seconds or
more Silent periods occurred more frequently in the
Korean negotiatorsrsquo interactions (51 per 30minutes)
than either the Chinese or European negotiators
Negotiators from a low context culture such as Europe
tend to regard the silence of a high context culture such
as Korea as a rejection which is not a rejection in a
real sense by their standards
32 Conversational Overlaps
The concept of interactional synchrony the uncon-
scious coordination of verbal and nonverbal behaviors
of 2 or more participants in a conversation was
discussed at length by Graham (1980) It is the number
of conversational overlaps or interruptions during a
conversation Conversational overlaps are defined as
periods when both speakers are talking at the same
time or when the conversational contribution of one
speaker overlaps that of the other speaker The number
of overlaps (interruptions) by each participant was
totaled and divided by the time of negotiation to arrive
at values which may be compared across interactions
According to Table 1 Korean negotiators interrupted
more than Chinese or European negotiators
33 Facial Gazing
Facial gazing is defined as the percentage of time a
negotiator gazes at the face of partner Randomly
selected 10-minute videotape excerpts of each of the
interactions served as data here The author recoded
the time each participant spent gazing at hisher
partnerrsquos face during 10 minutes According to Table 1
European negotiators spent considerably more time
gazing at negotiation partners than either Korean or
Chinese negotiators
Table 1 Comparison of Patterns of Nonverbal Negotiation Behavior
Nonverbal Negotiation Behavior Korean Chinese European Silent Periods(average number of silence for more than 10
seconds during 30 minutes)
Conversational Overlaps(average number of conversational
overlaps during 30 minutes)
Facial gazing(average number of gazing)
Touch(number of touch)
51
308
11 25
35
264
11 30
28
58
76 00
Negotiation Factors and Culture in Trade Negotiations
6
34 Touching
Touching means that negotiator touches another
negotiation partner except for beginning and ending
handshakes Except for European negotiators Korean
and Chinese negotiators seldom touch their partners
except for handshakes
Ⅳ Conclusions
The purpose of this study has been to find out basic
factors affecting international business negotiations
and to suggest some strategic implications for business
negotiators With the advancement of globalization
intercultural business negotiations become more and
more important as a marketing strategy The role of
business negotiators is extremely important in order to
achieve successful international business negotiations
In order to achieve agreement in international
business negotiations negotiators are required to
manage cultural differences between the parties
concerned in addition to the complexity of domestic
negotiations Because such a large variety of cultural
factors exist among nations it is critical for negotiators
to identify the kind of problem-solving approaches that
are most appropriate for each intercultural negotiator
Understanding cultural differences is vital for successful
intercultural negotiations An objective measurement
of culture is important to overcome misunderstanding
caused by stereotyping and prejudice about other
cultures
As for nonverbal negotiation behaviors Korean
negotiators tend to use more silent periods than the rest
of two groups Also Korean negotiators interrupted
more than Chinese and European negotiators
European negotiators used more lsquofacial gazingrsquo and
lsquotouchingrsquo strategies in negotiation However there are
study limitations as follows the most important
consideration is the validity of the principal outcome
measure individual profit Kellyrsquos negotiation game
and such measures have been used in other studies but
how well the game represents actual business
negotiations is problematic Much of the evidence
supplied for accepting and rejecting hypotheses is
based on self-reports and judgements of participants
Also small sample sizes do not allow for tests of
statistical significance The negotiator should understand
the cultural background specifically regarding business
negotiation Negotiators can ask more questions in
their negotiations Sometimes itrsquos smart to be a little
bit dumb in business negotiations
The more the negotiators ask questions the more
information they can get and they can exchange more
information Also using a silent strategy can be
necessary and aggressive influence tactics such as
warnings and threats particularly those emphasized
with expressions of emotions may be used in
negotiations in a very restrictive way
Cooperatives and educational institutions should
take advantage of current research to develop training
programs on cultural differences in not only verbal
communication but non-verbal communication for
better trade negotiation results
References
Achrol R S (1997) Changes in the theory of
interorganizational relations in marketing Toward
a network paradigm Journal of the Academy of
Marketing Science 25(1) 56-71
Adler N J amp Graham J L (1989) Cross-cultural
interaction the international comparison fallacy
Journal of International Business Studies 20(3)
515-537
Allred K G Mallozzi J S Matsui F amp Raia C P
(1997) The influence of anger and compassion on
negotiation performance Organizational Behavior
and Human Decision Processes 70(3) 175-187
Argyle M amp Cook M (1976) Gaze and mutual
gaze Cambridge England Cambridge University
Press
Atkinson J M amp Heritage J (1984) Structures of
social action Studies in conversation analysis
Cambridge England Cambridge University Press
Barry B Fulmer I S amp Van Kleef G A (2004) I
laughed I cried I settled The role of emotion in
J Glob Bus Trade Vol 9 No 2 (November 2013) 1-9
7
negotiation The Handbook of Negotiation and
Culture 71-94
Barry B amp Friedman R A (1998) Bargainer
characteristics in distributive and integrative
negotiation Journal of Personality and Social
Psychology 74(2) 345
Barry B amp Oliver R L (1996) Affect in dyadic
negotiation A model and propositions Organiza-
tional Behavior and Human Decision Processes
67(2) 127-143
Blackman C (1977) Negotiating China Case studies
and strategies St Leonards Australia Allen amp
Unwin
Brenkert G G (1998) Trust morality and interna-
tional business Business Ethics Quarterly 8(02)
293-317
Brunner J A amp Taoka G M (1977) Marketing and
negotiating in the peoplersquos republic of China
Perceptions of American businessmen who atten-
ded the 1975 Canton Fair Journal of International
Business Studies 69-82
Butler J K (1995) Behaviors trust and goal
achievement in a win-win negotiating role play
Group amp Organization Management 20(4) 486-
501
Campbell N C Graham J L Jolibert A amp
Meissner H G (1988) Marketing negotiations in
France Germany the United Kingdom and the
United States The Journal of Marketing 52 49-62
Casse P (1981) Training for the Cross-Cultural Mind
(2nd ed) Washington DC Society for
Intercultural Education Training and Research
Cellich C (1995 January) Negotiations for export
business Elements for success In International
Trade Centre (ED) International Trade Forum
(No 4 p 20) Geneva Author
Clopton S W (1984) Seller and buying firm factors
affecting industrial buyersrsquo negotiation behavior
and outcomes Journal of Marketing Research 21
39-53
Coates A (1968) Myself a Mandarin Oxford UK
Oxford University Press
Davidson W H (1987) Creating and managing joint
ventures in China California Management Review
29(4) 75-95
Deutsch M Kelley H H amp Rapoport A (1964)
Strategic interaction and conflict Berkeley CA
Berkeley Institute of International Studies
University of California
Evans F B (1963) Selling as a dyadic relationship A
new approach American Behavioral Scientist 6
76-79
Fang T (1997) Chinese business negotiating style A
socio-cultural approach (Licentiate thesis)
Linkoping Sweden Inter-national Graduate School
of Management and International Engineering
(IMIE)
Fisher R Ury W amp Patton B (1991) Getting to
Yes (2nd ed) New York NY Penguin Books
Ganesan S (1994) Determinants of long-term
orientation in buyer-seller relationships The
Journal of Marketing 19(4) 1-19
Gardner L amp Aronson G (Eds) (1968) Handbook
of Social Psychology Reading MA Addison-
Wesley
George J M Jones G R amp Gonzalez J A (1998)
The role of affect in cross-cultural negotiations
Journal of International Business Studies 29(4)
749-772
Gilsdorf J W (1997) Metacommunication effects on
international business negotiating in China
Business Communication Quarterly 60(2) 20-37
Goh B C (1996) Negotiating with the Chinese
Euro-Asia Business Review 5(1) 34-36
Graham J L (1985) The influence of culture on the
process of business negotiations An exploratory
study Journal of International Business Studies
81-96
Graham J L (1986) The problem-solving approach
to negotiations in industrial marketing Journal of
Business Research 14(6) 549-566
Graham J L (1990) An exploratory study of the
process of marketing negotiations using a cross-
cultural perspective In E A Scarcella amp S
Krashen (Eds) Developing communicative
Negotiation Factors and Culture in Trade Negotiations
8
competence in a second language (pp 239-279)
Rowley MA Newbury House
Greenhalgh L amp Gilkey R W (1993) The effect of
relationship orientation on negotiatorsrsquo cognitions
and tactics Group Decision and Negotiation 2(2)
167-183
Gumperz J J (1982) Discourse strategies Cambridge
UK Cambridge University Press
Hall E T (1976) Beyond culture Garden City NY
Anchor Press
Hall E T (1989) The silent language New York
NY Bentam-Doubleday
Hofstede G (1991) Cultural and organization amp
software of the mind Berkshire England
McGraw-Hill
Hofstede G (2001) Culturersquos consequences (2nd ed)
Thousand Oaks CA Sage
Jones G R amp George J M (1998) The experience
and evolution of trust Implications for cooperation
and teamwork Academy of Management Review
23(3) 531-546
Kumar R (1997) The Role of affect in negotiations
an integrative overview The Journal of Applied
Behavioral Science 33(1) 84-100
Kumar R (2004) Culture and emotions in
international negotiations An overview In M J
Gelfand amp J M Brett (Eds) The handbook of
negotiation and culture (pp 95-113) Stanford CA
Stanford Business Books
Lewicki R J amp Stark N (1996) What is ethically
appropriate in negotiations An empirical examina-
tion of bargaining tactics Social Justice Research
9(1) 69-95
Lewis S A amp Fry W R (1977) Effects of visual
access and orientation on the discovery of
integrative bargaining alternatives Organizational
Behavior and Human Performance 20(1) 75-92
Linton R (1945) The cultural background of personality
New York NY Appleton-Century Crofits
McAllister D J (1995) Affect-and cognition-based
trust as foundations for interpersonal cooperation
in organizations Academy of Management
Journal 38(1) 24-59
Min H amp Galle W (1993) International negotiation
strategies of US purchasing professionals Interna-
tional Journal of Purchasing and Materials
Management 29(2) 40-50
Pennington A L (1968) Customer-salesman bargain-
ing behavior in retail transactions Journal of
Marketing Research 255-262
Pruitt D G (1981) Bargaining Behavior New York
NY Academic Press
Reardon K K amp Spekman R E (1994) Starting out
right Negotiation lessons for domestic and cross-
cultural business alliances Business Horizons
37(1) 71-79
Rempel J K Holmes J G amp Zanna M P (1985)
Trust in close relationships Journal of Personality
and Social Psychology 49(1) 95
Rubin J Z amp Brown B R (1975) The social
psychology of bargaining and negotiation New
York NY Academic Press
Salacuse J W (1991) Making global deals negotia-
ting in the international marketplace Boston MA
Houghton Mifflin
Sawyer J amp Guetzkow H (1965) Bargaining and
Negotiation in International Relations In H C
Kelman (Ed) International behavior A social-
psychological analysis (pp 464-520) New York
NY Holt Rinehart and Winston
Sebenius J K (2002) The hidden challenge of cross-
border negotiations Harvard Business Review
80(3) 76-85
Shenkar O amp Ronen S (1987) The cultural context
of negotiations The implications of Chinese
interpersonal norms The Journal of Applied
Behavioral Science 23(2) 263-275
SRI International (1979) Doing Business in Taiwan
and Doing Business in Japan [Pamphlet] Menlo
Park CA Schmidt K D
Stewart S amp Charles F K (1989) Talking with
dragon Negotiating in the peoplersquos republic of
China Columbia Journal of World Business 23(3)
68-72
J Glob Bus Trade Vol 9 No 2 (November 2013) 1-9
9
Strong K amp Weber J (1998) The myth of the
trusting culture a global empirical assessment
Business amp Society 37(2) 157-183
Thibaut J W amp Kelly W H (1959) The social
psychology of groups New York NY McGraw-
Hill
Triandis H C Kurowski L L amp Gelfand M J
(1994) Workplace diversity In H C Triandis M
D Dunnette amp L M Hough (Eds) Handbook of
industrial and organizational psychology (pp 769-
827) Palo Alto CA Consulting Psychologists
Tung R L (1982) US-China trade negotiations
practices procedures and outcomes Journal
of International Business Studies 25-37
Weiss S E (1993) Analysis of complex negotiations
in international business The RBC perspective
Organization Science 4(2) 269-300
Weitz B (1979) A critical review of personal selling
research The need for contingency approaches In
G Albaum amp G A Churchill (Eds) Critical
issues in sales management State of the art and
future research needs Eugene OR University of
Oregon
Yoshimatsu H (2005) Japanrsquos keidanren and free
trade agreements Societal interests and trade
policy Asian Survey 45(2) 258-278
Zandt V (1970) How to negotiate in Japan Harvard
Business Review 25-38
J Glob Bus Trade Vol 9 No 2 (November 2013) 11-21
11
ISSN 1946-5130
Journal of Global Business and Trade
wwwiagbtcom
Is the Agrochemical Industry Traversing the Organic Route
Insights and Directions for a Philippine Agrochemical
Trading Company
Jane Keneth M Mampustia Jeanette Angeline B Madamba
b Agnes T Banzon
c and
Loida E Mojicad
abcd College of Economics and Management University of the Philippines Los Bantildeos Philippines
Received 12 August 2013 Revised 22 September 2013 Accepted 25 October 2013
ABSTRACT
This paper explores the strengths weaknesses challenges and opportunities of a Philippine agrochemical
trading company as it thrives within its broader macro-environment In an era of climate change adaptation
and ailing global economies agrochemical companies within the food chain face even greater barriers to
survival and competitiveness The study revealed that the agrochemical industry has made baby steps in
encouraging farmers to adopt the natural or organic way of farming through the use of biopesticides and
biofertilizers as a response to climate change but price-sensitive farmers appear indifferent to the use of
biopesticides and biofertilizer and readily switch suppliers depending on product prices as well as the
promotional activities done by agrochemical trading companies These suggest that agrochemical usage will
continue to dominate global agriculture in the next couple of years while biologicals in organic agriculture
will account for a minimal percentage despite the trend toward sustainable agriculture To be sustainable it is
suggested that agrochemical trading companies introduce new brands for each product type formulate a
customer retention strategy for its dealers and independent business partners and pursue a market penetration
strategy to widen the customer base as they track their moves against a changing global agrochemical
industry
Keywords agrochemical industry biopesticides climate change adaptation organic agriculture sustainability
Ⅰ Introduction2
Agrochemicals also known as crop protection
products are those products or substances which are
used to effectively and actively manage the agricultural
ecosystem Agrochemical products include pesticides
herbicides insecticides and fungicides Synthetic
fertilizers hormones and other chemical growth agents
2013 International Academy of Global Business and Trade
All rights reserved
as well as concentrated stores of raw animal manure
may also be included in the list of agrochemical
products These products can be classified into four
categories inorganic pesticides organic pesticides and
pre-emergent and post-emergent herbicides These
chemicals play a vital role in controlling and restrain-
ing the damaging attacks of pests weeds fungi
diseases and other undesirable pests which pose
serious threats to global crop production The benefits
offered by agrochemical products are two-fold the
Is the Agrochemical Industry Traversing the Organic Route Insights and Directions for a Philippine
Agrochemical Trading Company
12
control of certain pests and diseases to improve crop
productivity and indirectly poverty alleviation (Fertili-
zer and Pesticide Authority 2012)
Fig 1 Benefits of Pesticides to Control Human and Livestock Disease Vectors and Nuisance Organisms
Source Cooper and Dobson as cited in Cuyson S (2007)
Pesticide products when used properly can give
benefits not only to the community but to the whole
society as shown in Fig 1 Problems which most
farmers complain about like fast-growing weeds and
threats to crop productivity can be resolved through the
application of herbicide The application would reduce
cost of labor and fuel specifically for large plantations
Safety for the environment and human health is also
emphasized Careful regulatory policies are implemented
by the FPA so that the environment and human health
would not be at risk Although chemical-based crop protection products
have contributed time and again toward increasing
farmersrsquo incomes because these products prevent
massive crop losses caused by pests and diseases Due
to the need to efficiently meet demand farmers and
other agribusiness entities have to constantly rely on
crop-protecting chemical products since it only takes a
short period to harvest crops with the help of these
products (Tirado 2008) Agrochemical products as
well as the widespread use of irrigation have largely
contributed to the increase in agricultural production
On the other hand health concerns have caused a
negative perception of agrochemicals since over-
utilization of these products have caused problems
such as toxicity of the soil pollution and food poisoning
Established multinational companies involved in
the agrochemical industry as well as local companies
are pressured to effectively address the agricultural
trend of shifting to organic farming and developing
more environmentally-friendly products In addition
there are government policies to which they must align
their objectives with societal welfare in mind Non-
government organizations (NGOs) and environmental
groups such as Greenpeace have been actively making
their moves against crop protection companies With
this scenario players in the industry are bound to
strategize on how to improve product safety to defend
themselves from the actions of such groups in the
interest of sustainability
Phil-Agrochemicals Trading (not the real name) is
a nationwide distributor of generic agrochemical products
located in Southern Luzon Philippines Its distribution
network includes dealers independent business partners
(IBPs) and wholesalers The market may be skeptical
about the efficacy of generic agrochemical brands but
J Glob Bus Trade Vol 9 No 2 (November 2013) 11-21
13
this small company strives to be more responsible for
their products through continuous research on ways to
improve their products and demonstrate such efficacy
in crop protection Knowing their products may have
detrimental effects for the farmers if not properly used
the company conducts seminars or farmersrsquo group
meetings on the safe use of their products They also
give protective gear such as masks and gloves to the
farmer participants Products which are traded by this
company are manufactured by several suppliers in the
Philippines such as AgChem Manufacturing Corpora-
tion Radisson Agrochemical Corporation and Kemistar
Corporation These manufacturing compa-nies are
members of the Crop Protection Association of the
Philippines (CPAP) one of the leading crop protection
chemical associations in the country Phil-Agroche-
micals Trading also imports agrochemicals (speci-
fically insecticides) from Bharat Agro Chemicals in
India and China Xiamen Top using Import amp Export
Co Ltd from China About 10 of their total
inventory comes from imported insecticides Currently
Phil-Agrochemicals Trading which also distributes
products of its sister company has fifteen pesticide
products and two plant nutrition products in its
inventory pipeline
With the stiff competition in the Philippine agro-
chemical industry brought about even more by the
institution of Republic Act No 10068 (also known as
the Organic Act of 2010) the company has to find
ways to better strategize so as to gain customer trust
encourage continued patronage and improve overall
company performance The company has about eight
direct competitors
This paper aims to present an overview of the
agrochemical industry compare the firmrsquos operational
and functional strategies with the practices in the
industry identify and assess the problems and oppor-
tunities pertaining to these strategies and compare
these with its competitorsrsquo strategies and suggest
solutions to the problems or strategies to take
advantage of opportunities in view of the challenges of
going organic and the overall demand for the greening
of agriculture
II Methodology
Primary data for this exploratory research were
gathered from surveys and interviews with four
company officerspersonnel 60 farmers five indepen-
dent business partners and five dealers as well as an
actual apprenticeship at Phil-Agrochemical Trading
over a two-month period by the major author
Secondary data were obtained from printed sources
found at several government institutions such as the
Crop Protection Association of the Philippines (CPAP)
and the Fertilizer and Pesticide Authority (FPA)
company files and other printed or online publications
and unpublished special problem reports at the College
of Economics and Management library Descriptive
analysis combined with a comparative competitor analysis
and a SWOT analysis was used in this research
Ⅲ Review of Literature
Zhang et al (2011) identified three phases in the
history of pesticides and its application (1) the first
phase which covered the period before the 1870s saw
the use of natural pesticides (such as sulfur in ancient
Greece) as a pest control measure (2) the second phase
from the 1870s to 1945 saw the advent of inorganic
synthetic pesticides and the use of natural materials
and inorganic compounds and (3) the third phase
(from 1945 onwards) marked the era of organic
synthetic pesticides (eg DDT 24-D and later HCH
dieldrin) Since then humans synthesized most
pesticides which were later referred to as chemical
pesticides It was during the third phase (the era of
organic synthetic pesticides) when there was a boost in
agricultural productivity which became a moving force
for the advancement of human civilization
During the earlier portion of the third phase three
kinds of insecticides were used carbamated insecticides
organophosphorus insecticides and organochlorined
insecticides This was soon followed by the develop-
ment of herbicides and fungicides As seen in Table 1
herbicide use increased from 20 in 1960 to 48 in
2005 Herbicides comprised almost half of total
pesticide consumption in 2005 (Zhang et al 2011)
Is the Agrochemical Industry Traversing the Organic Route Insights and Directions for a Philippine
Agrochemical Trading Company
14
Table 1 Changes of Pesticide Consumption Worldwide
CATEGORY 1960 1970 1980 1990 2000 2005
Sales Sales Sales Sales Sales Sales
Insecticides 310 365 1002 371 4025 347 7655 29 7559 279 7798 25
Herbicides 170 20 939 348 4756 14 1162
5
44 1288
5
475 1497
1
48
Fungicides amp Bactericides
340 40 599 222 2181 188 5545 21 5306 196 7486 24
Others 30 35 159 59 638 55 1575 6 1354 5 936 3
Total 850 100 2700 100 11600
100 26400
100 27104
100 31191
100
Note Sales in millions USD
Source Xu (1997) httpwwwdocincomp-55305172html as cited in Zhang et al (2011)
According to the Food and Agriculture Organi-
zation of the United Nations (FAO) fertilizer and
pesticide use in the Philippines between 1961 and
2005 increased by 1000 and 325 respectively
This was caused by the widespread use of irrigation
agrochemicals and new seeds in the country However
crop yield only increased by a small amount even
though agrochemical products were used This was
mainly attributed to excessive and inappropriate use of
chemical-based products in farming causing land
degradation and losses in soil fertility
Ⅳ Overview of the Industry
41 Global Agrochemical Industry
Dussal (2011) stated that the world agrochemical
industry was valued at USD 134 billion in 2010 It is
expected to grow at a CAGR of 11 to reach USD
225 billion by 2015 The Asia Pacific region led the
global agrochemical and fertilizer consumption
accounting for 40 followed by North America with
32 The top ten global players include Bayer
Syngenta Potash Corp Agrium and Mosaic which
constitute around 90 of the world market share
Pesticide sales remained relatively constant over
the 1990s between USD 270 to 300 billion From 2007
to 2008 herbicides ranked first in the three major
categories of pesticides (insecticides fungicides
bactericides and herbicides) in terms of sales The
fungicidesbactericides ranked second Europe is now
the top consumer of pesticides in the world followed
by Asia Specific countries which largely use
pesticides are China the United States France Brazil
and Japan Most of the pesticides worldwide are used
for fruit and vegetable crops In developed countries
pesticides mainly herbicides are primarily used for
maize Since the 1980s there have been hundreds of
thousands of pesticides developed worldwide inclu-
ding biopesticides (Zhang et al 2011)
According to the US Environmental Agency
ldquobiopesticides are certain types of pesticides derived
from such natural materials as animals plants bacteria
and certain minerals For example canola oil and
baking soda have pesticide applications and are
considered biopesticides At the end of 2001 there
were approximately 195 registered biopesticide active
ingredients and 780 products Biopesticides fall into
three major classes
a Microbial pesticides consist of a micro-
organism (eg a bacterium fungus virus or
protozoan) as the active ingredient Microbial
pesticides can control many different kinds of
pests although each separate active ingre-
dient is relatively specific for its target pest(s)
For example there are fungi that control
certain weeds and other fungi that kill
specific insects
b The most widely used microbial pesticides
are subspecies and strains of Bacillus
thuringiensis or Bt Each strain of this
bacterium produces a different mix of
proteins and specifically kills one or a few
J Glob Bus Trade Vol 9 No 2 (November 2013) 11-21
15
related species of insect larvae While some
Btrsquos control moth larvae found on plants
other Btrsquos are specific for larvae of flies and
mosquitoes The target insect species are
determined by whether the particular Bt
produces a protein that can bind to a larval
gut receptor thereby causing the insect larvae
to starve
c Plant-Incorporated-Protectants (PIPs) are
pesticide substances that plants produce from
genetic material that has been added to the
plant For example scientists can take the
gene from the Bt pesticide protein and
introduce the gene into the plantrsquos own
genetic material Then the plant instead of
the Bt bacterium manufactures the substance
that destroys the pest The protein and its
genetic material but not the plant itself are
regulated by EPA
Fig 2 Distinguishing Factors for the Paradigm Shift in the Crop Protection Industry
Source Balayan (2010)
d Biochemical pesticides are naturally occurring
substances that control pests by non-toxic
mechanisms Conventional pesticides by
contrast are generally synthetic materials that
directly kill or disable the pest Biochemical
pesticides include substances such as insect
sex pheromones which interfere with mating
as well as various scented plant extracts that
attract insect pests to traps Because it is
sometimes difficult to determine whether a
substance meets the criteria for classification
as a biochemical pesticide the EPA has
established a special committee to make such
decisions
42 The Philippine Crop Protection Industry
According to the Samahan sa Pilipinas ng mga
Industriyang Kimika (SPIK) or Chemical Industries
Association of the Philippines in 2008 the utilization
of crop-protecting chemicals is still prevalent among
Filipino farmers In the country the most extensively
used pesticides are insecticides which account for 51
of the total market herbicides comprise 21
fungicides 14 and the remaining other types of
pesticides 14 These chemicals are used for crops
such as rice (about 33 million hectares of plantation
area) corn (32 million hectares) pineapple (67000
hectares) and banana (25000 hectares)
Is the Agrochemical Industry Traversing the Organic Route Insights and Directions for a Philippine
Agrochemical Trading Company
16
Because of the greater challenge faced by the
players there has been a progressive shift in the
industry from what is commonly known as an
agrochemical industry to a crop protection industry and
now to a plant science industry as shown in Fig 2 The
shift to a plant science industry is believed to deliver
products that would give better solutions to crop
problems and technologies that would lead to
sustainability As of now the multinational companies
or the CropLife members are the ones which are
already in the third phase (Balayan 2010) The generic
companies are still in phase 2 (crop protection) but on
their way to shift to phase 3 (plant science)
The Philippine crop protection industry is
comprised of firms engaged in the formulation
manufacture distribution repackaging importation
and exportation of chemical pesticides It has always
been dominated by transnational agrochemical com-
panies which are members of CropLife International
such as Bayer CropScience Syngenta Philippines Du
Pont Dow Agro These companies operate and manu-
facture their own agrochemical products These
companies focus more on the assurance of the safety of
their products Moreover they are now more respon-
sible about the flow of their products up through the
disposal phase Hence they practice product steward-
ship In 2008 the FPA has listed about 300 firms
operating in the country Other players in the industry
would include local companies such as the members of
the Crop Protection Association of the Philippines
(CPAP) and other generic product-making companies
As shown in Table 2 there has been an increasing
demand for pesticides in the country although a
continuous campaign against these products is done by
the NGOs An increase in Philippine importation of
pesticides is due to the fact that perceived sustainability
cannot be achieved without the help of these
agrochemical products The country is highly
dependent on importation due to the limited resources
available in the country for formulators and manufac-
turers Active ingredients are also imported by the
major industry players Local production is limited to
formulation of imported technical materials except for
24-D
Table 2 Value of Imports of Pesticides in the Philippines (in USD 1000rsquos)
Item 2006 2007 2008 2009 2010
Insecticides 39658 49152 65022 68873 51371
Fungicides 46751 40741 32109 26914 28648
Herbicides 22236 22793 21954 11715 5031
Disinfectants etc 10388 13033 30741 53249 85043
Total 119033 125719 149826 160751 170093
Source FAO (2010)
On the other hand exports of pesticides by the Philippines show minimal levels making the country a net importer of
pesticides (Table 3)
Table 3 Value of Exports of Pesticides in the Philippines (in USD 1000rsquos)
Item 2006 2007 2008 2009 2010
Insecticides 1335 2938 1547 1508 1928
Fungicides - - 1 15 132
Herbicides 1 262 400 81 27
Disinfectants etc 312 1199 915 1256 740
Total 1649 4399 2863 2859 2826
Source FAO (2010)
J Glob Bus Trade Vol 9 No 2 (November 2013) 11-21
17
43 Foreseen Trends in Global Pesticide
Production and Consumption
The trend nowadays is organic agriculture which is
seen also as sustainable agriculture Thus the ongoing
deterioration in the natural environment had Zhang et
al (2011) saying that biopesticides are the wave of the
future Such pesticides must be highly efficient non-
toxic and environment-friendly Biopesticides according
to Yang (2001) have the following advantages
a a positive control effect on pests safe to humans
and animals and no pollution
b no residuals
c strong specificity to target pests safe to natural
enemies and beneficial organisms
d raw materials and active ingredients are natural
products which helps to ensure sustainable
development
e they can be modified by means of modern
biotechnology and fermentation processes to
improve performance and enhance quality
f pest resistance is difficult to generate
Over 100 kinds of biopesticides exist at present
worldwide with about 30 types of biopesticides
commercially produced (Xu 2008) Countries such as
Mexico the United States and Canada dominate global
biopesticide usage accounting for 44 The total
world biopesticide consumption can be broken down
into 20 (Europe) 13 (Asia) 11 (Oceania) 9
(Latin America) and 3 (Carribean and Africa) (Qin
amp Kong 2006) As for China the biopesticide industry
has been expanding since the 1990s from 10 to 20
annually such that by 2006 total biopesticides
consumption reached 145000 tons accounting for 10
of total sales It is anticipated that biopesticides will
replace up to 20 of chemical pesticide consumption
in China in the years ahead
Since safer products are what consumers are
demanding companies such as United Farm Tech-
nologies Nuso Agro Science and Dow Agro started
selling and manufacturing safer pesticides called
biopesticides These products are derived from natural
materials Biopesticides constitute about 2 of the
global agrochemical market (Dussal 2011) In
Monsantorsquos pipeline are agricultural biological or
biopesticides produced using what they call the Bio-
Direct Technology which involves using molecules
found in nature expected to be developed for use in
topically applied crop protection and other products
(Monsanto 2012) Moreover Bayer CropScience
recently acquired AquaQuest a US-based supplier of
innovative biological pest management solutions based
on natural microorganisms for USD 500 million in its
bid to build a leading technology platform for green
products (Bayer 2012)
Ⅴ Results and Discussion
51 Compliance by Phil-Agrochemical
Trading with FPA Requirements
The FPA requirements relative to product labeling
were all met by the Phil-Agrochemical Trading These
include a statement of composition registration or
provisional permit number name and address of
company the productrsquos common name net contents
directions for use suitable indication of hazards
instructions on decontamination and safe disposal of
used containers the lot number and date of formulation
the FPA registration number re-entry period after
application triple rinse logo a person to contact in case
of emergency and safety instructions
52 Comparison of Phil-Agrochemical
Tradingrsquos Activities with CPAP
Activities
Four types of activities are carried out by CPAP
members product stewardship agromedical training
information education campaign aerial spraying semi-
nars and farmersrsquo meetings Phil-Agrochemical
Trading has yet to apply for CPAP membership A
comparison of its activities with CPAP activities
revealed that only farmersrsquo meetings are done by the
firm
Is the Agrochemical Industry Traversing the Organic Route Insights and Directions for a Philippine
Agrochemical Trading Company
18
53 Comparison of Phil-Agrochemical
Tradingrsquos Operations with Top
Competitors
Table 4 presents a summary comparison of Phil-
Agrochemical Tradingrsquos operations with two of its
top competitors CyBERTH Philippines Inc and
PhilAgrow Inc
CyBERTH Philippines Inc was established in
1999 and is engaged in trading pesticides and
fertilizers in the country However they trade more
pesticide products as fertilizer is more expensive The
companyrsquos product portfolio includes 24 registered
products categorized as insecticides herbicides
fungicides molluscicides or plant growth regulators
The major crops where these products can be used are
rice corn vegetables and mangos The companyrsquos
operations cover the research and development of new
products importation and local purchase of the
technical and inert materials of a particular product
formulation warehousing and supply of finished
products to its distributors This company continuously
searches for better products
PhilAgrow Inc started operations in 2006 and is an
importerdistributor of chemical pesticides such as
insecticides molluscicides fungicides herbicides
nematicides and specialties It has 18 FPA-registered
products
Table 4 Summary Comparison of Phil-Agrochemical Trading with Two Top Competitors
Points for Comparison Phil-Agrochemical
Trading CyBERTH Philippines Inc PhilAgrow Inc
Product Lines 14 FPA registered products 24 FPA registered products 18 FPA registered products
Product Variety
Herbicidesinsecticides
molluscicides fungicides fertilizer
Herbicides insecticides
molluscicides fungicides fertilizer
Insecticides molluscicides
fungicide herbicides nematicides specialties
Promotional Activities
Farmers meetings caravans
raffle promos provision of protective gears
Farmers meetings raffle
promos provision of protective gears
Farmers meetings raffle
promos provision of protective gears
Target Market
General trade market
plantation businesses small farmers (below 2ha and 2ha
and above)
General trade market
plantation businesses small farmers below 2 ha
and 2 ha and above)
General trade market
plantation businesses small farmers below 2 ha and 2 ha
and above)
Location Scope Domestic Domestic Domestic
Facilities (eg warehouse
transportation)
Rented (Outsourced
production) Owned Research facility
Provision of training to employees
- Yes Yes
Note Firm name was disguised upon firmrsquos request
Among the points for comparison it can be seen
that Phil-Agrochemical Trading has the least number
of product lines at 14 FPA-registered products vis-agrave-
vis CyBERTH Philippines Inc with 24 FPA-
registered products and PhilAgro Inc with 18 FPA-
registered products In terms of product variety Phil-
Agrochemical Trading and CyBERTH Philippines
Inc have 5 types of products while PhilAgrow has 6
types All firms carry out the same promotional
activities have the same target market and location
scopecoverage Facilities of Phil-Agrochemical
Trading are rented while those for CyBERTH
Philippines Inc are owned PhilAgrow Inc has its
own research facility Only CyBERTH Philippines
Inc and Phil-Agrow Inc provide training to
employees
54 Farmer Survey Results
Sixty farmers surveyed had about 11-15 years of
farming experience primarily grew rice operated
small farms (1-5 hectares) and were customers of Phil-
J Glob Bus Trade Vol 9 No 2 (November 2013) 11-21
19
Agrochemical Trading for five years or less The
majority (over 91) bought pesticides from other
distributors because of lower prices and availability of
preferred agrochemicals On a scale of 1 to 7 with 7
being the highest rating most farmers rated Phil-
Agrochemical Trading a ldquo4rdquo Suggestions given by the
farmers to the firm included lowering the product
prices and increasing promotional activities to
encourage customer retention and continued patronage
55 Assessment of Strengths Weaknesses
Opportunities and Threats
Fig 3 shows a SWOT Matrix where Phil-Agro-
chemical Tradingrsquos strengths are matched with its
opportunities and then with its threats while its
weaknesses are matched with its opportunities and
then with its threats to generate possible strategy
alternatives for the firm to become sustainable Such
strategies include the introduction of new brands per
product type creation of a customer retention strategy
for its dealers and IBPs and pursuing market
penetration
Fig 3 SWOT Matrix
External
Internal
Opportunities Threats
(1) Training programs and seminars are conducted by institutions
such as FPA and CPAP
(2) The openness of farmers to new knowledge in crop production
(3) The bright prospects for the plant
science industry towards the attainment of food security
(4) Increasing trend towards the
production of biopesticides (5) Availability of funding agencies
(6) The support of government and
NGOs for organic farming
(7) The negative perception on the use of chemical pesticides and fertilizers
(8) Small farmers are highly sensitive to
pesticide prices (9) Increasing competition in the industry
due to increasing number of new
entrants (10) The effects of climate change on the
industry
(11) Products of the industry are not highly differentiated
(12) Prices of inputs for the manufacture
of pesticides are volatile
Strengths
Introduction of different brands for
each type of pesticide
(S1 S2 and O1 O5)
Market Penetration
(S1 S3 and T1 T3 T6)
1 The firm has suppliers which are
members of CPAP
2 The firm has its BOD as distributors
3 They do not distribute Category I
pesticide 4 The company has developed
partnership with the dealers of
organic fertilizers
Weaknesses
Creation of customer retention
strategy for the dealers and IBPs
(W2 W3 W5 and O1 O2 O3)
Creation of customer retention strategy for the dealers and IBPs
(W2 W3 W4 and T1 T2 T3 T6)
1 Lack of warehousing facilities
2 Weak brand recognition
3 Non-commitment of dealers and
IBPs
4 Experiences stock-outs of products
5 The company does not have well-
established customer relationships
56 Insights and Directions It is apparent that though the agrochemical industry
has taken action in traversing the organic route toward
Is the Agrochemical Industry Traversing the Organic Route Insights and Directions for a Philippine
Agrochemical Trading Company
20
sustainability it has only taken small steps in that
direction Even if customers are clamoring for safe
food and in spite of the trend towards organic
agriculture and sustainability most farmers remain
indifferent toward using biopesticides and other
biologicals in farming on account of their sensitivity to
input prices and demand for more promotional
activities Thus in the next couple of years it is
expected that agrochemicals of a synthetic nature will
continue to dominate the global agrochemical industry
in terms of usage and market share Such a trend is
expected to spill over to Asia including the Philippines
as transnational companies take in a sizeable share of
the market
To survive and compete in the industry agroche-
mical trading companies must employ a number of
strategies such as introduce new brands for each
product type formulate a customer retention strategy
for its dealers and IBPs and pursue market penetration
Lastly in the case of Phil-Agrochemical Trading the
firm should consider CPAP membership and carry out
product stewardship agromedical traininginformation
education campaign and aerial spraying seminars to
enhance its competitiveness in the agrochemical
industry
References
Balayan L M A (2010) An apprenticeship study on
Bayer cropscience Gocus on its thrust towards
sustainable development through its quality health
safety and environment (QHSE) system (Under-
graduate Special Problem Report) Los Banos
Philippines University of the Philippines Los
Bantildeos
Castillo A (2000) A special problem report on Bayer
Philippines Inc (Undergraduate Special Problem
Report) Los Banos Philippines University of
the Philippines Los Bantildeos
Cuyson S (2007 March) Pesticides in sustainable
agriculture and the environment Paper presented
at the 38th annual scientific conference Tagbilaran
Philippines
David F R (2009) Strategic Management Concepts
and Cases (12th ed) Upper Saddle River NJ
Pearson Education
Dussal M (2011) Agrochemicals Retrieved from
httpwwwAgrochemicalInformationand Resour-
ceshtm
Lu J L (2009) Total pesticide exposure calculation
among vegetable farmers in Benguet Philippines
Journal of Environmental and Public Health 2009
Retrieved from httpwwwhindawicomjournals
jeph2009412054
Lum KY Mamat M J Cheah UB Castaneda
CP Rola AC amp Sinhaseni P (1993) Pesticide
research for public health and safety in Malaysia
the Philippines and Thailand Retrieved from
httpwwwnzdlorggsdlmode=d-00000-00-off-
0envl000010000direct-10401l11-en-5020-about-
00010004001110-0utfZz800ampcl=CL13ampd=HAS
H 016be195f7a6257ed84a093544ampgt=1
Palacio E B (2004) An apprenticeship study on the
crop protection division of syngenta corporation
(Undergraduate Special Problem Report) Los
Banos Philippines University of the Philippines
Los Bantildeos
Qin X F amp Kong F B (2006) Prospect and
situation of biopesticides Journal of Anhui Agri-
cultural Sciences 34(16) 4024 4057
The Philippines (1996) Philippine case study a
developing countryrsquos perspective on POPs Paper
presented at the IFCS Meeting on POPs Manila
Philippines Retreived from httpwwwchem
unepchpopsindxhtmsmanexp7html
Tirado R amp Bedoya D (2008) Agrochemical use in
the Philippines and its consequences to the environ-
ment Quezon Philippines Greenpeace Southeast
Asia Retrieved from httpwwwgreenpeacetopu
bliccationsGPSEA_agrochemical-use-in-the-phili
ppdf
Varca L M (2002) Impact of agrochemicals on soil
and water quality Food and Fertilizer Technology
J Glob Bus Trade Vol 9 No 2 (November 2013) 11-21
21
Center Retrieved from httpwwwagnetorg
libraryphpfunc=viewampid=20110804160130
Xu Y Z (2008) The application of biological
pesticides and industrial development measures
Chinese Agricultural Science Bulletin 24(8) 402-
404
Yang J L (2001) Green chemistry and technology
Beijing Beijing University of Posts and Teleco-
mmunications 176-180
Zhang W Jiang F amp Ou J (2011) Global pesticide
consumption and pollution with China as a focus
Proceedings of the International Academy of Ecol-
ogy and Environmental Sciences 1(2) 125-144
J Glob Bus Trade Vol 9 No 2 (November 2013) 23-27
23
ISSN 1946-5130
Journal of Global Business and Trade
wwwiagbtcom
A Study on the Dependency on Japan and the
Competitiveness of Gear Boxes
Kwang Hee Kim
Department of Business Administration Hyupsung University Korea
Received 15 August 2013 Revised 20 September 2013 Accepted 28 October 2013
ABSTRACT
From the trade deficit with Japan in 2012 of 2557 billion USD the trade surplus of material and components
industry was 2223 billion USD in deficit 87 of such trade deficit with Japan came from the material and
components industry
This study is to focus on the competitiveness index of absolute inferiority in automobile components as of
2012 and lsquogear box and other componentsrsquo that are over the trade for each amount of the automobile
components with Japan
Keywords competitiveness index(CI) dependence on Japan gear box industry trade deficit against Japan
Ⅰ Introduction3
As of 2012 Korea accomplished overall exports of
54787 billion USD and imports of 51958 billion USD
and as a result the trade surplus accomplished a
surplus of 2829 billion USD If this is limited to the
material and components industry the global exports
and imports were 25341 billion USD and 16249
billion USD respectively and as a result the trade
surplus recorded a surplus of 9092 billion USD that
the trade surplus exceeded 60 billion USD To put it
differently the present vast trade surplus mainly came
from the trade surplus of the material and components
industry
In the meantime the trade surplus with Japan
(2012) recorded a deficit of 2557 billion USD It was
less than the trade deficit with Japan for the previous
2013 International Academy of Global Business and Trade
All rights reserved
year 2011 (2864 billion USD) but it was attributable
to the decreasing imports from Japan from the
exchange rate with strong Yen and weak Won
currency The vast scale of the trade deficit with Japan
did not happen overnight
For this background the vulnerability of the
domestic material and components industry was the
greatest cause for the aforementioned From the trade
deficit with Japan in 2012 of 2557 billion USD the
trade surplus of material and components industry was
2223 billion USD in deficit 87 of such trade deficit
with Japan came from the material and components
industry
This study is to focus on the competitiveness index
(-091) of absolute inferiority in automobile compo-
nents as of 2012 and lsquogear box and other components
(8708-40-0000)rsquo that are over the trade for each
amount of automobile components with Japan
Through the foregoing the purpose is to analyze the
A Study on the Dependency on Japan and the Competitiveness of Gear Boxes
24
trend of export and import competitiveness on the
material and components industry with Japan and lead
a responsible strategy for improving the trade deficit
with Japan
Ⅱ Trade Surplus and Status
Looking into the global export and import scale of
lsquogear box and other componentsrsquo (2012) exports reached
2528801000 Dollars and imports 1568670000
Dollars as a result the trade surplus reached
1471934000 Dollars Looking into the export and
import scale with Japan on this item for the same year
it recorded the export of 2379 billion USD and import
of 491028 million USD as a result the trade deficit
recorded 467238 million USD
On the other hand the scale of trade deficit (-470
million USD) with Japan for lsquogear box and other
componentsrsquo was applicable for 18 of the entire
trade deficit with Japan (-2557 billion USD) and 21
of trade deficit with Japan for material and components
(-2233 billion USD)
Also looking only at the trade surplus with Japan
for automobile components (-430 million USD) the
trade deficit of lsquogear box and other componentsrsquo took a
high ratio applicable for 1159 that the status of these
item could be shown
Therefore relief from the trade deficit with Japan
by domestic automobile components industry could be
concluded as impossible without an improvement in
the trade deficit of the lsquogear box and other componentsrsquo
For reference from the costs of a completed car
the ratio for the gear box is known to be around 7-8
As such a gear box with a high ratio of production cost
also has the longest quality assurance limit in that it is
the core item for a high added-value to measure the
competitiveness of a complete car
As shown through the comparison with other
indices under the following Fig 1 the import scale
with Japan for the lsquogear box and other componentsrsquo is
very high Furthermore the import dependence of
Japan has declined from 801 in 1988 770 in
1998 597 in 2008 and 465 as of 2012 but the
import dependency on Japan may be assessed as high
Fig 1 Ratio of Gear Box in the Trade Deficit with
Japan (2012)
Source Prepared by the author by facilitating the Korea International Trade Association (2013)
The global export of this item has clear trend of
increase in recent days The trend of increase has been
significantly moderated from 252 million USD in
1988 to 9 million USD in 2000 However it began
with 2865 million USD in 2002 to leap to 6704
million USD in 2004 918 million USD in 2006
27079 million USD in 2008 and 75942 million USD
in 2010 and it increased to 1 billion 4234 million
USD in 2011 twice that of the previous year As of
2012 it has drastically increased to 2528801000
Dollars over 1 billion USD from the previous year that
exports has shown dramatic increase since 2009
In spite of that the exports to Japan of this item
were USD 970000 in 1988 USD 910000 in 1998
942 million USD in 2008 and 2379 million USD as
of 2012 it has seen very little increase for a quarter of
a century
On the other hand imports from Japan were
15506 million USD in 1988 19402 million USD in
1998 72344 million USD in 2008 and 965669
million USD in 2010 but it has plummeted to record
491028 million USD as of 2012 Compared to 2010
imports from Japan dropped less than a half
J Glob Bus Trade Vol 9 No 2 (November 2013) 23-27
25
Fig 2 Trend of Exports and Imports (1988~2012) of Gear Boxes (8708-40-0000)
Source Prepared by the author by facilitating the Korea International Trade Association (2013)
The trade deficit in automobile components with
Japan to this point has been pointed out with a cause of
importation in highly functional and high-tech
components impossible for domestic development
However according to the interview survey result on
the recent domestic automobile industry gear boxes
imported from Japan are mainly for large commercial
vehicles that are made for productivity purposes in
Korea
Ⅲ Price per Weight on Export and
Import Items
In order to consider the problems in lsquogear box and
other componentsrsquo in detail the price per weight price
of export and import items are analyzed for each price
Following is a brief summary of the export and
import scales and the status of gear boxes to Japan As
is well known in the case of Japan the status of gear
box exports and imports were an item with
overwhelmingly excessive exports Based on 2011
exports were 133 trillion Yen (approximately 18
trillion won) with 128 export countries On the other
hand the imports were only 606 billion Yen
(approximately 800 billion won)
The weight price of Japan for gear boxes is
approximately 1880 Yenkg for the gear boxes with a
high price imported as compared to the export product
price of 1500 Yenkg In particular the weight price
for the import item from the first import subject
country the Netherlands was 7380 Yenkg which
was overwhelmingly higher than the second country
the US of 1270 Yenkg Also the weight price of
export items from the US and Europe was around
1500 Yenkg but the import item price was 2000
Yenkg or higher
A Study on the Dependency on Japan and the Competitiveness of Gear Boxes
26
Table 1 Amount per Kg for Global Export and Import of Gear Boxes
Year Export Import
Amount (USD 1000) Weight (kg) USDkg mount (USD 1000) Weight (kg) USDkg
2005 119947 9259951 130 714512 45342883 158
2006 91804 8512492 108 778889 52223376 149
2007 127074 12051377 105 1066938 72512561 147 2008 270795 21068540 129 1212621 72940221 166
2009 307779 25239366 122 900597 53010625 170
2010 759422 58236825 130 1362034 81828230 166 2011 1423403 106723042 133 1405309 78567171 179
2012 2528801 180077148 140 1056867 59809776 177
A total of 8
years Average weight price 1246 Average weight price 1640
Source Prepared by the author by facilitating the Korea International Trade Association (2013)
On the other hand the weight price of imported
items from Korea was less than 1000 Yenkg for the
gear box an affordable price This fact could be
affirmed by the result calculated through facilitation of
the statistical data of Korea International Trade
Association by the author
In 2010 and 2012 the global weight price of export
items of Korearsquos lsquogear box and other components
(8708-40-0000)rsquo was 130 Dollarkg and 140 Dollarkg
respectively the import item price for the same year
was 166 Dollarkg and 177 Dollarkg respectively
There was a difference in weight price of 3 Dollarkg
or more between items of export and import (Table 1)
Looking into the trend of the 8-year period from
2005 to 2012 the weight price of import items was
higher than the export items The average weight price
of global export items for this item for the 8-year
period was 1246 Dollarkg while the average weight
price for the import item was 1640 Dollarkg there
was a unit price difference of 4 Dollarkg
Thereafter the weight price of the export item to
Japan for the above items in 2010 and 2012 was 81
Dollarkg and 74 Dollarkg respectively while the
import item price was 158 Dollarkg and 160
Dollarkg respectively there was a two times weight
price difference between the export and import items
(Table 2) Looking into the period of 2005 - 2012 for
the above the import items to Japan had a higher
weight price than the export items In addition the
average weight price of the export items for 8 years
was 1105 Dollarkg while the average weight price of
the import item was 1509 Dollarkg there was
approximately 4 Dollarkg or more of price difference
In addition the export amounts to Japan for 2010
and 2012 were 81 Dollarkg and 74 Dollarkg It
declined 4 Dollarkg or more compared to 2009 which
is considered as attributable to diverse types of gear
boxes exported with a drastic increase of exports to
Japan in these two periods
Characteristics of export and import items to the
world and Japan on the gear box and other components
(8708-40-0000) have a higher average weight price in
export and import to Japan than the export and import
items to the world have a higher average weight price
than the import items to Japan
Furthermore when comparing the weight price for
exports and imports to the world and Japan on this
item the import items were higher than the export
items To interpret it differently it is proof that the
export of the gear box had lower added value than the
imported items
J Glob Bus Trade Vol 9 No 2 (November 2013) 23-27
27
Table 2 Amount per Kg for Exports and Imports of Gear Boxes with Japan
Year Export Import
Amount (USD 1000) Weight (kg) USDkg mount (USD 1000) Weight (kg) USDkg
2005 14004 1010821 139 444022 29443945 151
2006 10124 805067 126 531454 38286910 139
2007 10180 845554 120 725042 55581305 130 2008 9420 708144 133 723444 49337793 147
2009 9235 743895 124 628173 39923189 157
2010 11075 1361065 81 965669 61103817 158 2011 19866 2284696 87 812394 49161068 165
2012 23790 3225976 74 491028 30683013 160
A total of 8
years Average weight price 1105 Average weight price 1509
Source Prepared by the author by facilitating the Korea International Trade Association (2013)
Ⅳ Conclusions
The following is the summary of contents shown
through the analysis of the lsquogear box and other
componentsrsquo
First the above items have shown a drastic
increasing trend for global export after 2009 but
export to Japan was still in a minimal increasing trend
close to horizontal line even as of 2012
Second characteristics of export and import items
to the world and Japan showed a higher average
weight price of export items to Japan than the export
items to the world and the import items from the
world had a higher average weight price than the
import items from Japan Also when comparing the
export and import weight prices with the world and
Japan for the above item the import items had a higher
rate than the export items To put it differently the
export of gear boxes was proven to have lower added
value than the import items
Lastly a brief mention was made on the direction
of the lsquogear box and other componentsrsquo
The recent assembly processing technology has
become standardized globally while the material and
components technology have been monopolized by
some advanced countries including Japan Because of
the foregoing the foreign currency earned from the
global market was turned over to Japan and the added
value for Korean industry has not been significant at all
Furthermore if the import of core material and
components such as lsquogear box and other componentsrsquo
is dependent on a specific country there is possible
subordination in the industrial structure with a high
possibility of losing the initiative in production and
price
Purchasing core material and components from
Japan was inevitable in the economic growth process
of Korea in the past but the time has come to make a
great change in the domestic industry
References
Grubel He G amp Peter L (1975) Intra-industry
trade The theory and measurement of interna-
tional trade in differentiated products London
UK MacMillan
Kim Kwang-Hee (2008) The competitiveness of
domestic auto parts industry against Japan The
Korean-Japan Journal of Economics amp Manage-
ments Studies 41
Kim Kwang-Hee (2013 June) A study on the
dependency on Japan and competitiveness of gear
box Paper presented at the 10th annual conference
and research symposium Mongolia National
University Mongolia
Korea International Trade Association (2013) Trade
statistics data Retrieved from httpwwwkitanet
J Glob Bus Trade Vol 9 No 2 (November 2013) 29-34
29
ISSN 1946-5130
Journal of Global Business and Trade
wwwiagbtcom
The Nature of Competition in an Indian Market Focusing on
the Volume Zone
Tirtha Bahadur Karki
Graduate school of Asian and International Business Strategy Japan
Received 14 June 2013 Revised 12 September 2013 Accepted 2 October 2013
ABSTRACT
Emerging countries are playing a growing role in the world economy It is a role that is expected to be even
greater in the future The recent global financial and economic crisis has further emphasized the stagnation of
most developed economics and taken prominence in emerging economics In particular China and India play
a significant role as global markets Henceforth it is estimated that the Indian volume zone will expand
rapidly and steadily On the other hand Japan and other developed economies tend to be sluggish Therefore
Japanese multinational corporations may have to target Indian volume zone consumers To do so they are
required to change their strategy management and production systems to compete with local and international
rivals in the market because the nature of the competition is totally different in an Indian market than other
developed country However definitions of the volume zone differ among research institutions researchers
countries and urban and local areas which creates considerable differences in the size of markets Thus in
this paper the literature review summaries and compares the definitions of the volume zone first Second this
paper tries to Fig out the most important part of the volume zone which has a key role in making a business
strategy Third differences between developed markets and the Indian market are examined and the nature of
competition in the Indian market is argued Finally the main argument and implication are stated
Keywords competition developed market emerging market Indian market strategy volume zone
Ⅰ Introduction4
There is very significant global interest in the
Indian economy Along with China Brazil Indonesia
and a few other countries India promises great potential
of growth in the next few years and decades The
future of the Indian economy is thus a significant
concern among the global financial and business
community economic policy-makers and managers
multilateral financial institutions economists and
2013 International Academy of Global Business and Trade
All rights reserved
other academics as well as investors and consumers in
India The significant global interest in India is not
surprising It is well known that - on a purchasing
power parity basis ndash India is already at over USD
four trillion of GDP the fourth largest economy in the
world very close to the size of the Japanese economy
the third largest In the next 15 to 18 years this size is
expected to grow as per various studies and estimates
four to five times As a result many foreign investors
and a majority of global companies and businesses are
making a beeline for the Indian market which
The Nature of Competition in an Indian Market Focusing on the Volume Zone
30
promises a booming volume zone5 of a few hundred
million consumers (Fig 1) expanding steadily in the
next few decades
Fig 1 Shares of Global Middle Consumption
2000-2050
Source Kharas (2010)
On the other hand advanced economies including
Japan are slowing down Japan has been in a long
recession with a real GDP growth rate of 39 in 2010
It underlines the world economy shift from developed
nations with their huge populations rising household
incomes and expansion of consumer goods and
service markets toward the emerging economies6
From these perspectives the expansion of the
Indian volume zone has attracted considerable
attention Many Japanese firms have already adjusted
their strategy management and production systems in
order to compete with the Indian volume zone
However there are no official definitions of volume
zone7 and these definitions differ among research
institutions researchers countries and urban and local
areas This creates considerable differences in the size
of volume zone markets Thus the literature review
summarizes and compares the definitions of volume
zone arguements After identifying the important part
of the volume zone (what is the volume zone what is
the trend of the volume zone etc) this paper argues the
differences between developed markets and the Indian
5 It is also called middle class middle income class and
middle income In this paper the middle class is identified as volume zone
6 The countries and consumers team 2010
7 Eric D et al (2007) Kharas (2011)
market which is very useful in knowing the nature of
competition in the Indian market Finally the main
argument and implications are stated
11 Definitions of Volume Zone
There are various definitions of volume zone based
on annual household disposal income annual
household income and expenditure Since the
definition of volume zone is not standardized with
each countryrsquos factors it remains uncertain Thus we
need to define and examine the Indian volume zone
which is most important in order to Fig out a business
strategy
12 Annual Household Disposable Income
The Ministry of Economy Trade and Industry
(2010) Aoshima Kubota and Sakamoto (2009) Japan
research institute (2010) Mizuho Research Institute
(2010) and Yanagawa and Mori (2010) defined the
Asian volume zone including that of India as
comprising people whose annual household disposa-
ble incomes range between $5000 and $35000 (upper
middle class $15001-35000 lower middle class
$5001-$15000 lower class $1000-$5000 the poor
up to $1000) and the rich as those whose annual
household disposable incomes exceed $35000 On the
other hand Indiarsquos National Council of Applied
Economic Research (NCAER report 20052006)
defined the Indian volume zone as comprising people
whose annual household disposable incomes range
between $22320 and $4444 (Rs1000000-Rs200000
at 20012002 price)
Comparing these two definitions of volume zone
(Fig 2) the former defines that the annual household
disposal incomes of people in the volume zone tends to
be higher at $5001 to $35000 and the latter defines
that the incomes of people in the volume zone tends to
be lower at $4444 to $22320
J Glob Bus Trade Vol 9 No 2 (November 2013) 29-34
31
Fig 2 Definitions of Volume Zone by Annual
Household Disposable Income
13 Annual Household Incomes
First the World Bank (2007) and Milanovic and
Yitzhaki (2002) defined the global volume zone as
those with annual household incomes between the
mean incomes of Brazil and Italy that is an annual per
capita income of approximately $4000-$17000 (at
2000 purchasing power parity (PPP)) Second Bhala
(2009) adopted an absolute approach definition with
an annual per capita income of $3900-$113000 in
PPP terms Third Court and Narasimhan (2010)
divided the consumers of developing countries
including India into the following classes on the basis
of their annual household incomes global class
$113000 and above upper middle class $56500-
$113000 middle class $22500-$56499 lower
middle class $13500-$22499 and deprived class
below $13500 From this distribution the middle class
is defined as those with an annual household income of
$13500-$113000 in PPP terms
In order to compare these definitions Fig 3
presents the minimum and maximum annual incomes
that were specified by various researchers Bhala (2009)
specified the minimum annual income as $3900
which is much lower than that specified in other
definitions
Fig 3 Definitions of Volume Zone by Annual
Household Income
14 Expenditure
Some researchers defined the volume zone on the
basis of expenditures In 2007 Banerjee and Duflo
(2007) defined it on the basis of per capita expenditure
between $2-$4day In 2008 they defined the global
volume zone on the basis of per capita expenditure of
$2-$10day in 1993 PPP (Banerjee amp Duflo 2008) On
the other hand Ravallion (2010) defined it on the basis
of per capita expenditure between $2-$13 day Both of
these expenditure based definitions are used only in
emerging economies
Fig 4 Definitions of Volume Zone by Expenditure
These two definitions also show differences since
the higher bound is $10day and $13day In summary
the volume zone is defined differently on the basis of
various standards locations and economies Owing to
its complexity and variety the volume zone consumersrsquo
jobs incomes consumptions lifestyles and subjective
The Nature of Competition in an Indian Market Focusing on the Volume Zone
32
consciousness of the levels of society must also be
considered for defining the Indian volume zone
Ⅱ Catching the Trend
In order to consider the differences between the
definitions of volume zone this paper argues about
most important part of the volume zone to make a
better strategy in business The management team in
business must know about the volume zone but
$3900 or $4000 (Fig 3) in annual household income
does not make a vast difference in its strategy and
consumers lifestyle In relation to the poor by
associating it with an ability to choose to spend time
and money on something other than survival consider
the volume zone in the case of Indian markets where
estimates range from 30 million to approximately 300
million people
The volume zone is not (yet) the biggest segment
of Indiarsquos overall population Given all the attention
focused on Indiarsquos middle class in recent years it is
important to keep a proper perspective on its size and
potential purchasing power Even using the most
generous estimates of the grouprsquos size the volume
zone comprises less than 30 percent of the population
Thus the rich and the poor combined far outweigh the
Indian middle class The importance of the middle
class lies in the fact that it is the fastest growing
segment of the population Evidence shows that as
income increases the amount and variety of this
discretionary spending increases For corporations the
middle class in India thus presents significant business
opportunities The sales growth of consumer goods
such as televisions and mobile phones to the middle
class has already been established Given the
tremendous growth potential an increasing number of
products are being geared towards the volume zone
population In the transport industry which has
traditionally been dominated by rail travel newer cars
like the Tata Nano (which retails for a little over USD
3000) and low-cost airlines have enabled the volume
zone population to be increasingly mobile The growth
of the volume zone and the economic growth of India
are in a virtuous cycle Rising incomes lead to more
consumption which in turn leads to higher economic
growth then more employment opportunities and
subsequently higher wages and the circle starts again
Thus as the volume zone grows and continues to
increase domestic demand the economy will also
continue to grow Regardless of which definition is
correct and certain it is important to keep a proper
perspective on the potential of the volume zone The
volume zone in India has generated tremendous
interest from the media and multinational corporations
are looking for a new market demographic
Ⅲ Developed Markets and the Indian
Market
In recent years Indiarsquos market growth has
outstripped the developed markets In the 80s GDP
growth in developed nations and India was essentially
the same Between 2000 and 2010 average growth in
the Indian market rose to the point where it was three
times higher Besides this India has corruption less
infrastructure fare of terrorism and etc which are
abnormal in a developed country
Consumers in India tend to be more ethnocentric
than those in developed ones Products from the
western hemisphere are seen by Indian cultures as
carrying western values that might harm their society
as well as the local workforce In developed countries
price quality durability and other product-related
aspects are the major factors that influence buying
decisions Consumers in India tend to be less indivi-
dualistic than in developed ones They care more for a
larger local community and like to be identified as part
of it Advertising which exhibits local values and
traditions has a greater impact on consumers of India
whereas the more individualistic consumers from
developed countries are more influenced by adverti-
sing where the product differentiates itself specifically
from other products in the market
J Glob Bus Trade Vol 9 No 2 (November 2013) 29-34
33
These are the common differences between the
Indian market and developed markets Besides these
there are lots of differences between Indian markets
and developed markets
A survey held by the Graduate School of Asian
and International Business strategy8 in October 2011
on the title of ldquoEntry Strategy of the Japanese Firms in
India and Chinardquo shows that Japanese firms in India
are going to change their target from the upper
(wealthy) class to the Volume Zone (Fig 5) In 2011
581 percent of the Japanese firms replied that they are
targeting upper class customers in India By the way
the survey shows only 274 percent of firms were
targeting the upper class after 3 years (2014) and more
firms targeted the middle class Thus we can
understand the Japanese strategies are shifting from the
upper class to the Volume Zone
Fig 5 Shifting Strategy in India
Ⅳ Conclusion
Thus it is clear that the Indian volume zone is
expanding and Japanese companies are shifting their
strategy from the upper class to the volume zone The
problem is the presence of Japanese companies in the
Indian market where Japanese companies are domi-
nated by Korean and European-American companies
8 Principle of Asia University DrIkejima Masahiro
leads the survey
According to Shintaku and Amano (2009) develo-
ped countriesrsquo firms have more strong technology and
find it more difficult to target the volume zone of
emerging markets and to adopt the strategy locally
There is no room to think about if the strong tech-
nology of a company is harmful for its strategy in
emerging markets The problem is how to approach
the volume zone and this is important Specially the
volume zone comes from the lower class and
companies should know their lifestyle and behavior If
firms understand the value of money for the volume
zone they can easily shift their strategy too This helps
them succeed in the Indian volume zone
Finally the conclusion of this paper presents the
hypothesis for further research about how to approach
the volume zone of India The hypothesis is (Fig 6)
ldquoTo compete successfully in the Indian volume zone
firms need to catch the trend of the volume zone and
educate customers construct market infrastructure
train management personnel and understand the
abilities of the supply side are essential This is why
they need to cultivate their resources at a lower level
than they are targeted (volume zone)
This paper cannot include the case study and
cannot examine the strategy That will be further
researched by this author in the future
Fig 6 Possible Way to Succeed in the Volume
Zone of India
The Nature of Competition in an Indian Market Focusing on the Volume Zone
34
References
Akihisa Yahata (2012) IndiaASEAN business guide
Two challenges of market creation in emerging
countries Tokyo Japan Research Institute
Retrieved from httpwwwjricojppagejspid=
22012
Aoshima Minoru Kubota Yosuke amp Sakamoto
Ryohei (2009) Manufacturing for emerging eco-
nomics that has entered the second stage Learning
to emerging economics strategy of electronics
industry focused on the middle of the economic
pyramid Knowledge Creation and Integration
17(12) Nomura Research Institute Retrieved from
httpswwwnricomjpopinionchitekishisan2009
pdfcs20091208pdf
Banerjee A V amp Duflo E (2008) What is middle
class about the middle classes around the world
The journal of economic perspectives a journal of
the American Economic Association 22(2) 3
Bhalla S (2009) The middle class kingdom of India
and China Wasington DC Peterson Institute for
International Economics
Court D amp Narasimhan L (2010) Capturing the
worldrsquos emerging middle class The McKinsey
Quarterly 1-6
Dyck S Hansakul S amp Saxena R (2009)
Emerging Asiarsquos middle class-A force to be
reckoned with (eSocialSciences Working Paper
No 2232) Retrieved from httpeconpapersrepec
orgRePEcesswpaperid2232
Eric D B Diana F amp Adil S Z (2007) Tracking
the growth of Indiarsquos middle class The McKinsey
Quarterly 51-61
Japan Research Institute (2010 October) Chinarsquos eco-
nomic policy debate heats up in run up to party
congress Asia Monthly 10(115) 1-15
Kharas H (2011 June 13) India China middle class
boom faces many challenges FIRSTPOST
Retrieved from httpwwwfirstpostcomworld
china-india-middle-class-boom-24637html
Milanovic B amp Yitzhaki S (2002) Decomposing
world income distribution Does the world have a
middle class Review of Income and Wealth
48(2) 155-178
Ministry of Economy Trade and Industry (2010)
White paper on international economy and trade
2010 Tokyo Author
Mizuho Research Institute (2010) Japan companies
deviating from volume zone market of China and
India (Mizuho Report) Tokyo Author Retrieved
from httpwwwmizuho-ricojppublicationresearch
pdfreportreport10-0407pdf
National Council of Applied Economic Research
(2005) Annual resport 2005 Retrieved from
httpwwwncaerorgdownloadsannualreportsan
nualreport_2005pdf
Shintaku Junjiro amp Amano Tomo (2009) Emerging
market strategies changes in market and resource
strategies The Journal of Economics 75(3) 40-62
Syusuke Watanabe Tokutaro Hiramoto amp Naoya
Tsuaaki (2012) Developing BoP business as the
principal strategy in 70 trillion of emerging and
developing economics Paying the road to a new
market that is expected to reach 55 billion people
Knowledge Creation and Integration 20(1)
Nomura Research Institute Retrieved from
httpswwwnricomjpopinionchitekishisan2012
pdfcs20120103pdf
Shukla R (2010) How India earns spends and saves
unmasking the real India New Delhi India
SAGE Publications India
Ravallion M (2009) The developing worldrsquos bulging
(but vulnerable) ldquomiddle classrdquo World Development
38(4) 445-454
Sridharan E (2004) The growth and sectoral
composition of Indiarsquos middle class Its impact on
the politics of economic liberalization India
Review 3(4) 405-428
Yanagawa Noriyuki amp Mori Naoko (2010) Income
bracket towing Asiarsquos domestic demand (NIRA
Monograph Series No 31) Tokyo National
Institute for Research Advancement Retrieved
from httpwwwniraorjppdfmonograph31pdf
J Glob Bus Trade Vol 9 No 2 (November 2013) 35-44
35
ISSN 1946-5130
Journal of Global Business and Trade
wwwiagbtcom
Analysis of Public Health Expenditures on Leading Causes of
Morbidity in the Philippines
Paul Joseph B Ramireza and
Earl Joanne S Santos
b
b College of Economics and Management University of the Philippines Los Bantildeos Philippines b Corresponding Author College of Economics and Management University of the Philippines Los Bantildeos Philippines
Received 21 August 2013 Revised 25 September 2013 Accepted 29 October 2013
ABSTRACT
Provision of public goods and services is one of the major roles of the government in an economy Some of
the public goods and services that are being provided cause negative effects while others create positive
externalities One evident case of such is the market for health care Aware of its role to provide health care to
the people governments are even more challenged with the remarkable growth of the demand for health care
Furthermore there are market failures existing in the health care sector Given that the paper examined the
effects of public spending on health care specifically on the principal causes of morbidity in the Philippines
Aside from public spending the paper also took into account private health spending in the analysis The
study employed a pooled ordinary least squares regression model Results showed that the increase in
government spending significantly reduce the number of tuberculosis cases in the Philippines On the other
hand results for diarrhea indicated that public spending and number of diarrhea cases are positively related
The findings imply that although an increase in public health expenditures can have a significant impact on
the number of cases of diseases lowering tuberculosis cases for instance the study can be further extended by
valuing as well the other benefits that can be derived from a prevented sickness resulting from an increase in
public health expenditures
Keywords health care morbidity positive externalities public goods public health expenditures
Ⅰ Introduction9
Economics texts suggest different extents to which
the government can intervene in market activities
Classical economists advocate that the main and in
some instances only role of the government is to
ensure peace and order in the economy ie ensuring
property rights are properly defined and laws and
policies are well-enforced Keynesian economists on
the other hand believe that the government has a
2013 International Academy of Global Business and Trade
All rights reserved
significant role as Keynes demonstrated during the
Great Depression At present different economies adopt
different blends of the two extreme cases However
common to all economies is the need for government
intervention in the presence of market failures and
missing markets given that the government can do
better than the market ie such intervention will not
lead to government failures resulting in further
inefficiencies
It is a known fact that one of the major roles of the
government in an economy is the provision of public
goods Paying no attention to it would result in under-
Analysis of Public Health Expenditures on Leading Causes of Morbidity in the Philippines
36
provision of such goods or worse not being provided
at all due to the free-rider problem Another widely
acceptable role of the government is to provide goods
or services that create a positive externality to the
society These goods or services are usually socially
underprovided since the individual in hisher own
private desire to maximize utility doesnrsquot consider the
beneficial effects to the society of such activities
Examples of such services are education and health
care This paper will provide a general overview of the
global demand for health care then focus on the role of
the government in health care provision in the
Philippines
Ⅱ Global Demand for Health Care
The concern for health is a global phenomenon
Despite the costs of health care services the demand
for health care is growing everywhere in the world
The surge of aging and chronic illnesses in the
developed countries and the shooting requirements of
the rising middle class accompanied by the lsquodiseases
of prosperityrsquo in the developing countries are all
driving demand Global pandemics that threaten the
world as well as environmental changes that cause
dramatic health care challenges are also adding up in
the demand for health care services
The rising demand for health care is evidenced by
the increased spending on health services The worldrsquos
total health expenditure as a percentage of Gross
Domestic Product (GDP) grew by 15 from 82 in
2000 to 94 in 2009 (Table 1) The American region
posted the highest growth in health expenditure as a
percentage of GDP at 26 while the South East
Asian region showed the least at 2 The growing
expenditure on health services are born from both the
public and private Public spending on health care is at
least about 50 for most of the countries The
spending has likewise grown by two percentage points
in excess of GDP growth across all Organization for
Economic Co-operation and Development (OECD)
countries for almost 50 years and is expected to be
more than a fifth of GDP by 2050 if the current trend
persists (Drouin et al 2008) As a result government
health agencies together with patients and health care
companies particularly in developing economies are
alarmed with the growth of health care spending
Given its current share of health care expenditures the
government is confronted with other increasing
demands of its people such as education defense and
pensions aside from demand for health care and the
escalating prices of health services
Table 1 Health Expenditure Ratios 2000 and 2009
Region
Total
expenditure on health
as of gross
domestic product
General government
expenditure
on health as of total
expenditure
on health
Private
expenditure on health
as of total
expenditure on health
General government
expenditure
on health as of total
government
expenditure
External
resources for health as
of total
expenditure on health
Social security expenditure on
health as of
general government
expenditure on
health
2000 2009 2000 2009 2000 2009 2000 2009 2000 2009 2000 2009
African Region 55 65 439 493 561 507 82 96 65 102 79 70
Region of the Americas 114 144 451 493 549 507 145 169 01 01 317 720
South-East Asia Region 37 38 319 371 689 629 44 49 09 16 133 144 European Region 80 93 739 749 261 248 140 146 01 01 522 495
Eastern Mediterranean
Region 42 47 472 509 528 491 69 71 10 11 184 194
Western Pacific Region 60 65 639 644 361 356 138 144 02 02 681 686
Global 82 94 563 591 437 408 133 143 03 04 451 595
Source World Health Organization (2012)
J Glob Bus Trade Vol 9 No2 (November 2013) 35-44
37
Moreover health care expenditures are signify-
cantly associated with improved health outcomes with
public health care expenditure having a larger impact
(Navignon et al 2012) Hence health care expendi-
tures are vital to improving the health status of the
society Relatedly Hurley (2000) stated that ldquothe
market failures that pervade the health care sector
create an important role both for non-market
institutions and for normative economic analysis to
help sort the ldquogoodrdquo policies from the ldquobadrdquo Thus
from a public policy perspective it is valuable to know
how a policy variable like public expenditures on
health care affects the principal causes of morbidity
rates
Ⅲ Status of Public Health
Expenditures in the Philippines
Public health expenditures include current and
capital spending from government budgets external
borrowing and grants and social health insurance
funds (HDR 2007) Although Fig 1 shows that the
budget allocated for public health care in the
Philippines is increasing in the past few years Fig 2
shows that compared to other Southeast Asian
countries the Philippines is actually way behind in
terms of public health care spending as percent of GDP
As a matter of fact according to the Human
Development Report (2007) the Philippines is one of
the countries around the world with the lowest
percentage ( of GDP) spent on public health
expenditure at 14 This current condition would
have a significant impact on the health and ultimately
the over-all productivity of the members of society
For instance the results of the study of Granlund (2006)
indicated that public expenditures on health care have
an effect on the number of absence days of individuals
Furthermore the results showed a positive causality
between health care expenditures and the health of the
society (Granlund 2006)
Sources Department of Budget and Management (2001-
2009)
Source Asian Development Bank (2008)
Since the budget for health is much less in the
Philippines as compared to most countries (and can be
safely assumed to be inadequate) the paper would
want to look at the impact on morbidity incidences
from increasing the current public spending on health
Though the study will just be limited to measuring the
impact on morbidity the results can then be used to
derive the value to society of higher public
expenditures in terms of less people afflicted or
infected by various diseases Unlike in the situation
where the public health care expenditure is already
sufficient (or optimal) it will be much easier to
estimate the external cost of inadequate public health
expenditure by measuring the forgone benefits (say it
resulted to an absence) from those people who were
infected In addition the results of the study could be
used to measure the externalities valued in terms of
cost savings if the spread of the disease was prevented
Analysis of Public Health Expenditures on Leading Causes of Morbidity in the Philippines
38
Ⅳ Leading Causes of Morbidity in the
Philippines
Morbidity may be referred as the state of poor
health the degree or severity of a health condition or
an incidence of a disease In the case of the Philippines
the leading cause of morbidity is pneumonia with an
incidence rate of 718 (per 100000 population) Table 2
shows the top ten leading causes of morbidity in 2007
while Fig 3 shows the trend in the number of cases in
the past few years for the major causes of morbidity
Table 2 Ten Leading Causes of Morbidity
Philippines 2007
Disease Number
of cases
Rate per
100000 population
ALRI and Pneumonia 605471 718
Acute Watery Diarrhea 539701 640 BronchitisBronchiolitis 487302 5778
Hypertension 398538 4726
Influenza 349609 4146 TB Respiratory 114714 136
Diseases of the Heart 31331 372
Dengue Fever 23773 282 Malaria 23207 275
Chickenpox 23090 274
Source Department of Health (2002)
Source Department of Health (2002-2007)
From Fig 1 and Fig 3 it seems that the increasing
public health care expenditures didnrsquot lead to a
significant decrease in the leading causes of morbidity
in the past few years However we cannot conclude
this immediately since there are other factors affecting
the number of cases like private health care
expenditures and population growth These other
variables would be considered later in analyzing the
impact of public health care expenditures on the
number of cases
Ⅴ Characteristics of Health Care
According to Hurley (2000) health care is distinct
from other commodities because of health care having
a combination of features that is only present
individually in other commodities Most of these
characteristics result in market failure or missing
markets causing inefficiencies like in the presence of
externalities information asymmetry and uncertainty
In each of these characteristics the government may be
able to minimize the inefficiencies resulting from these
market failures through public expenditures on health
care (which can be looked at as the policy variable of
the government) This somehow justifies the need for
government intervention on health care as a response
to these characteristics of health care
Though it is desirable to be able to disaggregate
public health expenditure as an answer to each of these
characteristics of health care it will not be easy as
policies on public health care usually answer the
inefficiency problem as a whole Thus the study
would focus on the rationale for public health care
expenditure as it provides a positive externality to the
society
51 Health as a Merit Good
A merit good is a good or service that is regarded
as desirable by the society such that the government
intervenes in its provision The idea is that these goods
and services provide positive externality to the society
and if left to individuals would tend to be under-
provided Thus the government can intervene to
correct this under-provision Common examples of
these merit goods are spending on public services such
as public education and public health care
In general the external benefits from health care
can be looked at in various ways According to Hurley
(2000) people may derive external benefit from
knowing that others receive the needed health care
J Glob Bus Trade Vol 9 No2 (November 2013) 35-44
39
services and not just any health care that a person can
afford In addition the externality from health care can
be looked at as the measure of joy (or prevention of
pity) caused by seeing a healthy person rather than a
sick one The problem however with this valuation of
the externality is that such joy or pity cannot be easily
quantified
An alternative way of looking at the positive
externality provided by the adequate (optimal) amount
of spending on public health would be the cost savings
from those who would have been affected if such
public health expenditures were not adequate (optimal)
The obstacle though is finding these cost savings if the
optimal amount of health expenditures is already in
place This is because one cannot predict who among
the millions or billions of people would have been
externally affected if the existing public health
expenditures were not in place In the case of countries
where public health expenditure is still inadequate we
can analyze the cost savings by looking at the effect of
an increase in public health expenditures on the people
who are currently experiencing diseases which may
have been prevented if the optimal level of expenditure
was in place
52 Prevention versus Cure
It is important to consider that the positive exter-
nalities from having optimal health expenditures can
be realized if such expenditures may have prevented
the spread of a communicable disease Thus if most of
the health expenditures were rather used for cures then
these positive externalities as we defined earlier
would not be realized to the fullest It is still important
to take note that cures also result in a positive
externality since it prevents the further spreading of the
disease given the carrier of the disease is cured as soon
as possible The government expenditures on disease
prevention and control and for infectious disease
prevention and control are exhibited in Fig 4 and Fig
5
Sources Department of Budget and Management (2002-
2009)
Sources Department of Budget and Management (2002-
2009)
Note that the sudden increase in the budget
allocated in both Figs during the 2008 and 2009 was
due to the Intensified Disease Prevention and Control
program introduced during 2008 This almost doubled
or tripled the budget allocation to these items as
compared to years before 2008 It is then desirable to
be able to see the impact of this significant increase in
the public health expenditures on the number of cases
however the data on the number of cases for 2008 is
not yet available
53 Communicable versus Non-
communicable Diseases
Externalities provided by the adequate amount of
spending needed for health care is more apparent in the
presence of communicable diseases In addition to the
general external effects discussed earlier communi-
cable diseases have additional external effects via the
probability of a healthy person being infected by the
Analysis of Public Health Expenditures on Leading Causes of Morbidity in the Philippines
40
person carrying a communicable disease Public
health expenditure may then lower this possibility of
infection to healthy people by providing health care for
people who cannot afford the needed medication
The situation under communicable diseases some-
how distorts the utility maximization problem of
individuals since the presence of a sick person implies
a higher chance of being sick also and thus lowers the
utility of the individual This external effect as pointed
out earlier would cause inefficiency if not recognized
Even though the benefits from societal prevention and
cure of communicable diseases are known the
problem changes to what we know as the free-rider
problem if individuals are left alone to solve the
problem
As we all know voluntary contribution would not
solve the problem due to the free-rider problem Free-
riding would be evident since contribution to
prevention doesnrsquot assure the contributor that he will
be the one that will be saved from the disease ie with
the prevention measures we assume that the infected
individuals will be much less but this doesnrsquot
specifically tell who these individuals are Since this is
the case a person may claim that he doesnrsquot need
prevention measures anyway since with or without the
prevention measure his final state will just be the same
(ie two extreme cases very healthy that in the end he
will be healthy or very vulnerable that heshe will
always be affected anyway) It is likewise possible that
people rather than donate may just choose to put this
prevention contribution into private health expendi-
tures by buying vitamins that give additional protection
or immunity This is the reason why public health
expenditure is essential in the case of communicable
diseases
We can then expect a more significant impact of
higher public expenditures on health care on the
number of communicable diseases as compared to
non-communicable diseases because of the additional
benefits from prevented infection Also we can expect
that public expenditures on health will have a lower
impact as compared to private health expenditures on
non-communicable diseases The paper would then
verify these hypotheses
Ⅵ Sources of Data and Analytical
Procedure
61 Sources of Data
The data used in the study were from various
national survey results gathered by various depart-
ments and agencies of the government Data for the
leading causes of morbidity and the number of cases
every year were taken from the Field Health Service
Information System (FHSIS) Annual Report The
FHSIS Annual Report reflects the activities and health
program accomplishments of the Department of
Health in the Philippines for a given year and serves as
a reference for planning and decision-making at the
local and national levels (FHSIS 2004) The FHSIS
also contains statistics on health systems health status
health services coverage and notifiable diseases in the
Philippines For the purposes of this study the data
utilized were the number of cases per region and per
year of the leading causes of morbidity in the
Philippines such as bronchitis tuberculosis influenza
hypertension and diarrhea
Data on Philippine government health care expen-
ditures were taken from the National Expenditure
Program (NEP) The NEP is an annual publication by
the Department of Budget and Management that
contains the details of the governmentrsquos proposed
program and intended to assist Congress in the review
and deliberation of the proposed national budget for
the legislation of the annual appropriations measures
for the succeeding fiscal year (NEP 2003) Annual and
per region data on public health expenditures were
elicited from the national government budget allocated
to the Department of Health Though it is desirable to
be able to split the expenditures into preventive and
curative measures the available data did not have such
information at the regional level
Data on household (private) expenditures for
health care were obtained from the Family Income and
J Glob Bus Trade Vol 9 No2 (November 2013) 35-44
41
Expenditure Survey (FIES) The FIES is a nationwide
survey of households undertaken every three years by
the National Statistics Office that contains data on
family income and expenditure such as levels of
consumption by item of expenditure as well as sources
of income in cash and in kind and provides
information on the levels of living and disparities in
income of Filipino families (FIES 2006) The study
utilized regional data on the average household
expenditure on medical care Data on the population
per region were also taken from the FHSIS Annual
Report while data on the number of households were
taken from the FIES
62 Analytical Procedure
As stated above it is not enough to just look at the
trends of morbidity cases and public expenditure to be
able to assess the impact of the latter to the former
There are other variables such as private health
expenditures and population at that period of time that
may also significantly affect the number of cases The
paper used a pooled ordinary least squares regression
model to analyze the impact of public health care
expenditures on the number of cases for the major
causes of morbidity in the Philippines from 2002-2006
across regions The model is given by
cases = f(pop privexp pubexp) where pop ndash regional population
privexp ndash average household expenditures
on health
pubexp ndash public health expenditures (lsquo000)
It is hypothesized that there is a positive relation-
ship between the number of cases and population On
the other hand a negative relationship between both
private and public expenditures and the number of
cases is expected
Ⅶ Results and Implications
71 Results and Discussion
Results from the empirical models of the different
morbidity causes are reported in Tables 3 and 4 Notice
that only the results for tuberculosis and diarrhea were
reported since neither public nor private expenditures
on health were able to explain the variation in the
number of cases for bronchitis pneumonia influenza
and hypertension
Table 3 Regression Results for Tuberculosis Cases
variable Coefficient standard error p-value
pop 00018028 00001077 0000
privexp -06158907 02659049 0023 pubexp -00059089 00024357 0018
constant 2103315 8129887 0012
Note highly significant at 1 significant at 5
711 Tuberculosis
The regression result showed that the model is
significant and was able to explain 87 of the
variation in tuberculosis cases based on the computed
adjusted R-squared Public and private expenditures on
health care were found to be significant (at 5) in
explaining the variation in the number of tuberculosis
cases while population was found to be highly
significant (at 1) The results conform to the
hypotheses that an increase in both public and private
spending on health care would result to a decline in the
number of tuberculosis cases Also an increase in the
population results in an increase in the number of cases
which was also expected
Estimates showed that on the average an increase
in the population by 555 increases the number of
tuberculosis cases by one Results also showed that an
increase in public health expenditures decreases the
number of tuberculosis cases Specifically the
estimated coefficient implies that on the average an
increase in public health expenditures by PhP169236
would lead to a one unit decrease in the number of
tuberculosis cases With the PhP16 billion total budget
for health in 2006 (PhP154 million of which was
allocated for tuberculosis prevention and control) an
additional 1 increase in government health expendi-
tures would approximately reduce the number of
tuberculosis cases also by 1 for the same year at the
Analysis of Public Health Expenditures on Leading Causes of Morbidity in the Philippines
42
country level In addition estimates showed that an
increase in the average household private expenditure
on health by PhP162 would result in a unit decline of
tuberculosis cases The value seems low at first glance
but this translates to a total of PhP166 million
spending on health for the household sector from the
174 million Filipino families across 17 regions in
2006 necessary to reduce tuberculosis cases by one
Interestingly public health expenditure seems to be
less costly in terms of preventing tuberculosis cases in
the country This is due to the fact that majority of
tuberculosis cases are experienced by poorer
households that rely more on public health care rather
than private health care which they cannot afford
Public health expenditures are also ideal for
tuberculosis cases because of the ancillary benefits
these provide by preventing the spread of this
communicable disease among the population
Table 4 Regression Results for Diarrhea Cases
variable coefficient standard error p-value
pop 00073148 00007181 0000
privexp -5919509 1773756 0001
pubexp 00385644 00162475 0020 constant 9123934 5423155 0097
Note highly significant at 1 significant at 5
712 Diarrhea
The regression result showed that the model is
significant and was able to explain 70 of the varia-
tion in diarrhea cases based on the computed adjusted
R-squared Public expenditures on health care were
found to be significant (at 5) in explaining the
variation in the number of diarrhea cases while
population and private expenditures on health care
were found to be highly significant (at 1) The results
conform to the hypothesis that an increase private
spending on health care would result in a decline in the
number of diarrhea cases while an increase in the
population results to an increase in the number of cases
However public health care expenditure and the
number of diarrhea cases were found to be positively
related One possible explanation for this result is that
public expenditure on health may be more oriented to
communicable diseases than non-communicable
diseases ie compared with the results of tuberculosis
In addition there are other significant factors that may
be affecting the prevalence of diarrhea which are not
incorporated in the public health care expenditures say
the availability of or access to safe drinking water
among others
Nevertheless results showed that an increase in the
average household private expenditure on health by
PhP017 or equivalently a total of PhP0174 million
spending on health for the household sector would
result in a unit decrease in the number of diarrhea cases
Estimates also showed that on the average an increase
in the population by 137 increases the number of
diarrhea cases by one in the country Results also
showed that an increase in public health expenditures
decreases the number of tuberculosis cases
72 Conclusions Implications and Further
Studies
The result of the study showed that public
expenditures on health care have a significant effect on
the number of tuberculosis cases in the Philippines
Although results for the other cases show that public
expenditure failed to explain the variation in the
number of cases it may be attributed to the unavaila-
bility of disaggregated data allocated for specific
diseases in each region This then can be considered as
the limitation of the study Nonetheless the results of
the study can be used to provide a rationale for the
abrupt increase in the spending for disease prevention
and control for 2008 and 2009
As pointed out earlier the result of the study can be
further extended by valuing the benefits that can be
derived from a prevented sickness resulting from an
increase in public health expenditures The benefits
may include the loss income from being absent
because of the disease and the prevented private
expenditures to prevent the disease Of course the
general external effects of being healthy or seeing a
healthy person may also be included as part of these
benefits These non-marketed goods which are
J Glob Bus Trade Vol 9 No2 (November 2013) 35-44
43
common to the health sector can be measured using
contingent valuation methods such as willingness-to-
pay (Hurley 2000) Knowing these benefits one can
then do a cost-benefit analysis of an increase in public
expenditure on health care Thus if the net benefits
that can be derived from a prevention of a tuberculosis
case is higher than PhP169236 which is the cost of
preventing it then it is rational for the government to
pursue an increase in public health care expenditure
References
Asian Development Bank (2008) Key indicators for
Asia and the Pacific 2008 Manila Author
Retrieved from httpwwwadborgsitesdefault
filespublication27728key-indicators-2008pdf
Connelly L B (2004) Economics and health
promotion The European Journal of Health
Economics (Formerly HEPAC) 5(3) 236-242
Chicago
Department of Budget and Management (nd)
Budget of expenditures and sources of financing
2000-2008 [Webpage] Retrieved from www
dbmgovph
Department of Budget and Management (2001)
Republic of the Philippines national expenditure
program 2001 Manila Author Retrieved from
httpwwwdbmgovph
Department of Budget and Management (2002)
Republic of the Philippines national expenditure
program 2002 Manila Author Retrieved from
httpwwwdbmgovph
Department of Budget and Management (2003)
Republic of the Philippines national expenditure
program 2003 Manila Author Retrieved from
httpwwwdbmgovph
Department of Budget and Management (2004)
Republic of the Philippines national expenditure
program 2004 Manila Author Retrieved from
httpwwwdbmgovph
Department of Budget and Management (2005)
Republic of the Philippines national expenditure
program 2005 Manila Author Retrieved from
httpwwwdbmgovph
Department of Budget and Management (2006)
Republic of the Philippines national expenditure
program 2006 Manila Author Retrieved from
httpwwwdbmgovph
Department of Budget and Management (2007)
Republic of the Philippines national expenditure
program 2007 Manila Author Retrieved from
httpwwwdbmgovph
Department of Budget and Management (2008)
Republic of the Philippines national expenditure
program 2008 Manila Author Retrieved from
httpwwwdbmgovph
Department of Budget and Management (2009)
Republic of the Philippines national expenditure
program 2009 Manila Author Retrieved from
httpwwwdbmgovph
Department of Health (2002) Field health service
information system annual report 2002 Manila
Author Retrieved from httpwwwdohgovph
sitesdefaultfilespublicationsFIELD20HEALT
H20SERVICE20INFORMATION20SYST
EM20ANNUAL20REPORT202002pdf
Department of Health (2003) Field health service
information system annual report 2003 Manila
Author Retrieved from httpwwwdohgovph
sitesdefaultfilespublicationsFIELD20HEALT
H20SERVICE20INFORMATION20SYST
EM20ANNUAL20REPORT202003_0pdf
Department of Health (2004) Field health service
information system annual report 2004 Manila
Author Retrieved from httpwwwdohgovph
sitesdefaultfilespublicationsFIELD20HEALT
H20SERVICE20INFORMATION20SYST
EM20ANNUAL20REPORT202004pdf
Department of Health (2005) Field health service
information system annual report 2005 Manila
Author Retrieved from httpwwwdohgovph
sitesdefaultfilespublicationsFIELD20HEALT
H20SERVICE20INFORMATION20SYST
EM20ANNUAL20REPORT202005_0pdf
Analysis of Public Health Expenditures on Leading Causes of Morbidity in the Philippines
44
Department of Health (2006) Field health service
information system annual report 2006 Manila
Author Retrieved from httpwwwdohgovph
sitesdefaultfilespublicationsFIELD20HEALT
H20SERVICE20INFORMATION20SYST
EM20ANNUAL20REPORT202006pdf
Department of Health (2007) Field health service
information system annual report 2007 Manila
Author Retrieved from httpwwwdohgovph
sitesdefaultfilespublicationsFIELD20HEALT
H20SERVICE20INFORMATION20SYST
EM20ANNUAL20REPORT202007_1pdf
Drouin J P Hediger V Henke N Kanzler L
Leydon E F amp De Santis P (2008) The Health
Care Century Health International 7 6-17
Granlund D (2006) The effect of health care expen-
ditures on sickness absence Paper Presented at the
Inaugural Biennial Conference of American Society
of Health Economists 2006 Madison WI
University of Wisconsin
Hurley J (2000) An overview of the normative
economics of the health sector Handbook of
Health Economics 1 55-118
Novignon J Olakojo S A amp Nonvignon J (2012)
The effects of public and private health care
expenditure on health status in sub-Saharan Africa
New evidence from panel data analysis Health
Economics Review 2(1) 1-8
Philippine Statistics Authority (nd) Family income
and expenditures survey 2000 2003 2006
[Webpage] Retrieved from wwwcensusgovph
United Nations (2007) Human development report
Retrieved from wwwhdrundporg
World Health Organization (2007) National health
accounts 2007 Geneva Author Retrieved from
httpwwwwhointen
World Health Organization (2012) World health
statistics 2012 Geneva Author Retrieved from
httpwwwwhointen
J Glob Bus Trade Vol 9 No 2 (November 2013) 45-60
45
ISSN 1946-5130
Journal of Global Business and Trade
wwwiagbtcom
Analysis of the Interests of Conceiving a Free Trade
Agreement between China and South Korea
Liu Zuankuoa and Zhan Baiming
b
a Shandong Normal University China b South-Central University for Nationalities China
Received 25 August 2013 Revised 22 September 2013 Accepted 28 October 2013
ABSTRACT
Based on the ldquoStarting Joint Minister Statement on free trade agreement between China and South Koreardquo
the article explains the basic ideas of this agreement It shows that there are some distinctive differences
between the statement and the theoretical study on interests China pays more attention to the diplomatic
significance rather than in trade While South Korea aims to guarantee its investment benefits by this
agreement both stations try to protect their producersrsquo benefits Finally this paper using the model GTAP
(Global Trade Analysis Project) puts forward two sets of simulation schemes and forecasts the economic
effects of the Free Trade Zones from the macroeconomics and welfare effects trade effects and industry
effects
Keywords analysis of benefits China-South Korea free trade agreement construction
Ⅰ Introduction10
Minister of Commerce Chen Deming and South
Korean Trade Minister Park Tae-ho attended the
China-ROK Trade Ministers Meeting in Beijing on
May 2nd 2012 and announced the official initiation of
China-ROK Free Trade Agreement negotiations on the
Ministersrsquo Joint Statement (referred to as ldquoStatementrdquo
as following) From the Free Trade Agreement (FTA)
we can see the basic ideas of the interest demands of
the Statement
The statement explains the basic ideas of the FTA
which includes trade in goods services investment
and other fields The interest demands reflected in the
2013 International Academy of Global Business and Trade
All rights reserved
Statement includes two aspects trade and investment
From the perspective of trade benefits the two
countries agreed that levels of trade liberalization in
good and service trades should go beyond those
promised levels in the WTO However there are some
sensitive product issues in the goods trade which
include lists of generally sensitive and highly sensitive
products From the perspective of investment benefits
the level and scope of liberalization were defined
according to both countriesrsquo investment arrangement at
present and in future Meanwhile the overseas
processing zones should be involved in China-ROK
FTA
Analysis of the Interests of Conceiving a Free Trade Agreement between China and South Korea
46
Table 1 MFN Tariff Levels of China and South Korea in Product Category ()
Category of products
China Korea
Average tax rate
Free tax rate Maximum Tax rate
Average tax rate
Free tax rate Maximum Tax rate
Livestock products 148 101 25 221 24 89 Milk products 120 0 20 675 0 176
Fruit Vegetable 148 59 30 574 02 887 Coffee Green tea 147 0 32 539 0 514 Grain 243 34 65 1345 03 800 Oilseed animal fat oil 110 53 30 370 41 630
Sugar Sweet 274 0 50 168 125 243
Drinks Cigarette 223 22 65 317 0 270 Cotton 152 0 40 00 1000 0 Other agricultural products 114 94 38 161 183 754 Fish and its products 109 63 23 161 07 50 Minerals Metals 74 87 50 46 269 8 Petro 48 200 9 41 107 8 Chemistry 66 16 47 57 67 321 Wood Paper 44 353 20 22 675 10 Textile 96 0 38 91 15 13 Cloth 160 0 25 126 0 13
Leather Shoes 132 06 25 79 26 16 Non-electrical machinery 80 90 35 60 226 13 Electronic machinery 83 240 35 62 214 13 Transportation equipment 115 08 45 55 268 10 Other products 119 96 35 67 160 13
Source World Trade Organization (nd)
The level of goods liberalization of the two
countries can be judged from WTO World Customs
Data 2011 In 2010 the simple average MFN tariffs
on agricultural and non-agricultural product imports
were 156 and 87 respectively while the simple
average MFN rates applied to Korea on agricultural
and non-agricultural products exports were 164 and
88 The simple average MFN tariffs on Korean
agricultural products and non-agricultural products
import were 485 and 66 while the MFN rates applied
to China on its agricultural products and non-
agricultural products export were 521 and 66 The
MFN import tariff rate of China and Korea divided by
product category is given via Table 1
Via Table 1 we can see that South Korea paid
more attention to protecting agricultural products (tax
rate 485) than industrial products (tax rate 66)
Therersquos a more than 40 percent difference in the simple
average MFN tariff On Chinarsquos part therersquos no big
difference between agricultural product protection
(156) and industrial product protection (87) the
gap of the simple average MFN tariff between these is
less than 10 percent Meanwhile South Korearsquos
protection on agricultural products (485) is much
higher than Chinarsquos (164) As for industrial product
protection there is a gap between China (156) and
South Korea (66) but the gap in industrial (9 or
so) is not as big as that shown in agricultural products
with a tax rate gap 42
From above it shows that the profit that China
benefits from the FTA mainly depends on the degree of
liberalization of agricultural products of South Korea
If this is the important part of South Korearsquos sensitive
products then the attitude expressed in the joint
statement ldquobeyond goods liberalization level of WTO
commitmentsrdquo has not displayed real significant trade
interests
In other words the previous various theoretical
insights on the China-Korea FTA are not the same as
the benefit idea implied in the statement
J Glob Bus Trade Vol 9 No 2 (November 2013) 45-60
47
Ⅱ Literature Review
With regard to the interests in the FTA negotiations
between China and South Korea Chinese scholars are
generally optimistic about the economic and trade
effects of the bilateral free trade agreement Xue Jing-
xiao and Zhang Bo-wei (2004) believed that Chinarsquos
GDP would grow if China and South Korea were to
establish a free trade area Huang Peng and Wang Jian-
xin (2010) analyze the potential effect of applying
GTAP in constructing a free trade zone between China
and South Korea which indicates that after the
fulfillment of the China-ROK FTA the two countriesrsquo
GDP and components such as consumption
investment government expenditure and so on
compared to the base period all experienced positive
growth South Korea obtains a greater benefit with a
growth rate of 207 while Chinarsquos only 018 Song
Jingen (2011) on the basis of a traditional trade gravity
model studied the effects on trade after the two
countries signed the free trade agreement The results
show that China and South Korearsquos agreement played
a strong role in promoting the trade of both countries
and the total volume of trade would increase nearly
60 He suggests that both countries should pay
attention to the opportunities brought by the agreement
when they are protecting their sensitive sectors Li
Xiao-feng and Gui Jia-yue (2009) based on partial
equilibrium estimates the effects of the establishment
of the China-ROK Free Trade Zone on bilateral trade
flows from the industrial level The simulated results
show that if China and Korea do not established a free
trade zone to a larger extent trade between China and
South Korea would be heavily influenced by the trade
diversion from the Korea-US Free Trade Zone If the
two countries establish a free trade zone it will be
more conducive to the development of comparative
advantages of both countries
Analysis of academic research on China-ROK free
trade agreements has a more rigorous theoretical
condition namely the import tariffs of all goods should
be canceled in the China-ROK FTZ Before the
implementation of the FTZ the higher the tariff is the
greater the increase of imports caused by the tariff
reductions will be From the perspective of exports
before the completion of a bilateral free trade zone the
higher the tariff of partner country is the greater the
exporterrsquos export growth will be after establishment
The joint statement announced by the ministers of
China and the ROK showed that on the one hand the
level of liberalization of trade in goods should
transcend their level of commitment in the WTO On
the other hand the problems of sensitive products
should be a concern A longer transitional period
partial concessions and exceptions should be used to
handle sensitive product issues It is not known which
products are arranged for a longer transition period
partial concessions or exceptions but it will greatly
reduce the expected trade benefits by theoretical study
because the theoretical results used free trade and tariff
barrier elimination as a precondition Meanwhile
when both countries regard their disadvantaged
industries as sensitive products to go beyond the
commitment level in the WTO as agreed in the joint
statement will be quite limited in the scope Thus the
domains of free trade will be relatively small
Professor Yorizumi Watanabe (2009) of Keio
University in Japan analyzed the historical significance
of the FTA among China Japan and South Korea and
pointed out that China makes free trade agreement
policies for three reasons on foreign affairs and
commercial intercourse First in maintaining the
double-digit rapid development in economy China has
become the ldquoworld factoryrdquo and it is imperative to
ensure the market of related industries Second China
has become a world power so it needs to show
Southeast Asian countries an image of a ldquogood
partnerrdquo so as to avoid being seen as a threat Third by
means of drawing those overseas Chinese who have
engaged in long-term economic activities in the
neighboring countries China formed the ldquoGreater
China Rimrdquo and turned it into Chinarsquos powerful
ldquoperipheryrdquo
The interpretation of the motives of Chinarsquos
making of free trade agreement policies by Professor
Watanabe made people feel that Chinarsquos interest
Analysis of the Interests of Conceiving a Free Trade Agreement between China and South Korea
48
demand consists of two aspects commercial inter-
course and diplomacy However regardless of the
relationship of bilabial trade between China and Japan
or between China and South Korea Chinarsquos
advantages in industry are mainly on textiles clothing
leather shoes and other products but the tariff rates of
Chinarsquos MFN of such goods are higher than those of
South Korea and Japan Meanwhile the Chinese
mainlandrsquos ldquoworld factoryrdquo status is a product of the
processing trade China has been acting the role of
assembling and integration in the East Asian labor
division system and the commodities in bilateral trade
between Sino-Korea and Sino-Japan are mainly
constituted by the intermediate input products This
means that Chinarsquos participation in the construction of
the FTZ with Japan and South Korea is not to ensure
the market of related industry and thus its trade
interests are far less than the diplomatic interests which
Professor Watanabe referred to Economists of South
Korea predict that the FTZ has a very large impact on
the Korean economy while there is a relatively small
impact on China For China the strategic goal of the
China and South Korea FTZ is greater than economic
significance while for South Korea the motivation of
getting economic interests is stronger China promoted
the China-ROK FTZ in order to ensure a dominant
position within the East Asian region which cannot
only impact America who took advantage of allies in
Asia to constrain China but also rely on the regional
group to enhance Chinarsquos status in the international
political situation and the multilateral system (Zheng
Zhi-shu 2009)
The interest that South Korea obtained from the
China-ROK FTA depends on the degree of liberali-
zation of Chinese industrial products If Chinese
industrial products constitute a major part of the
sensitive products in China the trade interest of South
Korea would not be significant So the motives of
South Korea negotiating bilateral free trade agreements
with China does not come from trade but from the
following that will be discussed in the third part of the
international investment interests
Ⅲ The Benefit Analysis
31 The balance of Investment Interests and
Trade Interests
Before China and the ROK passed the ldquothe
Associate Ministerial Statement of Starting China-
Korea Free Trade Agreement Negotiationsrdquo China
Japan and the ROK held investment agreement
negotiations in Beijing reached an agreement on all
the remaining issues in the investment agreement and
drafted the agreement on March 21st 2012 Three
parties said they would soon complete their internal
procedures so as to sign the agreement as soon as
possible
From the view of the sequence of time the
successful termination of negotiations on investment
agreements among China Japan and ROK preceded
the starting of negotiations on a bilateral FTA between
China and ROK This indicates that relative to the free
trade agreement the three countries are more
concerned about investment agreements or that South
Korea is keener on the investment issues among the
three countries or between the two countries South
Korean President Lee Myung-bak said that in the
investment agreements among the three countries the
dispute settlement mechanism was included between
the investors and the host country which can provide
legal protection for investors if they suffer a loss on
investment in the host country
Meanwhile the joint statements of two countries
also made clear the important position of investment in
the FTA In the area of investment for proper handling
of issues related to bilateral investment between the
two countries they will confirm the level and scope of
liberalization and take the current and future bilateral
investment-related arrangements into account
When the international economic integration has
developed both in scope and in depth from trade to
international production many bilateral and regional
free trade agreements reflected the feature of the trade
and investment integration such as the North
American Free Trade Agreement In most cases the
J Glob Bus Trade Vol 9 No 2 (November 2013) 45-60
49
countries that are dominant in international investment
will make use of the form of the FTZ to protect its
interests of overseas investments from losses
In terms of the structure of bilateral trade in goods
between China and ROK Korearsquos exports to China
mainly consist of productive goods Table 2 shows
classified by BEC the imports and exports of Chinarsquos
trade in goods to the ROK
Table 2 shows that during the 13 years from 1998
to 2010 among the types of Chinese and South
Korean BEC commodities the following conclusions
can be made according to the changing of exports and
imports of capital goods intermediate goods and
consumer goods
First the imports and exports of intermediate
goods in the cargo trade between China and the ROK
come in on top According to the SNArsquos three basic
categories of goods the annual average import and
export composition ratio of intermediate goods capital
goods and consumer goods trade between China and
Korea were respectively 722 164 and 112
Relative to capital goods and consumer goods the
exceeding ratio balances of intermediate goods trade
value are respectively 56 and 60 percentage points
Table 2 China amp South Korea Goods Trade Structure 1995-2010 (Classified by BEC)
(Unit Hundred Million Dollars)
Intermediate
Goods
Exports
Intermediate
Goods
Imports
Consumer
Goods
Exports
Consumer
Goods
Imports
Capital
Goods
Exports
Capital
Goods
Imports
1995 50 85 14 4 3 13
1998 43 134 12 5 8 11
1999 51 154 17 5 10 13
2000 73 204 25 6 15 22
2001 72 200 33 6 19 28
2002 90 217 43 7 22 61
2003 118 311 51 7 31 108
2004 167 455 61 11 49 153
2005 226 590 66 13 58 161
2006 296 702 83 15 65 173
2007 388 797 94 18 81 213
2008 508 869 96 19 132 223
2009 321 784 76 15 135 212
2010 421 1051 97 24 166 289
Source United Nations Statistics Division (nd)
From the composition of exports and imports
among all of Chinarsquos exports to South Korea the
annual average rates of intermediate goods capital
goods and consumer goods were respectively 642
202 and 155 The rates of these three types of
goods in Chinarsquos annual imports from South Korea
were respectively 803 174 and 22 For
intermediate goods the proportion of Chinarsquos exports
to South Korea is less than that of imports from South
Korea and the balance is up more than ten percentage
points
Second the proportion of the goods used for
production in the cargo trade is much higher than that
of the consumption part In Economics capital is
defined as the products that are produced by the
economic system itself and used as input factors so as
to further produce more products and labor service
According to the basic principles of economics
capital goods and intermediate goods with the
characteristics of production can be considered inputs
for the production of capital goods Statistics show that
the sum of annual import and export proportion is
nearly 886 leaving less than 12 to consumer
goods The very low proportion of consumer goods
trade between China and South Korea shows us the
Analysis of the Interests of Conceiving a Free Trade Agreement between China and South Korea
50
basic characteristics of the internationalization of
production behind the commodity trade structure
Regarding Chinese goods exported to South
Korea the annual average proportion of goods which
had entered the production process was 798 and
continued to rise from 784 in 1995 to 811 in
2005 and to 857 in 2010
Meanwhile the goods that China imported from
South Korea have a higher proportion for production
use and the annual average is almost up to 979 In
1995 the share was 956 and since 2003 its share
has always remained above 98
The proportion (approximately 98) of Chinarsquos
imports of productive goods from Korea is 18 higher
than that (about 80) of Chinarsquos exports indicating
that the degree of Chinarsquos dependence on South Korea
is higher than South Korea on China
Central Bank of Korea (June 14 2011 ) released
the ldquo2010 South Korean Current Account Balancerdquo
which said that the export growth of semiconductors
machinery precision machinery and other goods are
increasing significantly and the trade surplus to China
of such goods is increasing from $3697 billion to
$5104 billion
The formation of this kind of trade structure to a
large extent can be explained reasonably by South
Korearsquos direct investment in China From the
perspective of the trade of intermediate goods Li
Xian-zhu (2010) Ye Jing-yi and Wang Pei (2005)
explained the trade imbalance between China and
South Korea When analyzing the Korean chronic
surplus phenomenon in long term they pointed out
that one of the reasons is that there are many Korean
investment enterprises in China and most are
processing companies required to purchase a large
number of Korean raw materials and accessories for
processing The import of the raw materials and
accessories required by Chinarsquos processing trade is
mentioned above that is Chinese importation of
intermediate goods by BEC classification Some
scholars explained the trade imbalance from the point
of capital goods trade that South Korea has a
competitive advantage in the production of capital
goods that when coupled with the adjacent location is
conducive to reduce transportation costs and thus
South Korea has become one of the main countries for
China to get capital goods from for processing trade
which expanded the size of imports from Korea (Zhao
Fang amp Li Ji 2010)
Statistics show that from 1998 to 2010 among the
foreign direct investments divided by countries and
geographical areas Japan and South Korea have
always been Chinarsquos major source countries for foreign
investment Except those years of the financial crisis
(1998 2008-2009) the proportion of Japan and South
Korearsquos direct investment in China accounted for 13 -
20 For example in 2005 South Korearsquos direct invest-
ment was up to 5168340000 US dollars accounting
for 86 of Chinarsquos total $60324590000rsquos absorption
of foreign investment Japanrsquos direct investments were
6529770000 US dollars accounting for 1082
South Korearsquos direct investment is mainly in the
manufacturing industry By 2005 South Korean
investment in China is mainly focused on the
manufacturing and assembly of electronic appliances
textiles and clothing leasing and business services
food and beverage and retail industries among which
manufacturing accounted for dominance (Yang Li amp
Zhou Wenfeng 2008 ) However in the manufacturing
sector the investment structure of South Korea has a
tendency of changing from the consumer goods
industry including fiber clothing food manufacturing
leather footwear and others to capital goods industries
including electronic communications petrochemical
alloy machinery and equipment and others (Zang Xin
Dong Rongrong amp Cui Yan 2006)
In order to protect the interests of foreign invest-
ment one of the conditions that Japan and South
Korea agreed to in the China-Japan-Korea FTZ nego-
tiation was the signing of ldquoCJK investment agree-
mentsrdquo The tripartite negotiations started in 2007 with
content that included all the important aspects
contained in the international investment agreements
including such clauses as the definition of investment
scope of application MFNT national treatment
J Glob Bus Trade Vol 9 No 2 (November 2013) 45-60
51
expropriation transfer subrogation taxes general
exceptions and dispute resolution
32 The Balance of the Interests of Producers
and Consumers
According to the Yonhap News Agency on
January 12th 2012 the foreign minister of South
Korean Park Taeho said at a press conference held in
the central government office that China as a big
country made a lot of people worried that Korearsquos
agriculture might be pounded South Korea was not
going to allow massive Chinese agricultural products
into South Korea Before starting the China-ROK FTA
negotiations the Korean Government would fully
listen to the views of different fields
Table 3 The Share of South Korearsquos Agriculture in the National Economy 1998-2010
()
Agricultural Labor
Manufacturing Labor
Labor Services Agricultural
Output Manufacturing
Output Services Output
1998 019 2405 4081 336 4511 4044
1999 019 2406 4081 328 4645 4015 2000 017 2453 4087 297 4736 4015
2001 017 2421 4079 287 4557 4182
2002 016 2323 4103 262 4490 4282 2003 016 2316 3989 243 4480 4241
2004 014 2306 3884 239 4727 4034
2005 015 2278 3795 219 4794 4013 2006 014 2165 3468 209 4801 4032
2007 014 2092 345 195 4818 4033
2008 012 2012 3444 184 5064 3833 2009 013 1944 3484 194 4960 3912
2010 013 1909 3484 178 5211 3739
Source Database provided by Korearsquos Banks
Compared with the manufacturing and service
industries the proportion of South Korearsquos agriculture
is not so significant in the national economy The
proportion of employees in the total economic activity
decreased from 019 in 1998 down to 013 in 2010
and the proportion of the total value of agricultural
production in GDP decreased from 336 in 1998
down to 178 in 2010 If the China-ROK FTA finally
regarded the South Korearsquos agriculture as sensitive
products and put it outside the free trade it is no doubt
that this is only to protect the benefits of very few
agricultural producers by sacrificing the interests of
many other consumers
Let us observe the issues of Chinese sensitive
products Chinese Commerce Minister Chen Deming
said that the sensitive products taken into account in
the process of negotiation were related to agriculture in
Korea and Chinarsquos petrochemical electronics
machinery and other fields
Not completely identical to the situation of South
Korearsquos agriculture in the national economy from 1998
to 2010 the ratio of employees in Chinese petroche-
mical electronics and mechanical industries among the
countryrsquos total employment is not high but there is a
rising trend In 1998 Chinese petrochemical and
machinery industry employment accounted for 088
and 157 respectively of the countryrsquos total
employment In 2010 this proportion respectively rose
to 154 and 388
Similarly the ratio of the petrochemical and
mechanical fields in GDP also showed an increasing
trend and its share enlarged In 1998 the ratios were
135 and 213 In 2010 the ratios respectively
increased to 614 and 1173
Table 4 shows that Chinarsquos petrochemical and
machinery industries are growing and developing
rapidly From the production valuersquos movements of
ratio in GDP we can see that from 1998 to 2010 these
Analysis of the Interests of Conceiving a Free Trade Agreement between China and South Korea
52
two sectors in initial stages accounted for 348 of
GDP and by 2005 641
Chinese petrochemical products cover a wide
range of sectors In Chinarsquos Statistical Yearbook they
included the petroleum processing and coking industry
chemical materials and products manufacturing
chemical fiber manufacturing rubber and plastic
products industry Electronic and mechanical fields are
statistically included in machinery and equipment
involving manufacturing industries in common
equipment special equipment transportation
equipment electrical machinery and equipment
electronic and communications equipment instrument
and apparatus and office machinery
Table 4 The Share of Chinese Petrochemical and Machinery Industriesrsquo in the National Economy 1998-2010
()
Petrochemical Industry
Labor Proportion Machinery Industry Labor Proportion
Petrochemical IndustrialGDP
Machinery IndustrialGDP
1998 088 157 135 213
1999 081 145 139 222 2000 074 133 160 240
2001 068 124 155 253
2002 065 121 158 282 2003 098 191 178 340
2004 101 209 224 423
2005 113 244 230 411 2006 119 266 483 883
2007 127 296 554 1028
2008 141 344 608 1119 2009 143 344 547 1059
2010 154 388 614 1173
Source ChinaStatistics (2011)
Chinarsquos petrochemical and machinery accounted
for a high ratio in GDP The number of the labor force
in these two industries was not big and their sum share
is no more than 6 (542 in 2005) in the whole
national economy Thinking about it another way from
the perspective of proportion of factors Zhan Boming
and others (2010) observed and analyzed Chinarsquos
industrial enterprisesrsquo inclination in investment They
found that investment made by state-owned
petrochemical and machinery enterprises have capital
intensive investment tendencies and the investment of
the three-kind investment enterprises in these two
industries are petrochemical capital intensive while
labor-intensive industries including machinery and
transportation equipment manufacturing electronic
and communication equipment manufacturing The
fact means that the idea of separating the Chinese
petrochemical and machinery from the China - Korea
Free Trade Agreement negotiations are to protect those
investorsrsquo interests at the expense of the interests of
numerous consumers
If the Chinese petrochemical products and
machinery products are to be put outside the China-
Korea Free Trade Agreement as sensitive products and
South Korearsquos agricultural sector is also separated
from China-Korea free trade agreement then we can
say such a bilateral free trade agreement almost has no
sense of free trade
Ⅳ Simulation Analysis of the
Economic Effects of China-Korea
FTA
A GTAP model is used in this part to predict the
economic effects if the China-Korea free trade zone is
established
41 Basic Structure of the Model
The GTAP model was developed by Professor
Tomas W Hertel of Purdue University as a multi-
J Glob Bus Trade Vol 9 No 2 (November 2013) 45-60
53
national and multi-sector general equilibrium model
and it has been widely used in trade policy analysis In
the GTAP model framework first sub-models that can
detail description of each countryrsquos (or regionrsquos)
production consumption government spending and so
on are created and then the various sub-models are
combined into a multi-national and multi-sector
general equilibrium model through international
merchandise trade relations When using this model
framework for policy simulation it can also be used to
explore the changes that the policy brings in each
nation and sectorrsquos production import and export
commodity prices supply and demand factors
elements of remuneration GDP and the level of social
welfare
42 Basic Assumptions
421 Conditions of Factors
There are five different types of elements in the
model land capital skilled labor unskilled labor and
natural resources A GTAP model assumes that the
market is perfectly competitive the scale of production
unchanged and each product produced by using
nested constant coefficient to replace elasticity equa-
tion The intermediate inputs consist of domestic and
foreign products through constant coefficient instead of
elasticity equation The products (domestic and import
goods) of different regions are non-homogeneous and
therefore cannot be replaced with each other In the
factor market land among departments is not
completely mobile so the price of land for different
uses is different while the labor in the country is
allowed to flow freely Each country has only one
account to which all the income tax and endowments
are accumulated Then through the Cobb-Douglas
Utility Function income is divided into private
consumption savings and government consumption
by a fixed proportion In a GTAP model there are two
imaginary international departments which are
International Bank and International Traffic Each
countryrsquos savings are accumulated to an International
Bank being allocated among countries according to
the rate of capital return The International Traffic
Department can balance the differences between CIF
and FOB and link the world through bilateral trade
422 Conditions of Behavioral Agents
There are three kinds of typical behavior agents in
the model private departments government
departments and firms
4221 Behavior of Private Department
In private expenditure the private sector consump-
tion expenditure has the nature of non-homothetic
order and should include the impact of population
growth the private department sets levels by using a
CDE Utility Function on a per capita basis Private
department behavior equation
① Private Household Utility
② CompoSITC Demand
③ CompoSITC Tradeable
In these equations yp (r) stands for the regional
units of the private sector household expenditure of r
region ppriv (r) stands for the price index of private
sector household unit consumption expenditure of r
region UELAS stands for the relative utility costs and
elasticity pop (r) stands for the population of r region
qp (i r) stands for the demands of i product in r
regional private department unit EP (i k r) stands for
the cross-price flexibility between irsquos demands and krsquos
price in r regional household unit EY (i r) stands for
the demand of composite commodity i in r regional
household unit pp (i s) stands for the demand price of
integrated trade commodity i in a private household
unit of s region PMSHR (i s) stands for the share that
Analysis of the Interests of Conceiving a Free Trade Agreement between China and South Korea
54
the total imports in the private sector demand for
domestic products of s region ESUBD (i) stands for
the elasticity of substitution between domestic and
imported good i ppd (i s) stands for the demand price
of commodity i in s regional private department unit
qpd (i s) stands for the demand of the national product
i in s regional private department unit ppm (i s) stands
for the demand price for import integrated trade
commodity i in s regional private department unit
qpm (i s) stands for the import demand of product i in
s regional private department unit
4222 Behavior of Government Department
The total government expenditure allocates
between the various commodities via using a Cobb-
Douglas Utility Function This makes the government
expenditure on various commodities of their total
remains constant In an open system the governmentrsquos
demands can be divided into domestic products and
imported products and both of the products form an
integrated product through the CES Function
Government department action equation
① Government Utility
② Demand for CompoSITC Goods
③ CompoSITC Tradeable
In these equations yg (r) stands for the regional
government expenditure of r region pop (r) stands for
population of r region pgov (r) stands for the
consumption expenditures price index of government
departments in r region ug (r) stands for the average
capital expenditure utility level per people from the
government spending in r region VGA (i r) stands for
the expenditure buying i goods in r regional
government departments GOVEXP (r) stands for the
consumer spending in r regional government
departments pg (i r) stands for the demand price of
comprehensive trade i product in r regional
government departments qg (i r) stands for the
demand of i goods in r regional government
departments GMSHR (i s) stands for the government
departmentrsquos share of demand for national products in
total imports in s region pgd (i s) stands for the
demand price of domestic integrated i good in s
regional government departments qgd (i s) stands for
the demand of domestic i product in s regional
government departments pgm (i s) stands for the
demand price of imported comprehensive trade i good
in s regional government departments qgm (i s)
stands for the imported demands of i product in s
regional government departments ESUBD (i) stands
for the elasticity of substitution between domestic
goods and imported goods
4223 Behavior of the Firm
GTAP model assumes that manufacturers use Tree
Structure in the production function Firmsrsquo main
inputs can be divided into the original inputs and
intermediate inputs Suppose the production function
has the characteristics of divisibility and fixed scale
compensation Under the divisibility assumption
firmsrsquo decisions on the most appropriate volume of
original input is not influenced by the changing of
intermediate input price and quite reverse is true
Meanwhile under the assumption of fixed scale
compensation the proportion of factor input of firms
will not be influenced by the changes in production
volume either
On the top of Tree Structure it shows firmsrsquo
decisions of demand between intermediate inputs and
integrated original inputs Under the assumption of the
Leontief Function it shows a fixed proportional rela-
tionship between the intermediate input and original
comprehensive input and total output This is common
in general design of CGE model of which the main
advantage is that it can reduce the number of para-
meters needed to estimate in the model significantly
The bottom left part of the Tree describes the
J Glob Bus Trade Vol 9 No 2 (November 2013) 45-60
55
relationship between the original investment and
production
Assume that the relationship between the original
input and the production is CES Function and the
elasticity of substitution between different original
elements is equal Accordingly sum up the original
inputs in order to obtain the Aggregate Primary Input
At the bottom right part of the Tree Structure it shows
the relationship between the intermediate input and
production which consists of two sides First is the
substitution relationship between the domestic
products and comprehensive imported products
assuming both compose into integrated intermediate
goods through CES Function Second is the
substitution relationship among different sources of
imported intermediate goods assuming which are also
integrated through the CES Function Behavior of
Firm equation
① CompoSITC Intermediate Nest
② Valuemdashadded Nest
③ Total Output Nest
In these equations pf (i j r) and qf (i j r) stands
for the price and demand of i product while producing
j good in r region af (i j r) stands for the technological
change of original feature i in j industry of r region
FMSHR (i j r) stands for the share that r regionrsquos total
imports among the demand for domestic compre-
hensive products pfm (i j s) stands for the demand
price of integrated commodity i in j industry of s
region qfm (i j s) stands for the firmsrsquo total demands
of imports pfd (i j r) stands for the demand price of
domestic comprehensive commodity i in j industry of r
region qfd (i j s) stands for the firmsrsquo demand for
domestic products ESUBD (i) stands for the elasticity
of substitution between domestic and imported goods
pva (j r) stands for the added-value price of producing
j good in r region qva (j r ) stands for the added-value
of j industry in r region ava (j r) stands for the
technological changes of the added-value in j industry
of r region SVA (k j r) stands for the share of added-
value product i in j industry of r region pfe (i j r)
stands for the price of original element i which needed
to produce j product of r region qfe (i j r) stands for
the demand of original element i which needed to
produce j product of r region afe (i j r) stands for the
technological changes of original element i in j
industry of r region ESUBVA (j) stands for the
elasticity of substitution between original elements
during the added-value production in j industry qo (j r)
stands for the output of j department of r region ao (j r)
stands for the technological changes of output in j
department of r region ps (j r) stands for the supply
price of j product in r region ESUBT (j) stands for the
elasticity of substitution of intermediate inputs while
producing j product
423 Equilibrium Condition
A GTAP model assumes a regional household unit
includes a private department and government
department to determine the consumer behavior and
savings behavior of the private department and
government department in the country or region The
Model can be divided into a Closed System and an
Open System Without the government intervention in
a Closed System the income of regional household
unit comes from the reward of selling its own elements
to the firm Firmrsquos incomes come from the purchase of
each householdrsquos expenditure and every manufacturer
also makes money by selling their intermediate goods
All economic behavior expenditures and incomes are
equal Balance of a single country Closed System is
established by the accounting identities and market
equilibrium formula In an Open System due to the
Analysis of the Interests of Conceiving a Free Trade Agreement between China and South Korea
56
joining of foreign departments the government
expenditure and the private spending in local regional
department will be divided into two parts buying
domestic products and imported products
Furthermore some parts of firmrsquos intermediate raw
materials may also be imported and its products are
sold both domestically and abroad
Regional household unitsrsquo behaviors are basically
determined by Aggregate Utility Function which
consists of government expenditure private spending
and savings It is assumed the per capita Cobb-
Douglas Utility Function is adopted and this regional
household unit pursues the utility maximum of a
household unit As a result of using the Cobb-Douglas
Utility Function the proportion of three kinds of
current consumptions that were mentioned above is
fixed
43 The Analysis Method and the Simulation
Program
This article uses the seventh edition GTAP model
which includes 113 countries and 57 sectors In the
model the author combines 113 countries or regions
into three regions China Korea and other parts of the
world 57 industry sectors will be divided into 10 kinds
of product groups 1) food and crops 2) livestock and
meat products 3) forest rivers coal natural gas and
other minerals 4) processed foods 5) Textiles and
clothing 6) light manufacturing 7) heavy industry 8)
Utilities and construction 9) Transportation and
communication 10) other services
In order to fully investigate the effects of trade
liberalization this paper intends to respectively
measure the economic effects of a free trade zone
under two kinds of tax reductions program one
simulates a ldquozero tariff base scenariordquo under the
condition that both China and Korea have a full range
cancellation of goods trade tariffs In program 2
considering the protection of its sensitive industry with
the exceptions of Korearsquos high tariffs on food and crop
departments and the exception of Chinarsquos industrial
sector (light manufacturing and heavy industry) other
department tariff reductions will be by half
44 Simulation and Results of Analysis
441 Economic and Welfare Effects
According to model calculation results (shown in
table 5) we can see from the aspects of GDP growth
In program one after the completion of the China-
Korea free trade zone GDP in both China and Korea
show growth compared to the base period Korea
benefits more with a GDP increase of 139 billion
dollars and a growth rate of 206 China only
increases 25 billion dollars and the growth rate is
015 In program two the GDP of both China and
Korea shows growth compared with the base period
too respectively rising 74 and $540 million
considerably less than the GDP growth in program one
with full exemption of import tariffs This is because
program two still has different levels of trade
protection which leads to inefficient allocation of
resources After the establishment of a free trade zone
in the program one and program two countries with
larger benefits are different Korea benefits more in
program one China benefits more in program two
This is because the two countries have the same tax
reduction in program one Because the trade barriers
between Korea and the other countries in the world are
lower and according to the customs alliance theory
the lower the trade barriers between the Customs
Alliance member countries and other countries in the
world are the establishment of a customs alliance is
less likely to cause more costly trade transfers Under
the condition of full reduction and exemption of tariffs
and zero tariffs China may show a bigger trade
transfer effect thus Korea benefits more In program
two because of the protection for the sensitive food
and crop industry the allocation of resources is less
efficient in Korea
From the point of changes in the countryrsquos welfare
total welfare increases 4964 billion dollars in Korea in
program one while China reduces 653 million dollars
Korearsquos welfare increase is mainly caused by the
improved resource distribution efficiency and trade
conditions Chinarsquos entire welfare reduction is because
of the larger trade diversion effect In program two
J Glob Bus Trade Vol 9 No 2 (November 2013) 45-60
57
both two countriesrsquo welfare increases with Chinarsquos
growth of 189 million dollars and Korearsquos 65 million
dollars Compared to program one the increasing
volume of Korearsquos welfare significantly drops largely
because of Korearsquos high tariffs on food and crop
protection which results in a lower efficiency of
resource allocation
From the view of other regions in the world either
in program one or program two the GDP and welfare
decline at different degrees This means establishing a
free trade zone no matter what level of tax reduction
is conducive to economic growth for member
countries but this will bring adverse changes for those
regions excluded in the free trade zone
From the above analysis the establishment of
China-Korean free trade zone will promote the growth
of the national economy and social welfare regardless
of what level of tax reduction but for other regions in
the world it will bring a negative adverse change
Table 5 Changes of the Economy and Welfare in Different Programs ()
Program One Program Two
Change of GDP
Change Rate of
GDP
Welfare (million of
US dollars)
Change of GDP
Change Rate of
GDP
Welfare (million of US
dollars)
China Korea
Other regions in the world
25051 139023
-277225
015 206
-007
-65303 496385
-42123
74118 54328
-380194
005 008
-001
18941 16497
-15370
Source Compiled according to the result of Rung TAP operation
442 Trade Effects
According to the results of the model calculation
(shown in Table 6) it shows whether canceling all
import tariffs on goods or protecting part of industry by
cancellation of part of tariffs the bilateral trade has an
increase The exports and imports of other regions in
the world experienced varying degrees of reduction
Chinarsquos total economic output is larger so the
establishment of a China-Korea FTZ has less impact
on Chinarsquos import and export level as on Korearsquos The
tax reduction level in program two is not as large as in
program one and in program two some industries are
protected So compared to the program one trade
barriers cause lower efficiency in resource distribution
and the impact on imports and exports is smaller than
in program one
From the terms of the changes in trade either in
program one or program two the China-Korea free
trade zone improves the membersrsquo trade condition to
some degree Specifically Korea benefits more This is
because Korea has more open trade liberalization
whose tariffs on main trade products have been
reduced to a very low level According to the customs
alliance theory the lower the trade barriers between the
Customs Alliance member countries and other regions
in the world is the establishment of a customs alliance
is less likely to cause more costly trade transfers so the
establishment of a China-Korea free trade zone has
little impact on Korearsquos trade transfer and Korea
benefits more from the changes in trade condition than
China
For the other regions in the world under both
kinds of tax reduction and exemption programs there
are different degrees of reduction in import and export
trade conditions indicating that although the establi-
shment of a free trade zone can increase imports and
exports and improve trade conditions for member
countries it can cause an adverse trade effect for the
non-member countries elsewhere in the world
Through the above analysis we can see that after
the establishment of China-Korea free trade zone
regardless of the extent of tax reduction and exemption
it will promote the imports and exports and foreign
trade conditions within the zone but may cause
adverse trade effects on other regions outside it
Analysis of the Interests of Conceiving a Free Trade Agreement between China and South Korea
58
Table 6 Changes of Trade Effects in Different Program ()
Program one Program two
Export Import Trade Condition Export Import Trade Condition
China
Korea The rest of the world
181
244 -002
229
564 -01
005
14 -004
016
028 -00018
021
046 -0006
002
005 -0003
Source compiled according to the result of Rung TAP operation
443 Industry Effects
According to the model calculation results (shown
in Table 7) shown in program one establishing the
free trade zone has a great impact on specific industry
sectors in China and Korea Chinarsquos sectors with
increased output mainly concentrate in the primary
sector products among which the agricultural sector
takes the largest increase reaching 268 while the
industrial sectors (light manufacturing and heavy
industries) decrease slightly In general Chinarsquos sector
output changes but the rate of change is not large In
contrast there is a big difference in sector output
changes between departments in Korea Because of the
restriction of resources geography population and
other natural endowments sectors with reduced output
in Korea are concentrated in the primary sector
particularly in the agricultural sector with a significant
reduction of 2009 much greater than the changes in
other sectors Sectors with output increases concentrate
in the industrial product sectors among which textiles
and clothing sector are the most outstanding with a
927 increase The other regions in the world have a
slight growth in light manufacturing but the outputs of
other sectors experience different degrees of decline
In program two every country protects its weak
industries and the tax reductions are less than in
program one The change rates in industry output of
the two countries is not big except for Chinarsquos textile
and clothing industry which has a slight rise other
changes all decline compared to program one
Although in program two Chinarsquos protection of light
manufacturing and heavy industry help to slow the
decrease of industrial output we can see from Table 7
that China rsquos output of these two industries still
declines indicating that to enhance the level of
industrial development trade protection is not always
feasible It is fundamental to work hard on solving
problems such as low-end industrial structure low
technology in production lack of innovation and etc
Korearsquos protection of agriculture shows a better effect
the output change rate of Korearsquos food and crop
industry decreased from 2009 to 004 Due to
Korearsquos protection of agricultural products Chinarsquos
increased output in food and crop industry changes
from 268 up to 0161
Through the above analysis it can be concluded
that after the establishment of a China-Korea free trade
zone regardless the degrees of tax reduction and
exemption the output will be improved with the
optimization and upgrading of industries For the other
regions in the world it brings adverse impacts
Table7 The Output Changes of Sub-sectors in Program One and Program Two ()
Program one Program two
China Korea Other regions China Korea Other regions
Food and Crop
Livestock and meat products Forest rivers and coal
Natural gas and other minerals
Processed foods Textile and clothing
Light manufacturing
Heavy industries
268
056 031
114 004
-036
-025
-2009
-012 -144
-095 927
034
162
-035
-009 -004
-011 -032
001
-003
0161
0114 0137
0479 0274
-005
-008
-004
-015 -027
-082 534
-017
-018
-0008
-0009 -0027
-0019 -0233
0007
0015
J Glob Bus Trade Vol 9 No 2 (November 2013) 45-60
59
Public utilities construction
Transport and communications Other services
038
009 01
412
155 247
-009
-004 -006
0042
002 0037
023
006 011
-0006
-0005 -0005
Source compiled according to the result of Rung TAP operation
Ⅴ Conclusions
Based on the ldquoStarting Joint Minister Statement on
free trade agreement between China and South Koreardquo
the article explains the basic ideas of this agreement
Through the analysis of the investment interests and
trade interests of China and Korea it finds that
intermediate import and export products in China and
Korea trade rank first and the goods trade in
production is considerably higher than that in
consumption This formation of structure of goods
trade can be reasonably explained by Korearsquos direct
investment in China Through the analysis of
producersrsquo interests and the consumers in China and
Korea it finds that if China and Korea reach a free
trade agreement that excludes Korearsquos agriculture from
free trade as a sensitive product it will sacrifice the
majority of consumersrsquo interests and only protects the
interests of minor agricultural producers If Chinarsquos
petrochemical and machinery are separated from
China-Korea free trade agreement negotiations it will
also sacrifice the majority of consumersrsquo interests and
only protect the investorsrsquo interests Therefore it
shows firstly the insight on interests is significantly
different between the declaration and theoretical
research Secondly Chinarsquos diplomatic interests are
bigger than its trade significance and Korea protects its
investment interests in China through trade agreements
Thirdly both countries are trying to protect their
producersrsquo interests through trade agreements
Finally this paper uses the global trade analysis
project (Global Trade Analysis Project GTAP) model
and proposes ldquofull abolition of trade in goods tariffs
between China and Koreardquo and ldquoKorearsquos exceptions
on its high tariff food and crop sectors Chinarsquos
exceptions on industrial sector (light manufacturing
and heavy industry) and tariffs on other sectors
reduced by halfrdquo It predicts the economic benefits of
China-Korean free trade zone by two sets of simulation
programs from three aspects macroeconomic and
welfare effects trade effects as well as industry effects
It finds that after the establishment of a China-Korean
free trade zone regardless the level of tax reduction it
will promote the growth of the national economy and
improve the social welfare and import and export
Trade conditions and output will be improved with
industrial optimization and upgrading of industries in
two countries For the other regions in the world it will
bring negative and adverse changes
References
Baiming Z Jiang Y amp Maohong L (2010) Biased
investment by state-owned and foreign enterprises
and its production-trade effect Wuhan University
Journal (Philosophy amp Social Sciences) 2010(1)
117-124
ChinaStatistics (2011) China Statistical Yearbook
of 2011 Central Hong Kong Author Retrieved
from httpwwwchinastatisticsnetchina-
statistical-yearbook-2011-m-23html
Fang Z H A O amp Ji L I (2010) A research on
trade status and intra-industry trade between China
and South Korea Journal of Jilin Normal Uni-
versity (Humanities amp Social Science Edition)
2010(4) 52-56
Jianxin H P W (2010) The design of FTA nego-
tiation strategy between China and Korea based on
GTAP simulation World Economy Study 2010(6)
81-86
Li Y amp Zhou W F (2008) The investment from
Korea to China The present situation trend and
Chinarsquos policies Economic Research Guide
2008(3) 158-160
Analysis of the Interests of Conceiving a Free Trade Agreement between China and South Korea
60
Li X F amp Gui J X (2009) An empirical analysis of
the impact of the establishment of China-Korea
FTA on bilateral trade International Economics
and Trade Research 2009(5) 4-8
Li X Z (2010) The trade between China and Korea
and its structure change International Studies
2010(6) 48-52
Song J G (2011) The study of free trade agreement
between China and South Korea based on the
gravity model Contemporary Economic Research
2011(5) 81-85
United Nations Statistics Division (nd) Commodity
Trade statistics database New York NY Author
Retrieved from httpcomtradeunorgdata
Watanabe (2009) The possibility about the FTA
among Japan Korea and China The Economist
2009(12) 5-12
World Trade Organization (nd) World Customs
Data 2011 Retrieved from httpwwwwtoorg
statistics
Xin Z Rong R D amp Yan C (2006) An empirical
analysis of the influence about the direct
investment from Japanese South Korean to China
on the scale and industry Journal of International
Trade 2006(10) 44-50
Xue J X amp Zhang B (2004) The economic coope-
ration arrangements in East Asia A comparative
study based on the general equilibrium model The
Journal of World Economy 2004(6) 51-59
Ye J Y amp Wang P (2005) The analysis of the trade
deficit between China and Korea Economic
Science 2005(1) 115-126
Zheng Z S (2009) The strategic motivation com-
parison of FTA promotion between China and
Korea Commercial Times 2009(33) 35-36
J Glob Bus Trade Vol 9 No 2 (November 2013) 61-71
61
ISSN 1946-5130
Journal of Global Business and Trade
wwwiagbtcom
Stock Market Development and Economic Growth the Case
of the Philippine Stock Market
Princess Jace N Sta Mariaa and Agham C Cuevas
b
ab College of Economics and Management University of the Philippines Los Bantildeos Philippines
Received 25 August 2013 Revised 27 September 2013 Accepted 30 October 2013
ABSTRACT
The general objective of this study is to analyze the level of stock market development of the Philippine Stock
Exchange as reflected by its liquidity position and its implications to economic growth in the Philippines
Stock market liquidity was analyzed through its three liquidity measurements turnover ratio total value of
traded shares ratio and the market size ratio This study used Ordinary Least Squares (OLS) in analyzing the
relationship between stock market liquidity and economic growth using quarterly data from 1996 to 2012
Stock market liquidity as measured by the growth in value of traded shares and the growth in market size is
significantly related to the growth of the economy after controlling for variables such as inflation which
lagged by one period growth in foreign direct investment and openness to trade Further analysis showed that
the growth in market size causes economic growth However the determinant of the growth in value of traded
shares does not exhibit Granger causality but is proven to have a long run relationship as shown from the
results of the Error Correction Model
Keywords economic growth Philippine stock exchange stock market development stock market liquidity
Ⅰ Introduction11
Financial markets and intermediaries play a
significant role in the growth of the economy by
improving financial efficiency that would in turn
provide better allocation of resources As savers or
lenders hold current consumption for future expendi-
ture borrowers desire current consumption or invest-
ment that would eventually yield higher returns in the
future These institutions are responsible for main-
taining a healthy monetary economy in the country as
they mobilize and convert savings into funds and
channel them to borrowers or investors to further
2013 International Academy of Global Business and Trade
All rights reserved
allocate them to more productive investments
(Mishkin 2006) An efficient stable and vibrant stock
market is essential to the development of the financial
sector Stock markets are responsible for the expansion
of a companyrsquos capital by allowing stocks or shares to
be sold or traded in public
Kanasro Jalbani and Junejo (2009) stated that
stock markets play a crucial role in capital mobilization
and provide secondary markets for the investors and
financial institutions to buy and sell securities A stock
market is considered to be liquid when large
transactions are executed with only a small impact on
prices of securities Stock market liquidity is thus
considered a good tool to measure the efficiency of a
stock market A marketrsquos stability is also determined
Stock Market Development and Economic Growth the Case of the Philippine Stock Market
62
through the liquidity of its securities or the ease at
which these securities are bought or sold in the market
The Philippine Stock Exchange (PSE) the sole
stock market of the Philippines was established on
December 23 1993 when the respective founders of
both the Manila Stock Exchange (MSE) and the
Makati Stock Exchange (MKSE) decided to combine
the two exchanges to further develop a more efficient
capital market During the past decade the PSE has
been robust in terms of the daily value traded Both
foreign and domestic market capitalization which is
the measure of the size of listed companies in the stock
market has been increasing since 2002 In January
2013 the Philippine Stock Exchange index (PSEi) the
indicator used to measure the performance of active
and highly capitalized listed Philippine companies in
the PSE breached the 6000 level an all-time high in
Philippine stock market history
The general objective of the study is to analyze the
liquidity of the Philippine stock market and its
implications for economic growth Liquidity is
important as it is an aspect of a stock market that is
necessary for the traders to interact Specifically the
study aims to measure the liquidity of the Philippine
stock market and evaluate its trends for the given
period determine the linkages between stock market
liquidity and growth of the economy and determine the
causality between stock market development and
economic growth in the Philippines
The paper is organized as follows The next two
sections review the related literature followed by the
analytical and empirical framework The fourth section
discusses the results while the last section provides the
conclusion
Ⅱ Review of Related Literature
21 Stock Market Development as a
Determinant of Economic Growth
Several studies have been conducted on the
relevance of stock market development to economic
growth As cited by Petros (nd) the stock market
provides the fulcrum for capital market activities and it
is often cited as a barometer of business direction An
active stock market may be relied upon to measure
changes in general economic activities using the stock
market index (Obadan 1995) According to Petros
(nd) directly or indirectly a stock market through its
specific services can contribute to economic growth
Mobilization of savings creation of liquidity risk
diversification improved dissemination and acquisi-
tion of information and enhanced incentive for cor-
porate control are functions that are notably significant
thus by improving the efficiency and effectiveness of
these functions it can amplify the economic growth
rate
Tapitan (2012) highlighted the role of financial
intermediaries as a prerequisite for economic growth as
they play an important role in technological progress
The financial system affects capital accumulation by
altering the saving or by reallocating savings among
different capital producing technologies The key
assumption is that better technology is produced as a
by-product of capital investment
Capital investments are important in boosting the
growth of the countryrsquos economy As cited by Nagai-
shi (1999) Levine (1997) identified two channels in
which financial markets or intermediaries affect
economic growth through capital accumulation and
technological innovation In 1999 Garcia and Liu
(1999) identified three main channels through which
financial markets and intermediaries may affect
economic growth The first is by stimulating savings
Financial markets or intermediaries provide savers
with a relatively higher yield McKinnon (1973) and
Shaw (1973) (as cited by Garcia amp Liu 1999) claimed
that financial deepening improves not only produc-
tivity of capital but also the saving rate and therefore
investment and growth Second this can be done by
reducing information and transactions costs because
we know that high transaction costs would definitely
have a negative effect on trading for these discourage
people from transacting thus affecting onersquos profit
Lastly by promoting an efficient allocation of invest-
ment the allocation of resources is improved
J Glob Bus Trade Vol 9 No 2 (November 2013) 61-71
63
22 Stock Market Liquidity
Stahel (2004) (as cited by Benić amp Frani 2008)
argues that due to stock market integration investors
would tend to move their capital to where they expect
higher returns on their investments Von Wyss (2004)
(as cited by Benić amp Frani) defined four aspects or
dimensions of financial market liquidity the trading
time tightness depth and resiliency These dimen-
sions of liquidity may be presented with five different
levels of liquidity 1) the ability to trade at all 2) the
ability to buy or to sell a certain amount of an asset
with an influence on the quoted price 3) the ability to
buy or to sell a certain amount of an asset without any
influence on the quoted price 4) the ability to buy and
to sell an asset at about the same price at the same time
and 5) the ability to execute a transaction from points
two to four immediately
Sarr and Lybek (2002) claim that illiquid markets
are more of a symptom rather than a cause of
inadequate market functioning They posit that in order
to foster liquid financial markets sound and
transparent economic policies with appropriately
designed trading clearing and settlement systems as
well as appropriate intervention policies of the central
bank which can help contain systematic risk are the
only sustainable solution
Levine and Zervos (1998) investigated whether
measures of stock market liquidity size volatility and
integration with world capital markets are robustly
correlated with current and future rates of economic
growth capital accumulation productivity improve-
ments and saving rates They used data on 49
countries from the period 1976 to 1993 They
evaluated whether the stock market indicators together
with banking development are correlated with the
growth indicators Stock market development
indicators include the size in which capitalization is
measured by the value of listed domestic shares on
domestic exchanges divided by GDP the liquidity
which is measured by the turnover ratio and the value
traded ratio Using the international capital asset
pricing model (CAPM) and international arbitrage
pricing theory (APT) they concluded that stock market
liquidity and banking development are both positively
and robustly correlated with contemporaneous and
future rates of economic growth capital accumulation
and productivity growth Also both a stock market and
banks provide different financial services that could
actually help the economy as a whole On the other
hand based on their study they find no support that
these indicators reduce private savings rate or hinder
long run growth
Levine (1996) tested the liquidity of stock markets
for 38 countries (1976-1993) that include both Indus-
trial and developing countries Three measurements for
liquidity were used the total value of shares traded on
a countryrsquos stock exchanges as a share of GDP the
value of traded shares as a percentage of total market
capitalization or the turnover ratio and the value-
traded-ratio divided by stock price volatility He
claimed that a liquid market should be able to handle
heavy trading without large price swings Thus
empirically stock market size and volatility do not
matter but the ease of which shares can be traded The
results suggest that stock market liquidity helps
forecast economic growth even after accounting for a
variety of nonfinancial factors that influence economic
growth Stock market liquidity is still a reliable
indicator of future long term growth after controlling
for inflation fiscal policy political stability education
the efficiency of the legal system exchange rate policy
and openness to international trade
Ⅲ Analytical and Empirical
Framework
Stock markets contribute in easing financial
activities as well as guiding the countryrsquos firms and
investors to allocate their funds efficiently Levine
(1996) showed that countries that had more liquid
stock markets enjoyed both faster rates of capital
accumulation and greater productivity gains Stock
markets through creation of liquidity affect economic
activity by less risky investment in equity markets
which allows savers to acquire assets and quickly sell
Stock Market Development and Economic Growth the Case of the Philippine Stock Market
64
them As Fig 1 shows liquid markets improve capital
allocation that would in turn enhance growth in the
economy
Levine (2003) identified three core sources of
theoretically ambiguous relationships between econo-
mic growth and stock market liquidity He first stated
that stock market liquidity lowers the risk of investing
in longer-run higher return projects and in
consequence fosters a growth-accelerating reallocation
of capital The lower risk however affects savings and
capital accumulation rates ambiguously so that
aggregate growth will slow if savings rate fall enough
Second the cost of investing in the long run is lower
Higher rate of return on savings affects savings and
capital accumulation rates ambiguously so that growth
will fall if capital accumulation rates fall enough
Finally stock market liquidity affects incentives for
investors to undertake the costly processes of
researching and monitoring firms and managers
ambiguously Liquidity will affect growth positively if
stock market liquidity encourages agents to evaluate
and exert corporate control
31 Measures of Stock Market Liquidity
The study adopted two measurements of liquidity
used by Kanasro et al (2009) to determine the
efficiency of the Philippine stock market through
liquidity of its shares Stock market liquidity is
hypothesized to be
SML = f (TVTS MSIZE) (1)
Where
SML -- Stock Market Liquidity
TVTS -- Total Value of Traded Shares Ratio
MSIZE -- Market Size Ratio
The Total Value of Traded Shares Ratio (TVTS)
measures the value of equity transactions relative to the
size of the economy The formula for computing the
total value of traded shares ratio is as follows
TVTS = Total Value of Traded Shares
Gross Domestic Product (2)
The Market Size Ratio (MSIZE) measures the size
of the Philippine Stock Exchange in accordance with
the market capitalization as the ratio of GDP of the
Philippines during the sample period
MSIZE = Gross Domestic Product (3)
Market Capitalization
Fig 1 Schematic Diagram for Stock Market
Liquidity and Economic Growth (Levine
1996)
32 Empirical Model
To analyze the relationship between the liquidity of
the Philippine Stock Exchange (PSE) and economic
growth in the Philippines the two measures for stock
market liquidity in logarithm form were regressed to
the logarithm of Gross Domestic Product (LNGDP)
together with the other factors that influence economic
J Glob Bus Trade Vol 9 No 2 (November 2013) 61-71
65
growth using Ordinary Least Squares (OLS) This
study also adopted the regression model of Levine
(2003) Nurudeen (2009) and Mohtadi and Agarwal
(nd) The model directly examined the relationship
between stock market liquidity and economic growth
The regression model is as follows
LNGDP = β0 + β1 LN (TVTS) + β 2 LN (MSIZE)
+ β3 LN (OPEN) + β4 LN (FDI)
+ β4 (INFLAG) + μ (4)
Where
LNGDP -growth in Gross Domestic Product
LNTVTS-growth in Total Value of Traded
Shares Ratio
LNMSIZE-growth in Market Size Ratio
LNOPEN -growth in Openness to Trade
LNFDI-growth in Foreign Direct Investment
INFLAG-Inflation Rate lagged by one period
β-parameter of the indicators
micro-the error term
The variables in the model above are defined as
follows LNGDP refers to economic growth and it is
measured as the logarithm of the real GDP The
LNTVTS is the growth in Total Value of Traded
Shares Ratio and it is measured by dividing the total
value of traded shares with the gross domestic product
and transformed to its natural logarithm The
LNMSIZE is the growth in Market Size Ratio
measured by dividing the gross domestic product to
the market capitalization and transformed to its natural
logarithm LNOPEN refers to the growth in openness
to trade and it is measured by tariff revenues which is
measured by tariff rate multiplied by imports divided
by the sum of imports and exports and transformed to
its natural logarithm LNFDI refers to growth in
foreign direct investment INFLAG is the inflation rate
lagged by one period and μ is the error term
It is hypothesized that an increase in the growth in
total value of traded shares and market size should
increase the growth of the economy The variables
LNOPEN LNFDI INFLAG were used as control
variables to gauge the strength of the correlation
between stock market liquidity and economic growth
for the given period The inflation rate lagged by one
period (INFLAG) is the percentage rate of the change
in the general changes in the price level thus it
measures the monetary instability that negatively
affects economic performance Its lagged effect was
assigned to serve as a proxy for expected future
inflation Foreign direct investment (FDI) was
expected to augment savings and increase the rates of
capital accumulation giving a positive relationship to
economic growth Openness to trade (OPEN) refers to
the openness to international trade of the economy as
trade openness fosters competition in global markets it
was expected that its growth will have a positive
relationship with economic growth
Ⅳ Results and Discussion
This study used a simple Ordinary Least Squares
(OLS) method to determine and further analyze the
relationship between the level of stock market
development as proxied by liquidity position of the
Philippine stock market and economic growth It also
attempted to provide evidence on the existence of a
long run relationship between stock market
development and economic growth through the use of
the Granger Causality test
41 Liquidity of the Philippine Stock
Exchange
The Turnover Ratio measures the value of equity
transactions relative to the market size A high turnover
is an indicator of low transaction cost (Levine amp
Zervos 1998) The turnover position of the Philippine
Stock Exchange has experienced fluctuations The
Ramos administration (1992-1998) experienced a
steady growth in the economy during which the
Philippines Stock Exchange (PSE) was unified
However due to the 1997 Asian financial crisis its
performance declined Under the administration of
Stock Market Development and Economic Growth the Case of the Philippine Stock Market
66
Estrada a decline in the performance in the PSE can be
seen From a 1262 turnover ratio in 1999 it declined
to 218 in 2000 due to poor governance and
economic policies that affected the confidence among
potential investors The economic reforms and policies
under the Arroyo administration improved growth in
the economy giving stock market significant inflows
gaining back investorsrsquo confidence Due to different
problems that the economy experienced coupled with
the global crisis as shown in Fig 2 the trend continued
to be volatile The average turnover ratio of PSE is
380 during the sample period
The Total Value of Traded Shares Ratio (TVTS)
measures the value of equity transactions relative to the
size of the economy There are significant jumps in the
liquidity (total value of shares traded to GDP) in the
last six years Its TVTS ratio has grown to almost 28
The overall average liquidity during the sample period
is 65
Fig 2 Liquidity at Philippine Stock Exchange
(PSE) using Turnover Ratio (TOR) and
Total Value of Traded Shares (TVTS)
The Market Size (MSIZE) measures the size of the
Philippine Stock Exchange in accordance with the
market capitalization as the ratio of GDP of the
Philippines during the sample period As shown in Fig
3 the size of the PSE remained very small from the
year 1996-1999 which had about 3-5 until 2000
when it increased to almost 40 The 1997 Asian
financial crisis caused instability in the financial sector
and only a few companiesrsquo securities were listed The
overall average size of the market has remained only
254 of GDP which seemed to be low in comparison
with other developing markets Since the unification of
the Makati Stock Exchange and the Manila Stock
Exchange in 1993 the Philippine Stock Exchange has
remained relatively small As of May 2012 there are
344 listed companies in the PSE
Fig 3 Liquidity at the Philippine Stock Exchange
using Market Size (MSIZE)
42 Regression Results
The study used 67 observations from the first
quarter of 1996 to the third quarter of 2012 Three
variables were found to be significant using the
Ordinary Least Squares (OLS) method These
variables were the growth in total value of traded
shares (LNTVTS) growth in market size (LNMSIZE)
growth in openness to trade (LNOPEN) The turnover
ratio was not used as a determinant of liquidity as
Levine and Zervos (1996) states that the turnover ratio
measures trading of firmrsquos equities relative to the size
of the market and does not satisfy the degree in which
liquidity services on a macroeconomic scale Thus it
would not be providing significant liquidity to the
economy as a whole Therefore a large stock market is
not necessarily a liquid market
The Durbin-Watson and Breusch-Godfrey tests
were used to test for the presence of autocorrelation
Having found to have positive autocorrelation the
Cochrane-Orcutt Transformation was used as a
remedy to minimize the autocorrelation problem Table
1 shows the regression results after the Cochrane-
Orcutt Transformation
J Glob Bus Trade Vol 9 No 2 (November 2013) 61-71
67
From Table 1 results show that the effect of
growth on the total value of traded shares and the
growth of the market size on economic growth is
positive and statistically significant at the 1 level
The control variables which are the growth of
openness to trade and growth of foreign direct
investment also have the expected signs which are
positive however these variables are not significant
even at the 10 level The results also show that the
variable of inflation lagged by one period is negatively
related to economic growth and significant at the 10
level
Table 1 Cochrane-Orcutt Transformation Regression
Results
Variable Coefficient Std Error t-statistic Probability
LNTVTS 0134 0037 362 0001
LNMSIZE 0826 0046 1800 0000
INFLAG -0025 0013 -196 0055
LNOPEN 0269NS 0240 112 0268
LNFDI 0009NS 0009 100 0322
_cons 8062 0646 1248 0000
R2 = 09488 Prob gt F = 0000
Adjusted R2 =09445 DW Statistic
(transformed) = 2005368
Notes 1 significant at 1 level of significance
2 significant at 5 level of significance
3 significant at 10 level of significance 4 Values were rounded off to three decimal
places
Stock markets contribute to economic develop-
ment by enhancing the liquidity of capital investments
(Levine 1997) Moreover by increasing the quantity
and productivity through improved allocation of
capital as well as reducing the need to hold liquid
balances a liquid stock market would augment econo-
mic growth The results showed that the relationship
between the growth of market size (MSIZE) and
economic growth is positive and significant in
explaining economic growth in the Philippines as it
was used as a proxy for liquidity The coefficient 0826
implies that a 1 increase in growth of market size
would lead to an increase of 0826 in the growth of
GDP The result provides proof that the size of the
Philippine Stock Exchange (PSE) during the given
period determines the ability of the market to mobilize
savings improve the quality and quantity of invest-
ment and accelerate economic growth since the role of
the PSE is to bring companies together to raise capital
through securities
The other measure for liquidity has a positive and
significant effect on economic growth The growth in
total value of traded shares (LNTVTS) has a coeffi-
cient of 0134 implying that a 1 increase in the
growth of total value of traded shares will increase
economic growth by 0134 Since the growth of
TVTS measures the trading of firmrsquos equity as a share
of GDP its liquidity therefore positively reflects on an
economy-wide basis (Levine amp Zervos 1996)
Inflation (INFLAG) which was lagged by one
period conforms to economic theory by having a
negative relationship with economic growth since it
affects economic performance through monetary
instability It has a coefficient of -0025 which is
statistically significant at 10 level This means that a
1 increase in the inflation rate leads to a decrease in
the growth of GDP by 0025
The coefficient of the growth in openness to trade
(OPEN) conforms to the standard economic theory
since it is positively related to economic growth even
if it was used as a control variable The coefficient of
0269 implies that over the study period a 1 increase
in the degree of trade openness leads to approximately
0269 increase in growth of GDP Also there is a
positive relationship between the growth of foreign
direct investment (FDI) and economic growth since
FDI helps to supply long-term capital with new
technologies managerial and marketing capabilities
that would in turn augment economic growth through
employment increasing managerial skills diffusing
technologies and fostering innovations (Asiedu 2002
as cited by Adhikary 2011) The coefficient of 0009
implies that over the study period a 1 increase in the
degree foreign direct investment would lead to 0009
increase in growth of GDP
However results for openness to trade and foreign
direct investment in the model proved to be statistically
Stock Market Development and Economic Growth the Case of the Philippine Stock Market
68
insignificant after using these as control variables
along with the stock market liquidity measurements
The explanatory power or the goodness of fit of the
model as measured by the R-squared is at 09488
which means that 95 can be explained by the model
and it has a very strong fit The value indicates that
economic growth in the Philippines is adequately
explained by the model for the period between the first
quarter of 1996 to the third quarter of 2012 or that 95
of the variation in the growth of economic activities is
explained by the independent variables Moreover the
relationship between liquidity and growth remains
strong even after controlling for inflation foreign direct
investment and openness to trade Thus raising stock
market liquidity may independently produce
substantial growth
43 Long Run Relationship and Causality
431Test for Stationarity
One of the conditions in order to test Granger
Causality between the two variables is through its
stationarity It is important to know if the variable is
stationary or does not have a unit root or if the variable
is nonstationary or the variable contains a unit root
The variables LNTVTS LNMSIZE and LNGDP
were not stationary in their respective level forms
Thus for testing of the unit roots the Augmented
Dickey Fuller (ADF) test was used for the two
measurements of stock market liquidity which are the
LNTVTS and LNMSIZE and the proxy for economic
growth LNGDP The ADF includes the additional
lagged terms which can be examined by the Akaike
Information Criterion (AIC) to ensure that the errors
are uncorrelated If the variable is nonstationary at
level form but stationary after first differencing the
variable is integrated of order 1 and has a unit root
Using the said test variables LNTVTS LNMSIZE
and LNGDP are stationary after first differencing The
results for stationarity are shown in Table 2
Table 2 Stationarity Test Results
Variables Level Form P-value First Difference P-value
LNGDP 05891 lags (4) 00015 lags (4)
LNTVTS 06311 lags (4) 0000 lags (3)
LNMSIZE 03335 lags (4) 00039 lags (4)
Notes 1 significant at 1 level of significance
2 significant at 5 level of significance
432 Test for Cointegration
Since the stationarity of the variables have been
established the cointegration of the indicators of stock
market development and economic growth were tested
The results for the Cointegrating Regression Dickey
Fuller Test are shown in Table 3
Table 3 Cointegrating Regression Dickey Fuller
Test Results
Regressed Variables P-value
LNTVTS and LNGDP 00250
LNMSIZE and LNGDP 00545
Note significant at 5 level of significance
The regression results suggest that LNTVTS is
cointegrated with LNGDP Thus LNTVTS has a
long-run relationship with LNGDP which means
LNTVTS share a common stochastic drift or a
common trend with LNGDP The results also suggest
that LNMSIZE is also cointegrated with LNGDP
because the error term is stationary
433 Granger Causality
Granger Causality can only be tested if variables
are stationary and variables are cointegrated It is used
to establish whether a uni-directional or bi-directional
relationship exists between stock market development
and economic growth Results showed that LNTVTS
and LNMSIZE are both stationary and cointegrated
with LNGDP Table 4 shows the optimal number of
lags used in each determinant through Akaike
Information Criterion Table 5 shows the result of the
Granger Causality test
J Glob Bus Trade Vol 9 No 2 (November 2013) 61-71
69
Table 4 Akaike Information Criterion
LNGDP LNTVTS LNMSIZE
Lags AIC AIC AIC
0 212598 237417 215782
1 168524 222582 181308
2 164703 223876 179562
3 14775 214879 172127
4 14659 216273 167974
Note indicates the optimal number of lags
The results of the Granger Causality tests indicated
that there is a unidirectional causality between stock
market liquidity using the growth in the market size as
proxy and economic growth However results show
that there is no causality between growth in total value
of traded shares and economic growth Growth in total
value of traded shares and economic growth may have
a long-run relationship since they are cointegrated but
they do not exhibit Granger causality
Table 5 Granger Causality Test Results
Variable Computed
Statistic
F Tabular
Value
Granger
Causality
LNTVTS to
LNGDP 093NS 04532 No
LNGDP to
LNTVTS 038NS 07660 No
LNMSIZE to
LNGDP 347 00136 Yes
LNGDP to
LNMSIZE 037NS 08293 No
Notes 1 significant at 5 level of significance
2 NS - indicates insignificance
Since the variables LNTVTS and LNGDP were
found to be cointegrated an Error Correction Model
(ECM) was specified to test for the speed of
adjustment in the said determinants when one of these
variables experiences a shock Table 6 shows the Error
Correction Method results for LNTVTS and LNGDP
Table 6 Error Correction Method Results
Variables Speed of Adjustment
LNTVTS and LNGDP -0143817
Note significant at 5 level of significance
It can be observed from the results that LNTVTS
as the measure of stock market liquidity and LNGDP
for economic growth have the coefficient of the error
correction term with a negative sign and it is
statistically significant at the 5 level of significance
Thus the significance of the error correction mecha-
nism supports cointegration and suggests the existence
of a long-run equilibrium relationship between economic
growth and stock market development determinant
LNTVTS In other words the coefficient of the error
correction term which measures the speed of adjust-
ment back to equilibrium whenever the system is
experiencing a shock indicates that it would take 6953
asymp 7 quarters for a variable to adjust whenever one
experiences a shock
Ⅴ Summary and Conclusion
This research work studies stock market develop-
ment and its implications to economic growth by
analyzing the relationship between the stock market
measurements for liquidity and GDP growth in the
Philippines The specific objectives of the study were
to measure the liquidity of the Philippine stock market
and evaluate its trends for the given period determine
the linkages between stock market liquidity and
growth of the economy and to determine the causality
between stock market development and economic
growth
Using Ordinary Least Squares (OLS) method for
the time series data covering the period of the first
quarter of 1996 to the third quarter of 2012 it was
shown that the role of the stock market is essential to
economic growth in a developing country like the
Philippines The two measures used for liquidity the
growth in total value of traded shares and the growth in
market size were both positively related to economic
growth and statistically significant However results
for the growth in openness to trade and foreign direct
investment in the model proved to be statistically
insignificant after using it as control variables along
with the stock market liquidity measures Inflation on
Stock Market Development and Economic Growth the Case of the Philippine Stock Market
70
the other hand which was lagged by one period
conforms to theoretical conventions by having a
negative relationship to economic growth since it
affects economic performance because of monetary
instability About 95 of the variation in economic
growth is explained by the independent variables
Moreover the relationship between liquidity and
growth remains strong even after controlling for
inflation foreign direct investment and openness to
trade Thus raising stock market liquidity may
independently produce substantial growth
In assessing the relationship between stock market
development and economic growth it empirically
proved that the measure of economic growth (LNGDP)
and all of the determinants for stock market liquidity ndash
LNTVTS and LNMSIZE were both stationary and
cointegrated For the case of the Philippines there is a
unidirectional causality between stock market liquidity
using the growth in the market size as proxy and
economic growth For LNTVTS stock market
liquidity does not ldquoGranger causerdquo economic growth
and vice versa Since the two indicators have a long
run relationship the results of the Error Correction
Model suggest that there is an adjustment in stock
market liquidity as proxied by growth in total value of
traded shares and economic growth whenever one of
the indicators experiences a shock
Admittedly the study only tested a portion of the
financial side the stock marketrsquos liquidity Other
important determinants of stock market development
such as price volatility elasticity in trading corporate
governance could also be incorporated to give more
robust results There are a wide variety of factors that
can affect economic growth both on the financial and
real sectors of the economy which needs to be taken
into consideration The empirical results indicate that
the potential of the Philippines Stock Exchange in
fostering growth in the country should further be
explored
References
Adhikary B K (2010) FDI trade openness capital
formation and economic growth in Bangladesh A
linkage analysis International Journal of Business
and Management 6(1) 16-28
Benić V amp Franić I (2009) Stock market liquidity
comparative analysis of Croatian and regional
markets Financial Theory and Practice 32(4)
477-498
Garcia V F amp Liu L (1999) Macroeconomic
determinants of stock market development Journal
of Applied Economics 2(1) 29-59
Kanasro H A Jalbani A A amp Junejo M A (2009)
Stock Market Liquidity A Case Study of Karachi
Stock Exchange Pakistan Journal of Commerce
Social Science 3 25-34
Levine R amp Zervos S (1996) Stock market
development and long-run growth The World
Bank Economic Review 10(2) 323-339
Levine R amp Zervos S (1998) Stock markets banks
and economic growth American Economic Review
537-558
Levine R (1996) Stock markets A spur to economic
growth Finance and Development 33 7-10
Levine R (1996) Stock market liquidity and economic
growth Theory and evidence Retrieved from
httpfacultyhaasberkeleyeduross_levinepapers
0845_001pdf
Levine R (1997) Stock markets economic develop-
ment and capital control liberalization Perspec-
tive 3(5) 1-8
Mishkin F (2006) The economics of money banking
and financial markets (10th ed) Upper Saddle
River NJ Prentice Hall
Mohtadi H amp Agarwal S (2001) Stock market
development and economic growth Evidence
from developing countries Available at http
www uwm edumohadiPA-4-01pdf
Nagaishi M (1999) Stock market development and
economic growth Dubious relationship Economic
and Political Weekly 2004-2012
J Glob Bus Trade Vol 9 No 2 (November 2013) 61-71
71
Nurudeen A (2009) Does stock market development
raise economic growth Evidence from Nigeria
The Review of Finance and Banking 1(1) 015-
026
Petros J (2012) The effect of the stock exchange on
economic growth A case of the Zimbabwe stock
exchange Research of Business Economics 6 1-
17
Sarr A amp Lybek T (2002) Measuring liquidity in
financial markets (Working Paper No 02232)
Washington DC IMF
Tapitan J P (2012) Measuring link between financial
development and economic growth using a sample
of selected ASEAN countries (Unpublished under-
graduate thesis) Los Banos Philippines Univer-
sity of the Philippines Los Bantildeos
Von W R (2004) Measuring and predicting liquidity
in the stock market (Doctoral dissertation) Retrie-
ved from httpwww1 unisgchwwwedisnsf
SysLkpByIdentifier2899$FILEdis2899pdf
Xiao X amp Kong L L (2012) An Empirical Study
on the Relationship between Turnover Rate and
Stock Returns in Chinese Stock Market Advances
in Information Technology and Management 2(1)
239-245
Yartey C A (2008) The determinants of stock market
development in emerging economies Is South
Africa different (Working Paper No 0832)
Washington DC IMF
J Glob Bus Trade Vol 9 No 2 (November 2013) 61-71
73

Negotiation Factors and Culture in Trade Negotiations
4
1988) from America Taiwan Japan and Korea
(Grahametal 1988)
In the very relevant field of buyerseller interact-
tions Evansrsquo (1963) similarity hypothesis posits that
the more similar individuals are in buyerseller
relationships the more favorable will be the outcome
and the more likely a sale Mathews Wilson and
Monoky (1972) argue that perceived similarity results
in more cooperation between the buyer and seller
Attraction is the mechanism through which similarity
affects these outcomes
It should be noted that interpersonal attraction
might be conceived as an exogenous construct-
determined before negotiations begin as a part of the
combination of the negotiatorrsquos characteristics It may
also be argued that attraction is a consequence of the
negotiation However attraction is regarded as a
process-related construct
There is an abundance of studies in the negotiation
literature that focuses on the fundamental assumption
that personal parameters or negotiatorsrsquo characteristics
are relevant to negotiation processes and outcomes
(Barry amp Friedman 1998) Someone with a trusting
nature tends to give credence to the honesty of
statements of others until or unless reasons are
provided for disbelief In negotiation trust relates to
how they expect their partners to behave and respond
(Fells 1983)
In the cross-cultural negotiation literature duration
of the negotiation is described as a key aspect of the
process For example Tung (1982) and Van Zandt
(1970) report that negotiations with the Chinese and
Japanese are exasperatingly long from the perspective
of most American negotiators Pruitt (1981) discusses
at great length the pervasive influence of time on
negotiations That is a time limit affects the qualities of
the aspirations concession making and negotiation
satisfaction Although time limits per se are not varied
in this study negotiators from different cultures may
have different expectations about appropriate durations
which may in turn influence behaviors
Silent periods are operationally defined as gaps in
conversations lasting 10 seconds or more in duration
The time period of ten seconds was selected somewhat
arbitrarily but it is a long enough period of silence to
appear unnatural to most observers The tapes were
searched for gaps in conversations of ten seconds or
more The ten seconds time period while somewhat
arbitrary is a long enough silence to appear unnatural
to most American observers
The concept of interactional synchrony the
unconscious coordination of verbal and nonverbal
behaviors of 2 or more participants in a conversation
was discussed at length by Graham (1980) It is the
number of conversational overlaps or interruptions
during a conversation Conversational overlaps are
defined as periods when both speakers are talking at
the same time or when the conversational contribution
of one speaker overlaps that of the other speaker One
possible measure of this construct is the number of
conversational overlaps or interruptions during a
conversation Identification of such overlaps is
independent of the verbal content of the interactions
Facial gazing is defined as the percentage of time a
negotiator gazes at the face of partner Many resear-
chers have found significant relationships between
facial gazing and outcomes of negotiations (Lewis amp
Fry 1977) Moreover several authors have suggested
differences in facial gazing behaviors across cultures
(Argyle amp Cook 1976)
Touching means that a negotiator touches another
negotiation partner with the exception of beginning
and ending handshakes It is the number of times
negotiators touch their partners (excluding beginning
and ending handshakes) Graham (1985) reports
Brazilian businesspeople touch one another during
simulated negotiations while Japanese and American
negotiators do not
23 Outcome Measures
Researchers often find outcomes of business
negotiations difficult to measure and to compare
Various studies have used sale versus no sale an
obvious measure of negotiating effectiveness (eg
Pennington 1968) profits obtained by negotiators (eg
J Glob Bus Trade Vol 9 No 2 (November 2013) 1-9
5
Rubun amp Brown 1975) and a combination of
individual and joint profits (Clopton 1984) Beyond
profits negotiatorrsquos satisfaction is an important
measure of success especially if partners desire a
continued relationship Given the dual importance of
task accomplishment (profit) and relationship building
(satisfaction) especially in international negotiations
the present study uses both as outcomes
Ⅲ Cultural Difference in Nonverbal
Behavior
The participants in the experiment were 10
Chinese 10 Korean and 10 European Students who
are majoring in international business and Korean
businessmen are undergraduate students majoring
international commerce at Paichai University in Korea
This section deals with nonverbal aspects of
videotaped interactions The rhythms of the
conversations are discussed examining silent periods
and conversational overlaps Next facial gazing and
touching during negotiations are presented
31 Silent Periods
Silent periods are operationally defined as gaps in
conversations 10 seconds or more in duration The
time period of 10 seconds was selected somewhat
arbitrarily but it is long enough period of silence to
appear unnatural to most observers The tapes were
searched for gaps in conversations of 10 seconds or
more Silent periods occurred more frequently in the
Korean negotiatorsrsquo interactions (51 per 30minutes)
than either the Chinese or European negotiators
Negotiators from a low context culture such as Europe
tend to regard the silence of a high context culture such
as Korea as a rejection which is not a rejection in a
real sense by their standards
32 Conversational Overlaps
The concept of interactional synchrony the uncon-
scious coordination of verbal and nonverbal behaviors
of 2 or more participants in a conversation was
discussed at length by Graham (1980) It is the number
of conversational overlaps or interruptions during a
conversation Conversational overlaps are defined as
periods when both speakers are talking at the same
time or when the conversational contribution of one
speaker overlaps that of the other speaker The number
of overlaps (interruptions) by each participant was
totaled and divided by the time of negotiation to arrive
at values which may be compared across interactions
According to Table 1 Korean negotiators interrupted
more than Chinese or European negotiators
33 Facial Gazing
Facial gazing is defined as the percentage of time a
negotiator gazes at the face of partner Randomly
selected 10-minute videotape excerpts of each of the
interactions served as data here The author recoded
the time each participant spent gazing at hisher
partnerrsquos face during 10 minutes According to Table 1
European negotiators spent considerably more time
gazing at negotiation partners than either Korean or
Chinese negotiators
Table 1 Comparison of Patterns of Nonverbal Negotiation Behavior
Nonverbal Negotiation Behavior Korean Chinese European Silent Periods(average number of silence for more than 10
seconds during 30 minutes)
Conversational Overlaps(average number of conversational
overlaps during 30 minutes)
Facial gazing(average number of gazing)
Touch(number of touch)
51
308
11 25
35
264
11 30
28
58
76 00
Negotiation Factors and Culture in Trade Negotiations
6
34 Touching
Touching means that negotiator touches another
negotiation partner except for beginning and ending
handshakes Except for European negotiators Korean
and Chinese negotiators seldom touch their partners
except for handshakes
Ⅳ Conclusions
The purpose of this study has been to find out basic
factors affecting international business negotiations
and to suggest some strategic implications for business
negotiators With the advancement of globalization
intercultural business negotiations become more and
more important as a marketing strategy The role of
business negotiators is extremely important in order to
achieve successful international business negotiations
In order to achieve agreement in international
business negotiations negotiators are required to
manage cultural differences between the parties
concerned in addition to the complexity of domestic
negotiations Because such a large variety of cultural
factors exist among nations it is critical for negotiators
to identify the kind of problem-solving approaches that
are most appropriate for each intercultural negotiator
Understanding cultural differences is vital for successful
intercultural negotiations An objective measurement
of culture is important to overcome misunderstanding
caused by stereotyping and prejudice about other
cultures
As for nonverbal negotiation behaviors Korean
negotiators tend to use more silent periods than the rest
of two groups Also Korean negotiators interrupted
more than Chinese and European negotiators
European negotiators used more lsquofacial gazingrsquo and
lsquotouchingrsquo strategies in negotiation However there are
study limitations as follows the most important
consideration is the validity of the principal outcome
measure individual profit Kellyrsquos negotiation game
and such measures have been used in other studies but
how well the game represents actual business
negotiations is problematic Much of the evidence
supplied for accepting and rejecting hypotheses is
based on self-reports and judgements of participants
Also small sample sizes do not allow for tests of
statistical significance The negotiator should understand
the cultural background specifically regarding business
negotiation Negotiators can ask more questions in
their negotiations Sometimes itrsquos smart to be a little
bit dumb in business negotiations
The more the negotiators ask questions the more
information they can get and they can exchange more
information Also using a silent strategy can be
necessary and aggressive influence tactics such as
warnings and threats particularly those emphasized
with expressions of emotions may be used in
negotiations in a very restrictive way
Cooperatives and educational institutions should
take advantage of current research to develop training
programs on cultural differences in not only verbal
communication but non-verbal communication for
better trade negotiation results
References
Achrol R S (1997) Changes in the theory of
interorganizational relations in marketing Toward
a network paradigm Journal of the Academy of
Marketing Science 25(1) 56-71
Adler N J amp Graham J L (1989) Cross-cultural
interaction the international comparison fallacy
Journal of International Business Studies 20(3)
515-537
Allred K G Mallozzi J S Matsui F amp Raia C P
(1997) The influence of anger and compassion on
negotiation performance Organizational Behavior
and Human Decision Processes 70(3) 175-187
Argyle M amp Cook M (1976) Gaze and mutual
gaze Cambridge England Cambridge University
Press
Atkinson J M amp Heritage J (1984) Structures of
social action Studies in conversation analysis
Cambridge England Cambridge University Press
Barry B Fulmer I S amp Van Kleef G A (2004) I
laughed I cried I settled The role of emotion in
J Glob Bus Trade Vol 9 No 2 (November 2013) 1-9
7
negotiation The Handbook of Negotiation and
Culture 71-94
Barry B amp Friedman R A (1998) Bargainer
characteristics in distributive and integrative
negotiation Journal of Personality and Social
Psychology 74(2) 345
Barry B amp Oliver R L (1996) Affect in dyadic
negotiation A model and propositions Organiza-
tional Behavior and Human Decision Processes
67(2) 127-143
Blackman C (1977) Negotiating China Case studies
and strategies St Leonards Australia Allen amp
Unwin
Brenkert G G (1998) Trust morality and interna-
tional business Business Ethics Quarterly 8(02)
293-317
Brunner J A amp Taoka G M (1977) Marketing and
negotiating in the peoplersquos republic of China
Perceptions of American businessmen who atten-
ded the 1975 Canton Fair Journal of International
Business Studies 69-82
Butler J K (1995) Behaviors trust and goal
achievement in a win-win negotiating role play
Group amp Organization Management 20(4) 486-
501
Campbell N C Graham J L Jolibert A amp
Meissner H G (1988) Marketing negotiations in
France Germany the United Kingdom and the
United States The Journal of Marketing 52 49-62
Casse P (1981) Training for the Cross-Cultural Mind
(2nd ed) Washington DC Society for
Intercultural Education Training and Research
Cellich C (1995 January) Negotiations for export
business Elements for success In International
Trade Centre (ED) International Trade Forum
(No 4 p 20) Geneva Author
Clopton S W (1984) Seller and buying firm factors
affecting industrial buyersrsquo negotiation behavior
and outcomes Journal of Marketing Research 21
39-53
Coates A (1968) Myself a Mandarin Oxford UK
Oxford University Press
Davidson W H (1987) Creating and managing joint
ventures in China California Management Review
29(4) 75-95
Deutsch M Kelley H H amp Rapoport A (1964)
Strategic interaction and conflict Berkeley CA
Berkeley Institute of International Studies
University of California
Evans F B (1963) Selling as a dyadic relationship A
new approach American Behavioral Scientist 6
76-79
Fang T (1997) Chinese business negotiating style A
socio-cultural approach (Licentiate thesis)
Linkoping Sweden Inter-national Graduate School
of Management and International Engineering
(IMIE)
Fisher R Ury W amp Patton B (1991) Getting to
Yes (2nd ed) New York NY Penguin Books
Ganesan S (1994) Determinants of long-term
orientation in buyer-seller relationships The
Journal of Marketing 19(4) 1-19
Gardner L amp Aronson G (Eds) (1968) Handbook
of Social Psychology Reading MA Addison-
Wesley
George J M Jones G R amp Gonzalez J A (1998)
The role of affect in cross-cultural negotiations
Journal of International Business Studies 29(4)
749-772
Gilsdorf J W (1997) Metacommunication effects on
international business negotiating in China
Business Communication Quarterly 60(2) 20-37
Goh B C (1996) Negotiating with the Chinese
Euro-Asia Business Review 5(1) 34-36
Graham J L (1985) The influence of culture on the
process of business negotiations An exploratory
study Journal of International Business Studies
81-96
Graham J L (1986) The problem-solving approach
to negotiations in industrial marketing Journal of
Business Research 14(6) 549-566
Graham J L (1990) An exploratory study of the
process of marketing negotiations using a cross-
cultural perspective In E A Scarcella amp S
Krashen (Eds) Developing communicative
Negotiation Factors and Culture in Trade Negotiations
8
competence in a second language (pp 239-279)
Rowley MA Newbury House
Greenhalgh L amp Gilkey R W (1993) The effect of
relationship orientation on negotiatorsrsquo cognitions
and tactics Group Decision and Negotiation 2(2)
167-183
Gumperz J J (1982) Discourse strategies Cambridge
UK Cambridge University Press
Hall E T (1976) Beyond culture Garden City NY
Anchor Press
Hall E T (1989) The silent language New York
NY Bentam-Doubleday
Hofstede G (1991) Cultural and organization amp
software of the mind Berkshire England
McGraw-Hill
Hofstede G (2001) Culturersquos consequences (2nd ed)
Thousand Oaks CA Sage
Jones G R amp George J M (1998) The experience
and evolution of trust Implications for cooperation
and teamwork Academy of Management Review
23(3) 531-546
Kumar R (1997) The Role of affect in negotiations
an integrative overview The Journal of Applied
Behavioral Science 33(1) 84-100
Kumar R (2004) Culture and emotions in
international negotiations An overview In M J
Gelfand amp J M Brett (Eds) The handbook of
negotiation and culture (pp 95-113) Stanford CA
Stanford Business Books
Lewicki R J amp Stark N (1996) What is ethically
appropriate in negotiations An empirical examina-
tion of bargaining tactics Social Justice Research
9(1) 69-95
Lewis S A amp Fry W R (1977) Effects of visual
access and orientation on the discovery of
integrative bargaining alternatives Organizational
Behavior and Human Performance 20(1) 75-92
Linton R (1945) The cultural background of personality
New York NY Appleton-Century Crofits
McAllister D J (1995) Affect-and cognition-based
trust as foundations for interpersonal cooperation
in organizations Academy of Management
Journal 38(1) 24-59
Min H amp Galle W (1993) International negotiation
strategies of US purchasing professionals Interna-
tional Journal of Purchasing and Materials
Management 29(2) 40-50
Pennington A L (1968) Customer-salesman bargain-
ing behavior in retail transactions Journal of
Marketing Research 255-262
Pruitt D G (1981) Bargaining Behavior New York
NY Academic Press
Reardon K K amp Spekman R E (1994) Starting out
right Negotiation lessons for domestic and cross-
cultural business alliances Business Horizons
37(1) 71-79
Rempel J K Holmes J G amp Zanna M P (1985)
Trust in close relationships Journal of Personality
and Social Psychology 49(1) 95
Rubin J Z amp Brown B R (1975) The social
psychology of bargaining and negotiation New
York NY Academic Press
Salacuse J W (1991) Making global deals negotia-
ting in the international marketplace Boston MA
Houghton Mifflin
Sawyer J amp Guetzkow H (1965) Bargaining and
Negotiation in International Relations In H C
Kelman (Ed) International behavior A social-
psychological analysis (pp 464-520) New York
NY Holt Rinehart and Winston
Sebenius J K (2002) The hidden challenge of cross-
border negotiations Harvard Business Review
80(3) 76-85
Shenkar O amp Ronen S (1987) The cultural context
of negotiations The implications of Chinese
interpersonal norms The Journal of Applied
Behavioral Science 23(2) 263-275
SRI International (1979) Doing Business in Taiwan
and Doing Business in Japan [Pamphlet] Menlo
Park CA Schmidt K D
Stewart S amp Charles F K (1989) Talking with
dragon Negotiating in the peoplersquos republic of
China Columbia Journal of World Business 23(3)
68-72
J Glob Bus Trade Vol 9 No 2 (November 2013) 1-9
9
Strong K amp Weber J (1998) The myth of the
trusting culture a global empirical assessment
Business amp Society 37(2) 157-183
Thibaut J W amp Kelly W H (1959) The social
psychology of groups New York NY McGraw-
Hill
Triandis H C Kurowski L L amp Gelfand M J
(1994) Workplace diversity In H C Triandis M
D Dunnette amp L M Hough (Eds) Handbook of
industrial and organizational psychology (pp 769-
827) Palo Alto CA Consulting Psychologists
Tung R L (1982) US-China trade negotiations
practices procedures and outcomes Journal
of International Business Studies 25-37
Weiss S E (1993) Analysis of complex negotiations
in international business The RBC perspective
Organization Science 4(2) 269-300
Weitz B (1979) A critical review of personal selling
research The need for contingency approaches In
G Albaum amp G A Churchill (Eds) Critical
issues in sales management State of the art and
future research needs Eugene OR University of
Oregon
Yoshimatsu H (2005) Japanrsquos keidanren and free
trade agreements Societal interests and trade
policy Asian Survey 45(2) 258-278
Zandt V (1970) How to negotiate in Japan Harvard
Business Review 25-38
J Glob Bus Trade Vol 9 No 2 (November 2013) 11-21
11
ISSN 1946-5130
Journal of Global Business and Trade
wwwiagbtcom
Is the Agrochemical Industry Traversing the Organic Route
Insights and Directions for a Philippine Agrochemical
Trading Company
Jane Keneth M Mampustia Jeanette Angeline B Madamba
b Agnes T Banzon
c and
Loida E Mojicad
abcd College of Economics and Management University of the Philippines Los Bantildeos Philippines
Received 12 August 2013 Revised 22 September 2013 Accepted 25 October 2013
ABSTRACT
This paper explores the strengths weaknesses challenges and opportunities of a Philippine agrochemical
trading company as it thrives within its broader macro-environment In an era of climate change adaptation
and ailing global economies agrochemical companies within the food chain face even greater barriers to
survival and competitiveness The study revealed that the agrochemical industry has made baby steps in
encouraging farmers to adopt the natural or organic way of farming through the use of biopesticides and
biofertilizers as a response to climate change but price-sensitive farmers appear indifferent to the use of
biopesticides and biofertilizer and readily switch suppliers depending on product prices as well as the
promotional activities done by agrochemical trading companies These suggest that agrochemical usage will
continue to dominate global agriculture in the next couple of years while biologicals in organic agriculture
will account for a minimal percentage despite the trend toward sustainable agriculture To be sustainable it is
suggested that agrochemical trading companies introduce new brands for each product type formulate a
customer retention strategy for its dealers and independent business partners and pursue a market penetration
strategy to widen the customer base as they track their moves against a changing global agrochemical
industry
Keywords agrochemical industry biopesticides climate change adaptation organic agriculture sustainability
Ⅰ Introduction2
Agrochemicals also known as crop protection
products are those products or substances which are
used to effectively and actively manage the agricultural
ecosystem Agrochemical products include pesticides
herbicides insecticides and fungicides Synthetic
fertilizers hormones and other chemical growth agents
2013 International Academy of Global Business and Trade
All rights reserved
as well as concentrated stores of raw animal manure
may also be included in the list of agrochemical
products These products can be classified into four
categories inorganic pesticides organic pesticides and
pre-emergent and post-emergent herbicides These
chemicals play a vital role in controlling and restrain-
ing the damaging attacks of pests weeds fungi
diseases and other undesirable pests which pose
serious threats to global crop production The benefits
offered by agrochemical products are two-fold the
Is the Agrochemical Industry Traversing the Organic Route Insights and Directions for a Philippine
Agrochemical Trading Company
12
control of certain pests and diseases to improve crop
productivity and indirectly poverty alleviation (Fertili-
zer and Pesticide Authority 2012)
Fig 1 Benefits of Pesticides to Control Human and Livestock Disease Vectors and Nuisance Organisms
Source Cooper and Dobson as cited in Cuyson S (2007)
Pesticide products when used properly can give
benefits not only to the community but to the whole
society as shown in Fig 1 Problems which most
farmers complain about like fast-growing weeds and
threats to crop productivity can be resolved through the
application of herbicide The application would reduce
cost of labor and fuel specifically for large plantations
Safety for the environment and human health is also
emphasized Careful regulatory policies are implemented
by the FPA so that the environment and human health
would not be at risk Although chemical-based crop protection products
have contributed time and again toward increasing
farmersrsquo incomes because these products prevent
massive crop losses caused by pests and diseases Due
to the need to efficiently meet demand farmers and
other agribusiness entities have to constantly rely on
crop-protecting chemical products since it only takes a
short period to harvest crops with the help of these
products (Tirado 2008) Agrochemical products as
well as the widespread use of irrigation have largely
contributed to the increase in agricultural production
On the other hand health concerns have caused a
negative perception of agrochemicals since over-
utilization of these products have caused problems
such as toxicity of the soil pollution and food poisoning
Established multinational companies involved in
the agrochemical industry as well as local companies
are pressured to effectively address the agricultural
trend of shifting to organic farming and developing
more environmentally-friendly products In addition
there are government policies to which they must align
their objectives with societal welfare in mind Non-
government organizations (NGOs) and environmental
groups such as Greenpeace have been actively making
their moves against crop protection companies With
this scenario players in the industry are bound to
strategize on how to improve product safety to defend
themselves from the actions of such groups in the
interest of sustainability
Phil-Agrochemicals Trading (not the real name) is
a nationwide distributor of generic agrochemical products
located in Southern Luzon Philippines Its distribution
network includes dealers independent business partners
(IBPs) and wholesalers The market may be skeptical
about the efficacy of generic agrochemical brands but
J Glob Bus Trade Vol 9 No 2 (November 2013) 11-21
13
this small company strives to be more responsible for
their products through continuous research on ways to
improve their products and demonstrate such efficacy
in crop protection Knowing their products may have
detrimental effects for the farmers if not properly used
the company conducts seminars or farmersrsquo group
meetings on the safe use of their products They also
give protective gear such as masks and gloves to the
farmer participants Products which are traded by this
company are manufactured by several suppliers in the
Philippines such as AgChem Manufacturing Corpora-
tion Radisson Agrochemical Corporation and Kemistar
Corporation These manufacturing compa-nies are
members of the Crop Protection Association of the
Philippines (CPAP) one of the leading crop protection
chemical associations in the country Phil-Agroche-
micals Trading also imports agrochemicals (speci-
fically insecticides) from Bharat Agro Chemicals in
India and China Xiamen Top using Import amp Export
Co Ltd from China About 10 of their total
inventory comes from imported insecticides Currently
Phil-Agrochemicals Trading which also distributes
products of its sister company has fifteen pesticide
products and two plant nutrition products in its
inventory pipeline
With the stiff competition in the Philippine agro-
chemical industry brought about even more by the
institution of Republic Act No 10068 (also known as
the Organic Act of 2010) the company has to find
ways to better strategize so as to gain customer trust
encourage continued patronage and improve overall
company performance The company has about eight
direct competitors
This paper aims to present an overview of the
agrochemical industry compare the firmrsquos operational
and functional strategies with the practices in the
industry identify and assess the problems and oppor-
tunities pertaining to these strategies and compare
these with its competitorsrsquo strategies and suggest
solutions to the problems or strategies to take
advantage of opportunities in view of the challenges of
going organic and the overall demand for the greening
of agriculture
II Methodology
Primary data for this exploratory research were
gathered from surveys and interviews with four
company officerspersonnel 60 farmers five indepen-
dent business partners and five dealers as well as an
actual apprenticeship at Phil-Agrochemical Trading
over a two-month period by the major author
Secondary data were obtained from printed sources
found at several government institutions such as the
Crop Protection Association of the Philippines (CPAP)
and the Fertilizer and Pesticide Authority (FPA)
company files and other printed or online publications
and unpublished special problem reports at the College
of Economics and Management library Descriptive
analysis combined with a comparative competitor analysis
and a SWOT analysis was used in this research
Ⅲ Review of Literature
Zhang et al (2011) identified three phases in the
history of pesticides and its application (1) the first
phase which covered the period before the 1870s saw
the use of natural pesticides (such as sulfur in ancient
Greece) as a pest control measure (2) the second phase
from the 1870s to 1945 saw the advent of inorganic
synthetic pesticides and the use of natural materials
and inorganic compounds and (3) the third phase
(from 1945 onwards) marked the era of organic
synthetic pesticides (eg DDT 24-D and later HCH
dieldrin) Since then humans synthesized most
pesticides which were later referred to as chemical
pesticides It was during the third phase (the era of
organic synthetic pesticides) when there was a boost in
agricultural productivity which became a moving force
for the advancement of human civilization
During the earlier portion of the third phase three
kinds of insecticides were used carbamated insecticides
organophosphorus insecticides and organochlorined
insecticides This was soon followed by the develop-
ment of herbicides and fungicides As seen in Table 1
herbicide use increased from 20 in 1960 to 48 in
2005 Herbicides comprised almost half of total
pesticide consumption in 2005 (Zhang et al 2011)
Is the Agrochemical Industry Traversing the Organic Route Insights and Directions for a Philippine
Agrochemical Trading Company
14
Table 1 Changes of Pesticide Consumption Worldwide
CATEGORY 1960 1970 1980 1990 2000 2005
Sales Sales Sales Sales Sales Sales
Insecticides 310 365 1002 371 4025 347 7655 29 7559 279 7798 25
Herbicides 170 20 939 348 4756 14 1162
5
44 1288
5
475 1497
1
48
Fungicides amp Bactericides
340 40 599 222 2181 188 5545 21 5306 196 7486 24
Others 30 35 159 59 638 55 1575 6 1354 5 936 3
Total 850 100 2700 100 11600
100 26400
100 27104
100 31191
100
Note Sales in millions USD
Source Xu (1997) httpwwwdocincomp-55305172html as cited in Zhang et al (2011)
According to the Food and Agriculture Organi-
zation of the United Nations (FAO) fertilizer and
pesticide use in the Philippines between 1961 and
2005 increased by 1000 and 325 respectively
This was caused by the widespread use of irrigation
agrochemicals and new seeds in the country However
crop yield only increased by a small amount even
though agrochemical products were used This was
mainly attributed to excessive and inappropriate use of
chemical-based products in farming causing land
degradation and losses in soil fertility
Ⅳ Overview of the Industry
41 Global Agrochemical Industry
Dussal (2011) stated that the world agrochemical
industry was valued at USD 134 billion in 2010 It is
expected to grow at a CAGR of 11 to reach USD
225 billion by 2015 The Asia Pacific region led the
global agrochemical and fertilizer consumption
accounting for 40 followed by North America with
32 The top ten global players include Bayer
Syngenta Potash Corp Agrium and Mosaic which
constitute around 90 of the world market share
Pesticide sales remained relatively constant over
the 1990s between USD 270 to 300 billion From 2007
to 2008 herbicides ranked first in the three major
categories of pesticides (insecticides fungicides
bactericides and herbicides) in terms of sales The
fungicidesbactericides ranked second Europe is now
the top consumer of pesticides in the world followed
by Asia Specific countries which largely use
pesticides are China the United States France Brazil
and Japan Most of the pesticides worldwide are used
for fruit and vegetable crops In developed countries
pesticides mainly herbicides are primarily used for
maize Since the 1980s there have been hundreds of
thousands of pesticides developed worldwide inclu-
ding biopesticides (Zhang et al 2011)
According to the US Environmental Agency
ldquobiopesticides are certain types of pesticides derived
from such natural materials as animals plants bacteria
and certain minerals For example canola oil and
baking soda have pesticide applications and are
considered biopesticides At the end of 2001 there
were approximately 195 registered biopesticide active
ingredients and 780 products Biopesticides fall into
three major classes
a Microbial pesticides consist of a micro-
organism (eg a bacterium fungus virus or
protozoan) as the active ingredient Microbial
pesticides can control many different kinds of
pests although each separate active ingre-
dient is relatively specific for its target pest(s)
For example there are fungi that control
certain weeds and other fungi that kill
specific insects
b The most widely used microbial pesticides
are subspecies and strains of Bacillus
thuringiensis or Bt Each strain of this
bacterium produces a different mix of
proteins and specifically kills one or a few
J Glob Bus Trade Vol 9 No 2 (November 2013) 11-21
15
related species of insect larvae While some
Btrsquos control moth larvae found on plants
other Btrsquos are specific for larvae of flies and
mosquitoes The target insect species are
determined by whether the particular Bt
produces a protein that can bind to a larval
gut receptor thereby causing the insect larvae
to starve
c Plant-Incorporated-Protectants (PIPs) are
pesticide substances that plants produce from
genetic material that has been added to the
plant For example scientists can take the
gene from the Bt pesticide protein and
introduce the gene into the plantrsquos own
genetic material Then the plant instead of
the Bt bacterium manufactures the substance
that destroys the pest The protein and its
genetic material but not the plant itself are
regulated by EPA
Fig 2 Distinguishing Factors for the Paradigm Shift in the Crop Protection Industry
Source Balayan (2010)
d Biochemical pesticides are naturally occurring
substances that control pests by non-toxic
mechanisms Conventional pesticides by
contrast are generally synthetic materials that
directly kill or disable the pest Biochemical
pesticides include substances such as insect
sex pheromones which interfere with mating
as well as various scented plant extracts that
attract insect pests to traps Because it is
sometimes difficult to determine whether a
substance meets the criteria for classification
as a biochemical pesticide the EPA has
established a special committee to make such
decisions
42 The Philippine Crop Protection Industry
According to the Samahan sa Pilipinas ng mga
Industriyang Kimika (SPIK) or Chemical Industries
Association of the Philippines in 2008 the utilization
of crop-protecting chemicals is still prevalent among
Filipino farmers In the country the most extensively
used pesticides are insecticides which account for 51
of the total market herbicides comprise 21
fungicides 14 and the remaining other types of
pesticides 14 These chemicals are used for crops
such as rice (about 33 million hectares of plantation
area) corn (32 million hectares) pineapple (67000
hectares) and banana (25000 hectares)
Is the Agrochemical Industry Traversing the Organic Route Insights and Directions for a Philippine
Agrochemical Trading Company
16
Because of the greater challenge faced by the
players there has been a progressive shift in the
industry from what is commonly known as an
agrochemical industry to a crop protection industry and
now to a plant science industry as shown in Fig 2 The
shift to a plant science industry is believed to deliver
products that would give better solutions to crop
problems and technologies that would lead to
sustainability As of now the multinational companies
or the CropLife members are the ones which are
already in the third phase (Balayan 2010) The generic
companies are still in phase 2 (crop protection) but on
their way to shift to phase 3 (plant science)
The Philippine crop protection industry is
comprised of firms engaged in the formulation
manufacture distribution repackaging importation
and exportation of chemical pesticides It has always
been dominated by transnational agrochemical com-
panies which are members of CropLife International
such as Bayer CropScience Syngenta Philippines Du
Pont Dow Agro These companies operate and manu-
facture their own agrochemical products These
companies focus more on the assurance of the safety of
their products Moreover they are now more respon-
sible about the flow of their products up through the
disposal phase Hence they practice product steward-
ship In 2008 the FPA has listed about 300 firms
operating in the country Other players in the industry
would include local companies such as the members of
the Crop Protection Association of the Philippines
(CPAP) and other generic product-making companies
As shown in Table 2 there has been an increasing
demand for pesticides in the country although a
continuous campaign against these products is done by
the NGOs An increase in Philippine importation of
pesticides is due to the fact that perceived sustainability
cannot be achieved without the help of these
agrochemical products The country is highly
dependent on importation due to the limited resources
available in the country for formulators and manufac-
turers Active ingredients are also imported by the
major industry players Local production is limited to
formulation of imported technical materials except for
24-D
Table 2 Value of Imports of Pesticides in the Philippines (in USD 1000rsquos)
Item 2006 2007 2008 2009 2010
Insecticides 39658 49152 65022 68873 51371
Fungicides 46751 40741 32109 26914 28648
Herbicides 22236 22793 21954 11715 5031
Disinfectants etc 10388 13033 30741 53249 85043
Total 119033 125719 149826 160751 170093
Source FAO (2010)
On the other hand exports of pesticides by the Philippines show minimal levels making the country a net importer of
pesticides (Table 3)
Table 3 Value of Exports of Pesticides in the Philippines (in USD 1000rsquos)
Item 2006 2007 2008 2009 2010
Insecticides 1335 2938 1547 1508 1928
Fungicides - - 1 15 132
Herbicides 1 262 400 81 27
Disinfectants etc 312 1199 915 1256 740
Total 1649 4399 2863 2859 2826
Source FAO (2010)
J Glob Bus Trade Vol 9 No 2 (November 2013) 11-21
17
43 Foreseen Trends in Global Pesticide
Production and Consumption
The trend nowadays is organic agriculture which is
seen also as sustainable agriculture Thus the ongoing
deterioration in the natural environment had Zhang et
al (2011) saying that biopesticides are the wave of the
future Such pesticides must be highly efficient non-
toxic and environment-friendly Biopesticides according
to Yang (2001) have the following advantages
a a positive control effect on pests safe to humans
and animals and no pollution
b no residuals
c strong specificity to target pests safe to natural
enemies and beneficial organisms
d raw materials and active ingredients are natural
products which helps to ensure sustainable
development
e they can be modified by means of modern
biotechnology and fermentation processes to
improve performance and enhance quality
f pest resistance is difficult to generate
Over 100 kinds of biopesticides exist at present
worldwide with about 30 types of biopesticides
commercially produced (Xu 2008) Countries such as
Mexico the United States and Canada dominate global
biopesticide usage accounting for 44 The total
world biopesticide consumption can be broken down
into 20 (Europe) 13 (Asia) 11 (Oceania) 9
(Latin America) and 3 (Carribean and Africa) (Qin
amp Kong 2006) As for China the biopesticide industry
has been expanding since the 1990s from 10 to 20
annually such that by 2006 total biopesticides
consumption reached 145000 tons accounting for 10
of total sales It is anticipated that biopesticides will
replace up to 20 of chemical pesticide consumption
in China in the years ahead
Since safer products are what consumers are
demanding companies such as United Farm Tech-
nologies Nuso Agro Science and Dow Agro started
selling and manufacturing safer pesticides called
biopesticides These products are derived from natural
materials Biopesticides constitute about 2 of the
global agrochemical market (Dussal 2011) In
Monsantorsquos pipeline are agricultural biological or
biopesticides produced using what they call the Bio-
Direct Technology which involves using molecules
found in nature expected to be developed for use in
topically applied crop protection and other products
(Monsanto 2012) Moreover Bayer CropScience
recently acquired AquaQuest a US-based supplier of
innovative biological pest management solutions based
on natural microorganisms for USD 500 million in its
bid to build a leading technology platform for green
products (Bayer 2012)
Ⅴ Results and Discussion
51 Compliance by Phil-Agrochemical
Trading with FPA Requirements
The FPA requirements relative to product labeling
were all met by the Phil-Agrochemical Trading These
include a statement of composition registration or
provisional permit number name and address of
company the productrsquos common name net contents
directions for use suitable indication of hazards
instructions on decontamination and safe disposal of
used containers the lot number and date of formulation
the FPA registration number re-entry period after
application triple rinse logo a person to contact in case
of emergency and safety instructions
52 Comparison of Phil-Agrochemical
Tradingrsquos Activities with CPAP
Activities
Four types of activities are carried out by CPAP
members product stewardship agromedical training
information education campaign aerial spraying semi-
nars and farmersrsquo meetings Phil-Agrochemical
Trading has yet to apply for CPAP membership A
comparison of its activities with CPAP activities
revealed that only farmersrsquo meetings are done by the
firm
Is the Agrochemical Industry Traversing the Organic Route Insights and Directions for a Philippine
Agrochemical Trading Company
18
53 Comparison of Phil-Agrochemical
Tradingrsquos Operations with Top
Competitors
Table 4 presents a summary comparison of Phil-
Agrochemical Tradingrsquos operations with two of its
top competitors CyBERTH Philippines Inc and
PhilAgrow Inc
CyBERTH Philippines Inc was established in
1999 and is engaged in trading pesticides and
fertilizers in the country However they trade more
pesticide products as fertilizer is more expensive The
companyrsquos product portfolio includes 24 registered
products categorized as insecticides herbicides
fungicides molluscicides or plant growth regulators
The major crops where these products can be used are
rice corn vegetables and mangos The companyrsquos
operations cover the research and development of new
products importation and local purchase of the
technical and inert materials of a particular product
formulation warehousing and supply of finished
products to its distributors This company continuously
searches for better products
PhilAgrow Inc started operations in 2006 and is an
importerdistributor of chemical pesticides such as
insecticides molluscicides fungicides herbicides
nematicides and specialties It has 18 FPA-registered
products
Table 4 Summary Comparison of Phil-Agrochemical Trading with Two Top Competitors
Points for Comparison Phil-Agrochemical
Trading CyBERTH Philippines Inc PhilAgrow Inc
Product Lines 14 FPA registered products 24 FPA registered products 18 FPA registered products
Product Variety
Herbicidesinsecticides
molluscicides fungicides fertilizer
Herbicides insecticides
molluscicides fungicides fertilizer
Insecticides molluscicides
fungicide herbicides nematicides specialties
Promotional Activities
Farmers meetings caravans
raffle promos provision of protective gears
Farmers meetings raffle
promos provision of protective gears
Farmers meetings raffle
promos provision of protective gears
Target Market
General trade market
plantation businesses small farmers (below 2ha and 2ha
and above)
General trade market
plantation businesses small farmers below 2 ha
and 2 ha and above)
General trade market
plantation businesses small farmers below 2 ha and 2 ha
and above)
Location Scope Domestic Domestic Domestic
Facilities (eg warehouse
transportation)
Rented (Outsourced
production) Owned Research facility
Provision of training to employees
- Yes Yes
Note Firm name was disguised upon firmrsquos request
Among the points for comparison it can be seen
that Phil-Agrochemical Trading has the least number
of product lines at 14 FPA-registered products vis-agrave-
vis CyBERTH Philippines Inc with 24 FPA-
registered products and PhilAgro Inc with 18 FPA-
registered products In terms of product variety Phil-
Agrochemical Trading and CyBERTH Philippines
Inc have 5 types of products while PhilAgrow has 6
types All firms carry out the same promotional
activities have the same target market and location
scopecoverage Facilities of Phil-Agrochemical
Trading are rented while those for CyBERTH
Philippines Inc are owned PhilAgrow Inc has its
own research facility Only CyBERTH Philippines
Inc and Phil-Agrow Inc provide training to
employees
54 Farmer Survey Results
Sixty farmers surveyed had about 11-15 years of
farming experience primarily grew rice operated
small farms (1-5 hectares) and were customers of Phil-
J Glob Bus Trade Vol 9 No 2 (November 2013) 11-21
19
Agrochemical Trading for five years or less The
majority (over 91) bought pesticides from other
distributors because of lower prices and availability of
preferred agrochemicals On a scale of 1 to 7 with 7
being the highest rating most farmers rated Phil-
Agrochemical Trading a ldquo4rdquo Suggestions given by the
farmers to the firm included lowering the product
prices and increasing promotional activities to
encourage customer retention and continued patronage
55 Assessment of Strengths Weaknesses
Opportunities and Threats
Fig 3 shows a SWOT Matrix where Phil-Agro-
chemical Tradingrsquos strengths are matched with its
opportunities and then with its threats while its
weaknesses are matched with its opportunities and
then with its threats to generate possible strategy
alternatives for the firm to become sustainable Such
strategies include the introduction of new brands per
product type creation of a customer retention strategy
for its dealers and IBPs and pursuing market
penetration
Fig 3 SWOT Matrix
External
Internal
Opportunities Threats
(1) Training programs and seminars are conducted by institutions
such as FPA and CPAP
(2) The openness of farmers to new knowledge in crop production
(3) The bright prospects for the plant
science industry towards the attainment of food security
(4) Increasing trend towards the
production of biopesticides (5) Availability of funding agencies
(6) The support of government and
NGOs for organic farming
(7) The negative perception on the use of chemical pesticides and fertilizers
(8) Small farmers are highly sensitive to
pesticide prices (9) Increasing competition in the industry
due to increasing number of new
entrants (10) The effects of climate change on the
industry
(11) Products of the industry are not highly differentiated
(12) Prices of inputs for the manufacture
of pesticides are volatile
Strengths
Introduction of different brands for
each type of pesticide
(S1 S2 and O1 O5)
Market Penetration
(S1 S3 and T1 T3 T6)
1 The firm has suppliers which are
members of CPAP
2 The firm has its BOD as distributors
3 They do not distribute Category I
pesticide 4 The company has developed
partnership with the dealers of
organic fertilizers
Weaknesses
Creation of customer retention
strategy for the dealers and IBPs
(W2 W3 W5 and O1 O2 O3)
Creation of customer retention strategy for the dealers and IBPs
(W2 W3 W4 and T1 T2 T3 T6)
1 Lack of warehousing facilities
2 Weak brand recognition
3 Non-commitment of dealers and
IBPs
4 Experiences stock-outs of products
5 The company does not have well-
established customer relationships
56 Insights and Directions It is apparent that though the agrochemical industry
has taken action in traversing the organic route toward
Is the Agrochemical Industry Traversing the Organic Route Insights and Directions for a Philippine
Agrochemical Trading Company
20
sustainability it has only taken small steps in that
direction Even if customers are clamoring for safe
food and in spite of the trend towards organic
agriculture and sustainability most farmers remain
indifferent toward using biopesticides and other
biologicals in farming on account of their sensitivity to
input prices and demand for more promotional
activities Thus in the next couple of years it is
expected that agrochemicals of a synthetic nature will
continue to dominate the global agrochemical industry
in terms of usage and market share Such a trend is
expected to spill over to Asia including the Philippines
as transnational companies take in a sizeable share of
the market
To survive and compete in the industry agroche-
mical trading companies must employ a number of
strategies such as introduce new brands for each
product type formulate a customer retention strategy
for its dealers and IBPs and pursue market penetration
Lastly in the case of Phil-Agrochemical Trading the
firm should consider CPAP membership and carry out
product stewardship agromedical traininginformation
education campaign and aerial spraying seminars to
enhance its competitiveness in the agrochemical
industry
References
Balayan L M A (2010) An apprenticeship study on
Bayer cropscience Gocus on its thrust towards
sustainable development through its quality health
safety and environment (QHSE) system (Under-
graduate Special Problem Report) Los Banos
Philippines University of the Philippines Los
Bantildeos
Castillo A (2000) A special problem report on Bayer
Philippines Inc (Undergraduate Special Problem
Report) Los Banos Philippines University of
the Philippines Los Bantildeos
Cuyson S (2007 March) Pesticides in sustainable
agriculture and the environment Paper presented
at the 38th annual scientific conference Tagbilaran
Philippines
David F R (2009) Strategic Management Concepts
and Cases (12th ed) Upper Saddle River NJ
Pearson Education
Dussal M (2011) Agrochemicals Retrieved from
httpwwwAgrochemicalInformationand Resour-
ceshtm
Lu J L (2009) Total pesticide exposure calculation
among vegetable farmers in Benguet Philippines
Journal of Environmental and Public Health 2009
Retrieved from httpwwwhindawicomjournals
jeph2009412054
Lum KY Mamat M J Cheah UB Castaneda
CP Rola AC amp Sinhaseni P (1993) Pesticide
research for public health and safety in Malaysia
the Philippines and Thailand Retrieved from
httpwwwnzdlorggsdlmode=d-00000-00-off-
0envl000010000direct-10401l11-en-5020-about-
00010004001110-0utfZz800ampcl=CL13ampd=HAS
H 016be195f7a6257ed84a093544ampgt=1
Palacio E B (2004) An apprenticeship study on the
crop protection division of syngenta corporation
(Undergraduate Special Problem Report) Los
Banos Philippines University of the Philippines
Los Bantildeos
Qin X F amp Kong F B (2006) Prospect and
situation of biopesticides Journal of Anhui Agri-
cultural Sciences 34(16) 4024 4057
The Philippines (1996) Philippine case study a
developing countryrsquos perspective on POPs Paper
presented at the IFCS Meeting on POPs Manila
Philippines Retreived from httpwwwchem
unepchpopsindxhtmsmanexp7html
Tirado R amp Bedoya D (2008) Agrochemical use in
the Philippines and its consequences to the environ-
ment Quezon Philippines Greenpeace Southeast
Asia Retrieved from httpwwwgreenpeacetopu
bliccationsGPSEA_agrochemical-use-in-the-phili
ppdf
Varca L M (2002) Impact of agrochemicals on soil
and water quality Food and Fertilizer Technology
J Glob Bus Trade Vol 9 No 2 (November 2013) 11-21
21
Center Retrieved from httpwwwagnetorg
libraryphpfunc=viewampid=20110804160130
Xu Y Z (2008) The application of biological
pesticides and industrial development measures
Chinese Agricultural Science Bulletin 24(8) 402-
404
Yang J L (2001) Green chemistry and technology
Beijing Beijing University of Posts and Teleco-
mmunications 176-180
Zhang W Jiang F amp Ou J (2011) Global pesticide
consumption and pollution with China as a focus
Proceedings of the International Academy of Ecol-
ogy and Environmental Sciences 1(2) 125-144
J Glob Bus Trade Vol 9 No 2 (November 2013) 23-27
23
ISSN 1946-5130
Journal of Global Business and Trade
wwwiagbtcom
A Study on the Dependency on Japan and the
Competitiveness of Gear Boxes
Kwang Hee Kim
Department of Business Administration Hyupsung University Korea
Received 15 August 2013 Revised 20 September 2013 Accepted 28 October 2013
ABSTRACT
From the trade deficit with Japan in 2012 of 2557 billion USD the trade surplus of material and components
industry was 2223 billion USD in deficit 87 of such trade deficit with Japan came from the material and
components industry
This study is to focus on the competitiveness index of absolute inferiority in automobile components as of
2012 and lsquogear box and other componentsrsquo that are over the trade for each amount of the automobile
components with Japan
Keywords competitiveness index(CI) dependence on Japan gear box industry trade deficit against Japan
Ⅰ Introduction3
As of 2012 Korea accomplished overall exports of
54787 billion USD and imports of 51958 billion USD
and as a result the trade surplus accomplished a
surplus of 2829 billion USD If this is limited to the
material and components industry the global exports
and imports were 25341 billion USD and 16249
billion USD respectively and as a result the trade
surplus recorded a surplus of 9092 billion USD that
the trade surplus exceeded 60 billion USD To put it
differently the present vast trade surplus mainly came
from the trade surplus of the material and components
industry
In the meantime the trade surplus with Japan
(2012) recorded a deficit of 2557 billion USD It was
less than the trade deficit with Japan for the previous
2013 International Academy of Global Business and Trade
All rights reserved
year 2011 (2864 billion USD) but it was attributable
to the decreasing imports from Japan from the
exchange rate with strong Yen and weak Won
currency The vast scale of the trade deficit with Japan
did not happen overnight
For this background the vulnerability of the
domestic material and components industry was the
greatest cause for the aforementioned From the trade
deficit with Japan in 2012 of 2557 billion USD the
trade surplus of material and components industry was
2223 billion USD in deficit 87 of such trade deficit
with Japan came from the material and components
industry
This study is to focus on the competitiveness index
(-091) of absolute inferiority in automobile compo-
nents as of 2012 and lsquogear box and other components
(8708-40-0000)rsquo that are over the trade for each
amount of automobile components with Japan
Through the foregoing the purpose is to analyze the
A Study on the Dependency on Japan and the Competitiveness of Gear Boxes
24
trend of export and import competitiveness on the
material and components industry with Japan and lead
a responsible strategy for improving the trade deficit
with Japan
Ⅱ Trade Surplus and Status
Looking into the global export and import scale of
lsquogear box and other componentsrsquo (2012) exports reached
2528801000 Dollars and imports 1568670000
Dollars as a result the trade surplus reached
1471934000 Dollars Looking into the export and
import scale with Japan on this item for the same year
it recorded the export of 2379 billion USD and import
of 491028 million USD as a result the trade deficit
recorded 467238 million USD
On the other hand the scale of trade deficit (-470
million USD) with Japan for lsquogear box and other
componentsrsquo was applicable for 18 of the entire
trade deficit with Japan (-2557 billion USD) and 21
of trade deficit with Japan for material and components
(-2233 billion USD)
Also looking only at the trade surplus with Japan
for automobile components (-430 million USD) the
trade deficit of lsquogear box and other componentsrsquo took a
high ratio applicable for 1159 that the status of these
item could be shown
Therefore relief from the trade deficit with Japan
by domestic automobile components industry could be
concluded as impossible without an improvement in
the trade deficit of the lsquogear box and other componentsrsquo
For reference from the costs of a completed car
the ratio for the gear box is known to be around 7-8
As such a gear box with a high ratio of production cost
also has the longest quality assurance limit in that it is
the core item for a high added-value to measure the
competitiveness of a complete car
As shown through the comparison with other
indices under the following Fig 1 the import scale
with Japan for the lsquogear box and other componentsrsquo is
very high Furthermore the import dependence of
Japan has declined from 801 in 1988 770 in
1998 597 in 2008 and 465 as of 2012 but the
import dependency on Japan may be assessed as high
Fig 1 Ratio of Gear Box in the Trade Deficit with
Japan (2012)
Source Prepared by the author by facilitating the Korea International Trade Association (2013)
The global export of this item has clear trend of
increase in recent days The trend of increase has been
significantly moderated from 252 million USD in
1988 to 9 million USD in 2000 However it began
with 2865 million USD in 2002 to leap to 6704
million USD in 2004 918 million USD in 2006
27079 million USD in 2008 and 75942 million USD
in 2010 and it increased to 1 billion 4234 million
USD in 2011 twice that of the previous year As of
2012 it has drastically increased to 2528801000
Dollars over 1 billion USD from the previous year that
exports has shown dramatic increase since 2009
In spite of that the exports to Japan of this item
were USD 970000 in 1988 USD 910000 in 1998
942 million USD in 2008 and 2379 million USD as
of 2012 it has seen very little increase for a quarter of
a century
On the other hand imports from Japan were
15506 million USD in 1988 19402 million USD in
1998 72344 million USD in 2008 and 965669
million USD in 2010 but it has plummeted to record
491028 million USD as of 2012 Compared to 2010
imports from Japan dropped less than a half
J Glob Bus Trade Vol 9 No 2 (November 2013) 23-27
25
Fig 2 Trend of Exports and Imports (1988~2012) of Gear Boxes (8708-40-0000)
Source Prepared by the author by facilitating the Korea International Trade Association (2013)
The trade deficit in automobile components with
Japan to this point has been pointed out with a cause of
importation in highly functional and high-tech
components impossible for domestic development
However according to the interview survey result on
the recent domestic automobile industry gear boxes
imported from Japan are mainly for large commercial
vehicles that are made for productivity purposes in
Korea
Ⅲ Price per Weight on Export and
Import Items
In order to consider the problems in lsquogear box and
other componentsrsquo in detail the price per weight price
of export and import items are analyzed for each price
Following is a brief summary of the export and
import scales and the status of gear boxes to Japan As
is well known in the case of Japan the status of gear
box exports and imports were an item with
overwhelmingly excessive exports Based on 2011
exports were 133 trillion Yen (approximately 18
trillion won) with 128 export countries On the other
hand the imports were only 606 billion Yen
(approximately 800 billion won)
The weight price of Japan for gear boxes is
approximately 1880 Yenkg for the gear boxes with a
high price imported as compared to the export product
price of 1500 Yenkg In particular the weight price
for the import item from the first import subject
country the Netherlands was 7380 Yenkg which
was overwhelmingly higher than the second country
the US of 1270 Yenkg Also the weight price of
export items from the US and Europe was around
1500 Yenkg but the import item price was 2000
Yenkg or higher
A Study on the Dependency on Japan and the Competitiveness of Gear Boxes
26
Table 1 Amount per Kg for Global Export and Import of Gear Boxes
Year Export Import
Amount (USD 1000) Weight (kg) USDkg mount (USD 1000) Weight (kg) USDkg
2005 119947 9259951 130 714512 45342883 158
2006 91804 8512492 108 778889 52223376 149
2007 127074 12051377 105 1066938 72512561 147 2008 270795 21068540 129 1212621 72940221 166
2009 307779 25239366 122 900597 53010625 170
2010 759422 58236825 130 1362034 81828230 166 2011 1423403 106723042 133 1405309 78567171 179
2012 2528801 180077148 140 1056867 59809776 177
A total of 8
years Average weight price 1246 Average weight price 1640
Source Prepared by the author by facilitating the Korea International Trade Association (2013)
On the other hand the weight price of imported
items from Korea was less than 1000 Yenkg for the
gear box an affordable price This fact could be
affirmed by the result calculated through facilitation of
the statistical data of Korea International Trade
Association by the author
In 2010 and 2012 the global weight price of export
items of Korearsquos lsquogear box and other components
(8708-40-0000)rsquo was 130 Dollarkg and 140 Dollarkg
respectively the import item price for the same year
was 166 Dollarkg and 177 Dollarkg respectively
There was a difference in weight price of 3 Dollarkg
or more between items of export and import (Table 1)
Looking into the trend of the 8-year period from
2005 to 2012 the weight price of import items was
higher than the export items The average weight price
of global export items for this item for the 8-year
period was 1246 Dollarkg while the average weight
price for the import item was 1640 Dollarkg there
was a unit price difference of 4 Dollarkg
Thereafter the weight price of the export item to
Japan for the above items in 2010 and 2012 was 81
Dollarkg and 74 Dollarkg respectively while the
import item price was 158 Dollarkg and 160
Dollarkg respectively there was a two times weight
price difference between the export and import items
(Table 2) Looking into the period of 2005 - 2012 for
the above the import items to Japan had a higher
weight price than the export items In addition the
average weight price of the export items for 8 years
was 1105 Dollarkg while the average weight price of
the import item was 1509 Dollarkg there was
approximately 4 Dollarkg or more of price difference
In addition the export amounts to Japan for 2010
and 2012 were 81 Dollarkg and 74 Dollarkg It
declined 4 Dollarkg or more compared to 2009 which
is considered as attributable to diverse types of gear
boxes exported with a drastic increase of exports to
Japan in these two periods
Characteristics of export and import items to the
world and Japan on the gear box and other components
(8708-40-0000) have a higher average weight price in
export and import to Japan than the export and import
items to the world have a higher average weight price
than the import items to Japan
Furthermore when comparing the weight price for
exports and imports to the world and Japan on this
item the import items were higher than the export
items To interpret it differently it is proof that the
export of the gear box had lower added value than the
imported items
J Glob Bus Trade Vol 9 No 2 (November 2013) 23-27
27
Table 2 Amount per Kg for Exports and Imports of Gear Boxes with Japan
Year Export Import
Amount (USD 1000) Weight (kg) USDkg mount (USD 1000) Weight (kg) USDkg
2005 14004 1010821 139 444022 29443945 151
2006 10124 805067 126 531454 38286910 139
2007 10180 845554 120 725042 55581305 130 2008 9420 708144 133 723444 49337793 147
2009 9235 743895 124 628173 39923189 157
2010 11075 1361065 81 965669 61103817 158 2011 19866 2284696 87 812394 49161068 165
2012 23790 3225976 74 491028 30683013 160
A total of 8
years Average weight price 1105 Average weight price 1509
Source Prepared by the author by facilitating the Korea International Trade Association (2013)
Ⅳ Conclusions
The following is the summary of contents shown
through the analysis of the lsquogear box and other
componentsrsquo
First the above items have shown a drastic
increasing trend for global export after 2009 but
export to Japan was still in a minimal increasing trend
close to horizontal line even as of 2012
Second characteristics of export and import items
to the world and Japan showed a higher average
weight price of export items to Japan than the export
items to the world and the import items from the
world had a higher average weight price than the
import items from Japan Also when comparing the
export and import weight prices with the world and
Japan for the above item the import items had a higher
rate than the export items To put it differently the
export of gear boxes was proven to have lower added
value than the import items
Lastly a brief mention was made on the direction
of the lsquogear box and other componentsrsquo
The recent assembly processing technology has
become standardized globally while the material and
components technology have been monopolized by
some advanced countries including Japan Because of
the foregoing the foreign currency earned from the
global market was turned over to Japan and the added
value for Korean industry has not been significant at all
Furthermore if the import of core material and
components such as lsquogear box and other componentsrsquo
is dependent on a specific country there is possible
subordination in the industrial structure with a high
possibility of losing the initiative in production and
price
Purchasing core material and components from
Japan was inevitable in the economic growth process
of Korea in the past but the time has come to make a
great change in the domestic industry
References
Grubel He G amp Peter L (1975) Intra-industry
trade The theory and measurement of interna-
tional trade in differentiated products London
UK MacMillan
Kim Kwang-Hee (2008) The competitiveness of
domestic auto parts industry against Japan The
Korean-Japan Journal of Economics amp Manage-
ments Studies 41
Kim Kwang-Hee (2013 June) A study on the
dependency on Japan and competitiveness of gear
box Paper presented at the 10th annual conference
and research symposium Mongolia National
University Mongolia
Korea International Trade Association (2013) Trade
statistics data Retrieved from httpwwwkitanet
J Glob Bus Trade Vol 9 No 2 (November 2013) 29-34
29
ISSN 1946-5130
Journal of Global Business and Trade
wwwiagbtcom
The Nature of Competition in an Indian Market Focusing on
the Volume Zone
Tirtha Bahadur Karki
Graduate school of Asian and International Business Strategy Japan
Received 14 June 2013 Revised 12 September 2013 Accepted 2 October 2013
ABSTRACT
Emerging countries are playing a growing role in the world economy It is a role that is expected to be even
greater in the future The recent global financial and economic crisis has further emphasized the stagnation of
most developed economics and taken prominence in emerging economics In particular China and India play
a significant role as global markets Henceforth it is estimated that the Indian volume zone will expand
rapidly and steadily On the other hand Japan and other developed economies tend to be sluggish Therefore
Japanese multinational corporations may have to target Indian volume zone consumers To do so they are
required to change their strategy management and production systems to compete with local and international
rivals in the market because the nature of the competition is totally different in an Indian market than other
developed country However definitions of the volume zone differ among research institutions researchers
countries and urban and local areas which creates considerable differences in the size of markets Thus in
this paper the literature review summaries and compares the definitions of the volume zone first Second this
paper tries to Fig out the most important part of the volume zone which has a key role in making a business
strategy Third differences between developed markets and the Indian market are examined and the nature of
competition in the Indian market is argued Finally the main argument and implication are stated
Keywords competition developed market emerging market Indian market strategy volume zone
Ⅰ Introduction4
There is very significant global interest in the
Indian economy Along with China Brazil Indonesia
and a few other countries India promises great potential
of growth in the next few years and decades The
future of the Indian economy is thus a significant
concern among the global financial and business
community economic policy-makers and managers
multilateral financial institutions economists and
2013 International Academy of Global Business and Trade
All rights reserved
other academics as well as investors and consumers in
India The significant global interest in India is not
surprising It is well known that - on a purchasing
power parity basis ndash India is already at over USD
four trillion of GDP the fourth largest economy in the
world very close to the size of the Japanese economy
the third largest In the next 15 to 18 years this size is
expected to grow as per various studies and estimates
four to five times As a result many foreign investors
and a majority of global companies and businesses are
making a beeline for the Indian market which
The Nature of Competition in an Indian Market Focusing on the Volume Zone
30
promises a booming volume zone5 of a few hundred
million consumers (Fig 1) expanding steadily in the
next few decades
Fig 1 Shares of Global Middle Consumption
2000-2050
Source Kharas (2010)
On the other hand advanced economies including
Japan are slowing down Japan has been in a long
recession with a real GDP growth rate of 39 in 2010
It underlines the world economy shift from developed
nations with their huge populations rising household
incomes and expansion of consumer goods and
service markets toward the emerging economies6
From these perspectives the expansion of the
Indian volume zone has attracted considerable
attention Many Japanese firms have already adjusted
their strategy management and production systems in
order to compete with the Indian volume zone
However there are no official definitions of volume
zone7 and these definitions differ among research
institutions researchers countries and urban and local
areas This creates considerable differences in the size
of volume zone markets Thus the literature review
summarizes and compares the definitions of volume
zone arguements After identifying the important part
of the volume zone (what is the volume zone what is
the trend of the volume zone etc) this paper argues the
differences between developed markets and the Indian
5 It is also called middle class middle income class and
middle income In this paper the middle class is identified as volume zone
6 The countries and consumers team 2010
7 Eric D et al (2007) Kharas (2011)
market which is very useful in knowing the nature of
competition in the Indian market Finally the main
argument and implications are stated
11 Definitions of Volume Zone
There are various definitions of volume zone based
on annual household disposal income annual
household income and expenditure Since the
definition of volume zone is not standardized with
each countryrsquos factors it remains uncertain Thus we
need to define and examine the Indian volume zone
which is most important in order to Fig out a business
strategy
12 Annual Household Disposable Income
The Ministry of Economy Trade and Industry
(2010) Aoshima Kubota and Sakamoto (2009) Japan
research institute (2010) Mizuho Research Institute
(2010) and Yanagawa and Mori (2010) defined the
Asian volume zone including that of India as
comprising people whose annual household disposa-
ble incomes range between $5000 and $35000 (upper
middle class $15001-35000 lower middle class
$5001-$15000 lower class $1000-$5000 the poor
up to $1000) and the rich as those whose annual
household disposable incomes exceed $35000 On the
other hand Indiarsquos National Council of Applied
Economic Research (NCAER report 20052006)
defined the Indian volume zone as comprising people
whose annual household disposable incomes range
between $22320 and $4444 (Rs1000000-Rs200000
at 20012002 price)
Comparing these two definitions of volume zone
(Fig 2) the former defines that the annual household
disposal incomes of people in the volume zone tends to
be higher at $5001 to $35000 and the latter defines
that the incomes of people in the volume zone tends to
be lower at $4444 to $22320
J Glob Bus Trade Vol 9 No 2 (November 2013) 29-34
31
Fig 2 Definitions of Volume Zone by Annual
Household Disposable Income
13 Annual Household Incomes
First the World Bank (2007) and Milanovic and
Yitzhaki (2002) defined the global volume zone as
those with annual household incomes between the
mean incomes of Brazil and Italy that is an annual per
capita income of approximately $4000-$17000 (at
2000 purchasing power parity (PPP)) Second Bhala
(2009) adopted an absolute approach definition with
an annual per capita income of $3900-$113000 in
PPP terms Third Court and Narasimhan (2010)
divided the consumers of developing countries
including India into the following classes on the basis
of their annual household incomes global class
$113000 and above upper middle class $56500-
$113000 middle class $22500-$56499 lower
middle class $13500-$22499 and deprived class
below $13500 From this distribution the middle class
is defined as those with an annual household income of
$13500-$113000 in PPP terms
In order to compare these definitions Fig 3
presents the minimum and maximum annual incomes
that were specified by various researchers Bhala (2009)
specified the minimum annual income as $3900
which is much lower than that specified in other
definitions
Fig 3 Definitions of Volume Zone by Annual
Household Income
14 Expenditure
Some researchers defined the volume zone on the
basis of expenditures In 2007 Banerjee and Duflo
(2007) defined it on the basis of per capita expenditure
between $2-$4day In 2008 they defined the global
volume zone on the basis of per capita expenditure of
$2-$10day in 1993 PPP (Banerjee amp Duflo 2008) On
the other hand Ravallion (2010) defined it on the basis
of per capita expenditure between $2-$13 day Both of
these expenditure based definitions are used only in
emerging economies
Fig 4 Definitions of Volume Zone by Expenditure
These two definitions also show differences since
the higher bound is $10day and $13day In summary
the volume zone is defined differently on the basis of
various standards locations and economies Owing to
its complexity and variety the volume zone consumersrsquo
jobs incomes consumptions lifestyles and subjective
The Nature of Competition in an Indian Market Focusing on the Volume Zone
32
consciousness of the levels of society must also be
considered for defining the Indian volume zone
Ⅱ Catching the Trend
In order to consider the differences between the
definitions of volume zone this paper argues about
most important part of the volume zone to make a
better strategy in business The management team in
business must know about the volume zone but
$3900 or $4000 (Fig 3) in annual household income
does not make a vast difference in its strategy and
consumers lifestyle In relation to the poor by
associating it with an ability to choose to spend time
and money on something other than survival consider
the volume zone in the case of Indian markets where
estimates range from 30 million to approximately 300
million people
The volume zone is not (yet) the biggest segment
of Indiarsquos overall population Given all the attention
focused on Indiarsquos middle class in recent years it is
important to keep a proper perspective on its size and
potential purchasing power Even using the most
generous estimates of the grouprsquos size the volume
zone comprises less than 30 percent of the population
Thus the rich and the poor combined far outweigh the
Indian middle class The importance of the middle
class lies in the fact that it is the fastest growing
segment of the population Evidence shows that as
income increases the amount and variety of this
discretionary spending increases For corporations the
middle class in India thus presents significant business
opportunities The sales growth of consumer goods
such as televisions and mobile phones to the middle
class has already been established Given the
tremendous growth potential an increasing number of
products are being geared towards the volume zone
population In the transport industry which has
traditionally been dominated by rail travel newer cars
like the Tata Nano (which retails for a little over USD
3000) and low-cost airlines have enabled the volume
zone population to be increasingly mobile The growth
of the volume zone and the economic growth of India
are in a virtuous cycle Rising incomes lead to more
consumption which in turn leads to higher economic
growth then more employment opportunities and
subsequently higher wages and the circle starts again
Thus as the volume zone grows and continues to
increase domestic demand the economy will also
continue to grow Regardless of which definition is
correct and certain it is important to keep a proper
perspective on the potential of the volume zone The
volume zone in India has generated tremendous
interest from the media and multinational corporations
are looking for a new market demographic
Ⅲ Developed Markets and the Indian
Market
In recent years Indiarsquos market growth has
outstripped the developed markets In the 80s GDP
growth in developed nations and India was essentially
the same Between 2000 and 2010 average growth in
the Indian market rose to the point where it was three
times higher Besides this India has corruption less
infrastructure fare of terrorism and etc which are
abnormal in a developed country
Consumers in India tend to be more ethnocentric
than those in developed ones Products from the
western hemisphere are seen by Indian cultures as
carrying western values that might harm their society
as well as the local workforce In developed countries
price quality durability and other product-related
aspects are the major factors that influence buying
decisions Consumers in India tend to be less indivi-
dualistic than in developed ones They care more for a
larger local community and like to be identified as part
of it Advertising which exhibits local values and
traditions has a greater impact on consumers of India
whereas the more individualistic consumers from
developed countries are more influenced by adverti-
sing where the product differentiates itself specifically
from other products in the market
J Glob Bus Trade Vol 9 No 2 (November 2013) 29-34
33
These are the common differences between the
Indian market and developed markets Besides these
there are lots of differences between Indian markets
and developed markets
A survey held by the Graduate School of Asian
and International Business strategy8 in October 2011
on the title of ldquoEntry Strategy of the Japanese Firms in
India and Chinardquo shows that Japanese firms in India
are going to change their target from the upper
(wealthy) class to the Volume Zone (Fig 5) In 2011
581 percent of the Japanese firms replied that they are
targeting upper class customers in India By the way
the survey shows only 274 percent of firms were
targeting the upper class after 3 years (2014) and more
firms targeted the middle class Thus we can
understand the Japanese strategies are shifting from the
upper class to the Volume Zone
Fig 5 Shifting Strategy in India
Ⅳ Conclusion
Thus it is clear that the Indian volume zone is
expanding and Japanese companies are shifting their
strategy from the upper class to the volume zone The
problem is the presence of Japanese companies in the
Indian market where Japanese companies are domi-
nated by Korean and European-American companies
8 Principle of Asia University DrIkejima Masahiro
leads the survey
According to Shintaku and Amano (2009) develo-
ped countriesrsquo firms have more strong technology and
find it more difficult to target the volume zone of
emerging markets and to adopt the strategy locally
There is no room to think about if the strong tech-
nology of a company is harmful for its strategy in
emerging markets The problem is how to approach
the volume zone and this is important Specially the
volume zone comes from the lower class and
companies should know their lifestyle and behavior If
firms understand the value of money for the volume
zone they can easily shift their strategy too This helps
them succeed in the Indian volume zone
Finally the conclusion of this paper presents the
hypothesis for further research about how to approach
the volume zone of India The hypothesis is (Fig 6)
ldquoTo compete successfully in the Indian volume zone
firms need to catch the trend of the volume zone and
educate customers construct market infrastructure
train management personnel and understand the
abilities of the supply side are essential This is why
they need to cultivate their resources at a lower level
than they are targeted (volume zone)
This paper cannot include the case study and
cannot examine the strategy That will be further
researched by this author in the future
Fig 6 Possible Way to Succeed in the Volume
Zone of India
The Nature of Competition in an Indian Market Focusing on the Volume Zone
34
References
Akihisa Yahata (2012) IndiaASEAN business guide
Two challenges of market creation in emerging
countries Tokyo Japan Research Institute
Retrieved from httpwwwjricojppagejspid=
22012
Aoshima Minoru Kubota Yosuke amp Sakamoto
Ryohei (2009) Manufacturing for emerging eco-
nomics that has entered the second stage Learning
to emerging economics strategy of electronics
industry focused on the middle of the economic
pyramid Knowledge Creation and Integration
17(12) Nomura Research Institute Retrieved from
httpswwwnricomjpopinionchitekishisan2009
pdfcs20091208pdf
Banerjee A V amp Duflo E (2008) What is middle
class about the middle classes around the world
The journal of economic perspectives a journal of
the American Economic Association 22(2) 3
Bhalla S (2009) The middle class kingdom of India
and China Wasington DC Peterson Institute for
International Economics
Court D amp Narasimhan L (2010) Capturing the
worldrsquos emerging middle class The McKinsey
Quarterly 1-6
Dyck S Hansakul S amp Saxena R (2009)
Emerging Asiarsquos middle class-A force to be
reckoned with (eSocialSciences Working Paper
No 2232) Retrieved from httpeconpapersrepec
orgRePEcesswpaperid2232
Eric D B Diana F amp Adil S Z (2007) Tracking
the growth of Indiarsquos middle class The McKinsey
Quarterly 51-61
Japan Research Institute (2010 October) Chinarsquos eco-
nomic policy debate heats up in run up to party
congress Asia Monthly 10(115) 1-15
Kharas H (2011 June 13) India China middle class
boom faces many challenges FIRSTPOST
Retrieved from httpwwwfirstpostcomworld
china-india-middle-class-boom-24637html
Milanovic B amp Yitzhaki S (2002) Decomposing
world income distribution Does the world have a
middle class Review of Income and Wealth
48(2) 155-178
Ministry of Economy Trade and Industry (2010)
White paper on international economy and trade
2010 Tokyo Author
Mizuho Research Institute (2010) Japan companies
deviating from volume zone market of China and
India (Mizuho Report) Tokyo Author Retrieved
from httpwwwmizuho-ricojppublicationresearch
pdfreportreport10-0407pdf
National Council of Applied Economic Research
(2005) Annual resport 2005 Retrieved from
httpwwwncaerorgdownloadsannualreportsan
nualreport_2005pdf
Shintaku Junjiro amp Amano Tomo (2009) Emerging
market strategies changes in market and resource
strategies The Journal of Economics 75(3) 40-62
Syusuke Watanabe Tokutaro Hiramoto amp Naoya
Tsuaaki (2012) Developing BoP business as the
principal strategy in 70 trillion of emerging and
developing economics Paying the road to a new
market that is expected to reach 55 billion people
Knowledge Creation and Integration 20(1)
Nomura Research Institute Retrieved from
httpswwwnricomjpopinionchitekishisan2012
pdfcs20120103pdf
Shukla R (2010) How India earns spends and saves
unmasking the real India New Delhi India
SAGE Publications India
Ravallion M (2009) The developing worldrsquos bulging
(but vulnerable) ldquomiddle classrdquo World Development
38(4) 445-454
Sridharan E (2004) The growth and sectoral
composition of Indiarsquos middle class Its impact on
the politics of economic liberalization India
Review 3(4) 405-428
Yanagawa Noriyuki amp Mori Naoko (2010) Income
bracket towing Asiarsquos domestic demand (NIRA
Monograph Series No 31) Tokyo National
Institute for Research Advancement Retrieved
from httpwwwniraorjppdfmonograph31pdf
J Glob Bus Trade Vol 9 No 2 (November 2013) 35-44
35
ISSN 1946-5130
Journal of Global Business and Trade
wwwiagbtcom
Analysis of Public Health Expenditures on Leading Causes of
Morbidity in the Philippines
Paul Joseph B Ramireza and
Earl Joanne S Santos
b
b College of Economics and Management University of the Philippines Los Bantildeos Philippines b Corresponding Author College of Economics and Management University of the Philippines Los Bantildeos Philippines
Received 21 August 2013 Revised 25 September 2013 Accepted 29 October 2013
ABSTRACT
Provision of public goods and services is one of the major roles of the government in an economy Some of
the public goods and services that are being provided cause negative effects while others create positive
externalities One evident case of such is the market for health care Aware of its role to provide health care to
the people governments are even more challenged with the remarkable growth of the demand for health care
Furthermore there are market failures existing in the health care sector Given that the paper examined the
effects of public spending on health care specifically on the principal causes of morbidity in the Philippines
Aside from public spending the paper also took into account private health spending in the analysis The
study employed a pooled ordinary least squares regression model Results showed that the increase in
government spending significantly reduce the number of tuberculosis cases in the Philippines On the other
hand results for diarrhea indicated that public spending and number of diarrhea cases are positively related
The findings imply that although an increase in public health expenditures can have a significant impact on
the number of cases of diseases lowering tuberculosis cases for instance the study can be further extended by
valuing as well the other benefits that can be derived from a prevented sickness resulting from an increase in
public health expenditures
Keywords health care morbidity positive externalities public goods public health expenditures
Ⅰ Introduction9
Economics texts suggest different extents to which
the government can intervene in market activities
Classical economists advocate that the main and in
some instances only role of the government is to
ensure peace and order in the economy ie ensuring
property rights are properly defined and laws and
policies are well-enforced Keynesian economists on
the other hand believe that the government has a
2013 International Academy of Global Business and Trade
All rights reserved
significant role as Keynes demonstrated during the
Great Depression At present different economies adopt
different blends of the two extreme cases However
common to all economies is the need for government
intervention in the presence of market failures and
missing markets given that the government can do
better than the market ie such intervention will not
lead to government failures resulting in further
inefficiencies
It is a known fact that one of the major roles of the
government in an economy is the provision of public
goods Paying no attention to it would result in under-
Analysis of Public Health Expenditures on Leading Causes of Morbidity in the Philippines
36
provision of such goods or worse not being provided
at all due to the free-rider problem Another widely
acceptable role of the government is to provide goods
or services that create a positive externality to the
society These goods or services are usually socially
underprovided since the individual in hisher own
private desire to maximize utility doesnrsquot consider the
beneficial effects to the society of such activities
Examples of such services are education and health
care This paper will provide a general overview of the
global demand for health care then focus on the role of
the government in health care provision in the
Philippines
Ⅱ Global Demand for Health Care
The concern for health is a global phenomenon
Despite the costs of health care services the demand
for health care is growing everywhere in the world
The surge of aging and chronic illnesses in the
developed countries and the shooting requirements of
the rising middle class accompanied by the lsquodiseases
of prosperityrsquo in the developing countries are all
driving demand Global pandemics that threaten the
world as well as environmental changes that cause
dramatic health care challenges are also adding up in
the demand for health care services
The rising demand for health care is evidenced by
the increased spending on health services The worldrsquos
total health expenditure as a percentage of Gross
Domestic Product (GDP) grew by 15 from 82 in
2000 to 94 in 2009 (Table 1) The American region
posted the highest growth in health expenditure as a
percentage of GDP at 26 while the South East
Asian region showed the least at 2 The growing
expenditure on health services are born from both the
public and private Public spending on health care is at
least about 50 for most of the countries The
spending has likewise grown by two percentage points
in excess of GDP growth across all Organization for
Economic Co-operation and Development (OECD)
countries for almost 50 years and is expected to be
more than a fifth of GDP by 2050 if the current trend
persists (Drouin et al 2008) As a result government
health agencies together with patients and health care
companies particularly in developing economies are
alarmed with the growth of health care spending
Given its current share of health care expenditures the
government is confronted with other increasing
demands of its people such as education defense and
pensions aside from demand for health care and the
escalating prices of health services
Table 1 Health Expenditure Ratios 2000 and 2009
Region
Total
expenditure on health
as of gross
domestic product
General government
expenditure
on health as of total
expenditure
on health
Private
expenditure on health
as of total
expenditure on health
General government
expenditure
on health as of total
government
expenditure
External
resources for health as
of total
expenditure on health
Social security expenditure on
health as of
general government
expenditure on
health
2000 2009 2000 2009 2000 2009 2000 2009 2000 2009 2000 2009
African Region 55 65 439 493 561 507 82 96 65 102 79 70
Region of the Americas 114 144 451 493 549 507 145 169 01 01 317 720
South-East Asia Region 37 38 319 371 689 629 44 49 09 16 133 144 European Region 80 93 739 749 261 248 140 146 01 01 522 495
Eastern Mediterranean
Region 42 47 472 509 528 491 69 71 10 11 184 194
Western Pacific Region 60 65 639 644 361 356 138 144 02 02 681 686
Global 82 94 563 591 437 408 133 143 03 04 451 595
Source World Health Organization (2012)
J Glob Bus Trade Vol 9 No2 (November 2013) 35-44
37
Moreover health care expenditures are signify-
cantly associated with improved health outcomes with
public health care expenditure having a larger impact
(Navignon et al 2012) Hence health care expendi-
tures are vital to improving the health status of the
society Relatedly Hurley (2000) stated that ldquothe
market failures that pervade the health care sector
create an important role both for non-market
institutions and for normative economic analysis to
help sort the ldquogoodrdquo policies from the ldquobadrdquo Thus
from a public policy perspective it is valuable to know
how a policy variable like public expenditures on
health care affects the principal causes of morbidity
rates
Ⅲ Status of Public Health
Expenditures in the Philippines
Public health expenditures include current and
capital spending from government budgets external
borrowing and grants and social health insurance
funds (HDR 2007) Although Fig 1 shows that the
budget allocated for public health care in the
Philippines is increasing in the past few years Fig 2
shows that compared to other Southeast Asian
countries the Philippines is actually way behind in
terms of public health care spending as percent of GDP
As a matter of fact according to the Human
Development Report (2007) the Philippines is one of
the countries around the world with the lowest
percentage ( of GDP) spent on public health
expenditure at 14 This current condition would
have a significant impact on the health and ultimately
the over-all productivity of the members of society
For instance the results of the study of Granlund (2006)
indicated that public expenditures on health care have
an effect on the number of absence days of individuals
Furthermore the results showed a positive causality
between health care expenditures and the health of the
society (Granlund 2006)
Sources Department of Budget and Management (2001-
2009)
Source Asian Development Bank (2008)
Since the budget for health is much less in the
Philippines as compared to most countries (and can be
safely assumed to be inadequate) the paper would
want to look at the impact on morbidity incidences
from increasing the current public spending on health
Though the study will just be limited to measuring the
impact on morbidity the results can then be used to
derive the value to society of higher public
expenditures in terms of less people afflicted or
infected by various diseases Unlike in the situation
where the public health care expenditure is already
sufficient (or optimal) it will be much easier to
estimate the external cost of inadequate public health
expenditure by measuring the forgone benefits (say it
resulted to an absence) from those people who were
infected In addition the results of the study could be
used to measure the externalities valued in terms of
cost savings if the spread of the disease was prevented
Analysis of Public Health Expenditures on Leading Causes of Morbidity in the Philippines
38
Ⅳ Leading Causes of Morbidity in the
Philippines
Morbidity may be referred as the state of poor
health the degree or severity of a health condition or
an incidence of a disease In the case of the Philippines
the leading cause of morbidity is pneumonia with an
incidence rate of 718 (per 100000 population) Table 2
shows the top ten leading causes of morbidity in 2007
while Fig 3 shows the trend in the number of cases in
the past few years for the major causes of morbidity
Table 2 Ten Leading Causes of Morbidity
Philippines 2007
Disease Number
of cases
Rate per
100000 population
ALRI and Pneumonia 605471 718
Acute Watery Diarrhea 539701 640 BronchitisBronchiolitis 487302 5778
Hypertension 398538 4726
Influenza 349609 4146 TB Respiratory 114714 136
Diseases of the Heart 31331 372
Dengue Fever 23773 282 Malaria 23207 275
Chickenpox 23090 274
Source Department of Health (2002)
Source Department of Health (2002-2007)
From Fig 1 and Fig 3 it seems that the increasing
public health care expenditures didnrsquot lead to a
significant decrease in the leading causes of morbidity
in the past few years However we cannot conclude
this immediately since there are other factors affecting
the number of cases like private health care
expenditures and population growth These other
variables would be considered later in analyzing the
impact of public health care expenditures on the
number of cases
Ⅴ Characteristics of Health Care
According to Hurley (2000) health care is distinct
from other commodities because of health care having
a combination of features that is only present
individually in other commodities Most of these
characteristics result in market failure or missing
markets causing inefficiencies like in the presence of
externalities information asymmetry and uncertainty
In each of these characteristics the government may be
able to minimize the inefficiencies resulting from these
market failures through public expenditures on health
care (which can be looked at as the policy variable of
the government) This somehow justifies the need for
government intervention on health care as a response
to these characteristics of health care
Though it is desirable to be able to disaggregate
public health expenditure as an answer to each of these
characteristics of health care it will not be easy as
policies on public health care usually answer the
inefficiency problem as a whole Thus the study
would focus on the rationale for public health care
expenditure as it provides a positive externality to the
society
51 Health as a Merit Good
A merit good is a good or service that is regarded
as desirable by the society such that the government
intervenes in its provision The idea is that these goods
and services provide positive externality to the society
and if left to individuals would tend to be under-
provided Thus the government can intervene to
correct this under-provision Common examples of
these merit goods are spending on public services such
as public education and public health care
In general the external benefits from health care
can be looked at in various ways According to Hurley
(2000) people may derive external benefit from
knowing that others receive the needed health care
J Glob Bus Trade Vol 9 No2 (November 2013) 35-44
39
services and not just any health care that a person can
afford In addition the externality from health care can
be looked at as the measure of joy (or prevention of
pity) caused by seeing a healthy person rather than a
sick one The problem however with this valuation of
the externality is that such joy or pity cannot be easily
quantified
An alternative way of looking at the positive
externality provided by the adequate (optimal) amount
of spending on public health would be the cost savings
from those who would have been affected if such
public health expenditures were not adequate (optimal)
The obstacle though is finding these cost savings if the
optimal amount of health expenditures is already in
place This is because one cannot predict who among
the millions or billions of people would have been
externally affected if the existing public health
expenditures were not in place In the case of countries
where public health expenditure is still inadequate we
can analyze the cost savings by looking at the effect of
an increase in public health expenditures on the people
who are currently experiencing diseases which may
have been prevented if the optimal level of expenditure
was in place
52 Prevention versus Cure
It is important to consider that the positive exter-
nalities from having optimal health expenditures can
be realized if such expenditures may have prevented
the spread of a communicable disease Thus if most of
the health expenditures were rather used for cures then
these positive externalities as we defined earlier
would not be realized to the fullest It is still important
to take note that cures also result in a positive
externality since it prevents the further spreading of the
disease given the carrier of the disease is cured as soon
as possible The government expenditures on disease
prevention and control and for infectious disease
prevention and control are exhibited in Fig 4 and Fig
5
Sources Department of Budget and Management (2002-
2009)
Sources Department of Budget and Management (2002-
2009)
Note that the sudden increase in the budget
allocated in both Figs during the 2008 and 2009 was
due to the Intensified Disease Prevention and Control
program introduced during 2008 This almost doubled
or tripled the budget allocation to these items as
compared to years before 2008 It is then desirable to
be able to see the impact of this significant increase in
the public health expenditures on the number of cases
however the data on the number of cases for 2008 is
not yet available
53 Communicable versus Non-
communicable Diseases
Externalities provided by the adequate amount of
spending needed for health care is more apparent in the
presence of communicable diseases In addition to the
general external effects discussed earlier communi-
cable diseases have additional external effects via the
probability of a healthy person being infected by the
Analysis of Public Health Expenditures on Leading Causes of Morbidity in the Philippines
40
person carrying a communicable disease Public
health expenditure may then lower this possibility of
infection to healthy people by providing health care for
people who cannot afford the needed medication
The situation under communicable diseases some-
how distorts the utility maximization problem of
individuals since the presence of a sick person implies
a higher chance of being sick also and thus lowers the
utility of the individual This external effect as pointed
out earlier would cause inefficiency if not recognized
Even though the benefits from societal prevention and
cure of communicable diseases are known the
problem changes to what we know as the free-rider
problem if individuals are left alone to solve the
problem
As we all know voluntary contribution would not
solve the problem due to the free-rider problem Free-
riding would be evident since contribution to
prevention doesnrsquot assure the contributor that he will
be the one that will be saved from the disease ie with
the prevention measures we assume that the infected
individuals will be much less but this doesnrsquot
specifically tell who these individuals are Since this is
the case a person may claim that he doesnrsquot need
prevention measures anyway since with or without the
prevention measure his final state will just be the same
(ie two extreme cases very healthy that in the end he
will be healthy or very vulnerable that heshe will
always be affected anyway) It is likewise possible that
people rather than donate may just choose to put this
prevention contribution into private health expendi-
tures by buying vitamins that give additional protection
or immunity This is the reason why public health
expenditure is essential in the case of communicable
diseases
We can then expect a more significant impact of
higher public expenditures on health care on the
number of communicable diseases as compared to
non-communicable diseases because of the additional
benefits from prevented infection Also we can expect
that public expenditures on health will have a lower
impact as compared to private health expenditures on
non-communicable diseases The paper would then
verify these hypotheses
Ⅵ Sources of Data and Analytical
Procedure
61 Sources of Data
The data used in the study were from various
national survey results gathered by various depart-
ments and agencies of the government Data for the
leading causes of morbidity and the number of cases
every year were taken from the Field Health Service
Information System (FHSIS) Annual Report The
FHSIS Annual Report reflects the activities and health
program accomplishments of the Department of
Health in the Philippines for a given year and serves as
a reference for planning and decision-making at the
local and national levels (FHSIS 2004) The FHSIS
also contains statistics on health systems health status
health services coverage and notifiable diseases in the
Philippines For the purposes of this study the data
utilized were the number of cases per region and per
year of the leading causes of morbidity in the
Philippines such as bronchitis tuberculosis influenza
hypertension and diarrhea
Data on Philippine government health care expen-
ditures were taken from the National Expenditure
Program (NEP) The NEP is an annual publication by
the Department of Budget and Management that
contains the details of the governmentrsquos proposed
program and intended to assist Congress in the review
and deliberation of the proposed national budget for
the legislation of the annual appropriations measures
for the succeeding fiscal year (NEP 2003) Annual and
per region data on public health expenditures were
elicited from the national government budget allocated
to the Department of Health Though it is desirable to
be able to split the expenditures into preventive and
curative measures the available data did not have such
information at the regional level
Data on household (private) expenditures for
health care were obtained from the Family Income and
J Glob Bus Trade Vol 9 No2 (November 2013) 35-44
41
Expenditure Survey (FIES) The FIES is a nationwide
survey of households undertaken every three years by
the National Statistics Office that contains data on
family income and expenditure such as levels of
consumption by item of expenditure as well as sources
of income in cash and in kind and provides
information on the levels of living and disparities in
income of Filipino families (FIES 2006) The study
utilized regional data on the average household
expenditure on medical care Data on the population
per region were also taken from the FHSIS Annual
Report while data on the number of households were
taken from the FIES
62 Analytical Procedure
As stated above it is not enough to just look at the
trends of morbidity cases and public expenditure to be
able to assess the impact of the latter to the former
There are other variables such as private health
expenditures and population at that period of time that
may also significantly affect the number of cases The
paper used a pooled ordinary least squares regression
model to analyze the impact of public health care
expenditures on the number of cases for the major
causes of morbidity in the Philippines from 2002-2006
across regions The model is given by
cases = f(pop privexp pubexp) where pop ndash regional population
privexp ndash average household expenditures
on health
pubexp ndash public health expenditures (lsquo000)
It is hypothesized that there is a positive relation-
ship between the number of cases and population On
the other hand a negative relationship between both
private and public expenditures and the number of
cases is expected
Ⅶ Results and Implications
71 Results and Discussion
Results from the empirical models of the different
morbidity causes are reported in Tables 3 and 4 Notice
that only the results for tuberculosis and diarrhea were
reported since neither public nor private expenditures
on health were able to explain the variation in the
number of cases for bronchitis pneumonia influenza
and hypertension
Table 3 Regression Results for Tuberculosis Cases
variable Coefficient standard error p-value
pop 00018028 00001077 0000
privexp -06158907 02659049 0023 pubexp -00059089 00024357 0018
constant 2103315 8129887 0012
Note highly significant at 1 significant at 5
711 Tuberculosis
The regression result showed that the model is
significant and was able to explain 87 of the
variation in tuberculosis cases based on the computed
adjusted R-squared Public and private expenditures on
health care were found to be significant (at 5) in
explaining the variation in the number of tuberculosis
cases while population was found to be highly
significant (at 1) The results conform to the
hypotheses that an increase in both public and private
spending on health care would result to a decline in the
number of tuberculosis cases Also an increase in the
population results in an increase in the number of cases
which was also expected
Estimates showed that on the average an increase
in the population by 555 increases the number of
tuberculosis cases by one Results also showed that an
increase in public health expenditures decreases the
number of tuberculosis cases Specifically the
estimated coefficient implies that on the average an
increase in public health expenditures by PhP169236
would lead to a one unit decrease in the number of
tuberculosis cases With the PhP16 billion total budget
for health in 2006 (PhP154 million of which was
allocated for tuberculosis prevention and control) an
additional 1 increase in government health expendi-
tures would approximately reduce the number of
tuberculosis cases also by 1 for the same year at the
Analysis of Public Health Expenditures on Leading Causes of Morbidity in the Philippines
42
country level In addition estimates showed that an
increase in the average household private expenditure
on health by PhP162 would result in a unit decline of
tuberculosis cases The value seems low at first glance
but this translates to a total of PhP166 million
spending on health for the household sector from the
174 million Filipino families across 17 regions in
2006 necessary to reduce tuberculosis cases by one
Interestingly public health expenditure seems to be
less costly in terms of preventing tuberculosis cases in
the country This is due to the fact that majority of
tuberculosis cases are experienced by poorer
households that rely more on public health care rather
than private health care which they cannot afford
Public health expenditures are also ideal for
tuberculosis cases because of the ancillary benefits
these provide by preventing the spread of this
communicable disease among the population
Table 4 Regression Results for Diarrhea Cases
variable coefficient standard error p-value
pop 00073148 00007181 0000
privexp -5919509 1773756 0001
pubexp 00385644 00162475 0020 constant 9123934 5423155 0097
Note highly significant at 1 significant at 5
712 Diarrhea
The regression result showed that the model is
significant and was able to explain 70 of the varia-
tion in diarrhea cases based on the computed adjusted
R-squared Public expenditures on health care were
found to be significant (at 5) in explaining the
variation in the number of diarrhea cases while
population and private expenditures on health care
were found to be highly significant (at 1) The results
conform to the hypothesis that an increase private
spending on health care would result in a decline in the
number of diarrhea cases while an increase in the
population results to an increase in the number of cases
However public health care expenditure and the
number of diarrhea cases were found to be positively
related One possible explanation for this result is that
public expenditure on health may be more oriented to
communicable diseases than non-communicable
diseases ie compared with the results of tuberculosis
In addition there are other significant factors that may
be affecting the prevalence of diarrhea which are not
incorporated in the public health care expenditures say
the availability of or access to safe drinking water
among others
Nevertheless results showed that an increase in the
average household private expenditure on health by
PhP017 or equivalently a total of PhP0174 million
spending on health for the household sector would
result in a unit decrease in the number of diarrhea cases
Estimates also showed that on the average an increase
in the population by 137 increases the number of
diarrhea cases by one in the country Results also
showed that an increase in public health expenditures
decreases the number of tuberculosis cases
72 Conclusions Implications and Further
Studies
The result of the study showed that public
expenditures on health care have a significant effect on
the number of tuberculosis cases in the Philippines
Although results for the other cases show that public
expenditure failed to explain the variation in the
number of cases it may be attributed to the unavaila-
bility of disaggregated data allocated for specific
diseases in each region This then can be considered as
the limitation of the study Nonetheless the results of
the study can be used to provide a rationale for the
abrupt increase in the spending for disease prevention
and control for 2008 and 2009
As pointed out earlier the result of the study can be
further extended by valuing the benefits that can be
derived from a prevented sickness resulting from an
increase in public health expenditures The benefits
may include the loss income from being absent
because of the disease and the prevented private
expenditures to prevent the disease Of course the
general external effects of being healthy or seeing a
healthy person may also be included as part of these
benefits These non-marketed goods which are
J Glob Bus Trade Vol 9 No2 (November 2013) 35-44
43
common to the health sector can be measured using
contingent valuation methods such as willingness-to-
pay (Hurley 2000) Knowing these benefits one can
then do a cost-benefit analysis of an increase in public
expenditure on health care Thus if the net benefits
that can be derived from a prevention of a tuberculosis
case is higher than PhP169236 which is the cost of
preventing it then it is rational for the government to
pursue an increase in public health care expenditure
References
Asian Development Bank (2008) Key indicators for
Asia and the Pacific 2008 Manila Author
Retrieved from httpwwwadborgsitesdefault
filespublication27728key-indicators-2008pdf
Connelly L B (2004) Economics and health
promotion The European Journal of Health
Economics (Formerly HEPAC) 5(3) 236-242
Chicago
Department of Budget and Management (nd)
Budget of expenditures and sources of financing
2000-2008 [Webpage] Retrieved from www
dbmgovph
Department of Budget and Management (2001)
Republic of the Philippines national expenditure
program 2001 Manila Author Retrieved from
httpwwwdbmgovph
Department of Budget and Management (2002)
Republic of the Philippines national expenditure
program 2002 Manila Author Retrieved from
httpwwwdbmgovph
Department of Budget and Management (2003)
Republic of the Philippines national expenditure
program 2003 Manila Author Retrieved from
httpwwwdbmgovph
Department of Budget and Management (2004)
Republic of the Philippines national expenditure
program 2004 Manila Author Retrieved from
httpwwwdbmgovph
Department of Budget and Management (2005)
Republic of the Philippines national expenditure
program 2005 Manila Author Retrieved from
httpwwwdbmgovph
Department of Budget and Management (2006)
Republic of the Philippines national expenditure
program 2006 Manila Author Retrieved from
httpwwwdbmgovph
Department of Budget and Management (2007)
Republic of the Philippines national expenditure
program 2007 Manila Author Retrieved from
httpwwwdbmgovph
Department of Budget and Management (2008)
Republic of the Philippines national expenditure
program 2008 Manila Author Retrieved from
httpwwwdbmgovph
Department of Budget and Management (2009)
Republic of the Philippines national expenditure
program 2009 Manila Author Retrieved from
httpwwwdbmgovph
Department of Health (2002) Field health service
information system annual report 2002 Manila
Author Retrieved from httpwwwdohgovph
sitesdefaultfilespublicationsFIELD20HEALT
H20SERVICE20INFORMATION20SYST
EM20ANNUAL20REPORT202002pdf
Department of Health (2003) Field health service
information system annual report 2003 Manila
Author Retrieved from httpwwwdohgovph
sitesdefaultfilespublicationsFIELD20HEALT
H20SERVICE20INFORMATION20SYST
EM20ANNUAL20REPORT202003_0pdf
Department of Health (2004) Field health service
information system annual report 2004 Manila
Author Retrieved from httpwwwdohgovph
sitesdefaultfilespublicationsFIELD20HEALT
H20SERVICE20INFORMATION20SYST
EM20ANNUAL20REPORT202004pdf
Department of Health (2005) Field health service
information system annual report 2005 Manila
Author Retrieved from httpwwwdohgovph
sitesdefaultfilespublicationsFIELD20HEALT
H20SERVICE20INFORMATION20SYST
EM20ANNUAL20REPORT202005_0pdf
Analysis of Public Health Expenditures on Leading Causes of Morbidity in the Philippines
44
Department of Health (2006) Field health service
information system annual report 2006 Manila
Author Retrieved from httpwwwdohgovph
sitesdefaultfilespublicationsFIELD20HEALT
H20SERVICE20INFORMATION20SYST
EM20ANNUAL20REPORT202006pdf
Department of Health (2007) Field health service
information system annual report 2007 Manila
Author Retrieved from httpwwwdohgovph
sitesdefaultfilespublicationsFIELD20HEALT
H20SERVICE20INFORMATION20SYST
EM20ANNUAL20REPORT202007_1pdf
Drouin J P Hediger V Henke N Kanzler L
Leydon E F amp De Santis P (2008) The Health
Care Century Health International 7 6-17
Granlund D (2006) The effect of health care expen-
ditures on sickness absence Paper Presented at the
Inaugural Biennial Conference of American Society
of Health Economists 2006 Madison WI
University of Wisconsin
Hurley J (2000) An overview of the normative
economics of the health sector Handbook of
Health Economics 1 55-118
Novignon J Olakojo S A amp Nonvignon J (2012)
The effects of public and private health care
expenditure on health status in sub-Saharan Africa
New evidence from panel data analysis Health
Economics Review 2(1) 1-8
Philippine Statistics Authority (nd) Family income
and expenditures survey 2000 2003 2006
[Webpage] Retrieved from wwwcensusgovph
United Nations (2007) Human development report
Retrieved from wwwhdrundporg
World Health Organization (2007) National health
accounts 2007 Geneva Author Retrieved from
httpwwwwhointen
World Health Organization (2012) World health
statistics 2012 Geneva Author Retrieved from
httpwwwwhointen
J Glob Bus Trade Vol 9 No 2 (November 2013) 45-60
45
ISSN 1946-5130
Journal of Global Business and Trade
wwwiagbtcom
Analysis of the Interests of Conceiving a Free Trade
Agreement between China and South Korea
Liu Zuankuoa and Zhan Baiming
b
a Shandong Normal University China b South-Central University for Nationalities China
Received 25 August 2013 Revised 22 September 2013 Accepted 28 October 2013
ABSTRACT
Based on the ldquoStarting Joint Minister Statement on free trade agreement between China and South Koreardquo
the article explains the basic ideas of this agreement It shows that there are some distinctive differences
between the statement and the theoretical study on interests China pays more attention to the diplomatic
significance rather than in trade While South Korea aims to guarantee its investment benefits by this
agreement both stations try to protect their producersrsquo benefits Finally this paper using the model GTAP
(Global Trade Analysis Project) puts forward two sets of simulation schemes and forecasts the economic
effects of the Free Trade Zones from the macroeconomics and welfare effects trade effects and industry
effects
Keywords analysis of benefits China-South Korea free trade agreement construction
Ⅰ Introduction10
Minister of Commerce Chen Deming and South
Korean Trade Minister Park Tae-ho attended the
China-ROK Trade Ministers Meeting in Beijing on
May 2nd 2012 and announced the official initiation of
China-ROK Free Trade Agreement negotiations on the
Ministersrsquo Joint Statement (referred to as ldquoStatementrdquo
as following) From the Free Trade Agreement (FTA)
we can see the basic ideas of the interest demands of
the Statement
The statement explains the basic ideas of the FTA
which includes trade in goods services investment
and other fields The interest demands reflected in the
2013 International Academy of Global Business and Trade
All rights reserved
Statement includes two aspects trade and investment
From the perspective of trade benefits the two
countries agreed that levels of trade liberalization in
good and service trades should go beyond those
promised levels in the WTO However there are some
sensitive product issues in the goods trade which
include lists of generally sensitive and highly sensitive
products From the perspective of investment benefits
the level and scope of liberalization were defined
according to both countriesrsquo investment arrangement at
present and in future Meanwhile the overseas
processing zones should be involved in China-ROK
FTA
Analysis of the Interests of Conceiving a Free Trade Agreement between China and South Korea
46
Table 1 MFN Tariff Levels of China and South Korea in Product Category ()
Category of products
China Korea
Average tax rate
Free tax rate Maximum Tax rate
Average tax rate
Free tax rate Maximum Tax rate
Livestock products 148 101 25 221 24 89 Milk products 120 0 20 675 0 176
Fruit Vegetable 148 59 30 574 02 887 Coffee Green tea 147 0 32 539 0 514 Grain 243 34 65 1345 03 800 Oilseed animal fat oil 110 53 30 370 41 630
Sugar Sweet 274 0 50 168 125 243
Drinks Cigarette 223 22 65 317 0 270 Cotton 152 0 40 00 1000 0 Other agricultural products 114 94 38 161 183 754 Fish and its products 109 63 23 161 07 50 Minerals Metals 74 87 50 46 269 8 Petro 48 200 9 41 107 8 Chemistry 66 16 47 57 67 321 Wood Paper 44 353 20 22 675 10 Textile 96 0 38 91 15 13 Cloth 160 0 25 126 0 13
Leather Shoes 132 06 25 79 26 16 Non-electrical machinery 80 90 35 60 226 13 Electronic machinery 83 240 35 62 214 13 Transportation equipment 115 08 45 55 268 10 Other products 119 96 35 67 160 13
Source World Trade Organization (nd)
The level of goods liberalization of the two
countries can be judged from WTO World Customs
Data 2011 In 2010 the simple average MFN tariffs
on agricultural and non-agricultural product imports
were 156 and 87 respectively while the simple
average MFN rates applied to Korea on agricultural
and non-agricultural products exports were 164 and
88 The simple average MFN tariffs on Korean
agricultural products and non-agricultural products
import were 485 and 66 while the MFN rates applied
to China on its agricultural products and non-
agricultural products export were 521 and 66 The
MFN import tariff rate of China and Korea divided by
product category is given via Table 1
Via Table 1 we can see that South Korea paid
more attention to protecting agricultural products (tax
rate 485) than industrial products (tax rate 66)
Therersquos a more than 40 percent difference in the simple
average MFN tariff On Chinarsquos part therersquos no big
difference between agricultural product protection
(156) and industrial product protection (87) the
gap of the simple average MFN tariff between these is
less than 10 percent Meanwhile South Korearsquos
protection on agricultural products (485) is much
higher than Chinarsquos (164) As for industrial product
protection there is a gap between China (156) and
South Korea (66) but the gap in industrial (9 or
so) is not as big as that shown in agricultural products
with a tax rate gap 42
From above it shows that the profit that China
benefits from the FTA mainly depends on the degree of
liberalization of agricultural products of South Korea
If this is the important part of South Korearsquos sensitive
products then the attitude expressed in the joint
statement ldquobeyond goods liberalization level of WTO
commitmentsrdquo has not displayed real significant trade
interests
In other words the previous various theoretical
insights on the China-Korea FTA are not the same as
the benefit idea implied in the statement
J Glob Bus Trade Vol 9 No 2 (November 2013) 45-60
47
Ⅱ Literature Review
With regard to the interests in the FTA negotiations
between China and South Korea Chinese scholars are
generally optimistic about the economic and trade
effects of the bilateral free trade agreement Xue Jing-
xiao and Zhang Bo-wei (2004) believed that Chinarsquos
GDP would grow if China and South Korea were to
establish a free trade area Huang Peng and Wang Jian-
xin (2010) analyze the potential effect of applying
GTAP in constructing a free trade zone between China
and South Korea which indicates that after the
fulfillment of the China-ROK FTA the two countriesrsquo
GDP and components such as consumption
investment government expenditure and so on
compared to the base period all experienced positive
growth South Korea obtains a greater benefit with a
growth rate of 207 while Chinarsquos only 018 Song
Jingen (2011) on the basis of a traditional trade gravity
model studied the effects on trade after the two
countries signed the free trade agreement The results
show that China and South Korearsquos agreement played
a strong role in promoting the trade of both countries
and the total volume of trade would increase nearly
60 He suggests that both countries should pay
attention to the opportunities brought by the agreement
when they are protecting their sensitive sectors Li
Xiao-feng and Gui Jia-yue (2009) based on partial
equilibrium estimates the effects of the establishment
of the China-ROK Free Trade Zone on bilateral trade
flows from the industrial level The simulated results
show that if China and Korea do not established a free
trade zone to a larger extent trade between China and
South Korea would be heavily influenced by the trade
diversion from the Korea-US Free Trade Zone If the
two countries establish a free trade zone it will be
more conducive to the development of comparative
advantages of both countries
Analysis of academic research on China-ROK free
trade agreements has a more rigorous theoretical
condition namely the import tariffs of all goods should
be canceled in the China-ROK FTZ Before the
implementation of the FTZ the higher the tariff is the
greater the increase of imports caused by the tariff
reductions will be From the perspective of exports
before the completion of a bilateral free trade zone the
higher the tariff of partner country is the greater the
exporterrsquos export growth will be after establishment
The joint statement announced by the ministers of
China and the ROK showed that on the one hand the
level of liberalization of trade in goods should
transcend their level of commitment in the WTO On
the other hand the problems of sensitive products
should be a concern A longer transitional period
partial concessions and exceptions should be used to
handle sensitive product issues It is not known which
products are arranged for a longer transition period
partial concessions or exceptions but it will greatly
reduce the expected trade benefits by theoretical study
because the theoretical results used free trade and tariff
barrier elimination as a precondition Meanwhile
when both countries regard their disadvantaged
industries as sensitive products to go beyond the
commitment level in the WTO as agreed in the joint
statement will be quite limited in the scope Thus the
domains of free trade will be relatively small
Professor Yorizumi Watanabe (2009) of Keio
University in Japan analyzed the historical significance
of the FTA among China Japan and South Korea and
pointed out that China makes free trade agreement
policies for three reasons on foreign affairs and
commercial intercourse First in maintaining the
double-digit rapid development in economy China has
become the ldquoworld factoryrdquo and it is imperative to
ensure the market of related industries Second China
has become a world power so it needs to show
Southeast Asian countries an image of a ldquogood
partnerrdquo so as to avoid being seen as a threat Third by
means of drawing those overseas Chinese who have
engaged in long-term economic activities in the
neighboring countries China formed the ldquoGreater
China Rimrdquo and turned it into Chinarsquos powerful
ldquoperipheryrdquo
The interpretation of the motives of Chinarsquos
making of free trade agreement policies by Professor
Watanabe made people feel that Chinarsquos interest
Analysis of the Interests of Conceiving a Free Trade Agreement between China and South Korea
48
demand consists of two aspects commercial inter-
course and diplomacy However regardless of the
relationship of bilabial trade between China and Japan
or between China and South Korea Chinarsquos
advantages in industry are mainly on textiles clothing
leather shoes and other products but the tariff rates of
Chinarsquos MFN of such goods are higher than those of
South Korea and Japan Meanwhile the Chinese
mainlandrsquos ldquoworld factoryrdquo status is a product of the
processing trade China has been acting the role of
assembling and integration in the East Asian labor
division system and the commodities in bilateral trade
between Sino-Korea and Sino-Japan are mainly
constituted by the intermediate input products This
means that Chinarsquos participation in the construction of
the FTZ with Japan and South Korea is not to ensure
the market of related industry and thus its trade
interests are far less than the diplomatic interests which
Professor Watanabe referred to Economists of South
Korea predict that the FTZ has a very large impact on
the Korean economy while there is a relatively small
impact on China For China the strategic goal of the
China and South Korea FTZ is greater than economic
significance while for South Korea the motivation of
getting economic interests is stronger China promoted
the China-ROK FTZ in order to ensure a dominant
position within the East Asian region which cannot
only impact America who took advantage of allies in
Asia to constrain China but also rely on the regional
group to enhance Chinarsquos status in the international
political situation and the multilateral system (Zheng
Zhi-shu 2009)
The interest that South Korea obtained from the
China-ROK FTA depends on the degree of liberali-
zation of Chinese industrial products If Chinese
industrial products constitute a major part of the
sensitive products in China the trade interest of South
Korea would not be significant So the motives of
South Korea negotiating bilateral free trade agreements
with China does not come from trade but from the
following that will be discussed in the third part of the
international investment interests
Ⅲ The Benefit Analysis
31 The balance of Investment Interests and
Trade Interests
Before China and the ROK passed the ldquothe
Associate Ministerial Statement of Starting China-
Korea Free Trade Agreement Negotiationsrdquo China
Japan and the ROK held investment agreement
negotiations in Beijing reached an agreement on all
the remaining issues in the investment agreement and
drafted the agreement on March 21st 2012 Three
parties said they would soon complete their internal
procedures so as to sign the agreement as soon as
possible
From the view of the sequence of time the
successful termination of negotiations on investment
agreements among China Japan and ROK preceded
the starting of negotiations on a bilateral FTA between
China and ROK This indicates that relative to the free
trade agreement the three countries are more
concerned about investment agreements or that South
Korea is keener on the investment issues among the
three countries or between the two countries South
Korean President Lee Myung-bak said that in the
investment agreements among the three countries the
dispute settlement mechanism was included between
the investors and the host country which can provide
legal protection for investors if they suffer a loss on
investment in the host country
Meanwhile the joint statements of two countries
also made clear the important position of investment in
the FTA In the area of investment for proper handling
of issues related to bilateral investment between the
two countries they will confirm the level and scope of
liberalization and take the current and future bilateral
investment-related arrangements into account
When the international economic integration has
developed both in scope and in depth from trade to
international production many bilateral and regional
free trade agreements reflected the feature of the trade
and investment integration such as the North
American Free Trade Agreement In most cases the
J Glob Bus Trade Vol 9 No 2 (November 2013) 45-60
49
countries that are dominant in international investment
will make use of the form of the FTZ to protect its
interests of overseas investments from losses
In terms of the structure of bilateral trade in goods
between China and ROK Korearsquos exports to China
mainly consist of productive goods Table 2 shows
classified by BEC the imports and exports of Chinarsquos
trade in goods to the ROK
Table 2 shows that during the 13 years from 1998
to 2010 among the types of Chinese and South
Korean BEC commodities the following conclusions
can be made according to the changing of exports and
imports of capital goods intermediate goods and
consumer goods
First the imports and exports of intermediate
goods in the cargo trade between China and the ROK
come in on top According to the SNArsquos three basic
categories of goods the annual average import and
export composition ratio of intermediate goods capital
goods and consumer goods trade between China and
Korea were respectively 722 164 and 112
Relative to capital goods and consumer goods the
exceeding ratio balances of intermediate goods trade
value are respectively 56 and 60 percentage points
Table 2 China amp South Korea Goods Trade Structure 1995-2010 (Classified by BEC)
(Unit Hundred Million Dollars)
Intermediate
Goods
Exports
Intermediate
Goods
Imports
Consumer
Goods
Exports
Consumer
Goods
Imports
Capital
Goods
Exports
Capital
Goods
Imports
1995 50 85 14 4 3 13
1998 43 134 12 5 8 11
1999 51 154 17 5 10 13
2000 73 204 25 6 15 22
2001 72 200 33 6 19 28
2002 90 217 43 7 22 61
2003 118 311 51 7 31 108
2004 167 455 61 11 49 153
2005 226 590 66 13 58 161
2006 296 702 83 15 65 173
2007 388 797 94 18 81 213
2008 508 869 96 19 132 223
2009 321 784 76 15 135 212
2010 421 1051 97 24 166 289
Source United Nations Statistics Division (nd)
From the composition of exports and imports
among all of Chinarsquos exports to South Korea the
annual average rates of intermediate goods capital
goods and consumer goods were respectively 642
202 and 155 The rates of these three types of
goods in Chinarsquos annual imports from South Korea
were respectively 803 174 and 22 For
intermediate goods the proportion of Chinarsquos exports
to South Korea is less than that of imports from South
Korea and the balance is up more than ten percentage
points
Second the proportion of the goods used for
production in the cargo trade is much higher than that
of the consumption part In Economics capital is
defined as the products that are produced by the
economic system itself and used as input factors so as
to further produce more products and labor service
According to the basic principles of economics
capital goods and intermediate goods with the
characteristics of production can be considered inputs
for the production of capital goods Statistics show that
the sum of annual import and export proportion is
nearly 886 leaving less than 12 to consumer
goods The very low proportion of consumer goods
trade between China and South Korea shows us the
Analysis of the Interests of Conceiving a Free Trade Agreement between China and South Korea
50
basic characteristics of the internationalization of
production behind the commodity trade structure
Regarding Chinese goods exported to South
Korea the annual average proportion of goods which
had entered the production process was 798 and
continued to rise from 784 in 1995 to 811 in
2005 and to 857 in 2010
Meanwhile the goods that China imported from
South Korea have a higher proportion for production
use and the annual average is almost up to 979 In
1995 the share was 956 and since 2003 its share
has always remained above 98
The proportion (approximately 98) of Chinarsquos
imports of productive goods from Korea is 18 higher
than that (about 80) of Chinarsquos exports indicating
that the degree of Chinarsquos dependence on South Korea
is higher than South Korea on China
Central Bank of Korea (June 14 2011 ) released
the ldquo2010 South Korean Current Account Balancerdquo
which said that the export growth of semiconductors
machinery precision machinery and other goods are
increasing significantly and the trade surplus to China
of such goods is increasing from $3697 billion to
$5104 billion
The formation of this kind of trade structure to a
large extent can be explained reasonably by South
Korearsquos direct investment in China From the
perspective of the trade of intermediate goods Li
Xian-zhu (2010) Ye Jing-yi and Wang Pei (2005)
explained the trade imbalance between China and
South Korea When analyzing the Korean chronic
surplus phenomenon in long term they pointed out
that one of the reasons is that there are many Korean
investment enterprises in China and most are
processing companies required to purchase a large
number of Korean raw materials and accessories for
processing The import of the raw materials and
accessories required by Chinarsquos processing trade is
mentioned above that is Chinese importation of
intermediate goods by BEC classification Some
scholars explained the trade imbalance from the point
of capital goods trade that South Korea has a
competitive advantage in the production of capital
goods that when coupled with the adjacent location is
conducive to reduce transportation costs and thus
South Korea has become one of the main countries for
China to get capital goods from for processing trade
which expanded the size of imports from Korea (Zhao
Fang amp Li Ji 2010)
Statistics show that from 1998 to 2010 among the
foreign direct investments divided by countries and
geographical areas Japan and South Korea have
always been Chinarsquos major source countries for foreign
investment Except those years of the financial crisis
(1998 2008-2009) the proportion of Japan and South
Korearsquos direct investment in China accounted for 13 -
20 For example in 2005 South Korearsquos direct invest-
ment was up to 5168340000 US dollars accounting
for 86 of Chinarsquos total $60324590000rsquos absorption
of foreign investment Japanrsquos direct investments were
6529770000 US dollars accounting for 1082
South Korearsquos direct investment is mainly in the
manufacturing industry By 2005 South Korean
investment in China is mainly focused on the
manufacturing and assembly of electronic appliances
textiles and clothing leasing and business services
food and beverage and retail industries among which
manufacturing accounted for dominance (Yang Li amp
Zhou Wenfeng 2008 ) However in the manufacturing
sector the investment structure of South Korea has a
tendency of changing from the consumer goods
industry including fiber clothing food manufacturing
leather footwear and others to capital goods industries
including electronic communications petrochemical
alloy machinery and equipment and others (Zang Xin
Dong Rongrong amp Cui Yan 2006)
In order to protect the interests of foreign invest-
ment one of the conditions that Japan and South
Korea agreed to in the China-Japan-Korea FTZ nego-
tiation was the signing of ldquoCJK investment agree-
mentsrdquo The tripartite negotiations started in 2007 with
content that included all the important aspects
contained in the international investment agreements
including such clauses as the definition of investment
scope of application MFNT national treatment
J Glob Bus Trade Vol 9 No 2 (November 2013) 45-60
51
expropriation transfer subrogation taxes general
exceptions and dispute resolution
32 The Balance of the Interests of Producers
and Consumers
According to the Yonhap News Agency on
January 12th 2012 the foreign minister of South
Korean Park Taeho said at a press conference held in
the central government office that China as a big
country made a lot of people worried that Korearsquos
agriculture might be pounded South Korea was not
going to allow massive Chinese agricultural products
into South Korea Before starting the China-ROK FTA
negotiations the Korean Government would fully
listen to the views of different fields
Table 3 The Share of South Korearsquos Agriculture in the National Economy 1998-2010
()
Agricultural Labor
Manufacturing Labor
Labor Services Agricultural
Output Manufacturing
Output Services Output
1998 019 2405 4081 336 4511 4044
1999 019 2406 4081 328 4645 4015 2000 017 2453 4087 297 4736 4015
2001 017 2421 4079 287 4557 4182
2002 016 2323 4103 262 4490 4282 2003 016 2316 3989 243 4480 4241
2004 014 2306 3884 239 4727 4034
2005 015 2278 3795 219 4794 4013 2006 014 2165 3468 209 4801 4032
2007 014 2092 345 195 4818 4033
2008 012 2012 3444 184 5064 3833 2009 013 1944 3484 194 4960 3912
2010 013 1909 3484 178 5211 3739
Source Database provided by Korearsquos Banks
Compared with the manufacturing and service
industries the proportion of South Korearsquos agriculture
is not so significant in the national economy The
proportion of employees in the total economic activity
decreased from 019 in 1998 down to 013 in 2010
and the proportion of the total value of agricultural
production in GDP decreased from 336 in 1998
down to 178 in 2010 If the China-ROK FTA finally
regarded the South Korearsquos agriculture as sensitive
products and put it outside the free trade it is no doubt
that this is only to protect the benefits of very few
agricultural producers by sacrificing the interests of
many other consumers
Let us observe the issues of Chinese sensitive
products Chinese Commerce Minister Chen Deming
said that the sensitive products taken into account in
the process of negotiation were related to agriculture in
Korea and Chinarsquos petrochemical electronics
machinery and other fields
Not completely identical to the situation of South
Korearsquos agriculture in the national economy from 1998
to 2010 the ratio of employees in Chinese petroche-
mical electronics and mechanical industries among the
countryrsquos total employment is not high but there is a
rising trend In 1998 Chinese petrochemical and
machinery industry employment accounted for 088
and 157 respectively of the countryrsquos total
employment In 2010 this proportion respectively rose
to 154 and 388
Similarly the ratio of the petrochemical and
mechanical fields in GDP also showed an increasing
trend and its share enlarged In 1998 the ratios were
135 and 213 In 2010 the ratios respectively
increased to 614 and 1173
Table 4 shows that Chinarsquos petrochemical and
machinery industries are growing and developing
rapidly From the production valuersquos movements of
ratio in GDP we can see that from 1998 to 2010 these
Analysis of the Interests of Conceiving a Free Trade Agreement between China and South Korea
52
two sectors in initial stages accounted for 348 of
GDP and by 2005 641
Chinese petrochemical products cover a wide
range of sectors In Chinarsquos Statistical Yearbook they
included the petroleum processing and coking industry
chemical materials and products manufacturing
chemical fiber manufacturing rubber and plastic
products industry Electronic and mechanical fields are
statistically included in machinery and equipment
involving manufacturing industries in common
equipment special equipment transportation
equipment electrical machinery and equipment
electronic and communications equipment instrument
and apparatus and office machinery
Table 4 The Share of Chinese Petrochemical and Machinery Industriesrsquo in the National Economy 1998-2010
()
Petrochemical Industry
Labor Proportion Machinery Industry Labor Proportion
Petrochemical IndustrialGDP
Machinery IndustrialGDP
1998 088 157 135 213
1999 081 145 139 222 2000 074 133 160 240
2001 068 124 155 253
2002 065 121 158 282 2003 098 191 178 340
2004 101 209 224 423
2005 113 244 230 411 2006 119 266 483 883
2007 127 296 554 1028
2008 141 344 608 1119 2009 143 344 547 1059
2010 154 388 614 1173
Source ChinaStatistics (2011)
Chinarsquos petrochemical and machinery accounted
for a high ratio in GDP The number of the labor force
in these two industries was not big and their sum share
is no more than 6 (542 in 2005) in the whole
national economy Thinking about it another way from
the perspective of proportion of factors Zhan Boming
and others (2010) observed and analyzed Chinarsquos
industrial enterprisesrsquo inclination in investment They
found that investment made by state-owned
petrochemical and machinery enterprises have capital
intensive investment tendencies and the investment of
the three-kind investment enterprises in these two
industries are petrochemical capital intensive while
labor-intensive industries including machinery and
transportation equipment manufacturing electronic
and communication equipment manufacturing The
fact means that the idea of separating the Chinese
petrochemical and machinery from the China - Korea
Free Trade Agreement negotiations are to protect those
investorsrsquo interests at the expense of the interests of
numerous consumers
If the Chinese petrochemical products and
machinery products are to be put outside the China-
Korea Free Trade Agreement as sensitive products and
South Korearsquos agricultural sector is also separated
from China-Korea free trade agreement then we can
say such a bilateral free trade agreement almost has no
sense of free trade
Ⅳ Simulation Analysis of the
Economic Effects of China-Korea
FTA
A GTAP model is used in this part to predict the
economic effects if the China-Korea free trade zone is
established
41 Basic Structure of the Model
The GTAP model was developed by Professor
Tomas W Hertel of Purdue University as a multi-
J Glob Bus Trade Vol 9 No 2 (November 2013) 45-60
53
national and multi-sector general equilibrium model
and it has been widely used in trade policy analysis In
the GTAP model framework first sub-models that can
detail description of each countryrsquos (or regionrsquos)
production consumption government spending and so
on are created and then the various sub-models are
combined into a multi-national and multi-sector
general equilibrium model through international
merchandise trade relations When using this model
framework for policy simulation it can also be used to
explore the changes that the policy brings in each
nation and sectorrsquos production import and export
commodity prices supply and demand factors
elements of remuneration GDP and the level of social
welfare
42 Basic Assumptions
421 Conditions of Factors
There are five different types of elements in the
model land capital skilled labor unskilled labor and
natural resources A GTAP model assumes that the
market is perfectly competitive the scale of production
unchanged and each product produced by using
nested constant coefficient to replace elasticity equa-
tion The intermediate inputs consist of domestic and
foreign products through constant coefficient instead of
elasticity equation The products (domestic and import
goods) of different regions are non-homogeneous and
therefore cannot be replaced with each other In the
factor market land among departments is not
completely mobile so the price of land for different
uses is different while the labor in the country is
allowed to flow freely Each country has only one
account to which all the income tax and endowments
are accumulated Then through the Cobb-Douglas
Utility Function income is divided into private
consumption savings and government consumption
by a fixed proportion In a GTAP model there are two
imaginary international departments which are
International Bank and International Traffic Each
countryrsquos savings are accumulated to an International
Bank being allocated among countries according to
the rate of capital return The International Traffic
Department can balance the differences between CIF
and FOB and link the world through bilateral trade
422 Conditions of Behavioral Agents
There are three kinds of typical behavior agents in
the model private departments government
departments and firms
4221 Behavior of Private Department
In private expenditure the private sector consump-
tion expenditure has the nature of non-homothetic
order and should include the impact of population
growth the private department sets levels by using a
CDE Utility Function on a per capita basis Private
department behavior equation
① Private Household Utility
② CompoSITC Demand
③ CompoSITC Tradeable
In these equations yp (r) stands for the regional
units of the private sector household expenditure of r
region ppriv (r) stands for the price index of private
sector household unit consumption expenditure of r
region UELAS stands for the relative utility costs and
elasticity pop (r) stands for the population of r region
qp (i r) stands for the demands of i product in r
regional private department unit EP (i k r) stands for
the cross-price flexibility between irsquos demands and krsquos
price in r regional household unit EY (i r) stands for
the demand of composite commodity i in r regional
household unit pp (i s) stands for the demand price of
integrated trade commodity i in a private household
unit of s region PMSHR (i s) stands for the share that
Analysis of the Interests of Conceiving a Free Trade Agreement between China and South Korea
54
the total imports in the private sector demand for
domestic products of s region ESUBD (i) stands for
the elasticity of substitution between domestic and
imported good i ppd (i s) stands for the demand price
of commodity i in s regional private department unit
qpd (i s) stands for the demand of the national product
i in s regional private department unit ppm (i s) stands
for the demand price for import integrated trade
commodity i in s regional private department unit
qpm (i s) stands for the import demand of product i in
s regional private department unit
4222 Behavior of Government Department
The total government expenditure allocates
between the various commodities via using a Cobb-
Douglas Utility Function This makes the government
expenditure on various commodities of their total
remains constant In an open system the governmentrsquos
demands can be divided into domestic products and
imported products and both of the products form an
integrated product through the CES Function
Government department action equation
① Government Utility
② Demand for CompoSITC Goods
③ CompoSITC Tradeable
In these equations yg (r) stands for the regional
government expenditure of r region pop (r) stands for
population of r region pgov (r) stands for the
consumption expenditures price index of government
departments in r region ug (r) stands for the average
capital expenditure utility level per people from the
government spending in r region VGA (i r) stands for
the expenditure buying i goods in r regional
government departments GOVEXP (r) stands for the
consumer spending in r regional government
departments pg (i r) stands for the demand price of
comprehensive trade i product in r regional
government departments qg (i r) stands for the
demand of i goods in r regional government
departments GMSHR (i s) stands for the government
departmentrsquos share of demand for national products in
total imports in s region pgd (i s) stands for the
demand price of domestic integrated i good in s
regional government departments qgd (i s) stands for
the demand of domestic i product in s regional
government departments pgm (i s) stands for the
demand price of imported comprehensive trade i good
in s regional government departments qgm (i s)
stands for the imported demands of i product in s
regional government departments ESUBD (i) stands
for the elasticity of substitution between domestic
goods and imported goods
4223 Behavior of the Firm
GTAP model assumes that manufacturers use Tree
Structure in the production function Firmsrsquo main
inputs can be divided into the original inputs and
intermediate inputs Suppose the production function
has the characteristics of divisibility and fixed scale
compensation Under the divisibility assumption
firmsrsquo decisions on the most appropriate volume of
original input is not influenced by the changing of
intermediate input price and quite reverse is true
Meanwhile under the assumption of fixed scale
compensation the proportion of factor input of firms
will not be influenced by the changes in production
volume either
On the top of Tree Structure it shows firmsrsquo
decisions of demand between intermediate inputs and
integrated original inputs Under the assumption of the
Leontief Function it shows a fixed proportional rela-
tionship between the intermediate input and original
comprehensive input and total output This is common
in general design of CGE model of which the main
advantage is that it can reduce the number of para-
meters needed to estimate in the model significantly
The bottom left part of the Tree describes the
J Glob Bus Trade Vol 9 No 2 (November 2013) 45-60
55
relationship between the original investment and
production
Assume that the relationship between the original
input and the production is CES Function and the
elasticity of substitution between different original
elements is equal Accordingly sum up the original
inputs in order to obtain the Aggregate Primary Input
At the bottom right part of the Tree Structure it shows
the relationship between the intermediate input and
production which consists of two sides First is the
substitution relationship between the domestic
products and comprehensive imported products
assuming both compose into integrated intermediate
goods through CES Function Second is the
substitution relationship among different sources of
imported intermediate goods assuming which are also
integrated through the CES Function Behavior of
Firm equation
① CompoSITC Intermediate Nest
② Valuemdashadded Nest
③ Total Output Nest
In these equations pf (i j r) and qf (i j r) stands
for the price and demand of i product while producing
j good in r region af (i j r) stands for the technological
change of original feature i in j industry of r region
FMSHR (i j r) stands for the share that r regionrsquos total
imports among the demand for domestic compre-
hensive products pfm (i j s) stands for the demand
price of integrated commodity i in j industry of s
region qfm (i j s) stands for the firmsrsquo total demands
of imports pfd (i j r) stands for the demand price of
domestic comprehensive commodity i in j industry of r
region qfd (i j s) stands for the firmsrsquo demand for
domestic products ESUBD (i) stands for the elasticity
of substitution between domestic and imported goods
pva (j r) stands for the added-value price of producing
j good in r region qva (j r ) stands for the added-value
of j industry in r region ava (j r) stands for the
technological changes of the added-value in j industry
of r region SVA (k j r) stands for the share of added-
value product i in j industry of r region pfe (i j r)
stands for the price of original element i which needed
to produce j product of r region qfe (i j r) stands for
the demand of original element i which needed to
produce j product of r region afe (i j r) stands for the
technological changes of original element i in j
industry of r region ESUBVA (j) stands for the
elasticity of substitution between original elements
during the added-value production in j industry qo (j r)
stands for the output of j department of r region ao (j r)
stands for the technological changes of output in j
department of r region ps (j r) stands for the supply
price of j product in r region ESUBT (j) stands for the
elasticity of substitution of intermediate inputs while
producing j product
423 Equilibrium Condition
A GTAP model assumes a regional household unit
includes a private department and government
department to determine the consumer behavior and
savings behavior of the private department and
government department in the country or region The
Model can be divided into a Closed System and an
Open System Without the government intervention in
a Closed System the income of regional household
unit comes from the reward of selling its own elements
to the firm Firmrsquos incomes come from the purchase of
each householdrsquos expenditure and every manufacturer
also makes money by selling their intermediate goods
All economic behavior expenditures and incomes are
equal Balance of a single country Closed System is
established by the accounting identities and market
equilibrium formula In an Open System due to the
Analysis of the Interests of Conceiving a Free Trade Agreement between China and South Korea
56
joining of foreign departments the government
expenditure and the private spending in local regional
department will be divided into two parts buying
domestic products and imported products
Furthermore some parts of firmrsquos intermediate raw
materials may also be imported and its products are
sold both domestically and abroad
Regional household unitsrsquo behaviors are basically
determined by Aggregate Utility Function which
consists of government expenditure private spending
and savings It is assumed the per capita Cobb-
Douglas Utility Function is adopted and this regional
household unit pursues the utility maximum of a
household unit As a result of using the Cobb-Douglas
Utility Function the proportion of three kinds of
current consumptions that were mentioned above is
fixed
43 The Analysis Method and the Simulation
Program
This article uses the seventh edition GTAP model
which includes 113 countries and 57 sectors In the
model the author combines 113 countries or regions
into three regions China Korea and other parts of the
world 57 industry sectors will be divided into 10 kinds
of product groups 1) food and crops 2) livestock and
meat products 3) forest rivers coal natural gas and
other minerals 4) processed foods 5) Textiles and
clothing 6) light manufacturing 7) heavy industry 8)
Utilities and construction 9) Transportation and
communication 10) other services
In order to fully investigate the effects of trade
liberalization this paper intends to respectively
measure the economic effects of a free trade zone
under two kinds of tax reductions program one
simulates a ldquozero tariff base scenariordquo under the
condition that both China and Korea have a full range
cancellation of goods trade tariffs In program 2
considering the protection of its sensitive industry with
the exceptions of Korearsquos high tariffs on food and crop
departments and the exception of Chinarsquos industrial
sector (light manufacturing and heavy industry) other
department tariff reductions will be by half
44 Simulation and Results of Analysis
441 Economic and Welfare Effects
According to model calculation results (shown in
table 5) we can see from the aspects of GDP growth
In program one after the completion of the China-
Korea free trade zone GDP in both China and Korea
show growth compared to the base period Korea
benefits more with a GDP increase of 139 billion
dollars and a growth rate of 206 China only
increases 25 billion dollars and the growth rate is
015 In program two the GDP of both China and
Korea shows growth compared with the base period
too respectively rising 74 and $540 million
considerably less than the GDP growth in program one
with full exemption of import tariffs This is because
program two still has different levels of trade
protection which leads to inefficient allocation of
resources After the establishment of a free trade zone
in the program one and program two countries with
larger benefits are different Korea benefits more in
program one China benefits more in program two
This is because the two countries have the same tax
reduction in program one Because the trade barriers
between Korea and the other countries in the world are
lower and according to the customs alliance theory
the lower the trade barriers between the Customs
Alliance member countries and other countries in the
world are the establishment of a customs alliance is
less likely to cause more costly trade transfers Under
the condition of full reduction and exemption of tariffs
and zero tariffs China may show a bigger trade
transfer effect thus Korea benefits more In program
two because of the protection for the sensitive food
and crop industry the allocation of resources is less
efficient in Korea
From the point of changes in the countryrsquos welfare
total welfare increases 4964 billion dollars in Korea in
program one while China reduces 653 million dollars
Korearsquos welfare increase is mainly caused by the
improved resource distribution efficiency and trade
conditions Chinarsquos entire welfare reduction is because
of the larger trade diversion effect In program two
J Glob Bus Trade Vol 9 No 2 (November 2013) 45-60
57
both two countriesrsquo welfare increases with Chinarsquos
growth of 189 million dollars and Korearsquos 65 million
dollars Compared to program one the increasing
volume of Korearsquos welfare significantly drops largely
because of Korearsquos high tariffs on food and crop
protection which results in a lower efficiency of
resource allocation
From the view of other regions in the world either
in program one or program two the GDP and welfare
decline at different degrees This means establishing a
free trade zone no matter what level of tax reduction
is conducive to economic growth for member
countries but this will bring adverse changes for those
regions excluded in the free trade zone
From the above analysis the establishment of
China-Korean free trade zone will promote the growth
of the national economy and social welfare regardless
of what level of tax reduction but for other regions in
the world it will bring a negative adverse change
Table 5 Changes of the Economy and Welfare in Different Programs ()
Program One Program Two
Change of GDP
Change Rate of
GDP
Welfare (million of
US dollars)
Change of GDP
Change Rate of
GDP
Welfare (million of US
dollars)
China Korea
Other regions in the world
25051 139023
-277225
015 206
-007
-65303 496385
-42123
74118 54328
-380194
005 008
-001
18941 16497
-15370
Source Compiled according to the result of Rung TAP operation
442 Trade Effects
According to the results of the model calculation
(shown in Table 6) it shows whether canceling all
import tariffs on goods or protecting part of industry by
cancellation of part of tariffs the bilateral trade has an
increase The exports and imports of other regions in
the world experienced varying degrees of reduction
Chinarsquos total economic output is larger so the
establishment of a China-Korea FTZ has less impact
on Chinarsquos import and export level as on Korearsquos The
tax reduction level in program two is not as large as in
program one and in program two some industries are
protected So compared to the program one trade
barriers cause lower efficiency in resource distribution
and the impact on imports and exports is smaller than
in program one
From the terms of the changes in trade either in
program one or program two the China-Korea free
trade zone improves the membersrsquo trade condition to
some degree Specifically Korea benefits more This is
because Korea has more open trade liberalization
whose tariffs on main trade products have been
reduced to a very low level According to the customs
alliance theory the lower the trade barriers between the
Customs Alliance member countries and other regions
in the world is the establishment of a customs alliance
is less likely to cause more costly trade transfers so the
establishment of a China-Korea free trade zone has
little impact on Korearsquos trade transfer and Korea
benefits more from the changes in trade condition than
China
For the other regions in the world under both
kinds of tax reduction and exemption programs there
are different degrees of reduction in import and export
trade conditions indicating that although the establi-
shment of a free trade zone can increase imports and
exports and improve trade conditions for member
countries it can cause an adverse trade effect for the
non-member countries elsewhere in the world
Through the above analysis we can see that after
the establishment of China-Korea free trade zone
regardless of the extent of tax reduction and exemption
it will promote the imports and exports and foreign
trade conditions within the zone but may cause
adverse trade effects on other regions outside it
Analysis of the Interests of Conceiving a Free Trade Agreement between China and South Korea
58
Table 6 Changes of Trade Effects in Different Program ()
Program one Program two
Export Import Trade Condition Export Import Trade Condition
China
Korea The rest of the world
181
244 -002
229
564 -01
005
14 -004
016
028 -00018
021
046 -0006
002
005 -0003
Source compiled according to the result of Rung TAP operation
443 Industry Effects
According to the model calculation results (shown
in Table 7) shown in program one establishing the
free trade zone has a great impact on specific industry
sectors in China and Korea Chinarsquos sectors with
increased output mainly concentrate in the primary
sector products among which the agricultural sector
takes the largest increase reaching 268 while the
industrial sectors (light manufacturing and heavy
industries) decrease slightly In general Chinarsquos sector
output changes but the rate of change is not large In
contrast there is a big difference in sector output
changes between departments in Korea Because of the
restriction of resources geography population and
other natural endowments sectors with reduced output
in Korea are concentrated in the primary sector
particularly in the agricultural sector with a significant
reduction of 2009 much greater than the changes in
other sectors Sectors with output increases concentrate
in the industrial product sectors among which textiles
and clothing sector are the most outstanding with a
927 increase The other regions in the world have a
slight growth in light manufacturing but the outputs of
other sectors experience different degrees of decline
In program two every country protects its weak
industries and the tax reductions are less than in
program one The change rates in industry output of
the two countries is not big except for Chinarsquos textile
and clothing industry which has a slight rise other
changes all decline compared to program one
Although in program two Chinarsquos protection of light
manufacturing and heavy industry help to slow the
decrease of industrial output we can see from Table 7
that China rsquos output of these two industries still
declines indicating that to enhance the level of
industrial development trade protection is not always
feasible It is fundamental to work hard on solving
problems such as low-end industrial structure low
technology in production lack of innovation and etc
Korearsquos protection of agriculture shows a better effect
the output change rate of Korearsquos food and crop
industry decreased from 2009 to 004 Due to
Korearsquos protection of agricultural products Chinarsquos
increased output in food and crop industry changes
from 268 up to 0161
Through the above analysis it can be concluded
that after the establishment of a China-Korea free trade
zone regardless the degrees of tax reduction and
exemption the output will be improved with the
optimization and upgrading of industries For the other
regions in the world it brings adverse impacts
Table7 The Output Changes of Sub-sectors in Program One and Program Two ()
Program one Program two
China Korea Other regions China Korea Other regions
Food and Crop
Livestock and meat products Forest rivers and coal
Natural gas and other minerals
Processed foods Textile and clothing
Light manufacturing
Heavy industries
268
056 031
114 004
-036
-025
-2009
-012 -144
-095 927
034
162
-035
-009 -004
-011 -032
001
-003
0161
0114 0137
0479 0274
-005
-008
-004
-015 -027
-082 534
-017
-018
-0008
-0009 -0027
-0019 -0233
0007
0015
J Glob Bus Trade Vol 9 No 2 (November 2013) 45-60
59
Public utilities construction
Transport and communications Other services
038
009 01
412
155 247
-009
-004 -006
0042
002 0037
023
006 011
-0006
-0005 -0005
Source compiled according to the result of Rung TAP operation
Ⅴ Conclusions
Based on the ldquoStarting Joint Minister Statement on
free trade agreement between China and South Koreardquo
the article explains the basic ideas of this agreement
Through the analysis of the investment interests and
trade interests of China and Korea it finds that
intermediate import and export products in China and
Korea trade rank first and the goods trade in
production is considerably higher than that in
consumption This formation of structure of goods
trade can be reasonably explained by Korearsquos direct
investment in China Through the analysis of
producersrsquo interests and the consumers in China and
Korea it finds that if China and Korea reach a free
trade agreement that excludes Korearsquos agriculture from
free trade as a sensitive product it will sacrifice the
majority of consumersrsquo interests and only protects the
interests of minor agricultural producers If Chinarsquos
petrochemical and machinery are separated from
China-Korea free trade agreement negotiations it will
also sacrifice the majority of consumersrsquo interests and
only protect the investorsrsquo interests Therefore it
shows firstly the insight on interests is significantly
different between the declaration and theoretical
research Secondly Chinarsquos diplomatic interests are
bigger than its trade significance and Korea protects its
investment interests in China through trade agreements
Thirdly both countries are trying to protect their
producersrsquo interests through trade agreements
Finally this paper uses the global trade analysis
project (Global Trade Analysis Project GTAP) model
and proposes ldquofull abolition of trade in goods tariffs
between China and Koreardquo and ldquoKorearsquos exceptions
on its high tariff food and crop sectors Chinarsquos
exceptions on industrial sector (light manufacturing
and heavy industry) and tariffs on other sectors
reduced by halfrdquo It predicts the economic benefits of
China-Korean free trade zone by two sets of simulation
programs from three aspects macroeconomic and
welfare effects trade effects as well as industry effects
It finds that after the establishment of a China-Korean
free trade zone regardless the level of tax reduction it
will promote the growth of the national economy and
improve the social welfare and import and export
Trade conditions and output will be improved with
industrial optimization and upgrading of industries in
two countries For the other regions in the world it will
bring negative and adverse changes
References
Baiming Z Jiang Y amp Maohong L (2010) Biased
investment by state-owned and foreign enterprises
and its production-trade effect Wuhan University
Journal (Philosophy amp Social Sciences) 2010(1)
117-124
ChinaStatistics (2011) China Statistical Yearbook
of 2011 Central Hong Kong Author Retrieved
from httpwwwchinastatisticsnetchina-
statistical-yearbook-2011-m-23html
Fang Z H A O amp Ji L I (2010) A research on
trade status and intra-industry trade between China
and South Korea Journal of Jilin Normal Uni-
versity (Humanities amp Social Science Edition)
2010(4) 52-56
Jianxin H P W (2010) The design of FTA nego-
tiation strategy between China and Korea based on
GTAP simulation World Economy Study 2010(6)
81-86
Li Y amp Zhou W F (2008) The investment from
Korea to China The present situation trend and
Chinarsquos policies Economic Research Guide
2008(3) 158-160
Analysis of the Interests of Conceiving a Free Trade Agreement between China and South Korea
60
Li X F amp Gui J X (2009) An empirical analysis of
the impact of the establishment of China-Korea
FTA on bilateral trade International Economics
and Trade Research 2009(5) 4-8
Li X Z (2010) The trade between China and Korea
and its structure change International Studies
2010(6) 48-52
Song J G (2011) The study of free trade agreement
between China and South Korea based on the
gravity model Contemporary Economic Research
2011(5) 81-85
United Nations Statistics Division (nd) Commodity
Trade statistics database New York NY Author
Retrieved from httpcomtradeunorgdata
Watanabe (2009) The possibility about the FTA
among Japan Korea and China The Economist
2009(12) 5-12
World Trade Organization (nd) World Customs
Data 2011 Retrieved from httpwwwwtoorg
statistics
Xin Z Rong R D amp Yan C (2006) An empirical
analysis of the influence about the direct
investment from Japanese South Korean to China
on the scale and industry Journal of International
Trade 2006(10) 44-50
Xue J X amp Zhang B (2004) The economic coope-
ration arrangements in East Asia A comparative
study based on the general equilibrium model The
Journal of World Economy 2004(6) 51-59
Ye J Y amp Wang P (2005) The analysis of the trade
deficit between China and Korea Economic
Science 2005(1) 115-126
Zheng Z S (2009) The strategic motivation com-
parison of FTA promotion between China and
Korea Commercial Times 2009(33) 35-36
J Glob Bus Trade Vol 9 No 2 (November 2013) 61-71
61
ISSN 1946-5130
Journal of Global Business and Trade
wwwiagbtcom
Stock Market Development and Economic Growth the Case
of the Philippine Stock Market
Princess Jace N Sta Mariaa and Agham C Cuevas
b
ab College of Economics and Management University of the Philippines Los Bantildeos Philippines
Received 25 August 2013 Revised 27 September 2013 Accepted 30 October 2013
ABSTRACT
The general objective of this study is to analyze the level of stock market development of the Philippine Stock
Exchange as reflected by its liquidity position and its implications to economic growth in the Philippines
Stock market liquidity was analyzed through its three liquidity measurements turnover ratio total value of
traded shares ratio and the market size ratio This study used Ordinary Least Squares (OLS) in analyzing the
relationship between stock market liquidity and economic growth using quarterly data from 1996 to 2012
Stock market liquidity as measured by the growth in value of traded shares and the growth in market size is
significantly related to the growth of the economy after controlling for variables such as inflation which
lagged by one period growth in foreign direct investment and openness to trade Further analysis showed that
the growth in market size causes economic growth However the determinant of the growth in value of traded
shares does not exhibit Granger causality but is proven to have a long run relationship as shown from the
results of the Error Correction Model
Keywords economic growth Philippine stock exchange stock market development stock market liquidity
Ⅰ Introduction11
Financial markets and intermediaries play a
significant role in the growth of the economy by
improving financial efficiency that would in turn
provide better allocation of resources As savers or
lenders hold current consumption for future expendi-
ture borrowers desire current consumption or invest-
ment that would eventually yield higher returns in the
future These institutions are responsible for main-
taining a healthy monetary economy in the country as
they mobilize and convert savings into funds and
channel them to borrowers or investors to further
2013 International Academy of Global Business and Trade
All rights reserved
allocate them to more productive investments
(Mishkin 2006) An efficient stable and vibrant stock
market is essential to the development of the financial
sector Stock markets are responsible for the expansion
of a companyrsquos capital by allowing stocks or shares to
be sold or traded in public
Kanasro Jalbani and Junejo (2009) stated that
stock markets play a crucial role in capital mobilization
and provide secondary markets for the investors and
financial institutions to buy and sell securities A stock
market is considered to be liquid when large
transactions are executed with only a small impact on
prices of securities Stock market liquidity is thus
considered a good tool to measure the efficiency of a
stock market A marketrsquos stability is also determined
Stock Market Development and Economic Growth the Case of the Philippine Stock Market
62
through the liquidity of its securities or the ease at
which these securities are bought or sold in the market
The Philippine Stock Exchange (PSE) the sole
stock market of the Philippines was established on
December 23 1993 when the respective founders of
both the Manila Stock Exchange (MSE) and the
Makati Stock Exchange (MKSE) decided to combine
the two exchanges to further develop a more efficient
capital market During the past decade the PSE has
been robust in terms of the daily value traded Both
foreign and domestic market capitalization which is
the measure of the size of listed companies in the stock
market has been increasing since 2002 In January
2013 the Philippine Stock Exchange index (PSEi) the
indicator used to measure the performance of active
and highly capitalized listed Philippine companies in
the PSE breached the 6000 level an all-time high in
Philippine stock market history
The general objective of the study is to analyze the
liquidity of the Philippine stock market and its
implications for economic growth Liquidity is
important as it is an aspect of a stock market that is
necessary for the traders to interact Specifically the
study aims to measure the liquidity of the Philippine
stock market and evaluate its trends for the given
period determine the linkages between stock market
liquidity and growth of the economy and determine the
causality between stock market development and
economic growth in the Philippines
The paper is organized as follows The next two
sections review the related literature followed by the
analytical and empirical framework The fourth section
discusses the results while the last section provides the
conclusion
Ⅱ Review of Related Literature
21 Stock Market Development as a
Determinant of Economic Growth
Several studies have been conducted on the
relevance of stock market development to economic
growth As cited by Petros (nd) the stock market
provides the fulcrum for capital market activities and it
is often cited as a barometer of business direction An
active stock market may be relied upon to measure
changes in general economic activities using the stock
market index (Obadan 1995) According to Petros
(nd) directly or indirectly a stock market through its
specific services can contribute to economic growth
Mobilization of savings creation of liquidity risk
diversification improved dissemination and acquisi-
tion of information and enhanced incentive for cor-
porate control are functions that are notably significant
thus by improving the efficiency and effectiveness of
these functions it can amplify the economic growth
rate
Tapitan (2012) highlighted the role of financial
intermediaries as a prerequisite for economic growth as
they play an important role in technological progress
The financial system affects capital accumulation by
altering the saving or by reallocating savings among
different capital producing technologies The key
assumption is that better technology is produced as a
by-product of capital investment
Capital investments are important in boosting the
growth of the countryrsquos economy As cited by Nagai-
shi (1999) Levine (1997) identified two channels in
which financial markets or intermediaries affect
economic growth through capital accumulation and
technological innovation In 1999 Garcia and Liu
(1999) identified three main channels through which
financial markets and intermediaries may affect
economic growth The first is by stimulating savings
Financial markets or intermediaries provide savers
with a relatively higher yield McKinnon (1973) and
Shaw (1973) (as cited by Garcia amp Liu 1999) claimed
that financial deepening improves not only produc-
tivity of capital but also the saving rate and therefore
investment and growth Second this can be done by
reducing information and transactions costs because
we know that high transaction costs would definitely
have a negative effect on trading for these discourage
people from transacting thus affecting onersquos profit
Lastly by promoting an efficient allocation of invest-
ment the allocation of resources is improved
J Glob Bus Trade Vol 9 No 2 (November 2013) 61-71
63
22 Stock Market Liquidity
Stahel (2004) (as cited by Benić amp Frani 2008)
argues that due to stock market integration investors
would tend to move their capital to where they expect
higher returns on their investments Von Wyss (2004)
(as cited by Benić amp Frani) defined four aspects or
dimensions of financial market liquidity the trading
time tightness depth and resiliency These dimen-
sions of liquidity may be presented with five different
levels of liquidity 1) the ability to trade at all 2) the
ability to buy or to sell a certain amount of an asset
with an influence on the quoted price 3) the ability to
buy or to sell a certain amount of an asset without any
influence on the quoted price 4) the ability to buy and
to sell an asset at about the same price at the same time
and 5) the ability to execute a transaction from points
two to four immediately
Sarr and Lybek (2002) claim that illiquid markets
are more of a symptom rather than a cause of
inadequate market functioning They posit that in order
to foster liquid financial markets sound and
transparent economic policies with appropriately
designed trading clearing and settlement systems as
well as appropriate intervention policies of the central
bank which can help contain systematic risk are the
only sustainable solution
Levine and Zervos (1998) investigated whether
measures of stock market liquidity size volatility and
integration with world capital markets are robustly
correlated with current and future rates of economic
growth capital accumulation productivity improve-
ments and saving rates They used data on 49
countries from the period 1976 to 1993 They
evaluated whether the stock market indicators together
with banking development are correlated with the
growth indicators Stock market development
indicators include the size in which capitalization is
measured by the value of listed domestic shares on
domestic exchanges divided by GDP the liquidity
which is measured by the turnover ratio and the value
traded ratio Using the international capital asset
pricing model (CAPM) and international arbitrage
pricing theory (APT) they concluded that stock market
liquidity and banking development are both positively
and robustly correlated with contemporaneous and
future rates of economic growth capital accumulation
and productivity growth Also both a stock market and
banks provide different financial services that could
actually help the economy as a whole On the other
hand based on their study they find no support that
these indicators reduce private savings rate or hinder
long run growth
Levine (1996) tested the liquidity of stock markets
for 38 countries (1976-1993) that include both Indus-
trial and developing countries Three measurements for
liquidity were used the total value of shares traded on
a countryrsquos stock exchanges as a share of GDP the
value of traded shares as a percentage of total market
capitalization or the turnover ratio and the value-
traded-ratio divided by stock price volatility He
claimed that a liquid market should be able to handle
heavy trading without large price swings Thus
empirically stock market size and volatility do not
matter but the ease of which shares can be traded The
results suggest that stock market liquidity helps
forecast economic growth even after accounting for a
variety of nonfinancial factors that influence economic
growth Stock market liquidity is still a reliable
indicator of future long term growth after controlling
for inflation fiscal policy political stability education
the efficiency of the legal system exchange rate policy
and openness to international trade
Ⅲ Analytical and Empirical
Framework
Stock markets contribute in easing financial
activities as well as guiding the countryrsquos firms and
investors to allocate their funds efficiently Levine
(1996) showed that countries that had more liquid
stock markets enjoyed both faster rates of capital
accumulation and greater productivity gains Stock
markets through creation of liquidity affect economic
activity by less risky investment in equity markets
which allows savers to acquire assets and quickly sell
Stock Market Development and Economic Growth the Case of the Philippine Stock Market
64
them As Fig 1 shows liquid markets improve capital
allocation that would in turn enhance growth in the
economy
Levine (2003) identified three core sources of
theoretically ambiguous relationships between econo-
mic growth and stock market liquidity He first stated
that stock market liquidity lowers the risk of investing
in longer-run higher return projects and in
consequence fosters a growth-accelerating reallocation
of capital The lower risk however affects savings and
capital accumulation rates ambiguously so that
aggregate growth will slow if savings rate fall enough
Second the cost of investing in the long run is lower
Higher rate of return on savings affects savings and
capital accumulation rates ambiguously so that growth
will fall if capital accumulation rates fall enough
Finally stock market liquidity affects incentives for
investors to undertake the costly processes of
researching and monitoring firms and managers
ambiguously Liquidity will affect growth positively if
stock market liquidity encourages agents to evaluate
and exert corporate control
31 Measures of Stock Market Liquidity
The study adopted two measurements of liquidity
used by Kanasro et al (2009) to determine the
efficiency of the Philippine stock market through
liquidity of its shares Stock market liquidity is
hypothesized to be
SML = f (TVTS MSIZE) (1)
Where
SML -- Stock Market Liquidity
TVTS -- Total Value of Traded Shares Ratio
MSIZE -- Market Size Ratio
The Total Value of Traded Shares Ratio (TVTS)
measures the value of equity transactions relative to the
size of the economy The formula for computing the
total value of traded shares ratio is as follows
TVTS = Total Value of Traded Shares
Gross Domestic Product (2)
The Market Size Ratio (MSIZE) measures the size
of the Philippine Stock Exchange in accordance with
the market capitalization as the ratio of GDP of the
Philippines during the sample period
MSIZE = Gross Domestic Product (3)
Market Capitalization
Fig 1 Schematic Diagram for Stock Market
Liquidity and Economic Growth (Levine
1996)
32 Empirical Model
To analyze the relationship between the liquidity of
the Philippine Stock Exchange (PSE) and economic
growth in the Philippines the two measures for stock
market liquidity in logarithm form were regressed to
the logarithm of Gross Domestic Product (LNGDP)
together with the other factors that influence economic
J Glob Bus Trade Vol 9 No 2 (November 2013) 61-71
65
growth using Ordinary Least Squares (OLS) This
study also adopted the regression model of Levine
(2003) Nurudeen (2009) and Mohtadi and Agarwal
(nd) The model directly examined the relationship
between stock market liquidity and economic growth
The regression model is as follows
LNGDP = β0 + β1 LN (TVTS) + β 2 LN (MSIZE)
+ β3 LN (OPEN) + β4 LN (FDI)
+ β4 (INFLAG) + μ (4)
Where
LNGDP -growth in Gross Domestic Product
LNTVTS-growth in Total Value of Traded
Shares Ratio
LNMSIZE-growth in Market Size Ratio
LNOPEN -growth in Openness to Trade
LNFDI-growth in Foreign Direct Investment
INFLAG-Inflation Rate lagged by one period
β-parameter of the indicators
micro-the error term
The variables in the model above are defined as
follows LNGDP refers to economic growth and it is
measured as the logarithm of the real GDP The
LNTVTS is the growth in Total Value of Traded
Shares Ratio and it is measured by dividing the total
value of traded shares with the gross domestic product
and transformed to its natural logarithm The
LNMSIZE is the growth in Market Size Ratio
measured by dividing the gross domestic product to
the market capitalization and transformed to its natural
logarithm LNOPEN refers to the growth in openness
to trade and it is measured by tariff revenues which is
measured by tariff rate multiplied by imports divided
by the sum of imports and exports and transformed to
its natural logarithm LNFDI refers to growth in
foreign direct investment INFLAG is the inflation rate
lagged by one period and μ is the error term
It is hypothesized that an increase in the growth in
total value of traded shares and market size should
increase the growth of the economy The variables
LNOPEN LNFDI INFLAG were used as control
variables to gauge the strength of the correlation
between stock market liquidity and economic growth
for the given period The inflation rate lagged by one
period (INFLAG) is the percentage rate of the change
in the general changes in the price level thus it
measures the monetary instability that negatively
affects economic performance Its lagged effect was
assigned to serve as a proxy for expected future
inflation Foreign direct investment (FDI) was
expected to augment savings and increase the rates of
capital accumulation giving a positive relationship to
economic growth Openness to trade (OPEN) refers to
the openness to international trade of the economy as
trade openness fosters competition in global markets it
was expected that its growth will have a positive
relationship with economic growth
Ⅳ Results and Discussion
This study used a simple Ordinary Least Squares
(OLS) method to determine and further analyze the
relationship between the level of stock market
development as proxied by liquidity position of the
Philippine stock market and economic growth It also
attempted to provide evidence on the existence of a
long run relationship between stock market
development and economic growth through the use of
the Granger Causality test
41 Liquidity of the Philippine Stock
Exchange
The Turnover Ratio measures the value of equity
transactions relative to the market size A high turnover
is an indicator of low transaction cost (Levine amp
Zervos 1998) The turnover position of the Philippine
Stock Exchange has experienced fluctuations The
Ramos administration (1992-1998) experienced a
steady growth in the economy during which the
Philippines Stock Exchange (PSE) was unified
However due to the 1997 Asian financial crisis its
performance declined Under the administration of
Stock Market Development and Economic Growth the Case of the Philippine Stock Market
66
Estrada a decline in the performance in the PSE can be
seen From a 1262 turnover ratio in 1999 it declined
to 218 in 2000 due to poor governance and
economic policies that affected the confidence among
potential investors The economic reforms and policies
under the Arroyo administration improved growth in
the economy giving stock market significant inflows
gaining back investorsrsquo confidence Due to different
problems that the economy experienced coupled with
the global crisis as shown in Fig 2 the trend continued
to be volatile The average turnover ratio of PSE is
380 during the sample period
The Total Value of Traded Shares Ratio (TVTS)
measures the value of equity transactions relative to the
size of the economy There are significant jumps in the
liquidity (total value of shares traded to GDP) in the
last six years Its TVTS ratio has grown to almost 28
The overall average liquidity during the sample period
is 65
Fig 2 Liquidity at Philippine Stock Exchange
(PSE) using Turnover Ratio (TOR) and
Total Value of Traded Shares (TVTS)
The Market Size (MSIZE) measures the size of the
Philippine Stock Exchange in accordance with the
market capitalization as the ratio of GDP of the
Philippines during the sample period As shown in Fig
3 the size of the PSE remained very small from the
year 1996-1999 which had about 3-5 until 2000
when it increased to almost 40 The 1997 Asian
financial crisis caused instability in the financial sector
and only a few companiesrsquo securities were listed The
overall average size of the market has remained only
254 of GDP which seemed to be low in comparison
with other developing markets Since the unification of
the Makati Stock Exchange and the Manila Stock
Exchange in 1993 the Philippine Stock Exchange has
remained relatively small As of May 2012 there are
344 listed companies in the PSE
Fig 3 Liquidity at the Philippine Stock Exchange
using Market Size (MSIZE)
42 Regression Results
The study used 67 observations from the first
quarter of 1996 to the third quarter of 2012 Three
variables were found to be significant using the
Ordinary Least Squares (OLS) method These
variables were the growth in total value of traded
shares (LNTVTS) growth in market size (LNMSIZE)
growth in openness to trade (LNOPEN) The turnover
ratio was not used as a determinant of liquidity as
Levine and Zervos (1996) states that the turnover ratio
measures trading of firmrsquos equities relative to the size
of the market and does not satisfy the degree in which
liquidity services on a macroeconomic scale Thus it
would not be providing significant liquidity to the
economy as a whole Therefore a large stock market is
not necessarily a liquid market
The Durbin-Watson and Breusch-Godfrey tests
were used to test for the presence of autocorrelation
Having found to have positive autocorrelation the
Cochrane-Orcutt Transformation was used as a
remedy to minimize the autocorrelation problem Table
1 shows the regression results after the Cochrane-
Orcutt Transformation
J Glob Bus Trade Vol 9 No 2 (November 2013) 61-71
67
From Table 1 results show that the effect of
growth on the total value of traded shares and the
growth of the market size on economic growth is
positive and statistically significant at the 1 level
The control variables which are the growth of
openness to trade and growth of foreign direct
investment also have the expected signs which are
positive however these variables are not significant
even at the 10 level The results also show that the
variable of inflation lagged by one period is negatively
related to economic growth and significant at the 10
level
Table 1 Cochrane-Orcutt Transformation Regression
Results
Variable Coefficient Std Error t-statistic Probability
LNTVTS 0134 0037 362 0001
LNMSIZE 0826 0046 1800 0000
INFLAG -0025 0013 -196 0055
LNOPEN 0269NS 0240 112 0268
LNFDI 0009NS 0009 100 0322
_cons 8062 0646 1248 0000
R2 = 09488 Prob gt F = 0000
Adjusted R2 =09445 DW Statistic
(transformed) = 2005368
Notes 1 significant at 1 level of significance
2 significant at 5 level of significance
3 significant at 10 level of significance 4 Values were rounded off to three decimal
places
Stock markets contribute to economic develop-
ment by enhancing the liquidity of capital investments
(Levine 1997) Moreover by increasing the quantity
and productivity through improved allocation of
capital as well as reducing the need to hold liquid
balances a liquid stock market would augment econo-
mic growth The results showed that the relationship
between the growth of market size (MSIZE) and
economic growth is positive and significant in
explaining economic growth in the Philippines as it
was used as a proxy for liquidity The coefficient 0826
implies that a 1 increase in growth of market size
would lead to an increase of 0826 in the growth of
GDP The result provides proof that the size of the
Philippine Stock Exchange (PSE) during the given
period determines the ability of the market to mobilize
savings improve the quality and quantity of invest-
ment and accelerate economic growth since the role of
the PSE is to bring companies together to raise capital
through securities
The other measure for liquidity has a positive and
significant effect on economic growth The growth in
total value of traded shares (LNTVTS) has a coeffi-
cient of 0134 implying that a 1 increase in the
growth of total value of traded shares will increase
economic growth by 0134 Since the growth of
TVTS measures the trading of firmrsquos equity as a share
of GDP its liquidity therefore positively reflects on an
economy-wide basis (Levine amp Zervos 1996)
Inflation (INFLAG) which was lagged by one
period conforms to economic theory by having a
negative relationship with economic growth since it
affects economic performance through monetary
instability It has a coefficient of -0025 which is
statistically significant at 10 level This means that a
1 increase in the inflation rate leads to a decrease in
the growth of GDP by 0025
The coefficient of the growth in openness to trade
(OPEN) conforms to the standard economic theory
since it is positively related to economic growth even
if it was used as a control variable The coefficient of
0269 implies that over the study period a 1 increase
in the degree of trade openness leads to approximately
0269 increase in growth of GDP Also there is a
positive relationship between the growth of foreign
direct investment (FDI) and economic growth since
FDI helps to supply long-term capital with new
technologies managerial and marketing capabilities
that would in turn augment economic growth through
employment increasing managerial skills diffusing
technologies and fostering innovations (Asiedu 2002
as cited by Adhikary 2011) The coefficient of 0009
implies that over the study period a 1 increase in the
degree foreign direct investment would lead to 0009
increase in growth of GDP
However results for openness to trade and foreign
direct investment in the model proved to be statistically
Stock Market Development and Economic Growth the Case of the Philippine Stock Market
68
insignificant after using these as control variables
along with the stock market liquidity measurements
The explanatory power or the goodness of fit of the
model as measured by the R-squared is at 09488
which means that 95 can be explained by the model
and it has a very strong fit The value indicates that
economic growth in the Philippines is adequately
explained by the model for the period between the first
quarter of 1996 to the third quarter of 2012 or that 95
of the variation in the growth of economic activities is
explained by the independent variables Moreover the
relationship between liquidity and growth remains
strong even after controlling for inflation foreign direct
investment and openness to trade Thus raising stock
market liquidity may independently produce
substantial growth
43 Long Run Relationship and Causality
431Test for Stationarity
One of the conditions in order to test Granger
Causality between the two variables is through its
stationarity It is important to know if the variable is
stationary or does not have a unit root or if the variable
is nonstationary or the variable contains a unit root
The variables LNTVTS LNMSIZE and LNGDP
were not stationary in their respective level forms
Thus for testing of the unit roots the Augmented
Dickey Fuller (ADF) test was used for the two
measurements of stock market liquidity which are the
LNTVTS and LNMSIZE and the proxy for economic
growth LNGDP The ADF includes the additional
lagged terms which can be examined by the Akaike
Information Criterion (AIC) to ensure that the errors
are uncorrelated If the variable is nonstationary at
level form but stationary after first differencing the
variable is integrated of order 1 and has a unit root
Using the said test variables LNTVTS LNMSIZE
and LNGDP are stationary after first differencing The
results for stationarity are shown in Table 2
Table 2 Stationarity Test Results
Variables Level Form P-value First Difference P-value
LNGDP 05891 lags (4) 00015 lags (4)
LNTVTS 06311 lags (4) 0000 lags (3)
LNMSIZE 03335 lags (4) 00039 lags (4)
Notes 1 significant at 1 level of significance
2 significant at 5 level of significance
432 Test for Cointegration
Since the stationarity of the variables have been
established the cointegration of the indicators of stock
market development and economic growth were tested
The results for the Cointegrating Regression Dickey
Fuller Test are shown in Table 3
Table 3 Cointegrating Regression Dickey Fuller
Test Results
Regressed Variables P-value
LNTVTS and LNGDP 00250
LNMSIZE and LNGDP 00545
Note significant at 5 level of significance
The regression results suggest that LNTVTS is
cointegrated with LNGDP Thus LNTVTS has a
long-run relationship with LNGDP which means
LNTVTS share a common stochastic drift or a
common trend with LNGDP The results also suggest
that LNMSIZE is also cointegrated with LNGDP
because the error term is stationary
433 Granger Causality
Granger Causality can only be tested if variables
are stationary and variables are cointegrated It is used
to establish whether a uni-directional or bi-directional
relationship exists between stock market development
and economic growth Results showed that LNTVTS
and LNMSIZE are both stationary and cointegrated
with LNGDP Table 4 shows the optimal number of
lags used in each determinant through Akaike
Information Criterion Table 5 shows the result of the
Granger Causality test
J Glob Bus Trade Vol 9 No 2 (November 2013) 61-71
69
Table 4 Akaike Information Criterion
LNGDP LNTVTS LNMSIZE
Lags AIC AIC AIC
0 212598 237417 215782
1 168524 222582 181308
2 164703 223876 179562
3 14775 214879 172127
4 14659 216273 167974
Note indicates the optimal number of lags
The results of the Granger Causality tests indicated
that there is a unidirectional causality between stock
market liquidity using the growth in the market size as
proxy and economic growth However results show
that there is no causality between growth in total value
of traded shares and economic growth Growth in total
value of traded shares and economic growth may have
a long-run relationship since they are cointegrated but
they do not exhibit Granger causality
Table 5 Granger Causality Test Results
Variable Computed
Statistic
F Tabular
Value
Granger
Causality
LNTVTS to
LNGDP 093NS 04532 No
LNGDP to
LNTVTS 038NS 07660 No
LNMSIZE to
LNGDP 347 00136 Yes
LNGDP to
LNMSIZE 037NS 08293 No
Notes 1 significant at 5 level of significance
2 NS - indicates insignificance
Since the variables LNTVTS and LNGDP were
found to be cointegrated an Error Correction Model
(ECM) was specified to test for the speed of
adjustment in the said determinants when one of these
variables experiences a shock Table 6 shows the Error
Correction Method results for LNTVTS and LNGDP
Table 6 Error Correction Method Results
Variables Speed of Adjustment
LNTVTS and LNGDP -0143817
Note significant at 5 level of significance
It can be observed from the results that LNTVTS
as the measure of stock market liquidity and LNGDP
for economic growth have the coefficient of the error
correction term with a negative sign and it is
statistically significant at the 5 level of significance
Thus the significance of the error correction mecha-
nism supports cointegration and suggests the existence
of a long-run equilibrium relationship between economic
growth and stock market development determinant
LNTVTS In other words the coefficient of the error
correction term which measures the speed of adjust-
ment back to equilibrium whenever the system is
experiencing a shock indicates that it would take 6953
asymp 7 quarters for a variable to adjust whenever one
experiences a shock
Ⅴ Summary and Conclusion
This research work studies stock market develop-
ment and its implications to economic growth by
analyzing the relationship between the stock market
measurements for liquidity and GDP growth in the
Philippines The specific objectives of the study were
to measure the liquidity of the Philippine stock market
and evaluate its trends for the given period determine
the linkages between stock market liquidity and
growth of the economy and to determine the causality
between stock market development and economic
growth
Using Ordinary Least Squares (OLS) method for
the time series data covering the period of the first
quarter of 1996 to the third quarter of 2012 it was
shown that the role of the stock market is essential to
economic growth in a developing country like the
Philippines The two measures used for liquidity the
growth in total value of traded shares and the growth in
market size were both positively related to economic
growth and statistically significant However results
for the growth in openness to trade and foreign direct
investment in the model proved to be statistically
insignificant after using it as control variables along
with the stock market liquidity measures Inflation on
Stock Market Development and Economic Growth the Case of the Philippine Stock Market
70
the other hand which was lagged by one period
conforms to theoretical conventions by having a
negative relationship to economic growth since it
affects economic performance because of monetary
instability About 95 of the variation in economic
growth is explained by the independent variables
Moreover the relationship between liquidity and
growth remains strong even after controlling for
inflation foreign direct investment and openness to
trade Thus raising stock market liquidity may
independently produce substantial growth
In assessing the relationship between stock market
development and economic growth it empirically
proved that the measure of economic growth (LNGDP)
and all of the determinants for stock market liquidity ndash
LNTVTS and LNMSIZE were both stationary and
cointegrated For the case of the Philippines there is a
unidirectional causality between stock market liquidity
using the growth in the market size as proxy and
economic growth For LNTVTS stock market
liquidity does not ldquoGranger causerdquo economic growth
and vice versa Since the two indicators have a long
run relationship the results of the Error Correction
Model suggest that there is an adjustment in stock
market liquidity as proxied by growth in total value of
traded shares and economic growth whenever one of
the indicators experiences a shock
Admittedly the study only tested a portion of the
financial side the stock marketrsquos liquidity Other
important determinants of stock market development
such as price volatility elasticity in trading corporate
governance could also be incorporated to give more
robust results There are a wide variety of factors that
can affect economic growth both on the financial and
real sectors of the economy which needs to be taken
into consideration The empirical results indicate that
the potential of the Philippines Stock Exchange in
fostering growth in the country should further be
explored
References
Adhikary B K (2010) FDI trade openness capital
formation and economic growth in Bangladesh A
linkage analysis International Journal of Business
and Management 6(1) 16-28
Benić V amp Franić I (2009) Stock market liquidity
comparative analysis of Croatian and regional
markets Financial Theory and Practice 32(4)
477-498
Garcia V F amp Liu L (1999) Macroeconomic
determinants of stock market development Journal
of Applied Economics 2(1) 29-59
Kanasro H A Jalbani A A amp Junejo M A (2009)
Stock Market Liquidity A Case Study of Karachi
Stock Exchange Pakistan Journal of Commerce
Social Science 3 25-34
Levine R amp Zervos S (1996) Stock market
development and long-run growth The World
Bank Economic Review 10(2) 323-339
Levine R amp Zervos S (1998) Stock markets banks
and economic growth American Economic Review
537-558
Levine R (1996) Stock markets A spur to economic
growth Finance and Development 33 7-10
Levine R (1996) Stock market liquidity and economic
growth Theory and evidence Retrieved from
httpfacultyhaasberkeleyeduross_levinepapers
0845_001pdf
Levine R (1997) Stock markets economic develop-
ment and capital control liberalization Perspec-
tive 3(5) 1-8
Mishkin F (2006) The economics of money banking
and financial markets (10th ed) Upper Saddle
River NJ Prentice Hall
Mohtadi H amp Agarwal S (2001) Stock market
development and economic growth Evidence
from developing countries Available at http
www uwm edumohadiPA-4-01pdf
Nagaishi M (1999) Stock market development and
economic growth Dubious relationship Economic
and Political Weekly 2004-2012
J Glob Bus Trade Vol 9 No 2 (November 2013) 61-71
71
Nurudeen A (2009) Does stock market development
raise economic growth Evidence from Nigeria
The Review of Finance and Banking 1(1) 015-
026
Petros J (2012) The effect of the stock exchange on
economic growth A case of the Zimbabwe stock
exchange Research of Business Economics 6 1-
17
Sarr A amp Lybek T (2002) Measuring liquidity in
financial markets (Working Paper No 02232)
Washington DC IMF
Tapitan J P (2012) Measuring link between financial
development and economic growth using a sample
of selected ASEAN countries (Unpublished under-
graduate thesis) Los Banos Philippines Univer-
sity of the Philippines Los Bantildeos
Von W R (2004) Measuring and predicting liquidity
in the stock market (Doctoral dissertation) Retrie-
ved from httpwww1 unisgchwwwedisnsf
SysLkpByIdentifier2899$FILEdis2899pdf
Xiao X amp Kong L L (2012) An Empirical Study
on the Relationship between Turnover Rate and
Stock Returns in Chinese Stock Market Advances
in Information Technology and Management 2(1)
239-245
Yartey C A (2008) The determinants of stock market
development in emerging economies Is South
Africa different (Working Paper No 0832)
Washington DC IMF
J Glob Bus Trade Vol 9 No 2 (November 2013) 61-71
73

J Glob Bus Trade Vol 9 No 2 (November 2013) 1-9
5
Rubun amp Brown 1975) and a combination of
individual and joint profits (Clopton 1984) Beyond
profits negotiatorrsquos satisfaction is an important
measure of success especially if partners desire a
continued relationship Given the dual importance of
task accomplishment (profit) and relationship building
(satisfaction) especially in international negotiations
the present study uses both as outcomes
Ⅲ Cultural Difference in Nonverbal
Behavior
The participants in the experiment were 10
Chinese 10 Korean and 10 European Students who
are majoring in international business and Korean
businessmen are undergraduate students majoring
international commerce at Paichai University in Korea
This section deals with nonverbal aspects of
videotaped interactions The rhythms of the
conversations are discussed examining silent periods
and conversational overlaps Next facial gazing and
touching during negotiations are presented
31 Silent Periods
Silent periods are operationally defined as gaps in
conversations 10 seconds or more in duration The
time period of 10 seconds was selected somewhat
arbitrarily but it is long enough period of silence to
appear unnatural to most observers The tapes were
searched for gaps in conversations of 10 seconds or
more Silent periods occurred more frequently in the
Korean negotiatorsrsquo interactions (51 per 30minutes)
than either the Chinese or European negotiators
Negotiators from a low context culture such as Europe
tend to regard the silence of a high context culture such
as Korea as a rejection which is not a rejection in a
real sense by their standards
32 Conversational Overlaps
The concept of interactional synchrony the uncon-
scious coordination of verbal and nonverbal behaviors
of 2 or more participants in a conversation was
discussed at length by Graham (1980) It is the number
of conversational overlaps or interruptions during a
conversation Conversational overlaps are defined as
periods when both speakers are talking at the same
time or when the conversational contribution of one
speaker overlaps that of the other speaker The number
of overlaps (interruptions) by each participant was
totaled and divided by the time of negotiation to arrive
at values which may be compared across interactions
According to Table 1 Korean negotiators interrupted
more than Chinese or European negotiators
33 Facial Gazing
Facial gazing is defined as the percentage of time a
negotiator gazes at the face of partner Randomly
selected 10-minute videotape excerpts of each of the
interactions served as data here The author recoded
the time each participant spent gazing at hisher
partnerrsquos face during 10 minutes According to Table 1
European negotiators spent considerably more time
gazing at negotiation partners than either Korean or
Chinese negotiators
Table 1 Comparison of Patterns of Nonverbal Negotiation Behavior
Nonverbal Negotiation Behavior Korean Chinese European Silent Periods(average number of silence for more than 10
seconds during 30 minutes)
Conversational Overlaps(average number of conversational
overlaps during 30 minutes)
Facial gazing(average number of gazing)
Touch(number of touch)
51
308
11 25
35
264
11 30
28
58
76 00
Negotiation Factors and Culture in Trade Negotiations
6
34 Touching
Touching means that negotiator touches another
negotiation partner except for beginning and ending
handshakes Except for European negotiators Korean
and Chinese negotiators seldom touch their partners
except for handshakes
Ⅳ Conclusions
The purpose of this study has been to find out basic
factors affecting international business negotiations
and to suggest some strategic implications for business
negotiators With the advancement of globalization
intercultural business negotiations become more and
more important as a marketing strategy The role of
business negotiators is extremely important in order to
achieve successful international business negotiations
In order to achieve agreement in international
business negotiations negotiators are required to
manage cultural differences between the parties
concerned in addition to the complexity of domestic
negotiations Because such a large variety of cultural
factors exist among nations it is critical for negotiators
to identify the kind of problem-solving approaches that
are most appropriate for each intercultural negotiator
Understanding cultural differences is vital for successful
intercultural negotiations An objective measurement
of culture is important to overcome misunderstanding
caused by stereotyping and prejudice about other
cultures
As for nonverbal negotiation behaviors Korean
negotiators tend to use more silent periods than the rest
of two groups Also Korean negotiators interrupted
more than Chinese and European negotiators
European negotiators used more lsquofacial gazingrsquo and
lsquotouchingrsquo strategies in negotiation However there are
study limitations as follows the most important
consideration is the validity of the principal outcome
measure individual profit Kellyrsquos negotiation game
and such measures have been used in other studies but
how well the game represents actual business
negotiations is problematic Much of the evidence
supplied for accepting and rejecting hypotheses is
based on self-reports and judgements of participants
Also small sample sizes do not allow for tests of
statistical significance The negotiator should understand
the cultural background specifically regarding business
negotiation Negotiators can ask more questions in
their negotiations Sometimes itrsquos smart to be a little
bit dumb in business negotiations
The more the negotiators ask questions the more
information they can get and they can exchange more
information Also using a silent strategy can be
necessary and aggressive influence tactics such as
warnings and threats particularly those emphasized
with expressions of emotions may be used in
negotiations in a very restrictive way
Cooperatives and educational institutions should
take advantage of current research to develop training
programs on cultural differences in not only verbal
communication but non-verbal communication for
better trade negotiation results
References
Achrol R S (1997) Changes in the theory of
interorganizational relations in marketing Toward
a network paradigm Journal of the Academy of
Marketing Science 25(1) 56-71
Adler N J amp Graham J L (1989) Cross-cultural
interaction the international comparison fallacy
Journal of International Business Studies 20(3)
515-537
Allred K G Mallozzi J S Matsui F amp Raia C P
(1997) The influence of anger and compassion on
negotiation performance Organizational Behavior
and Human Decision Processes 70(3) 175-187
Argyle M amp Cook M (1976) Gaze and mutual
gaze Cambridge England Cambridge University
Press
Atkinson J M amp Heritage J (1984) Structures of
social action Studies in conversation analysis
Cambridge England Cambridge University Press
Barry B Fulmer I S amp Van Kleef G A (2004) I
laughed I cried I settled The role of emotion in
J Glob Bus Trade Vol 9 No 2 (November 2013) 1-9
7
negotiation The Handbook of Negotiation and
Culture 71-94
Barry B amp Friedman R A (1998) Bargainer
characteristics in distributive and integrative
negotiation Journal of Personality and Social
Psychology 74(2) 345
Barry B amp Oliver R L (1996) Affect in dyadic
negotiation A model and propositions Organiza-
tional Behavior and Human Decision Processes
67(2) 127-143
Blackman C (1977) Negotiating China Case studies
and strategies St Leonards Australia Allen amp
Unwin
Brenkert G G (1998) Trust morality and interna-
tional business Business Ethics Quarterly 8(02)
293-317
Brunner J A amp Taoka G M (1977) Marketing and
negotiating in the peoplersquos republic of China
Perceptions of American businessmen who atten-
ded the 1975 Canton Fair Journal of International
Business Studies 69-82
Butler J K (1995) Behaviors trust and goal
achievement in a win-win negotiating role play
Group amp Organization Management 20(4) 486-
501
Campbell N C Graham J L Jolibert A amp
Meissner H G (1988) Marketing negotiations in
France Germany the United Kingdom and the
United States The Journal of Marketing 52 49-62
Casse P (1981) Training for the Cross-Cultural Mind
(2nd ed) Washington DC Society for
Intercultural Education Training and Research
Cellich C (1995 January) Negotiations for export
business Elements for success In International
Trade Centre (ED) International Trade Forum
(No 4 p 20) Geneva Author
Clopton S W (1984) Seller and buying firm factors
affecting industrial buyersrsquo negotiation behavior
and outcomes Journal of Marketing Research 21
39-53
Coates A (1968) Myself a Mandarin Oxford UK
Oxford University Press
Davidson W H (1987) Creating and managing joint
ventures in China California Management Review
29(4) 75-95
Deutsch M Kelley H H amp Rapoport A (1964)
Strategic interaction and conflict Berkeley CA
Berkeley Institute of International Studies
University of California
Evans F B (1963) Selling as a dyadic relationship A
new approach American Behavioral Scientist 6
76-79
Fang T (1997) Chinese business negotiating style A
socio-cultural approach (Licentiate thesis)
Linkoping Sweden Inter-national Graduate School
of Management and International Engineering
(IMIE)
Fisher R Ury W amp Patton B (1991) Getting to
Yes (2nd ed) New York NY Penguin Books
Ganesan S (1994) Determinants of long-term
orientation in buyer-seller relationships The
Journal of Marketing 19(4) 1-19
Gardner L amp Aronson G (Eds) (1968) Handbook
of Social Psychology Reading MA Addison-
Wesley
George J M Jones G R amp Gonzalez J A (1998)
The role of affect in cross-cultural negotiations
Journal of International Business Studies 29(4)
749-772
Gilsdorf J W (1997) Metacommunication effects on
international business negotiating in China
Business Communication Quarterly 60(2) 20-37
Goh B C (1996) Negotiating with the Chinese
Euro-Asia Business Review 5(1) 34-36
Graham J L (1985) The influence of culture on the
process of business negotiations An exploratory
study Journal of International Business Studies
81-96
Graham J L (1986) The problem-solving approach
to negotiations in industrial marketing Journal of
Business Research 14(6) 549-566
Graham J L (1990) An exploratory study of the
process of marketing negotiations using a cross-
cultural perspective In E A Scarcella amp S
Krashen (Eds) Developing communicative
Negotiation Factors and Culture in Trade Negotiations
8
competence in a second language (pp 239-279)
Rowley MA Newbury House
Greenhalgh L amp Gilkey R W (1993) The effect of
relationship orientation on negotiatorsrsquo cognitions
and tactics Group Decision and Negotiation 2(2)
167-183
Gumperz J J (1982) Discourse strategies Cambridge
UK Cambridge University Press
Hall E T (1976) Beyond culture Garden City NY
Anchor Press
Hall E T (1989) The silent language New York
NY Bentam-Doubleday
Hofstede G (1991) Cultural and organization amp
software of the mind Berkshire England
McGraw-Hill
Hofstede G (2001) Culturersquos consequences (2nd ed)
Thousand Oaks CA Sage
Jones G R amp George J M (1998) The experience
and evolution of trust Implications for cooperation
and teamwork Academy of Management Review
23(3) 531-546
Kumar R (1997) The Role of affect in negotiations
an integrative overview The Journal of Applied
Behavioral Science 33(1) 84-100
Kumar R (2004) Culture and emotions in
international negotiations An overview In M J
Gelfand amp J M Brett (Eds) The handbook of
negotiation and culture (pp 95-113) Stanford CA
Stanford Business Books
Lewicki R J amp Stark N (1996) What is ethically
appropriate in negotiations An empirical examina-
tion of bargaining tactics Social Justice Research
9(1) 69-95
Lewis S A amp Fry W R (1977) Effects of visual
access and orientation on the discovery of
integrative bargaining alternatives Organizational
Behavior and Human Performance 20(1) 75-92
Linton R (1945) The cultural background of personality
New York NY Appleton-Century Crofits
McAllister D J (1995) Affect-and cognition-based
trust as foundations for interpersonal cooperation
in organizations Academy of Management
Journal 38(1) 24-59
Min H amp Galle W (1993) International negotiation
strategies of US purchasing professionals Interna-
tional Journal of Purchasing and Materials
Management 29(2) 40-50
Pennington A L (1968) Customer-salesman bargain-
ing behavior in retail transactions Journal of
Marketing Research 255-262
Pruitt D G (1981) Bargaining Behavior New York
NY Academic Press
Reardon K K amp Spekman R E (1994) Starting out
right Negotiation lessons for domestic and cross-
cultural business alliances Business Horizons
37(1) 71-79
Rempel J K Holmes J G amp Zanna M P (1985)
Trust in close relationships Journal of Personality
and Social Psychology 49(1) 95
Rubin J Z amp Brown B R (1975) The social
psychology of bargaining and negotiation New
York NY Academic Press
Salacuse J W (1991) Making global deals negotia-
ting in the international marketplace Boston MA
Houghton Mifflin
Sawyer J amp Guetzkow H (1965) Bargaining and
Negotiation in International Relations In H C
Kelman (Ed) International behavior A social-
psychological analysis (pp 464-520) New York
NY Holt Rinehart and Winston
Sebenius J K (2002) The hidden challenge of cross-
border negotiations Harvard Business Review
80(3) 76-85
Shenkar O amp Ronen S (1987) The cultural context
of negotiations The implications of Chinese
interpersonal norms The Journal of Applied
Behavioral Science 23(2) 263-275
SRI International (1979) Doing Business in Taiwan
and Doing Business in Japan [Pamphlet] Menlo
Park CA Schmidt K D
Stewart S amp Charles F K (1989) Talking with
dragon Negotiating in the peoplersquos republic of
China Columbia Journal of World Business 23(3)
68-72
J Glob Bus Trade Vol 9 No 2 (November 2013) 1-9
9
Strong K amp Weber J (1998) The myth of the
trusting culture a global empirical assessment
Business amp Society 37(2) 157-183
Thibaut J W amp Kelly W H (1959) The social
psychology of groups New York NY McGraw-
Hill
Triandis H C Kurowski L L amp Gelfand M J
(1994) Workplace diversity In H C Triandis M
D Dunnette amp L M Hough (Eds) Handbook of
industrial and organizational psychology (pp 769-
827) Palo Alto CA Consulting Psychologists
Tung R L (1982) US-China trade negotiations
practices procedures and outcomes Journal
of International Business Studies 25-37
Weiss S E (1993) Analysis of complex negotiations
in international business The RBC perspective
Organization Science 4(2) 269-300
Weitz B (1979) A critical review of personal selling
research The need for contingency approaches In
G Albaum amp G A Churchill (Eds) Critical
issues in sales management State of the art and
future research needs Eugene OR University of
Oregon
Yoshimatsu H (2005) Japanrsquos keidanren and free
trade agreements Societal interests and trade
policy Asian Survey 45(2) 258-278
Zandt V (1970) How to negotiate in Japan Harvard
Business Review 25-38
J Glob Bus Trade Vol 9 No 2 (November 2013) 11-21
11
ISSN 1946-5130
Journal of Global Business and Trade
wwwiagbtcom
Is the Agrochemical Industry Traversing the Organic Route
Insights and Directions for a Philippine Agrochemical
Trading Company
Jane Keneth M Mampustia Jeanette Angeline B Madamba
b Agnes T Banzon
c and
Loida E Mojicad
abcd College of Economics and Management University of the Philippines Los Bantildeos Philippines
Received 12 August 2013 Revised 22 September 2013 Accepted 25 October 2013
ABSTRACT
This paper explores the strengths weaknesses challenges and opportunities of a Philippine agrochemical
trading company as it thrives within its broader macro-environment In an era of climate change adaptation
and ailing global economies agrochemical companies within the food chain face even greater barriers to
survival and competitiveness The study revealed that the agrochemical industry has made baby steps in
encouraging farmers to adopt the natural or organic way of farming through the use of biopesticides and
biofertilizers as a response to climate change but price-sensitive farmers appear indifferent to the use of
biopesticides and biofertilizer and readily switch suppliers depending on product prices as well as the
promotional activities done by agrochemical trading companies These suggest that agrochemical usage will
continue to dominate global agriculture in the next couple of years while biologicals in organic agriculture
will account for a minimal percentage despite the trend toward sustainable agriculture To be sustainable it is
suggested that agrochemical trading companies introduce new brands for each product type formulate a
customer retention strategy for its dealers and independent business partners and pursue a market penetration
strategy to widen the customer base as they track their moves against a changing global agrochemical
industry
Keywords agrochemical industry biopesticides climate change adaptation organic agriculture sustainability
Ⅰ Introduction2
Agrochemicals also known as crop protection
products are those products or substances which are
used to effectively and actively manage the agricultural
ecosystem Agrochemical products include pesticides
herbicides insecticides and fungicides Synthetic
fertilizers hormones and other chemical growth agents
2013 International Academy of Global Business and Trade
All rights reserved
as well as concentrated stores of raw animal manure
may also be included in the list of agrochemical
products These products can be classified into four
categories inorganic pesticides organic pesticides and
pre-emergent and post-emergent herbicides These
chemicals play a vital role in controlling and restrain-
ing the damaging attacks of pests weeds fungi
diseases and other undesirable pests which pose
serious threats to global crop production The benefits
offered by agrochemical products are two-fold the
Is the Agrochemical Industry Traversing the Organic Route Insights and Directions for a Philippine
Agrochemical Trading Company
12
control of certain pests and diseases to improve crop
productivity and indirectly poverty alleviation (Fertili-
zer and Pesticide Authority 2012)
Fig 1 Benefits of Pesticides to Control Human and Livestock Disease Vectors and Nuisance Organisms
Source Cooper and Dobson as cited in Cuyson S (2007)
Pesticide products when used properly can give
benefits not only to the community but to the whole
society as shown in Fig 1 Problems which most
farmers complain about like fast-growing weeds and
threats to crop productivity can be resolved through the
application of herbicide The application would reduce
cost of labor and fuel specifically for large plantations
Safety for the environment and human health is also
emphasized Careful regulatory policies are implemented
by the FPA so that the environment and human health
would not be at risk Although chemical-based crop protection products
have contributed time and again toward increasing
farmersrsquo incomes because these products prevent
massive crop losses caused by pests and diseases Due
to the need to efficiently meet demand farmers and
other agribusiness entities have to constantly rely on
crop-protecting chemical products since it only takes a
short period to harvest crops with the help of these
products (Tirado 2008) Agrochemical products as
well as the widespread use of irrigation have largely
contributed to the increase in agricultural production
On the other hand health concerns have caused a
negative perception of agrochemicals since over-
utilization of these products have caused problems
such as toxicity of the soil pollution and food poisoning
Established multinational companies involved in
the agrochemical industry as well as local companies
are pressured to effectively address the agricultural
trend of shifting to organic farming and developing
more environmentally-friendly products In addition
there are government policies to which they must align
their objectives with societal welfare in mind Non-
government organizations (NGOs) and environmental
groups such as Greenpeace have been actively making
their moves against crop protection companies With
this scenario players in the industry are bound to
strategize on how to improve product safety to defend
themselves from the actions of such groups in the
interest of sustainability
Phil-Agrochemicals Trading (not the real name) is
a nationwide distributor of generic agrochemical products
located in Southern Luzon Philippines Its distribution
network includes dealers independent business partners
(IBPs) and wholesalers The market may be skeptical
about the efficacy of generic agrochemical brands but
J Glob Bus Trade Vol 9 No 2 (November 2013) 11-21
13
this small company strives to be more responsible for
their products through continuous research on ways to
improve their products and demonstrate such efficacy
in crop protection Knowing their products may have
detrimental effects for the farmers if not properly used
the company conducts seminars or farmersrsquo group
meetings on the safe use of their products They also
give protective gear such as masks and gloves to the
farmer participants Products which are traded by this
company are manufactured by several suppliers in the
Philippines such as AgChem Manufacturing Corpora-
tion Radisson Agrochemical Corporation and Kemistar
Corporation These manufacturing compa-nies are
members of the Crop Protection Association of the
Philippines (CPAP) one of the leading crop protection
chemical associations in the country Phil-Agroche-
micals Trading also imports agrochemicals (speci-
fically insecticides) from Bharat Agro Chemicals in
India and China Xiamen Top using Import amp Export
Co Ltd from China About 10 of their total
inventory comes from imported insecticides Currently
Phil-Agrochemicals Trading which also distributes
products of its sister company has fifteen pesticide
products and two plant nutrition products in its
inventory pipeline
With the stiff competition in the Philippine agro-
chemical industry brought about even more by the
institution of Republic Act No 10068 (also known as
the Organic Act of 2010) the company has to find
ways to better strategize so as to gain customer trust
encourage continued patronage and improve overall
company performance The company has about eight
direct competitors
This paper aims to present an overview of the
agrochemical industry compare the firmrsquos operational
and functional strategies with the practices in the
industry identify and assess the problems and oppor-
tunities pertaining to these strategies and compare
these with its competitorsrsquo strategies and suggest
solutions to the problems or strategies to take
advantage of opportunities in view of the challenges of
going organic and the overall demand for the greening
of agriculture
II Methodology
Primary data for this exploratory research were
gathered from surveys and interviews with four
company officerspersonnel 60 farmers five indepen-
dent business partners and five dealers as well as an
actual apprenticeship at Phil-Agrochemical Trading
over a two-month period by the major author
Secondary data were obtained from printed sources
found at several government institutions such as the
Crop Protection Association of the Philippines (CPAP)
and the Fertilizer and Pesticide Authority (FPA)
company files and other printed or online publications
and unpublished special problem reports at the College
of Economics and Management library Descriptive
analysis combined with a comparative competitor analysis
and a SWOT analysis was used in this research
Ⅲ Review of Literature
Zhang et al (2011) identified three phases in the
history of pesticides and its application (1) the first
phase which covered the period before the 1870s saw
the use of natural pesticides (such as sulfur in ancient
Greece) as a pest control measure (2) the second phase
from the 1870s to 1945 saw the advent of inorganic
synthetic pesticides and the use of natural materials
and inorganic compounds and (3) the third phase
(from 1945 onwards) marked the era of organic
synthetic pesticides (eg DDT 24-D and later HCH
dieldrin) Since then humans synthesized most
pesticides which were later referred to as chemical
pesticides It was during the third phase (the era of
organic synthetic pesticides) when there was a boost in
agricultural productivity which became a moving force
for the advancement of human civilization
During the earlier portion of the third phase three
kinds of insecticides were used carbamated insecticides
organophosphorus insecticides and organochlorined
insecticides This was soon followed by the develop-
ment of herbicides and fungicides As seen in Table 1
herbicide use increased from 20 in 1960 to 48 in
2005 Herbicides comprised almost half of total
pesticide consumption in 2005 (Zhang et al 2011)
Is the Agrochemical Industry Traversing the Organic Route Insights and Directions for a Philippine
Agrochemical Trading Company
14
Table 1 Changes of Pesticide Consumption Worldwide
CATEGORY 1960 1970 1980 1990 2000 2005
Sales Sales Sales Sales Sales Sales
Insecticides 310 365 1002 371 4025 347 7655 29 7559 279 7798 25
Herbicides 170 20 939 348 4756 14 1162
5
44 1288
5
475 1497
1
48
Fungicides amp Bactericides
340 40 599 222 2181 188 5545 21 5306 196 7486 24
Others 30 35 159 59 638 55 1575 6 1354 5 936 3
Total 850 100 2700 100 11600
100 26400
100 27104
100 31191
100
Note Sales in millions USD
Source Xu (1997) httpwwwdocincomp-55305172html as cited in Zhang et al (2011)
According to the Food and Agriculture Organi-
zation of the United Nations (FAO) fertilizer and
pesticide use in the Philippines between 1961 and
2005 increased by 1000 and 325 respectively
This was caused by the widespread use of irrigation
agrochemicals and new seeds in the country However
crop yield only increased by a small amount even
though agrochemical products were used This was
mainly attributed to excessive and inappropriate use of
chemical-based products in farming causing land
degradation and losses in soil fertility
Ⅳ Overview of the Industry
41 Global Agrochemical Industry
Dussal (2011) stated that the world agrochemical
industry was valued at USD 134 billion in 2010 It is
expected to grow at a CAGR of 11 to reach USD
225 billion by 2015 The Asia Pacific region led the
global agrochemical and fertilizer consumption
accounting for 40 followed by North America with
32 The top ten global players include Bayer
Syngenta Potash Corp Agrium and Mosaic which
constitute around 90 of the world market share
Pesticide sales remained relatively constant over
the 1990s between USD 270 to 300 billion From 2007
to 2008 herbicides ranked first in the three major
categories of pesticides (insecticides fungicides
bactericides and herbicides) in terms of sales The
fungicidesbactericides ranked second Europe is now
the top consumer of pesticides in the world followed
by Asia Specific countries which largely use
pesticides are China the United States France Brazil
and Japan Most of the pesticides worldwide are used
for fruit and vegetable crops In developed countries
pesticides mainly herbicides are primarily used for
maize Since the 1980s there have been hundreds of
thousands of pesticides developed worldwide inclu-
ding biopesticides (Zhang et al 2011)
According to the US Environmental Agency
ldquobiopesticides are certain types of pesticides derived
from such natural materials as animals plants bacteria
and certain minerals For example canola oil and
baking soda have pesticide applications and are
considered biopesticides At the end of 2001 there
were approximately 195 registered biopesticide active
ingredients and 780 products Biopesticides fall into
three major classes
a Microbial pesticides consist of a micro-
organism (eg a bacterium fungus virus or
protozoan) as the active ingredient Microbial
pesticides can control many different kinds of
pests although each separate active ingre-
dient is relatively specific for its target pest(s)
For example there are fungi that control
certain weeds and other fungi that kill
specific insects
b The most widely used microbial pesticides
are subspecies and strains of Bacillus
thuringiensis or Bt Each strain of this
bacterium produces a different mix of
proteins and specifically kills one or a few
J Glob Bus Trade Vol 9 No 2 (November 2013) 11-21
15
related species of insect larvae While some
Btrsquos control moth larvae found on plants
other Btrsquos are specific for larvae of flies and
mosquitoes The target insect species are
determined by whether the particular Bt
produces a protein that can bind to a larval
gut receptor thereby causing the insect larvae
to starve
c Plant-Incorporated-Protectants (PIPs) are
pesticide substances that plants produce from
genetic material that has been added to the
plant For example scientists can take the
gene from the Bt pesticide protein and
introduce the gene into the plantrsquos own
genetic material Then the plant instead of
the Bt bacterium manufactures the substance
that destroys the pest The protein and its
genetic material but not the plant itself are
regulated by EPA
Fig 2 Distinguishing Factors for the Paradigm Shift in the Crop Protection Industry
Source Balayan (2010)
d Biochemical pesticides are naturally occurring
substances that control pests by non-toxic
mechanisms Conventional pesticides by
contrast are generally synthetic materials that
directly kill or disable the pest Biochemical
pesticides include substances such as insect
sex pheromones which interfere with mating
as well as various scented plant extracts that
attract insect pests to traps Because it is
sometimes difficult to determine whether a
substance meets the criteria for classification
as a biochemical pesticide the EPA has
established a special committee to make such
decisions
42 The Philippine Crop Protection Industry
According to the Samahan sa Pilipinas ng mga
Industriyang Kimika (SPIK) or Chemical Industries
Association of the Philippines in 2008 the utilization
of crop-protecting chemicals is still prevalent among
Filipino farmers In the country the most extensively
used pesticides are insecticides which account for 51
of the total market herbicides comprise 21
fungicides 14 and the remaining other types of
pesticides 14 These chemicals are used for crops
such as rice (about 33 million hectares of plantation
area) corn (32 million hectares) pineapple (67000
hectares) and banana (25000 hectares)
Is the Agrochemical Industry Traversing the Organic Route Insights and Directions for a Philippine
Agrochemical Trading Company
16
Because of the greater challenge faced by the
players there has been a progressive shift in the
industry from what is commonly known as an
agrochemical industry to a crop protection industry and
now to a plant science industry as shown in Fig 2 The
shift to a plant science industry is believed to deliver
products that would give better solutions to crop
problems and technologies that would lead to
sustainability As of now the multinational companies
or the CropLife members are the ones which are
already in the third phase (Balayan 2010) The generic
companies are still in phase 2 (crop protection) but on
their way to shift to phase 3 (plant science)
The Philippine crop protection industry is
comprised of firms engaged in the formulation
manufacture distribution repackaging importation
and exportation of chemical pesticides It has always
been dominated by transnational agrochemical com-
panies which are members of CropLife International
such as Bayer CropScience Syngenta Philippines Du
Pont Dow Agro These companies operate and manu-
facture their own agrochemical products These
companies focus more on the assurance of the safety of
their products Moreover they are now more respon-
sible about the flow of their products up through the
disposal phase Hence they practice product steward-
ship In 2008 the FPA has listed about 300 firms
operating in the country Other players in the industry
would include local companies such as the members of
the Crop Protection Association of the Philippines
(CPAP) and other generic product-making companies
As shown in Table 2 there has been an increasing
demand for pesticides in the country although a
continuous campaign against these products is done by
the NGOs An increase in Philippine importation of
pesticides is due to the fact that perceived sustainability
cannot be achieved without the help of these
agrochemical products The country is highly
dependent on importation due to the limited resources
available in the country for formulators and manufac-
turers Active ingredients are also imported by the
major industry players Local production is limited to
formulation of imported technical materials except for
24-D
Table 2 Value of Imports of Pesticides in the Philippines (in USD 1000rsquos)
Item 2006 2007 2008 2009 2010
Insecticides 39658 49152 65022 68873 51371
Fungicides 46751 40741 32109 26914 28648
Herbicides 22236 22793 21954 11715 5031
Disinfectants etc 10388 13033 30741 53249 85043
Total 119033 125719 149826 160751 170093
Source FAO (2010)
On the other hand exports of pesticides by the Philippines show minimal levels making the country a net importer of
pesticides (Table 3)
Table 3 Value of Exports of Pesticides in the Philippines (in USD 1000rsquos)
Item 2006 2007 2008 2009 2010
Insecticides 1335 2938 1547 1508 1928
Fungicides - - 1 15 132
Herbicides 1 262 400 81 27
Disinfectants etc 312 1199 915 1256 740
Total 1649 4399 2863 2859 2826
Source FAO (2010)
J Glob Bus Trade Vol 9 No 2 (November 2013) 11-21
17
43 Foreseen Trends in Global Pesticide
Production and Consumption
The trend nowadays is organic agriculture which is
seen also as sustainable agriculture Thus the ongoing
deterioration in the natural environment had Zhang et
al (2011) saying that biopesticides are the wave of the
future Such pesticides must be highly efficient non-
toxic and environment-friendly Biopesticides according
to Yang (2001) have the following advantages
a a positive control effect on pests safe to humans
and animals and no pollution
b no residuals
c strong specificity to target pests safe to natural
enemies and beneficial organisms
d raw materials and active ingredients are natural
products which helps to ensure sustainable
development
e they can be modified by means of modern
biotechnology and fermentation processes to
improve performance and enhance quality
f pest resistance is difficult to generate
Over 100 kinds of biopesticides exist at present
worldwide with about 30 types of biopesticides
commercially produced (Xu 2008) Countries such as
Mexico the United States and Canada dominate global
biopesticide usage accounting for 44 The total
world biopesticide consumption can be broken down
into 20 (Europe) 13 (Asia) 11 (Oceania) 9
(Latin America) and 3 (Carribean and Africa) (Qin
amp Kong 2006) As for China the biopesticide industry
has been expanding since the 1990s from 10 to 20
annually such that by 2006 total biopesticides
consumption reached 145000 tons accounting for 10
of total sales It is anticipated that biopesticides will
replace up to 20 of chemical pesticide consumption
in China in the years ahead
Since safer products are what consumers are
demanding companies such as United Farm Tech-
nologies Nuso Agro Science and Dow Agro started
selling and manufacturing safer pesticides called
biopesticides These products are derived from natural
materials Biopesticides constitute about 2 of the
global agrochemical market (Dussal 2011) In
Monsantorsquos pipeline are agricultural biological or
biopesticides produced using what they call the Bio-
Direct Technology which involves using molecules
found in nature expected to be developed for use in
topically applied crop protection and other products
(Monsanto 2012) Moreover Bayer CropScience
recently acquired AquaQuest a US-based supplier of
innovative biological pest management solutions based
on natural microorganisms for USD 500 million in its
bid to build a leading technology platform for green
products (Bayer 2012)
Ⅴ Results and Discussion
51 Compliance by Phil-Agrochemical
Trading with FPA Requirements
The FPA requirements relative to product labeling
were all met by the Phil-Agrochemical Trading These
include a statement of composition registration or
provisional permit number name and address of
company the productrsquos common name net contents
directions for use suitable indication of hazards
instructions on decontamination and safe disposal of
used containers the lot number and date of formulation
the FPA registration number re-entry period after
application triple rinse logo a person to contact in case
of emergency and safety instructions
52 Comparison of Phil-Agrochemical
Tradingrsquos Activities with CPAP
Activities
Four types of activities are carried out by CPAP
members product stewardship agromedical training
information education campaign aerial spraying semi-
nars and farmersrsquo meetings Phil-Agrochemical
Trading has yet to apply for CPAP membership A
comparison of its activities with CPAP activities
revealed that only farmersrsquo meetings are done by the
firm
Is the Agrochemical Industry Traversing the Organic Route Insights and Directions for a Philippine
Agrochemical Trading Company
18
53 Comparison of Phil-Agrochemical
Tradingrsquos Operations with Top
Competitors
Table 4 presents a summary comparison of Phil-
Agrochemical Tradingrsquos operations with two of its
top competitors CyBERTH Philippines Inc and
PhilAgrow Inc
CyBERTH Philippines Inc was established in
1999 and is engaged in trading pesticides and
fertilizers in the country However they trade more
pesticide products as fertilizer is more expensive The
companyrsquos product portfolio includes 24 registered
products categorized as insecticides herbicides
fungicides molluscicides or plant growth regulators
The major crops where these products can be used are
rice corn vegetables and mangos The companyrsquos
operations cover the research and development of new
products importation and local purchase of the
technical and inert materials of a particular product
formulation warehousing and supply of finished
products to its distributors This company continuously
searches for better products
PhilAgrow Inc started operations in 2006 and is an
importerdistributor of chemical pesticides such as
insecticides molluscicides fungicides herbicides
nematicides and specialties It has 18 FPA-registered
products
Table 4 Summary Comparison of Phil-Agrochemical Trading with Two Top Competitors
Points for Comparison Phil-Agrochemical
Trading CyBERTH Philippines Inc PhilAgrow Inc
Product Lines 14 FPA registered products 24 FPA registered products 18 FPA registered products
Product Variety
Herbicidesinsecticides
molluscicides fungicides fertilizer
Herbicides insecticides
molluscicides fungicides fertilizer
Insecticides molluscicides
fungicide herbicides nematicides specialties
Promotional Activities
Farmers meetings caravans
raffle promos provision of protective gears
Farmers meetings raffle
promos provision of protective gears
Farmers meetings raffle
promos provision of protective gears
Target Market
General trade market
plantation businesses small farmers (below 2ha and 2ha
and above)
General trade market
plantation businesses small farmers below 2 ha
and 2 ha and above)
General trade market
plantation businesses small farmers below 2 ha and 2 ha
and above)
Location Scope Domestic Domestic Domestic
Facilities (eg warehouse
transportation)
Rented (Outsourced
production) Owned Research facility
Provision of training to employees
- Yes Yes
Note Firm name was disguised upon firmrsquos request
Among the points for comparison it can be seen
that Phil-Agrochemical Trading has the least number
of product lines at 14 FPA-registered products vis-agrave-
vis CyBERTH Philippines Inc with 24 FPA-
registered products and PhilAgro Inc with 18 FPA-
registered products In terms of product variety Phil-
Agrochemical Trading and CyBERTH Philippines
Inc have 5 types of products while PhilAgrow has 6
types All firms carry out the same promotional
activities have the same target market and location
scopecoverage Facilities of Phil-Agrochemical
Trading are rented while those for CyBERTH
Philippines Inc are owned PhilAgrow Inc has its
own research facility Only CyBERTH Philippines
Inc and Phil-Agrow Inc provide training to
employees
54 Farmer Survey Results
Sixty farmers surveyed had about 11-15 years of
farming experience primarily grew rice operated
small farms (1-5 hectares) and were customers of Phil-
J Glob Bus Trade Vol 9 No 2 (November 2013) 11-21
19
Agrochemical Trading for five years or less The
majority (over 91) bought pesticides from other
distributors because of lower prices and availability of
preferred agrochemicals On a scale of 1 to 7 with 7
being the highest rating most farmers rated Phil-
Agrochemical Trading a ldquo4rdquo Suggestions given by the
farmers to the firm included lowering the product
prices and increasing promotional activities to
encourage customer retention and continued patronage
55 Assessment of Strengths Weaknesses
Opportunities and Threats
Fig 3 shows a SWOT Matrix where Phil-Agro-
chemical Tradingrsquos strengths are matched with its
opportunities and then with its threats while its
weaknesses are matched with its opportunities and
then with its threats to generate possible strategy
alternatives for the firm to become sustainable Such
strategies include the introduction of new brands per
product type creation of a customer retention strategy
for its dealers and IBPs and pursuing market
penetration
Fig 3 SWOT Matrix
External
Internal
Opportunities Threats
(1) Training programs and seminars are conducted by institutions
such as FPA and CPAP
(2) The openness of farmers to new knowledge in crop production
(3) The bright prospects for the plant
science industry towards the attainment of food security
(4) Increasing trend towards the
production of biopesticides (5) Availability of funding agencies
(6) The support of government and
NGOs for organic farming
(7) The negative perception on the use of chemical pesticides and fertilizers
(8) Small farmers are highly sensitive to
pesticide prices (9) Increasing competition in the industry
due to increasing number of new
entrants (10) The effects of climate change on the
industry
(11) Products of the industry are not highly differentiated
(12) Prices of inputs for the manufacture
of pesticides are volatile
Strengths
Introduction of different brands for
each type of pesticide
(S1 S2 and O1 O5)
Market Penetration
(S1 S3 and T1 T3 T6)
1 The firm has suppliers which are
members of CPAP
2 The firm has its BOD as distributors
3 They do not distribute Category I
pesticide 4 The company has developed
partnership with the dealers of
organic fertilizers
Weaknesses
Creation of customer retention
strategy for the dealers and IBPs
(W2 W3 W5 and O1 O2 O3)
Creation of customer retention strategy for the dealers and IBPs
(W2 W3 W4 and T1 T2 T3 T6)
1 Lack of warehousing facilities
2 Weak brand recognition
3 Non-commitment of dealers and
IBPs
4 Experiences stock-outs of products
5 The company does not have well-
established customer relationships
56 Insights and Directions It is apparent that though the agrochemical industry
has taken action in traversing the organic route toward
Is the Agrochemical Industry Traversing the Organic Route Insights and Directions for a Philippine
Agrochemical Trading Company
20
sustainability it has only taken small steps in that
direction Even if customers are clamoring for safe
food and in spite of the trend towards organic
agriculture and sustainability most farmers remain
indifferent toward using biopesticides and other
biologicals in farming on account of their sensitivity to
input prices and demand for more promotional
activities Thus in the next couple of years it is
expected that agrochemicals of a synthetic nature will
continue to dominate the global agrochemical industry
in terms of usage and market share Such a trend is
expected to spill over to Asia including the Philippines
as transnational companies take in a sizeable share of
the market
To survive and compete in the industry agroche-
mical trading companies must employ a number of
strategies such as introduce new brands for each
product type formulate a customer retention strategy
for its dealers and IBPs and pursue market penetration
Lastly in the case of Phil-Agrochemical Trading the
firm should consider CPAP membership and carry out
product stewardship agromedical traininginformation
education campaign and aerial spraying seminars to
enhance its competitiveness in the agrochemical
industry
References
Balayan L M A (2010) An apprenticeship study on
Bayer cropscience Gocus on its thrust towards
sustainable development through its quality health
safety and environment (QHSE) system (Under-
graduate Special Problem Report) Los Banos
Philippines University of the Philippines Los
Bantildeos
Castillo A (2000) A special problem report on Bayer
Philippines Inc (Undergraduate Special Problem
Report) Los Banos Philippines University of
the Philippines Los Bantildeos
Cuyson S (2007 March) Pesticides in sustainable
agriculture and the environment Paper presented
at the 38th annual scientific conference Tagbilaran
Philippines
David F R (2009) Strategic Management Concepts
and Cases (12th ed) Upper Saddle River NJ
Pearson Education
Dussal M (2011) Agrochemicals Retrieved from
httpwwwAgrochemicalInformationand Resour-
ceshtm
Lu J L (2009) Total pesticide exposure calculation
among vegetable farmers in Benguet Philippines
Journal of Environmental and Public Health 2009
Retrieved from httpwwwhindawicomjournals
jeph2009412054
Lum KY Mamat M J Cheah UB Castaneda
CP Rola AC amp Sinhaseni P (1993) Pesticide
research for public health and safety in Malaysia
the Philippines and Thailand Retrieved from
httpwwwnzdlorggsdlmode=d-00000-00-off-
0envl000010000direct-10401l11-en-5020-about-
00010004001110-0utfZz800ampcl=CL13ampd=HAS
H 016be195f7a6257ed84a093544ampgt=1
Palacio E B (2004) An apprenticeship study on the
crop protection division of syngenta corporation
(Undergraduate Special Problem Report) Los
Banos Philippines University of the Philippines
Los Bantildeos
Qin X F amp Kong F B (2006) Prospect and
situation of biopesticides Journal of Anhui Agri-
cultural Sciences 34(16) 4024 4057
The Philippines (1996) Philippine case study a
developing countryrsquos perspective on POPs Paper
presented at the IFCS Meeting on POPs Manila
Philippines Retreived from httpwwwchem
unepchpopsindxhtmsmanexp7html
Tirado R amp Bedoya D (2008) Agrochemical use in
the Philippines and its consequences to the environ-
ment Quezon Philippines Greenpeace Southeast
Asia Retrieved from httpwwwgreenpeacetopu
bliccationsGPSEA_agrochemical-use-in-the-phili
ppdf
Varca L M (2002) Impact of agrochemicals on soil
and water quality Food and Fertilizer Technology
J Glob Bus Trade Vol 9 No 2 (November 2013) 11-21
21
Center Retrieved from httpwwwagnetorg
libraryphpfunc=viewampid=20110804160130
Xu Y Z (2008) The application of biological
pesticides and industrial development measures
Chinese Agricultural Science Bulletin 24(8) 402-
404
Yang J L (2001) Green chemistry and technology
Beijing Beijing University of Posts and Teleco-
mmunications 176-180
Zhang W Jiang F amp Ou J (2011) Global pesticide
consumption and pollution with China as a focus
Proceedings of the International Academy of Ecol-
ogy and Environmental Sciences 1(2) 125-144
J Glob Bus Trade Vol 9 No 2 (November 2013) 23-27
23
ISSN 1946-5130
Journal of Global Business and Trade
wwwiagbtcom
A Study on the Dependency on Japan and the
Competitiveness of Gear Boxes
Kwang Hee Kim
Department of Business Administration Hyupsung University Korea
Received 15 August 2013 Revised 20 September 2013 Accepted 28 October 2013
ABSTRACT
From the trade deficit with Japan in 2012 of 2557 billion USD the trade surplus of material and components
industry was 2223 billion USD in deficit 87 of such trade deficit with Japan came from the material and
components industry
This study is to focus on the competitiveness index of absolute inferiority in automobile components as of
2012 and lsquogear box and other componentsrsquo that are over the trade for each amount of the automobile
components with Japan
Keywords competitiveness index(CI) dependence on Japan gear box industry trade deficit against Japan
Ⅰ Introduction3
As of 2012 Korea accomplished overall exports of
54787 billion USD and imports of 51958 billion USD
and as a result the trade surplus accomplished a
surplus of 2829 billion USD If this is limited to the
material and components industry the global exports
and imports were 25341 billion USD and 16249
billion USD respectively and as a result the trade
surplus recorded a surplus of 9092 billion USD that
the trade surplus exceeded 60 billion USD To put it
differently the present vast trade surplus mainly came
from the trade surplus of the material and components
industry
In the meantime the trade surplus with Japan
(2012) recorded a deficit of 2557 billion USD It was
less than the trade deficit with Japan for the previous
2013 International Academy of Global Business and Trade
All rights reserved
year 2011 (2864 billion USD) but it was attributable
to the decreasing imports from Japan from the
exchange rate with strong Yen and weak Won
currency The vast scale of the trade deficit with Japan
did not happen overnight
For this background the vulnerability of the
domestic material and components industry was the
greatest cause for the aforementioned From the trade
deficit with Japan in 2012 of 2557 billion USD the
trade surplus of material and components industry was
2223 billion USD in deficit 87 of such trade deficit
with Japan came from the material and components
industry
This study is to focus on the competitiveness index
(-091) of absolute inferiority in automobile compo-
nents as of 2012 and lsquogear box and other components
(8708-40-0000)rsquo that are over the trade for each
amount of automobile components with Japan
Through the foregoing the purpose is to analyze the
A Study on the Dependency on Japan and the Competitiveness of Gear Boxes
24
trend of export and import competitiveness on the
material and components industry with Japan and lead
a responsible strategy for improving the trade deficit
with Japan
Ⅱ Trade Surplus and Status
Looking into the global export and import scale of
lsquogear box and other componentsrsquo (2012) exports reached
2528801000 Dollars and imports 1568670000
Dollars as a result the trade surplus reached
1471934000 Dollars Looking into the export and
import scale with Japan on this item for the same year
it recorded the export of 2379 billion USD and import
of 491028 million USD as a result the trade deficit
recorded 467238 million USD
On the other hand the scale of trade deficit (-470
million USD) with Japan for lsquogear box and other
componentsrsquo was applicable for 18 of the entire
trade deficit with Japan (-2557 billion USD) and 21
of trade deficit with Japan for material and components
(-2233 billion USD)
Also looking only at the trade surplus with Japan
for automobile components (-430 million USD) the
trade deficit of lsquogear box and other componentsrsquo took a
high ratio applicable for 1159 that the status of these
item could be shown
Therefore relief from the trade deficit with Japan
by domestic automobile components industry could be
concluded as impossible without an improvement in
the trade deficit of the lsquogear box and other componentsrsquo
For reference from the costs of a completed car
the ratio for the gear box is known to be around 7-8
As such a gear box with a high ratio of production cost
also has the longest quality assurance limit in that it is
the core item for a high added-value to measure the
competitiveness of a complete car
As shown through the comparison with other
indices under the following Fig 1 the import scale
with Japan for the lsquogear box and other componentsrsquo is
very high Furthermore the import dependence of
Japan has declined from 801 in 1988 770 in
1998 597 in 2008 and 465 as of 2012 but the
import dependency on Japan may be assessed as high
Fig 1 Ratio of Gear Box in the Trade Deficit with
Japan (2012)
Source Prepared by the author by facilitating the Korea International Trade Association (2013)
The global export of this item has clear trend of
increase in recent days The trend of increase has been
significantly moderated from 252 million USD in
1988 to 9 million USD in 2000 However it began
with 2865 million USD in 2002 to leap to 6704
million USD in 2004 918 million USD in 2006
27079 million USD in 2008 and 75942 million USD
in 2010 and it increased to 1 billion 4234 million
USD in 2011 twice that of the previous year As of
2012 it has drastically increased to 2528801000
Dollars over 1 billion USD from the previous year that
exports has shown dramatic increase since 2009
In spite of that the exports to Japan of this item
were USD 970000 in 1988 USD 910000 in 1998
942 million USD in 2008 and 2379 million USD as
of 2012 it has seen very little increase for a quarter of
a century
On the other hand imports from Japan were
15506 million USD in 1988 19402 million USD in
1998 72344 million USD in 2008 and 965669
million USD in 2010 but it has plummeted to record
491028 million USD as of 2012 Compared to 2010
imports from Japan dropped less than a half
J Glob Bus Trade Vol 9 No 2 (November 2013) 23-27
25
Fig 2 Trend of Exports and Imports (1988~2012) of Gear Boxes (8708-40-0000)
Source Prepared by the author by facilitating the Korea International Trade Association (2013)
The trade deficit in automobile components with
Japan to this point has been pointed out with a cause of
importation in highly functional and high-tech
components impossible for domestic development
However according to the interview survey result on
the recent domestic automobile industry gear boxes
imported from Japan are mainly for large commercial
vehicles that are made for productivity purposes in
Korea
Ⅲ Price per Weight on Export and
Import Items
In order to consider the problems in lsquogear box and
other componentsrsquo in detail the price per weight price
of export and import items are analyzed for each price
Following is a brief summary of the export and
import scales and the status of gear boxes to Japan As
is well known in the case of Japan the status of gear
box exports and imports were an item with
overwhelmingly excessive exports Based on 2011
exports were 133 trillion Yen (approximately 18
trillion won) with 128 export countries On the other
hand the imports were only 606 billion Yen
(approximately 800 billion won)
The weight price of Japan for gear boxes is
approximately 1880 Yenkg for the gear boxes with a
high price imported as compared to the export product
price of 1500 Yenkg In particular the weight price
for the import item from the first import subject
country the Netherlands was 7380 Yenkg which
was overwhelmingly higher than the second country
the US of 1270 Yenkg Also the weight price of
export items from the US and Europe was around
1500 Yenkg but the import item price was 2000
Yenkg or higher
A Study on the Dependency on Japan and the Competitiveness of Gear Boxes
26
Table 1 Amount per Kg for Global Export and Import of Gear Boxes
Year Export Import
Amount (USD 1000) Weight (kg) USDkg mount (USD 1000) Weight (kg) USDkg
2005 119947 9259951 130 714512 45342883 158
2006 91804 8512492 108 778889 52223376 149
2007 127074 12051377 105 1066938 72512561 147 2008 270795 21068540 129 1212621 72940221 166
2009 307779 25239366 122 900597 53010625 170
2010 759422 58236825 130 1362034 81828230 166 2011 1423403 106723042 133 1405309 78567171 179
2012 2528801 180077148 140 1056867 59809776 177
A total of 8
years Average weight price 1246 Average weight price 1640
Source Prepared by the author by facilitating the Korea International Trade Association (2013)
On the other hand the weight price of imported
items from Korea was less than 1000 Yenkg for the
gear box an affordable price This fact could be
affirmed by the result calculated through facilitation of
the statistical data of Korea International Trade
Association by the author
In 2010 and 2012 the global weight price of export
items of Korearsquos lsquogear box and other components
(8708-40-0000)rsquo was 130 Dollarkg and 140 Dollarkg
respectively the import item price for the same year
was 166 Dollarkg and 177 Dollarkg respectively
There was a difference in weight price of 3 Dollarkg
or more between items of export and import (Table 1)
Looking into the trend of the 8-year period from
2005 to 2012 the weight price of import items was
higher than the export items The average weight price
of global export items for this item for the 8-year
period was 1246 Dollarkg while the average weight
price for the import item was 1640 Dollarkg there
was a unit price difference of 4 Dollarkg
Thereafter the weight price of the export item to
Japan for the above items in 2010 and 2012 was 81
Dollarkg and 74 Dollarkg respectively while the
import item price was 158 Dollarkg and 160
Dollarkg respectively there was a two times weight
price difference between the export and import items
(Table 2) Looking into the period of 2005 - 2012 for
the above the import items to Japan had a higher
weight price than the export items In addition the
average weight price of the export items for 8 years
was 1105 Dollarkg while the average weight price of
the import item was 1509 Dollarkg there was
approximately 4 Dollarkg or more of price difference
In addition the export amounts to Japan for 2010
and 2012 were 81 Dollarkg and 74 Dollarkg It
declined 4 Dollarkg or more compared to 2009 which
is considered as attributable to diverse types of gear
boxes exported with a drastic increase of exports to
Japan in these two periods
Characteristics of export and import items to the
world and Japan on the gear box and other components
(8708-40-0000) have a higher average weight price in
export and import to Japan than the export and import
items to the world have a higher average weight price
than the import items to Japan
Furthermore when comparing the weight price for
exports and imports to the world and Japan on this
item the import items were higher than the export
items To interpret it differently it is proof that the
export of the gear box had lower added value than the
imported items
J Glob Bus Trade Vol 9 No 2 (November 2013) 23-27
27
Table 2 Amount per Kg for Exports and Imports of Gear Boxes with Japan
Year Export Import
Amount (USD 1000) Weight (kg) USDkg mount (USD 1000) Weight (kg) USDkg
2005 14004 1010821 139 444022 29443945 151
2006 10124 805067 126 531454 38286910 139
2007 10180 845554 120 725042 55581305 130 2008 9420 708144 133 723444 49337793 147
2009 9235 743895 124 628173 39923189 157
2010 11075 1361065 81 965669 61103817 158 2011 19866 2284696 87 812394 49161068 165
2012 23790 3225976 74 491028 30683013 160
A total of 8
years Average weight price 1105 Average weight price 1509
Source Prepared by the author by facilitating the Korea International Trade Association (2013)
Ⅳ Conclusions
The following is the summary of contents shown
through the analysis of the lsquogear box and other
componentsrsquo
First the above items have shown a drastic
increasing trend for global export after 2009 but
export to Japan was still in a minimal increasing trend
close to horizontal line even as of 2012
Second characteristics of export and import items
to the world and Japan showed a higher average
weight price of export items to Japan than the export
items to the world and the import items from the
world had a higher average weight price than the
import items from Japan Also when comparing the
export and import weight prices with the world and
Japan for the above item the import items had a higher
rate than the export items To put it differently the
export of gear boxes was proven to have lower added
value than the import items
Lastly a brief mention was made on the direction
of the lsquogear box and other componentsrsquo
The recent assembly processing technology has
become standardized globally while the material and
components technology have been monopolized by
some advanced countries including Japan Because of
the foregoing the foreign currency earned from the
global market was turned over to Japan and the added
value for Korean industry has not been significant at all
Furthermore if the import of core material and
components such as lsquogear box and other componentsrsquo
is dependent on a specific country there is possible
subordination in the industrial structure with a high
possibility of losing the initiative in production and
price
Purchasing core material and components from
Japan was inevitable in the economic growth process
of Korea in the past but the time has come to make a
great change in the domestic industry
References
Grubel He G amp Peter L (1975) Intra-industry
trade The theory and measurement of interna-
tional trade in differentiated products London
UK MacMillan
Kim Kwang-Hee (2008) The competitiveness of
domestic auto parts industry against Japan The
Korean-Japan Journal of Economics amp Manage-
ments Studies 41
Kim Kwang-Hee (2013 June) A study on the
dependency on Japan and competitiveness of gear
box Paper presented at the 10th annual conference
and research symposium Mongolia National
University Mongolia
Korea International Trade Association (2013) Trade
statistics data Retrieved from httpwwwkitanet
J Glob Bus Trade Vol 9 No 2 (November 2013) 29-34
29
ISSN 1946-5130
Journal of Global Business and Trade
wwwiagbtcom
The Nature of Competition in an Indian Market Focusing on
the Volume Zone
Tirtha Bahadur Karki
Graduate school of Asian and International Business Strategy Japan
Received 14 June 2013 Revised 12 September 2013 Accepted 2 October 2013
ABSTRACT
Emerging countries are playing a growing role in the world economy It is a role that is expected to be even
greater in the future The recent global financial and economic crisis has further emphasized the stagnation of
most developed economics and taken prominence in emerging economics In particular China and India play
a significant role as global markets Henceforth it is estimated that the Indian volume zone will expand
rapidly and steadily On the other hand Japan and other developed economies tend to be sluggish Therefore
Japanese multinational corporations may have to target Indian volume zone consumers To do so they are
required to change their strategy management and production systems to compete with local and international
rivals in the market because the nature of the competition is totally different in an Indian market than other
developed country However definitions of the volume zone differ among research institutions researchers
countries and urban and local areas which creates considerable differences in the size of markets Thus in
this paper the literature review summaries and compares the definitions of the volume zone first Second this
paper tries to Fig out the most important part of the volume zone which has a key role in making a business
strategy Third differences between developed markets and the Indian market are examined and the nature of
competition in the Indian market is argued Finally the main argument and implication are stated
Keywords competition developed market emerging market Indian market strategy volume zone
Ⅰ Introduction4
There is very significant global interest in the
Indian economy Along with China Brazil Indonesia
and a few other countries India promises great potential
of growth in the next few years and decades The
future of the Indian economy is thus a significant
concern among the global financial and business
community economic policy-makers and managers
multilateral financial institutions economists and
2013 International Academy of Global Business and Trade
All rights reserved
other academics as well as investors and consumers in
India The significant global interest in India is not
surprising It is well known that - on a purchasing
power parity basis ndash India is already at over USD
four trillion of GDP the fourth largest economy in the
world very close to the size of the Japanese economy
the third largest In the next 15 to 18 years this size is
expected to grow as per various studies and estimates
four to five times As a result many foreign investors
and a majority of global companies and businesses are
making a beeline for the Indian market which
The Nature of Competition in an Indian Market Focusing on the Volume Zone
30
promises a booming volume zone5 of a few hundred
million consumers (Fig 1) expanding steadily in the
next few decades
Fig 1 Shares of Global Middle Consumption
2000-2050
Source Kharas (2010)
On the other hand advanced economies including
Japan are slowing down Japan has been in a long
recession with a real GDP growth rate of 39 in 2010
It underlines the world economy shift from developed
nations with their huge populations rising household
incomes and expansion of consumer goods and
service markets toward the emerging economies6
From these perspectives the expansion of the
Indian volume zone has attracted considerable
attention Many Japanese firms have already adjusted
their strategy management and production systems in
order to compete with the Indian volume zone
However there are no official definitions of volume
zone7 and these definitions differ among research
institutions researchers countries and urban and local
areas This creates considerable differences in the size
of volume zone markets Thus the literature review
summarizes and compares the definitions of volume
zone arguements After identifying the important part
of the volume zone (what is the volume zone what is
the trend of the volume zone etc) this paper argues the
differences between developed markets and the Indian
5 It is also called middle class middle income class and
middle income In this paper the middle class is identified as volume zone
6 The countries and consumers team 2010
7 Eric D et al (2007) Kharas (2011)
market which is very useful in knowing the nature of
competition in the Indian market Finally the main
argument and implications are stated
11 Definitions of Volume Zone
There are various definitions of volume zone based
on annual household disposal income annual
household income and expenditure Since the
definition of volume zone is not standardized with
each countryrsquos factors it remains uncertain Thus we
need to define and examine the Indian volume zone
which is most important in order to Fig out a business
strategy
12 Annual Household Disposable Income
The Ministry of Economy Trade and Industry
(2010) Aoshima Kubota and Sakamoto (2009) Japan
research institute (2010) Mizuho Research Institute
(2010) and Yanagawa and Mori (2010) defined the
Asian volume zone including that of India as
comprising people whose annual household disposa-
ble incomes range between $5000 and $35000 (upper
middle class $15001-35000 lower middle class
$5001-$15000 lower class $1000-$5000 the poor
up to $1000) and the rich as those whose annual
household disposable incomes exceed $35000 On the
other hand Indiarsquos National Council of Applied
Economic Research (NCAER report 20052006)
defined the Indian volume zone as comprising people
whose annual household disposable incomes range
between $22320 and $4444 (Rs1000000-Rs200000
at 20012002 price)
Comparing these two definitions of volume zone
(Fig 2) the former defines that the annual household
disposal incomes of people in the volume zone tends to
be higher at $5001 to $35000 and the latter defines
that the incomes of people in the volume zone tends to
be lower at $4444 to $22320
J Glob Bus Trade Vol 9 No 2 (November 2013) 29-34
31
Fig 2 Definitions of Volume Zone by Annual
Household Disposable Income
13 Annual Household Incomes
First the World Bank (2007) and Milanovic and
Yitzhaki (2002) defined the global volume zone as
those with annual household incomes between the
mean incomes of Brazil and Italy that is an annual per
capita income of approximately $4000-$17000 (at
2000 purchasing power parity (PPP)) Second Bhala
(2009) adopted an absolute approach definition with
an annual per capita income of $3900-$113000 in
PPP terms Third Court and Narasimhan (2010)
divided the consumers of developing countries
including India into the following classes on the basis
of their annual household incomes global class
$113000 and above upper middle class $56500-
$113000 middle class $22500-$56499 lower
middle class $13500-$22499 and deprived class
below $13500 From this distribution the middle class
is defined as those with an annual household income of
$13500-$113000 in PPP terms
In order to compare these definitions Fig 3
presents the minimum and maximum annual incomes
that were specified by various researchers Bhala (2009)
specified the minimum annual income as $3900
which is much lower than that specified in other
definitions
Fig 3 Definitions of Volume Zone by Annual
Household Income
14 Expenditure
Some researchers defined the volume zone on the
basis of expenditures In 2007 Banerjee and Duflo
(2007) defined it on the basis of per capita expenditure
between $2-$4day In 2008 they defined the global
volume zone on the basis of per capita expenditure of
$2-$10day in 1993 PPP (Banerjee amp Duflo 2008) On
the other hand Ravallion (2010) defined it on the basis
of per capita expenditure between $2-$13 day Both of
these expenditure based definitions are used only in
emerging economies
Fig 4 Definitions of Volume Zone by Expenditure
These two definitions also show differences since
the higher bound is $10day and $13day In summary
the volume zone is defined differently on the basis of
various standards locations and economies Owing to
its complexity and variety the volume zone consumersrsquo
jobs incomes consumptions lifestyles and subjective
The Nature of Competition in an Indian Market Focusing on the Volume Zone
32
consciousness of the levels of society must also be
considered for defining the Indian volume zone
Ⅱ Catching the Trend
In order to consider the differences between the
definitions of volume zone this paper argues about
most important part of the volume zone to make a
better strategy in business The management team in
business must know about the volume zone but
$3900 or $4000 (Fig 3) in annual household income
does not make a vast difference in its strategy and
consumers lifestyle In relation to the poor by
associating it with an ability to choose to spend time
and money on something other than survival consider
the volume zone in the case of Indian markets where
estimates range from 30 million to approximately 300
million people
The volume zone is not (yet) the biggest segment
of Indiarsquos overall population Given all the attention
focused on Indiarsquos middle class in recent years it is
important to keep a proper perspective on its size and
potential purchasing power Even using the most
generous estimates of the grouprsquos size the volume
zone comprises less than 30 percent of the population
Thus the rich and the poor combined far outweigh the
Indian middle class The importance of the middle
class lies in the fact that it is the fastest growing
segment of the population Evidence shows that as
income increases the amount and variety of this
discretionary spending increases For corporations the
middle class in India thus presents significant business
opportunities The sales growth of consumer goods
such as televisions and mobile phones to the middle
class has already been established Given the
tremendous growth potential an increasing number of
products are being geared towards the volume zone
population In the transport industry which has
traditionally been dominated by rail travel newer cars
like the Tata Nano (which retails for a little over USD
3000) and low-cost airlines have enabled the volume
zone population to be increasingly mobile The growth
of the volume zone and the economic growth of India
are in a virtuous cycle Rising incomes lead to more
consumption which in turn leads to higher economic
growth then more employment opportunities and
subsequently higher wages and the circle starts again
Thus as the volume zone grows and continues to
increase domestic demand the economy will also
continue to grow Regardless of which definition is
correct and certain it is important to keep a proper
perspective on the potential of the volume zone The
volume zone in India has generated tremendous
interest from the media and multinational corporations
are looking for a new market demographic
Ⅲ Developed Markets and the Indian
Market
In recent years Indiarsquos market growth has
outstripped the developed markets In the 80s GDP
growth in developed nations and India was essentially
the same Between 2000 and 2010 average growth in
the Indian market rose to the point where it was three
times higher Besides this India has corruption less
infrastructure fare of terrorism and etc which are
abnormal in a developed country
Consumers in India tend to be more ethnocentric
than those in developed ones Products from the
western hemisphere are seen by Indian cultures as
carrying western values that might harm their society
as well as the local workforce In developed countries
price quality durability and other product-related
aspects are the major factors that influence buying
decisions Consumers in India tend to be less indivi-
dualistic than in developed ones They care more for a
larger local community and like to be identified as part
of it Advertising which exhibits local values and
traditions has a greater impact on consumers of India
whereas the more individualistic consumers from
developed countries are more influenced by adverti-
sing where the product differentiates itself specifically
from other products in the market
J Glob Bus Trade Vol 9 No 2 (November 2013) 29-34
33
These are the common differences between the
Indian market and developed markets Besides these
there are lots of differences between Indian markets
and developed markets
A survey held by the Graduate School of Asian
and International Business strategy8 in October 2011
on the title of ldquoEntry Strategy of the Japanese Firms in
India and Chinardquo shows that Japanese firms in India
are going to change their target from the upper
(wealthy) class to the Volume Zone (Fig 5) In 2011
581 percent of the Japanese firms replied that they are
targeting upper class customers in India By the way
the survey shows only 274 percent of firms were
targeting the upper class after 3 years (2014) and more
firms targeted the middle class Thus we can
understand the Japanese strategies are shifting from the
upper class to the Volume Zone
Fig 5 Shifting Strategy in India
Ⅳ Conclusion
Thus it is clear that the Indian volume zone is
expanding and Japanese companies are shifting their
strategy from the upper class to the volume zone The
problem is the presence of Japanese companies in the
Indian market where Japanese companies are domi-
nated by Korean and European-American companies
8 Principle of Asia University DrIkejima Masahiro
leads the survey
According to Shintaku and Amano (2009) develo-
ped countriesrsquo firms have more strong technology and
find it more difficult to target the volume zone of
emerging markets and to adopt the strategy locally
There is no room to think about if the strong tech-
nology of a company is harmful for its strategy in
emerging markets The problem is how to approach
the volume zone and this is important Specially the
volume zone comes from the lower class and
companies should know their lifestyle and behavior If
firms understand the value of money for the volume
zone they can easily shift their strategy too This helps
them succeed in the Indian volume zone
Finally the conclusion of this paper presents the
hypothesis for further research about how to approach
the volume zone of India The hypothesis is (Fig 6)
ldquoTo compete successfully in the Indian volume zone
firms need to catch the trend of the volume zone and
educate customers construct market infrastructure
train management personnel and understand the
abilities of the supply side are essential This is why
they need to cultivate their resources at a lower level
than they are targeted (volume zone)
This paper cannot include the case study and
cannot examine the strategy That will be further
researched by this author in the future
Fig 6 Possible Way to Succeed in the Volume
Zone of India
The Nature of Competition in an Indian Market Focusing on the Volume Zone
34
References
Akihisa Yahata (2012) IndiaASEAN business guide
Two challenges of market creation in emerging
countries Tokyo Japan Research Institute
Retrieved from httpwwwjricojppagejspid=
22012
Aoshima Minoru Kubota Yosuke amp Sakamoto
Ryohei (2009) Manufacturing for emerging eco-
nomics that has entered the second stage Learning
to emerging economics strategy of electronics
industry focused on the middle of the economic
pyramid Knowledge Creation and Integration
17(12) Nomura Research Institute Retrieved from
httpswwwnricomjpopinionchitekishisan2009
pdfcs20091208pdf
Banerjee A V amp Duflo E (2008) What is middle
class about the middle classes around the world
The journal of economic perspectives a journal of
the American Economic Association 22(2) 3
Bhalla S (2009) The middle class kingdom of India
and China Wasington DC Peterson Institute for
International Economics
Court D amp Narasimhan L (2010) Capturing the
worldrsquos emerging middle class The McKinsey
Quarterly 1-6
Dyck S Hansakul S amp Saxena R (2009)
Emerging Asiarsquos middle class-A force to be
reckoned with (eSocialSciences Working Paper
No 2232) Retrieved from httpeconpapersrepec
orgRePEcesswpaperid2232
Eric D B Diana F amp Adil S Z (2007) Tracking
the growth of Indiarsquos middle class The McKinsey
Quarterly 51-61
Japan Research Institute (2010 October) Chinarsquos eco-
nomic policy debate heats up in run up to party
congress Asia Monthly 10(115) 1-15
Kharas H (2011 June 13) India China middle class
boom faces many challenges FIRSTPOST
Retrieved from httpwwwfirstpostcomworld
china-india-middle-class-boom-24637html
Milanovic B amp Yitzhaki S (2002) Decomposing
world income distribution Does the world have a
middle class Review of Income and Wealth
48(2) 155-178
Ministry of Economy Trade and Industry (2010)
White paper on international economy and trade
2010 Tokyo Author
Mizuho Research Institute (2010) Japan companies
deviating from volume zone market of China and
India (Mizuho Report) Tokyo Author Retrieved
from httpwwwmizuho-ricojppublicationresearch
pdfreportreport10-0407pdf
National Council of Applied Economic Research
(2005) Annual resport 2005 Retrieved from
httpwwwncaerorgdownloadsannualreportsan
nualreport_2005pdf
Shintaku Junjiro amp Amano Tomo (2009) Emerging
market strategies changes in market and resource
strategies The Journal of Economics 75(3) 40-62
Syusuke Watanabe Tokutaro Hiramoto amp Naoya
Tsuaaki (2012) Developing BoP business as the
principal strategy in 70 trillion of emerging and
developing economics Paying the road to a new
market that is expected to reach 55 billion people
Knowledge Creation and Integration 20(1)
Nomura Research Institute Retrieved from
httpswwwnricomjpopinionchitekishisan2012
pdfcs20120103pdf
Shukla R (2010) How India earns spends and saves
unmasking the real India New Delhi India
SAGE Publications India
Ravallion M (2009) The developing worldrsquos bulging
(but vulnerable) ldquomiddle classrdquo World Development
38(4) 445-454
Sridharan E (2004) The growth and sectoral
composition of Indiarsquos middle class Its impact on
the politics of economic liberalization India
Review 3(4) 405-428
Yanagawa Noriyuki amp Mori Naoko (2010) Income
bracket towing Asiarsquos domestic demand (NIRA
Monograph Series No 31) Tokyo National
Institute for Research Advancement Retrieved
from httpwwwniraorjppdfmonograph31pdf
J Glob Bus Trade Vol 9 No 2 (November 2013) 35-44
35
ISSN 1946-5130
Journal of Global Business and Trade
wwwiagbtcom
Analysis of Public Health Expenditures on Leading Causes of
Morbidity in the Philippines
Paul Joseph B Ramireza and
Earl Joanne S Santos
b
b College of Economics and Management University of the Philippines Los Bantildeos Philippines b Corresponding Author College of Economics and Management University of the Philippines Los Bantildeos Philippines
Received 21 August 2013 Revised 25 September 2013 Accepted 29 October 2013
ABSTRACT
Provision of public goods and services is one of the major roles of the government in an economy Some of
the public goods and services that are being provided cause negative effects while others create positive
externalities One evident case of such is the market for health care Aware of its role to provide health care to
the people governments are even more challenged with the remarkable growth of the demand for health care
Furthermore there are market failures existing in the health care sector Given that the paper examined the
effects of public spending on health care specifically on the principal causes of morbidity in the Philippines
Aside from public spending the paper also took into account private health spending in the analysis The
study employed a pooled ordinary least squares regression model Results showed that the increase in
government spending significantly reduce the number of tuberculosis cases in the Philippines On the other
hand results for diarrhea indicated that public spending and number of diarrhea cases are positively related
The findings imply that although an increase in public health expenditures can have a significant impact on
the number of cases of diseases lowering tuberculosis cases for instance the study can be further extended by
valuing as well the other benefits that can be derived from a prevented sickness resulting from an increase in
public health expenditures
Keywords health care morbidity positive externalities public goods public health expenditures
Ⅰ Introduction9
Economics texts suggest different extents to which
the government can intervene in market activities
Classical economists advocate that the main and in
some instances only role of the government is to
ensure peace and order in the economy ie ensuring
property rights are properly defined and laws and
policies are well-enforced Keynesian economists on
the other hand believe that the government has a
2013 International Academy of Global Business and Trade
All rights reserved
significant role as Keynes demonstrated during the
Great Depression At present different economies adopt
different blends of the two extreme cases However
common to all economies is the need for government
intervention in the presence of market failures and
missing markets given that the government can do
better than the market ie such intervention will not
lead to government failures resulting in further
inefficiencies
It is a known fact that one of the major roles of the
government in an economy is the provision of public
goods Paying no attention to it would result in under-
Analysis of Public Health Expenditures on Leading Causes of Morbidity in the Philippines
36
provision of such goods or worse not being provided
at all due to the free-rider problem Another widely
acceptable role of the government is to provide goods
or services that create a positive externality to the
society These goods or services are usually socially
underprovided since the individual in hisher own
private desire to maximize utility doesnrsquot consider the
beneficial effects to the society of such activities
Examples of such services are education and health
care This paper will provide a general overview of the
global demand for health care then focus on the role of
the government in health care provision in the
Philippines
Ⅱ Global Demand for Health Care
The concern for health is a global phenomenon
Despite the costs of health care services the demand
for health care is growing everywhere in the world
The surge of aging and chronic illnesses in the
developed countries and the shooting requirements of
the rising middle class accompanied by the lsquodiseases
of prosperityrsquo in the developing countries are all
driving demand Global pandemics that threaten the
world as well as environmental changes that cause
dramatic health care challenges are also adding up in
the demand for health care services
The rising demand for health care is evidenced by
the increased spending on health services The worldrsquos
total health expenditure as a percentage of Gross
Domestic Product (GDP) grew by 15 from 82 in
2000 to 94 in 2009 (Table 1) The American region
posted the highest growth in health expenditure as a
percentage of GDP at 26 while the South East
Asian region showed the least at 2 The growing
expenditure on health services are born from both the
public and private Public spending on health care is at
least about 50 for most of the countries The
spending has likewise grown by two percentage points
in excess of GDP growth across all Organization for
Economic Co-operation and Development (OECD)
countries for almost 50 years and is expected to be
more than a fifth of GDP by 2050 if the current trend
persists (Drouin et al 2008) As a result government
health agencies together with patients and health care
companies particularly in developing economies are
alarmed with the growth of health care spending
Given its current share of health care expenditures the
government is confronted with other increasing
demands of its people such as education defense and
pensions aside from demand for health care and the
escalating prices of health services
Table 1 Health Expenditure Ratios 2000 and 2009
Region
Total
expenditure on health
as of gross
domestic product
General government
expenditure
on health as of total
expenditure
on health
Private
expenditure on health
as of total
expenditure on health
General government
expenditure
on health as of total
government
expenditure
External
resources for health as
of total
expenditure on health
Social security expenditure on
health as of
general government
expenditure on
health
2000 2009 2000 2009 2000 2009 2000 2009 2000 2009 2000 2009
African Region 55 65 439 493 561 507 82 96 65 102 79 70
Region of the Americas 114 144 451 493 549 507 145 169 01 01 317 720
South-East Asia Region 37 38 319 371 689 629 44 49 09 16 133 144 European Region 80 93 739 749 261 248 140 146 01 01 522 495
Eastern Mediterranean
Region 42 47 472 509 528 491 69 71 10 11 184 194
Western Pacific Region 60 65 639 644 361 356 138 144 02 02 681 686
Global 82 94 563 591 437 408 133 143 03 04 451 595
Source World Health Organization (2012)
J Glob Bus Trade Vol 9 No2 (November 2013) 35-44
37
Moreover health care expenditures are signify-
cantly associated with improved health outcomes with
public health care expenditure having a larger impact
(Navignon et al 2012) Hence health care expendi-
tures are vital to improving the health status of the
society Relatedly Hurley (2000) stated that ldquothe
market failures that pervade the health care sector
create an important role both for non-market
institutions and for normative economic analysis to
help sort the ldquogoodrdquo policies from the ldquobadrdquo Thus
from a public policy perspective it is valuable to know
how a policy variable like public expenditures on
health care affects the principal causes of morbidity
rates
Ⅲ Status of Public Health
Expenditures in the Philippines
Public health expenditures include current and
capital spending from government budgets external
borrowing and grants and social health insurance
funds (HDR 2007) Although Fig 1 shows that the
budget allocated for public health care in the
Philippines is increasing in the past few years Fig 2
shows that compared to other Southeast Asian
countries the Philippines is actually way behind in
terms of public health care spending as percent of GDP
As a matter of fact according to the Human
Development Report (2007) the Philippines is one of
the countries around the world with the lowest
percentage ( of GDP) spent on public health
expenditure at 14 This current condition would
have a significant impact on the health and ultimately
the over-all productivity of the members of society
For instance the results of the study of Granlund (2006)
indicated that public expenditures on health care have
an effect on the number of absence days of individuals
Furthermore the results showed a positive causality
between health care expenditures and the health of the
society (Granlund 2006)
Sources Department of Budget and Management (2001-
2009)
Source Asian Development Bank (2008)
Since the budget for health is much less in the
Philippines as compared to most countries (and can be
safely assumed to be inadequate) the paper would
want to look at the impact on morbidity incidences
from increasing the current public spending on health
Though the study will just be limited to measuring the
impact on morbidity the results can then be used to
derive the value to society of higher public
expenditures in terms of less people afflicted or
infected by various diseases Unlike in the situation
where the public health care expenditure is already
sufficient (or optimal) it will be much easier to
estimate the external cost of inadequate public health
expenditure by measuring the forgone benefits (say it
resulted to an absence) from those people who were
infected In addition the results of the study could be
used to measure the externalities valued in terms of
cost savings if the spread of the disease was prevented
Analysis of Public Health Expenditures on Leading Causes of Morbidity in the Philippines
38
Ⅳ Leading Causes of Morbidity in the
Philippines
Morbidity may be referred as the state of poor
health the degree or severity of a health condition or
an incidence of a disease In the case of the Philippines
the leading cause of morbidity is pneumonia with an
incidence rate of 718 (per 100000 population) Table 2
shows the top ten leading causes of morbidity in 2007
while Fig 3 shows the trend in the number of cases in
the past few years for the major causes of morbidity
Table 2 Ten Leading Causes of Morbidity
Philippines 2007
Disease Number
of cases
Rate per
100000 population
ALRI and Pneumonia 605471 718
Acute Watery Diarrhea 539701 640 BronchitisBronchiolitis 487302 5778
Hypertension 398538 4726
Influenza 349609 4146 TB Respiratory 114714 136
Diseases of the Heart 31331 372
Dengue Fever 23773 282 Malaria 23207 275
Chickenpox 23090 274
Source Department of Health (2002)
Source Department of Health (2002-2007)
From Fig 1 and Fig 3 it seems that the increasing
public health care expenditures didnrsquot lead to a
significant decrease in the leading causes of morbidity
in the past few years However we cannot conclude
this immediately since there are other factors affecting
the number of cases like private health care
expenditures and population growth These other
variables would be considered later in analyzing the
impact of public health care expenditures on the
number of cases
Ⅴ Characteristics of Health Care
According to Hurley (2000) health care is distinct
from other commodities because of health care having
a combination of features that is only present
individually in other commodities Most of these
characteristics result in market failure or missing
markets causing inefficiencies like in the presence of
externalities information asymmetry and uncertainty
In each of these characteristics the government may be
able to minimize the inefficiencies resulting from these
market failures through public expenditures on health
care (which can be looked at as the policy variable of
the government) This somehow justifies the need for
government intervention on health care as a response
to these characteristics of health care
Though it is desirable to be able to disaggregate
public health expenditure as an answer to each of these
characteristics of health care it will not be easy as
policies on public health care usually answer the
inefficiency problem as a whole Thus the study
would focus on the rationale for public health care
expenditure as it provides a positive externality to the
society
51 Health as a Merit Good
A merit good is a good or service that is regarded
as desirable by the society such that the government
intervenes in its provision The idea is that these goods
and services provide positive externality to the society
and if left to individuals would tend to be under-
provided Thus the government can intervene to
correct this under-provision Common examples of
these merit goods are spending on public services such
as public education and public health care
In general the external benefits from health care
can be looked at in various ways According to Hurley
(2000) people may derive external benefit from
knowing that others receive the needed health care
J Glob Bus Trade Vol 9 No2 (November 2013) 35-44
39
services and not just any health care that a person can
afford In addition the externality from health care can
be looked at as the measure of joy (or prevention of
pity) caused by seeing a healthy person rather than a
sick one The problem however with this valuation of
the externality is that such joy or pity cannot be easily
quantified
An alternative way of looking at the positive
externality provided by the adequate (optimal) amount
of spending on public health would be the cost savings
from those who would have been affected if such
public health expenditures were not adequate (optimal)
The obstacle though is finding these cost savings if the
optimal amount of health expenditures is already in
place This is because one cannot predict who among
the millions or billions of people would have been
externally affected if the existing public health
expenditures were not in place In the case of countries
where public health expenditure is still inadequate we
can analyze the cost savings by looking at the effect of
an increase in public health expenditures on the people
who are currently experiencing diseases which may
have been prevented if the optimal level of expenditure
was in place
52 Prevention versus Cure
It is important to consider that the positive exter-
nalities from having optimal health expenditures can
be realized if such expenditures may have prevented
the spread of a communicable disease Thus if most of
the health expenditures were rather used for cures then
these positive externalities as we defined earlier
would not be realized to the fullest It is still important
to take note that cures also result in a positive
externality since it prevents the further spreading of the
disease given the carrier of the disease is cured as soon
as possible The government expenditures on disease
prevention and control and for infectious disease
prevention and control are exhibited in Fig 4 and Fig
5
Sources Department of Budget and Management (2002-
2009)
Sources Department of Budget and Management (2002-
2009)
Note that the sudden increase in the budget
allocated in both Figs during the 2008 and 2009 was
due to the Intensified Disease Prevention and Control
program introduced during 2008 This almost doubled
or tripled the budget allocation to these items as
compared to years before 2008 It is then desirable to
be able to see the impact of this significant increase in
the public health expenditures on the number of cases
however the data on the number of cases for 2008 is
not yet available
53 Communicable versus Non-
communicable Diseases
Externalities provided by the adequate amount of
spending needed for health care is more apparent in the
presence of communicable diseases In addition to the
general external effects discussed earlier communi-
cable diseases have additional external effects via the
probability of a healthy person being infected by the
Analysis of Public Health Expenditures on Leading Causes of Morbidity in the Philippines
40
person carrying a communicable disease Public
health expenditure may then lower this possibility of
infection to healthy people by providing health care for
people who cannot afford the needed medication
The situation under communicable diseases some-
how distorts the utility maximization problem of
individuals since the presence of a sick person implies
a higher chance of being sick also and thus lowers the
utility of the individual This external effect as pointed
out earlier would cause inefficiency if not recognized
Even though the benefits from societal prevention and
cure of communicable diseases are known the
problem changes to what we know as the free-rider
problem if individuals are left alone to solve the
problem
As we all know voluntary contribution would not
solve the problem due to the free-rider problem Free-
riding would be evident since contribution to
prevention doesnrsquot assure the contributor that he will
be the one that will be saved from the disease ie with
the prevention measures we assume that the infected
individuals will be much less but this doesnrsquot
specifically tell who these individuals are Since this is
the case a person may claim that he doesnrsquot need
prevention measures anyway since with or without the
prevention measure his final state will just be the same
(ie two extreme cases very healthy that in the end he
will be healthy or very vulnerable that heshe will
always be affected anyway) It is likewise possible that
people rather than donate may just choose to put this
prevention contribution into private health expendi-
tures by buying vitamins that give additional protection
or immunity This is the reason why public health
expenditure is essential in the case of communicable
diseases
We can then expect a more significant impact of
higher public expenditures on health care on the
number of communicable diseases as compared to
non-communicable diseases because of the additional
benefits from prevented infection Also we can expect
that public expenditures on health will have a lower
impact as compared to private health expenditures on
non-communicable diseases The paper would then
verify these hypotheses
Ⅵ Sources of Data and Analytical
Procedure
61 Sources of Data
The data used in the study were from various
national survey results gathered by various depart-
ments and agencies of the government Data for the
leading causes of morbidity and the number of cases
every year were taken from the Field Health Service
Information System (FHSIS) Annual Report The
FHSIS Annual Report reflects the activities and health
program accomplishments of the Department of
Health in the Philippines for a given year and serves as
a reference for planning and decision-making at the
local and national levels (FHSIS 2004) The FHSIS
also contains statistics on health systems health status
health services coverage and notifiable diseases in the
Philippines For the purposes of this study the data
utilized were the number of cases per region and per
year of the leading causes of morbidity in the
Philippines such as bronchitis tuberculosis influenza
hypertension and diarrhea
Data on Philippine government health care expen-
ditures were taken from the National Expenditure
Program (NEP) The NEP is an annual publication by
the Department of Budget and Management that
contains the details of the governmentrsquos proposed
program and intended to assist Congress in the review
and deliberation of the proposed national budget for
the legislation of the annual appropriations measures
for the succeeding fiscal year (NEP 2003) Annual and
per region data on public health expenditures were
elicited from the national government budget allocated
to the Department of Health Though it is desirable to
be able to split the expenditures into preventive and
curative measures the available data did not have such
information at the regional level
Data on household (private) expenditures for
health care were obtained from the Family Income and
J Glob Bus Trade Vol 9 No2 (November 2013) 35-44
41
Expenditure Survey (FIES) The FIES is a nationwide
survey of households undertaken every three years by
the National Statistics Office that contains data on
family income and expenditure such as levels of
consumption by item of expenditure as well as sources
of income in cash and in kind and provides
information on the levels of living and disparities in
income of Filipino families (FIES 2006) The study
utilized regional data on the average household
expenditure on medical care Data on the population
per region were also taken from the FHSIS Annual
Report while data on the number of households were
taken from the FIES
62 Analytical Procedure
As stated above it is not enough to just look at the
trends of morbidity cases and public expenditure to be
able to assess the impact of the latter to the former
There are other variables such as private health
expenditures and population at that period of time that
may also significantly affect the number of cases The
paper used a pooled ordinary least squares regression
model to analyze the impact of public health care
expenditures on the number of cases for the major
causes of morbidity in the Philippines from 2002-2006
across regions The model is given by
cases = f(pop privexp pubexp) where pop ndash regional population
privexp ndash average household expenditures
on health
pubexp ndash public health expenditures (lsquo000)
It is hypothesized that there is a positive relation-
ship between the number of cases and population On
the other hand a negative relationship between both
private and public expenditures and the number of
cases is expected
Ⅶ Results and Implications
71 Results and Discussion
Results from the empirical models of the different
morbidity causes are reported in Tables 3 and 4 Notice
that only the results for tuberculosis and diarrhea were
reported since neither public nor private expenditures
on health were able to explain the variation in the
number of cases for bronchitis pneumonia influenza
and hypertension
Table 3 Regression Results for Tuberculosis Cases
variable Coefficient standard error p-value
pop 00018028 00001077 0000
privexp -06158907 02659049 0023 pubexp -00059089 00024357 0018
constant 2103315 8129887 0012
Note highly significant at 1 significant at 5
711 Tuberculosis
The regression result showed that the model is
significant and was able to explain 87 of the
variation in tuberculosis cases based on the computed
adjusted R-squared Public and private expenditures on
health care were found to be significant (at 5) in
explaining the variation in the number of tuberculosis
cases while population was found to be highly
significant (at 1) The results conform to the
hypotheses that an increase in both public and private
spending on health care would result to a decline in the
number of tuberculosis cases Also an increase in the
population results in an increase in the number of cases
which was also expected
Estimates showed that on the average an increase
in the population by 555 increases the number of
tuberculosis cases by one Results also showed that an
increase in public health expenditures decreases the
number of tuberculosis cases Specifically the
estimated coefficient implies that on the average an
increase in public health expenditures by PhP169236
would lead to a one unit decrease in the number of
tuberculosis cases With the PhP16 billion total budget
for health in 2006 (PhP154 million of which was
allocated for tuberculosis prevention and control) an
additional 1 increase in government health expendi-
tures would approximately reduce the number of
tuberculosis cases also by 1 for the same year at the
Analysis of Public Health Expenditures on Leading Causes of Morbidity in the Philippines
42
country level In addition estimates showed that an
increase in the average household private expenditure
on health by PhP162 would result in a unit decline of
tuberculosis cases The value seems low at first glance
but this translates to a total of PhP166 million
spending on health for the household sector from the
174 million Filipino families across 17 regions in
2006 necessary to reduce tuberculosis cases by one
Interestingly public health expenditure seems to be
less costly in terms of preventing tuberculosis cases in
the country This is due to the fact that majority of
tuberculosis cases are experienced by poorer
households that rely more on public health care rather
than private health care which they cannot afford
Public health expenditures are also ideal for
tuberculosis cases because of the ancillary benefits
these provide by preventing the spread of this
communicable disease among the population
Table 4 Regression Results for Diarrhea Cases
variable coefficient standard error p-value
pop 00073148 00007181 0000
privexp -5919509 1773756 0001
pubexp 00385644 00162475 0020 constant 9123934 5423155 0097
Note highly significant at 1 significant at 5
712 Diarrhea
The regression result showed that the model is
significant and was able to explain 70 of the varia-
tion in diarrhea cases based on the computed adjusted
R-squared Public expenditures on health care were
found to be significant (at 5) in explaining the
variation in the number of diarrhea cases while
population and private expenditures on health care
were found to be highly significant (at 1) The results
conform to the hypothesis that an increase private
spending on health care would result in a decline in the
number of diarrhea cases while an increase in the
population results to an increase in the number of cases
However public health care expenditure and the
number of diarrhea cases were found to be positively
related One possible explanation for this result is that
public expenditure on health may be more oriented to
communicable diseases than non-communicable
diseases ie compared with the results of tuberculosis
In addition there are other significant factors that may
be affecting the prevalence of diarrhea which are not
incorporated in the public health care expenditures say
the availability of or access to safe drinking water
among others
Nevertheless results showed that an increase in the
average household private expenditure on health by
PhP017 or equivalently a total of PhP0174 million
spending on health for the household sector would
result in a unit decrease in the number of diarrhea cases
Estimates also showed that on the average an increase
in the population by 137 increases the number of
diarrhea cases by one in the country Results also
showed that an increase in public health expenditures
decreases the number of tuberculosis cases
72 Conclusions Implications and Further
Studies
The result of the study showed that public
expenditures on health care have a significant effect on
the number of tuberculosis cases in the Philippines
Although results for the other cases show that public
expenditure failed to explain the variation in the
number of cases it may be attributed to the unavaila-
bility of disaggregated data allocated for specific
diseases in each region This then can be considered as
the limitation of the study Nonetheless the results of
the study can be used to provide a rationale for the
abrupt increase in the spending for disease prevention
and control for 2008 and 2009
As pointed out earlier the result of the study can be
further extended by valuing the benefits that can be
derived from a prevented sickness resulting from an
increase in public health expenditures The benefits
may include the loss income from being absent
because of the disease and the prevented private
expenditures to prevent the disease Of course the
general external effects of being healthy or seeing a
healthy person may also be included as part of these
benefits These non-marketed goods which are
J Glob Bus Trade Vol 9 No2 (November 2013) 35-44
43
common to the health sector can be measured using
contingent valuation methods such as willingness-to-
pay (Hurley 2000) Knowing these benefits one can
then do a cost-benefit analysis of an increase in public
expenditure on health care Thus if the net benefits
that can be derived from a prevention of a tuberculosis
case is higher than PhP169236 which is the cost of
preventing it then it is rational for the government to
pursue an increase in public health care expenditure
References
Asian Development Bank (2008) Key indicators for
Asia and the Pacific 2008 Manila Author
Retrieved from httpwwwadborgsitesdefault
filespublication27728key-indicators-2008pdf
Connelly L B (2004) Economics and health
promotion The European Journal of Health
Economics (Formerly HEPAC) 5(3) 236-242
Chicago
Department of Budget and Management (nd)
Budget of expenditures and sources of financing
2000-2008 [Webpage] Retrieved from www
dbmgovph
Department of Budget and Management (2001)
Republic of the Philippines national expenditure
program 2001 Manila Author Retrieved from
httpwwwdbmgovph
Department of Budget and Management (2002)
Republic of the Philippines national expenditure
program 2002 Manila Author Retrieved from
httpwwwdbmgovph
Department of Budget and Management (2003)
Republic of the Philippines national expenditure
program 2003 Manila Author Retrieved from
httpwwwdbmgovph
Department of Budget and Management (2004)
Republic of the Philippines national expenditure
program 2004 Manila Author Retrieved from
httpwwwdbmgovph
Department of Budget and Management (2005)
Republic of the Philippines national expenditure
program 2005 Manila Author Retrieved from
httpwwwdbmgovph
Department of Budget and Management (2006)
Republic of the Philippines national expenditure
program 2006 Manila Author Retrieved from
httpwwwdbmgovph
Department of Budget and Management (2007)
Republic of the Philippines national expenditure
program 2007 Manila Author Retrieved from
httpwwwdbmgovph
Department of Budget and Management (2008)
Republic of the Philippines national expenditure
program 2008 Manila Author Retrieved from
httpwwwdbmgovph
Department of Budget and Management (2009)
Republic of the Philippines national expenditure
program 2009 Manila Author Retrieved from
httpwwwdbmgovph
Department of Health (2002) Field health service
information system annual report 2002 Manila
Author Retrieved from httpwwwdohgovph
sitesdefaultfilespublicationsFIELD20HEALT
H20SERVICE20INFORMATION20SYST
EM20ANNUAL20REPORT202002pdf
Department of Health (2003) Field health service
information system annual report 2003 Manila
Author Retrieved from httpwwwdohgovph
sitesdefaultfilespublicationsFIELD20HEALT
H20SERVICE20INFORMATION20SYST
EM20ANNUAL20REPORT202003_0pdf
Department of Health (2004) Field health service
information system annual report 2004 Manila
Author Retrieved from httpwwwdohgovph
sitesdefaultfilespublicationsFIELD20HEALT
H20SERVICE20INFORMATION20SYST
EM20ANNUAL20REPORT202004pdf
Department of Health (2005) Field health service
information system annual report 2005 Manila
Author Retrieved from httpwwwdohgovph
sitesdefaultfilespublicationsFIELD20HEALT
H20SERVICE20INFORMATION20SYST
EM20ANNUAL20REPORT202005_0pdf
Analysis of Public Health Expenditures on Leading Causes of Morbidity in the Philippines
44
Department of Health (2006) Field health service
information system annual report 2006 Manila
Author Retrieved from httpwwwdohgovph
sitesdefaultfilespublicationsFIELD20HEALT
H20SERVICE20INFORMATION20SYST
EM20ANNUAL20REPORT202006pdf
Department of Health (2007) Field health service
information system annual report 2007 Manila
Author Retrieved from httpwwwdohgovph
sitesdefaultfilespublicationsFIELD20HEALT
H20SERVICE20INFORMATION20SYST
EM20ANNUAL20REPORT202007_1pdf
Drouin J P Hediger V Henke N Kanzler L
Leydon E F amp De Santis P (2008) The Health
Care Century Health International 7 6-17
Granlund D (2006) The effect of health care expen-
ditures on sickness absence Paper Presented at the
Inaugural Biennial Conference of American Society
of Health Economists 2006 Madison WI
University of Wisconsin
Hurley J (2000) An overview of the normative
economics of the health sector Handbook of
Health Economics 1 55-118
Novignon J Olakojo S A amp Nonvignon J (2012)
The effects of public and private health care
expenditure on health status in sub-Saharan Africa
New evidence from panel data analysis Health
Economics Review 2(1) 1-8
Philippine Statistics Authority (nd) Family income
and expenditures survey 2000 2003 2006
[Webpage] Retrieved from wwwcensusgovph
United Nations (2007) Human development report
Retrieved from wwwhdrundporg
World Health Organization (2007) National health
accounts 2007 Geneva Author Retrieved from
httpwwwwhointen
World Health Organization (2012) World health
statistics 2012 Geneva Author Retrieved from
httpwwwwhointen
J Glob Bus Trade Vol 9 No 2 (November 2013) 45-60
45
ISSN 1946-5130
Journal of Global Business and Trade
wwwiagbtcom
Analysis of the Interests of Conceiving a Free Trade
Agreement between China and South Korea
Liu Zuankuoa and Zhan Baiming
b
a Shandong Normal University China b South-Central University for Nationalities China
Received 25 August 2013 Revised 22 September 2013 Accepted 28 October 2013
ABSTRACT
Based on the ldquoStarting Joint Minister Statement on free trade agreement between China and South Koreardquo
the article explains the basic ideas of this agreement It shows that there are some distinctive differences
between the statement and the theoretical study on interests China pays more attention to the diplomatic
significance rather than in trade While South Korea aims to guarantee its investment benefits by this
agreement both stations try to protect their producersrsquo benefits Finally this paper using the model GTAP
(Global Trade Analysis Project) puts forward two sets of simulation schemes and forecasts the economic
effects of the Free Trade Zones from the macroeconomics and welfare effects trade effects and industry
effects
Keywords analysis of benefits China-South Korea free trade agreement construction
Ⅰ Introduction10
Minister of Commerce Chen Deming and South
Korean Trade Minister Park Tae-ho attended the
China-ROK Trade Ministers Meeting in Beijing on
May 2nd 2012 and announced the official initiation of
China-ROK Free Trade Agreement negotiations on the
Ministersrsquo Joint Statement (referred to as ldquoStatementrdquo
as following) From the Free Trade Agreement (FTA)
we can see the basic ideas of the interest demands of
the Statement
The statement explains the basic ideas of the FTA
which includes trade in goods services investment
and other fields The interest demands reflected in the
2013 International Academy of Global Business and Trade
All rights reserved
Statement includes two aspects trade and investment
From the perspective of trade benefits the two
countries agreed that levels of trade liberalization in
good and service trades should go beyond those
promised levels in the WTO However there are some
sensitive product issues in the goods trade which
include lists of generally sensitive and highly sensitive
products From the perspective of investment benefits
the level and scope of liberalization were defined
according to both countriesrsquo investment arrangement at
present and in future Meanwhile the overseas
processing zones should be involved in China-ROK
FTA
Analysis of the Interests of Conceiving a Free Trade Agreement between China and South Korea
46
Table 1 MFN Tariff Levels of China and South Korea in Product Category ()
Category of products
China Korea
Average tax rate
Free tax rate Maximum Tax rate
Average tax rate
Free tax rate Maximum Tax rate
Livestock products 148 101 25 221 24 89 Milk products 120 0 20 675 0 176
Fruit Vegetable 148 59 30 574 02 887 Coffee Green tea 147 0 32 539 0 514 Grain 243 34 65 1345 03 800 Oilseed animal fat oil 110 53 30 370 41 630
Sugar Sweet 274 0 50 168 125 243
Drinks Cigarette 223 22 65 317 0 270 Cotton 152 0 40 00 1000 0 Other agricultural products 114 94 38 161 183 754 Fish and its products 109 63 23 161 07 50 Minerals Metals 74 87 50 46 269 8 Petro 48 200 9 41 107 8 Chemistry 66 16 47 57 67 321 Wood Paper 44 353 20 22 675 10 Textile 96 0 38 91 15 13 Cloth 160 0 25 126 0 13
Leather Shoes 132 06 25 79 26 16 Non-electrical machinery 80 90 35 60 226 13 Electronic machinery 83 240 35 62 214 13 Transportation equipment 115 08 45 55 268 10 Other products 119 96 35 67 160 13
Source World Trade Organization (nd)
The level of goods liberalization of the two
countries can be judged from WTO World Customs
Data 2011 In 2010 the simple average MFN tariffs
on agricultural and non-agricultural product imports
were 156 and 87 respectively while the simple
average MFN rates applied to Korea on agricultural
and non-agricultural products exports were 164 and
88 The simple average MFN tariffs on Korean
agricultural products and non-agricultural products
import were 485 and 66 while the MFN rates applied
to China on its agricultural products and non-
agricultural products export were 521 and 66 The
MFN import tariff rate of China and Korea divided by
product category is given via Table 1
Via Table 1 we can see that South Korea paid
more attention to protecting agricultural products (tax
rate 485) than industrial products (tax rate 66)
Therersquos a more than 40 percent difference in the simple
average MFN tariff On Chinarsquos part therersquos no big
difference between agricultural product protection
(156) and industrial product protection (87) the
gap of the simple average MFN tariff between these is
less than 10 percent Meanwhile South Korearsquos
protection on agricultural products (485) is much
higher than Chinarsquos (164) As for industrial product
protection there is a gap between China (156) and
South Korea (66) but the gap in industrial (9 or
so) is not as big as that shown in agricultural products
with a tax rate gap 42
From above it shows that the profit that China
benefits from the FTA mainly depends on the degree of
liberalization of agricultural products of South Korea
If this is the important part of South Korearsquos sensitive
products then the attitude expressed in the joint
statement ldquobeyond goods liberalization level of WTO
commitmentsrdquo has not displayed real significant trade
interests
In other words the previous various theoretical
insights on the China-Korea FTA are not the same as
the benefit idea implied in the statement
J Glob Bus Trade Vol 9 No 2 (November 2013) 45-60
47
Ⅱ Literature Review
With regard to the interests in the FTA negotiations
between China and South Korea Chinese scholars are
generally optimistic about the economic and trade
effects of the bilateral free trade agreement Xue Jing-
xiao and Zhang Bo-wei (2004) believed that Chinarsquos
GDP would grow if China and South Korea were to
establish a free trade area Huang Peng and Wang Jian-
xin (2010) analyze the potential effect of applying
GTAP in constructing a free trade zone between China
and South Korea which indicates that after the
fulfillment of the China-ROK FTA the two countriesrsquo
GDP and components such as consumption
investment government expenditure and so on
compared to the base period all experienced positive
growth South Korea obtains a greater benefit with a
growth rate of 207 while Chinarsquos only 018 Song
Jingen (2011) on the basis of a traditional trade gravity
model studied the effects on trade after the two
countries signed the free trade agreement The results
show that China and South Korearsquos agreement played
a strong role in promoting the trade of both countries
and the total volume of trade would increase nearly
60 He suggests that both countries should pay
attention to the opportunities brought by the agreement
when they are protecting their sensitive sectors Li
Xiao-feng and Gui Jia-yue (2009) based on partial
equilibrium estimates the effects of the establishment
of the China-ROK Free Trade Zone on bilateral trade
flows from the industrial level The simulated results
show that if China and Korea do not established a free
trade zone to a larger extent trade between China and
South Korea would be heavily influenced by the trade
diversion from the Korea-US Free Trade Zone If the
two countries establish a free trade zone it will be
more conducive to the development of comparative
advantages of both countries
Analysis of academic research on China-ROK free
trade agreements has a more rigorous theoretical
condition namely the import tariffs of all goods should
be canceled in the China-ROK FTZ Before the
implementation of the FTZ the higher the tariff is the
greater the increase of imports caused by the tariff
reductions will be From the perspective of exports
before the completion of a bilateral free trade zone the
higher the tariff of partner country is the greater the
exporterrsquos export growth will be after establishment
The joint statement announced by the ministers of
China and the ROK showed that on the one hand the
level of liberalization of trade in goods should
transcend their level of commitment in the WTO On
the other hand the problems of sensitive products
should be a concern A longer transitional period
partial concessions and exceptions should be used to
handle sensitive product issues It is not known which
products are arranged for a longer transition period
partial concessions or exceptions but it will greatly
reduce the expected trade benefits by theoretical study
because the theoretical results used free trade and tariff
barrier elimination as a precondition Meanwhile
when both countries regard their disadvantaged
industries as sensitive products to go beyond the
commitment level in the WTO as agreed in the joint
statement will be quite limited in the scope Thus the
domains of free trade will be relatively small
Professor Yorizumi Watanabe (2009) of Keio
University in Japan analyzed the historical significance
of the FTA among China Japan and South Korea and
pointed out that China makes free trade agreement
policies for three reasons on foreign affairs and
commercial intercourse First in maintaining the
double-digit rapid development in economy China has
become the ldquoworld factoryrdquo and it is imperative to
ensure the market of related industries Second China
has become a world power so it needs to show
Southeast Asian countries an image of a ldquogood
partnerrdquo so as to avoid being seen as a threat Third by
means of drawing those overseas Chinese who have
engaged in long-term economic activities in the
neighboring countries China formed the ldquoGreater
China Rimrdquo and turned it into Chinarsquos powerful
ldquoperipheryrdquo
The interpretation of the motives of Chinarsquos
making of free trade agreement policies by Professor
Watanabe made people feel that Chinarsquos interest
Analysis of the Interests of Conceiving a Free Trade Agreement between China and South Korea
48
demand consists of two aspects commercial inter-
course and diplomacy However regardless of the
relationship of bilabial trade between China and Japan
or between China and South Korea Chinarsquos
advantages in industry are mainly on textiles clothing
leather shoes and other products but the tariff rates of
Chinarsquos MFN of such goods are higher than those of
South Korea and Japan Meanwhile the Chinese
mainlandrsquos ldquoworld factoryrdquo status is a product of the
processing trade China has been acting the role of
assembling and integration in the East Asian labor
division system and the commodities in bilateral trade
between Sino-Korea and Sino-Japan are mainly
constituted by the intermediate input products This
means that Chinarsquos participation in the construction of
the FTZ with Japan and South Korea is not to ensure
the market of related industry and thus its trade
interests are far less than the diplomatic interests which
Professor Watanabe referred to Economists of South
Korea predict that the FTZ has a very large impact on
the Korean economy while there is a relatively small
impact on China For China the strategic goal of the
China and South Korea FTZ is greater than economic
significance while for South Korea the motivation of
getting economic interests is stronger China promoted
the China-ROK FTZ in order to ensure a dominant
position within the East Asian region which cannot
only impact America who took advantage of allies in
Asia to constrain China but also rely on the regional
group to enhance Chinarsquos status in the international
political situation and the multilateral system (Zheng
Zhi-shu 2009)
The interest that South Korea obtained from the
China-ROK FTA depends on the degree of liberali-
zation of Chinese industrial products If Chinese
industrial products constitute a major part of the
sensitive products in China the trade interest of South
Korea would not be significant So the motives of
South Korea negotiating bilateral free trade agreements
with China does not come from trade but from the
following that will be discussed in the third part of the
international investment interests
Ⅲ The Benefit Analysis
31 The balance of Investment Interests and
Trade Interests
Before China and the ROK passed the ldquothe
Associate Ministerial Statement of Starting China-
Korea Free Trade Agreement Negotiationsrdquo China
Japan and the ROK held investment agreement
negotiations in Beijing reached an agreement on all
the remaining issues in the investment agreement and
drafted the agreement on March 21st 2012 Three
parties said they would soon complete their internal
procedures so as to sign the agreement as soon as
possible
From the view of the sequence of time the
successful termination of negotiations on investment
agreements among China Japan and ROK preceded
the starting of negotiations on a bilateral FTA between
China and ROK This indicates that relative to the free
trade agreement the three countries are more
concerned about investment agreements or that South
Korea is keener on the investment issues among the
three countries or between the two countries South
Korean President Lee Myung-bak said that in the
investment agreements among the three countries the
dispute settlement mechanism was included between
the investors and the host country which can provide
legal protection for investors if they suffer a loss on
investment in the host country
Meanwhile the joint statements of two countries
also made clear the important position of investment in
the FTA In the area of investment for proper handling
of issues related to bilateral investment between the
two countries they will confirm the level and scope of
liberalization and take the current and future bilateral
investment-related arrangements into account
When the international economic integration has
developed both in scope and in depth from trade to
international production many bilateral and regional
free trade agreements reflected the feature of the trade
and investment integration such as the North
American Free Trade Agreement In most cases the
J Glob Bus Trade Vol 9 No 2 (November 2013) 45-60
49
countries that are dominant in international investment
will make use of the form of the FTZ to protect its
interests of overseas investments from losses
In terms of the structure of bilateral trade in goods
between China and ROK Korearsquos exports to China
mainly consist of productive goods Table 2 shows
classified by BEC the imports and exports of Chinarsquos
trade in goods to the ROK
Table 2 shows that during the 13 years from 1998
to 2010 among the types of Chinese and South
Korean BEC commodities the following conclusions
can be made according to the changing of exports and
imports of capital goods intermediate goods and
consumer goods
First the imports and exports of intermediate
goods in the cargo trade between China and the ROK
come in on top According to the SNArsquos three basic
categories of goods the annual average import and
export composition ratio of intermediate goods capital
goods and consumer goods trade between China and
Korea were respectively 722 164 and 112
Relative to capital goods and consumer goods the
exceeding ratio balances of intermediate goods trade
value are respectively 56 and 60 percentage points
Table 2 China amp South Korea Goods Trade Structure 1995-2010 (Classified by BEC)
(Unit Hundred Million Dollars)
Intermediate
Goods
Exports
Intermediate
Goods
Imports
Consumer
Goods
Exports
Consumer
Goods
Imports
Capital
Goods
Exports
Capital
Goods
Imports
1995 50 85 14 4 3 13
1998 43 134 12 5 8 11
1999 51 154 17 5 10 13
2000 73 204 25 6 15 22
2001 72 200 33 6 19 28
2002 90 217 43 7 22 61
2003 118 311 51 7 31 108
2004 167 455 61 11 49 153
2005 226 590 66 13 58 161
2006 296 702 83 15 65 173
2007 388 797 94 18 81 213
2008 508 869 96 19 132 223
2009 321 784 76 15 135 212
2010 421 1051 97 24 166 289
Source United Nations Statistics Division (nd)
From the composition of exports and imports
among all of Chinarsquos exports to South Korea the
annual average rates of intermediate goods capital
goods and consumer goods were respectively 642
202 and 155 The rates of these three types of
goods in Chinarsquos annual imports from South Korea
were respectively 803 174 and 22 For
intermediate goods the proportion of Chinarsquos exports
to South Korea is less than that of imports from South
Korea and the balance is up more than ten percentage
points
Second the proportion of the goods used for
production in the cargo trade is much higher than that
of the consumption part In Economics capital is
defined as the products that are produced by the
economic system itself and used as input factors so as
to further produce more products and labor service
According to the basic principles of economics
capital goods and intermediate goods with the
characteristics of production can be considered inputs
for the production of capital goods Statistics show that
the sum of annual import and export proportion is
nearly 886 leaving less than 12 to consumer
goods The very low proportion of consumer goods
trade between China and South Korea shows us the
Analysis of the Interests of Conceiving a Free Trade Agreement between China and South Korea
50
basic characteristics of the internationalization of
production behind the commodity trade structure
Regarding Chinese goods exported to South
Korea the annual average proportion of goods which
had entered the production process was 798 and
continued to rise from 784 in 1995 to 811 in
2005 and to 857 in 2010
Meanwhile the goods that China imported from
South Korea have a higher proportion for production
use and the annual average is almost up to 979 In
1995 the share was 956 and since 2003 its share
has always remained above 98
The proportion (approximately 98) of Chinarsquos
imports of productive goods from Korea is 18 higher
than that (about 80) of Chinarsquos exports indicating
that the degree of Chinarsquos dependence on South Korea
is higher than South Korea on China
Central Bank of Korea (June 14 2011 ) released
the ldquo2010 South Korean Current Account Balancerdquo
which said that the export growth of semiconductors
machinery precision machinery and other goods are
increasing significantly and the trade surplus to China
of such goods is increasing from $3697 billion to
$5104 billion
The formation of this kind of trade structure to a
large extent can be explained reasonably by South
Korearsquos direct investment in China From the
perspective of the trade of intermediate goods Li
Xian-zhu (2010) Ye Jing-yi and Wang Pei (2005)
explained the trade imbalance between China and
South Korea When analyzing the Korean chronic
surplus phenomenon in long term they pointed out
that one of the reasons is that there are many Korean
investment enterprises in China and most are
processing companies required to purchase a large
number of Korean raw materials and accessories for
processing The import of the raw materials and
accessories required by Chinarsquos processing trade is
mentioned above that is Chinese importation of
intermediate goods by BEC classification Some
scholars explained the trade imbalance from the point
of capital goods trade that South Korea has a
competitive advantage in the production of capital
goods that when coupled with the adjacent location is
conducive to reduce transportation costs and thus
South Korea has become one of the main countries for
China to get capital goods from for processing trade
which expanded the size of imports from Korea (Zhao
Fang amp Li Ji 2010)
Statistics show that from 1998 to 2010 among the
foreign direct investments divided by countries and
geographical areas Japan and South Korea have
always been Chinarsquos major source countries for foreign
investment Except those years of the financial crisis
(1998 2008-2009) the proportion of Japan and South
Korearsquos direct investment in China accounted for 13 -
20 For example in 2005 South Korearsquos direct invest-
ment was up to 5168340000 US dollars accounting
for 86 of Chinarsquos total $60324590000rsquos absorption
of foreign investment Japanrsquos direct investments were
6529770000 US dollars accounting for 1082
South Korearsquos direct investment is mainly in the
manufacturing industry By 2005 South Korean
investment in China is mainly focused on the
manufacturing and assembly of electronic appliances
textiles and clothing leasing and business services
food and beverage and retail industries among which
manufacturing accounted for dominance (Yang Li amp
Zhou Wenfeng 2008 ) However in the manufacturing
sector the investment structure of South Korea has a
tendency of changing from the consumer goods
industry including fiber clothing food manufacturing
leather footwear and others to capital goods industries
including electronic communications petrochemical
alloy machinery and equipment and others (Zang Xin
Dong Rongrong amp Cui Yan 2006)
In order to protect the interests of foreign invest-
ment one of the conditions that Japan and South
Korea agreed to in the China-Japan-Korea FTZ nego-
tiation was the signing of ldquoCJK investment agree-
mentsrdquo The tripartite negotiations started in 2007 with
content that included all the important aspects
contained in the international investment agreements
including such clauses as the definition of investment
scope of application MFNT national treatment
J Glob Bus Trade Vol 9 No 2 (November 2013) 45-60
51
expropriation transfer subrogation taxes general
exceptions and dispute resolution
32 The Balance of the Interests of Producers
and Consumers
According to the Yonhap News Agency on
January 12th 2012 the foreign minister of South
Korean Park Taeho said at a press conference held in
the central government office that China as a big
country made a lot of people worried that Korearsquos
agriculture might be pounded South Korea was not
going to allow massive Chinese agricultural products
into South Korea Before starting the China-ROK FTA
negotiations the Korean Government would fully
listen to the views of different fields
Table 3 The Share of South Korearsquos Agriculture in the National Economy 1998-2010
()
Agricultural Labor
Manufacturing Labor
Labor Services Agricultural
Output Manufacturing
Output Services Output
1998 019 2405 4081 336 4511 4044
1999 019 2406 4081 328 4645 4015 2000 017 2453 4087 297 4736 4015
2001 017 2421 4079 287 4557 4182
2002 016 2323 4103 262 4490 4282 2003 016 2316 3989 243 4480 4241
2004 014 2306 3884 239 4727 4034
2005 015 2278 3795 219 4794 4013 2006 014 2165 3468 209 4801 4032
2007 014 2092 345 195 4818 4033
2008 012 2012 3444 184 5064 3833 2009 013 1944 3484 194 4960 3912
2010 013 1909 3484 178 5211 3739
Source Database provided by Korearsquos Banks
Compared with the manufacturing and service
industries the proportion of South Korearsquos agriculture
is not so significant in the national economy The
proportion of employees in the total economic activity
decreased from 019 in 1998 down to 013 in 2010
and the proportion of the total value of agricultural
production in GDP decreased from 336 in 1998
down to 178 in 2010 If the China-ROK FTA finally
regarded the South Korearsquos agriculture as sensitive
products and put it outside the free trade it is no doubt
that this is only to protect the benefits of very few
agricultural producers by sacrificing the interests of
many other consumers
Let us observe the issues of Chinese sensitive
products Chinese Commerce Minister Chen Deming
said that the sensitive products taken into account in
the process of negotiation were related to agriculture in
Korea and Chinarsquos petrochemical electronics
machinery and other fields
Not completely identical to the situation of South
Korearsquos agriculture in the national economy from 1998
to 2010 the ratio of employees in Chinese petroche-
mical electronics and mechanical industries among the
countryrsquos total employment is not high but there is a
rising trend In 1998 Chinese petrochemical and
machinery industry employment accounted for 088
and 157 respectively of the countryrsquos total
employment In 2010 this proportion respectively rose
to 154 and 388
Similarly the ratio of the petrochemical and
mechanical fields in GDP also showed an increasing
trend and its share enlarged In 1998 the ratios were
135 and 213 In 2010 the ratios respectively
increased to 614 and 1173
Table 4 shows that Chinarsquos petrochemical and
machinery industries are growing and developing
rapidly From the production valuersquos movements of
ratio in GDP we can see that from 1998 to 2010 these
Analysis of the Interests of Conceiving a Free Trade Agreement between China and South Korea
52
two sectors in initial stages accounted for 348 of
GDP and by 2005 641
Chinese petrochemical products cover a wide
range of sectors In Chinarsquos Statistical Yearbook they
included the petroleum processing and coking industry
chemical materials and products manufacturing
chemical fiber manufacturing rubber and plastic
products industry Electronic and mechanical fields are
statistically included in machinery and equipment
involving manufacturing industries in common
equipment special equipment transportation
equipment electrical machinery and equipment
electronic and communications equipment instrument
and apparatus and office machinery
Table 4 The Share of Chinese Petrochemical and Machinery Industriesrsquo in the National Economy 1998-2010
()
Petrochemical Industry
Labor Proportion Machinery Industry Labor Proportion
Petrochemical IndustrialGDP
Machinery IndustrialGDP
1998 088 157 135 213
1999 081 145 139 222 2000 074 133 160 240
2001 068 124 155 253
2002 065 121 158 282 2003 098 191 178 340
2004 101 209 224 423
2005 113 244 230 411 2006 119 266 483 883
2007 127 296 554 1028
2008 141 344 608 1119 2009 143 344 547 1059
2010 154 388 614 1173
Source ChinaStatistics (2011)
Chinarsquos petrochemical and machinery accounted
for a high ratio in GDP The number of the labor force
in these two industries was not big and their sum share
is no more than 6 (542 in 2005) in the whole
national economy Thinking about it another way from
the perspective of proportion of factors Zhan Boming
and others (2010) observed and analyzed Chinarsquos
industrial enterprisesrsquo inclination in investment They
found that investment made by state-owned
petrochemical and machinery enterprises have capital
intensive investment tendencies and the investment of
the three-kind investment enterprises in these two
industries are petrochemical capital intensive while
labor-intensive industries including machinery and
transportation equipment manufacturing electronic
and communication equipment manufacturing The
fact means that the idea of separating the Chinese
petrochemical and machinery from the China - Korea
Free Trade Agreement negotiations are to protect those
investorsrsquo interests at the expense of the interests of
numerous consumers
If the Chinese petrochemical products and
machinery products are to be put outside the China-
Korea Free Trade Agreement as sensitive products and
South Korearsquos agricultural sector is also separated
from China-Korea free trade agreement then we can
say such a bilateral free trade agreement almost has no
sense of free trade
Ⅳ Simulation Analysis of the
Economic Effects of China-Korea
FTA
A GTAP model is used in this part to predict the
economic effects if the China-Korea free trade zone is
established
41 Basic Structure of the Model
The GTAP model was developed by Professor
Tomas W Hertel of Purdue University as a multi-
J Glob Bus Trade Vol 9 No 2 (November 2013) 45-60
53
national and multi-sector general equilibrium model
and it has been widely used in trade policy analysis In
the GTAP model framework first sub-models that can
detail description of each countryrsquos (or regionrsquos)
production consumption government spending and so
on are created and then the various sub-models are
combined into a multi-national and multi-sector
general equilibrium model through international
merchandise trade relations When using this model
framework for policy simulation it can also be used to
explore the changes that the policy brings in each
nation and sectorrsquos production import and export
commodity prices supply and demand factors
elements of remuneration GDP and the level of social
welfare
42 Basic Assumptions
421 Conditions of Factors
There are five different types of elements in the
model land capital skilled labor unskilled labor and
natural resources A GTAP model assumes that the
market is perfectly competitive the scale of production
unchanged and each product produced by using
nested constant coefficient to replace elasticity equa-
tion The intermediate inputs consist of domestic and
foreign products through constant coefficient instead of
elasticity equation The products (domestic and import
goods) of different regions are non-homogeneous and
therefore cannot be replaced with each other In the
factor market land among departments is not
completely mobile so the price of land for different
uses is different while the labor in the country is
allowed to flow freely Each country has only one
account to which all the income tax and endowments
are accumulated Then through the Cobb-Douglas
Utility Function income is divided into private
consumption savings and government consumption
by a fixed proportion In a GTAP model there are two
imaginary international departments which are
International Bank and International Traffic Each
countryrsquos savings are accumulated to an International
Bank being allocated among countries according to
the rate of capital return The International Traffic
Department can balance the differences between CIF
and FOB and link the world through bilateral trade
422 Conditions of Behavioral Agents
There are three kinds of typical behavior agents in
the model private departments government
departments and firms
4221 Behavior of Private Department
In private expenditure the private sector consump-
tion expenditure has the nature of non-homothetic
order and should include the impact of population
growth the private department sets levels by using a
CDE Utility Function on a per capita basis Private
department behavior equation
① Private Household Utility
② CompoSITC Demand
③ CompoSITC Tradeable
In these equations yp (r) stands for the regional
units of the private sector household expenditure of r
region ppriv (r) stands for the price index of private
sector household unit consumption expenditure of r
region UELAS stands for the relative utility costs and
elasticity pop (r) stands for the population of r region
qp (i r) stands for the demands of i product in r
regional private department unit EP (i k r) stands for
the cross-price flexibility between irsquos demands and krsquos
price in r regional household unit EY (i r) stands for
the demand of composite commodity i in r regional
household unit pp (i s) stands for the demand price of
integrated trade commodity i in a private household
unit of s region PMSHR (i s) stands for the share that
Analysis of the Interests of Conceiving a Free Trade Agreement between China and South Korea
54
the total imports in the private sector demand for
domestic products of s region ESUBD (i) stands for
the elasticity of substitution between domestic and
imported good i ppd (i s) stands for the demand price
of commodity i in s regional private department unit
qpd (i s) stands for the demand of the national product
i in s regional private department unit ppm (i s) stands
for the demand price for import integrated trade
commodity i in s regional private department unit
qpm (i s) stands for the import demand of product i in
s regional private department unit
4222 Behavior of Government Department
The total government expenditure allocates
between the various commodities via using a Cobb-
Douglas Utility Function This makes the government
expenditure on various commodities of their total
remains constant In an open system the governmentrsquos
demands can be divided into domestic products and
imported products and both of the products form an
integrated product through the CES Function
Government department action equation
① Government Utility
② Demand for CompoSITC Goods
③ CompoSITC Tradeable
In these equations yg (r) stands for the regional
government expenditure of r region pop (r) stands for
population of r region pgov (r) stands for the
consumption expenditures price index of government
departments in r region ug (r) stands for the average
capital expenditure utility level per people from the
government spending in r region VGA (i r) stands for
the expenditure buying i goods in r regional
government departments GOVEXP (r) stands for the
consumer spending in r regional government
departments pg (i r) stands for the demand price of
comprehensive trade i product in r regional
government departments qg (i r) stands for the
demand of i goods in r regional government
departments GMSHR (i s) stands for the government
departmentrsquos share of demand for national products in
total imports in s region pgd (i s) stands for the
demand price of domestic integrated i good in s
regional government departments qgd (i s) stands for
the demand of domestic i product in s regional
government departments pgm (i s) stands for the
demand price of imported comprehensive trade i good
in s regional government departments qgm (i s)
stands for the imported demands of i product in s
regional government departments ESUBD (i) stands
for the elasticity of substitution between domestic
goods and imported goods
4223 Behavior of the Firm
GTAP model assumes that manufacturers use Tree
Structure in the production function Firmsrsquo main
inputs can be divided into the original inputs and
intermediate inputs Suppose the production function
has the characteristics of divisibility and fixed scale
compensation Under the divisibility assumption
firmsrsquo decisions on the most appropriate volume of
original input is not influenced by the changing of
intermediate input price and quite reverse is true
Meanwhile under the assumption of fixed scale
compensation the proportion of factor input of firms
will not be influenced by the changes in production
volume either
On the top of Tree Structure it shows firmsrsquo
decisions of demand between intermediate inputs and
integrated original inputs Under the assumption of the
Leontief Function it shows a fixed proportional rela-
tionship between the intermediate input and original
comprehensive input and total output This is common
in general design of CGE model of which the main
advantage is that it can reduce the number of para-
meters needed to estimate in the model significantly
The bottom left part of the Tree describes the
J Glob Bus Trade Vol 9 No 2 (November 2013) 45-60
55
relationship between the original investment and
production
Assume that the relationship between the original
input and the production is CES Function and the
elasticity of substitution between different original
elements is equal Accordingly sum up the original
inputs in order to obtain the Aggregate Primary Input
At the bottom right part of the Tree Structure it shows
the relationship between the intermediate input and
production which consists of two sides First is the
substitution relationship between the domestic
products and comprehensive imported products
assuming both compose into integrated intermediate
goods through CES Function Second is the
substitution relationship among different sources of
imported intermediate goods assuming which are also
integrated through the CES Function Behavior of
Firm equation
① CompoSITC Intermediate Nest
② Valuemdashadded Nest
③ Total Output Nest
In these equations pf (i j r) and qf (i j r) stands
for the price and demand of i product while producing
j good in r region af (i j r) stands for the technological
change of original feature i in j industry of r region
FMSHR (i j r) stands for the share that r regionrsquos total
imports among the demand for domestic compre-
hensive products pfm (i j s) stands for the demand
price of integrated commodity i in j industry of s
region qfm (i j s) stands for the firmsrsquo total demands
of imports pfd (i j r) stands for the demand price of
domestic comprehensive commodity i in j industry of r
region qfd (i j s) stands for the firmsrsquo demand for
domestic products ESUBD (i) stands for the elasticity
of substitution between domestic and imported goods
pva (j r) stands for the added-value price of producing
j good in r region qva (j r ) stands for the added-value
of j industry in r region ava (j r) stands for the
technological changes of the added-value in j industry
of r region SVA (k j r) stands for the share of added-
value product i in j industry of r region pfe (i j r)
stands for the price of original element i which needed
to produce j product of r region qfe (i j r) stands for
the demand of original element i which needed to
produce j product of r region afe (i j r) stands for the
technological changes of original element i in j
industry of r region ESUBVA (j) stands for the
elasticity of substitution between original elements
during the added-value production in j industry qo (j r)
stands for the output of j department of r region ao (j r)
stands for the technological changes of output in j
department of r region ps (j r) stands for the supply
price of j product in r region ESUBT (j) stands for the
elasticity of substitution of intermediate inputs while
producing j product
423 Equilibrium Condition
A GTAP model assumes a regional household unit
includes a private department and government
department to determine the consumer behavior and
savings behavior of the private department and
government department in the country or region The
Model can be divided into a Closed System and an
Open System Without the government intervention in
a Closed System the income of regional household
unit comes from the reward of selling its own elements
to the firm Firmrsquos incomes come from the purchase of
each householdrsquos expenditure and every manufacturer
also makes money by selling their intermediate goods
All economic behavior expenditures and incomes are
equal Balance of a single country Closed System is
established by the accounting identities and market
equilibrium formula In an Open System due to the
Analysis of the Interests of Conceiving a Free Trade Agreement between China and South Korea
56
joining of foreign departments the government
expenditure and the private spending in local regional
department will be divided into two parts buying
domestic products and imported products
Furthermore some parts of firmrsquos intermediate raw
materials may also be imported and its products are
sold both domestically and abroad
Regional household unitsrsquo behaviors are basically
determined by Aggregate Utility Function which
consists of government expenditure private spending
and savings It is assumed the per capita Cobb-
Douglas Utility Function is adopted and this regional
household unit pursues the utility maximum of a
household unit As a result of using the Cobb-Douglas
Utility Function the proportion of three kinds of
current consumptions that were mentioned above is
fixed
43 The Analysis Method and the Simulation
Program
This article uses the seventh edition GTAP model
which includes 113 countries and 57 sectors In the
model the author combines 113 countries or regions
into three regions China Korea and other parts of the
world 57 industry sectors will be divided into 10 kinds
of product groups 1) food and crops 2) livestock and
meat products 3) forest rivers coal natural gas and
other minerals 4) processed foods 5) Textiles and
clothing 6) light manufacturing 7) heavy industry 8)
Utilities and construction 9) Transportation and
communication 10) other services
In order to fully investigate the effects of trade
liberalization this paper intends to respectively
measure the economic effects of a free trade zone
under two kinds of tax reductions program one
simulates a ldquozero tariff base scenariordquo under the
condition that both China and Korea have a full range
cancellation of goods trade tariffs In program 2
considering the protection of its sensitive industry with
the exceptions of Korearsquos high tariffs on food and crop
departments and the exception of Chinarsquos industrial
sector (light manufacturing and heavy industry) other
department tariff reductions will be by half
44 Simulation and Results of Analysis
441 Economic and Welfare Effects
According to model calculation results (shown in
table 5) we can see from the aspects of GDP growth
In program one after the completion of the China-
Korea free trade zone GDP in both China and Korea
show growth compared to the base period Korea
benefits more with a GDP increase of 139 billion
dollars and a growth rate of 206 China only
increases 25 billion dollars and the growth rate is
015 In program two the GDP of both China and
Korea shows growth compared with the base period
too respectively rising 74 and $540 million
considerably less than the GDP growth in program one
with full exemption of import tariffs This is because
program two still has different levels of trade
protection which leads to inefficient allocation of
resources After the establishment of a free trade zone
in the program one and program two countries with
larger benefits are different Korea benefits more in
program one China benefits more in program two
This is because the two countries have the same tax
reduction in program one Because the trade barriers
between Korea and the other countries in the world are
lower and according to the customs alliance theory
the lower the trade barriers between the Customs
Alliance member countries and other countries in the
world are the establishment of a customs alliance is
less likely to cause more costly trade transfers Under
the condition of full reduction and exemption of tariffs
and zero tariffs China may show a bigger trade
transfer effect thus Korea benefits more In program
two because of the protection for the sensitive food
and crop industry the allocation of resources is less
efficient in Korea
From the point of changes in the countryrsquos welfare
total welfare increases 4964 billion dollars in Korea in
program one while China reduces 653 million dollars
Korearsquos welfare increase is mainly caused by the
improved resource distribution efficiency and trade
conditions Chinarsquos entire welfare reduction is because
of the larger trade diversion effect In program two
J Glob Bus Trade Vol 9 No 2 (November 2013) 45-60
57
both two countriesrsquo welfare increases with Chinarsquos
growth of 189 million dollars and Korearsquos 65 million
dollars Compared to program one the increasing
volume of Korearsquos welfare significantly drops largely
because of Korearsquos high tariffs on food and crop
protection which results in a lower efficiency of
resource allocation
From the view of other regions in the world either
in program one or program two the GDP and welfare
decline at different degrees This means establishing a
free trade zone no matter what level of tax reduction
is conducive to economic growth for member
countries but this will bring adverse changes for those
regions excluded in the free trade zone
From the above analysis the establishment of
China-Korean free trade zone will promote the growth
of the national economy and social welfare regardless
of what level of tax reduction but for other regions in
the world it will bring a negative adverse change
Table 5 Changes of the Economy and Welfare in Different Programs ()
Program One Program Two
Change of GDP
Change Rate of
GDP
Welfare (million of
US dollars)
Change of GDP
Change Rate of
GDP
Welfare (million of US
dollars)
China Korea
Other regions in the world
25051 139023
-277225
015 206
-007
-65303 496385
-42123
74118 54328
-380194
005 008
-001
18941 16497
-15370
Source Compiled according to the result of Rung TAP operation
442 Trade Effects
According to the results of the model calculation
(shown in Table 6) it shows whether canceling all
import tariffs on goods or protecting part of industry by
cancellation of part of tariffs the bilateral trade has an
increase The exports and imports of other regions in
the world experienced varying degrees of reduction
Chinarsquos total economic output is larger so the
establishment of a China-Korea FTZ has less impact
on Chinarsquos import and export level as on Korearsquos The
tax reduction level in program two is not as large as in
program one and in program two some industries are
protected So compared to the program one trade
barriers cause lower efficiency in resource distribution
and the impact on imports and exports is smaller than
in program one
From the terms of the changes in trade either in
program one or program two the China-Korea free
trade zone improves the membersrsquo trade condition to
some degree Specifically Korea benefits more This is
because Korea has more open trade liberalization
whose tariffs on main trade products have been
reduced to a very low level According to the customs
alliance theory the lower the trade barriers between the
Customs Alliance member countries and other regions
in the world is the establishment of a customs alliance
is less likely to cause more costly trade transfers so the
establishment of a China-Korea free trade zone has
little impact on Korearsquos trade transfer and Korea
benefits more from the changes in trade condition than
China
For the other regions in the world under both
kinds of tax reduction and exemption programs there
are different degrees of reduction in import and export
trade conditions indicating that although the establi-
shment of a free trade zone can increase imports and
exports and improve trade conditions for member
countries it can cause an adverse trade effect for the
non-member countries elsewhere in the world
Through the above analysis we can see that after
the establishment of China-Korea free trade zone
regardless of the extent of tax reduction and exemption
it will promote the imports and exports and foreign
trade conditions within the zone but may cause
adverse trade effects on other regions outside it
Analysis of the Interests of Conceiving a Free Trade Agreement between China and South Korea
58
Table 6 Changes of Trade Effects in Different Program ()
Program one Program two
Export Import Trade Condition Export Import Trade Condition
China
Korea The rest of the world
181
244 -002
229
564 -01
005
14 -004
016
028 -00018
021
046 -0006
002
005 -0003
Source compiled according to the result of Rung TAP operation
443 Industry Effects
According to the model calculation results (shown
in Table 7) shown in program one establishing the
free trade zone has a great impact on specific industry
sectors in China and Korea Chinarsquos sectors with
increased output mainly concentrate in the primary
sector products among which the agricultural sector
takes the largest increase reaching 268 while the
industrial sectors (light manufacturing and heavy
industries) decrease slightly In general Chinarsquos sector
output changes but the rate of change is not large In
contrast there is a big difference in sector output
changes between departments in Korea Because of the
restriction of resources geography population and
other natural endowments sectors with reduced output
in Korea are concentrated in the primary sector
particularly in the agricultural sector with a significant
reduction of 2009 much greater than the changes in
other sectors Sectors with output increases concentrate
in the industrial product sectors among which textiles
and clothing sector are the most outstanding with a
927 increase The other regions in the world have a
slight growth in light manufacturing but the outputs of
other sectors experience different degrees of decline
In program two every country protects its weak
industries and the tax reductions are less than in
program one The change rates in industry output of
the two countries is not big except for Chinarsquos textile
and clothing industry which has a slight rise other
changes all decline compared to program one
Although in program two Chinarsquos protection of light
manufacturing and heavy industry help to slow the
decrease of industrial output we can see from Table 7
that China rsquos output of these two industries still
declines indicating that to enhance the level of
industrial development trade protection is not always
feasible It is fundamental to work hard on solving
problems such as low-end industrial structure low
technology in production lack of innovation and etc
Korearsquos protection of agriculture shows a better effect
the output change rate of Korearsquos food and crop
industry decreased from 2009 to 004 Due to
Korearsquos protection of agricultural products Chinarsquos
increased output in food and crop industry changes
from 268 up to 0161
Through the above analysis it can be concluded
that after the establishment of a China-Korea free trade
zone regardless the degrees of tax reduction and
exemption the output will be improved with the
optimization and upgrading of industries For the other
regions in the world it brings adverse impacts
Table7 The Output Changes of Sub-sectors in Program One and Program Two ()
Program one Program two
China Korea Other regions China Korea Other regions
Food and Crop
Livestock and meat products Forest rivers and coal
Natural gas and other minerals
Processed foods Textile and clothing
Light manufacturing
Heavy industries
268
056 031
114 004
-036
-025
-2009
-012 -144
-095 927
034
162
-035
-009 -004
-011 -032
001
-003
0161
0114 0137
0479 0274
-005
-008
-004
-015 -027
-082 534
-017
-018
-0008
-0009 -0027
-0019 -0233
0007
0015
J Glob Bus Trade Vol 9 No 2 (November 2013) 45-60
59
Public utilities construction
Transport and communications Other services
038
009 01
412
155 247
-009
-004 -006
0042
002 0037
023
006 011
-0006
-0005 -0005
Source compiled according to the result of Rung TAP operation
Ⅴ Conclusions
Based on the ldquoStarting Joint Minister Statement on
free trade agreement between China and South Koreardquo
the article explains the basic ideas of this agreement
Through the analysis of the investment interests and
trade interests of China and Korea it finds that
intermediate import and export products in China and
Korea trade rank first and the goods trade in
production is considerably higher than that in
consumption This formation of structure of goods
trade can be reasonably explained by Korearsquos direct
investment in China Through the analysis of
producersrsquo interests and the consumers in China and
Korea it finds that if China and Korea reach a free
trade agreement that excludes Korearsquos agriculture from
free trade as a sensitive product it will sacrifice the
majority of consumersrsquo interests and only protects the
interests of minor agricultural producers If Chinarsquos
petrochemical and machinery are separated from
China-Korea free trade agreement negotiations it will
also sacrifice the majority of consumersrsquo interests and
only protect the investorsrsquo interests Therefore it
shows firstly the insight on interests is significantly
different between the declaration and theoretical
research Secondly Chinarsquos diplomatic interests are
bigger than its trade significance and Korea protects its
investment interests in China through trade agreements
Thirdly both countries are trying to protect their
producersrsquo interests through trade agreements
Finally this paper uses the global trade analysis
project (Global Trade Analysis Project GTAP) model
and proposes ldquofull abolition of trade in goods tariffs
between China and Koreardquo and ldquoKorearsquos exceptions
on its high tariff food and crop sectors Chinarsquos
exceptions on industrial sector (light manufacturing
and heavy industry) and tariffs on other sectors
reduced by halfrdquo It predicts the economic benefits of
China-Korean free trade zone by two sets of simulation
programs from three aspects macroeconomic and
welfare effects trade effects as well as industry effects
It finds that after the establishment of a China-Korean
free trade zone regardless the level of tax reduction it
will promote the growth of the national economy and
improve the social welfare and import and export
Trade conditions and output will be improved with
industrial optimization and upgrading of industries in
two countries For the other regions in the world it will
bring negative and adverse changes
References
Baiming Z Jiang Y amp Maohong L (2010) Biased
investment by state-owned and foreign enterprises
and its production-trade effect Wuhan University
Journal (Philosophy amp Social Sciences) 2010(1)
117-124
ChinaStatistics (2011) China Statistical Yearbook
of 2011 Central Hong Kong Author Retrieved
from httpwwwchinastatisticsnetchina-
statistical-yearbook-2011-m-23html
Fang Z H A O amp Ji L I (2010) A research on
trade status and intra-industry trade between China
and South Korea Journal of Jilin Normal Uni-
versity (Humanities amp Social Science Edition)
2010(4) 52-56
Jianxin H P W (2010) The design of FTA nego-
tiation strategy between China and Korea based on
GTAP simulation World Economy Study 2010(6)
81-86
Li Y amp Zhou W F (2008) The investment from
Korea to China The present situation trend and
Chinarsquos policies Economic Research Guide
2008(3) 158-160
Analysis of the Interests of Conceiving a Free Trade Agreement between China and South Korea
60
Li X F amp Gui J X (2009) An empirical analysis of
the impact of the establishment of China-Korea
FTA on bilateral trade International Economics
and Trade Research 2009(5) 4-8
Li X Z (2010) The trade between China and Korea
and its structure change International Studies
2010(6) 48-52
Song J G (2011) The study of free trade agreement
between China and South Korea based on the
gravity model Contemporary Economic Research
2011(5) 81-85
United Nations Statistics Division (nd) Commodity
Trade statistics database New York NY Author
Retrieved from httpcomtradeunorgdata
Watanabe (2009) The possibility about the FTA
among Japan Korea and China The Economist
2009(12) 5-12
World Trade Organization (nd) World Customs
Data 2011 Retrieved from httpwwwwtoorg
statistics
Xin Z Rong R D amp Yan C (2006) An empirical
analysis of the influence about the direct
investment from Japanese South Korean to China
on the scale and industry Journal of International
Trade 2006(10) 44-50
Xue J X amp Zhang B (2004) The economic coope-
ration arrangements in East Asia A comparative
study based on the general equilibrium model The
Journal of World Economy 2004(6) 51-59
Ye J Y amp Wang P (2005) The analysis of the trade
deficit between China and Korea Economic
Science 2005(1) 115-126
Zheng Z S (2009) The strategic motivation com-
parison of FTA promotion between China and
Korea Commercial Times 2009(33) 35-36
J Glob Bus Trade Vol 9 No 2 (November 2013) 61-71
61
ISSN 1946-5130
Journal of Global Business and Trade
wwwiagbtcom
Stock Market Development and Economic Growth the Case
of the Philippine Stock Market
Princess Jace N Sta Mariaa and Agham C Cuevas
b
ab College of Economics and Management University of the Philippines Los Bantildeos Philippines
Received 25 August 2013 Revised 27 September 2013 Accepted 30 October 2013
ABSTRACT
The general objective of this study is to analyze the level of stock market development of the Philippine Stock
Exchange as reflected by its liquidity position and its implications to economic growth in the Philippines
Stock market liquidity was analyzed through its three liquidity measurements turnover ratio total value of
traded shares ratio and the market size ratio This study used Ordinary Least Squares (OLS) in analyzing the
relationship between stock market liquidity and economic growth using quarterly data from 1996 to 2012
Stock market liquidity as measured by the growth in value of traded shares and the growth in market size is
significantly related to the growth of the economy after controlling for variables such as inflation which
lagged by one period growth in foreign direct investment and openness to trade Further analysis showed that
the growth in market size causes economic growth However the determinant of the growth in value of traded
shares does not exhibit Granger causality but is proven to have a long run relationship as shown from the
results of the Error Correction Model
Keywords economic growth Philippine stock exchange stock market development stock market liquidity
Ⅰ Introduction11
Financial markets and intermediaries play a
significant role in the growth of the economy by
improving financial efficiency that would in turn
provide better allocation of resources As savers or
lenders hold current consumption for future expendi-
ture borrowers desire current consumption or invest-
ment that would eventually yield higher returns in the
future These institutions are responsible for main-
taining a healthy monetary economy in the country as
they mobilize and convert savings into funds and
channel them to borrowers or investors to further
2013 International Academy of Global Business and Trade
All rights reserved
allocate them to more productive investments
(Mishkin 2006) An efficient stable and vibrant stock
market is essential to the development of the financial
sector Stock markets are responsible for the expansion
of a companyrsquos capital by allowing stocks or shares to
be sold or traded in public
Kanasro Jalbani and Junejo (2009) stated that
stock markets play a crucial role in capital mobilization
and provide secondary markets for the investors and
financial institutions to buy and sell securities A stock
market is considered to be liquid when large
transactions are executed with only a small impact on
prices of securities Stock market liquidity is thus
considered a good tool to measure the efficiency of a
stock market A marketrsquos stability is also determined
Stock Market Development and Economic Growth the Case of the Philippine Stock Market
62
through the liquidity of its securities or the ease at
which these securities are bought or sold in the market
The Philippine Stock Exchange (PSE) the sole
stock market of the Philippines was established on
December 23 1993 when the respective founders of
both the Manila Stock Exchange (MSE) and the
Makati Stock Exchange (MKSE) decided to combine
the two exchanges to further develop a more efficient
capital market During the past decade the PSE has
been robust in terms of the daily value traded Both
foreign and domestic market capitalization which is
the measure of the size of listed companies in the stock
market has been increasing since 2002 In January
2013 the Philippine Stock Exchange index (PSEi) the
indicator used to measure the performance of active
and highly capitalized listed Philippine companies in
the PSE breached the 6000 level an all-time high in
Philippine stock market history
The general objective of the study is to analyze the
liquidity of the Philippine stock market and its
implications for economic growth Liquidity is
important as it is an aspect of a stock market that is
necessary for the traders to interact Specifically the
study aims to measure the liquidity of the Philippine
stock market and evaluate its trends for the given
period determine the linkages between stock market
liquidity and growth of the economy and determine the
causality between stock market development and
economic growth in the Philippines
The paper is organized as follows The next two
sections review the related literature followed by the
analytical and empirical framework The fourth section
discusses the results while the last section provides the
conclusion
Ⅱ Review of Related Literature
21 Stock Market Development as a
Determinant of Economic Growth
Several studies have been conducted on the
relevance of stock market development to economic
growth As cited by Petros (nd) the stock market
provides the fulcrum for capital market activities and it
is often cited as a barometer of business direction An
active stock market may be relied upon to measure
changes in general economic activities using the stock
market index (Obadan 1995) According to Petros
(nd) directly or indirectly a stock market through its
specific services can contribute to economic growth
Mobilization of savings creation of liquidity risk
diversification improved dissemination and acquisi-
tion of information and enhanced incentive for cor-
porate control are functions that are notably significant
thus by improving the efficiency and effectiveness of
these functions it can amplify the economic growth
rate
Tapitan (2012) highlighted the role of financial
intermediaries as a prerequisite for economic growth as
they play an important role in technological progress
The financial system affects capital accumulation by
altering the saving or by reallocating savings among
different capital producing technologies The key
assumption is that better technology is produced as a
by-product of capital investment
Capital investments are important in boosting the
growth of the countryrsquos economy As cited by Nagai-
shi (1999) Levine (1997) identified two channels in
which financial markets or intermediaries affect
economic growth through capital accumulation and
technological innovation In 1999 Garcia and Liu
(1999) identified three main channels through which
financial markets and intermediaries may affect
economic growth The first is by stimulating savings
Financial markets or intermediaries provide savers
with a relatively higher yield McKinnon (1973) and
Shaw (1973) (as cited by Garcia amp Liu 1999) claimed
that financial deepening improves not only produc-
tivity of capital but also the saving rate and therefore
investment and growth Second this can be done by
reducing information and transactions costs because
we know that high transaction costs would definitely
have a negative effect on trading for these discourage
people from transacting thus affecting onersquos profit
Lastly by promoting an efficient allocation of invest-
ment the allocation of resources is improved
J Glob Bus Trade Vol 9 No 2 (November 2013) 61-71
63
22 Stock Market Liquidity
Stahel (2004) (as cited by Benić amp Frani 2008)
argues that due to stock market integration investors
would tend to move their capital to where they expect
higher returns on their investments Von Wyss (2004)
(as cited by Benić amp Frani) defined four aspects or
dimensions of financial market liquidity the trading
time tightness depth and resiliency These dimen-
sions of liquidity may be presented with five different
levels of liquidity 1) the ability to trade at all 2) the
ability to buy or to sell a certain amount of an asset
with an influence on the quoted price 3) the ability to
buy or to sell a certain amount of an asset without any
influence on the quoted price 4) the ability to buy and
to sell an asset at about the same price at the same time
and 5) the ability to execute a transaction from points
two to four immediately
Sarr and Lybek (2002) claim that illiquid markets
are more of a symptom rather than a cause of
inadequate market functioning They posit that in order
to foster liquid financial markets sound and
transparent economic policies with appropriately
designed trading clearing and settlement systems as
well as appropriate intervention policies of the central
bank which can help contain systematic risk are the
only sustainable solution
Levine and Zervos (1998) investigated whether
measures of stock market liquidity size volatility and
integration with world capital markets are robustly
correlated with current and future rates of economic
growth capital accumulation productivity improve-
ments and saving rates They used data on 49
countries from the period 1976 to 1993 They
evaluated whether the stock market indicators together
with banking development are correlated with the
growth indicators Stock market development
indicators include the size in which capitalization is
measured by the value of listed domestic shares on
domestic exchanges divided by GDP the liquidity
which is measured by the turnover ratio and the value
traded ratio Using the international capital asset
pricing model (CAPM) and international arbitrage
pricing theory (APT) they concluded that stock market
liquidity and banking development are both positively
and robustly correlated with contemporaneous and
future rates of economic growth capital accumulation
and productivity growth Also both a stock market and
banks provide different financial services that could
actually help the economy as a whole On the other
hand based on their study they find no support that
these indicators reduce private savings rate or hinder
long run growth
Levine (1996) tested the liquidity of stock markets
for 38 countries (1976-1993) that include both Indus-
trial and developing countries Three measurements for
liquidity were used the total value of shares traded on
a countryrsquos stock exchanges as a share of GDP the
value of traded shares as a percentage of total market
capitalization or the turnover ratio and the value-
traded-ratio divided by stock price volatility He
claimed that a liquid market should be able to handle
heavy trading without large price swings Thus
empirically stock market size and volatility do not
matter but the ease of which shares can be traded The
results suggest that stock market liquidity helps
forecast economic growth even after accounting for a
variety of nonfinancial factors that influence economic
growth Stock market liquidity is still a reliable
indicator of future long term growth after controlling
for inflation fiscal policy political stability education
the efficiency of the legal system exchange rate policy
and openness to international trade
Ⅲ Analytical and Empirical
Framework
Stock markets contribute in easing financial
activities as well as guiding the countryrsquos firms and
investors to allocate their funds efficiently Levine
(1996) showed that countries that had more liquid
stock markets enjoyed both faster rates of capital
accumulation and greater productivity gains Stock
markets through creation of liquidity affect economic
activity by less risky investment in equity markets
which allows savers to acquire assets and quickly sell
Stock Market Development and Economic Growth the Case of the Philippine Stock Market
64
them As Fig 1 shows liquid markets improve capital
allocation that would in turn enhance growth in the
economy
Levine (2003) identified three core sources of
theoretically ambiguous relationships between econo-
mic growth and stock market liquidity He first stated
that stock market liquidity lowers the risk of investing
in longer-run higher return projects and in
consequence fosters a growth-accelerating reallocation
of capital The lower risk however affects savings and
capital accumulation rates ambiguously so that
aggregate growth will slow if savings rate fall enough
Second the cost of investing in the long run is lower
Higher rate of return on savings affects savings and
capital accumulation rates ambiguously so that growth
will fall if capital accumulation rates fall enough
Finally stock market liquidity affects incentives for
investors to undertake the costly processes of
researching and monitoring firms and managers
ambiguously Liquidity will affect growth positively if
stock market liquidity encourages agents to evaluate
and exert corporate control
31 Measures of Stock Market Liquidity
The study adopted two measurements of liquidity
used by Kanasro et al (2009) to determine the
efficiency of the Philippine stock market through
liquidity of its shares Stock market liquidity is
hypothesized to be
SML = f (TVTS MSIZE) (1)
Where
SML -- Stock Market Liquidity
TVTS -- Total Value of Traded Shares Ratio
MSIZE -- Market Size Ratio
The Total Value of Traded Shares Ratio (TVTS)
measures the value of equity transactions relative to the
size of the economy The formula for computing the
total value of traded shares ratio is as follows
TVTS = Total Value of Traded Shares
Gross Domestic Product (2)
The Market Size Ratio (MSIZE) measures the size
of the Philippine Stock Exchange in accordance with
the market capitalization as the ratio of GDP of the
Philippines during the sample period
MSIZE = Gross Domestic Product (3)
Market Capitalization
Fig 1 Schematic Diagram for Stock Market
Liquidity and Economic Growth (Levine
1996)
32 Empirical Model
To analyze the relationship between the liquidity of
the Philippine Stock Exchange (PSE) and economic
growth in the Philippines the two measures for stock
market liquidity in logarithm form were regressed to
the logarithm of Gross Domestic Product (LNGDP)
together with the other factors that influence economic
J Glob Bus Trade Vol 9 No 2 (November 2013) 61-71
65
growth using Ordinary Least Squares (OLS) This
study also adopted the regression model of Levine
(2003) Nurudeen (2009) and Mohtadi and Agarwal
(nd) The model directly examined the relationship
between stock market liquidity and economic growth
The regression model is as follows
LNGDP = β0 + β1 LN (TVTS) + β 2 LN (MSIZE)
+ β3 LN (OPEN) + β4 LN (FDI)
+ β4 (INFLAG) + μ (4)
Where
LNGDP -growth in Gross Domestic Product
LNTVTS-growth in Total Value of Traded
Shares Ratio
LNMSIZE-growth in Market Size Ratio
LNOPEN -growth in Openness to Trade
LNFDI-growth in Foreign Direct Investment
INFLAG-Inflation Rate lagged by one period
β-parameter of the indicators
micro-the error term
The variables in the model above are defined as
follows LNGDP refers to economic growth and it is
measured as the logarithm of the real GDP The
LNTVTS is the growth in Total Value of Traded
Shares Ratio and it is measured by dividing the total
value of traded shares with the gross domestic product
and transformed to its natural logarithm The
LNMSIZE is the growth in Market Size Ratio
measured by dividing the gross domestic product to
the market capitalization and transformed to its natural
logarithm LNOPEN refers to the growth in openness
to trade and it is measured by tariff revenues which is
measured by tariff rate multiplied by imports divided
by the sum of imports and exports and transformed to
its natural logarithm LNFDI refers to growth in
foreign direct investment INFLAG is the inflation rate
lagged by one period and μ is the error term
It is hypothesized that an increase in the growth in
total value of traded shares and market size should
increase the growth of the economy The variables
LNOPEN LNFDI INFLAG were used as control
variables to gauge the strength of the correlation
between stock market liquidity and economic growth
for the given period The inflation rate lagged by one
period (INFLAG) is the percentage rate of the change
in the general changes in the price level thus it
measures the monetary instability that negatively
affects economic performance Its lagged effect was
assigned to serve as a proxy for expected future
inflation Foreign direct investment (FDI) was
expected to augment savings and increase the rates of
capital accumulation giving a positive relationship to
economic growth Openness to trade (OPEN) refers to
the openness to international trade of the economy as
trade openness fosters competition in global markets it
was expected that its growth will have a positive
relationship with economic growth
Ⅳ Results and Discussion
This study used a simple Ordinary Least Squares
(OLS) method to determine and further analyze the
relationship between the level of stock market
development as proxied by liquidity position of the
Philippine stock market and economic growth It also
attempted to provide evidence on the existence of a
long run relationship between stock market
development and economic growth through the use of
the Granger Causality test
41 Liquidity of the Philippine Stock
Exchange
The Turnover Ratio measures the value of equity
transactions relative to the market size A high turnover
is an indicator of low transaction cost (Levine amp
Zervos 1998) The turnover position of the Philippine
Stock Exchange has experienced fluctuations The
Ramos administration (1992-1998) experienced a
steady growth in the economy during which the
Philippines Stock Exchange (PSE) was unified
However due to the 1997 Asian financial crisis its
performance declined Under the administration of
Stock Market Development and Economic Growth the Case of the Philippine Stock Market
66
Estrada a decline in the performance in the PSE can be
seen From a 1262 turnover ratio in 1999 it declined
to 218 in 2000 due to poor governance and
economic policies that affected the confidence among
potential investors The economic reforms and policies
under the Arroyo administration improved growth in
the economy giving stock market significant inflows
gaining back investorsrsquo confidence Due to different
problems that the economy experienced coupled with
the global crisis as shown in Fig 2 the trend continued
to be volatile The average turnover ratio of PSE is
380 during the sample period
The Total Value of Traded Shares Ratio (TVTS)
measures the value of equity transactions relative to the
size of the economy There are significant jumps in the
liquidity (total value of shares traded to GDP) in the
last six years Its TVTS ratio has grown to almost 28
The overall average liquidity during the sample period
is 65
Fig 2 Liquidity at Philippine Stock Exchange
(PSE) using Turnover Ratio (TOR) and
Total Value of Traded Shares (TVTS)
The Market Size (MSIZE) measures the size of the
Philippine Stock Exchange in accordance with the
market capitalization as the ratio of GDP of the
Philippines during the sample period As shown in Fig
3 the size of the PSE remained very small from the
year 1996-1999 which had about 3-5 until 2000
when it increased to almost 40 The 1997 Asian
financial crisis caused instability in the financial sector
and only a few companiesrsquo securities were listed The
overall average size of the market has remained only
254 of GDP which seemed to be low in comparison
with other developing markets Since the unification of
the Makati Stock Exchange and the Manila Stock
Exchange in 1993 the Philippine Stock Exchange has
remained relatively small As of May 2012 there are
344 listed companies in the PSE
Fig 3 Liquidity at the Philippine Stock Exchange
using Market Size (MSIZE)
42 Regression Results
The study used 67 observations from the first
quarter of 1996 to the third quarter of 2012 Three
variables were found to be significant using the
Ordinary Least Squares (OLS) method These
variables were the growth in total value of traded
shares (LNTVTS) growth in market size (LNMSIZE)
growth in openness to trade (LNOPEN) The turnover
ratio was not used as a determinant of liquidity as
Levine and Zervos (1996) states that the turnover ratio
measures trading of firmrsquos equities relative to the size
of the market and does not satisfy the degree in which
liquidity services on a macroeconomic scale Thus it
would not be providing significant liquidity to the
economy as a whole Therefore a large stock market is
not necessarily a liquid market
The Durbin-Watson and Breusch-Godfrey tests
were used to test for the presence of autocorrelation
Having found to have positive autocorrelation the
Cochrane-Orcutt Transformation was used as a
remedy to minimize the autocorrelation problem Table
1 shows the regression results after the Cochrane-
Orcutt Transformation
J Glob Bus Trade Vol 9 No 2 (November 2013) 61-71
67
From Table 1 results show that the effect of
growth on the total value of traded shares and the
growth of the market size on economic growth is
positive and statistically significant at the 1 level
The control variables which are the growth of
openness to trade and growth of foreign direct
investment also have the expected signs which are
positive however these variables are not significant
even at the 10 level The results also show that the
variable of inflation lagged by one period is negatively
related to economic growth and significant at the 10
level
Table 1 Cochrane-Orcutt Transformation Regression
Results
Variable Coefficient Std Error t-statistic Probability
LNTVTS 0134 0037 362 0001
LNMSIZE 0826 0046 1800 0000
INFLAG -0025 0013 -196 0055
LNOPEN 0269NS 0240 112 0268
LNFDI 0009NS 0009 100 0322
_cons 8062 0646 1248 0000
R2 = 09488 Prob gt F = 0000
Adjusted R2 =09445 DW Statistic
(transformed) = 2005368
Notes 1 significant at 1 level of significance
2 significant at 5 level of significance
3 significant at 10 level of significance 4 Values were rounded off to three decimal
places
Stock markets contribute to economic develop-
ment by enhancing the liquidity of capital investments
(Levine 1997) Moreover by increasing the quantity
and productivity through improved allocation of
capital as well as reducing the need to hold liquid
balances a liquid stock market would augment econo-
mic growth The results showed that the relationship
between the growth of market size (MSIZE) and
economic growth is positive and significant in
explaining economic growth in the Philippines as it
was used as a proxy for liquidity The coefficient 0826
implies that a 1 increase in growth of market size
would lead to an increase of 0826 in the growth of
GDP The result provides proof that the size of the
Philippine Stock Exchange (PSE) during the given
period determines the ability of the market to mobilize
savings improve the quality and quantity of invest-
ment and accelerate economic growth since the role of
the PSE is to bring companies together to raise capital
through securities
The other measure for liquidity has a positive and
significant effect on economic growth The growth in
total value of traded shares (LNTVTS) has a coeffi-
cient of 0134 implying that a 1 increase in the
growth of total value of traded shares will increase
economic growth by 0134 Since the growth of
TVTS measures the trading of firmrsquos equity as a share
of GDP its liquidity therefore positively reflects on an
economy-wide basis (Levine amp Zervos 1996)
Inflation (INFLAG) which was lagged by one
period conforms to economic theory by having a
negative relationship with economic growth since it
affects economic performance through monetary
instability It has a coefficient of -0025 which is
statistically significant at 10 level This means that a
1 increase in the inflation rate leads to a decrease in
the growth of GDP by 0025
The coefficient of the growth in openness to trade
(OPEN) conforms to the standard economic theory
since it is positively related to economic growth even
if it was used as a control variable The coefficient of
0269 implies that over the study period a 1 increase
in the degree of trade openness leads to approximately
0269 increase in growth of GDP Also there is a
positive relationship between the growth of foreign
direct investment (FDI) and economic growth since
FDI helps to supply long-term capital with new
technologies managerial and marketing capabilities
that would in turn augment economic growth through
employment increasing managerial skills diffusing
technologies and fostering innovations (Asiedu 2002
as cited by Adhikary 2011) The coefficient of 0009
implies that over the study period a 1 increase in the
degree foreign direct investment would lead to 0009
increase in growth of GDP
However results for openness to trade and foreign
direct investment in the model proved to be statistically
Stock Market Development and Economic Growth the Case of the Philippine Stock Market
68
insignificant after using these as control variables
along with the stock market liquidity measurements
The explanatory power or the goodness of fit of the
model as measured by the R-squared is at 09488
which means that 95 can be explained by the model
and it has a very strong fit The value indicates that
economic growth in the Philippines is adequately
explained by the model for the period between the first
quarter of 1996 to the third quarter of 2012 or that 95
of the variation in the growth of economic activities is
explained by the independent variables Moreover the
relationship between liquidity and growth remains
strong even after controlling for inflation foreign direct
investment and openness to trade Thus raising stock
market liquidity may independently produce
substantial growth
43 Long Run Relationship and Causality
431Test for Stationarity
One of the conditions in order to test Granger
Causality between the two variables is through its
stationarity It is important to know if the variable is
stationary or does not have a unit root or if the variable
is nonstationary or the variable contains a unit root
The variables LNTVTS LNMSIZE and LNGDP
were not stationary in their respective level forms
Thus for testing of the unit roots the Augmented
Dickey Fuller (ADF) test was used for the two
measurements of stock market liquidity which are the
LNTVTS and LNMSIZE and the proxy for economic
growth LNGDP The ADF includes the additional
lagged terms which can be examined by the Akaike
Information Criterion (AIC) to ensure that the errors
are uncorrelated If the variable is nonstationary at
level form but stationary after first differencing the
variable is integrated of order 1 and has a unit root
Using the said test variables LNTVTS LNMSIZE
and LNGDP are stationary after first differencing The
results for stationarity are shown in Table 2
Table 2 Stationarity Test Results
Variables Level Form P-value First Difference P-value
LNGDP 05891 lags (4) 00015 lags (4)
LNTVTS 06311 lags (4) 0000 lags (3)
LNMSIZE 03335 lags (4) 00039 lags (4)
Notes 1 significant at 1 level of significance
2 significant at 5 level of significance
432 Test for Cointegration
Since the stationarity of the variables have been
established the cointegration of the indicators of stock
market development and economic growth were tested
The results for the Cointegrating Regression Dickey
Fuller Test are shown in Table 3
Table 3 Cointegrating Regression Dickey Fuller
Test Results
Regressed Variables P-value
LNTVTS and LNGDP 00250
LNMSIZE and LNGDP 00545
Note significant at 5 level of significance
The regression results suggest that LNTVTS is
cointegrated with LNGDP Thus LNTVTS has a
long-run relationship with LNGDP which means
LNTVTS share a common stochastic drift or a
common trend with LNGDP The results also suggest
that LNMSIZE is also cointegrated with LNGDP
because the error term is stationary
433 Granger Causality
Granger Causality can only be tested if variables
are stationary and variables are cointegrated It is used
to establish whether a uni-directional or bi-directional
relationship exists between stock market development
and economic growth Results showed that LNTVTS
and LNMSIZE are both stationary and cointegrated
with LNGDP Table 4 shows the optimal number of
lags used in each determinant through Akaike
Information Criterion Table 5 shows the result of the
Granger Causality test
J Glob Bus Trade Vol 9 No 2 (November 2013) 61-71
69
Table 4 Akaike Information Criterion
LNGDP LNTVTS LNMSIZE
Lags AIC AIC AIC
0 212598 237417 215782
1 168524 222582 181308
2 164703 223876 179562
3 14775 214879 172127
4 14659 216273 167974
Note indicates the optimal number of lags
The results of the Granger Causality tests indicated
that there is a unidirectional causality between stock
market liquidity using the growth in the market size as
proxy and economic growth However results show
that there is no causality between growth in total value
of traded shares and economic growth Growth in total
value of traded shares and economic growth may have
a long-run relationship since they are cointegrated but
they do not exhibit Granger causality
Table 5 Granger Causality Test Results
Variable Computed
Statistic
F Tabular
Value
Granger
Causality
LNTVTS to
LNGDP 093NS 04532 No
LNGDP to
LNTVTS 038NS 07660 No
LNMSIZE to
LNGDP 347 00136 Yes
LNGDP to
LNMSIZE 037NS 08293 No
Notes 1 significant at 5 level of significance
2 NS - indicates insignificance
Since the variables LNTVTS and LNGDP were
found to be cointegrated an Error Correction Model
(ECM) was specified to test for the speed of
adjustment in the said determinants when one of these
variables experiences a shock Table 6 shows the Error
Correction Method results for LNTVTS and LNGDP
Table 6 Error Correction Method Results
Variables Speed of Adjustment
LNTVTS and LNGDP -0143817
Note significant at 5 level of significance
It can be observed from the results that LNTVTS
as the measure of stock market liquidity and LNGDP
for economic growth have the coefficient of the error
correction term with a negative sign and it is
statistically significant at the 5 level of significance
Thus the significance of the error correction mecha-
nism supports cointegration and suggests the existence
of a long-run equilibrium relationship between economic
growth and stock market development determinant
LNTVTS In other words the coefficient of the error
correction term which measures the speed of adjust-
ment back to equilibrium whenever the system is
experiencing a shock indicates that it would take 6953
asymp 7 quarters for a variable to adjust whenever one
experiences a shock
Ⅴ Summary and Conclusion
This research work studies stock market develop-
ment and its implications to economic growth by
analyzing the relationship between the stock market
measurements for liquidity and GDP growth in the
Philippines The specific objectives of the study were
to measure the liquidity of the Philippine stock market
and evaluate its trends for the given period determine
the linkages between stock market liquidity and
growth of the economy and to determine the causality
between stock market development and economic
growth
Using Ordinary Least Squares (OLS) method for
the time series data covering the period of the first
quarter of 1996 to the third quarter of 2012 it was
shown that the role of the stock market is essential to
economic growth in a developing country like the
Philippines The two measures used for liquidity the
growth in total value of traded shares and the growth in
market size were both positively related to economic
growth and statistically significant However results
for the growth in openness to trade and foreign direct
investment in the model proved to be statistically
insignificant after using it as control variables along
with the stock market liquidity measures Inflation on
Stock Market Development and Economic Growth the Case of the Philippine Stock Market
70
the other hand which was lagged by one period
conforms to theoretical conventions by having a
negative relationship to economic growth since it
affects economic performance because of monetary
instability About 95 of the variation in economic
growth is explained by the independent variables
Moreover the relationship between liquidity and
growth remains strong even after controlling for
inflation foreign direct investment and openness to
trade Thus raising stock market liquidity may
independently produce substantial growth
In assessing the relationship between stock market
development and economic growth it empirically
proved that the measure of economic growth (LNGDP)
and all of the determinants for stock market liquidity ndash
LNTVTS and LNMSIZE were both stationary and
cointegrated For the case of the Philippines there is a
unidirectional causality between stock market liquidity
using the growth in the market size as proxy and
economic growth For LNTVTS stock market
liquidity does not ldquoGranger causerdquo economic growth
and vice versa Since the two indicators have a long
run relationship the results of the Error Correction
Model suggest that there is an adjustment in stock
market liquidity as proxied by growth in total value of
traded shares and economic growth whenever one of
the indicators experiences a shock
Admittedly the study only tested a portion of the
financial side the stock marketrsquos liquidity Other
important determinants of stock market development
such as price volatility elasticity in trading corporate
governance could also be incorporated to give more
robust results There are a wide variety of factors that
can affect economic growth both on the financial and
real sectors of the economy which needs to be taken
into consideration The empirical results indicate that
the potential of the Philippines Stock Exchange in
fostering growth in the country should further be
explored
References
Adhikary B K (2010) FDI trade openness capital
formation and economic growth in Bangladesh A
linkage analysis International Journal of Business
and Management 6(1) 16-28
Benić V amp Franić I (2009) Stock market liquidity
comparative analysis of Croatian and regional
markets Financial Theory and Practice 32(4)
477-498
Garcia V F amp Liu L (1999) Macroeconomic
determinants of stock market development Journal
of Applied Economics 2(1) 29-59
Kanasro H A Jalbani A A amp Junejo M A (2009)
Stock Market Liquidity A Case Study of Karachi
Stock Exchange Pakistan Journal of Commerce
Social Science 3 25-34
Levine R amp Zervos S (1996) Stock market
development and long-run growth The World
Bank Economic Review 10(2) 323-339
Levine R amp Zervos S (1998) Stock markets banks
and economic growth American Economic Review
537-558
Levine R (1996) Stock markets A spur to economic
growth Finance and Development 33 7-10
Levine R (1996) Stock market liquidity and economic
growth Theory and evidence Retrieved from
httpfacultyhaasberkeleyeduross_levinepapers
0845_001pdf
Levine R (1997) Stock markets economic develop-
ment and capital control liberalization Perspec-
tive 3(5) 1-8
Mishkin F (2006) The economics of money banking
and financial markets (10th ed) Upper Saddle
River NJ Prentice Hall
Mohtadi H amp Agarwal S (2001) Stock market
development and economic growth Evidence
from developing countries Available at http
www uwm edumohadiPA-4-01pdf
Nagaishi M (1999) Stock market development and
economic growth Dubious relationship Economic
and Political Weekly 2004-2012
J Glob Bus Trade Vol 9 No 2 (November 2013) 61-71
71
Nurudeen A (2009) Does stock market development
raise economic growth Evidence from Nigeria
The Review of Finance and Banking 1(1) 015-
026
Petros J (2012) The effect of the stock exchange on
economic growth A case of the Zimbabwe stock
exchange Research of Business Economics 6 1-
17
Sarr A amp Lybek T (2002) Measuring liquidity in
financial markets (Working Paper No 02232)
Washington DC IMF
Tapitan J P (2012) Measuring link between financial
development and economic growth using a sample
of selected ASEAN countries (Unpublished under-
graduate thesis) Los Banos Philippines Univer-
sity of the Philippines Los Bantildeos
Von W R (2004) Measuring and predicting liquidity
in the stock market (Doctoral dissertation) Retrie-
ved from httpwww1 unisgchwwwedisnsf
SysLkpByIdentifier2899$FILEdis2899pdf
Xiao X amp Kong L L (2012) An Empirical Study
on the Relationship between Turnover Rate and
Stock Returns in Chinese Stock Market Advances
in Information Technology and Management 2(1)
239-245
Yartey C A (2008) The determinants of stock market
development in emerging economies Is South
Africa different (Working Paper No 0832)
Washington DC IMF
J Glob Bus Trade Vol 9 No 2 (November 2013) 61-71
73

Negotiation Factors and Culture in Trade Negotiations
6
34 Touching
Touching means that negotiator touches another
negotiation partner except for beginning and ending
handshakes Except for European negotiators Korean
and Chinese negotiators seldom touch their partners
except for handshakes
Ⅳ Conclusions
The purpose of this study has been to find out basic
factors affecting international business negotiations
and to suggest some strategic implications for business
negotiators With the advancement of globalization
intercultural business negotiations become more and
more important as a marketing strategy The role of
business negotiators is extremely important in order to
achieve successful international business negotiations
In order to achieve agreement in international
business negotiations negotiators are required to
manage cultural differences between the parties
concerned in addition to the complexity of domestic
negotiations Because such a large variety of cultural
factors exist among nations it is critical for negotiators
to identify the kind of problem-solving approaches that
are most appropriate for each intercultural negotiator
Understanding cultural differences is vital for successful
intercultural negotiations An objective measurement
of culture is important to overcome misunderstanding
caused by stereotyping and prejudice about other
cultures
As for nonverbal negotiation behaviors Korean
negotiators tend to use more silent periods than the rest
of two groups Also Korean negotiators interrupted
more than Chinese and European negotiators
European negotiators used more lsquofacial gazingrsquo and
lsquotouchingrsquo strategies in negotiation However there are
study limitations as follows the most important
consideration is the validity of the principal outcome
measure individual profit Kellyrsquos negotiation game
and such measures have been used in other studies but
how well the game represents actual business
negotiations is problematic Much of the evidence
supplied for accepting and rejecting hypotheses is
based on self-reports and judgements of participants
Also small sample sizes do not allow for tests of
statistical significance The negotiator should understand
the cultural background specifically regarding business
negotiation Negotiators can ask more questions in
their negotiations Sometimes itrsquos smart to be a little
bit dumb in business negotiations
The more the negotiators ask questions the more
information they can get and they can exchange more
information Also using a silent strategy can be
necessary and aggressive influence tactics such as
warnings and threats particularly those emphasized
with expressions of emotions may be used in
negotiations in a very restrictive way
Cooperatives and educational institutions should
take advantage of current research to develop training
programs on cultural differences in not only verbal
communication but non-verbal communication for
better trade negotiation results
References
Achrol R S (1997) Changes in the theory of
interorganizational relations in marketing Toward
a network paradigm Journal of the Academy of
Marketing Science 25(1) 56-71
Adler N J amp Graham J L (1989) Cross-cultural
interaction the international comparison fallacy
Journal of International Business Studies 20(3)
515-537
Allred K G Mallozzi J S Matsui F amp Raia C P
(1997) The influence of anger and compassion on
negotiation performance Organizational Behavior
and Human Decision Processes 70(3) 175-187
Argyle M amp Cook M (1976) Gaze and mutual
gaze Cambridge England Cambridge University
Press
Atkinson J M amp Heritage J (1984) Structures of
social action Studies in conversation analysis
Cambridge England Cambridge University Press
Barry B Fulmer I S amp Van Kleef G A (2004) I
laughed I cried I settled The role of emotion in
J Glob Bus Trade Vol 9 No 2 (November 2013) 1-9
7
negotiation The Handbook of Negotiation and
Culture 71-94
Barry B amp Friedman R A (1998) Bargainer
characteristics in distributive and integrative
negotiation Journal of Personality and Social
Psychology 74(2) 345
Barry B amp Oliver R L (1996) Affect in dyadic
negotiation A model and propositions Organiza-
tional Behavior and Human Decision Processes
67(2) 127-143
Blackman C (1977) Negotiating China Case studies
and strategies St Leonards Australia Allen amp
Unwin
Brenkert G G (1998) Trust morality and interna-
tional business Business Ethics Quarterly 8(02)
293-317
Brunner J A amp Taoka G M (1977) Marketing and
negotiating in the peoplersquos republic of China
Perceptions of American businessmen who atten-
ded the 1975 Canton Fair Journal of International
Business Studies 69-82
Butler J K (1995) Behaviors trust and goal
achievement in a win-win negotiating role play
Group amp Organization Management 20(4) 486-
501
Campbell N C Graham J L Jolibert A amp
Meissner H G (1988) Marketing negotiations in
France Germany the United Kingdom and the
United States The Journal of Marketing 52 49-62
Casse P (1981) Training for the Cross-Cultural Mind
(2nd ed) Washington DC Society for
Intercultural Education Training and Research
Cellich C (1995 January) Negotiations for export
business Elements for success In International
Trade Centre (ED) International Trade Forum
(No 4 p 20) Geneva Author
Clopton S W (1984) Seller and buying firm factors
affecting industrial buyersrsquo negotiation behavior
and outcomes Journal of Marketing Research 21
39-53
Coates A (1968) Myself a Mandarin Oxford UK
Oxford University Press
Davidson W H (1987) Creating and managing joint
ventures in China California Management Review
29(4) 75-95
Deutsch M Kelley H H amp Rapoport A (1964)
Strategic interaction and conflict Berkeley CA
Berkeley Institute of International Studies
University of California
Evans F B (1963) Selling as a dyadic relationship A
new approach American Behavioral Scientist 6
76-79
Fang T (1997) Chinese business negotiating style A
socio-cultural approach (Licentiate thesis)
Linkoping Sweden Inter-national Graduate School
of Management and International Engineering
(IMIE)
Fisher R Ury W amp Patton B (1991) Getting to
Yes (2nd ed) New York NY Penguin Books
Ganesan S (1994) Determinants of long-term
orientation in buyer-seller relationships The
Journal of Marketing 19(4) 1-19
Gardner L amp Aronson G (Eds) (1968) Handbook
of Social Psychology Reading MA Addison-
Wesley
George J M Jones G R amp Gonzalez J A (1998)
The role of affect in cross-cultural negotiations
Journal of International Business Studies 29(4)
749-772
Gilsdorf J W (1997) Metacommunication effects on
international business negotiating in China
Business Communication Quarterly 60(2) 20-37
Goh B C (1996) Negotiating with the Chinese
Euro-Asia Business Review 5(1) 34-36
Graham J L (1985) The influence of culture on the
process of business negotiations An exploratory
study Journal of International Business Studies
81-96
Graham J L (1986) The problem-solving approach
to negotiations in industrial marketing Journal of
Business Research 14(6) 549-566
Graham J L (1990) An exploratory study of the
process of marketing negotiations using a cross-
cultural perspective In E A Scarcella amp S
Krashen (Eds) Developing communicative
Negotiation Factors and Culture in Trade Negotiations
8
competence in a second language (pp 239-279)
Rowley MA Newbury House
Greenhalgh L amp Gilkey R W (1993) The effect of
relationship orientation on negotiatorsrsquo cognitions
and tactics Group Decision and Negotiation 2(2)
167-183
Gumperz J J (1982) Discourse strategies Cambridge
UK Cambridge University Press
Hall E T (1976) Beyond culture Garden City NY
Anchor Press
Hall E T (1989) The silent language New York
NY Bentam-Doubleday
Hofstede G (1991) Cultural and organization amp
software of the mind Berkshire England
McGraw-Hill
Hofstede G (2001) Culturersquos consequences (2nd ed)
Thousand Oaks CA Sage
Jones G R amp George J M (1998) The experience
and evolution of trust Implications for cooperation
and teamwork Academy of Management Review
23(3) 531-546
Kumar R (1997) The Role of affect in negotiations
an integrative overview The Journal of Applied
Behavioral Science 33(1) 84-100
Kumar R (2004) Culture and emotions in
international negotiations An overview In M J
Gelfand amp J M Brett (Eds) The handbook of
negotiation and culture (pp 95-113) Stanford CA
Stanford Business Books
Lewicki R J amp Stark N (1996) What is ethically
appropriate in negotiations An empirical examina-
tion of bargaining tactics Social Justice Research
9(1) 69-95
Lewis S A amp Fry W R (1977) Effects of visual
access and orientation on the discovery of
integrative bargaining alternatives Organizational
Behavior and Human Performance 20(1) 75-92
Linton R (1945) The cultural background of personality
New York NY Appleton-Century Crofits
McAllister D J (1995) Affect-and cognition-based
trust as foundations for interpersonal cooperation
in organizations Academy of Management
Journal 38(1) 24-59
Min H amp Galle W (1993) International negotiation
strategies of US purchasing professionals Interna-
tional Journal of Purchasing and Materials
Management 29(2) 40-50
Pennington A L (1968) Customer-salesman bargain-
ing behavior in retail transactions Journal of
Marketing Research 255-262
Pruitt D G (1981) Bargaining Behavior New York
NY Academic Press
Reardon K K amp Spekman R E (1994) Starting out
right Negotiation lessons for domestic and cross-
cultural business alliances Business Horizons
37(1) 71-79
Rempel J K Holmes J G amp Zanna M P (1985)
Trust in close relationships Journal of Personality
and Social Psychology 49(1) 95
Rubin J Z amp Brown B R (1975) The social
psychology of bargaining and negotiation New
York NY Academic Press
Salacuse J W (1991) Making global deals negotia-
ting in the international marketplace Boston MA
Houghton Mifflin
Sawyer J amp Guetzkow H (1965) Bargaining and
Negotiation in International Relations In H C
Kelman (Ed) International behavior A social-
psychological analysis (pp 464-520) New York
NY Holt Rinehart and Winston
Sebenius J K (2002) The hidden challenge of cross-
border negotiations Harvard Business Review
80(3) 76-85
Shenkar O amp Ronen S (1987) The cultural context
of negotiations The implications of Chinese
interpersonal norms The Journal of Applied
Behavioral Science 23(2) 263-275
SRI International (1979) Doing Business in Taiwan
and Doing Business in Japan [Pamphlet] Menlo
Park CA Schmidt K D
Stewart S amp Charles F K (1989) Talking with
dragon Negotiating in the peoplersquos republic of
China Columbia Journal of World Business 23(3)
68-72
J Glob Bus Trade Vol 9 No 2 (November 2013) 1-9
9
Strong K amp Weber J (1998) The myth of the
trusting culture a global empirical assessment
Business amp Society 37(2) 157-183
Thibaut J W amp Kelly W H (1959) The social
psychology of groups New York NY McGraw-
Hill
Triandis H C Kurowski L L amp Gelfand M J
(1994) Workplace diversity In H C Triandis M
D Dunnette amp L M Hough (Eds) Handbook of
industrial and organizational psychology (pp 769-
827) Palo Alto CA Consulting Psychologists
Tung R L (1982) US-China trade negotiations
practices procedures and outcomes Journal
of International Business Studies 25-37
Weiss S E (1993) Analysis of complex negotiations
in international business The RBC perspective
Organization Science 4(2) 269-300
Weitz B (1979) A critical review of personal selling
research The need for contingency approaches In
G Albaum amp G A Churchill (Eds) Critical
issues in sales management State of the art and
future research needs Eugene OR University of
Oregon
Yoshimatsu H (2005) Japanrsquos keidanren and free
trade agreements Societal interests and trade
policy Asian Survey 45(2) 258-278
Zandt V (1970) How to negotiate in Japan Harvard
Business Review 25-38
J Glob Bus Trade Vol 9 No 2 (November 2013) 11-21
11
ISSN 1946-5130
Journal of Global Business and Trade
wwwiagbtcom
Is the Agrochemical Industry Traversing the Organic Route
Insights and Directions for a Philippine Agrochemical
Trading Company
Jane Keneth M Mampustia Jeanette Angeline B Madamba
b Agnes T Banzon
c and
Loida E Mojicad
abcd College of Economics and Management University of the Philippines Los Bantildeos Philippines
Received 12 August 2013 Revised 22 September 2013 Accepted 25 October 2013
ABSTRACT
This paper explores the strengths weaknesses challenges and opportunities of a Philippine agrochemical
trading company as it thrives within its broader macro-environment In an era of climate change adaptation
and ailing global economies agrochemical companies within the food chain face even greater barriers to
survival and competitiveness The study revealed that the agrochemical industry has made baby steps in
encouraging farmers to adopt the natural or organic way of farming through the use of biopesticides and
biofertilizers as a response to climate change but price-sensitive farmers appear indifferent to the use of
biopesticides and biofertilizer and readily switch suppliers depending on product prices as well as the
promotional activities done by agrochemical trading companies These suggest that agrochemical usage will
continue to dominate global agriculture in the next couple of years while biologicals in organic agriculture
will account for a minimal percentage despite the trend toward sustainable agriculture To be sustainable it is
suggested that agrochemical trading companies introduce new brands for each product type formulate a
customer retention strategy for its dealers and independent business partners and pursue a market penetration
strategy to widen the customer base as they track their moves against a changing global agrochemical
industry
Keywords agrochemical industry biopesticides climate change adaptation organic agriculture sustainability
Ⅰ Introduction2
Agrochemicals also known as crop protection
products are those products or substances which are
used to effectively and actively manage the agricultural
ecosystem Agrochemical products include pesticides
herbicides insecticides and fungicides Synthetic
fertilizers hormones and other chemical growth agents
2013 International Academy of Global Business and Trade
All rights reserved
as well as concentrated stores of raw animal manure
may also be included in the list of agrochemical
products These products can be classified into four
categories inorganic pesticides organic pesticides and
pre-emergent and post-emergent herbicides These
chemicals play a vital role in controlling and restrain-
ing the damaging attacks of pests weeds fungi
diseases and other undesirable pests which pose
serious threats to global crop production The benefits
offered by agrochemical products are two-fold the
Is the Agrochemical Industry Traversing the Organic Route Insights and Directions for a Philippine
Agrochemical Trading Company
12
control of certain pests and diseases to improve crop
productivity and indirectly poverty alleviation (Fertili-
zer and Pesticide Authority 2012)
Fig 1 Benefits of Pesticides to Control Human and Livestock Disease Vectors and Nuisance Organisms
Source Cooper and Dobson as cited in Cuyson S (2007)
Pesticide products when used properly can give
benefits not only to the community but to the whole
society as shown in Fig 1 Problems which most
farmers complain about like fast-growing weeds and
threats to crop productivity can be resolved through the
application of herbicide The application would reduce
cost of labor and fuel specifically for large plantations
Safety for the environment and human health is also
emphasized Careful regulatory policies are implemented
by the FPA so that the environment and human health
would not be at risk Although chemical-based crop protection products
have contributed time and again toward increasing
farmersrsquo incomes because these products prevent
massive crop losses caused by pests and diseases Due
to the need to efficiently meet demand farmers and
other agribusiness entities have to constantly rely on
crop-protecting chemical products since it only takes a
short period to harvest crops with the help of these
products (Tirado 2008) Agrochemical products as
well as the widespread use of irrigation have largely
contributed to the increase in agricultural production
On the other hand health concerns have caused a
negative perception of agrochemicals since over-
utilization of these products have caused problems
such as toxicity of the soil pollution and food poisoning
Established multinational companies involved in
the agrochemical industry as well as local companies
are pressured to effectively address the agricultural
trend of shifting to organic farming and developing
more environmentally-friendly products In addition
there are government policies to which they must align
their objectives with societal welfare in mind Non-
government organizations (NGOs) and environmental
groups such as Greenpeace have been actively making
their moves against crop protection companies With
this scenario players in the industry are bound to
strategize on how to improve product safety to defend
themselves from the actions of such groups in the
interest of sustainability
Phil-Agrochemicals Trading (not the real name) is
a nationwide distributor of generic agrochemical products
located in Southern Luzon Philippines Its distribution
network includes dealers independent business partners
(IBPs) and wholesalers The market may be skeptical
about the efficacy of generic agrochemical brands but
J Glob Bus Trade Vol 9 No 2 (November 2013) 11-21
13
this small company strives to be more responsible for
their products through continuous research on ways to
improve their products and demonstrate such efficacy
in crop protection Knowing their products may have
detrimental effects for the farmers if not properly used
the company conducts seminars or farmersrsquo group
meetings on the safe use of their products They also
give protective gear such as masks and gloves to the
farmer participants Products which are traded by this
company are manufactured by several suppliers in the
Philippines such as AgChem Manufacturing Corpora-
tion Radisson Agrochemical Corporation and Kemistar
Corporation These manufacturing compa-nies are
members of the Crop Protection Association of the
Philippines (CPAP) one of the leading crop protection
chemical associations in the country Phil-Agroche-
micals Trading also imports agrochemicals (speci-
fically insecticides) from Bharat Agro Chemicals in
India and China Xiamen Top using Import amp Export
Co Ltd from China About 10 of their total
inventory comes from imported insecticides Currently
Phil-Agrochemicals Trading which also distributes
products of its sister company has fifteen pesticide
products and two plant nutrition products in its
inventory pipeline
With the stiff competition in the Philippine agro-
chemical industry brought about even more by the
institution of Republic Act No 10068 (also known as
the Organic Act of 2010) the company has to find
ways to better strategize so as to gain customer trust
encourage continued patronage and improve overall
company performance The company has about eight
direct competitors
This paper aims to present an overview of the
agrochemical industry compare the firmrsquos operational
and functional strategies with the practices in the
industry identify and assess the problems and oppor-
tunities pertaining to these strategies and compare
these with its competitorsrsquo strategies and suggest
solutions to the problems or strategies to take
advantage of opportunities in view of the challenges of
going organic and the overall demand for the greening
of agriculture
II Methodology
Primary data for this exploratory research were
gathered from surveys and interviews with four
company officerspersonnel 60 farmers five indepen-
dent business partners and five dealers as well as an
actual apprenticeship at Phil-Agrochemical Trading
over a two-month period by the major author
Secondary data were obtained from printed sources
found at several government institutions such as the
Crop Protection Association of the Philippines (CPAP)
and the Fertilizer and Pesticide Authority (FPA)
company files and other printed or online publications
and unpublished special problem reports at the College
of Economics and Management library Descriptive
analysis combined with a comparative competitor analysis
and a SWOT analysis was used in this research
Ⅲ Review of Literature
Zhang et al (2011) identified three phases in the
history of pesticides and its application (1) the first
phase which covered the period before the 1870s saw
the use of natural pesticides (such as sulfur in ancient
Greece) as a pest control measure (2) the second phase
from the 1870s to 1945 saw the advent of inorganic
synthetic pesticides and the use of natural materials
and inorganic compounds and (3) the third phase
(from 1945 onwards) marked the era of organic
synthetic pesticides (eg DDT 24-D and later HCH
dieldrin) Since then humans synthesized most
pesticides which were later referred to as chemical
pesticides It was during the third phase (the era of
organic synthetic pesticides) when there was a boost in
agricultural productivity which became a moving force
for the advancement of human civilization
During the earlier portion of the third phase three
kinds of insecticides were used carbamated insecticides
organophosphorus insecticides and organochlorined
insecticides This was soon followed by the develop-
ment of herbicides and fungicides As seen in Table 1
herbicide use increased from 20 in 1960 to 48 in
2005 Herbicides comprised almost half of total
pesticide consumption in 2005 (Zhang et al 2011)
Is the Agrochemical Industry Traversing the Organic Route Insights and Directions for a Philippine
Agrochemical Trading Company
14
Table 1 Changes of Pesticide Consumption Worldwide
CATEGORY 1960 1970 1980 1990 2000 2005
Sales Sales Sales Sales Sales Sales
Insecticides 310 365 1002 371 4025 347 7655 29 7559 279 7798 25
Herbicides 170 20 939 348 4756 14 1162
5
44 1288
5
475 1497
1
48
Fungicides amp Bactericides
340 40 599 222 2181 188 5545 21 5306 196 7486 24
Others 30 35 159 59 638 55 1575 6 1354 5 936 3
Total 850 100 2700 100 11600
100 26400
100 27104
100 31191
100
Note Sales in millions USD
Source Xu (1997) httpwwwdocincomp-55305172html as cited in Zhang et al (2011)
According to the Food and Agriculture Organi-
zation of the United Nations (FAO) fertilizer and
pesticide use in the Philippines between 1961 and
2005 increased by 1000 and 325 respectively
This was caused by the widespread use of irrigation
agrochemicals and new seeds in the country However
crop yield only increased by a small amount even
though agrochemical products were used This was
mainly attributed to excessive and inappropriate use of
chemical-based products in farming causing land
degradation and losses in soil fertility
Ⅳ Overview of the Industry
41 Global Agrochemical Industry
Dussal (2011) stated that the world agrochemical
industry was valued at USD 134 billion in 2010 It is
expected to grow at a CAGR of 11 to reach USD
225 billion by 2015 The Asia Pacific region led the
global agrochemical and fertilizer consumption
accounting for 40 followed by North America with
32 The top ten global players include Bayer
Syngenta Potash Corp Agrium and Mosaic which
constitute around 90 of the world market share
Pesticide sales remained relatively constant over
the 1990s between USD 270 to 300 billion From 2007
to 2008 herbicides ranked first in the three major
categories of pesticides (insecticides fungicides
bactericides and herbicides) in terms of sales The
fungicidesbactericides ranked second Europe is now
the top consumer of pesticides in the world followed
by Asia Specific countries which largely use
pesticides are China the United States France Brazil
and Japan Most of the pesticides worldwide are used
for fruit and vegetable crops In developed countries
pesticides mainly herbicides are primarily used for
maize Since the 1980s there have been hundreds of
thousands of pesticides developed worldwide inclu-
ding biopesticides (Zhang et al 2011)
According to the US Environmental Agency
ldquobiopesticides are certain types of pesticides derived
from such natural materials as animals plants bacteria
and certain minerals For example canola oil and
baking soda have pesticide applications and are
considered biopesticides At the end of 2001 there
were approximately 195 registered biopesticide active
ingredients and 780 products Biopesticides fall into
three major classes
a Microbial pesticides consist of a micro-
organism (eg a bacterium fungus virus or
protozoan) as the active ingredient Microbial
pesticides can control many different kinds of
pests although each separate active ingre-
dient is relatively specific for its target pest(s)
For example there are fungi that control
certain weeds and other fungi that kill
specific insects
b The most widely used microbial pesticides
are subspecies and strains of Bacillus
thuringiensis or Bt Each strain of this
bacterium produces a different mix of
proteins and specifically kills one or a few
J Glob Bus Trade Vol 9 No 2 (November 2013) 11-21
15
related species of insect larvae While some
Btrsquos control moth larvae found on plants
other Btrsquos are specific for larvae of flies and
mosquitoes The target insect species are
determined by whether the particular Bt
produces a protein that can bind to a larval
gut receptor thereby causing the insect larvae
to starve
c Plant-Incorporated-Protectants (PIPs) are
pesticide substances that plants produce from
genetic material that has been added to the
plant For example scientists can take the
gene from the Bt pesticide protein and
introduce the gene into the plantrsquos own
genetic material Then the plant instead of
the Bt bacterium manufactures the substance
that destroys the pest The protein and its
genetic material but not the plant itself are
regulated by EPA
Fig 2 Distinguishing Factors for the Paradigm Shift in the Crop Protection Industry
Source Balayan (2010)
d Biochemical pesticides are naturally occurring
substances that control pests by non-toxic
mechanisms Conventional pesticides by
contrast are generally synthetic materials that
directly kill or disable the pest Biochemical
pesticides include substances such as insect
sex pheromones which interfere with mating
as well as various scented plant extracts that
attract insect pests to traps Because it is
sometimes difficult to determine whether a
substance meets the criteria for classification
as a biochemical pesticide the EPA has
established a special committee to make such
decisions
42 The Philippine Crop Protection Industry
According to the Samahan sa Pilipinas ng mga
Industriyang Kimika (SPIK) or Chemical Industries
Association of the Philippines in 2008 the utilization
of crop-protecting chemicals is still prevalent among
Filipino farmers In the country the most extensively
used pesticides are insecticides which account for 51
of the total market herbicides comprise 21
fungicides 14 and the remaining other types of
pesticides 14 These chemicals are used for crops
such as rice (about 33 million hectares of plantation
area) corn (32 million hectares) pineapple (67000
hectares) and banana (25000 hectares)
Is the Agrochemical Industry Traversing the Organic Route Insights and Directions for a Philippine
Agrochemical Trading Company
16
Because of the greater challenge faced by the
players there has been a progressive shift in the
industry from what is commonly known as an
agrochemical industry to a crop protection industry and
now to a plant science industry as shown in Fig 2 The
shift to a plant science industry is believed to deliver
products that would give better solutions to crop
problems and technologies that would lead to
sustainability As of now the multinational companies
or the CropLife members are the ones which are
already in the third phase (Balayan 2010) The generic
companies are still in phase 2 (crop protection) but on
their way to shift to phase 3 (plant science)
The Philippine crop protection industry is
comprised of firms engaged in the formulation
manufacture distribution repackaging importation
and exportation of chemical pesticides It has always
been dominated by transnational agrochemical com-
panies which are members of CropLife International
such as Bayer CropScience Syngenta Philippines Du
Pont Dow Agro These companies operate and manu-
facture their own agrochemical products These
companies focus more on the assurance of the safety of
their products Moreover they are now more respon-
sible about the flow of their products up through the
disposal phase Hence they practice product steward-
ship In 2008 the FPA has listed about 300 firms
operating in the country Other players in the industry
would include local companies such as the members of
the Crop Protection Association of the Philippines
(CPAP) and other generic product-making companies
As shown in Table 2 there has been an increasing
demand for pesticides in the country although a
continuous campaign against these products is done by
the NGOs An increase in Philippine importation of
pesticides is due to the fact that perceived sustainability
cannot be achieved without the help of these
agrochemical products The country is highly
dependent on importation due to the limited resources
available in the country for formulators and manufac-
turers Active ingredients are also imported by the
major industry players Local production is limited to
formulation of imported technical materials except for
24-D
Table 2 Value of Imports of Pesticides in the Philippines (in USD 1000rsquos)
Item 2006 2007 2008 2009 2010
Insecticides 39658 49152 65022 68873 51371
Fungicides 46751 40741 32109 26914 28648
Herbicides 22236 22793 21954 11715 5031
Disinfectants etc 10388 13033 30741 53249 85043
Total 119033 125719 149826 160751 170093
Source FAO (2010)
On the other hand exports of pesticides by the Philippines show minimal levels making the country a net importer of
pesticides (Table 3)
Table 3 Value of Exports of Pesticides in the Philippines (in USD 1000rsquos)
Item 2006 2007 2008 2009 2010
Insecticides 1335 2938 1547 1508 1928
Fungicides - - 1 15 132
Herbicides 1 262 400 81 27
Disinfectants etc 312 1199 915 1256 740
Total 1649 4399 2863 2859 2826
Source FAO (2010)
J Glob Bus Trade Vol 9 No 2 (November 2013) 11-21
17
43 Foreseen Trends in Global Pesticide
Production and Consumption
The trend nowadays is organic agriculture which is
seen also as sustainable agriculture Thus the ongoing
deterioration in the natural environment had Zhang et
al (2011) saying that biopesticides are the wave of the
future Such pesticides must be highly efficient non-
toxic and environment-friendly Biopesticides according
to Yang (2001) have the following advantages
a a positive control effect on pests safe to humans
and animals and no pollution
b no residuals
c strong specificity to target pests safe to natural
enemies and beneficial organisms
d raw materials and active ingredients are natural
products which helps to ensure sustainable
development
e they can be modified by means of modern
biotechnology and fermentation processes to
improve performance and enhance quality
f pest resistance is difficult to generate
Over 100 kinds of biopesticides exist at present
worldwide with about 30 types of biopesticides
commercially produced (Xu 2008) Countries such as
Mexico the United States and Canada dominate global
biopesticide usage accounting for 44 The total
world biopesticide consumption can be broken down
into 20 (Europe) 13 (Asia) 11 (Oceania) 9
(Latin America) and 3 (Carribean and Africa) (Qin
amp Kong 2006) As for China the biopesticide industry
has been expanding since the 1990s from 10 to 20
annually such that by 2006 total biopesticides
consumption reached 145000 tons accounting for 10
of total sales It is anticipated that biopesticides will
replace up to 20 of chemical pesticide consumption
in China in the years ahead
Since safer products are what consumers are
demanding companies such as United Farm Tech-
nologies Nuso Agro Science and Dow Agro started
selling and manufacturing safer pesticides called
biopesticides These products are derived from natural
materials Biopesticides constitute about 2 of the
global agrochemical market (Dussal 2011) In
Monsantorsquos pipeline are agricultural biological or
biopesticides produced using what they call the Bio-
Direct Technology which involves using molecules
found in nature expected to be developed for use in
topically applied crop protection and other products
(Monsanto 2012) Moreover Bayer CropScience
recently acquired AquaQuest a US-based supplier of
innovative biological pest management solutions based
on natural microorganisms for USD 500 million in its
bid to build a leading technology platform for green
products (Bayer 2012)
Ⅴ Results and Discussion
51 Compliance by Phil-Agrochemical
Trading with FPA Requirements
The FPA requirements relative to product labeling
were all met by the Phil-Agrochemical Trading These
include a statement of composition registration or
provisional permit number name and address of
company the productrsquos common name net contents
directions for use suitable indication of hazards
instructions on decontamination and safe disposal of
used containers the lot number and date of formulation
the FPA registration number re-entry period after
application triple rinse logo a person to contact in case
of emergency and safety instructions
52 Comparison of Phil-Agrochemical
Tradingrsquos Activities with CPAP
Activities
Four types of activities are carried out by CPAP
members product stewardship agromedical training
information education campaign aerial spraying semi-
nars and farmersrsquo meetings Phil-Agrochemical
Trading has yet to apply for CPAP membership A
comparison of its activities with CPAP activities
revealed that only farmersrsquo meetings are done by the
firm
Is the Agrochemical Industry Traversing the Organic Route Insights and Directions for a Philippine
Agrochemical Trading Company
18
53 Comparison of Phil-Agrochemical
Tradingrsquos Operations with Top
Competitors
Table 4 presents a summary comparison of Phil-
Agrochemical Tradingrsquos operations with two of its
top competitors CyBERTH Philippines Inc and
PhilAgrow Inc
CyBERTH Philippines Inc was established in
1999 and is engaged in trading pesticides and
fertilizers in the country However they trade more
pesticide products as fertilizer is more expensive The
companyrsquos product portfolio includes 24 registered
products categorized as insecticides herbicides
fungicides molluscicides or plant growth regulators
The major crops where these products can be used are
rice corn vegetables and mangos The companyrsquos
operations cover the research and development of new
products importation and local purchase of the
technical and inert materials of a particular product
formulation warehousing and supply of finished
products to its distributors This company continuously
searches for better products
PhilAgrow Inc started operations in 2006 and is an
importerdistributor of chemical pesticides such as
insecticides molluscicides fungicides herbicides
nematicides and specialties It has 18 FPA-registered
products
Table 4 Summary Comparison of Phil-Agrochemical Trading with Two Top Competitors
Points for Comparison Phil-Agrochemical
Trading CyBERTH Philippines Inc PhilAgrow Inc
Product Lines 14 FPA registered products 24 FPA registered products 18 FPA registered products
Product Variety
Herbicidesinsecticides
molluscicides fungicides fertilizer
Herbicides insecticides
molluscicides fungicides fertilizer
Insecticides molluscicides
fungicide herbicides nematicides specialties
Promotional Activities
Farmers meetings caravans
raffle promos provision of protective gears
Farmers meetings raffle
promos provision of protective gears
Farmers meetings raffle
promos provision of protective gears
Target Market
General trade market
plantation businesses small farmers (below 2ha and 2ha
and above)
General trade market
plantation businesses small farmers below 2 ha
and 2 ha and above)
General trade market
plantation businesses small farmers below 2 ha and 2 ha
and above)
Location Scope Domestic Domestic Domestic
Facilities (eg warehouse
transportation)
Rented (Outsourced
production) Owned Research facility
Provision of training to employees
- Yes Yes
Note Firm name was disguised upon firmrsquos request
Among the points for comparison it can be seen
that Phil-Agrochemical Trading has the least number
of product lines at 14 FPA-registered products vis-agrave-
vis CyBERTH Philippines Inc with 24 FPA-
registered products and PhilAgro Inc with 18 FPA-
registered products In terms of product variety Phil-
Agrochemical Trading and CyBERTH Philippines
Inc have 5 types of products while PhilAgrow has 6
types All firms carry out the same promotional
activities have the same target market and location
scopecoverage Facilities of Phil-Agrochemical
Trading are rented while those for CyBERTH
Philippines Inc are owned PhilAgrow Inc has its
own research facility Only CyBERTH Philippines
Inc and Phil-Agrow Inc provide training to
employees
54 Farmer Survey Results
Sixty farmers surveyed had about 11-15 years of
farming experience primarily grew rice operated
small farms (1-5 hectares) and were customers of Phil-
J Glob Bus Trade Vol 9 No 2 (November 2013) 11-21
19
Agrochemical Trading for five years or less The
majority (over 91) bought pesticides from other
distributors because of lower prices and availability of
preferred agrochemicals On a scale of 1 to 7 with 7
being the highest rating most farmers rated Phil-
Agrochemical Trading a ldquo4rdquo Suggestions given by the
farmers to the firm included lowering the product
prices and increasing promotional activities to
encourage customer retention and continued patronage
55 Assessment of Strengths Weaknesses
Opportunities and Threats
Fig 3 shows a SWOT Matrix where Phil-Agro-
chemical Tradingrsquos strengths are matched with its
opportunities and then with its threats while its
weaknesses are matched with its opportunities and
then with its threats to generate possible strategy
alternatives for the firm to become sustainable Such
strategies include the introduction of new brands per
product type creation of a customer retention strategy
for its dealers and IBPs and pursuing market
penetration
Fig 3 SWOT Matrix
External
Internal
Opportunities Threats
(1) Training programs and seminars are conducted by institutions
such as FPA and CPAP
(2) The openness of farmers to new knowledge in crop production
(3) The bright prospects for the plant
science industry towards the attainment of food security
(4) Increasing trend towards the
production of biopesticides (5) Availability of funding agencies
(6) The support of government and
NGOs for organic farming
(7) The negative perception on the use of chemical pesticides and fertilizers
(8) Small farmers are highly sensitive to
pesticide prices (9) Increasing competition in the industry
due to increasing number of new
entrants (10) The effects of climate change on the
industry
(11) Products of the industry are not highly differentiated
(12) Prices of inputs for the manufacture
of pesticides are volatile
Strengths
Introduction of different brands for
each type of pesticide
(S1 S2 and O1 O5)
Market Penetration
(S1 S3 and T1 T3 T6)
1 The firm has suppliers which are
members of CPAP
2 The firm has its BOD as distributors
3 They do not distribute Category I
pesticide 4 The company has developed
partnership with the dealers of
organic fertilizers
Weaknesses
Creation of customer retention
strategy for the dealers and IBPs
(W2 W3 W5 and O1 O2 O3)
Creation of customer retention strategy for the dealers and IBPs
(W2 W3 W4 and T1 T2 T3 T6)
1 Lack of warehousing facilities
2 Weak brand recognition
3 Non-commitment of dealers and
IBPs
4 Experiences stock-outs of products
5 The company does not have well-
established customer relationships
56 Insights and Directions It is apparent that though the agrochemical industry
has taken action in traversing the organic route toward
Is the Agrochemical Industry Traversing the Organic Route Insights and Directions for a Philippine
Agrochemical Trading Company
20
sustainability it has only taken small steps in that
direction Even if customers are clamoring for safe
food and in spite of the trend towards organic
agriculture and sustainability most farmers remain
indifferent toward using biopesticides and other
biologicals in farming on account of their sensitivity to
input prices and demand for more promotional
activities Thus in the next couple of years it is
expected that agrochemicals of a synthetic nature will
continue to dominate the global agrochemical industry
in terms of usage and market share Such a trend is
expected to spill over to Asia including the Philippines
as transnational companies take in a sizeable share of
the market
To survive and compete in the industry agroche-
mical trading companies must employ a number of
strategies such as introduce new brands for each
product type formulate a customer retention strategy
for its dealers and IBPs and pursue market penetration
Lastly in the case of Phil-Agrochemical Trading the
firm should consider CPAP membership and carry out
product stewardship agromedical traininginformation
education campaign and aerial spraying seminars to
enhance its competitiveness in the agrochemical
industry
References
Balayan L M A (2010) An apprenticeship study on
Bayer cropscience Gocus on its thrust towards
sustainable development through its quality health
safety and environment (QHSE) system (Under-
graduate Special Problem Report) Los Banos
Philippines University of the Philippines Los
Bantildeos
Castillo A (2000) A special problem report on Bayer
Philippines Inc (Undergraduate Special Problem
Report) Los Banos Philippines University of
the Philippines Los Bantildeos
Cuyson S (2007 March) Pesticides in sustainable
agriculture and the environment Paper presented
at the 38th annual scientific conference Tagbilaran
Philippines
David F R (2009) Strategic Management Concepts
and Cases (12th ed) Upper Saddle River NJ
Pearson Education
Dussal M (2011) Agrochemicals Retrieved from
httpwwwAgrochemicalInformationand Resour-
ceshtm
Lu J L (2009) Total pesticide exposure calculation
among vegetable farmers in Benguet Philippines
Journal of Environmental and Public Health 2009
Retrieved from httpwwwhindawicomjournals
jeph2009412054
Lum KY Mamat M J Cheah UB Castaneda
CP Rola AC amp Sinhaseni P (1993) Pesticide
research for public health and safety in Malaysia
the Philippines and Thailand Retrieved from
httpwwwnzdlorggsdlmode=d-00000-00-off-
0envl000010000direct-10401l11-en-5020-about-
00010004001110-0utfZz800ampcl=CL13ampd=HAS
H 016be195f7a6257ed84a093544ampgt=1
Palacio E B (2004) An apprenticeship study on the
crop protection division of syngenta corporation
(Undergraduate Special Problem Report) Los
Banos Philippines University of the Philippines
Los Bantildeos
Qin X F amp Kong F B (2006) Prospect and
situation of biopesticides Journal of Anhui Agri-
cultural Sciences 34(16) 4024 4057
The Philippines (1996) Philippine case study a
developing countryrsquos perspective on POPs Paper
presented at the IFCS Meeting on POPs Manila
Philippines Retreived from httpwwwchem
unepchpopsindxhtmsmanexp7html
Tirado R amp Bedoya D (2008) Agrochemical use in
the Philippines and its consequences to the environ-
ment Quezon Philippines Greenpeace Southeast
Asia Retrieved from httpwwwgreenpeacetopu
bliccationsGPSEA_agrochemical-use-in-the-phili
ppdf
Varca L M (2002) Impact of agrochemicals on soil
and water quality Food and Fertilizer Technology
J Glob Bus Trade Vol 9 No 2 (November 2013) 11-21
21
Center Retrieved from httpwwwagnetorg
libraryphpfunc=viewampid=20110804160130
Xu Y Z (2008) The application of biological
pesticides and industrial development measures
Chinese Agricultural Science Bulletin 24(8) 402-
404
Yang J L (2001) Green chemistry and technology
Beijing Beijing University of Posts and Teleco-
mmunications 176-180
Zhang W Jiang F amp Ou J (2011) Global pesticide
consumption and pollution with China as a focus
Proceedings of the International Academy of Ecol-
ogy and Environmental Sciences 1(2) 125-144
J Glob Bus Trade Vol 9 No 2 (November 2013) 23-27
23
ISSN 1946-5130
Journal of Global Business and Trade
wwwiagbtcom
A Study on the Dependency on Japan and the
Competitiveness of Gear Boxes
Kwang Hee Kim
Department of Business Administration Hyupsung University Korea
Received 15 August 2013 Revised 20 September 2013 Accepted 28 October 2013
ABSTRACT
From the trade deficit with Japan in 2012 of 2557 billion USD the trade surplus of material and components
industry was 2223 billion USD in deficit 87 of such trade deficit with Japan came from the material and
components industry
This study is to focus on the competitiveness index of absolute inferiority in automobile components as of
2012 and lsquogear box and other componentsrsquo that are over the trade for each amount of the automobile
components with Japan
Keywords competitiveness index(CI) dependence on Japan gear box industry trade deficit against Japan
Ⅰ Introduction3
As of 2012 Korea accomplished overall exports of
54787 billion USD and imports of 51958 billion USD
and as a result the trade surplus accomplished a
surplus of 2829 billion USD If this is limited to the
material and components industry the global exports
and imports were 25341 billion USD and 16249
billion USD respectively and as a result the trade
surplus recorded a surplus of 9092 billion USD that
the trade surplus exceeded 60 billion USD To put it
differently the present vast trade surplus mainly came
from the trade surplus of the material and components
industry
In the meantime the trade surplus with Japan
(2012) recorded a deficit of 2557 billion USD It was
less than the trade deficit with Japan for the previous
2013 International Academy of Global Business and Trade
All rights reserved
year 2011 (2864 billion USD) but it was attributable
to the decreasing imports from Japan from the
exchange rate with strong Yen and weak Won
currency The vast scale of the trade deficit with Japan
did not happen overnight
For this background the vulnerability of the
domestic material and components industry was the
greatest cause for the aforementioned From the trade
deficit with Japan in 2012 of 2557 billion USD the
trade surplus of material and components industry was
2223 billion USD in deficit 87 of such trade deficit
with Japan came from the material and components
industry
This study is to focus on the competitiveness index
(-091) of absolute inferiority in automobile compo-
nents as of 2012 and lsquogear box and other components
(8708-40-0000)rsquo that are over the trade for each
amount of automobile components with Japan
Through the foregoing the purpose is to analyze the
A Study on the Dependency on Japan and the Competitiveness of Gear Boxes
24
trend of export and import competitiveness on the
material and components industry with Japan and lead
a responsible strategy for improving the trade deficit
with Japan
Ⅱ Trade Surplus and Status
Looking into the global export and import scale of
lsquogear box and other componentsrsquo (2012) exports reached
2528801000 Dollars and imports 1568670000
Dollars as a result the trade surplus reached
1471934000 Dollars Looking into the export and
import scale with Japan on this item for the same year
it recorded the export of 2379 billion USD and import
of 491028 million USD as a result the trade deficit
recorded 467238 million USD
On the other hand the scale of trade deficit (-470
million USD) with Japan for lsquogear box and other
componentsrsquo was applicable for 18 of the entire
trade deficit with Japan (-2557 billion USD) and 21
of trade deficit with Japan for material and components
(-2233 billion USD)
Also looking only at the trade surplus with Japan
for automobile components (-430 million USD) the
trade deficit of lsquogear box and other componentsrsquo took a
high ratio applicable for 1159 that the status of these
item could be shown
Therefore relief from the trade deficit with Japan
by domestic automobile components industry could be
concluded as impossible without an improvement in
the trade deficit of the lsquogear box and other componentsrsquo
For reference from the costs of a completed car
the ratio for the gear box is known to be around 7-8
As such a gear box with a high ratio of production cost
also has the longest quality assurance limit in that it is
the core item for a high added-value to measure the
competitiveness of a complete car
As shown through the comparison with other
indices under the following Fig 1 the import scale
with Japan for the lsquogear box and other componentsrsquo is
very high Furthermore the import dependence of
Japan has declined from 801 in 1988 770 in
1998 597 in 2008 and 465 as of 2012 but the
import dependency on Japan may be assessed as high
Fig 1 Ratio of Gear Box in the Trade Deficit with
Japan (2012)
Source Prepared by the author by facilitating the Korea International Trade Association (2013)
The global export of this item has clear trend of
increase in recent days The trend of increase has been
significantly moderated from 252 million USD in
1988 to 9 million USD in 2000 However it began
with 2865 million USD in 2002 to leap to 6704
million USD in 2004 918 million USD in 2006
27079 million USD in 2008 and 75942 million USD
in 2010 and it increased to 1 billion 4234 million
USD in 2011 twice that of the previous year As of
2012 it has drastically increased to 2528801000
Dollars over 1 billion USD from the previous year that
exports has shown dramatic increase since 2009
In spite of that the exports to Japan of this item
were USD 970000 in 1988 USD 910000 in 1998
942 million USD in 2008 and 2379 million USD as
of 2012 it has seen very little increase for a quarter of
a century
On the other hand imports from Japan were
15506 million USD in 1988 19402 million USD in
1998 72344 million USD in 2008 and 965669
million USD in 2010 but it has plummeted to record
491028 million USD as of 2012 Compared to 2010
imports from Japan dropped less than a half
J Glob Bus Trade Vol 9 No 2 (November 2013) 23-27
25
Fig 2 Trend of Exports and Imports (1988~2012) of Gear Boxes (8708-40-0000)
Source Prepared by the author by facilitating the Korea International Trade Association (2013)
The trade deficit in automobile components with
Japan to this point has been pointed out with a cause of
importation in highly functional and high-tech
components impossible for domestic development
However according to the interview survey result on
the recent domestic automobile industry gear boxes
imported from Japan are mainly for large commercial
vehicles that are made for productivity purposes in
Korea
Ⅲ Price per Weight on Export and
Import Items
In order to consider the problems in lsquogear box and
other componentsrsquo in detail the price per weight price
of export and import items are analyzed for each price
Following is a brief summary of the export and
import scales and the status of gear boxes to Japan As
is well known in the case of Japan the status of gear
box exports and imports were an item with
overwhelmingly excessive exports Based on 2011
exports were 133 trillion Yen (approximately 18
trillion won) with 128 export countries On the other
hand the imports were only 606 billion Yen
(approximately 800 billion won)
The weight price of Japan for gear boxes is
approximately 1880 Yenkg for the gear boxes with a
high price imported as compared to the export product
price of 1500 Yenkg In particular the weight price
for the import item from the first import subject
country the Netherlands was 7380 Yenkg which
was overwhelmingly higher than the second country
the US of 1270 Yenkg Also the weight price of
export items from the US and Europe was around
1500 Yenkg but the import item price was 2000
Yenkg or higher
A Study on the Dependency on Japan and the Competitiveness of Gear Boxes
26
Table 1 Amount per Kg for Global Export and Import of Gear Boxes
Year Export Import
Amount (USD 1000) Weight (kg) USDkg mount (USD 1000) Weight (kg) USDkg
2005 119947 9259951 130 714512 45342883 158
2006 91804 8512492 108 778889 52223376 149
2007 127074 12051377 105 1066938 72512561 147 2008 270795 21068540 129 1212621 72940221 166
2009 307779 25239366 122 900597 53010625 170
2010 759422 58236825 130 1362034 81828230 166 2011 1423403 106723042 133 1405309 78567171 179
2012 2528801 180077148 140 1056867 59809776 177
A total of 8
years Average weight price 1246 Average weight price 1640
Source Prepared by the author by facilitating the Korea International Trade Association (2013)
On the other hand the weight price of imported
items from Korea was less than 1000 Yenkg for the
gear box an affordable price This fact could be
affirmed by the result calculated through facilitation of
the statistical data of Korea International Trade
Association by the author
In 2010 and 2012 the global weight price of export
items of Korearsquos lsquogear box and other components
(8708-40-0000)rsquo was 130 Dollarkg and 140 Dollarkg
respectively the import item price for the same year
was 166 Dollarkg and 177 Dollarkg respectively
There was a difference in weight price of 3 Dollarkg
or more between items of export and import (Table 1)
Looking into the trend of the 8-year period from
2005 to 2012 the weight price of import items was
higher than the export items The average weight price
of global export items for this item for the 8-year
period was 1246 Dollarkg while the average weight
price for the import item was 1640 Dollarkg there
was a unit price difference of 4 Dollarkg
Thereafter the weight price of the export item to
Japan for the above items in 2010 and 2012 was 81
Dollarkg and 74 Dollarkg respectively while the
import item price was 158 Dollarkg and 160
Dollarkg respectively there was a two times weight
price difference between the export and import items
(Table 2) Looking into the period of 2005 - 2012 for
the above the import items to Japan had a higher
weight price than the export items In addition the
average weight price of the export items for 8 years
was 1105 Dollarkg while the average weight price of
the import item was 1509 Dollarkg there was
approximately 4 Dollarkg or more of price difference
In addition the export amounts to Japan for 2010
and 2012 were 81 Dollarkg and 74 Dollarkg It
declined 4 Dollarkg or more compared to 2009 which
is considered as attributable to diverse types of gear
boxes exported with a drastic increase of exports to
Japan in these two periods
Characteristics of export and import items to the
world and Japan on the gear box and other components
(8708-40-0000) have a higher average weight price in
export and import to Japan than the export and import
items to the world have a higher average weight price
than the import items to Japan
Furthermore when comparing the weight price for
exports and imports to the world and Japan on this
item the import items were higher than the export
items To interpret it differently it is proof that the
export of the gear box had lower added value than the
imported items
J Glob Bus Trade Vol 9 No 2 (November 2013) 23-27
27
Table 2 Amount per Kg for Exports and Imports of Gear Boxes with Japan
Year Export Import
Amount (USD 1000) Weight (kg) USDkg mount (USD 1000) Weight (kg) USDkg
2005 14004 1010821 139 444022 29443945 151
2006 10124 805067 126 531454 38286910 139
2007 10180 845554 120 725042 55581305 130 2008 9420 708144 133 723444 49337793 147
2009 9235 743895 124 628173 39923189 157
2010 11075 1361065 81 965669 61103817 158 2011 19866 2284696 87 812394 49161068 165
2012 23790 3225976 74 491028 30683013 160
A total of 8
years Average weight price 1105 Average weight price 1509
Source Prepared by the author by facilitating the Korea International Trade Association (2013)
Ⅳ Conclusions
The following is the summary of contents shown
through the analysis of the lsquogear box and other
componentsrsquo
First the above items have shown a drastic
increasing trend for global export after 2009 but
export to Japan was still in a minimal increasing trend
close to horizontal line even as of 2012
Second characteristics of export and import items
to the world and Japan showed a higher average
weight price of export items to Japan than the export
items to the world and the import items from the
world had a higher average weight price than the
import items from Japan Also when comparing the
export and import weight prices with the world and
Japan for the above item the import items had a higher
rate than the export items To put it differently the
export of gear boxes was proven to have lower added
value than the import items
Lastly a brief mention was made on the direction
of the lsquogear box and other componentsrsquo
The recent assembly processing technology has
become standardized globally while the material and
components technology have been monopolized by
some advanced countries including Japan Because of
the foregoing the foreign currency earned from the
global market was turned over to Japan and the added
value for Korean industry has not been significant at all
Furthermore if the import of core material and
components such as lsquogear box and other componentsrsquo
is dependent on a specific country there is possible
subordination in the industrial structure with a high
possibility of losing the initiative in production and
price
Purchasing core material and components from
Japan was inevitable in the economic growth process
of Korea in the past but the time has come to make a
great change in the domestic industry
References
Grubel He G amp Peter L (1975) Intra-industry
trade The theory and measurement of interna-
tional trade in differentiated products London
UK MacMillan
Kim Kwang-Hee (2008) The competitiveness of
domestic auto parts industry against Japan The
Korean-Japan Journal of Economics amp Manage-
ments Studies 41
Kim Kwang-Hee (2013 June) A study on the
dependency on Japan and competitiveness of gear
box Paper presented at the 10th annual conference
and research symposium Mongolia National
University Mongolia
Korea International Trade Association (2013) Trade
statistics data Retrieved from httpwwwkitanet
J Glob Bus Trade Vol 9 No 2 (November 2013) 29-34
29
ISSN 1946-5130
Journal of Global Business and Trade
wwwiagbtcom
The Nature of Competition in an Indian Market Focusing on
the Volume Zone
Tirtha Bahadur Karki
Graduate school of Asian and International Business Strategy Japan
Received 14 June 2013 Revised 12 September 2013 Accepted 2 October 2013
ABSTRACT
Emerging countries are playing a growing role in the world economy It is a role that is expected to be even
greater in the future The recent global financial and economic crisis has further emphasized the stagnation of
most developed economics and taken prominence in emerging economics In particular China and India play
a significant role as global markets Henceforth it is estimated that the Indian volume zone will expand
rapidly and steadily On the other hand Japan and other developed economies tend to be sluggish Therefore
Japanese multinational corporations may have to target Indian volume zone consumers To do so they are
required to change their strategy management and production systems to compete with local and international
rivals in the market because the nature of the competition is totally different in an Indian market than other
developed country However definitions of the volume zone differ among research institutions researchers
countries and urban and local areas which creates considerable differences in the size of markets Thus in
this paper the literature review summaries and compares the definitions of the volume zone first Second this
paper tries to Fig out the most important part of the volume zone which has a key role in making a business
strategy Third differences between developed markets and the Indian market are examined and the nature of
competition in the Indian market is argued Finally the main argument and implication are stated
Keywords competition developed market emerging market Indian market strategy volume zone
Ⅰ Introduction4
There is very significant global interest in the
Indian economy Along with China Brazil Indonesia
and a few other countries India promises great potential
of growth in the next few years and decades The
future of the Indian economy is thus a significant
concern among the global financial and business
community economic policy-makers and managers
multilateral financial institutions economists and
2013 International Academy of Global Business and Trade
All rights reserved
other academics as well as investors and consumers in
India The significant global interest in India is not
surprising It is well known that - on a purchasing
power parity basis ndash India is already at over USD
four trillion of GDP the fourth largest economy in the
world very close to the size of the Japanese economy
the third largest In the next 15 to 18 years this size is
expected to grow as per various studies and estimates
four to five times As a result many foreign investors
and a majority of global companies and businesses are
making a beeline for the Indian market which
The Nature of Competition in an Indian Market Focusing on the Volume Zone
30
promises a booming volume zone5 of a few hundred
million consumers (Fig 1) expanding steadily in the
next few decades
Fig 1 Shares of Global Middle Consumption
2000-2050
Source Kharas (2010)
On the other hand advanced economies including
Japan are slowing down Japan has been in a long
recession with a real GDP growth rate of 39 in 2010
It underlines the world economy shift from developed
nations with their huge populations rising household
incomes and expansion of consumer goods and
service markets toward the emerging economies6
From these perspectives the expansion of the
Indian volume zone has attracted considerable
attention Many Japanese firms have already adjusted
their strategy management and production systems in
order to compete with the Indian volume zone
However there are no official definitions of volume
zone7 and these definitions differ among research
institutions researchers countries and urban and local
areas This creates considerable differences in the size
of volume zone markets Thus the literature review
summarizes and compares the definitions of volume
zone arguements After identifying the important part
of the volume zone (what is the volume zone what is
the trend of the volume zone etc) this paper argues the
differences between developed markets and the Indian
5 It is also called middle class middle income class and
middle income In this paper the middle class is identified as volume zone
6 The countries and consumers team 2010
7 Eric D et al (2007) Kharas (2011)
market which is very useful in knowing the nature of
competition in the Indian market Finally the main
argument and implications are stated
11 Definitions of Volume Zone
There are various definitions of volume zone based
on annual household disposal income annual
household income and expenditure Since the
definition of volume zone is not standardized with
each countryrsquos factors it remains uncertain Thus we
need to define and examine the Indian volume zone
which is most important in order to Fig out a business
strategy
12 Annual Household Disposable Income
The Ministry of Economy Trade and Industry
(2010) Aoshima Kubota and Sakamoto (2009) Japan
research institute (2010) Mizuho Research Institute
(2010) and Yanagawa and Mori (2010) defined the
Asian volume zone including that of India as
comprising people whose annual household disposa-
ble incomes range between $5000 and $35000 (upper
middle class $15001-35000 lower middle class
$5001-$15000 lower class $1000-$5000 the poor
up to $1000) and the rich as those whose annual
household disposable incomes exceed $35000 On the
other hand Indiarsquos National Council of Applied
Economic Research (NCAER report 20052006)
defined the Indian volume zone as comprising people
whose annual household disposable incomes range
between $22320 and $4444 (Rs1000000-Rs200000
at 20012002 price)
Comparing these two definitions of volume zone
(Fig 2) the former defines that the annual household
disposal incomes of people in the volume zone tends to
be higher at $5001 to $35000 and the latter defines
that the incomes of people in the volume zone tends to
be lower at $4444 to $22320
J Glob Bus Trade Vol 9 No 2 (November 2013) 29-34
31
Fig 2 Definitions of Volume Zone by Annual
Household Disposable Income
13 Annual Household Incomes
First the World Bank (2007) and Milanovic and
Yitzhaki (2002) defined the global volume zone as
those with annual household incomes between the
mean incomes of Brazil and Italy that is an annual per
capita income of approximately $4000-$17000 (at
2000 purchasing power parity (PPP)) Second Bhala
(2009) adopted an absolute approach definition with
an annual per capita income of $3900-$113000 in
PPP terms Third Court and Narasimhan (2010)
divided the consumers of developing countries
including India into the following classes on the basis
of their annual household incomes global class
$113000 and above upper middle class $56500-
$113000 middle class $22500-$56499 lower
middle class $13500-$22499 and deprived class
below $13500 From this distribution the middle class
is defined as those with an annual household income of
$13500-$113000 in PPP terms
In order to compare these definitions Fig 3
presents the minimum and maximum annual incomes
that were specified by various researchers Bhala (2009)
specified the minimum annual income as $3900
which is much lower than that specified in other
definitions
Fig 3 Definitions of Volume Zone by Annual
Household Income
14 Expenditure
Some researchers defined the volume zone on the
basis of expenditures In 2007 Banerjee and Duflo
(2007) defined it on the basis of per capita expenditure
between $2-$4day In 2008 they defined the global
volume zone on the basis of per capita expenditure of
$2-$10day in 1993 PPP (Banerjee amp Duflo 2008) On
the other hand Ravallion (2010) defined it on the basis
of per capita expenditure between $2-$13 day Both of
these expenditure based definitions are used only in
emerging economies
Fig 4 Definitions of Volume Zone by Expenditure
These two definitions also show differences since
the higher bound is $10day and $13day In summary
the volume zone is defined differently on the basis of
various standards locations and economies Owing to
its complexity and variety the volume zone consumersrsquo
jobs incomes consumptions lifestyles and subjective
The Nature of Competition in an Indian Market Focusing on the Volume Zone
32
consciousness of the levels of society must also be
considered for defining the Indian volume zone
Ⅱ Catching the Trend
In order to consider the differences between the
definitions of volume zone this paper argues about
most important part of the volume zone to make a
better strategy in business The management team in
business must know about the volume zone but
$3900 or $4000 (Fig 3) in annual household income
does not make a vast difference in its strategy and
consumers lifestyle In relation to the poor by
associating it with an ability to choose to spend time
and money on something other than survival consider
the volume zone in the case of Indian markets where
estimates range from 30 million to approximately 300
million people
The volume zone is not (yet) the biggest segment
of Indiarsquos overall population Given all the attention
focused on Indiarsquos middle class in recent years it is
important to keep a proper perspective on its size and
potential purchasing power Even using the most
generous estimates of the grouprsquos size the volume
zone comprises less than 30 percent of the population
Thus the rich and the poor combined far outweigh the
Indian middle class The importance of the middle
class lies in the fact that it is the fastest growing
segment of the population Evidence shows that as
income increases the amount and variety of this
discretionary spending increases For corporations the
middle class in India thus presents significant business
opportunities The sales growth of consumer goods
such as televisions and mobile phones to the middle
class has already been established Given the
tremendous growth potential an increasing number of
products are being geared towards the volume zone
population In the transport industry which has
traditionally been dominated by rail travel newer cars
like the Tata Nano (which retails for a little over USD
3000) and low-cost airlines have enabled the volume
zone population to be increasingly mobile The growth
of the volume zone and the economic growth of India
are in a virtuous cycle Rising incomes lead to more
consumption which in turn leads to higher economic
growth then more employment opportunities and
subsequently higher wages and the circle starts again
Thus as the volume zone grows and continues to
increase domestic demand the economy will also
continue to grow Regardless of which definition is
correct and certain it is important to keep a proper
perspective on the potential of the volume zone The
volume zone in India has generated tremendous
interest from the media and multinational corporations
are looking for a new market demographic
Ⅲ Developed Markets and the Indian
Market
In recent years Indiarsquos market growth has
outstripped the developed markets In the 80s GDP
growth in developed nations and India was essentially
the same Between 2000 and 2010 average growth in
the Indian market rose to the point where it was three
times higher Besides this India has corruption less
infrastructure fare of terrorism and etc which are
abnormal in a developed country
Consumers in India tend to be more ethnocentric
than those in developed ones Products from the
western hemisphere are seen by Indian cultures as
carrying western values that might harm their society
as well as the local workforce In developed countries
price quality durability and other product-related
aspects are the major factors that influence buying
decisions Consumers in India tend to be less indivi-
dualistic than in developed ones They care more for a
larger local community and like to be identified as part
of it Advertising which exhibits local values and
traditions has a greater impact on consumers of India
whereas the more individualistic consumers from
developed countries are more influenced by adverti-
sing where the product differentiates itself specifically
from other products in the market
J Glob Bus Trade Vol 9 No 2 (November 2013) 29-34
33
These are the common differences between the
Indian market and developed markets Besides these
there are lots of differences between Indian markets
and developed markets
A survey held by the Graduate School of Asian
and International Business strategy8 in October 2011
on the title of ldquoEntry Strategy of the Japanese Firms in
India and Chinardquo shows that Japanese firms in India
are going to change their target from the upper
(wealthy) class to the Volume Zone (Fig 5) In 2011
581 percent of the Japanese firms replied that they are
targeting upper class customers in India By the way
the survey shows only 274 percent of firms were
targeting the upper class after 3 years (2014) and more
firms targeted the middle class Thus we can
understand the Japanese strategies are shifting from the
upper class to the Volume Zone
Fig 5 Shifting Strategy in India
Ⅳ Conclusion
Thus it is clear that the Indian volume zone is
expanding and Japanese companies are shifting their
strategy from the upper class to the volume zone The
problem is the presence of Japanese companies in the
Indian market where Japanese companies are domi-
nated by Korean and European-American companies
8 Principle of Asia University DrIkejima Masahiro
leads the survey
According to Shintaku and Amano (2009) develo-
ped countriesrsquo firms have more strong technology and
find it more difficult to target the volume zone of
emerging markets and to adopt the strategy locally
There is no room to think about if the strong tech-
nology of a company is harmful for its strategy in
emerging markets The problem is how to approach
the volume zone and this is important Specially the
volume zone comes from the lower class and
companies should know their lifestyle and behavior If
firms understand the value of money for the volume
zone they can easily shift their strategy too This helps
them succeed in the Indian volume zone
Finally the conclusion of this paper presents the
hypothesis for further research about how to approach
the volume zone of India The hypothesis is (Fig 6)
ldquoTo compete successfully in the Indian volume zone
firms need to catch the trend of the volume zone and
educate customers construct market infrastructure
train management personnel and understand the
abilities of the supply side are essential This is why
they need to cultivate their resources at a lower level
than they are targeted (volume zone)
This paper cannot include the case study and
cannot examine the strategy That will be further
researched by this author in the future
Fig 6 Possible Way to Succeed in the Volume
Zone of India
The Nature of Competition in an Indian Market Focusing on the Volume Zone
34
References
Akihisa Yahata (2012) IndiaASEAN business guide
Two challenges of market creation in emerging
countries Tokyo Japan Research Institute
Retrieved from httpwwwjricojppagejspid=
22012
Aoshima Minoru Kubota Yosuke amp Sakamoto
Ryohei (2009) Manufacturing for emerging eco-
nomics that has entered the second stage Learning
to emerging economics strategy of electronics
industry focused on the middle of the economic
pyramid Knowledge Creation and Integration
17(12) Nomura Research Institute Retrieved from
httpswwwnricomjpopinionchitekishisan2009
pdfcs20091208pdf
Banerjee A V amp Duflo E (2008) What is middle
class about the middle classes around the world
The journal of economic perspectives a journal of
the American Economic Association 22(2) 3
Bhalla S (2009) The middle class kingdom of India
and China Wasington DC Peterson Institute for
International Economics
Court D amp Narasimhan L (2010) Capturing the
worldrsquos emerging middle class The McKinsey
Quarterly 1-6
Dyck S Hansakul S amp Saxena R (2009)
Emerging Asiarsquos middle class-A force to be
reckoned with (eSocialSciences Working Paper
No 2232) Retrieved from httpeconpapersrepec
orgRePEcesswpaperid2232
Eric D B Diana F amp Adil S Z (2007) Tracking
the growth of Indiarsquos middle class The McKinsey
Quarterly 51-61
Japan Research Institute (2010 October) Chinarsquos eco-
nomic policy debate heats up in run up to party
congress Asia Monthly 10(115) 1-15
Kharas H (2011 June 13) India China middle class
boom faces many challenges FIRSTPOST
Retrieved from httpwwwfirstpostcomworld
china-india-middle-class-boom-24637html
Milanovic B amp Yitzhaki S (2002) Decomposing
world income distribution Does the world have a
middle class Review of Income and Wealth
48(2) 155-178
Ministry of Economy Trade and Industry (2010)
White paper on international economy and trade
2010 Tokyo Author
Mizuho Research Institute (2010) Japan companies
deviating from volume zone market of China and
India (Mizuho Report) Tokyo Author Retrieved
from httpwwwmizuho-ricojppublicationresearch
pdfreportreport10-0407pdf
National Council of Applied Economic Research
(2005) Annual resport 2005 Retrieved from
httpwwwncaerorgdownloadsannualreportsan
nualreport_2005pdf
Shintaku Junjiro amp Amano Tomo (2009) Emerging
market strategies changes in market and resource
strategies The Journal of Economics 75(3) 40-62
Syusuke Watanabe Tokutaro Hiramoto amp Naoya
Tsuaaki (2012) Developing BoP business as the
principal strategy in 70 trillion of emerging and
developing economics Paying the road to a new
market that is expected to reach 55 billion people
Knowledge Creation and Integration 20(1)
Nomura Research Institute Retrieved from
httpswwwnricomjpopinionchitekishisan2012
pdfcs20120103pdf
Shukla R (2010) How India earns spends and saves
unmasking the real India New Delhi India
SAGE Publications India
Ravallion M (2009) The developing worldrsquos bulging
(but vulnerable) ldquomiddle classrdquo World Development
38(4) 445-454
Sridharan E (2004) The growth and sectoral
composition of Indiarsquos middle class Its impact on
the politics of economic liberalization India
Review 3(4) 405-428
Yanagawa Noriyuki amp Mori Naoko (2010) Income
bracket towing Asiarsquos domestic demand (NIRA
Monograph Series No 31) Tokyo National
Institute for Research Advancement Retrieved
from httpwwwniraorjppdfmonograph31pdf
J Glob Bus Trade Vol 9 No 2 (November 2013) 35-44
35
ISSN 1946-5130
Journal of Global Business and Trade
wwwiagbtcom
Analysis of Public Health Expenditures on Leading Causes of
Morbidity in the Philippines
Paul Joseph B Ramireza and
Earl Joanne S Santos
b
b College of Economics and Management University of the Philippines Los Bantildeos Philippines b Corresponding Author College of Economics and Management University of the Philippines Los Bantildeos Philippines
Received 21 August 2013 Revised 25 September 2013 Accepted 29 October 2013
ABSTRACT
Provision of public goods and services is one of the major roles of the government in an economy Some of
the public goods and services that are being provided cause negative effects while others create positive
externalities One evident case of such is the market for health care Aware of its role to provide health care to
the people governments are even more challenged with the remarkable growth of the demand for health care
Furthermore there are market failures existing in the health care sector Given that the paper examined the
effects of public spending on health care specifically on the principal causes of morbidity in the Philippines
Aside from public spending the paper also took into account private health spending in the analysis The
study employed a pooled ordinary least squares regression model Results showed that the increase in
government spending significantly reduce the number of tuberculosis cases in the Philippines On the other
hand results for diarrhea indicated that public spending and number of diarrhea cases are positively related
The findings imply that although an increase in public health expenditures can have a significant impact on
the number of cases of diseases lowering tuberculosis cases for instance the study can be further extended by
valuing as well the other benefits that can be derived from a prevented sickness resulting from an increase in
public health expenditures
Keywords health care morbidity positive externalities public goods public health expenditures
Ⅰ Introduction9
Economics texts suggest different extents to which
the government can intervene in market activities
Classical economists advocate that the main and in
some instances only role of the government is to
ensure peace and order in the economy ie ensuring
property rights are properly defined and laws and
policies are well-enforced Keynesian economists on
the other hand believe that the government has a
2013 International Academy of Global Business and Trade
All rights reserved
significant role as Keynes demonstrated during the
Great Depression At present different economies adopt
different blends of the two extreme cases However
common to all economies is the need for government
intervention in the presence of market failures and
missing markets given that the government can do
better than the market ie such intervention will not
lead to government failures resulting in further
inefficiencies
It is a known fact that one of the major roles of the
government in an economy is the provision of public
goods Paying no attention to it would result in under-
Analysis of Public Health Expenditures on Leading Causes of Morbidity in the Philippines
36
provision of such goods or worse not being provided
at all due to the free-rider problem Another widely
acceptable role of the government is to provide goods
or services that create a positive externality to the
society These goods or services are usually socially
underprovided since the individual in hisher own
private desire to maximize utility doesnrsquot consider the
beneficial effects to the society of such activities
Examples of such services are education and health
care This paper will provide a general overview of the
global demand for health care then focus on the role of
the government in health care provision in the
Philippines
Ⅱ Global Demand for Health Care
The concern for health is a global phenomenon
Despite the costs of health care services the demand
for health care is growing everywhere in the world
The surge of aging and chronic illnesses in the
developed countries and the shooting requirements of
the rising middle class accompanied by the lsquodiseases
of prosperityrsquo in the developing countries are all
driving demand Global pandemics that threaten the
world as well as environmental changes that cause
dramatic health care challenges are also adding up in
the demand for health care services
The rising demand for health care is evidenced by
the increased spending on health services The worldrsquos
total health expenditure as a percentage of Gross
Domestic Product (GDP) grew by 15 from 82 in
2000 to 94 in 2009 (Table 1) The American region
posted the highest growth in health expenditure as a
percentage of GDP at 26 while the South East
Asian region showed the least at 2 The growing
expenditure on health services are born from both the
public and private Public spending on health care is at
least about 50 for most of the countries The
spending has likewise grown by two percentage points
in excess of GDP growth across all Organization for
Economic Co-operation and Development (OECD)
countries for almost 50 years and is expected to be
more than a fifth of GDP by 2050 if the current trend
persists (Drouin et al 2008) As a result government
health agencies together with patients and health care
companies particularly in developing economies are
alarmed with the growth of health care spending
Given its current share of health care expenditures the
government is confronted with other increasing
demands of its people such as education defense and
pensions aside from demand for health care and the
escalating prices of health services
Table 1 Health Expenditure Ratios 2000 and 2009
Region
Total
expenditure on health
as of gross
domestic product
General government
expenditure
on health as of total
expenditure
on health
Private
expenditure on health
as of total
expenditure on health
General government
expenditure
on health as of total
government
expenditure
External
resources for health as
of total
expenditure on health
Social security expenditure on
health as of
general government
expenditure on
health
2000 2009 2000 2009 2000 2009 2000 2009 2000 2009 2000 2009
African Region 55 65 439 493 561 507 82 96 65 102 79 70
Region of the Americas 114 144 451 493 549 507 145 169 01 01 317 720
South-East Asia Region 37 38 319 371 689 629 44 49 09 16 133 144 European Region 80 93 739 749 261 248 140 146 01 01 522 495
Eastern Mediterranean
Region 42 47 472 509 528 491 69 71 10 11 184 194
Western Pacific Region 60 65 639 644 361 356 138 144 02 02 681 686
Global 82 94 563 591 437 408 133 143 03 04 451 595
Source World Health Organization (2012)
J Glob Bus Trade Vol 9 No2 (November 2013) 35-44
37
Moreover health care expenditures are signify-
cantly associated with improved health outcomes with
public health care expenditure having a larger impact
(Navignon et al 2012) Hence health care expendi-
tures are vital to improving the health status of the
society Relatedly Hurley (2000) stated that ldquothe
market failures that pervade the health care sector
create an important role both for non-market
institutions and for normative economic analysis to
help sort the ldquogoodrdquo policies from the ldquobadrdquo Thus
from a public policy perspective it is valuable to know
how a policy variable like public expenditures on
health care affects the principal causes of morbidity
rates
Ⅲ Status of Public Health
Expenditures in the Philippines
Public health expenditures include current and
capital spending from government budgets external
borrowing and grants and social health insurance
funds (HDR 2007) Although Fig 1 shows that the
budget allocated for public health care in the
Philippines is increasing in the past few years Fig 2
shows that compared to other Southeast Asian
countries the Philippines is actually way behind in
terms of public health care spending as percent of GDP
As a matter of fact according to the Human
Development Report (2007) the Philippines is one of
the countries around the world with the lowest
percentage ( of GDP) spent on public health
expenditure at 14 This current condition would
have a significant impact on the health and ultimately
the over-all productivity of the members of society
For instance the results of the study of Granlund (2006)
indicated that public expenditures on health care have
an effect on the number of absence days of individuals
Furthermore the results showed a positive causality
between health care expenditures and the health of the
society (Granlund 2006)
Sources Department of Budget and Management (2001-
2009)
Source Asian Development Bank (2008)
Since the budget for health is much less in the
Philippines as compared to most countries (and can be
safely assumed to be inadequate) the paper would
want to look at the impact on morbidity incidences
from increasing the current public spending on health
Though the study will just be limited to measuring the
impact on morbidity the results can then be used to
derive the value to society of higher public
expenditures in terms of less people afflicted or
infected by various diseases Unlike in the situation
where the public health care expenditure is already
sufficient (or optimal) it will be much easier to
estimate the external cost of inadequate public health
expenditure by measuring the forgone benefits (say it
resulted to an absence) from those people who were
infected In addition the results of the study could be
used to measure the externalities valued in terms of
cost savings if the spread of the disease was prevented
Analysis of Public Health Expenditures on Leading Causes of Morbidity in the Philippines
38
Ⅳ Leading Causes of Morbidity in the
Philippines
Morbidity may be referred as the state of poor
health the degree or severity of a health condition or
an incidence of a disease In the case of the Philippines
the leading cause of morbidity is pneumonia with an
incidence rate of 718 (per 100000 population) Table 2
shows the top ten leading causes of morbidity in 2007
while Fig 3 shows the trend in the number of cases in
the past few years for the major causes of morbidity
Table 2 Ten Leading Causes of Morbidity
Philippines 2007
Disease Number
of cases
Rate per
100000 population
ALRI and Pneumonia 605471 718
Acute Watery Diarrhea 539701 640 BronchitisBronchiolitis 487302 5778
Hypertension 398538 4726
Influenza 349609 4146 TB Respiratory 114714 136
Diseases of the Heart 31331 372
Dengue Fever 23773 282 Malaria 23207 275
Chickenpox 23090 274
Source Department of Health (2002)
Source Department of Health (2002-2007)
From Fig 1 and Fig 3 it seems that the increasing
public health care expenditures didnrsquot lead to a
significant decrease in the leading causes of morbidity
in the past few years However we cannot conclude
this immediately since there are other factors affecting
the number of cases like private health care
expenditures and population growth These other
variables would be considered later in analyzing the
impact of public health care expenditures on the
number of cases
Ⅴ Characteristics of Health Care
According to Hurley (2000) health care is distinct
from other commodities because of health care having
a combination of features that is only present
individually in other commodities Most of these
characteristics result in market failure or missing
markets causing inefficiencies like in the presence of
externalities information asymmetry and uncertainty
In each of these characteristics the government may be
able to minimize the inefficiencies resulting from these
market failures through public expenditures on health
care (which can be looked at as the policy variable of
the government) This somehow justifies the need for
government intervention on health care as a response
to these characteristics of health care
Though it is desirable to be able to disaggregate
public health expenditure as an answer to each of these
characteristics of health care it will not be easy as
policies on public health care usually answer the
inefficiency problem as a whole Thus the study
would focus on the rationale for public health care
expenditure as it provides a positive externality to the
society
51 Health as a Merit Good
A merit good is a good or service that is regarded
as desirable by the society such that the government
intervenes in its provision The idea is that these goods
and services provide positive externality to the society
and if left to individuals would tend to be under-
provided Thus the government can intervene to
correct this under-provision Common examples of
these merit goods are spending on public services such
as public education and public health care
In general the external benefits from health care
can be looked at in various ways According to Hurley
(2000) people may derive external benefit from
knowing that others receive the needed health care
J Glob Bus Trade Vol 9 No2 (November 2013) 35-44
39
services and not just any health care that a person can
afford In addition the externality from health care can
be looked at as the measure of joy (or prevention of
pity) caused by seeing a healthy person rather than a
sick one The problem however with this valuation of
the externality is that such joy or pity cannot be easily
quantified
An alternative way of looking at the positive
externality provided by the adequate (optimal) amount
of spending on public health would be the cost savings
from those who would have been affected if such
public health expenditures were not adequate (optimal)
The obstacle though is finding these cost savings if the
optimal amount of health expenditures is already in
place This is because one cannot predict who among
the millions or billions of people would have been
externally affected if the existing public health
expenditures were not in place In the case of countries
where public health expenditure is still inadequate we
can analyze the cost savings by looking at the effect of
an increase in public health expenditures on the people
who are currently experiencing diseases which may
have been prevented if the optimal level of expenditure
was in place
52 Prevention versus Cure
It is important to consider that the positive exter-
nalities from having optimal health expenditures can
be realized if such expenditures may have prevented
the spread of a communicable disease Thus if most of
the health expenditures were rather used for cures then
these positive externalities as we defined earlier
would not be realized to the fullest It is still important
to take note that cures also result in a positive
externality since it prevents the further spreading of the
disease given the carrier of the disease is cured as soon
as possible The government expenditures on disease
prevention and control and for infectious disease
prevention and control are exhibited in Fig 4 and Fig
5
Sources Department of Budget and Management (2002-
2009)
Sources Department of Budget and Management (2002-
2009)
Note that the sudden increase in the budget
allocated in both Figs during the 2008 and 2009 was
due to the Intensified Disease Prevention and Control
program introduced during 2008 This almost doubled
or tripled the budget allocation to these items as
compared to years before 2008 It is then desirable to
be able to see the impact of this significant increase in
the public health expenditures on the number of cases
however the data on the number of cases for 2008 is
not yet available
53 Communicable versus Non-
communicable Diseases
Externalities provided by the adequate amount of
spending needed for health care is more apparent in the
presence of communicable diseases In addition to the
general external effects discussed earlier communi-
cable diseases have additional external effects via the
probability of a healthy person being infected by the
Analysis of Public Health Expenditures on Leading Causes of Morbidity in the Philippines
40
person carrying a communicable disease Public
health expenditure may then lower this possibility of
infection to healthy people by providing health care for
people who cannot afford the needed medication
The situation under communicable diseases some-
how distorts the utility maximization problem of
individuals since the presence of a sick person implies
a higher chance of being sick also and thus lowers the
utility of the individual This external effect as pointed
out earlier would cause inefficiency if not recognized
Even though the benefits from societal prevention and
cure of communicable diseases are known the
problem changes to what we know as the free-rider
problem if individuals are left alone to solve the
problem
As we all know voluntary contribution would not
solve the problem due to the free-rider problem Free-
riding would be evident since contribution to
prevention doesnrsquot assure the contributor that he will
be the one that will be saved from the disease ie with
the prevention measures we assume that the infected
individuals will be much less but this doesnrsquot
specifically tell who these individuals are Since this is
the case a person may claim that he doesnrsquot need
prevention measures anyway since with or without the
prevention measure his final state will just be the same
(ie two extreme cases very healthy that in the end he
will be healthy or very vulnerable that heshe will
always be affected anyway) It is likewise possible that
people rather than donate may just choose to put this
prevention contribution into private health expendi-
tures by buying vitamins that give additional protection
or immunity This is the reason why public health
expenditure is essential in the case of communicable
diseases
We can then expect a more significant impact of
higher public expenditures on health care on the
number of communicable diseases as compared to
non-communicable diseases because of the additional
benefits from prevented infection Also we can expect
that public expenditures on health will have a lower
impact as compared to private health expenditures on
non-communicable diseases The paper would then
verify these hypotheses
Ⅵ Sources of Data and Analytical
Procedure
61 Sources of Data
The data used in the study were from various
national survey results gathered by various depart-
ments and agencies of the government Data for the
leading causes of morbidity and the number of cases
every year were taken from the Field Health Service
Information System (FHSIS) Annual Report The
FHSIS Annual Report reflects the activities and health
program accomplishments of the Department of
Health in the Philippines for a given year and serves as
a reference for planning and decision-making at the
local and national levels (FHSIS 2004) The FHSIS
also contains statistics on health systems health status
health services coverage and notifiable diseases in the
Philippines For the purposes of this study the data
utilized were the number of cases per region and per
year of the leading causes of morbidity in the
Philippines such as bronchitis tuberculosis influenza
hypertension and diarrhea
Data on Philippine government health care expen-
ditures were taken from the National Expenditure
Program (NEP) The NEP is an annual publication by
the Department of Budget and Management that
contains the details of the governmentrsquos proposed
program and intended to assist Congress in the review
and deliberation of the proposed national budget for
the legislation of the annual appropriations measures
for the succeeding fiscal year (NEP 2003) Annual and
per region data on public health expenditures were
elicited from the national government budget allocated
to the Department of Health Though it is desirable to
be able to split the expenditures into preventive and
curative measures the available data did not have such
information at the regional level
Data on household (private) expenditures for
health care were obtained from the Family Income and
J Glob Bus Trade Vol 9 No2 (November 2013) 35-44
41
Expenditure Survey (FIES) The FIES is a nationwide
survey of households undertaken every three years by
the National Statistics Office that contains data on
family income and expenditure such as levels of
consumption by item of expenditure as well as sources
of income in cash and in kind and provides
information on the levels of living and disparities in
income of Filipino families (FIES 2006) The study
utilized regional data on the average household
expenditure on medical care Data on the population
per region were also taken from the FHSIS Annual
Report while data on the number of households were
taken from the FIES
62 Analytical Procedure
As stated above it is not enough to just look at the
trends of morbidity cases and public expenditure to be
able to assess the impact of the latter to the former
There are other variables such as private health
expenditures and population at that period of time that
may also significantly affect the number of cases The
paper used a pooled ordinary least squares regression
model to analyze the impact of public health care
expenditures on the number of cases for the major
causes of morbidity in the Philippines from 2002-2006
across regions The model is given by
cases = f(pop privexp pubexp) where pop ndash regional population
privexp ndash average household expenditures
on health
pubexp ndash public health expenditures (lsquo000)
It is hypothesized that there is a positive relation-
ship between the number of cases and population On
the other hand a negative relationship between both
private and public expenditures and the number of
cases is expected
Ⅶ Results and Implications
71 Results and Discussion
Results from the empirical models of the different
morbidity causes are reported in Tables 3 and 4 Notice
that only the results for tuberculosis and diarrhea were
reported since neither public nor private expenditures
on health were able to explain the variation in the
number of cases for bronchitis pneumonia influenza
and hypertension
Table 3 Regression Results for Tuberculosis Cases
variable Coefficient standard error p-value
pop 00018028 00001077 0000
privexp -06158907 02659049 0023 pubexp -00059089 00024357 0018
constant 2103315 8129887 0012
Note highly significant at 1 significant at 5
711 Tuberculosis
The regression result showed that the model is
significant and was able to explain 87 of the
variation in tuberculosis cases based on the computed
adjusted R-squared Public and private expenditures on
health care were found to be significant (at 5) in
explaining the variation in the number of tuberculosis
cases while population was found to be highly
significant (at 1) The results conform to the
hypotheses that an increase in both public and private
spending on health care would result to a decline in the
number of tuberculosis cases Also an increase in the
population results in an increase in the number of cases
which was also expected
Estimates showed that on the average an increase
in the population by 555 increases the number of
tuberculosis cases by one Results also showed that an
increase in public health expenditures decreases the
number of tuberculosis cases Specifically the
estimated coefficient implies that on the average an
increase in public health expenditures by PhP169236
would lead to a one unit decrease in the number of
tuberculosis cases With the PhP16 billion total budget
for health in 2006 (PhP154 million of which was
allocated for tuberculosis prevention and control) an
additional 1 increase in government health expendi-
tures would approximately reduce the number of
tuberculosis cases also by 1 for the same year at the
Analysis of Public Health Expenditures on Leading Causes of Morbidity in the Philippines
42
country level In addition estimates showed that an
increase in the average household private expenditure
on health by PhP162 would result in a unit decline of
tuberculosis cases The value seems low at first glance
but this translates to a total of PhP166 million
spending on health for the household sector from the
174 million Filipino families across 17 regions in
2006 necessary to reduce tuberculosis cases by one
Interestingly public health expenditure seems to be
less costly in terms of preventing tuberculosis cases in
the country This is due to the fact that majority of
tuberculosis cases are experienced by poorer
households that rely more on public health care rather
than private health care which they cannot afford
Public health expenditures are also ideal for
tuberculosis cases because of the ancillary benefits
these provide by preventing the spread of this
communicable disease among the population
Table 4 Regression Results for Diarrhea Cases
variable coefficient standard error p-value
pop 00073148 00007181 0000
privexp -5919509 1773756 0001
pubexp 00385644 00162475 0020 constant 9123934 5423155 0097
Note highly significant at 1 significant at 5
712 Diarrhea
The regression result showed that the model is
significant and was able to explain 70 of the varia-
tion in diarrhea cases based on the computed adjusted
R-squared Public expenditures on health care were
found to be significant (at 5) in explaining the
variation in the number of diarrhea cases while
population and private expenditures on health care
were found to be highly significant (at 1) The results
conform to the hypothesis that an increase private
spending on health care would result in a decline in the
number of diarrhea cases while an increase in the
population results to an increase in the number of cases
However public health care expenditure and the
number of diarrhea cases were found to be positively
related One possible explanation for this result is that
public expenditure on health may be more oriented to
communicable diseases than non-communicable
diseases ie compared with the results of tuberculosis
In addition there are other significant factors that may
be affecting the prevalence of diarrhea which are not
incorporated in the public health care expenditures say
the availability of or access to safe drinking water
among others
Nevertheless results showed that an increase in the
average household private expenditure on health by
PhP017 or equivalently a total of PhP0174 million
spending on health for the household sector would
result in a unit decrease in the number of diarrhea cases
Estimates also showed that on the average an increase
in the population by 137 increases the number of
diarrhea cases by one in the country Results also
showed that an increase in public health expenditures
decreases the number of tuberculosis cases
72 Conclusions Implications and Further
Studies
The result of the study showed that public
expenditures on health care have a significant effect on
the number of tuberculosis cases in the Philippines
Although results for the other cases show that public
expenditure failed to explain the variation in the
number of cases it may be attributed to the unavaila-
bility of disaggregated data allocated for specific
diseases in each region This then can be considered as
the limitation of the study Nonetheless the results of
the study can be used to provide a rationale for the
abrupt increase in the spending for disease prevention
and control for 2008 and 2009
As pointed out earlier the result of the study can be
further extended by valuing the benefits that can be
derived from a prevented sickness resulting from an
increase in public health expenditures The benefits
may include the loss income from being absent
because of the disease and the prevented private
expenditures to prevent the disease Of course the
general external effects of being healthy or seeing a
healthy person may also be included as part of these
benefits These non-marketed goods which are
J Glob Bus Trade Vol 9 No2 (November 2013) 35-44
43
common to the health sector can be measured using
contingent valuation methods such as willingness-to-
pay (Hurley 2000) Knowing these benefits one can
then do a cost-benefit analysis of an increase in public
expenditure on health care Thus if the net benefits
that can be derived from a prevention of a tuberculosis
case is higher than PhP169236 which is the cost of
preventing it then it is rational for the government to
pursue an increase in public health care expenditure
References
Asian Development Bank (2008) Key indicators for
Asia and the Pacific 2008 Manila Author
Retrieved from httpwwwadborgsitesdefault
filespublication27728key-indicators-2008pdf
Connelly L B (2004) Economics and health
promotion The European Journal of Health
Economics (Formerly HEPAC) 5(3) 236-242
Chicago
Department of Budget and Management (nd)
Budget of expenditures and sources of financing
2000-2008 [Webpage] Retrieved from www
dbmgovph
Department of Budget and Management (2001)
Republic of the Philippines national expenditure
program 2001 Manila Author Retrieved from
httpwwwdbmgovph
Department of Budget and Management (2002)
Republic of the Philippines national expenditure
program 2002 Manila Author Retrieved from
httpwwwdbmgovph
Department of Budget and Management (2003)
Republic of the Philippines national expenditure
program 2003 Manila Author Retrieved from
httpwwwdbmgovph
Department of Budget and Management (2004)
Republic of the Philippines national expenditure
program 2004 Manila Author Retrieved from
httpwwwdbmgovph
Department of Budget and Management (2005)
Republic of the Philippines national expenditure
program 2005 Manila Author Retrieved from
httpwwwdbmgovph
Department of Budget and Management (2006)
Republic of the Philippines national expenditure
program 2006 Manila Author Retrieved from
httpwwwdbmgovph
Department of Budget and Management (2007)
Republic of the Philippines national expenditure
program 2007 Manila Author Retrieved from
httpwwwdbmgovph
Department of Budget and Management (2008)
Republic of the Philippines national expenditure
program 2008 Manila Author Retrieved from
httpwwwdbmgovph
Department of Budget and Management (2009)
Republic of the Philippines national expenditure
program 2009 Manila Author Retrieved from
httpwwwdbmgovph
Department of Health (2002) Field health service
information system annual report 2002 Manila
Author Retrieved from httpwwwdohgovph
sitesdefaultfilespublicationsFIELD20HEALT
H20SERVICE20INFORMATION20SYST
EM20ANNUAL20REPORT202002pdf
Department of Health (2003) Field health service
information system annual report 2003 Manila
Author Retrieved from httpwwwdohgovph
sitesdefaultfilespublicationsFIELD20HEALT
H20SERVICE20INFORMATION20SYST
EM20ANNUAL20REPORT202003_0pdf
Department of Health (2004) Field health service
information system annual report 2004 Manila
Author Retrieved from httpwwwdohgovph
sitesdefaultfilespublicationsFIELD20HEALT
H20SERVICE20INFORMATION20SYST
EM20ANNUAL20REPORT202004pdf
Department of Health (2005) Field health service
information system annual report 2005 Manila
Author Retrieved from httpwwwdohgovph
sitesdefaultfilespublicationsFIELD20HEALT
H20SERVICE20INFORMATION20SYST
EM20ANNUAL20REPORT202005_0pdf
Analysis of Public Health Expenditures on Leading Causes of Morbidity in the Philippines
44
Department of Health (2006) Field health service
information system annual report 2006 Manila
Author Retrieved from httpwwwdohgovph
sitesdefaultfilespublicationsFIELD20HEALT
H20SERVICE20INFORMATION20SYST
EM20ANNUAL20REPORT202006pdf
Department of Health (2007) Field health service
information system annual report 2007 Manila
Author Retrieved from httpwwwdohgovph
sitesdefaultfilespublicationsFIELD20HEALT
H20SERVICE20INFORMATION20SYST
EM20ANNUAL20REPORT202007_1pdf
Drouin J P Hediger V Henke N Kanzler L
Leydon E F amp De Santis P (2008) The Health
Care Century Health International 7 6-17
Granlund D (2006) The effect of health care expen-
ditures on sickness absence Paper Presented at the
Inaugural Biennial Conference of American Society
of Health Economists 2006 Madison WI
University of Wisconsin
Hurley J (2000) An overview of the normative
economics of the health sector Handbook of
Health Economics 1 55-118
Novignon J Olakojo S A amp Nonvignon J (2012)
The effects of public and private health care
expenditure on health status in sub-Saharan Africa
New evidence from panel data analysis Health
Economics Review 2(1) 1-8
Philippine Statistics Authority (nd) Family income
and expenditures survey 2000 2003 2006
[Webpage] Retrieved from wwwcensusgovph
United Nations (2007) Human development report
Retrieved from wwwhdrundporg
World Health Organization (2007) National health
accounts 2007 Geneva Author Retrieved from
httpwwwwhointen
World Health Organization (2012) World health
statistics 2012 Geneva Author Retrieved from
httpwwwwhointen
J Glob Bus Trade Vol 9 No 2 (November 2013) 45-60
45
ISSN 1946-5130
Journal of Global Business and Trade
wwwiagbtcom
Analysis of the Interests of Conceiving a Free Trade
Agreement between China and South Korea
Liu Zuankuoa and Zhan Baiming
b
a Shandong Normal University China b South-Central University for Nationalities China
Received 25 August 2013 Revised 22 September 2013 Accepted 28 October 2013
ABSTRACT
Based on the ldquoStarting Joint Minister Statement on free trade agreement between China and South Koreardquo
the article explains the basic ideas of this agreement It shows that there are some distinctive differences
between the statement and the theoretical study on interests China pays more attention to the diplomatic
significance rather than in trade While South Korea aims to guarantee its investment benefits by this
agreement both stations try to protect their producersrsquo benefits Finally this paper using the model GTAP
(Global Trade Analysis Project) puts forward two sets of simulation schemes and forecasts the economic
effects of the Free Trade Zones from the macroeconomics and welfare effects trade effects and industry
effects
Keywords analysis of benefits China-South Korea free trade agreement construction
Ⅰ Introduction10
Minister of Commerce Chen Deming and South
Korean Trade Minister Park Tae-ho attended the
China-ROK Trade Ministers Meeting in Beijing on
May 2nd 2012 and announced the official initiation of
China-ROK Free Trade Agreement negotiations on the
Ministersrsquo Joint Statement (referred to as ldquoStatementrdquo
as following) From the Free Trade Agreement (FTA)
we can see the basic ideas of the interest demands of
the Statement
The statement explains the basic ideas of the FTA
which includes trade in goods services investment
and other fields The interest demands reflected in the
2013 International Academy of Global Business and Trade
All rights reserved
Statement includes two aspects trade and investment
From the perspective of trade benefits the two
countries agreed that levels of trade liberalization in
good and service trades should go beyond those
promised levels in the WTO However there are some
sensitive product issues in the goods trade which
include lists of generally sensitive and highly sensitive
products From the perspective of investment benefits
the level and scope of liberalization were defined
according to both countriesrsquo investment arrangement at
present and in future Meanwhile the overseas
processing zones should be involved in China-ROK
FTA
Analysis of the Interests of Conceiving a Free Trade Agreement between China and South Korea
46
Table 1 MFN Tariff Levels of China and South Korea in Product Category ()
Category of products
China Korea
Average tax rate
Free tax rate Maximum Tax rate
Average tax rate
Free tax rate Maximum Tax rate
Livestock products 148 101 25 221 24 89 Milk products 120 0 20 675 0 176
Fruit Vegetable 148 59 30 574 02 887 Coffee Green tea 147 0 32 539 0 514 Grain 243 34 65 1345 03 800 Oilseed animal fat oil 110 53 30 370 41 630
Sugar Sweet 274 0 50 168 125 243
Drinks Cigarette 223 22 65 317 0 270 Cotton 152 0 40 00 1000 0 Other agricultural products 114 94 38 161 183 754 Fish and its products 109 63 23 161 07 50 Minerals Metals 74 87 50 46 269 8 Petro 48 200 9 41 107 8 Chemistry 66 16 47 57 67 321 Wood Paper 44 353 20 22 675 10 Textile 96 0 38 91 15 13 Cloth 160 0 25 126 0 13
Leather Shoes 132 06 25 79 26 16 Non-electrical machinery 80 90 35 60 226 13 Electronic machinery 83 240 35 62 214 13 Transportation equipment 115 08 45 55 268 10 Other products 119 96 35 67 160 13
Source World Trade Organization (nd)
The level of goods liberalization of the two
countries can be judged from WTO World Customs
Data 2011 In 2010 the simple average MFN tariffs
on agricultural and non-agricultural product imports
were 156 and 87 respectively while the simple
average MFN rates applied to Korea on agricultural
and non-agricultural products exports were 164 and
88 The simple average MFN tariffs on Korean
agricultural products and non-agricultural products
import were 485 and 66 while the MFN rates applied
to China on its agricultural products and non-
agricultural products export were 521 and 66 The
MFN import tariff rate of China and Korea divided by
product category is given via Table 1
Via Table 1 we can see that South Korea paid
more attention to protecting agricultural products (tax
rate 485) than industrial products (tax rate 66)
Therersquos a more than 40 percent difference in the simple
average MFN tariff On Chinarsquos part therersquos no big
difference between agricultural product protection
(156) and industrial product protection (87) the
gap of the simple average MFN tariff between these is
less than 10 percent Meanwhile South Korearsquos
protection on agricultural products (485) is much
higher than Chinarsquos (164) As for industrial product
protection there is a gap between China (156) and
South Korea (66) but the gap in industrial (9 or
so) is not as big as that shown in agricultural products
with a tax rate gap 42
From above it shows that the profit that China
benefits from the FTA mainly depends on the degree of
liberalization of agricultural products of South Korea
If this is the important part of South Korearsquos sensitive
products then the attitude expressed in the joint
statement ldquobeyond goods liberalization level of WTO
commitmentsrdquo has not displayed real significant trade
interests
In other words the previous various theoretical
insights on the China-Korea FTA are not the same as
the benefit idea implied in the statement
J Glob Bus Trade Vol 9 No 2 (November 2013) 45-60
47
Ⅱ Literature Review
With regard to the interests in the FTA negotiations
between China and South Korea Chinese scholars are
generally optimistic about the economic and trade
effects of the bilateral free trade agreement Xue Jing-
xiao and Zhang Bo-wei (2004) believed that Chinarsquos
GDP would grow if China and South Korea were to
establish a free trade area Huang Peng and Wang Jian-
xin (2010) analyze the potential effect of applying
GTAP in constructing a free trade zone between China
and South Korea which indicates that after the
fulfillment of the China-ROK FTA the two countriesrsquo
GDP and components such as consumption
investment government expenditure and so on
compared to the base period all experienced positive
growth South Korea obtains a greater benefit with a
growth rate of 207 while Chinarsquos only 018 Song
Jingen (2011) on the basis of a traditional trade gravity
model studied the effects on trade after the two
countries signed the free trade agreement The results
show that China and South Korearsquos agreement played
a strong role in promoting the trade of both countries
and the total volume of trade would increase nearly
60 He suggests that both countries should pay
attention to the opportunities brought by the agreement
when they are protecting their sensitive sectors Li
Xiao-feng and Gui Jia-yue (2009) based on partial
equilibrium estimates the effects of the establishment
of the China-ROK Free Trade Zone on bilateral trade
flows from the industrial level The simulated results
show that if China and Korea do not established a free
trade zone to a larger extent trade between China and
South Korea would be heavily influenced by the trade
diversion from the Korea-US Free Trade Zone If the
two countries establish a free trade zone it will be
more conducive to the development of comparative
advantages of both countries
Analysis of academic research on China-ROK free
trade agreements has a more rigorous theoretical
condition namely the import tariffs of all goods should
be canceled in the China-ROK FTZ Before the
implementation of the FTZ the higher the tariff is the
greater the increase of imports caused by the tariff
reductions will be From the perspective of exports
before the completion of a bilateral free trade zone the
higher the tariff of partner country is the greater the
exporterrsquos export growth will be after establishment
The joint statement announced by the ministers of
China and the ROK showed that on the one hand the
level of liberalization of trade in goods should
transcend their level of commitment in the WTO On
the other hand the problems of sensitive products
should be a concern A longer transitional period
partial concessions and exceptions should be used to
handle sensitive product issues It is not known which
products are arranged for a longer transition period
partial concessions or exceptions but it will greatly
reduce the expected trade benefits by theoretical study
because the theoretical results used free trade and tariff
barrier elimination as a precondition Meanwhile
when both countries regard their disadvantaged
industries as sensitive products to go beyond the
commitment level in the WTO as agreed in the joint
statement will be quite limited in the scope Thus the
domains of free trade will be relatively small
Professor Yorizumi Watanabe (2009) of Keio
University in Japan analyzed the historical significance
of the FTA among China Japan and South Korea and
pointed out that China makes free trade agreement
policies for three reasons on foreign affairs and
commercial intercourse First in maintaining the
double-digit rapid development in economy China has
become the ldquoworld factoryrdquo and it is imperative to
ensure the market of related industries Second China
has become a world power so it needs to show
Southeast Asian countries an image of a ldquogood
partnerrdquo so as to avoid being seen as a threat Third by
means of drawing those overseas Chinese who have
engaged in long-term economic activities in the
neighboring countries China formed the ldquoGreater
China Rimrdquo and turned it into Chinarsquos powerful
ldquoperipheryrdquo
The interpretation of the motives of Chinarsquos
making of free trade agreement policies by Professor
Watanabe made people feel that Chinarsquos interest
Analysis of the Interests of Conceiving a Free Trade Agreement between China and South Korea
48
demand consists of two aspects commercial inter-
course and diplomacy However regardless of the
relationship of bilabial trade between China and Japan
or between China and South Korea Chinarsquos
advantages in industry are mainly on textiles clothing
leather shoes and other products but the tariff rates of
Chinarsquos MFN of such goods are higher than those of
South Korea and Japan Meanwhile the Chinese
mainlandrsquos ldquoworld factoryrdquo status is a product of the
processing trade China has been acting the role of
assembling and integration in the East Asian labor
division system and the commodities in bilateral trade
between Sino-Korea and Sino-Japan are mainly
constituted by the intermediate input products This
means that Chinarsquos participation in the construction of
the FTZ with Japan and South Korea is not to ensure
the market of related industry and thus its trade
interests are far less than the diplomatic interests which
Professor Watanabe referred to Economists of South
Korea predict that the FTZ has a very large impact on
the Korean economy while there is a relatively small
impact on China For China the strategic goal of the
China and South Korea FTZ is greater than economic
significance while for South Korea the motivation of
getting economic interests is stronger China promoted
the China-ROK FTZ in order to ensure a dominant
position within the East Asian region which cannot
only impact America who took advantage of allies in
Asia to constrain China but also rely on the regional
group to enhance Chinarsquos status in the international
political situation and the multilateral system (Zheng
Zhi-shu 2009)
The interest that South Korea obtained from the
China-ROK FTA depends on the degree of liberali-
zation of Chinese industrial products If Chinese
industrial products constitute a major part of the
sensitive products in China the trade interest of South
Korea would not be significant So the motives of
South Korea negotiating bilateral free trade agreements
with China does not come from trade but from the
following that will be discussed in the third part of the
international investment interests
Ⅲ The Benefit Analysis
31 The balance of Investment Interests and
Trade Interests
Before China and the ROK passed the ldquothe
Associate Ministerial Statement of Starting China-
Korea Free Trade Agreement Negotiationsrdquo China
Japan and the ROK held investment agreement
negotiations in Beijing reached an agreement on all
the remaining issues in the investment agreement and
drafted the agreement on March 21st 2012 Three
parties said they would soon complete their internal
procedures so as to sign the agreement as soon as
possible
From the view of the sequence of time the
successful termination of negotiations on investment
agreements among China Japan and ROK preceded
the starting of negotiations on a bilateral FTA between
China and ROK This indicates that relative to the free
trade agreement the three countries are more
concerned about investment agreements or that South
Korea is keener on the investment issues among the
three countries or between the two countries South
Korean President Lee Myung-bak said that in the
investment agreements among the three countries the
dispute settlement mechanism was included between
the investors and the host country which can provide
legal protection for investors if they suffer a loss on
investment in the host country
Meanwhile the joint statements of two countries
also made clear the important position of investment in
the FTA In the area of investment for proper handling
of issues related to bilateral investment between the
two countries they will confirm the level and scope of
liberalization and take the current and future bilateral
investment-related arrangements into account
When the international economic integration has
developed both in scope and in depth from trade to
international production many bilateral and regional
free trade agreements reflected the feature of the trade
and investment integration such as the North
American Free Trade Agreement In most cases the
J Glob Bus Trade Vol 9 No 2 (November 2013) 45-60
49
countries that are dominant in international investment
will make use of the form of the FTZ to protect its
interests of overseas investments from losses
In terms of the structure of bilateral trade in goods
between China and ROK Korearsquos exports to China
mainly consist of productive goods Table 2 shows
classified by BEC the imports and exports of Chinarsquos
trade in goods to the ROK
Table 2 shows that during the 13 years from 1998
to 2010 among the types of Chinese and South
Korean BEC commodities the following conclusions
can be made according to the changing of exports and
imports of capital goods intermediate goods and
consumer goods
First the imports and exports of intermediate
goods in the cargo trade between China and the ROK
come in on top According to the SNArsquos three basic
categories of goods the annual average import and
export composition ratio of intermediate goods capital
goods and consumer goods trade between China and
Korea were respectively 722 164 and 112
Relative to capital goods and consumer goods the
exceeding ratio balances of intermediate goods trade
value are respectively 56 and 60 percentage points
Table 2 China amp South Korea Goods Trade Structure 1995-2010 (Classified by BEC)
(Unit Hundred Million Dollars)
Intermediate
Goods
Exports
Intermediate
Goods
Imports
Consumer
Goods
Exports
Consumer
Goods
Imports
Capital
Goods
Exports
Capital
Goods
Imports
1995 50 85 14 4 3 13
1998 43 134 12 5 8 11
1999 51 154 17 5 10 13
2000 73 204 25 6 15 22
2001 72 200 33 6 19 28
2002 90 217 43 7 22 61
2003 118 311 51 7 31 108
2004 167 455 61 11 49 153
2005 226 590 66 13 58 161
2006 296 702 83 15 65 173
2007 388 797 94 18 81 213
2008 508 869 96 19 132 223
2009 321 784 76 15 135 212
2010 421 1051 97 24 166 289
Source United Nations Statistics Division (nd)
From the composition of exports and imports
among all of Chinarsquos exports to South Korea the
annual average rates of intermediate goods capital
goods and consumer goods were respectively 642
202 and 155 The rates of these three types of
goods in Chinarsquos annual imports from South Korea
were respectively 803 174 and 22 For
intermediate goods the proportion of Chinarsquos exports
to South Korea is less than that of imports from South
Korea and the balance is up more than ten percentage
points
Second the proportion of the goods used for
production in the cargo trade is much higher than that
of the consumption part In Economics capital is
defined as the products that are produced by the
economic system itself and used as input factors so as
to further produce more products and labor service
According to the basic principles of economics
capital goods and intermediate goods with the
characteristics of production can be considered inputs
for the production of capital goods Statistics show that
the sum of annual import and export proportion is
nearly 886 leaving less than 12 to consumer
goods The very low proportion of consumer goods
trade between China and South Korea shows us the
Analysis of the Interests of Conceiving a Free Trade Agreement between China and South Korea
50
basic characteristics of the internationalization of
production behind the commodity trade structure
Regarding Chinese goods exported to South
Korea the annual average proportion of goods which
had entered the production process was 798 and
continued to rise from 784 in 1995 to 811 in
2005 and to 857 in 2010
Meanwhile the goods that China imported from
South Korea have a higher proportion for production
use and the annual average is almost up to 979 In
1995 the share was 956 and since 2003 its share
has always remained above 98
The proportion (approximately 98) of Chinarsquos
imports of productive goods from Korea is 18 higher
than that (about 80) of Chinarsquos exports indicating
that the degree of Chinarsquos dependence on South Korea
is higher than South Korea on China
Central Bank of Korea (June 14 2011 ) released
the ldquo2010 South Korean Current Account Balancerdquo
which said that the export growth of semiconductors
machinery precision machinery and other goods are
increasing significantly and the trade surplus to China
of such goods is increasing from $3697 billion to
$5104 billion
The formation of this kind of trade structure to a
large extent can be explained reasonably by South
Korearsquos direct investment in China From the
perspective of the trade of intermediate goods Li
Xian-zhu (2010) Ye Jing-yi and Wang Pei (2005)
explained the trade imbalance between China and
South Korea When analyzing the Korean chronic
surplus phenomenon in long term they pointed out
that one of the reasons is that there are many Korean
investment enterprises in China and most are
processing companies required to purchase a large
number of Korean raw materials and accessories for
processing The import of the raw materials and
accessories required by Chinarsquos processing trade is
mentioned above that is Chinese importation of
intermediate goods by BEC classification Some
scholars explained the trade imbalance from the point
of capital goods trade that South Korea has a
competitive advantage in the production of capital
goods that when coupled with the adjacent location is
conducive to reduce transportation costs and thus
South Korea has become one of the main countries for
China to get capital goods from for processing trade
which expanded the size of imports from Korea (Zhao
Fang amp Li Ji 2010)
Statistics show that from 1998 to 2010 among the
foreign direct investments divided by countries and
geographical areas Japan and South Korea have
always been Chinarsquos major source countries for foreign
investment Except those years of the financial crisis
(1998 2008-2009) the proportion of Japan and South
Korearsquos direct investment in China accounted for 13 -
20 For example in 2005 South Korearsquos direct invest-
ment was up to 5168340000 US dollars accounting
for 86 of Chinarsquos total $60324590000rsquos absorption
of foreign investment Japanrsquos direct investments were
6529770000 US dollars accounting for 1082
South Korearsquos direct investment is mainly in the
manufacturing industry By 2005 South Korean
investment in China is mainly focused on the
manufacturing and assembly of electronic appliances
textiles and clothing leasing and business services
food and beverage and retail industries among which
manufacturing accounted for dominance (Yang Li amp
Zhou Wenfeng 2008 ) However in the manufacturing
sector the investment structure of South Korea has a
tendency of changing from the consumer goods
industry including fiber clothing food manufacturing
leather footwear and others to capital goods industries
including electronic communications petrochemical
alloy machinery and equipment and others (Zang Xin
Dong Rongrong amp Cui Yan 2006)
In order to protect the interests of foreign invest-
ment one of the conditions that Japan and South
Korea agreed to in the China-Japan-Korea FTZ nego-
tiation was the signing of ldquoCJK investment agree-
mentsrdquo The tripartite negotiations started in 2007 with
content that included all the important aspects
contained in the international investment agreements
including such clauses as the definition of investment
scope of application MFNT national treatment
J Glob Bus Trade Vol 9 No 2 (November 2013) 45-60
51
expropriation transfer subrogation taxes general
exceptions and dispute resolution
32 The Balance of the Interests of Producers
and Consumers
According to the Yonhap News Agency on
January 12th 2012 the foreign minister of South
Korean Park Taeho said at a press conference held in
the central government office that China as a big
country made a lot of people worried that Korearsquos
agriculture might be pounded South Korea was not
going to allow massive Chinese agricultural products
into South Korea Before starting the China-ROK FTA
negotiations the Korean Government would fully
listen to the views of different fields
Table 3 The Share of South Korearsquos Agriculture in the National Economy 1998-2010
()
Agricultural Labor
Manufacturing Labor
Labor Services Agricultural
Output Manufacturing
Output Services Output
1998 019 2405 4081 336 4511 4044
1999 019 2406 4081 328 4645 4015 2000 017 2453 4087 297 4736 4015
2001 017 2421 4079 287 4557 4182
2002 016 2323 4103 262 4490 4282 2003 016 2316 3989 243 4480 4241
2004 014 2306 3884 239 4727 4034
2005 015 2278 3795 219 4794 4013 2006 014 2165 3468 209 4801 4032
2007 014 2092 345 195 4818 4033
2008 012 2012 3444 184 5064 3833 2009 013 1944 3484 194 4960 3912
2010 013 1909 3484 178 5211 3739
Source Database provided by Korearsquos Banks
Compared with the manufacturing and service
industries the proportion of South Korearsquos agriculture
is not so significant in the national economy The
proportion of employees in the total economic activity
decreased from 019 in 1998 down to 013 in 2010
and the proportion of the total value of agricultural
production in GDP decreased from 336 in 1998
down to 178 in 2010 If the China-ROK FTA finally
regarded the South Korearsquos agriculture as sensitive
products and put it outside the free trade it is no doubt
that this is only to protect the benefits of very few
agricultural producers by sacrificing the interests of
many other consumers
Let us observe the issues of Chinese sensitive
products Chinese Commerce Minister Chen Deming
said that the sensitive products taken into account in
the process of negotiation were related to agriculture in
Korea and Chinarsquos petrochemical electronics
machinery and other fields
Not completely identical to the situation of South
Korearsquos agriculture in the national economy from 1998
to 2010 the ratio of employees in Chinese petroche-
mical electronics and mechanical industries among the
countryrsquos total employment is not high but there is a
rising trend In 1998 Chinese petrochemical and
machinery industry employment accounted for 088
and 157 respectively of the countryrsquos total
employment In 2010 this proportion respectively rose
to 154 and 388
Similarly the ratio of the petrochemical and
mechanical fields in GDP also showed an increasing
trend and its share enlarged In 1998 the ratios were
135 and 213 In 2010 the ratios respectively
increased to 614 and 1173
Table 4 shows that Chinarsquos petrochemical and
machinery industries are growing and developing
rapidly From the production valuersquos movements of
ratio in GDP we can see that from 1998 to 2010 these
Analysis of the Interests of Conceiving a Free Trade Agreement between China and South Korea
52
two sectors in initial stages accounted for 348 of
GDP and by 2005 641
Chinese petrochemical products cover a wide
range of sectors In Chinarsquos Statistical Yearbook they
included the petroleum processing and coking industry
chemical materials and products manufacturing
chemical fiber manufacturing rubber and plastic
products industry Electronic and mechanical fields are
statistically included in machinery and equipment
involving manufacturing industries in common
equipment special equipment transportation
equipment electrical machinery and equipment
electronic and communications equipment instrument
and apparatus and office machinery
Table 4 The Share of Chinese Petrochemical and Machinery Industriesrsquo in the National Economy 1998-2010
()
Petrochemical Industry
Labor Proportion Machinery Industry Labor Proportion
Petrochemical IndustrialGDP
Machinery IndustrialGDP
1998 088 157 135 213
1999 081 145 139 222 2000 074 133 160 240
2001 068 124 155 253
2002 065 121 158 282 2003 098 191 178 340
2004 101 209 224 423
2005 113 244 230 411 2006 119 266 483 883
2007 127 296 554 1028
2008 141 344 608 1119 2009 143 344 547 1059
2010 154 388 614 1173
Source ChinaStatistics (2011)
Chinarsquos petrochemical and machinery accounted
for a high ratio in GDP The number of the labor force
in these two industries was not big and their sum share
is no more than 6 (542 in 2005) in the whole
national economy Thinking about it another way from
the perspective of proportion of factors Zhan Boming
and others (2010) observed and analyzed Chinarsquos
industrial enterprisesrsquo inclination in investment They
found that investment made by state-owned
petrochemical and machinery enterprises have capital
intensive investment tendencies and the investment of
the three-kind investment enterprises in these two
industries are petrochemical capital intensive while
labor-intensive industries including machinery and
transportation equipment manufacturing electronic
and communication equipment manufacturing The
fact means that the idea of separating the Chinese
petrochemical and machinery from the China - Korea
Free Trade Agreement negotiations are to protect those
investorsrsquo interests at the expense of the interests of
numerous consumers
If the Chinese petrochemical products and
machinery products are to be put outside the China-
Korea Free Trade Agreement as sensitive products and
South Korearsquos agricultural sector is also separated
from China-Korea free trade agreement then we can
say such a bilateral free trade agreement almost has no
sense of free trade
Ⅳ Simulation Analysis of the
Economic Effects of China-Korea
FTA
A GTAP model is used in this part to predict the
economic effects if the China-Korea free trade zone is
established
41 Basic Structure of the Model
The GTAP model was developed by Professor
Tomas W Hertel of Purdue University as a multi-
J Glob Bus Trade Vol 9 No 2 (November 2013) 45-60
53
national and multi-sector general equilibrium model
and it has been widely used in trade policy analysis In
the GTAP model framework first sub-models that can
detail description of each countryrsquos (or regionrsquos)
production consumption government spending and so
on are created and then the various sub-models are
combined into a multi-national and multi-sector
general equilibrium model through international
merchandise trade relations When using this model
framework for policy simulation it can also be used to
explore the changes that the policy brings in each
nation and sectorrsquos production import and export
commodity prices supply and demand factors
elements of remuneration GDP and the level of social
welfare
42 Basic Assumptions
421 Conditions of Factors
There are five different types of elements in the
model land capital skilled labor unskilled labor and
natural resources A GTAP model assumes that the
market is perfectly competitive the scale of production
unchanged and each product produced by using
nested constant coefficient to replace elasticity equa-
tion The intermediate inputs consist of domestic and
foreign products through constant coefficient instead of
elasticity equation The products (domestic and import
goods) of different regions are non-homogeneous and
therefore cannot be replaced with each other In the
factor market land among departments is not
completely mobile so the price of land for different
uses is different while the labor in the country is
allowed to flow freely Each country has only one
account to which all the income tax and endowments
are accumulated Then through the Cobb-Douglas
Utility Function income is divided into private
consumption savings and government consumption
by a fixed proportion In a GTAP model there are two
imaginary international departments which are
International Bank and International Traffic Each
countryrsquos savings are accumulated to an International
Bank being allocated among countries according to
the rate of capital return The International Traffic
Department can balance the differences between CIF
and FOB and link the world through bilateral trade
422 Conditions of Behavioral Agents
There are three kinds of typical behavior agents in
the model private departments government
departments and firms
4221 Behavior of Private Department
In private expenditure the private sector consump-
tion expenditure has the nature of non-homothetic
order and should include the impact of population
growth the private department sets levels by using a
CDE Utility Function on a per capita basis Private
department behavior equation
① Private Household Utility
② CompoSITC Demand
③ CompoSITC Tradeable
In these equations yp (r) stands for the regional
units of the private sector household expenditure of r
region ppriv (r) stands for the price index of private
sector household unit consumption expenditure of r
region UELAS stands for the relative utility costs and
elasticity pop (r) stands for the population of r region
qp (i r) stands for the demands of i product in r
regional private department unit EP (i k r) stands for
the cross-price flexibility between irsquos demands and krsquos
price in r regional household unit EY (i r) stands for
the demand of composite commodity i in r regional
household unit pp (i s) stands for the demand price of
integrated trade commodity i in a private household
unit of s region PMSHR (i s) stands for the share that
Analysis of the Interests of Conceiving a Free Trade Agreement between China and South Korea
54
the total imports in the private sector demand for
domestic products of s region ESUBD (i) stands for
the elasticity of substitution between domestic and
imported good i ppd (i s) stands for the demand price
of commodity i in s regional private department unit
qpd (i s) stands for the demand of the national product
i in s regional private department unit ppm (i s) stands
for the demand price for import integrated trade
commodity i in s regional private department unit
qpm (i s) stands for the import demand of product i in
s regional private department unit
4222 Behavior of Government Department
The total government expenditure allocates
between the various commodities via using a Cobb-
Douglas Utility Function This makes the government
expenditure on various commodities of their total
remains constant In an open system the governmentrsquos
demands can be divided into domestic products and
imported products and both of the products form an
integrated product through the CES Function
Government department action equation
① Government Utility
② Demand for CompoSITC Goods
③ CompoSITC Tradeable
In these equations yg (r) stands for the regional
government expenditure of r region pop (r) stands for
population of r region pgov (r) stands for the
consumption expenditures price index of government
departments in r region ug (r) stands for the average
capital expenditure utility level per people from the
government spending in r region VGA (i r) stands for
the expenditure buying i goods in r regional
government departments GOVEXP (r) stands for the
consumer spending in r regional government
departments pg (i r) stands for the demand price of
comprehensive trade i product in r regional
government departments qg (i r) stands for the
demand of i goods in r regional government
departments GMSHR (i s) stands for the government
departmentrsquos share of demand for national products in
total imports in s region pgd (i s) stands for the
demand price of domestic integrated i good in s
regional government departments qgd (i s) stands for
the demand of domestic i product in s regional
government departments pgm (i s) stands for the
demand price of imported comprehensive trade i good
in s regional government departments qgm (i s)
stands for the imported demands of i product in s
regional government departments ESUBD (i) stands
for the elasticity of substitution between domestic
goods and imported goods
4223 Behavior of the Firm
GTAP model assumes that manufacturers use Tree
Structure in the production function Firmsrsquo main
inputs can be divided into the original inputs and
intermediate inputs Suppose the production function
has the characteristics of divisibility and fixed scale
compensation Under the divisibility assumption
firmsrsquo decisions on the most appropriate volume of
original input is not influenced by the changing of
intermediate input price and quite reverse is true
Meanwhile under the assumption of fixed scale
compensation the proportion of factor input of firms
will not be influenced by the changes in production
volume either
On the top of Tree Structure it shows firmsrsquo
decisions of demand between intermediate inputs and
integrated original inputs Under the assumption of the
Leontief Function it shows a fixed proportional rela-
tionship between the intermediate input and original
comprehensive input and total output This is common
in general design of CGE model of which the main
advantage is that it can reduce the number of para-
meters needed to estimate in the model significantly
The bottom left part of the Tree describes the
J Glob Bus Trade Vol 9 No 2 (November 2013) 45-60
55
relationship between the original investment and
production
Assume that the relationship between the original
input and the production is CES Function and the
elasticity of substitution between different original
elements is equal Accordingly sum up the original
inputs in order to obtain the Aggregate Primary Input
At the bottom right part of the Tree Structure it shows
the relationship between the intermediate input and
production which consists of two sides First is the
substitution relationship between the domestic
products and comprehensive imported products
assuming both compose into integrated intermediate
goods through CES Function Second is the
substitution relationship among different sources of
imported intermediate goods assuming which are also
integrated through the CES Function Behavior of
Firm equation
① CompoSITC Intermediate Nest
② Valuemdashadded Nest
③ Total Output Nest
In these equations pf (i j r) and qf (i j r) stands
for the price and demand of i product while producing
j good in r region af (i j r) stands for the technological
change of original feature i in j industry of r region
FMSHR (i j r) stands for the share that r regionrsquos total
imports among the demand for domestic compre-
hensive products pfm (i j s) stands for the demand
price of integrated commodity i in j industry of s
region qfm (i j s) stands for the firmsrsquo total demands
of imports pfd (i j r) stands for the demand price of
domestic comprehensive commodity i in j industry of r
region qfd (i j s) stands for the firmsrsquo demand for
domestic products ESUBD (i) stands for the elasticity
of substitution between domestic and imported goods
pva (j r) stands for the added-value price of producing
j good in r region qva (j r ) stands for the added-value
of j industry in r region ava (j r) stands for the
technological changes of the added-value in j industry
of r region SVA (k j r) stands for the share of added-
value product i in j industry of r region pfe (i j r)
stands for the price of original element i which needed
to produce j product of r region qfe (i j r) stands for
the demand of original element i which needed to
produce j product of r region afe (i j r) stands for the
technological changes of original element i in j
industry of r region ESUBVA (j) stands for the
elasticity of substitution between original elements
during the added-value production in j industry qo (j r)
stands for the output of j department of r region ao (j r)
stands for the technological changes of output in j
department of r region ps (j r) stands for the supply
price of j product in r region ESUBT (j) stands for the
elasticity of substitution of intermediate inputs while
producing j product
423 Equilibrium Condition
A GTAP model assumes a regional household unit
includes a private department and government
department to determine the consumer behavior and
savings behavior of the private department and
government department in the country or region The
Model can be divided into a Closed System and an
Open System Without the government intervention in
a Closed System the income of regional household
unit comes from the reward of selling its own elements
to the firm Firmrsquos incomes come from the purchase of
each householdrsquos expenditure and every manufacturer
also makes money by selling their intermediate goods
All economic behavior expenditures and incomes are
equal Balance of a single country Closed System is
established by the accounting identities and market
equilibrium formula In an Open System due to the
Analysis of the Interests of Conceiving a Free Trade Agreement between China and South Korea
56
joining of foreign departments the government
expenditure and the private spending in local regional
department will be divided into two parts buying
domestic products and imported products
Furthermore some parts of firmrsquos intermediate raw
materials may also be imported and its products are
sold both domestically and abroad
Regional household unitsrsquo behaviors are basically
determined by Aggregate Utility Function which
consists of government expenditure private spending
and savings It is assumed the per capita Cobb-
Douglas Utility Function is adopted and this regional
household unit pursues the utility maximum of a
household unit As a result of using the Cobb-Douglas
Utility Function the proportion of three kinds of
current consumptions that were mentioned above is
fixed
43 The Analysis Method and the Simulation
Program
This article uses the seventh edition GTAP model
which includes 113 countries and 57 sectors In the
model the author combines 113 countries or regions
into three regions China Korea and other parts of the
world 57 industry sectors will be divided into 10 kinds
of product groups 1) food and crops 2) livestock and
meat products 3) forest rivers coal natural gas and
other minerals 4) processed foods 5) Textiles and
clothing 6) light manufacturing 7) heavy industry 8)
Utilities and construction 9) Transportation and
communication 10) other services
In order to fully investigate the effects of trade
liberalization this paper intends to respectively
measure the economic effects of a free trade zone
under two kinds of tax reductions program one
simulates a ldquozero tariff base scenariordquo under the
condition that both China and Korea have a full range
cancellation of goods trade tariffs In program 2
considering the protection of its sensitive industry with
the exceptions of Korearsquos high tariffs on food and crop
departments and the exception of Chinarsquos industrial
sector (light manufacturing and heavy industry) other
department tariff reductions will be by half
44 Simulation and Results of Analysis
441 Economic and Welfare Effects
According to model calculation results (shown in
table 5) we can see from the aspects of GDP growth
In program one after the completion of the China-
Korea free trade zone GDP in both China and Korea
show growth compared to the base period Korea
benefits more with a GDP increase of 139 billion
dollars and a growth rate of 206 China only
increases 25 billion dollars and the growth rate is
015 In program two the GDP of both China and
Korea shows growth compared with the base period
too respectively rising 74 and $540 million
considerably less than the GDP growth in program one
with full exemption of import tariffs This is because
program two still has different levels of trade
protection which leads to inefficient allocation of
resources After the establishment of a free trade zone
in the program one and program two countries with
larger benefits are different Korea benefits more in
program one China benefits more in program two
This is because the two countries have the same tax
reduction in program one Because the trade barriers
between Korea and the other countries in the world are
lower and according to the customs alliance theory
the lower the trade barriers between the Customs
Alliance member countries and other countries in the
world are the establishment of a customs alliance is
less likely to cause more costly trade transfers Under
the condition of full reduction and exemption of tariffs
and zero tariffs China may show a bigger trade
transfer effect thus Korea benefits more In program
two because of the protection for the sensitive food
and crop industry the allocation of resources is less
efficient in Korea
From the point of changes in the countryrsquos welfare
total welfare increases 4964 billion dollars in Korea in
program one while China reduces 653 million dollars
Korearsquos welfare increase is mainly caused by the
improved resource distribution efficiency and trade
conditions Chinarsquos entire welfare reduction is because
of the larger trade diversion effect In program two
J Glob Bus Trade Vol 9 No 2 (November 2013) 45-60
57
both two countriesrsquo welfare increases with Chinarsquos
growth of 189 million dollars and Korearsquos 65 million
dollars Compared to program one the increasing
volume of Korearsquos welfare significantly drops largely
because of Korearsquos high tariffs on food and crop
protection which results in a lower efficiency of
resource allocation
From the view of other regions in the world either
in program one or program two the GDP and welfare
decline at different degrees This means establishing a
free trade zone no matter what level of tax reduction
is conducive to economic growth for member
countries but this will bring adverse changes for those
regions excluded in the free trade zone
From the above analysis the establishment of
China-Korean free trade zone will promote the growth
of the national economy and social welfare regardless
of what level of tax reduction but for other regions in
the world it will bring a negative adverse change
Table 5 Changes of the Economy and Welfare in Different Programs ()
Program One Program Two
Change of GDP
Change Rate of
GDP
Welfare (million of
US dollars)
Change of GDP
Change Rate of
GDP
Welfare (million of US
dollars)
China Korea
Other regions in the world
25051 139023
-277225
015 206
-007
-65303 496385
-42123
74118 54328
-380194
005 008
-001
18941 16497
-15370
Source Compiled according to the result of Rung TAP operation
442 Trade Effects
According to the results of the model calculation
(shown in Table 6) it shows whether canceling all
import tariffs on goods or protecting part of industry by
cancellation of part of tariffs the bilateral trade has an
increase The exports and imports of other regions in
the world experienced varying degrees of reduction
Chinarsquos total economic output is larger so the
establishment of a China-Korea FTZ has less impact
on Chinarsquos import and export level as on Korearsquos The
tax reduction level in program two is not as large as in
program one and in program two some industries are
protected So compared to the program one trade
barriers cause lower efficiency in resource distribution
and the impact on imports and exports is smaller than
in program one
From the terms of the changes in trade either in
program one or program two the China-Korea free
trade zone improves the membersrsquo trade condition to
some degree Specifically Korea benefits more This is
because Korea has more open trade liberalization
whose tariffs on main trade products have been
reduced to a very low level According to the customs
alliance theory the lower the trade barriers between the
Customs Alliance member countries and other regions
in the world is the establishment of a customs alliance
is less likely to cause more costly trade transfers so the
establishment of a China-Korea free trade zone has
little impact on Korearsquos trade transfer and Korea
benefits more from the changes in trade condition than
China
For the other regions in the world under both
kinds of tax reduction and exemption programs there
are different degrees of reduction in import and export
trade conditions indicating that although the establi-
shment of a free trade zone can increase imports and
exports and improve trade conditions for member
countries it can cause an adverse trade effect for the
non-member countries elsewhere in the world
Through the above analysis we can see that after
the establishment of China-Korea free trade zone
regardless of the extent of tax reduction and exemption
it will promote the imports and exports and foreign
trade conditions within the zone but may cause
adverse trade effects on other regions outside it
Analysis of the Interests of Conceiving a Free Trade Agreement between China and South Korea
58
Table 6 Changes of Trade Effects in Different Program ()
Program one Program two
Export Import Trade Condition Export Import Trade Condition
China
Korea The rest of the world
181
244 -002
229
564 -01
005
14 -004
016
028 -00018
021
046 -0006
002
005 -0003
Source compiled according to the result of Rung TAP operation
443 Industry Effects
According to the model calculation results (shown
in Table 7) shown in program one establishing the
free trade zone has a great impact on specific industry
sectors in China and Korea Chinarsquos sectors with
increased output mainly concentrate in the primary
sector products among which the agricultural sector
takes the largest increase reaching 268 while the
industrial sectors (light manufacturing and heavy
industries) decrease slightly In general Chinarsquos sector
output changes but the rate of change is not large In
contrast there is a big difference in sector output
changes between departments in Korea Because of the
restriction of resources geography population and
other natural endowments sectors with reduced output
in Korea are concentrated in the primary sector
particularly in the agricultural sector with a significant
reduction of 2009 much greater than the changes in
other sectors Sectors with output increases concentrate
in the industrial product sectors among which textiles
and clothing sector are the most outstanding with a
927 increase The other regions in the world have a
slight growth in light manufacturing but the outputs of
other sectors experience different degrees of decline
In program two every country protects its weak
industries and the tax reductions are less than in
program one The change rates in industry output of
the two countries is not big except for Chinarsquos textile
and clothing industry which has a slight rise other
changes all decline compared to program one
Although in program two Chinarsquos protection of light
manufacturing and heavy industry help to slow the
decrease of industrial output we can see from Table 7
that China rsquos output of these two industries still
declines indicating that to enhance the level of
industrial development trade protection is not always
feasible It is fundamental to work hard on solving
problems such as low-end industrial structure low
technology in production lack of innovation and etc
Korearsquos protection of agriculture shows a better effect
the output change rate of Korearsquos food and crop
industry decreased from 2009 to 004 Due to
Korearsquos protection of agricultural products Chinarsquos
increased output in food and crop industry changes
from 268 up to 0161
Through the above analysis it can be concluded
that after the establishment of a China-Korea free trade
zone regardless the degrees of tax reduction and
exemption the output will be improved with the
optimization and upgrading of industries For the other
regions in the world it brings adverse impacts
Table7 The Output Changes of Sub-sectors in Program One and Program Two ()
Program one Program two
China Korea Other regions China Korea Other regions
Food and Crop
Livestock and meat products Forest rivers and coal
Natural gas and other minerals
Processed foods Textile and clothing
Light manufacturing
Heavy industries
268
056 031
114 004
-036
-025
-2009
-012 -144
-095 927
034
162
-035
-009 -004
-011 -032
001
-003
0161
0114 0137
0479 0274
-005
-008
-004
-015 -027
-082 534
-017
-018
-0008
-0009 -0027
-0019 -0233
0007
0015
J Glob Bus Trade Vol 9 No 2 (November 2013) 45-60
59
Public utilities construction
Transport and communications Other services
038
009 01
412
155 247
-009
-004 -006
0042
002 0037
023
006 011
-0006
-0005 -0005
Source compiled according to the result of Rung TAP operation
Ⅴ Conclusions
Based on the ldquoStarting Joint Minister Statement on
free trade agreement between China and South Koreardquo
the article explains the basic ideas of this agreement
Through the analysis of the investment interests and
trade interests of China and Korea it finds that
intermediate import and export products in China and
Korea trade rank first and the goods trade in
production is considerably higher than that in
consumption This formation of structure of goods
trade can be reasonably explained by Korearsquos direct
investment in China Through the analysis of
producersrsquo interests and the consumers in China and
Korea it finds that if China and Korea reach a free
trade agreement that excludes Korearsquos agriculture from
free trade as a sensitive product it will sacrifice the
majority of consumersrsquo interests and only protects the
interests of minor agricultural producers If Chinarsquos
petrochemical and machinery are separated from
China-Korea free trade agreement negotiations it will
also sacrifice the majority of consumersrsquo interests and
only protect the investorsrsquo interests Therefore it
shows firstly the insight on interests is significantly
different between the declaration and theoretical
research Secondly Chinarsquos diplomatic interests are
bigger than its trade significance and Korea protects its
investment interests in China through trade agreements
Thirdly both countries are trying to protect their
producersrsquo interests through trade agreements
Finally this paper uses the global trade analysis
project (Global Trade Analysis Project GTAP) model
and proposes ldquofull abolition of trade in goods tariffs
between China and Koreardquo and ldquoKorearsquos exceptions
on its high tariff food and crop sectors Chinarsquos
exceptions on industrial sector (light manufacturing
and heavy industry) and tariffs on other sectors
reduced by halfrdquo It predicts the economic benefits of
China-Korean free trade zone by two sets of simulation
programs from three aspects macroeconomic and
welfare effects trade effects as well as industry effects
It finds that after the establishment of a China-Korean
free trade zone regardless the level of tax reduction it
will promote the growth of the national economy and
improve the social welfare and import and export
Trade conditions and output will be improved with
industrial optimization and upgrading of industries in
two countries For the other regions in the world it will
bring negative and adverse changes
References
Baiming Z Jiang Y amp Maohong L (2010) Biased
investment by state-owned and foreign enterprises
and its production-trade effect Wuhan University
Journal (Philosophy amp Social Sciences) 2010(1)
117-124
ChinaStatistics (2011) China Statistical Yearbook
of 2011 Central Hong Kong Author Retrieved
from httpwwwchinastatisticsnetchina-
statistical-yearbook-2011-m-23html
Fang Z H A O amp Ji L I (2010) A research on
trade status and intra-industry trade between China
and South Korea Journal of Jilin Normal Uni-
versity (Humanities amp Social Science Edition)
2010(4) 52-56
Jianxin H P W (2010) The design of FTA nego-
tiation strategy between China and Korea based on
GTAP simulation World Economy Study 2010(6)
81-86
Li Y amp Zhou W F (2008) The investment from
Korea to China The present situation trend and
Chinarsquos policies Economic Research Guide
2008(3) 158-160
Analysis of the Interests of Conceiving a Free Trade Agreement between China and South Korea
60
Li X F amp Gui J X (2009) An empirical analysis of
the impact of the establishment of China-Korea
FTA on bilateral trade International Economics
and Trade Research 2009(5) 4-8
Li X Z (2010) The trade between China and Korea
and its structure change International Studies
2010(6) 48-52
Song J G (2011) The study of free trade agreement
between China and South Korea based on the
gravity model Contemporary Economic Research
2011(5) 81-85
United Nations Statistics Division (nd) Commodity
Trade statistics database New York NY Author
Retrieved from httpcomtradeunorgdata
Watanabe (2009) The possibility about the FTA
among Japan Korea and China The Economist
2009(12) 5-12
World Trade Organization (nd) World Customs
Data 2011 Retrieved from httpwwwwtoorg
statistics
Xin Z Rong R D amp Yan C (2006) An empirical
analysis of the influence about the direct
investment from Japanese South Korean to China
on the scale and industry Journal of International
Trade 2006(10) 44-50
Xue J X amp Zhang B (2004) The economic coope-
ration arrangements in East Asia A comparative
study based on the general equilibrium model The
Journal of World Economy 2004(6) 51-59
Ye J Y amp Wang P (2005) The analysis of the trade
deficit between China and Korea Economic
Science 2005(1) 115-126
Zheng Z S (2009) The strategic motivation com-
parison of FTA promotion between China and
Korea Commercial Times 2009(33) 35-36
J Glob Bus Trade Vol 9 No 2 (November 2013) 61-71
61
ISSN 1946-5130
Journal of Global Business and Trade
wwwiagbtcom
Stock Market Development and Economic Growth the Case
of the Philippine Stock Market
Princess Jace N Sta Mariaa and Agham C Cuevas
b
ab College of Economics and Management University of the Philippines Los Bantildeos Philippines
Received 25 August 2013 Revised 27 September 2013 Accepted 30 October 2013
ABSTRACT
The general objective of this study is to analyze the level of stock market development of the Philippine Stock
Exchange as reflected by its liquidity position and its implications to economic growth in the Philippines
Stock market liquidity was analyzed through its three liquidity measurements turnover ratio total value of
traded shares ratio and the market size ratio This study used Ordinary Least Squares (OLS) in analyzing the
relationship between stock market liquidity and economic growth using quarterly data from 1996 to 2012
Stock market liquidity as measured by the growth in value of traded shares and the growth in market size is
significantly related to the growth of the economy after controlling for variables such as inflation which
lagged by one period growth in foreign direct investment and openness to trade Further analysis showed that
the growth in market size causes economic growth However the determinant of the growth in value of traded
shares does not exhibit Granger causality but is proven to have a long run relationship as shown from the
results of the Error Correction Model
Keywords economic growth Philippine stock exchange stock market development stock market liquidity
Ⅰ Introduction11
Financial markets and intermediaries play a
significant role in the growth of the economy by
improving financial efficiency that would in turn
provide better allocation of resources As savers or
lenders hold current consumption for future expendi-
ture borrowers desire current consumption or invest-
ment that would eventually yield higher returns in the
future These institutions are responsible for main-
taining a healthy monetary economy in the country as
they mobilize and convert savings into funds and
channel them to borrowers or investors to further
2013 International Academy of Global Business and Trade
All rights reserved
allocate them to more productive investments
(Mishkin 2006) An efficient stable and vibrant stock
market is essential to the development of the financial
sector Stock markets are responsible for the expansion
of a companyrsquos capital by allowing stocks or shares to
be sold or traded in public
Kanasro Jalbani and Junejo (2009) stated that
stock markets play a crucial role in capital mobilization
and provide secondary markets for the investors and
financial institutions to buy and sell securities A stock
market is considered to be liquid when large
transactions are executed with only a small impact on
prices of securities Stock market liquidity is thus
considered a good tool to measure the efficiency of a
stock market A marketrsquos stability is also determined
Stock Market Development and Economic Growth the Case of the Philippine Stock Market
62
through the liquidity of its securities or the ease at
which these securities are bought or sold in the market
The Philippine Stock Exchange (PSE) the sole
stock market of the Philippines was established on
December 23 1993 when the respective founders of
both the Manila Stock Exchange (MSE) and the
Makati Stock Exchange (MKSE) decided to combine
the two exchanges to further develop a more efficient
capital market During the past decade the PSE has
been robust in terms of the daily value traded Both
foreign and domestic market capitalization which is
the measure of the size of listed companies in the stock
market has been increasing since 2002 In January
2013 the Philippine Stock Exchange index (PSEi) the
indicator used to measure the performance of active
and highly capitalized listed Philippine companies in
the PSE breached the 6000 level an all-time high in
Philippine stock market history
The general objective of the study is to analyze the
liquidity of the Philippine stock market and its
implications for economic growth Liquidity is
important as it is an aspect of a stock market that is
necessary for the traders to interact Specifically the
study aims to measure the liquidity of the Philippine
stock market and evaluate its trends for the given
period determine the linkages between stock market
liquidity and growth of the economy and determine the
causality between stock market development and
economic growth in the Philippines
The paper is organized as follows The next two
sections review the related literature followed by the
analytical and empirical framework The fourth section
discusses the results while the last section provides the
conclusion
Ⅱ Review of Related Literature
21 Stock Market Development as a
Determinant of Economic Growth
Several studies have been conducted on the
relevance of stock market development to economic
growth As cited by Petros (nd) the stock market
provides the fulcrum for capital market activities and it
is often cited as a barometer of business direction An
active stock market may be relied upon to measure
changes in general economic activities using the stock
market index (Obadan 1995) According to Petros
(nd) directly or indirectly a stock market through its
specific services can contribute to economic growth
Mobilization of savings creation of liquidity risk
diversification improved dissemination and acquisi-
tion of information and enhanced incentive for cor-
porate control are functions that are notably significant
thus by improving the efficiency and effectiveness of
these functions it can amplify the economic growth
rate
Tapitan (2012) highlighted the role of financial
intermediaries as a prerequisite for economic growth as
they play an important role in technological progress
The financial system affects capital accumulation by
altering the saving or by reallocating savings among
different capital producing technologies The key
assumption is that better technology is produced as a
by-product of capital investment
Capital investments are important in boosting the
growth of the countryrsquos economy As cited by Nagai-
shi (1999) Levine (1997) identified two channels in
which financial markets or intermediaries affect
economic growth through capital accumulation and
technological innovation In 1999 Garcia and Liu
(1999) identified three main channels through which
financial markets and intermediaries may affect
economic growth The first is by stimulating savings
Financial markets or intermediaries provide savers
with a relatively higher yield McKinnon (1973) and
Shaw (1973) (as cited by Garcia amp Liu 1999) claimed
that financial deepening improves not only produc-
tivity of capital but also the saving rate and therefore
investment and growth Second this can be done by
reducing information and transactions costs because
we know that high transaction costs would definitely
have a negative effect on trading for these discourage
people from transacting thus affecting onersquos profit
Lastly by promoting an efficient allocation of invest-
ment the allocation of resources is improved
J Glob Bus Trade Vol 9 No 2 (November 2013) 61-71
63
22 Stock Market Liquidity
Stahel (2004) (as cited by Benić amp Frani 2008)
argues that due to stock market integration investors
would tend to move their capital to where they expect
higher returns on their investments Von Wyss (2004)
(as cited by Benić amp Frani) defined four aspects or
dimensions of financial market liquidity the trading
time tightness depth and resiliency These dimen-
sions of liquidity may be presented with five different
levels of liquidity 1) the ability to trade at all 2) the
ability to buy or to sell a certain amount of an asset
with an influence on the quoted price 3) the ability to
buy or to sell a certain amount of an asset without any
influence on the quoted price 4) the ability to buy and
to sell an asset at about the same price at the same time
and 5) the ability to execute a transaction from points
two to four immediately
Sarr and Lybek (2002) claim that illiquid markets
are more of a symptom rather than a cause of
inadequate market functioning They posit that in order
to foster liquid financial markets sound and
transparent economic policies with appropriately
designed trading clearing and settlement systems as
well as appropriate intervention policies of the central
bank which can help contain systematic risk are the
only sustainable solution
Levine and Zervos (1998) investigated whether
measures of stock market liquidity size volatility and
integration with world capital markets are robustly
correlated with current and future rates of economic
growth capital accumulation productivity improve-
ments and saving rates They used data on 49
countries from the period 1976 to 1993 They
evaluated whether the stock market indicators together
with banking development are correlated with the
growth indicators Stock market development
indicators include the size in which capitalization is
measured by the value of listed domestic shares on
domestic exchanges divided by GDP the liquidity
which is measured by the turnover ratio and the value
traded ratio Using the international capital asset
pricing model (CAPM) and international arbitrage
pricing theory (APT) they concluded that stock market
liquidity and banking development are both positively
and robustly correlated with contemporaneous and
future rates of economic growth capital accumulation
and productivity growth Also both a stock market and
banks provide different financial services that could
actually help the economy as a whole On the other
hand based on their study they find no support that
these indicators reduce private savings rate or hinder
long run growth
Levine (1996) tested the liquidity of stock markets
for 38 countries (1976-1993) that include both Indus-
trial and developing countries Three measurements for
liquidity were used the total value of shares traded on
a countryrsquos stock exchanges as a share of GDP the
value of traded shares as a percentage of total market
capitalization or the turnover ratio and the value-
traded-ratio divided by stock price volatility He
claimed that a liquid market should be able to handle
heavy trading without large price swings Thus
empirically stock market size and volatility do not
matter but the ease of which shares can be traded The
results suggest that stock market liquidity helps
forecast economic growth even after accounting for a
variety of nonfinancial factors that influence economic
growth Stock market liquidity is still a reliable
indicator of future long term growth after controlling
for inflation fiscal policy political stability education
the efficiency of the legal system exchange rate policy
and openness to international trade
Ⅲ Analytical and Empirical
Framework
Stock markets contribute in easing financial
activities as well as guiding the countryrsquos firms and
investors to allocate their funds efficiently Levine
(1996) showed that countries that had more liquid
stock markets enjoyed both faster rates of capital
accumulation and greater productivity gains Stock
markets through creation of liquidity affect economic
activity by less risky investment in equity markets
which allows savers to acquire assets and quickly sell
Stock Market Development and Economic Growth the Case of the Philippine Stock Market
64
them As Fig 1 shows liquid markets improve capital
allocation that would in turn enhance growth in the
economy
Levine (2003) identified three core sources of
theoretically ambiguous relationships between econo-
mic growth and stock market liquidity He first stated
that stock market liquidity lowers the risk of investing
in longer-run higher return projects and in
consequence fosters a growth-accelerating reallocation
of capital The lower risk however affects savings and
capital accumulation rates ambiguously so that
aggregate growth will slow if savings rate fall enough
Second the cost of investing in the long run is lower
Higher rate of return on savings affects savings and
capital accumulation rates ambiguously so that growth
will fall if capital accumulation rates fall enough
Finally stock market liquidity affects incentives for
investors to undertake the costly processes of
researching and monitoring firms and managers
ambiguously Liquidity will affect growth positively if
stock market liquidity encourages agents to evaluate
and exert corporate control
31 Measures of Stock Market Liquidity
The study adopted two measurements of liquidity
used by Kanasro et al (2009) to determine the
efficiency of the Philippine stock market through
liquidity of its shares Stock market liquidity is
hypothesized to be
SML = f (TVTS MSIZE) (1)
Where
SML -- Stock Market Liquidity
TVTS -- Total Value of Traded Shares Ratio
MSIZE -- Market Size Ratio
The Total Value of Traded Shares Ratio (TVTS)
measures the value of equity transactions relative to the
size of the economy The formula for computing the
total value of traded shares ratio is as follows
TVTS = Total Value of Traded Shares
Gross Domestic Product (2)
The Market Size Ratio (MSIZE) measures the size
of the Philippine Stock Exchange in accordance with
the market capitalization as the ratio of GDP of the
Philippines during the sample period
MSIZE = Gross Domestic Product (3)
Market Capitalization
Fig 1 Schematic Diagram for Stock Market
Liquidity and Economic Growth (Levine
1996)
32 Empirical Model
To analyze the relationship between the liquidity of
the Philippine Stock Exchange (PSE) and economic
growth in the Philippines the two measures for stock
market liquidity in logarithm form were regressed to
the logarithm of Gross Domestic Product (LNGDP)
together with the other factors that influence economic
J Glob Bus Trade Vol 9 No 2 (November 2013) 61-71
65
growth using Ordinary Least Squares (OLS) This
study also adopted the regression model of Levine
(2003) Nurudeen (2009) and Mohtadi and Agarwal
(nd) The model directly examined the relationship
between stock market liquidity and economic growth
The regression model is as follows
LNGDP = β0 + β1 LN (TVTS) + β 2 LN (MSIZE)
+ β3 LN (OPEN) + β4 LN (FDI)
+ β4 (INFLAG) + μ (4)
Where
LNGDP -growth in Gross Domestic Product
LNTVTS-growth in Total Value of Traded
Shares Ratio
LNMSIZE-growth in Market Size Ratio
LNOPEN -growth in Openness to Trade
LNFDI-growth in Foreign Direct Investment
INFLAG-Inflation Rate lagged by one period
β-parameter of the indicators
micro-the error term
The variables in the model above are defined as
follows LNGDP refers to economic growth and it is
measured as the logarithm of the real GDP The
LNTVTS is the growth in Total Value of Traded
Shares Ratio and it is measured by dividing the total
value of traded shares with the gross domestic product
and transformed to its natural logarithm The
LNMSIZE is the growth in Market Size Ratio
measured by dividing the gross domestic product to
the market capitalization and transformed to its natural
logarithm LNOPEN refers to the growth in openness
to trade and it is measured by tariff revenues which is
measured by tariff rate multiplied by imports divided
by the sum of imports and exports and transformed to
its natural logarithm LNFDI refers to growth in
foreign direct investment INFLAG is the inflation rate
lagged by one period and μ is the error term
It is hypothesized that an increase in the growth in
total value of traded shares and market size should
increase the growth of the economy The variables
LNOPEN LNFDI INFLAG were used as control
variables to gauge the strength of the correlation
between stock market liquidity and economic growth
for the given period The inflation rate lagged by one
period (INFLAG) is the percentage rate of the change
in the general changes in the price level thus it
measures the monetary instability that negatively
affects economic performance Its lagged effect was
assigned to serve as a proxy for expected future
inflation Foreign direct investment (FDI) was
expected to augment savings and increase the rates of
capital accumulation giving a positive relationship to
economic growth Openness to trade (OPEN) refers to
the openness to international trade of the economy as
trade openness fosters competition in global markets it
was expected that its growth will have a positive
relationship with economic growth
Ⅳ Results and Discussion
This study used a simple Ordinary Least Squares
(OLS) method to determine and further analyze the
relationship between the level of stock market
development as proxied by liquidity position of the
Philippine stock market and economic growth It also
attempted to provide evidence on the existence of a
long run relationship between stock market
development and economic growth through the use of
the Granger Causality test
41 Liquidity of the Philippine Stock
Exchange
The Turnover Ratio measures the value of equity
transactions relative to the market size A high turnover
is an indicator of low transaction cost (Levine amp
Zervos 1998) The turnover position of the Philippine
Stock Exchange has experienced fluctuations The
Ramos administration (1992-1998) experienced a
steady growth in the economy during which the
Philippines Stock Exchange (PSE) was unified
However due to the 1997 Asian financial crisis its
performance declined Under the administration of
Stock Market Development and Economic Growth the Case of the Philippine Stock Market
66
Estrada a decline in the performance in the PSE can be
seen From a 1262 turnover ratio in 1999 it declined
to 218 in 2000 due to poor governance and
economic policies that affected the confidence among
potential investors The economic reforms and policies
under the Arroyo administration improved growth in
the economy giving stock market significant inflows
gaining back investorsrsquo confidence Due to different
problems that the economy experienced coupled with
the global crisis as shown in Fig 2 the trend continued
to be volatile The average turnover ratio of PSE is
380 during the sample period
The Total Value of Traded Shares Ratio (TVTS)
measures the value of equity transactions relative to the
size of the economy There are significant jumps in the
liquidity (total value of shares traded to GDP) in the
last six years Its TVTS ratio has grown to almost 28
The overall average liquidity during the sample period
is 65
Fig 2 Liquidity at Philippine Stock Exchange
(PSE) using Turnover Ratio (TOR) and
Total Value of Traded Shares (TVTS)
The Market Size (MSIZE) measures the size of the
Philippine Stock Exchange in accordance with the
market capitalization as the ratio of GDP of the
Philippines during the sample period As shown in Fig
3 the size of the PSE remained very small from the
year 1996-1999 which had about 3-5 until 2000
when it increased to almost 40 The 1997 Asian
financial crisis caused instability in the financial sector
and only a few companiesrsquo securities were listed The
overall average size of the market has remained only
254 of GDP which seemed to be low in comparison
with other developing markets Since the unification of
the Makati Stock Exchange and the Manila Stock
Exchange in 1993 the Philippine Stock Exchange has
remained relatively small As of May 2012 there are
344 listed companies in the PSE
Fig 3 Liquidity at the Philippine Stock Exchange
using Market Size (MSIZE)
42 Regression Results
The study used 67 observations from the first
quarter of 1996 to the third quarter of 2012 Three
variables were found to be significant using the
Ordinary Least Squares (OLS) method These
variables were the growth in total value of traded
shares (LNTVTS) growth in market size (LNMSIZE)
growth in openness to trade (LNOPEN) The turnover
ratio was not used as a determinant of liquidity as
Levine and Zervos (1996) states that the turnover ratio
measures trading of firmrsquos equities relative to the size
of the market and does not satisfy the degree in which
liquidity services on a macroeconomic scale Thus it
would not be providing significant liquidity to the
economy as a whole Therefore a large stock market is
not necessarily a liquid market
The Durbin-Watson and Breusch-Godfrey tests
were used to test for the presence of autocorrelation
Having found to have positive autocorrelation the
Cochrane-Orcutt Transformation was used as a
remedy to minimize the autocorrelation problem Table
1 shows the regression results after the Cochrane-
Orcutt Transformation
J Glob Bus Trade Vol 9 No 2 (November 2013) 61-71
67
From Table 1 results show that the effect of
growth on the total value of traded shares and the
growth of the market size on economic growth is
positive and statistically significant at the 1 level
The control variables which are the growth of
openness to trade and growth of foreign direct
investment also have the expected signs which are
positive however these variables are not significant
even at the 10 level The results also show that the
variable of inflation lagged by one period is negatively
related to economic growth and significant at the 10
level
Table 1 Cochrane-Orcutt Transformation Regression
Results
Variable Coefficient Std Error t-statistic Probability
LNTVTS 0134 0037 362 0001
LNMSIZE 0826 0046 1800 0000
INFLAG -0025 0013 -196 0055
LNOPEN 0269NS 0240 112 0268
LNFDI 0009NS 0009 100 0322
_cons 8062 0646 1248 0000
R2 = 09488 Prob gt F = 0000
Adjusted R2 =09445 DW Statistic
(transformed) = 2005368
Notes 1 significant at 1 level of significance
2 significant at 5 level of significance
3 significant at 10 level of significance 4 Values were rounded off to three decimal
places
Stock markets contribute to economic develop-
ment by enhancing the liquidity of capital investments
(Levine 1997) Moreover by increasing the quantity
and productivity through improved allocation of
capital as well as reducing the need to hold liquid
balances a liquid stock market would augment econo-
mic growth The results showed that the relationship
between the growth of market size (MSIZE) and
economic growth is positive and significant in
explaining economic growth in the Philippines as it
was used as a proxy for liquidity The coefficient 0826
implies that a 1 increase in growth of market size
would lead to an increase of 0826 in the growth of
GDP The result provides proof that the size of the
Philippine Stock Exchange (PSE) during the given
period determines the ability of the market to mobilize
savings improve the quality and quantity of invest-
ment and accelerate economic growth since the role of
the PSE is to bring companies together to raise capital
through securities
The other measure for liquidity has a positive and
significant effect on economic growth The growth in
total value of traded shares (LNTVTS) has a coeffi-
cient of 0134 implying that a 1 increase in the
growth of total value of traded shares will increase
economic growth by 0134 Since the growth of
TVTS measures the trading of firmrsquos equity as a share
of GDP its liquidity therefore positively reflects on an
economy-wide basis (Levine amp Zervos 1996)
Inflation (INFLAG) which was lagged by one
period conforms to economic theory by having a
negative relationship with economic growth since it
affects economic performance through monetary
instability It has a coefficient of -0025 which is
statistically significant at 10 level This means that a
1 increase in the inflation rate leads to a decrease in
the growth of GDP by 0025
The coefficient of the growth in openness to trade
(OPEN) conforms to the standard economic theory
since it is positively related to economic growth even
if it was used as a control variable The coefficient of
0269 implies that over the study period a 1 increase
in the degree of trade openness leads to approximately
0269 increase in growth of GDP Also there is a
positive relationship between the growth of foreign
direct investment (FDI) and economic growth since
FDI helps to supply long-term capital with new
technologies managerial and marketing capabilities
that would in turn augment economic growth through
employment increasing managerial skills diffusing
technologies and fostering innovations (Asiedu 2002
as cited by Adhikary 2011) The coefficient of 0009
implies that over the study period a 1 increase in the
degree foreign direct investment would lead to 0009
increase in growth of GDP
However results for openness to trade and foreign
direct investment in the model proved to be statistically
Stock Market Development and Economic Growth the Case of the Philippine Stock Market
68
insignificant after using these as control variables
along with the stock market liquidity measurements
The explanatory power or the goodness of fit of the
model as measured by the R-squared is at 09488
which means that 95 can be explained by the model
and it has a very strong fit The value indicates that
economic growth in the Philippines is adequately
explained by the model for the period between the first
quarter of 1996 to the third quarter of 2012 or that 95
of the variation in the growth of economic activities is
explained by the independent variables Moreover the
relationship between liquidity and growth remains
strong even after controlling for inflation foreign direct
investment and openness to trade Thus raising stock
market liquidity may independently produce
substantial growth
43 Long Run Relationship and Causality
431Test for Stationarity
One of the conditions in order to test Granger
Causality between the two variables is through its
stationarity It is important to know if the variable is
stationary or does not have a unit root or if the variable
is nonstationary or the variable contains a unit root
The variables LNTVTS LNMSIZE and LNGDP
were not stationary in their respective level forms
Thus for testing of the unit roots the Augmented
Dickey Fuller (ADF) test was used for the two
measurements of stock market liquidity which are the
LNTVTS and LNMSIZE and the proxy for economic
growth LNGDP The ADF includes the additional
lagged terms which can be examined by the Akaike
Information Criterion (AIC) to ensure that the errors
are uncorrelated If the variable is nonstationary at
level form but stationary after first differencing the
variable is integrated of order 1 and has a unit root
Using the said test variables LNTVTS LNMSIZE
and LNGDP are stationary after first differencing The
results for stationarity are shown in Table 2
Table 2 Stationarity Test Results
Variables Level Form P-value First Difference P-value
LNGDP 05891 lags (4) 00015 lags (4)
LNTVTS 06311 lags (4) 0000 lags (3)
LNMSIZE 03335 lags (4) 00039 lags (4)
Notes 1 significant at 1 level of significance
2 significant at 5 level of significance
432 Test for Cointegration
Since the stationarity of the variables have been
established the cointegration of the indicators of stock
market development and economic growth were tested
The results for the Cointegrating Regression Dickey
Fuller Test are shown in Table 3
Table 3 Cointegrating Regression Dickey Fuller
Test Results
Regressed Variables P-value
LNTVTS and LNGDP 00250
LNMSIZE and LNGDP 00545
Note significant at 5 level of significance
The regression results suggest that LNTVTS is
cointegrated with LNGDP Thus LNTVTS has a
long-run relationship with LNGDP which means
LNTVTS share a common stochastic drift or a
common trend with LNGDP The results also suggest
that LNMSIZE is also cointegrated with LNGDP
because the error term is stationary
433 Granger Causality
Granger Causality can only be tested if variables
are stationary and variables are cointegrated It is used
to establish whether a uni-directional or bi-directional
relationship exists between stock market development
and economic growth Results showed that LNTVTS
and LNMSIZE are both stationary and cointegrated
with LNGDP Table 4 shows the optimal number of
lags used in each determinant through Akaike
Information Criterion Table 5 shows the result of the
Granger Causality test
J Glob Bus Trade Vol 9 No 2 (November 2013) 61-71
69
Table 4 Akaike Information Criterion
LNGDP LNTVTS LNMSIZE
Lags AIC AIC AIC
0 212598 237417 215782
1 168524 222582 181308
2 164703 223876 179562
3 14775 214879 172127
4 14659 216273 167974
Note indicates the optimal number of lags
The results of the Granger Causality tests indicated
that there is a unidirectional causality between stock
market liquidity using the growth in the market size as
proxy and economic growth However results show
that there is no causality between growth in total value
of traded shares and economic growth Growth in total
value of traded shares and economic growth may have
a long-run relationship since they are cointegrated but
they do not exhibit Granger causality
Table 5 Granger Causality Test Results
Variable Computed
Statistic
F Tabular
Value
Granger
Causality
LNTVTS to
LNGDP 093NS 04532 No
LNGDP to
LNTVTS 038NS 07660 No
LNMSIZE to
LNGDP 347 00136 Yes
LNGDP to
LNMSIZE 037NS 08293 No
Notes 1 significant at 5 level of significance
2 NS - indicates insignificance
Since the variables LNTVTS and LNGDP were
found to be cointegrated an Error Correction Model
(ECM) was specified to test for the speed of
adjustment in the said determinants when one of these
variables experiences a shock Table 6 shows the Error
Correction Method results for LNTVTS and LNGDP
Table 6 Error Correction Method Results
Variables Speed of Adjustment
LNTVTS and LNGDP -0143817
Note significant at 5 level of significance
It can be observed from the results that LNTVTS
as the measure of stock market liquidity and LNGDP
for economic growth have the coefficient of the error
correction term with a negative sign and it is
statistically significant at the 5 level of significance
Thus the significance of the error correction mecha-
nism supports cointegration and suggests the existence
of a long-run equilibrium relationship between economic
growth and stock market development determinant
LNTVTS In other words the coefficient of the error
correction term which measures the speed of adjust-
ment back to equilibrium whenever the system is
experiencing a shock indicates that it would take 6953
asymp 7 quarters for a variable to adjust whenever one
experiences a shock
Ⅴ Summary and Conclusion
This research work studies stock market develop-
ment and its implications to economic growth by
analyzing the relationship between the stock market
measurements for liquidity and GDP growth in the
Philippines The specific objectives of the study were
to measure the liquidity of the Philippine stock market
and evaluate its trends for the given period determine
the linkages between stock market liquidity and
growth of the economy and to determine the causality
between stock market development and economic
growth
Using Ordinary Least Squares (OLS) method for
the time series data covering the period of the first
quarter of 1996 to the third quarter of 2012 it was
shown that the role of the stock market is essential to
economic growth in a developing country like the
Philippines The two measures used for liquidity the
growth in total value of traded shares and the growth in
market size were both positively related to economic
growth and statistically significant However results
for the growth in openness to trade and foreign direct
investment in the model proved to be statistically
insignificant after using it as control variables along
with the stock market liquidity measures Inflation on
Stock Market Development and Economic Growth the Case of the Philippine Stock Market
70
the other hand which was lagged by one period
conforms to theoretical conventions by having a
negative relationship to economic growth since it
affects economic performance because of monetary
instability About 95 of the variation in economic
growth is explained by the independent variables
Moreover the relationship between liquidity and
growth remains strong even after controlling for
inflation foreign direct investment and openness to
trade Thus raising stock market liquidity may
independently produce substantial growth
In assessing the relationship between stock market
development and economic growth it empirically
proved that the measure of economic growth (LNGDP)
and all of the determinants for stock market liquidity ndash
LNTVTS and LNMSIZE were both stationary and
cointegrated For the case of the Philippines there is a
unidirectional causality between stock market liquidity
using the growth in the market size as proxy and
economic growth For LNTVTS stock market
liquidity does not ldquoGranger causerdquo economic growth
and vice versa Since the two indicators have a long
run relationship the results of the Error Correction
Model suggest that there is an adjustment in stock
market liquidity as proxied by growth in total value of
traded shares and economic growth whenever one of
the indicators experiences a shock
Admittedly the study only tested a portion of the
financial side the stock marketrsquos liquidity Other
important determinants of stock market development
such as price volatility elasticity in trading corporate
governance could also be incorporated to give more
robust results There are a wide variety of factors that
can affect economic growth both on the financial and
real sectors of the economy which needs to be taken
into consideration The empirical results indicate that
the potential of the Philippines Stock Exchange in
fostering growth in the country should further be
explored
References
Adhikary B K (2010) FDI trade openness capital
formation and economic growth in Bangladesh A
linkage analysis International Journal of Business
and Management 6(1) 16-28
Benić V amp Franić I (2009) Stock market liquidity
comparative analysis of Croatian and regional
markets Financial Theory and Practice 32(4)
477-498
Garcia V F amp Liu L (1999) Macroeconomic
determinants of stock market development Journal
of Applied Economics 2(1) 29-59
Kanasro H A Jalbani A A amp Junejo M A (2009)
Stock Market Liquidity A Case Study of Karachi
Stock Exchange Pakistan Journal of Commerce
Social Science 3 25-34
Levine R amp Zervos S (1996) Stock market
development and long-run growth The World
Bank Economic Review 10(2) 323-339
Levine R amp Zervos S (1998) Stock markets banks
and economic growth American Economic Review
537-558
Levine R (1996) Stock markets A spur to economic
growth Finance and Development 33 7-10
Levine R (1996) Stock market liquidity and economic
growth Theory and evidence Retrieved from
httpfacultyhaasberkeleyeduross_levinepapers
0845_001pdf
Levine R (1997) Stock markets economic develop-
ment and capital control liberalization Perspec-
tive 3(5) 1-8
Mishkin F (2006) The economics of money banking
and financial markets (10th ed) Upper Saddle
River NJ Prentice Hall
Mohtadi H amp Agarwal S (2001) Stock market
development and economic growth Evidence
from developing countries Available at http
www uwm edumohadiPA-4-01pdf
Nagaishi M (1999) Stock market development and
economic growth Dubious relationship Economic
and Political Weekly 2004-2012
J Glob Bus Trade Vol 9 No 2 (November 2013) 61-71
71
Nurudeen A (2009) Does stock market development
raise economic growth Evidence from Nigeria
The Review of Finance and Banking 1(1) 015-
026
Petros J (2012) The effect of the stock exchange on
economic growth A case of the Zimbabwe stock
exchange Research of Business Economics 6 1-
17
Sarr A amp Lybek T (2002) Measuring liquidity in
financial markets (Working Paper No 02232)
Washington DC IMF
Tapitan J P (2012) Measuring link between financial
development and economic growth using a sample
of selected ASEAN countries (Unpublished under-
graduate thesis) Los Banos Philippines Univer-
sity of the Philippines Los Bantildeos
Von W R (2004) Measuring and predicting liquidity
in the stock market (Doctoral dissertation) Retrie-
ved from httpwww1 unisgchwwwedisnsf
SysLkpByIdentifier2899$FILEdis2899pdf
Xiao X amp Kong L L (2012) An Empirical Study
on the Relationship between Turnover Rate and
Stock Returns in Chinese Stock Market Advances
in Information Technology and Management 2(1)
239-245
Yartey C A (2008) The determinants of stock market
development in emerging economies Is South
Africa different (Working Paper No 0832)
Washington DC IMF
J Glob Bus Trade Vol 9 No 2 (November 2013) 61-71
73
J Glob Bus Trade Vol 9 No 2 (November 2013) 1-9
7
negotiation The Handbook of Negotiation and
Culture 71-94
Barry B amp Friedman R A (1998) Bargainer
characteristics in distributive and integrative
negotiation Journal of Personality and Social
Psychology 74(2) 345
Barry B amp Oliver R L (1996) Affect in dyadic
negotiation A model and propositions Organiza-
tional Behavior and Human Decision Processes
67(2) 127-143
Blackman C (1977) Negotiating China Case studies
and strategies St Leonards Australia Allen amp
Unwin
Brenkert G G (1998) Trust morality and interna-
tional business Business Ethics Quarterly 8(02)
293-317
Brunner J A amp Taoka G M (1977) Marketing and
negotiating in the peoplersquos republic of China
Perceptions of American businessmen who atten-
ded the 1975 Canton Fair Journal of International
Business Studies 69-82
Butler J K (1995) Behaviors trust and goal
achievement in a win-win negotiating role play
Group amp Organization Management 20(4) 486-
501
Campbell N C Graham J L Jolibert A amp
Meissner H G (1988) Marketing negotiations in
France Germany the United Kingdom and the
United States The Journal of Marketing 52 49-62
Casse P (1981) Training for the Cross-Cultural Mind
(2nd ed) Washington DC Society for
Intercultural Education Training and Research
Cellich C (1995 January) Negotiations for export
business Elements for success In International
Trade Centre (ED) International Trade Forum
(No 4 p 20) Geneva Author
Clopton S W (1984) Seller and buying firm factors
affecting industrial buyersrsquo negotiation behavior
and outcomes Journal of Marketing Research 21
39-53
Coates A (1968) Myself a Mandarin Oxford UK
Oxford University Press
Davidson W H (1987) Creating and managing joint
ventures in China California Management Review
29(4) 75-95
Deutsch M Kelley H H amp Rapoport A (1964)
Strategic interaction and conflict Berkeley CA
Berkeley Institute of International Studies
University of California
Evans F B (1963) Selling as a dyadic relationship A
new approach American Behavioral Scientist 6
76-79
Fang T (1997) Chinese business negotiating style A
socio-cultural approach (Licentiate thesis)
Linkoping Sweden Inter-national Graduate School
of Management and International Engineering
(IMIE)
Fisher R Ury W amp Patton B (1991) Getting to
Yes (2nd ed) New York NY Penguin Books
Ganesan S (1994) Determinants of long-term
orientation in buyer-seller relationships The
Journal of Marketing 19(4) 1-19
Gardner L amp Aronson G (Eds) (1968) Handbook
of Social Psychology Reading MA Addison-
Wesley
George J M Jones G R amp Gonzalez J A (1998)
The role of affect in cross-cultural negotiations
Journal of International Business Studies 29(4)
749-772
Gilsdorf J W (1997) Metacommunication effects on
international business negotiating in China
Business Communication Quarterly 60(2) 20-37
Goh B C (1996) Negotiating with the Chinese
Euro-Asia Business Review 5(1) 34-36
Graham J L (1985) The influence of culture on the
process of business negotiations An exploratory
study Journal of International Business Studies
81-96
Graham J L (1986) The problem-solving approach
to negotiations in industrial marketing Journal of
Business Research 14(6) 549-566
Graham J L (1990) An exploratory study of the
process of marketing negotiations using a cross-
cultural perspective In E A Scarcella amp S
Krashen (Eds) Developing communicative
Negotiation Factors and Culture in Trade Negotiations
8
competence in a second language (pp 239-279)
Rowley MA Newbury House
Greenhalgh L amp Gilkey R W (1993) The effect of
relationship orientation on negotiatorsrsquo cognitions
and tactics Group Decision and Negotiation 2(2)
167-183
Gumperz J J (1982) Discourse strategies Cambridge
UK Cambridge University Press
Hall E T (1976) Beyond culture Garden City NY
Anchor Press
Hall E T (1989) The silent language New York
NY Bentam-Doubleday
Hofstede G (1991) Cultural and organization amp
software of the mind Berkshire England
McGraw-Hill
Hofstede G (2001) Culturersquos consequences (2nd ed)
Thousand Oaks CA Sage
Jones G R amp George J M (1998) The experience
and evolution of trust Implications for cooperation
and teamwork Academy of Management Review
23(3) 531-546
Kumar R (1997) The Role of affect in negotiations
an integrative overview The Journal of Applied
Behavioral Science 33(1) 84-100
Kumar R (2004) Culture and emotions in
international negotiations An overview In M J
Gelfand amp J M Brett (Eds) The handbook of
negotiation and culture (pp 95-113) Stanford CA
Stanford Business Books
Lewicki R J amp Stark N (1996) What is ethically
appropriate in negotiations An empirical examina-
tion of bargaining tactics Social Justice Research
9(1) 69-95
Lewis S A amp Fry W R (1977) Effects of visual
access and orientation on the discovery of
integrative bargaining alternatives Organizational
Behavior and Human Performance 20(1) 75-92
Linton R (1945) The cultural background of personality
New York NY Appleton-Century Crofits
McAllister D J (1995) Affect-and cognition-based
trust as foundations for interpersonal cooperation
in organizations Academy of Management
Journal 38(1) 24-59
Min H amp Galle W (1993) International negotiation
strategies of US purchasing professionals Interna-
tional Journal of Purchasing and Materials
Management 29(2) 40-50
Pennington A L (1968) Customer-salesman bargain-
ing behavior in retail transactions Journal of
Marketing Research 255-262
Pruitt D G (1981) Bargaining Behavior New York
NY Academic Press
Reardon K K amp Spekman R E (1994) Starting out
right Negotiation lessons for domestic and cross-
cultural business alliances Business Horizons
37(1) 71-79
Rempel J K Holmes J G amp Zanna M P (1985)
Trust in close relationships Journal of Personality
and Social Psychology 49(1) 95
Rubin J Z amp Brown B R (1975) The social
psychology of bargaining and negotiation New
York NY Academic Press
Salacuse J W (1991) Making global deals negotia-
ting in the international marketplace Boston MA
Houghton Mifflin
Sawyer J amp Guetzkow H (1965) Bargaining and
Negotiation in International Relations In H C
Kelman (Ed) International behavior A social-
psychological analysis (pp 464-520) New York
NY Holt Rinehart and Winston
Sebenius J K (2002) The hidden challenge of cross-
border negotiations Harvard Business Review
80(3) 76-85
Shenkar O amp Ronen S (1987) The cultural context
of negotiations The implications of Chinese
interpersonal norms The Journal of Applied
Behavioral Science 23(2) 263-275
SRI International (1979) Doing Business in Taiwan
and Doing Business in Japan [Pamphlet] Menlo
Park CA Schmidt K D
Stewart S amp Charles F K (1989) Talking with
dragon Negotiating in the peoplersquos republic of
China Columbia Journal of World Business 23(3)
68-72
J Glob Bus Trade Vol 9 No 2 (November 2013) 1-9
9
Strong K amp Weber J (1998) The myth of the
trusting culture a global empirical assessment
Business amp Society 37(2) 157-183
Thibaut J W amp Kelly W H (1959) The social
psychology of groups New York NY McGraw-
Hill
Triandis H C Kurowski L L amp Gelfand M J
(1994) Workplace diversity In H C Triandis M
D Dunnette amp L M Hough (Eds) Handbook of
industrial and organizational psychology (pp 769-
827) Palo Alto CA Consulting Psychologists
Tung R L (1982) US-China trade negotiations
practices procedures and outcomes Journal
of International Business Studies 25-37
Weiss S E (1993) Analysis of complex negotiations
in international business The RBC perspective
Organization Science 4(2) 269-300
Weitz B (1979) A critical review of personal selling
research The need for contingency approaches In
G Albaum amp G A Churchill (Eds) Critical
issues in sales management State of the art and
future research needs Eugene OR University of
Oregon
Yoshimatsu H (2005) Japanrsquos keidanren and free
trade agreements Societal interests and trade
policy Asian Survey 45(2) 258-278
Zandt V (1970) How to negotiate in Japan Harvard
Business Review 25-38
J Glob Bus Trade Vol 9 No 2 (November 2013) 11-21
11
ISSN 1946-5130
Journal of Global Business and Trade
wwwiagbtcom
Is the Agrochemical Industry Traversing the Organic Route
Insights and Directions for a Philippine Agrochemical
Trading Company
Jane Keneth M Mampustia Jeanette Angeline B Madamba
b Agnes T Banzon
c and
Loida E Mojicad
abcd College of Economics and Management University of the Philippines Los Bantildeos Philippines
Received 12 August 2013 Revised 22 September 2013 Accepted 25 October 2013
ABSTRACT
This paper explores the strengths weaknesses challenges and opportunities of a Philippine agrochemical
trading company as it thrives within its broader macro-environment In an era of climate change adaptation
and ailing global economies agrochemical companies within the food chain face even greater barriers to
survival and competitiveness The study revealed that the agrochemical industry has made baby steps in
encouraging farmers to adopt the natural or organic way of farming through the use of biopesticides and
biofertilizers as a response to climate change but price-sensitive farmers appear indifferent to the use of
biopesticides and biofertilizer and readily switch suppliers depending on product prices as well as the
promotional activities done by agrochemical trading companies These suggest that agrochemical usage will
continue to dominate global agriculture in the next couple of years while biologicals in organic agriculture
will account for a minimal percentage despite the trend toward sustainable agriculture To be sustainable it is
suggested that agrochemical trading companies introduce new brands for each product type formulate a
customer retention strategy for its dealers and independent business partners and pursue a market penetration
strategy to widen the customer base as they track their moves against a changing global agrochemical
industry
Keywords agrochemical industry biopesticides climate change adaptation organic agriculture sustainability
Ⅰ Introduction2
Agrochemicals also known as crop protection
products are those products or substances which are
used to effectively and actively manage the agricultural
ecosystem Agrochemical products include pesticides
herbicides insecticides and fungicides Synthetic
fertilizers hormones and other chemical growth agents
2013 International Academy of Global Business and Trade
All rights reserved
as well as concentrated stores of raw animal manure
may also be included in the list of agrochemical
products These products can be classified into four
categories inorganic pesticides organic pesticides and
pre-emergent and post-emergent herbicides These
chemicals play a vital role in controlling and restrain-
ing the damaging attacks of pests weeds fungi
diseases and other undesirable pests which pose
serious threats to global crop production The benefits
offered by agrochemical products are two-fold the
Is the Agrochemical Industry Traversing the Organic Route Insights and Directions for a Philippine
Agrochemical Trading Company
12
control of certain pests and diseases to improve crop
productivity and indirectly poverty alleviation (Fertili-
zer and Pesticide Authority 2012)
Fig 1 Benefits of Pesticides to Control Human and Livestock Disease Vectors and Nuisance Organisms
Source Cooper and Dobson as cited in Cuyson S (2007)
Pesticide products when used properly can give
benefits not only to the community but to the whole
society as shown in Fig 1 Problems which most
farmers complain about like fast-growing weeds and
threats to crop productivity can be resolved through the
application of herbicide The application would reduce
cost of labor and fuel specifically for large plantations
Safety for the environment and human health is also
emphasized Careful regulatory policies are implemented
by the FPA so that the environment and human health
would not be at risk Although chemical-based crop protection products
have contributed time and again toward increasing
farmersrsquo incomes because these products prevent
massive crop losses caused by pests and diseases Due
to the need to efficiently meet demand farmers and
other agribusiness entities have to constantly rely on
crop-protecting chemical products since it only takes a
short period to harvest crops with the help of these
products (Tirado 2008) Agrochemical products as
well as the widespread use of irrigation have largely
contributed to the increase in agricultural production
On the other hand health concerns have caused a
negative perception of agrochemicals since over-
utilization of these products have caused problems
such as toxicity of the soil pollution and food poisoning
Established multinational companies involved in
the agrochemical industry as well as local companies
are pressured to effectively address the agricultural
trend of shifting to organic farming and developing
more environmentally-friendly products In addition
there are government policies to which they must align
their objectives with societal welfare in mind Non-
government organizations (NGOs) and environmental
groups such as Greenpeace have been actively making
their moves against crop protection companies With
this scenario players in the industry are bound to
strategize on how to improve product safety to defend
themselves from the actions of such groups in the
interest of sustainability
Phil-Agrochemicals Trading (not the real name) is
a nationwide distributor of generic agrochemical products
located in Southern Luzon Philippines Its distribution
network includes dealers independent business partners
(IBPs) and wholesalers The market may be skeptical
about the efficacy of generic agrochemical brands but
J Glob Bus Trade Vol 9 No 2 (November 2013) 11-21
13
this small company strives to be more responsible for
their products through continuous research on ways to
improve their products and demonstrate such efficacy
in crop protection Knowing their products may have
detrimental effects for the farmers if not properly used
the company conducts seminars or farmersrsquo group
meetings on the safe use of their products They also
give protective gear such as masks and gloves to the
farmer participants Products which are traded by this
company are manufactured by several suppliers in the
Philippines such as AgChem Manufacturing Corpora-
tion Radisson Agrochemical Corporation and Kemistar
Corporation These manufacturing compa-nies are
members of the Crop Protection Association of the
Philippines (CPAP) one of the leading crop protection
chemical associations in the country Phil-Agroche-
micals Trading also imports agrochemicals (speci-
fically insecticides) from Bharat Agro Chemicals in
India and China Xiamen Top using Import amp Export
Co Ltd from China About 10 of their total
inventory comes from imported insecticides Currently
Phil-Agrochemicals Trading which also distributes
products of its sister company has fifteen pesticide
products and two plant nutrition products in its
inventory pipeline
With the stiff competition in the Philippine agro-
chemical industry brought about even more by the
institution of Republic Act No 10068 (also known as
the Organic Act of 2010) the company has to find
ways to better strategize so as to gain customer trust
encourage continued patronage and improve overall
company performance The company has about eight
direct competitors
This paper aims to present an overview of the
agrochemical industry compare the firmrsquos operational
and functional strategies with the practices in the
industry identify and assess the problems and oppor-
tunities pertaining to these strategies and compare
these with its competitorsrsquo strategies and suggest
solutions to the problems or strategies to take
advantage of opportunities in view of the challenges of
going organic and the overall demand for the greening
of agriculture
II Methodology
Primary data for this exploratory research were
gathered from surveys and interviews with four
company officerspersonnel 60 farmers five indepen-
dent business partners and five dealers as well as an
actual apprenticeship at Phil-Agrochemical Trading
over a two-month period by the major author
Secondary data were obtained from printed sources
found at several government institutions such as the
Crop Protection Association of the Philippines (CPAP)
and the Fertilizer and Pesticide Authority (FPA)
company files and other printed or online publications
and unpublished special problem reports at the College
of Economics and Management library Descriptive
analysis combined with a comparative competitor analysis
and a SWOT analysis was used in this research
Ⅲ Review of Literature
Zhang et al (2011) identified three phases in the
history of pesticides and its application (1) the first
phase which covered the period before the 1870s saw
the use of natural pesticides (such as sulfur in ancient
Greece) as a pest control measure (2) the second phase
from the 1870s to 1945 saw the advent of inorganic
synthetic pesticides and the use of natural materials
and inorganic compounds and (3) the third phase
(from 1945 onwards) marked the era of organic
synthetic pesticides (eg DDT 24-D and later HCH
dieldrin) Since then humans synthesized most
pesticides which were later referred to as chemical
pesticides It was during the third phase (the era of
organic synthetic pesticides) when there was a boost in
agricultural productivity which became a moving force
for the advancement of human civilization
During the earlier portion of the third phase three
kinds of insecticides were used carbamated insecticides
organophosphorus insecticides and organochlorined
insecticides This was soon followed by the develop-
ment of herbicides and fungicides As seen in Table 1
herbicide use increased from 20 in 1960 to 48 in
2005 Herbicides comprised almost half of total
pesticide consumption in 2005 (Zhang et al 2011)
Is the Agrochemical Industry Traversing the Organic Route Insights and Directions for a Philippine
Agrochemical Trading Company
14
Table 1 Changes of Pesticide Consumption Worldwide
CATEGORY 1960 1970 1980 1990 2000 2005
Sales Sales Sales Sales Sales Sales
Insecticides 310 365 1002 371 4025 347 7655 29 7559 279 7798 25
Herbicides 170 20 939 348 4756 14 1162
5
44 1288
5
475 1497
1
48
Fungicides amp Bactericides
340 40 599 222 2181 188 5545 21 5306 196 7486 24
Others 30 35 159 59 638 55 1575 6 1354 5 936 3
Total 850 100 2700 100 11600
100 26400
100 27104
100 31191
100
Note Sales in millions USD
Source Xu (1997) httpwwwdocincomp-55305172html as cited in Zhang et al (2011)
According to the Food and Agriculture Organi-
zation of the United Nations (FAO) fertilizer and
pesticide use in the Philippines between 1961 and
2005 increased by 1000 and 325 respectively
This was caused by the widespread use of irrigation
agrochemicals and new seeds in the country However
crop yield only increased by a small amount even
though agrochemical products were used This was
mainly attributed to excessive and inappropriate use of
chemical-based products in farming causing land
degradation and losses in soil fertility
Ⅳ Overview of the Industry
41 Global Agrochemical Industry
Dussal (2011) stated that the world agrochemical
industry was valued at USD 134 billion in 2010 It is
expected to grow at a CAGR of 11 to reach USD
225 billion by 2015 The Asia Pacific region led the
global agrochemical and fertilizer consumption
accounting for 40 followed by North America with
32 The top ten global players include Bayer
Syngenta Potash Corp Agrium and Mosaic which
constitute around 90 of the world market share
Pesticide sales remained relatively constant over
the 1990s between USD 270 to 300 billion From 2007
to 2008 herbicides ranked first in the three major
categories of pesticides (insecticides fungicides
bactericides and herbicides) in terms of sales The
fungicidesbactericides ranked second Europe is now
the top consumer of pesticides in the world followed
by Asia Specific countries which largely use
pesticides are China the United States France Brazil
and Japan Most of the pesticides worldwide are used
for fruit and vegetable crops In developed countries
pesticides mainly herbicides are primarily used for
maize Since the 1980s there have been hundreds of
thousands of pesticides developed worldwide inclu-
ding biopesticides (Zhang et al 2011)
According to the US Environmental Agency
ldquobiopesticides are certain types of pesticides derived
from such natural materials as animals plants bacteria
and certain minerals For example canola oil and
baking soda have pesticide applications and are
considered biopesticides At the end of 2001 there
were approximately 195 registered biopesticide active
ingredients and 780 products Biopesticides fall into
three major classes
a Microbial pesticides consist of a micro-
organism (eg a bacterium fungus virus or
protozoan) as the active ingredient Microbial
pesticides can control many different kinds of
pests although each separate active ingre-
dient is relatively specific for its target pest(s)
For example there are fungi that control
certain weeds and other fungi that kill
specific insects
b The most widely used microbial pesticides
are subspecies and strains of Bacillus
thuringiensis or Bt Each strain of this
bacterium produces a different mix of
proteins and specifically kills one or a few
J Glob Bus Trade Vol 9 No 2 (November 2013) 11-21
15
related species of insect larvae While some
Btrsquos control moth larvae found on plants
other Btrsquos are specific for larvae of flies and
mosquitoes The target insect species are
determined by whether the particular Bt
produces a protein that can bind to a larval
gut receptor thereby causing the insect larvae
to starve
c Plant-Incorporated-Protectants (PIPs) are
pesticide substances that plants produce from
genetic material that has been added to the
plant For example scientists can take the
gene from the Bt pesticide protein and
introduce the gene into the plantrsquos own
genetic material Then the plant instead of
the Bt bacterium manufactures the substance
that destroys the pest The protein and its
genetic material but not the plant itself are
regulated by EPA
Fig 2 Distinguishing Factors for the Paradigm Shift in the Crop Protection Industry
Source Balayan (2010)
d Biochemical pesticides are naturally occurring
substances that control pests by non-toxic
mechanisms Conventional pesticides by
contrast are generally synthetic materials that
directly kill or disable the pest Biochemical
pesticides include substances such as insect
sex pheromones which interfere with mating
as well as various scented plant extracts that
attract insect pests to traps Because it is
sometimes difficult to determine whether a
substance meets the criteria for classification
as a biochemical pesticide the EPA has
established a special committee to make such
decisions
42 The Philippine Crop Protection Industry
According to the Samahan sa Pilipinas ng mga
Industriyang Kimika (SPIK) or Chemical Industries
Association of the Philippines in 2008 the utilization
of crop-protecting chemicals is still prevalent among
Filipino farmers In the country the most extensively
used pesticides are insecticides which account for 51
of the total market herbicides comprise 21
fungicides 14 and the remaining other types of
pesticides 14 These chemicals are used for crops
such as rice (about 33 million hectares of plantation
area) corn (32 million hectares) pineapple (67000
hectares) and banana (25000 hectares)
Is the Agrochemical Industry Traversing the Organic Route Insights and Directions for a Philippine
Agrochemical Trading Company
16
Because of the greater challenge faced by the
players there has been a progressive shift in the
industry from what is commonly known as an
agrochemical industry to a crop protection industry and
now to a plant science industry as shown in Fig 2 The
shift to a plant science industry is believed to deliver
products that would give better solutions to crop
problems and technologies that would lead to
sustainability As of now the multinational companies
or the CropLife members are the ones which are
already in the third phase (Balayan 2010) The generic
companies are still in phase 2 (crop protection) but on
their way to shift to phase 3 (plant science)
The Philippine crop protection industry is
comprised of firms engaged in the formulation
manufacture distribution repackaging importation
and exportation of chemical pesticides It has always
been dominated by transnational agrochemical com-
panies which are members of CropLife International
such as Bayer CropScience Syngenta Philippines Du
Pont Dow Agro These companies operate and manu-
facture their own agrochemical products These
companies focus more on the assurance of the safety of
their products Moreover they are now more respon-
sible about the flow of their products up through the
disposal phase Hence they practice product steward-
ship In 2008 the FPA has listed about 300 firms
operating in the country Other players in the industry
would include local companies such as the members of
the Crop Protection Association of the Philippines
(CPAP) and other generic product-making companies
As shown in Table 2 there has been an increasing
demand for pesticides in the country although a
continuous campaign against these products is done by
the NGOs An increase in Philippine importation of
pesticides is due to the fact that perceived sustainability
cannot be achieved without the help of these
agrochemical products The country is highly
dependent on importation due to the limited resources
available in the country for formulators and manufac-
turers Active ingredients are also imported by the
major industry players Local production is limited to
formulation of imported technical materials except for
24-D
Table 2 Value of Imports of Pesticides in the Philippines (in USD 1000rsquos)
Item 2006 2007 2008 2009 2010
Insecticides 39658 49152 65022 68873 51371
Fungicides 46751 40741 32109 26914 28648
Herbicides 22236 22793 21954 11715 5031
Disinfectants etc 10388 13033 30741 53249 85043
Total 119033 125719 149826 160751 170093
Source FAO (2010)
On the other hand exports of pesticides by the Philippines show minimal levels making the country a net importer of
pesticides (Table 3)
Table 3 Value of Exports of Pesticides in the Philippines (in USD 1000rsquos)
Item 2006 2007 2008 2009 2010
Insecticides 1335 2938 1547 1508 1928
Fungicides - - 1 15 132
Herbicides 1 262 400 81 27
Disinfectants etc 312 1199 915 1256 740
Total 1649 4399 2863 2859 2826
Source FAO (2010)
J Glob Bus Trade Vol 9 No 2 (November 2013) 11-21
17
43 Foreseen Trends in Global Pesticide
Production and Consumption
The trend nowadays is organic agriculture which is
seen also as sustainable agriculture Thus the ongoing
deterioration in the natural environment had Zhang et
al (2011) saying that biopesticides are the wave of the
future Such pesticides must be highly efficient non-
toxic and environment-friendly Biopesticides according
to Yang (2001) have the following advantages
a a positive control effect on pests safe to humans
and animals and no pollution
b no residuals
c strong specificity to target pests safe to natural
enemies and beneficial organisms
d raw materials and active ingredients are natural
products which helps to ensure sustainable
development
e they can be modified by means of modern
biotechnology and fermentation processes to
improve performance and enhance quality
f pest resistance is difficult to generate
Over 100 kinds of biopesticides exist at present
worldwide with about 30 types of biopesticides
commercially produced (Xu 2008) Countries such as
Mexico the United States and Canada dominate global
biopesticide usage accounting for 44 The total
world biopesticide consumption can be broken down
into 20 (Europe) 13 (Asia) 11 (Oceania) 9
(Latin America) and 3 (Carribean and Africa) (Qin
amp Kong 2006) As for China the biopesticide industry
has been expanding since the 1990s from 10 to 20
annually such that by 2006 total biopesticides
consumption reached 145000 tons accounting for 10
of total sales It is anticipated that biopesticides will
replace up to 20 of chemical pesticide consumption
in China in the years ahead
Since safer products are what consumers are
demanding companies such as United Farm Tech-
nologies Nuso Agro Science and Dow Agro started
selling and manufacturing safer pesticides called
biopesticides These products are derived from natural
materials Biopesticides constitute about 2 of the
global agrochemical market (Dussal 2011) In
Monsantorsquos pipeline are agricultural biological or
biopesticides produced using what they call the Bio-
Direct Technology which involves using molecules
found in nature expected to be developed for use in
topically applied crop protection and other products
(Monsanto 2012) Moreover Bayer CropScience
recently acquired AquaQuest a US-based supplier of
innovative biological pest management solutions based
on natural microorganisms for USD 500 million in its
bid to build a leading technology platform for green
products (Bayer 2012)
Ⅴ Results and Discussion
51 Compliance by Phil-Agrochemical
Trading with FPA Requirements
The FPA requirements relative to product labeling
were all met by the Phil-Agrochemical Trading These
include a statement of composition registration or
provisional permit number name and address of
company the productrsquos common name net contents
directions for use suitable indication of hazards
instructions on decontamination and safe disposal of
used containers the lot number and date of formulation
the FPA registration number re-entry period after
application triple rinse logo a person to contact in case
of emergency and safety instructions
52 Comparison of Phil-Agrochemical
Tradingrsquos Activities with CPAP
Activities
Four types of activities are carried out by CPAP
members product stewardship agromedical training
information education campaign aerial spraying semi-
nars and farmersrsquo meetings Phil-Agrochemical
Trading has yet to apply for CPAP membership A
comparison of its activities with CPAP activities
revealed that only farmersrsquo meetings are done by the
firm
Is the Agrochemical Industry Traversing the Organic Route Insights and Directions for a Philippine
Agrochemical Trading Company
18
53 Comparison of Phil-Agrochemical
Tradingrsquos Operations with Top
Competitors
Table 4 presents a summary comparison of Phil-
Agrochemical Tradingrsquos operations with two of its
top competitors CyBERTH Philippines Inc and
PhilAgrow Inc
CyBERTH Philippines Inc was established in
1999 and is engaged in trading pesticides and
fertilizers in the country However they trade more
pesticide products as fertilizer is more expensive The
companyrsquos product portfolio includes 24 registered
products categorized as insecticides herbicides
fungicides molluscicides or plant growth regulators
The major crops where these products can be used are
rice corn vegetables and mangos The companyrsquos
operations cover the research and development of new
products importation and local purchase of the
technical and inert materials of a particular product
formulation warehousing and supply of finished
products to its distributors This company continuously
searches for better products
PhilAgrow Inc started operations in 2006 and is an
importerdistributor of chemical pesticides such as
insecticides molluscicides fungicides herbicides
nematicides and specialties It has 18 FPA-registered
products
Table 4 Summary Comparison of Phil-Agrochemical Trading with Two Top Competitors
Points for Comparison Phil-Agrochemical
Trading CyBERTH Philippines Inc PhilAgrow Inc
Product Lines 14 FPA registered products 24 FPA registered products 18 FPA registered products
Product Variety
Herbicidesinsecticides
molluscicides fungicides fertilizer
Herbicides insecticides
molluscicides fungicides fertilizer
Insecticides molluscicides
fungicide herbicides nematicides specialties
Promotional Activities
Farmers meetings caravans
raffle promos provision of protective gears
Farmers meetings raffle
promos provision of protective gears
Farmers meetings raffle
promos provision of protective gears
Target Market
General trade market
plantation businesses small farmers (below 2ha and 2ha
and above)
General trade market
plantation businesses small farmers below 2 ha
and 2 ha and above)
General trade market
plantation businesses small farmers below 2 ha and 2 ha
and above)
Location Scope Domestic Domestic Domestic
Facilities (eg warehouse
transportation)
Rented (Outsourced
production) Owned Research facility
Provision of training to employees
- Yes Yes
Note Firm name was disguised upon firmrsquos request
Among the points for comparison it can be seen
that Phil-Agrochemical Trading has the least number
of product lines at 14 FPA-registered products vis-agrave-
vis CyBERTH Philippines Inc with 24 FPA-
registered products and PhilAgro Inc with 18 FPA-
registered products In terms of product variety Phil-
Agrochemical Trading and CyBERTH Philippines
Inc have 5 types of products while PhilAgrow has 6
types All firms carry out the same promotional
activities have the same target market and location
scopecoverage Facilities of Phil-Agrochemical
Trading are rented while those for CyBERTH
Philippines Inc are owned PhilAgrow Inc has its
own research facility Only CyBERTH Philippines
Inc and Phil-Agrow Inc provide training to
employees
54 Farmer Survey Results
Sixty farmers surveyed had about 11-15 years of
farming experience primarily grew rice operated
small farms (1-5 hectares) and were customers of Phil-
J Glob Bus Trade Vol 9 No 2 (November 2013) 11-21
19
Agrochemical Trading for five years or less The
majority (over 91) bought pesticides from other
distributors because of lower prices and availability of
preferred agrochemicals On a scale of 1 to 7 with 7
being the highest rating most farmers rated Phil-
Agrochemical Trading a ldquo4rdquo Suggestions given by the
farmers to the firm included lowering the product
prices and increasing promotional activities to
encourage customer retention and continued patronage
55 Assessment of Strengths Weaknesses
Opportunities and Threats
Fig 3 shows a SWOT Matrix where Phil-Agro-
chemical Tradingrsquos strengths are matched with its
opportunities and then with its threats while its
weaknesses are matched with its opportunities and
then with its threats to generate possible strategy
alternatives for the firm to become sustainable Such
strategies include the introduction of new brands per
product type creation of a customer retention strategy
for its dealers and IBPs and pursuing market
penetration
Fig 3 SWOT Matrix
External
Internal
Opportunities Threats
(1) Training programs and seminars are conducted by institutions
such as FPA and CPAP
(2) The openness of farmers to new knowledge in crop production
(3) The bright prospects for the plant
science industry towards the attainment of food security
(4) Increasing trend towards the
production of biopesticides (5) Availability of funding agencies
(6) The support of government and
NGOs for organic farming
(7) The negative perception on the use of chemical pesticides and fertilizers
(8) Small farmers are highly sensitive to
pesticide prices (9) Increasing competition in the industry
due to increasing number of new
entrants (10) The effects of climate change on the
industry
(11) Products of the industry are not highly differentiated
(12) Prices of inputs for the manufacture
of pesticides are volatile
Strengths
Introduction of different brands for
each type of pesticide
(S1 S2 and O1 O5)
Market Penetration
(S1 S3 and T1 T3 T6)
1 The firm has suppliers which are
members of CPAP
2 The firm has its BOD as distributors
3 They do not distribute Category I
pesticide 4 The company has developed
partnership with the dealers of
organic fertilizers
Weaknesses
Creation of customer retention
strategy for the dealers and IBPs
(W2 W3 W5 and O1 O2 O3)
Creation of customer retention strategy for the dealers and IBPs
(W2 W3 W4 and T1 T2 T3 T6)
1 Lack of warehousing facilities
2 Weak brand recognition
3 Non-commitment of dealers and
IBPs
4 Experiences stock-outs of products
5 The company does not have well-
established customer relationships
56 Insights and Directions It is apparent that though the agrochemical industry
has taken action in traversing the organic route toward
Is the Agrochemical Industry Traversing the Organic Route Insights and Directions for a Philippine
Agrochemical Trading Company
20
sustainability it has only taken small steps in that
direction Even if customers are clamoring for safe
food and in spite of the trend towards organic
agriculture and sustainability most farmers remain
indifferent toward using biopesticides and other
biologicals in farming on account of their sensitivity to
input prices and demand for more promotional
activities Thus in the next couple of years it is
expected that agrochemicals of a synthetic nature will
continue to dominate the global agrochemical industry
in terms of usage and market share Such a trend is
expected to spill over to Asia including the Philippines
as transnational companies take in a sizeable share of
the market
To survive and compete in the industry agroche-
mical trading companies must employ a number of
strategies such as introduce new brands for each
product type formulate a customer retention strategy
for its dealers and IBPs and pursue market penetration
Lastly in the case of Phil-Agrochemical Trading the
firm should consider CPAP membership and carry out
product stewardship agromedical traininginformation
education campaign and aerial spraying seminars to
enhance its competitiveness in the agrochemical
industry
References
Balayan L M A (2010) An apprenticeship study on
Bayer cropscience Gocus on its thrust towards
sustainable development through its quality health
safety and environment (QHSE) system (Under-
graduate Special Problem Report) Los Banos
Philippines University of the Philippines Los
Bantildeos
Castillo A (2000) A special problem report on Bayer
Philippines Inc (Undergraduate Special Problem
Report) Los Banos Philippines University of
the Philippines Los Bantildeos
Cuyson S (2007 March) Pesticides in sustainable
agriculture and the environment Paper presented
at the 38th annual scientific conference Tagbilaran
Philippines
David F R (2009) Strategic Management Concepts
and Cases (12th ed) Upper Saddle River NJ
Pearson Education
Dussal M (2011) Agrochemicals Retrieved from
httpwwwAgrochemicalInformationand Resour-
ceshtm
Lu J L (2009) Total pesticide exposure calculation
among vegetable farmers in Benguet Philippines
Journal of Environmental and Public Health 2009
Retrieved from httpwwwhindawicomjournals
jeph2009412054
Lum KY Mamat M J Cheah UB Castaneda
CP Rola AC amp Sinhaseni P (1993) Pesticide
research for public health and safety in Malaysia
the Philippines and Thailand Retrieved from
httpwwwnzdlorggsdlmode=d-00000-00-off-
0envl000010000direct-10401l11-en-5020-about-
00010004001110-0utfZz800ampcl=CL13ampd=HAS
H 016be195f7a6257ed84a093544ampgt=1
Palacio E B (2004) An apprenticeship study on the
crop protection division of syngenta corporation
(Undergraduate Special Problem Report) Los
Banos Philippines University of the Philippines
Los Bantildeos
Qin X F amp Kong F B (2006) Prospect and
situation of biopesticides Journal of Anhui Agri-
cultural Sciences 34(16) 4024 4057
The Philippines (1996) Philippine case study a
developing countryrsquos perspective on POPs Paper
presented at the IFCS Meeting on POPs Manila
Philippines Retreived from httpwwwchem
unepchpopsindxhtmsmanexp7html
Tirado R amp Bedoya D (2008) Agrochemical use in
the Philippines and its consequences to the environ-
ment Quezon Philippines Greenpeace Southeast
Asia Retrieved from httpwwwgreenpeacetopu
bliccationsGPSEA_agrochemical-use-in-the-phili
ppdf
Varca L M (2002) Impact of agrochemicals on soil
and water quality Food and Fertilizer Technology
J Glob Bus Trade Vol 9 No 2 (November 2013) 11-21
21
Center Retrieved from httpwwwagnetorg
libraryphpfunc=viewampid=20110804160130
Xu Y Z (2008) The application of biological
pesticides and industrial development measures
Chinese Agricultural Science Bulletin 24(8) 402-
404
Yang J L (2001) Green chemistry and technology
Beijing Beijing University of Posts and Teleco-
mmunications 176-180
Zhang W Jiang F amp Ou J (2011) Global pesticide
consumption and pollution with China as a focus
Proceedings of the International Academy of Ecol-
ogy and Environmental Sciences 1(2) 125-144
J Glob Bus Trade Vol 9 No 2 (November 2013) 23-27
23
ISSN 1946-5130
Journal of Global Business and Trade
wwwiagbtcom
A Study on the Dependency on Japan and the
Competitiveness of Gear Boxes
Kwang Hee Kim
Department of Business Administration Hyupsung University Korea
Received 15 August 2013 Revised 20 September 2013 Accepted 28 October 2013
ABSTRACT
From the trade deficit with Japan in 2012 of 2557 billion USD the trade surplus of material and components
industry was 2223 billion USD in deficit 87 of such trade deficit with Japan came from the material and
components industry
This study is to focus on the competitiveness index of absolute inferiority in automobile components as of
2012 and lsquogear box and other componentsrsquo that are over the trade for each amount of the automobile
components with Japan
Keywords competitiveness index(CI) dependence on Japan gear box industry trade deficit against Japan
Ⅰ Introduction3
As of 2012 Korea accomplished overall exports of
54787 billion USD and imports of 51958 billion USD
and as a result the trade surplus accomplished a
surplus of 2829 billion USD If this is limited to the
material and components industry the global exports
and imports were 25341 billion USD and 16249
billion USD respectively and as a result the trade
surplus recorded a surplus of 9092 billion USD that
the trade surplus exceeded 60 billion USD To put it
differently the present vast trade surplus mainly came
from the trade surplus of the material and components
industry
In the meantime the trade surplus with Japan
(2012) recorded a deficit of 2557 billion USD It was
less than the trade deficit with Japan for the previous
2013 International Academy of Global Business and Trade
All rights reserved
year 2011 (2864 billion USD) but it was attributable
to the decreasing imports from Japan from the
exchange rate with strong Yen and weak Won
currency The vast scale of the trade deficit with Japan
did not happen overnight
For this background the vulnerability of the
domestic material and components industry was the
greatest cause for the aforementioned From the trade
deficit with Japan in 2012 of 2557 billion USD the
trade surplus of material and components industry was
2223 billion USD in deficit 87 of such trade deficit
with Japan came from the material and components
industry
This study is to focus on the competitiveness index
(-091) of absolute inferiority in automobile compo-
nents as of 2012 and lsquogear box and other components
(8708-40-0000)rsquo that are over the trade for each
amount of automobile components with Japan
Through the foregoing the purpose is to analyze the
A Study on the Dependency on Japan and the Competitiveness of Gear Boxes
24
trend of export and import competitiveness on the
material and components industry with Japan and lead
a responsible strategy for improving the trade deficit
with Japan
Ⅱ Trade Surplus and Status
Looking into the global export and import scale of
lsquogear box and other componentsrsquo (2012) exports reached
2528801000 Dollars and imports 1568670000
Dollars as a result the trade surplus reached
1471934000 Dollars Looking into the export and
import scale with Japan on this item for the same year
it recorded the export of 2379 billion USD and import
of 491028 million USD as a result the trade deficit
recorded 467238 million USD
On the other hand the scale of trade deficit (-470
million USD) with Japan for lsquogear box and other
componentsrsquo was applicable for 18 of the entire
trade deficit with Japan (-2557 billion USD) and 21
of trade deficit with Japan for material and components
(-2233 billion USD)
Also looking only at the trade surplus with Japan
for automobile components (-430 million USD) the
trade deficit of lsquogear box and other componentsrsquo took a
high ratio applicable for 1159 that the status of these
item could be shown
Therefore relief from the trade deficit with Japan
by domestic automobile components industry could be
concluded as impossible without an improvement in
the trade deficit of the lsquogear box and other componentsrsquo
For reference from the costs of a completed car
the ratio for the gear box is known to be around 7-8
As such a gear box with a high ratio of production cost
also has the longest quality assurance limit in that it is
the core item for a high added-value to measure the
competitiveness of a complete car
As shown through the comparison with other
indices under the following Fig 1 the import scale
with Japan for the lsquogear box and other componentsrsquo is
very high Furthermore the import dependence of
Japan has declined from 801 in 1988 770 in
1998 597 in 2008 and 465 as of 2012 but the
import dependency on Japan may be assessed as high
Fig 1 Ratio of Gear Box in the Trade Deficit with
Japan (2012)
Source Prepared by the author by facilitating the Korea International Trade Association (2013)
The global export of this item has clear trend of
increase in recent days The trend of increase has been
significantly moderated from 252 million USD in
1988 to 9 million USD in 2000 However it began
with 2865 million USD in 2002 to leap to 6704
million USD in 2004 918 million USD in 2006
27079 million USD in 2008 and 75942 million USD
in 2010 and it increased to 1 billion 4234 million
USD in 2011 twice that of the previous year As of
2012 it has drastically increased to 2528801000
Dollars over 1 billion USD from the previous year that
exports has shown dramatic increase since 2009
In spite of that the exports to Japan of this item
were USD 970000 in 1988 USD 910000 in 1998
942 million USD in 2008 and 2379 million USD as
of 2012 it has seen very little increase for a quarter of
a century
On the other hand imports from Japan were
15506 million USD in 1988 19402 million USD in
1998 72344 million USD in 2008 and 965669
million USD in 2010 but it has plummeted to record
491028 million USD as of 2012 Compared to 2010
imports from Japan dropped less than a half
J Glob Bus Trade Vol 9 No 2 (November 2013) 23-27
25
Fig 2 Trend of Exports and Imports (1988~2012) of Gear Boxes (8708-40-0000)
Source Prepared by the author by facilitating the Korea International Trade Association (2013)
The trade deficit in automobile components with
Japan to this point has been pointed out with a cause of
importation in highly functional and high-tech
components impossible for domestic development
However according to the interview survey result on
the recent domestic automobile industry gear boxes
imported from Japan are mainly for large commercial
vehicles that are made for productivity purposes in
Korea
Ⅲ Price per Weight on Export and
Import Items
In order to consider the problems in lsquogear box and
other componentsrsquo in detail the price per weight price
of export and import items are analyzed for each price
Following is a brief summary of the export and
import scales and the status of gear boxes to Japan As
is well known in the case of Japan the status of gear
box exports and imports were an item with
overwhelmingly excessive exports Based on 2011
exports were 133 trillion Yen (approximately 18
trillion won) with 128 export countries On the other
hand the imports were only 606 billion Yen
(approximately 800 billion won)
The weight price of Japan for gear boxes is
approximately 1880 Yenkg for the gear boxes with a
high price imported as compared to the export product
price of 1500 Yenkg In particular the weight price
for the import item from the first import subject
country the Netherlands was 7380 Yenkg which
was overwhelmingly higher than the second country
the US of 1270 Yenkg Also the weight price of
export items from the US and Europe was around
1500 Yenkg but the import item price was 2000
Yenkg or higher
A Study on the Dependency on Japan and the Competitiveness of Gear Boxes
26
Table 1 Amount per Kg for Global Export and Import of Gear Boxes
Year Export Import
Amount (USD 1000) Weight (kg) USDkg mount (USD 1000) Weight (kg) USDkg
2005 119947 9259951 130 714512 45342883 158
2006 91804 8512492 108 778889 52223376 149
2007 127074 12051377 105 1066938 72512561 147 2008 270795 21068540 129 1212621 72940221 166
2009 307779 25239366 122 900597 53010625 170
2010 759422 58236825 130 1362034 81828230 166 2011 1423403 106723042 133 1405309 78567171 179
2012 2528801 180077148 140 1056867 59809776 177
A total of 8
years Average weight price 1246 Average weight price 1640
Source Prepared by the author by facilitating the Korea International Trade Association (2013)
On the other hand the weight price of imported
items from Korea was less than 1000 Yenkg for the
gear box an affordable price This fact could be
affirmed by the result calculated through facilitation of
the statistical data of Korea International Trade
Association by the author
In 2010 and 2012 the global weight price of export
items of Korearsquos lsquogear box and other components
(8708-40-0000)rsquo was 130 Dollarkg and 140 Dollarkg
respectively the import item price for the same year
was 166 Dollarkg and 177 Dollarkg respectively
There was a difference in weight price of 3 Dollarkg
or more between items of export and import (Table 1)
Looking into the trend of the 8-year period from
2005 to 2012 the weight price of import items was
higher than the export items The average weight price
of global export items for this item for the 8-year
period was 1246 Dollarkg while the average weight
price for the import item was 1640 Dollarkg there
was a unit price difference of 4 Dollarkg
Thereafter the weight price of the export item to
Japan for the above items in 2010 and 2012 was 81
Dollarkg and 74 Dollarkg respectively while the
import item price was 158 Dollarkg and 160
Dollarkg respectively there was a two times weight
price difference between the export and import items
(Table 2) Looking into the period of 2005 - 2012 for
the above the import items to Japan had a higher
weight price than the export items In addition the
average weight price of the export items for 8 years
was 1105 Dollarkg while the average weight price of
the import item was 1509 Dollarkg there was
approximately 4 Dollarkg or more of price difference
In addition the export amounts to Japan for 2010
and 2012 were 81 Dollarkg and 74 Dollarkg It
declined 4 Dollarkg or more compared to 2009 which
is considered as attributable to diverse types of gear
boxes exported with a drastic increase of exports to
Japan in these two periods
Characteristics of export and import items to the
world and Japan on the gear box and other components
(8708-40-0000) have a higher average weight price in
export and import to Japan than the export and import
items to the world have a higher average weight price
than the import items to Japan
Furthermore when comparing the weight price for
exports and imports to the world and Japan on this
item the import items were higher than the export
items To interpret it differently it is proof that the
export of the gear box had lower added value than the
imported items
J Glob Bus Trade Vol 9 No 2 (November 2013) 23-27
27
Table 2 Amount per Kg for Exports and Imports of Gear Boxes with Japan
Year Export Import
Amount (USD 1000) Weight (kg) USDkg mount (USD 1000) Weight (kg) USDkg
2005 14004 1010821 139 444022 29443945 151
2006 10124 805067 126 531454 38286910 139
2007 10180 845554 120 725042 55581305 130 2008 9420 708144 133 723444 49337793 147
2009 9235 743895 124 628173 39923189 157
2010 11075 1361065 81 965669 61103817 158 2011 19866 2284696 87 812394 49161068 165
2012 23790 3225976 74 491028 30683013 160
A total of 8
years Average weight price 1105 Average weight price 1509
Source Prepared by the author by facilitating the Korea International Trade Association (2013)
Ⅳ Conclusions
The following is the summary of contents shown
through the analysis of the lsquogear box and other
componentsrsquo
First the above items have shown a drastic
increasing trend for global export after 2009 but
export to Japan was still in a minimal increasing trend
close to horizontal line even as of 2012
Second characteristics of export and import items
to the world and Japan showed a higher average
weight price of export items to Japan than the export
items to the world and the import items from the
world had a higher average weight price than the
import items from Japan Also when comparing the
export and import weight prices with the world and
Japan for the above item the import items had a higher
rate than the export items To put it differently the
export of gear boxes was proven to have lower added
value than the import items
Lastly a brief mention was made on the direction
of the lsquogear box and other componentsrsquo
The recent assembly processing technology has
become standardized globally while the material and
components technology have been monopolized by
some advanced countries including Japan Because of
the foregoing the foreign currency earned from the
global market was turned over to Japan and the added
value for Korean industry has not been significant at all
Furthermore if the import of core material and
components such as lsquogear box and other componentsrsquo
is dependent on a specific country there is possible
subordination in the industrial structure with a high
possibility of losing the initiative in production and
price
Purchasing core material and components from
Japan was inevitable in the economic growth process
of Korea in the past but the time has come to make a
great change in the domestic industry
References
Grubel He G amp Peter L (1975) Intra-industry
trade The theory and measurement of interna-
tional trade in differentiated products London
UK MacMillan
Kim Kwang-Hee (2008) The competitiveness of
domestic auto parts industry against Japan The
Korean-Japan Journal of Economics amp Manage-
ments Studies 41
Kim Kwang-Hee (2013 June) A study on the
dependency on Japan and competitiveness of gear
box Paper presented at the 10th annual conference
and research symposium Mongolia National
University Mongolia
Korea International Trade Association (2013) Trade
statistics data Retrieved from httpwwwkitanet
J Glob Bus Trade Vol 9 No 2 (November 2013) 29-34
29
ISSN 1946-5130
Journal of Global Business and Trade
wwwiagbtcom
The Nature of Competition in an Indian Market Focusing on
the Volume Zone
Tirtha Bahadur Karki
Graduate school of Asian and International Business Strategy Japan
Received 14 June 2013 Revised 12 September 2013 Accepted 2 October 2013
ABSTRACT
Emerging countries are playing a growing role in the world economy It is a role that is expected to be even
greater in the future The recent global financial and economic crisis has further emphasized the stagnation of
most developed economics and taken prominence in emerging economics In particular China and India play
a significant role as global markets Henceforth it is estimated that the Indian volume zone will expand
rapidly and steadily On the other hand Japan and other developed economies tend to be sluggish Therefore
Japanese multinational corporations may have to target Indian volume zone consumers To do so they are
required to change their strategy management and production systems to compete with local and international
rivals in the market because the nature of the competition is totally different in an Indian market than other
developed country However definitions of the volume zone differ among research institutions researchers
countries and urban and local areas which creates considerable differences in the size of markets Thus in
this paper the literature review summaries and compares the definitions of the volume zone first Second this
paper tries to Fig out the most important part of the volume zone which has a key role in making a business
strategy Third differences between developed markets and the Indian market are examined and the nature of
competition in the Indian market is argued Finally the main argument and implication are stated
Keywords competition developed market emerging market Indian market strategy volume zone
Ⅰ Introduction4
There is very significant global interest in the
Indian economy Along with China Brazil Indonesia
and a few other countries India promises great potential
of growth in the next few years and decades The
future of the Indian economy is thus a significant
concern among the global financial and business
community economic policy-makers and managers
multilateral financial institutions economists and
2013 International Academy of Global Business and Trade
All rights reserved
other academics as well as investors and consumers in
India The significant global interest in India is not
surprising It is well known that - on a purchasing
power parity basis ndash India is already at over USD
four trillion of GDP the fourth largest economy in the
world very close to the size of the Japanese economy
the third largest In the next 15 to 18 years this size is
expected to grow as per various studies and estimates
four to five times As a result many foreign investors
and a majority of global companies and businesses are
making a beeline for the Indian market which
The Nature of Competition in an Indian Market Focusing on the Volume Zone
30
promises a booming volume zone5 of a few hundred
million consumers (Fig 1) expanding steadily in the
next few decades
Fig 1 Shares of Global Middle Consumption
2000-2050
Source Kharas (2010)
On the other hand advanced economies including
Japan are slowing down Japan has been in a long
recession with a real GDP growth rate of 39 in 2010
It underlines the world economy shift from developed
nations with their huge populations rising household
incomes and expansion of consumer goods and
service markets toward the emerging economies6
From these perspectives the expansion of the
Indian volume zone has attracted considerable
attention Many Japanese firms have already adjusted
their strategy management and production systems in
order to compete with the Indian volume zone
However there are no official definitions of volume
zone7 and these definitions differ among research
institutions researchers countries and urban and local
areas This creates considerable differences in the size
of volume zone markets Thus the literature review
summarizes and compares the definitions of volume
zone arguements After identifying the important part
of the volume zone (what is the volume zone what is
the trend of the volume zone etc) this paper argues the
differences between developed markets and the Indian
5 It is also called middle class middle income class and
middle income In this paper the middle class is identified as volume zone
6 The countries and consumers team 2010
7 Eric D et al (2007) Kharas (2011)
market which is very useful in knowing the nature of
competition in the Indian market Finally the main
argument and implications are stated
11 Definitions of Volume Zone
There are various definitions of volume zone based
on annual household disposal income annual
household income and expenditure Since the
definition of volume zone is not standardized with
each countryrsquos factors it remains uncertain Thus we
need to define and examine the Indian volume zone
which is most important in order to Fig out a business
strategy
12 Annual Household Disposable Income
The Ministry of Economy Trade and Industry
(2010) Aoshima Kubota and Sakamoto (2009) Japan
research institute (2010) Mizuho Research Institute
(2010) and Yanagawa and Mori (2010) defined the
Asian volume zone including that of India as
comprising people whose annual household disposa-
ble incomes range between $5000 and $35000 (upper
middle class $15001-35000 lower middle class
$5001-$15000 lower class $1000-$5000 the poor
up to $1000) and the rich as those whose annual
household disposable incomes exceed $35000 On the
other hand Indiarsquos National Council of Applied
Economic Research (NCAER report 20052006)
defined the Indian volume zone as comprising people
whose annual household disposable incomes range
between $22320 and $4444 (Rs1000000-Rs200000
at 20012002 price)
Comparing these two definitions of volume zone
(Fig 2) the former defines that the annual household
disposal incomes of people in the volume zone tends to
be higher at $5001 to $35000 and the latter defines
that the incomes of people in the volume zone tends to
be lower at $4444 to $22320
J Glob Bus Trade Vol 9 No 2 (November 2013) 29-34
31
Fig 2 Definitions of Volume Zone by Annual
Household Disposable Income
13 Annual Household Incomes
First the World Bank (2007) and Milanovic and
Yitzhaki (2002) defined the global volume zone as
those with annual household incomes between the
mean incomes of Brazil and Italy that is an annual per
capita income of approximately $4000-$17000 (at
2000 purchasing power parity (PPP)) Second Bhala
(2009) adopted an absolute approach definition with
an annual per capita income of $3900-$113000 in
PPP terms Third Court and Narasimhan (2010)
divided the consumers of developing countries
including India into the following classes on the basis
of their annual household incomes global class
$113000 and above upper middle class $56500-
$113000 middle class $22500-$56499 lower
middle class $13500-$22499 and deprived class
below $13500 From this distribution the middle class
is defined as those with an annual household income of
$13500-$113000 in PPP terms
In order to compare these definitions Fig 3
presents the minimum and maximum annual incomes
that were specified by various researchers Bhala (2009)
specified the minimum annual income as $3900
which is much lower than that specified in other
definitions
Fig 3 Definitions of Volume Zone by Annual
Household Income
14 Expenditure
Some researchers defined the volume zone on the
basis of expenditures In 2007 Banerjee and Duflo
(2007) defined it on the basis of per capita expenditure
between $2-$4day In 2008 they defined the global
volume zone on the basis of per capita expenditure of
$2-$10day in 1993 PPP (Banerjee amp Duflo 2008) On
the other hand Ravallion (2010) defined it on the basis
of per capita expenditure between $2-$13 day Both of
these expenditure based definitions are used only in
emerging economies
Fig 4 Definitions of Volume Zone by Expenditure
These two definitions also show differences since
the higher bound is $10day and $13day In summary
the volume zone is defined differently on the basis of
various standards locations and economies Owing to
its complexity and variety the volume zone consumersrsquo
jobs incomes consumptions lifestyles and subjective
The Nature of Competition in an Indian Market Focusing on the Volume Zone
32
consciousness of the levels of society must also be
considered for defining the Indian volume zone
Ⅱ Catching the Trend
In order to consider the differences between the
definitions of volume zone this paper argues about
most important part of the volume zone to make a
better strategy in business The management team in
business must know about the volume zone but
$3900 or $4000 (Fig 3) in annual household income
does not make a vast difference in its strategy and
consumers lifestyle In relation to the poor by
associating it with an ability to choose to spend time
and money on something other than survival consider
the volume zone in the case of Indian markets where
estimates range from 30 million to approximately 300
million people
The volume zone is not (yet) the biggest segment
of Indiarsquos overall population Given all the attention
focused on Indiarsquos middle class in recent years it is
important to keep a proper perspective on its size and
potential purchasing power Even using the most
generous estimates of the grouprsquos size the volume
zone comprises less than 30 percent of the population
Thus the rich and the poor combined far outweigh the
Indian middle class The importance of the middle
class lies in the fact that it is the fastest growing
segment of the population Evidence shows that as
income increases the amount and variety of this
discretionary spending increases For corporations the
middle class in India thus presents significant business
opportunities The sales growth of consumer goods
such as televisions and mobile phones to the middle
class has already been established Given the
tremendous growth potential an increasing number of
products are being geared towards the volume zone
population In the transport industry which has
traditionally been dominated by rail travel newer cars
like the Tata Nano (which retails for a little over USD
3000) and low-cost airlines have enabled the volume
zone population to be increasingly mobile The growth
of the volume zone and the economic growth of India
are in a virtuous cycle Rising incomes lead to more
consumption which in turn leads to higher economic
growth then more employment opportunities and
subsequently higher wages and the circle starts again
Thus as the volume zone grows and continues to
increase domestic demand the economy will also
continue to grow Regardless of which definition is
correct and certain it is important to keep a proper
perspective on the potential of the volume zone The
volume zone in India has generated tremendous
interest from the media and multinational corporations
are looking for a new market demographic
Ⅲ Developed Markets and the Indian
Market
In recent years Indiarsquos market growth has
outstripped the developed markets In the 80s GDP
growth in developed nations and India was essentially
the same Between 2000 and 2010 average growth in
the Indian market rose to the point where it was three
times higher Besides this India has corruption less
infrastructure fare of terrorism and etc which are
abnormal in a developed country
Consumers in India tend to be more ethnocentric
than those in developed ones Products from the
western hemisphere are seen by Indian cultures as
carrying western values that might harm their society
as well as the local workforce In developed countries
price quality durability and other product-related
aspects are the major factors that influence buying
decisions Consumers in India tend to be less indivi-
dualistic than in developed ones They care more for a
larger local community and like to be identified as part
of it Advertising which exhibits local values and
traditions has a greater impact on consumers of India
whereas the more individualistic consumers from
developed countries are more influenced by adverti-
sing where the product differentiates itself specifically
from other products in the market
J Glob Bus Trade Vol 9 No 2 (November 2013) 29-34
33
These are the common differences between the
Indian market and developed markets Besides these
there are lots of differences between Indian markets
and developed markets
A survey held by the Graduate School of Asian
and International Business strategy8 in October 2011
on the title of ldquoEntry Strategy of the Japanese Firms in
India and Chinardquo shows that Japanese firms in India
are going to change their target from the upper
(wealthy) class to the Volume Zone (Fig 5) In 2011
581 percent of the Japanese firms replied that they are
targeting upper class customers in India By the way
the survey shows only 274 percent of firms were
targeting the upper class after 3 years (2014) and more
firms targeted the middle class Thus we can
understand the Japanese strategies are shifting from the
upper class to the Volume Zone
Fig 5 Shifting Strategy in India
Ⅳ Conclusion
Thus it is clear that the Indian volume zone is
expanding and Japanese companies are shifting their
strategy from the upper class to the volume zone The
problem is the presence of Japanese companies in the
Indian market where Japanese companies are domi-
nated by Korean and European-American companies
8 Principle of Asia University DrIkejima Masahiro
leads the survey
According to Shintaku and Amano (2009) develo-
ped countriesrsquo firms have more strong technology and
find it more difficult to target the volume zone of
emerging markets and to adopt the strategy locally
There is no room to think about if the strong tech-
nology of a company is harmful for its strategy in
emerging markets The problem is how to approach
the volume zone and this is important Specially the
volume zone comes from the lower class and
companies should know their lifestyle and behavior If
firms understand the value of money for the volume
zone they can easily shift their strategy too This helps
them succeed in the Indian volume zone
Finally the conclusion of this paper presents the
hypothesis for further research about how to approach
the volume zone of India The hypothesis is (Fig 6)
ldquoTo compete successfully in the Indian volume zone
firms need to catch the trend of the volume zone and
educate customers construct market infrastructure
train management personnel and understand the
abilities of the supply side are essential This is why
they need to cultivate their resources at a lower level
than they are targeted (volume zone)
This paper cannot include the case study and
cannot examine the strategy That will be further
researched by this author in the future
Fig 6 Possible Way to Succeed in the Volume
Zone of India
The Nature of Competition in an Indian Market Focusing on the Volume Zone
34
References
Akihisa Yahata (2012) IndiaASEAN business guide
Two challenges of market creation in emerging
countries Tokyo Japan Research Institute
Retrieved from httpwwwjricojppagejspid=
22012
Aoshima Minoru Kubota Yosuke amp Sakamoto
Ryohei (2009) Manufacturing for emerging eco-
nomics that has entered the second stage Learning
to emerging economics strategy of electronics
industry focused on the middle of the economic
pyramid Knowledge Creation and Integration
17(12) Nomura Research Institute Retrieved from
httpswwwnricomjpopinionchitekishisan2009
pdfcs20091208pdf
Banerjee A V amp Duflo E (2008) What is middle
class about the middle classes around the world
The journal of economic perspectives a journal of
the American Economic Association 22(2) 3
Bhalla S (2009) The middle class kingdom of India
and China Wasington DC Peterson Institute for
International Economics
Court D amp Narasimhan L (2010) Capturing the
worldrsquos emerging middle class The McKinsey
Quarterly 1-6
Dyck S Hansakul S amp Saxena R (2009)
Emerging Asiarsquos middle class-A force to be
reckoned with (eSocialSciences Working Paper
No 2232) Retrieved from httpeconpapersrepec
orgRePEcesswpaperid2232
Eric D B Diana F amp Adil S Z (2007) Tracking
the growth of Indiarsquos middle class The McKinsey
Quarterly 51-61
Japan Research Institute (2010 October) Chinarsquos eco-
nomic policy debate heats up in run up to party
congress Asia Monthly 10(115) 1-15
Kharas H (2011 June 13) India China middle class
boom faces many challenges FIRSTPOST
Retrieved from httpwwwfirstpostcomworld
china-india-middle-class-boom-24637html
Milanovic B amp Yitzhaki S (2002) Decomposing
world income distribution Does the world have a
middle class Review of Income and Wealth
48(2) 155-178
Ministry of Economy Trade and Industry (2010)
White paper on international economy and trade
2010 Tokyo Author
Mizuho Research Institute (2010) Japan companies
deviating from volume zone market of China and
India (Mizuho Report) Tokyo Author Retrieved
from httpwwwmizuho-ricojppublicationresearch
pdfreportreport10-0407pdf
National Council of Applied Economic Research
(2005) Annual resport 2005 Retrieved from
httpwwwncaerorgdownloadsannualreportsan
nualreport_2005pdf
Shintaku Junjiro amp Amano Tomo (2009) Emerging
market strategies changes in market and resource
strategies The Journal of Economics 75(3) 40-62
Syusuke Watanabe Tokutaro Hiramoto amp Naoya
Tsuaaki (2012) Developing BoP business as the
principal strategy in 70 trillion of emerging and
developing economics Paying the road to a new
market that is expected to reach 55 billion people
Knowledge Creation and Integration 20(1)
Nomura Research Institute Retrieved from
httpswwwnricomjpopinionchitekishisan2012
pdfcs20120103pdf
Shukla R (2010) How India earns spends and saves
unmasking the real India New Delhi India
SAGE Publications India
Ravallion M (2009) The developing worldrsquos bulging
(but vulnerable) ldquomiddle classrdquo World Development
38(4) 445-454
Sridharan E (2004) The growth and sectoral
composition of Indiarsquos middle class Its impact on
the politics of economic liberalization India
Review 3(4) 405-428
Yanagawa Noriyuki amp Mori Naoko (2010) Income
bracket towing Asiarsquos domestic demand (NIRA
Monograph Series No 31) Tokyo National
Institute for Research Advancement Retrieved
from httpwwwniraorjppdfmonograph31pdf
J Glob Bus Trade Vol 9 No 2 (November 2013) 35-44
35
ISSN 1946-5130
Journal of Global Business and Trade
wwwiagbtcom
Analysis of Public Health Expenditures on Leading Causes of
Morbidity in the Philippines
Paul Joseph B Ramireza and
Earl Joanne S Santos
b
b College of Economics and Management University of the Philippines Los Bantildeos Philippines b Corresponding Author College of Economics and Management University of the Philippines Los Bantildeos Philippines
Received 21 August 2013 Revised 25 September 2013 Accepted 29 October 2013
ABSTRACT
Provision of public goods and services is one of the major roles of the government in an economy Some of
the public goods and services that are being provided cause negative effects while others create positive
externalities One evident case of such is the market for health care Aware of its role to provide health care to
the people governments are even more challenged with the remarkable growth of the demand for health care
Furthermore there are market failures existing in the health care sector Given that the paper examined the
effects of public spending on health care specifically on the principal causes of morbidity in the Philippines
Aside from public spending the paper also took into account private health spending in the analysis The
study employed a pooled ordinary least squares regression model Results showed that the increase in
government spending significantly reduce the number of tuberculosis cases in the Philippines On the other
hand results for diarrhea indicated that public spending and number of diarrhea cases are positively related
The findings imply that although an increase in public health expenditures can have a significant impact on
the number of cases of diseases lowering tuberculosis cases for instance the study can be further extended by
valuing as well the other benefits that can be derived from a prevented sickness resulting from an increase in
public health expenditures
Keywords health care morbidity positive externalities public goods public health expenditures
Ⅰ Introduction9
Economics texts suggest different extents to which
the government can intervene in market activities
Classical economists advocate that the main and in
some instances only role of the government is to
ensure peace and order in the economy ie ensuring
property rights are properly defined and laws and
policies are well-enforced Keynesian economists on
the other hand believe that the government has a
2013 International Academy of Global Business and Trade
All rights reserved
significant role as Keynes demonstrated during the
Great Depression At present different economies adopt
different blends of the two extreme cases However
common to all economies is the need for government
intervention in the presence of market failures and
missing markets given that the government can do
better than the market ie such intervention will not
lead to government failures resulting in further
inefficiencies
It is a known fact that one of the major roles of the
government in an economy is the provision of public
goods Paying no attention to it would result in under-
Analysis of Public Health Expenditures on Leading Causes of Morbidity in the Philippines
36
provision of such goods or worse not being provided
at all due to the free-rider problem Another widely
acceptable role of the government is to provide goods
or services that create a positive externality to the
society These goods or services are usually socially
underprovided since the individual in hisher own
private desire to maximize utility doesnrsquot consider the
beneficial effects to the society of such activities
Examples of such services are education and health
care This paper will provide a general overview of the
global demand for health care then focus on the role of
the government in health care provision in the
Philippines
Ⅱ Global Demand for Health Care
The concern for health is a global phenomenon
Despite the costs of health care services the demand
for health care is growing everywhere in the world
The surge of aging and chronic illnesses in the
developed countries and the shooting requirements of
the rising middle class accompanied by the lsquodiseases
of prosperityrsquo in the developing countries are all
driving demand Global pandemics that threaten the
world as well as environmental changes that cause
dramatic health care challenges are also adding up in
the demand for health care services
The rising demand for health care is evidenced by
the increased spending on health services The worldrsquos
total health expenditure as a percentage of Gross
Domestic Product (GDP) grew by 15 from 82 in
2000 to 94 in 2009 (Table 1) The American region
posted the highest growth in health expenditure as a
percentage of GDP at 26 while the South East
Asian region showed the least at 2 The growing
expenditure on health services are born from both the
public and private Public spending on health care is at
least about 50 for most of the countries The
spending has likewise grown by two percentage points
in excess of GDP growth across all Organization for
Economic Co-operation and Development (OECD)
countries for almost 50 years and is expected to be
more than a fifth of GDP by 2050 if the current trend
persists (Drouin et al 2008) As a result government
health agencies together with patients and health care
companies particularly in developing economies are
alarmed with the growth of health care spending
Given its current share of health care expenditures the
government is confronted with other increasing
demands of its people such as education defense and
pensions aside from demand for health care and the
escalating prices of health services
Table 1 Health Expenditure Ratios 2000 and 2009
Region
Total
expenditure on health
as of gross
domestic product
General government
expenditure
on health as of total
expenditure
on health
Private
expenditure on health
as of total
expenditure on health
General government
expenditure
on health as of total
government
expenditure
External
resources for health as
of total
expenditure on health
Social security expenditure on
health as of
general government
expenditure on
health
2000 2009 2000 2009 2000 2009 2000 2009 2000 2009 2000 2009
African Region 55 65 439 493 561 507 82 96 65 102 79 70
Region of the Americas 114 144 451 493 549 507 145 169 01 01 317 720
South-East Asia Region 37 38 319 371 689 629 44 49 09 16 133 144 European Region 80 93 739 749 261 248 140 146 01 01 522 495
Eastern Mediterranean
Region 42 47 472 509 528 491 69 71 10 11 184 194
Western Pacific Region 60 65 639 644 361 356 138 144 02 02 681 686
Global 82 94 563 591 437 408 133 143 03 04 451 595
Source World Health Organization (2012)
J Glob Bus Trade Vol 9 No2 (November 2013) 35-44
37
Moreover health care expenditures are signify-
cantly associated with improved health outcomes with
public health care expenditure having a larger impact
(Navignon et al 2012) Hence health care expendi-
tures are vital to improving the health status of the
society Relatedly Hurley (2000) stated that ldquothe
market failures that pervade the health care sector
create an important role both for non-market
institutions and for normative economic analysis to
help sort the ldquogoodrdquo policies from the ldquobadrdquo Thus
from a public policy perspective it is valuable to know
how a policy variable like public expenditures on
health care affects the principal causes of morbidity
rates
Ⅲ Status of Public Health
Expenditures in the Philippines
Public health expenditures include current and
capital spending from government budgets external
borrowing and grants and social health insurance
funds (HDR 2007) Although Fig 1 shows that the
budget allocated for public health care in the
Philippines is increasing in the past few years Fig 2
shows that compared to other Southeast Asian
countries the Philippines is actually way behind in
terms of public health care spending as percent of GDP
As a matter of fact according to the Human
Development Report (2007) the Philippines is one of
the countries around the world with the lowest
percentage ( of GDP) spent on public health
expenditure at 14 This current condition would
have a significant impact on the health and ultimately
the over-all productivity of the members of society
For instance the results of the study of Granlund (2006)
indicated that public expenditures on health care have
an effect on the number of absence days of individuals
Furthermore the results showed a positive causality
between health care expenditures and the health of the
society (Granlund 2006)
Sources Department of Budget and Management (2001-
2009)
Source Asian Development Bank (2008)
Since the budget for health is much less in the
Philippines as compared to most countries (and can be
safely assumed to be inadequate) the paper would
want to look at the impact on morbidity incidences
from increasing the current public spending on health
Though the study will just be limited to measuring the
impact on morbidity the results can then be used to
derive the value to society of higher public
expenditures in terms of less people afflicted or
infected by various diseases Unlike in the situation
where the public health care expenditure is already
sufficient (or optimal) it will be much easier to
estimate the external cost of inadequate public health
expenditure by measuring the forgone benefits (say it
resulted to an absence) from those people who were
infected In addition the results of the study could be
used to measure the externalities valued in terms of
cost savings if the spread of the disease was prevented
Analysis of Public Health Expenditures on Leading Causes of Morbidity in the Philippines
38
Ⅳ Leading Causes of Morbidity in the
Philippines
Morbidity may be referred as the state of poor
health the degree or severity of a health condition or
an incidence of a disease In the case of the Philippines
the leading cause of morbidity is pneumonia with an
incidence rate of 718 (per 100000 population) Table 2
shows the top ten leading causes of morbidity in 2007
while Fig 3 shows the trend in the number of cases in
the past few years for the major causes of morbidity
Table 2 Ten Leading Causes of Morbidity
Philippines 2007
Disease Number
of cases
Rate per
100000 population
ALRI and Pneumonia 605471 718
Acute Watery Diarrhea 539701 640 BronchitisBronchiolitis 487302 5778
Hypertension 398538 4726
Influenza 349609 4146 TB Respiratory 114714 136
Diseases of the Heart 31331 372
Dengue Fever 23773 282 Malaria 23207 275
Chickenpox 23090 274
Source Department of Health (2002)
Source Department of Health (2002-2007)
From Fig 1 and Fig 3 it seems that the increasing
public health care expenditures didnrsquot lead to a
significant decrease in the leading causes of morbidity
in the past few years However we cannot conclude
this immediately since there are other factors affecting
the number of cases like private health care
expenditures and population growth These other
variables would be considered later in analyzing the
impact of public health care expenditures on the
number of cases
Ⅴ Characteristics of Health Care
According to Hurley (2000) health care is distinct
from other commodities because of health care having
a combination of features that is only present
individually in other commodities Most of these
characteristics result in market failure or missing
markets causing inefficiencies like in the presence of
externalities information asymmetry and uncertainty
In each of these characteristics the government may be
able to minimize the inefficiencies resulting from these
market failures through public expenditures on health
care (which can be looked at as the policy variable of
the government) This somehow justifies the need for
government intervention on health care as a response
to these characteristics of health care
Though it is desirable to be able to disaggregate
public health expenditure as an answer to each of these
characteristics of health care it will not be easy as
policies on public health care usually answer the
inefficiency problem as a whole Thus the study
would focus on the rationale for public health care
expenditure as it provides a positive externality to the
society
51 Health as a Merit Good
A merit good is a good or service that is regarded
as desirable by the society such that the government
intervenes in its provision The idea is that these goods
and services provide positive externality to the society
and if left to individuals would tend to be under-
provided Thus the government can intervene to
correct this under-provision Common examples of
these merit goods are spending on public services such
as public education and public health care
In general the external benefits from health care
can be looked at in various ways According to Hurley
(2000) people may derive external benefit from
knowing that others receive the needed health care
J Glob Bus Trade Vol 9 No2 (November 2013) 35-44
39
services and not just any health care that a person can
afford In addition the externality from health care can
be looked at as the measure of joy (or prevention of
pity) caused by seeing a healthy person rather than a
sick one The problem however with this valuation of
the externality is that such joy or pity cannot be easily
quantified
An alternative way of looking at the positive
externality provided by the adequate (optimal) amount
of spending on public health would be the cost savings
from those who would have been affected if such
public health expenditures were not adequate (optimal)
The obstacle though is finding these cost savings if the
optimal amount of health expenditures is already in
place This is because one cannot predict who among
the millions or billions of people would have been
externally affected if the existing public health
expenditures were not in place In the case of countries
where public health expenditure is still inadequate we
can analyze the cost savings by looking at the effect of
an increase in public health expenditures on the people
who are currently experiencing diseases which may
have been prevented if the optimal level of expenditure
was in place
52 Prevention versus Cure
It is important to consider that the positive exter-
nalities from having optimal health expenditures can
be realized if such expenditures may have prevented
the spread of a communicable disease Thus if most of
the health expenditures were rather used for cures then
these positive externalities as we defined earlier
would not be realized to the fullest It is still important
to take note that cures also result in a positive
externality since it prevents the further spreading of the
disease given the carrier of the disease is cured as soon
as possible The government expenditures on disease
prevention and control and for infectious disease
prevention and control are exhibited in Fig 4 and Fig
5
Sources Department of Budget and Management (2002-
2009)
Sources Department of Budget and Management (2002-
2009)
Note that the sudden increase in the budget
allocated in both Figs during the 2008 and 2009 was
due to the Intensified Disease Prevention and Control
program introduced during 2008 This almost doubled
or tripled the budget allocation to these items as
compared to years before 2008 It is then desirable to
be able to see the impact of this significant increase in
the public health expenditures on the number of cases
however the data on the number of cases for 2008 is
not yet available
53 Communicable versus Non-
communicable Diseases
Externalities provided by the adequate amount of
spending needed for health care is more apparent in the
presence of communicable diseases In addition to the
general external effects discussed earlier communi-
cable diseases have additional external effects via the
probability of a healthy person being infected by the
Analysis of Public Health Expenditures on Leading Causes of Morbidity in the Philippines
40
person carrying a communicable disease Public
health expenditure may then lower this possibility of
infection to healthy people by providing health care for
people who cannot afford the needed medication
The situation under communicable diseases some-
how distorts the utility maximization problem of
individuals since the presence of a sick person implies
a higher chance of being sick also and thus lowers the
utility of the individual This external effect as pointed
out earlier would cause inefficiency if not recognized
Even though the benefits from societal prevention and
cure of communicable diseases are known the
problem changes to what we know as the free-rider
problem if individuals are left alone to solve the
problem
As we all know voluntary contribution would not
solve the problem due to the free-rider problem Free-
riding would be evident since contribution to
prevention doesnrsquot assure the contributor that he will
be the one that will be saved from the disease ie with
the prevention measures we assume that the infected
individuals will be much less but this doesnrsquot
specifically tell who these individuals are Since this is
the case a person may claim that he doesnrsquot need
prevention measures anyway since with or without the
prevention measure his final state will just be the same
(ie two extreme cases very healthy that in the end he
will be healthy or very vulnerable that heshe will
always be affected anyway) It is likewise possible that
people rather than donate may just choose to put this
prevention contribution into private health expendi-
tures by buying vitamins that give additional protection
or immunity This is the reason why public health
expenditure is essential in the case of communicable
diseases
We can then expect a more significant impact of
higher public expenditures on health care on the
number of communicable diseases as compared to
non-communicable diseases because of the additional
benefits from prevented infection Also we can expect
that public expenditures on health will have a lower
impact as compared to private health expenditures on
non-communicable diseases The paper would then
verify these hypotheses
Ⅵ Sources of Data and Analytical
Procedure
61 Sources of Data
The data used in the study were from various
national survey results gathered by various depart-
ments and agencies of the government Data for the
leading causes of morbidity and the number of cases
every year were taken from the Field Health Service
Information System (FHSIS) Annual Report The
FHSIS Annual Report reflects the activities and health
program accomplishments of the Department of
Health in the Philippines for a given year and serves as
a reference for planning and decision-making at the
local and national levels (FHSIS 2004) The FHSIS
also contains statistics on health systems health status
health services coverage and notifiable diseases in the
Philippines For the purposes of this study the data
utilized were the number of cases per region and per
year of the leading causes of morbidity in the
Philippines such as bronchitis tuberculosis influenza
hypertension and diarrhea
Data on Philippine government health care expen-
ditures were taken from the National Expenditure
Program (NEP) The NEP is an annual publication by
the Department of Budget and Management that
contains the details of the governmentrsquos proposed
program and intended to assist Congress in the review
and deliberation of the proposed national budget for
the legislation of the annual appropriations measures
for the succeeding fiscal year (NEP 2003) Annual and
per region data on public health expenditures were
elicited from the national government budget allocated
to the Department of Health Though it is desirable to
be able to split the expenditures into preventive and
curative measures the available data did not have such
information at the regional level
Data on household (private) expenditures for
health care were obtained from the Family Income and
J Glob Bus Trade Vol 9 No2 (November 2013) 35-44
41
Expenditure Survey (FIES) The FIES is a nationwide
survey of households undertaken every three years by
the National Statistics Office that contains data on
family income and expenditure such as levels of
consumption by item of expenditure as well as sources
of income in cash and in kind and provides
information on the levels of living and disparities in
income of Filipino families (FIES 2006) The study
utilized regional data on the average household
expenditure on medical care Data on the population
per region were also taken from the FHSIS Annual
Report while data on the number of households were
taken from the FIES
62 Analytical Procedure
As stated above it is not enough to just look at the
trends of morbidity cases and public expenditure to be
able to assess the impact of the latter to the former
There are other variables such as private health
expenditures and population at that period of time that
may also significantly affect the number of cases The
paper used a pooled ordinary least squares regression
model to analyze the impact of public health care
expenditures on the number of cases for the major
causes of morbidity in the Philippines from 2002-2006
across regions The model is given by
cases = f(pop privexp pubexp) where pop ndash regional population
privexp ndash average household expenditures
on health
pubexp ndash public health expenditures (lsquo000)
It is hypothesized that there is a positive relation-
ship between the number of cases and population On
the other hand a negative relationship between both
private and public expenditures and the number of
cases is expected
Ⅶ Results and Implications
71 Results and Discussion
Results from the empirical models of the different
morbidity causes are reported in Tables 3 and 4 Notice
that only the results for tuberculosis and diarrhea were
reported since neither public nor private expenditures
on health were able to explain the variation in the
number of cases for bronchitis pneumonia influenza
and hypertension
Table 3 Regression Results for Tuberculosis Cases
variable Coefficient standard error p-value
pop 00018028 00001077 0000
privexp -06158907 02659049 0023 pubexp -00059089 00024357 0018
constant 2103315 8129887 0012
Note highly significant at 1 significant at 5
711 Tuberculosis
The regression result showed that the model is
significant and was able to explain 87 of the
variation in tuberculosis cases based on the computed
adjusted R-squared Public and private expenditures on
health care were found to be significant (at 5) in
explaining the variation in the number of tuberculosis
cases while population was found to be highly
significant (at 1) The results conform to the
hypotheses that an increase in both public and private
spending on health care would result to a decline in the
number of tuberculosis cases Also an increase in the
population results in an increase in the number of cases
which was also expected
Estimates showed that on the average an increase
in the population by 555 increases the number of
tuberculosis cases by one Results also showed that an
increase in public health expenditures decreases the
number of tuberculosis cases Specifically the
estimated coefficient implies that on the average an
increase in public health expenditures by PhP169236
would lead to a one unit decrease in the number of
tuberculosis cases With the PhP16 billion total budget
for health in 2006 (PhP154 million of which was
allocated for tuberculosis prevention and control) an
additional 1 increase in government health expendi-
tures would approximately reduce the number of
tuberculosis cases also by 1 for the same year at the
Analysis of Public Health Expenditures on Leading Causes of Morbidity in the Philippines
42
country level In addition estimates showed that an
increase in the average household private expenditure
on health by PhP162 would result in a unit decline of
tuberculosis cases The value seems low at first glance
but this translates to a total of PhP166 million
spending on health for the household sector from the
174 million Filipino families across 17 regions in
2006 necessary to reduce tuberculosis cases by one
Interestingly public health expenditure seems to be
less costly in terms of preventing tuberculosis cases in
the country This is due to the fact that majority of
tuberculosis cases are experienced by poorer
households that rely more on public health care rather
than private health care which they cannot afford
Public health expenditures are also ideal for
tuberculosis cases because of the ancillary benefits
these provide by preventing the spread of this
communicable disease among the population
Table 4 Regression Results for Diarrhea Cases
variable coefficient standard error p-value
pop 00073148 00007181 0000
privexp -5919509 1773756 0001
pubexp 00385644 00162475 0020 constant 9123934 5423155 0097
Note highly significant at 1 significant at 5
712 Diarrhea
The regression result showed that the model is
significant and was able to explain 70 of the varia-
tion in diarrhea cases based on the computed adjusted
R-squared Public expenditures on health care were
found to be significant (at 5) in explaining the
variation in the number of diarrhea cases while
population and private expenditures on health care
were found to be highly significant (at 1) The results
conform to the hypothesis that an increase private
spending on health care would result in a decline in the
number of diarrhea cases while an increase in the
population results to an increase in the number of cases
However public health care expenditure and the
number of diarrhea cases were found to be positively
related One possible explanation for this result is that
public expenditure on health may be more oriented to
communicable diseases than non-communicable
diseases ie compared with the results of tuberculosis
In addition there are other significant factors that may
be affecting the prevalence of diarrhea which are not
incorporated in the public health care expenditures say
the availability of or access to safe drinking water
among others
Nevertheless results showed that an increase in the
average household private expenditure on health by
PhP017 or equivalently a total of PhP0174 million
spending on health for the household sector would
result in a unit decrease in the number of diarrhea cases
Estimates also showed that on the average an increase
in the population by 137 increases the number of
diarrhea cases by one in the country Results also
showed that an increase in public health expenditures
decreases the number of tuberculosis cases
72 Conclusions Implications and Further
Studies
The result of the study showed that public
expenditures on health care have a significant effect on
the number of tuberculosis cases in the Philippines
Although results for the other cases show that public
expenditure failed to explain the variation in the
number of cases it may be attributed to the unavaila-
bility of disaggregated data allocated for specific
diseases in each region This then can be considered as
the limitation of the study Nonetheless the results of
the study can be used to provide a rationale for the
abrupt increase in the spending for disease prevention
and control for 2008 and 2009
As pointed out earlier the result of the study can be
further extended by valuing the benefits that can be
derived from a prevented sickness resulting from an
increase in public health expenditures The benefits
may include the loss income from being absent
because of the disease and the prevented private
expenditures to prevent the disease Of course the
general external effects of being healthy or seeing a
healthy person may also be included as part of these
benefits These non-marketed goods which are
J Glob Bus Trade Vol 9 No2 (November 2013) 35-44
43
common to the health sector can be measured using
contingent valuation methods such as willingness-to-
pay (Hurley 2000) Knowing these benefits one can
then do a cost-benefit analysis of an increase in public
expenditure on health care Thus if the net benefits
that can be derived from a prevention of a tuberculosis
case is higher than PhP169236 which is the cost of
preventing it then it is rational for the government to
pursue an increase in public health care expenditure
References
Asian Development Bank (2008) Key indicators for
Asia and the Pacific 2008 Manila Author
Retrieved from httpwwwadborgsitesdefault
filespublication27728key-indicators-2008pdf
Connelly L B (2004) Economics and health
promotion The European Journal of Health
Economics (Formerly HEPAC) 5(3) 236-242
Chicago
Department of Budget and Management (nd)
Budget of expenditures and sources of financing
2000-2008 [Webpage] Retrieved from www
dbmgovph
Department of Budget and Management (2001)
Republic of the Philippines national expenditure
program 2001 Manila Author Retrieved from
httpwwwdbmgovph
Department of Budget and Management (2002)
Republic of the Philippines national expenditure
program 2002 Manila Author Retrieved from
httpwwwdbmgovph
Department of Budget and Management (2003)
Republic of the Philippines national expenditure
program 2003 Manila Author Retrieved from
httpwwwdbmgovph
Department of Budget and Management (2004)
Republic of the Philippines national expenditure
program 2004 Manila Author Retrieved from
httpwwwdbmgovph
Department of Budget and Management (2005)
Republic of the Philippines national expenditure
program 2005 Manila Author Retrieved from
httpwwwdbmgovph
Department of Budget and Management (2006)
Republic of the Philippines national expenditure
program 2006 Manila Author Retrieved from
httpwwwdbmgovph
Department of Budget and Management (2007)
Republic of the Philippines national expenditure
program 2007 Manila Author Retrieved from
httpwwwdbmgovph
Department of Budget and Management (2008)
Republic of the Philippines national expenditure
program 2008 Manila Author Retrieved from
httpwwwdbmgovph
Department of Budget and Management (2009)
Republic of the Philippines national expenditure
program 2009 Manila Author Retrieved from
httpwwwdbmgovph
Department of Health (2002) Field health service
information system annual report 2002 Manila
Author Retrieved from httpwwwdohgovph
sitesdefaultfilespublicationsFIELD20HEALT
H20SERVICE20INFORMATION20SYST
EM20ANNUAL20REPORT202002pdf
Department of Health (2003) Field health service
information system annual report 2003 Manila
Author Retrieved from httpwwwdohgovph
sitesdefaultfilespublicationsFIELD20HEALT
H20SERVICE20INFORMATION20SYST
EM20ANNUAL20REPORT202003_0pdf
Department of Health (2004) Field health service
information system annual report 2004 Manila
Author Retrieved from httpwwwdohgovph
sitesdefaultfilespublicationsFIELD20HEALT
H20SERVICE20INFORMATION20SYST
EM20ANNUAL20REPORT202004pdf
Department of Health (2005) Field health service
information system annual report 2005 Manila
Author Retrieved from httpwwwdohgovph
sitesdefaultfilespublicationsFIELD20HEALT
H20SERVICE20INFORMATION20SYST
EM20ANNUAL20REPORT202005_0pdf
Analysis of Public Health Expenditures on Leading Causes of Morbidity in the Philippines
44
Department of Health (2006) Field health service
information system annual report 2006 Manila
Author Retrieved from httpwwwdohgovph
sitesdefaultfilespublicationsFIELD20HEALT
H20SERVICE20INFORMATION20SYST
EM20ANNUAL20REPORT202006pdf
Department of Health (2007) Field health service
information system annual report 2007 Manila
Author Retrieved from httpwwwdohgovph
sitesdefaultfilespublicationsFIELD20HEALT
H20SERVICE20INFORMATION20SYST
EM20ANNUAL20REPORT202007_1pdf
Drouin J P Hediger V Henke N Kanzler L
Leydon E F amp De Santis P (2008) The Health
Care Century Health International 7 6-17
Granlund D (2006) The effect of health care expen-
ditures on sickness absence Paper Presented at the
Inaugural Biennial Conference of American Society
of Health Economists 2006 Madison WI
University of Wisconsin
Hurley J (2000) An overview of the normative
economics of the health sector Handbook of
Health Economics 1 55-118
Novignon J Olakojo S A amp Nonvignon J (2012)
The effects of public and private health care
expenditure on health status in sub-Saharan Africa
New evidence from panel data analysis Health
Economics Review 2(1) 1-8
Philippine Statistics Authority (nd) Family income
and expenditures survey 2000 2003 2006
[Webpage] Retrieved from wwwcensusgovph
United Nations (2007) Human development report
Retrieved from wwwhdrundporg
World Health Organization (2007) National health
accounts 2007 Geneva Author Retrieved from
httpwwwwhointen
World Health Organization (2012) World health
statistics 2012 Geneva Author Retrieved from
httpwwwwhointen
J Glob Bus Trade Vol 9 No 2 (November 2013) 45-60
45
ISSN 1946-5130
Journal of Global Business and Trade
wwwiagbtcom
Analysis of the Interests of Conceiving a Free Trade
Agreement between China and South Korea
Liu Zuankuoa and Zhan Baiming
b
a Shandong Normal University China b South-Central University for Nationalities China
Received 25 August 2013 Revised 22 September 2013 Accepted 28 October 2013
ABSTRACT
Based on the ldquoStarting Joint Minister Statement on free trade agreement between China and South Koreardquo
the article explains the basic ideas of this agreement It shows that there are some distinctive differences
between the statement and the theoretical study on interests China pays more attention to the diplomatic
significance rather than in trade While South Korea aims to guarantee its investment benefits by this
agreement both stations try to protect their producersrsquo benefits Finally this paper using the model GTAP
(Global Trade Analysis Project) puts forward two sets of simulation schemes and forecasts the economic
effects of the Free Trade Zones from the macroeconomics and welfare effects trade effects and industry
effects
Keywords analysis of benefits China-South Korea free trade agreement construction
Ⅰ Introduction10
Minister of Commerce Chen Deming and South
Korean Trade Minister Park Tae-ho attended the
China-ROK Trade Ministers Meeting in Beijing on
May 2nd 2012 and announced the official initiation of
China-ROK Free Trade Agreement negotiations on the
Ministersrsquo Joint Statement (referred to as ldquoStatementrdquo
as following) From the Free Trade Agreement (FTA)
we can see the basic ideas of the interest demands of
the Statement
The statement explains the basic ideas of the FTA
which includes trade in goods services investment
and other fields The interest demands reflected in the
2013 International Academy of Global Business and Trade
All rights reserved
Statement includes two aspects trade and investment
From the perspective of trade benefits the two
countries agreed that levels of trade liberalization in
good and service trades should go beyond those
promised levels in the WTO However there are some
sensitive product issues in the goods trade which
include lists of generally sensitive and highly sensitive
products From the perspective of investment benefits
the level and scope of liberalization were defined
according to both countriesrsquo investment arrangement at
present and in future Meanwhile the overseas
processing zones should be involved in China-ROK
FTA
Analysis of the Interests of Conceiving a Free Trade Agreement between China and South Korea
46
Table 1 MFN Tariff Levels of China and South Korea in Product Category ()
Category of products
China Korea
Average tax rate
Free tax rate Maximum Tax rate
Average tax rate
Free tax rate Maximum Tax rate
Livestock products 148 101 25 221 24 89 Milk products 120 0 20 675 0 176
Fruit Vegetable 148 59 30 574 02 887 Coffee Green tea 147 0 32 539 0 514 Grain 243 34 65 1345 03 800 Oilseed animal fat oil 110 53 30 370 41 630
Sugar Sweet 274 0 50 168 125 243
Drinks Cigarette 223 22 65 317 0 270 Cotton 152 0 40 00 1000 0 Other agricultural products 114 94 38 161 183 754 Fish and its products 109 63 23 161 07 50 Minerals Metals 74 87 50 46 269 8 Petro 48 200 9 41 107 8 Chemistry 66 16 47 57 67 321 Wood Paper 44 353 20 22 675 10 Textile 96 0 38 91 15 13 Cloth 160 0 25 126 0 13
Leather Shoes 132 06 25 79 26 16 Non-electrical machinery 80 90 35 60 226 13 Electronic machinery 83 240 35 62 214 13 Transportation equipment 115 08 45 55 268 10 Other products 119 96 35 67 160 13
Source World Trade Organization (nd)
The level of goods liberalization of the two
countries can be judged from WTO World Customs
Data 2011 In 2010 the simple average MFN tariffs
on agricultural and non-agricultural product imports
were 156 and 87 respectively while the simple
average MFN rates applied to Korea on agricultural
and non-agricultural products exports were 164 and
88 The simple average MFN tariffs on Korean
agricultural products and non-agricultural products
import were 485 and 66 while the MFN rates applied
to China on its agricultural products and non-
agricultural products export were 521 and 66 The
MFN import tariff rate of China and Korea divided by
product category is given via Table 1
Via Table 1 we can see that South Korea paid
more attention to protecting agricultural products (tax
rate 485) than industrial products (tax rate 66)
Therersquos a more than 40 percent difference in the simple
average MFN tariff On Chinarsquos part therersquos no big
difference between agricultural product protection
(156) and industrial product protection (87) the
gap of the simple average MFN tariff between these is
less than 10 percent Meanwhile South Korearsquos
protection on agricultural products (485) is much
higher than Chinarsquos (164) As for industrial product
protection there is a gap between China (156) and
South Korea (66) but the gap in industrial (9 or
so) is not as big as that shown in agricultural products
with a tax rate gap 42
From above it shows that the profit that China
benefits from the FTA mainly depends on the degree of
liberalization of agricultural products of South Korea
If this is the important part of South Korearsquos sensitive
products then the attitude expressed in the joint
statement ldquobeyond goods liberalization level of WTO
commitmentsrdquo has not displayed real significant trade
interests
In other words the previous various theoretical
insights on the China-Korea FTA are not the same as
the benefit idea implied in the statement
J Glob Bus Trade Vol 9 No 2 (November 2013) 45-60
47
Ⅱ Literature Review
With regard to the interests in the FTA negotiations
between China and South Korea Chinese scholars are
generally optimistic about the economic and trade
effects of the bilateral free trade agreement Xue Jing-
xiao and Zhang Bo-wei (2004) believed that Chinarsquos
GDP would grow if China and South Korea were to
establish a free trade area Huang Peng and Wang Jian-
xin (2010) analyze the potential effect of applying
GTAP in constructing a free trade zone between China
and South Korea which indicates that after the
fulfillment of the China-ROK FTA the two countriesrsquo
GDP and components such as consumption
investment government expenditure and so on
compared to the base period all experienced positive
growth South Korea obtains a greater benefit with a
growth rate of 207 while Chinarsquos only 018 Song
Jingen (2011) on the basis of a traditional trade gravity
model studied the effects on trade after the two
countries signed the free trade agreement The results
show that China and South Korearsquos agreement played
a strong role in promoting the trade of both countries
and the total volume of trade would increase nearly
60 He suggests that both countries should pay
attention to the opportunities brought by the agreement
when they are protecting their sensitive sectors Li
Xiao-feng and Gui Jia-yue (2009) based on partial
equilibrium estimates the effects of the establishment
of the China-ROK Free Trade Zone on bilateral trade
flows from the industrial level The simulated results
show that if China and Korea do not established a free
trade zone to a larger extent trade between China and
South Korea would be heavily influenced by the trade
diversion from the Korea-US Free Trade Zone If the
two countries establish a free trade zone it will be
more conducive to the development of comparative
advantages of both countries
Analysis of academic research on China-ROK free
trade agreements has a more rigorous theoretical
condition namely the import tariffs of all goods should
be canceled in the China-ROK FTZ Before the
implementation of the FTZ the higher the tariff is the
greater the increase of imports caused by the tariff
reductions will be From the perspective of exports
before the completion of a bilateral free trade zone the
higher the tariff of partner country is the greater the
exporterrsquos export growth will be after establishment
The joint statement announced by the ministers of
China and the ROK showed that on the one hand the
level of liberalization of trade in goods should
transcend their level of commitment in the WTO On
the other hand the problems of sensitive products
should be a concern A longer transitional period
partial concessions and exceptions should be used to
handle sensitive product issues It is not known which
products are arranged for a longer transition period
partial concessions or exceptions but it will greatly
reduce the expected trade benefits by theoretical study
because the theoretical results used free trade and tariff
barrier elimination as a precondition Meanwhile
when both countries regard their disadvantaged
industries as sensitive products to go beyond the
commitment level in the WTO as agreed in the joint
statement will be quite limited in the scope Thus the
domains of free trade will be relatively small
Professor Yorizumi Watanabe (2009) of Keio
University in Japan analyzed the historical significance
of the FTA among China Japan and South Korea and
pointed out that China makes free trade agreement
policies for three reasons on foreign affairs and
commercial intercourse First in maintaining the
double-digit rapid development in economy China has
become the ldquoworld factoryrdquo and it is imperative to
ensure the market of related industries Second China
has become a world power so it needs to show
Southeast Asian countries an image of a ldquogood
partnerrdquo so as to avoid being seen as a threat Third by
means of drawing those overseas Chinese who have
engaged in long-term economic activities in the
neighboring countries China formed the ldquoGreater
China Rimrdquo and turned it into Chinarsquos powerful
ldquoperipheryrdquo
The interpretation of the motives of Chinarsquos
making of free trade agreement policies by Professor
Watanabe made people feel that Chinarsquos interest
Analysis of the Interests of Conceiving a Free Trade Agreement between China and South Korea
48
demand consists of two aspects commercial inter-
course and diplomacy However regardless of the
relationship of bilabial trade between China and Japan
or between China and South Korea Chinarsquos
advantages in industry are mainly on textiles clothing
leather shoes and other products but the tariff rates of
Chinarsquos MFN of such goods are higher than those of
South Korea and Japan Meanwhile the Chinese
mainlandrsquos ldquoworld factoryrdquo status is a product of the
processing trade China has been acting the role of
assembling and integration in the East Asian labor
division system and the commodities in bilateral trade
between Sino-Korea and Sino-Japan are mainly
constituted by the intermediate input products This
means that Chinarsquos participation in the construction of
the FTZ with Japan and South Korea is not to ensure
the market of related industry and thus its trade
interests are far less than the diplomatic interests which
Professor Watanabe referred to Economists of South
Korea predict that the FTZ has a very large impact on
the Korean economy while there is a relatively small
impact on China For China the strategic goal of the
China and South Korea FTZ is greater than economic
significance while for South Korea the motivation of
getting economic interests is stronger China promoted
the China-ROK FTZ in order to ensure a dominant
position within the East Asian region which cannot
only impact America who took advantage of allies in
Asia to constrain China but also rely on the regional
group to enhance Chinarsquos status in the international
political situation and the multilateral system (Zheng
Zhi-shu 2009)
The interest that South Korea obtained from the
China-ROK FTA depends on the degree of liberali-
zation of Chinese industrial products If Chinese
industrial products constitute a major part of the
sensitive products in China the trade interest of South
Korea would not be significant So the motives of
South Korea negotiating bilateral free trade agreements
with China does not come from trade but from the
following that will be discussed in the third part of the
international investment interests
Ⅲ The Benefit Analysis
31 The balance of Investment Interests and
Trade Interests
Before China and the ROK passed the ldquothe
Associate Ministerial Statement of Starting China-
Korea Free Trade Agreement Negotiationsrdquo China
Japan and the ROK held investment agreement
negotiations in Beijing reached an agreement on all
the remaining issues in the investment agreement and
drafted the agreement on March 21st 2012 Three
parties said they would soon complete their internal
procedures so as to sign the agreement as soon as
possible
From the view of the sequence of time the
successful termination of negotiations on investment
agreements among China Japan and ROK preceded
the starting of negotiations on a bilateral FTA between
China and ROK This indicates that relative to the free
trade agreement the three countries are more
concerned about investment agreements or that South
Korea is keener on the investment issues among the
three countries or between the two countries South
Korean President Lee Myung-bak said that in the
investment agreements among the three countries the
dispute settlement mechanism was included between
the investors and the host country which can provide
legal protection for investors if they suffer a loss on
investment in the host country
Meanwhile the joint statements of two countries
also made clear the important position of investment in
the FTA In the area of investment for proper handling
of issues related to bilateral investment between the
two countries they will confirm the level and scope of
liberalization and take the current and future bilateral
investment-related arrangements into account
When the international economic integration has
developed both in scope and in depth from trade to
international production many bilateral and regional
free trade agreements reflected the feature of the trade
and investment integration such as the North
American Free Trade Agreement In most cases the
J Glob Bus Trade Vol 9 No 2 (November 2013) 45-60
49
countries that are dominant in international investment
will make use of the form of the FTZ to protect its
interests of overseas investments from losses
In terms of the structure of bilateral trade in goods
between China and ROK Korearsquos exports to China
mainly consist of productive goods Table 2 shows
classified by BEC the imports and exports of Chinarsquos
trade in goods to the ROK
Table 2 shows that during the 13 years from 1998
to 2010 among the types of Chinese and South
Korean BEC commodities the following conclusions
can be made according to the changing of exports and
imports of capital goods intermediate goods and
consumer goods
First the imports and exports of intermediate
goods in the cargo trade between China and the ROK
come in on top According to the SNArsquos three basic
categories of goods the annual average import and
export composition ratio of intermediate goods capital
goods and consumer goods trade between China and
Korea were respectively 722 164 and 112
Relative to capital goods and consumer goods the
exceeding ratio balances of intermediate goods trade
value are respectively 56 and 60 percentage points
Table 2 China amp South Korea Goods Trade Structure 1995-2010 (Classified by BEC)
(Unit Hundred Million Dollars)
Intermediate
Goods
Exports
Intermediate
Goods
Imports
Consumer
Goods
Exports
Consumer
Goods
Imports
Capital
Goods
Exports
Capital
Goods
Imports
1995 50 85 14 4 3 13
1998 43 134 12 5 8 11
1999 51 154 17 5 10 13
2000 73 204 25 6 15 22
2001 72 200 33 6 19 28
2002 90 217 43 7 22 61
2003 118 311 51 7 31 108
2004 167 455 61 11 49 153
2005 226 590 66 13 58 161
2006 296 702 83 15 65 173
2007 388 797 94 18 81 213
2008 508 869 96 19 132 223
2009 321 784 76 15 135 212
2010 421 1051 97 24 166 289
Source United Nations Statistics Division (nd)
From the composition of exports and imports
among all of Chinarsquos exports to South Korea the
annual average rates of intermediate goods capital
goods and consumer goods were respectively 642
202 and 155 The rates of these three types of
goods in Chinarsquos annual imports from South Korea
were respectively 803 174 and 22 For
intermediate goods the proportion of Chinarsquos exports
to South Korea is less than that of imports from South
Korea and the balance is up more than ten percentage
points
Second the proportion of the goods used for
production in the cargo trade is much higher than that
of the consumption part In Economics capital is
defined as the products that are produced by the
economic system itself and used as input factors so as
to further produce more products and labor service
According to the basic principles of economics
capital goods and intermediate goods with the
characteristics of production can be considered inputs
for the production of capital goods Statistics show that
the sum of annual import and export proportion is
nearly 886 leaving less than 12 to consumer
goods The very low proportion of consumer goods
trade between China and South Korea shows us the
Analysis of the Interests of Conceiving a Free Trade Agreement between China and South Korea
50
basic characteristics of the internationalization of
production behind the commodity trade structure
Regarding Chinese goods exported to South
Korea the annual average proportion of goods which
had entered the production process was 798 and
continued to rise from 784 in 1995 to 811 in
2005 and to 857 in 2010
Meanwhile the goods that China imported from
South Korea have a higher proportion for production
use and the annual average is almost up to 979 In
1995 the share was 956 and since 2003 its share
has always remained above 98
The proportion (approximately 98) of Chinarsquos
imports of productive goods from Korea is 18 higher
than that (about 80) of Chinarsquos exports indicating
that the degree of Chinarsquos dependence on South Korea
is higher than South Korea on China
Central Bank of Korea (June 14 2011 ) released
the ldquo2010 South Korean Current Account Balancerdquo
which said that the export growth of semiconductors
machinery precision machinery and other goods are
increasing significantly and the trade surplus to China
of such goods is increasing from $3697 billion to
$5104 billion
The formation of this kind of trade structure to a
large extent can be explained reasonably by South
Korearsquos direct investment in China From the
perspective of the trade of intermediate goods Li
Xian-zhu (2010) Ye Jing-yi and Wang Pei (2005)
explained the trade imbalance between China and
South Korea When analyzing the Korean chronic
surplus phenomenon in long term they pointed out
that one of the reasons is that there are many Korean
investment enterprises in China and most are
processing companies required to purchase a large
number of Korean raw materials and accessories for
processing The import of the raw materials and
accessories required by Chinarsquos processing trade is
mentioned above that is Chinese importation of
intermediate goods by BEC classification Some
scholars explained the trade imbalance from the point
of capital goods trade that South Korea has a
competitive advantage in the production of capital
goods that when coupled with the adjacent location is
conducive to reduce transportation costs and thus
South Korea has become one of the main countries for
China to get capital goods from for processing trade
which expanded the size of imports from Korea (Zhao
Fang amp Li Ji 2010)
Statistics show that from 1998 to 2010 among the
foreign direct investments divided by countries and
geographical areas Japan and South Korea have
always been Chinarsquos major source countries for foreign
investment Except those years of the financial crisis
(1998 2008-2009) the proportion of Japan and South
Korearsquos direct investment in China accounted for 13 -
20 For example in 2005 South Korearsquos direct invest-
ment was up to 5168340000 US dollars accounting
for 86 of Chinarsquos total $60324590000rsquos absorption
of foreign investment Japanrsquos direct investments were
6529770000 US dollars accounting for 1082
South Korearsquos direct investment is mainly in the
manufacturing industry By 2005 South Korean
investment in China is mainly focused on the
manufacturing and assembly of electronic appliances
textiles and clothing leasing and business services
food and beverage and retail industries among which
manufacturing accounted for dominance (Yang Li amp
Zhou Wenfeng 2008 ) However in the manufacturing
sector the investment structure of South Korea has a
tendency of changing from the consumer goods
industry including fiber clothing food manufacturing
leather footwear and others to capital goods industries
including electronic communications petrochemical
alloy machinery and equipment and others (Zang Xin
Dong Rongrong amp Cui Yan 2006)
In order to protect the interests of foreign invest-
ment one of the conditions that Japan and South
Korea agreed to in the China-Japan-Korea FTZ nego-
tiation was the signing of ldquoCJK investment agree-
mentsrdquo The tripartite negotiations started in 2007 with
content that included all the important aspects
contained in the international investment agreements
including such clauses as the definition of investment
scope of application MFNT national treatment
J Glob Bus Trade Vol 9 No 2 (November 2013) 45-60
51
expropriation transfer subrogation taxes general
exceptions and dispute resolution
32 The Balance of the Interests of Producers
and Consumers
According to the Yonhap News Agency on
January 12th 2012 the foreign minister of South
Korean Park Taeho said at a press conference held in
the central government office that China as a big
country made a lot of people worried that Korearsquos
agriculture might be pounded South Korea was not
going to allow massive Chinese agricultural products
into South Korea Before starting the China-ROK FTA
negotiations the Korean Government would fully
listen to the views of different fields
Table 3 The Share of South Korearsquos Agriculture in the National Economy 1998-2010
()
Agricultural Labor
Manufacturing Labor
Labor Services Agricultural
Output Manufacturing
Output Services Output
1998 019 2405 4081 336 4511 4044
1999 019 2406 4081 328 4645 4015 2000 017 2453 4087 297 4736 4015
2001 017 2421 4079 287 4557 4182
2002 016 2323 4103 262 4490 4282 2003 016 2316 3989 243 4480 4241
2004 014 2306 3884 239 4727 4034
2005 015 2278 3795 219 4794 4013 2006 014 2165 3468 209 4801 4032
2007 014 2092 345 195 4818 4033
2008 012 2012 3444 184 5064 3833 2009 013 1944 3484 194 4960 3912
2010 013 1909 3484 178 5211 3739
Source Database provided by Korearsquos Banks
Compared with the manufacturing and service
industries the proportion of South Korearsquos agriculture
is not so significant in the national economy The
proportion of employees in the total economic activity
decreased from 019 in 1998 down to 013 in 2010
and the proportion of the total value of agricultural
production in GDP decreased from 336 in 1998
down to 178 in 2010 If the China-ROK FTA finally
regarded the South Korearsquos agriculture as sensitive
products and put it outside the free trade it is no doubt
that this is only to protect the benefits of very few
agricultural producers by sacrificing the interests of
many other consumers
Let us observe the issues of Chinese sensitive
products Chinese Commerce Minister Chen Deming
said that the sensitive products taken into account in
the process of negotiation were related to agriculture in
Korea and Chinarsquos petrochemical electronics
machinery and other fields
Not completely identical to the situation of South
Korearsquos agriculture in the national economy from 1998
to 2010 the ratio of employees in Chinese petroche-
mical electronics and mechanical industries among the
countryrsquos total employment is not high but there is a
rising trend In 1998 Chinese petrochemical and
machinery industry employment accounted for 088
and 157 respectively of the countryrsquos total
employment In 2010 this proportion respectively rose
to 154 and 388
Similarly the ratio of the petrochemical and
mechanical fields in GDP also showed an increasing
trend and its share enlarged In 1998 the ratios were
135 and 213 In 2010 the ratios respectively
increased to 614 and 1173
Table 4 shows that Chinarsquos petrochemical and
machinery industries are growing and developing
rapidly From the production valuersquos movements of
ratio in GDP we can see that from 1998 to 2010 these
Analysis of the Interests of Conceiving a Free Trade Agreement between China and South Korea
52
two sectors in initial stages accounted for 348 of
GDP and by 2005 641
Chinese petrochemical products cover a wide
range of sectors In Chinarsquos Statistical Yearbook they
included the petroleum processing and coking industry
chemical materials and products manufacturing
chemical fiber manufacturing rubber and plastic
products industry Electronic and mechanical fields are
statistically included in machinery and equipment
involving manufacturing industries in common
equipment special equipment transportation
equipment electrical machinery and equipment
electronic and communications equipment instrument
and apparatus and office machinery
Table 4 The Share of Chinese Petrochemical and Machinery Industriesrsquo in the National Economy 1998-2010
()
Petrochemical Industry
Labor Proportion Machinery Industry Labor Proportion
Petrochemical IndustrialGDP
Machinery IndustrialGDP
1998 088 157 135 213
1999 081 145 139 222 2000 074 133 160 240
2001 068 124 155 253
2002 065 121 158 282 2003 098 191 178 340
2004 101 209 224 423
2005 113 244 230 411 2006 119 266 483 883
2007 127 296 554 1028
2008 141 344 608 1119 2009 143 344 547 1059
2010 154 388 614 1173
Source ChinaStatistics (2011)
Chinarsquos petrochemical and machinery accounted
for a high ratio in GDP The number of the labor force
in these two industries was not big and their sum share
is no more than 6 (542 in 2005) in the whole
national economy Thinking about it another way from
the perspective of proportion of factors Zhan Boming
and others (2010) observed and analyzed Chinarsquos
industrial enterprisesrsquo inclination in investment They
found that investment made by state-owned
petrochemical and machinery enterprises have capital
intensive investment tendencies and the investment of
the three-kind investment enterprises in these two
industries are petrochemical capital intensive while
labor-intensive industries including machinery and
transportation equipment manufacturing electronic
and communication equipment manufacturing The
fact means that the idea of separating the Chinese
petrochemical and machinery from the China - Korea
Free Trade Agreement negotiations are to protect those
investorsrsquo interests at the expense of the interests of
numerous consumers
If the Chinese petrochemical products and
machinery products are to be put outside the China-
Korea Free Trade Agreement as sensitive products and
South Korearsquos agricultural sector is also separated
from China-Korea free trade agreement then we can
say such a bilateral free trade agreement almost has no
sense of free trade
Ⅳ Simulation Analysis of the
Economic Effects of China-Korea
FTA
A GTAP model is used in this part to predict the
economic effects if the China-Korea free trade zone is
established
41 Basic Structure of the Model
The GTAP model was developed by Professor
Tomas W Hertel of Purdue University as a multi-
J Glob Bus Trade Vol 9 No 2 (November 2013) 45-60
53
national and multi-sector general equilibrium model
and it has been widely used in trade policy analysis In
the GTAP model framework first sub-models that can
detail description of each countryrsquos (or regionrsquos)
production consumption government spending and so
on are created and then the various sub-models are
combined into a multi-national and multi-sector
general equilibrium model through international
merchandise trade relations When using this model
framework for policy simulation it can also be used to
explore the changes that the policy brings in each
nation and sectorrsquos production import and export
commodity prices supply and demand factors
elements of remuneration GDP and the level of social
welfare
42 Basic Assumptions
421 Conditions of Factors
There are five different types of elements in the
model land capital skilled labor unskilled labor and
natural resources A GTAP model assumes that the
market is perfectly competitive the scale of production
unchanged and each product produced by using
nested constant coefficient to replace elasticity equa-
tion The intermediate inputs consist of domestic and
foreign products through constant coefficient instead of
elasticity equation The products (domestic and import
goods) of different regions are non-homogeneous and
therefore cannot be replaced with each other In the
factor market land among departments is not
completely mobile so the price of land for different
uses is different while the labor in the country is
allowed to flow freely Each country has only one
account to which all the income tax and endowments
are accumulated Then through the Cobb-Douglas
Utility Function income is divided into private
consumption savings and government consumption
by a fixed proportion In a GTAP model there are two
imaginary international departments which are
International Bank and International Traffic Each
countryrsquos savings are accumulated to an International
Bank being allocated among countries according to
the rate of capital return The International Traffic
Department can balance the differences between CIF
and FOB and link the world through bilateral trade
422 Conditions of Behavioral Agents
There are three kinds of typical behavior agents in
the model private departments government
departments and firms
4221 Behavior of Private Department
In private expenditure the private sector consump-
tion expenditure has the nature of non-homothetic
order and should include the impact of population
growth the private department sets levels by using a
CDE Utility Function on a per capita basis Private
department behavior equation
① Private Household Utility
② CompoSITC Demand
③ CompoSITC Tradeable
In these equations yp (r) stands for the regional
units of the private sector household expenditure of r
region ppriv (r) stands for the price index of private
sector household unit consumption expenditure of r
region UELAS stands for the relative utility costs and
elasticity pop (r) stands for the population of r region
qp (i r) stands for the demands of i product in r
regional private department unit EP (i k r) stands for
the cross-price flexibility between irsquos demands and krsquos
price in r regional household unit EY (i r) stands for
the demand of composite commodity i in r regional
household unit pp (i s) stands for the demand price of
integrated trade commodity i in a private household
unit of s region PMSHR (i s) stands for the share that
Analysis of the Interests of Conceiving a Free Trade Agreement between China and South Korea
54
the total imports in the private sector demand for
domestic products of s region ESUBD (i) stands for
the elasticity of substitution between domestic and
imported good i ppd (i s) stands for the demand price
of commodity i in s regional private department unit
qpd (i s) stands for the demand of the national product
i in s regional private department unit ppm (i s) stands
for the demand price for import integrated trade
commodity i in s regional private department unit
qpm (i s) stands for the import demand of product i in
s regional private department unit
4222 Behavior of Government Department
The total government expenditure allocates
between the various commodities via using a Cobb-
Douglas Utility Function This makes the government
expenditure on various commodities of their total
remains constant In an open system the governmentrsquos
demands can be divided into domestic products and
imported products and both of the products form an
integrated product through the CES Function
Government department action equation
① Government Utility
② Demand for CompoSITC Goods
③ CompoSITC Tradeable
In these equations yg (r) stands for the regional
government expenditure of r region pop (r) stands for
population of r region pgov (r) stands for the
consumption expenditures price index of government
departments in r region ug (r) stands for the average
capital expenditure utility level per people from the
government spending in r region VGA (i r) stands for
the expenditure buying i goods in r regional
government departments GOVEXP (r) stands for the
consumer spending in r regional government
departments pg (i r) stands for the demand price of
comprehensive trade i product in r regional
government departments qg (i r) stands for the
demand of i goods in r regional government
departments GMSHR (i s) stands for the government
departmentrsquos share of demand for national products in
total imports in s region pgd (i s) stands for the
demand price of domestic integrated i good in s
regional government departments qgd (i s) stands for
the demand of domestic i product in s regional
government departments pgm (i s) stands for the
demand price of imported comprehensive trade i good
in s regional government departments qgm (i s)
stands for the imported demands of i product in s
regional government departments ESUBD (i) stands
for the elasticity of substitution between domestic
goods and imported goods
4223 Behavior of the Firm
GTAP model assumes that manufacturers use Tree
Structure in the production function Firmsrsquo main
inputs can be divided into the original inputs and
intermediate inputs Suppose the production function
has the characteristics of divisibility and fixed scale
compensation Under the divisibility assumption
firmsrsquo decisions on the most appropriate volume of
original input is not influenced by the changing of
intermediate input price and quite reverse is true
Meanwhile under the assumption of fixed scale
compensation the proportion of factor input of firms
will not be influenced by the changes in production
volume either
On the top of Tree Structure it shows firmsrsquo
decisions of demand between intermediate inputs and
integrated original inputs Under the assumption of the
Leontief Function it shows a fixed proportional rela-
tionship between the intermediate input and original
comprehensive input and total output This is common
in general design of CGE model of which the main
advantage is that it can reduce the number of para-
meters needed to estimate in the model significantly
The bottom left part of the Tree describes the
J Glob Bus Trade Vol 9 No 2 (November 2013) 45-60
55
relationship between the original investment and
production
Assume that the relationship between the original
input and the production is CES Function and the
elasticity of substitution between different original
elements is equal Accordingly sum up the original
inputs in order to obtain the Aggregate Primary Input
At the bottom right part of the Tree Structure it shows
the relationship between the intermediate input and
production which consists of two sides First is the
substitution relationship between the domestic
products and comprehensive imported products
assuming both compose into integrated intermediate
goods through CES Function Second is the
substitution relationship among different sources of
imported intermediate goods assuming which are also
integrated through the CES Function Behavior of
Firm equation
① CompoSITC Intermediate Nest
② Valuemdashadded Nest
③ Total Output Nest
In these equations pf (i j r) and qf (i j r) stands
for the price and demand of i product while producing
j good in r region af (i j r) stands for the technological
change of original feature i in j industry of r region
FMSHR (i j r) stands for the share that r regionrsquos total
imports among the demand for domestic compre-
hensive products pfm (i j s) stands for the demand
price of integrated commodity i in j industry of s
region qfm (i j s) stands for the firmsrsquo total demands
of imports pfd (i j r) stands for the demand price of
domestic comprehensive commodity i in j industry of r
region qfd (i j s) stands for the firmsrsquo demand for
domestic products ESUBD (i) stands for the elasticity
of substitution between domestic and imported goods
pva (j r) stands for the added-value price of producing
j good in r region qva (j r ) stands for the added-value
of j industry in r region ava (j r) stands for the
technological changes of the added-value in j industry
of r region SVA (k j r) stands for the share of added-
value product i in j industry of r region pfe (i j r)
stands for the price of original element i which needed
to produce j product of r region qfe (i j r) stands for
the demand of original element i which needed to
produce j product of r region afe (i j r) stands for the
technological changes of original element i in j
industry of r region ESUBVA (j) stands for the
elasticity of substitution between original elements
during the added-value production in j industry qo (j r)
stands for the output of j department of r region ao (j r)
stands for the technological changes of output in j
department of r region ps (j r) stands for the supply
price of j product in r region ESUBT (j) stands for the
elasticity of substitution of intermediate inputs while
producing j product
423 Equilibrium Condition
A GTAP model assumes a regional household unit
includes a private department and government
department to determine the consumer behavior and
savings behavior of the private department and
government department in the country or region The
Model can be divided into a Closed System and an
Open System Without the government intervention in
a Closed System the income of regional household
unit comes from the reward of selling its own elements
to the firm Firmrsquos incomes come from the purchase of
each householdrsquos expenditure and every manufacturer
also makes money by selling their intermediate goods
All economic behavior expenditures and incomes are
equal Balance of a single country Closed System is
established by the accounting identities and market
equilibrium formula In an Open System due to the
Analysis of the Interests of Conceiving a Free Trade Agreement between China and South Korea
56
joining of foreign departments the government
expenditure and the private spending in local regional
department will be divided into two parts buying
domestic products and imported products
Furthermore some parts of firmrsquos intermediate raw
materials may also be imported and its products are
sold both domestically and abroad
Regional household unitsrsquo behaviors are basically
determined by Aggregate Utility Function which
consists of government expenditure private spending
and savings It is assumed the per capita Cobb-
Douglas Utility Function is adopted and this regional
household unit pursues the utility maximum of a
household unit As a result of using the Cobb-Douglas
Utility Function the proportion of three kinds of
current consumptions that were mentioned above is
fixed
43 The Analysis Method and the Simulation
Program
This article uses the seventh edition GTAP model
which includes 113 countries and 57 sectors In the
model the author combines 113 countries or regions
into three regions China Korea and other parts of the
world 57 industry sectors will be divided into 10 kinds
of product groups 1) food and crops 2) livestock and
meat products 3) forest rivers coal natural gas and
other minerals 4) processed foods 5) Textiles and
clothing 6) light manufacturing 7) heavy industry 8)
Utilities and construction 9) Transportation and
communication 10) other services
In order to fully investigate the effects of trade
liberalization this paper intends to respectively
measure the economic effects of a free trade zone
under two kinds of tax reductions program one
simulates a ldquozero tariff base scenariordquo under the
condition that both China and Korea have a full range
cancellation of goods trade tariffs In program 2
considering the protection of its sensitive industry with
the exceptions of Korearsquos high tariffs on food and crop
departments and the exception of Chinarsquos industrial
sector (light manufacturing and heavy industry) other
department tariff reductions will be by half
44 Simulation and Results of Analysis
441 Economic and Welfare Effects
According to model calculation results (shown in
table 5) we can see from the aspects of GDP growth
In program one after the completion of the China-
Korea free trade zone GDP in both China and Korea
show growth compared to the base period Korea
benefits more with a GDP increase of 139 billion
dollars and a growth rate of 206 China only
increases 25 billion dollars and the growth rate is
015 In program two the GDP of both China and
Korea shows growth compared with the base period
too respectively rising 74 and $540 million
considerably less than the GDP growth in program one
with full exemption of import tariffs This is because
program two still has different levels of trade
protection which leads to inefficient allocation of
resources After the establishment of a free trade zone
in the program one and program two countries with
larger benefits are different Korea benefits more in
program one China benefits more in program two
This is because the two countries have the same tax
reduction in program one Because the trade barriers
between Korea and the other countries in the world are
lower and according to the customs alliance theory
the lower the trade barriers between the Customs
Alliance member countries and other countries in the
world are the establishment of a customs alliance is
less likely to cause more costly trade transfers Under
the condition of full reduction and exemption of tariffs
and zero tariffs China may show a bigger trade
transfer effect thus Korea benefits more In program
two because of the protection for the sensitive food
and crop industry the allocation of resources is less
efficient in Korea
From the point of changes in the countryrsquos welfare
total welfare increases 4964 billion dollars in Korea in
program one while China reduces 653 million dollars
Korearsquos welfare increase is mainly caused by the
improved resource distribution efficiency and trade
conditions Chinarsquos entire welfare reduction is because
of the larger trade diversion effect In program two
J Glob Bus Trade Vol 9 No 2 (November 2013) 45-60
57
both two countriesrsquo welfare increases with Chinarsquos
growth of 189 million dollars and Korearsquos 65 million
dollars Compared to program one the increasing
volume of Korearsquos welfare significantly drops largely
because of Korearsquos high tariffs on food and crop
protection which results in a lower efficiency of
resource allocation
From the view of other regions in the world either
in program one or program two the GDP and welfare
decline at different degrees This means establishing a
free trade zone no matter what level of tax reduction
is conducive to economic growth for member
countries but this will bring adverse changes for those
regions excluded in the free trade zone
From the above analysis the establishment of
China-Korean free trade zone will promote the growth
of the national economy and social welfare regardless
of what level of tax reduction but for other regions in
the world it will bring a negative adverse change
Table 5 Changes of the Economy and Welfare in Different Programs ()
Program One Program Two
Change of GDP
Change Rate of
GDP
Welfare (million of
US dollars)
Change of GDP
Change Rate of
GDP
Welfare (million of US
dollars)
China Korea
Other regions in the world
25051 139023
-277225
015 206
-007
-65303 496385
-42123
74118 54328
-380194
005 008
-001
18941 16497
-15370
Source Compiled according to the result of Rung TAP operation
442 Trade Effects
According to the results of the model calculation
(shown in Table 6) it shows whether canceling all
import tariffs on goods or protecting part of industry by
cancellation of part of tariffs the bilateral trade has an
increase The exports and imports of other regions in
the world experienced varying degrees of reduction
Chinarsquos total economic output is larger so the
establishment of a China-Korea FTZ has less impact
on Chinarsquos import and export level as on Korearsquos The
tax reduction level in program two is not as large as in
program one and in program two some industries are
protected So compared to the program one trade
barriers cause lower efficiency in resource distribution
and the impact on imports and exports is smaller than
in program one
From the terms of the changes in trade either in
program one or program two the China-Korea free
trade zone improves the membersrsquo trade condition to
some degree Specifically Korea benefits more This is
because Korea has more open trade liberalization
whose tariffs on main trade products have been
reduced to a very low level According to the customs
alliance theory the lower the trade barriers between the
Customs Alliance member countries and other regions
in the world is the establishment of a customs alliance
is less likely to cause more costly trade transfers so the
establishment of a China-Korea free trade zone has
little impact on Korearsquos trade transfer and Korea
benefits more from the changes in trade condition than
China
For the other regions in the world under both
kinds of tax reduction and exemption programs there
are different degrees of reduction in import and export
trade conditions indicating that although the establi-
shment of a free trade zone can increase imports and
exports and improve trade conditions for member
countries it can cause an adverse trade effect for the
non-member countries elsewhere in the world
Through the above analysis we can see that after
the establishment of China-Korea free trade zone
regardless of the extent of tax reduction and exemption
it will promote the imports and exports and foreign
trade conditions within the zone but may cause
adverse trade effects on other regions outside it
Analysis of the Interests of Conceiving a Free Trade Agreement between China and South Korea
58
Table 6 Changes of Trade Effects in Different Program ()
Program one Program two
Export Import Trade Condition Export Import Trade Condition
China
Korea The rest of the world
181
244 -002
229
564 -01
005
14 -004
016
028 -00018
021
046 -0006
002
005 -0003
Source compiled according to the result of Rung TAP operation
443 Industry Effects
According to the model calculation results (shown
in Table 7) shown in program one establishing the
free trade zone has a great impact on specific industry
sectors in China and Korea Chinarsquos sectors with
increased output mainly concentrate in the primary
sector products among which the agricultural sector
takes the largest increase reaching 268 while the
industrial sectors (light manufacturing and heavy
industries) decrease slightly In general Chinarsquos sector
output changes but the rate of change is not large In
contrast there is a big difference in sector output
changes between departments in Korea Because of the
restriction of resources geography population and
other natural endowments sectors with reduced output
in Korea are concentrated in the primary sector
particularly in the agricultural sector with a significant
reduction of 2009 much greater than the changes in
other sectors Sectors with output increases concentrate
in the industrial product sectors among which textiles
and clothing sector are the most outstanding with a
927 increase The other regions in the world have a
slight growth in light manufacturing but the outputs of
other sectors experience different degrees of decline
In program two every country protects its weak
industries and the tax reductions are less than in
program one The change rates in industry output of
the two countries is not big except for Chinarsquos textile
and clothing industry which has a slight rise other
changes all decline compared to program one
Although in program two Chinarsquos protection of light
manufacturing and heavy industry help to slow the
decrease of industrial output we can see from Table 7
that China rsquos output of these two industries still
declines indicating that to enhance the level of
industrial development trade protection is not always
feasible It is fundamental to work hard on solving
problems such as low-end industrial structure low
technology in production lack of innovation and etc
Korearsquos protection of agriculture shows a better effect
the output change rate of Korearsquos food and crop
industry decreased from 2009 to 004 Due to
Korearsquos protection of agricultural products Chinarsquos
increased output in food and crop industry changes
from 268 up to 0161
Through the above analysis it can be concluded
that after the establishment of a China-Korea free trade
zone regardless the degrees of tax reduction and
exemption the output will be improved with the
optimization and upgrading of industries For the other
regions in the world it brings adverse impacts
Table7 The Output Changes of Sub-sectors in Program One and Program Two ()
Program one Program two
China Korea Other regions China Korea Other regions
Food and Crop
Livestock and meat products Forest rivers and coal
Natural gas and other minerals
Processed foods Textile and clothing
Light manufacturing
Heavy industries
268
056 031
114 004
-036
-025
-2009
-012 -144
-095 927
034
162
-035
-009 -004
-011 -032
001
-003
0161
0114 0137
0479 0274
-005
-008
-004
-015 -027
-082 534
-017
-018
-0008
-0009 -0027
-0019 -0233
0007
0015
J Glob Bus Trade Vol 9 No 2 (November 2013) 45-60
59
Public utilities construction
Transport and communications Other services
038
009 01
412
155 247
-009
-004 -006
0042
002 0037
023
006 011
-0006
-0005 -0005
Source compiled according to the result of Rung TAP operation
Ⅴ Conclusions
Based on the ldquoStarting Joint Minister Statement on
free trade agreement between China and South Koreardquo
the article explains the basic ideas of this agreement
Through the analysis of the investment interests and
trade interests of China and Korea it finds that
intermediate import and export products in China and
Korea trade rank first and the goods trade in
production is considerably higher than that in
consumption This formation of structure of goods
trade can be reasonably explained by Korearsquos direct
investment in China Through the analysis of
producersrsquo interests and the consumers in China and
Korea it finds that if China and Korea reach a free
trade agreement that excludes Korearsquos agriculture from
free trade as a sensitive product it will sacrifice the
majority of consumersrsquo interests and only protects the
interests of minor agricultural producers If Chinarsquos
petrochemical and machinery are separated from
China-Korea free trade agreement negotiations it will
also sacrifice the majority of consumersrsquo interests and
only protect the investorsrsquo interests Therefore it
shows firstly the insight on interests is significantly
different between the declaration and theoretical
research Secondly Chinarsquos diplomatic interests are
bigger than its trade significance and Korea protects its
investment interests in China through trade agreements
Thirdly both countries are trying to protect their
producersrsquo interests through trade agreements
Finally this paper uses the global trade analysis
project (Global Trade Analysis Project GTAP) model
and proposes ldquofull abolition of trade in goods tariffs
between China and Koreardquo and ldquoKorearsquos exceptions
on its high tariff food and crop sectors Chinarsquos
exceptions on industrial sector (light manufacturing
and heavy industry) and tariffs on other sectors
reduced by halfrdquo It predicts the economic benefits of
China-Korean free trade zone by two sets of simulation
programs from three aspects macroeconomic and
welfare effects trade effects as well as industry effects
It finds that after the establishment of a China-Korean
free trade zone regardless the level of tax reduction it
will promote the growth of the national economy and
improve the social welfare and import and export
Trade conditions and output will be improved with
industrial optimization and upgrading of industries in
two countries For the other regions in the world it will
bring negative and adverse changes
References
Baiming Z Jiang Y amp Maohong L (2010) Biased
investment by state-owned and foreign enterprises
and its production-trade effect Wuhan University
Journal (Philosophy amp Social Sciences) 2010(1)
117-124
ChinaStatistics (2011) China Statistical Yearbook
of 2011 Central Hong Kong Author Retrieved
from httpwwwchinastatisticsnetchina-
statistical-yearbook-2011-m-23html
Fang Z H A O amp Ji L I (2010) A research on
trade status and intra-industry trade between China
and South Korea Journal of Jilin Normal Uni-
versity (Humanities amp Social Science Edition)
2010(4) 52-56
Jianxin H P W (2010) The design of FTA nego-
tiation strategy between China and Korea based on
GTAP simulation World Economy Study 2010(6)
81-86
Li Y amp Zhou W F (2008) The investment from
Korea to China The present situation trend and
Chinarsquos policies Economic Research Guide
2008(3) 158-160
Analysis of the Interests of Conceiving a Free Trade Agreement between China and South Korea
60
Li X F amp Gui J X (2009) An empirical analysis of
the impact of the establishment of China-Korea
FTA on bilateral trade International Economics
and Trade Research 2009(5) 4-8
Li X Z (2010) The trade between China and Korea
and its structure change International Studies
2010(6) 48-52
Song J G (2011) The study of free trade agreement
between China and South Korea based on the
gravity model Contemporary Economic Research
2011(5) 81-85
United Nations Statistics Division (nd) Commodity
Trade statistics database New York NY Author
Retrieved from httpcomtradeunorgdata
Watanabe (2009) The possibility about the FTA
among Japan Korea and China The Economist
2009(12) 5-12
World Trade Organization (nd) World Customs
Data 2011 Retrieved from httpwwwwtoorg
statistics
Xin Z Rong R D amp Yan C (2006) An empirical
analysis of the influence about the direct
investment from Japanese South Korean to China
on the scale and industry Journal of International
Trade 2006(10) 44-50
Xue J X amp Zhang B (2004) The economic coope-
ration arrangements in East Asia A comparative
study based on the general equilibrium model The
Journal of World Economy 2004(6) 51-59
Ye J Y amp Wang P (2005) The analysis of the trade
deficit between China and Korea Economic
Science 2005(1) 115-126
Zheng Z S (2009) The strategic motivation com-
parison of FTA promotion between China and
Korea Commercial Times 2009(33) 35-36
J Glob Bus Trade Vol 9 No 2 (November 2013) 61-71
61
ISSN 1946-5130
Journal of Global Business and Trade
wwwiagbtcom
Stock Market Development and Economic Growth the Case
of the Philippine Stock Market
Princess Jace N Sta Mariaa and Agham C Cuevas
b
ab College of Economics and Management University of the Philippines Los Bantildeos Philippines
Received 25 August 2013 Revised 27 September 2013 Accepted 30 October 2013
ABSTRACT
The general objective of this study is to analyze the level of stock market development of the Philippine Stock
Exchange as reflected by its liquidity position and its implications to economic growth in the Philippines
Stock market liquidity was analyzed through its three liquidity measurements turnover ratio total value of
traded shares ratio and the market size ratio This study used Ordinary Least Squares (OLS) in analyzing the
relationship between stock market liquidity and economic growth using quarterly data from 1996 to 2012
Stock market liquidity as measured by the growth in value of traded shares and the growth in market size is
significantly related to the growth of the economy after controlling for variables such as inflation which
lagged by one period growth in foreign direct investment and openness to trade Further analysis showed that
the growth in market size causes economic growth However the determinant of the growth in value of traded
shares does not exhibit Granger causality but is proven to have a long run relationship as shown from the
results of the Error Correction Model
Keywords economic growth Philippine stock exchange stock market development stock market liquidity
Ⅰ Introduction11
Financial markets and intermediaries play a
significant role in the growth of the economy by
improving financial efficiency that would in turn
provide better allocation of resources As savers or
lenders hold current consumption for future expendi-
ture borrowers desire current consumption or invest-
ment that would eventually yield higher returns in the
future These institutions are responsible for main-
taining a healthy monetary economy in the country as
they mobilize and convert savings into funds and
channel them to borrowers or investors to further
2013 International Academy of Global Business and Trade
All rights reserved
allocate them to more productive investments
(Mishkin 2006) An efficient stable and vibrant stock
market is essential to the development of the financial
sector Stock markets are responsible for the expansion
of a companyrsquos capital by allowing stocks or shares to
be sold or traded in public
Kanasro Jalbani and Junejo (2009) stated that
stock markets play a crucial role in capital mobilization
and provide secondary markets for the investors and
financial institutions to buy and sell securities A stock
market is considered to be liquid when large
transactions are executed with only a small impact on
prices of securities Stock market liquidity is thus
considered a good tool to measure the efficiency of a
stock market A marketrsquos stability is also determined
Stock Market Development and Economic Growth the Case of the Philippine Stock Market
62
through the liquidity of its securities or the ease at
which these securities are bought or sold in the market
The Philippine Stock Exchange (PSE) the sole
stock market of the Philippines was established on
December 23 1993 when the respective founders of
both the Manila Stock Exchange (MSE) and the
Makati Stock Exchange (MKSE) decided to combine
the two exchanges to further develop a more efficient
capital market During the past decade the PSE has
been robust in terms of the daily value traded Both
foreign and domestic market capitalization which is
the measure of the size of listed companies in the stock
market has been increasing since 2002 In January
2013 the Philippine Stock Exchange index (PSEi) the
indicator used to measure the performance of active
and highly capitalized listed Philippine companies in
the PSE breached the 6000 level an all-time high in
Philippine stock market history
The general objective of the study is to analyze the
liquidity of the Philippine stock market and its
implications for economic growth Liquidity is
important as it is an aspect of a stock market that is
necessary for the traders to interact Specifically the
study aims to measure the liquidity of the Philippine
stock market and evaluate its trends for the given
period determine the linkages between stock market
liquidity and growth of the economy and determine the
causality between stock market development and
economic growth in the Philippines
The paper is organized as follows The next two
sections review the related literature followed by the
analytical and empirical framework The fourth section
discusses the results while the last section provides the
conclusion
Ⅱ Review of Related Literature
21 Stock Market Development as a
Determinant of Economic Growth
Several studies have been conducted on the
relevance of stock market development to economic
growth As cited by Petros (nd) the stock market
provides the fulcrum for capital market activities and it
is often cited as a barometer of business direction An
active stock market may be relied upon to measure
changes in general economic activities using the stock
market index (Obadan 1995) According to Petros
(nd) directly or indirectly a stock market through its
specific services can contribute to economic growth
Mobilization of savings creation of liquidity risk
diversification improved dissemination and acquisi-
tion of information and enhanced incentive for cor-
porate control are functions that are notably significant
thus by improving the efficiency and effectiveness of
these functions it can amplify the economic growth
rate
Tapitan (2012) highlighted the role of financial
intermediaries as a prerequisite for economic growth as
they play an important role in technological progress
The financial system affects capital accumulation by
altering the saving or by reallocating savings among
different capital producing technologies The key
assumption is that better technology is produced as a
by-product of capital investment
Capital investments are important in boosting the
growth of the countryrsquos economy As cited by Nagai-
shi (1999) Levine (1997) identified two channels in
which financial markets or intermediaries affect
economic growth through capital accumulation and
technological innovation In 1999 Garcia and Liu
(1999) identified three main channels through which
financial markets and intermediaries may affect
economic growth The first is by stimulating savings
Financial markets or intermediaries provide savers
with a relatively higher yield McKinnon (1973) and
Shaw (1973) (as cited by Garcia amp Liu 1999) claimed
that financial deepening improves not only produc-
tivity of capital but also the saving rate and therefore
investment and growth Second this can be done by
reducing information and transactions costs because
we know that high transaction costs would definitely
have a negative effect on trading for these discourage
people from transacting thus affecting onersquos profit
Lastly by promoting an efficient allocation of invest-
ment the allocation of resources is improved
J Glob Bus Trade Vol 9 No 2 (November 2013) 61-71
63
22 Stock Market Liquidity
Stahel (2004) (as cited by Benić amp Frani 2008)
argues that due to stock market integration investors
would tend to move their capital to where they expect
higher returns on their investments Von Wyss (2004)
(as cited by Benić amp Frani) defined four aspects or
dimensions of financial market liquidity the trading
time tightness depth and resiliency These dimen-
sions of liquidity may be presented with five different
levels of liquidity 1) the ability to trade at all 2) the
ability to buy or to sell a certain amount of an asset
with an influence on the quoted price 3) the ability to
buy or to sell a certain amount of an asset without any
influence on the quoted price 4) the ability to buy and
to sell an asset at about the same price at the same time
and 5) the ability to execute a transaction from points
two to four immediately
Sarr and Lybek (2002) claim that illiquid markets
are more of a symptom rather than a cause of
inadequate market functioning They posit that in order
to foster liquid financial markets sound and
transparent economic policies with appropriately
designed trading clearing and settlement systems as
well as appropriate intervention policies of the central
bank which can help contain systematic risk are the
only sustainable solution
Levine and Zervos (1998) investigated whether
measures of stock market liquidity size volatility and
integration with world capital markets are robustly
correlated with current and future rates of economic
growth capital accumulation productivity improve-
ments and saving rates They used data on 49
countries from the period 1976 to 1993 They
evaluated whether the stock market indicators together
with banking development are correlated with the
growth indicators Stock market development
indicators include the size in which capitalization is
measured by the value of listed domestic shares on
domestic exchanges divided by GDP the liquidity
which is measured by the turnover ratio and the value
traded ratio Using the international capital asset
pricing model (CAPM) and international arbitrage
pricing theory (APT) they concluded that stock market
liquidity and banking development are both positively
and robustly correlated with contemporaneous and
future rates of economic growth capital accumulation
and productivity growth Also both a stock market and
banks provide different financial services that could
actually help the economy as a whole On the other
hand based on their study they find no support that
these indicators reduce private savings rate or hinder
long run growth
Levine (1996) tested the liquidity of stock markets
for 38 countries (1976-1993) that include both Indus-
trial and developing countries Three measurements for
liquidity were used the total value of shares traded on
a countryrsquos stock exchanges as a share of GDP the
value of traded shares as a percentage of total market
capitalization or the turnover ratio and the value-
traded-ratio divided by stock price volatility He
claimed that a liquid market should be able to handle
heavy trading without large price swings Thus
empirically stock market size and volatility do not
matter but the ease of which shares can be traded The
results suggest that stock market liquidity helps
forecast economic growth even after accounting for a
variety of nonfinancial factors that influence economic
growth Stock market liquidity is still a reliable
indicator of future long term growth after controlling
for inflation fiscal policy political stability education
the efficiency of the legal system exchange rate policy
and openness to international trade
Ⅲ Analytical and Empirical
Framework
Stock markets contribute in easing financial
activities as well as guiding the countryrsquos firms and
investors to allocate their funds efficiently Levine
(1996) showed that countries that had more liquid
stock markets enjoyed both faster rates of capital
accumulation and greater productivity gains Stock
markets through creation of liquidity affect economic
activity by less risky investment in equity markets
which allows savers to acquire assets and quickly sell
Stock Market Development and Economic Growth the Case of the Philippine Stock Market
64
them As Fig 1 shows liquid markets improve capital
allocation that would in turn enhance growth in the
economy
Levine (2003) identified three core sources of
theoretically ambiguous relationships between econo-
mic growth and stock market liquidity He first stated
that stock market liquidity lowers the risk of investing
in longer-run higher return projects and in
consequence fosters a growth-accelerating reallocation
of capital The lower risk however affects savings and
capital accumulation rates ambiguously so that
aggregate growth will slow if savings rate fall enough
Second the cost of investing in the long run is lower
Higher rate of return on savings affects savings and
capital accumulation rates ambiguously so that growth
will fall if capital accumulation rates fall enough
Finally stock market liquidity affects incentives for
investors to undertake the costly processes of
researching and monitoring firms and managers
ambiguously Liquidity will affect growth positively if
stock market liquidity encourages agents to evaluate
and exert corporate control
31 Measures of Stock Market Liquidity
The study adopted two measurements of liquidity
used by Kanasro et al (2009) to determine the
efficiency of the Philippine stock market through
liquidity of its shares Stock market liquidity is
hypothesized to be
SML = f (TVTS MSIZE) (1)
Where
SML -- Stock Market Liquidity
TVTS -- Total Value of Traded Shares Ratio
MSIZE -- Market Size Ratio
The Total Value of Traded Shares Ratio (TVTS)
measures the value of equity transactions relative to the
size of the economy The formula for computing the
total value of traded shares ratio is as follows
TVTS = Total Value of Traded Shares
Gross Domestic Product (2)
The Market Size Ratio (MSIZE) measures the size
of the Philippine Stock Exchange in accordance with
the market capitalization as the ratio of GDP of the
Philippines during the sample period
MSIZE = Gross Domestic Product (3)
Market Capitalization
Fig 1 Schematic Diagram for Stock Market
Liquidity and Economic Growth (Levine
1996)
32 Empirical Model
To analyze the relationship between the liquidity of
the Philippine Stock Exchange (PSE) and economic
growth in the Philippines the two measures for stock
market liquidity in logarithm form were regressed to
the logarithm of Gross Domestic Product (LNGDP)
together with the other factors that influence economic
J Glob Bus Trade Vol 9 No 2 (November 2013) 61-71
65
growth using Ordinary Least Squares (OLS) This
study also adopted the regression model of Levine
(2003) Nurudeen (2009) and Mohtadi and Agarwal
(nd) The model directly examined the relationship
between stock market liquidity and economic growth
The regression model is as follows
LNGDP = β0 + β1 LN (TVTS) + β 2 LN (MSIZE)
+ β3 LN (OPEN) + β4 LN (FDI)
+ β4 (INFLAG) + μ (4)
Where
LNGDP -growth in Gross Domestic Product
LNTVTS-growth in Total Value of Traded
Shares Ratio
LNMSIZE-growth in Market Size Ratio
LNOPEN -growth in Openness to Trade
LNFDI-growth in Foreign Direct Investment
INFLAG-Inflation Rate lagged by one period
β-parameter of the indicators
micro-the error term
The variables in the model above are defined as
follows LNGDP refers to economic growth and it is
measured as the logarithm of the real GDP The
LNTVTS is the growth in Total Value of Traded
Shares Ratio and it is measured by dividing the total
value of traded shares with the gross domestic product
and transformed to its natural logarithm The
LNMSIZE is the growth in Market Size Ratio
measured by dividing the gross domestic product to
the market capitalization and transformed to its natural
logarithm LNOPEN refers to the growth in openness
to trade and it is measured by tariff revenues which is
measured by tariff rate multiplied by imports divided
by the sum of imports and exports and transformed to
its natural logarithm LNFDI refers to growth in
foreign direct investment INFLAG is the inflation rate
lagged by one period and μ is the error term
It is hypothesized that an increase in the growth in
total value of traded shares and market size should
increase the growth of the economy The variables
LNOPEN LNFDI INFLAG were used as control
variables to gauge the strength of the correlation
between stock market liquidity and economic growth
for the given period The inflation rate lagged by one
period (INFLAG) is the percentage rate of the change
in the general changes in the price level thus it
measures the monetary instability that negatively
affects economic performance Its lagged effect was
assigned to serve as a proxy for expected future
inflation Foreign direct investment (FDI) was
expected to augment savings and increase the rates of
capital accumulation giving a positive relationship to
economic growth Openness to trade (OPEN) refers to
the openness to international trade of the economy as
trade openness fosters competition in global markets it
was expected that its growth will have a positive
relationship with economic growth
Ⅳ Results and Discussion
This study used a simple Ordinary Least Squares
(OLS) method to determine and further analyze the
relationship between the level of stock market
development as proxied by liquidity position of the
Philippine stock market and economic growth It also
attempted to provide evidence on the existence of a
long run relationship between stock market
development and economic growth through the use of
the Granger Causality test
41 Liquidity of the Philippine Stock
Exchange
The Turnover Ratio measures the value of equity
transactions relative to the market size A high turnover
is an indicator of low transaction cost (Levine amp
Zervos 1998) The turnover position of the Philippine
Stock Exchange has experienced fluctuations The
Ramos administration (1992-1998) experienced a
steady growth in the economy during which the
Philippines Stock Exchange (PSE) was unified
However due to the 1997 Asian financial crisis its
performance declined Under the administration of
Stock Market Development and Economic Growth the Case of the Philippine Stock Market
66
Estrada a decline in the performance in the PSE can be
seen From a 1262 turnover ratio in 1999 it declined
to 218 in 2000 due to poor governance and
economic policies that affected the confidence among
potential investors The economic reforms and policies
under the Arroyo administration improved growth in
the economy giving stock market significant inflows
gaining back investorsrsquo confidence Due to different
problems that the economy experienced coupled with
the global crisis as shown in Fig 2 the trend continued
to be volatile The average turnover ratio of PSE is
380 during the sample period
The Total Value of Traded Shares Ratio (TVTS)
measures the value of equity transactions relative to the
size of the economy There are significant jumps in the
liquidity (total value of shares traded to GDP) in the
last six years Its TVTS ratio has grown to almost 28
The overall average liquidity during the sample period
is 65
Fig 2 Liquidity at Philippine Stock Exchange
(PSE) using Turnover Ratio (TOR) and
Total Value of Traded Shares (TVTS)
The Market Size (MSIZE) measures the size of the
Philippine Stock Exchange in accordance with the
market capitalization as the ratio of GDP of the
Philippines during the sample period As shown in Fig
3 the size of the PSE remained very small from the
year 1996-1999 which had about 3-5 until 2000
when it increased to almost 40 The 1997 Asian
financial crisis caused instability in the financial sector
and only a few companiesrsquo securities were listed The
overall average size of the market has remained only
254 of GDP which seemed to be low in comparison
with other developing markets Since the unification of
the Makati Stock Exchange and the Manila Stock
Exchange in 1993 the Philippine Stock Exchange has
remained relatively small As of May 2012 there are
344 listed companies in the PSE
Fig 3 Liquidity at the Philippine Stock Exchange
using Market Size (MSIZE)
42 Regression Results
The study used 67 observations from the first
quarter of 1996 to the third quarter of 2012 Three
variables were found to be significant using the
Ordinary Least Squares (OLS) method These
variables were the growth in total value of traded
shares (LNTVTS) growth in market size (LNMSIZE)
growth in openness to trade (LNOPEN) The turnover
ratio was not used as a determinant of liquidity as
Levine and Zervos (1996) states that the turnover ratio
measures trading of firmrsquos equities relative to the size
of the market and does not satisfy the degree in which
liquidity services on a macroeconomic scale Thus it
would not be providing significant liquidity to the
economy as a whole Therefore a large stock market is
not necessarily a liquid market
The Durbin-Watson and Breusch-Godfrey tests
were used to test for the presence of autocorrelation
Having found to have positive autocorrelation the
Cochrane-Orcutt Transformation was used as a
remedy to minimize the autocorrelation problem Table
1 shows the regression results after the Cochrane-
Orcutt Transformation
J Glob Bus Trade Vol 9 No 2 (November 2013) 61-71
67
From Table 1 results show that the effect of
growth on the total value of traded shares and the
growth of the market size on economic growth is
positive and statistically significant at the 1 level
The control variables which are the growth of
openness to trade and growth of foreign direct
investment also have the expected signs which are
positive however these variables are not significant
even at the 10 level The results also show that the
variable of inflation lagged by one period is negatively
related to economic growth and significant at the 10
level
Table 1 Cochrane-Orcutt Transformation Regression
Results
Variable Coefficient Std Error t-statistic Probability
LNTVTS 0134 0037 362 0001
LNMSIZE 0826 0046 1800 0000
INFLAG -0025 0013 -196 0055
LNOPEN 0269NS 0240 112 0268
LNFDI 0009NS 0009 100 0322
_cons 8062 0646 1248 0000
R2 = 09488 Prob gt F = 0000
Adjusted R2 =09445 DW Statistic
(transformed) = 2005368
Notes 1 significant at 1 level of significance
2 significant at 5 level of significance
3 significant at 10 level of significance 4 Values were rounded off to three decimal
places
Stock markets contribute to economic develop-
ment by enhancing the liquidity of capital investments
(Levine 1997) Moreover by increasing the quantity
and productivity through improved allocation of
capital as well as reducing the need to hold liquid
balances a liquid stock market would augment econo-
mic growth The results showed that the relationship
between the growth of market size (MSIZE) and
economic growth is positive and significant in
explaining economic growth in the Philippines as it
was used as a proxy for liquidity The coefficient 0826
implies that a 1 increase in growth of market size
would lead to an increase of 0826 in the growth of
GDP The result provides proof that the size of the
Philippine Stock Exchange (PSE) during the given
period determines the ability of the market to mobilize
savings improve the quality and quantity of invest-
ment and accelerate economic growth since the role of
the PSE is to bring companies together to raise capital
through securities
The other measure for liquidity has a positive and
significant effect on economic growth The growth in
total value of traded shares (LNTVTS) has a coeffi-
cient of 0134 implying that a 1 increase in the
growth of total value of traded shares will increase
economic growth by 0134 Since the growth of
TVTS measures the trading of firmrsquos equity as a share
of GDP its liquidity therefore positively reflects on an
economy-wide basis (Levine amp Zervos 1996)
Inflation (INFLAG) which was lagged by one
period conforms to economic theory by having a
negative relationship with economic growth since it
affects economic performance through monetary
instability It has a coefficient of -0025 which is
statistically significant at 10 level This means that a
1 increase in the inflation rate leads to a decrease in
the growth of GDP by 0025
The coefficient of the growth in openness to trade
(OPEN) conforms to the standard economic theory
since it is positively related to economic growth even
if it was used as a control variable The coefficient of
0269 implies that over the study period a 1 increase
in the degree of trade openness leads to approximately
0269 increase in growth of GDP Also there is a
positive relationship between the growth of foreign
direct investment (FDI) and economic growth since
FDI helps to supply long-term capital with new
technologies managerial and marketing capabilities
that would in turn augment economic growth through
employment increasing managerial skills diffusing
technologies and fostering innovations (Asiedu 2002
as cited by Adhikary 2011) The coefficient of 0009
implies that over the study period a 1 increase in the
degree foreign direct investment would lead to 0009
increase in growth of GDP
However results for openness to trade and foreign
direct investment in the model proved to be statistically
Stock Market Development and Economic Growth the Case of the Philippine Stock Market
68
insignificant after using these as control variables
along with the stock market liquidity measurements
The explanatory power or the goodness of fit of the
model as measured by the R-squared is at 09488
which means that 95 can be explained by the model
and it has a very strong fit The value indicates that
economic growth in the Philippines is adequately
explained by the model for the period between the first
quarter of 1996 to the third quarter of 2012 or that 95
of the variation in the growth of economic activities is
explained by the independent variables Moreover the
relationship between liquidity and growth remains
strong even after controlling for inflation foreign direct
investment and openness to trade Thus raising stock
market liquidity may independently produce
substantial growth
43 Long Run Relationship and Causality
431Test for Stationarity
One of the conditions in order to test Granger
Causality between the two variables is through its
stationarity It is important to know if the variable is
stationary or does not have a unit root or if the variable
is nonstationary or the variable contains a unit root
The variables LNTVTS LNMSIZE and LNGDP
were not stationary in their respective level forms
Thus for testing of the unit roots the Augmented
Dickey Fuller (ADF) test was used for the two
measurements of stock market liquidity which are the
LNTVTS and LNMSIZE and the proxy for economic
growth LNGDP The ADF includes the additional
lagged terms which can be examined by the Akaike
Information Criterion (AIC) to ensure that the errors
are uncorrelated If the variable is nonstationary at
level form but stationary after first differencing the
variable is integrated of order 1 and has a unit root
Using the said test variables LNTVTS LNMSIZE
and LNGDP are stationary after first differencing The
results for stationarity are shown in Table 2
Table 2 Stationarity Test Results
Variables Level Form P-value First Difference P-value
LNGDP 05891 lags (4) 00015 lags (4)
LNTVTS 06311 lags (4) 0000 lags (3)
LNMSIZE 03335 lags (4) 00039 lags (4)
Notes 1 significant at 1 level of significance
2 significant at 5 level of significance
432 Test for Cointegration
Since the stationarity of the variables have been
established the cointegration of the indicators of stock
market development and economic growth were tested
The results for the Cointegrating Regression Dickey
Fuller Test are shown in Table 3
Table 3 Cointegrating Regression Dickey Fuller
Test Results
Regressed Variables P-value
LNTVTS and LNGDP 00250
LNMSIZE and LNGDP 00545
Note significant at 5 level of significance
The regression results suggest that LNTVTS is
cointegrated with LNGDP Thus LNTVTS has a
long-run relationship with LNGDP which means
LNTVTS share a common stochastic drift or a
common trend with LNGDP The results also suggest
that LNMSIZE is also cointegrated with LNGDP
because the error term is stationary
433 Granger Causality
Granger Causality can only be tested if variables
are stationary and variables are cointegrated It is used
to establish whether a uni-directional or bi-directional
relationship exists between stock market development
and economic growth Results showed that LNTVTS
and LNMSIZE are both stationary and cointegrated
with LNGDP Table 4 shows the optimal number of
lags used in each determinant through Akaike
Information Criterion Table 5 shows the result of the
Granger Causality test
J Glob Bus Trade Vol 9 No 2 (November 2013) 61-71
69
Table 4 Akaike Information Criterion
LNGDP LNTVTS LNMSIZE
Lags AIC AIC AIC
0 212598 237417 215782
1 168524 222582 181308
2 164703 223876 179562
3 14775 214879 172127
4 14659 216273 167974
Note indicates the optimal number of lags
The results of the Granger Causality tests indicated
that there is a unidirectional causality between stock
market liquidity using the growth in the market size as
proxy and economic growth However results show
that there is no causality between growth in total value
of traded shares and economic growth Growth in total
value of traded shares and economic growth may have
a long-run relationship since they are cointegrated but
they do not exhibit Granger causality
Table 5 Granger Causality Test Results
Variable Computed
Statistic
F Tabular
Value
Granger
Causality
LNTVTS to
LNGDP 093NS 04532 No
LNGDP to
LNTVTS 038NS 07660 No
LNMSIZE to
LNGDP 347 00136 Yes
LNGDP to
LNMSIZE 037NS 08293 No
Notes 1 significant at 5 level of significance
2 NS - indicates insignificance
Since the variables LNTVTS and LNGDP were
found to be cointegrated an Error Correction Model
(ECM) was specified to test for the speed of
adjustment in the said determinants when one of these
variables experiences a shock Table 6 shows the Error
Correction Method results for LNTVTS and LNGDP
Table 6 Error Correction Method Results
Variables Speed of Adjustment
LNTVTS and LNGDP -0143817
Note significant at 5 level of significance
It can be observed from the results that LNTVTS
as the measure of stock market liquidity and LNGDP
for economic growth have the coefficient of the error
correction term with a negative sign and it is
statistically significant at the 5 level of significance
Thus the significance of the error correction mecha-
nism supports cointegration and suggests the existence
of a long-run equilibrium relationship between economic
growth and stock market development determinant
LNTVTS In other words the coefficient of the error
correction term which measures the speed of adjust-
ment back to equilibrium whenever the system is
experiencing a shock indicates that it would take 6953
asymp 7 quarters for a variable to adjust whenever one
experiences a shock
Ⅴ Summary and Conclusion
This research work studies stock market develop-
ment and its implications to economic growth by
analyzing the relationship between the stock market
measurements for liquidity and GDP growth in the
Philippines The specific objectives of the study were
to measure the liquidity of the Philippine stock market
and evaluate its trends for the given period determine
the linkages between stock market liquidity and
growth of the economy and to determine the causality
between stock market development and economic
growth
Using Ordinary Least Squares (OLS) method for
the time series data covering the period of the first
quarter of 1996 to the third quarter of 2012 it was
shown that the role of the stock market is essential to
economic growth in a developing country like the
Philippines The two measures used for liquidity the
growth in total value of traded shares and the growth in
market size were both positively related to economic
growth and statistically significant However results
for the growth in openness to trade and foreign direct
investment in the model proved to be statistically
insignificant after using it as control variables along
with the stock market liquidity measures Inflation on
Stock Market Development and Economic Growth the Case of the Philippine Stock Market
70
the other hand which was lagged by one period
conforms to theoretical conventions by having a
negative relationship to economic growth since it
affects economic performance because of monetary
instability About 95 of the variation in economic
growth is explained by the independent variables
Moreover the relationship between liquidity and
growth remains strong even after controlling for
inflation foreign direct investment and openness to
trade Thus raising stock market liquidity may
independently produce substantial growth
In assessing the relationship between stock market
development and economic growth it empirically
proved that the measure of economic growth (LNGDP)
and all of the determinants for stock market liquidity ndash
LNTVTS and LNMSIZE were both stationary and
cointegrated For the case of the Philippines there is a
unidirectional causality between stock market liquidity
using the growth in the market size as proxy and
economic growth For LNTVTS stock market
liquidity does not ldquoGranger causerdquo economic growth
and vice versa Since the two indicators have a long
run relationship the results of the Error Correction
Model suggest that there is an adjustment in stock
market liquidity as proxied by growth in total value of
traded shares and economic growth whenever one of
the indicators experiences a shock
Admittedly the study only tested a portion of the
financial side the stock marketrsquos liquidity Other
important determinants of stock market development
such as price volatility elasticity in trading corporate
governance could also be incorporated to give more
robust results There are a wide variety of factors that
can affect economic growth both on the financial and
real sectors of the economy which needs to be taken
into consideration The empirical results indicate that
the potential of the Philippines Stock Exchange in
fostering growth in the country should further be
explored
References
Adhikary B K (2010) FDI trade openness capital
formation and economic growth in Bangladesh A
linkage analysis International Journal of Business
and Management 6(1) 16-28
Benić V amp Franić I (2009) Stock market liquidity
comparative analysis of Croatian and regional
markets Financial Theory and Practice 32(4)
477-498
Garcia V F amp Liu L (1999) Macroeconomic
determinants of stock market development Journal
of Applied Economics 2(1) 29-59
Kanasro H A Jalbani A A amp Junejo M A (2009)
Stock Market Liquidity A Case Study of Karachi
Stock Exchange Pakistan Journal of Commerce
Social Science 3 25-34
Levine R amp Zervos S (1996) Stock market
development and long-run growth The World
Bank Economic Review 10(2) 323-339
Levine R amp Zervos S (1998) Stock markets banks
and economic growth American Economic Review
537-558
Levine R (1996) Stock markets A spur to economic
growth Finance and Development 33 7-10
Levine R (1996) Stock market liquidity and economic
growth Theory and evidence Retrieved from
httpfacultyhaasberkeleyeduross_levinepapers
0845_001pdf
Levine R (1997) Stock markets economic develop-
ment and capital control liberalization Perspec-
tive 3(5) 1-8
Mishkin F (2006) The economics of money banking
and financial markets (10th ed) Upper Saddle
River NJ Prentice Hall
Mohtadi H amp Agarwal S (2001) Stock market
development and economic growth Evidence
from developing countries Available at http
www uwm edumohadiPA-4-01pdf
Nagaishi M (1999) Stock market development and
economic growth Dubious relationship Economic
and Political Weekly 2004-2012
J Glob Bus Trade Vol 9 No 2 (November 2013) 61-71
71
Nurudeen A (2009) Does stock market development
raise economic growth Evidence from Nigeria
The Review of Finance and Banking 1(1) 015-
026
Petros J (2012) The effect of the stock exchange on
economic growth A case of the Zimbabwe stock
exchange Research of Business Economics 6 1-
17
Sarr A amp Lybek T (2002) Measuring liquidity in
financial markets (Working Paper No 02232)
Washington DC IMF
Tapitan J P (2012) Measuring link between financial
development and economic growth using a sample
of selected ASEAN countries (Unpublished under-
graduate thesis) Los Banos Philippines Univer-
sity of the Philippines Los Bantildeos
Von W R (2004) Measuring and predicting liquidity
in the stock market (Doctoral dissertation) Retrie-
ved from httpwww1 unisgchwwwedisnsf
SysLkpByIdentifier2899$FILEdis2899pdf
Xiao X amp Kong L L (2012) An Empirical Study
on the Relationship between Turnover Rate and
Stock Returns in Chinese Stock Market Advances
in Information Technology and Management 2(1)
239-245
Yartey C A (2008) The determinants of stock market
development in emerging economies Is South
Africa different (Working Paper No 0832)
Washington DC IMF
J Glob Bus Trade Vol 9 No 2 (November 2013) 61-71
73