Embed Size (px)
Citation preview

Contents lists available at ScienceDirect
Journal of Financial Economics
Journal of Financial Economics 99 (2011) 523–545
0304-40
doi:10.1
$ We
Germai
seminar
Reconst
Alicante
Iowa, U
Technol
(Lubrafi
support� Cor
E-m
journal homepage: www.elsevier.com/locate/jfec
Board structure and price informativeness$
Daniel Ferreira a,d,e, Miguel A. Ferreira b,d,�, Clara C. Raposo c
a London School of Economics and Political Science, Houghton Street, London WC2A 2AE, UKb Universidade Nova de Lisboa, Faculdade de Economia, 1099-032 Lisbon, Portugalc Universidade Tecnica de Lisboa, Instituto Superior de Economia e Gest~ao, 1200-781 Lisbon, Portugald European Corporate Governance Institute, 1180 Brussels, Belgiume Centre for Economic Policy Research, London EC1V 0DG, UK
a r t i c l e i n f o
Article history:
Received 21 April 2008
Received in revised form
21 October 2009
Accepted 15 March 2010Available online 16 October 2010
JEL classification:
G32
G34
L22
Keywords:
Corporate boards
Independent directors
Price informativeness
Monitoring
Takeovers
5X/$ - see front matter & 2010 Elsevier B.V.
016/j.jfineco.2010.10.007
thank an anonymous referee, Heitor Almeida
n, Itay Goldstein, Jeffrey Gordon, Wayne Mikk
participants at the Center for Economic R
ruction and Development, London School of E
, Universidade de Evora, Universidade Nova
niversity of Konstanz, University of Texas-A
ogy corporate finance and governance work
n), and the 2008 Hitotsubashi University co
from a grant of the Fundac- ~ao para a Ciencia
responding author at: Universidade Nova de
ail address: [email protected] (M.A. Fe
a b s t r a c t
We develop and test the hypothesis that stock price informativeness affects the
structure of corporate boards. We find a negative relation between price informative-
ness and board independence. This finding is robust to the inclusion of many firm-level
controls, including firm fixed effects, and to the choice of the measure of price
informativeness. Consistent with the hypothesis that price informativeness and board
monitoring are substitutes, this relation is particularly strong for firms more exposed to
both external and internal governance mechanisms and for firms in which firm-specific
knowledge is relatively unimportant. Our results suggest that firms with more
informative stock prices have less demanding board structures.
& 2010 Elsevier B.V. All rights reserved.
1. Introduction
The view that prices aggregate information that isdispersed among market participants dates back to Hayek(1945). The modern version of such an idea is found in the
All rights reserved.
, Dan Bernhardt, Art Durn
elson, Walter Novaes, Cha
esearch and Graduate Ed
conomics, Michigan State
de Lisboa, University of Ab
ustin, and University of W
shop, the 2008 European
nference on corporate go
e Tecnologia (FCT).
Lisboa, Faculdade de Econo
rreira).
works of Grossman and Stiglitz (1980) and Kyle (1985), inwhich the main role of stock markets is the productionand aggregation of information as a consequence oftrading between speculators and other types of (perhapsless informed) investors. The idea that this type of
ev, Antoine Faure-Grimaud, Carola Frydman, Jose-Miguel Gaspar, Laurent
ru Raheja, Raghu Rau, Pedro Santa-Clara, Antoinette Schoar, Laura Starks,
ucation-Economics Institute, Cass Business School, European Bank for
University, Tilburg University, Toulouse Business School, Universidad de
erdeen, University of Bristol, University of Illinois-Urbana, University of
arwick, and participants at the 2007 Lisbon-Massachusetts Institute of
Finance Association meeting, the 2008 Luso-Brazilian Finance meeting
vernance for helpful comments and suggestions. We acknowledge the
mia, 1099-032 Lisbon, Portugal.

D. Ferreira et al. / Journal of Financial Economics 99 (2011) 523–545524
information can also be useful for the provision ofincentives in firms and for the design of corporategovernance mechanisms is a more recent one. Holmstromand Tirole (1993) and Faure-Grimaud and Gromb (2004)examine the role of stock prices in disciplining managersand providing incentives to insiders. A set of relatedstudies exists on the role of stock prices in guiding corpo-rate investment decisions (Khanna, Slezak, and Bradley,1994; Dow and Gorton, 1997; and Dow, Goldstein, andGuembel, 2007).
We contribute to this literature by providing robustevidence of a negative relation between stock priceinformativeness and corporate board independence. Ourmain proxy for price informativeness is the probability ofinformed trading (PIN), which is developed in a series ofpapers beginning with Easley, Kiefer, and O’Hara (1996).The results are unchanged when we use alternativeproxies for the rate of information flow into stock prices,such as firm-specific stock return variation (Morck, Yeung,and Yu, 2000) and measures of illiquidity or price impactof order flow (Amihud, 2002). We also investigate therelation between price informativeness and additionalcharacteristics of the board of directors. We find that priceinformativeness is positively related to the number ofdirectors with low attendance at board meetings andnegatively related to the number of board meetings. Theseresults are compatible with board monitoring and priceinformativeness being substitutes.
We show that the negative correlation between priceinformativeness and board independence remains strongafter controlling for a long list of possible covariates. Thiscorrelation is not explained by firm size and complexity,performance, governance mechanisms, ownership struc-ture, and earnings informativeness, among others. In fact,the results are unchanged after the inclusion of firm fixedeffects, suggesting that time-invariant unobserved firmcharacteristics cannot explain our empirical findings. Thiseffect is at least as strong as the ones between boardindependence and other firm-level variables that havebeen shown in the literature on corporate boards (Boone,Field, Karpoff, and Raheja, 2007; Coles, Daniel, andNaveen, 2008; and Linck, Netter, and Yang, 2008).Regarding the direction of causality, we use instrumentalvariables methods to estimate the effect of price informa-tiveness on board independence. As instruments, we usevariables that are known to be correlated with priceinformativeness, such as share turnover, analyst coverage,and Standard & Poor’s 500 membership, but have neverbeen used as explanatory variables of board independencein previous studies. Our evidence suggests that priceinformativeness affects board structure.
We develop a simple adverse selection model thatrationalizes the relation between board independence andprice informativeness. The goal of the model is to clarifythe role of price informativeness in the choice of boardstructures. We argue that the information revealed bystock prices should affect how directors monitor man-agers. We identify two mechanisms by which prices canaffect monitoring. On the one hand, the informationrevealed by stock prices allows external monitoringmechanisms to operate more efficiently. For example, if
prices fall due to the announcement of value-decreasinginvestments, the firm becomes a cheaper takeover target.Managers who value control would avoid undertakingsuch value-destroying projects. Thus, stock markets playan important monitoring role. On the other hand, moreinformative prices bring new information to both marketsand boards. Directors could use the information revealedby stock prices as an input to their monitoring task.Arguably, a better informed board of directors should be abetter monitor.
Our model predicts that price informativeness mattersfor board monitoring, but that the sign of this relation isambiguous. Changing board structure in the directionpreferred by shareholders could be difficult (i.e., costly),especially when ownership is dispersed, in which casecoordination costs arise. More informative prices makeboards more effective but also reduce the need for boardindependence. Thus, whether price informativeness andboard independence are substitutes or complements is inthe end an empirical question.
A parallel segment of the literature focuses on moralhazard models (e.g., Adams and Ferreira, 2007) that leadmore naturally to the question of substitutability betweenboard independence and managerial incentives throughequity-based compensation (e.g., Coles, Lemmon, andWang, 2008). Our focus on adverse selection issues (asin Hermalin and Weisbach, 1998) is a natural choice forunderstanding the role of stock prices in determiningboard structure. We see the two approaches as comple-mentary. In a simple extension to the model, we introducemoral hazard to study the relation between compensationincentives, board monitoring, and price informativeness.
Our model also has unambiguous predictions that weexplore in our empirical analysis. We find that thenegative relation between price informativeness andboard independence is particularly strong for firms moreexposed to both external and internal governancemechanisms. The substitution effect between price infor-mativeness and board independence is stronger for firmsmore exposed to the market for corporate control (i.e.,firms with few takeover defenses). The substitution effectis stronger for firms with a high concentration ofinstitutional ownership and with a high chief executiveofficer (CEO) pay-performance sensitivity. Intuitively,when prices become more informative, incentive con-tracts solve moral hazard problems more often, makingboard monitoring less important. We also find that thesubstitution effect is stronger for firms in which firm-specific knowledge is relatively unimportant.
Few empirical studies have been conducted on theinteraction between different governance mechanisms.Mikkelson and Partch (1997) find evidence consistentwith the effectiveness of board oversight being enhancedby an active takeover market. More recent examplesinclude Cremers and Nair (2005), who find a complemen-tarity effect between openness to the market for corporatecontrol and the presence of institutional investors, andGillan, Hartzell, and Starks (2006), who find that anindependent board can act as a substitute for the marketfor corporate control. Coles, Lemmon, and Wang (2008)provide evidence of a substitution effect between board

D. Ferreira et al. / Journal of Financial Economics 99 (2011) 523–545 525
independence and pay-performance sensitivity. Our paperadds to this growing literature by showing that stock priceinformativeness also affects organization design, in parti-cular, board structure.
Our results are consistent with the notion that theoptimal board structure depends on the characteristics ofthe firm; that is, ‘‘one size’’ does not fit all firms. Theevidence is consistent with board structure being affectedby the degree of complexity of firms’ operations and thetrade-off between the costs and benefits of advising andmonitoring management (Boone, Field, Karpoff, andRaheja, 2007; Coles, Daniel, and Naveen, 2008; and Linck,Netter, and Yang, 2008).
Our paper is related to the literature on how corporategovernance mechanisms affect the public release ofinformation. Warfield, Wild, and Wild (1995) find thatmanagerial ownership improves earnings informative-ness. Klein (2002) and Petra (2007) find that moreindependent boards improve earnings quality and infor-mativeness, while Vafeas (2000) find no such a relation.Leuz, Triantis, and Wang (2008) (see also Coles, 2008) findthat board independence reduces the likelihood of a firmgoing private after enactment of the 2002 Sarbanes-OxleyAct. Our paper differs from this strand of the literature bystudying the interaction between two corporate govern-ance mechanisms (board and market monitoring), insteadof the effects of governance on disclosure and earningsinformativeness. While earnings informativeness mea-sures the accuracy of accounting information provided toinvestors, price informativeness measures for the inten-sity of stock market monitoring.
On the theoretical side, our model integrates twoindependent lines of research. The first one explains boardstructure as the result of optimal shareholder choicesunder incomplete contracts (Hermalin and Weisbach,1998; Raheja, 2005; and Adams and Ferreira, 2007).The second one examines the role of stock prices indisciplining managers and providing incentives to insiders(Holmstrom and Tirole, 1993; Faure-Grimaud and Gromb,2004; Almazan, Banerji, and Motta, 2008; and Edmans,2009). To the best of our knowledge, these two strands ofthe literature have never been integrated.
The remainder of the paper is organized as follows. InSection 2 we present a simple model to motivate therelation between stock price informativeness and boardindependence. Section 3 describes the sample and thedata. Section 4 presents our core evidence on the relationbetween board independence and stock price informa-tiveness. In Section 5 we further investigate some of theadditional implications of the model, and in Section 6 weperform robustness checks. Section 7 concludes.
1 For a model that endogenizes the cost of board independence, see
Adams and Ferreira (2007).
2. The model
Using a simple model, we show that a link can existbetween the board’s monitoring role and the informationrevealed by stock prices. On the one hand, moreinformative prices can reinforce the internal monitoringactivity performed by the board of directors. On the otherhand, higher price informativeness can enhance the
effectiveness of external monitoring mechanisms, suchas disciplining takeovers. Hence, board independence andprice informativeness can interact as either complementsor substitutes. We examine this trade-off and discuss theempirical predictions that are tested later in the paper.
In what follows, we take the degree of price informa-tiveness as exogenously given and focus on the optimalchoice of board monitoring. We keep the model as simpleas possible by focusing only on what is essential for theempirical analysis.
2.1. Setup
We model the need for monitoring the CEO in a simpleadverse selection setting. In this setup, board monitoringamounts to replacing a low-quality CEO. In Section 2.6, weextend the model to introduce CEO’s effort and incentivecontracts.
There are three dates (0, 1, and 2) and four types ofparticipants: shareholders, a board of directors, a CEO, andthe stock market. Shareholders are risk–neutral agentswho care about the market value of the firm, appointdirectors to the board, and delegate firm management tothe CEO. The sequence of events is as follows.
At date 0, the shareholders choose the composition ofthe board of directors (i.e., its level of independence i) andhire a CEO whose type is not known by anyone. The valueof the firm is equal to t, the talent of its CEO. CEOs can beof two types t 2 fL¼ 0,H¼ 1g. For simplicity, we assumethat both types are equally likely in the population. Theunconditional expected value of the firm when a new CEOis appointed is then 1
2.The board of directors is characterized by its level of
independence i 2 ½0,1�. This level i corresponds to theprobability that the board monitors and replaces a CEOwho is revealed to be of type L at date 1. The choice ofboard independence is nontrivial because a more inde-pendent board is costlier but also generates moremonitoring of the CEO. We assume that board indepen-dence has an ex ante cost ki2=2 to shareholders. This costcan arise due to the fact that dispersed shareholders findit difficult to influence board composition.1
At date 1, the board can learn about the CEO’s typefrom two sources: stock prices or its own assessment.With probability p (which we interpret as the degree ofprice informativeness), stock prices reveal the CEO’s typeto everyone. If the CEO is of type L, the board replaces theCEO with probability i. If the board does not replace theCEO when his type is L, an external raider takes overthe firm and replaces its CEO with probability t 2 ½0,1�,which we interpret as a measure of takeover threat.
With probability (1�p), stock prices do not reveal theCEO’s type, but the board can unilaterally learn it withprobability b. If the board learns that the CEO is of type L,the board replaces the CEO with probability i.
In case the CEO is replaced at date 1 by either theboard or an outside raider, his successor is randomly

D. Ferreira et al. / Journal of Financial Economics 99 (2011) 523–545526
drawn from the population. Thus, conditional on the marketor the board being informed and willing to replace the CEO,or both, the firm’s expected value is 3
4. If the CEO’s type is notrevealed, or if the type is revealed to be H, the CEO is notreplaced (i.e., neither the market nor the board is interestedin monitoring and replacing the incumbent CEO).2
At date 2, the value of the firm, which depends on thetype of the CEO in charge, is revealed to everyone.
2.2. Board independence and price informativeness
The shareholders’ problem at date 0 is to maximize theexpected value of the firm by choosing the level ofmonitoring of the board of directors according to
maxi2½0,1�
EV ¼ p ðiþt�itÞ34þð1�i�tþ itÞ1
2
� �
þð1�pÞ bi3
4þbð1�iÞ
1
2þð1�bÞ
1
2
� ��k
i2
2: ð1Þ
Assuming an interior solution, the optimal boardstructure is given by
i� ¼1
4k½pð1�tÞþð1�pÞb�: ð2Þ
Proposition 1. The optimal degree of board independence
varies with the degree of price informativeness according to
@i�
@p¼
1�t�b4k
: ð3Þ
The sign of the relation between board independenceand price informativeness is ambiguous, depending on thevalues of the parameters. This result is explained by theinteraction of two effects. The marginal benefit of i
conditional on the market being informed is ð1�tÞ=4,and the marginal benefit of i conditional on the marketnot being informed is b=4. Changes in p shift the weightson these two terms. If 1�t4b, the marginal value ofboard independence is higher when the market isinformed. An increase in p shifts more weight to thecase of the market being informed, increasing theequilibrium level of board monitoring. In this case, priceinformativeness and board monitoring are complements.If 1�tob, the marginal value of board independence ishigher when there is no market information. Thus, anincrease in p makes board independence marginally lessvaluable, reducing the equilibrium level of board mon-itoring. In this case, board independence and priceinformativeness are substitutes.3
Price informativeness and board monitoring can becomplements because price informativeness is a nonrivalgood that can be used by both insiders and outsiders.4
2 The model could easily accommodate a positive probability of a
raider acquiring information and placing a takeover bid, even if prices
are uninformative.3 Note that @2EV=@i@p¼ ð1�t�bÞ=4 and also that @2EV=@i2 ¼�k.
Thus, @i�=@p¼�ð@2EV=@i@pÞ=ð@2EV=@i2Þ ¼ ð1�t�bÞ=4k, which is Proposi-
tion 1.4 Gordon (2007) proposes the hypothesis that board independence
and stock price informativeness are complements. He claims that the
monitoring advantages of independent directors are more clear in an
Price informativeness and board monitoring can besubstitutes because both internal and external monitoringmechanisms perform the same task of disciplining theCEO. Intuitively, the substitution effect is likely todominate when the probability of takeovers is high andthe board’s knowledge of firm-specific information ishigh. Ultimately, finding out which effect dominates is anempirical question.
2.3. Takeover threats
More external monitoring makes the substitution effectbetween price informativeness and board independencestronger. If a disciplining takeover is more likely when themarket is informed, there is less need for boards to monitor.Hence, we expect the level of board independence of thosefirms that are more exposed to the market for corporatecontrol to exhibit higher sensitivity to stock price informa-tiveness. In sum, the substitution effect is unambiguouslystronger when takeover threats are more likely.
Proposition 2. The higher is the likelihood of a takeover, the
stronger (weaker) is the substitution (complementarity)effect of price informativeness on the choice of board
independence:
@2i�
@p@t¼�
1
4k: ð4Þ
This prediction can be tested by using takeover defensesas an inverse proxy for the likelihood of takeovers.
2.4. Institutional investors
Evidence shows that institutional investors also per-form an active role in corporate governance (e.g., Gillanand Starks, 2007). We interpret parameter k as a measureof how costly internal monitoring is (i.e., the costs toshareholders of changing the board structure). If there issignificant institutional ownership concentration, k islikely to be low (Shleifer and Vishny, 1986).
Proposition 3. The relation between board independence
and price informativeness is stronger when the marginal cost
of internal monitoring is smaller:
@2i�
@p@k¼�
1
k
@i�
@p: ð5Þ
The relation (in absolute values) between board inde-pendence and price informativeness is less pronouncedwhen the marginal cost of external monitoring k is higher(i.e., when @i�=@p40, then @2i�=@p@ko0, reducing thecomplementarity effect; and when @i�=@po0, then @2i�=
@p@k40, reducing the substitution effect). These resultssuggest that price informativeness significantly affects boardindependence only when the board can effectively act as aninternal monitoring mechanism (low monitoring cost k).
(footnote continued)
environment with increasing stock price informativeness as insiders lose
their information advantage about the firm’s prospects.

(footnote continued)
Therefore, in equilibrium the CEO always chooses eFB when the board
monitors and the board never fires the CEO for low effort.6 Holmstrom and Milgrom (1987) rationalize the use of linear
D. Ferreira et al. / Journal of Financial Economics 99 (2011) 523–545 527
Empirically, we use the concentration of institutionalinvestors as a (inverse) proxy for k.
2.5. Firm-specific knowledge
The parameter b reflects the board’s ability to gatherfirm-specific information. The model predicts that theeffect of b on the relation between board independenceand price informativeness is as follows.
Proposition 4. The higher is the probability that the board
learns firm-specific information, the stronger (weaker) is the
substitution (complementarity) effect of price informative-
ness on the choice of board independence:
@2i�
@p@b¼�
1
4k: ð6Þ
The board should find it harder to acquire firm-specificinformation in more innovative firms than in firms thatundertake simple and well-known projects. According tothis interpretation, innovative firms would have low b. Thisresult suggests that the (absolute value of the) effect of priceinformativeness on board independence is stronger in lessinnovative firms when there is a substitution effect, butweaker when there is a complementarity effect. Empirically,we use research and development expenditures as a(inverse) proxy for b.
2.6. An extension: effort and incentive compensation
To analyze the impact of CEO compensation contractson the relation between price informativeness and boardmonitoring, we now add moral hazard elements to themodel. Specifically, we assume that the market value ofthe firm (gross of CEO compensation) is given by
v¼ tþeþe, ð7Þ
where t 2 f0,1g is the CEO’s talent as before, e 2 ½0,1Þ isthe effort exerted by the CEO, and e�Nð0,s2Þ is luck.Effort choices are made after date 1 and before firm valueis publicly revealed at date 2.
We continue to assume that prices are fully informa-tive about firm fundamentals with probability p and thatprices are not informative with probability 1�p. In thissetup, informative prices allow one to break down v intoits components (i.e., talent t and effort e are perfectlyobservable). If prices are not informative, only v can beobserved. In this case, we also assume that s2 ¼1 toguarantee that no information can be inferred from prices.
As in the case of pure adverse selection, informedmonitoring by either the board or the market candiscipline managers by firing those with low talent andthose who exert low levels of effort. If prices areinformative, both the board and the market observe effortchoice e and fire the CEO with combined probabilityiþt�it if the first-best level of effort eFB is not chosen.5 In
5 Because effort is observable when prices are informative or when
the board is informed, the board only needs to threaten to fire a CEO in
case he does not choose eFB. We assume that this threat is credible.
case there is no monitoring (which happens with prob-ability 1�i�tþ it), the firm can offer a compensationcontract to the CEO that is contingent on his type and onfirm value w(v,t). Compensation contracts can induce CEOeffort and substitute for direct monitoring when boardsare unwilling to monitor or when the takeover market isineffective.
Even if prices are not informative, the board can beinformed (with probability b) and fire the CEO if the first-best level of effort eFB is not chosen (with probability i).However, if the board is uninformed or if it is informedbut does not monitor, contracts contingent on v cannotinduce CEO effort because of the assumption that s2 ¼1.
We assume that the compensation contract is linear inv�t:
w¼ aþdðv�tÞ: ð8Þ
Because compensation contracts are written only whenprices are informative, the firm offers different contractsto CEOs of different types t.6
We assume that the CEO has a (Bernoulli) utilityfunction (defined over wealth and effort) with constantabsolute risk-aversion coefficient of one:
uðw,eÞ ¼�exp � w�e2
2
� �� �: ð9Þ
When prices are informative but there is no monitor-ing, the firm chooses an optimal compensation contract(that is, a fixed transfer a and a bonus d) for the CEO.Formally, the problem is to
maxa,d
e��a�de�, ð10Þ
subject to the incentive compatibility (IC) constraint
e� ¼ argmaxe
E �exp � aþdðeþeÞ� e2
2
� �� �� �ð11Þ
and to the individual rationality (IR) constraint
E �exp � aþdðeþeÞ� e2
2
� �� �� �ZU0, ð12Þ
where U0 is the CEO’s expected outside utility (we assumethat U0=�1 for simplicity).
In the standard linear contracts setup, we can rewritethe IC constraint in certainty equivalent form
e� ¼ argmaxe
aþde�e2
2�d2s2
2
!: ð13Þ
Because the objective function is strictly concave, theCEO’s chosen level of effort is given by the first-ordercondition, which implies e� ¼ d.
contracts in environments similar to this one, in a continuous-time
dynamic moral hazard setup. However, in a static world these linear
contracts are usually not optimal (e.g., Bolton and Dewatripont, 2005). In
line with many other applications, we use the linear contracts setup only
for tractability and simplicity.

D. Ferreira et al. / Journal of Financial Economics 99 (2011) 523–545528
We can also rewrite the IR constraint in certainty-equivalent form. Because the fixed transfer a does notenter the IC constraint, the IR constraint must be binding,implying that
a¼�deþe2
2þd2s2
2: ð14Þ
After replacing e* and a in the firm’s maximizationproblem, the optimal compensation contract is given by
a� ¼ s2�1
2ð1þs2Þ2
ð15Þ
and
d� ¼1
1þs2: ð16Þ
The expected value of the firm (net of the effect oftalent t and of compensation) when an incentive contractis used is given by
ð1�d�Þe��a� ¼ 1
2ð1þs2Þ¼
d�
2: ð17Þ
When either the board or the market is informed andmonitors the CEO, the first best level of effort eFB=1 isimplemented and the CEO receives a flat wage of wFB ¼ 1
2
(he is fired and earns his outside utility if he chooses anydifferent effort level). Thus, the value of the firm (net ofthe effect of talent) when the market or the boardmonitors the CEO is 1
2.The introduction of moral hazard changes slightly the
shareholders’ problem at date 0. Shareholders now choosethe level of monitoring of the board of directors accordingto
maxi2½0,1�
p ðiþt�itÞ54þð1�i�tþ itÞ 1þd�
2
� �� �
þð1�pÞ bi5
4þbð1�iÞ
1
2þð1�bÞ
1
2
� ��k
i2
2: ð18Þ
The optimal board independence is now given by
i� ¼1
4k½pð1�tÞð3�2d�Þþ3ð1�pÞb�, ð19Þ
which is virtually identical to Eq. (2) except for the addedbenefit of board monitoring on inducing effort and for theimpact of the pay-performance sensitivity parameter d�
on board independence.As before, the impact of price informativeness on board
independence is ambiguous:
@i�
@p¼
1
4k½3ð1�t�bÞ�2d�ð1�tÞ�: ð20Þ
In our model, d� changes only due to changes inexogenous risk s2. Increases in s2 always reduce pay-performance sensitivity d�, which reflects the trade-offbetween risk and incentives. Consistent with this hypoth-esis, Aggarwal and Samwick (1999) find a negativecorrelation between proxies for risk and equity-basedincentives. However, Prendergast (2002) surveys theempirical literature on this topic and finds no systematicevidence of a trade-off between incentives and risk. Forexample, Core and Guay (1999) find that more risk leadsto more incentives.
Through its effect on d�, exogenous risk affects boardindependence i*. Empirically, it is more convenient to testhypotheses concerning the effect of d� on i*. Because bothi* and d� are endogenously chosen, implicitly we areassuming that changes in exogenous risk are driving thechanges in pay-performance sensitivity, which then havean impact on board independence. Proposition 5addresses the effect of pay-performance sensitivity onboard independence.
Proposition 5. The optimal degree of board independence
varies with pay-performance sensitivity according to
@i�
@d�¼�
pð1�tÞ2k
: ð21Þ
Board independence and incentive compensation aresubstitutes. This is not a novel implication of our model. Ithas been shown in a number of papers (Denis and Sarin,1999; Shivdasani and Yermack, 1999; Coles, Daniel, andNaveen, 2008; and Coles, Lemmon, and Wang, 2008). Thenovel result that our model delivers is given by Proposi-tion 6.
Proposition 6. The higher is pay-performance sensitivity,the stronger (weaker) is the substitution (complementarity)effect of price informativeness on the choice of board
independence:
@2i�
@p@d�¼�
1�t2k
o0: ð22Þ
Intuitively, when prices become more informative,incentive contracts solve moral hazard problems moreoften, making board monitoring less important. Anotherway to understand the intuition behind this result is toconsider a situation in which moral hazard exists but thefirm is constrained to use flat compensation contracts (i.e.,d¼ 0). In such a case, firms cannot pay for performance,and a change in price informativeness leads to a loweradjustment in board independence compared with a casein which both governance mechanisms (board indepen-dence and incentive contracts) are available. Formally,
@i�
@p
����d ¼ 0
�@i�
@p
����d ¼ d�
¼2d�ð1�tÞ
4k40: ð23Þ
This expression indicates that there is a more pronouncedsubstitution effect between i and p when firms areallowed to choose pay-performance sensitivity doptimally.
3. Sample and variables
In this section, we describe the measures of boardstructure and price informativeness, the sample, and thecontrol variables used in this study.
3.1. Measures and determinants of board structure
Our main dependent variable is the fraction ofindependent directors, which is a proxy for the monitor-ing intensity of the board. For a director to qualify asindependent, he must not be an employee, a former

8 We also include other important takeover defenses in the
regressions (results not tabulated): blank check preferred, fair price
provision, limitation of shareholders’ ability to call a special meeting,
limit to shareholders’ action by written consent, and unequal voting
rights. None of these takeover defenses displays statistically significant
effects on board independence.9 Some of the literature discusses whether some types of institu-
tions specialize in monitoring and activism instead of trading. Research
by Chen, Harford, and Li (2007) shows that ‘‘independent’’ institutions
(mutual fund managers and investment advisers) are effective monitors,
while ‘‘grey’’ institutions (bank trusts, insurance companies, and other
D. Ferreira et al. / Journal of Financial Economics 99 (2011) 523–545 529
executive, or a relative of a current corporate executive ofthe company. In addition, the director must not have anybusiness relations with the company.
In Section 6.3, we also consider other board structurevariables. As alternative proxies for the monitoringactivity performed by the board of directors, we use theannual number of regular board meetings and the fractionof directors with low attendance.7
To identify the effect of price informativeness on thestructure of corporate boards, we need to control for otherpossible determinants of board structure. The literatureprovides many suggestions in this regard (Boone, Field,Karpoff, and Raheja, 2007; Coles, Daniel, and Naveen,2008; and Linck, Netter, and Yang, 2008). Our goal in thispaper is not to replicate these works, but rather to makesure that our results are not driven by the omission ofvariables that have been found to correlate with boardstructure. The determinants of board structure can beclassified into three broadly defined hypotheses: thescope of operations hypothesis, the monitoring hypoth-esis, and the negotiation hypothesis.
The scope of operations hypothesis suggests that thesize and complexity of a firm’s operations affect its boardstructure (Fama and Jensen, 1983). As a firm grows anddiversifies, it faces an increasing demand for specializedboard members who can perform tasks such as auditingand setting managerial compensation. Under this hypoth-esis, more complex firms face larger agency costs and thusrequire additional board monitoring.
We consider three proxies to capture firms’ operationalcomplexity: firm size (as measured by equity marketcapitalization), firm age (the number of years since thefirm’s stock is exchange-listed), and the number ofbusiness segments. We expect larger, older, and morediversified firms to have a higher fraction of independentdirectors. We also add leverage to this list, because Coles,Daniel, and Naveen (2008) argue that more leveragedfirms are more dependent on external resources and thusleverage can be considered as a proxy for firm complexityand the CEO’s need for advice.
The monitoring hypothesis is the set of formal andinformal theories emphasizing the importance of a firm’sbusiness environment for the optimal design of its boardstructure (e.g., Demsetz and Lehn, 1985; Raheja, 2005;and Adams and Ferreira, 2007). We use several variablesto capture some of the elements of these theories. Tocontrol for the costs of outside monitoring, we use growthopportunities as proxied by the market-to-book ratio andR&D expenditures, stock price volatility as proxied by thevariance of stock returns, and CEO pay-performancesensitivity as proxied by stock and stock options owner-ship. We also consider free cash flow, profitability, andindustry concentration, because these variables arepossibly related to agency conflicts and other opportu-nities for the CEO to extract private benefits. Similarly, weinclude as controls several of the takeover defenses in a
7 We interpret low attendance to board meeting as indicating less
monitoring. For some firms, low attendance could be optimal because
less monitoring is needed.
firm’s charter. We control for staggered boards, poisonpills, cumulative voting, and supermajority provisions,which have been identified as the most important take-over impediments (Gillan, Hartzell, and Starks, 2006; andLarcker, Richardson, and Tuna, 2007).8
Finally, the negotiation hypothesis emphasizes the roleof the negotiation between the CEO and outside directorsas an important determinant of board composition(Hermalin and Weisbach, 1998). We include two mea-sures of CEO influence: CEO’s tenure and pay-performancesensitivity (PPS).
We introduce institutional ownership variables asadditional controls in our empirical specifications.Because the trading activity of large institutional investorscan have a direct effect on the rate of information flowinto stock prices, we expect institutional ownership tocorrelate with price informativeness. There is alsoevidence that institutional investors perform an activerole in corporate governance (Gillan and Starks, 2007).Institutional investors are expected to have more influ-ence when they are large shareholders, because they haveeasier access to board members and benefit fromeconomies of scale in monitoring activities (Carleton,Nelson, and Weisbach, 1998). Thus, we consider theconcentration of institutional ownership as measured bythe Herfindahl index as in Hartzell and Starks (2003). Wealso control for the total institutional ownership (definedas the percentage of shares outstanding held byinstitutions).9
3.2. Measures of price informativeness
Our primary measure of stock price informativeness isthe probability of informed trading (PIN) developed byEasley, Kiefer, and O’Hara (1996). This measure is basedon a structural market microstructure model, in whichtrades come from either noise traders or informed traders.The trading process is modeled in the following way. Atthe beginning of each day, there is a probability l thatsome traders acquire new (private) information about thefundamental value of the firm. Trading orders arrivethroughout the day according to three different Poissondistributions: Informed orders come in at the average ratem, uninformed buy orders come in at the rate eb, and unin-formed sell orders come in at the rate es. The probability
institutions) are not. Independent institutions tend to be ‘‘pressure-
resistant,’’ while grey institutions tend to be ‘‘pressure-sensitive’’ or
loyal to corporate management. For example, Brickley, Lease, and Smith
(1988) find that banks and insurance companies are more supportive of
antitakeover amendment proposals than other types of institutional
investors.
12 Cross-country patterns of firm-specific return variation also
correspond to likely patterns of price informativeness. Morck, Yeung,
and Yu (2000) and Jin and Myers (2006) find high firm-specific stock
return variation in developed markets, but low firm-specific return
variation in emerging markets.13 The daily returns for the small-minus-big (SMB) and high-minus-
low (HML) factors are drawn from French’s website: http://mba.tuck.
dartmouth.edu/pages/faculty/ken.french/data_library.html.14 Alternative estimates of firm-specific return variation are pro-
D. Ferreira et al. / Journal of Financial Economics 99 (2011) 523–545530
that the opening trade of the day is information-based isgiven by
PIN¼lm
lmþebþes: ð24Þ
Easley, Hvidkjaer, and O’Hara (2002) use intra-daytransaction data to estimate the above parameters andthus the probability of informed trading in a stock. PINshould be low for stocks with little fluctuation in theirdaily buy and sell orders, which are more likely to comefrom liquidity or noise trading. Likewise, PIN should behigh for stocks that display frequent large deviations fromtheir normal order flows.
Previous empirical work generally supports the use ofPIN as a valid measure of the probability of informedtrading and a proxy for stock price informativeness.Easley, Hvidkjaer, and O’Hara (2002) find that the risk ofprivate information trading is priced, i.e., stocks withhigher PIN have higher expected returns.10 Vega (2006)shows that stocks with higher PIN have smaller reactionsfollowing an earnings announcement, which is consistentwith the idea that their prices incorporate more privateinformation and track their fundamental values moreclosely. PIN also seems to be related to managerialdecisions. Chen, Goldstein, and Jiang (2007) find a positiverelation between PIN and the sensitivity of firm invest-ment to stock prices, which supports the hypothesis thatmanagers learn from the private information incorporatedinto stock prices. Ferreira and Laux (2007) find a positiverelation between strong corporate governance (few take-over defenses) and PIN, suggesting that strong share-holder protection induces private information collectionand trading by informed market participants.
Although we use PIN as our main proxy for the rate ofinformation flow into stock prices, we acknowledge thatthis measure is imperfect. PIN might capture someilliquidity effects that are not related to private informa-tion.11 Nevertheless, it is important to keep in mind thatthere is no reason to believe that measurement error inPIN can explain our findings. If anything, it makes itharder to detect any underlying relation between thelatent variables.
As an alternative to PIN, we also consider other priceinformativeness variables to corroborate our interpreta-tion of the results. We first consider firm-specific stockreturn variation. French and Roll (1986) and Roll (1988)show that a significant portion of stock return variation isnot explained by market movements. They suggest thatfirm-specific return variation measures the rate of privateinformation incorporation into prices via trading.Although both uninformed trading and trading on thebasis of public information can in principle explain firm-specific return variation, considerable empirical evidencesupports the use of firm-specific return variation as ameasure of the rate of information flow into stock prices.
10 See Mohanram and Rajgopal (2009) for a critique of this finding.11 A recent paper by Duarte and Young (2009) suggests that the
relation between PIN and expected returns is explained by the fact that
PIN is also a proxy for illiquidity that is not related to private
information.
High levels of firm-specific return variation are associatedwith more efficient capital allocation (Durnev, Morck, andYeung, 2004) and with more information about futureearnings embedded in stock prices (Durnev, Morck,Yeung, and Zarowin, 2003).12
We estimate annual firm-specific return variation byregressing stock returns on the three factors from theFama-French model. For each firm-year, firm-specificreturn variation is estimated by 1�R2 from the regression
rit ¼ aiþb1iRMtþb2iSMBtþb3iHMLtþeit , ð25Þ
using daily return data, where rit is the return of stock i inday t in excess of the risk-free rate, RMt is the value-weighted excess market return, SMBt is the small-minus-big size factor return, and HMLt is the high-minus-lowbook-to-market factor return.13 We conduct our testsusing a logistic transformation of 1�R2:
C¼ log1�R2
R2
� �: ð26Þ
The variable C measures firm-specific stock returnvariation relative to market-wide variation or lack ofsynchronicity with the market.14
Finally, as an alternative measure of price informa-tiveness, we use the illiquidity ratio of Amihud (2002).This measure is defined as the annual average of the dailyratio between a stock’s absolute return and its dollarvolume (multiplied by 106):
ILLIQ ¼1
Di
XDi
t ¼ 1
jritj
VOLDit, ð27Þ
where Di is the annual number of valid observation daysfor stock i and VOLDit is the dollar volume of stock i onday t. The illiquidity ratio gives the absolute (percentage)price change per dollar of daily trading volume andproxies for the price impact of order flow. The magnitudeof the price impact should be a positive function of theperceived amount of informed trading on a stock (Kyle,1985), although illiquidity also reflects the inventory costsassociated with trading a given order size.
3.3. Sample
We start with firms in the Investor ResponsibilityResearch Center (IRRC) database between 1990 and2001.15 The IRRC database contains detailed information
vided by a market model that assumes b2i ¼ b3i ¼ 0 in Eq. (25) and by a
two-factor (market and industry) model. We obtain similar findings
using these alternative estimates.15 Our sample ends in 2001 because PIN estimates are less reliable
when short sales represent a significant fraction of the trading volume.
In fact, PIN relies on trade classification algorithms that in some cases
fail to classify short sales correctly (Asquith, Oman, and Safaya, 2007).

D. Ferreira et al. / Journal of Financial Economics 99 (2011) 523–545 531
on governance and director characteristics for a largenumber of US firms. We obtain board data for these firmsfrom Compact Disclosure for the 1990–1995 period andfrom IRRC for the 1996–2001 period.16 We excludefinancial firms (standard industrial classification codes6000–6999). After these adjustments the number of firmsin the sample is 2,188. Next we merge the IRRC databasewith the probability of informed trading for each firm-year, based on data from Easley, Hvidkjaer, and O’Hara(2002).17 The final sample contains 1,443 firms and a totalof 9,447 firm-year observations.
We obtain financial and segment data from Compustatand stock returns and turnover data from Center forResearch in Security Prices. The governance index ofGompers, Ishii, and Metrick (2003) (GIM), individualtakeover defenses, and board attendance are from theIRRC database. We obtain data on institutional holdingsand the number of analysts covering each firm fromThomson CDA/Spectrum Institutional 13F Holdings andInstitutional Brokers’ Estimate System. Blockholder own-ership is based on data from Dlugosz, Fahlenbrach,Gompers, and Metrick (2006). Finally, we obtain addi-tional director characteristics such as CEO stock and stockoptions ownership, CEO tenure, and number of boardmeetings from ExecuComp. We compute a measure ofCEO pay-performance sensitivity that includes the effectsof stock ownership and existing and newly granted stockoptions. For stock ownership, we compute PPS as thenumber of shares held by the CEO divided by the numberof shares outstanding. For stock options, we compute PPSas the option delta from the Black-Scholes option-pricingmodel multiplied by the ratio of the number of sharesheld to shares outstanding. We winsorize all variables atthe bottom and top 1% level. Table A1 in the Appendixdefines in detail the variables used in this study and liststheir sources.
Table 1 presents descriptive statistics of our data. Themedian fraction of independent directors is 0.778 and themedian PIN is 0.154. These statistics (and others inTable 1) are comparable to those in other studies (e.g.,Easley, Hvidkjaer, and O’Hara, 2002; and Coles, Daniel,and Naveen, 2008).
4. Main evidence
Fig. 1 presents a visual summary of the relationbetween board independence and PIN. We first sort firmsinto quintile portfolios ranked by PIN. We then calculatethe average board independence within each portfolio.The main finding in this paper is clear from the figure: Theaverage board independence for the lowest PIN (low
16 We thank Tina Yang for helping us with the Compact Disclosure
board data. While IRRC provides detailed information on affiliation of
directors, Compact Disclosure identifies only whether the director is an
officer of the firm. Thus, board composition is described only in terms of
the percentage of executive directors (insiders or officers) and
nonexecutive directors on the board. In the robustness section, we
report results using only IRRC data.17 The estimates of PIN are obtained from Soeren Hvidkjaer’s
website: http://www.smith.umd.edu/faculty/hvidkjaer/data.htm.
market monitoring) portfolio (Q1) is greater than the onefor the highest PIN (high market monitoring) portfolio(Q5). The low-PIN portfolio displays board independenceof about 80%, and the corresponding figure for the high-PIN portfolio is about 70%. The 10 percentage pointdifference between the two extreme quintile portfolios(i.e., one director for an average board size of ten) isstatistically significant (t-statistic of 22.1). Moreover, allintermediate PIN portfolios display lower board indepen-dence than the low-PIN portfolio. The economic effect ofPIN on board independence is sizable if compared withthe analogous effects of other well-known determinantsof board structure.
Table 2 presents the outcome of several ordinary leastsquares (OLS) panel regressions, where the dependentvariable y is a logistic transformation (or the log oddsratio) of the fraction of independent directors z (i.e., y=ln(z/1�z)). We use a logistic transformation because thefraction of independent directors is bounded betweenzero and one. Our explanatory variable of interest is PIN.All regressions include industry (two-digit SIC) and yeardummy variables. All reported t-statistics are adjusted forheteroskedasticity and within-firm correlation usingclustered standard errors. In addition, the inclusion ofyear dummies accounts for some forms of cross-sectionaldependence.
Column 1 presents the coefficients of a regression ofthe fraction of independent directors on PIN. There isstrong evidence of a negative and statistically significantrelation. The PIN coefficient is �3.1376, with a t-statisticof �13.60.
Controlling for other firm characteristics does notchange this result qualitatively. Column 2 presentsestimates for a specification that does not include PPSand tenure as controls because these variables are notavailable for the 1990–1991 period. The PIN coefficient is�1.9860 with a t-statistic of �7.76. In Column 3 we addPPS and tenure as controls, but the PIN estimate andt-statistic are barely affected. Overall, we find that theprobability of informed trading displays a significantnegative relation with board independence.
With respect to the other explanatory variables, wefind that leverage, firm age, and the number of businesssegments are all positively and significantly related toboard independence. Firm size enters with a positive butinsignificant coefficient (at the 5% level) in the majority ofspecifications. These findings are consistent with thescope of the operations hypothesis that more complexfirms require more independent boards.
Consistent with the findings of Boone, Field, Karpoff,and Raheja (2007) and Coles, Daniel, and Naveen (2008),we find no statistically significant relations betweenboard independence and market-to-book ratio, R&Dexpenditures, return on assets, free cash flow, and stockreturn variance. In contrast, we find that the coefficientsof PPS and tenure are both negative and statisticallysignificant, which is consistent with the suggestion ofHermalin and Weisbach (1998) that board structure isinfluenced by the negotiations between CEOs and outsidedirectors. The evidence indicates that board independenceis negatively related to the degree of CEO influence.

Table 1Summary statistics.
This table reports the mean, median, standard deviation, minimum, maximum, and number of observations (N) for each variable. The sample consists
of observations on Investor Responsibility Research Center (IRRC) firms from 1990 to 2001. Financial industries are omitted (standard industrial
classification codes 6000–6999). Board data are taken from IRRC and Compact Disclosure. Governance data are taken from IRRC. Executive compensation
data are from ExecuComp. Accounting and segment data are from Compustat. Stock return and volume data are from the Center for Research in Security
Prices. Institutional holdings data are from Thomson CDA/Spectrum 13F Holdings. Analysts data are from the Institutional Brokers’ Estimate System. Refer
to Table A1 in the Appendix for variable definitions. All variables are winsorized at the bottom and top 1% level.
Mean Median Standard Minimum Maximum N
Variable deviation
Fraction of independent directors 0.753 0.778 0.135 0.100 0.955 9,447
Board size 9.819 10.000 2.798 3.000 17.000 9,447
Number of board meetings 7.282 7.000 2.689 3.000 16.000 6,233
Board attendance 0.025 0.000 0.054 0.000 0.250 4,922
Probability of informed trading (PIN) 0.162 0.154 0.056 0.068 0.357 9,447
Firm-specific return variation 0.738 0.756 0.101 0.424 0.917 11,755
Illiquidity 0.165 0.009 0.711 0.000 6.881 12,964
Firm size 3,819 1,079 7,989 14 51,179 9,236
Leverage 0.274 0.270 0.176 0.000 0.919 9,228
Firm age 32.026 39.917 15.758 1.167 50.917 9,447
Number of business segments 2.158 1.000 1.461 1.000 6.000 9,447
Market-to-book 2.861 2.063 2.979 0.528 23.957 9,236
R&D expenditures 0.019 0.000 0.038 0.000 0.368 8,774
Stock return variance 0.173 0.113 0.206 0.012 2.189 9,447
Free cash flow 0.076 0.079 0.090 �0.447 0.332 9,086
Return on assets 0.145 0.141 0.082 �0.352 0.409 9,241
CEO pay-performance sensitivity (PPS) 0.019 0.003 0.044 0.000 0.258 9,447
CEO tenure 4.257 1.000 6.318 0.000 27.000 9,447
Governance index (GIM) 9.433 10.000 2.746 3.000 5.000 8,404
Staggered board dummy 0.616 1.000 0.486 0.000 1.000 8,335
Poison pill dummy 0.587 1.000 0.492 0.000 1.000 8,335
Cumulative voting dummy 0.137 0.000 0.344 0.000 1.000 8,335
Supermajority dummy 0.188 0.000 0.390 0.000 1.000 8,335
Institutional ownership 0.472 0.524 0.260 0.000 0.914 9,447
Institutional Herfindahl 0.067 0.050 0.073 0.000 0.477 9,447
Blockholder ownership 0.192 0.162 0.184 0.000 0.663 5,235
Outside blockholder ownership 0.136 0.096 0.148 0.000 0.557 5,235
Stock return �0.074 �0.053 0.412 �1.754 1.251 9,447
Stock return (absolute) 0.303 0.220 0.289 0.000 1.754 9,447
Industry Herfindahl 0.128 0.097 0.120 0.026 1.000 9,447
Earnings quality 0.100 0.056 0.127 0.005 0.578 7,783
Earnings informativeness 0.658 0.722 0.267 0.029 0.997 7,594
NYSE dummy 0.881 1.000 0.323 0.000 1.000 9,295
Number of analysts 8.322 6.000 8.205 0.000 31.000 9,447
Share turnover 0.909 0.727 0.699 0.068 8.136 9,447
S&P 500 dummy 0.266 0.000 0.442 0.000 1.000 9,294
D. Ferreira et al. / Journal of Financial Economics 99 (2011) 523–545532
In particular, the negative and significant coefficient ofPPS is consistent with board independence and manage-rial ownership being substitutes, as in Denis and Sarin(1999), Shivdasani and Yermack (1999), Coles, Daniel, andNaveen (2008), and Coles, Lemmon, and Wang (2008).18
Our model also predicts a negative relation between PPSand board independence (see Proposition 5).
The effect of PIN on board independence is economic-ally significant if compared with the effects of otherimportant board structure determinants. Using the speci-fication in Column 3, a one standard deviation increase inPIN reduces board independence by roughly 2 percentagepoints (at the averages of the data). If we perform thesame experiment with the other variables that also entersignificantly in the regression, we obtain effects of 1.2
18 Others, however, have found a positive relation between insider
ownership and board independence (Ryan and Wiggins, 2004; and
Davila and Penalva, 2006).
percentage points for increasing leverage by one standarddeviation, 2.2 percentage points for increasing firm age,1.2 percentage points for increasing the number ofbusiness segments, and �1.6 percentage points forincreasing PPS.19
In Columns 4–5 we control for takeover defenses, totalinstitutional ownership, and institutional ownership con-centration. The staggered board, poison pill, and cumula-tive voting coefficients are positive and statisticallysignificant, which is consistent with the idea that boardindependence is higher in firms that are insulated fromthe market for corporate control (Gillan, Hartzell, andStarks, 2006). The institutional ownership variables arenot significantly related to board independence.
19 Coles, Lemmon, and Wang (2008) find quantitatively stronger
effects of PPS on board structure in a structural model estimation. Our
reduced-form approach is bound to be less efficient. We are able to
produce qualitatively similar results, but the magnitudes of the effects
are smaller.

Fig. 1. Board independence by probability of informed trading quintiles. This figure plots the mean fraction of independent directors by probability of
informed trading (PIN) quintiles. Refer to Table A1 in the Appendix for variable definitions. The sample consists of observations on Investor Responsibility
Research Center firms from 1990 to 2001. Financial industries are omitted (standard industrial classification codes 6000–6999).
Table 2Board independence and probability of informed trading.
Estimates of ordinary least squares panel regressions of the logistic transformed fraction of independent directors are shown. Refer to Table A1 in the
Appendix for variable definitions. The sample consists of observations on Investor Responsibility Research Center firms from 1990 to 2001. Financial
industries are omitted (standard industrial classification codes 6000–6999). Regressions include industry and year dummies. Robust t-statistics adjusted
for firm-level clustering are in parentheses.
Variable (1) (2) (3) (4) (5)
Probability of informed trading (PIN) �3.1376 �1.9860 �1.9204 �1.5890 �1.5830
(�13.60) (�7.76) (�7.02) (�5.32) (�5.34)
Firm size (log) 0.0259 0.0184 0.0288 0.0275
(1.79) (1.27) (1.91) (1.78)
Leverage 0.4392 0.3812 0.3450 0.3501
(4.33) (3.85) (3.26) (3.28)
Firm age (log) 0.1566 0.1519 0.1212 0.1256
(7.05) (6.96) (4.81) (4.98)
Number of business segments (log) 0.0997 0.1062 0.0883 0.0881
(4.14) (4.63) (3.79) (3.79)
Market-to-book (log) 0.0066 0.0146 0.0235 0.0244
(0.28) (0.60) (0.94) (0.98)
R&D expenditures 0.1626 �0.0524 �0.3821 �0.3568
(0.40) (�0.13) (�0.86) (�0.80)
Stock return variance �0.0723 �0.0381 �0.0089 �0.0115
(�1.27) (�0.64) (�0.14) (�0.18)
Free cash flow 0.3023 0.3765 0.2489 0.2431
(1.05) (1.33) (0.77) (0.75)
Return on assets �0.5283 �0.5432 �0.5269 �0.5384
(�1.56) (�1.65) (�1.47) (�1.49)
CEO pay-performance sensitivity (PPS) �1.9301 �1.4872 �1.4945
(�5.83) (�4.06) (�4.08)
CEO tenure �0.0048 �0.0065 �0.0066
(�1.86) (�2.50) (�2.56)
Staggered board dummy 0.0743 0.0776
(2.03) (2.12)
Poison pill dummy 0.1673 0.1629
(4.73) (4.57)
Cumulative voting dummy 0.1375 0.1398
(2.87) (2.93)
Supermajority dummy 0.0009 0.0008
(0.02) (0.02)
Institutional ownership 0.0893
(1.44)
Institutional Herfindahl 0.1222
(0.46)
R2 0.082 0.144 0.162 0.160 0.161
Number of observations 9,447 8,610 7,504 6,675 6,675
D. Ferreira et al. / Journal of Financial Economics 99 (2011) 523–545 533

D. Ferreira et al. / Journal of Financial Economics 99 (2011) 523–545534
In summary, we find that the probability of informedtrading displays a statistically and economically signifi-cant negative relation with board independence. Thisrelation is robust to the inclusion of many variables thatare likely to correlate with board independence.
5. Interpreting the relation between boardindependence and the probability of informed trading
In Section 4, we find evidence of a negative relationbetween board independence and the probability ofinformed trading. Our findings suggest that when moreinformation flows to the market (via trading on privateinformation), firms tend to choose less independentboards. The interpretation is that when stock prices aremore revealing, the stock market is a substitute for themonitoring role of corporate boards. In this section, wepresent additional results that strengthen this interpreta-tion by investigating whether the relation between priceinformativeness and board independence is heteroge-neous across groups of firms in the way predicted byour model.
Table 3Board independence and probability of informed trading: the role of take
performance sensitivity, and stock performance.
Estimates of ordinary least squares panel regressions of the logistic transform
value of one if a firm has a governance index (GIM) above the median. Poison
Institutional Herfindahl dummy takes the value of one if a firm has institutional
has research and development expenditures to assets ratio above the 80th per
officer pay-performance sensitivity above the median. Stock return (absolute) d
above the 80th percentile. Refer to Table A1 in the Appendix for variable defi
Research Center firms from 1990 to 2001. Financial industries are omitted (stan
control variables (coefficients not shown) used in Column 5 of Table 2 and
clustering are in parentheses.
Variable (1) (2)
Probability of informed trading (PIN) �1.7810 �2.0272 �
(�5.10) (�4.70) (
PIN�GIM dummy 0.8113
(2.09)
PIN�Poison pill dummy 0.8068
(2.39)
PIN� Institutional Herfindahl dummy �
(
PIN�R&D dummy
PIN�PPS dummy
PIN� Stock return (absolute) dummy
GIM dummy 0.0177
(0.21)
Poison pill dummy 0.0419
(0.80)
Institutional Herfindahl dummy
R&D dummy
PPS dummy
Stock return (absolute) dummy
R2 0.165 0.162
Number of observations 6,675 6,675
5.1. Takeover defenses
If a firm adopts a large number of takeover defenses, itmight become partially insulated from the market forcorporate control (Field and Karpoff, 2002; and Masulis,Wang, and Xie, 2007). In such cases, the takeover marketcannot play an effective disciplinary role. Our hypothesisis that the trade-off between board independence andprice informativeness is more relevant when there are fewtakeover defenses. This is implied by Proposition 2.
We use the governance index of Gompers, Ishii, andMetrick (2003) as a proxy for the number of takeoverdefenses a firm has in place. Column 1 of Table 3 presentsthe results of a regression that includes an interactionbetween PIN and a dummy variable that takes the value ofone if a firm has a GIM index above the median in oursample (10 takeover defenses) and zero otherwise. In thespecifications of Table 3 we use the same set of controlvariables as in Column 5 of Table 2 (coefficients notshown).
We find that the interaction variable (PIN�GIMdummy) coefficient is positive and significant, whilethe PIN coefficient remains negative and significant.
over defenses, institutional ownership, firm-specific knowledge, pay-
ed fraction of independent directors are shown. GIM dummy takes the
pill dummy takes the value of one if a firm has a poison pill provision.
ownership above the median. R&D dummy takes the value of one if a firm
centile. PPS dummy takes the value of one if a firm has chief executive
ummy takes the value of one if a firm has absolute abnormal stock return
nitions. The sample consists of observations on Investor Responsibility
dard industrial classification codes 6000–6999). Regressions include the
industry and year dummies. Robust t-statistics adjusted for firm-level
(3) (4) (5) (6) (7)
0.8873 �1.7323 �0.8364 �1.2740 �0.9626
�2.24) (�5.48) (�2.31) (�4.25) (�2.19)
0.7896
(2.37)
1.1500 �1.0200
�3.27) (�2.87)
0.9609 0.4144
(2.29) (1.09)
�0.9383 �0.8878
(�2.42) (�2.29)
�0.6907 �0.6461
(�2.09) (�1.97)
0.0633
(1.21)
0.2153 0.1784
(3.94) (3.24)
�0.1741 �0.1176
(�2.68) (�1.96)
0.0572 0.0534
(1.01) (0.94)
0.1190 0.0675
(1.86) (1.07)
0.163 0.161 0.156 0.164 0.169
6,675 6,675 6,675 6,675 6,675

D. Ferreira et al. / Journal of Financial Economics 99 (2011) 523–545 535
The interpretation is that the negative relation betweenboard independence and PIN is stronger for low GIMfirms. We use alternatively an interaction variablebetween PIN and a particularly important takeoverdefense: the poison pill. Brickley, Coles, and Terry(1994) show that takeover outcomes are affected bypoison pill provisions and outside directors. We find thatthe coefficient on this interaction variable is positive andsignificant, while the PIN coefficient remains negative andsignificant (see Column 2 of Table 3).
We conclude that the market for corporate control hasan important role to play in shaping the relation betweenboard independence and price informativeness. Priceinformativeness can substitute for independent directorsonly when the firm is open to the market for corporatecontrol. This finding is consistent with the evidenceprovided by Gillan, Hartzell, and Starks (2006), whoshow that if a disciplining takeover is more likely, thenthere is less need for board monitoring.
5.2. Institutional ownership concentration
If our theory is correct, shareholders should frequentlyintervene to change the board structure in response toexogenous changes in price informativeness.20 Our theoryis thus less plausible in dispersed ownership structures inwhich shareholders have no incentives to engage inactivism. Unlike individual investors, institutional inves-tors (especially if they hold large blocks of stock) couldhave a clear incentive to maximize firm value by changingboard structure whenever necessary. Our hypothesis isthat the trade-off between board independence and priceinformativeness is more relevant when there are largeshareholders or when there is a higher concentration ofinstitutional ownership. This is implied by Proposition 3.
Column 3 of Table 3 presents the results of a regressionthat includes an interaction between PIN and an institu-tional ownership concentration dummy that takes thevalue of one for firms whose institutional Herfindahlindex is above the median in our sample and zero other-wise. The interaction variable is negative and statisticallysignificant, i.e., PIN is more strongly negatively related toboard independence for those firms with a high concen-tration of institutional ownership.21
These results suggest that price informativeness is amore effective substitute for internal monitoring by theboard when large institutional shareholders supervise theboard themselves. Without a substantial concentration ofinstitutional ownership, perhaps the board plays only aminor role. In such cases, it would be natural to find aweaker relation between board independence and stockprice informativeness.
20 See Karpoff (2001) and Gillan and Starks (2007) for a summary of
the evidence on shareholder activism and governance structure. The
evidence suggests that active shareholders do affect governance
structures, although the effect of activism on firm performance is not
clear-cut.21 Results (not tabulated) show consistent findings if we use the
institutional Herfindahl index as an interaction term, instead of the high
institutional Herfindahl dummy.
5.3. Firm-specific knowledge
When firm-specific knowledge is important, a boardthat is too independent could fail to obtain crucialinformation. The idea is simply that CEOs and insidedirectors possess more firm-specific knowledge thanoutside directors. We thus expect that costs associatedwith the acquisition of firm-specific knowledge can affectthe relation between board structure and price informa-tiveness. Specifically, if stock markets can substitute forcorporate boards as monitors of management, we expectto find a stronger negative relation between boardindependence and price informativeness when firm-specific knowledge is less important. This hypothesis isformally derived in Proposition 4.
Measuring firm-specific knowledge is a difficult task.Following Coles, Daniel, and Naveen (2008), we use R&Dexpenditures as a proxy for the importance of firm-specific knowledge. If the kind of information that marketprices convey cannot substitute for the knowledge thatinsiders possess, the substitution effect should be weakerfor firms with high R&D.
Column 4 of Table 3 presents the results of a regressionthat includes an interaction between PIN and a dummyvariable that takes the value of one for firms whose ratioof R&D expenditures to assets is above the 80thpercentile.22 The evidence shows that the negativerelation between board independence and PIN is morepronounced in low R&D firms. This evidence is consistentwith the hypothesis that when firm-specific knowledge isless important, the private information revealed by stockprices can substitute for the monitoring role of corporateboards.
5.4. Pay-performance sensitivity
Executive compensation plans can help to align theinterests of managers with those of shareholders. Previousmodels on the monitoring role of stock prices (Holmstromand Tirole, 1993; and Coles, Lemmon, and Wang, 2008)have focused on executive compensation as the mainmechanism through which stock prices discipline man-agers. Thus, we expect to find a stronger relation betweenprice informativeness and board independence in firms inwhich pay-performance sensitivity of CEO compensationcontracts is high. This is implied by Proposition 6.
Column 5 of Table 3 presents the results of a regressionthat includes an interaction between PIN and a PPSdummy that takes the value of one for firms whose PPS isabove the median in our sample. We find a negative andstatistically significant interaction variable coefficient.The PIN coefficient remains negative and significant.These results suggest that price informativeness is amore effective substitute for internal monitoring by theboard when managerial incentives are closely tied toshareholder value.
22 The 80th percentile corresponds to the median for firms with
positive R&D expenditures as only 40% of the observations have positive
R&D. The findings are similar if we use the 75th percentile as the cutoff.

23 The idea that board structure does not change much over time
could be more a myth than reality. Cicero, Wintoki, and Yang (2008) find
that two-thirds of the firms in their sample change either board size or
independence during a two-year period. They also find that firms close
63% of the gap between their actual and target board independence over
a two-year period.
D. Ferreira et al. / Journal of Financial Economics 99 (2011) 523–545536
5.5. Extreme stock performance
We investigate whether corporate boards matter moreduring certain periods. Independent boards seem to beparticularly effective in performing specific tasks, such ashiring and firing the CEO (Weisbach, 1988; and Borokho-vich, Parrino, and Trapani, 1996), adopting takeoverdefenses (Brickley, Coles, and Terry, 1994), and negotiat-ing takeovers (Cotter, Shivdasani, and Zenner, 1997). Weproxy for these special circumstances using abnormalstock returns. Abnormal stock returns are calculated as afirm’s stock return minus the value-weighted marketreturn. The idea is that a firm’s stock price is likely todisplay sharp falls or rises during these events. Column 6of Table 3 presents the results of a regression thatincludes an interaction between PIN and an absoluteabnormal stock return dummy that takes the value of onefor firms whose absolute abnormal return is above the80th percentile. The coefficient on the interaction variableis negative and statistically significant, suggesting that thenegative relation between price informativeness andboard independence is more pronounced during periodsof extreme stock performance. Consistent with thehypothesis that board composition is more likely tochange during crises and other exceptional events, theabsolute abnormal stock return coefficient is positive butstatistically weak.
Finally, in Column 7 we include all interactions jointly.The results confirm the previous findings with theexception of the R&D interaction term that becomesinsignificant.
6. Robustness
In this section, we check the robustness of our mainresults. We first present several alternative estimationmethods, which address several concerns with ourestimates, such as omitted variables, reverse causality,and measurement errors. We then present results usingalternative measures of price informativeness and addi-tional board-related variables. In the final subsection, wepresent other robustness checks such as different samplesand additional control variables.
6.1. Endogeneity: omitted variables and reverse causality
Endogeneity problems are ubiquitous in empiricalresearch on corporate governance. In our setting, therecould be many reasons for board structure and priceinformativeness to be jointly determined.
We first address the potential endogeneity problemsusing firm fixed effects methods that control for unob-served sources of firm heterogeneity. Fixed effectsmethods solve joint determination problems in whichan unobserved time-invariant variable simultaneouslydetermines both PIN and board independence. It is alsoequivalent to looking only at within-firm changes in PIN.
Columns 1 and 2 of Table 4 present the firm fixedeffects estimates (with t-statistics adjusted for firm-levelclustering). There is still evidence of a negative relation
between board independence and PIN. In Column 2, theestimate of the PIN coefficient is �0.5755 with asignificant t-statistic of �2.88.
The fixed effects results go a long way towarddismissing omitted variables explanations as sources ofendogeneity. Because only the effects of within-firmchanges in board independence are taken into account,firm-specific omitted variables cannot explain theobserved relation between PIN and board independence.An issue here is whether there is enough variation in PINand board independence over time so that one canestimate this relation with precision. The short answeris yes. Although t-statistics are lower, suggesting a lowerprecision in the estimates, they are still high by traditionalstandards.23
Another approach to address endogeneity concerns isto use lagged PIN as an explanatory variable. Columns 3and 4 of Table 4 present the results of these estimations,confirming a negative relation between board indepen-dence and PIN.
We also use two-stage least squares (2SLS) address thepotential endogeneity of PIN. Two-stage least squaresmethods allow us to address omitted variables andreverse causality issues simultaneously. The caveat isthat, unlike the fixed effects method, it requires strongerassumptions that are usually not possible to test for.Under standard identification assumptions, we apply 2SLSmethods to isolate the effect of PIN on board indepen-dence. To this end, we need instruments for PIN: avariable that is correlated with PIN (this assumption canbe tested), but uncorrelated with board structure exceptindirectly through other independent variables. That is,the instrument should be a variable that can be excludedfrom the original list of control variables without affectingthe results. This last requirement cannot be tested bystatistical methods. It is, in the end, an act of faith.
We use analyst coverage, share turnover, and S&P500 membership as instruments. Easley, O’Hara, andPaperman (1998) suggest that analysts can turn privateinformation into public information and do not havesignificant firm-specific information. Analysts can attractadditional uninformed order flow to a stock, an effect thatwould also reduce PIN. Empirical evidence seems tosupport a negative relation between price informative-ness and analyst coverage (Piotroski and Roulstone, 2004;and Chan and Hameed, 2006). Share turnover is also likelyto be negatively related to PIN, again consistent with thenotion that stocks with greater trading activity tend tohave more uninformed order flow (Easley, Hvidkjaer, andO’Hara, 2002). We use as an additional instrument adummy variable that takes the value of one if a stock isincluded in the S&P 500 index as these firms tendto attract more investor attention (Denis, McConnell,Ovtchinnikov, and Yu, 2003). Thus, our instruments have

Table 4Board independence and probability of informed trading: firm fixed effects and lagged explanatory variable.
Estimates of panel regressions of the logistic transformed fraction of independent directors using alternative estimation methods are shown. Columns 1
and 2 present estimates of panel regressions with firm fixed effects. Columns 3 and 4 present estimates of regressions using lagged PIN as the explanatory
variable. Refer to Table A1 in the Appendix for variable definitions. The sample consists of observations on Investor Responsibility Research Center firms
from 1990 to 2001. Financial industries are omitted (standard industrial classification codes 6000–6999). Regressions include industry and year
dummies. Robust t-statistics adjusted for firm-level clustering are in parentheses.
Firm fixed effects Lag PIN
Variable (1) (2) (3) (4)
Probability of informed trading (PIN) �0.6940 �0.5755 �1.6905 �1.3996
(�3.90) (�2.88) (�6.47) (�4.93)
Firm size (log) 0.0738 0.0730 0.0297 0.0316
(3.29) (3.05) (2.08) (2.11)
Leverage 0.3394 0.2558 0.4344 0.3422
(3.42) (2.41) (4.18) (3.16)
Firm age (log) 0.4413 0.6588 0.1595 0.1222
(8.82) (7.47) (6.97) (4.79)
Number of business segments (log) 0.0150 0.0109 0.1024 0.0871
(0.84) (0.61) (4.27) (3.72)
Market-to-book (log) 0.0098 �0.0138 0.0080 0.0259
(0.48) (�0.67) (0.32) (1.04)
R&D expenditures �0.4203 �0.6375 0.0910 �0.4870
(�0.96) (�1.08) (0.22) (�1.07)
Stock return variance 0.2085 0.1563 �0.0746 �0.0142
(4.26) (2.70) (�1.23) (�0.22)
Free cash flow �0.1143 �0.2589 0.2094 0.1690
(�0.64) (�1.13) (0.69) (0.52)
Return on assets 0.0063 0.1342 �0.4355 �0.4848
(0.03) (0.48) (�1.23) (�1.33)
CEO pay-performance sensitivity (PPS) 0.6723 �1.4900
(2.19) (�4.04)
CEO tenure �0.0053 �0.0067
(�2.67) (�2.58)
Staggered board dummy �0.0550 0.0810
(�0.74) (2.20)
Poison pill dummy 0.0339 0.1635
(1.00) (4.54)
Cumulative voting dummy �0.0347 0.1426
(�0.39) (2.97)
Supermajority dummy �0.0700 �0.0026
(�1.03) (�0.06)
Institutional ownership 0.0442 0.0983
(0.61) (1.56)
Institutional Herfindahl 0.2783 0.0535
(1.91) (0.20)
R2 0.095 0.084 0.139 0.159
Number of observations 8,610 6,675 7,927 6,594
D. Ferreira et al. / Journal of Financial Economics 99 (2011) 523–545 537
been found to be significantly correlated with price infor-mativeness but have never been used as explanatoryvariables of board independence in previous studies. Wereport results using all three instruments jointly.24
Columns 1 and 2 of Table 5 present the results of thefirst stage regressions that use PIN as the dependentvariable. The results support the conclusion that analystcoverage and share turnover are negatively and signifi-cantly related to PIN, and the S&P 500 membershipdummy is positively related to PIN. F-tests that theinstruments can be excluded from the first-stage regres-sions are strongly rejected (F-statistics are 24.47 and 10.8
24 In untabulated results, we obtain similar results using analyst
coverage, share turnover, or S&P 500 dummy as instruments one at a
time. We also obtain consistent results using lagged PIN as an
instrument. See Aslan, Easley, Hvidkjaer, and O’Hara (2008) for a
discussion of alternative instruments for PIN.
in Columns 1 and 2). We conclude that our instrumentsare associated with PIN and that our specifications do notsuffer from weak instruments concerns.
Columns 3 and 4 of Table 5 present the coefficients ofthe second-stage regression that uses board independenceas the dependent variable. There is still evidence of anegative relation between board independence and PINafter taking into account the possibility that PIN isendogenous. The evidence suggests the existence of acausal link from price informativeness to board structure.To assess the quality of the instruments formally, we alsoperform a Hansen X2- test of instrument orthogonality.This statistic jointly tests the null hypotheses of correctmodel specification and orthogonality between theinstruments and the errors. Our instruments performadequately in our tests (p-value is 0.12 and 0.87 in thespecifications of Columns 3 and 4), indicating that wecannot reject the null hypothesis of instrument suitability.

Table 5Board independence and probability of informed trading: two-stage least squares and simultaneous equations.
Estimates of panel regressions of the logistic transformed fraction of independent directors using alternative estimation methods are shown. The two-
stage least squares (2SLS) panel regression uses analyst coverage, share turnover, and S&P 500 dummy as instruments for probability of informed trading
(PIN). Columns 1 and 2 present first-stage regression estimates with PIN as the dependent variable. Columns 3 and 4 present second stage regression
estimates with the logistic transformed fraction of independent directors as the dependent variable. Columns 5 and 6 present the estimates of a system of
simultaneous equations in which the dependent variables are the logistic transformed fraction of independent directors and PIN. Refer to Table A1 in the
Appendix for variable definitions. The sample consists of observations on Investor Responsibility Research Center firms from 1990 to 2001. Financial
industries are omitted (standard industrial classification codes 6000–6999). Regressions include industry and year dummies. Robust t-statistics adjusted
for firm-level clustering are in parentheses.
Two-stage least squares Three-stage least squares
First First Second Second Fraction of PIN
stage stage stage stage independent
directors
Variable (1) (2) (3) (4) (5) (6)
Probability of informed trading (PIN) �8.8139 �17.5817 �17.0020
(�4.54) (�2.18) (�2.20)
Fraction of independent directors �0.0051
(�1.65)
Firm size (log) �0.0232 �0.0212 �0.1375 �0.3100 �0.2966 �0.0208
(�51.59) (�42.28) (�2.95) (�1.83) (�1.82) (�44.87)
Leverage �0.0154 �0.0162 0.3395 0.0934 0.1115 �0.0137
(�5.18) (�5.07) (5.87) (0.63) (0.79) (�4.32)
Firm age (log) �0.0045 �0.0022 0.1303 0.0951 0.0907 �0.0018
(�6.84) (�2.72) (9.46) (3.93) (3.98) (�1.98)
Number of business segments (log) �0.0056 �0.0034 0.0645 0.0369 0.0359 �0.0031
(�7.68) (�4.44) (3.85) (1.18) (1.17) (�3.65)
Market-to-book (log) 0.0042 0.0046 0.0370 0.0998 0.0972 0.0047
(4.94) (5.17) (2.23) (2.31) (2.35) (5.66)
R&D expenditures 0.0191 0.0299 0.2163 0.0552 0.0313 0.0270
(1.48) (2.00) (0.95) (0.14) (0.08) (1.95)
Stock return variance �0.0277 �0.0302 �0.3181 �0.5516 �0.5250 �0.0299
(�8.94) (�8.86) (�3.88) (�1.98) (�1.96) (�10.23)
Free cash flow �0.0135 �0.0113 0.2832 0.1246 0.1589 �0.0081
(�1.65) (�1.21) (1.88) (0.57) (0.73) (�0.90)
Return on assets 0.0091 0.0055 �0.5447 �0.5000 �0.5479 �0.0001
(0.97) (0.53) (�3.08) (�2.02) (�2.32) (�0.01)
CEO pay-performance sensitivity (PPS) �0.0035 �1.5850 �1.3866
(�0.29) (�5.43) (�6.99)
CEO tenure �0.0003 �0.0107 �0.0055
(�3.64) (�3.92) (�2.34)
Staggered board dummy �0.0025 0.0388 0.0770
(�2.54) (1.24) (3.05)
Poison pill dummy �0.0032 0.1109 0.1533
(�3.13) (3.12) (4.96)
Cumulative voting dummy �0.0007 0.1272 0.1280
(�0.53) (3.96) (5.37)
Supermajority dummy 0.0006 0.0105 �0.0006
(0.50) (0.36) (�0.03)
Institutional ownership �0.0090 �0.0719 �0.0866 �0.0096
(�3.73) (�0.79) (�0.97) (�4.54)
Institutional Herfindahl 0.0660 1.2384 1.2865 0.0714
(6.55) (2.08) (2.27) (9.42)
Number of analysts �0.0013 �0.0042 0.0001
(�3.11) (�3.98) (0.15)
Share turnover �0.0059 �0.0023 �0.0021
(�7.04) (�2.51) (�2.69)
S&P 500 dummy 0.0034 0.0016 0.0017
(3.11) (1.37) (1.80)
R2 0.462 0.442
Number of observations 8,610 6,675 8,610 6,675 6,675 6,675
D. Ferreira et al. / Journal of Financial Economics 99 (2011) 523–545538
In a final approach to address endogeneity concerns,we estimate simultaneous equations of board indepen-dence and PIN using three-stage least squares (3SLS)regressions. We use internal governance variables such asPPS, CEO tenure, and takeover defenses as excludedvariables from the PIN equation. Columns 5 and 6 of
Table 5 report the 3SLS estimates. The PIN coefficient isnegative and significant at the 5% level in the boardindependence equation. The board independence coeffi-cient is negative in the PIN equation, but insignificant atthe 5% level. Thus, the simultaneous equations evidenceshows that PIN affects board structure, while there is

D. Ferreira et al. / Journal of Financial Economics 99 (2011) 523–545 539
weak evidence that board independence affects PIN. Theseresults should, however, be interpreted with caution,especially because no strong theoretical justificationsexist for the instruments for board independence.
Our conclusion here is twofold. Omitted variables areunlikely to explain the relation between PIN and boardindependence: On top of our long list of control variables,firm fixed effects take care of most time-invariantunobserved variables. We also find evidence consistentwith a causal effect from price informativeness to boardindependence, but only weak evidence in the oppositedirection.
6.2. Alternative measures of price informativeness
Is the empirical relation between board independenceand PIN driven by the rate of information flow into stock
Table 6Board independence and alternative measures of stock price informativeness.
Estimates of ordinary least squares panel regressions of alternative price in
transformed relative firm-specific return variation as the explanatory variable
impact measure of Amihud (2002) as the explanatory variable. Refer to Tab
observations on Investor Responsibility Research Center firms from 1990 to 2
codes 6000–6999). Regressions include industry and year dummies. Robust t-s
Variable (1)
Firm-specific return variation (logistic) �0.0877
(�4.88)
Illiquidity (log)
Firm size (log) 0.0748
(7.23)
Leverage 0.2839
(3.79)
Firm age (log) 0.1417
(8.64)
Number of business segments (log) 0.0996
(4.92)
Market-to-book (log) 0.0137
(0.85)
R&D expenditures 0.9549
(4.47)
Stock return variance
Free cash flow 0.4644
(2.09)
Return on assets �0.9283
(�3.80)
CEO pay-performance sensitivity (PPS)
CEO tenure
Staggered board dummy
Poison pill dummy
Cumulative voting dummy
Supermajority dummy
Institutional ownership
Institutional Herfindahl
R2 0.151
Number of observations 11,755
prices? In this subsection, we use two alternativemeasures of stock price informativeness. First, we usefirm-specific stock return variation, or nonsynchronicityof stock returns (Morck, Yeung, and Yu, 2000). Second, weuse the illiquidity ratio of Amihud (2002), which is aproxy for the price impact of order flow.
We estimate board independence regressions similarto those in Table 2. We report the results in Table 6.Columns 1 and 2 show results for the regressions usingthe logistic transformation of the annual firm-specificreturn variation (C) as the measure of price informative-ness. We find that the coefficients on C are negative andstatistically significant. Thus, board independence is lowerin firms whose stock returns are less synchronized withthe market.
Columns 3 and 4 in Table 6 present estimates usingthe annual illiquidity ratio (ILLIQ). ILLIQ is also negativelyrelated to board independence, which supports the
formativeness measures are shown. Columns 1 and 2 use the logistic
. Columns 3 and 4 use the logarithm of the illiquidity measure or price
le A1 in the Appendix for variable definitions. The sample consists of
001. Financial industries are omitted (standard industrial classification
tatistics adjusted for firm-level clustering are in parentheses.
(2) (3) (4)
�0.0597
(�3.01)
�0.0829 �0.0781
(�6.96) (�4.71)
0.0653 �0.0208 �0.0303
(5.58) (�1.07) (�1.32)
0.2217 0.3264 0.2619
(2.59) (4.46) (3.12)
0.1158 0.1500 0.1293
(5.58) (9.22) (6.21)
0.0645 0.1111 0.0815
(3.14) (5.42) (4.02)
0.0374 �0.0262 0.0110
(2.02) (�1.40) (0.52)
0.4927 0.6232 0.1074
(1.78) (2.85) (0.38)
�0.0266 �0.0285
(�0.83) (�0.70)
0.3398 0.6486 0.5587
(1.30) (2.94) (2.11)
�0.7424 �1.0350 �0.9125
(�2.64) (�4.17) (�3.18)
�1.3878 �1.4063
(�4.78) (�4.74)
�0.0058 �0.0067
(�2.72) (�3.09)
0.0958 0.0889
(3.06) (2.85)
0.1844 0.1757
(6.23) (5.90)
0.0888 0.0809
(2.18) (1.98)
�0.0213 �0.0194
(�0.53) (�0.48)
0.1015 0.0596
(1.92) (1.10)
0.0373 0.3003
(0.17) (1.34)
0.157 0.159 0.159
9,196 12,964 8,911
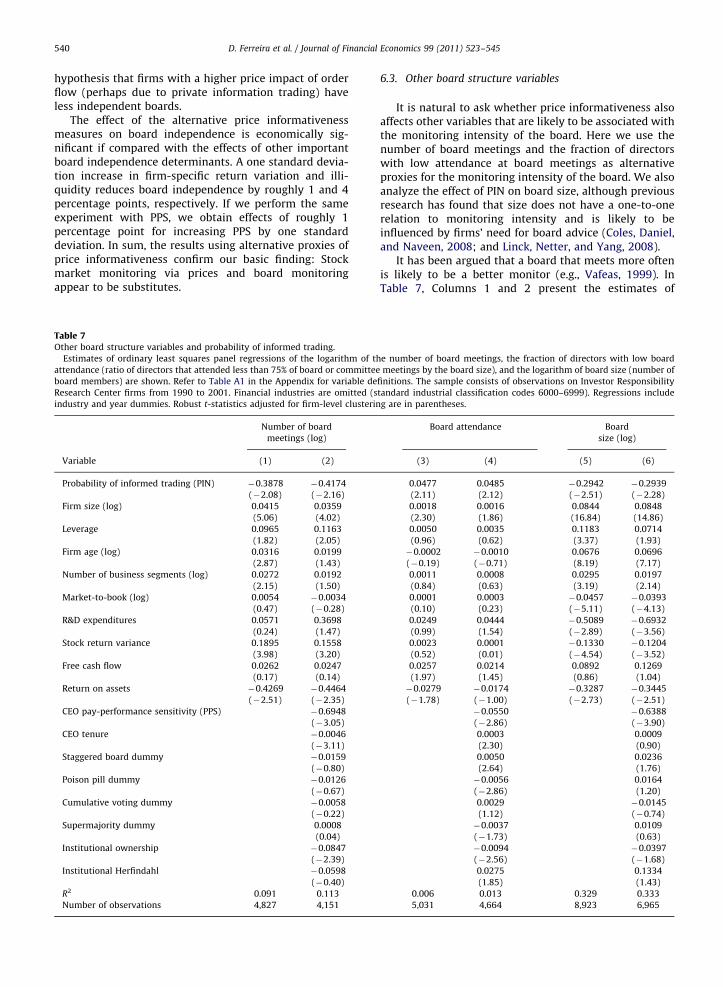
D. Ferreira et al. / Journal of Financial Economics 99 (2011) 523–545540
hypothesis that firms with a higher price impact of orderflow (perhaps due to private information trading) haveless independent boards.
The effect of the alternative price informativenessmeasures on board independence is economically sig-nificant if compared with the effects of other importantboard independence determinants. A one standard devia-tion increase in firm-specific return variation and illi-quidity reduces board independence by roughly 1 and 4percentage points, respectively. If we perform the sameexperiment with PPS, we obtain effects of roughly 1percentage point for increasing PPS by one standarddeviation. In sum, the results using alternative proxies ofprice informativeness confirm our basic finding: Stockmarket monitoring via prices and board monitoringappear to be substitutes.
Table 7Other board structure variables and probability of informed trading.
Estimates of ordinary least squares panel regressions of the logarithm of th
attendance (ratio of directors that attended less than 75% of board or committee
board members) are shown. Refer to Table A1 in the Appendix for variable de
Research Center firms from 1990 to 2001. Financial industries are omitted (s
industry and year dummies. Robust t-statistics adjusted for firm-level clusterin
Number of board
meetings (log)
Variable (1) (2)
Probability of informed trading (PIN) �0.3878 �0.4174
(�2.08) (�2.16)
Firm size (log) 0.0415 0.0359
(5.06) (4.02)
Leverage 0.0965 0.1163
(1.82) (2.05)
Firm age (log) 0.0316 0.0199
(2.87) (1.43)
Number of business segments (log) 0.0272 0.0192
(2.15) (1.50)
Market-to-book (log) 0.0054 �0.0034
(0.47) (�0.28)
R&D expenditures 0.0571 0.3698
(0.24) (1.47)
Stock return variance 0.1895 0.1558
(3.98) (3.20)
Free cash flow 0.0262 0.0247
(0.17) (0.14)
Return on assets �0.4269 �0.4464
(�2.51) (�2.35)
CEO pay-performance sensitivity (PPS) �0.6948
(�3.05)
CEO tenure �0.0046
(�3.11)
Staggered board dummy �0.0159
(�0.80)
Poison pill dummy �0.0126
(�0.67)
Cumulative voting dummy �0.0058
(�0.22)
Supermajority dummy 0.0008
(0.04)
Institutional ownership �0.0847
(�2.39)
Institutional Herfindahl �0.0598
(�0.40)
R2 0.091 0.113
Number of observations 4,827 4,151
6.3. Other board structure variables
It is natural to ask whether price informativeness alsoaffects other variables that are likely to be associated withthe monitoring intensity of the board. Here we use thenumber of board meetings and the fraction of directorswith low attendance at board meetings as alternativeproxies for the monitoring intensity of the board. We alsoanalyze the effect of PIN on board size, although previousresearch has found that size does not have a one-to-onerelation to monitoring intensity and is likely to beinfluenced by firms’ need for board advice (Coles, Daniel,and Naveen, 2008; and Linck, Netter, and Yang, 2008).
It has been argued that a board that meets more oftenis likely to be a better monitor (e.g., Vafeas, 1999). InTable 7, Columns 1 and 2 present the estimates of
e number of board meetings, the fraction of directors with low board
meetings by the board size), and the logarithm of board size (number of
finitions. The sample consists of observations on Investor Responsibility
tandard industrial classification codes 6000–6999). Regressions include
g are in parentheses.
Board attendance Board
size (log)
(3) (4) (5) (6)
0.0477 0.0485 �0.2942 �0.2939
(2.11) (2.12) (�2.51) (�2.28)
0.0018 0.0016 0.0844 0.0848
(2.30) (1.86) (16.84) (14.86)
0.0050 0.0035 0.1183 0.0714
(0.96) (0.62) (3.37) (1.93)
�0.0002 �0.0010 0.0676 0.0696
(�0.19) (�0.71) (8.19) (7.17)
0.0011 0.0008 0.0295 0.0197
(0.84) (0.63) (3.19) (2.14)
0.0001 0.0003 �0.0457 �0.0393
(0.10) (0.23) (�5.11) (�4.13)
0.0249 0.0444 �0.5089 �0.6932
(0.99) (1.54) (�2.89) (�3.56)
0.0023 0.0001 �0.1330 �0.1204
(0.52) (0.01) (�4.54) (�3.52)
0.0257 0.0214 0.0892 0.1269
(1.97) (1.45) (0.86) (1.04)
�0.0279 �0.0174 �0.3287 �0.3445
(�1.78) (�1.00) (�2.73) (�2.51)
�0.0550 �0.6388
(�2.86) (�3.90)
0.0003 0.0009
(2.30) (0.90)
0.0050 0.0236
(2.64) (1.76)
�0.0056 0.0164
(�2.86) (1.20)
0.0029 �0.0145
(1.12) (�0.74)
�0.0037 0.0109
(�1.73) (0.63)
�0.0094 �0.0397
(�2.56) (�1.68)
0.0275 0.1334
(1.85) (1.43)
0.006 0.013 0.329 0.333
5,031 4,664 8,923 6,965

D. Ferreira et al. / Journal of Financial Economics 99 (2011) 523–545 541
regressions in which the logarithm of the annual numberof board meetings is the dependent variable. We find anegative relation between the number of board meetingsand PIN. This result is compatible with board monitoringand price informativeness being substitutes.
The Securities Exchange Act of 1934 requires corpora-tions to list in their proxy statements the name of eachdirector who attended fewer than 75% of the boardmeetings and board committees meetings on which theyserve. A higher fraction of directors with low attendanceat meetings is likely to indicate a low monitoringintensity. Columns 3 and 4 present the estimates ofregressions in which the annual fraction of directors withlow attendance is the dependent variable. We find apositive relation between less-assiduous boards and PIN.Again, this result is compatible with board monitoringand price informativeness being substitutes.
Finally, Columns 5 and 6 present the outcome ofregressions in which the dependent variable is thelogarithm of board size. There is evidence of a negativeand statistically significant relation between board sizeand PIN. Most of the other firm-level characteristics enterwith their expected signs and are usually consistent withthe literature on board structure determinants. It has beenargued that larger boards are poor monitors (Jensen,1993). However, some also argue that larger boards aremore diverse and produce more specialized advice tomanagers (Coles, Daniel, and Naveen, 2008; and Linck,Netter, and Yang, 2008). Thus, although the evidence thatwe find is interesting, it is difficult to interpret. It shouldalso be noted that board size and independence arepositively correlated in the sample.
6.4. Additional robustness checks
This subsection discusses several additional robustnesschecks. We check whether our findings are robust to thesample period, to functional form assumptions, and to theinclusion of additional control variables. These resultsappear in Table 8. In the specifications of Table 8 we usethe same set of control variables as in Column 5 of Table 2(coefficients not shown).
Column 1 uses the 1996–2001 sample period, not1990–2001. The 1996–2001 period corresponds to theperiod for which the IRRC directorship data are available.Therefore, Column 1 uses only IRRC directorship data, notboth Compact Disclosure (1990–1995) and IRRC data(1996–2001). A potential concern arises because CompactDisclosure classifies each director as either executive ornonexecutive, while IRRC uses a finer definition ofindependence. Column 2 uses board data from CompactDisclosure for the whole sample period (1990–2001) as analternative to the IRRC directorship data.
Column 3 uses the logarithm of board independence,instead of the logistic transformation, as the dependentvariable. Column 4 uses the fraction of independentdirectors (i.e., restricted to [0,1]) as the dependentvariable.
Column 5 reports results after controlling for bloc-kholder ownership, considering all types of blockholders
instead of institutional investors only. Column 6 reportsresults after controlling for outside blockholders owner-ship, not 13F institutional investors only. These bloc-kholder ownership data are taken from Dlugosz,Fahlenbrach, Gompers, and Metrick (2006) and cover the1996–2001 sample period.
Column 7 presents results that take into accountproduct market competition. Shleifer and Vishny (1997)suggest that product market competition is one of themost effective mechanisms to eliminate managerialinefficiency. We try to capture the competitive structureof an industry by using the industry Herfindahl index,calculated as the sum of squared market shares of allfirms in each industry (two-digit SIC) in each year.Industries with lower Herfindahl indices possess morecompetitive product markets.
Column 8 includes lagged board size as an additionalcontrol variable following Boone, Field, Karpoff, andRaheja (2007) and Coles, Daniel, and Naveen (2008). Tocontrol for the potential differences in liquidity andgovernance requirements between stock exchanges, inColumn 9 we include a dummy variable that takes thevalue of one if a firm is listed on the New York StockExchange.
In Columns 1–9, the estimated coefficient on theprobability of informed trading remains negative andstrongly significant. Our basic result is thus confirmed:Higher rate of information incorporation into stock pricesvia trading is strongly associated with less board inde-pendence or, in other words, with less need for boardmonitoring.
Others have shown that board structure affects firms’disclosure policy (e.g., Leuz, Triantis, and Wang, 2008) andaccounting quality (e.g., Petra, 2007). Columns 10 and 11present results that control for earnings quality andearnings informativeness. Earnings quality is measuredby the annual absolute value of firm-specific residualsfrom an industry regression of total accruals on lagged,contemporaneous, and leading cash flow from operations(Dechow and Dichev, 2002). This variable is an inverseindex of accounting quality, in that it increases in themagnitude of unexpected accruals. Following Francis andSchipper (1999) and Bushman, Chen, Engel, and Smith(2004), we measure earnings informativeness by the R2 ofa firm-level regression of 15-month stock returns (endingthree months after the end of fiscal year t) on incomebefore extraordinary items (NIBE) in year t and the changein NIBE from year t�1 to t, scaled by market value at thebeginning of year t. Weak evidence exists of a positiveassociation between board independence and earningsquality and informativeness. Most important, the magni-tude of the PIN coefficient is not affected by thesecontrols.
A different concern with our measure of priceinformativeness is that PIN is a proxy for extreme stockperformance. We find this to be true in our sample. Firmswith abnormal stock returns in the bottom and topquintiles have significantly higher PIN than firms withmoderate levels of abnormal returns. It could be the casethat PIN is simply proxying for extreme stock priceperformance and that board structure changes as a

Table 8Board independence and probability of informed trading: additional robustness checks.
Estimates of panel regressions of the fraction of independent directors are shown. The dependent variable is the logistic transformed fraction of
independent directors in all columns, with the exceptions of Column 3, which uses the log fraction of independent directors, and of Column 4, which uses
the fraction of independent directors. Column 1 uses the 1996–2001 period. Column 2 uses only board data from Compact Disclosure. Columns 5 and 6
control for blockholders ownership. Column 7 controls for industry concentration using the industry Herfindahl index. Column 8 controls for lagged
board size. Column 9 controls for stocks traded in the NYSE. Column 10 controls for the earnings quality measure of Dechow and Dichev (2002). Column
11 controls for earnings informativeness using the R2 from a regression of stock returns on income before extraordinary items and changes on income
before extraordinary items (scaled by market value of equity). Column 12 controls for extreme abnormal stock return using two dummy variables, one
indicating those firms with abnormal stock return below the 20th percentile (Q1) and one indicating those firms with abnormal stock return above the
80th percentile (Q5). Column 13 uses as explanatory variable PIN Q5–Q1 dummy that equals one for firm-years with probability of informed trading (PIN)
above the 80th percentile (Q5) and zero for firm-years with PINs below the 20th percentile (Q1) (observations with intermediate values of PIN are not
included in this regression). Column 14 uses as explanatory variable PIN dummy that equals one for firm-years above the median and zero otherwise.
Column 15 shows estimates of median regressions (least absolute deviations). Column 16 shows estimates of the Fama-MacBeth estimation method.
Refer to Table A1 in the Appendix for variable definitions. The sample consists of observations on Investor Responsibility Research Center firms from 1990
to 2001. Financial industries are omitted (standard industrial classification codes 6000–6999). Regressions include the control variables (coefficients not
shown) used in Column 5 of Table 2 and industry and year dummies. Robust t-statistics adjusted for firm-level clustering are in parentheses.
1996 Compact Board Board All Outside Industry Board
–2001 disclosure independence (log) independence blockholders blockholders Herfindahl size
Variable (1) (2) (3) (4) (5) (6) (7) (8)
Probability of informed trading �0.9345 �0.9884 �0.3668 �0.1975 �0.9084 �0.9871 �1.5924 �1.5657
(�2.56) (�3.52) (�4.23) (�2.99) (�2.44) (�2.63) (�5.38) (�5.15)
Blockholders ownership 0.0325
(0.31)
Outside blockholders ownership 0.3567
(3.11)
Industry Herfindahl 0.1393
(1.08)
Board size (lag) 0.0196
(2.44)
R2 0.162 0.155 0.143 0.092 0.162 0.167 0.161 0.169
N 4,439 5,955 6,827 6,965 4,439 4,439 6,675 6,133
Earnings Earnings Abnormal PIN PIN Median Fama-
NYSE quality informativeness stock return Q5–Q1 dummy regression MacBeth
Variable (9) (10) (11) (12) (13) (14) (15) (16)
Probability of informed trading �1.5464 �1.3023 �1.6186 �1.5887 �1.9516 �0.8826
(�5.21) (�4.48) (�4.93) (�5.28) (�5.92) (�3.61)
Probability of informed trading (Q5-Q1) �0.2923
(�5.04)
Probability of informed trading (dummy) �0.1247
(�4.89)
NYSE dummy 0.0953
(1.62)
Earnings quality �0.1487
(�1.77)
Earnings informativeness �0.0168
(�0.40)
Abnormal stock return (Q1 bottom dummy) 0.0131
(0.55)
Abnormal stock return (Q5 top dummy) 0.0079
(0.34)
R2 0.162 0.182 0.174 0.161 0.182 0.159 0.157
Number of observations 6,675 5,664 5,751 6,675 2,722 6,675 6,675 6,675
D. Ferreira et al. / Journal of Financial Economics 99 (2011) 523–545542
response to such events. To address this concern, inColumn 12 we include as controls two dummy variables:one indicating those firms with past abnormal stockreturns below the 20th percentile (Q1) and one indicatingthose firms with past abnormal stock returns above the80th percentile (Q5). The evidence that extreme abnormalreturns affect board structure directly is weak, while thePIN coefficient is not materially affected.
So far we have treated PIN as a continuous variable. Wenow take an alternative approach and classify firms as either
low PIN or high PIN. Specifically, we define two dummyvariables: PIN Q5–Q1 is equal to one for firm-years with PINsabove the 80th percentile (Q5) and zero for firm-years withPINs below the 20th percentile (Q1) (observations withintermediate values of PIN are not included in this regres-sion), and a PIN dummy equals one for firm-years above themedian and zero otherwise. This procedure tackles somepossible measurement errors problems in the PIN variable.Columns 13 and 14 report the results that confirm a negativerelation between PIN and board independence.

D. Ferreira et al. / Journal of Financial Economics 99 (2011) 523–545 543
Finally, as alternative procedures to tackle potentialproblems with outliers and cross-sectional error correla-tion, we present results using a least-absolute deviation(median) regression (Column 15) and the Fama-MacBethprocedure (Column 16). If anything, outliers seem toreduce the magnitude of the estimated effects.
7. Conclusion
We theoretically and empirically identify importantinteractions between internal and external governancemechanisms. We find evidence that stock market mon-itoring is a substitute for board monitoring. The strength
Table A1Definitions of variables.
Variable
Fraction of independent
directors
Ratio of number of independent directors
and 1996–2001 data from Investor Respon
Board size Number of board members (IRRC)
Number of board meetings Number of board meetings per year (Execu
Board attendance Ratio of directors that attended less than 7
Probability of informed trading
(PIN)
Probability of informed trading of Easley, H
Firm-specific return variation 1�R2 of the Fama-French three-factor reg
Illiquidity Average daily ratio of a stock absolute retu
Firm size Market capitalization in millions of dollars
Leverage Ratio of total debt to total assets (Compus
Firm age Number of years since the stock inclusion
Number of business segments Number of business segments in which fir
Market-to-book Ratio of market value of equity to book va
R&D expenditures Ratio of research and development expend
Stock return variance Stock return variance (annualized) estimat
Free cash flow Ratio of operating income before deprecia
(Compustat: (item 13� item 128)/item 6)
Return on assets Ratio of operating income before deprecia
CEO pay-performance
sensitivity(PPS)
Sensitivity of chief executive officer’s stock
percentage
of the number of shares outstanding (Exec
CEO tenure Number of years since the date the directo
Governance index (GIM) Governance index of Gompers, Ishii, and M
Staggered board dummy Dummy variable that takes the value of on
Poison pill dummy Dummy variable that takes the value of on
Cumulative voting dummy Dummy variable that takes the value of on
Supermajority dummy Dummy variable that takes the value of on
Institutional ownership Number of shares held by institutions divid
Holdings)
Institutional Herfindahl Institutional Herfindahl index calculated u
Blockholder ownership Number of shares held by all blockholders
Outside blockholder ownership Number of shares held by outside blockho
Stock return Annual abnormal stock return calculated as
(CRSP)
Stock return (absolute) Annual absolute abnormal stock return (CR
Industry Herfindahl Industry Herfindahl index calculated as th
in the industry [two-digit standard indust
Earnings quality Absolute value of firm-specific residuals fr
lagged, contemporaneous, and leading cas
Earnings informativeness R2 of a firm-level regression of 15-month
income
before extraordinary items (NIBE) in year t
equity at the beginning of year t
NYSE dummy Dummy variable that takes the value of on
Number of analysts Number of analysts covering a firm (Instit
Share turnover Annual number of shares traded divided b
S&P 500 dummy Dummy variable that takes the value of on
otherwise (CRSP)
of this relation is influenced by other governancemechanisms such as pay-performance sensitivity andthe market for corporate control.
We add a new element to the list of determinants ofboard structure: price informativeness. We find robustempirical evidence that stock price informativeness isnegatively related to board independence. The correlationbetween price informativeness and board independence isas strong as the ones between board independence andother firm-level variables that have been shown in theliterature on corporate boards. Given our long list ofcontrol variables and the use of fixed effects methods, it isunlikely that price informativeness is capturing the effectsof omitted variables.
Definition
to board size [1990–1995 data from Compact Disclosure
sibility Research Center (IRRC)]
Comp)
5% of board or committee meetings to board size (IRRC)
vidkjaer, and O’Hara (2002)
ression model using daily stock returns
rn by the dollar volume (Amihud, 2002)
(Compustat: item 25� item 199)
tat: (item 9 + item 34)/item 6)
in the Center for Research in Security Prices (CRSP) database
m operates (Compustat)
lue of equity (Compustat: item 25� item 199/item 60)
itures to total assets (Compustat: item 46/item 6)
ed with daily stock returns (CRSP)
tion minus capital expenditures to total assets
tion to total assets (Compustat: item 13/item 6)
and stock options holdings to changes in shareholder wealth, as a
uComp)
r became chief executive officer (ExecuComp)
etrick (2003), which is based on 24 antitakeover provisions (IRRC)
e if a firm has a staggered board, and zero otherwise
e if a firm has a poison pill provision, and zero otherwise
e if a firm has a cumulative vote provision, and zero otherwise
e if a firm has a supermajority vote requirement, and zero otherwise
ed by the number of shares outstanding (Thomson CDA/Spectrum 13F
sing institutional ownership
divided by the number of shares outstanding
lders divided by the number of shares outstanding
firm’s stock return minus the return on the CRSP value-weighted index
SP)
e sum of squared market shares of firms’ sales (COMPUSTAT: item 12)
rial classification (SIC) code]
om an annual industry regression (two-digit SIC) of total accruals on
h flow from operations; variables scaled by total assets
stock returns (ending three months after the end of fiscal year t) on
and the change in NIBE from year t�1 to t, scaled by market value of
e if a firm is listed on the NYSE, and zero otherwise (CRSP)
utional Brokers’ Estimate System)
y the number of shares outstanding (CRSP)
e if a firm is a member of the Standard & Poor’s 500 index, and zero

D. Ferreira et al. / Journal of Financial Economics 99 (2011) 523–545544
Our model delivers many empirical predictions thatfind support in the data. The negative relation betweenprice informativeness and board monitoring is particu-larly strong for firms with few takeover defenses, highconcentration of institutional shareholders, high pay-performance sensitivity in CEO compensation, and lowfirm-specific knowledge. We conclude that the strength ofthe substitutability between price informativeness andboard independence can be accurately measured onlywhen taking into account the overall governanceframework.
Our results suggests that, if stock prices are informa-tive, stock markets are able to perform a monitoring rolelike the one normally associated with the board ofdirectors. The evidence that more informative prices areassociated with a lower degree of board independence,fewer board meetings, low attendance at board meetings,and smaller board size all point in the same direction:Firms with more informative stock prices require lessdemanding board structures. Our findings suggest thatstock price informativeness affects optimal organizationdesign.
Appendix
See Table A1.
References
Adams, R., Ferreira, D., 2007. A theory of friendly boards. Journal ofFinance 62, 217–250.
Aggarwal, R., Samwick, A., 1999. The other side of the trade-off: theimpact of risk on executive compensation. Journal of PoliticalEconomy 107, 65–105.
Almazan, A., Banerji, S., Motta, A., 2008. Attracting attention: cheapmanagerial talk and costly market monitoring. Journal of Finance 63,1399–1436.
Amihud, Y., 2002. Illiquidity and stock returns: cross-section and time-series effects. Journal of Financial Markets 5, 31–56.
Aslan, H., Easley, D., Hvidkjaer, S., O’Hara, M., 2008. Firm characteristicsand informed trading: implications for asset pricing. Unpublishedworking paper, Cornell University.
Asquith, P., Oman, R., Safaya, C., 2007. Short sales and trade classificationalgorithms. Unpublished working paper, National Bureau of Eco-nomic Research.
Bolton, P., Dewatripont, M., 2005. Contract Theory. MIT Press, Cam-bridge, MA.
Boone, A., Field, L., Karpoff, J., Raheja, C., 2007. The determinants ofcorporate board size and composition: an empirical analysis. Journalof Financial Economics 85, 66–101.
Borokhovich, K., Parrino, R., Trapani, T., 1996. Outside directors and CEOselection. Journal of Financial and Quantitative Analysis 31,337–355.
Brickley, J., Coles, J., Terry, R., 1994. Outside directors and the adoption ofpoison pills. Journal of Financial Economics 35, 371–390.
Brickley, J., Lease, R., Smith, C., 1988. Ownership structure and voting onantitakeover amendments. Journal of Financial Economics 20,267–292.
Bushman, R., Chen, Q., Engel, E., Smith, A., 2004. Financial accountinginformation, organizational complexity and corporate governancesystems. Journal of Accounting and Economics 37, 167–201.
Carleton, W., Nelson, J., Weisbach, M., 1998. The influence of institutionson corporate governance through private negotiations: Evidencefrom TIAA-CREF. Journal of Finance 53, 1335–1362.
Chan, K., Hameed, A., 2006. Stock price synchronicity and analystcoverage in emerging markets. Journal of Financial Economics 80,115–147.
Chen, Q., Goldstein, I., Jiang, W., 2007. Price informativeness andinvestment sensitivity to stock price. Review of Financial Studies 20,619–650.
Chen, X., Harford, J., Li, K., 2007. Monitoring: Which institutions matter?Journal of Financial Economics 86, 279–305.
Cicero, D., Wintoki, M., Yang, T., 2008. Do firms adjust to a target boardstructure? Unpublished working paper, University of Georgia.
Coles, J., 2008. Disclosure policy: a discussion of Leuz, Triantis, and Wang(2008). Journal of Accounting and Economics 45, 209–220.
Coles, J., Daniel, N., Naveen, L., 2008. Boards: Does one size fit all? Journalof Financial Economics 87, 329–356.
Coles, J., Lemmon, M., Wang, Y., 2008. The joint determinants ofmanagerial ownership, board independence, and firm performance.Unpublished working paper, Arizona State University.
Core, J., Guay, W., 1999. The use of equity grants to manage optimalequity incentive levels. Journal of Accounting and Economics 28,151–184.
Cotter, J., Shivdasani, A., Zenner, M., 1997. Do independent directorsenhance target shareholder wealth during tender offers? Journal ofFinancial Economics 43, 195–218.
Cremers, M., Nair, V., 2005. Governance mechanisms and equity prices.Journal of Finance 60, 2859–2894.
Davila, A., Penalva, F., 2006. Governance structure and the weighting ofperformance measures in CEO compensation. Review of AccountingStudies 11, 463–493.
Dechow, P., Dichev, I., 2002. The quality of accruals and earnings.Accounting Review 77, 35–59.
Demsetz, H., Lehn, K., 1985. The structure of corporate ownership:causes and consequences. Journal of Political Economy 93,1155–1177.
Denis, D., McConnell, J., Ovtchinnikov, A., Yu, Y., 2003. S&P 500 indexadditions and earnings expectations. Journal of Finance 58,1821–1840.
Denis, D., Sarin, A., 1999. Ownership and board structures inpublicly traded corporations. Journal of Financial Economics 52,187–223.
Dlugosz, J., Fahlenbrach, R., Gompers, P., Metrick, A., 2006. Large blocksof stock: prevalence, size, and measurement. Journal of CorporateFinance 12, 594–618.
Dow, J., Goldstein, I., Guembel, A., 2007. Incentives for informationproduction in markets where prices affect real investment. Unpub-lished working paper, London Business School.
Dow, J., Gorton, G., 1997. Stock market efficiency and economicefficiency: Is there a connection? Journal of Finance 52, 1087–1129.
Duarte, J., Young, L., 2009. Why is PIN priced? Journal of FinancialEconomics 91, 119–138.
Durnev, A., Morck, R., Yeung, B., 2004. Value-enhancing capital budget-ing and firm-specific stock return variation. Journal of Finance 59,65–105.
Durnev, A., Morck, R., Yeung, B., Zarowin, P., 2003. Does greater firm-specific return variation mean more or less informed stock pricing?Journal of Accounting Research 41, 797–836.
Easley, D., Hvidkjaer, S., O’Hara, M., 2002. Is information risk adeterminant of asset returns? Journal of Finance 57, 2185–2221.
Easley, D., Kiefer, N., O’Hara, M., 1996. Cream-skimming or profitsharing? The curious role of purchased order flow. Journal of Finance51, 811–833.
Easley, D., O’Hara, M., Paperman, J., 1998. Financial analysts andinformation-based trade. Journal of Financial Markets 1, 175–201.
Edmans, A., 2009. Blockholders, market efficiency, and managerialmyopia. Journal of Finance 64, 2481–2513.
Fama, E., Jensen, M., 1983. Separation of ownership and control. Journalof Law and Economics 26, 301–325.
Faure-Grimaud, A., Gromb, D., 2004. Public trading and privateincentives. Review of Financial Studies 17, 985–1014.
Ferreira, M., Laux, P., 2007. Corporate governance, idiosyncratic risk andinformation flow. Journal of Finance 62, 951–989.
Field, L., Karpoff, J., 2002. Takeover defenses of IPO firms. Journal ofFinance 57, 1857–1889.
Francis, J., Schipper, K., 1999. Have financial statements lost theirrelevance? Journal of Accounting Research 37, 319–352.
French, K., Roll, R., 1986. Stock return variances: the arrival ofinformation and the reaction of traders. Journal of FinancialEconomics 17, 5–26.
Gillan, S., Hartzell, J., Starks, L., 2006. Evidence on corporate governance:the joint determination of board structure and charter provisions.Unpublished working paper, University of Texas at Austin.
Gillan, S., Starks, L., 2007. The evolution of shareholder activism inthe United States. Journal of Applied Corporate Finance 19,55–73.
Gompers, P., Ishii, J., Metrick, A., 2003. Corporate governance and equityprices. Quarterly Journal of Economics 118, 107–155.

D. Ferreira et al. / Journal of Financial Economics 99 (2011) 523–545 545
Gordon, J., 2007. Independent directors and stock market prices: the newcorporate governance paradigm. Stanford Law Review 59,1465–1568.
Grossman, S., Stiglitz, J., 1980. On the impossibility of informationallyefficient markets. American Economic Review 70, 393–408.
Hartzell, J., Starks, L., 2003. Institutional investors and executivecompensation. Journal of Finance 58, 2351–2374.
Hayek, F., 1945. The use of knowledge in society. American EconomicReview 35, 519–530.
Hermalin, B., Weisbach, M., 1998. Endogenously chosen boards ofdirectors and their monitoring of the CEO. American EconomicReview 88, 96–118.
Holmstrom, B., Milgrom, P., 1987. Aggregation and linearity in theprovision of intertemporal incentives. Econometrica 55, 303–328.
Holmstrom, B., Tirole, J., 1993. Market liquidity and performancemonitoring. Journal of Political Economy 101, 678–709.
Jensen, M., 1993. The modern industrial revolution, exit, and the failureof internal control systems. Journal of Finance 48, 831–880.
Jin, L., Myers, S., 2006. R2 around the world: new theory and new tests.Journal of Financial Economics 79, 257–292.
Karpoff, J., 2001. The impact of shareholder activism on targetcompanies: a survey of empirical findings. Unpublished workingpaper, University of Washington.
Khanna, N., Slezak, S., Bradley, M., 1994. Insider trading, outside search,and research allocation: why firm and society may disagree oninsider trading restrictions. Review of Financial Studies 7, 575–608.
Klein, A., 2002. Audit committee, board of director characteristics, andearnings management. Journal of Accounting and Economics 33,375–400.
Kyle, A., 1985. Continuous auctions and insider trading. Econometrica53, 1315–1336.
Larcker, D., Richardson, S., Tuna, I., 2007. Corporate governance,accounting outcomes, and organizational performance. AccountingReview 82, 963–1008.
Leuz, C., Triantis, A., Wang, T., 2008. Why do firms go dark? Causes andeconomic consequences of voluntary SEC deregistrations. Journal ofAccounting and Economics 45, 181–208.
Linck, J., Netter, J., Yang, T., 2008. The determinants of board structure.Journal of Financial Economics 87, 308–328.
Masulis, R., Wang, C., Xie, F., 2007. Corporate governance and acquirerreturns. Journal of Finance 62, 1851–1889.
Mikkelson, W., Partch, M., 1997. The decline of takeovers anddisciplinary managerial turnover. Journal of Financial Economics 44,205–228.
Mohanram, P., Rajgopal, S., 2009. Is PIN priced risk? Journal ofAccounting and Economics 47, 226–243.
Morck, R., Yeung, B., Yu, W., 2000. The information content of stockmarkets: Why do emerging markets have synchronous stock pricemovements? Journal of Financial Economics 58, 215–260.
Petra, S., 2007. The effects of corporate governance on the informative-ness of earnings. Economics of Governance 8, 129–152.
Piotroski, J., Roulstone, D., 2004. The influence of analysts, institutionalinvestors, and insiders on the incorporation of market, industry, andfirm-specific information into stock prices. The Accounting Review79, 1119–1151.
Prendergast, C., 2002. The tenuous trade-off between risk and incentives.Journal of Political Economy 110, 1071–1102.
Raheja, C., 2005. Determinants of board size and composition: a theoryof corporate boards. Journal of Financial and Quantitative Analysis40, 283–306.
Roll, R., 1988. R2. Journal of Finance 43, 541–566.Ryan, H., Wiggins, R., 2004. Who is in whose pocket? Director
compensation, board independence, and barriers to effectivemonitoring. Journal of Financial Economics 73, 497–524.
Shivdasani, A., Yermack, D., 1999. CEO involvement in the selection ofnew board members: an empirical analysis. Journal of Finance 54,1829–1853.
Shleifer, A., Vishny, R., 1986. Large shareholders and corporate control.Journal of Political Economy 94, 461–488.
Shleifer, A., Vishny, R., 1997. A survey of corporate governance. Journal ofFinance 52, 737–783.
Vafeas, N., 1999. Board meeting frequency and firm performance. Journalof Financial Economics 53, 113–142.
Vafeas, N., 2000. Board structure and the informativeness of earnings.Journal of Accounting and Public Policy 19, 139–160.
Vega, C., 2006. Stock price reaction to public and private information.Journal of Financial Economics 82, 103–133.
Warfield, T., Wild, J., Wild, K., 1995. Managerial ownership, accountingchoices, and informativeness of earnings. Journal of Accounting andEconomics 20, 61–91.
Weisbach, M., 1988. Outside directors and CEO turnover. Journal ofFinancial Economics 20, 421–460.