Embed Size (px)
Citation preview
1
1Cyclic AMP directs IP3-evoked Ca2+ signalling to different intracellular Ca2+ stores 2
3
Stephen C. Tovey and Colin W. Taylor* 4
5
Department of Pharmacology, University of Cambridge, Tennis Court Road, Cambridge, 6
CB2 1PD, United Kingdom 7
8*Corresponding author: [email protected] 9
10
Running title: Discrete IP3-sensitive Ca2+ stores 11
12
Key words: calcium signalling, cholesterol, cyclic AMP, IP3 receptor, spatial organization 13
14
15
16
17
© 2012. Published by The Company of Biologists Ltd.Jo
urna
l of C
ell S
cien
ceA
ccep
ted
man
uscr
ipt
JCS Advance Online Article. Posted on 22 March 2013
2
1
Summary 2
Cholesterol depletion reversibly abolishes carbachol-evoked Ca2+ release from IP3-sensitive 3
stores, without affecting the distribution of IP3 receptors (IP3R) or ER, IP3 formation or 4
responses to photolysis of caged IP3. Receptors that stimulate cAMP formation do not alone 5
evoke Ca2+ signals, but they potentiate those evoked by carbachol. We show that these 6
potentiated signals are entirely unaffected by cholesterol depletion, and that within individual 7
cells different IP3-sensitive Ca2+ stores are released by carbachol alone and by carbachol 8
combined with receptors that stimulate cAMP formation. We suggest that muscarinic 9
acetylcholine receptors in lipid rafts deliver IP3 at high concentration to associated IP3R, 10
stimulating them to release Ca2+. Muscarinic receptors outside rafts are less closely 11
associated with IP3R and provide insufficient local IP3 to activate IP3R directly. These IP3R, 12
probably type 2 IP3R within a discrete Ca2+ store, are activated only when their sensitivity is 13
increased by cAMP. Sensitization of IP3R by cAMP extends the effective range of signalling 14
by phospholipase C, allowing muscarinic receptors that are otherwise ineffective to recruit 15
additional IP3-sensitive Ca2+ stores. 16
17
18
19
Jour
nal o
f Cel
l Sci
ence
Acc
epte
d m
anus
crip
t
3
1
Introduction 2
Many cells respond to extracellular stimuli with an increase in intracellular free Ca2+ 3
concentration ([Ca2+]i). The complex spatio-temporal organization of these Ca2+ signals 4
provides the versatility that allows them selectively to regulate many cellular processes 5
(Berridge et al., 2000). Inositol 1,4,5-trisphosphate (IP3), by stimulating Ca2+ release from the 6
endoplasmic reticulum (ER), provides a common link between receptors at the plasma 7
membrane and cytoplasmic Ca2+ signals. Diverse stimuli, via their receptors, stimulate 8
phospholipase C (PLC) and so formation of IP3, which binds to IP3 receptors (IP3R) causing 9
Ca2+ to leak into the cytosol (Foskett et al., 2007; Taylor and Tovey, 2010). 10
Parathyroid hormone (PTH) stimulates adenylyl cyclase (AC) via G protein-coupled 11
receptors (GPCR).The type 1 PTH receptor (PTHR1) has attracted most attention because it 12
has essential roles in bone remodelling and plasma Ca2+ homeostasis, and it is a target of 13
drugs used to treat osteoporosis (Mannstadt et al., 1999). PTHR1 can stimulate both AC and 14
an increase in [Ca2+]i, but the relationships between these events are complex (reviewed in 15
Taylor and Tovey, 2012). PTH invariably stimulates AC, but it can also stimulate PLC 16
directly when the signalling proteins are expressed at high levels (Offermanns et al., 1996; 17
Schwindinger et al., 1998; Taylor and Tovey, 2012) or when PTHR1 associates with the 18
scaffold proteins, Na+-H+-exchanger regulatory factors (NHERF) (Wang et al., 2010). Cyclic 19
AMP (cAMP), via exchange protein activated by cAMP (epac) and the monomeric G protein 20
Rap, can also stimulate PLCε (Schmidt et al., 2001). We (Short and Taylor, 2000; Tovey et 21
al., 2008; Tovey et al., 2003) and others (Schwindinger et al., 1998) find that in HEK 293 22
cells stably expressing physiological levels of PTHR1 (HEK-PR1 cells), PTH stimulates AC, 23
but it does not alone evoke an increase in [Ca2+]i. However, PTH (or endogenous β2-24
adrenoceptors) potentiates the Ca2+ signals evoked by receptors that stimulate PLC (Kurian et 25
al., 2009; Tovey et al., 2008). This effect of PTH is entirely mediated by cAMP, it requires 26
activation of neither cAMP-dependent protein kinase (PKA) nor epacs, and it results from 27
cAMP binding to IP3R directly or to a protein that tightly associates with IP3R (Tovey et al., 28
2008; Tovey et al., 2010). Although cAMP increases the sensitivity of all three IP3R subtypes 29
to IP3 (Tovey et al., 2010), in intact HEK-PR1 cells a specific association of IP3R2 and AC6, 30
an ‘AC-IP3R junction’, allows AC to deliver cAMP directly and at high concentration to IP3R 31
(Fig. 1A) (Tovey et al., 2008). 32
Jour
nal o
f Cel
l Sci
ence
Acc
epte
d m
anus
crip
t
4
Lipid rafts are ordered regions of the plasma membrane in which the outer leaflet is 1
enriched in cholesterol and sphingolipids (Simons and Toomre, 2000). Many signalling 2
proteins, including GPCRs, G proteins, ACs, IP3Rs and PLCs, associate with lipid rafts and 3
are thereby organized into signalling complexes (Isshiki and Anderson, 1999; Ostrom and 4
Insel, 2004; Simons and Toomre, 2000). Disruption of lipid rafts by cholesterol depletion has 5
been reported to inhibit IP3-evoked Ca2+ release (Nagata et al., 2007; Singleton and 6
Bourguignon, 2004; Weerth et al., 2007) and to disrupt selective regulation of AC6 and AC8 7
by store-operated Ca2+ entry (Willoughby and Cooper, 2007). Evidence that delivery of 8
cAMP from AC6 to IP3R2 mediates the effects of PTH on IP3-evoked Ca2+ signals in HEK-9
PR1 cells (Tovey et al., 2008) alongside reports that AC5/6 (Head et al., 2005; Ostrom et al., 10
2002; Willoughby and Cooper, 2007) and IP3R2 (Weerth et al., 2007) can associate with 11
cholesterol-rich lipid rafts prompted us to examine the role of lipid rafts in signalling by PTH. 12
13
Results 14
Loss of cholesterol inhibits carbachol-evoked Ca2+ release, but not its potentiation by 15
PTH 16
Carbachol (CCh), a stable analogue of acetylcholine that stimulates IP3 formation via 17
endogenous M3 muscarinic receptors (M3R) (Luo et al., 2008), evoked Ca2+ release from the 18
intracellular stores of HEK 293 cells (Short et al., 2000). This IP3-evoked Ca2+ release was 19
potentiated by PTH in HEK-PR1 cells (Fig. 1B), by isoproterenol, which stimulates 20
endogenous β2-adrenoceptors (Supplementary Fig. S1A) (Kurian et al., 2009), or by high 21
concentrations of a membrane-permeant analogue of cAMP, 8-bromo-cAMP (8-Br-cAMP) 22
(Supplementary Fig. S1B). Neither PTH nor isoproterenol alone stimulated Ca2+ release (Fig. 23
1B and Supplementary Fig. S1A). These results are consistent with earlier work suggesting 24
that AC6-IP3R2 junctions allow cAMP to be delivered directly to IP3R at high concentrations 25
to cause an increase in their sensitivity to IP3 (Tovey et al., 2008; Tovey et al., 2010). 26
Subsequent experiments assess whether cholesterol, an essential component of lipid rafts 27
(Simons and Ikonen, 1997), is required for this selective communication (Fig. 1A). 28
Filipin-staining established that most cholesterol was in the plasma membrane and that 29
exposure to β-methylcyclodextrin (βMCD, 2 % w/v, 2 h at 20°C) caused loss of plasma 30
membrane cholesterol without perturbing cell morphology (Fig. 1C and D). Similar results 31
were obtained with brief exposure (10 min) to βMCD (2 % w/v) at 37°C (Supplementary Fig. 32
S2A-C). In most experiments, the more prolonged (30 min - 2 h) treatment at 20°C was used 33
Jour
nal o
f Cel
l Sci
ence
Acc
epte
d m
anus
crip
t
5
because it was then easier to adjust incubation times to achieve effective cholesterol depletion 1
without causing cellular damage. Pre-treatment of cells with βMCD at 20°C massively 2
attenuated the Ca2+ release evoked by CCh in populations of HEK-PR1 cells (Fig. 1E). The 3
peak increase in [Ca2+]i evoked by a maximal concentration of CCh (1 mM) was reduced by 4
80 ± 11 % from 234 ± 22 nM to 51 ± 26 nM (Fig. 1F). The sensitivity to CCh was not 5
significantly affected: the pEC50 (-logEC50, where EC50 is the half-maximally effective 6
concentration) was 4.38 ± 0.14 and 3.88 ± 1.07 for control and βMCD-treated cells, 7
respectively (Fig. 1F). CCh-evoked Ca2+ release was similarly inhibited by brief treatment 8
with βMCD (2 % w/v, 10 min) at 37°C (Supplementary Fig. S2D). The effects of cholesterol 9
depletion on CCh-evoked Ca2+-release were reversed by cholesterol repletion (Fig. 1G). 10
Although loss of cholesterol almost abolished responses to CCh, it had no significant 11
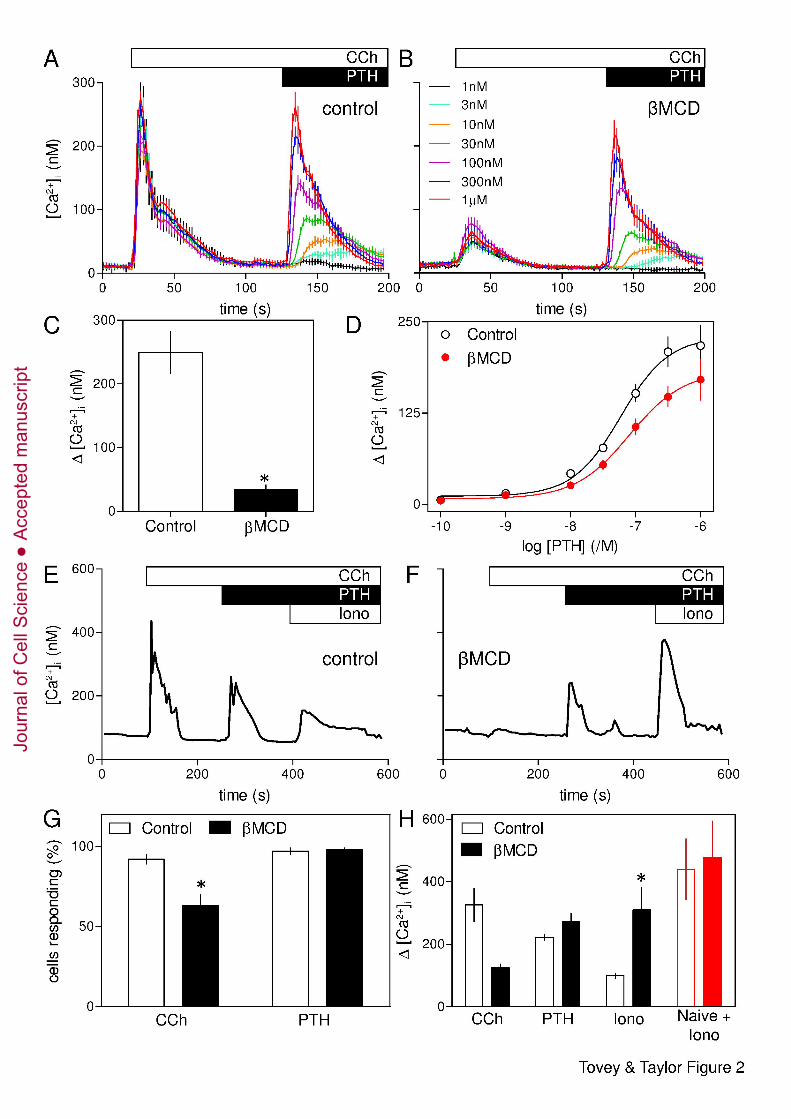
effect on the Ca2+ signals evoked by subsequent addition of PTH (Fig. 2A-C). Neither the 12
amplitude of the Ca2+ signal evoked by addition of a maximal concentration of PTH after 13
CCh (229 ± 28 nM and 187 ± 30 nM, in control and βMCD-treated cells, respectively) nor 14
the sensitivity to PTH (pEC50 = 7.25 ± 0.21 and 7.11 ± 0.17) was affected by loss of 15
cholesterol (Fig. 2D). It is worth noting that in these and related experiments (Fig. 2, 3, 16
Supplementary Fig. S1, S3B and S7), the Ca2+ signal evoked by addition of PTH directly 17
reports the potentiated response because although CCh is present throughout, [Ca2+]i has 18
returned to its basal level before PTH is added. The results with cell populations were 19
confirmed in single cells, where a maximal concentration of CCh (1 mM) evoked a transient 20
release of Ca2+ in 92 ± 3 % of cells, and subsequent addition of PTH (100 nM) caused further 21
Ca2+ release in 97 ± 2 % of cells (Fig. 2E-H). Pre-treatment with βMCD significantly reduced 22
both the number of cells responding to CCh alone (to 63 ± 7 %, Fig. 2G) and the amplitude of 23
the peak Ca2+ signal (Fig. 2H). Even in those cells that responded to CCh, the amplitude of 24
the Ca2+ signal was reduced from 350 ± 52 nM to 191 ± 7 nM. However, βMCD had no 25
effect on the number of cells in which PTH potentiated CCh-evoked Ca2+ signals (98 ± 1 % 26
cells, Fig. 2G) or the amplitude of the peak response to PTH (229 ± 8 nM and 278 ± 27 nM in 27
control and βMCD-treated cells, respectively). It is important to recall that PTH evokes Ca2+ 28
signals only when cells are co-stimulated with CCh (Fig. 1B), yet after βMCD-treatment 29
many cells (37 %) failed to respond to CCh alone, but almost all cells (98 %) responded to 30
CCh with PTH (Fig. 2G). Many βMCD-treated cells therefore responded to PTH with CCh 31
despite not responding to CCh alone. 32
Jour
nal o
f Cel
l Sci
ence
Acc
epte
d m
anus
crip
t
6
Addition of ionomycin, a Ca2+ ionophore, to cells in Ca2+-free HBS was used to define the 1
amount of Ca2+ within intracellular stores (Fig. 2E and F). The results demonstrate that loss 2
of cholesterol had no effect on the initial Ca2+ content of the stores (Fig. 2H, red), but their 3
residual Ca2+ content after stimulation with CCh and PTH was significantly greater in 4
βMCD-treated cells (Fig. 2H). We conclude that cholesterol depletion has no direct effect on 5
the Ca2+ content of the intracellular stores, but it attenuates the Ca2+ signals evoked by CCh 6
alone, without affecting those evoked by CCh with PTH. 7
8
Potentiation of CCh-evoked Ca2+ release by β2-adrenoceptors is unaffected by loss of 9
cholesterol 10
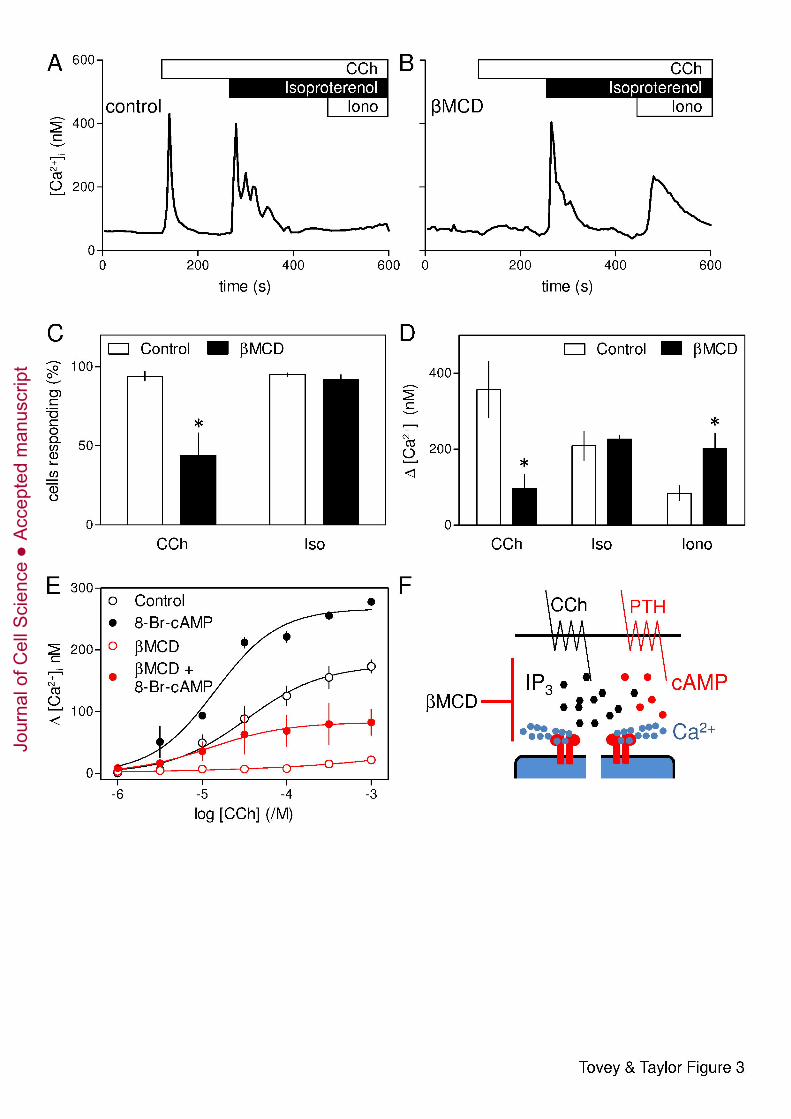
Endogenous β2-adrenoceptors in HEK 293 cells stimulate AC and thereby potentiate CCh-11
evoked Ca2+ release (Supplementary Fig. S1A). The response to β2-adrenoceptors is larger in 12
the parental HEK 293 cells; we therefore used these cells to examine responses to 13
isoproterenol, a selective agonist of β-adrenoceptors. In populations of these cells, βMCD 14
almost abolished the Ca2+ signals evoked by CCh (Supplementary Fig. S3A) without 15
affecting the amplitude or sensitivity of the subsequent responses to isoproterenol 16
(Supplementary Fig. S3B). In measurements of single cells, CCh (1 mM) caused a transient 17
increase in [Ca2+]i in 94 ± 3 % of cells, and subsequent addition of isoproterenol (1 µM) 18
caused further Ca2+ release from 95 ± 1 % of cells (Fig. 3A-C). As with HEK-PR1 cells, pre-19
treatment with βMCD reduced the number of cells responding to CCh (Fig. 3C), and in those 20
cells that responded the amplitude of the increase in [Ca2+]i was significantly reduced (Fig. 21
3D). However, the Ca2+ signals evoked by addition of isoproterenol after CCh were 22
unaffected by loss of cholesterol: 92 ± 3 % of cells responded and the amplitude of the 23
increase in [Ca2+]i was similar with (209 ± 38 nM) or without βMCD-treatment (227 ± 9 nM) 24
(Fig. 3C and D). Just as with PTH, therefore, many cells in which βMCD-treatment abolished 25
responses to CCh alone responded normally to stimulation with CCh and isoproterenol. 26
Furthermore, the residual Ca2+ content of the intracellular stores after stimulation with CCh 27
and isoproterenol was significantly larger in cells that had been depleted of cholesterol (Fig. 28
3D). 29
Potentiation of CCh-evoked Ca2+ signals by PTH and β2-adrenoceptors depends on their 30
ability to deliver cAMP locally at high concentrations to associated IP3R (Fig. 1A) (Tovey et 31
al., 2008), but the effects are mimicked by a uniformly high concentration of 8-Br-cAMP 32
(Supplementary Fig. S1B). As with PTH and isoproterenol, under conditions where βMCD 33
Jour
nal o
f Cel
l Sci
ence
Acc
epte
d m
anus
crip
t
7
almost abolished responses to CCh alone, 8-Br-cAMP still potentiated CCh-evoked increases 1
in [Ca2+]i (Fig. 3E). These results demonstrate that whether cAMP is delivered focally or 2
globally, it effectively allows CCh to evoke Ca2+ release under conditions where CCh alone 3
is ineffective. 4
We conclude that loss of cholesterol massively attenuates Ca2+ signals evoked by CCh 5
without affecting the potentiated signals evoked by CCh in combination with 8-Br-cAMP or 6
stimulation of AC by endogenous β2-adrenoceptors or heterologously expressed PTH 7
receptors (Fig. 3F). There is, therefore, a surprising independence of the Ca2+ release evoked 8
by IP3 in response to CCh alone or CCh with cAMP that does not require spatially organized 9
cAMP signals. 10
11
Cholesterol-depletion affects neither CCh-evoked IP3 formation nor the sensitivity of 12
IP3 receptors 13
Maximal activation of endogenous M3R in HEK cells generates insufficient IP3 to directly 14
release all IP3-sensitive Ca2+ stores (Tovey et al., 2008) (Fig. 2 and 3). This is consistent with 15
the EC50 for CCh-evoked Ca2+-release and the KD of CCh binding to M3R (Burford et al., 16
1995) being similar. The lack of ‘spare receptors’ is an experimental advantage in that it 17
allows use of saturating concentrations of CCh to evoke submaximal Ca2+ signals similar to 18
those evoked by physiological stimuli, but it requires sensitive methods to resolve CCh-19
stimulated IP3 formation. We used a FRET-based IP3-biosensor to allow real-time recording 20
of IP3 levels in CCh-stimulated HEK-PR1 cells (see Materials and methods, and 21
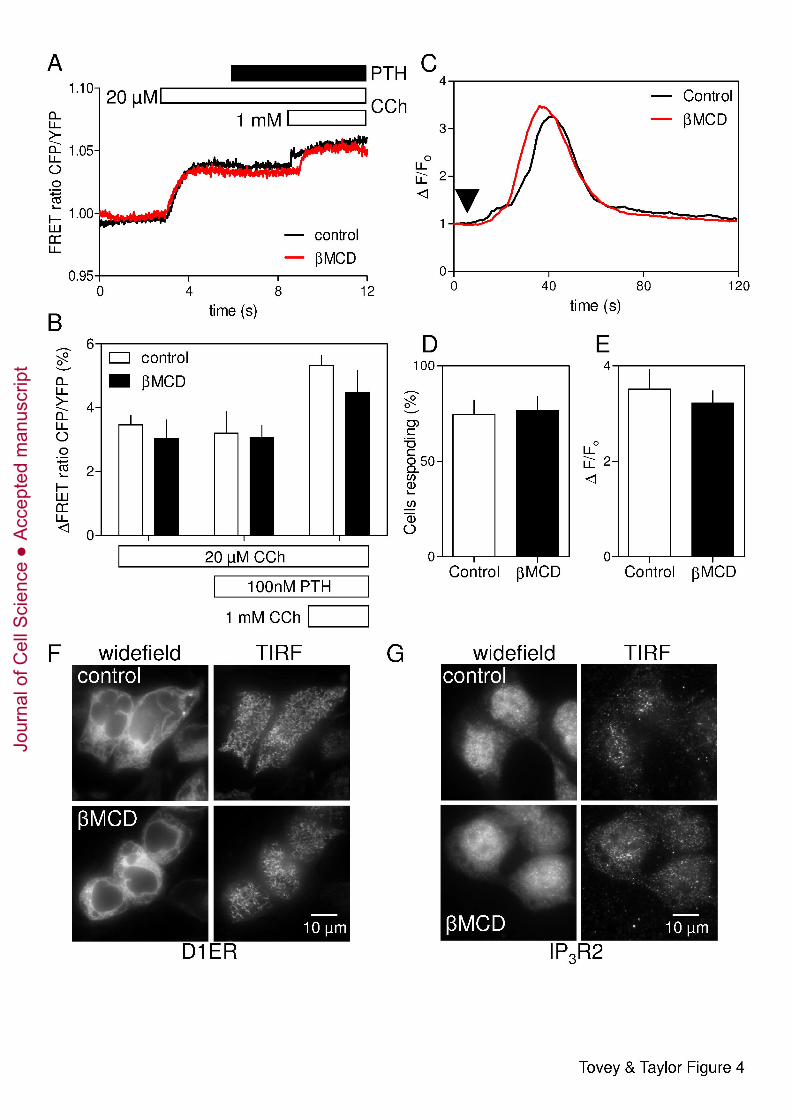
Supplementary Fig. S4). Results shown in Fig. 4A show that CCh (20 µM) evoked a rapid 22
and sustained increase in cytosolic IP3 concentration that was unaffected by subsequent 23
addition of PTH (100 nM), but increased further when the CCh concentration was increased 24
(1 mM). This confirms that PTH does not affect the intracellular concentration of IP3 (Short 25
and Taylor, 2000). Treatment with βMCD had no effect on the IP3 signals evoked by CCh 26
alone or CCh with PTH (Fig. 4A and B). 27
We used photolysis of ciIP3 non-disruptively loaded into cells as ciIP3/PM (Dakin and Li, 28
2007) to assess the effects of βMCD on the Ca2+ signals evoked by activation of IP3R 29
directly. Photolysis of ciIP3 in HEK-PR1 cells caused transient increases in [Ca2+]i (Fig. 4C). 30
The amplitudes of these Ca2+ signals varied between cells (Supplementary Fig. S5), perhaps 31
reflecting differences in loading and de-esterification of ciIP3/PM. However, in a large 32
sample (n > 400 cells), the response to iIP3 was unaffected by treatment with βMCD (Fig. 33
Jour
nal o
f Cel
l Sci
ence
Acc
epte
d m
anus
crip
t
8
4C-E). Neither the fraction of cells responding to photolysis of ciIP3 (75 ± 7 % and 77 ± 7 % 1
for control and βMCD-treated cells, respectively) nor the average amplitude of the increase in 2
fluo-4 fluorescence (ΔF/Fo, 3.52 ± 0.40 and 3.22 ± 0.26) was affected by βMCD. 3
Treatment with βMCD caused HEK-PR1 cells to become slightly more rounded (Fig. 1C 4
and 4F), but there was no obvious redistribution of the ER and it remained associated with 5
the plasma membrane (Fig. 4F). Immunostaining for each of the three IP3R subtypes 6
confirmed that their distributions, whether assessed by widefield microscopy or total internal 7
reflection fluorescence microscopy (TIRFM), were also unaffected by cholesterol depletion 8
(Fig. 4G and Supplementary Fig. S6). 9
We conclude that selective inhibition of CCh-evoked Ca2+ release by cholesterol depletion 10
occurs under conditions where CCh-evoked increases in cytosolic IP3 are unaffected (Fig. 11
4B), intracellular Ca2+ stores are intact (Fig. 2H), IP3R respond normally to IP3 (Fig. 4C-E) 12
and there are no obvious changes in the distribution of the ER (Fig. 4F) or IP3Rs (Fig. 4G and 13
Supplementary Fig. S6). This suggests that for cells stimulated with CCh alone cholesterol 14
depletion disrupts effective delivery of IP3 to IP3R, yet it has no effect on IP3 delivery to IP3R 15
that respond in the presence of either cAMP or 8-Br-cAMP. 16
17
CCh mobilizes Ca2+ from different stores in the presence of PTH 18
The ability of CCh with PTH to evoke Ca2+ release when responses to CCh alone are almost 19
abolished by cholesterol depletion is unexpected because PTH increases [Ca2+]i only when 20
paired with a stimulus, like CCh, that stimulates IP3 production (Fig. 1B) (Tovey et al., 2008). 21
How might loss of cholesterol disrupt delivery of IP3 to IP3R when CCh alone is the stimulus 22
without affecting IP3 delivery when CCh is combined with activation of receptors that 23
stimulate AC? The effect cannot simply result from sensitization of IP3R by cAMP 24
counteracting inhibition of M3R coupling to PLC because there was no detectable inhibition 25
of IP3 production (Fig. 4A), and inhibition of PLC with U73122 similarly inhibited responses 26
to CCh alone or CCh with PTH (Supplementary Fig. S7). In most of our experiments, where 27
cells were first stimulated with CCh before addition of PTH, there was more Ca2+ in the 28
intracellular stores at the time of PTH addition for cells treated with βMCD (Fig. 2H and 3D). 29
We had therefore to consider whether the lack of effect of βMCD on responses to CCh with 30
PTH might result from a fortuitous combination of a larger intracellular Ca2+ pool together 31
with PTH, via cAMP, increasing the sensitivity of IP3R (Tovey et al., 2008). That explanation 32
is unlikely because responses to every concentration of PTH were insensitive to βMCD (Fig. 33
Jour
nal o
f Cel
l Sci
ence
Acc
epte
d m
anus
crip
t
9
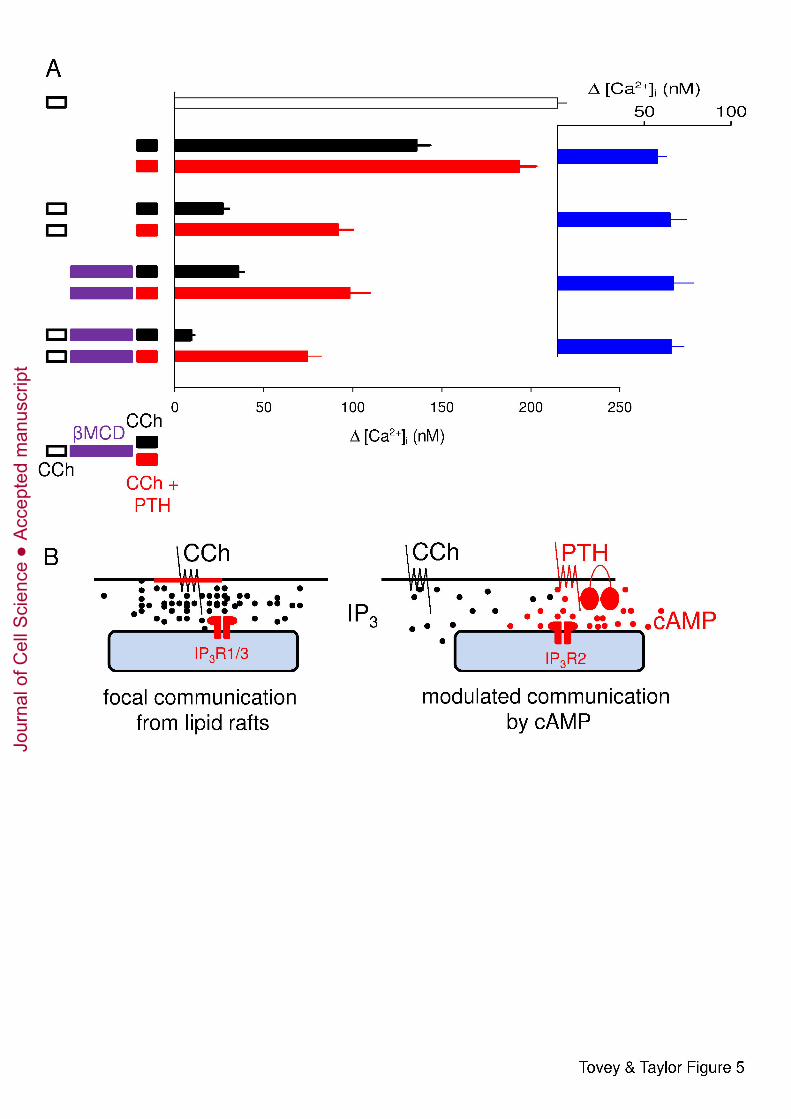
2D). We nevertheless assessed the proposal directly using a protocol that allowed the CCh-1
sensitive Ca2+ stores to be depleted before treatment with βMCD and then stimulation with 2
CCh and PTH. 3
Cells were first stimulated with CCh in nominally Ca2+-free HBS to deplete the stores that 4
respond to CCh alone. They were then rapidly depleted of cholesterol by incubation with 5
βMCD (2 % w/v, 10 min, 37°C, Supplementary Fig. S2) and then the effects of PTH with 6
CCh on [Ca2+]i were assessed. The results demonstrate that prior stimulation with CCh or 7
βMCD massively attenuated the Ca2+ signals evoked by subsequent addition of CCh, and 8
combining the treatments almost abolished the response to CCh (Fig. 5A, black). However, 9
the increase in [Ca2+]i evoked by CCh with PTH was entirely unaffected by any of the 10
treatments. Prior depletion of the CCh-sensitive Ca2+ stores, cholesterol depletion, or both 11
together had no effect on the ability of PTH to potentiate the increase in [Ca2+]i evoked by 12
CCh (Fig. 5A, blue). These results demonstrate that the Ca2+ stores released by CCh alone 13
and those released by CCh combined with PTH are functionally independent (Fig. 5B). We 14
conclude that M3R communicate with different IP3R in different Ca2+ stores when cells are 15
activated by CCh alone or by CCh with stimuli that increase cAMP. Cholesterol depletion 16
distinguishes these two pathways, and although cAMP is delivered focally to IP3R when its 17
production is stimulated by PTH (Tovey et al., 2008) globally applied 8-Br-cAMP has the 18
same effect (Fig. 3E and Supplementary Fig. S1B). The two pathways from M3R to IP3R are 19
not, therefore, dependent on local delivery of cAMP, they must differ in how they deliver IP3 20
to IP3R. 21
22
Discussion 23
Functionally distinct IP3-sensitive Ca2+ stores respond independently to CCh alone or to CCh 24
delivered with stimuli, like PTH, that activate AC (Fig. 5B). Cholesterol depletion almost 25
abolishes responses to CCh (Fig. 1) without affecting Ca2+ signals evoked by CCh with PTH 26
(Fig. 2), isoproterenol or 8-Br-cAMP (Fig. 3). Responses to PTH with CCh are unchanged 27
despite there being more Ca2+ within the intracellular stores after cholesterol depletion (Fig. 28
2), and they are unaffected by depletion of the Ca2+ stores that respond to CCh alone (Fig. 29
5A). These results establish that even when M3R are maximally activated, a population of 30
M3R stimulates Ca2+ release via IP3R from a store that is unaffected by cAMP or 8-Br-cAMP. 31
Because cAMP increases the sensitivity of all IP3R subtypes to IP3 (Tovey et al., 2010), we 32
conclude that the IP3 concentration to which these CCh-regulated IP3Rs are locally exposed 33
must be sufficient to cause their maximal activation. Evidence that βMCD massively 34
Jour
nal o
f Cel
l Sci
ence
Acc
epte
d m
anus
crip
t
10
attenuates CCh-evoked Ca2+ signals (Fig. 1-3, 5A, Supplementary Fig. S2, S3 and S7) 1
without affecting IP3 formation (Fig. 4) is consistent with such a spatially organized delivery 2
of IP3 to IP3R that is disrupted by cholesterol depletion (Fig. 5B, left). Responses to CCh 3
alone are attenuated by loss of IP3R1, but not of IP3R2 (Tovey et al., 2008), suggesting that 4
these locally activated IP3R are likely to be IP3R1 (or IP3R3). Depleting cells, probably the 5
plasma membrane (Fig. 1C), of cholesterol, disrupts communication between these M3R and 6
IP3R (Fig. 1). Lipid rafts are enriched in M3R, Gαq and PLCβ, they associate with IP3R, and 7
in many cells disrupting lipid rafts inhibits M3R-evoked Ca2+ signals (Gosens et al., 2007; 8
Lockwich et al., 2000). We propose that M3R within lipid rafts locally deliver saturating 9
concentrations of IP3 to closely associated IP3R (Fig. 5B, left). The concentration-dependent 10
effects of CCh must then come largely from all-or-nothing recruitment of these IP3R 11
junctions rather than from graded recruitment of IP3R within a junction. The graded CCh 12
signal is transduced into a digital recruitment of IP3R junctions. Cholesterol depletion 13
disrupts lipid rafts and thereby the interactions between M3R and IP3R that facilitate focal 14
delivery of IP3, so that diffusion and degradation of IP3 rapidly reduce its concentration to 15
below the threshold for IP3R activation, thereby abolishing the CCh-evoked Ca2+ signals (Fig. 16
5B, left). 17
A second population of M3R is unaffected by cholesterol depletion and less intimately 18
associated with IP3R. Activation of these M3R provides insufficient IP3 to activate IP3R 19
directly, but these IP3R respond when they are co-stimulated with cAMP (Fig. 5B, right). 20
Previous work showed that loss of IP3R2 attenuated Ca2+ signals evoked by CCh and PTH 21
without affecting responses to CCh alone (Tovey et al., 2008). This suggests that IP3R2 22
populate the Ca2+ store from which CCh evokes Ca2+ release only in the presence of cAMP 23
(Fig. 5B, right). 24
We showed earlier that activation of M3R and P2Y receptors in single HEK cells evokes 25
Ca2+ release from functionally distinct IP3-sensitive stores (Short et al., 2000), suggesting that 26
IP3 can be locally delivered to IP3R. HEK cells are well-suited to addressing this feature 27
because even maximally activated M3R generate insufficient IP3 to release Ca2+ from all IP3-28
sensitive stores. Signalling from M3R to IP3R therefore remains focal even when M3R are 29
fully activated. In most cells with larger numbers of receptors, maximal activation is likely to 30
generate high concentrations of IP3 that flood the cytosol and obscure spatial organization. 31
HEK cells provide the experimental convenience of working with all M3R activated while 32
retaining physiologically relevant spatial organization. This experimental opportunity 33
allowed us to demonstrate that M3R in lipid rafts deliver IP3 at high local concentration to 34
Jour
nal o
f Cel
l Sci
ence
Acc
epte
d m
anus
crip
t
11
associated IP3R (Fig. 5B, left). Such digital communication is robust and analogous to the 1
digital signalling we proposed for cAMP delivery from AC6 to IP3R2 (Fig. 1A) (Tovey et al., 2
2008). M3R outside lipid rafts are less intimately associated with IP3R and their activation 3
fails to deliver enough IP3 to activate IP3R directly. Cyclic AMP, by sensitizing IP3R (Tovey 4
et al., 2008; Tovey et al., 2010), extends the range over which these M3R can signal, allowing 5
M3R that are otherwise ineffective to recruit additional IP3-sensitive Ca2+ stores. We 6
conclude that M3R can signal directly to IP3R via digital junctions or more loosely via IP3 7
diffusing over longer distances. The latter is ineffective unless cAMP tunes IP3R sensitivity, 8
effectively extending the range of action of IP3 produced in response to these otherwise 9
ineffective M3R. 10
11
Materials and methods 12
Materials 13
Cell culture media, Lipofectamine 2000, Alexa-488 conjugated secondary antibodies, fluo-14
4/AM, fura-2/AM and Ca2+ standard solutions for calibration of fura-2 fluorescence signals to 15
[Ca2+]i were from Life Technologies (Paisley, UK). Ionomycin and 8-bromo-cAMP (8-Br-16
cAMP) were from Merck Bioscience (Nottingham, UK). 1,2-bis(o-aminophenoxy)ethane- 17
N,N,N',N'-tetraacetic acid (BAPTA) was from Molekula (Gillingham, UK). U73122 was 18
from Tocris (Bristol, UK). Foetal bovine serum, carbamylcholine chloride (CCh), poly-L-19
lysine, β-methylcyclodextrin (βMCD), filipin and isoproterenol were from Sigma-Aldrich 20
(Poole, UK). G418 was from ForMedium (Hunstanton, UK). Cholesterol (plant-derived) was 21
from Avanti Polar Lipids Inc. (Alabaster, USA). A peptide comprising residues 1-34 of 22
human PTH (hereafter described as ‘PTH’) was from Bachem (St. Helens, UK). Cell-23
permeant caged iIP3 (ciIP3PM) was from Sichem (Bremen, Germany). Inositol 1,4,5-24
trisphosphate (IP3) was from Alexis Biochemicals (Nottingham, UK) and 3H-IP3 25
(681Gbq/mmol) was from Perkin Elmer (Cambridge, UK). Cell culture plastics and 96-well 26
assay plates were from Greiner (Stonehouse, UK). Imaging dishes (35-mm diameter with a 7-27
mm glass insert) were from MatTek Corporation (Ashland, USA) or PAA laboratories 28
(Yeovil, UK). VECTASHIELD mounting reagent was from Vector Laboratories 29
(Peterborough, UK). A plasmid encoding a Ca2+-indicator protein targeted to the ER lumen, 30
D1ER, was a gift from R. Tsien (San Diego, USA) (Palmer et al., 2004). It was used to 31
identify ER rather than to measure free [Ca2+]. An affinity-purified polyclonal antibody 32
against the C-terminal of IP3R1 has been described (Cardy et al., 1997). D. Yule (University 33
Jour
nal o
f Cel
l Sci
ence
Acc
epte
d m
anus
crip
t
12
of Rochester, USA) provided affinity-purified antibodies to the N- (residues 320-338) and C-1
terminals (residues 2686-2702) of IP3R2 (Betzenhauser et al., 2009; Betzenhauser et al., 2
2008). A monoclonal antibody against IP3R3 was from BD Transduction Laboratories 3
(Oxford, UK). A polyclonal anti-GFP antibody was from Abcam (Cambridge, UK). 4
5
Cell culture and transfection 6
HEK 293 and HEK 293 cells stably transfected with the human type 1 PTH receptor (HEK-7
PR1 cells) (Short and Taylor, 2000) were cultured at 37°C in Dulbecco’s modified Eagle’s 8
medium/Ham’s F12 with GlutaMAXTM-1, supplemented with foetal bovine serum (10 %) 9
and 800 µg/mL G418 (HEK-PR1 cells only) in a humidified atmosphere containing 95 % air 10
and 5 % CO2. Medium was replaced every third day, and cells were passaged when they 11
reached about 80 % confluence. For experiments with cell populations, cells were seeded into 12
96-well plates (~2 x10⁴ cells/well). For single-cell analyses, cells were seeded (1.2 x 10⁵ 13
cells/well) onto either 35-mm imaging dishes with a 7-mm glass insert or 22-mm round glass 14
coverslips, each pre-coated with 0.01 % poly-L-lysine. Cells were grown for a further 2-3 15
days before experiments or transfection. The latter used Lipofectamine 2000 according to the 16
manufacturer’s instructions with 1 µg DNA/well for cells in 35-mm imaging dishes. 17
18
Measurement of [Ca2+]i 19
Almost confluent cultures of HEK 293 or HEK-PR1 cells in 96-well plates were washed, 20
loaded with fluo-4/AM (2 µM), and [Ca2+]i was measured in populations of cells using a 21
FlexStation fluorescence plate-reader (MDS Analytical Devices, Wokingham, UK) (Tovey et 22
al., 2008). All experiments were performed at 20°C in HBS, nominally Ca2+-free HBS or 23
Ca2+-free HBS. HBS had the following composition: 135 mM NaCl, 5.9 mM KCl, 1.2 mM 24
MgCl2, 1.5 mM CaCl2, 11.6 mM Hepes, 11.5 mM glucose, pH 7.3; CaCl2 was omitted from 25
nominally Ca2+-free HBS; Ca2+-free HBS was supplemented with 10 mM BAPTA. Single-26
cell analyses of [Ca2+]i in HEK 293/HEK-PR1 cells loaded with fura-2/AM (2 µM) were 27
performed as previously reported (Tovey et al., 2003). Fluorescence ratios were calibrated, 28
after correction for background fluorescence, to [Ca2+]i by reference to Ca2+-calibration 29
solutions. 30
To allow photolysis of ciIP3, HEK-PR1 cells were first incubated at 20°C for 45 min in 31
HBS containing ci-IP3/PM (1 µM) (Dakin and Li, 2007; Smith and Parker, 2009) and then for 32
45 min with HBS containing fluo-4/AM (2 µM) and ci-IP3/PM (1 µM). After at least 60 min 33
Jour
nal o
f Cel
l Sci
ence
Acc
epte
d m
anus
crip
t
13
(during which any treatments used to deplete cholesterol were applied), cells were used for 1
single-cell imaging. Imaging dishes were mounted on the stage of an Olympus IX81 inverted 2
fluorescence microscope (60x TIRF objective, numerical aperture 1.45). Excitation light was 3
provided by a 488-nm diode-pumped solid-state laser (Olympus Digital Laser Systems, 4
Milton Keynes, UK) and emitted fluorescence (500-550 nm) was captured with an eMCCD 5
camera (Andor ixon 897, Andor, Belfast, UK). Two high-intensity flashes (~1 ms, 3000 µF, 6
300 V, ~170 J) from a JML-C2 xenon flash-lamp (Rapp OptoElectronic, Hamburg, 7
Germany) equipped with a 395-nm barrier filter were used to photolyze ciIP3. Photolysis of 8
ciIP3 releases a form of IP3 (iIP3) in which the 2- and 3-hydroxyl groups are protected by an 9
isopropylidene group. This does not prevent it from activating IP3R, but iIP3 is more resistant 10
than IP3 to degradation by endogenous enzymes (Dakin and Li, 2007). For these 11
measurements of [Ca2+]i using a non-ratiometric indicator (fluo-4), responses are reported as 12
F/Fo, where Fo is the average fluorescence intensity recorded from a defined region of interest 13
(ROI) in the 5 s immediately before flash photolysis, and F is the fluorescence intensity from 14
the same region after the flash. 15
16
Identification of endoplasmic reticulum and IP3 receptors 17
Total internal reflection fluorescence microscopy (TIRFM) using an Olympus IX81 inverted 18
microscope with a triple-line TIRF combiner and a 150x TIRF objective (numerical aperture 19
1.45) was used to visualize the ER in HEK-PR1 cells expressing D1ER (Palmer et al., 2004). 20
Fluorescence of EYFP was excited using a 488-nm diode-pumped solid-state laser, with 21
emitted fluorescence (500-550 nm) captured using an eMCCD camera (Andor ixon 897). 22
Widefield images of D1ER were obtained by excitation at 504 nm, with emission collected at 23
530-570 nm. 24
Endogenous IP3R were immunostained as described (Tovey et al., 2001), with all steps 25
performed at 20°C in phosphate-buffered saline (PBS) unless stated otherwise. Cells on 35-26
mm imaging dishes were washed, fixed with paraformaldehyde (4 % v/v in PBS) for 30 min, 27
washed again and permeabilized with Triton-X100 (0.2 % v/v in PBS, 10 min). Cells were 28
then incubated in blocking medium (3 % w/v bovine serum albumin in PBS) for 1 h, then 29
with primary antibody (1:100 in blocking medium) overnight at 4°C, washed (3 x 10 min), 30
incubated with Alexa-488 conjugated secondary antibody for 1 h (1:1000 in blocking 31
medium) and washed (3 x10 min). Immunofluorescence was imaged as described for D1ER. 32
Jour
nal o
f Cel
l Sci
ence
Acc
epte
d m
anus
crip
t
14
PBS had the following composition: 137 mM NaCl, 2.7 mM KCl, 10 mM Na2HPO4, 1.8 mM 1
KH2PO4, pH 7.4. 2
3
4
Measurement of IP3 5
Intracellular IP3 was measured using a FRET-based IP3-sensor derived from the IP3-binding 6
core (IBC) of IP3R1 tagged at its N- and C-termini with ECFP and EYFP, respectively, each 7
attached by a short linker (Supplementary Fig. S4A). The sequence encoding residues 224-8
604 of IP3R1 was PCR-amplified from a full-length rat IP3R1(S1+) sequence (GenBank: 9
GQ233032.1) using primers 1 and 2. The sequences of all primers are provided in 10
Supplementary Table S1. The fragment was cloned as a BamHI/XhoI fragment into the 11
pENTR1 vector (Gateway) to generate the construct pENTR1-IBC. The open reading frame 12
(ORF) of ECFP was PCR-amplified from the pECFP-ER vector (Clontech) using primers 3 13
and 4 and cloned as a BamHI/MluI fragment into pENTR1-IBC to generate the construct 14
pENTR1-ECFP-IBC. The ORF of EYFP was PCR-amplified from the pC1-EYFP vector 15
(Clontech) using primers 3 and 5, and cloned as an EcoRI/XhoI fragment into pENTR1-16
ECFP-IBC to generate the construct pENTR1-ECFP-IBC-EYFP. The latter was inserted into 17
the expression vector pcDNA3.2 (Gateway) to generate the IP3-sensor expression plasmid. 18
Properties of the IP3-sensor are shown in Supplementary Fig. S4. 19
Cells on 35-mm imaging dishes were transfected with the plasmid encoding the IP3-sensor 20
(1 µg/dish) using Lipofectamine 2000, and used 2 days later. An Olympus IX81 inverted 21
microscope equipped with a 60x TIRF objective (numerical aperture 1.45) and a 440/520 nm 22
dual band-pass dichroic mirror was used to record fluorescence using widefield excitation at 23
427 nm and simultaneous collection of CFP (455-485 nm) and YFP (520-550 nm) emissions 24
using an Olympus U-SIP split imaging TV port fitted with a 505-nm dichroic mirror 25
(Supplementary Fig. S4E). Split images were obtained at 1-s intervals using an eMCDD 26
camera (Andor ixon 897). CFP and YFP emissions were background corrected and a 27
normalised CFP/YFP ratio was calculated for each cell. IP3 binding causes an increase in 28
CFP/YFP ratio, indicative of decreased FRET (Supplementary Fig. S4D and E). 29
303H-IP3 binding and western blotting of the IP3-sensor 31
HEK cells transfected with the IP3-sensor in 6-well plates were washed, scraped into PBS 32
containing protease inhibitors (1 tablet/10 mL, Roche Diagnostics, Mannheim, Germany) and 33
centrifuged (650 xg, 2 min). The pellet was lyzed by two freeze-thaw cycles in liquid 34
Jour
nal o
f Cel
l Sci
ence
Acc
epte
d m
anus
crip
t
15
nitrogen, sonication (1 min) and passage through a syringe needle. After centrifugation 1
(12,000 xg, 5 min), the supernatant was used for western blotting or 3H-IP3 binding. For 2
blotting, proteins (50 µg) were loaded onto NuPAGE 4-12% Bis Tris gels (Life 3
Technologies) and blotted with an anti-GFP antibody (1:1000). Equilibrium-competition 4
binding assays were performed as described (Rossi et al., 2009). Briefly, incubations (500 5
µL) at 4°C were performed in 50 mM Tris, 1 mM EDTA, pH 8.3 with 3H-IP3 (0.75 nM) and 6
cell supernatant (150 µg protein). Reactions were terminated after 5 min by addition of 7
poly(ethylene glycol) 8000 (500 µL, 30 % w/v) and γ-globulin (30 µL, 25 mg/mL) and 8
centrifugation (20,000 xg, 5 min). Radioactivity was determined by liquid scintillation 9
counting. Non-specific binding was determined by addition of 1 µM IP3. 10
11
Cholesterol depletion, repletion and measurement 12
After loading with a Ca2+ indicator (and, where appropriate, ciIP3), cells were depleted of 13
intracellular cholesterol by incubation with βMCD (2 % w/v, ~15 mM) for either 10 min at 14
37°C or for up to 2 h at 20°C (Rodal et al., 1999; Sampson et al., 2004). After washing, cells 15
were used for experiments. Cholesterol was restored as a βMCD:cholesterol complex (10:1, 16
0.26 % w/v (~2 mM) βMCD:200 µM cholesterol) added to cells for 1 h at 37°C. Briefly, a 17
100 mM solution of cholesterol was prepared in methanol:chloroform (2:1) and complexes of 18
βMCD:cholesterol were formed by drop-wise addition of cholesterol to a continuously stirred 19
(~2 h) solution of 0.26 % w/v βMCD in HBS maintained at 80°C. 20
Free cholesterol was measured using filipin, a fluorescent antibiotic that binds to the free 21
3β-hydroxyl of cholesterol (McCabe and Berthiaume, 2001). Cells were fixed with 22
paraformaldehyde at 20°C (4 % w/v, 30 min), washed 3-times with PBS, and then with PBS 23
containing glycine (1.5 mg/mL, 10 min) to terminate fixation. Cells were stained with filipin 24
(50 µg/mL) in PBS containing foetal bovine serum (10 %) for 2 h at 20°C, washed with PBS 25
(3 x 10 min), and mounted (VECTASHIELD). Filipin staining was visualized using an 26
Olympus IX81 inverted fluorescence microscope with excitation at 380 nm and emission at 27
460-550 nm. Identical microscope and eMCCD camera settings were used to capture each 28
image. The method used to quantify filipin staining is described in the legend to Fig. 1C. 29
30
Analysis 31
Concentration-effect relationships for each experiment were individually fitted to Hill 32
equations using non-linear curve-fitting (GraphPad Prism, version 5) and the results obtained 33
Jour
nal o
f Cel
l Sci
ence
Acc
epte
d m
anus
crip
t
16
from each (pEC50, Hill coefficient h, maximal response) were pooled for statistical analysis 1
and presentation. Student’s t-test was used for statistical analyses. 2
3
4
Acknowledgements 5
We thank Dr Ana Rossi for production and initial characterization of the IP3-sensor, and 6
Roger Tsien and David Yule for gifts of the D1ER expression plasmid and antibodies to 7
IP3R2, respectively. Supported by the Wellcome Trust (085295) and Biotechnology and 8
Biological Sciences Research Council (BB/H009736/1). 9
10
Supplementary information is available online. 11
12
References 13
Berridge, M. J., Lipp, P. and Bootman, M. D. (2000). The versatility and universality of 14
calcium signalling. Nat. Rev. Mol. Cell Biol. 1, 11-21. 15
Betzenhauser, M. J., Fike, J. L., Wagner, L. E., 2nd and Yule, D. I. (2009). Protein kinase 16
A increases type-2 inositol 1,4,5-trisphosphate receptor activity by phosphorylation of 17
serine 937. J. Biol. Chem. 284, 25116-25125. 18
Betzenhauser, M. J., Wagner, L. E., 2nd, Iwai, M., Michikawa, T., Mikoshiba, K. and 19
Yule, D. I. (2008). ATP modulation of Ca2+ release by type-2 and type-3 InsP3R: 20
Differing ATP sensitivities and molecular determinants of action. J. Biol. Chem. 283, 21
21579-21587. 22
Burford, N. T., Tobin, A. B. and Nahorski, S. R. (1995). Differential coupling of m1, m2 23
and m3 muscarinic receptor subtypes to inositol 1,4,5-trisphosphate and adenosine 3',5'-24
cyclic monophosphate accumulation in Chinese hamster ovary cells. J. Pharmacol. Exp. 25
Ther. 274, 134-142. 26
Cardy, T. J. A., Traynor, D. and Taylor, C. W. (1997). Differential regulation of types 1 27
and 3 inositol trisphosphate receptors by cytosolic Ca2+. Biochem. J. 328, 785-793. 28
Dakin, K. and Li, W. H. (2007). Cell membrane permeable esters of D-myo-inositol 1,4,5-29
trisphosphate. Cell Calcium 42, 291-301. 30
Foskett, J. K., White, C., Cheung, K. H. and Mak, D. O. (2007). Inositol trisphosphate 31
receptor Ca2+ release channels. Physiol. Rev. 87, 593-658. 32
Gosens, R., Stelmack, G. L., Dueck, G., Mutawe, M. M., Hinton, M., McNeill, K. D., 33
Paulson, A., Dakshinamurti, S., Gerthoffer, W. T., Thliveris, J. A. et al. (2007). 34
Jour
nal o
f Cel
l Sci
ence
Acc
epte
d m
anus
crip
t
17
Caveolae facilitate muscarinic receptor-mediated intracellular Ca2+ mobilization and 1
contraction in airway smooth muscle. Am. J. Physiol. 293, L1406-L1418. 2
Head, B. P., Patel, H. H., Roth, D. M., Lai, N. C., Niesman, I. R., Farquhar, M. G. and 3
Insel, P. A. (2005). G-protein-couped receptor signaling components localize in both 4
sarcolemmal and intracellular caveolin-3-associated microdomains in adult cardiac 5
myocytes. J. Biol. Chem. 280, 31036-31044. 6
Isshiki, M. and Anderson, R. G. W. (1999). Calcium signal transduction from caveolae. 7
Cell Calcium 26, 201-208. 8
Kurian, N., Hall, C. J., Wilkinson, G. F., Sullivan, M., Tobin, A. B. and Willars, G. B. 9
(2009). Full and partial agonists of muscarinic M3 receptors reveal single and oscillatory 10
Ca2+ responses by β2-adrenoceptors. J. Pharmacol. Exp. Ther. 330, 502-512. 11
Lockwich, T. P., Liu, X., Singh, B. B., Jadlowiec, J., Weiland, S. and Ambudkar, I. S. 12
(2000). Assembly of Trp1 in a signaling complex associated with caveolin-scaffolding 13
lipid raft domains. J. Biol. Chem. 275, 11934-11942. 14
Luo, J., Busillo, J. M. and Benovic, J. L. (2008). M3 muscarinic acetylcholine receptor-15
mediated signaling is regulated by distinct mechanisms. Mol. Pharmacol. 74, 338-347. 16
Mannstadt, M., Juppner, H. and Gardella, T. J. (1999). Receptors for PTH and PTHrP: 17
their biological importance and functional properties. Am. J. Physiol. 277, F665-F675. 18
McCabe, J. B. and Berthiaume, L. G. (2001). N-terminal protein acylation confers 19
localization to cholesterol, sphingolipid-enriched membranes but not to lipid 20
rafts/caveolae. Mol. Biol. Cell 12, 3601-3017. 21
Nagata, J., Guerra, M. T., Shugrue, C. A., Gomes, D. A., Nagata, N. and Nathanson, M. 22
H. (2007). Lipid rafts establish calcium waves in hepatocytes. Gastroenterology 133, 256-23
267. 24
Offermanns, S., Iida-Klein, A., Segre, G. V. and Simon, M. I. (1996). Gαq family 25
members couple parathyroid hormone (PTH)/PTH-related peptide and calcitonin receptors 26
to phospholipase C in COS-7 cells. Mol. Endocrinol. 10, 566-574. 27
Ostrom, R. S. and Insel, P. A. (2004). The evolving role of lipid rafts and caveolae in G 28
protein-coupled receptor signaling: implications for molecular pharmacology. Br. J. 29
Pharmacol. 143, 235-245. 30
Ostrom, R. S., Liu, X., Head, B. P., Gregorian, C., Seasholtz, T. M. and Insel, P. A. 31
(2002). Localization of adenylyl cyclase isoforms and G protein-coupled receptors in 32
vascular smooth muscle cells: expression in caveolin-rich and noncaveolin domains. Mol. 33
Pharmacol. 62, 983-992. 34
Jour
nal o
f Cel
l Sci
ence
Acc
epte
d m
anus
crip
t
18
Palmer, A. E., Jin, C., Reed, J. C. and Tsien, R. Y. (2004). Bcl-2-mediated alterations in 1
endoplasmic reticulum Ca2+ analyzed with an improved genetically encoded fluorescent 2
sensor. Proc. Natl. Acad. Sci. USA 101, 17404-17409. 3
Rodal, S. K., Skretting, G., Garred, O., Vilhardt, F., van Deurs, B. and Sandvig, K. 4
(1999). Extraction of cholesterol with methyl-beta-cyclodextrin perturbs formation of 5
clathrin-coated endocytic vesicles. Mol. Biol. Cell 10, 961-974. 6
Rossi, A. M., Riley, A. M., Tovey, S. C., Rahman, T., Dellis, O., Taylor, E. J. A., 7
Veresov, V. G., Potter, B. V. L. and Taylor, C. W. (2009). Synthetic partial agonists 8
reveal key steps in IP3 receptor activation. Nat. Chem. Biol. 5, 631-639. 9
Sampson, L. J., Hayabuchi, Y., Standen, N. B. and Dart, C. (2004). Caveolae localize 10
protein kinase A signaling to arterial ATP-sensitive potassium channels. Circ. Res. 95, 11
1012-1018. 12
Schmidt, M., Evellin, S., Weernink, P. A. O., vom Dorp, F., Rehmann, H., Lomasney, J. 13
W. and Jakobs, K. H. (2001). A new phospholipase-C-calcium signalling pathway 14
mediated by cyclic AMP and a Rap GTPase. Nat. Cell Biol. 3, 1020-1024. 15
Schwindinger, W. F., Fredericks, J., Watkins, L., Robinson, H., Bathon, J. M., Pines, 16
M., Suva, L. J. and Levine, M. A. (1998). Coupling of the PTH/PTHrP receptor to 17
multiple G-proteins. Direct demonstration of receptor activation of Gs, Gq/11, and Gi(1) by 18
[α-32P]GTP-γ-azidoanilide photoaffinity labeling. Endocrine 8, 201-209. 19
Short, A. D. and Taylor, C. W. (2000). Parathyroid hormone controls the size of the 20
intracellular Ca2+ stores available to receptors linked to inositol trisphosphate formation. J. 21
Biol. Chem. 275, 1807-1813. 22
Short, A. D., Winston, G. P. and Taylor, C. W. (2000). Different receptors use inositol 23
trisphosphate to mobilize different intracellular Ca2+ pools. Biochem. J. 351, 683-686. 24
Simons, K. and Ikonen, E. (1997). Functional rafts in cell membranes. Nature 387, 569-572. 25
Simons, K. and Toomre, D. (2000). Lipid rafts and signal transduction. Nat. Rev. Mol. Cell 26
Biol. 1, 31-41. 27
Singleton, P. A. and Bourguignon, L. Y. (2004). CD44 interaction with ankyrin and IP3 28
receptor in lipid rafts promotes hyaluronan-mediated Ca2+ signaling leading to nitric oxide 29
production and endothelial cell adhesion and proliferation. Exp. Cell Res. 295, 102-118. 30
Smith, I. F. and Parker, I. (2009). Imaging the quantal substructure of single IP3R channel 31
activity during Ca2+ puffs in intact mammalian cells. Proc. Natl. Acad. Sci. USA 106, 32
6404-6409. 33
Jour
nal o
f Cel
l Sci
ence
Acc
epte
d m
anus
crip
t
19
Taylor, C. W. and Tovey, S. C. (2010). IP3 receptors: toward understanding their activation. 1
Cold Spring Harb. Persp. Biol. 2, a004010. 2
Taylor, C. W. and Tovey, S. C. (2012). From parathyroid hormone to cytosolic Ca2+ signals. 3
Biochem. Soc. Trans. 40, 147-152. 4
Tovey, S., Dedos, S. G., Taylor, E. J. A., Church, J. E. and Taylor, C. W. (2008). 5
Selective coupling of type 6 adenylyl cyclase with type 2 IP3 receptors mediates a direct 6
sensitization of IP3 receptors by cAMP. J. Cell Biol. 183, 297-311. 7
Tovey, S. C., De Smet, P., Lipp, P., Thomas, D., Young, K. W., Missiaen, L., De Smedt, 8
H., Parys, J., Berridge, M. J., Thuring, J. et al. (2001). Calcium puffs are generic InsP3-9
activated elementary calcium signals and are downregulated by prolonged hormonal 10
stimulation to inhibit cellular calcium responses. J. Cell Sci. 114, 3979-3989. 11
Tovey, S. C., Dedos, S. G., Rahman, T., Taylor, E. J. A., Pantazaka, E. and Taylor, C. 12
W. (2010). Regulation of inositol 1,4,5-trisphosphate receptors by cAMP independent of 13
cAMP-dependent protein kinase. J. Biol. Chem. 285, 12979-12989. 14
Tovey, S. C., Goraya, T. A. and Taylor, C. W. (2003). Parathyroid hormone increases the 15
sensitivity of inositol trisphosphate receptors by a mechanism that is independent of cyclic 16
AMP. Br. J. Pharmacol. 138, 81-90. 17
Wang, B., Ardura, J. A., Romero, G., Yang, Y., Hall, R. A. and Friedman, P. A. (2010). 18
Na/H exchanger regulatory factors control parathyroid hormone receptor signaling by 19
facilitating differential activation of Gα protein subunits. J. Biol. Chem. 285, 26976-20
26986. 21
Weerth, S. H., Holtzclaw, L. A. and Russell, J. T. (2007). Signaling proteins in raft-like 22
microdomains are essential for Ca2+ wave propagation in glial cells. Cell Calcium 41, 155-23
167. 24
Willoughby, D. and Cooper, D. M. (2007). Organization and Ca2+ regulation of adenylyl 25
cyclases in cAMP microdomains. Physiol. Rev. 87, 965-1010. 26
27
28
29
Jour
nal o
f Cel
l Sci
ence
Acc
epte
d m
anus
crip
t
20
1
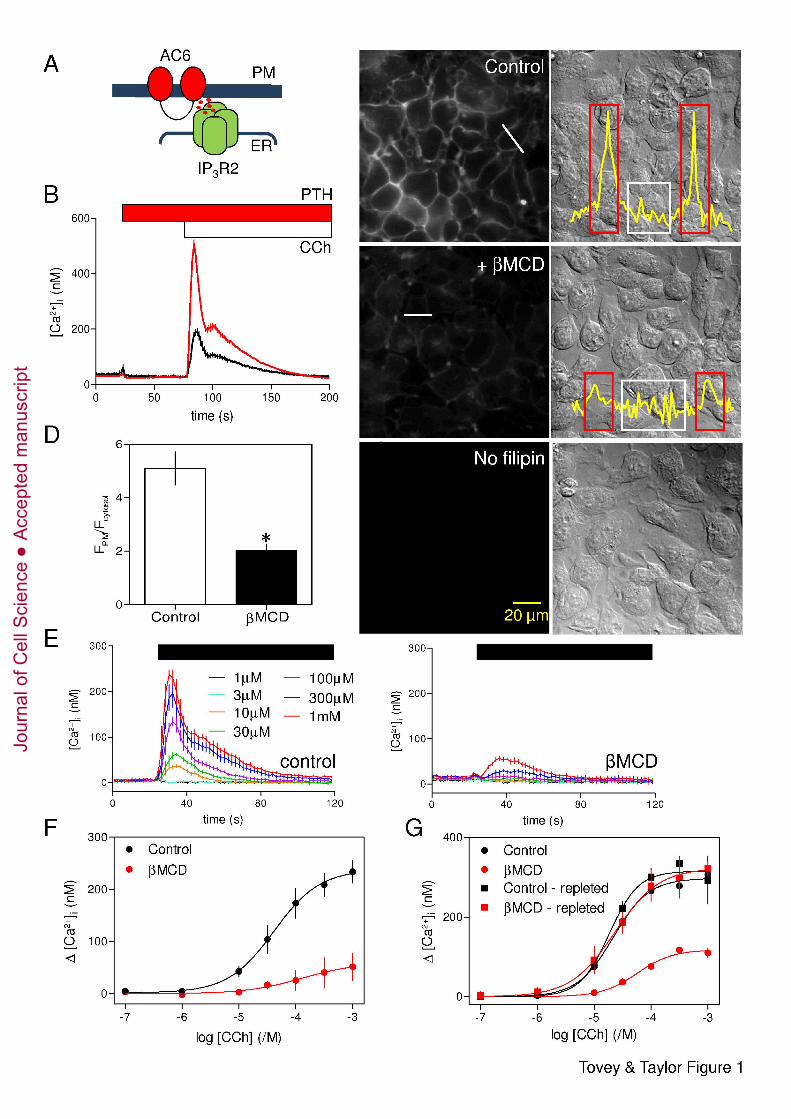
Fig. 1. Cholesterol depletion reversibly inhibits CCh-evoked Ca2+ release. (A) 2
Potentiation of CCh-evoked Ca2+ release by cAMP is mediated by a close association of 3
IP3R2 and AC6 that delivers high concentrations of cAMP directly to IP3R (Tovey et al., 4
2008). (B) Populations of HEK-PR1 cells in Ca2+-free HBS were stimulated with a maximal 5
concentration of CCh (1 mM) alone (black) or after addition of PTH (100 nM) (red). Results 6
show means ± SEM for 3-4 wells from a single experiment, each typical of at least 3 7
experiments. (C) Typical fields of cells showing filipin staining (left) or differential 8
interference contrast images (right) for control cells, cells treated with βMCD (2 %, 20°C), or 9
unstained control cells. Images are typical of at least 3 experiments. Scale bar applies to all 10
images. Free cholesterol levels in the plasma membrane were quantified by measuring 11
fluorescence intensities along lines drawn across cells. Profiles, corresponding to white lines 12
in panels, are shown in the overlaid traces. (D) From the fluorescence transects, regions of 13
interest (ROI) corresponding to the plasma membrane (red boxes in C) or cytosol (white 14
boxes) were identified and the average fluorescence intensities within each were calculated 15
(FPM and Fcytosol, respectively). The histogram shows the FPM/Fcytosol ratios from control cells 16
and cells treated with βMCD (2 %, 20°C). Results are means ± SEM from 3 experiments with 17
10 cells analysed in each field. *P < 0.05. Similar analysis of the effects of treatment with 18
βMCD at 37°C is shown in Supplementary Fig. S2. (E) Populations of HEK-PR1 cells in 19
Ca2+-free HBS were stimulated with the indicated concentrations of CCh (left) and after pre-20
treatment with βMCD at 20°C (right). Results are means ± SEM from a single experiment 21
with 3 replicates for each condition. (F) Summary results show concentration-dependent 22
effects of CCh on Ca2+ release with and without βMCD-treatment. (G) Concentration-23
dependent effects of CCh on Ca2+ signals under the conditions indicated. Cholesterol 24
depletion with βMCD and repletion with βMCD:cholesterol were performed at 37°C and 25
before loading cells with fluo-4/AM. Results (F and G) are means ± SEM from 3 26
experiments, each with matched control and treated cells. 27
28
29
Jour
nal o
f Cel
l Sci
ence
Acc
epte
d m
anus
crip
t
21
1
Fig. 2. Potentiation of CCh-evoked Ca2+ release by PTH is unaffected by loss of 2
cholesterol. (A) In Ca2+-free HBS, CCh (1 mM) evoked a transient release of Ca2+ from the 3
intracellular stores of populations of HEK-PR1 cells. Addition of the indicated concentrations 4
of PTH in the continued presence of CCh then evoked a further concentration-dependent Ca2+ 5
release. (B) Similar experiments in cells pre-treated with βMCD (at 20°C) inhibited the initial 6
response to CCh without significantly affecting the subsequent response to PTH. Results (A 7
and B) are means ± SEM from a single experiment with 3 replicates for each condition. The 8
code applies to both panels. (C and D) Summary results (means ± SEM from 3 experiments) 9
show peak increases in [Ca2+]i evoked by CCh (1 mM) (C) and the concentration-dependent 10
effects of a subsequent addition of PTH on [Ca2+]i (D) in control and βMCD-treated cells. (E 11
and F) Typical response of a single HEK-PR1 cell in Ca2+-free HBS to CCh (1 mM) followed 12
by PTH (100 nM) and then (to release any Ca2+ remaining within intracellular stores), 13
ionomycin (Iono, 1 µM). Results are shown for control cells (E) or after pre-treatment with 14
βMCD (at 20°C) (F). (G) Summary results show the percentage of all cells that responded to 15
CCh, or CCh with PTH. (H) Summary results from experiments similar to those shown in E 16
and F show the Ca2+ signals evoked by addition of CCh, or PTH after CCh. Ionomycin was 17
added after stimulation with CCh and PTH to define the residual Ca2+ content of the 18
intracellular stores. In parallel experiments, the initial Ca2+ content of the stores was defined 19
by addition of ionomycin to cells that had not been stimulated (naive, red). Results (G and H) 20
are means ± SEM from at least 3 coverslips, with > 50 cells analyzed for each. *P < 0.05. 21
22
Fig. 3. Cholesterol depletion attenuates CCh-evoked Ca2+ signals without affecting their 23
potentiation by β-adrenoceptors. (A and B) Typical responses from a single HEK 293 cell 24
with (B) or without (A) treatment with βMCD (at 20°C) and then stimulated in Ca2+-free 25
HBS with CCh (1 mM), then isoproterenol (1 µM) and finally with ionomycin (Iono, 1 µM) 26
to release any Ca2+ remaining within the intracellular stores. (C and D) Summary results 27
show the percentage of cells responding to CCh alone, or to CCh with isoproterenol (C), and 28
the amplitude of the peak increase in [Ca2+]i evoked by each stimulus (D) for control and 29
βMCD-treated cells. Results are means ± SEM from n ≥ 3 coverslips, with >50 cells analyzed 30
from each. *P < 0.05. (E) Populations of HEK-PR1 cells were stimulated with the indicated 31
concentrations of CCh alone or with 8-Br-cAMP (10 mM, 20 min) with or without βMCD 32
treatment (at 20°C). Results are means ± SEM from 3 experiments. (F) Depletion of 33
Jour
nal o
f Cel
l Sci
ence
Acc
epte
d m
anus
crip
t
22
cholesterol selectively inhibits Ca2+ release evoked by CCh alone without affecting Ca2+ 1
release by CCh with PTH (or isoproterenol). 2
3
Fig. 4. Cholesterol depletion has no effect on IP3 formation, IP3 receptor sensitivity or 4
ER morphology. (A) Normalized changes in the CFP/YFP FRET ratio of an IP3-sensor (see 5
Materials and methods, and Supplementary Fig. S4) in HEK-PR1 cells stimulated with CCh 6
(20 µM), then PTH (100 nM) and finally a maximal concentration of CCh (1 mM). Traces 7
show changes in FRET ratio for single cells, each representative of 6 experiments, with or 8
without βMCD treatment. (B) Summary (means ± SEM) show cumulative changes in FRET 9
ratio for 15 control cells and 11 βMCD-treated cells from 6 independent experiments. (C) 10
Ca2+ release evoked by photolysis of ciIP3 (arrow) in HEK-PR1 cells with and without pre-11
treatment with βMCD (2 % w/v, 20°C). Each trace shows the average change in fluorescence 12
(ΔF/Fo) for ≥ 20 cells from a single field. Examples of responses from individual cells are 13
shown in Supplementary Fig. S5. (D and E) Summary results show the fraction of cells 14
responding to iIP3 (D) and average amplitude (ΔF/Fo) of the Ca2+ transient in cells that 15
responded (E). Results are means ± SEM for n ≥ 3 coverslips, with 5 fields per coverslip 16
(~150 cells/coverslip). (F and G) Distribution of the ER marker, D1ER (F) and IP3R2 (G) in 17
control and βMCD-treated HEK-PR1cells. Images show the distributions in widefield and in 18
the region immediately beneath the plasma membrane using TIRFM. Images are 19
representative of at least 3 experiments. Supplementary Fig. S6 shows similar analyses of 20
IP3R1 and IP3R3. 21
22
23
Jour
nal o
f Cel
l Sci
ence
Acc
epte
d m
anus
crip
t
23
1
Fig. 5. CCh and CCh with PTH stimulate Ca2+ release from functionally distinct stores. 2
(A) Cells were stimulated with CCh (1 mM, 2 min), βMCD (2% w/v, 10 min, 37°C) and then 3
stimulated for 2 min with CCh alone (1 mM) or combined with PTH (100 nM) as indicated. 4
All treatments were carried out in nominally Ca2+-free HBS. Results show the peak increase 5
in [Ca2+]i (means ± SEM from 8 experiments) evoked by the final stimulus. Inset (blue) 6
shows the difference between paired observations for cells stimulated with CCh alone or CCh 7
with PTH. (B) Focal and modulated communication between M3R and IP3R. Different Ca2+ 8
stores respond to CCh alone (left) or CCh with PTH (right). We suggest that activation of 9
M3R within lipid rafts delivers a saturating concentration of IP3 to closely associated IP3R 10
(probably IP3R1 or IP3R3) allowing their robust ‘all-or-nothing’ activation. Graded responses 11
to increasing concentrations of CCh result from recruitment of these digital junctions, rather 12
than graded activity within each junction. Because each junction is either inactive or 13
maximally activated, sensitization of IP3R within them by cAMP or 8-Br-cAMP has no effect 14
on IP3-evoked Ca2+ release. M3R outside lipid rafts are less intimately associated with IP3R. 15
Stimulation of these M3R provides insufficient IP3 to activate the more distant IP3R directly. 16
Cyclic AMP focally directed from AC6 to IP3R2 in response to PTH (Tovey et al., 2008), or 17
8-Br-cAMP delivered globally, increase IP3R sensitivity and thereby brings these IP3R within 18
the sensitivity range of the IP3 provided by more distant M3R. Modulation of IP3R by cAMP 19
extends the effective signalling range of PLC signalling pathways, allowing M3R that were 20
ineffective in the absence of cAMP to trigger Ca2+ release from a distinct store in the 21
presence of cAMP. 22
23
Jour
nal o
f Cel
l Sci
ence
Acc
epte
d m
anus
crip
t
24
1
SUPPLEMENTARY MATERIALS 2
3
Cyclic AMP directs IP3-evoked Ca2+ signalling to different intracellular Ca2+ stores 4
Stephen C. Tovey and Colin W. Taylor 5
Department of Pharmacology, University of Cambridge, Tennis Court Road, Cambridge, 6
CB2 1PD, United Kingdom 7
8
9
Supplementary Fig. S1. Potentiation of CCh-evoked Ca2+ signals by endogenous β2-10
adrenoceptors in HEK cells or 8-Br-cAMP in HEK-PR1 cells. (A and B) Experiments 11
similar to those shown in Fig. 1B, show the Ca2+ signals evoked by CCh alone (black) or 12
after addition of isoproterenol (A, 1 µM, red) or pre-incubation with 8-Br-cAMP (B, 10 mM, 13
20 min, red). Results show means ± SEM for 3-4 wells from a single experiment, each typical 14
of at least 3 similar experiments. 15
16
Supplementary Fig. S2. Brief treatment with βMCD at 37°C depletes the plasma 17
membrane of cholesterol and attenuates CCh-evoked Ca2+ signals. (A-C) The analysis is 18
similar to that shown in Fig. 1C-G, but with a briefer treatment (10 min) with βMCD (2 %, 19
w/v) at 37°C. Typical fields of cells show filipin staining (upper panels) or differential 20
interference contrast images (lower panels) for control cells (i), cells treated with βMCD (ii), 21
or unstained control cells (iii) (A). Images are typical of at least 3 experiments. The scale bar 22
applies to all images. Free cholesterol levels in the plasma membrane were quantified by 23
measuring filipin fluorescence intensities along lines drawn across cells. (B) Typical 24
fluorescence profiles, corresponding to the lines shown in Ai (i) and Aii (ii). (C) From the 25
fluorescence transect, ROI corresponding to the plasma membrane (red boxes in B) or cytosol 26
(black in B) were identified and the average fluorescence intensities within each were 27
calculated (FPM and Fcytosol, respectively). The histogram shows the FPM/Fcytosol ratios from 28
control cells and after treatment with βMCD (2 %, 10 min, 37°C). Results are means ± SEM 29
from 3 experiments with 10 cells analysed in each field. *P < 0.05. (D) Effects of βMCD (2 30
%, 10 min, 37°C) on CCh-evoked Ca2+ signals. Results are means ± SEM from 3 31
experiments, each with matched control and treated cells. 32
33
Jour
nal o
f Cel
l Sci
ence
Acc
epte
d m
anus
crip
t
25
Supplementary Fig. S3. Loss of cholesterol attenuates Ca2+ signals evoked by CCh alone, 1
but not those evoked by isoproterenol with CCh. (A, B) Ca2+ signals were recorded during 2
sequential stimulation with CCh and then isoproterenol from populations of control HEK 3
cells (black) or after treatment with βMCD (at 20°C, red). Results (means ± SEM from 3 4
experiments) show concentration-dependent effects of CCh (A) and concentration-dependent 5
effects of isoproterenol for cells stimulated with 1 mM CCh (B). 6
7
Supplementary Fig. S4. FRET sensor for IP3. (A) Structure of the IP3-sensor used. The 8
fluorescent proteins (ECFP and EYFP are linked by the short sequences shown to the IP3-9
binding core (IBC). (B) Supernatants from HEK cell lyzates transiently expressing the IP3-10
sensor were immunoblotted (50 µg protein/lane) with an anti-GFP antibody. The only band 11
detected has the size expected of the full-length IP3-sensor (∼96 kDa). Molecular weight 12
makers are shown on the left. (C) Total and non-specific (NS) 3H-IP3 binding to supernatants 13
(150 µg total protein) from HEK cells transiently expressing the IP3-sensor (red) or 14
untransfected HEK cells (black). Results show means ± SEM of three replicates. (D) Images 15
show the uniform cytosolic distribution of the IP3-sensor in two typical HEK-PR1 cells. The 16
excitation and emission wavelengths used are shown alongside the images. Insets illustrate 17
the wavelengths used to collect each image. Scale bar applies to all images. (E) Traces, each 18
typical of at least 4 experiments, show CFP and YFP emission and the resultant change in 19
FRET in a HEK-PR1 cell stimulated with CCh (1 mM) and then PTH (100 nM). RFU, 20
relative fluorescent units. The fluorescence of YFP is pH-sensitive, but we have confirmed 21
that CCh does not affect cytosolic pH in HEK-PR1 cells (Lopez Sanjurjo, C. I., Tovey, S. 22
C., Prole, D. L. and Taylor, C.W. (2013). Lysosomes shape IP3-evoked Ca2+ signals by 23
selectively sequestering Ca2+ released from the endoplasmic reticulum. J. Cell. Sci. In press). 24
25
Supplementary Fig. S5. Responses to photolysis of ciIP3. Typical traces from single HEK-26
PR1 cells showing responses to photorelease of ciIP3 (at arrow). Each trace shows the average 27
change in fluorescence (ΔF/Fo) for a single HEK-PR1 cell. 28
29
Supplementary Fig. S6. Cholesterol depletion does not affect the subcellular distribution 30
of IP3R. (A and B) Immunostaining for IP3R1 (A) or IP3R3 (B) in control and βMCD-treated 31
HEK-PR1 cells. Images show fluorescence detected in widefield and in the region 32
immediately beneath the plasma membrane using TIRFM. The scale bar applies to all 33
Jour
nal o
f Cel
l Sci
ence
Acc
epte
d m
anus
crip
t
26
images. Images are representative of at least 3 experiments. Similar analyses of D1ER and 1
IP3R2 are shown in Fig. 4F and G. 2
3
Supplementary Fig. S7. Inhibition of PLC with U73122 does not mimic cholesterol 4
depletion. (A) Concentration-dependent effects of U73122 (added 20 min before stimulation) 5
on Ca2+ release evoked by CCh alone (1 mM) or CCh with PTH (100 nM). Results are means 6
± SEM from 3 experiments. (B) Typical traces from cells stimulated with CCh and then CCh 7
with PTH after treatment with the indicated concentrations of U73122 show that no effective 8
concentration of U73122 mimics the ability of βMCD to abolish responses to CCh alone 9
without affecting responses to PTH with CCh. Traces show means ± SEM for 3-4 wells from 10
a single experiment, each typical of at least 3 similar experiments. 11
Jour
nal o
f Cel
l Sci
ence
Acc
epte
d m
anus
crip
t
Jour
nal o
f Cel
l Sci
ence
Acc
epte
d m
anus
crip
t
Jour
nal o
f Cel
l Sci
ence
Acc
epte
d m
anus
crip
t
Jour
nal o
f Cel
l Sci
ence
Acc
epte
d m
anus
crip
t
Jour
nal o
f Cel
l Sci
ence
Acc
epte
d m
anus
crip
t
Jour
nal o
f Cel
l Sci
ence
Acc
epte
d m
anus
crip
t