Embed Size (px)
Citation preview

JOURNAL OF BUSINESS AND BEHAVIORAL SCIENCES
Volume 30 Number 2 ISSN 1946-8113 FALL 2018
IN THIS ISSUE
A Case of Organization Expertise: An Ideal-Types Organization Typology that Predicts Market
Performance………………………………………………………………….Sheppeck and Millitello
Behavior of The Monthly Changes of NASDAQ Composite Index: 1971-2016
………………………Hamid and Dhakar
Clinical Coordination and the Supply Chain: Reducing Adverse Effects of Mechanical
Ventilation………………………………………………………….……..……….Schmidt and Ward
Toward Effective Use of The Statement of Cash Flows ………………………………………….Arnold, Ellis and Krishnan
Terrorist Attacks on September 11, 2001: A Test of Market Efficiency in the Insurance and Airline
Industries
……………………………………………………..Kozoyed and Bacon
Ethical Attitudes and Behavior of Undergraduate Business Students: Trends and the Role of the
Electronic Resources Policy
…………………………………………Case and King
Impact of Technology on Global Supply Chain Risk: An Empirical Study
…………………………………………………………..Farahbod and Varzandeh
An Exploratory Examination of Antecedents to Software Piracy: A Cross-Cultural Comparison
…………………………………… Setterstrom, Knight, Aleassa and Pearson
Has the Statement of Financial Accounting Standards (SFAS 142) Helped or Hindered the Bottom
Line and Security Prices?
…………………………………..Stunda
Patient Violence Against Healthcare Workers
…………………………………………….. Samuels, Hunt and Tezra
An Analysis of Television Advertising Strategy of a Japanese Enterprise: Cultural Perspectives
…………………………………………………Zhang
A REFEREED PUBLICATION OF THE AMERICAN SOCIETY
OF BUSINESS AND BEHAVIORAL SCIENCES

2
JOURNAL OF BUSINESS AND BEHAVIORAL SCIENCES P.O. Box 502147, San Diego, CA 92150-2147: Tel 909-648-2120
Email: [email protected] http://www.asbbs.org
ISSN: 1946-8113 Editor-in-Chief
Wali I. Mondal
National University
Editorial Board
Karen Blotnicky
Mount Saint Vincent University
Pani Chakrapani
University of Redlands
Gerald Calvasina
University of Southern Utah
Shamsul Chowdhury
Roosevelt University
Steve Dunphy
Indiana University Northeast
Lisa Flynn
SUNY, Oneonta
Sharon Heilmann
Wright State University
Sheldon Smith
Utah Valley University
John Bennett
Saint Leo University
Saiful Huq
University of New Brunswick
William J. Kehoe
University of Virginia
Maureen Nixon
South University Virginia Beach
Z.S. Andrew Demirdjian
California State University long Beach
Douglas McCabe
Georgetown University
Marybeth McCabe
National University
Thomas Vogel
Canisius College
Jake Zhu
California State University San
Bernardino
Linda Whitten
Skyline College
The Journal of Business and Behavioral Sciences is a publication of the American Society
of Business and Behavioral Sciences (ASBBS). Papers published in the Journal went
through a blind review process prior to acceptance for publication. The editors wish to thank
anonymous referees for their contributions.
The national annual meeting of ASBBS is held in Las Vegas in March of each year and the
international meeting is held in May/June of each year. Visit www.asbbs.org for information
regarding ASBBS.

3
JOURNAL OF BUSINESS AND BEHAVIORAL SCIENCES
ISSN 1946-8113
Volume 30, Number 2; Fall 2018
TABLE OF CONTENTS
A Case of Organization Expertise: An Ideal-Types Organization Typology that Predicts
Market Performance
Sheppeck and Millitello……………………………………….4
Behavior of The Monthly Changes of NASDAQ Composite Index: 1971-2016
Hamid and Dhakar………………………………………………21
Clinical Coordination and the Supply Chain: Reducing Adverse Effects of Mechanical
Ventilation
Schmidt and Ward………………………………………36
Toward Effective Use of The Statement of Cash Flows
Arnold, Ellis and Krishnan………………………….46
Terrorist Attacks on September 11, 2001: A Test of Market Efficiency in the Insurance
and Airline Industries
Kozoyed and Bacon……………………………63.
Ethical Attitudes and Behavior of Undergraduate Business Students: Trends and the
Role of the Electronic Resources Policy
Case and King………………………………75.
Impact of Technology on Global Supply Chain Risk: An Empirical Study
Farahbod and Varzandeh………………………………..89
An Exploratory Examination of Antecedents to Software Piracy: A Cross-
Cultural Comparison
Setterstrom, Knight, Aleassa and Pearson……………………………….98
Has the Statement of Financial Accounting Standards (SFAS 142) Helped or Hindered
the Bottom Line and Security Prices?
Stunda, Ronald…………………………………………….116
Patient Violence Against Healthcare Workers
Samuels, Hunt and Tezra………………………………………….127
An Analysis of Television Advertising Strategy of a Japanese Enterprise: Cultural
Perspectives
Zhang, Wenting………………………………………..139
Journal of Business and Behavioral Sciences Vol 30, No 2; Fall 2018
4
A CASE OF ORGANIZATION EXPERTISE: AN IDEAL-TYPES ORGANIZATION TYPOLOGY THAT PREDICTS
MARKET PERFORMANCE
Mick Sheppeck Jack Militello
University of St. Thomas
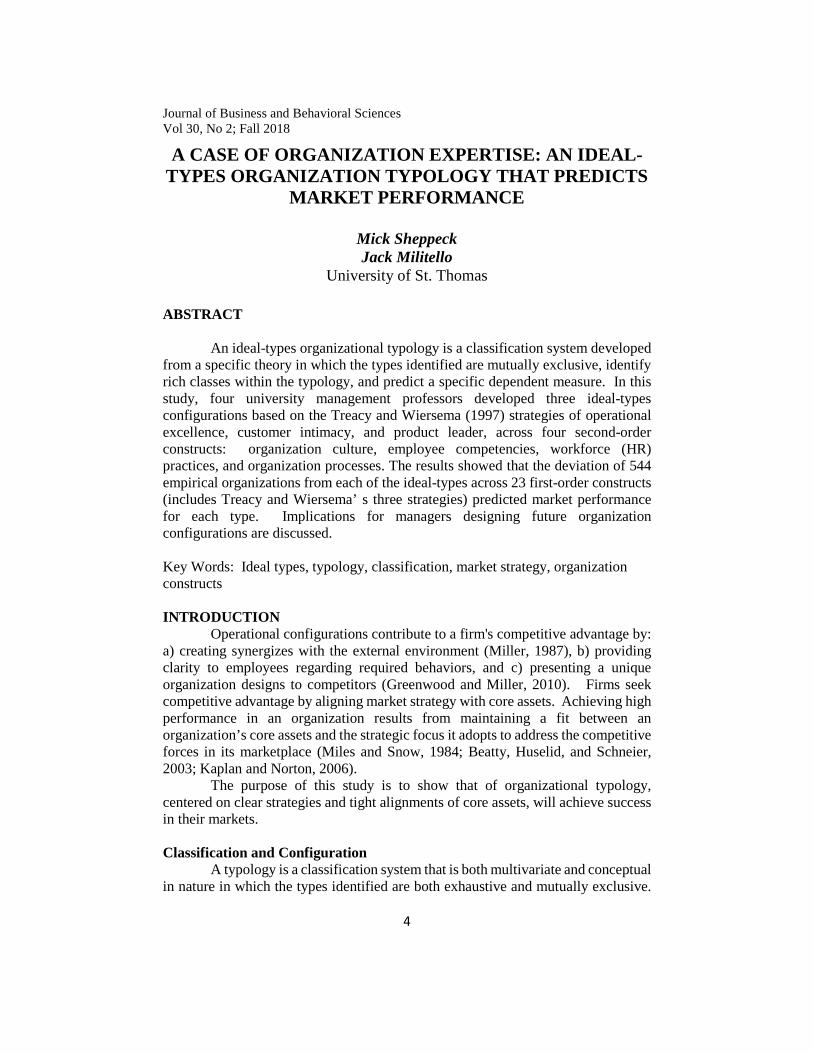
ABSTRACT
An ideal-types organizational typology is a classification system developed from a specific theory in which the types identified are mutually exclusive, identify rich classes within the typology, and predict a specific dependent measure. In this study, four university management professors developed three ideal-types configurations based on the Treacy and Wiersema (1997) strategies of operational excellence, customer intimacy, and product leader, across four second-order constructs: organization culture, employee competencies, workforce (HR) practices, and organization processes. The results showed that the deviation of 544 empirical organizations from each of the ideal-types across 23 first-order constructs (includes Treacy and Wiersema’ s three strategies) predicted market performance for each type. Implications for managers designing future organization configurations are discussed.
Key Words: Ideal types, typology, classification, market strategy, organization constructs
INTRODUCTION Operational configurations contribute to a firm's competitive advantage by:
a) creating synergizes with the external environment (Miller, 1987), b) providing clarity to employees regarding required behaviors, and c) presenting a unique organization designs to competitors (Greenwood and Miller, 2010). Firms seek competitive advantage by aligning market strategy with core assets. Achieving high performance in an organization results from maintaining a fit between an organization’s core assets and the strategic focus it adopts to address the competitive forces in its marketplace (Miles and Snow, 1984; Beatty, Huselid, and Schneier, 2003; Kaplan and Norton, 2006).
The purpose of this study is to show that of organizational typology, centered on clear strategies and tight alignments of core assets, will achieve success in their markets.
Classification and Configuration A typology is a classification system that is both multivariate and conceptual
in nature in which the types identified are both exhaustive and mutually exclusive.

Journal of Business and Behavioral Sciences
5
The variables used to form a typology represent constructs within the particular field of study. When the variables are combined, they identify classes within the typology space that are type concepts rather than empirical cases. Ideal-types organizations are a special form of typology in that they represent holistic configurations described by many unidimensional constructs (Doty and Glick, 1994; Snow and Ketchen, 2014).
A configuration is any multidimensional constellation of conceptually distinct characteristics that commonly occurs together. (Meyer, Tsui, and Hinings, 1993, 1175). Alignments are commonly occurring clusters of attributes… that are internally consistent, such that the presence of some attributes can lead to the reliable prediction of others.” (Miller and Mintzberg (1983, 57) Configuration theories focus on the realized pattern of multiple independent variables, how the variables interact longitudinally, and how the pattern is related to the dependent variable of interest (Miller and Friesen, 1984). These ideal-types are theoretical abstractions that result in a specified level of a dependent variable. “…typologies identify multiple ideal-types, each of which represents a unique combination of the organizational attributes that are believed to determine the relevant outcome(s)” (Doty and Glick, 1994, 232)
Historically, there have been a number of organization typologies noted in management science. Porter (1980); Mintzberg (1980); Miles and Snow (1978), Short, Payne, and Ketchen, (2008). These authors suggest the use of the term organizational configurations as an umbrella concept when referring to more specific terms for identifying configurations: (a) competitive strategy vs. broader organizational features; and (b) the applicability of the configurations--context specific vs. generalizable. They note that configuration group membership has consistently been associated with significant levels of organization performance. Study Objectives
Based on their observations of successful organizations, Treacy and Wiersema (1997) identified three generic market disciplines: Operational Excellence (OE), Product Leadership (PL), and Customer Intimacy (CI). The OE (best cost) approach achieves a low cost of goods sold and the lowest prices delivered to customers. CI (best solution) strategies utilize provide tailored solutions to customer needs at a premium price. The PL (best product) includes organizations that are first to market with new or upgraded products/services or the movement of products/services to new markets. We used these market disciplines to represent the generic market strategies in this study.
We have crafted an organizational ideal-types typology using expert judges. They focused on the trio of market strategies, supported by organization culture, employee competencies, workforce (HR) practices, and business processes. The intention is to determine the capability of each ideal-type in predicting market performance using the deviation of empirical organizations in the study from each ideal-types profile.
Our assertion is that ideal-types models will predict firm market performance. Because ideal-types organizations are conceptual constructs designed via theory to
Sheppeck and Militello
6
predict market performance, each type should represent a configuration that would be successful in the marketplace (Delery and Doty, 1996).
Therefore… H1: The deviation of empirical organizations from each of the ideal-types organization configurations will predict market performance.
Organization environment is a critical contingency variable in organization theory and it affects organization success by establishing both constraints and opportunities (Dess and Beard, 1984; Ginter, Swayne, and Duncan, 2002). We developed a single scale of environment items as a moderator in studying the relationship between ideal-types configurations and market performance.
Therefore… H2: Environmental dynamism will moderate the relationship between the ideal-types organization configurations and market performance.
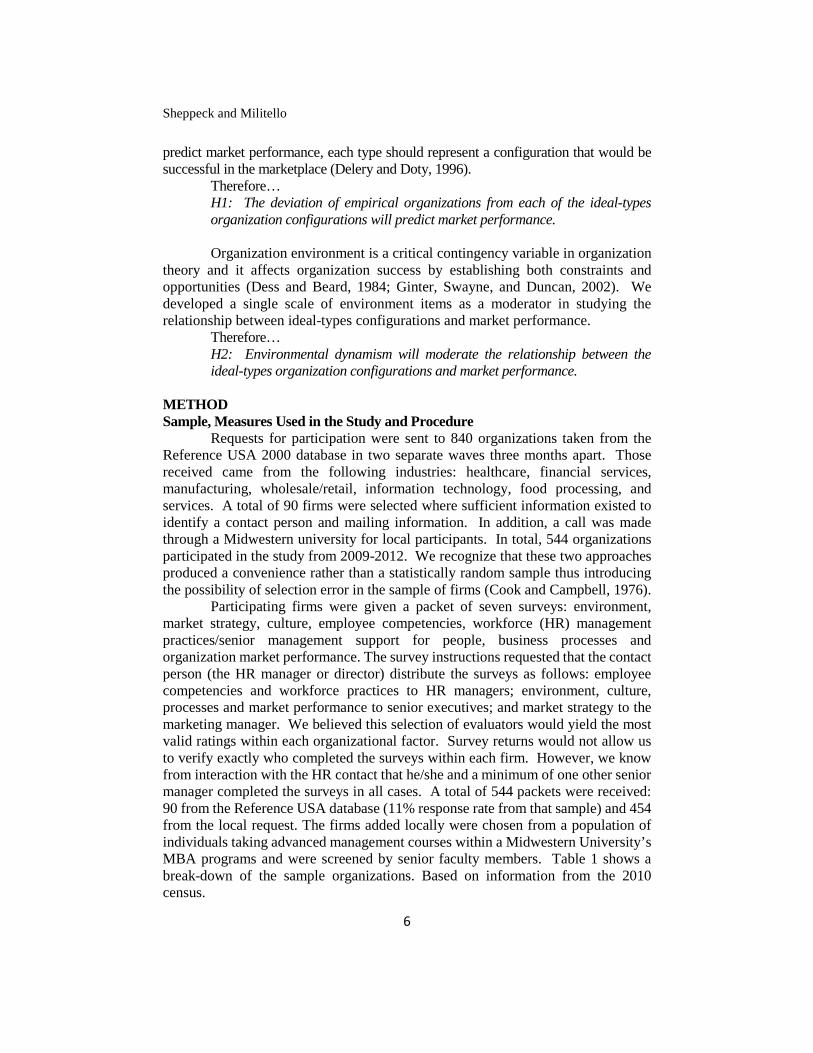
METHOD Sample, Measures Used in the Study and Procedure
Requests for participation were sent to 840 organizations taken from the Reference USA 2000 database in two separate waves three months apart. Those received came from the following industries: healthcare, financial services, manufacturing, wholesale/retail, information technology, food processing, and services. A total of 90 firms were selected where sufficient information existed to identify a contact person and mailing information. In addition, a call was made through a Midwestern university for local participants. In total, 544 organizations participated in the study from 2009-2012. We recognize that these two approaches produced a convenience rather than a statistically random sample thus introducing the possibility of selection error in the sample of firms (Cook and Campbell, 1976).
Participating firms were given a packet of seven surveys: environment, market strategy, culture, employee competencies, workforce (HR) management practices/senior management support for people, business processes and organization market performance. The survey instructions requested that the contact person (the HR manager or director) distribute the surveys as follows: employee competencies and workforce practices to HR managers; environment, culture, processes and market performance to senior executives; and market strategy to the marketing manager. We believed this selection of evaluators would yield the most valid ratings within each organizational factor. Survey returns would not allow us to verify exactly who completed the surveys within each firm. However, we know from interaction with the HR contact that he/she and a minimum of one other senior manager completed the surveys in all cases. A total of 544 packets were received: 90 from the Reference USA database (11% response rate from that sample) and 454 from the local request. The firms added locally were chosen from a population of individuals taking advanced management courses within a Midwestern University’s MBA programs and were screened by senior faculty members. Table 1 shows a break-down of the sample organizations. Based on information from the 2010 census.

Journal of Business and Behavioral Sciences
7
We chose to focus on the following broad constructs: an organization's environment, market strategy, organization culture, employee capabilities, workforce (HR) practices (including senior management perspective regarding employees), and business processes. The centrality of these variables for organization success has been strongly advocated. (Chan, Shaffer, and Snape 2004; Roberts, 2004; and Skrinjar, Stemberger, and Hernaus 2007).
Table I Sample Demographics
INDUSTRY N % 2010 % U.S.CENSUS
Manufacturing 101 18.5 8
Wholesale/retail 71 13.1 37
Financial/insurance/real-estate 54 9.9 18
Transportation/communication 69 12.7 8
Agriculture/mining/construction 25 4.6 0.2
Service 224 41.2 29
Totals 544 100
EMPLOYEES N %
Less than 200 209 38.5
200 – 499 117 21.5
500 – 999 53 9.7
1,000 – 4,999 73 13.4
5,000 – 9,999 33 6.1
Over 10,000 59 10.8
Totals 544 100
Sheppeck and Militello
8
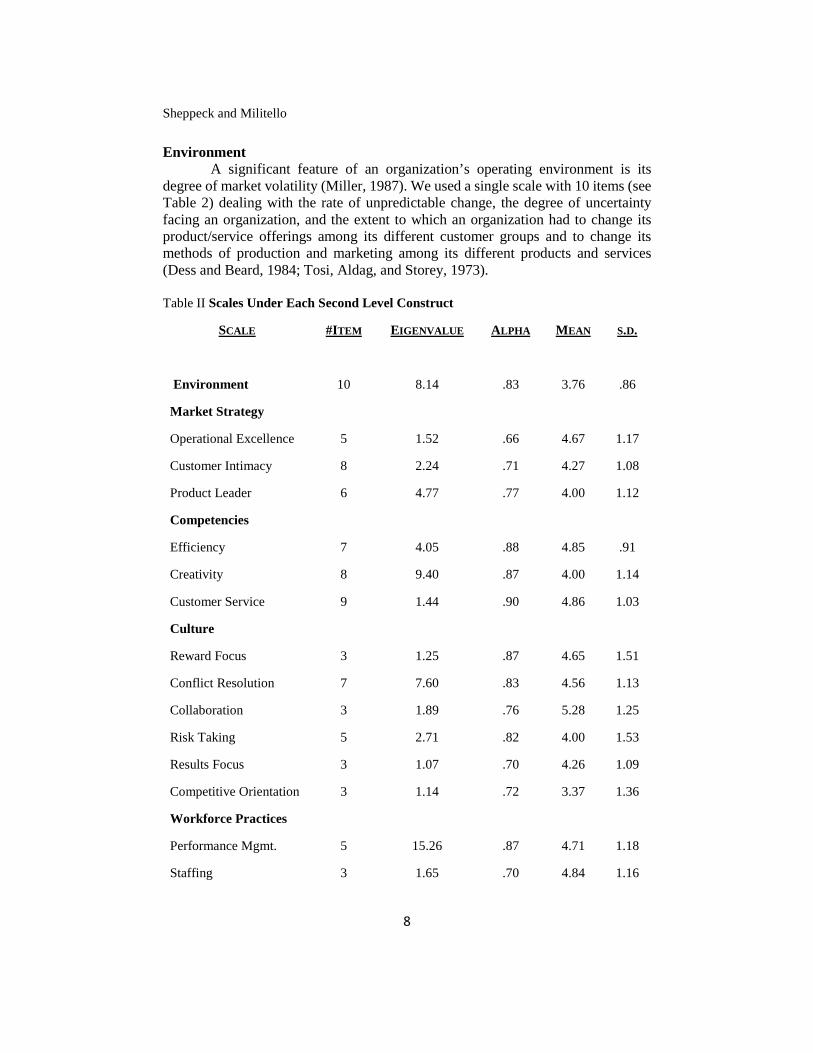
Environment A significant feature of an organization’s operating environment is its
degree of market volatility (Miller, 1987). We used a single scale with 10 items (see Table 2) dealing with the rate of unpredictable change, the degree of uncertainty facing an organization, and the extent to which an organization had to change its product/service offerings among its different customer groups and to change its methods of production and marketing among its different products and services (Dess and Beard, 1984; Tosi, Aldag, and Storey, 1973).
Table II Scales Under Each Second Level Construct
SCALE #ITEM EIGENVALUE ALPHA MEAN S.D.
Environment 10 8.14 .83 3.76 .86
Market Strategy
Operational Excellence 5 1.52 .66 4.67 1.17
Customer Intimacy 8 2.24 .71 4.27 1.08
Product Leader 6 4.77 .77 4.00 1.12
Competencies
Efficiency 7 4.05 .88 4.85 .91
Creativity 8 9.40 .87 4.00 1.14
Customer Service 9 1.44 .90 4.86 1.03
Culture
Reward Focus 3 1.25 .87 4.65 1.51
Conflict Resolution 7 7.60 .83 4.56 1.13
Collaboration 3 1.89 .76 5.28 1.25
Risk Taking 5 2.71 .82 4.00 1.53
Results Focus 3 1.07 .70 4.26 1.09
Competitive Orientation 3 1.14 .72 3.37 1.36
Workforce Practices
Performance Mgmt. 5 15.26 .87 4.71 1.18
Staffing 3 1.65 .70 4.84 1.16
Journal of Business and Behavioral Sciences
9
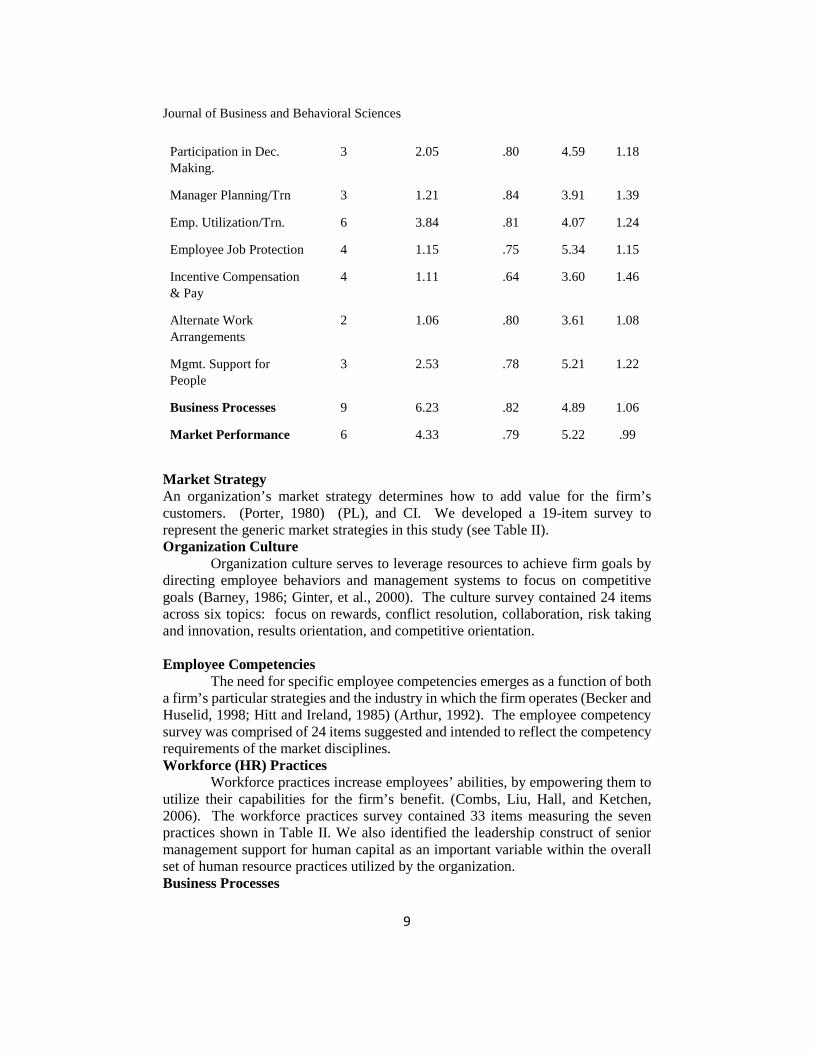
Participation in Dec. Making.
3 2.05 .80 4.59 1.18
Manager Planning/Trn 3 1.21 .84 3.91 1.39
Emp. Utilization/Trn. 6 3.84 .81 4.07 1.24
Employee Job Protection 4 1.15 .75 5.34 1.15
Incentive Compensation & Pay
4 1.11 .64 3.60 1.46
Alternate Work
Arrangements
2 1.06 .80 3.61 1.08
Mgmt. Support for People
3 2.53 .78 5.21 1.22
Business Processes 9 6.23 .82 4.89 1.06
Market Performance 6 4.33 .79 5.22 .99
Market StrategyAn organization’s market strategy determines how to add value for the firm’s customers. (Porter, 1980) (PL), and CI. We developed a 19-item survey to represent the generic market strategies in this study (see Table II).Organization Culture
Organization culture serves to leverage resources to achieve firm goals by directing employee behaviors and management systems to focus on competitive goals (Barney, 1986; Ginter, et al., 2000). The culture survey contained 24 items across six topics: focus on rewards, conflict resolution, collaboration, risk taking and innovation, results orientation, and competitive orientation.
Employee Competencies The need for specific employee competencies emerges as a function of both
a firm’s particular strategies and the industry in which the firm operates (Becker and Huselid, 1998; Hitt and Ireland, 1985) (Arthur, 1992). The employee competency survey was comprised of 24 items suggested and intended to reflect the competency requirements of the market disciplines. Workforce (HR) Practices
Workforce practices increase employees’ abilities, by empowering them to utilize their capabilities for the firm’s benefit. (Combs, Liu, Hall, and Ketchen, 2006). The workforce practices survey contained 33 items measuring the seven practices shown in Table II. We also identified the leadership construct of senior management support for human capital as an important variable within the overall set of human resource practices utilized by the organization. Business Processes
Sheppeck and Militello
10
As noted by McCormack and Johnson (2001), the management of an enterprise means the management of its processes. A total of nine items dealing with strategic processes were developed based on Quinn and Rohrbaugh (1983), and supplemented by items dealing with resource acquisition (people and capital), position in the market, maintaining customers, and overall financial performance (see Table II). Market Performance
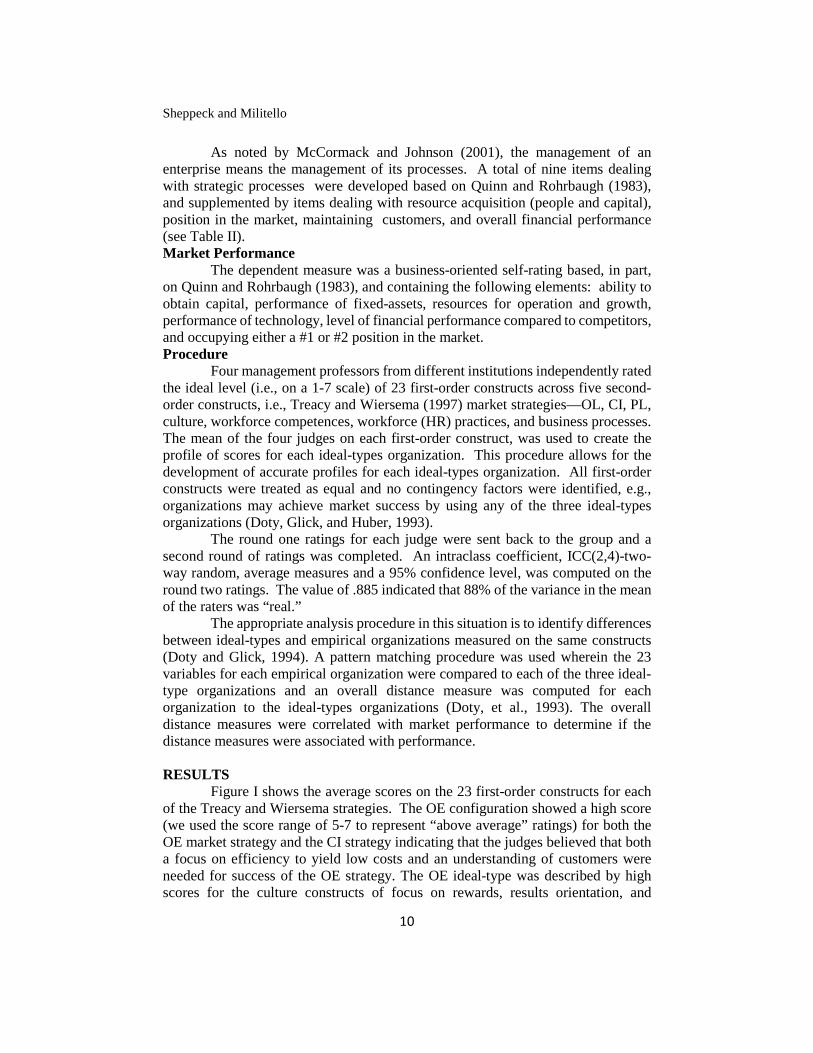
The dependent measure was a business-oriented self-rating based, in part, on Quinn and Rohrbaugh (1983), and containing the following elements: ability to obtain capital, performance of fixed-assets, resources for operation and growth, performance of technology, level of financial performance compared to competitors, and occupying either a #1 or #2 position in the market. Procedure
Four management professors from different institutions independently rated the ideal level (i.e., on a 1-7 scale) of 23 first-order constructs across five second-order constructs, i.e., Treacy and Wiersema (1997) market strategies—OL, CI, PL, culture, workforce competences, workforce (HR) practices, and business processes. The mean of the four judges on each first-order construct, was used to create the profile of scores for each ideal-types organization. This procedure allows for the development of accurate profiles for each ideal-types organization. All first-order constructs were treated as equal and no contingency factors were identified, e.g., organizations may achieve market success by using any of the three ideal-types organizations (Doty, Glick, and Huber, 1993).
The round one ratings for each judge were sent back to the group and a second round of ratings was completed. An intraclass coefficient, ICC(2,4)-two-way random, average measures and a 95% confidence level, was computed on the round two ratings. The value of .885 indicated that 88% of the variance in the mean of the raters was “real.”
The appropriate analysis procedure in this situation is to identify differences between ideal-types and empirical organizations measured on the same constructs (Doty and Glick, 1994). A pattern matching procedure was used wherein the 23 variables for each empirical organization were compared to each of the three ideal-type organizations and an overall distance measure was computed for each organization to the ideal-types organizations (Doty, et al., 1993). The overall distance measures were correlated with market performance to determine if the distance measures were associated with performance.
RESULTS Figure I shows the average scores on the 23 first-order constructs for each
of the Treacy and Wiersema strategies. The OE configuration showed a high score (we used the score range of 5-7 to represent “above average” ratings) for both the OE market strategy and the CI strategy indicating that the judges believed that both a focus on efficiency to yield low costs and an understanding of customers were needed for success of the OE strategy. The OE ideal-type was described by high scores for the culture constructs of focus on rewards, results orientation, and

Journal of Business and Behavioral Sciences
11
competitive orientation. These cultural features are designed to result in reliable employee behaviors. The only above average employee competency was efficiency.
Three HR practices were rated as above average. The strong focus on staffing suggests the desire to find the appropriate efficiency oriented employees to work in this culture. Performance management, paying above market pay rates and using incentives would serve to focus employees’ attention on achieving specified performance goals. The cultural variable of results orientation further reinforces this HR practice. An average rating for the management support for people construct suggests less of an emphasis on the human capital management philosophy in these organizations. The average rated workforce (HR) practices of employee participation and utilization may signal a supervisory directed control of performance.
The judges’ ratings for OE firms showed a strong focus on a cost control competitive culture, staffing to achieve economies of scale, low participation, and limited or informal training. Our ideal-types procedure yielded results similar in many respects to previous taxonomic and typology studies (Slocum, Lei, and Buller, 2014; Toh, Morgeson, and Campion, 2008) for low cost organizations.
Our CI ideal-type organization showed strong market strategies for OE and CI. These results suggest that customer oriented market strategies must be

Sheppeck and Militello
12

Journal of Business and Behavioral Sciences
13
supplemented by OE internal processes to provide consistent behaviors in the core of the business while teams engage in customizing behaviors. The CI-ideal type had only one cultural construct rated above average: collaboration/teaming. This high score supports a work design where teams of employees collaborate to provide a unique product or service for a customer. The competency construct of customer service mentality was also rated high due to its focus on dealing with customers’ needs and seeing the “big picture”. The following HR practices were rated above average: staffing, participation in decision making, employee utilization/training, incentive compensation and pay level, alternative work arrangements, and senior management support for people. These practices support a work environment where employees are incentivized to work with customers, and where the management team believes that employees represent a source of competitive advantage. Finally, the process dimension in which the organization’s business model was well suited to customers’ needs was also rated high.
The PL-ideal type had only the PL market strategy as above average. This type also showed five of the six cultural constructs as rated above average. The only culture construct not highly rated was conflict resolution. Creative systems thinking and customer service mentality we rated as high. These two competencies describe a workforce capable of viewing issues from a total systems perspective, understanding the “big picture” with customers, and having deep knowledge of the organization’s products/services. They support a firm that succeeds in the marketplace through innovation and a first mover position. Six of the nine HR practices were rated as above average in importance: performance management, staffing, employee participation, employee utilization and training, incentive compensation and pay level, and senior management support for employees. Finally, as in the CI ideal-type the organization’s business model was also well suited to customers’ needs. The strong focus on rewards also suggests that the imperative to be first to market carries with it some form of reward beyond an organization’s base pay (Lawler, 1990).
In terms of workforce (HR) practices, the high rating on incentive compensation and pay level reinforces the cultural value of rewarding those individuals who exhibit superior performance. The high staffing rating implies an energized focused process designed to recruit and hire employees into the organization that suit the PL cultural style. The participation and employee utilization ratings speak to the practices of sharing information with employees, involving them in business decisions and problem solving, working in teams, and designing jobs to produce high levels of employee motivation. Management support for people construct also showed a high rating indicating that managers view employees as an important factor for competitive advantage. The high rating on business processes indicates that the organization’s business model is in tune with customers’ needs and priorities which results in the retention of customers over time. These findings support the competitive nature of the culture in these organizations along with employee competencies that result in customer and product/service focus.
Sheppeck and Militello
14
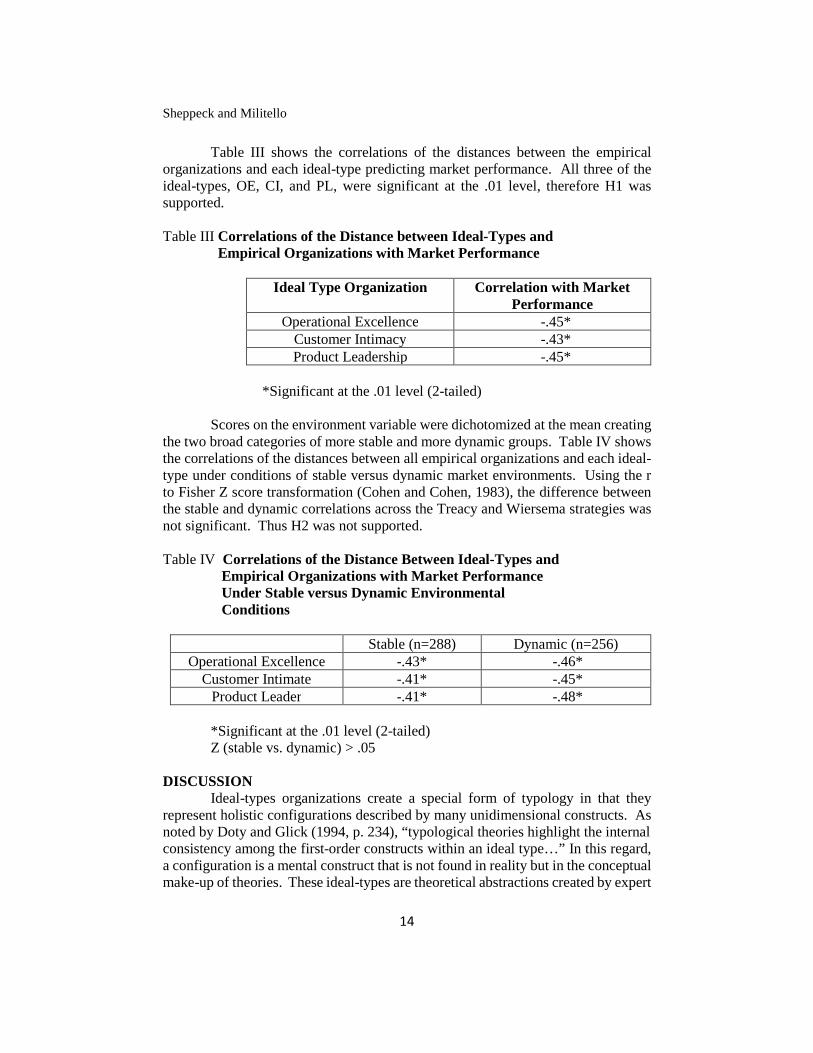
Table III shows the correlations of the distances between the empirical organizations and each ideal-type predicting market performance. All three of the ideal-types, OE, CI, and PL, were significant at the .01 level, therefore H1 was supported.
Table III Correlations of the Distance between Ideal-Types and Empirical Organizations with Market Performance
Ideal Type Organization Correlation with Market Performance
Operational Excellence -.45*Customer Intimacy -.43*Product Leadership -.45*
*Significant at the .01 level (2-tailed)
Scores on the environment variable were dichotomized at the mean creating the two broad categories of more stable and more dynamic groups. Table IV shows the correlations of the distances between all empirical organizations and each ideal-type under conditions of stable versus dynamic market environments. Using the r to Fisher Z score transformation (Cohen and Cohen, 1983), the difference between the stable and dynamic correlations across the Treacy and Wiersema strategies was not significant. Thus H2 was not supported.
Table IV Correlations of the Distance Between Ideal-Types and Empirical Organizations with Market Performance Under Stable versus Dynamic Environmental Conditions
Stable (n=288) Dynamic (n=256)Operational Excellence -.43* -.46*
Customer Intimate -.41* -.45*Product Leader -.41* -.48*
*Significant at the .01 level (2-tailed) Z (stable vs. dynamic) > .05
DISCUSSIONIdeal-types organizations create a special form of typology in that they
represent holistic configurations described by many unidimensional constructs. As noted by Doty and Glick (1994, p. 234), “typological theories highlight the internal consistency among the first-order constructs within an ideal type…” In this regard, a configuration is a mental construct that is not found in reality but in the conceptual make-up of theories. These ideal-types are theoretical abstractions created by expert
Journal of Business and Behavioral Sciences
15
judges that are designed to result in a specified level of a dependent variable, in this study organization market performance. Comparison to Previous OE Ideal-Type Organizations
Two recent taxonomies (Slocum, et al., 2014; Toh, et al., 2008) focused on organizations that connected HR systems of practices to business strategies and contextual variables. These studies utilize the “control to commitment” continuum as noted by Dyer and Reeves (1995). On the control size of the continuum, Slocum, et al.’s (2014) consolidators focused on a culture of high competition with rivals, the use of staffing practices to achieve economy of scale for employee hiring, a strong use of outsourcing, processes shaped to yield value at lower costs, and little employee participation. Toh, et al.’s (2008) cost minimizers were also focused on low costs via lower investments in HR practices including employee participation.
Our panel agreed with these results regarding a focus on competition with rivals, a culture of high results orientation and lower risk taking, intense staffing to find employees who fit with the OE culture, lower costs via a smaller investment in HR practices (only 3 of 9 practices in the survey were targeted as important by our judges), employees with high efficiency competencies, little actual employee participation, and strong variable pay practices. Our judges also added to this set a cultural (focus on rewards) and practice-oriented focus (incentive compensation and above market pay system) offering a broad set of rewards for high individual performance, and a contemporary emphasis on motivation via employee recognition. Comparison to Previous CI Ideal-Type Organizations
Slocum, et al.’s (2014) trendsetters, Toh, et al.’s (2008) commitment maximizers tended to adopted a larger number of HR practices than other taxonomies/typologies (6 of 9 HR practices). These organizations focused on risk and results oriented cultures vis-a-vis customers, with intense staffing systems, the use of teams/high employee involvement/utilization, use of a broader set of employee skills that targeted problem solving and decision making, compensation tied to long-term corporate earnings, flexible job design, and training for managers and non-managers.
Our panel agreed with a strong focus on collaboration in these organizations and employees utilizing their customer focused skills and mindset. Our panel did not rate risk taking and results orientation as above average; however, their ratings were close to the cutoff point. The judges rated alternative work arrangements as above average, the only ideal-type to show this high score. Comparison to Previous PL Ideal-Type Organizations
Slocum, et al.’s (2014) pioneers, Toh, et al.’s (2008) commitment maximizers utilized risk taking in ambiguous situations, teams and individual employees exercising initiative resulting in value from new product/service ideas, high performance standards, strong focus on staffing the “best” employees, high employee involvement, employee development, and use of contingent compensation programs.
Our judges agreed with the focus on a risk taking and collaboration culture but added an emphasis on attaining results, competitive orientation and a
Sheppeck and Militello
16
culture of emphasizing rewards, i.e., a performance based organization. The only highly rated cultural item in the CI typology was collaboration, perhaps suggesting a greater focus on results in PL than in CI organizations. This may result from the customer team work design in CI firms versus the more product-oriented approach in PL organizations. A culture of rewards was further reinforced in PL firms by performance management activities, staffing to find employees to fit this culture and use of strong incentive compensation practices. Employee participation, the full utilization of employee abilities, and employee development further supported an employee oriented strategy. These factors indicate that the first mover organization ought to have sound financial backing that is typically found in established firms with more stable models. True innovators develop ideas but it is the PL firm with a workable culture and talent base that is able to implement and sustain innovation on a profitable scale. Major Findings
We believe there are three major findings from this study. The first is that clear and meaningful descriptions of ideal-types organizations using a large number of theory-based variables and based on a specific market strategy foundation is possible. Four management professor judges developed reliable descriptions of ideal-types organizations guided by the Treacy and Wiersema (1997) market strategies, OE, CI, and PL, and other organizational variables in two rounds of a Delphi-like process. This result indicates the potential of utilizing the ideal-types methodology by expert judges for building organizational typologies that may be used to predict specific dependent measures (Short, et al., 2008). In particular, this procedure has the potential for describing ideal-types organizations in industries experiencing rapid change in today’s economy: e.g., biotechnology, health care providers, emerging energy sources, etc. (Slocum, et. al., 2014).
The second finding is that empirical deviations from the ideal-types organization configurations were significantly associated with firm market performance. The three ideal-type models not only predicted organization market success, but also resembled employment strategies articulated in previous studies, Slocum, et al., 2014: consolidators, trendsetters, and pioneers; Toh, et al., 2008: cost minimizers and commitment maximizers. The similarities among these historic employment models and the three configurations developed by the expert judges, may indicate a) the judges’ deep expertise regarding these configurations, and b) the configurations’ validity for predicting organization market performance. As noted by Tversky and Kahneman (1974), the learning of expertise in a discipline depends upon an environment that demonstrates some degree of regularity and predictability and a judge’s opportunity to learn the regularities via prolonged practice over time. We believe our judges had spent considerable time in their university roles viewing and discussing the nature of the variables that affect organizations within a specific economy and making predictions regarding an organization’s performance in the marketplace. The development of deep expertise regarding organization models and their validity for predicting various organization outcomes emerges from serious observation and hypothesis testing regarding those models in the economy.
Journal of Business and Behavioral Sciences
17
Our third contribution is showing that the impact of environment as a moderator between ideal-type and empirical organization differences and the dependent measure of firm market performance was negligible in this sample. The Z score between the correlation of ideal-types and empirical organizations for OE, CI, and PL, organizations under stable vs. dynamic conditions was not significant. Therefore, the environment did not impact the relationship between ideal-type and empirical organizations under the OE, CI, or PL strategies. Managerial Implications We feel there are two implications for practicing managers that emerge from this study. First, a fundamental principle of open systems (Katz and Kahn, 1978) is equifinality: an organization can achieve the same final state via a number of pathways. Each ideal-type organization within a typology is a unique collection of attributes designed to predict a relevant outcome like organization performance (Doty and Glick, 1994). The OE, CI, and PL strategies represent unique and valid ways for attacking a market; large deviations from an ideal-type produces lower market performance for organizations. Second, practicing managers may, with some accuracy, predict the future performance of those different configurations, i.e., organizational expertise leads to the ability to accurately configure organizations as environments change. Study Limitations
The findings from this study must be interpreted in light of several limitations. First, as noted earlier the convenience nature of the sample introduced a selection error that could affect both the internal and external validity of the study (Cook and Campbell 1976). Although there were 544 firms involved in the project, specific over and under-representation against the national population of firms may skew the sample toward organizations exhibiting a strong relationship to the ideal-types and limiting the generalizability of firms to which the findings may be applied. Second, the cross-sectional nature of the research design with a limited number of survey respondents for each firm, may introduce common method bias that again would threaten the internal validity of the study and lead to overestimates of the size of the relationships among the study variables. Furthermore, we were unable to determine the extent to which respondents communicated with each other as they completed the surveys. Future research should attempt to obtain a nationally representative set of firms and to control how the survey instruments are completed within each organization. Finally, the small number of manufacturing firms as compared to service firms may have limited the range of scores in these organizations thus reducing the connections to market performance.
Conclusions Ideal-types organizations allow the researcher to model the nature or pattern
of the relationships among multiple constructs that leads to fit within a particular ideal-type organization. Using the deviation of empirical organizations from each ideal-type to predict a specific dependent variable provides a powerful approach for theory building. The results from this study suggest that the ideal-types methodology could be used effectively in specific contexts and with appropriate

Sheppeck and Militello
18
expert judges, e.g., hospital and clinic settings described by medical doctors, high technology organizations with network structures described by entrepreneurs at each node, etc., to identify organizational configurations predictive of important outcomes thus opening up new avenues of theory development. Acknowledgments
We wish to thank the members of our expert panel: Jason Shaw, The Hong Kong Polytechnic University, Kevin Love, Central Michigan University, Pete Simmons, Saint Leo University, and Jack Militello, the University of St. Thomas. We are also grateful to John Sailors for the initial data analyses.
REFERENCES
Arthur, W. (1992). “The link between business strategy and industrial relations systems in American steel minimills.” Industrial and Labor Relations Review, Volume 45, 488-506. Barney J. (1991). “Firm resources and sustained competitive advantage.”
Journal of Management, Volume 17, 99-120. Barney, J. (1986). “Organizational culture: Can it be a source of sustained competitive advantage?” Academy of Management Review, Volume 11, 656-665. Becker, B., and Huselid, M. (1998). “High performance work systems and firm performance: a synthesis of research and managerial implications,” in G. Ferris, ed., Research in Personnel and Human Resources Management. Stamford, CT: JAI Press, Volume 16, 53-101. Beatty, R., Huselid, M., and Schneier, C. (2003). “New HR metrics.”
Organizational Dynamics, Volume 2, 207-121. Chan, L., Shaffer, M., and Snape, E. (2004). “In search of sustained competitive advantage: the impact of organizational culture, competitive strategy and human resource management practices on firm performance.” International Journal of Human Resource Management, Volume 15, 17-35. Cohen, J., & Cohen, P. (1983). Applied Multiple Regression/Correlation Analysis for the Behavioral Sciences. Hillsdale, NJ: Erlbaum. Cook, T.D. and Campbell, D.T. (1976). “The design and conduct of quasi experiments and true experiments in field settings,” in M.D. Dunnette, (Ed.), Handbook of Industrial and Organizational Psychology. Chicago: Rand McNally College Publishing Company.
Combs, J., Liu, Y., Hall, A., and Ketchen, D. (2006). “How much do high-performance work practices matter? A meta-analysis of their effects on organizational performance.” Personnel Psychology, Volume 59, 501-528
Delery, J., and Doty, D. (1996). “Modes of theorizing in strategic human resource management: Tests of universalistic, contingency and configurational performance predictions.” Academy of Management Journal, Volume 39, 802-835.
Journal of Business and Behavioral Sciences
19
Dess, G., and Beard, D. (1984). “Dimensions of organizational task environment.” Administrative Science Quarterly, Volume 29, 52-73.
Doty, D., and Glick, W. (1994). “Typologies as a unique form of theory building: Toward improved understanding and modeling.” Academy of Management Review, Volume 19, 230-251.
Doty, D., Glick, W., and Huber, G. (1993). “Fit, effectiveness, and equifinality: A test of two configurational theories.” Academy of Management Journal, Volume 36, 1196-1250.
Dyer, L., and Reeves, T. (1995). “Human resource strategies and firm performance: What do we know and where do we need to go?” The International Journal of Human Resource Management, Volume 6, 656
670. Ginter, P., Swayne, L., and Duncan, W. (2002). The Strategic Management of Health Care Organizations. Oxford: Blackwell Publishers, 4th.edition. Greenwood, R., and Miller, D. (2010). “Tackling design anew: Getting back to the heart of organizational theory.” Academy of Management Perspectives, Volume 24, 78-88. Hitt, M., and Ireland, R. (1985). “Corporate distinctive competence, strategy, industry and performance.” Strategic Management Journal, Volume 6, 273-293. Huselid, M. (1995). “The impact of human resource management practices on turnover, productivity, and corporate financial practices.” Academy of Management Journal, Volume 38, 635-672. Kahneman, D. (2011). Thinking, Fast and Slow. NY: Farrar, Straus, and Giroux Kaplan, R. and Norton, D. (2006). Alignment. Boston: Harvard Business School Press. Katz, D., and Kahn, R. (1978). The Social Psychology of Organizations. New York: John Wiley & Sons, 2nd edition.Lawler, E. (1990). Strategic Pay. San Francisco: Jossey-Bass Publishers. McCormack, K., and Johnson, W. (2001). Business Process Orientation Gaining the E-Business Competitive Advantage. Florida: St. Lucie Press. Meyer, A, Tsui, A., and Hinings, C. (1993). “Configurational approaches to organizational analysis.” Academy of Management Journal, Volume 36, 1175-1195. Miles, R., and Snow, C. (1978). Organizational Strategy, Structure and Process. NY: McGraw-Hill Book Co. Miles, R., and Snow, C. (1984). “Fit, failure, and the hall of fame.”
California Management Review, Volume 26, 10-28.Miller, D. (1987). “The genesis of configuration.” Academy of Management Review, Volume 12, 686-701. Miller, D. and Friesen, P. (1984). Organizations: A Quantum View. Englewood Cliffs, N.J.: Prentice-Hall. Miller, D. & Mintzberg, H. (1983). “The case for configuration,” in Gareth Morgan (Ed.), Beyond Method: Strategies For Social Research. Beverly

Sheppeck and Militello
20
Hills: Sage Publications.
Mintzberg, H. (1980). “Structure in 5’s: A synthesis of the research on organization design.” Management Sciences, Volume 26, 322-341. Porter, M. (1980). Competitive Strategy. New York: The Free Press.Quinn, R. and Rohrbaugh, J. (1983). “A spatial model of effectiveness criteria: Towards a competing values approach to organizational analysis.” Management Science, Volume 29, 363-377.Roberts, J. (2004). The Modern Firm. New York: Oxford. Short, J., Payne, G., and Ketchen, D. (2008). “Research on organizational configurations: Past accomplishment and future challenges.” Journal of Management, Volume 34, 1053-1079. Slocum, J., Lei, D., and Buller, P. (2014). “Executing business strategies through human resource management practices.” Organizational Dynamics, Volume 43, 73-87. SHRM/CCH Incorporated. (1995). Ideas and Trends in Personnel. Human Resource Management, issue 356. Skrinjar, R., Stemberger, M., and Hernaus, T. (2007). "The Impact of Business Process Orientation on Organizational Performance."
Proceedings of the 2007 Informing Science and IT Education Joint Conference.Sorensen, J. (2002). “The strength of corporate culture and the reliability of firm performance.” Administrative Science Quarterly, Volume 47, 70-91. Toh, S., Morgeson, F., and Campion, M. (2008). “Human resource configurations: Investigating fit with the organizational context.”
Journal of Applied Psychology, Volume 93, 864-882. Tosi, H., Aldag, R., and Storey, R. (1973). “On the measurement of the environment: An assessment of the Lawrence and Lorsch environmental uncertainty subscale.” Administrative Science Quarterly, Volume 18, 27-36. Treacy, M., & Wiersema, F. (1997). The Discipline of Market Leaders: Choose Your Customers, Narrow Your Focus, Dominate Your Market. New York: Basic Books. Tversky, A. and Kahnemann, D. (1974). “Judgment under uncertainty: Heuristics and biases.” Science, Volume 185, 453-458

Journal of Business and Behavioral Sciences Vol 30, No 2; Fall 2018
21
BEHAVIOR OF THE MONTHLY CHANGES OF NASDAQ COMPOSITE INDEX: 1971-2016
Shaikh A. Hamid Tej Dhakar
Southern New Hampshire University
ABSTRACT
This paper looks at the seasonality in the monthly changes of NASDAQ Index from the perspective of means and standard deviations of monthly changes from 1971 to 2016, and seasonality in the case of three sub-periods carved based on structural changes in the economy. We do not find monthly seasonality in terms of mean for the full data period (1971 to 2016) but we do find monthly seasonality for the first sub-period (1971 to 1992). We find seasonality in terms of volatility for the full data set as well for the first two sub-periods, but not for the last sub-period (2003 to 2016). Previous researchers have found significantly higher returns in small stocks in January – which came to be known as the January effect. We find significantly higher index changes for January as well as for December using the full data set. But when we decompose the data set into sub-periods, the January effect is highly significant during the first sub-period, not so significant during the second sub-period, and vanishes in the last sub-period (2003 to 2016). This implies higher efficiency in the pricing of the stocks in the NASDAQ Index in recent times. The month effect varies with the time period we consider. Given that no consistent pattern is detectable is a reflection of the efficiency of the NASDAQ Composite stocks to a large degree.
Key Words: NASDAQ Index, Behavior, Monthly Seasonality, Mean, Volatility
INTRODUCTION We look at the behavior of monthly changes of the NASDAQ Composite Index over the period 1971 to 2016. We specifically explore for monthly seasonality. Existence of seasonality will indicate inefficiency in the market and will provide guideline on strategy for investing in NASDAQ stocks. We look at the seasonality in monthly changes of the Index, firstly, for the whole data period, and then for sub-periods so as to get deeper insight.
LITERATURE SURVEY Since the time stock exchanges were first established, traders and investors have exhaustively looked for patterns in stock prices that they could exploit to realize superior returns. As early as 1900, Bachelier characterized security prices as being efficient. Over thirty years later came the landmark work by Cowles (1933) in which he documented the inability of forty-five professional agencies to forecast stock prices. The conclusion was that stock prices are random – in general they do not exhibit patterns. This was followed by the researches of Working (1934),
Hamid and Dhakar
22
Cowles and Jones (1937), Kendall (1953), and Osborne (1959). They documented that stock and commodity prices behave like a random walk – as if they are independent random drawings. These empirical works were buttressed by the theoretical work of Samuelson (1965) and Mandelbrot (1966). Fama (1965, 1970) also contributed to this body of literature which came to be termed the ‘random walk hypothesis’ and efficient markets hypothesis’ (EMH). [In economics, This hypothesis postulates that stock prices reflect all available information; they change in response to new information; since new information by definition cannot be deduced from previous information, new information must be independent over time; if the arrival of new information is random, stock price changes are random – the changes cannot be anticipated; hence it is not possible to generate risk-adjusted abnormal returns from stocks. The overall finding is that it is difficult to earn above-average profits by trading on publicly available information because it is already incorporated in securities prices. However, some researchers have been able to identify profitable opportunities or anomalies. These findings go against the concept of efficient markets. As a result, some academics have deprecated the concept. The adherents of the new camp may possibly be increasing. Among the various anomalies discovered, the January effect is possibly the most well-known. It has been documented for financial markets across the globe. For a detailed discussion of this and other anomalies, see Hamid (2017). The next section describes the descriptive statistics of NASDAQ Composite Index, followed by results of analyses of monthly seasonality for the entire data set, and then for the three sub-periods. Some tentative conclusions follow. Finally we summarize and conclude.
RESEARCH METHODOLOGY Our data consists of percentage changes in the monthly closing values of the from February 1971 to December 2016. The NASDAQ Composite Index is market -value weighted and hence does not include dividends. It may seem that analysis of month effect will be affected by the omission of dividends. Lakonishok and Smidt (1988) find that this omission does not seem to affect their results with respect to month effect. Hence, we do not include dividends. In addition to analyzing the data for the entire period (February 1971 to December 2016), to gain deeper insight into the behavior of the Nasdaq Composite we divide the period into the following sub-periods:
February 1971 to December 1992; January 1993 to December 2002 (includes run-up caused by the dot.com boom and
the crash in mid-2000); January 2003 to December 2016 (includes the volatile world we live).
We hope to show that the month effect is sensitive to the time-period under study. Many studies have used the dummy variable methodology to detect market seasonality. Chien, Lee and Wang (2002) provide statistical analysis and empirical evidence that the methodology may provide misleading results. We avoid this methodology.

Journal of Business and Behavioral Sciences
23
We study the month effect in terms of monthly percentage changes in three different ways:
1. If the mean of monthly percentage changes is different from zero for the sample as well as for each month within the sample. We subject the mean percentage change for a given month i to the following hypothesis test: Ho: µi = 0 vs. Ho: µi≠ 0.
2. If the mean of the monthly percentage changes for a month is different from the mean of the other eleven months stacked. We conduct the following hypothesis test for a given month i: Ho: µi = µj vs. Ho: µi ≠ µj, where j = {1, 2, …, i-1, i+1, ,,,, , 11, 12}.
3. If the variability of the percentage changes for a given month is significantly different from that of the remaining eleven months stacked. We conduct the following hypothesis test for a given month i: Ho: σi
2 = σj2 vs. Ho: σi
2 ≠ σj2, where
j = {1, 2, …, i-1, i+1, ,,,, , 11, 12}.
In addition to standard t-test which assumes normal distribution of the data, we also use Kruskal-Wallis non-parametric test which tests for differences among several population medians, and does not depend on normal distribution of data. We also use Mood’s Median Test which performs a nonparametric analysis of a one-way layout. It is highly robust against outliers and errors in data. Further, we use Mann-Whitney test which performs a two-sample rank test for the difference between two population medians. THE DATA AND DESCRIPTIVE STATISTICS NASDAQ Composite was introduced on February 5, 1971 with an initial value of 100. The first month closed on February 26 with Nasdaq Composite at 101.34. Ignoring the first month since it was a partial month, we have 551 end-of-month NASDAQ Composite values which lead us to 550 values of monthly percentage changes until the end of December 2016 spanning almost 46 years.
Table 1: Monthly % change of NASDAQ Composite 1971-2016 Number of Observations 550
Minimum -27.23
Maximum 21.98
Range 49.21
Mean 0.91
Median 1.29
Standard Deviation 6.06
Skewness -0.49
Kurtosis 1.98
Confidence Level (95.0%) 0.51
Over this period, the value of NASDAQ Composite increased from 101.34 at the end of February 1971 to 5383.12 at the end of December 2016 for a 5,212% increase. In other words, NASDAQ Composite increased by 9.02% compounded
Hamid and Dhakar
24
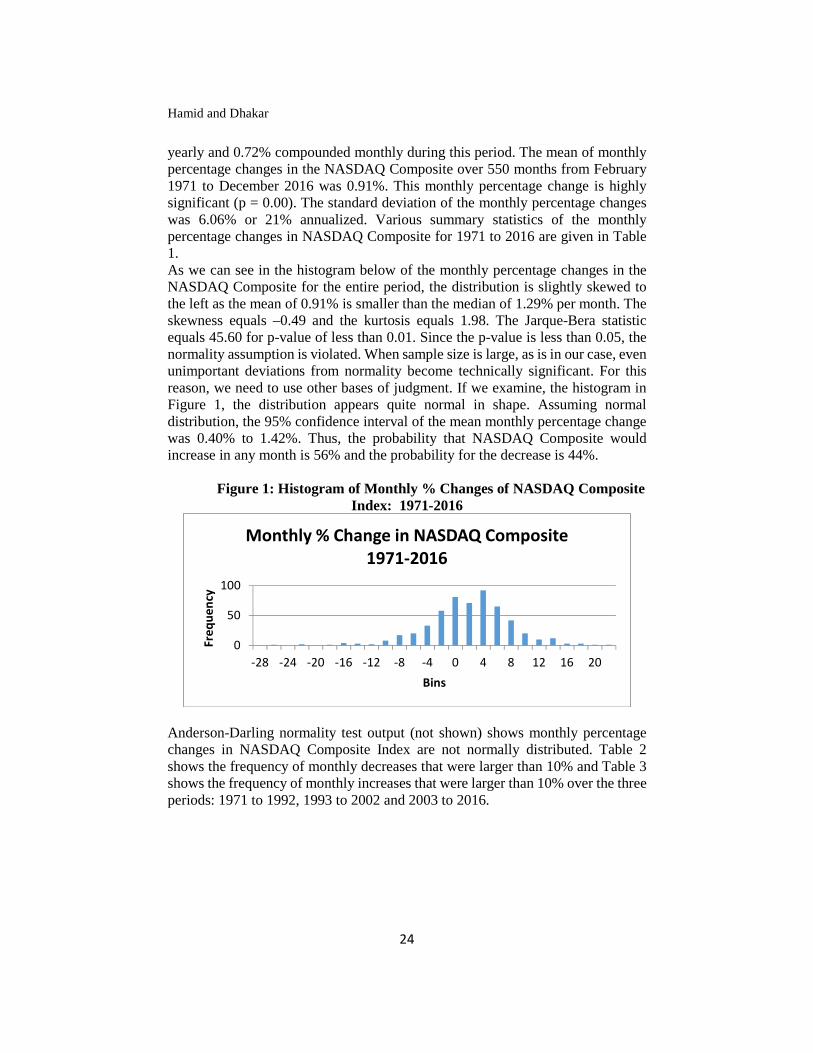
yearly and 0.72% compounded monthly during this period. The mean of monthly percentage changes in the NASDAQ Composite over 550 months from February 1971 to December 2016 was 0.91%. This monthly percentage change is highly significant (p = 0.00). The standard deviation of the monthly percentage changes was 6.06% or 21% annualized. Various summary statistics of the monthly percentage changes in NASDAQ Composite for 1971 to 2016 are given in Table 1. As we can see in the histogram below of the monthly percentage changes in the NASDAQ Composite for the entire period, the distribution is slightly skewed to the left as the mean of 0.91% is smaller than the median of 1.29% per month. The skewness equals –0.49 and the kurtosis equals 1.98. The Jarque-Bera statistic equals 45.60 for p-value of less than 0.01. Since the p-value is less than 0.05, the normality assumption is violated. When sample size is large, as is in our case, even unimportant deviations from normality become technically significant. For this reason, we need to use other bases of judgment. If we examine, the histogram in Figure 1, the distribution appears quite normal in shape. Assuming normal distribution, the 95% confidence interval of the mean monthly percentage change was 0.40% to 1.42%. Thus, the probability that NASDAQ Composite would increase in any month is 56% and the probability for the decrease is 44%.
Figure 1: Histogram of Monthly % Changes of NASDAQ Composite Index: 1971-2016
Anderson-Darling normality test output (not shown) shows monthly percentage changes in NASDAQ Composite Index are not normally distributed. Table 2 shows the frequency of monthly decreases that were larger than 10% and Table 3 shows the frequency of monthly increases that were larger than 10% over the three periods: 1971 to 1992, 1993 to 2002 and 2003 to 2016.
0
50
100
-28 -24 -20 -16 -12 -8 -4 0 4 8 12 16 20
Fre
qu
en
cy
Bins
Monthly % Change in NASDAQ Composite 1971-2016

Journal of Business and Behavioral Sciences
25
Table 2: Monthly Decreases Larger than 10%: 1971-2016
PeriodJan
Feb
Mar
Apr
May
Jun
Jul
Aug
Sep
Oct
Nov
Dec
Total
1971-1992 1 2 1 2 1 71993-2002 2 1 1 1 2 3 1 112003-2016 1 1 1 3Total 2 2 1 1 4 5 3 3 21
Table 3: Monthly Increases Larger than 10%: 1971-2016
PeriodJan
Feb
Mar
Apr
May
Jun
Jul
Aug
Sep
Oct
Nov
Dec
Total
1971-1992 5 1 2 1 91993-2002 2 1 1 1 1 1 1 1 2 4 2 172003-2016 1 1 1 1 4Total 7 1 1 2 1 1 1 2 2 5 4 3 30
There were a total of 51 such instances from 1971 to 2016. Of those, 28 occurred during the period 1993-2002 (55%), 16 occurred during 1971-1992 (31%) and only seven occurred during 2003-2016 (14%). Most of the larger than 10% changes occurred in the months of August through November. January had the largest number of larger than 10% increases but none of the larger than 10% decreases. June and July also no larger than 10% decreases. Looking at individual values since inception in 1971, Nasdaq Composite fell by as much as 27.23% in October 1987, which included the Black Monday. On the other hand, Nasdaq Composite increased by as much as 21.98% during December 1999, when the Y2K apocalypse did not happen.
ANALYSIS OF RESULTS 1971 to 2016 Table 4 shows that the mean of the 550 monthly changes in the full data set is 0.91% which annualizes to 10.92%. The standard deviation of monthly changes is 6.06% or 20.99%. The months with significant positive mean percentage increases in the NASDAQ Composite Index are Jan (2.35%), December (1.84%), Nov (1.61%), and April (1.35%). The returns of only January and December are significant.

Hamid and Dhakar
26
Table 4: Monthly Percentage Change in Nasdaq Composite Index: 1971-2016
Period 1971-2016
All Jan Feb Mar
Apr May
Jun Jul Aug
Sep Oct Nov
Dec
Count 550 45 45 46 46 46 46 46 46 46 46 46 46
Mean 0.91 2.35 0.6
2 0.8
9 1.3
5 0.9
5 0.67
0.35
0.12
-0.5
30.74
1.61
1.84
Median
1.29 2.97 0.5
71.4
81.6
72.5
20.6
0.13
1.63
0.41
1.94 2.2
90.8
Minimum
-27.23
-9.89 -
22.39
-17.
1
-15.57
-11.91
-9.44
-9.2
2
-19.93
-16.98
-27.2
3
-22.
9-9.69
Maximum
21.98 16.65 19.19
10.94
15 11.07
16.62
10.52
11.66
12.98
17.17
14.22
21.98
Standard Deviation
6.06 6.46 6.5
4 5.2
5 5.5
5 5.1
5 4.86
5.25
6.27
6.33
8.31 6.8
6 5.25
p-value ()
0.00 0.02 0.5
3 0.2
6 0.1
1 0.2
2 0.35
0.66
0.90
0.58
0.55 0.1
2 0.02
p-value (t test)
0.12 0.7
6 0.9
8 0.5
9 0.9
6 0.73
0.46
0.37
0.11
0.88 0.4
7 0.22
p-value (F test)
0.29 0.2
6 0.1
0 0.2
1 0.0
7 0.03
0.10
0.40
0.36
0.00 0.1
3 0.10
Mean % Change
Positive
Positive
Positive
Mo Effect (Mean)
Mo Effect (Var)
Lower
Higher
Note: “Positive” implies the mean of monthly percentage changes was significantly greater than zero; “Negative” implies the mean of monthly percentage changes was significantly less than zero; “Higher” implies the mean or the variance of the monthly percentage changes of a month was significantly higher than those of the other eleven months stacked; “Lower” implies the mean or the variance of the monthly percentage changes of a month was significantly lower than those of the other eleven months stacked. The sum of the mean changes of the three-month period November to January has is 5.80%. Annualized, that is 23.20%. The sum of the returns of the other nine months is 5.60%. So the monthly returns are not even roughly evenly spread out. The mean for September is negative (-0.53%) but significantly different from the mean of changes of the other eleven months at a p value of 0.112 (not highly

Journal of Business and Behavioral Sciences
27
significant). In a similar research with Dow Jones Industrial Average we found significant negative returns for September. The variance of the percentage changes of June is significantly lower than the variance of the other eleven months stacked; the variance of the percentage changes of October is significantly higher than that of other eleven months stacked. October’s changes also have the widest range. This reflects the greater volatility in the monthly changes of October compared to that of other eleven months. This conforms to the perception about October as being a volatile month. The cyclicity of the means of monthly percentage changes for the entire period is clearly visible. On average, there has been a steadily decreasing mean of monthly changes from April to September and then a rising trend until January. Short-term traders stand to gain, on average, by shorting NASDAQ Composite Index stocks in August and then close the position in September. On average, a short-term trader stands to gain significantly by buying at the end of September, and selling at the end of January. Kruskal-Wallis test of difference in medians of monthly changes shows no significant difference in the medians (H-statistic = 6.49; p = 0.84). January has the highest median (2.97%) followed by May (2.52%) and November (2.29%). July has the lowest median (0.13%). Mood Median test also shows no significant difference in the medians (Chi-Square = 5.04, p = 0.93). So both nonparametric tests yield similar results and reinforces the conclusion we got from standard t-test.
1971-1992Table 5 shows the mean change of 0.89% per month for 1971 to 1992 is significantly different from zero. The mean change of January is the highest (3.93%), followed by December (2.01%), November (1.61%), and February (1.59%). The sum of the mean of the changes of these four months is 9.14% or annualized 27.42%. The sum of the mean changes of the other eight months is 1.67%.

Hamid and Dhakar
28
Table 5: Monthly Percentage Changes in NASDAQ Composite Index: 1971-1992
Period
1971-
9211992
All Jan Fe
b
M
ar
Ap
r
M
ay
Ju
n
Jul Au
g
Se
p
Oc
t
No
v
Dec
Count 262 21 21 22 22 22 22 22 22 22 22 22 22
Mean 0.8
9
3.9
3
1.
59
0.
89
1.
37
1.
01
0.
52
-
0.
10
0.
16
-
1.
26
-
0.9
2
1.
61
2.0
1
Median 1.2
1
4.3
0
1.
97
1.
91
1.
50
1.
03
1.
02
-
0.
43
0.
59
-
0.
02
-
0.9
6
2.
22
1.8
9
Minimum -
27.
23
-
8.5
8
-
6.
22
-
17
.1
0
-
8.
18
-
7.
67
-
5.
97
-
8.
41
-
13
.0
1
-
10
.7
4
-
27.
23
-
15
.1
2
-
4.9
7
Maximum 17.
17
16.
65
9.
39
7.
51
8.
46
9.
26
6.
59
8.
89
10
.8
6
6.
04
17.
17
9.
26
11.
92
Standard
Deviation
5.6
0
6.8
4
4.
53
5.
16
4.
46
4.
57
3.
66
4.
75
6.
06
4.
86
9.3
0
5.
80
4.4
7
p-value
()
0.0
11
0.0
16
0.
12
3
0.
43
0
0.
16
3
0.
31
0
0.
51
1
0.
92
3
0.
90
0
0.
23
6
0.6
47
0.
20
6
0.0
47
p-value (t
test)
0.0
42
0.
47
3
0.
99
9
0.
60
7
0.
89
5
0.
64
8
0.
32
7
0.
56
1
0.
04
2
0.3
37
0.
54
5
0.2
41
p-value (F
test)
0.1
09
0.
11
6
0.
32
6
0.
09
1
0.
11
7
0.
00
9
0.
17
0
0.
33
6
0.
21
7
0.0
01
0.
44
6
0.0
96
Mean %
Change
Pos
itiv
e
Pos
itiv
e
Pos
itiv
e
Month
Effect
(Mean)
Hig
her
Lo
we
r
Journal of Business and Behavioral Sciences
29
Month
Effect
(Var)
Lo
we
r
Hi
gh
er
Note: See “Notes” below Table 4. The mean of changes of January is significantly higher than the mean of changes of the other eleven months stacked. The mean of changes of September is significantly lower than the mean of changes of the other eleven months stacked (-1.26%). The variance of the percentage changes of June is significantly lower than the variance of the other eleven months stacked; the variance of the percentage changes of October is significantly higher than that of other eleven months stacked. We see in the full data series similar effect in terms of volatility for the two months. We see a downward trend of monthly changes from the highest level in January to the lowest level in September, and thereafter a rising trend all the way to January. Trading strategy would be similar to what we have for the full data series. Kruskal-Wallis test of difference in medians of monthly changes shows no significant difference in the medians (H-statistic = 11.71; p = 0.39). January has the highest median (4.30%) followed by November (2.22%) and February (1.97%). October has the lowest median (-0.96%). Mood Median test also shows no significant difference in the medians (Chi-Square = 8.20, p = 0.70). Both nonparametric tests yield similar results and do not reinforce the conclusion we get from standard t-test.
1993-2002 Table 6 shows the mean of monthly changes for the second sub-period (0.91%) is not significantly different from zero. This was the result of the stock market crash in mid-200, and the effect of the subsequent massive acts of terrorism on September 11, 2001. But the mean of the changes of none of the months was significantly different from zero at 5% level. Only the mean of January (3.96%) was significantly different from zero at 5.3% level. It was different from the mean change of the other eleven months stacked at 11.2% level. The sum of the mean of the monthly changes of October, November, December, and January is 11.57%. The sum of the mean changes of the other eight months is -0.61%. At 5% significance level we do not find any sort of month effect, either in terms of mean or of volatility.

Hamid and Dhakar
30
Table 6: Monthly Percentage Changes in NASDAQ Composite Index: 1993-2002
Period
1993-
2002
All Ja
n
Fe
b
Ma
r
Ap
r
Ma
y
Ju
n
Jul Au
g
Se
p
Oc
t
No
v
De
c
Count 12
0
10 10 10 10 10 10 10 10 10 10 10 10
Mean 0.9
1
3.
96
-
1.3
9
-
0.6
2
0.5
1
-
0.0
1
2.
76
-
1.
20
0.2
2
-
0.8
8
2.
78
2.6
9
2.
14
Median 1.3
8
2.
96
-
2.3
3
1.5
0
2.4
9
-
0.0
4
2.
68
-
1.
48
2.8
6
1.2
7
1.
94
4.0
3
0.
05
Minimum -
22.
90
-
3.
17
-
22.
39
-
14.
48
-
15.
57
-
11.
91
-
9.
44
-
9.
22
-
19.
93
-
16.
98
-
8.
25
-
22.
90
-
9.
69
Maximu
m
21.
98
14
.2
8
19.
19
7.5
8
15.
00
11.
07
16
.6
2
10
.5
2
11.
66
12.
98
13
.4
5
14.
22
21
.9
8
Standard
Deviation
8.2
6
5.
61
11.
57
6.8
9
8.5
4
6.4
5
7.
63
6.
54
9.2
4
9.6
3
7.
14
11.
05
8.
97
p-value
()
0.2
28
0.
05
3
0.7
12
0.7
83
0.8
54
0.9
98
0.
28
3
0.
57
6
0.9
43
0.7
79
0.
24
9
0.4
62
0.
47
0
p-value (t
test)
0.
11
2
0.5
18
0.4
87
0.8
79
0.6
57
0.
44
5
0.
32
1
0.8
07
0.5
48
0.
41
2
0.6
02
0.
65
9
p-value (F
test)
0.
09
1
0.1
08
0.2
70
0.5
04
0.1
95
0.
41
9
0.
21
1
0.3
72
0.3
07
0.
31
8
0.1
46
0.
41
9
Note: See “Notes” below Table 4. Kruskal-Wallis test of difference in medians of monthly changes shows no significant difference in the medians (H-statistic = 6.07; p = 0.87). November has the highest median (4.03%) followed by January (2.96%) and April (2.49%). May has the lowest median (0.04%). Mood Median test also shows no significant difference in the medians (Chi-Square = 6.07, p = 0.87). Both nonparametric tests yield similar results and reinforces the conclusion we get from standard t-test.

Journal of Business and Behavioral Sciences
31
2003-2016The mean of monthly changes of the third sub-period (0.95%) was significantly different from zero at 1.20% level (Table 7). The mean of monthly changes of July (2.16%) is the highest followed by March (1.98%) and October (1.90%) and April (1.90%%). But none of the means are significantly different from zero at 5% level. The mean of changes of January was negative. This is partly the result of small sample size (14) and partly a reflection of the greater efficiency of the financial markets. The mean of changes of none of the months was significantly different from the mean of the other eleven months stacked. The variance of the monthly changes of October was significantly higher than that of the other eleven months stacked. The variance of the mean of changes of December was significantly lower than that of the other eleven months stacked.
Table 7: Monthly Percentage Changes in NASDAQ Composite Index: 2003-2016
Period
2003-2016
All Ja
n
Fe
b
M
ar
Ap
r
M
ay
Ju
n
Jul Au
g
Se
p
Oc
t
No
v
De
c
Count 168 14 14 14 14 14 14 14 14 14 14 14 14
Mean 0.9
5
-
1.
15
0.
61
1.
98
1.
90
1.
52
-
0.
58
2.
16
-
0.
03
0.8
9
1.9
0
0.8
5
1.3
6
Median 1.4
4
-
1.
42
0.
03
0.
30
1.
35
3.
23
-
0.
43
2.
13
1.
27
1.7
5
4.0
3
2.0
2
0.7
1
Minimum -
17.
73
-
9.
89
-
6.
68
-
2.
56
-
3.
88
-
8.
29
-
9.
10
-
7.
83
-
6.
86
-
11.
64
-
17.
73
-
10.
77
-
1.9
8
Maximum 12.
35
8.
01
7.
08
10
.9
4
12
.3
5
8.
99
3.
90
7.
82
4.
82
12.
04
11.
14
6.1
7
6.1
9
Standard
Deviation
4.8
2
5.
30
3.
99
4.
08
4.
81
5.
30
3.
82
4.
87
4.
19
5.7
4
7.4
2
4.7
5
2.6
3
p-value
()
0.0
12
0.
43
1
0.
58
0
0.
09
2
0.
16
3
0.
30
3
0.
57
8
0.
12
1
0.
97
9
0.5
73
0.3
55
0.5
14
0.0
76
p-value (t
test)
0.
14
1
0.
74
6
0.
34
5
0.
45
3
0.
67
9
0.
14
5
0.
34
8
0.
38
1
0.9
66
0.6
15
0.9
37
0.5
89

Hamid and Dhakar
32
p-value (F
test)
0.
34
4
0.
20
5
0.
23
5
0.
53
7
0.
35
9
0.
15
6
0.
52
7
0.
27
6
0.2
25
0.0
24
0.5
08
0.0
06
Mean %
Change
Pos
itiv
e
Month
Effect
(Mean)
Month
Effect
(Var)
Hig
her
Lo
we
r
Note: See “Notes” below Table 4. Kruskal-Wallis test of difference in medians of monthly changes shows no significant difference in the medians (H-statistic = 8.01; p = 0.71). October has the highest median (4.03%) followed by May (3.23%) and July (2.13%). January has the lowest median (-1.42%). Mood Median test also shows no significant difference in the medians (Chi-Square = 7.43, p = 0.76). Both nonparametric tests yield similar results and reinforces the conclusion we get from standard t-test. However, what emerges is the fizzling out of the January effect in more recent times. The mean change of January was high positive in the first two sub-periods, but it turned negative in the third sub-period.
COMPARISONS OF MEAN OF MONTHLY CHANGES OVER THREE SUB-PERIODS The mean of monthly changes of the three sub-periods are: 0.89%, 0.91%, and 0.95%. No significant difference is detected in the two-sample t-test between the first and second sub-periods, the first and third three sub-periods, and the second and third sub-periods. The standard deviations for the three sub-periods are: 5.60% and 8.26%, and 4.82%. F-test for differences in variances show highly significant differences in the three standard deviations. The second sub-period was most volatile. The last sub-period was the least volatile. Figure 9 shows the higher volatility of mean of monthly changes of the second sub-period. The mean of monthly changes of the last sub-period is the least volatile. The figure also shows the high positive mean change for January in the first two sub-periods and the negative January mean change in last sub-period.

Journal of Business and Behavioral Sciences
33
Figure 9: Comparison of means of monthly percentage changes of NASDAQ Composite Index: 1971 to 1992, 1993 to 2002, 2003 to 2016
Kruskal-Wallis test of the medians of monthly changes of the four sub-periods do not show any significant difference (H-statistic = 0.40; p = 0.94). Though not significantly different, the third sub-period has the highest median (1.03%) followed by the second (0.84%). Mood Median test also shows no difference in the medians (Chi-Square = 0.87, p = 0.83). We used t-tests to find differences in the means of the six pairs that can be formed with the four sub-periods. No significant difference was revealed. We used nonparametric Mann-Whitney tests to find differences in the medians of the six pairs that can be formed with the four sub-periods. Again, no significant difference was detected. We used F-test to explore differences in the standard deviations of the six pairs obtained from four sub-periods. Interestingly we find the variances of each sub-period to be highly significantly different at levels of significance of 0.00 in each case.1 The second sub-period has the highest standard deviation, then the first, then the last, and the third sub-period has the lowest standard deviation. From 8.62% standard deviation of monthly changes that we found for the second sub-period, it came down to 3.57% for the third sub-period (a fall of about 59%). In the last sub-period, it increased to 4.46% (an increase of about 25%).
SUMMARY AND CONCLUSION For the 550 monthly changes in our study, we find that the mean of monthly percentage changes was 0.91% or 10.92%% annualized. The standard deviation of monthly changes is 6.06% or 20.99%. The months with significant positive mean percentage increases in the NASDAQ Composite Index are Jan (2.35%), December (1.84%), Nov (1.61%), and April (1.35%). The returns of only January and December are significant. However, for the full data set, the changes of none
-2.00
-1.00
0.00
1.00
2.00
3.00
4.00
5.00
Jan Feb Mar Apr May Jun Jul Aug Sep Oct Nov Dec
Perc
en
tag
e C
han
ge
Month
Means of Monthly Percentage Changes
1971-19921993-2002
Hamid and Dhakar
34
of the months was significantly greater than the changes of the other eleven months stacked. We do not find monthly seasonality in terms of mean for the full data period (1971 to 2016) but we do find monthly seasonality for the first sub-period (1971 to 1992). We find monthly seasonality in terms of volatility for the full data set as well for the first two sub-periods, but not for the last sub-period (2003 to 2016). Previous researchers have found significantly higher returns in small stocks in January – which came to be known as the January effect. We find significantly higher index changes for January as well as for December using the full data set. But when we decompose the data set into sub-periods, the January effect is highly significant during the first sub-period, not so significant during the second sub-period, and vanishes in the last sub-period (2003 to 2016). This implies higher efficiency in the pricing of the stocks in the NASDAQ Index in recent times. There is seasonality in terms of volatility – volatility of the changes of a month being significantly higher than the monthly changes of the other eleven months stacked – for the full data set, for the first sub-period, and the last sub-period, but not for the second sub-period. The volatility of the monthly changes of October is significantly higher when compared to that of other eleven months stacked, for the full data set, for the first sub-period, and for the last sub-period. The second sub-period (1993 to 2002) is devoid of any form of seasonality. So the month effect varies with the time period we consider. Given that no consistent pattern is detectable is a reflection of the efficiency of the NASDAQ Composite stocks to a large degree.
REFERENCES
Bachelier, L. (1900). “Theorie de la Speculation.“ Paris, Gauthier-Villars, reprinted 1964, in P. Cootner, ed.: The Random Character of Stock Market Prices, (Massachusetts Institute of Technology, Cambridge, Massachusetts), 17 – 78. “
Chien, Chin-Chen, Cheng-few Lee and Andrew M. L. Wang (2002). “A note on stock market seasonality: The impact of stock price volatility on the application of dummy variable regression model.” The Quarterly Review of Economics and Finance, Volume 42, 155-162.
Cowles, A. (1933). “Can Economic Forecasters Forecast?” Econometrica, Volume 7, Number 3, 229 – 263.
Cowles, A. I. And H. Jones (1937). “Some a Posteori Probabilities in Stock Market Action.” Econometrica, Volume 5, 280 – 294.
Hamid, S. A. (2017). “Seasonality in the Monthly Returns of Large Stocks.” Journal of Business and Behavioral Sciences, Volume 29, Number 2, 103-121.
Journal of Business and Behavioral Sciences
35
Kendall, M. (1953). The Analysis of Economics Time Series: Part 1: Prices. In P. Cootner, ed.: The Random Character of Stock Prices (MIT Press, Cambridge).
Lakonishok, J. and S. Smidt (1988). “Are Seasonal Anomalies Real? A Ninety Year Perspective.” Journal of Financial Studies, 1(4), 403 – 425.
Mandelbrot, B. (1966). “Forecasts of Future Prices, Unbiased Markets, and Martingale Models.” Journal of Business, 39, 242 – 255.
Osborne, M. F. M. (1959). “Brownian Motion in the Stock Market.” Operations Research,7, 145 – 173.
Samuelson, P. (1965). “Proof That Properly Anticipated Prices Fluctuate Randomly.” Industrial Management Review, 6, 41 – 49.
Working, H. (1934). “A Random Difference Series for Use in the Analysis of Time Series.” Journal of the American Statistical Association, 29, 11 – 24.
Journal of Business and Behavioral Sciences Vol 30, No 2; Fall 2018
36
CLINICAL COORDINATION AND THE SUPPLY CHAIN: REDUCING ADVERSE EFFECTS OF
MECHANICAL VENTILATION
Ryan N. Schmidt Troy Ward
Texas Tech University Health Sciences Center
ABSTRACT
The purpose of this paper is to analyze current practices as compared to studies regarding the most current evidence-based medicine when attempting to reduce the occurrence of Ventilator Associated Pneumonia (VAP) and reducing the amount of time spent on mechanical ventilation after Coronary Artery Bypass Graft (CABG) surgery. The occurrence of VAP or extensive time on mechanical ventilation after CABG both increase mortality and complicate early liberation from mechanical ventilation. Utilizing the methods found in this paper, various evidence-based best practices will be evaluated for effectiveness and possible implementation. Data will be collected at the facility level and compared to national standards to establish if the need exists. A side by side comparison will then be developed using current practice and the best practices as supported by the referenced studies. In an attempt to achieve real outcomes and change at the facility level, a proposal will be developed that will be presented to all stakeholders explaining the need for the change and the potential increase in resources. This will include analysis of any price or expense-related increases. In conclusion, it was found that some interventions, such as use of sub-glottic suctioning endotracheal tubes and communication of time spent on bypass during CABG, will assist in reducing some of the adverse effects of mechanical ventilation. Furthermore, the new intervention was not only reduced patient safety risk measures but also did so with little significance in cost increases while increasing the quality of care received by the patient.
Key Words: healthcare, supply chain, patient safety, quality, continual process improvement, compliance
INTRODUCTION (PRACTICE/POLICY IMPLICATIONS) The purpose of this study is to provide a real-time, case-based review (within a small to mid-sized hospital; Southwest United States) which demonstrates the need for continuous process improvement through prioritized evaluation/review. This continual process behavior provides operational communication measures that

Journal of Business and Behavioral Sciences
37
reflect both the best interests of patients (quality/safety optimization) and organizational interests (reduction in overall enterprise compliance risk).
The impact of this study provides significant macro-level insight that is two-fold: (1) the importance of the supply chain (contracting/negotiations) on patient care and (2) the continuous need to evaluate buyer agreements impacting provider’s selection decisions and the overall care to patients. The supply chain and its contractual agreements (typically determined through Group Purchase Organizations [GPOs]) are ever-changing and changing at an accelerated rate of influence. Similarly, this rate could be compared to that of health insurers and their in-network/out-of-network reimbursement authorizations towards in-patient services, out-patient service and prescription drug coverage. Typically, health insurance services are being carefully managed by the healthcare setting, although, health organizations have little influence over insurers’ changes in reimbursement (particularly with larger public and private insurers) but fully understand the impact of mismanaging reimbursement. Ironically, health organizations have yet to realize and optimize their supply chain costs even though they have the ability to optimize and achieve substantial levels of savings by doing so. Likewise, the timely review of agreements (current costs of devices in this case) impact the decisional options for physicians to realize they can now choose a safer medical device and improve both patient safety and the quality of care the patient receives. Compliance, risk management and litigation mitigation are a significant threat to the fiscal security of health organizations and the supply chain is directly related to the organization’s ability to provide quality care, at the right price and at the right time to its patients while continuing to follow best practices to reduce risk to both the patient and the health organization.
This case study will further demonstrate the importance of the supply chain while requiring a real-time look at contractual changes in GPO activity in order to best protect the patient and advise physicians on those changes within the participating healthcare organization.
INTRODUCTION (CLINICAL) The occurrence of Ventilator Associated Pneumonia (VAP) has been studied thoroughly over the years. Moliere et al (2010) find that depending on the causative bacteria and susceptibility of such, the morality rate could be as high as 33% for those patients contracting this condition. There are a number of studies outlining the use of protocols to prevent VAP, many of which will be used in this paper to either support the use or discount the process in use at the current facility. The prolonged amount of time spent on a mechanical ventilator after Coronary Artery Bypass Graft (CABG) procedure has also been studied to a lesser extent. Although there is less studied data, it is necessary to note that it is no less dangerous. The protocols in place at the current facility regarding extubating (removing the endotracheal tube) the CABG patient and those suggested as best practice will also be compared and contrasted. In order to understand and give

Schmidt and Ward
38
visual representation between current and proposed future practice, it will be necessary to formulate a side by side comparison. The need for change will be developed into a proposal so all stakeholders can have a voice in its content. As with any change in today’s healthcare environment, this initiative will be explained at an administrative, managerial, and staff member level in order to get input and approval granted. A calendar will then be developed for the roll out process.
Ventilator Associated Pneumonia (VAP) is a condition contracted while a patient is being mechanically ventilated. Klompas et al (2014) explains that VAP is a Health Care Associated Infection (HAI). VAP has been studied throughout the years and was defined at one time by the National Hospital Safety Network (NHSN) as a “never event”. The definition of a never event is a condition that the patient does not have upon admission to the hospital and should “never” occur after their admission. Many protocols have been developed to assist in reducing the occurrence of VAP.
PROBLEM The prolonged ventilation of a patient after a CABG procedure has been found to be rather detrimental to their health. According to Gummus et al (2015), “Prolonged ventilation contributed to chronic renal dysfunction and longer re-perfusion time. Every minute increase for every 82.5 minutes of bypass time increased the risk of delayed extubation by 3.5%”. This information has a two-fold finding; the timing of the surgery itself has a profound impact on the ability to wean from the ventilator. Although you, of course, cannot rush the procedure itself, it is good information to have when considering the patient’s arrival to the critical care unit (CCU). The information on how long the patient was actually on the bypass machine is information not currently given during clinical handoff. This would give the clinicians at bedside some idea of how aggressive they need to be in liberating the patient from the ventilator. The current facility rate from arrival in CCU to extubation stands at 6.5 hours while the benchmark has been set at 6 or less hours.
PREVIOUS RESEARCH The National Safety Healthcare Network (NHSN) works in conjunction with the Centers for Disease Control (CDC) in order to define what constitutes a VAP (CDC, 2017). There are many monitoring elements that define VAP including Ventilator Associated Events (VAE) and Ventilator Associated Conditions (VAC) that finally validates a VAP occurrence. Although NHSN no longer requires reporting of VAP numbers, it is still reported to Leapfrog, a national hospital compare group. The last nationally reported number of VAP per one thousand vent days was 0.1. The current facility rate is 1.18 per one thousand vent days. This data was validated via consultation with the facilities’ in house Infection Prevention Specialist. That may seem high but the low number of overall vent days provides a small denominator. There has only been one occurrence of VAP

Journal of Business and Behavioral Sciences
39
at the facility this year. This analysis and use of the information provided by this research will benefit our patient population.
When analyzing the preventative measures of VAP, we first look at the studies. Klompas et al (2014) studied the effects of the various elements of protocols and made certain recommendations regarding their use. The study broke the recommendations down to one of three categories in regards to the quality of the evidence: low, medium, or high. Many of the protocol elements in current practice are included but there are elements in need of adding and potentially deleting. Elements the study noted should be used in best practice but not being used currently are the use of a non-invasive ventilation protocol to avoid intubation and the use of sub-glottic endotracheal tubes (ETT). These tubes have an opening at the end just above the patient’s vocal chords that constantly suction “micro-aspirates” from the patient’s sub-glottic region. In addition to these two elements, current process includes things the study identifies as “not recommended”; ulcer prophylaxis (providing a medication to reduce stomach acid) and early parenteral nutrition (tube feeding via gastric tube). These elements, whether to include or delete, will be considered later.
As mentioned above, current practice does not include the use of sub-glottic ETT. In the past, an analysis was completed and evidence at that time did not fully support the use of these expensive pieces of equipment. However, Akdogan et al (2017) found that including the use of these tubes along with other elements of an all-inclusive bundle prevent VAP. They found that in the group using sub-glottic ETT (ETT-SD) there was a 43.2% occurrence of VAP when compared to the group with standard tubes that had VAP occur at an 82.29% rate. This proves that using these tubes helps significantly reduce the occurrence of VAP. Other elements used in this study include: cuff pressure measurement, head position, oral care with Chlorhexidine, Peptic Ulcer prophylaxis, Orogastric (as opposed to nasogastric) tube, deep vein thrombosis prophylaxis and daily break of sedation. When comparing these elements to current practice, the use of ETT-SD is necessary to properly assure all evidence-based elements are provided to the patient.
One bundle element that was studied by two researchers was the use of tooth brushing vs. oral care that does or does include the use of chlorhexidine. Chacko et al (2017) found that tooth brushing in their control group had a VAP rate of 10.1/1000 vent days and the experimental group had an occurrence of 8.6/1000 vent days. They concluded that there was no statistically significant difference in the two groups, however, still recommended tooth brushing as a part of overall best practice. Vital et al (2016) compared groups that had tooth brushing with chlorhexidine gel with those getting oral care that included chlorhexidine wash only. They concluded that although not statistically significant, 21.1% occurrence rate in control group vs. 14.2% from the experimental group, the rate of VAP occurrence did go down from one group to the other. Current practice includes the use of chlorhexidine with oral care, not tooth brushing.

Schmidt and Ward
40
Best practices are in place at most healthcare institutions throughout the United States but two studies was performed on compliance with the bundle compliance as their focus. Parisi et al (2016) rolled out a standard VAP bundle including using sodium bicarbonate mouthwash. The use of sodium bicarbonate mouthwash was new to this author. They found that when the compliance rate with the bundle was at their compliance threshold, that the density was reduced from 21.6 to 11.6. This resulted in an overall decrease of VAP occurrence from 23.4 to 15.4/1000 vent days. Another study, Su et al (2017), found that when they monitored the overall hand hygiene compliance, either with alcohol foam or hand washing, the rate of VAP was reduced. What was found interesting while looking through this study is that it was noted, when performing a hand hygiene compliance check after the study had been completed that the hand hygiene compliance went down. This resulted in a requisite increase in the occurrence of VAP. This shows that hand hygiene, always the best way to reduce the rate of infection, is crucial in the reduction of VAP. Current practice includes the monitoring and requisite reporting of hand hygiene compliance monthly by infection control practitioners.
As stated previously, studies on the effects of prolonged mechanical ventilation after a CABG procedure, is not as well studied as VAP but it is necessary to consider when attempting to provide best practice, best care for your patients. CABG procedures, otherwise known as open heart surgery, is performed thousands of times each year throughout the United States. Cardiovascular disease is the leading cause of death. The effects on patients after surgery are often overlooked, in my opinion, because the focus is put on the surgery itself and not the time spent being ventilated after surgery. Prolonged ventilation after CABG surgery causes both short- and long-term side effects. Vagheggini et al (2015) studied the effects of prolonged ventilation in two distinct groups. Group one was those patients that underwent one procedure such as a valve replacement vs. group two that had more than one complication, such as multiple bypasses. It showed that group two had a lower, 78.9% (longer) weaning rate than group one, 43.7%. What was even more telling was the fact the mortality rate of group two was 31.3% compared to group one at 5.3%. This is proof that the more prolonged the mechanical ventilator weaning after complicated CABG procedures, the outcomes degrade very quickly.
Current practice states that a patient will be weaned from the mechanical ventilator within six hours of arrival to CCU. In an attempt to find relative studies, one was found that speaks to certain ventilator modes. Moradian et al (2017) compared the use of Adaptive Support Ventilation (ASV) to that of a more conventional ventilator wean protocol. Essentially, ASV is a mode on the ventilator that makes adjustments from the actual patient data. If the patient needs more or less volume, pressure, etc. the machine makes the adjustment automatically. This study was also directed at analyzing the occurrence of atelectasis in the post CABG patient. It found that the using ASV neither reduced the occurrence of atelectasis in the studied population nor did it reduce the amount of time spent on the ventilator. Of

Journal of Business and Behavioral Sciences
41
note, the study said the patients were easily extubated after twenty to thirty minutes after returning from surgery.
BACKGROUND The differences between what has been learned from the studies vs. what current practice dictates is as follows for VAP bundle:
Current Practice Supported by Evidence Continue with bundle
element
Head of bed 30 degrees Yes Yes Oral care every two hours with chlorhexidine
Oral care is supported, chlorhexidine is questionable without tooth brushing
Add tooth brushing to current practice instead of oral care alone
DVT prophylaxis Yes Yes Cuff pressure 20-25 cmH2O
Evidence suggests a wider range
Adjust current practice to allow a range of 20-30 cm H2O
No circuit change unless inoperable
Yes Yes
Spontaneous awakening trials (SAT)
Yes Yes
Spontaneous breathing trials (SBT)
Yes Yes
Physician explanation for multiple transports
No – Implemented for internal quality purposes
Even though not supported by evidence, this element helps with quality monitoring
Oral gastric tubes Somewhat Yes - This element poses no patient risk and could eliminate exposure to transient flora transfer
As one can see, the current bundle elements are evidence-based. The other element that has been supported by evidence but not yet adopted by the facility is the use of ETT-SD. After researching this topic, the recommendation will come forward to institute these ETT-SD throughout the facility. In the past, the use of these tubes were cost prohibitive. Therefore, the additional resources needed to add these tubes to the bundle will be analyzed in the next section.

Schmidt and Ward
42
ANALYSIS/IMPLEMENTATION PLAN In order to better understand the impact that will occur with the use of these ETT-SD, a cost analysis was performed. The first step was to obtain the annual usage of ETT at the facility. Second, it was necessary to obtain pricing on both the tubes currently in use and the ETT-SD. Third, it was necessary to investigate whether or not the newly proposed equipment was on a Group Purchasing Organization (GPO) contract. A summary and financial breakdown of the data will follow.
The data were obtained and the information assimilated as a mostly accurate representation of what the additional resources would entail. An analysis was performed, and stakeholders involved in the process moving forward. It was decided that all ETT would need to be replaced for consistency. It was generally felt that if each area could have a different choice of ETT it would result in the unnecessary reintubation of a patient. In other words, if the patient was intubated with a standard ETT and then moved to CCU, they would have to be reintubated to meet bundle protocols. This data also includes those areas that keep stock of ETT and outfit each intubation tray in each crash cart. The two GPOs that were associated with the facility were contacted. After obtaining the cost of standard ETT vs. that of the ETT-SD, the following was found:
Replace stock on shelves and in crash cart
Actual annual volume 2016
Anticipated total needed
Cost of traditional ETT
Cost of new ETT-SD
Additional resources (capital) needed
670 6,239 6,909 $1.47 $1.86 $2,694.51
There was a lack of significant pricing variation between the two bundled options being considered. Previously, it was disclosed that the ETT-SD were 200-300 percent higher in price than traditional ETT.
The next step to adopting this element was to create a proposal for administrative approval. Although this may seem completely reasonable to clinicians, it still results in an increase in supply expense that must be justified. The following is the proposal to be sent to administration for approval:
In order for the Cardiopulmonary and Neurology Division to function effectively in preventing the occurrence of Ventilator Associated Pneumonia (VAP), we are suggesting changes in the existing VAP bundle that will require additional resources. Traditional endotracheal tubes (ETT) allow micro-aspirates to be aspirated into the lungs. These micro-aspirates have been shown to contribute to the occurrence of VAP. There is evidence that supports the use of sub-glottic draining ETT to remove the micro-aspirates. In the past, it was cost prohibitive to use these tubes because they were much more costly than traditional ETT.
Journal of Business and Behavioral Sciences
43
However, after performing an analysis (available upon request) we found that we need only $2,694.51 to convert existing stock and anticipated volumes vs. those used in fiscal year 2016. We find that this small amount of increase to supply cost will pay dividends in reducing our current VAP rate of 1.18 per 1000 vent days more towards best practice standards of care at 0.1 per 100 vent days as of the last national report. We appreciate the consideration of this proposal and look forward to your response.
The justification and decision needed to move forward with the other two bundle adjustments, adding tooth brushing to oral care and adjusting the range of cuff pressure, can be approved at the Critical Care Interdisciplinary Council (CCIC) that occurs once per month.
Other concerns about the changes associated with this recommendation need to be considered as well. However, before the changes can move forward, there are other considerations. This change must go to the various physician-based councils for approval. Although not attended by every physician, the minutes reflect the changes approved and are to be read by physicians in that practice area. In addition to going to the CCIC, this proposal will need approval from the Hospital Based Physician group, the Cardiovascular Committee, and Medical Executive Committee (MEC). Arrangements will be made with the physician relations office pending approval from administration. The educational needs will also be assessed pending approval. This will mean coordinating said education between Cardiopulmonary staff and Critical Care Nursing to assure a common knowledge. This includes an analysis to see if there is anything further in need of documentation. The coordination of this education will be the responsibility of both educators in the respective areas. The vendor will be contacted for a demonstration and to provide in-service training to applicable staff.
CONCLUSION/FUTURE RESEARCH This study demonstrated the direct impact that the supply chain can have on both patient safety and reducing the overall risk of VAP. Additionally, supply chain measure can also reduce the overall litigation risk to the healthcare organization while providing quality care at the right price. In this case, VAP is an outstanding example for which it is clear that the patient acquired the illness as a result of preventable experiences suffered within the walls of the healthcare organization. Although there are acceptable levels of VAP, they are very low and the healthcare organization must strive to meet standards of practice while reducing the overall costs of quality care. There is a significant need for healthcare organizations to continually explore cost-effective best practice measures and, most often, those clinical and fiscal explorations directly involve the supply chain.
Future research could be done and replicate the correlation between the following three areas: (1) best practice standards/acceptable standards of care, (2) supply chain [variations in medical devices/GPO pricing agreements] and (3) physician

Schmidt and Ward
44
integration into both practice standards and supply chain/GPO changes in negotiated pricing.
REFERENCES
Nguile-Makao, M., Zahar, J. R., Francais, A., Tabah, A., Garrouste-Orgeas, M., Allaouchiche, B., … Goldgran-Toledano, D. (2010). Attributable mortality of ventilator-associated pneumonia: respective impact of main characteristics at ICU admission and VAP onset using conditional logistic regression and multi-state models. Intensive Care MedicineRetrieved from https://link-springer-com.ezproxy.ttuhsc.edu/content/pdf/10.1007%2Fs00134-010-1824-6.pdf
Klompas, M., Branson, R., Eichenwald, E., Greene, L., Howell, M., Lee, G., . . . Berenholtz, S. (2014). Strategies to Prevent Ventilator-Associated Pneumonia in Acute Care Hospitals: 2014 Update. Infection Control and Hospital Epidemiology, 35(8), 915-936. doi:10.1086/677144
Funda Gumus, Adil Polat, Abdulkadir Yektas, Tolga Totoz, Murat Bagci, Vedat Erentug, Aysin
Alagol, Prolonged Mechanical Ventilation after CABG: Risk Factor Analysis, In Journal of Cardiothoracic and Vascular Anesthesia, Volume 29, Issue 1, 2015, Pages 52-58, ISSN 1053-0770, https://doi.org/10.1053/j.jvca.2014.09.002.
Ozlem Akdogan, Yasemin Ersoy, Ciğdem Kuzucu, Ender Gedik, Turkan Togal, Funda Yetkin,
Assessment of the effectiveness of a ventilator associated pneumonia prevention bundle that contains endotracheal tube with subglottic drainage and cuff pressure monitorization, In The Brazilian Journal of Infectious Diseases, Volume 21, Issue 3, 2017, Pages 276-281, ISSN 1413-8670, https://doi.org/10.1016/j.bjid.2017.01.002.
Chacko, R., Rajan, A., Lionel,P., M., T., Yadav, B., & Premkumar, J. (2017). Oral
decontamination techniques and ventilator associated pneumonia. British Journal of Nursing, 26(11), 594-599
De Lacerda Vidal, C. F., Vidal, A. K. de L., Monteiro, J. G. de M., Cavalcanti, A., Henriques, A.
P. T., Oliveira, M., Lacerda, H. R. (2017). Impact of oral hygiene involving toothbrushing versus chlorhexidine in the prevention of ventilator-associated pneumonia: a randomized study. BMC Infectious Diseases, 17, 112. http://doi.org.ezproxy.ttuhsc.edu/10.1186/s12879-017-2188-0
Su, K.-C., Kou, Y. R., Lin, F.-C., Wu, C.-H., Feng, J.-Y., Huang, S.-F., Chang, S.-C. (2017).
Journal of Business and Behavioral Sciences
45
A simplified prevention bundle with dual hand hygiene audit reduces early-onset ventilator-associated pneumonia in cardiovascular surgery units: An interrupted time-series analysis. PLoS ONE, 12(8), e0182252. http://doi.org.ezproxy.ttuhsc.edu/10.1371/journal.pone.0182252
Vagheggini, G., Vlad, E. P., Mazzoleni, S., Bortolotti, U., Guarracino, F., & Ambrosino, N. (2014). Outcomes for difficult-to-wean subjects after cardiac surgery. Respiratory Care, 60(1), 56-62. doi:10.4187/respcare.03315
Moradian, S. T., Saeid, Y., Ebadi, A., Hemmat, A., & Ghiasi, M. S. (2017). Adaptive Support
Ventilation Reduces the Incidence of Atelectasis in Patients Undergoing Coronary Artery Bypass Grafting: A Randomized Clinical Trial. Anesthesiology and Pain Medicine, 7(3), e44619. http://doi.org.ezproxy.ttuhsc.edu/10.5812/aapm.44619
Ventilator associated events (VAE). (2017, January). Retrieved from https://www.cdc.gov/nhsn/pdfs/pscmanual/10-vae_final.pdf

Journal of Business and Behavioral Sciences Vol 30, No 2; Fall 2018
46
TOWARD EFFECTIVE USE OF THE STATEMENT OF CASH FLOWS
Allen G. Arnold R. Barry Ellis
V. Sivarama KrishnanUniversity of Central Oklahoma
ABSTRACT This paper promotes the use of the statement of cash flows in financial analysis by exploring analytical techniques using elements of the statement. The Financial Accounting Standards Board made the statement of cash flows a required part financial reporting in 1987 and, since 1988, companies have included the statement of cash flows in their quarterly and annual reports. Our review of collegiate finance textbooks shows that financial analysis, as presented in most of these textbooks, is predominantly based on the income statement and the balance sheet. The statement of cash flows is typically discussed as an after-thought, if at all. Practically all the financial ratios are based on numbers drawn from either the income statement or balance sheet. The paper develops a common-size analysis framework as the starting point for the financial analysis using the statement of cash flows. We propose four different common-size models for financial analysis using the statement of cash flows and discuss the relative merits and disadvantage of these. As diagnostic tools, common-size statement of cash flows can be used to examine the quality of a firm’s earnings as well its life cycle phase (growth, mature, declining, etc.) We review eight ratios based on components of the statement of cash flows as alternatives to traditional financial ratios.
Keywords: Statement of cash flows, dividend sustainability, leverage ratios, solvency ratios, capital intensity, capital reinvestment
INTRODUCTION Financial analysis utilizes ratios based on financial statements to standardize financial data for comparison of internal and external performance. The usefulness of financial statements for financial analysis is of utmost importance to academic researchers, investors and regulators. In the Statement of Financial Accounting Concepts No. 2, the Financial Accounting Standards Board (FASB) examines the qualities that make accounting information (FASB, 1980) and lists the key qualitative characteristics for usefulness as relevance and reliability. FASB states that, in order to be relevant, information must be capable of making a difference in a decision and should have predictive value.

Journal of Business and Behavioral Sciences
47
In 1987, the Financial Accounting Standards Board, to address the qualitative characteristic of relevance, required the statement of cash flows to be included in financial reporting. The statement of cash flows incorporates information from the balance sheet and income statement in three major categories to calculate cash flow. The statement has been included in corporate quarterly and annual reports since 1988 (Mautz & Angell, 2009) and requires the classification of cash payments and receipts according to their attribution from operating, investing, or financing activities (FASB, 1987). However, a review of 13 current textbooks in the discipline of Finance shows that much of the financial analysis as presented in these textbooks is predominantly based on the balance sheet and income statement data (Bodie, Kane, & Marcus, 2013; Block, Hirt, & Danielsen, 2011; Brigham & Davies, 2013; Brigham & Ehrhardt, 2014; Brigham & Houston, 2013; Cornett, Adair, Nofsinger, 2012; Gitman, 2009; Keown, Martin, & Petty, 2014; Lasher, 2011; Melicher, & Norton, 2011; Ross, Westerfield, & Jaffe, 2013; Ross, Westerfield, & Jordan, 2013; Titman, Keown, & Martin, 2011). The statement of cash flows is rarely utilized in ratio analysis. Essentially, three decades after the introduction of the statement of cash flows, almost all financial ratios are based on elements from the income statement and/or balance sheet. The present focus of financial analysis is on income and assets/liabilities rather than on corporate cash flows. In contrast, the statement of cash flows concentrates on financial liquidity, corporate sustainability, and durability.
Greater utilization of the statement of cash flows in financial analysis could supplement traditional balance sheet and income statement analysis in providing new direction for creditors, investors, and managers. In conducting a literature review of peer-reviewed journals, 2,855 articles were located using the search terms “balance sheet analysis” and “income statement analysis,” but only104 papers were identified through “statement of cash flows analysis.” Virtually none of the journal articles were focused on financial analysis utilizing the statement of cash flows’ data to create cash flow-based ratios to evaluate and compare corporate firms’ performance. This paucity of peer-reviewed research using statement of cash flows in financial analysis indicates a need for further study in this specific area.
This paper presents an overview of approaches to financial analysis that utilize the information presented by the statement of cash flows to supplement and enhance the extant financial analysis tools. The paper reviews statement of cash flows ratios and proposes a common-size methodology as an initial framework for financial analysis using the statement of cash flows. The statement of cash flows, when presented in a common-size format, provides more useful and easily understandable information to compare financial performance, both internally and externally. Eight statement of cash flows ratios are reviewed and illustrated as simple diagnostic tools to identify a firm’s relative strengths and weaknesses. Also, four distinct common-size models are offered and illustrated for comparison relating to

Arnold, Ellis and Krishnan
48
their relative merits and disadvantages. Prior to presenting the statement of cash flows as a valuable and indispensable resource in analysis focused on business performance evaluation, this paper will offer a review of the pertinent literature relating to financial statement ratio analysis from a comparative valuation perspective.
LITERATURE REVIEW Financial ratios produce important information utilized in a fundamental analysis of a firm. Financial data are derived from the firm’s balance sheet, income statement, statement of shareholders’ equity, and the statement of cash flows (Brigham & Ehrhardt, 2014). Financial ratio analysis has been utilized for decades to evaluate firm performance and financial condition and to predict firm sustainability regarding bankruptcy (Chen & Shimerda, 1981). Financial statement comparability is paramount in order to evaluate a firm’s financial performance. Financial analysts need to be able to accurately analyze financial data, both between firms and over time (Horrigan, 1968). This is a declared goal of the Financial Accounting Standards Board (FASB). Standardization and comparability is of extreme importance to analysts, regulators, managers, lenders, investors, and other users of financial statements (De Franco, Kothari, & Verdi, 2011).
Plewa and Friedlob (2002) noted that horizontal analysis and vertical analysis were frequently utilized to analyze balance sheets and income statements, but not the statement of cash flows. They recommended the use of vertical and horizontal analysis to evaluate trends and relationships in statement of cash flows analysis. Their technique used percentage analysis to highlight specific relationships in analyzing financial data. They stated that vertical analysis frequently utilized common-size financial statements to focus on a firm’s relationships between sales and expenses (income statement) and/or assets and equity (balance sheet). Common-sized financials can also be used as a scaling factor for standardization in comparing financial statements among different size companies. Plewa and Friedlob proposed using this method to analyze the statement of cash flows to elucidate management decisions relating to operating, investing, and financing activities of a firm (2002).
The utility of common size analysis is in comparing a firm’s performance across time periods, or with competitors or industry standards (Brigham & Ehrhardt, 2014). Rolph, in reviewing Wall and Dunning’s Ratio Analysis of Financial Statements, stated that the utilization of common-size ratios was “of great importance even if their sole function were to focus the attention of the analyst on relevant phases of the financial statement which are usually overlooked” (1928, p. 227). The cash flow patterns are also valuable in an examination of the quality of a firm’s earnings relating to its life cycle phase (introduction, growth, mature, shake-out, decline) (Dickinson, 2011). Further, Dickinson finds a slight but
Journal of Business and Behavioral Sciences
49
exploitable market inefficiently in the use of the life cycle information contained in the statement of cash flows.
Traditionally, financial statement analysis relies on ratios derived from data retrieved from the firm’s balance sheet and/or income statement (Ibarra, 2009; Le Maux & Morin, 2011). Balance sheet and income statement ratios provide a plethora of valuable information about a firm relating to its assets, debt load, sales, earnings before interest and taxes, tax obligations and net income, however they have certain limitations. A balance sheet displays historical asset values and is a static document, frozen in time and place. Income statements based on accrual accounting include non-cash allocations, such as depreciation, amortizations, and pension contributions, which minimize taxation, but do not reflect a firm’s true cash position (Mills & Yamamura, 1998). Recording transactions when they occur, regardless of when the cash is actually received or paid, can paint a picture that loses track of cash flows. Liu, Nissim, and Thomas explicate that the purchase of inventory with cash reduces operating cash flow, but earnings remain unaffected until the inventory is sold (2007). A more detailed understanding of a firm’s sources and uses of its cash, and how and why values on specific ledger items have changed, requires an examination of the statement of cash flows. Figlewicz and Zeller (1991) find that cash flow ratios enhance the ability to assess the firm’s performance, ability to fund growth, and service debt and equity obligations.
The three categories of the firm’s activities – operating, investing, and financing - provide a comprehensive portrait of the financial condition of the firm that cannot be deduced from the balance sheet and income statement alone (Ibarra, 2009; Mautz & Angell, 2009). The statement of cash flows can be constructed using the direct method or the indirect method. In the direct method, separate categories of cash inflows and outflows are presented resulting in a net cash flow from operations. The indirect method reconciles the net income, as reported on the income statement, with the firm’s cash flow from operations. Traditionally, the indirect method has been used in 90% of statements of cash flows (Broome, 2004). Utilizing the indirect method to convert accrual-based data to cash inflows and outflows, the statement of cash flows incorporates information from the balance sheet and/or income statement in three major categories to reconcile the change in the cash and cash equivalents account.
A singular advantage of the statement of cash flows is its focus on liquidity, especially in regard to bankruptcy predictability. Financial ratios are used to evaluate the financial condition of a firm relating to bankruptcy (Altman, 1968; Beaver, McNichols, & Rhie, 2005; Chawla, 2013; Wu, Gaunt, & Gray, 2010), however very few research studies have utilized data from, or ratios based on, the statement of cash flows (Bhandari & Iyer, 2013; Murty & Misra, 2004; Piatti, 2014). Analysis of a statement of cash flows can be a valid predictor of business failure (Aziz & Lawson, 1989). The statement of cash flows, which illuminates a firm’s ability to convert its activities into cash, has been essentially disregarded by

Arnold, Ellis and Krishnan
50
most financial analysts, who tend to concentrate only on balance sheet and income statement entries and ratios (Le Maux & Morin, 2011). Although there are many financial analysis ratios that can indicate financial distress, analyzing a firm’s cash flows produces earlier indicators and more effective prediction of early warning signs of impending bankruptcy (Abd-Razak, Zubir, & Wan-Asma’, 2010). Sharma and Iselin (2003) found, both in archival analysis and behavioral experimentation, that the cash flow model exhibited better prediction accuracy with respect to solvency assessment than the accrual model. However, ratios incorporating cash flows from operating activities suffer a major drawback in that the ratio is not meaningful if the cash flows from operating activities is negative (Ibarra, 2009). Further research needs to be conducted to compare and contrast the utility of ratios composed from the statement of cash flows versus ratios traditionally derived from a firm’s balance sheet and income statement regarding business failure prediction accuracy.
This limited literature review adequately presents the value of utilizing the statement of cash flows and common-sized cash flow-based ratios in financial analysis in conjunction with the balance sheet and the income statement. The statement of cash flows, especially when presented in a common-sized format, provides more useful and easily understandable information to compare financial performance, both internally and externally, than other more frequently used financial statements. However, the utilization of the statement of cash flows needs more theoretical development in order to justify and encourage its usage by academics and practitioners in the fields of finance and accounting.
EXAMPLES OF ANALYTICAL TECHNIQUES UTILIZING THE STATEMENT OF CASH FLOWS
The principal tool of financial analysis is the ratio. Financial ratios allow comparisons in relative, rather than absolute, terms, which helps alleviate the problem of size difference. Standardizing or scaling numbers facilitates comparisons. The absolute numbers are normalized through the use of ratios. Common-sizing financial data is an example of the use of financial ratios. The statement of cash flows should be considered for as prominent a role in financial ratio analysis as the balance sheet and the income statement.
The following financial ratios based on the statement of cash flows are appropriate, and can augment traditional financial ratios.
1. Cash Return on Assets: cash flow from operating activities/average total assets (Figlewicz and Zeller, 1988). Figlewicz and Zeller classify this ratio as an efficiency ratio. The higher the ratio, the better the use of assets. Cash return on assets is similar to return on assets; cash return on assets measures the contribution of assets to operating cash flows while return on assets measures the contribution of assets to net income.

Journal of Business and Behavioral Sciences
51
2. Cash Flow Margin: cash flow from operating activities/sales (Figlewicz and Zeller, 1988). This is a profitability ratio similar to profit margin. The higher the ratio, the greater the ability to translate sales into cash.
3. Cash Return Ratio: cash flow from operating activities/average shareholders’ equity (Figlewicz and Zeller, 1988). This is a profitability ratio similar to return on common stockholders’ equity and signals future actual return on equity. A rising trend is favorable.
4. Earnings Quality Ratio: cash flow from operating activities/net income (Figlewicz and Zeller, 1988). The higher the ratio, the more sustainable earnings are and the higher the integrity of the earnings.
5. Cash Flow / Dividend Coverage Ratio: cash flow from operating activities/common dividends (Figlewicz and Zeller, 1988). Both the numerator and denominator can be calculated on a per share basis, producing the same result. This ratio is similar to the reciprocal of the payout ratio. The payout ratio is often used to determine the sustainability of dividends. The cash flow/dividend coverage ratio measures the degree of protection for equity investors. A higher ratio and an increasing trend indicate a higher ability to sustain and increase the level of dividends.
6. Cash Debt Coverage Ratio: cash flow from operating activities/average total liabilities (Weygandt, Kieso, and Kimmel, 1998). This is a leverage or solvency ratio. The higher the ratio, the greater the greater the firm’s ability to carry its debt.
7. Capital Intensity Ratio: capital expenditures/sales (Elmasr, 2007). Capital expenditures is a line item in the cash flow from investing activities section of the statement of cash flows and is likely to be labeled “payment for acquisition of property, plant, and equipment.” The higher the ratio, the more aggressively the firm is reinvesting sales back into capital assets. The ratio can be viewed as the amount of property, plant, and equipment required to generate one dollar of sales revenue.
8. Capital Expenditures Ratio: capital expenditures/net income (Bednarek and Moszoro, 2014). Similar to the capital intensity ratio, the higher the capital expenditures ratio, the more aggressively the firm is reinvesting earnings back into productive assets. The lower the ratio, the less the firm has to spend on property, plant, and equipment. Bednarek and Moszoro suggest that a lower ratio is consistent with higher risk aversion.
Each of the proposed eight ratios are illustrated in Table 1 for fiscal 2013 and 2015 for Apple, Home Depot, and Procter & Gamble.

Arnold, Ellis and Krishnan
52
Table 1 Illustrations of Financial Ratios Using Components of the Statement of Cash Flows
Apple (AAPL)
Ratio 2016 2015 2014
CFO / Avg. Assets 0.2151 0.3112 0.2721 CFO / Sales 0.3053 0.3477 0.3267 CFO / Avg. Equity 0.5317 0.7039 0.5080 CFO / NI 1.4408 1.5220 1.5113 CFO / Dividends 5.4176 7.0293 5.3670 CFO / Avg. Liab. 0.3611 0.5577 0.5862 CapEx/Sales 0.0591 0.0481 0.0524 CapEx/NI 0.2787 0.2106 0.2422
Home Depot (HD)
Ratio 2016 2015 2014
CFO / Avg. Assets 0.2272 0.2049 0.1870 CFO / Sales 0.1059 0.0991 0.0968 CFO / Avg. Equity 1.1987 0.7546 0.5035 CFO / NI 1.3373 1.2990 1.4165 CFO / Dividends 3.0924 3.2577 3.4008 CFO / Avg. Liab. 0.2804 0.2812 0.2974 CapEx/Sales 0.0170 0.0173 0.0176 CapEx/NI 0.2144 0.2273 0.2579
Procter & Gamble (PG)
Ratio 2016 2015 2014
CFO / Avg. Assets 0.1203 0.1067 0.0985 CFO / Sales 0.2363 0.1915 0.1680 CFO / Avg. Equity 0.2551 0.2196 0.2013 CFO / NI 1.4556 2.0448 1.1844 CFO / Dividends 2.0757 2.0047 2.0197 CFO / Avg. Liab. 0.2277 0.2076 0.1927 CapEx/Sales 0.0508 0.0490 0.0463 CapEx/NI 0.3125 0.5230 0.3265

Journal of Business and Behavioral Sciences
53
Four common-size statement of cash flow models are proposed: common-size by sales, common-size by net income, common-size by EBIT, and common-size by EBITDA.
1. Common-Size by Sales: scaling on sales is proposed because generating sales gives rise to all the cash inflows and outflows. Ultimately, earnings growth must come from revenues. Scaling on sales also provides a ready comparison with the common size format used for income statements.
2. Common-Size by Net Income: scaling on net income is proposed because it reflects expenses and indicates the company’s financial position and ability to manage assets. Net income can be reinvested or distributed to owners. Stock returns have been shown to be highly correlated to net income (Ball and Brown, 1968 and Wahlen, Baginski, and Bradshaw, 2014). However, the informational content of net income may be diminished by the disadvantages of accrual accounting described above.
3. Common-Size by EBIT: scaling on EBIT is proposed because the measure is a close proxy for operating income and is not impacted by the financing mix used by the firm; EBIT, however, includes the non-cash flow charge of depreciation. Another possible disadvantage of EBIT is the exclusion of income taxes; firms that produce positive earnings must pay taxes.
4. Common-Size by EBITDA: scaling on EBITDA is proposed because of its similarity to the cash flows from operating activities. EBITDA excludes the non-cash expenses of depreciation and amortization from consideration and can be seen as a proxy for cash profit. This has become a popular measure for firms in the growth-phase of their life cycle. EBITDA has value for comparison purposes since firms can select different depreciation methods. However, EBITDA does not consider the capital expenditures needed to maintain the firm’s productive capacity.
Apple’s statement of cash flows for 2014 - 2016 raw values used for the common size statements are presented in Table 2 and each of the proposed common size methodologies are illustrated in Tables 3 through 6.
Table 2 Statement of Cash Flows for Apple
In $1,000
2016 2015 2014
REVENUE 215,639,000 233,715,000 182,795,000
EBIT 64,023,000 74,151,000 54,298,000

Arnold, Ellis and Krishnan
54
Depreciation & Amortization
10,505,000 11,257,000 7,946,000
EBITDA 74,528,000 85,408,000 62,244,000
Operating Activities
Net Income 45,687,000 53,394,000 39,510,000
Depreciation and Amortization
10,505,000 11,257,000 7,946,000
Adjustments To Net Income
5,439,000 11,021,000 10,460,000
Changes In Accounts Receivables, net
1,095,000 611,000 -4,232,000
Changes In Accounts Payable
1,791,000 5,400,000 5,938,000
Changes In Inventories
217,000 −238,000 -76,000
Changes In Other Assets
1,090,000 −179,000 167,000
Total Cash Flow From Operating Activities
65,824,000 81,266,000 59,713,000
Investing ActivitiesCapital Expenditures (payment for Property, Plant, & Equipment)
-12,734,000 −11,247,000 -9,571,000
Investments -30,634,000 −44,417,000 -9,017,000
Other Cash flows from Investing Activities
-2,609,000 −610,000 -3,991,000
Total Cash Flows From Investing Activities
-45,977,000 −56,274,000 -22,579,000
Dividends Paid -12,150,000 −11,561,000 -11,126,000
Issuance of Stock 495,000 543,000 730,000
Purchase of Stock -29,722,000 −35,253,000 -45,000,000
Net Borrowings (Commercial Paper and Long-term Debt)
22,057,000 29,305,000 18,266,000
Other Cash Flows from Financing Activities
-1,163,000 −750,000 -419,000
Total Cash Flows From Financing Activities
-20,483,000 −17,716,000 -37,549,000
Change In Cash & Equivalents
-636,000 7,276,000 -415,000

Journal of Business and Behavioral Sciences
55
Note. This table presents abbreviated statements of cash flows for Apple, Inc. for years 2014 - 2016. Revenue, EBIT, Depreciation & Amortization, and EBITDA are also presented here and the values are used as the scaling amounts in Tables 3 - 5. EBIT is calculated as operating income plus income from dividends and interest. Adjustments to net income are comprised of share-based compensation expense, deferred income tax expense, vendor receivables, other current and non-current assets, deferred revenue, current and non-current liabilities. Investments include proceeds from sale, maturing, or purchase of marketable securities. Other Cash flows from Investing Activities include proceeds from other long-term assets, intangibles, and other investing activities. Other cash flows from financing activities include excess tax benefits, and taxes paid related to settlement of equity awards.
Table 3 Common Size Statement of Cash Flows for Apple Standardized on Sales
In Percent
2016 2015 2014
Operating Activities
Net Income 21.19 22.85 21.61
Depreciation and Amortization
4.87 4.82 4.35
Adjustments To Net Income
2.52 4.72 5.72
Changes In Accounts Receivables, net
0.51 0.26 −2.32
Changes In Accounts Payable
0.83 2.31 3.25
Changes In Inventories
0.10 −0.10 −0.04
Changes In Other Assets
0.51 −0.08 0.09
Total Cash Flow From Operating Activities
30.53 34.77 32.67
Investing ActivitiesCapital Expenditures (payment for Property, Plant, & Equipment)
−5.91 −4.81 −5.24
Investments −14.21 −19.00 −4.93
Other Cash flows from Investing Activities
−1.21 −0.26 −2.18

Arnold, Ellis and Krishnan
56
Total Cash Flows From Investing Activities
−21.32 −24.08 −12.35
Financing Activities
Dividends Paid −5.63 −4.95 −6.09
Issuance of Stock 0.23 0.23 0.40
Purchase of Stock −13.78 −15.08 −24.62
Net Borrowings (Commercial Paper and Long-term Debt)
10.23 12.54 9.99
Other Cash Flows from Financing Activities
−0.54 −0.32 −0.23
Total Cash Flows From Financing Activities
−9.50 −7.58 −20.54
Change In Cash & Equivalents
−0.29 3.11 −0.23
Note. This table presents common size statements of Cash Flows for Apple, Inc. for years 2014 - 2016. Values are standardized on sales revenues.
Table 4 Common Size Statement of Cash Flows for Apple Standardized on Net Income
In Percent2016 2015 2014
Operating Activities
Net Income 100.00 100.00 100.00
Depreciation and Amortization 22.99 21.08 20.11
Adjustments To Net Income 11.90 20.64 26.47
Changes In Accounts Receivables, net 2.40 1.14 −10.71
Changes In Accounts Payable 3.92 10.11 15.03
Changes In Inventories 0.47 −0.45 −0.19
Changes In Other Assets 2.39 −0.34 0.42
Total Cash Flow From Operating Activities
144.08 152.20 151.13
Investing ActivitiesCapital Expenditures (payment for Property, Plant, & Equipment)
−27.87 −21.06 −24.22

Journal of Business and Behavioral Sciences
57
Investments −67.05 −83.19 −22.82
Other Cash flows from Investing Activities
−5.71 −1.14 −10.10
Total Cash Flows From Investing Activities
−100.63 −105.39 −57.15
Financing Activities
Dividends Paid −26.59 −21.65 −28.16
Issuance of Stock 1.08 1.02 1.85
Purchase of Stock −65.06 −66.02 −113.90
Net Borrowings (Commercial Paper and Long-term Debt)
48.28 54.88 46.23
Other Cash Flows from Financing Activities
−2.55 −1.40 −1.06
Total Cash Flows From Financing Activities
−44.83 −33.18 −95.04
Change In Cash & Equivalents −1.39 13.63 −1.05
Note. This table presents common size statements of Cash Flows for Apple, Inc. for years 2014 - 2016. Values are standardized on net income.
Table 5 Common Size Statement of Cash Flows for Apple Standardized on EBIT
In Percent2016 2015 2014
Operating Activities
Net Income 71.36 72.01 72.77
Depreciation and Amortization 16.41 15.18 14.63
Adjustments To Net Income 8.50 14.86 19.26
Changes In Accounts Receivables, net 1.71 0.82 −7.79
Changes In Accounts Payable 2.80 7.28 10.94
Changes In Inventories 0.34 −0.32 −0.14
Changes In Other Assets 1.70 −0.24 0.31
Total Cash Flow From Operating Activities
102.81 109.60 109.97
Investing ActivitiesCapital Expenditures (payment for Property, Plant, & Equipment)
−19.89 −15.17 −17.63
Investments −47.85 −59.90 −16.61
Other Cash flows from Investing Activities
−4.08 −0.82 −7.35
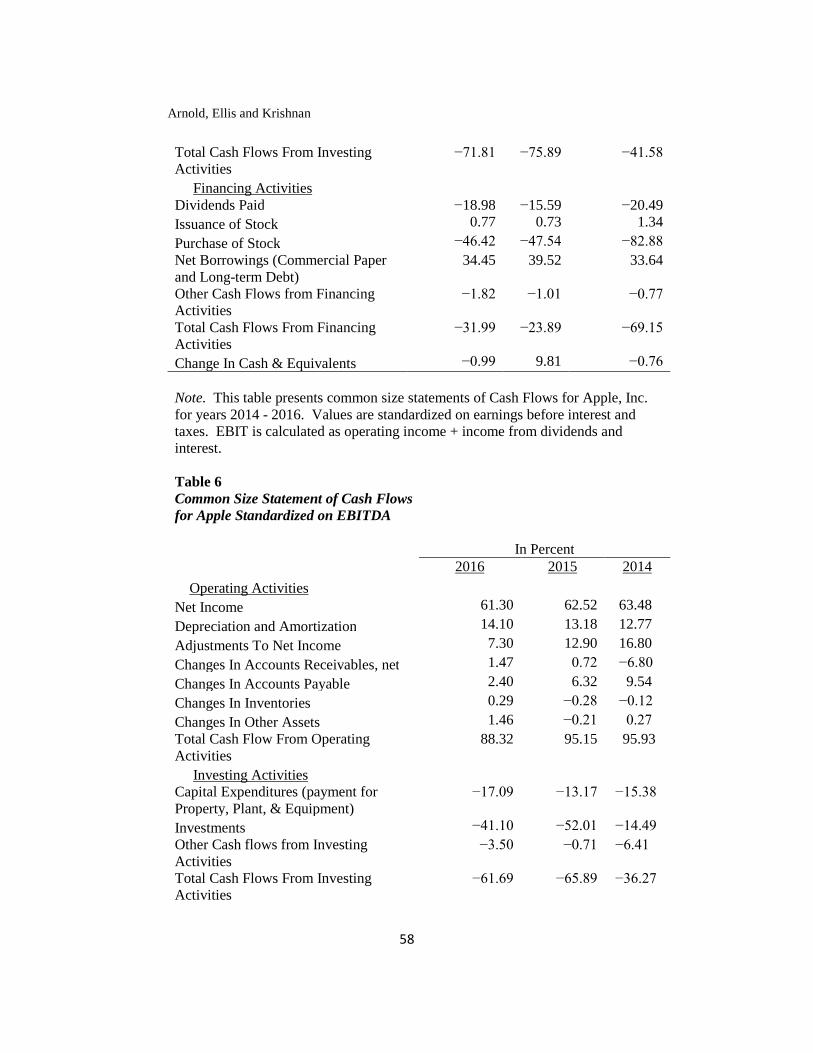
Arnold, Ellis and Krishnan
58
Total Cash Flows From Investing Activities
−71.81 −75.89 −41.58
Financing ActivitiesDividends Paid −18.98 −15.59 −20.49
Issuance of Stock 0.77 0.73 1.34
Purchase of Stock −46.42 −47.54 −82.88
Net Borrowings (Commercial Paper and Long-term Debt)
34.45 39.52 33.64
Other Cash Flows from Financing Activities
−1.82 −1.01 −0.77
Total Cash Flows From Financing Activities
−31.99 −23.89 −69.15
Change In Cash & Equivalents −0.99 9.81 −0.76
Note. This table presents common size statements of Cash Flows for Apple, Inc. for years 2014 - 2016. Values are standardized on earnings before interest and taxes. EBIT is calculated as operating income + income from dividends and interest.
Table 6 Common Size Statement of Cash Flows for Apple Standardized on EBITDA
In Percent2016 2015 2014
Operating Activities
Net Income 61.30 62.52 63.48
Depreciation and Amortization 14.10 13.18 12.77
Adjustments To Net Income 7.30 12.90 16.80
Changes In Accounts Receivables, net 1.47 0.72 −6.80
Changes In Accounts Payable 2.40 6.32 9.54
Changes In Inventories 0.29 −0.28 −0.12
Changes In Other Assets 1.46 −0.21 0.27
Total Cash Flow From Operating Activities
88.32 95.15 95.93
Investing ActivitiesCapital Expenditures (payment for Property, Plant, & Equipment)
−17.09 −13.17 −15.38
Investments −41.10 −52.01 −14.49
Other Cash flows from Investing Activities
−3.50 −0.71 −6.41
Total Cash Flows From Investing Activities
−61.69 −65.89 −36.27
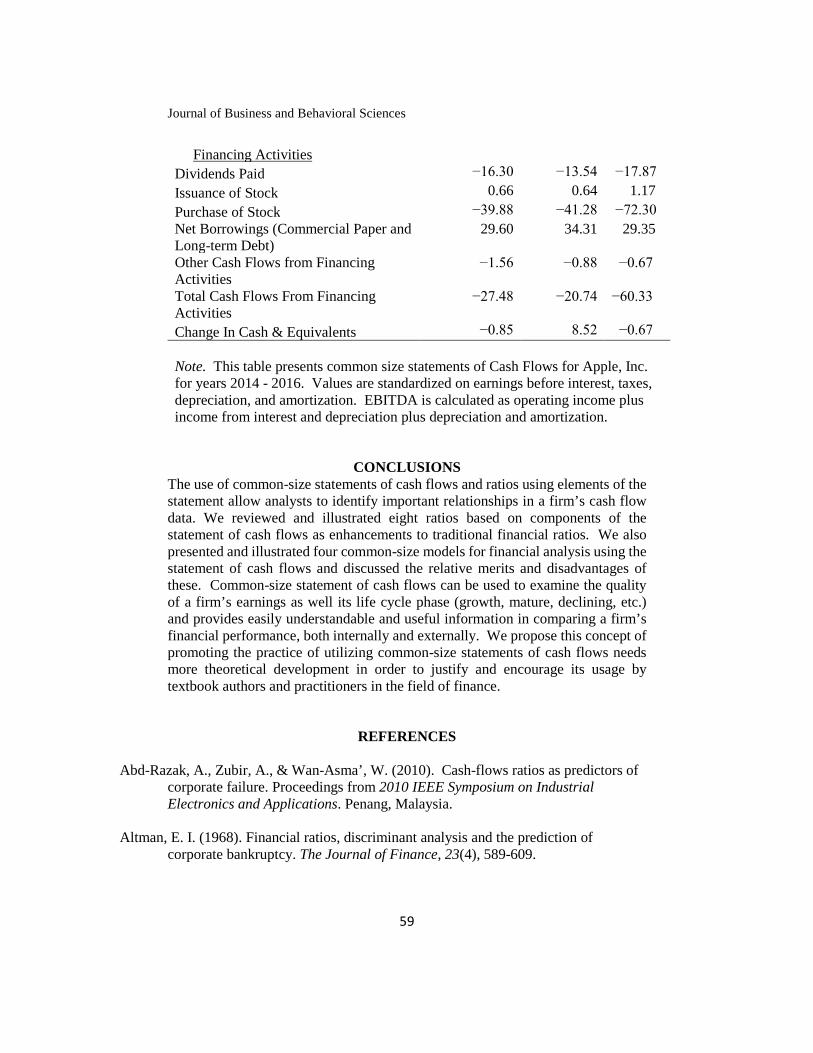
Journal of Business and Behavioral Sciences
59
Financing Activities
Dividends Paid −16.30 −13.54 −17.87
Issuance of Stock 0.66 0.64 1.17
Purchase of Stock −39.88 −41.28 −72.30
Net Borrowings (Commercial Paper and Long-term Debt)
29.60 34.31 29.35
Other Cash Flows from Financing Activities
−1.56 −0.88 −0.67
Total Cash Flows From Financing Activities
−27.48 −20.74 −60.33
Change In Cash & Equivalents −0.85 8.52 −0.67
Note. This table presents common size statements of Cash Flows for Apple, Inc. for years 2014 - 2016. Values are standardized on earnings before interest, taxes, depreciation, and amortization. EBITDA is calculated as operating income plus income from interest and depreciation plus depreciation and amortization.
CONCLUSIONS The use of common-size statements of cash flows and ratios using elements of the statement allow analysts to identify important relationships in a firm’s cash flow data. We reviewed and illustrated eight ratios based on components of the statement of cash flows as enhancements to traditional financial ratios. We also presented and illustrated four common-size models for financial analysis using the statement of cash flows and discussed the relative merits and disadvantages of these. Common-size statement of cash flows can be used to examine the quality of a firm’s earnings as well its life cycle phase (growth, mature, declining, etc.) and provides easily understandable and useful information in comparing a firm’s financial performance, both internally and externally. We propose this concept of promoting the practice of utilizing common-size statements of cash flows needs more theoretical development in order to justify and encourage its usage by textbook authors and practitioners in the field of finance.
REFERENCES
Abd-Razak, A., Zubir, A., & Wan-Asma’, W. (2010). Cash-flows ratios as predictors of corporate failure. Proceedings from 2010 IEEE Symposium on Industrial Electronics and Applications. Penang, Malaysia.
Altman, E. I. (1968). Financial ratios, discriminant analysis and the prediction of corporate bankruptcy. The Journal of Finance, 23(4), 589-609.

Arnold, Ellis and Krishnan
60
Aziz, A., & Lawson, G. H. (1989) Cash flow reporting and financial distress models: testing of hypotheses. Financial Management, 18(1), 55-63.
Ball, R., & Brown, P. (1968). An empirical evaluation of accounting income numbers. Journal of Accounting Research, 159-178.
Beaver, W. H., McNichols, M. F., & Rhie, J. (2005). Have financial statements become less informative? Evidence from the ability of financial ratios to predict bankruptcy. Review of Accounting Studies, 10, 93-122.
Bednarek, Z., & Moszoro, M. (2014). The Arrow–Lind theorem revisited: ownership concentration and valuation. Applied Financial Economics, 24(5), 357-375.
Bhandari, S. B. & Iyer, R. (2013). Predicting business failure using cash flow statement based measures. Managerial Finance, 39(7), 667-676.
Bodie, Z., Kane, A., & Marcus, A. J. (2013). Essentials of investments (9th ed.). New York, NY: McGraw Hill Irwin.
Block, S. B., Hirt, G. A., & Danielsen, B. R. (2011). Foundations of financial management (14th ed.). New York, NY: McGraw Hill Irwin.
Brigham, E. F. & Davies, P. R. (2013). Intermediate financial management (11th ed.). Mason, OH: South-Western, Cengage Learning.
Brigham, E. F. & Ehrhardt, M. C. (2014). Financial management: Theory & practice(14th ed.). Mason, OH: South-Western, Cengage Learning.
Brigham, E. F. & Houston, J. F. (2013). Fundamentals of financial management (13th
ed.). Mason, OH: South-Western, Cengage Learning.
Broome, O. W. (2004). Statement of cash flows: time for change! Financial Analysts Journal, 60(2), 16-22.
Chawla, G. K. (2013). The predictive value of bankruptcy models. The Business Review, Cambridge, 21(2), 17-23.
Chen, K. H. & Shimerda, T. A. (1981). An empirical analysis of useful financial ratios. Financial Management, 10(1), 51-60.
Cornett, M. M., Adair, T. A., & Nofsinger, J. (2012). Finance: Applications & theory (3rd
ed.). New York, NY: McGraw Hill Education
De Franco, G., Kothari, S. P., & Verdi, R. S. (2011). The benefits of financial statement comparability. Journal of Accounting Research, 49(4), 895-931.

Journal of Business and Behavioral Sciences
61
Dickinson, V. (2011). Cash flow patterns as a proxy for firm life cycle. The Accounting Review, 86(6), 1969-1994.
Elmasr, H. (2007). Capital intensity and stock returns. Journal of Investment Strategy, 2(1), 61. FASB. (n.d.). Facts about FASB: Mission. http://www.fasb.org/jsp/FASB/Page/SectionPage&cid=1176154526495
Financial Accounting Standards Board, Statement of Financial Accounting Concepts (SFAC) No. 2—Qualitative Characteristics of Accounting Information (Norwalk, CT: FASB, 1980).
Figlewicz, R. E. & Zeller, T. L. (1988). Ratios from statement of cash flows complement traditional analysis. Financial Management, 17(4), 9-10.
Figlewicz, R. E., & Zeller, T. L. (1991). An analysis of performance, liquidity, coverage, and capital ratios from the statement of cash flows. Akron Business and Economic Review, 22(1), 64-91.
Gitman, L. J. (2009). Principles of managerial finance (12th ed.). Boston, MA: Pearson Prentice Hall.
Horrigan, J. O. (1968). A short history of financial ratio analysis. The Accounting Review, 43(2). 284-294.
Ibarra, V. C. (2009). Cash flow ratios: Tools for financial analysis. Journal of International Business Research, 8(1), 91-107.
Keown, A. J., Martin, J. D., & Petty, J. W. (2014). Foundations of finance: The logic and practice of financial management (8th ed.). Upper Saddle River, NJ: Pearson.
Lasher, W. R. (2011). Practical financial management (6th ed.). Mason, OH: South-Western, Cengage Learning.
Le Maux, J. & Morin, D. (2011) Black and white and red all over: Lehman Brothers’ inevitable bankruptcy splashed across its financial statements. International Journal of Business and Social Science, 2(20), 39-65.
Liu, J., Nissim, D., & Thomas, J. (2007). Is cash flow king in valuations? Financial Analysts Journal, 63(2), 56-68. http://www.jstor.org/stable/4480828
Mautz, R. D. & Angell, R. J. (2009). Reading the statement of cash flows. Commercial Lending Review, 24(3), 15-20.

Arnold, Ellis and Krishnan
62
Melicher, R. W. & Norton, E. A (2011). Introduction to finance: Markets, investments, and financial management (14th ed.). Danvers, MA: John Wiley & Sons.
Mills, J. R. & Yamamura, J. H. (1998). The power of cash flow ratios. Journal of Accountancy, 186(4), 53-61.
Murty, A. V. N. & Misra, D. P. (2004). Cash flow ratios as indicators of corporate failure. Finance India, 18(3), 1315-1325.
Piatti, D. (2014). Operating cash flow and creditworthiness assessment. Academy of Accounting and Financial Studies Journal, 18(2), 1-16.
Plewa, F. J. & Friedlob, G. T. (February, 2002). New ways to analyze: Cash flows. The National Public Accountant. http://www.highbeam.com/publications/the-national-public-accountant-p779/february-2002
Rolph, J. G. (1928). [Review of the book Ratio Analysis of Financial Statements by A. Wall & R. W. Dunning]. Journal of the American Statistical Association, 38, 227-228.
Ross, S. A., Westerfield, R. W. & Jaffe, J. (2013). Corporate finance (10th ed.). New York, NY: McGraw Hill Irwin.
Ross, S. A., Westerfield, R. W. & Jordan, B. D. (2013). Fundamentals of corporate finance (10th ed.). New York, NY: McGraw Hill Irwin.
Sharma, D. S. & Iselin, E. R. (2003). The relative relevance of cash flow and accrual information for solvency assessments: A multi-method approach. Journal of Business Finance & Accounting, 30(7), 1115-1140.
Titman, S., Keown, A. J., & Martin, J. D. (2011). Financial management: Principles and applications (11th ed.). Boston, MA: Prentice Hall.
Wahlen, J. M., Baginski, S. P., & Bradshaw, M. (2014). Financial reporting, financial statement analysis and valuation. Nelson Education.
Weygandt, J. J., Kieso, D. E., and Kimmel, P.D. (1998), Financial accounting, (2nd ed.) Somerset, NJ: John Wiley & Sons.

Journal of Business and Behavioral Sciences Vol 30, No 2; Fall 2018
63
TERRORIST ATTACKS ON SEPTEMBER 11, 2001: A TEST OF MARKET EFFICIENCY IN THE INSURANCE
AND AIRLINE INDUSTRIES
Chad Kozoyed Frank Bacon
Longwood University
ABSTRACT
How will the market react to an unforeseen event? How efficiently did it react to the terrorist attacks on September 11, 2001? This event study tests the semi-strong market efficiency theory by looking at the stock price returns of two samples totaling 29 firms that were greatly affected by this event using the risk adjusted event study methodology. The evidence shows that both the insurance airline industries were greatly negatively affected on and after the event. However, it is clear to see that the firms in the airline industry were hurt a lot worse overall and their stock price returns took a longer time to recover. Regardless of the differentiation, both industries confirm the semi-strong market efficiency theory.
Key Words: market, efficiency, terrorist attack, insurance, airline
INTRODUCTION
“A market is efficient with respect to an information system if and only if security prices act as if everyone knows that information system. If this condition holds, prices are said to "fully reflect" the information system” (Beaver). Market efficiency has two implications. First, in any given time period, a securities’ abnormal return depends on information or news received by the market in that period. And second, an investor who uses the same information as the market cannot expect to earn abnormal returns (Ross). For this to hold, one of the following conditions must be true: investors react rationally, investors have offsetting irrationalities in the marketplace, or arbitrage of professionals dominates the speculation of amateurs in the market. Unforeseen catastrophes like terrorist attacks have a major effect on the overall stock market. These attacks can cause uncertainty and panic and affect all companies in the market. This study tests the semi-strong efficiency theory by analyzing the impact the attacks on September 11, 2001 had on the risk adjusted stock price returns of insurance and airline firms. The biggest attack on American soil was the attack on September 11, 2001 when terrorists hijacked commercial airlines and flew the planes into the World Trade Center and the Pentagon causing mass casualties and destruction. This event hurt over 400 businesses with the destruction of buildings and the loss of major
Kozoyed and Bacon
64
resources. It closed the NYSE for four days until it was re-opened on September 17, 2001. Thus, insurance companies were hit hard after the event by damages to buildings and infrastructure, as well as deaths. In addition, the airline industry suffered damages from the event, but most importantly the attacks significantly reduced air travel with people fearful of another attack. This study looks at the airline and insurance industries since research suggests that they were the most negatively affected by the terrorist attacks.
PROBLEM AND PURPOSE
How does the market respond to an unforeseen crisis? Is the market efficient enough to react to events right as they happen or does it take time for them to adjust? Also, do all of the industries in the market react and behave the same way? What types of industries are most negatively affected by an unforeseen crisis?
The purpose of this study is to test market efficiency by analyzing the effect of the unforeseen September 11, 2001 terrorist attacks on risk adjusted stock returns of 2 samples of different firms each that are expected to have been the most negatively impacted. The study will analyze 20 firms from the life insurance, property and casualty, and insurance brokers industry within the financial sector, as well as 9 firms within the regional and major airlines industry of the service sector. This study will randomly select the sample of firms within the two sectors resulting in a total of 29 different companies. The study hypothesizes that both selected industries reacted negatively to attacks on September 11, 2001 according to semi-strong form efficient market hypothesis. This research analyzes the risk-adjusted rate of return of the stock prices for the insurance and airline sample firms thirty trading days before and thirty trading days after the date of the event in order to test the semi-strong efficient market hypothesis.
LITERATURE REVIEW
Market Efficiency and Investment Analysis Fees
This study tests the semi-strong market efficiency theory by using the standard event study methodology in the finance literature. If the market is semi-strong form efficient, then two popular methods of stock valuation are rendered useless resulting in a most significant implication of this study. Investors pay analysts who use these valuation models billions of dollars annually for investment advice and guidance. Thus, if the market is efficient, these investors are wasting billions of dollars on useless investment advice. Efforts to determine the “right” value of stock are useless since in an efficient market the “right” price is the market price that almost instantly impounds all available and relevant information.

Journal of Business and Behavioral Sciences
65
Technical Stock Analysis
The first method called into question by the efficient market hypothesis is technical stock analysis. Technical analysis is, in essence, the recording of the actual history of trading for one stock or a group of equities and deducing the future trend from this historical analysis. Technical analysts identify buy and sell points by analyzing past price movement with charts. Often called chartists, they closely examine the effect on stock price of supply and demand, popular opinions, moods, guesses, and blind necessities. Using these factors continually and automatically, technical analysis disregards the minor fluctuation in the market and identifies how stock prices tend to move in trends in the long run. Finally changes in trends are determined by shifts in supply and demand relationships and can be detected sooner or later in the market (Levy). With regards to technical analysis, critics contend that the behavior of the stock market in the past may not be indicative of behavior in the years to come and that multiple interpretations could be made by looking at the chart of stock price movements. These critics also argue that if technical analysis were continually successful, an influx of technical traders will neutralize whatever profit potential exists (Levy).
Fundamental Stock Analysis
The other stock valuation model used by analysts to determine market value is fundamental stock analysis. According to the underlying assumption of fundamental stock analysis, each security has an intrinsic value, which is the present value of expected future cash flows of the firm. Therefore, value and future cash flow depend upon the firm’s earning potential, economic variables, and financial factors that cause actual market prices to move toward intrinsic values (Levy). If the fundamental intrinsic value is below the market value, the analyst recommends a sell signal and the opposite or a buy signal when the intrinsic value is above the market value. Critics of fundamental analysis contend that the market reacts so quickly that it is impossible to maximize profit from the market because the investor is forced to wait for information to be publicly available. This information comprises statistics on sales, orders, earnings, and dividend announcements. Not only is this information hard to collect but it is also costly and not always reliable. A fundamental analyst may find himself heavily invested in a security for a considerable length of time before the market support develops (Levy).
Market Efficiency
If the market is semi-strong form efficient, investors are wasting billions of dollars on technical and fundamental analyst fees for worthless advice. There are three different forms of market efficiency as defined by the efficient market hypothesis. These include strong-form efficiency, semi-strong form efficiency, and weak form
Kozoyed and Bacon
66
efficiency. Strong form efficiency states that the market reacts to all forms of information including past, public, and private. This makes it impossible for someone to earn an above normal return because the stock price reflects all information whether known or not. An above normal return would be a return greater than the expected risk adjusted return of the stock price. Accordingly, an investor can’t earn an above normal return by acting on inside information. Research suggests that the market is not strong form efficient because insiders outperform the market with information regarding both profitable and non-profitable situations. This finding provides enough evidence to refute the strong-form of the efficient market hypothesis (Finnerty). Next, the weak form efficient market hypothesis states that all past information is imbedded in stock price. This means that the stock price would not reflect other information, such as earnings forecasts, merger announcements, or money supply figures (Ross). This means that no investor can earn an above normal return by acting on past information rendering technical analysis useless since its basic assumption rests on the ability to use the past stock price movement identified in charts to predict future stock prices. Weak-form efficiency is about the weakest type of efficiency that we would expect a financial market to display because historical price information is the easiest kind of information about a stock to acquire (Ross). No investor can earn an above normal return by acting on past information.
Semi-Strong Form Efficiency
Finally, the form of market efficiency tested in this study is the semi-strong form efficient market hypothesis. This states that all stock prices reflect public information making it impossible to earn an abnormal return by acting or investing on public information, thus rendering fundamental stock analysis useless. This information includes historical stock prices and published accounting statements of a firm (Ross). This study tested the semi-strong form efficient market hypothesis by examining the risk-adjusted returns of 9 airline and 20 insurance firms’ stock prices from thirty trading days before the event to thirty days after. Ross defines an efficient market response as the stock price instantaneously adjusts to and fully reflects new information. There is no tendency for subsequent increases and decreases (Ross).
September 11 Terrorist Attacks and Effect on Insurance and Airline Stock Returns
Previous research shows the market as a whole was significantly negatively affected by the terrorist attacks on September 11th. Marc Davis reported that, “Not only has this attack affected the market but other notable attacks have caused harm as well. On the first day of NYSE trading after 9/11, the market fell 684 points, a 7.1% decline, setting a record for the biggest loss in exchange history for one

Journal of Business and Behavioral Sciences
67
trading day. At the close of trading that Friday, ending a week that saw the biggest losses in NYSE history, the Dow Jones was down almost 1,370 points, representing a loss of over 14%”(Davis, 2017). The attack on September 11th is the second most costly catastrophic event, right behind Hurricane Katrina (Jasen, 2011). This terrorist attack put our economy through a six-month recession and required government intervention in order to recover from the slump (Jasen, 2011).
The financial sector was one of the industries greatly affected. Over 200 insurers shared losses of around $33 billion after the attacks and this led the insurance industry to re-evaluate its risk. The Fiscal Times reports, “Of the $33 billion in insured losses, about a third were property claims, a third were for business interruption, and the remainder were liability (including aviation), workers’ compensation, event cancellation, and life insurance”(Jasen, 2011). Even though insurance companies have taken a hit they have been able to rebound from this crisis and in the long run able to be profitable. They also have been able to learn from this crisis and how to prevent more losses (Woehr, 2006). Today, there is even terrorism insurance to prepare for the worst to come. Next as far as the airline industry is concerned, it was significantly affected by these attacks and possibly made worse off than insurance firms. Marc Davis reported that, American Airlines
stock dropped from a $29.70 per share on September 11 to $18.00 per share on
September 17, a 39% decline. United Airlines stock dropped from $30.82 per share
to $17.50 per share on September 17, a 42% decline. (Davis, 2017) Both of these airlines had their planes hijacked and destroyed on the day of the attack. Not only did airline companies struggle from the wreckage of the aftermath, but they also were affected afterwards by the lack of travel out of fear and increased security procedures by TSA. An economic study performed by Cornell University proved that federal baggage screenings brought about a 6 percent reduction overall in passenger volume, with a 9 percent reduction in the nation's busiest airports, this totaling a nearly $1 billion loss for the airline industry (Blalock). In terms of government intervention both of the industries were treated differently. On September 23, 2001 President Busch signed an Airline Bail Out Package worth $15 billion in federal aid to help the struggling industry in order for airline travel to continue (Bush Signs Airline Bailout Package). It wasn’t until November 26,2002 that President Busch signed the Terrorism Risk Insurance Act of 2002 (Terrorism Risk Insurance Program). This Act allowed the government to bail out the insurance companies as a last resort in the future. The insurance industry’s premiums following the incident rose drastically to account for the possibility of another event occurring.
METHODOLOGY
This study used the standard risk adjusted event study methodology from the finance literature to test the stock market’s response to the attacks on September
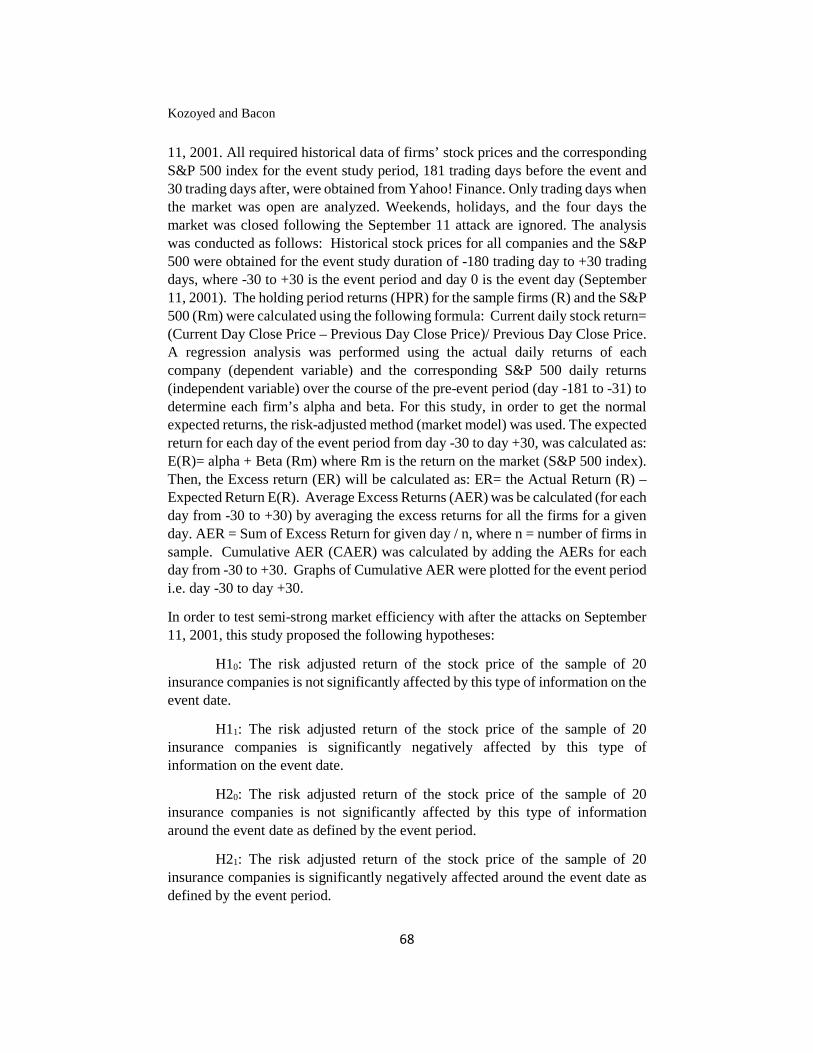
Kozoyed and Bacon
68
11, 2001. All required historical data of firms’ stock prices and the corresponding S&P 500 index for the event study period, 181 trading days before the event and 30 trading days after, were obtained from Yahoo! Finance. Only trading days when the market was open are analyzed. Weekends, holidays, and the four days the market was closed following the September 11 attack are ignored. The analysis was conducted as follows: Historical stock prices for all companies and the S&P 500 were obtained for the event study duration of -180 trading day to +30 trading days, where -30 to +30 is the event period and day 0 is the event day (September 11, 2001). The holding period returns (HPR) for the sample firms (R) and the S&P 500 (Rm) were calculated using the following formula: Current daily stock return= (Current Day Close Price – Previous Day Close Price)/ Previous Day Close Price. A regression analysis was performed using the actual daily returns of each company (dependent variable) and the corresponding S&P 500 daily returns (independent variable) over the course of the pre-event period (day -181 to -31) to determine each firm’s alpha and beta. For this study, in order to get the normal expected returns, the risk-adjusted method (market model) was used. The expected return for each day of the event period from day -30 to day +30, was calculated as: E(R)= alpha + Beta (Rm) where Rm is the return on the market (S&P 500 index). Then, the Excess return (ER) will be calculated as: ER= the Actual Return (R) – Expected Return E(R). Average Excess Returns (AER) was be calculated (for each day from -30 to +30) by averaging the excess returns for all the firms for a given day. AER = Sum of Excess Return for given day / n, where n = number of firms in sample. Cumulative AER (CAER) was calculated by adding the AERs for each day from -30 to +30. Graphs of Cumulative AER were plotted for the event period i.e. day -30 to day +30.
In order to test semi-strong market efficiency with after the attacks on September 11, 2001, this study proposed the following hypotheses:
H10: The risk adjusted return of the stock price of the sample of 20 insurance companies is not significantly affected by this type of information on the event date.
H11: The risk adjusted return of the stock price of the sample of 20 insurance companies is significantly negatively affected by this type of information on the event date.
H20: The risk adjusted return of the stock price of the sample of 20 insurance companies is not significantly affected by this type of information around the event date as defined by the event period.
H21: The risk adjusted return of the stock price of the sample of 20 insurance companies is significantly negatively affected around the event date as defined by the event period.

Journal of Business and Behavioral Sciences
69
H30: The risk adjusted return of the stock price of the sample of 9 airline companies is not significantly affected by this type of information on the event date.
H31: The risk adjusted return of the stock price of the sample of 9 airline companies is significantly negatively affected by this type of information on the event date.
H40: The risk adjusted return of the stock price of the sample of 9 airline companies is not significantly affected by this type of information around the event date as defined by the event period.
H41: The risk adjusted return of the stock price of the sample of 9 airline companies is significantly negatively affected around the event date as defined by the event period.
H50: The risk adjusted return of the stock price of the global sample of 20 insurance and 9 airline companies is not significantly affected by this type of information on the event date.
H51: The risk adjusted return of the stock price of the global sample of 20 insurance and 9 airline companies is significantly negatively affected by this type of information on the event date.
H60: The risk adjusted return of the stock price of the global sample of 20 insurance and 9 airline companies is not significantly affected by this type of information around the event date as defined by the event period.
H61: The risk adjusted return of the stock price of the global sample of 20 insurance and 9 airline companies is significantly negatively affected around the event date as defined by the event period.
The sample firms were randomly selected from the life Insurance, property and casualty, and insurance brokers industries within the financial services sector. Also, firms were randomly selected from the regional and major airline industry within the services sector. The reason for choosing these industries is based on the expectation that these two industries should suffer the greatest damage in the overall market from the September 11 terrorist attacks.
QUANTITATIVE TESTS AND RESULTS
Did the market react to the terrorist attacks on September 11, 2001? Were the risk-adjusted stock price returns for the two industries significantly negatively affected? If there were a significant reaction regarding the event, then the difference in

Kozoyed and Bacon
70
Actual Daily Returns and Expected Daily Returns (from day -30 to day +30) would be significant. If a significant risk adjusted difference is detected, then we can support the alternative hypotheses that the unforeseen event of the attacks would cause decreased returns on stock prices. To statistically test for a difference in the risk adjusted average excess returns and the cumulative average excess returns (for the firms over the time period day -30 to day +30), a paired sample t-test was performed and found a significant difference at a 5% level between actual and expected risk adjusted returns of the two samples of firms as well as both samples together. Average Excess Return (AER) graphs for both samples and the samples combined show significant variation in the AERs on the event (day 0)
Figure 1. CAER of 20 Insurance Firms vs. Event Period
a. Note that the market was closed for four days after the attacks on September 11, 2001. The market was reopened on September 17, 2001.
Results here support the alternate hypotheses that the risk adjusted return of the stock price of both samples of firms and the samples combined are significantly negatively affected on and around the event period of the terrorist attacks. Another purpose of this analysis was to test the semi-strong efficiency of the market in reacting to these unforeseen attacks. The key in determining this is if the AER and CAER are significantly different from zero or if there is a visible graphical or statistical relationship between time and either AER or CAER. CAER graphs (see Figures 1,2, and 3) show significant negative reactions of the risk adjusted returns for the two samples of firms and the samples combined on the event day 0. The
-0.100
-0.080
-0.060
-0.040
-0.020
0.000
0.020
0.040
0.060
0.080
0.100
-30 -25 -20 -15 -10 -5 0 5 10 15 20 25 30
Trading Days
CAER for Insurance Firms
CAER

Journal of Business and Behavioral Sciences
71
two samples of the firms and the samples combined recover after the event providing evidence that the market is semi-strong efficient. Although the firms are able to recover, the recovery period between the two samples observed differs. The insurance firms were able to recover twenty market days quicker compared to the airline firms.
Figure 2. CAER of 9 Airline Firms vs. Event Period
a. Note that the market was closed for four days after the attacks on September 11, 2001. The market was reopened on September 17, 2001.
-0.3
-0.2
-0.1
0
0.1
0.2
0.3
-30 -25 -20 -15 -10 -5 0 5 10 15 20 25 30
Trading Days
CAER for Airline Firms
CAER
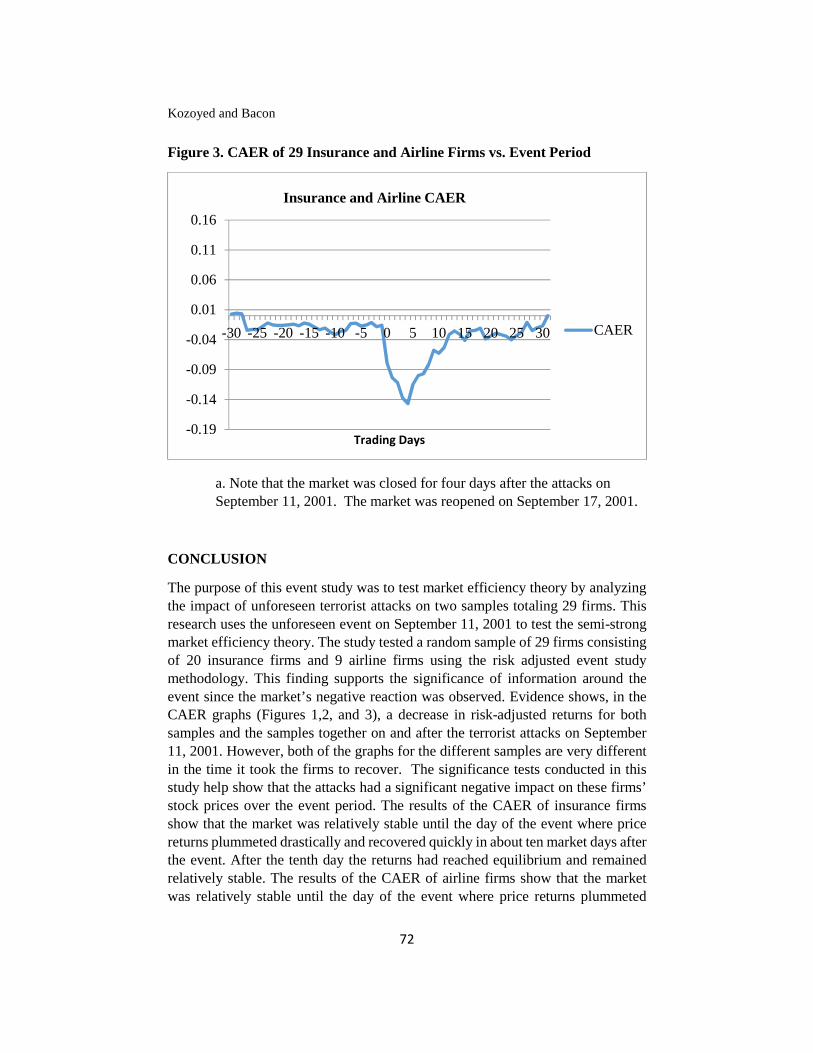
Kozoyed and Bacon
72
Figure 3. CAER of 29 Insurance and Airline Firms vs. Event Period
a. Note that the market was closed for four days after the attacks on September 11, 2001. The market was reopened on September 17, 2001.
CONCLUSION
The purpose of this event study was to test market efficiency theory by analyzing the impact of unforeseen terrorist attacks on two samples totaling 29 firms. This research uses the unforeseen event on September 11, 2001 to test the semi-strong market efficiency theory. The study tested a random sample of 29 firms consisting of 20 insurance firms and 9 airline firms using the risk adjusted event study methodology. This finding supports the significance of information around the event since the market’s negative reaction was observed. Evidence shows, in the CAER graphs (Figures 1,2, and 3), a decrease in risk-adjusted returns for both samples and the samples together on and after the terrorist attacks on September 11, 2001. However, both of the graphs for the different samples are very different in the time it took the firms to recover. The significance tests conducted in this study help show that the attacks had a significant negative impact on these firms’ stock prices over the event period. The results of the CAER of insurance firms show that the market was relatively stable until the day of the event where price returns plummeted drastically and recovered quickly in about ten market days after the event. After the tenth day the returns had reached equilibrium and remained relatively stable. The results of the CAER of airline firms show that the market was relatively stable until the day of the event where price returns plummeted
-0.19
-0.14
-0.09
-0.04
0.01
0.06
0.11
0.16
-30 -25 -20 -15 -10 -5 0 5 10 15 20 25 30
Trading Days
Insurance and Airline CAER
CAER
Journal of Business and Behavioral Sciences
73
drastically and didn’t recover until 30 days after the event. Evidence confirms that the airline industry was more negatively affected compared to the insurance firms and that it had a greater long-run impact on these firms. For the combined samples evidence shows that the market was relatively stable until the day of the event when price returns plummeted drastically and recovered in around ten to fifteen days after the event. Following the fifteenth day the airline and insurance firms remained relatively stable with the rest of the market. These results are consistent with a semi-strong efficient market because the market reacted very negatively on and after the unforeseen terrorist attacks but was able to adjust back to equilibrium in the days following. Even though the terrorist attacks on September 11, 2001 negatively affected insurance and airline firms’ stock returns in the short run, these companies and the financial industry as a whole were able to bounce back and remain stable.
REFERENCES
Bacon, F.W. and J. Greis. (2008). Stock Split Announcements: A Test of Market Efficiency. Journal of Business and Behavioral Sciences,18 (1), 18-27.
Bacon, F.W. and N. Kinsler. (2008). Stock Repurchase Announcements: A Test of Market Efficiency. ASBBS E-Journal 4 (1), 94-105.
Beaver, W. (1981). Market Efficiency. The Accounting Review, 56(1), 23-37.
Blalock, G., Kadiyali, V., & Simon, D. (2007). The Impact of Post‐9/11 Airport
Security Measures on the Demand for Air Travel. The Journal of Law & Economics, 50(4), 731-755.
Bush Signs Airline Bailout Package. (2001, September 23). Retrieved April 29, 2018, from http://www.cnn.com/2001/US/09/22/rec.airline.deal/
Davis, M. (2017, May 6). How September 11 Affected the U.S. Stock Market.
Retrieved July 10, 2017 from http://www.investopedia.com/financial-
edge/0911/how-september-11-affected-the-u.s.-stock-
market.aspx?lgl=rira-baseline-vertical
Fama, E. F., “Efficient Capital Markets: A Review of Theory and Empirical Work,” Journal of Finance, May 1970, 383-417.Fama, Eugene. "Market Efficiency, Long-Term Returns, and Behavioral Finance. "Journal of Financial Economics 49 (1997): 283-306. Print.

Kozoyed and Bacon
74
Finnerty, J. (1976). Insiders and Market Efficiency. The Journal of Finance, 31(4), 1141-1148. Doi: 10.2307/2326279
Jasen, G. (2011, September 9). Economic Cost of 9/11: Three Industries Still Recovering. Retrieved November 22, 2016, from http://www.thefiscaltimes.com/Articles/2011/09/09/Economic-Cost-of 9-11-Three-Industries-Still-Recovering
Levy, R. (1966). Conceptual Foundations of Technical Analysis. Financial Analysts Journal, 22(4), 83-89. Retrieved from http://www.jstor.org/stable/4470026
Ross, S. A., Westerfield, R. Jaffe J. (2015). Corporate Finance (10th ed.). McGraw-Hill Education
Terrorism Risk Insurance Program. Retrieved April 29, 2018, from
https://www.treasury.gov/resource-center/fin-
mkts/Pages/program.aspx
Woehr, M. (2006). 9/11 and the Insurance Industry: Five Years Later Insurance & Technology. Retrieved December 01, 2016, from http://www.insurancetech.com/data-and-analytics/9-11-and-the-
insurance-industry-five-years-later/d/d-id/1309633
9/11's Costly Insurance Impact. (2011). Retrieved November 21, 2016, fromhttp://www.claimsjournal.com/news/national/2011/09/09/190969.htm
Journal of Business and Behavioral Sciences Vol 30, No 2; Fall 2018
75
ETHICAL ATTITUDES AND BEHAVIOR OF UNDERGRADUATE BUSINESS STUDENTS: TRENDS AND THE ROLE OF THE ELECTRONIC RESOURCES
POLICY
Carl J. Case Darwin L. King
St. Bonaventure University
ABSTRACT As the Internet population continues to grow, so does the issue of productivity. Because of online temptations and opportunities for distraction, businesses implement electronic resource policies, block websites, and monitor behavior. Unfortunately, violating company Internet policies is still one of the five most common unethical behaviors in the workplace. As a result, this longitudinal study was undertaken to empirically examine the ethical attitudes and online ethical behavior of the undergraduate business student population. Findings suggest that although most students regard the electronic resources policy as a deterrent for himself/herself and others, the policy is becoming less effective. In addition, gender and academic class are correlated to unethical behaviors. Results imply that administrators may need to re-evaluate policy notification/reinforcement strategies and educators further proactively implement instruction with respect to ethical online behavior.
Key Words: electronic resources policy, online ethical behavior, undergraduate business students
INTRODUCTION
The number of Internet users worldwide reached 3.77 billion in 2017, an increase of 10% in one year, with 90% using the Internet each day, for an average of 8 hours and 34 minutes (Kemp, 2017). Uses include both personal and business. In the U.S., for example, according to the U.S. Census Bureau, 62% of households have broadband, or high speed, Internet subscriptions for personal use (Ryan and Lewis, 2017). From a business perspective, the Internet has become an important tool for communication, sales, advertising, and public relations (Hamel, 2017).
Perspective as to productivity, however, varies. For instance, a Pew Research Center survey sample of 1,066 adult Internet users found that 46% of working online adults feel his/her productivity has increased because of the Internet, email and cell phones, while only 7% feel less productive (Purcell & Rainie, 2014). In contrast, a study of 2,186 hiring managers and human resource professionals found that 19% of employers believe that workers are productive less than five hours a
Case and King
76
day with cell phones/texting (55% of employers) and the Internet (41% of employers) as the primary problems (Nikravan, 2016). The most common result is compromised quality of work (48%) even though 76% of these employers have taken at least one step to mitigate productivity killers such as blocking certain Internet sites (32%) and banning personal calls/cell phone use (26%).
Another form of Internet temptation while at work is shopping. CareerBuilder’s 2016 U.S. Cyber Monday survey of over 5,500 individuals conducted online by Harris Poll found that 53% of workers indicated spending work time holiday shopping on the Internet, an increase of 3% from the previous year (careerbuilder.com, 2016). Of those shopping, 43% spent an hour or more doing so.
Policies, web site blocking, and monitoring techniques have therefore been utilized to control these negative Internet behaviors. For example, in 2002, a study found that 68% of small business firms used at least one technique to monitor employee of computer-based resources and 38% had formal policies regulating the use of these resources (Mitchell and Jones, 2002). A Pew Research Center survey also found that 46% of employers block access to certain websites and 46% have rules about what employees can say or post online (Purcell & Rainie, 2014). The Career Builder survey further found that 11% of employers fired an employee for holiday shopping on the Internet while at work, 54% indicated blocking employees from accessing certain websites, and 35% monitored the sites employees visit. In addition, 52% restrict employees from posting on behalf of the company on social media, 29% have adopted stricter policies in this regard over the previous year, 24% fired an employee for using the Internet for non-work related activity, and 17% fired an employee for an employee post on social media. And, according to Proofpoint, one in five employers has disciplined an employee for violating social media policies and 10% have terminated an employee for it (Albrecht, 2015).
Unfortunately, violating company Internet policies is still one of the five most common unethical behaviors in the workplace according to the Ethics Resource Center (Rodriguez, 2015). As a result, this research was conducted to examine the ethical attitudes and behavior of the undergraduate business student population, in other words, those that may be tempted in the workplace of the future.
This study examines several questions. Do students perceive the electronic resources policy as an effective deterrent for himself/herself and for others in appropriately using the Internet? What are student predispositions toward ethical actions? What is the incidence of unethical behavior? Do these factors vary by gender and/or academic class? Finally, are these factors consist across years or trending either upward or downward? Results are important in determining if there is a need for proactive education with respect to ethical electronic behavior.
Journal of Business and Behavioral Sciences
77
PREVIOUS RESEARCH
Researchers have examined several facets related to policies. While an exploratory study investigated policy perceptions, subsequent research has examined risky behavior and reactive approaches with respect to policies.
To examine policy perceptions, the authors conducted an exploratory study of undergraduate business students in 2001 (Case and King, 2002). The researchers found that 32% of respondents indicated that the university Internet Use Policy was an effective deterrent for him/her and 29% indicated that it effectively deterred others. In terms of academic class, 46% of freshmen, 35% of sophomores, 23% of juniors, and 27% of seniors indicated the policy was effective. Moreover, 43% of females and 26% of males indicated the policy was effective.
A study of business executives further found that 40% indicated that their company Internet Use Policy was effective (Case and Young, 2002). Of the organizations requiring an employee acknowledgement signature, 53% indicated that the policy was an effective deterrent with an average of 4.22 employees disciplined-only, .22 employees terminated-only, and .22 employees both disciplined and ultimately terminated because of a policy violation. Of the organizations not requiring an employee signature, only 13% indicated that the policy was an effective deterrent while an average of 2.5 employees disciplined-only, 1.63 employees terminated-only, and .75 employees both disciplined and ultimately terminated.
In 2013, the authors conducted a follow-up study to better understand the relationship of Internet Use Policy perceptions and risky online behavior (Case and King, 2014). Online activities included downloading/viewing pornography, gambling, visiting chartrooms, and cybersex. This longitudinal analysis of undergraduate business students found that during the five-year study, 15% to 25% of students per year indicated participating in at least one of the behaviors. The most common activity was downloading/viewing pornography (10% to 19% per year) and the least common activity was cybersex (0% to 3% per year). With respect to Internet Use Policy effectiveness, 43% to 57% of students per year perceived the policy to be a strong or mild deterrent with respect to negative electronic behavior for him or her. A lesser percent, 36% to 52% of students per year, perceived the policy to be a strong or mild deterrent for others.
With respect to reactive approaches to behavior, a two-stage longitudinal study utilizing actual employee usage and audit logs, not self-reporting survey measures, to monitor the web activity of employees was conducted (Shepherd and Mejias, 2016). In stage one, a mild policy reminder sent to company employees resulted in a 12% decrease in employee Internet abuse, an effect that lasted for one week. In stage two, a more severe policy reminder resulted in a 33% decrease in employee Internet abuse, an effect that resulted in abuse levels consistently lower than

Case and King
78
pretreatment levels, even after three weeks. Although the warnings in both stages resulted in an immediate and significant decrease in employee nonwork Internet use, the severe policy warning was more effective in reducing and maintaining lower levels of employee nonwork Internet use.
Finally, another study found that punishment severity and punishment certainty did not influence employee intention to avoid Internet misuse (Liaq et.al, 2009). Results did indicate, however, that perceived importance, perceived behavioral control, and subjective norms had significant influence on these intentions. Li et.al (2014) further proposed a theoretical model that integrates an intrinsic self-regulatory approach with an extrinsic sanction-based command-and-control approach to examine employees' Internet Use Policy compliance intention. This research suggests that the self-regulatory approach is more effective than the sanction-based command-and-control approach. Based on the self-regulatory approach, organizational justice not only influences compliance intention directly but also indirectly through fostering ethical objections against Internet abuses.
ELECTRONIC RESOURCES POLICY
The study university utilizes a signed policy for the responsible and acceptable use of electronic resources. Upon enrollment, students review the policy and sign a form acknowledging his/her acceptance of the policy. The purpose of the policy is to require the ethical, legal, and secure use of computing and electronic communication by all members of the university community. A fundamental aspect of the policy relates to appropriate use requiring users of university electronic resources to utilize such resources in a responsible, ethical and legal manner consistent with the university’s mission and policies. Categories of inappropriate and prohibited use of electronic resources include:
• violating university policies such as those in the student handbook; • propagating chain letters or virus hoaxes; • spamming (spreading email or postings widely and without good
purpose); • commercial use of university systems for non-university purposes; • behavior that may cause excessive network traffic or computing load; • email that threatens another with bodily harm; • violating civil or criminal law at the federal, state, or local levels, and so
on.
RESEARCH DESIGN
This study employs a survey research design. The research was conducted at a private, northeastern U.S. university. A Student Electronic Resources Usage instrument was developed by the authors and administered to undergraduate

Journal of Business and Behavioral Sciences
79
students enrolled in a School of Business course. The courses included a variety of subjects such as Business Information Systems, Introduction to Financial Accounting, Macroeconomics, and Business Policy. A convenience sample of class sections and faculty members was selected. The surveys were collected during a five-consecutive year or 10 semester period (from Fall 2012 until Spring 2017).
The survey instrument was utilized to collect student demographic data such as gender and academic class. In addition, the survey examined student Internet attitudes regarding student electronic resources policies. Specifically, each student was prompted to rate how effective the electronic resources policy that he/she signed at the study university was in deterring inappropriate behavior for him/her and others. The effectiveness questions were rated using a 5-point Likert-type scale. In addition, respondents were asked to indicate his/her participation in a variety of unethical academic practices. Results were summarized by academic year and correlation statistics were calculated to determine potential relationships between study variables and unethical behaviors.
All surveys were anonymous and completed in an academic classroom. The response rate was 100 percent. Students were also informed that results would have no effect on their course grade.
RESULTS
A sample of 1,524 usable surveys was obtained. Table 1 indicates that, overall, 61% of the respondents were male and 39% were female.
TABLE 1
Gender Response Rate by Academic Year
2013 2014 2015 2016 2017 Total
Male 59% 62% 60% 64% 60% 61%
Female 41% 38% 40% 36% 40% 39%
Count 360 364 340 240 220 1524
The response rate by academic class is presented in Table 2. Overall, 16% of respondents were freshmen, 32% were sophomores, 23% were juniors, and 29% were seniors.

Case and King
80
TABLE 2
Academic Class Response Rate by Academic Year
2013 2014 2015 2016 2017 Total
Freshmen 23% 6% 18% 21% 10% 16%
Sophomore 28% 37% 34% 29% 29% 32%
Junior 24% 23% 20% 20% 32% 23%
Senior 25% 34% 28% 30% 29% 29%
Responses were first examined to determine the level of effectiveness of the electronic resource policy as a deterrent for the respondent. Table 3 illustrates that in 2013, 58% perceived the policy to be a strong or mild deterrent with respect to negative electronic behavior. The percentage from 2014 to 2017 was 49%, 45%, 53%, and 41%, respectively. Only 15% mildly or strongly disagreed that the policy was a deterrent in 2013. The disagreement percentage from 2014 to 2017 was 20%, 24%, 19%, and 19%, respectively. Finally, the percentage of students with a neutral rating from 2013 to 2017 was 26%, 30%, 31%, 28%, and 40%, respectively.
TABLE 3
Electronic Resources Policy Effectiveness For You
Deterrent Level Academic Year
For YOU 2013 2014 2015 2016 2017
Strongly Disagree 7% 12% 13% 8% 9%
Mildly Disagree 8% 8% 11% 11% 10%
Neutral 26% 30% 31% 28% 40%
Mildly Agree 32% 30% 28% 29% 27%
Strongly Agree 26% 19% 17% 24% 14%
Table 4 depicts respondent perception of the level of effectiveness of the electronic resource policy as a deterrent for others. Results demonstrate that in 2013, 52% perceived the policy to be a strong or mild deterrent with respect to negative electronic behavior. The percentage from 2014 to 2017 was 41%, 36%, 48%, and

Journal of Business and Behavioral Sciences
81
37%, respectively. Moreover, in 2013, only 15% mildly or strongly disagreed that the policy is a deterrent. The disagreement percentage from 2014 to 2017 was 22%, 24%, 20%, and 23%, respectively. Finally, the percentage of students with a neutral rating from 2013 to 2017 was 33%, 37%, 40%, 32%, and 40%, respectively.
TABLE 4
Electronic Resources Policy Effectiveness For Others
Deterrent Level Academic Year
For OTHERS 2013 2014 2015 2016 2017
Strongly Disagree 5% 10% 11% 8% 8%
Mildly Disagree 10% 12% 13% 12% 15%
Neutral 33% 37% 40% 32% 40%
Mildly Agree 32% 29% 26% 29% 25%
Strongly Agree 20% 12% 10% 19% 12%
Students were next prompted to indicate his/her propensity to commit unethical behavior. Results show that overall from 2013 to 2017, 8%, 16%, 16%, 12%, and 12%, respectively, of students would lie on a resume or during an interview to get a job (Table 5). Moreover, from 2013 to 2017, 3%, 5%, 6%, 6%, and 5%, respectively, of students have visited a web site to learn how to cheat. Overall, from 2013 to 2017, 10%, 19%, 18%, 15% and 15%, respectively, of students indicated at least one of these unethical beliefs.
TABLE 5
Unethical Belief (Percentage of Students)
Academic Year
Belief 2013 2014 2015 2016 2017
Would lie on resume/interview 8% 16% 16% 12% 12%
Visited site to learn how to cheat 3% 5% 6% 6% 5%
Overall 10% 19% 18% 15% 15%

Case and King
82
Respondents were also asked to indicate if he/she participated in activities that are both violations of electronic use policies and generally deemed unethical. Results show that overall from 2013 to 2017, 23%, 29%, 28%, 35%, and 24%, respectively, of students participated in at least one of the behaviors (Table 6). In terms of cheating on an exam using information technology (IT) from 2013 to 2017, 7%, 10%, 10%, 12%, and 9%, respectively, indicated this behavior. In terms of downloading a paper and claiming it as his/her own work, from 2013 to 2017, 5%, 5%, 5%, 5%, and 4%, respectively, indicated this behavior. In terms of cheating on an online exam, from 2013 to 2017, 9%, 11%, 10%, 17%, and 9%, respectively, indicated this behavior. In terms of cutting and pasting information from the Internet and not citing the information in the student’s paper, from 2013 to 2017, 9%, 10%, 11%, 13%, and 8%, respectively, indicated this behavior.
TABLE 6
Unethical Internet Behavior (Percentage of Students)
Internet Academic Year
Behavior 2013 2014 2015 2016 2017
Cheated on exams using IT 7% 10% 10% 12% 9%
Downloaded papers as own 5% 5% 5% 5% 4%
Cheated on online exams 9% 11% 10% 17% 9%
Cut/Paste without citation 9% 10% 11% 13% 8%
Overall 23% 29% 28% 35% 24%
Table 7 depicts the occurrence per student per year of the various unethical activities. Results show that during the five-year study period, students cheated on one exam per year per student using IT. Moreover, students downloaded 2-3 papers and cheated on 1-2 online exams per person per year during the study period. And, from 2013 to 2017, 7%, 9%, 8%, 15%, and 8%, respectively, of student papers contained information that was cut and pasted from the Internet but not cited in the student paper.
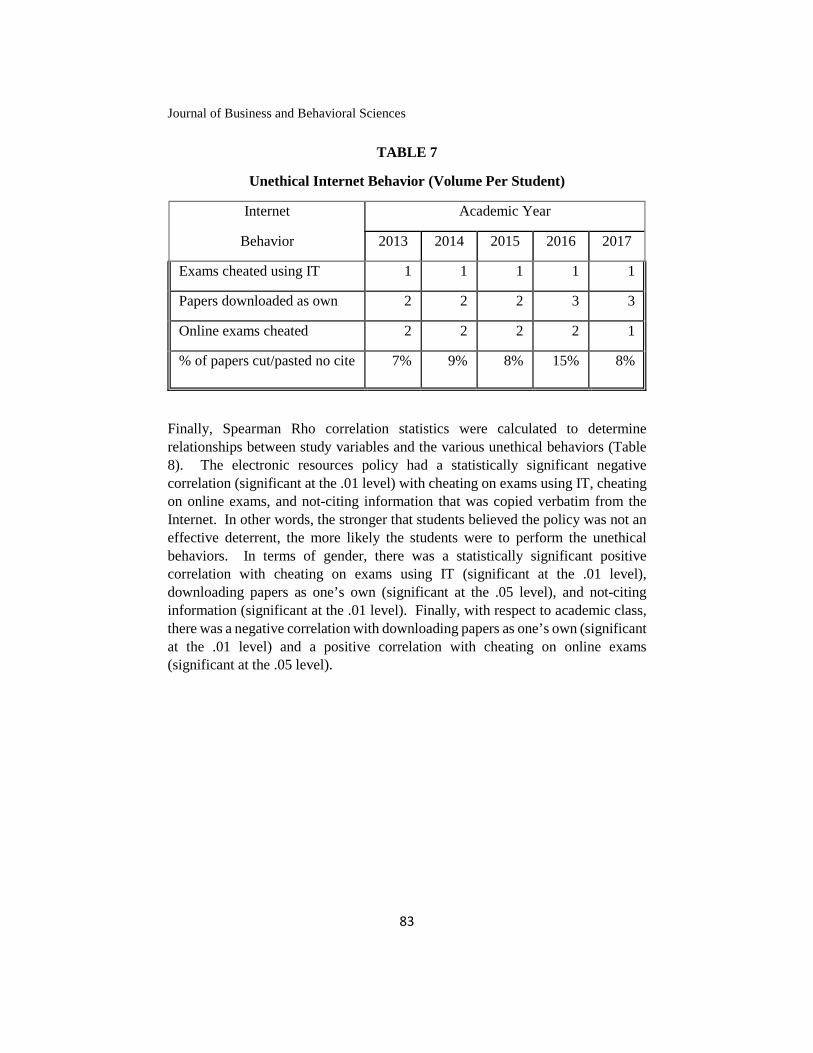
Journal of Business and Behavioral Sciences
83
TABLE 7
Unethical Internet Behavior (Volume Per Student)
Internet Academic Year
Behavior 2013 2014 2015 2016 2017
Exams cheated using IT 1 1 1 1 1
Papers downloaded as own 2 2 2 3 3
Online exams cheated 2 2 2 2 1
% of papers cut/pasted no cite 7% 9% 8% 15% 8%
Finally, Spearman Rho correlation statistics were calculated to determine relationships between study variables and the various unethical behaviors (Table 8). The electronic resources policy had a statistically significant negative correlation (significant at the .01 level) with cheating on exams using IT, cheating on online exams, and not-citing information that was copied verbatim from the Internet. In other words, the stronger that students believed the policy was not an effective deterrent, the more likely the students were to perform the unethical behaviors. In terms of gender, there was a statistically significant positive correlation with cheating on exams using IT (significant at the .01 level), downloading papers as one’s own (significant at the .05 level), and not-citing information (significant at the .01 level). Finally, with respect to academic class, there was a negative correlation with downloading papers as one’s own (significant at the .01 level) and a positive correlation with cheating on online exams (significant at the .05 level).
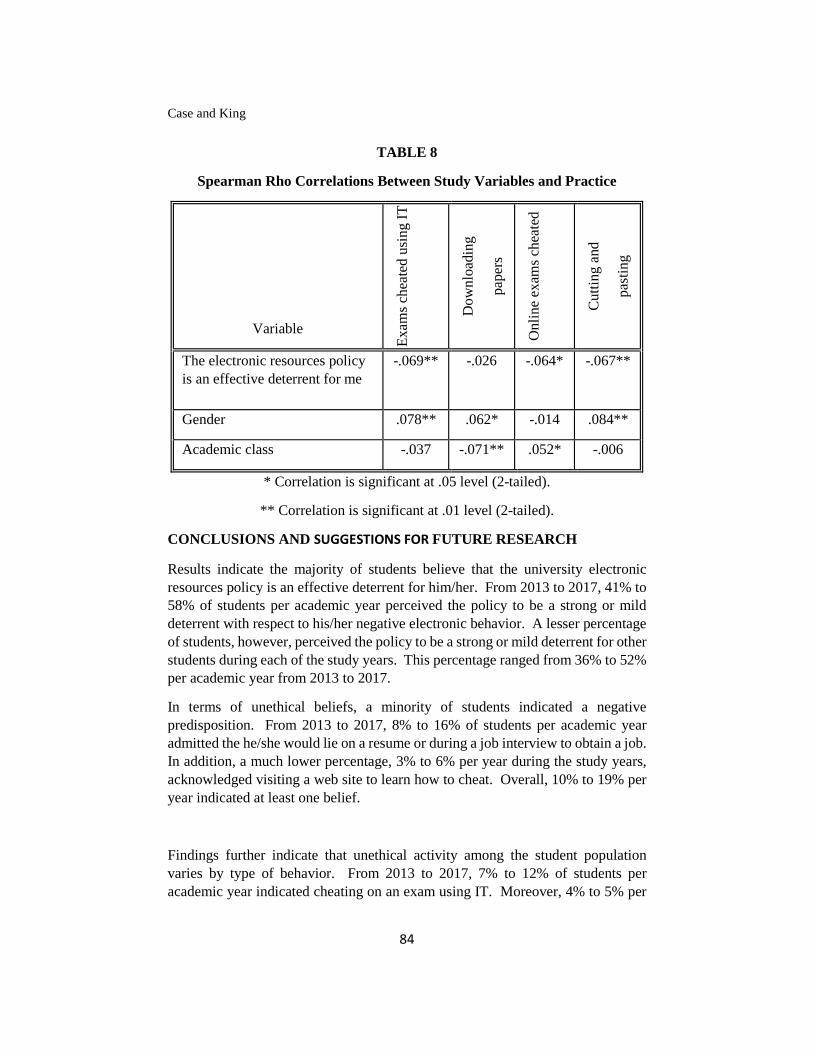
Case and King
84
TABLE 8
Spearman Rho Correlations Between Study Variables and Practice
Variable
Ex
ams
chea
ted
usi
ng
IT
Do
wn
load
ing
pap
ers
On
lin
e ex
ams
chea
ted
Cu
ttin
g a
nd
pas
tin
g
The electronic resources policy is an effective deterrent for me
-.069** -.026 -.064* -.067**
Gender .078** .062* -.014 .084**
Academic class -.037 -.071** .052* -.006
* Correlation is significant at .05 level (2-tailed).
** Correlation is significant at .01 level (2-tailed).
CONCLUSIONS AND SUGGESTIONS FOR FUTURE RESEARCH
Results indicate the majority of students believe that the university electronic resources policy is an effective deterrent for him/her. From 2013 to 2017, 41% to 58% of students per academic year perceived the policy to be a strong or mild deterrent with respect to his/her negative electronic behavior. A lesser percentage of students, however, perceived the policy to be a strong or mild deterrent for other students during each of the study years. This percentage ranged from 36% to 52% per academic year from 2013 to 2017.
In terms of unethical beliefs, a minority of students indicated a negative predisposition. From 2013 to 2017, 8% to 16% of students per academic year admitted the he/she would lie on a resume or during a job interview to obtain a job. In addition, a much lower percentage, 3% to 6% per year during the study years, acknowledged visiting a web site to learn how to cheat. Overall, 10% to 19% per year indicated at least one belief.
Findings further indicate that unethical activity among the student population varies by type of behavior. From 2013 to 2017, 7% to 12% of students per academic year indicated cheating on an exam using IT. Moreover, 4% to 5% per
Journal of Business and Behavioral Sciences
85
year during the five-year period downloaded papers as their own, 9% to 17% cheated on an online exam, and 8% to 13% cut/pasted information from the Internet without citing the material. Overall, from 2013 to 2017, 23% to 35% indicated participating in at least one of the unethical behaviors in an academic year. Volume per activity per year, on the other hand, was relatively low and consistent across the study years. Students indicated cheating on one exam per year using IT, downloading 2-3 papers as his/her own per year, and cheating on 1-2 online exams per year. The percentage of papers that contained non-cited information that was cut/pasted from the Internet, however, ranged from 7% to 15% during the study years.
When examining study variables, electronic use policy effectiveness was statistically significantly correlated with three of the four unethical activities. The level of deterrence was negatively correlated with the quantity of exams cheating using IT, the number of online exams, and the percentage of papers without citations. With respect to gender, there were three statistically significantly correlations. Males had a higher incidence of cheating using IT, downloading papers as his own, and not citing information cut/pasted from the Internet. In terms of academic class, downloading papers as one’s own and cheating on online exams were significantly correlated. Freshmen, relative to seniors, were more likely to download papers and cheating on online exams was more likely with seniors. No other activities were statistically correlated with academic class.
There are three important implications from the study. One finding is that the electronic resources policy is becoming less effective. With respect to policy effectiveness perception, the percent of students with this belief is trending downward or decreasing (Chart 1). This is evident with both the perception that the policy is an effective deterrent for the student and for other students. Interestingly, in all years, students indicate that the policy is more of a deterrent for him/her as compared to others suggesting that students may view himself/herself as morally superior to others. Of note is there has been a dramatic change in effectiveness, from 58% in 2013 to 41% of students in 2018, an overall decrease of 29% in just five years. This is troubling given the statistical correlation found in which the stronger that students believed the policy was not an effective deterrent, the more likely the student was to participate in an unethical behavior. Furthermore, although the percentages of students with unethical beliefs are low (3% to 16%), the percentages indicating specific behaviors are low per activity (4% to 17%), and the volume of incidence per student is minimal, the overall percentage of students engaging in at least one behavior is noteworthy (23% to 35% per year). These trends suggest that administrators and educators may need to re-evaluate existing policies or re-examine policy notice/reinforcement methodologies. It is possible that more reinforcement is needed to constantly remind students about unethical behavior. Moreover, reprimands or punishments

Case and King
86
may need to be implemented. In addition, proactive classroom discussion about ethical technology behavior and/or public notice about violations may be helpful is discouraging negative behavior.
CHART 1
Policy Effectiveness Trends
A second implication relates to gender. Three of the four unethical activities were statistically correlated with males. It is possible that males are more forthcoming and/or proud of these types of defiant activities. Conversely, females may perceive these activities while in college as a personal negative reflection and thus underreport participation. Moreover, it could be that females are more serious about academic study and therefore not perceive the need for cheating or may not feel the reward is greater than the risks associated with the unethical behaviors. In any event, results imply that educators may need to implement different approaches with males versus females if there is a desire to change the moral compass and behavior of male students.
Finally, results suggest that academic class is a factor with respect to unethical behavior. Freshmen were more likely to download a paper and submit it as his/her own and seniors more likely to cheat on an online exam. If academic class is used as a proxy for age, it appears that possibly maturation and/or education may affect the level of paper download cheating. It is further possible that seniors are more likely to cheat on online exams given that online courses are a relatively new trend and one that generally is offered in more classes as the student progresses through his/her academic career. Results suggest the further need for educational efforts directed at upperclassmen with respect to online course ethics and possible changes in online pedagogy in order to minimize the cheating.
0
10
20
30
40
50
60
70
2013 2014 2015 2016 2017Perc
en
t o
f R
esp
on
den
ts
Academic Year
Detrrent for You
Deterrent for Others
Journal of Business and Behavioral Sciences
87
The limitations of this study are primarily a function of the nature of the research methodology and sample. The instrument relies on self-reporting so there could be recency effects and underreporting of activity. Moreover, the research was conducted using a sample of one university. Finally, although academic class was relatively equally distributed, there were less freshmen surveyed. As a result, replication at multiple universities and the inclusion of more freshmen would increase the research robustness. Future research needs to examine if these results are indeed trends and if educational efforts can be effectively employed to mitigate negative activities. The study does, however, further clarify the state of Internet ethics and effectiveness of the electronic use policy among undergraduate business students.
REFERENCES
Albrecht, S. (2015). The Hazards of Social Media. Law & Order, July, 63.7, 8.
Careerbuilder.com (2016). 53% of Employees Are Using Time at Work to Shop Online, Increase From Last Year, Finds Annual CareerBuilder Survey. Careerbuilder.com, November 22, http://www.careerbuilder.com/share/aboutus/pressreleasesdetail.aspx?sd=11%2F22%2F2016&id=pr978&ed=12%2F31%2F2016
Case, C. J. & King, D. L. (2002). Are Student Internet Use Policies Effective? Issues in Information Systems, Volume III, 76-81.
Case, C. J. & King, D. L. (2014). System Security: A Trend Analysis of Student Electronic Resources Use Policy Perceptions and Risky Behavior. ASBBS E-Journal, 10.1, 31-42.
Case, C. J. & Young, K. A. (2002). Employee Internet Use Policy: An Examination of Perceived Effectiveness. Issues in Information Systems, Volume III, 82-88.
Hamel, G. (20.17). How Do Companies Use the Internet? Bizfluent.com, September 26, https://bizfluent.com/info-7794503-do-companies-use-internet.html

Case and King
88
Kemp, S. (2017). Digital in 2017 Digital Overview. Wearesocial.com, January 24, https://wearesocial.com/special-reports/digital-in-2017-global-overview
Li, H., Sarathy, R., Zhang, J., & Luo, X. (2014). Exploring the Effects of Organizational Justice, Personal Ethics and Sanction on Internet Use Policy Compliance. Information Systems Journal, November, 24.6, 479-502.
Liao, Q., Gurung, A., Luo, X. & Li, L. (2009). Workplace Management and Employee Misuse: Does Punishment Matter? Journal of Computer Information Systems, 51.2, Winter, 49-59.
Mitchell, R. B. & Jones, T. (2002). Policies Controlling Use of Computer-Based Resources in Small Business. Journal of Computer Information Systems, 42.4, Summer, 77-83.
Nikravan, L (2016). New CareerBuilder Survey Reveals How Much Smartphones Are Sapping Productivity at Work. Prnewswire.com, Jun 09, 2016, https://www.prnewswire.com/news-releases/new-careerbuilder-survey-reveals-how-much-smartphones-are-sapping-productivity-at-work-300281718.html
Purcell, K. & Lee Rainie, L. (2014). Technology’s Impact on Workers. pewinternet.org, December 30, http://www.pewinternet.org/2014/12/30/technologys-impact-on-workers/
Rodriguez, M. S. (2015), The 5 Most Common Unethical Workplace Behaviors. Bsci21.org, October 21, http://www.bsci21.org/the-5-most-common-unethical-workplace-behaviors/
Ryan, C. & Lewis, J. (2017). Computer and Internet Use in the United States: 2015. Census.gov, September 11, https://www.census.gov/library/publications/2017/acs/acs-37.html
Shepherd, M. M. & Mejias, R. J. (2016). Nontechnical Deterrence Effects of Mild and Severe Internet Use Policy Reminders in Reducing Employee Internet Abuse. International Journal of Human-Computer Interaction, 32.7, 557-567.

Journal of Business and Behavioral Sciences Vol 30, No 2; Fall 2018
89
IMPACT OF TECHNOLOGY ON GLOBAL SUPPLY CHAIN RISK: AN EMPIRICAL STUDY
Kamy Farahbod Jay Varzandeh
California State University, San Bernardino
ABSTRACT
In this paper, we develop a methodology for calculating the Supply Chain Risk Index (RI) based on an earlier study of prioritizing global risks of supply chain for timely response. Varzandeh, et al. (2016) analyzed the Failure Mode and Effect Analysis as a product of three measurements. These three measurements include the probability of the occurrence and the severity of the effect and the ability of the process to detect the existence of the stated problems. Subsequently, for reducing RI, they suggest managers find ways to (1) reduce the chance of occurrences, or (2) reduce the severity of their impacts, or (3) improve detection capabilities at a time, or a combination of the three measurements together. This study expands on the previous research and explores the impact of technology on global supply chain risk. Following the recognition of the potential contribution of technology as a risk reduction tool, a survey instrument that measures the familiarity of the supply chain mangers and their usage of technology to control and to reduce risks is introduced. Responses from three groups of supply chain managers working for large, medium, and small companies are analyzed, and the results are reported. The results point to a need for increased awareness of potential known and unknown risks, and ever increasing use of technology to manage global supply chain risks effectively.
Key Words: Global supply chain, Technology, Risk Management, Risk Index
INTRODUCTION Risk management has been a constant concern for supply chain managers for more than a decade. This concern has been exacerbated through the years for many reasons, including more outsourcing and globalization of partnerships. While the knowledge of the subject is on the rise and the information technology has provided more visibility and cohesion for chain members, it seems still a substantial number of global chains practice the old approach of guessing and intuition to manage their risks. Prior to globalization, companies tended to buy locally produced products and relied on local governments to provide the necessary infrastructure and regulations to control risks. Now that supply chains are sourcing globally, it is incumbent upon them to undertake their own assurance of known and unknowns risks from many fronts. Organizations are exploring markets in all continents, and the logistics of matching demand and supply are becoming more

Farahbod and Varzandeh
90
challenging. Structural changes are constantly putting pressure on supply chains to do more with less and often they are associated with geopolitical, socio-economic, technological and other risks, which necessitate mitigation approaches. These challenges require seeking more innovative solutions, which coupled with rising consumer expectations, can and possibly would create disruptions in sourcing and other vital functions of the chains. Today’s global chains require a different logistics and supply chain strategy to operate effectively This study recognizes the vital role of technology in addressing risk management concerns of today’s global chains. Here, the information technology is treated as a main driver of supply chain management, which not only facilitates the flow of information and makes the subsequent flow of materials and funds possible, but it also is a fundamental risk reduction tool. A survey instrument that measures the familiarity of the supply chain mangers and their usage of technology to control and reduce risks is introduced. Responses from three groups of supply chain managers working for large, medium, and small companies are analyzed, and the results are reported. The results point to a need for increased awareness of potential known and unknown risks, and ever increasing use of technology to manage global supply chain risks effectively.
THE CHALLENGE OF MATCHING GLOBAL DEMAND AND SUPPLY Today, supply chains are becoming the backbone of the global economy and many governments and businesses are becoming increasingly concerned about supply chain disruptions and managing its risk mitigation. In other words, they are seeking to build and to create supply chains resiliencies through better understanding of demand and supply globally. According to the 2015 IMH industry survey (Castiglia, 2014), the demand pressure for lower prices and faster responses will be one of the major challenges for industries in the next decade. The report also highlights the need for investing in advanced technologies to support their supply chain network to satisfy the diverse global demands of constantly changing marketplaces. Moreover, the report shows that the management of this ever divers and changing market demands becomes more uncertain and complicated when the supply side of industries’ supply chains are frequently and increasingly disrupted and are becoming difficult to manage. Noteworthy to know that many worldwide supply disruptions are driven by natural disasters, political unrest, labor stoppages, changing economic and political regulatory restrictions, etc., and industries should include those possibilities and their mitigation approaches into their strategic planning. Understandingly, companies that can respond to supply disruptions better and faster they would have a more competitive edge over their competitors. Interestingly to know that although organizations can influence their global demand through pricing, advertising and other forms of promotions, but they can better manage supply strategically within their supply chains. Moreover, according to Bill Michels of Airpark consulting (Ferre, et al, 2007), the future supply chains are moving away from being cost focused to more of a focus on value. He emphasizes that the value can be created through the degree to which the suppliers can have speed to the market, new product development and innovation,

Journal of Business and Behavioral Sciences
91
integration and transparency. And, at some points industries need to emphasize on sustainability, corporate and social responsibility which customers are demanding. According to Airpark consulting report global economy brings the need for suppliers’ integrations within diverse supply chains structures such as Japanese, Korean, European, and North American supply chains. That need amplifies the complexity of matching global demand and supply to create needed values. Choices of suppliers and their chains are then becoming keys to how organizations will succeed in the challenging business environment of next decade. Those choices are strategic and are associated with major risks and uncertainties discussed earlier. Each potential supplier and its chain should be then evaluated on the aforementioned risk criteria such as financial, country and logistics risks. Those risks are often specific to products and services created, chosen locations, customers, and the chains network design. Therefore, for organizations to see the complete pictures of all risks and thus to formulate sound mitigation strategies they need to relate and measure risks to their suppliers and not to general risk statistics. Consequently, organizations global network design determines the fundamental risk categories for companies, which may be unique to them and may not be applied to others.
ANATOMY OF SUPPLY CHAINS RISKS According to the earlier discussions, globalization of supply chains has made Supply Chain Risk Management (SCRM) one of the top priorities of most business entities. Whether the risk is due to natural disasters, changing government regulations, or failure of information networks, the results could potentially impact the chain members and their image, their employees, suppliers, customers, and stockholders (3). Some events, such as natural disasters are not only likely, but can have severe consequences. Thus, it is vital to detect and subsequently address them as soon as they occur. Most natural disasters are also uncontrollable, meaning that preventive measures would not reduce the probability of their occurrence (4). On the other hand, the issues in production processes are quite controllable and their risk can be managed effectively. In a 2006 survey conducted by Accenture (Hicxsolution.com, 2014), the majority of respondents indicated that their global operations strategy has increased their supply chain risks significantly. The results highlight that the performance of supply chain partners can have more impact on their supply chain than other listed risk elements. Also, natural disasters, volatility of fuel prices, and logistics capacity are listed as the other highly important elements in creating risks for supply chain performance. That suggests the crucial role of global network design in selecting partners, locations, and availability of resources. In other words, the global supply chain is shifting the cost cutting and risk mitigation effort to focus on distribution, logistics, and partners’ reliability and away from manufacturing cost. Therefore, according to the survey, one of the important concerns is the issue of suppliers’ disruptions and product availability. Subsequently, mitigating this risk and concern (suppliers’ disruptions and product availability) requires creating a seamless

Farahbod and Varzandeh
92
connectivity to all supply chains partners and it should be in line with supply chain optimization effort to reduce cost. For achieving the above goals, it is imperative for organizations to locate where the supply chains risks may occur and how they can be measured. According to the leading supplier information management platform provider HicxSolution.com (2014), the supply chain disruptions most commonly occur at tier 1 suppliers, and each company has its own distinct risks from other chain members which should be measured, prioritized and mitigated. The ability to mobilize efforts to measure and formulate mitigations strategies are then the key to bringing global demand and supply closer to each other. In order to acquire consistent information and to know more about supply chains risks, organizations need to use technology to automate collecting data, and to distribute and communicate with all engaged partners. Moreover, the more organizations are engaged in collaborating with their suppliers the better would be the strategic relationship among them, and thus the relevant information will be disclosed faster. Noteworthy to say that the degree to which an organization should collaborate with its suppliers depends on how critical suppliers and their roles are in the organization’s market segment. Therefore, knowing the critical suppliers, their roles, and their related risk criteria should provide the necessary metrics to measure the related risks through disclosed information.
METHODOLOGY AND FINDINGS Typically, companies view risk management as a project. They identify the risk factors and develop a strategy to deal with them. More appropriately, Supply Chain Risk Management (SCRM) should be recognized as an ongoing program dealing with known and unknown risks as they materialize. Christopher (2011) perceives SCRM as a process for identifying potential negative events, determining their chance of occurrence, and assessing the severity of their impacts. In this approach, very similar to quality management process (Failure Mode and Effect Analysis, FMEA), a Risk Index (RI), which is the product of three measurements, can be calculated (Varzandeh, et al., 2016). The three measurements include the probability and the severity of the effect of the occurrence as identified by Christopher, plus the ability of the process to detect the existence of the stated problems. That is, RI = (Occurrence) X (Severity) X (Detection) Subsequently, for reducing RI, organization should find ways to either reduce the chance or risk of occurrences, the severity of their impacts, and to improve detection capabilities, or a combination of the three measurements. The impact of technology on risk and this risk index is threefold. First, technology enables the supply chain managers to assess the probability of the occurrence of negative events more accurately. Second, it allows for a more precise evaluation of the severity of the impact of the negative event by providing more detailed and exact data. Finally, it helps in generating real time and accurate warning to detect negative incidents as soon as they occur. The primary purpose of this study is then to evaluate the familiarity and readiness of three sizes of manufacturing

Journal of Business and Behavioral Sciences
93
organizations (Large, medium, and small) with risk factors and SCRM strategies. Also, the secondary purpose of this study is to explore how supply chain managers view SCRM. In particular, whether they recognize the potential impact of technology in supply chain risk management is explored. Surveys are administered to supply chain managers in 28 small, 31 medium and 16 large organizations by phone and in personal visits. All firms are involved in doing business globally. Also, small firms employed less than 50, medium-size firm employed 50 to less than 100, and large firms employed 100 or more employees. The following tables show the survey and the resulting numbers. In Table 1, the supply chain managers are asked to indicate their personal and their organizations’ familiarity with their chain risk factors. Managers are also asked to indicate whether they have a formal SCRM program. Following a similar set up as in the Accenture survey (3), the risk factors are categorized as (1) economical, (2) environmental, (3) geopolitical, (4) relational, and (5) technological. Where economical risk factors include commodity and energy price volatility, customer price volatility, inflation, and regulation failures, etc.; environmental risk factors include natural disasters and land pollutions, etc.; geopolitical risk factors include corrupt and unstable governments, wars, and terrorism, etc.; relational risk factors include supplier and customer relations, etc.; and finally technological risk factors include infrastructural and communication network breakdowns, hacking, and treat from new technologies, etc.
Tables 2, 3, and 4, report the frequency of relevant risks and their probability, severity, and detection opportunity for the three groups of organizations in the survey. A low probability (score of 1) means a likelihood of occurrence of 1 in 1,000 or less, while a medium probability (score of 5) specifies a likelihood of occurrence of 1 in 20 down to 1 in 1000, and a high probability (score of 10) indicates a likelihood of occurrence of 1 in 20 or more. Furthermore, marginal severity (score of 1) means no or minor impact, significant severity (score of 5) specifies a moderate to major impact, and critical severity (score of 10) indicates a catastrophic impact on the performance of the supply chain. Finally, high

Farahbod and Varzandeh
94
detection opportunity (score of 1) means a high likelihood of detecting the risk, a medium opportunity (score of 5) specifies a good likelihood of detecting the risk, and low detection opportunity (score of 10) indicates no known methods to detect the risk until it is too late for the chain to take corrective action.

Journal of Business and Behavioral Sciences
95
Any SCRM program that does not include a correct strategy to follow the calculation of the risk index has little or no value. Therefore, the calculation of the supply chain risk index must be followed by a very serious action plan that reduces risk. Based on this analysis, risk reduction can be achieved by reducing occurrence likelihood, severity, or detection scores. In many cases, however, it is impossible or very improbable to mitigate risks. That is why supply chain managers must develop a strategy to identify and deal with risks that might be accepted, mitigated, transferred, or avoided (3). The choice of the appropriate strategy depends on the characteristics of the risk factor and the tolerance of the organization for taking risks. In Table 5, supply chain managers are asked whether they are aware of the potential impact of technology on the risk measures and the risk index. They also report the use of technology as a tool to reduce the risk by their organization. The results, quite understandably, point to the advantages of larger organization in both the knowledge of availability and of the use technology as a risk reduction instrument.

Farahbod and Varzandeh
96
CONCLUSIONS
This paper is providing an in-depth study of the extent to which organizations are aware of the risks associated with their supply chains and how they can prepare themselves to avoid and/or to mitigate them. The results of surveying different organizations, nationwide, are presented in the Tables 1, 2, 3, and 4. Also, Table 5 presents the SCRM strategies adopted by those organizations in light of their risk awareness. Table 1 indicates that the smaller is the size of the organizations within their supply chains the less they are aware of SCRM strategies, and therefore they put less effort to adopt one. These organizations, obviously, will be more prone to unexpected consequences and catastrophic losses. However, the small organizations are less engaged with global economy and they have lower Risk indices for relational and technological risk categories than those for the larger size organizations. On the contrary, they have much higher risk indices for Economic and Environmental categories of risks (Table 6), which can threat their steady operations when one happens. The results in Table 6 highlight higher vulnerability for smaller size organizations than for the medium and larger sizes for the first two risk categories. This outcome substantiates the fact that smaller size organizations lack some SCRM strategies, which result in their higher vulnerability for the stated risk categories.
The results of the survey in Table 5 are also alarming for the small and medium size organizations in global logistics. They indicate that larger organizations benefit from the knowledge and availability of technology to reduce the measures of risk and hence the risk index. Their strategies are heavily aimed at use of technology to avoid and mitigate supply chain risks. According to the results of this study, globalization is becoming a noticeable force for organizations to implement some form of SCRM to manage the stated risks. The large size organizations’ risk management is directed at avoiding and mitigating the negative impacts of the risks instead of transferring those to their partners within their supply chains. On the other hand the smaller size organizations confront the risks after they are occurred and often try to adjust their operations afterward. More specifically, as Table 6 shows, their high economic and
Journal of Business and Behavioral Sciences
97
environmental risk indices reveal the fact that their survival significantly depends on structuring strategies to have a calculated mitigation and /or avoiding risks policies. Obviously, technology plays a pivotal and important role in impacting and reducing their supply chain risks. According to the results of this study, Organizations, irrespective of their sizes, can benefit from the use of technology to manage, reduce, and/or to avoid risks in their supply chain and to have significant reductions on reducing and managing their supply chain risk categories.
REFERENCES
Castiglia, F. (2014). “CEO, Trans American Customs & Logistics,” Linked Report.
Christopher, M. (2011). Logistics & Supply Chain Management, 4th ed., Pearson, Harlow, England.
Fawcett, S. E., Ellran, and L. M., Ogden, J. A. (2007). Supply Chain Management. Pearson/Prentice Hall, Upper Saddle River, NJ.
Flynn, A. E. (2008). Leadership in Supply Chain Management, Institute for Supply Management, Tempe, AZ.
Hicxsolution.com. (2014). Managing Supply Chain Uncertainty, “The Leading Supplier Information Management Platform Provider”
Ferre, J, Karlberg, J., and J. Hintlin (2007). “Integration: The Key to Global Success,” Supply Chain Management Review, pp 24-30.
Michels, Bill. (2014). “Megatrend in Supply Chains,” Airpark Consulting.
Varzandeh, J., Farahabod, K., and J. Zhu (2016). “Global Supply Chain Risk Management, A Survey Analysis,” Journal of Business and Behavioral Sciences.
Journal of Business and Behavioral Sciences Vol 30, No 2; Fall 2018
98
AN EXPLORATORY EXAMINATION OF ANTECEDENTS TO SOFTWARE PIRACY: A CROSS-
CULTURAL COMPARISON
Andrew J. Setterstrom Northern Illinois University
Michael B Knight Florida Southern College
Hasan Aleassa Arab Open University-Kuwait
John M. Pearson Southern Illinois University Carbondale
ABSTRACT Software piracy continues to be a growing problem on a global scale. This study conducts a cross-cultural comparison of individuals’ intent to pirate software using two subsamples: Jordan and U.S. respondents. Our results suggest TRA provides a strong predictive ability for our U.S. subsample, but not for our Jordanian subsample. Furthermore, while our culturally-related factors varied in their ability to moderate the relationships of TRA across cultural groups, their inclusion dramatically improved the ability to predict software pirating intentions for our Jordanian subsample. Overall, our results suggest culture plays an important role in affecting software piracy.
Keywords: Software Piracy, Multi-Group Analysis, Culture, Theory of Reasoned Action1. Introduction
With 1.5 billion PCs installed globally, the development and sale of commercial software remains a promising industry sector with nearly $101 billion in revenue during 2011 (Business Software Alliance, 2012). At the same time, however, software piracy remains a serious threat for firms that create and sell software. Software piracy can be defined as the illegal installation, reproduction, or distribution of commercial software. A recent study by the Business Software Alliance found that 57% of individuals globally admitted to pirating software, which translates to $63.4 billion in software being pirated in 2011 (Business Software Alliance, 2012).
Given the magnitude of the problem, it is not surprising that the software industry has implemented a number of different strategies in an attempt to mitigate software piracy (see Gopal and Gupta (2010) for discussion). Yet, despite these efforts the amount of software pirated has nearly doubled from 2003 to 2011 (Business Software Alliance, 2012). Interestingly, the dramatic rise in software piracy can be attributed largely to emerging economies. To illustrate, it was found that 58% of software installed on PCs in the country of Jordan was pirated in 2011.

Journal of Business and Behavioral Sciences
99
At the same time, the piracy rate in the U.S. was substantially lower at 19% (Business Software Alliance, 2012). This raises an important question, “what differences, if any, explain the disparity in software piracy rates between the US and Jordan?”
Research has demonstrated that culture plays a critical role with respect to individual behavior towards IT (Sia et al, 2009; Srite & Karahanna, 2006; Du, Liu, Straub, Knight, 2016). We postulate this holds true for the decision to pirate software as well. While software piracy has been examined in the IS literature, the effect of culture on the decision to pirate software is not fully understood (Holsapple et al, 2008) and efforts to systematically examine factors that lead to the decision to pirate software across cultures have been minimal. The aim of this research is to fill this gap. First we examined the predictive ability of the Theory of Reasoned Action (TRA) using two subsamples of respondents, one from the U.S. and one from Jordan, to determine if the difference in software piracy rates between countries is simply due to varying levels of attitudes and subjective norms. Our results demonstrate that the use of TRA alone to predict pirating behavior is not equally effective across cultures. We then examined the moderating effects of culturally-related factors on the relationships of TRA and compared the results across subsamples to determine where differences in the propensity to pirate software are derived.
For academics in general, our study provides a rigorous examination of the applicability of TRA as a predictive model for individuals from different cultures. For IS researchers in particular, this study examines a new combination of antecedents to software piracy that have not been previously tested together. For practitioners, our results compare and contrast the ethical decision-making process for individuals from different regions of the world. By identifying similarities in what motivates ethical decisions, practitioners potentially will be better informed about which anti-piracy measures will be effective regardless of an individual’s cultural background. Literature Review
Software piracy has been called one of the most important ethical issues of the information age (Mason, 1986) and antecedents that lead to the decision to pirate software have received considerable attention in the IS literature (see Holsapple et al. 2008 for review). For example, using Expected Utility Theory and Deterrence Theory as a basis for their research, Peace et al (2003) expanded upon the Theory of Planned Behavior to explain the decision to pirate software. Their results suggested that punishment severity, punishment certainty, and software costs were significant predictors of attitude towards pirating software. In turn, the constructs of the Theory of Planned Behavior were all significantly related to intentions to pirate software. Another example is provided by Moores and Chang (2006), who examined the role of ethical considerations in the decision to pirate software. Adapting a four-component model from the moral psychology literature, they found evidence that moral judgment is significantly related to intentions to acquire pirated versions of software, which in turn leads to the buying and use of illegal copies of software. Furthermore, they found that an individual’s age played
Setterstrom, Knight, Aleassa and Pearson
100
an important role in moderating the effectiveness of the model, suggesting that individuals of younger age may not apply moral reasoning in the decision to pirate software. More recently, Nill et al. (2010) used a sample of MBA students from Germany to test a model designed to explain the amount of pirated software installed on respondents’ personal computers. Their results suggested that knowledge of consequences, attitudes towards piracy, and fear of legal consequences were negatively related to the amount of pirated software the respondents possessed. At the same time, availability of software to pirate was positively related to software pirating. Interestingly, social norms, gender, and age did not have significant relationships with the amount of pirated software the respondents had installed on their PCs.
Of particular relevance to our research are studies that have attempted to examine cultural antecedents to software piracy across multiple countries. Two approaches to measuring attributes of culture are found in the IS literature: the use of macro- and micro-level data. Using a macro-level approach, Husted (2000) used data from 39 countries to determine whether a country’s individualism/collectivism dimension affects piracy rates. Motivating this research was the hypothesis that members of individualistic cultures tend to value their own goals above that of the group, while members of collective cultures tend to believe that the well-being of the group supersedes that of the individual. Results from Husted’s study provided evidence that individualism was negatively related to software piracy, while cultural factors of power distance, masculinity, uncertainty avoidance, and Confucian dynamism did not have significant relationships. In a similar study, Moores (2008) found individualism and masculinity to be significantly related to software piracy rates. His study also found that software piracy rates have been declining and that the rate of decline in a given country was influenced by the cultural factors of power distance and uncertainty avoidance. Lastly, Yang et al. (2009) found individualism, economic wealth, and spending on IT to be negatively related to software piracy.
Adopting a micro-level (or social psychological) approach, Swinyard et al. (1990) provided one of the first cross-cultural examinations of antecedents to software piracy using samples from the U.S. and Singapore. Results from this study found that individuals from the U.S. sample were more knowledgeable about software piracy laws, possessed stronger attitudes against software piracy, and had stronger behavior intentions against pirating software than individuals from the Singapore sample. More recently, Kini et al. (2004) used Kohlberg’s (1969) levels of moral development to determine if there are cultural differences between individuals from the U.S. and Thailand. Their research suggested that individuals from the U.S. possess higher degrees of moral intensity relating to software piracy than individuals from Thailand. Interestingly, their results also suggested there were also differences in moral intensities across gender, but not age. We note that while numerous studies have developed predictive models and tested them with respondents residing in various countries including China (Chan et al., 2013), Germany (Nill et al, 2010), Hong Kong (Moores & Dhillon, 2000), Jordan (Aleassa et al., 2011), Thailand (Moore & Esichaikul, 2011), and the U.S. (Moores
Journal of Business and Behavioral Sciences
101
et al, 2009), only minimal work has been done in this in the examination of cross-cultural differences. Hypothesis Development
First articulated by Ajzen and Fishbein (1973), the Theory of Reasoned Action provides an explanation of the mental processes that drive individual behavior. Specifically, attitude towards the behavior and subjective norms relating to the behavior are responsible for, in part, the formulation of behavior intention. In turn, behavior intention is argued to be the direct cognitive antecedent to actual behavior. In the context of this study, we define intention as an individual’s assessment of the likelihood that he/she would pirate software. Attitude is defined as an individual’s belief that pirating software is unethical. We posit that when an individual believes the act of pirating software is morally wrong, that belief will act as an impediment in the development of intentions to pirate software. Previous research has provided evidence that a strong relationship exists between an individual’s attitudes and intentions to pirate software (Aleassa et al., 2011; Moores et al., 2009). We define subjective norms as an individual’s belief that important others think that software should not be pirated. When an individual believes that others expect him not to pirate software, that individual will be less likely to develop intentions to pirate software, as he does not want to create conflict in his social environment. Like attitude, research has provided evidence that a significant relationship exists between subjective norms and intentions to pirate software (Aleassa et al., 2011; Moores et al., 2009).
Various studies have examined the predictive ability of behavior models such as TRA in Arabic countries and attitude and subjective norms have been found at times to be significant predictors of behavior (e.g., AbuShanab et al., 2010; Aleassa et al., 2011). However, the cultural psychology perspective would suggest that a theory about psychology, such as TRA, may vary in its applicability across different cultures. This is due to the inseparable nature of culture and individual attitudes and beliefs; as cultures vary so will the general attitudes and beliefs held by the populations of those cultures. For instance, research examining the Technology Acceptance Model (TAM) has found that TAM may not be effective at predicting behavior across all cultures (McCoy et al., 2007). Thus, it is not surprising that some question exists about the predictive ability of TRA for individuals from non-Western countries. In particular, it is posited that non-Western cultures tend to be more collectivistic, while their Western counterparts have more individualistic cultures (Hofstede, 1980). It has been further hypothesized that decisions by individuals from collectivistic cultures are more strongly motivated by social factors than those individuals from individualistic cultures, as concerns for the well-being of social groups are more important that individual. Similarly, individuals from individualistic cultures are more strongly motivated by attitudes than those individuals from collective cultures, as these individuals tend to value their own goals above social groups (Fishbein & Ajzen, 2010). Further, research has posited that espoused power distance and individualism/collectivism plays an important role in individual employees’ innovative behavior. (Du, et al., 2016).Therefore, we predict that while attitude

Setterstrom, Knight, Aleassa and Pearson
102
will have a significant relationship with intention for respondents from both cultures in our study, this construct will provide less predictive ability for our Jordan group than our US group. At the same time, we predict that while subjective norms will have a significant relationship with intention for respondents from both cultures in our study, it will provide greater predictive ability for individuals from Jordan than from the U.S.
H1. The relationship between an individual’s attitude toward software piracy and intention to pirate software will be stronger for the US subsample than for the Jordanian subsample.
H2: The relationship between subjective norms and intention to pirate software will be stronger for the Jordan subsample than for the US subsample.
As previously discussed in our introduction, the rate of software piracy in Jordan is more than twice as high as the rate in the US. This is not unexpected, as studies have demonstrated that country-level socio-economic factors such as greater economic prosperity (GDP), greater political freedom, greater numbers of Internet users, and greater PC distribution within a country all negatively influence software piracy rates (Goel & Nelson, 2009; Moores, 2008; Gopal & Sanders, 1998; Yang et al., 2009). Moreover, individualism is negatively related to software piracy rates (Husted, 2000; Moores, 2008; Yang et al., 2009); non-Western countries, such as Jordan, tend to have more collectivistic cultures than Western countries, such as the US. Consequently, we anticipate that Jordanian subjects from our study will demonstrate a higher propensity to pirate software than our US subjects.
H3. Individuals from the Jordanian subsample will have significantly higher latent variables scores for intention to pirate software than individuals from the US subsample.
While theories such as TRA and TAM provide the benefit of strong predictive ability via parsimonious models, research has suggested that extensions in the form of moderators can help to better predict individual behavior (King & He, 2006; Sheppard et al., 1988). For this study we are concerned with the moderating effects of public self-consciousness, religiosity, and an individual’s ideologies. These constructs were selected for examination based on their long historical use within the ethical decision-making literature and the discretion of the researchers.
Public self-consciousness is defined as “the tendency to be aware of the publicly displayed aspect of the self, the self as a social object that creates impacts on other people” (Carver & Scheier, 1981: p. 46). While a publically self-conscious individual may have formulated idiosyncratic personal attitudes about a situation, he is more inclined to conform to norms to avoid creating dissonance among those perceived as socially important. This is due to possessing a high degree of the belief that others perceive and judge his behaviors. While not receiving attention in the IS literature, public self-consciousness has been demonstrated to moderate the attitude-behavior relationship in other contexts (e.g., Lalwani et al., 2009; Millar, 2007). Given this evidence, we expect that as an individual’s level of public

Journal of Business and Behavioral Sciences
103
self-consciousness increases, the relationship between subjective norms and intention to pirate software will strengthen.
H4. The relationship between subjective norms and intention to pirate software will be moderated by public self-consciousness such that the relationship becomes stronger as the level of public self-consciousness increases.
An individual’s response to an ethically questionable situation can, in part, can be explained by that person’s ethical ideology, or moral philosophy (Forsyth, 1980). In this way, ideology can be viewed as a framework of right and wrong that an individual uses to make ethical decision. For the purposes of this research, we adopt a parsimonious approach to operationalizing ideology that identifies two dimensions of the construct: idealism and relativism. Idealism is defined as the degree to which an individual believes “that desirable consequences can, with the ‘right’ action, always be obtained” (Forsyth, 1980: p. 176). Idealistic individuals are concerned with the outcomes for the decisions they make and therefore they attempt to avoid harming others. Relativism is defined as “the extent to which the individual rejects universal moral rules” (Forsyth, 1980: p. 175). When an individual is relativistic, the circumstances under which moral actions take place play a larger role in the judgment of those actions rather than universal principles.
The use of relativism and idealism has long been used in research attempting to understand ethical decision-making. Studies utilizing these constructs have typically found that idealism to be positively related to ethical behavior, while relativism is negatively related to ethical decisions (Schlenker & Forsyth, 1977). Correspondingly, we expect idealism to positively moderate the relationship between attitude and intention to pirate software. At the same time, we anticipate that relativism will negatively moderate the attitude-intention relationship. In a meta-analysis of research examining relativism and idealism, the US was found to be significantly less idealistic than Middle Eastern countries, while the Middle East and the US were not different in their degrees of relativism (Forsyth et al., 2008). Limited research has attempted to systematically determine the differences in moderating effects of ideologies across cultures. However, without prior research to inform us, we believe that the magnitude of a given ideology that can be seen in a culture is indicative of its importance in decision making for the individuals within that culture. Therefore, we expect idealism to have a stronger moderating effect for the Jordanian subsample, while we do not expect there to be a difference in the moderating effect of relativism between cultures.
H6. The moderating effect that idealism has on the attitude-intention relationship will be greater for the Jordan subsample than for the US subsample.
H7. The moderating effect that relativism has on the attitude-intention relationship will be equivalent between the US and Jordan subsamples.
Religiosity refers to the degree to which an individual integrates religion into his or her life. As such, a person with a high degree of religiosity has
Setterstrom, Knight, Aleassa and Pearson
104
internalized the values and morals of their religious beliefs and uses them as a point of reference in making judgments and evaluations (De George, 1986). In the IS literature, higher degrees of religiosity have been demonstrated to be negatively related to intentions to pirate software (Aleassa et al., 2011). Therefore, we anticipate that as levels of religiosity increase, the attitude-intention relationship will be strengthened. However, little research has examined the cross-cultural differences that religiosity has on ethical decision-making (Vitell, 2009). Given that we have no evidence of the contrary, we argue that there will be no difference in the moderating effect of religiosity across cultures.
H8. The moderating effect that religiosity has on the attitude-intention relationship will be equivalent between the US and Jordan subsamples.
While not of theoretical interest to this study, we included age and gender as control variables, as they have been shown to be significantly related to the pirating of software (Sims et al., 1996). Methodology
Employing a cultural psychological perspective, our research conducts analysis at the individual-level to provide insight into attributes about the culture in which an individual resides that affect the ethical decision-making process. Therefore, to test our research hypotheses a survey methodology was used. Data was collected from a sample of undergraduate business students from two large universities: one in Jordan and one in the U.S. Previous studies have found that college students are some of the most active software pirates (see Holsapple et al, 2008). We therefore believe that they serve as a good proxy to our targeted population, which is individuals that pirate software.
The first step in testing our hypotheses was to develop our instrument. We used an extensive literature review to identify previously validated instruments for our constructs of interest. To measure idealism and relativism, we adopted two instruments from the Ethics Position Question (Forsyth, 1980); each consisted of 10 items. To measure public self-consciousness we adopted a 7-item instrument developed by (Fenigstein et al., 1975). To measure religiosity we used an instrument developed by Evans et al. (1995) and added an additional item from Rohrbaugh and Jessor (1975); this resulted in a total of 12 items. Attitude towards software policy was measured using items from an instrument developed by Gupta et al. (2004) and an additional item developed by the researchers, resulting in 6 items. Subjective norms was measured using 4 items from the literature (Al-Rafee & Cronan 2006; Mathieson 1991; Peace et al., 2003) adapted to the context of software piracy. All items measuring our independent variables utilized a 7-point Likert scale.
To measure our dependent variable, intention to pirate software, we used scenario-based items developed by the researchers. This approach of gauging intention entails soliciting respondents’ attitudes regarding a scenario in which a financially challenged “friend” asks for a pirated copy of software. A 7-point Likert scale was used to record responses to five questions in the context of this ethical dilemma. We argue that an individual’s decision to pirate software is

Journal of Business and Behavioral Sciences
105
affected by contextual situations. Therefore, we used scenario-based measures, as they have been argued to a suitable method for measuring behavior intentions (Hunt & Vitell, 1986).
Prior to testing our hypotheses, an important step in our analysis was to empirically establish measurement invariance between our two samples. That is, the psychometric properties from our two cultural groups must be demonstrated to have the same structure if we are to accept the assertion that our groups have interpreted our instrument items in the same way. Failure to establish measurement invariance suggests that we have measured different phenomena across cultural groups, making comparisons between groups using our data meaningless. Measurement invariance was assessed using component-based confirmatory factor analysis (CFA) via SmartPLS 2.0 (M3) (Ringle et al., 2005). First, we conducted CFA analyses for each subgroup of data and retained items that had factor loadings of .5 or higher (Hair et al., 2006) in both groups. Once configural invariance was verified, we assessed metric invariance (equivalent factor loadings) and scalar invariance (equivalent intercepts) across groups (see Vandenberg & Lance, 2000).
To test our hypotheses, partial least squares (PLS) path modeling was utilized. To assess structural differences between our culture groups, we employed the approach discussed by Chin (2000). Specifically, we estimated the path coefficients for each of our subgroups separately using SmartPLS, followed by a bootstrap resampling technique to calculate standard errors for the structural paths. A t-test was then used to test for significant differences between path estimates across cultural groups. Results
A total of 338 and 323 completed surveys were collected from US and Jordanian respondents, respectively. Examination of the respondents’ names revealed no duplications. The data was screened for multivariate outliers using the Mahalanobis distance measure; 14 cases from the US sample and 5 cases from the Jordanian samples were identified as potential outliers and removed. A total sample of 324 responses from the US sample and 318 responses from the Jordanian samples were retained for use during hypothesis testing.
Prior to testing our hypotheses relating to our foundation theory, TRA, we conducted CFA using PLS for all constructs included in our model. After removing items that did not load significantly across both cultural samples, three items were retained to measure the constructs of attitude, social norms, and piracy intention, respectively. The average variance extracted (AVE) statistics exceeded .50 for each construct, while all AVE values were greater than the squared correlations between constructs (Fornell & Larcker, 1981). Items did not have substantial cross-loadings when compared to the loadings of items on their respective latent variable (Chin, 1998), while all composite reliabilities exceeded .70 (Nunnally, 1978). T-tests indicated no significant differences in item weights or loadings across cultures for retained items. We therefore conclude that are instrument demonstrated sufficient validity and measurement invariance across subsamples to proceed with analysis.

Setterstrom, Knight, Aleassa and Pearson
106
First, we calculated models including only control variables relating to intention. For our US group, 8.2% of the variance was explained, with age (β = -.215, t-statistic = 3.541) and gender (β = -.214, t-statistic = 3.939) significantly relating to intention at the .05 level. For our Jordanian sample, 1.7% of variance was explained by our control variables, with age significantly relating to intention (β = -.132, t-statistic = 2.344). Interestingly, gender’s relationship was non-significant (β = .005, t-statistic = 0.082) while also having a significantly lower path coefficient than the US sample (t-statistic = -2.651).
Next, we added the attitude and subjective norms constructs to our model. The significance of our control variables did not change across groups. 42.8% of the variance was explained by the TRA model for our US group, which was significant improvement over the control variable model (F = 58.165, p < .001). Both attitude (β = -.204, t-statistic = 4.084) and subjective norms (β = -.464, t-statistic = 9.796) had significant relationships with intention for the US group. For the Jordanian group, only 3.5% of the variance was explained by the TRA model, which was not a significant improvement over the control variable model (F = 2.359, p = .053). Further, neither attitude (β = -.009, t = 0.101) nor subjective norms (β = -.131, t = 1.800) were significantly related to intention. The value of the path coefficients for attitude (t = 1.903) was significantly higher for the US group than the Jordan group, strongly supporting hypotheses 1. Interestingly, the path estimate between subjective norms and intention was significantly higher for the U.S. group than for the Jordanian group (t = 3.845), which was contrary to what was hypothesized. Thus, hypothesis 2 was not supported.
To test whether the value for a construct of interest varied between groups, we exported the unstandardized latent variable scores to SPSS 18.0 and conducted a regression analysis using latent variable scores as the dependent variable and a dummy code indicating whether a given case was from the US or Jordanian sample as the independent variable. We found that the US and Jordan groups did not significantly vary in their score for social norms. However, the US had significantly higher scores for attitude (t = 12.474) than the Jordan group, while at the same time having a significantly lower score for piracy intention (t = -4.547). Thus, hypothesis 3 was supported.
Prior to testing for two-way interaction (moderating) effects, we examined a model that included lower–order terms to be used as moderators (public self-consciousness, religiosity, idealism, and relativism) and statistically validated our instrument for all constructs included in our model. After removing items that did not load significantly across both cultural samples, 6 items we retained for self-consciousness, 8 items were retained for religiosity, and 3 items were retained for idealism and relativism, respectively. All AVE statistics exceeded .50 for each construct, while all AVE values were greater than the squared correlations between constructs. No items had substantial cross-loadings, while all composite reliabilities exceeded .70. T-tests indicated no significant differences in item weights. One item for intention demonstrated a significantly different factor loading across groups (t = 3.552). Given that 28 of 29 loadings and all weights were equivalent, we argue that we have achieved an acceptable level of

Journal of Business and Behavioral Sciences
107
measurement invariance to continue with our analysis (see Appendix I for final instrument). Measurement model statistics for our study are presented in tables 1 and 2 for the U.S. and Jordanian subsamples, respectively.
Table 1. Composite reliability, AVE, and latent variable correlations (U.S. sample)
CompositeReliability AVE ATT SN RELG RELT IDL PSC INT
ATT .906 .762 .873
SN .912 .775 .544 .880
RELG .942 .671 .127 .124 .819
RELT .818 .615 -.058 -.168 -.179 .784
IDL .793 .567 .187 .174 .150 -.029 .753
PSC .866 .524 -.123 -.024 .093 .043 .172 .724
INT .951 .866 -.515 -.598 -.197 .325 -.147 .135 .931
• bolded diagonal represents the square roots of the AVE • ATT = Attitude, SN = Subjective Norms, RELG = Religiosity,
RELT = Relativism, IDL = Idealism, PSC = Public Self-Consciousness, and INT = Intention to Pirate Software
Table 2. Composite reliability, AVE, and latent variable (Jordan sample)
CompositeReliability AVE ATT SN RELG RELT IDL PSC INT
ATT .918 .790 .889
SN .793 .566 ,051 .752
RELG .952 .714 .040 .025 .845
RELT .902 .755 .411 .156 .034 .869
IDL .803 .580 -.358 -.153 -.029 .086 .762
PSC .904 .612 -.089 -.166 .003 -.231 .246 .782
INT .918 .789 -.066 -.151 .067 -.069 .086 .301 .888
• bolded diagonal represents the square roots of the AVE • ATT = Attitude, SN = Subjective Norms, RELG = Religiosity,
RELT = Relativism, IDL = Idealism, PSC = Public Self-Consciousness, and INT = Intention to Pirate Software
We estimated the lower-order terms model and found that 47.6% of the variance for the US group was explained, which was a significant improvement over the TRA model (F = 34.313, p < .001). Age, attitude, and social norms remained significant in their influence of intention, while gender became non-significant (t-
Setterstrom, Knight, Aleassa and Pearson
108
statistic = 1.897). Idealism and public self-consciousness did not have significant relationships with intention. However, religiosity (β = -.081, t = 1.960) and relativism (β = .172, t-statistic = 3.948) were significantly related to intention. For our Jordanian group, the addition of the lower-order terms resulted in 11.6% of the variance being explained, which was a significant improvement over the TRA model (F = 5.251, p < .001). Age remained a significant predictor of piracy intention, while attitude, social norms, and gender remained insignificant. While relativism, idealism, and religiosity were not significant predictors of intention, public self-consciousness had a significant relationship (β = .263, t-statistic = 4.879).
At this point, we imported our unstandardized latent variables scores into SPSS to determine if there were significant differences in the moderator variables between groups. Our results suggest that the US sample had significantly higher scores for public self-consciousness (t-statistic = 3.406) and idealism (t-statistic = 3.472), while the Jordan sample had significantly higher scores for religiosity (t-statistic = 4.632). Groups had statistically similar scores for relativism.
Next, we included our interaction terms into our model to determine if significant interaction effects were present. For the US group, 49.6% of the variance was explained by the full interaction model. While this was a significant improvement in the model (F = 22.782, p < .001), none of the interaction terms had significant relationships with piracy intention. For the Jordan group, 36.9% of the variance is explained by the interaction model, which was a significant improvement over the lower-term model (F = 17.735). While three of our interaction effects were insignificant for the Jordan group, idealism was found to be a significant moderator of attitude (β = -1.104, t = 2.557).
The last step in our analysis was to examine whether the moderating effects in our research were equivalent across groups. Our results suggest that idealism’s moderating effect for the Jordan group was significantly stronger than for the US group (t = 2.059). Thus, the results of our study support hypothesis 5. All other moderators were not significantly different in their effects across groups. We therefore conclude that hypotheses 6 and 7 were not supported by our study. While the moderating effect of religiosity did not differ between cultures in our study (non-significant t-stats), the moderating effects of religiosity were not significant in our model for either group. As such, it could be argued that hypothesis 8 was supported, though these results are trivial.
Discussion and Conclusions The results of our study suggest there are dramatic differences between individuals from the US and Jordan in terms of which antecedents can effectively predict software piracy. With respect to our control variable model, age behaved similarly across both cultural groups as a predictor of intention to pirate software: older individuals were less likely to pirate software. This is not surprising, as age has been shown to be negatively correlated to an individual’s propensity to make unethical decisions (Kish-Gephart et al., 2010; Gopal & Sanders, 1998). This result has clear

Journal of Business and Behavioral Sciences
109
ramifications for practitioners, as it suggests strategies for reducing software piracy should target younger individuals when applicable (i.e., awareness campaigns). For gender, females in the US subsample were less likely to pirate software than their male counterparts. This gender-intention relationship was not observed in the Jordan subsample. While research examining software piracy typically has found that males have a higher propensity to pirate software (e.g., Hinduja, 2008; Moores & Dhillon, 2000), some studies using respondents from outside of the U.S. have failed to find these gender differences (Gopal & Sanders, 1998; Nill et al., 2010). We interpret this to mean that there are important gender differences between the cultures examined in our study. For practitioners, this suggests that targeting males with strategies for reducing software piracy may be effective within the U.S. and other Western cultures. However, such an approach may not be effective outside of the U.S, particularly in non-Western cultures.
With respect to our foundation theory, TRA, we hypothesized its predictive performance would be greater for our US groups. After controlling for age and gender, attitude and subjective norms were both significantly related in the anticipated direction with intentions to pirate software for the US sample. At the same time, the Jordanian sample did not demonstrate significant relationships for the same model. Furthermore, there was a remarkable disparity between the amount of variance explained by attitude and subjective norms for the US group (ΔR2 = .346) and Jordanian group (ΔR2 = .018). This is important to researchers, as we interpret these findings to mean that culture has a significant impact on the applicability of theoretical models such as TRA, and would suggest caution must be used when comparing the results of studies from countries with significantly different cultures. Furthermore, our results provide support for the theory underpinning the cultural psychological perspective; that is, theories of psychology will, at times, vary across cultures.
Prior to testing for moderators, we entered all lower order terms (public self-consciousness, religiosity, idealism, and relativism) into our model. While we made no hypotheses about the direct effect of these constructs on intention, we still found several interesting results. For the US group, the addition of these lower-terms significantly increased the explanatory power of our model (ΔR2 = .048). Specifically, relativism had a significant positive relationship with intention, while religiosity had a significant negative relationship; both of these results are congruent with previous literature examining these constructs’ relationships with ethical decisions (Valentine & Bateman, 2011; Vitell, 2009). The increase in variance for the Jordanian group was also significant, and remarkably greater in magnitude than the US group (ΔR2 = .081). In contrast to the US subsample, public self-consciousness was the only lower-order to significantly relate (positively) to intention, suggesting higher levels of public self-consciousness are associated with higher levels of intention to pirate software. This result is contrary to what theory would lead us to expect. One possible explanation for this result is that software piracy does not have a strong negative stigma associated with it in the Jordanian culture, while being perceived as helpful to friends is viewed as socially important. Given this scenario, individuals that are highly self-aware of their public image

Setterstrom, Knight, Aleassa and Pearson
110
could be expected to have higher intentions to pirate software if that action was perceived as beneficial to others. This explanation seems plausible given the collective nature of non-Western cultures such as Jordan.
Worth noting are the significant differences in scores between our two subgroups for our culturally-related constructs. Not surprisingly, individuals from Jordan demonstrated a higher level of religiosity than their U.S. counterparts. Again, the non-individualist nature of non-Western cultures explains this result. On the other hand, individuals from the U.S. reported higher levels of idealism and public self-consciousness, which is contrary to what prior research (Forsyth et al., 2008; Triandis, 1989) and theory would suggest. A review of related literature did not provide an explanation for these results. We believe further investigation is warranted.
While we expected cultural differences in the effects of our moderating variables, we did not anticipate the sharp differences in results across groups. For the US group, none of the interaction terms were significant. Additionally, while the inclusion of the interaction terms provided a significant improvement in the overall model, the increase in the amount of variance explained was marginal (ΔR2
= .020); On the other hand, the explanatory power for the Jordanian subsample nearly tripled (ΔR2 = .253). Additionally, we anticipated idealism to have a larger effect on individuals from Jordan than from the US. Our results confirmed this, as the attitude-idealism interaction term having a significant negative relationship with intention for the Jordanian group. For researchers, these results demonstrate that predicting individuals’ intentions to pirate software and, more generally, make ethical decisions can be effectively predicted in non-Western countries like Jordan. However, unlike in Western countries, the inclusion of culturally related constructs, such as ideology, would appear to be needed in non-individualist cultures.
Several limitations exist for this study. First, the use of college students could limit the generalizability of our results. While we believe our sample adequately represents the population of interest (individuals that pirate software), additional research is needed to determine if this assumption holds true. Further, our study examines only two countries/cultures and within the one context of software piracy. It is possible that research examining different ethical decisions might produce different results, even using the same sample groups. Another potential limitation is the methods utilized to collect the data for this study. A paper-based approach was utilized to collect the Jordanian data while a web-based approach was used to collect data from respondents in the U.S. This could raise questions about selection and participation biases that could possibly influence the type of respondent that participated within each group.
Based on our results, several avenues for future research could be pursued. First, much work has been conducted in Western cultures (i.e., the U.S.) to develop models for predicting individual behavior, such as TRA, TPB, and TAM. These theories provide parsimonious explanations of the mental processes that precede the development of intention, and have been found to be robust in their applicability across many contexts. To our knowledge, such a model has not been
Journal of Business and Behavioral Sciences
111
developed for Arabic countries, or non-Western countries in general, and we believe research in this area would potentially represent a significant contribution to IS research. Second, while one of the goals of this research was to identify similar factors that motivate individuals to make ethical decisions across the cultural groups used in our study, our results suggested that the mental processes for our two subsamples were dramatically different and that there were no substantial similarities. Future research that successfully identifies factors that affect an individual’s decision to or to not pirate software across all cultures would potentially be very beneficial to practitioners grappling with mitigating software piracy occurring in the various countries around the world.
Furthermore, research has suggested that persons from individualistic cultures tend to be less concerned with public self-consciousness than collective cultures when looking for queues for how to behave (Triandis, 1989). Therefore, we anticipate the impact of public self-consciousness as a moderator will be greater for Jordanians than individuals from an individualistic country such as the US.
REFERENCES
AbuShanab, E., J. M. Pearson, and A. J. Setterstrom. 2010. “Internet Banking and Customers’ Acceptance in Jordan: The Unified Model’s Perspective.” Communications of the Association for Information Systems 26(23): 493-524.
Ajzen, I., and M. Fishbein. 1973. “Attitudinal and Normative Variables as Predictors of Specific Behavior.” Journal of Personality and Social Psychology 27(1): 41-57.
Al-Rafee, S., and T. P. Cronan. 2006. “Digital Piracy: Factors that Influence Attitude Toward Behavior.” Journal of Business Ethics 63: 237-259.
Aleassa, H., J. M. Pearson, and S. McClurg. 2011. “Investigating Software Piracy in Jordan: An Extension of the Theory of Reasoned Action.” Journal of Business Ethics 98 (4): 663-676.
Business Software Alliance. 2012. 2011 BSA global software piracy study. http://portal.bsa.org/globalpiracy2011/downloads/study_pdf/2011_BSA_Piracy_Study-Standard.pdf. Accessed July 13, 2012.
Carver, C. S., and M. F. Scheier. 1981. Attention and Self-Regulation: A Control-Theory Approach to Human Behavior. New York, NY: Springer.
Chin, W. W. 1998. “The Partial Least Squares Approach for Structural Equation Modeling.” Chap. 10 In Modern methods for business research, ed. G. A. Marcoulides. London: Lawrence Erlbaum Associates.
Chin, W. W. 2000. Frequently Asked Questions – Partial Least Squares and PLS-Graph. http://disc-nt.cba.uh.edu/chin/plsfaq.htm. Accessed May 22, 2011.
De George, R. T. 1986. Ethics and Business Ethics. Journal of Business Ethics5(6): 421-432.

Setterstrom, Knight, Aleassa and Pearson
112
Du,R., Liu, L., Straub, D., Knight, M.B., (2016), The impact of espoused national cultural values on innovative behaviour: an empirical study in the Chinese IT-enabled global service industry, Asia Pacific Business Review, March/2016/DOI: 10.1080/13602381.2016.1156907
Evans, T. D., F. T. Cullen, R. G. Dunaway, and V. S. Burton. 1995. “Religion and Crime Reexamined: The Impact of Religion, Secular Controls, and Social Ecology on Adult Criminality.” Criminology 33(2): 195-224.
Fenigstein, A., M. F. Scheier, and A. H. Buss. 1975. “Public and Private Self-Consciousness: Assessment and Theory.” Journal of Consulting and Clinical Psychology 43(4): 522-527.
Fishbein, M., and I. Ajzen. 2010. Predicting and Changing Behavior. New York, NY: Psychology Press.
Fornell, C., and D. F. Larcker. 1981. “Evaluating Structural Equation Models with Unobservable Variables and Measurement Error.” Journal of Marketing Research 18(1): 39-50.
Forsyth, D. R. 1980. A taxonomy of ethical ideologies. Journal of Personality and Social Psychology 39(1): 175-184.
Forsyth, D. R., E. H. Jr. O’Boyle, and M. A. McDaniel. 2008. “East Meets West: A Meta-Analytical Investigation of Cultural Variations in Idealism and Relativism.” Journal of Business Ethics 83: 813-833.
Goel, R. K., and M. A. Nelson. 2009. “Determinants of Software Piracy: Economics, Institutions, and Technology.” Journal of Technology Transfer34(6): 637-658.
Gopal, R. D., and A. Gupta. 2010. “Trading Higher Software Piracy for Higher Profits: The Case of Phantom Piracy.” Management Science 56(11): 1946-1962.
Gopal, R. D., and G. L. Sanders. 1998. “International Software Piracy: Analysis of Key Issues and Impacts.” Information Systems Research 9(4): 380-397.
Gupta, P. B., S. Could, and B. Pola. 2004. “To Pirate or Not to Pirate: A Comparative Study of the Ethical versus Other Influences on the Consumer’s Software Acquisition-Mode Decision.” Journal of Business Ethics 55(3): 255-274.
Hair, J. F., W. C. Black, B. J. Babin, R. E. Anderson, and R. L. Tatham. 2006. Multivariate Data Analysis. 6th ed. Englewood Cliffs, NJ: Prentice Hall.
Hinduja, S. 2008. “Deindividuation and Internet Software Piracy.” CyberPsychology & Behavior 11(4): 391-398.
Hofstede, G. 1980. Culture’s consequences: International differences in work-related values. Beverly Hills, CA: Sage Publications.
Holsapple, C., D. Iyengar, H. Jin, and S. Rao. 2008. “Parameters for Software Piracy Research.” The Information Society 24(4): 199-218.
Hunt, S. D., and S. Vitell. 1986. “A General Theory of Marketing Ethics.” Journal of Macromarketing 6: 5-16.
Husted, B. W. 2000. “The Impact of National Culture on Software Piracy”. Journal of Business Ethics 26(3): 197-211.
Journal of Business and Behavioral Sciences
113
King, W. R., and J. He. 2006. “A Meta-Analysis of the Technology Acceptance Model.” Information & Management 43(6): 740-755.
Kini, R. B., H. V. Ramakrishna, and B. S. Vijayaraman. 2004. “Shaping of Moral Intensity Regarding Software Piracy: A Comparison between Thailand and U.S. Students.” Journal of Business Ethics 49: 91-104.
Kish-Gephart, J. J., D. A. Harrison, and L. K. Trevino. 2010. “Bad Apples, Bad Cases, and Bad Barrels: Meta-Analytic Evidence About Sources of Unethical Decisions at Work.” Journal of Applied Psychology 95(1): 1-31.
Kolberg, L. 1969. “Stage and Sequence: The Cognitive-Developmental Approach to Socialization.” In Handbook of Socialization Theory & Research, ed. D. Growling. Chicago, IL: Rand McNally.
Lalwani, A. K., L. J. Shrum, and C. Y. Chiu. 2009. “Motivated Response Styles: The Role of Cultural Values, Regulatory Focus, and Self-Consciousness in the Socially Desirable Responding.” Journal of Personality and Social Psychology 96(4): 870-882.
Mason, R. 1986. “Four Ethical Issues of the Information Age.” MIS Quarterly10(1): 4-12.
Mathieson, K. 1991. “Predicting User Intentions: Comparing the Technology Acceptance Model with the Theory of Planned Behavior.” Information Systems Research 2(3): 173-191.
McCoy, S., D. F. Galetta, and W. King. 2007. “Applying TAM Across Cultures: The Need for Caution.” European Journal of Information Systems 16: 81-90.
Millar, M. 2007. “The Influence of Public Self-Consciousness and Anger on Aggressive Driving.” Personality and Individual Differences 43(8): 2116-2126.
Moores, T. T. 2008. “An Analysis of the Impact of Economic Wealth and National Culture on the Rise and Fall of Software Piracy Rates.” Journal of Business Ethics 81: 39-51.
Moores, T. T., and J. C. J. Chang. 2006. “Ethical Decision Making in Software Piracy: Initial Development and Test of a Four-Component Model.” MIS Quarterly 30(1): 167-180.
Moores, T. T., and G. Dhillon. 2000. “Software Piracy: A View from Hong Kong.” Communications of the ACM 43(12): 88-93.
Moores, T. T., A. Nill, and M. A. Rothenberger. 2009. “Knowledge of Software Piracy as an Antecedent to Reducing Pirating Behavior.” Journal of Computing Information Systems 50 (1): 82-89.
Nill, A., J. Schibrowsky, and J. W. Peltier. 2010. “Factors that Influence Software Piracy: A View from Germany.” Communications of the ACM 53(6): 131-134.
Nunnally, J. C. 1978. Psychometric Theory. New York, NY: McGraw-Hill. Peace, A. G., D. F. Galletta, and J. Y. Thong. 2003. “Software Piracy in the
Workplace: A Model and Empirical Test.” Journal of Management Information Systems 20(1): 153-177.
Ringle, C. M., S. Wende, and S. Will. 2005. SmartPLS 2.0 (M3) beta. http://www.smartpls.de.

Setterstrom, Knight, Aleassa and Pearson
114
Rohrbaugh, J., and R. Jessor. 1975. “Religiosity in Youth: A Personal Control Against Deviant Behavior.” Journal of Personality 43(1): 136-155.
Schlenker, B. R., and D. R. Forsyth. 1977. “On the Ethics of Psychological Research.” Journal of Experimental Social Psychology 13(4): 369-396.
Sheppard, B. H., J. Hartwick, and P. R. Warshaw. 1988. “The Theory of Reasoned Action: A Meta-Analysis of Past Research with Recommendations for Modifications and Future Research.” Journal of Consumer Research 15(3): 325-343.
Sia, C. L., K. H. Lim, K. Leung, M. K. O. Lee, W. Huang, and I. Benbasat. 2009. “Web Strategies to Promote Internet Shopping: is Cultural-Customization Needed?” MIS Quarterly 33(3): 491–512
Sims, R. R., H. K. Cheng, and H. Teegen. 1996. “Toward a Profile of Student Software Piraters.” Journal of Business Ethics 15(8): 839-849.
Srite, M., and E. Karahanna. 2006. “The Role of Espoused National Cultural Values in Technology Acceptance.” MIS Quarterly 30(3): 679-704.
Swinyard, W. R., H. Rinne, and A. K. Kau. 1990. “The Morality of Software Piracy: A Cross-Cultural Analysis.” Journal of Business Ethics 9: 655-664.
Triandis, H. C. 1989. “The Self and Social Behavior in Differing Cultural Contexts.” Psychological Review 96(3): 506-520.
Valentine, S. R., and C. R. Bateman. 2011. “The Impact of Ethical Ideologies, Moral Intensity, and Social Context on Sales-Based Ethical Reasoning.” Journal of Business Ethics 102(1): 155-168.
Vandenberg, R. J., and C. E. Lance. 2000. “A Review and Synthesis of the Measurement Invariance Literature: Suggestions, Practices, and Recommendations for Organizational Research.” Organizational Research Methods 3(1): 4-70.
Vitell, S. J. 2009. “The Role of Religiosity in Business and Consumer Ethics: A Review of the Literature.” The Journal of Business Ethics 90: 155-167.
Yang, D., M. Sonmez, D. Bosworth, and G. Fryxell. 2009. “Global Software Piracy: Searching for Further Explanations.” Journal of Business Ethics 87: 269-283.

Journal of Business and Behavioral Sciences
115
Appendix I
Please note that the survey instrument is available on request from the corresponding author at [email protected]

Journal of Business and Behavioral Sciences Vol 30, No 2; Fall 2018
116
HAS THE STATEMENT OF FINANCIAL ACCOUNTING STANDARDS (SFAS 142) HELPED OR HINDERED THE
BOTTOM LINE AND SECURITY PRICES?
Ronald A. Stunda Valdosta State University
ABSTRACT
Prior research surrounding goodwill assesses primarily the effects of the change on reporting of goodwill brought about by SFAS 142. This paper extends the research on goodwill by specifically assessing the impact that SFAS 142 has had on reported goodwill, the associated effect net income, and the linkage to security prices. Findings show that since the inception of SFAS in 2002, the amount of goodwill recorded by acquiring firms has increased in each subsequent year. Along with the goodwill increase has been the rise in firm risk for each of the 15 years analyzed. When a standardized ratio of net income increase to goodwill increase is assessed for the study period the results show that the ratio of income to goodwill has also risen in each of the years since inception of SFAS 142, indicating that the recording of goodwill has the side effect of being linked to an increase of current and future income of the acquiring firms. This may be resultant from recording an asset that is not subject to amortization.
Keywords: Goodwill, SFAS 142, acquisition, security prices
INTRODUCTION
Statement of Financial Accounting Standard (SFAS) 142, Goodwill and Other Intangible Assets, made two significant changes to goodwill accounting when it was adopted in June, 2001. First, firms are required to annually test goodwill for impairment. Second, firms are prohibited from systematically amortizing goodwill. While it may be argued that both of these changes may affect bottom line net income, it is the second significant change, the prohibition of systematically amortizing goodwill which will be evaluated in this research.
Basic elements of the SFAS 142 require the cost of an acquisition to be measured at the date of the announcement of acquisition by the acquirer of the acquiree’s net assets. Goodwill is to be allocated among reporting units, which are operating segments of an enterprise. Goodwill is not amortized, it is instead considered to have an indefinite life. Practically, however, goodwill’s life is limited, it is simply unknown what that limited life is. As a result, a periodic test of goodwill is necessary to assess potential impairment.
Goodwill is recorded as an intangible asset but is also considered a “growth asset” (Damodaran, 2012). A growth firm that grows entirely through

Journal of Business and Behavioral Sciences
117
internal investments will not show its growth assets on its balance sheet until it makes those investments. If that firm is acquired by another firm, the goodwill that shows up on the acquiring firm’s balance sheet will include those externally purchased growth assets. Investors, therefore, have to wrestle with what to do with goodwill, since on the surface it is an asset that has no direct bearing on bottom line net income. Most goodwill research has concentrated on the usefulness of the new standard as compared to the previous practices. Hitz and Kuhner (2002) analyzed the usefulness of impairment charge in decision making through comparing the net income prior to and after goodwill writeoffs to current period income. Chen et al. (2004) found that the new rules of goodwill accounting outperform the previous enactments. On the other hand Wiese (2005) favored the amortization approach. Chambers (2006) concluded that that goodwill accounting under SFAS 142 does not improve financial reporting compared to amortization-based accounting. Zhang and Zhang (2006) discovered that management is motivated to allocate more purchase price to goodwill. When the payment is made in form of stock-for-stock acquisitions rather than cash payment, then the existence of goodwill overpayment becomes evident (Loughran and Vijn, 1997). Little research has been conducted on the effect that the presence of goodwill has on net income and how that effect may have altered over the years since the 2001 inception of SFAS 142.
LITERATURE REVIEW
Sundararajan (1995) analyzes the two manners in which goodwill may be presented; the first is the residual approach that considers goodwill as a leftover amount. Goodwill represents the excess of purchase price over the fair market value of the acquiree’s net assets and cannot be identified separately. The second is the excess profit approach where goodwill is the difference between the combined company’s profits over normal earnings for a similar business. The second definition states that goodwill is the present value of the projected future excess normal earnings that may be generated by the acquiree. This concept is difficult to measure given the uncertainty related to the future earnings as well as the difficulty attributed to the probable discount rate to use (Sundararajan, 1995).
Chambers (2006) finds evidence that the elimination of systematic amortization has reduced the value relevance of financial reporting, due to goodwill, and contrary to the expectations of the Financial Accounting Standards Board. The study shows that an accounting system that permits systematic amortization of goodwill provides the most value relevant accounting numbers. Whereas, the non-amortization of goodwill has left investors and analysts less prone to assimilate its effects.
Extant research on mergers and acquisitions shows that acquiring firms tend to historically overpay for target firms during the acquisition (Keller 1990, Shefrin 2002, Shefrin 2006, David, Graham, and Harvey 2007, Malmendier and Tate 2004, Doukas and Petmezas 2007). New rules on goodwill have not reduced the propensity of acquirers to overpay for target firms (Malmendier and Tate,

Stunda
118
2008). In fact, acquisition accounting rules provide additional incentive for acquiring firms to continue to overpay for targets. As a result of the new differential accounting treatment provided for in SFAS 142, Zhang and Zhang (2006) find that managers allocate more purchase price to goodwill in order to reduce amortization expenses.
DATA AND DESIGN
The sample consists of analysis of goodwill associated with mergers and acquisitions (M&A) which have occurred since the first full year after inception of SFAS 142 (2002) through the most current full year available (2016). The time period also considers economic expansion and economic contraction periods. Quarterly earnings and security prices during the years 20022016 are obtained for the selected firms. Earnings data are obtained from Compustat and security price information is derived from the Center for Research on Security Prices (CRSP).
Table 1 Sample Summary Mergers and Acquisitions 2002-2016
Year Mergers/Acquisitions Yr. over Yr. % Chg.
Sample Firms
2002 105 - 128
2003 108 2.5% 137
2004 143 32.5% 162
2005 148 3.6% 171
2006 169 14.8% 180
2007 179 6.1% 189
2008 142 (18.6)% 150
2009 114 (19.4)% 126
2010 124 8.9% 131
2011 127 2.7% 134
2012 128 0.8% 131
2013 130 1.5% 138
2014 139 6.8% 144
2015 150 7.6% 156
2016 161 7.1% 171
Total 2,067 2,248
Source: Institute for Mergers, Acquisitions, and Alliances
In addition, the Electronic Data Gathering and Retrieval System (EDGAR), and the Dow Jones News Retrieval Service (DJNRS) are used to analyze financial notes and other firm information in order to discover M&A activities of acquiring firms. Any M&A firms not containing required data are eliminated from the final

Journal of Business and Behavioral Sciences
119
sample. Total number of M&A announcements along with the associated number of firms are presented in Table 1.
HYPOTHESIS DEVELOPMENT
Zhang and Zhang (2006) find that managers tend to allocate more purchase price to goodwill during M&A activities in order to avoid amortization expenses and therefore boost current and future earnings. Wiese (2005), on the other hand, finds that acquiring firms do not tend to load purchase price amounts into goodwill. In order to assess the degree of use of goodwill accounting during M&A activities by acquiring firms, it is best to place the concept of recording goodwill in perspective of actual acquisitions over the time periods since inception of SFAS 142. This leads to the first hypothesis, stated in null form:
H1: There is no significant increase in reporting goodwill by acquiring firms subsequent to passage of SFAS 142.
Chen et al (2004) find that the new rules of goodwill accounting outperform the previous enactments by producing greater bottom lines as goodwill values increase for acquiring firms. The study is limited to assessment of two years subsequent to SFAS 142 passage. Zhang and Zhang (2006) confirm that the new rule of non-amortization of goodwill during acquisitions results in greater short term net income to the acquiring firm. This leads to the second hypothesis, stated in the null form:
H2: There is no significant difference in the change in net income relative to the change in reported goodwill of acquiring firms subsequent to passage of SFAF 142.
The association between accounting earnings and security returns was first propounded by Ball and Brown (1968). The premise of the Ball and Brown study was to see whether the magnitude of unexpected earnings (as opposed to merely the sign of unexpected earnings) was related to the magnitude of the stock price response. Beaver, Clarke and Wright (1979) addressed the issue and discovered, in fact, that the magnitude of unexpected earnings was related to the magnitude of the stock price response. Again, they focused on market-adjusted stock returns to facilitate across-firm comparisons and to control for market-wide movements in stock prices. Ball and Brown (1968) and Beaver, Clarke and Wright (1979) show that despite the deficiencies of historical cost accounting, accounting earnings are potentially useful to investors. They also ushered in the so-called information perspective on the decision usefulness of accounting. The information perspective implies that investors’ response to accounting information can provide a guide as to what type of information is or is not valued by investors. Consistent with the

Stunda
120
literature, the term “Earnings Response Coefficient, or “ERC” is used to describe the strength of the market response to unexpected earnings.
The above literature gives rise to the third hypothesis, stated in the null form:
H3: There is no significant difference in share price effect of acquiring firms versus nonacquiring firms subsequent to passage of SFAS 142.
METHODOLOGY
In assessing hypothesis 1 an analysis of variance (ANOVA) is conducted on the total composite number of sample firms by year in the study (n=15). Since these amounts are raw numbers, they must first be standardized in order to assess them from a statistical perspective. This is done by subtracting the yearly amount from the 15 year mean. That difference is then divided by the standard deviation. A one way ANOVA test is then performed on the absolute value of the result for each year in the sample. Any statistical differences are then analyzed.
An analysis of hypothesis 2 also utilizes a one way ANOVA test. Similar to hypothesis 1, the composite number of sample firms by year (n=15) is utilized. A standardized ratio for each year is obtained which is the result of the percent change in net income divided by the percent change in goodwill. A one way ANOVA test is then performed on the absolute value of the result for each year in the sample. Any statistical differences are then analyzed.
The purpose of the test of hypothesis 3 is to assess any differences in the relative information content of unexpected earnings to share prices. In order to accomplish this, a cross sectional analysis of total firms in the acquisition sample is compared to an equal number of firms of similar size and industry representation which did not engage in M&A activities during the 2002-2016 test period. Reported quarterly returns and associated stock prices nearest the acquisition are captured and a subsequent cross sectional regression analysis is performed.
Ordinary least squares (OLS) regression was used to test the hypothesis. The reason for using OLS measurement was to remain consistent with the approach used by prior researchers [i.e., Town (1992), Williams (2010), Kemal (2011), Altunbas (2004), Holmstrom (2001)], thus insuring comparability to prior studies. Cross-sectional dependence and heteroskedasticity are not likely to be present in stock return metrics since sample firms are not affected by common event dates (Binder 1985; Bernard 1987; Grammatikos and Yourougou 1990). However, whenever a set of multiple regression variables are employed, there is a probability of the presence of multicollinearity within the set of independent variables which may be problematic from an interpretive perspective. The following regression model [similar to that used in Ball and Brown (1968), Town (1992), Williams (2010), Kemal (2011), Altunbas and Ibanes (2004), and Holmstrom (2001)] is used to assess empirical results:

Journal of Business and Behavioral Sciences
121
CARit = a + b1UEAit + b2UENit +b3Mbit + b4Bit +b5MVit +eit (1) Where: CARit = Cumulative abnormal return firm i, time t
a = Intercept term UEAit = Unexpected earnings for firm i, time t, for all acquiring
firms in the 2002-2016 sample (n= 2,248) UENit = Unexpected earnings for firm i, time t, for all non-acquiring
firms in the 2006-2015 sample (n=2,248) MBit = Market to book value of equity as proxy for growth and
persistence Bit = Market model slope coefficient as proxy for systematic risk MVit = Firm size proxy eit = error term for firm i, time t
The coefficient “a” measures the intercept. The coefficient b1 is the earnings response coefficient (ERC) for all acquiring firms in the 2002-2016 sample (2,248). The coefficient b2 is the ERC for all non-acquiring firms in the 2002-2016 sample (2,248). The coefficients b3, b4, and b5, are assessed for any potential contributions to the ERC for all firms in the sample. To investigate the effects of the information content of earnings on security prices, there must be some control for variables shown by prior studies to be determinants of ERC. For this reason, the variables represented by coefficients b3 through b5 are included in the study. Unexpected earnings (UEi) is measured as the difference between the actual earnings (EAi) and security market participants’ expectations for earnings proxied by consensus analyst following as per Investment Brokers Estimate Service (IBES) (EXi). The unexpected earnings are scaled by the firm’s stock price (Pi) 180 days prior to the forecast:
UEi = [(MFi) – (EXi)]/Pi (2)
For each firm sample, an abnormal return (ARit) is generated around the event dates of -1, 0, +1 (day 0 representing the day of the acquisition announcement per DJNRS). The market model is utilized along with the CRSP equally-weighted market index and regression parameters are established between -290 and -91. Abnormal returns are then summed to calculate a crosssectional cumulative abnormal return (CARit).
RESULTS H1
Results for the one-way ANOVA test of hypothesis 1 are presented in Table 2 below steadily increased each year, even outpacing the percentage increase in acquisitions. Table 2 presents the average standardized goodwill increases for

Stunda
122
each of the 15 years in the study (n=15). The oneway ANOVA test indicates an F-ratio of 22.190 with an associated p-value of .0000. When the Levene test was performed to assess for homogeneity of variance, a Levene statistic of 7.3850 was obtained with a significance level of .001. This test indicates significant differences in the variances of the groups.
Table 2-Test of Hypothesis 1 One Way ANOVA-Change in Goodwill Reported by Acquiring Firms (2002-2016) Summary Groups Count Sum Average Variance 2002 128 1094.7 8.552 5.381 2003 137 1592.6 11.625 6.049 2004 162 1758.4 10.854 6.482 2005 171 1922.1 11.240 7.012 2006 180 2040.4 11.335 7.129 2007 189 2231.5 11.807 7.259 2008 150 2036.7 13.578 8.159 2009 126 1956.2 15.525 8.495 2010 131 2045.9 15.617 8.394 2011 134 2215.1 16.531 8.812 2012 131 2380.4 18.168 9.138 2013 138 2575.8 18.659 9.583 2014 144 2773.5 19.257 9.985 2015 156 3026.7 19.402 10.158 2016 171 3561.6 20.824 10.620 Source of Variation SS df MS F-ratio P-value Between Groups 3618.106 14 301.618 22.190 .0000 Within Groups 1082.775 2234 5.002 Total 4700.881 2248 Levene Statistic df1 df2 Two-tail Significance 7.3850 14 2234 .001 t-stat df p-value Welch’s t-test 1.595 14 <.020
Because the variances of the groups are not equal, there exists violation of the assumption of homogeneity across the sample. In order to account for this, the Welch’s test was performed. This test assesses the significance between groups when variances do not equal. Based on the Welch’s test, and as indicated in Table 3, a t-statistic of 1.595 was computed with a p-value of less than .020. This indicates that the mean of the sample groups are significantly different, and thus the null of the similarity between the groups is rejected.

Journal of Business and Behavioral Sciences
123
RESULTS H2
Results for the one-way ANOVA test of hypothesis 2 are presented in Table 3 below. Table 3 presents the average standardized ratio of net income increases to goodwill increases for each of the 15 years in the study (n=15).
Table 3-Test of Hypothesis 2ne Way ANOVA-Change in Income Relative to Goodwill Reported by Acquiring Firms (2002-2016) Summary Groups Count Sum Average Variance 2002 128 500.8 3.913 2.158 2003 137 612.3 4.469 2.285 2004 162 640.2 3.952 2.389 2005 171 678.5 3.968 2.497 2006 180 702.1 3.901 2.601 2007 189 737.3 3.900 2.613 2008 150 691.2 4.608 3.001 2009 126 593.6 4.711 3.189 2010 131 610.4 4.660 3.284 2011 134 631.2 4.710 3.319 2012 131 651.8 4.976 3.521 2013 138 671.0 4.863 3.368 2014 144 707.4 4.912 3.828 2015 156 805.6 5.164 4.028 2016 171 912.3 5.335 4.231 Source of Variation SS df MS F-ratio P-value Between Groups 1489.590 14 152.215 23.229 .0000 Within Groups 386.213 2234 4.186 Total 1875.803 2248 Levene Statistic df1 df2 Two-tail Significance 7.4560 14 2234 .001 t-stat df p-value Welch’s t-test 1.702 14 <.020
Because the variances of the groups are not equal, there exists violation of the assumption of homogeneity across the sample. In order to account for this, the Welch’s test was performed. This test assesses the significance between groups
when variances do not equal. Based on the Welch’s test, and as indicated in Table 4, a t-statistic of 1.702 was computed with a p-value of less than .020.
This indicates that the mean of the sample groups are significantly different, and thus the null of the similarity between the groups is rejected.
The one-way ANOVA test indicates an F-ratio of 23.229 with an associated p-value of .0000. When the Levene test was performed to assess for homogeneity
of variance, a Levene statistic of 7.4560 was obtained with a significance level of .001. This test indicates significant differences in the variances of the groups.

Stunda
124
RESULTS H3
Table 4 indicates the earnings response coefficients for the sample of study firms over the 15year assessment period. Results indicate that the ERC for acquiring firms reporting goodwill during the study period (b1), is significantly negative relative to stock prices of the firms. This indicates that investors view acquiring firms recording goodwill as a negative signal and therefore bid down the share price of the firm’s associated stock. The ERC for similar size and industry firms not reporting goodwill or undergoing M&A activities during the same study period (b2) is significantly positive, thus reflecting a positive association between accounting earnings and share price, as demonstrated in numerous previous studies All other variables in the model are found not to be significant at conventional levels.
Table 4: Test of Hypothesis 3 ERC Effect of Goodwill Reported by Acquiring Firms 2002-2016 Model: CARit = a + b1UEAit + b2UENit +b3Mbit + b4Bit +b5MVit +eit
a b1 b2 b3 b4 b5 Adj. R2
.05 -.02 .11 .07 .03 .21 263 (.37) (2.27) (1.64)a (.18) (.56) (.52)
b1 = information content of all acquiring firms recording goodwill (2,248) b2 = information content of all non-acquiring firms (2,248) b3 = control variable for growth and persistence b4 = control variable systematic risk b5 = control variable firm size
a= significant at the .01 level b= significance at the .10 level
study period 2002-2016
CONCLUSIONS
When a standardized ratio of net income increase to goodwill increase is assessed for the study period the results show that the ratio of income to goodwill has also risen in each of the years since inception of SFAS 142, indicating that the recording of goodwill has the side effect of being linked to the increase of current and future income of the acquiring firms. This may be resultant from recording an asset that is not subject to amortization.
This study extends prior research on the subject of goodwill by exploring the impact that SFAS 142 has had on the recording of goodwill, its impact on net income, and the associated relation to stock prices. Results would be helpful to

Journal of Business and Behavioral Sciences
125
managers, investors, and analysts as all concerned parties attempt to maximize shareholder wealth.
REFERENCES
Altunbas, Y. (2004). Mergers and acquisitions and bank performance. The Role of Strategic Similarities, September.
Ball, R., and P. Brown (1968). An empirical evaluation of accounting income numbers, Journal of Accounting Research 6, 159-178.
Beaver, W, R. Clarke, and W. Wright (1979). The Association Between Unsystematic Security Returns and Earnings Forecast Errors, Journal of Accounting Research (Autumn), 316340.
Bernard, V. (1987). Cross-sectional dependence and problems in inference in market-based accounting research. Journal of Accounting Research 25 (Spring): 1-48.
Binder, J. (1985). Measuring the effects of regulation with stock price data. Rand Journal of Economics16 (Summer): 167-183.
Chambers D. (2006). “Is Goodwill Impairment Accounting Under SFAS 142 an Improvement over Systematic Amortization of Goodwill.” Working Paper, University of Kentucky.
Damodaran, A. (2012). Musings on Markets. Stern School of Business, NYU. David, I., J. Graham, and C. Harvey (2007). Managerial Miscalibration. Quarterly Journal of Economics 12, 1547-1584.
Doukas, J., and D. Petmezas (2007). Acquisitions, Overconfident Managers and Self-attribution Bias. European Financial Management 13, 531-577.
Duso T, K. Gugler, and B. Yurtoglu (2006). “Is the Event Study Methodology Useful for Merger Analysis? A Comparison of Stock Market and Accounting Data”. Working Paper, Humboldt University Berlin.
Financial Accounting Standards Board, Statement of Financial Accounting Standard No. 142, June, 2001.
Grammatikos, T. and P. Yourougou (1990). Market expectations of the effects of the Tax Reform Act of 1986 on banking organizations. Journal of Banking and Finance 14 (December): 1171-1187.
Holmstrom, B. (2001). Corporate governance and merger activity in the U.S. Journal of Economic Perspectives 15, September: 158-172.
Hitz J, and C. Kuhner (2002). “The New Rules for the Accounting of Derivative Goodwill in Accordance with SFAS 141 and SFAS 142.” The Audit, pp. 273-287.
Institute for Mergers, Acquisitions, and Alliances. Vienna, Austria, May, 230-256. Keller, J. (1990). Calculated Offer: Why AT&T Wants to Fight for NCR Despite
Rejected Bid. The Wall Street Journal, December 4. Kusnadi J, and A. Sohrabian (1999). “The Impact of Insurance Mergers on
Shareholder Returns”. URL: http://www.csupomona.edu. Loughran T, and A. Vijh (1997). “Do Long-Term Shareholders Benefit from
Corporate Acquisitions?” Journal of Finance. 52(5): 1765-1790.
Stunda
126
Malmendier, U., and G. Tate (2008). Who Makes Acquisitions? CEO Overconfidence and the Market‟s Reaction. Journal of Financial Economics 89, 20-43.
Shefrin, H. (2002). Beyond Greed and Fear: Understanding Behavioral Finance and the Psychology of Investing. Oxford University Press, Oxford, UK.
Shefrin, H. (2006). Behavioral Corporate Finance. McGraw-Hill/Irwin, New York. Sundararajan V. (1995). “Accounting for Goodwill”. The CPA Journal Online. Town, R. (1992). Merger waves and the structure of merger and acquisitions.
Journal of Applied Econometrics, 7, 83-100. Wiese A. (2005). “Accounting for Goodwill: The Transition from Amortization to
Impairment- An Impact Assessment”. Working Paper, University of Stellenbosch.
Williams, J. (2010). A case of merger and acquisition blind spot. Allied Academies of Financial Studies Journal September: 15-29.
Zhang I, and Y. Zhang (2006). “Accounting Discretion and Purchase Price Allocation after Acquisitions”. Working Paper, University of Minnesota.

Journal of Business and Behavioral Sciences Vol 30, No 2; Fall 2018
127
PATIENT VIOLENCE AGAINST HEALTHCARE WORKERS
Shenae K. Samuels Sharon Hunt Jordan Tezra
Texas Tech University Health Sciences Center
ABSTRACT Patient violence towards healthcare workers is a significant issue many hospitals and other healthcare facilities face today. With the number of workplace violence injuries on the rise and with a vast majority of perpetrators being identified as patients, this paper aims to provide a review of the literature pertaining to patient violence against healthcare workers while identifying and describing potential solutions inclusive of an implementation plan for a new program focused on preventing patient-related violence against healthcare workers. Findings of the literature review indicate that the common causes of violent behavior from patients are feelings of stress or not having control. The literature also suggests that consequence of patient violence against healthcare workers may include both physical and mental effects; and financial consequences at the organizational level. Ultimately, the literature indicates the need to recognize risk factors and solutions in order to create a safer work environment for healthcare workers.
Key Words: Healthcare, healthcare workers, patient violence, work-related violence, literature review
INTRODUCTION Workplace violence can happen anywhere, at any time, and to anyone. In 2009, there were about 575,000 nonfatal workplace violent crimes committed in the United States (Harrell, 2011). Between 2005 and 2009, approximately 10 percent of the workplace violence victims were employed in the healthcare industry (Harrell, 2011). Research suggests that this rate may be considerably higher since incidents due to the lack of a standard definition of workplace violence, underreporting, and the lack of mandated regulations for workplace violence prevention (Gerberich et al., 2004). Most occurrences are nonfatal, but they are still capable of causing serious injuries and having multiple consequences for the victim and the organization for which they work. The perpetrators are often patients and it is an all-too-common problem in healthcare, which has been tolerated and widely overlooked. Every healthcare facility should consider developing a workplace violence prevention program with strategies focused on managing violent patients to better protect their employees and create a safer environment. This paper reviews how violence from patients can affect healthcare workers and an organization by causing injuries and physical trauma,

Samuels, Hunt and Tezra
128
lowering quality of care, and increasing costs. Furthermore, it discusses potential solutions such as prevention training and how a new plan can be implemented to decrease incidents of patient violence against healthcare workers. According to the National Institute for Occupational Safety and Health (2002), workplace violence is defined as any act or threat of violence directed at someone who is at work or on duty. The violent person could be an employee, patient, visitor, or even someone with no legitimate relationship to the employee or organization. Healthcare workers experience a significant amount of workplace violence, especially from the patients they are caring for. Patients are the main source of physical violence in the healthcare setting, which is categorized as Type II violence since it is the recipient of service who becomes violent towards employees (Wax, Pinette, & Cartin, 2016).
Between 2011 and 2013, the average number of workplace assaults were 24,000 per year, of which almost 75% occurred in healthcare settings and data suggests that healthcare workers are four times as likely to have missed days due to workplace violence and injury (Phillips, 2016). Other studies show a growth in the number of injuries from workplace violence for all healthcare workers with workplace violence almost doubled for nurses and nurse assistants between 2012 and 2014 (Gomaa et al., 2015). Of the workplace violence injury reported, 49 percent were specified as being physical, verbal or destruction of property, and 99 percent were physical assaults (Gomaa et al., 2015). Furthermore, from the reports where the perpetrator type was specified, 95 percent of them were identified as patients (Gomaa et al., 2015). In a study done by Crilly, Chaboyer, & Creedy (2004), 70 percent of the emergency department nurses reported a total of 110 violent incidents from patients in a span of just five months. This averages out to about 5 incidents a week (Crilly, Chaboyer, & Creedy, 2004). Another study found the type of verbal violence towards nurses was usually shouting and cursing. While physical violence was typically an employee being grabbed, scratched, or kicked (Speroni, Fitch, Dawson, Dugan, & Atherton, 2015).
Common barriers to patient violence prevention are underreporting and the culture of acceptance. Most violent incidents are not reported by healthcare workers due to the lack of reporting policies at their organization, feeling too busy, assuming that an incident is too minor or unnecessary to report, fear of being judged or blamed, and some have even become accustomed to violence (Gacki-Smith et al., 2009; Gerberich et al., 2004). The culture of acceptance is a further contributor to the lack of reporting on account of many healthcare workers thinking violence is a part of their job and unavoidable. This may be the result of a lack of appropriate procedures, the absence of management support, and feeling like abuse is expected from certain patients. Identifying the risk factors and possible solutions can help break down these barriers.

Journal of Business and Behavioral Sciences
129
LITERATURE REVIEWThere are numerous risk factors associated with patient violence against health care workers in hospitals. Many healthcare workers are vulnerable to becoming victims but nurses are believed to encounter violence the most while on the job (Gerberich et al., 2004). In terms of healthcare settings, long-term care facilities, emergency departments, and psychiatric departments have an increased possibility for violence (Gerberich et al., 2005). Patients typically classified as high risk for violence consist of people who are under the influence of drugs or alcohol, have a history of mental illness, and previous offenders (Crilly et al., 2004; McPhaul, & Lipscomb, 2004). Feelings of stress or not having control stemming from their illness, injury, or fragmented services are also common causes of violent behavior from patients (Gates, 2004). In addition, there are other circumstances that can lead to patients becoming violent towards medical staff. Transporting patients, working when understaffed or alone, long wait times, poor environmental designs, poorly lit areas, inadequate security, and lack of formal training can heighten the risk of violence (McPhaul, & Lipscomb, 2004; OSHA, 2016).
When a healthcare worker becomes a victim of violence it can have both physical and mental consequences. Physical injuries may be minor or severe and are capable of causing temporary or permanent disabilities. Some victims may even struggle with short- and/or long-term psychological trauma, which could cause anxiety, depression, and post-traumatic stress disorder (Gerberich et al., 2004; Texas Department of Insurance, n.d.). These consequences can, in turn, have an impact on job performance, morale, and decrease the quality of care for patients.
The repercussions of violence are capable of going beyond the victim. Often times, the employer or organization will take on the cost of caring for the employee’s injuries, time taken off from work, medical leave, workers’ compensation, increased turnover, and legal action against perpetrators. Each incident bears its own distinct costs that may be astronomical. For example, one organization’s annual cost for nurses who experienced workplace violence was $78,924 for treatment and $15,232 compensation for lost wages, which added up to $94,156 (Speroni et al., 2015). The national costs for workplace violence in hospitals are estimated to be $234.2 million for staff turnover, $42.3 million in medical care and lost wages compensation for employee victims, and $90.7 million for disability and absenteeism (Van Den Bos, Creten, Davenport, & Roberts, 2017).
Despite its economic burden, there are no federal laws that directly apply to violence against healthcare workers. However, with increasing recognition, some states have passed laws regarding assaults against healthcare workers. In 2013, Texas made it a felony to assault healthcare workers providing care in the emergency department (Houston Chronicle, 2013). Other states that have implemented policies pertaining to violence against healthcare workers include Delaware and New York. Delaware made assaulting emergency personnel a felony
Samuels, Hunt and Tezra
130
in the second-degree (Emergency Nurses Association, 2016) while New York has legislation making the assault of all registered and licensed practical nurses on duty a felony (The New York State Senate, 2010).
In addition to state initiatives, some change has occurred within organizations. For example, Mission Health, a hospital system based in Asheville, North Carolina, formed a Behavioral Emergency Response Team to help prevent assaults against employees in one of their hospitals (Stempniak, 2017). In its implementation process, Mission Health used data analysis and continuous improvement to assist with designing the team and procedures used for each at-risk unit. When a patient’s behavior escalates and staff members are unable to ameliorate or stop the event a call is made to the hospital operator. At that time, the operator sends a “Code BERT” to initiate the 24-hour response team’s arrival within 15 minutes. A behavioral health clinician is made available to guide any necessary verbal de-escalations, medication is administered by a primary nurse (as needed), the team debriefs everyone, and house supervisors proceed to round on the patient daily (Stempniak, 2017).
In the first year of the program, approximately 75 percent of the nurses surveyed from Mission Health reported feeling safer in the workplace and more comfortable caring for patients with behavioral health emergencies. Moreover, there was a reduction in the number of missed days due to injuries, as well as the number of reportable assaults since 2013. These were the only nationally benchmarked statistics connected to workplace violence. In light of its success, Mission Health plans to expand this initiative throughout its facilities and are researching more ways to reduce assaults in their emergency departments. Its chief quality officer advises that it is important for organizations to utilize reliable data, however, they should not get overwhelmed by the numbers. Instead, hospitals may want to consider testing a strategy, make improvements, re-test, and then repeat (Stempniak, 2017).
SOLUTIONS TO ADDRESS THE ISSUE While some progress has been made in the recognition and initiatives surrounding this issue, violence against healthcare workers continues to grow leading to increased missed days, job burnout, job dissatisfaction, reduced productivity and feelings of unsafety among employees (Phillips, 2016). With such consequences, it is important for healthcare facilities to take a new approach to addressing and mitigating events in which a patient takes violent actions against medical staff. Prevention is undoubtedly the best way to take on the issue in order to avoid negative effects that not only impacts healthcare workers, but the quality of care that an organization offers. A focus group consisting of emergency department employees showed a support for preventative measures to address workplace violence (Gates, et al., 2011).
Journal of Business and Behavioral Sciences
131
In addressing this issue, it is also important to note that different units in a facility may be at greater risk for workplace violence. For example, caring for patients with mental illness or for patients displaying narcotic-seeking behavior may increase a unit’s risk of violence against its employees (Phillips, 2016). Furthermore, some may be at a greater risk simply because they are busier and/or experiencing higher stress levels (NIOSH, 2002). Identifying and prioritizing these units is imperative in preventing incidents. Determining which units encounter more patient violence can aid in developing supplemental procedures to meet the needs of those units and can assist in the decision to secure additional security. The environment can also play an integral role in the risk of workplace violence as some environments may be hazardous and may interfere with an employee’s ability to escape a volatile situation. As such, facilities should ensure that patient rooms are well lit, and that furniture is arranged in a manner that does not hinder an employee from making a quick exit (NIOSH, 2002). These modifications are inexpensive solutions that present a quick escape and a better chance of avoiding potential violence.
Training also plays an integral role in violence prevention. Employees should be trained on warning signs, situational awareness, and how to track patients with a history of violence (OSHA, 2016). Educating medical staff about the behavioral and physical of patients who may be at-risk for violent behaviors may provide an opportunity to take action before an incident occurs. Situational awareness teaches employees how to assess their surroundings in attempt to determine how safe it is if a patient should become violent, what their exit strategy should be, and to recognize if another coworker is in a potentially violent situation. Tracking prompts employees to report and be informed of patients who have been violent in the past and could possibly be repeat offenders. Proper training equips employees with the knowledge of how to recognize risks and may decrease the number of incidents.
Enhancing administrative controls is another way in which organizations can prepare their healthcare workers in the event of a violent attack from patients. For example, creating a buddy system to keep employees from working alone with potentially violent patients gives employees the opportunity to reduce the risk of being overpowered if an incident was to occur (Wax et al., 2016). This encourages employees to identify the signs of an assault, as well as to pair up with someone as needed. In the event that a patient’s behavior escalates, a system a silent alert button located on the pagers of employees could assist healthcare workers by notifying security personnel when there is a threat (Wax
Samuels, Hunt and Tezra
132
et al., 2016). This technology would allow employees to discretely signal security to intervene when there is a risk or incident in progress.
While violence prevention is key, not all violence from patients can be prevented; therefore, intervention strategies are sometimes necessary. Consequently, training employees on de-escalation and escape techniques is valuable when circumstances may not allow security to respond quickly enough (OSHA, 2016). Coaching employees on how to maintain their composure during an incident provides them with appropriate ways to respond without further aggravating a combative patient. Additionally, escape techniques introduce new environmental design enhancements and demonstrate ways for employees to safely escape from an area to try to avoid further injury.
After an incident takes place, established protocols need to be in place to ensure that there is adequate support given to any employee who becomes a victim of patient violence. For instance, if there are any physical injuries sustained then immediate medical care should be administered and the victim should be allowed to go home for the remainder of the day if they wish. Treating the victim also gives the hospital and management an understanding of how severe the assault was and whether time off is essential for recovery. Counselors trained in treating workplace assault victims should also be available to manage any adverse mental effects that victims may experience from their encounter. Victims may suffer from psychological trauma with various reactions such as fear of returning to work and feelings of helplessness. Devoting the time and effort to the victim’s wellbeing shows medical staff that their management cares about them. It also helps with reducing or preventing absenteeism, loss of productivity, and turnover (OSHA, 2016).
Reporting and tracking are also essential steps in the response to violence against healthcare workers. It is crucial to record and track each and every incident, regardless of its severity, in an effort to observe trends and facilitate improvement. Reporting both internally and to law enforcement is also relevant, particularly if the review of documentation would be needed to check for accuracy of narratives. Internal reporting should still include incidents not requiring law enforcement involvement. This allows the hospital to track patients that have a history of violence while receiving medical care and produces data that may be analyzed in an effort to prevent future incidents (OSHA, 2016). Furthermore, working closely with law enforcement to appropriately report incidents is vital when legal action may be taken against the perpetrator. These reports can further protect the hospital by ensuring that authorities also have records of each incident.

Journal of Business and Behavioral Sciences
133
Forming a committee consisting of managers and medical staff may assist in effective sharing of ideas, reviewing data, implementing strategies, and coordinating improvements. Equal representation between the two groups would be an exceptional way to encourage staff participation and bring valuable insight from the people who have the most direct experience with violence from patients. Management support should maintain their awareness and assert their commitment to the success of the program. This can be accomplished by assembling a group of individuals that meets regularly; therefore, promoting continuous dedication to preventing incidents and creating a safe workplace (OSHA, 2016).
Creating a team similar to the one developed at Mission Health to prevent and intervene during incidents could play a key role in providing a safer work environment (Stempniak, 2017). A response team made up of various specialists trained to quickly respond, protect employees, and de-escalate violence may be an effective approach to the issue. The team could be notified of a risk or active incident with the silent alert button provided on medical staffs’ pagers. Depending on the circumstances, one or more members trained in security, psychology, emergency medical care, and/or others would be dispatched to take control of the situation and contact law enforcement if needed. A team trained and skilled at handling patient violence towards medical staff could make a significant impact on minimizing injuries and financial consequences.
The anticipated benefits of these proposed solutions include reduced number of incidents, reduced employee time off from work and worker’s compensation claims, prevention of legal costs, assistance with morale, and quality of care improvements. Additionally, the program may raise management’s awareness and involvement in staff safety, make training more productive and consistent, improve record-keeping, and streamline the evaluation of the program.
On the other hand, there are potential obstacles to implementing the proposed solutions. These include the initial costs of training and new equipment, the challenge of arranging law enforcement’s frequent involvement in improving safety, the lack of a standardized definition of violence, and lastly, the inability to predict unanticipated consequences of such solutions. While overcoming these obstacles can be difficult, gaining a new perspective often leads to creative ideas and approach. Despite the start-up costs, training and new equipment is worth the investment through reduced missing days and employee turnover, as well as savings in worker’s compensation claims, and legal costs. Encouraging open discussions with management about what is considered violence is also important as it allows for additional clarification for reporting and tracking purposes..
PROPOSED IMPLEMENTATION PLAN

Samuels, Hunt and Tezra
134
The timeline for developing and implementing a new workplace violence prevention program focused on managing patient violence towards healthcare workers is approximately 4 months. The first step would be to get management’s commitment to the program. Their complete support in conjunction with employee participation is essential in order for the program to be successful. The high-risk unit managers and seasoned employees would need to be involved since they have encountered the issue the most. These units should at least consist of the emergency and psychiatric departments. Hospital security and the legal department should also be included in the program to provide input and feedback on actions involving their expertise and participation.
To initiate the project, the project manager must gather information by meeting with the risk management team to evaluate the facility’s current policies and procedures on workplace violence. Afterwards, data on recent violent patient incidents that occurred in the hospital should be reviewed to determine the contributing factors and significance of the issue. The costs and implications (i.e. time off work, employee turnover, etc.) of these incidents should be analyzed with managers from the human resources and finance departments to determine the financial impact on the hospital. A meeting should then be coordinated with the project team, which is comprised of members from management participating in implementing the plan. At this time, the project manager should share the collected information, assess how current methods pertain to cases where the patient is the perpetrator and the employee is the victim, and to identify the goals and objectives of the program.
The team should visit worksites, especially high-risk units, to conduct a risk analysis and collaborate with medical staff and other personnel. This gives them the opportunity to gain the knowledge and perspective on what it would take to create an effective program. They should also lead discussions with the medical staff about the common risk factors and worksite assessments to become more educated on the potential hazards and equipment that would make caring for potentially violent patients safer. Organized meetings should be held with the on-site counselors, security personnel, in-house counsel, and legal team to deliberate what strategies will be used to address the issue and what their roles will be in the program. The existing investigation and reporting processes must also be evaluated so that improvements can be made for better investigations and increased reporting after an incident. Next, the project manager and team should conduct a meeting to present the proposed solutions and the resources required to the hospital administrators who are the key decision makers. Once approval is received to move forward, the process of finishing the project and bringing the program to life begins.

Journal of Business and Behavioral Sciences
135
Finalizing the policies and procedures then delivering the news about a new program ensures all those affected have a shared understanding of its benefits, are informed of the required training schedule, and given the anticipated start date. The engineering controls and equipment should then be set up and supplied in the designated units and work areas in preparation for being utilized during training, test-runs, and immediately when the program starts. Training will serve as the foundation for the program’s success. Each training program for the medical staff, security personnel, and management should be built to review the policies and procedures, gain knowledge of process improvements, practice current techniques, and become familiar with new engineering controls and equipment. Once training is completed, a two-week long field test of the new practices should be conducted with a pre-selected group of individuals from various units and roles. Following the test-run, feedback on the program’s strengths and weaknesses can be used to verify process effectiveness and discover any integral enhancements that might be needed. The program is then ready to launch once the modifications are completed.
The committee must continue to monitor and periodically review the program in an effort to evaluate its effectiveness and to uncover any shortcomings or needed adjustments. Mandatory reporting of all incidents, as well as obtaining input from employees is also needed to support continuous program evaluation. Each unit, especially the ones that are high-risk, should be encouraged to hold monthly meetings to discuss the staff’s role in preventing, mitigating, and reporting incidents. Continuous collaboration between the response team and medical staff is required to share successful strategies, barriers encountered, and new ideas. Training materials can then be updated accordingly then distributed or demonstrated. Annual refresher training should also be held to maintain knowledge of existing procedures.
CONCLUSIONWorkplace violence in healthcare settings is common as healthcare workers are four times as likely to have missed days due to workplace violence and injury (Phillips, 2016). Violence in a healthcare environment may stem from a confused, distressed, mentally ill, or intoxicated patient. Patient violence towards healthcare workers is a serious and growing problem that hospital leaders need to address in order to avoid negative impacts on employees and hospital operations. Implementing a program with procedures on how to prevent, intervene, investigate, and report patient violence against healthcare workers will not eliminate the problem but it will provide them with support and a safer work environment while ensuring that quality of care is sustained or improved.

Samuels, Hunt and Tezra
136
REFERENCES
Crilly, J., Chaboyer, W., & Creedy, D. (2004). Violence towards emergency department nurses by patients. Accident and Emergency Nursing, 12(2), 67-73. Retrieved from http://www.sciencedirect.com.ezproxy.ttuhsc.edu/science/article/pii/S0965230203000997?via%3Dihub
Emergency Nurses Association. (2016). Delaware Closes Loophole in Law to Better Protect Emergency Nurses. Retrieved from https://www.ena.org/press-room/press-releases/2016/06/30/delaware-closes-loophole-in-law-to-better-protect-emergency-nurses
Gacki-Smith, J., Juarez, A.M., Boyett, L., Homeyer, C., Robinson, L., & MacLean S.L. (2009). Violence Against Nurses Working in US Emergency Departments. The Journal of Nursing Administration, 39(7/8), 340-349. Retrieved from http://ovidsp.tx.ovid.com.ezproxy.ttuhsc.edu/sp-3.26.1a/ovidweb.cgi?QS2=434f4e1a73d37e8c467d24888931c7baf16c2be4e5604e59a63f002bf916115eafa09b358db3b7fa215456182c4c88b624718b5ac322fb9dafd5680387a7a9199b3502a2e6d5e5b9727e58f05cf0028d279e6000fcf2412170bb9d3a9d378d1f5c8116014ab7e981ff36c7ae38f1625f00acccce54ab8f141cf0239998f607c071d7368584f7e60ba94714504535a4c2a9528034b8d79f664d2607412b779297bf88630a00484872fa8075d774de627693cad8564aae66512bd2231bc2a1a912b205f703f49fc3fd34cefb9b2707632f6dcaa340fe519fc058177f5d29e0a5f7375f5f60aabee4fe
Gates, D.M. (2004). The epidemic of violence against healthcare workers. Occupational and Environmental Medicine, 61, 649-650. Retrieved fromhttps://www.ncbi.nlm.nih.gov/pmc/articles/PMC1740822/pdf/v061p00649.pdf
Gates, D., Gillespie, G., Smith, C., Rode, J., Kowalenko, T., & Smith, B. (2011). Using Action Research to Plan a Violence Prevention Program for Emergency Departments. Journal of Emergency Nursing, 37(1), 32-39. Retrieved from http://www.sciencedirect.com.ezproxy.ttuhsc.edu/science/article/pii/S0099176709004334?via%3Dihub
Gerberich, S.G., Church, T.R., McGovern, P.M., Hansen, H., Nachreiner, N.M., Geisser, M.S., & Watt, G.D. (2004). An epidemiological study of the
Journal of Business and Behavioral Sciences
137
magnitude and consequences of work related violence: The Minnesota Nurses’ Study. Occupational and Environmental Medicine, 61(6), 495-503. Retrieved from http://oem.bmj.com.ezproxy.ttuhsc.edu/content/61/6/495
Gerberich, S.G., Church, T.R., McGovern, P.M., Hansen, H., Nachreiner, N.M., Geisser, M.S., & Jurek, A. (2005). Risk Factors for Work-Related Assaults on Nurses. Epidemiology, 16(5), 704-709. Retrieved from http://ovidsp.tx.ovid.com.ezproxy.ttuhsc.edu/sp-3.26.1a/ovidweb.cgi?T=JS&PAGE=fulltext&D=ovft&AN=00001648-200509000-00020&NEWS=N&CSC=Y&CHANNEL=PubMed
Gomaa, A.E., Tapp, L.C., Luckhaupt, S.E., Vanoli, K., Sarmiento, R.F., Raudabaugh, W.M., & Sprigg, S.M. (2015). Occupational Traumatic Injuries Among Workers in Health Care Facilities – United States, 2012-2014. Morbidity and Mortality Weekly Report, 64, 405-410. Retrieved from https://www.cdc.gov/mmwr/preview/mmwrhtml/mm6415a2.htm?s_cid=mm6415a2_w
Harrell, E. (2011). Workplace Violence, 1993-2009. Bureau of Justice Statistics.Retrieved from https://www.bjs.gov/content/pub/pdf/wv09.pdf
Houston Chronicle. (2013). Texas Legislature Update: Nurse Assault Bill passes Senate.Retrieved from http://www.chron.com/neighborhood/friendswood/news/article/TEXAS-LEGISLATURE-UPDATE-Nurse-Assault-Bill-9364981.php
McPhaul, K.M., & Lipscomb, J.A. (2004). Workplace Violence in Health Care: Recognized but not Regulated. The Online Journal of Issues in Nursing, 9(3). Retrieved from http://nursingworld.org/MainMenuCategories/ANAMarketplace/ANAPeriodicals/OJIN/TableofContents/Volume92004/No3Sept04/ViolenceinHealthCare.aspx
Occupational Safety and Health Administration. (2016). Guidelines for Preventing Workplace Violence for Healthcare and Social Service Workers. Retrieved from https://www.osha.gov/Publications/osha3148.pdf
Occupational Safety and Health Administration. (2015). Workplace Violence in Healthcare. Retrieved from https://www.osha.gov/Publications/OSHA3826.pdf
Samuels, Hunt and Tezra
138
Phillips, J. P. (2016). Workplace violence against health care workers in the United States. New England journal of medicine, 374(17), 1661-1669.
Speroni, K.G., Fitch, T., Dawson, E., Dugan, L., & Atherton, M. (2015). Incidence and Cost of Nurse Workplace Violence Perpetrated by Hospital Patients or Patient Visitors. Journal of Emergency Nursing, 40(3), 218-228. Retrieved from http://www.sciencedirect.com.ezproxy.ttuhsc.edu/science/article/pii/S009917671300216X?via%3Dihub
Stempniak, M. (2017). Violence in the Hospital: Preventing Assaults Using a Clinical Approach. Hospitals & Health Networks. Retrieved from http://www.hhnmag.com/articles/8306-violence-in-the-hospital-preventing-assaults-using-a-clinical-approach
Texas Department of Insurance. (n.d.). Health Care Facilities and Workplace Violence Prevention. Retrieved from http://www.tdi.texas.gov/pubs/videoresource/stpwpvhealthc.pdf
The National Institute for Occupational Safety and Health. (2002). Occupational Hazards in Hospitals. Retrieved from https://www.cdc.gov/niosh/docs/2002-101/pdfs/2002-101.pdf
The New York State Senate. (2010). Senate Acts To Protect Nurses From Violence. Retrieved from https://www.nysenate.gov/newsroom/press-releases/senate-acts-protect-nurses-violence
Van Den Bos, J., Creten, N., Davenport, S., & Roberts, M. (2017). Cost of community violence to hospitals and health systems. Retrieved from http://www.aha.org/content/17/community-violence-report.pdf
Wax, J.R., Pinette, M.G., & Cartin, A. (2016). Workplace Violence in Health Care – It’s Not “Part of the Job”. Obstetrical & Gynecological Survey, 71(7), 427-434. Retrieved from http://ovidsp.tx.ovid.com.ezproxy.ttuhsc.edu/sp-3.26.1a/ovidweb.cgi?T=JS&PAGE=fulltext&D=ovft&AN=00006254-201607000-00019&NEWS=N&CSC=Y&CHANNEL=PubMed

Journal of Business and Behavioral Sciences Vol 30, No 2; Fall 2018
139
AN ANALYSIS OF TELEVISION ADVERTISING STRATEGY OF A JAPANESE ENTERPRISE:
CULTURAL PERSPECTIVES
Wenting Zhang Niigata University
ABSTRACT Both commercial and enterprise advertisements are deeply connected with the cultural values of a society. Advertisements that sensitively reflect changes in the times show the changes in the cultural sphere it is projected. Communication through advertisement could be the way to encourage understanding of different cultures. The comparison of advertisement between different cultures does not only provide understanding of different cultures but also provides important insights about how a product is perceived by the target audience. This paper analyzes Shiseido's corporate strategy that has advanced into foreign markets and will focus on the television advertisement of the same enterprise in Japan and China. The analysis describes how cultural specificity in Japan and China has been shown and managed in the advertisements.
Key Words: Advertisement, Cultural specificity, Deep structural analysis, Tool of different cultures understanding.
INTRODUCTION Advertisements as a part of marketing has been used widely and strategically. The changes in media exert significant impacts on the status of advertisement. Japanese data of advertisement shows that video advertisement has been growing at the highest rate compared to other types of advertisement. During 2016, 12.1% of total advertisement expenditures went to media advertisement including newspaper and magazine compared to 33.4% in Television advertisement. However, Internet advertisement in video form has grown much faster compared to other types of advertisement, rising to 20.14 percent during the same year. Video media can express more information in a shorter time than other media which explains its higher rate of growth. Even though the print media has the comparative advantage of recording, the rapid popularity of portable terminal has taken over the print media.
Regardless of which countries and regions the video advertisements occur, commercial advertisement and enterprise advertisements are projected to different segments of population. Advertisements that sensitively reflect changes in the times significantly show the changes in the cultural sphere in which it is projected. Communication through advertisement could be the way to encourage understanding of different cultures. This paper focuses on advertisement as the index to understanding different cultures with a view to examining the

Zhang
140
advertisement of one enterprise between different countries, namely Japan and China.
The TV commercial of the same enterprise in Japan and China
This paper takes Shiseido TV commercials as the research target. In May 2015, Shiseido Enterprise launched “Be beautiful in every moment of your lifetime” as a message aiming to clarify its brand and to increasing customers’ loyalty. To specify this message, a Japanese version “Your kiss” in 2007, and a Chinese version “White Lucent” in 2010 were released. Although both CMs were aiming to express the same mission of the enterprise “Realizing the beauty in a moment and in a lifetime”, the stories in the CMs are different. The Japanese version “Your kiss” tells a story about a lady who is kissed by a man. Barely concealing her embarrassment, she runs into the bathroom almost crushed by anxiety, but in the process of adding lipstick she gradually regains her confidence. The Chinese version “White lucent” tells a story of a heroine who is staggering emotionally due to anxiety, confusion and happiness while waiting for her wedding day. Through slipping the skincare product to her skin she becomes relaxed and confident. This paper analyzes the different methods of creating beauty by Shiseido.
The purpose of advertisement is mainly to foster customers’ inherent needs and evoking the desire. This is shown by analyzing Shiseido’s advertisement in Japan and China with extraction. To accomplish this objective, sequence’s extraction, opposite relation`s extraction, opposite axis`s extraction, the metaphor specification and deep construction map were created or fulfilled. Framing analysis and Mise-en-scène were also used as a video analysis method. Furthermore, this paper does not only focus on analyzing the video parts but also analyzes the verbalized narration, the background music, the subtitle and character’s age, clothing, proportion, haircut, face, career, scene setting and the atmosphere separately. These constructs help analyze the comparative contrast of video parts.
Deep structural analysis The Shiseido’s message of advertisements expressed contrast in the heroine’s expression to the background color in the first half and in the second half. It is because the caring of the rough skin and moisture status are regarded as the motivation of mental state in the video.
Structure of Japanese advertisement The sequence in Japanese version “your kiss” is constituted by one scene. The series is designed as follow: 1. Running into the bathroom. 2. Looking at the mirror. 3. Covering the face with hands. 4. Removing lipstick. 5. Applying lipstick. 6. Repeating. 7. Looking at herself in the mirror. 8. Done applying lipstick. 9. Looking at the mirror. 10. able to smile and regain confidence.

Journal of Business and Behavioral Sciences
141
From the extraction analysis of the sequence, we can see the continuous pattern “looking at the mirror” and “applying lipstick.” By applying lipstick repeatedly and confining herself to the mirror, the heroine is reborn. The important thing here is that the video analysis does not only highlight male’s view but also emphasizes the female's internal point of view.
The next part is the extraction of opposite elements according to the correlations of cross reference of applying lipstick. The verbalization of the scenes in video analysis graph and linguistic analysis graph are taken as references. Analysis is then made on how the female’s expressions including the additional elements surrounding her have been affected by the heroine’s embarrassment arising from the romance, and her feelings calming down. The transition flows from the “Ff” linguistic analysis, “gloomy you, responsive you, kissing you, liking you” with "You" representing male are opposite to the "Me” representing female, “me being kissed, liking me, me changing my mind”. The image of heroine’s emotional fluctuation is emphasized. The transition is described below followed by Figure 1.
【Opposite relations extraction】
Crying eyes and painful eyes (A) ⇔ vivid eyes (a)
Worried expression and sad expression(B) ⇔ a smiling female (b)
Dark room (C) ⇔ bright light (c)
Taking out Lipstick in the handbag(D) ⇔ putting back in handbag(d)
Sighing female with restless eyes (E) ⇔ confident eyes (e)
gloomy you, responsive you, kissing you, loving you (F)⇔ me being
kissed, liking me, me changing my mind(f)
As shown in Figure 1, from the extraction of opposite relations and in accordance with the changes of the heroine, the other elements have also changed. In the “Ff”, “you” is the male and “me” the heroine. Male is standing in the favorable position while female is on the opposite. Four opposite axes have been collated according to the extracted opposite relations.
【Opposite axis’s extraction】
Bb、Cc Anxiety <->relief
Aa、Ee、Bb、Cc Melancholy <->vitality
Ee、Aa、Cc Self-abased <-> confidence
Bb、Aa、Ee、Cc Frustrated <-> rebirth
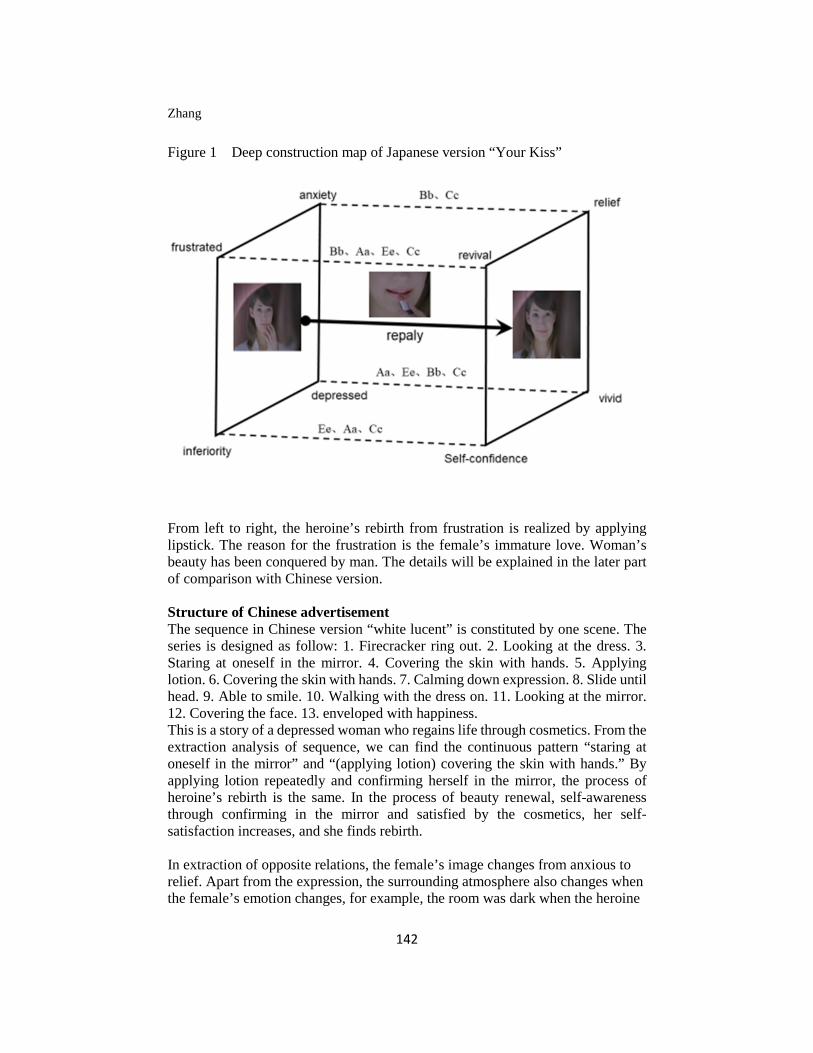
Zhang
142
Figure 1 Deep construction map of Japanese version “Your Kiss”
From left to right, the heroine’s rebirth from frustration is realized by applying lipstick. The reason for the frustration is the female’s immature love. Woman’s beauty has been conquered by man. The details will be explained in the later part of comparison with Chinese version.
Structure of Chinese advertisement The sequence in Chinese version “white lucent” is constituted by one scene. The series is designed as follow: 1. Firecracker ring out. 2. Looking at the dress. 3. Staring at oneself in the mirror. 4. Covering the skin with hands. 5. Applying lotion. 6. Covering the skin with hands. 7. Calming down expression. 8. Slide until head. 9. Able to smile. 10. Walking with the dress on. 11. Looking at the mirror. 12. Covering the face. 13. enveloped with happiness. This is a story of a depressed woman who regains life through cosmetics. From the extraction analysis of sequence, we can find the continuous pattern “staring at oneself in the mirror” and “(applying lotion) covering the skin with hands.” By applying lotion repeatedly and confirming herself in the mirror, the process of heroine’s rebirth is the same. In the process of beauty renewal, self-awareness through confirming in the mirror and satisfied by the cosmetics, her self-satisfaction increases, and she finds rebirth.
In extraction of opposite relations, the female’s image changes from anxious to relief. Apart from the expression, the surrounding atmosphere also changes when the female’s emotion changes, for example, the room was dark when the heroine

Journal of Business and Behavioral Sciences
143
was feeling anxious, and it turned bright when she felt relieved. In terms of the linguistic analysis: “Ff” shows “missing you, your smiling face, innocent you, you in memory, you from afar, frustrated you, you under the moonlight, unchanging you” and “waiting for the bus, fascinating me, me looking, my life”. With “you” representing the female and “me” representing the male. Although an actress acted as protagonist, she narrates “I am a man.” Here we can see that women’s beauty is deeply connected with men. Below is the construct of the events leading up to Figure 2.
【Opposite relations extraction】Red firecracker, red building, red paper-cut, red belt, red glass, red furniture (A) ⇔White dress, white cosmetics, white flower, white wall, white lotion, white curtain, white window, white headwear(a)
Worried face (B) ⇔ smiling woman with a happy face (b)
Gloomy eyes (C) ⇔ calm face (c)
Anxious eyes(D)⇔ eyes full of expectations, expressions full of hope(d)
Looking back, recalled first the meeting, past memory (E)⇔ the moment
right now (e)missing you, your smiling face, innocent you, you in memory, you from afar, frustrated you, you under the moonlight, unchanging you(F) ⇔
waiting for the bus, fascinating me, me looking, my life(f)
Shattered appearance(G) ⇔ silvery and echoing laughter(g)Different with “your kiss,” the character is opposite “you” is the heroine and “me” is the male. The female becomes beautiful through the protection of a man and is lead to a good direction. Next, the opposite axis shows the extracted opposite relations. 【Opposite axis’s extraction】
Cc、Bb、Dd、Gg Anxiety <-> relief
Dd、Gg、Bb Melancholy <->vitality
Bb、Cc、Dd、Gg Self-abased <-> confidence
Ee、Bb、Cc、Dd、Gg Frustrated <-> rebirth
In the deep structural graph, from left to right, heroine's expressions changes from a worried face to a smiling face. The growth comes from the flashback that started from the encounter with a male. Psychological effect significantly works.

Zhang
144
Figure 2 Deep construction map of Chinese version “White Lucent”
In this CM, on the left side describes a female who is feeling anxious in love, and on the right side shows the process of regaining relief. From the expression of heroine’s mood to external elements, the first half and the second half are designed in contrast to each other. The beauty has been revived through cosmetics, while the Japanese version’s immature love, the core part of the beauty revival is the maturity of love.
In the Japanese version “your kiss” and the Chinese version “white lucent” CMs, one shows immature love and the other shows mature love. We conclude that both loves are beneficial to women’s beauty. In the Japanese version, the setting of the scene is immature love, the woman is innocent and submissive. In relation to the active man and a compliant woman, woman with traditional submissive beauty is preferred in Japan. On the contrary, the story of Chinese mature love, the woman is protected and guided by a man, therefore woman with strong, smart and glamorous beauty is much preferred.
Video analysis of two advertisements First, let us look at the video framing of the Japanese version “your kiss.” The camera angle of this CM is vertical, and the shooting position is in the front and left side of the heroine. Camera distance is constituted of half close and close range. The Chinese “white lucent” used staggered high angle, vertical angle and low angle, the shooting position is omnidirectional with heroine as an axis. The shooting distance is from long shot at the whole body to closeup on her face. In
Journal of Business and Behavioral Sciences
145
the video framing of the Japanese version “your kiss,” the shooting angle, position and distance are decided from the place where model is fixed vertically. This is because the woman is portrayed by others’ point of view with the shooting method from a man’s view. The female usually seen by a male improves herself through that view and further pursues for beauty. As Ochi(2002) argued, the image pointed out by the view from the outside is internalized as a figure among women. Through different angles and perspective, man’s view has been internalized in female through camera.
For Mise-en-scène, the Japanese version “your kiss” was set on a high key and front lighting which shows a pink world. While the Chinese version “white lucent” was a combination of front and back lighting and using whitish color tone. Avoiding obvious contrast, it tries to express the beauty in subtle changes to manifest Japanese characteristics.
An Analysis of Shiseido’s overseas advertising strategy Before comparing and analyzing Shiseido’s message advertisement in Japanese version and Chinese version as a case study, we could see that due to the differences in cultural and social background between Japan and china, the value of beauty expressed by Shiseido are also different.
The Japanese version “your kiss” is a beauty that is portrayed with three characteristics. First, it is integrated with western beauty. Secondly, it is blended with nature, and thirdly, it is internalized with male’s view and submissive beauty. On the other hand, Chinese version “white lucent” is a beauty which is vigorous traditional and beauty with sexual charm through male’s view.
In the Japanese advertisement, beauty is merged in its unique culture with the beauty of vision of the western world. The intention is to show the traditional Japanese value which is a mild, introverted and submissive beautiful woman. Shiseido emphasized in the camera that a woman becomes more charming and conforms herself in the mirror through a man’s view. On the other hand, in the Chinese version, “White lucent” emphasizes vigorous western beauty. Looking at the selection standard of model, we can refer that the vision for western beauty is stronger than of the Japanese portrayal. Shiseido designed and produced the advertisement, considering Chinese government’s direction of female’s standard of beauty as a reflection of both western and socially independent beauty. In both Japanese and Chinese versions, internalized male’s view and the female’s own view are essential for the process of beauty revival. And the process has been emphasized through the symbolic “mirror's view” in both advertisements. Weisenfeld (2009) pointed out that the reason for women using cosmetics is not only to become healthy and happy but also to become more attractive and charming to the same sex and opposite sex. The common element “mirror” plays an important role in the process of beauty rebirth as confirming unhealthy self in the mirror ->put on cosmetics -> reconfirms in the mirror -> satisfied a bit ->put on

Zhang
146
cosmetics -> reconfirms in the mirror -> more satisfied. These are the male and female’s points of view in the sight that dominates beauty through which Shiseido expresses female’s psychology.
To explain Shiseido’s corporate strategy, the subtle difference in the meaning of the Japanese version “be beautiful in every moment of your lifetime” and the Chinese version “the beauty in one moment, the beauty in a lifetime (the beauty in one moment is the beauty in a lifetime)”corporate message is that, the Japanese version was produced to meet women of wide age group and to emphasize the importance of being beautiful in every moment of your lifetime through a love story, while the Chinese version describes the essential inherited beauty of closely connected beauty in one moment and the beauty in a lifetime. In this background, as an enterprise entering the Chinese market, in confronting the cultural problems, Shiseido weakens Japanese cultural elements and puts efforts to make it easily accepted by the Chinese women by giving continuity to the traditional Chinese color red and Shiseido’s symbol mark Tsubaki’s red and uses a strategy of subconsciously appealing to the Chinese women. Furthermore, in both Japanese and Chinese versions, process of beauty revival from frustration, “the mirror's view” has been taken as an important element. In the mechanism where women’s beauty has been desired, both male and female's views have been assimilated and the woman’s image has been created. Thus, Shiseido’s aspiration of expressing this female image has been reached.
Conclusion Corporate advertisement is designed to attract potential customers, provoke sympathy in customers, increase new density and high sensitivity, and improve the loyalty of existing customers through corporate mission and the way of thinking instead of attracting customers with the products. It is also useful for hardly differentiable products and services and a tool for product branding. On the other hand, although corporate advertisement is designed to deliver corporate common value, it does not always attract customers with the same expression or method in different countries and regions. Each country has different conditions and restrictions in the expression of advertisement. Although there are regulations concerning advertisement in Japan, self-dependence is possible. However, in China, there are obligatory pre-censorship in advertising association regarding medicines and TV commercials and examining authorities in every province and city. The national hygienic administrative bureau exerts its power in examining foods and medicines leading to significant differences in expression restrictions. Through comparative analysis of Shiseido’s Japanese commercial and Chinese commercial, we are able to create contents with the consideration of advertising restrictions and cultural value in different counties and regions when trying to use corporate message to attract customers in different cultural background.
Journal of Business and Behavioral Sciences
147
REFERENCES Akinori, Takada. (2010). Theory and Techniques of Story Analysis.
Okayama: University Education.Hao, Hu. (2004). Cosmetic confession. Guangdong: Economics. Hiroaki, Takahashi., & Takayuki, Oii. (2003). Basic research on Japanese
aesthetic consciousness. Journal of Art Engineering.Hiroshi, Narumi. (2001). Fashion asking - body, image, Japan. Tokyo:
Serica Syobo.Hiroyoshi, Ishikawa., & Hideo, Takisima. (2000). A woman and man
reading from advertisements - gender and sexuality. Tokyo:Yuzakaku.
Kiyoshi, Abe., & Koji, Nanba. (2006). Reading media culture: doing cultural studies in Japan. Kyoto: Sekaishisosha.
Ling Jie, Zhou. (2010). The Cultural Source of Chinese Crimson Cognition. Education and social sciences, 3, 38-39.
Ochi Kazuhiro.(2002). Creation of the Woman's Image. Language and Culture Research Series, 1, 1-15.
Teruko, Inoue., & Female Journalism Research Group. (1992). Research on women's magazines Comparepolitan-Japan, US, Mexico. Tokyo: Kakiuchi.
Wei, Zang. (2009). Analysis of Japanese and Chinese cosmetic advertisement discourse. Comparative social culture research, 26, 25-33.
Weisenfeld, Gennifer. (2009). Selling Shiseido: Cosmetics Advertising & Design in Early 20th-Century Japan. Massachusetts Institute of Technology.
Xian Wen, Xie. (2006). Present state and future prospects of rapidly expanding Chinese cosmetic advertisements. International commerce, 39 (11) ,140-143.
Xian Wen, Xie. (2009). The current situation and problems of China net cosmetics market showing new developments (1). International commerce, 42 (11) ,40-43.
Xian Wen, Xie. (2009). The current situation and problems of China net cosmetics market showing new developments (2). International commerce, 42 (12) ,38-41.
Xian Wen, Xie. (2010). Advertising strategy of Chinese cosmetics and daily goods enterprises that is being reexamined by strengthening regulations and developing new markets. International commerce, 43 (3) ,40-43.
Xian Wen, Xie. (2010). Exploring the Current Status and Problems of P & G Rural Penetration Strategy. International commerce, 43 (4) ,38-41.
Xian Wen, Xie. (2010). Present state and future prospects of cosmetic market for Chinese pharmacies expanding rapidly. International commerce, 43 (5), 38-41.

Zhang
148
Xian Wen, Xie. (2010). China's men's cosmetic market rapidly growing led by foreign capital. International commerce, 43 (6), 42-45.
Ye, Shi. (2007). Global management and corporate communication: By the studying of Shiseido Co. Human Society and Environmental Studies, 13, 245-258.