Embed Size (px)
Citation preview

Journal of Asian Rehabilitation Science
Journal of Asian R
ehabilitation Science
The Soc
iety of Asian R
ehabilitation Scie
nce
The Society of Asian Rehabilitation Science
ISSN 2434-0758 J.Asia.Reha.Sci.
Vol.2 No.3 Aug. 2019
Editorial advisor
Hitoshi MARUYAMA (International University of Health and Welfare)
Editor-in-chief
Ko ONODA (International University of Health and Welfare)
Editorial board
Japan: Nobuyuki HIRAGI (International University of Health and Welfare)
Takamichi TANIGUCHI (International University of Health and Welfare)
Tubasa KAWASAKI(Tokyo International University)
Tamae SATO(International University of Health and Welfare)
China: Huang QIUCHEN (China Rehabilitation Research Center)
Korea: Kim Myung CHUL (Eulji University)
The Journal of Asia Rehabilitation Science (ISSN 2434-07058) is published for the Society of
Asia Rehabilitation Science. The journal is published quarterly.
The editors welcome original papers with significant areas of physical therapy, occupational therapy
and speech and language therapy.
Manuscripts should be submitted to:
http://rehaac.org/asiareha.html
For enquiries please contact:
JARS Editorial Office
i
The Journal of Asian Rehabilitation Science
Vol.2 No.3, August
2019
Contents
ORIGINAL ARTICLES
Development of Height estimation formula in Elderly Adults Using Ambulatory Rehabilitation
………………………………………………………………………… A. YAKABI, et al.・12
Relationship between Students’ preferences for Flipped or Traditional classrooms and Perceived course workload
…………………………………………………………………………… M. ITOKAZU・17
J. Asi. Reha. Sci.2(3):12-16,2019
12
*Corresponding author: AKIHIRO YAKABI ([email protected])
©2019 The Society of Journal of Asian Rehabilitation Science.
The Journal of Asian Rehabilitation Science
Original Article
Development of Height estimation formula in Elderly
Adults Using Ambulatory Rehabilitation
AKIHIRO YAKABI RPT,PhD 1), YOHEI SAWAYA RPT,MS1, 2), TAMAE SATO RPT,MS 1,2)
MINAMI SATO RPT 2, 3), AKIRA KUBO RPT,PhD 1), MASAHIRO ISHIZAKA RPT,PhD 1)
KO ONODA RPT,PhD 1), TSUYOSHI HARA RPT,PhD 1)
1) Department of Physical Therapy, school of Health Science, International University of Health and Welfare
(2600-1 Kitakanemaru, Otawara-shi, Tochigi 324-8501, Japan)
2) Department of Physical Therapy, Graduate School of Health and Welfare Sciences,
International University of Health and Welfare
3) Division of Rehabilitation Shioya Hospital of International University of Health and Welfare
Abstract. [Purpose] To develop a height estimation equation in addition to kyphosis index and forearm
length and lower leg length. [Subjects and Methods] The estimated height of 122 elderly patients
requiring long-term care who were unable to measure height while standing was estimated and
calculated among the patients in the rehabilitation community, measured height, forearm length, lower
leg length, and kyphosis index. [Results] The actual measured height in males and females was= 15.2 +
(2.5 × lower leg length) + (2.5 × forearm length) + (- 0.6 × kyphosis index), and R2 was 0.77 and
improved more than the predicted form from the lower leg and forearm lengths.
[Conclusion] The accuracy is improved in the estimated height expression obtained by adding the
kyphosis index to the independent variable for the lower leg and forearm lengths.
Key Words: Estimated equation, Kyphosis, Elderly people who need long-term care
(This article was submitted June.29, 2019, and was accepted July.22, 2019)
1. INTRODUCTION
“Height” is the length measured from the sole to the top of the head, generally in the upright position. It
is used to assess a child’s development and create prosthesis for leg amputee 1). Moreover, height
measurement is necessary to assess the body composition component, body mass index (BMI),
nutritional status, and basal metabolism, among others. In general, height is measured while standing
with bare feet on the foot shaped as the plate of the height meter, standing on the post with the back part,
buttocks, and heels in the posture with the jaws attached to the post with the outer ear hole of the head
and the orbit the edge. As a precaution, when not standing, it is measured with the tape measure in the
supine position1). Previous studies has been reported that accurate height measurement is difficult in
elderly people due to difficulty of maintaining a standing posture because of marked joint contracture,
deformation, decreased ADL, etc. Nishida et al. reported that, the correlation coefficient of the height
prediction formula is high (0.92), in the healthy adults, using the forearm and lower leg lengths2). In
addition, Kubo et al. calculated the estimated height according to the length of the forearm and lower of
hospitalized elderly patients, and good correlation coefficient was obtained3). However, when the
estimated height formula was used at the clinical setting, the measured height was significantly different from the estimated height. This may be due to the great influence of joint contracture and deformity in
J. Asi. Reha. Sci.2(3):12-16,2019
13
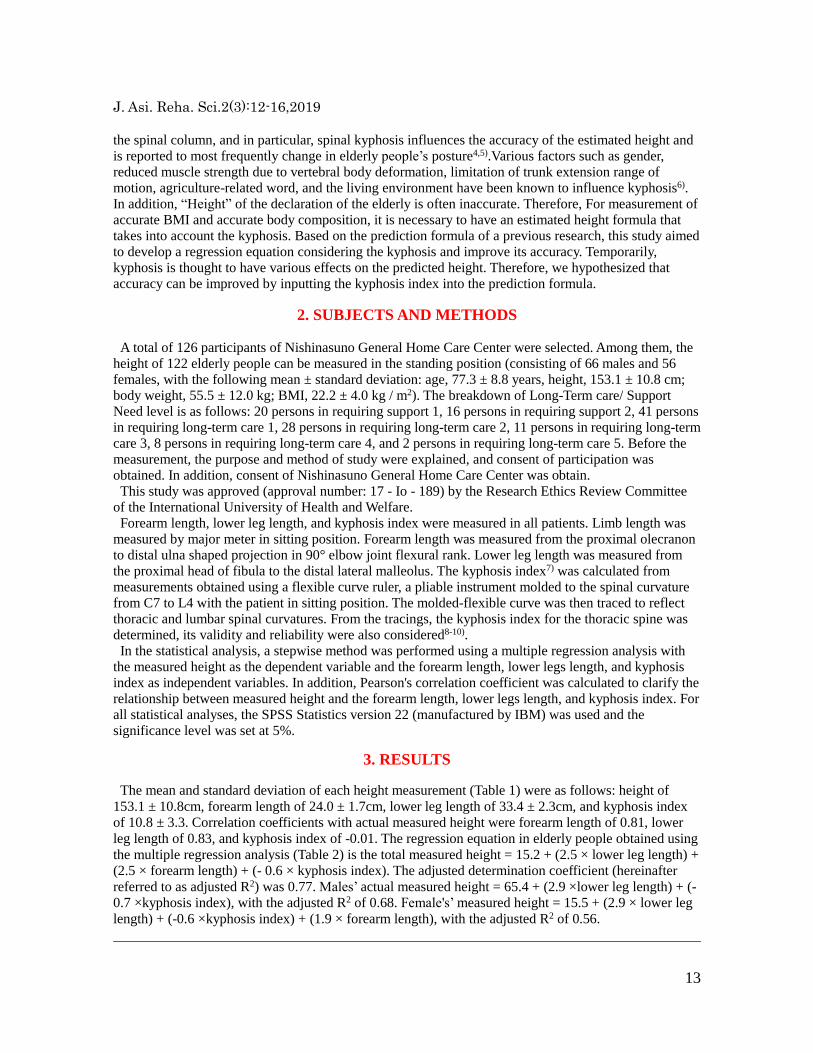
the spinal column, and in particular, spinal kyphosis influences the accuracy of the estimated height and
is reported to most frequently change in elderly people’s posture4,5).Various factors such as gender,
reduced muscle strength due to vertebral body deformation, limitation of trunk extension range of
motion, agriculture-related word, and the living environment have been known to influence kyphosis6).
In addition, “Height” of the declaration of the elderly is often inaccurate. Therefore, For measurement of
accurate BMI and accurate body composition, it is necessary to have an estimated height formula that
takes into account the kyphosis. Based on the prediction formula of a previous research, this study aimed
to develop a regression equation considering the kyphosis and improve its accuracy. Temporarily,
kyphosis is thought to have various effects on the predicted height. Therefore, we hypothesized that
accuracy can be improved by inputting the kyphosis index into the prediction formula.
2. SUBJECTS AND METHODS
A total of 126 participants of Nishinasuno General Home Care Center were selected. Among them, the
height of 122 elderly people can be measured in the standing position (consisting of 66 males and 56
females, with the following mean ± standard deviation: age, 77.3 ± 8.8 years, height, 153.1 ± 10.8 cm;
body weight, 55.5 ± 12.0 kg; BMI, 22.2 ± 4.0 kg / m2). The breakdown of Long-Term care/ Support
Need level is as follows: 20 persons in requiring support 1, 16 persons in requiring support 2, 41 persons
in requiring long-term care 1, 28 persons in requiring long-term care 2, 11 persons in requiring long-term
care 3, 8 persons in requiring long-term care 4, and 2 persons in requiring long-term care 5. Before the
measurement, the purpose and method of study were explained, and consent of participation was
obtained. In addition, consent of Nishinasuno General Home Care Center was obtain.
This study was approved (approval number: 17 - Io - 189) by the Research Ethics Review Committee
of the International University of Health and Welfare.
Forearm length, lower leg length, and kyphosis index were measured in all patients. Limb length was
measured by major meter in sitting position. Forearm length was measured from the proximal olecranon
to distal ulna shaped projection in 90° elbow joint flexural rank. Lower leg length was measured from
the proximal head of fibula to the distal lateral malleolus. The kyphosis index7) was calculated from
measurements obtained using a flexible curve ruler, a pliable instrument molded to the spinal curvature
from C7 to L4 with the patient in sitting position. The molded-flexible curve was then traced to reflect
thoracic and lumbar spinal curvatures. From the tracings, the kyphosis index for the thoracic spine was
determined, its validity and reliability were also considered8-10).
In the statistical analysis, a stepwise method was performed using a multiple regression analysis with
the measured height as the dependent variable and the forearm length, lower legs length, and kyphosis
index as independent variables. In addition, Pearson's correlation coefficient was calculated to clarify the
relationship between measured height and the forearm length, lower legs length, and kyphosis index. For
all statistical analyses, the SPSS Statistics version 22 (manufactured by IBM) was used and the
significance level was set at 5%.
3. RESULTS
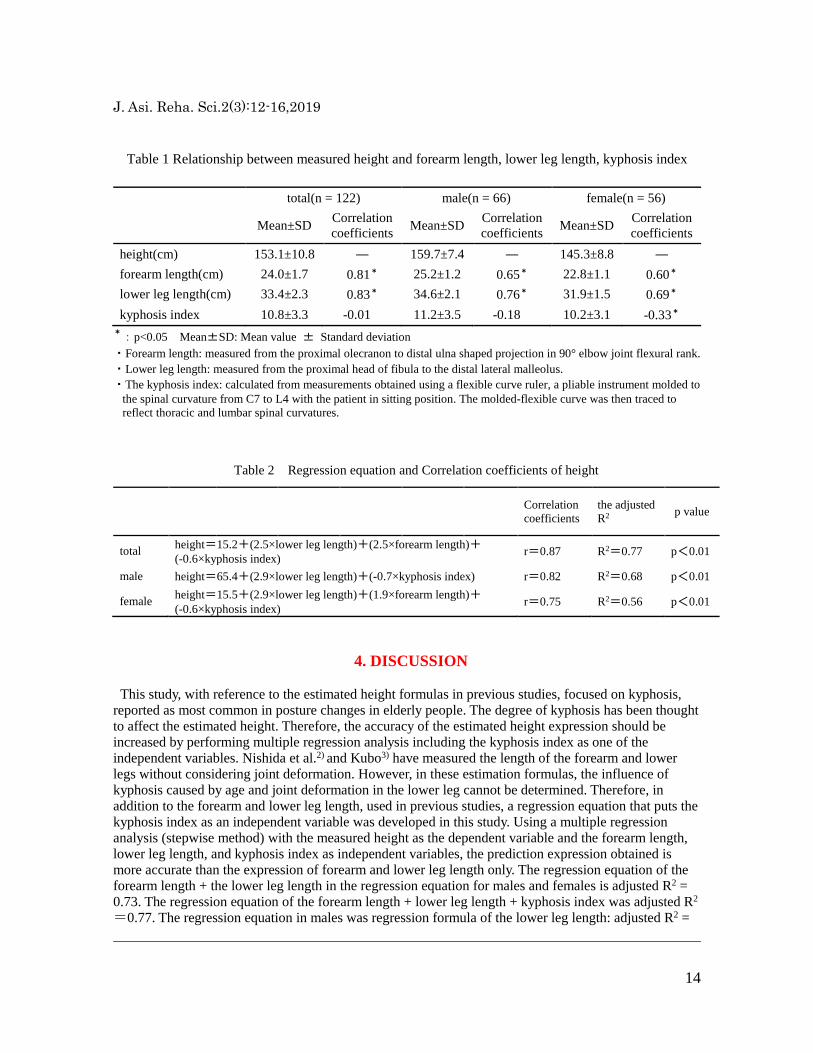
The mean and standard deviation of each height measurement (Table 1) were as follows: height of
153.1 ± 10.8cm, forearm length of 24.0 ± 1.7cm, lower leg length of 33.4 ± 2.3cm, and kyphosis index
of 10.8 ± 3.3. Correlation coefficients with actual measured height were forearm length of 0.81, lower
leg length of 0.83, and kyphosis index of -0.01. The regression equation in elderly people obtained using
the multiple regression analysis (Table 2) is the total measured height = 15.2 + (2.5 × lower leg length) +
(2.5 × forearm length) + (- 0.6 × kyphosis index). The adjusted determination coefficient (hereinafter
referred to as adjusted R2) was 0.77. Males’ actual measured height = 65.4 + (2.9 ×lower leg length) + (-
0.7 ×kyphosis index), with the adjusted R2 of 0.68. Female's’ measured height = 15.5 + (2.9 × lower leg
length) + (-0.6 ×kyphosis index) + (1.9 × forearm length), with the adjusted R2 of 0.56.
J. Asi. Reha. Sci.2(3):12-16,2019
14
Table 1 Relationship between measured height and forearm length, lower leg length, kyphosis index
total(n = 122) male(n = 66) female(n = 56)
Mean±SD Correlation
coefficients Mean±SD
Correlation
coefficients Mean±SD
Correlation
coefficients
height(cm) 153.1±10.8 ― 159.7±7.4 ― 145.3±8.8 ―
forearm length(cm) 24.0±1.7 0.81* 25.2±1.2 0.65* 22.8±1.1 0.60*
lower leg length(cm) 33.4±2.3 0.83* 34.6±2.1 0.76* 31.9±1.5 0.69*
kyphosis index 10.8±3.3 -0.01 11.2±3.5 -0.18 10.2±3.1 -0.33*
*:p<0.05 Mean±SD: Mean value ± Standard deviation
・Forearm length: measured from the proximal olecranon to distal ulna shaped projection in 90° elbow joint flexural rank.
・Lower leg length: measured from the proximal head of fibula to the distal lateral malleolus.
・The kyphosis index: calculated from measurements obtained using a flexible curve ruler, a pliable instrument molded to
the spinal curvature from C7 to L4 with the patient in sitting position. The molded-flexible curve was then traced to
reflect thoracic and lumbar spinal curvatures.
Table 2 Regression equation and Correlation coefficients of height
Correlation
coefficients
the adjusted
R2 p value
total height=15.2+(2.5×lower leg length)+(2.5×forearm length)+ (-0.6×kyphosis index)
r=0.87 R2=0.77 p<0.01
male height=65.4+(2.9×lower leg length)+(-0.7×kyphosis index) r=0.82 R2=0.68 p<0.01
female height=15.5+(2.9×lower leg length)+(1.9×forearm length)+ (-0.6×kyphosis index)
r=0.75 R2=0.56 p<0.01
4. DISCUSSION
This study, with reference to the estimated height formulas in previous studies, focused on kyphosis,
reported as most common in posture changes in elderly people. The degree of kyphosis has been thought
to affect the estimated height. Therefore, the accuracy of the estimated height expression should be
increased by performing multiple regression analysis including the kyphosis index as one of the
independent variables. Nishida et al.2) and Kubo3) have measured the length of the forearm and lower
legs without considering joint deformation. However, in these estimation formulas, the influence of
kyphosis caused by age and joint deformation in the lower leg cannot be determined. Therefore, in
addition to the forearm and lower leg length, used in previous studies, a regression equation that puts the
kyphosis index as an independent variable was developed in this study. Using a multiple regression
analysis (stepwise method) with the measured height as the dependent variable and the forearm length,
lower leg length, and kyphosis index as independent variables, the prediction expression obtained is
more accurate than the expression of forearm and lower leg length only. The regression equation of the
forearm length + the lower leg length in the regression equation for males and females is adjusted R2 =
0.73. The regression equation of the forearm length + lower leg length + kyphosis index was adjusted R2
=0.77. The regression equation in males was regression formula of the lower leg length: adjusted R2 =
J. Asi. Reha. Sci.2(3):12-16,2019
15
0.58, and the accuracy was improved with R2 = 0.68 in regression equation of lower leg + kyphosis
index. The regression equation in females was regression formula of the lower leg length: adjusted R2 =
0.47, regression equation of lower leg + forearm length + kyphosis index: adjusted R2 = 0.56, which
resulted in improved accuracy. This is based on the hypothesis that during height measurements in an
upright posture in elderly people, the actual height was lower than the predicted height due to kyphosis;
therefore, by inserting the kyphosis index as an independent variable, the precision of regression
equation was considered to be improved.
However, in this study, 122 participants cannot be considered as a sufficient number of samples.
Posture changes not only affect kyphosis but also influence joint deformation in the lower leg, which is
sufficiently conceivable. And their malalignment at neck were not measured, orthopedic disease were
not investigate (knee or hip osteoarthritis). Therefore, a similar study should be conducted with a large
sample-sized cohort to expand the field, and a prediction formula that considers not only the influence of
kyphosis but also hip and knee joints should be established. In addition, the ability of rapid measurement
should be considered when using the prediction formula; therefore, instruments that can immediately
calculate the extent of the spine should also be developed.
Funding and Conflict of interest
No funding was provided for this study. The author declares no conflict of interest.
Acknowledgement
The author is grateful to the subjects and co-author for assistance with data acquisition.
J. Asi. Reha. Sci.2(3):12-16,2019
16
REFERENCES
1) Matsuzawa T, Eguchi K:Textbook of physical therapy evaluation 5th edition KANEHARA &
Co.,Ltd.,Tokyo Printed and Bound in Japan p28.
2) Nishida Y, Kubo A, Tanaka Y:Estimating stature from forearm length and lower length.
Rigakuryouhougaku,2002,29:29-31.(In Japanese)
3) Kubo A, Keiri H:Estimating height from Forearm and lower leg lengths of elderly
persons.Rigakuryouhou Kagaku,2007,22:115-118.(In Japanese)
4) Takai I, Miyano M, Nakai N, et. Postural change and posture control with aging. Japan Society of
Physiological Anthropology,2001,6:41-46.
5) Ito Y, Yamada T, Takeda M. Investigation of respiratory function and breathing pattern in elderly
people with kyphosis posture. Rigakuryouhou Kagaku,2007,22:353-358. (In Japanese)
6) Sakamitsu T, Urabe T, Tamamoto T. Relationship of kyphosis with balance and walking ability in
the elderly. Rigakuryouhou Kagaku,2007,22:489-494. (In Japanese)
7) Milne JS, Williamson J.A longitudinal study of kyphosis in older people. Age
Ageing,1983,12:225-233.
8) Teragaki Y, Araya K, Sueki K. Reliability and validity of the index of kyphosis on sitting,
Rigakuryouhou Kagaku,2004,19:137-140.(In Japanese)
9) Teri L, Murray E, Keith B. Assessnent of thoracic kyphosis using the flexicurve for individuals
with osteoporosis. Hong Kong Physiotherapy Journal,2000,18:53-57.
10) Kathleen M.A., Audrey M.W., Bibershtein, Sonia. Interrater and intrarater reliability in the
measurement of kyphosis in postmenopausal women with osteoporosis. Spine (Phila Pa
1976),1998,18:1978-1985.
J. Asi. Reha. Sci.2(3):17-22,2019
17
*Corresponding author: MASAFUMI ITOKAZU ([email protected])
©2019 The Society of Journal of Asian Rehabilitation Science.
The Journal of Asian Rehabilitation Science
Original Article
Relationship between Students’ preferences for Flipped
or Traditional classrooms and Perceived course workload
MASAFUMI ITOKAZU,RPT, PhD1)
1) Department of Physical Therapy, school of Health Science at Narita, International University of Health and Welfare
(4-3 Kōzunomori, Narita City, Chiba 286-8686, Japan)
Abstract. [Purpose] The purpose of this study was to investigate whether students preferred a flipped
classroom to a traditional classroom teaching method and determine how students perceived their
workload in flipped classrooms via quantitative evaluation. [Subjects and Methods] The participants
were 153 students belonging to the Department of Physical Therapy. The questionnaire survey asking
about their impressions of the course and the workload was given after the course. [Results] About
70% of the students who participated in the flipped classroom preferred it, while 15% preferred the
traditional classroom. The workload for students in the flipped classroom was significantly higher than
for those in the traditional classroom. [Conclusion] The results of the study suggested that there are a
certain number of students who prefer TC, and it is necessary to give a thorough preliminary
explanation of the flipped classroom methodology to make it successful.
Key Words: Flipped classroom, Traditional classroom, Course workload
(This article was submitted July.19, 2019, and was accepted August.19, 2019)
1. INTRODUCTION
In the current university education environment, active learning in classrooms is being frequently
promoted1,2). The flipped classroom (FC) is an active learning method3,4). What differentiates it from the
traditional classroom (TC) is that the students attend classes after watching a lecture video online, which
provides them with basic knowledge of the topics that will be explored in the classroom5,6). Students are
then required to apply the basic knowledge learned from the video to group work in the classroom, and
this promotes active learning6).
Many practical examples are reported in Japan and other countries7-11). Two reported results of using
FCs are that periodic testing results are significantly better in comparison with that of TCs, and the
students’ active learning ability is improved7-10). What is common to the research is that although it takes
time to introduce FCs, it is a better method for promoting student motivation for learning than TCs9,13,14).
There has been much research on the introduction of the FC in training courses for medical doctors,
nurses, and rehabilitation specialists12,14-19) While many of them have found that the FC is more effective
than the TC4,8,11), some studies have raised concerns about the increased workload for students inherent
in the FC15-21). Some previous studies have found student dissatisfaction increased after the introduction
of the FC15,18,21). However, these few studies use limited objective indicators such as learning time4), and
it is difficult to indicate that they objectively evaluate the psychological students' workload participating
in FC.
J. Asi. Reha. Sci.2(3):17-22,2019
18
In this study, we hypothesized that the workload of FC adoption varies among students and that it is
higher among students who prefer TC than among students who prefer FC. The purpose of this research
was to investigate whether students preferred the FC to the TC and to determine via quantitative
evaluation how students perceived their time and psychological workload in FCs.
2. SUBJECTS AND METHODS
The participants were second and third- year university physical therapy students (N = 153, male: 82,
female: 71; age: 20.3 ± 2.3 years). The study was conducted by the Declaration of Helsinki. Participants
were provided an information sheet on the study, and they gave written informed consent. Students participated in and completed a course in which the FC methodology was used. After
completing the course, the questionnaire survey asking about their impressions of course workload as compared to that of a TC was given.
The questionnaire investigated “ease of understanding” and “ease of learning,” using a five-point Likert scale: 1: traditional; 2: likely traditional; 3: neither; 4: likely flipped: and 5: flipped. In addition, the participants’ perception of the workload in an FC compared to what they perceived in a TC was investigated using a ten-point scale (from 1: not at all to 10: very much). In the questionnaire results, the ratio of each stage of “easy to understand” and “easy to learn” was calculated. The median value and quartile range were calculated for the students’ workload in the FC. Dependent on the answers to the questions, the participants were divided into three groups: Flipped group: group of flipped and likely flipped answered; Traditional group: group of traditional and likely traditional answered, and the course workload of each group was calculated. The Kruskal-Wallis test was performed on the data to determine statistically significant differences among the three groups. The Steel-Dwass test accounted for multiple comparisons within all groups. The relationship between the answers to the questions about the FC and the students’ course workload was calculated using Spearman’s correlation coefficient. Statistical analysis was conducted using R 2.8.1, and significance was assumed at p<0.05.
3. RESULTS
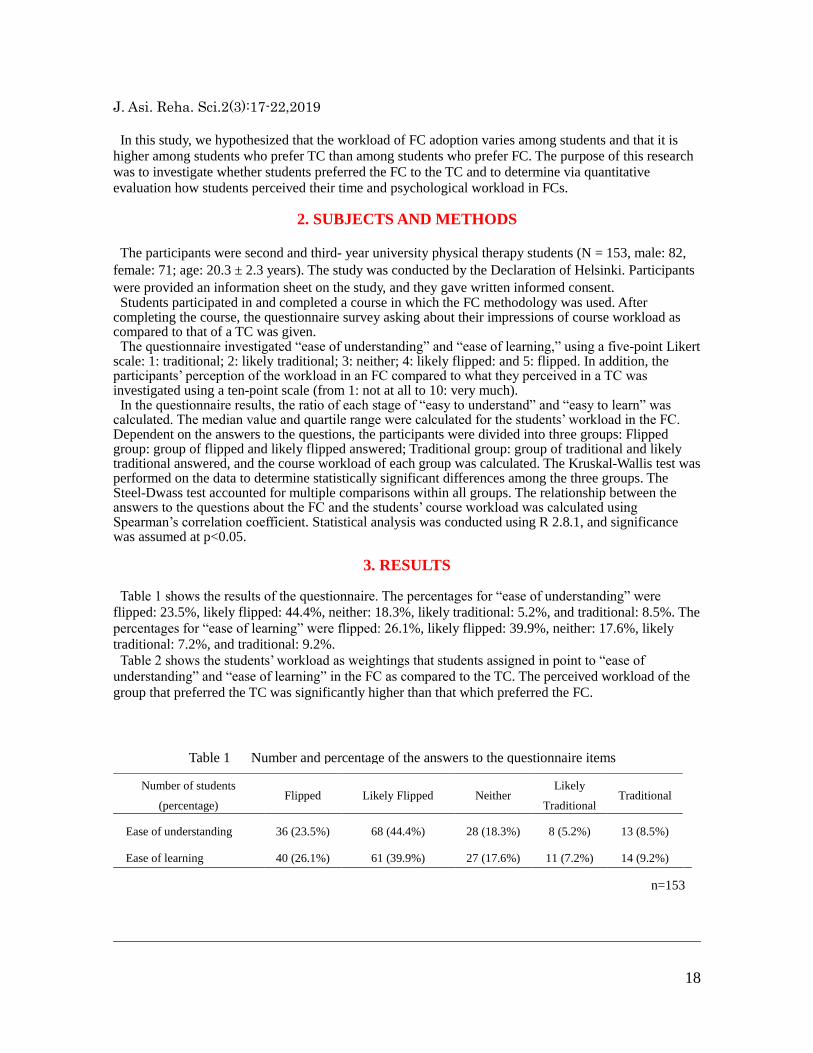
Table 1 shows the results of the questionnaire. The percentages for “ease of understanding” were
flipped: 23.5%, likely flipped: 44.4%, neither: 18.3%, likely traditional: 5.2%, and traditional: 8.5%. The
percentages for “ease of learning” were flipped: 26.1%, likely flipped: 39.9%, neither: 17.6%, likely
traditional: 7.2%, and traditional: 9.2%.
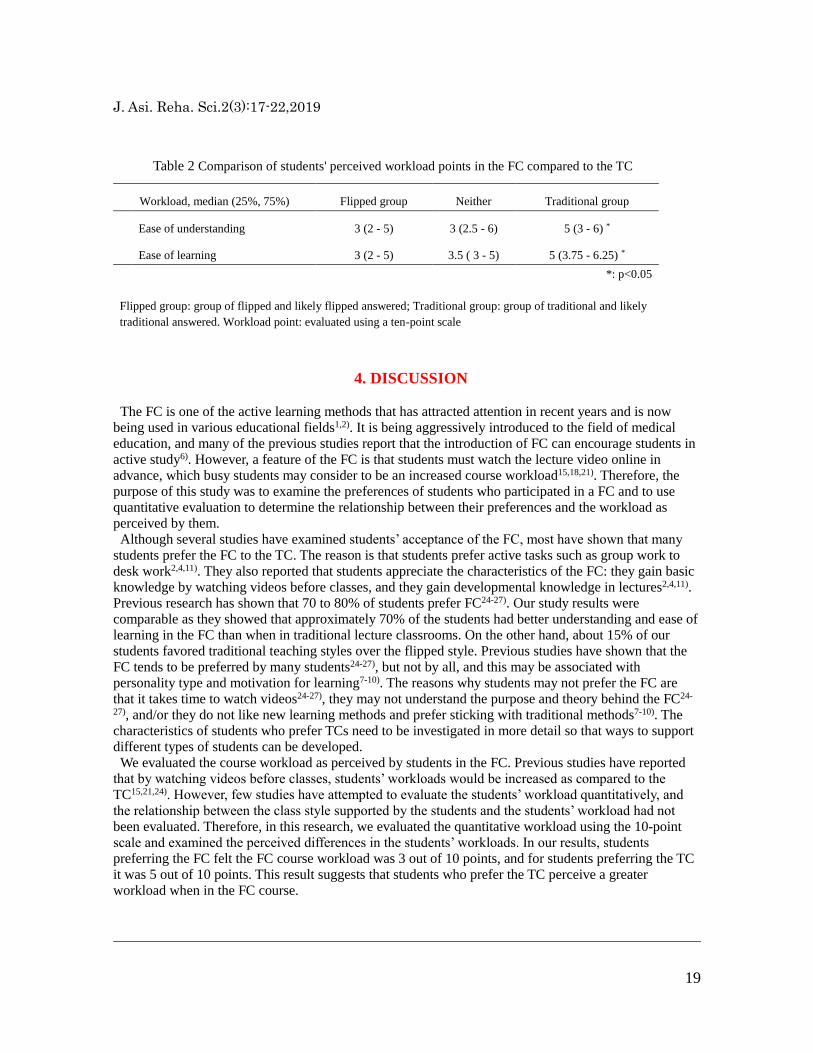
Table 2 shows the students’ workload as weightings that students assigned in point to “ease of
understanding” and “ease of learning” in the FC as compared to the TC. The perceived workload of the
group that preferred the TC was significantly higher than that which preferred the FC.
Number of students
(percentage) Flipped Likely Flipped Neither
Likely
Traditional Traditional
Ease of understanding 36 (23.5%) 68 (44.4%) 28 (18.3%) 8 (5.2%) 13 (8.5%)
Ease of learning 40 (26.1%) 61 (39.9%) 27 (17.6%) 11 (7.2%) 14 (9.2%)
n=153
Table 1 Number and percentage of the answers to the questionnaire items
J. Asi. Reha. Sci.2(3):17-22,2019
19
4. DISCUSSION
The FC is one of the active learning methods that has attracted attention in recent years and is now
being used in various educational fields1,2). It is being aggressively introduced to the field of medical
education, and many of the previous studies report that the introduction of FC can encourage students in
active study6). However, a feature of the FC is that students must watch the lecture video online in
advance, which busy students may consider to be an increased course workload15,18,21). Therefore, the
purpose of this study was to examine the preferences of students who participated in a FC and to use
quantitative evaluation to determine the relationship between their preferences and the workload as
perceived by them.
Although several studies have examined students’ acceptance of the FC, most have shown that many
students prefer the FC to the TC. The reason is that students prefer active tasks such as group work to
desk work2,4,11). They also reported that students appreciate the characteristics of the FC: they gain basic
knowledge by watching videos before classes, and they gain developmental knowledge in lectures2,4,11).
Previous research has shown that 70 to 80% of students prefer FC24-27). Our study results were
comparable as they showed that approximately 70% of the students had better understanding and ease of
learning in the FC than when in traditional lecture classrooms. On the other hand, about 15% of our
students favored traditional teaching styles over the flipped style. Previous studies have shown that the
FC tends to be preferred by many students24-27), but not by all, and this may be associated with
personality type and motivation for learning7-10). The reasons why students may not prefer the FC are
that it takes time to watch videos24-27), they may not understand the purpose and theory behind the FC24-
27), and/or they do not like new learning methods and prefer sticking with traditional methods7-10). The
characteristics of students who prefer TCs need to be investigated in more detail so that ways to support
different types of students can be developed.
We evaluated the course workload as perceived by students in the FC. Previous studies have reported
that by watching videos before classes, students’ workloads would be increased as compared to the
TC15,21,24). However, few studies have attempted to evaluate the students’ workload quantitatively, and
the relationship between the class style supported by the students and the students’ workload had not
been evaluated. Therefore, in this research, we evaluated the quantitative workload using the 10-point
scale and examined the perceived differences in the students’ workloads. In our results, students
preferring the FC felt the FC course workload was 3 out of 10 points, and for students preferring the TC
it was 5 out of 10 points. This result suggests that students who prefer the TC perceive a greater
workload when in the FC course.
Workload, median (25%, 75%) Flipped group Neither Traditional group
Ease of understanding 3 (2 - 5) 3 (2.5 - 6) 5 (3 - 6) *
Ease of learning 3 (2 - 5) 3.5 ( 3 - 5) 5 (3.75 - 6.25) *
*: p<0.05
Flipped group: group of flipped and likely flipped answered; Traditional group: group of traditional and likely
traditional answered. Workload point: evaluated using a ten-point scale
Table 2 Comparison of students' perceived workload points in the FC compared to the TC
J. Asi. Reha. Sci.2(3):17-22,2019
20
The results of this study show that a certain number of students prefer TC, and as described in previous
studies, it is necessary to give them a sufficient explanation of the purpose and methods used in FCs28). It
is also important to check whether students can adapt to the class style once the FC is introduced by
checking lecture video viewing logs and observing the students in the FC environment.
The limitation of this study was that we did not get data on students’ perception of the workload at the
time they were introduced to the FC. When we have this data, it can be possible to institute additional
measures to help students. Also, no specific support measures have yet been considered for students who
prefer the TC. The FC environment makes it easier to help individual students with problems than the
TC, and when problems are identified, it will be easier to provide support in the FC.
Funding and Conflict of interest
No funding was provided for this study. The author declares no conflict of interest.
Acknowledgement
The author is grateful to the subjects and co-author for assistance with data acquisition.
J. Asi. Reha. Sci.2(3):17-22,2019
21
REFERENCES
1) O’Flaherty J, Phillips C: The use of flipped classrooms in higher education: A scoping review. Internet
High Educ. 25:85-95, 2015.
2) Mehta NB, Hull AL, Young JB, et al.: Just imagine: new paradigms for medical education. Acad Med
88(10):1418-23, 2013.
3) Shi CR, Rana J, Burgin S: Teaching & Learning Tips 6: The flipped classroom. Int J Dermatol.
57(4):463-66, 2018.
4) Tang F, Chen C, Zhu Y: Comparison between flipped classroom and lecture-based classroom in
ophthalmology clerkship. Med Educ Online. 22(1):1395679, 2017.
5) Bergmann J, Aaron S: Remixing chemistry class: two Colorado teachers make podcasts of their lectures
to free up class time for hands-on activities. Learn Leading Technol. 36:22e27, 2009.
6) Pierce R, Fox J: Vodcasts and active-learning exercises in a “flipped classroom” model of a renal
pharmacotherapy module. Am J Pharm Educ. 76:196, 2012.
7) Chen F, Lui AM, Martinelli SM: A systematic review of the effectiveness of flipped classrooms in
medical education. Med Educ., 51(6):585-597, 2017.
8) Hew KF, Lo CK: Flipped classroom improves student learning in health professions education: a meta-
analysis. BMC Med Educ., 18(1):38, 2018.
9) Tan C, Yue WG, Fu Y: Effectiveness of flipped classrooms in nursing education: Systematic review and
meta-analysis. Chinese Nursing Research, 4(4):192-200, 2017.
10) Betihavas V, Bridgman H, Kornhaber R, et al.: The evidence for 'flipping out': A systematic review of
the flipped classroom in nursing education. Nurse Educ Today., 38:15-21, 2016.
11) Geist MJ, Larimore D, Rawiszer H, et al.: Flipped versus traditional instruction and achievement in a
baccalaureate nursing pharmacology course. Nurs. Educ. Perspect., 36(2):114-115, 2015.
12) Onoda K, Itokazu M, Maruyama H: Introduction on the flipped classroom to the physical therapy field:
Part 1. J Intr Univ Health Welfare., 21(2):31-36, 2016 (in Japanese).
13) Horn MB: The transformational potential of flipped classrooms. Educ Next. 13:78e79, 2013.
14) Heitz C, Prusakowski M, Willis G, et al.: Does the concept of the flipped classroom extend to the
emergency medicine clinical clerkship? West J Emerg Med 16 (6):851–5, 2015.
15) Missildine K, Fountain R, Summers L, et al.: Flipping the classroom to improve student performance
and satisfaction. J. Nurs. Educ. 52(10):597-599, 2013.
16) Tune JD, Sturek M, Basile DP: Flipped classroom model improves graduate student performance in
cardiovascular, respiratory, and renal physiology. Am. J. Physiol. Adv. Physiol. Educ. 37 (4):316-320,
2013.
17) McLaughlin JE, Roth MT, Glatt DM, et al.: The flipped classroom: a course redesign to foster learning
and engagement in a health professions school. Acad. Med. 89 (2):236-243, 2014.
18) Critz CM, Knight D: Using the flipped classroom in graduate nursing education. Nurse Educ. 38
(5):210-213, 2013.
J. Asi. Reha. Sci.2(3):17-22,2019
22
19) Della RCB: Flipping the classroom with team-based learning in undergraduate nursing education. Nurse
Educ. 40 (2):71-74, 2015.
20) Murphy J, Chang JM, Suaray K: Student performance and attitudes in a collaborative and flipped linear
algebra course. Int J Math Educ Sci Technol. 47(5):653-73, 2016.
21) Simpson V, Richards, E: Flipping the classroom to teach population health: increasing the relevance.
Nurse Educ. Pract. 15 (3):162-167, 2015.
22) Jimenez-Munoz A: Flipped Lectures: Flipping Lectures: Analysing Student Workload in EMI Contexts.
Procedia Soc Behav Sci. 212:35-41, 2015.
23) Moffett J: Twelve tips for "flipping" the classroom. Med Teach. 37(4):331-6, 2015.
24) Cotta KI, Shah S, Almgren MM, et al.: Effectiveness of flipped classroom instructional model in
teaching pharmaceutical calculations. Curr Pharm Teach Learn. 8(5):646-53, 2016.
25) Galway LP, Corbett KK, Takaro TK, et al.: Novel integration of online and flipped classroom
instructional models in public health higher education. BMC Med Educ. 14(1):181, 2014.
26) Kiviniemi MT: Effects of a blended learning approach on student outcomes in a graduate-level public
health course. BMC Med Educ. 14:181, 2014.
27) Porcaro PA, Jackson DE, McLaughlin PM, et al.: Curriculum design of a flipped classroom to enhance
haematology learning. J Sci Educ Technol. 25(3):345–57, 2016.
28) Lo CK, Hew KFA. Critical review of flipped classroom challenges in K-12 education: possible solutions
and recommendations for future research. Res Pract Technol Enhanc Learn. 12(1):4, 2017.