Embed Size (px)
Citation preview

Editorial Board
I
JAQM Editorial Board Editors Ion Ivan, Academy of Economic Studies, Romania Claudiu Herteliu, Academy of Economic Studies, Romania Gheorghe Nosca, Association for Development through Science and Education, Romania Editorial Team Adrian Visoiu, Academy of Economic Studies, Romania Catalin Boja, Academy of Economic Studies, Romania Cristian Amancei, Academy of Economic Studies, Romania Cristian Toma, Academy of Economic Studies, Romania Dan Pele, Academy of Economic Studies, Romania Erika Tusa, Academy of Economic Studies, Romania Eugen Dumitrascu, Craiova University, Romania Irina Isaic, Academy of Economic Studies, Romania Marius Popa, Academy of Economic Studies, Romania Mihai Sacala, Academy of Economic Studies, Romania Miruna Mazurencu Marinescu, Academy of Economic Studies, Romania Nicu Enescu, Craiova University, Romania Manuscript Editor Lucian Naie, IBM Romania

Advisory Board
II
JAQM Advisory Board Alexandru Isaic-Maniu, Academy of Economic Studies, Romania Anatol Godonoaga, Academy of Economic Studies of Moldova Bogdan Ghilic Micu, Academy of Economic Studies, Romania Catalin Balescu, National University of Arts, Romania Constanta Bodea, Academy of Economic Studies, Romania Constantin Mitrut, Academy of Economic Studies, Romania Cristescu Marian-Pompiliu, Lucian Blaga University, Romania Cristian Pop Eleches, Columbia University, USA Dan Petrovici, Kent University, UK Daniel Teodorescu, Emory University, USA Dumitru Marin, Academy of Economic Studies, Romania Dumitru Matis, Babes-Bolyai University, Romania Gabriel Badescu, Babes-Bolyai University, Romania Gabriel Popescu, Academy of Economic Studies, Romania Gherghe Nosca, Association for Development through Science and Education, Romania Gheorghe Sabau, Academy of Economic Studies, Romania Ilie Costas, Academy of Economic Studies of Moldova Ilie Tamas, Academy of Economic Studies, Romania Ioan I. Andone, Al. Ioan Cuza University, Romania Ion Bolun, Academy of Economic Studies of Moldova Ion Ciuca, Politechnica University of Bucharest, Romania Ion Ivan, Academy of Economic Studies, Romania Ion Gh. Rosca, Academy of Economic Studies, Romania Ion Smeureanu, Academy of Economic Studies, Romania Irinel Burloiu, Intel Romania Kim Viborg Andersen, Institut for Informatik, Copenhagen Business School, Denmark Manoj V. Pradhan, Morgan Stanley - London Research Division, UK Mihaela Muntean, Western University Timisoara, Romania Nicolae Tapus, University Politehnica of Bucharest, Romania Nicolae Tomai, Babes-Bolyai University, Romania Oprea Dumitru, Ioan Cuza University, Romania Ovidiu Artopolescu, Microsoft Romania Panagiotis Sinioros, Technical Education Institute, Piraeus, Greece Perran Penrose, Independent, Connected with Harvard University, USA and London University, UK Peter Nijkamp, Free University De Boelelaan, The Nederlands Radu Macovei, University of Medicine Carol Davila, Romania Radu Serban, Academy of Economic Studies, Romania Recep Boztemur, Middle East Technical University Ankara, Turkey Stefan Nitchi, Babes-Bolyai University, Romania Tudorel Andrei, Academy of Economic Studies, Romania Valentin Cristea, Politechnica University of Bucharest, Romania Valter Cantino, Universita Degli Studi Di Torino, Italy Vergil Voineagu, Academy of Economic Studies, Romania Victor Croitoru, University Politehnica of Bucharest, Romania Victor Ploae, Ovidius University, Romania Victor Valeriu Patriciu, Military Technical Academy, Romania Victor Voicu, University of Medicine Carol Davila, Romania Viorel Gh. Voda, Mathematics Institute of Romanian Academy, Romania
Contents
III
Page Editor’s note 1 Welcome letters 2 Education in the Romanian Information Society in the Period Leading Up to EU Integration
Ion IVAN, Daniel MILODIN, Lucian NAIE The Clasification Of Romanian High-Schools 6 Miruna MARINESCU MAZURENCU, Constanta MIHAESCU, Ileana NICULESCU-ARON, Laura ASANDULUI
Students’ Perceptions Regarding E-learning 18 Dragos ANASTASIU The Study of Curricular Dependency 25 Iulian Ionut RADULESCU The Influence of Software Complexity on the Maintenance Effort - Case Study on Software Developed within Educational Process –
43
Andrei TOMA, Ioan GABRIEL The Degree of Software Licences Usage in Schools, High-schools and Universities 51 Sergiu CAPISIZU, Gheorghe NOSCA, Adriean PARLOG The Audit of The Information Technologies & Communication Projects Developed by Students
58
Alexandru ISAIC-MANIU, Claudiu HERTELIU The Evolution of Economist's Labour Market in Romania 68 Catalin BOJA Storage Optimization of Educational System Data 81 Dumitru MARIN, Daniela MARINESCU Modelling the Educational Process in Asymmetric Information 95 Quantitative Methods Inquiries
Marius POPA Evaluation Methods of The Text Entities 102 Ioan I. ANDONE Analyses and Quantitative Methods for Information Management in Medium Size Companies
109

Contents
IV
Page Miscellanea
Richard LUCKING, Marius PROFIROIU, Tudorel ANDREI Young Public Manager in Romania - a New Approach 118 Review
Gheorghe NOSCA Marius Cosmin CODREA, “Pattern Analysis of Chlorophyll Fluorescence Signals", PhD Thesis
128
Editor’s note
1
Ion IVAN Editor in chief PhD, University Professor, Department of Economic Informatics Faculty of Cybernetics, Statistics and Economic Informatics Academy of Economic Studies, Bucharest, Romania Author of more than 25 books and over 75 journal articles in the field of software quality management, software metrics and informatics audit. His work focuses on the analysis of quality of software applications. E-mail: [email protected] ; Web Page: http://www.ionivan.ro
The quantitative methods development requires interdisciplinary teams made up of high skilled specialists. The study and the analysis of the phenomena, the organizations, the processes and the objects give the possibility to identify interdependences, constraints, functions of performance. Using the quantitative methods they obtain indices for characterizing a process evolution or to establish the process status. These methods are used in optimization, in forecasting, in comparative analysis. The experimental data gathering is a very important step for practical verifying of the defined topic solution.
The submitted articles must contain: • the topic presentation; • the model definition; • the algorithm presentation; • the experimental results; • generalization.
The authors must prove his/her knowledge in the topic area, and must show the difference between his/her original work and the works published by others authors about the same topic.
Our aim is, also, to build the link between theory and practical experiments. The articles must have very concrete aspects.
The Advisory Board is made up of scientists from Romania and from abroad, who have used quantitative methods in their scientific research activities.
In order to achieve its goal, the JQAM requires high quality level articles. The target group is made up of specialists who like to introduce rigour, robustness and high quality level in their daily activities.
Only using quantitative methods it is possible to demonstrate the efficiency of the chosen variant, to compare the solutions in order to rank them, to observe the trends and to forecast, to simulate and to optimize.
The journal is open for approaching new research areas through the use of the quantitative methods. This means that, periodically, some issues will be dedicated to some actual topics.
The reviews of the PhD theses and books containing quantitative methods will be published in the on-line JQAM, in order to boost scientific research, and to inform the readers.
Our aim is that the JQAM to be a mark in the Romanian scientific society, and not only.
Welcome letters
2
Recep BOZTEMUR PhD, Associate University Professor History Chair, Middle East Studies Middle East Technical University Ankara, Turkey E-mail: [email protected]
Quantitative methods have long been applied to scientific researches either to
collect data conducive to carry out the work or to reach meaningful conclusions in academic research. Therefore, in areas from statistics to econometrics and from political arithmetic to comparative history, the quantitative methods are used both as a research technique and as a source of the study.
The quantitative method can be understood in two –but highly correlated- ways: The method is not only collecting the data simply, but also an approach to understand the relations between the data, facts and events. In the former, i.e. as a data-collecting technique, quantitative methods are the basic assistants to social sciences and humanities. Humanities use quantitative methods in collecting, classifying, evaluating and concluding their data. In this manner, the quantitative model is no more than one of the functions of the social science approaches.
However, in the latter sense, i.e. as an approach of the research itself, the quantitative method is used in humanities as well as social sciences in the formulation of the problematic of the research, in creating and asking the questions, in grouping and sub-grouping the data to be used in the research, in forming groups of data to constitute meaningful clusters of information, and in outlining different series of data. Various clusters, many series, and different groups of data are reviewed, evaluated, assessed, compared, contrasted and/or conciliated with one another through the established procedures of the quantitative method to produce healthy conclusions out of the research. Statistics always talk about probabilities, possibilities, and prospects; however, the quantitative method in social sciences and humanities has already occupied an important locus among social science approaches to produce certainties, specificities, explicitness, and definite conclusions. Establishing mathematical models in social sciences, using series, sequences and cycles in politics and economics, and comparing time series in history are ultimately helpful for the social scientists to produce certain results in their works. Sometimes exhausting, sometimes laborious, but the quantitative methods are now an inseparable part of social sciences.
The JAQM seems to have appeared very timely to fill up the vacuum in the field of quantitative methods. With its objectives, academic structure, and elaborated procedures, it has the full capacity to develop social science literature not only in Romania but also at the world scale. The JAQM will also improve the quality of research in social sciences with its academic procedures of selecting, evaluating and refereeing the articles to be published. These processes are not only to contribute to our understanding of the matter under question, but also to help the authors improve their works following the critiques of the experts of the field. The objectivity, generality and independence of scientific research as the most significant qualities of the quantitative method are adopted, therefore, as the basic tenets of the JAQM to provide the audience of the quantitative methods with no more than the research results of scientific and academic works. The JAQM is expected to contribute to the development of quality in quantitative methods, to the enhancement of the methodological literature in social sciences as well as to provide new platforms for the researchers in the field.

Welcome letters
3
Microsoft Romania Dear Professor Ivan,
I am very pleased to welcome the initiative for lunching Journal of Applied Quantitative Methods online publication. As a representative of a software company, I would like to salute the interdisciplinary approach taken by the group of respected professors and researchers to gather valuable contributions in this online journal. Sharing our knowledge and experience has never been so demanding and in the same time possible like nowadays in the digital society.
I wish you all the success in positioning this publication as a place to meet for
scientific and business community. Sincerely yours, Ovidiu ARTOPESCU General Manager Microsoft Romania

Welcome letters
4
SIVECO Romania Dear Professor,
Recently, we found out about the publishing of the Journal of Applied Quantitative Methods as an online journal.
As a company strongly involved in Research & Development, with many
participations in national and international research projects, SIVECO Romania welcomes the new journal and wishes it many and valuable issues.
We consider the domain of analysis based on quantitative methods as very modern
and very interesting for our activity. We will follow closely the evolution of your journal and hope to participate through
our specialists with contributed papers. Best regards, Irina SOCOL General Manager SIVECO Romania

Welcome letters
5
ASE Bucharest, Romania
Bucharest Academy of Economic Studies acknowledges the apparition of Journal of Applied Quantitative Methods and sustains the efforts of the scientific and editorial board to assure the high quality level that you have set as objective.
We have the certitude that all established objectives will become a reality. The journal generous topic permits the participation of specialists from various
scientific research domains and allows the presentation of practice oriented papers with an interdisciplinary character.
We wish you great success. Ion Gh. ROSCA Rector ASE Bucharest, Romania
Education in the Romanian Information Society
in the Period Leading Up to EU Integration
6
THE CLASSIFICATION OF ROMANIAN HIGH-SCHOOLS
Ion IVAN1 PhD, University Professor, Department of Economic Informatics Academy of Economic Studies, Bucharest, Romania Author of more than 25 books and over 75 journal articles in the field of software quality management, software metrics and informatics audit. His work focuses on the analysis of quality of software applications. E-mail: [email protected] , Web page: http://www.ionivan.ro
Daniel MILODIN2 Academy of Economic Studies, Bucharest, Romania Graduated of “The Informatized Project Management” Master Program E-mail: [email protected]
Lucian NAIE3 IBM, Romania PhD Candidate, Academy of Economic Studies, Bucharest, Romania Published articles: The Risk In Content Management (co-author), ICBE 2006, 27 - 28 October 2006, Transilvania University, Brasov, Romania E-mail: [email protected]
Abstract: The article tries to tackle the issue of high-schools classification from one city, district or from Romania. The classification criteria are presented. The National Database of Education is also presented and the application of criteria is illustrated. An algorithm for high-school multi-rang classification is proposed in order to build classes of high-schools performance. Key words: classification criteria, NDBE, high-schools performance.
1. High-school classification
Let us consider the multitude of high-schools from Romania, L={L1, L2, …, Ln}.
According to the statistics, at this moment, there is a number of 1,397 schools, where 770,192 pupils are learning and 76,071 teachers are teaching4.
High-schools are different, one from another, by a series of quantitative elements, such as:
• high-school age; • number of pupils whom attend those high-schools; • the pupils’ profile at entrance; • number of laboratories from every high-school; • teachers’ number.
Also, some differences are given by the qualitative elements, like: • the quality of the learning process; • the quality of pupil, meaning the marks obtained at the admission tests;
Education in the Romanian Information Society
in the Period Leading Up to EU Integration
7
• the quality and the experience of the teachers; • the number of graduating pupils, whom pass the admission tests for colleges; • the number of pupils whom are participating and are obtaining awards to the
Olympics In order to set hierarchy, it is necessary to set a correspondence between high-
school Li and a number Hi by creating the pair (Li,Hi), i=1, 2, ...., n. The Hi number is a score determined with an acknowledged procedure, based on data well measured, which contain performance elements, also accepted, due to the comparison of the obtained levels.
Setting high-schools hierarchy means to order the pairs (Li,Hi), i=1, 2, ...., n,
resulting the following sequence of pairs ( HL '1
'1, ), .....( HL '
n'n , ) with H'
i > H'1i+ , i=1,2,....,n-
1. High-schools classification has a dynamic character due to time variation of the
elements, which are inflowing in H1,...., Hn indicators’ calculation. The classification is well defined if for the L multitude elements there is only an
inequality like H'i > H'
1i+ , and not equality H'i = H'
1i+ .
After creating and publishing the sorted list of high-schools and the calculation procedure of the classification coefficients, the moment of the next classification is presented, usually after 5 years, in order to give enough time for schools to improve their score, and to obtain a better rank and to pass into a superior class.
2. The classification criteria
In order to set the hierarchy, a series of criteria, both quantitative and qualitative is
defined. Some of them are objective, others are subjective. The most important criteria, which are used for the multi-rang classification are chosen.
The age criterion takes into consideration the year when the high-school was opened. There will be the oldest school and the newest school from the country, presented in the table 1, which contain a selection of 10 high-schools, ranked by age, without being the oldest schools from country: Table 1. A list of schools in oldness order, extracted from a sample Nr. Crt.
High-school name Locality Establishing year
1. National College Timişoara 1773 2. National College Iaşi Iaşi 1828
3. High-School „Ecaterina Teodoroiu” Târgu-Jiu 1855 4. National College „Gh Lazăr” Bucureşti 1860 5. National College „IL Caragiale” Ploieşti 1864 6. National College „Mihai Viteazu” Ploieşti 1874 7. National College „Traian” D-Turnu Severin 1883 8. National College „Tudor Vladimirescu” Târgu-Jiu 1890 9. National College „Emil Racoviţă” Iaşi 1964 10. National College of Informatics Piatra-Neamţ 1968
After defining a template that includes the presentation elements for schools age,
the list extends in order to include all the 1,397 high-schools, thus the classification becomes
Education in the Romanian Information Society
in the Period Leading Up to EU Integration
8
complete. For high-schools created in the same year, the difference is given by the number of pupils.
The age criterion does not change the order, but has an important weight in the aggregate classification using multiple criteria of performance.
The criteria regarding the number of pupils that attend a school demonstrate the capacity of schools housing during the years of studies, and the capacity to attract pupils. Based on this criterion the table 2 is built, which contains the top ten high-schools classified by the number of pupils, which pass the admission tests: Table 2. The top ten school by the number of pupils No. High-school name Locality Number of pupils 1 Scholar-Group Industrial "DIMITRIE GUSTI" Bucureşti Sectorul 5 3405 2 Bilingual High-School "DECEBAL" Bucuresti Sectorul 3 2361 3 Technical College for Telecommunication "GHE.
AIRINEI" Bucuresti Sectorul 6 2142
4 National College "SPIRU HARET" Bucuresti Sectorul 2 2000 5 Technical College "ION CREANGA" Targu Neamt 1836 6 Technical College "M.VITEAZUL" Oradea 1819
7 Scholar-Group "Astra" Pitesti 1801 8 Technical College "MIRON NICOLESCU" Bucuresti Sectorul 4 1774 9 Scholar-Group "DIMITRIE LEONIDA" Petrosani 1758 10 Scholar-Group Industrial "STEFAN PROCOPIU" Vaslui 1754
Source: The data are for scholar year 2005-2006
The indicator being dynamic, the schools rank is different from one year to another, due to the variation of pupils graduating school and pupils admitted in the school.
The admission results criterion is very used and shows the degree of knowledge of the future pupils, aspects of the quality regarding the teaching process, teachers, showing the differences between the pupils who passed the high-school admission tests and those who passed the college admission tests.
The top ten schools by the best results criterion are given in table 3, and the list of the same schools using the worst result criterion is given in table 4: Table 3. The top ten schools by the grade average Nr. Crt
High-school name Locality
First grade point average in 2006
1 National College "SFANTUL SAVA" BUCURESTI 10.00
2 National College of informatics "TUDOR
VIANU" BUCURESTI
9.99 3 National College "UNIREA" FOCSANI VRANCEA 9.98 4 College "COSTACHE NEGRUZZI" IASI 9.97 5 National College "MIHAI VITEAZUL" BUCURESTI 9.96 6 National College "ION LUCA CARAGIALE" PRAHOVA 9.95 7 National College "O.GOGA" SIBIU SIBIU 9.94 8 National College "VASILE ALECSANDRI" GALATI 9.93 9 TEORETICAL HIGH-SCHOOL 'OVIDIUS' CONSTANTA 9.92 10 National College "EMIL RACOVITA" CLUJ 9.91
Education in the Romanian Information Society
in the Period Leading Up to EU Integration
9
Table 4. The top ten schools based by the least grade average No. High-school name
Locality Last grade point average in 2006
1 National College "SFANTUL SAVA" BUCURESTI 9.33
2 National College of informatics "TUDOR
VIANU" BUCURESTI
9.5 3 National College "UNIREA" FOCSANI VRANCEA 9.12 4 College "COSTACHE NEGRUZZI" IASI 8.94 5 National College "MIHAI VITEAZUL" BUCURESTI 9.52 6 National College "ION LUCA CARAGIALE" PRAHOVA 9.14 7 National College "O.GOGA" SIBIU SIBIU 8.63
8 National College "VASILE ALECSANDRI" GALATI 9.18 9 TEORETICAL HIGH-SCHOOL 'OVIDIUS' CONSTANTA 9.39 10 National College "EMIL RACOVITA" CLUJ 9.04
GPA is also a dynamic indicator, being affected by the pupils results obtained at the
admission tests. Using this criterion, the schools are classified as difficult to access in, which offer a
high qualification level, or easy to access in, which offer a lower qualification level, this indicator regarding the way how pupils and parents perceive the school, as a serious, good one or as an ordinary school.
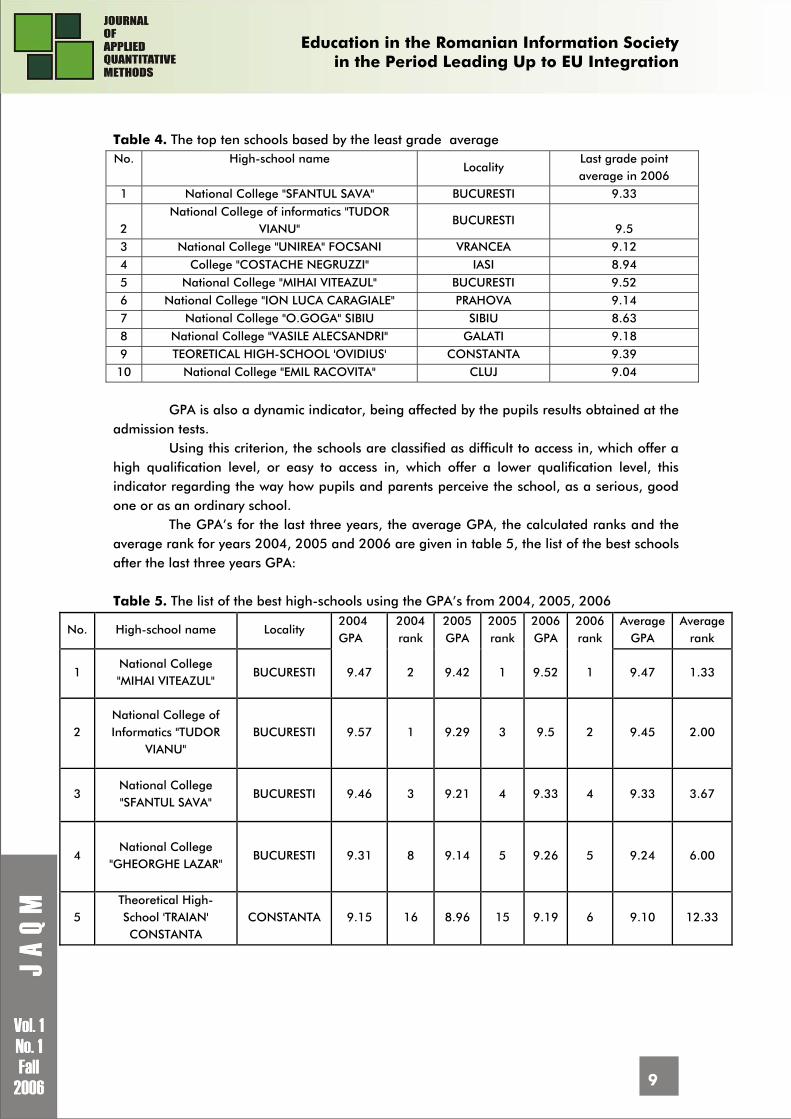
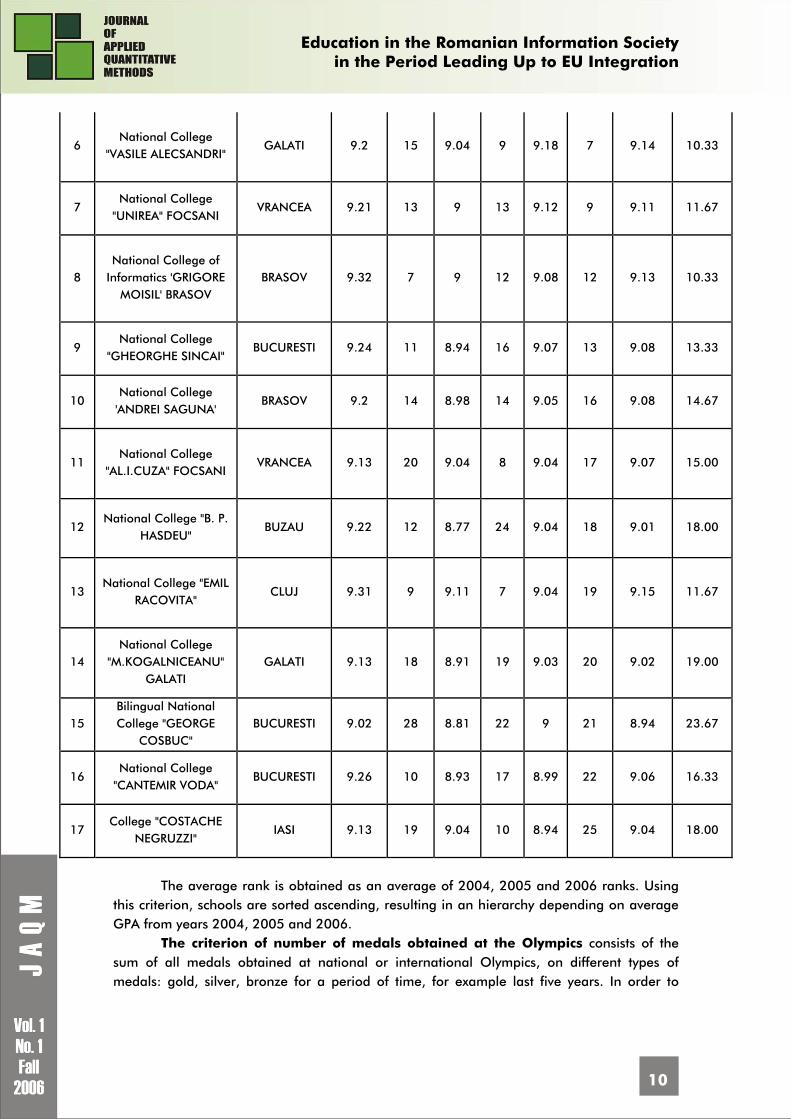
The GPA’s for the last three years, the average GPA, the calculated ranks and the average rank for years 2004, 2005 and 2006 are given in table 5, the list of the best schools after the last three years GPA:
Table 5. The list of the best high-schools using the GPA’s from 2004, 2005, 2006
No. High-school name Locality 2004 GPA
2004 rank
2005 GPA
2005 rank
2006 GPA
2006 rank
Average GPA
Average rank
1 National College "MIHAI VITEAZUL"
BUCURESTI 9.47 2 9.42 1 9.52 1 9.47 1.33
2 National College of Informatics "TUDOR
VIANU" BUCURESTI 9.57 1 9.29 3 9.5 2 9.45 2.00
3 National College "SFANTUL SAVA"
BUCURESTI 9.46 3 9.21 4 9.33 4 9.33 3.67
4 National College
"GHEORGHE LAZAR" BUCURESTI 9.31 8 9.14 5 9.26 5 9.24 6.00
5 Theoretical High- School 'TRAIAN' CONSTANTA
CONSTANTA 9.15 16 8.96 15 9.19 6 9.10 12.33
Education in the Romanian Information Society
in the Period Leading Up to EU Integration
10
6 National College
"VASILE ALECSANDRI" GALATI 9.2 15 9.04 9 9.18 7 9.14 10.33
7 National College
"UNIREA" FOCSANI VRANCEA 9.21 13 9 13 9.12 9 9.11 11.67
8 National College of
Informatics 'GRIGORE MOISIL' BRASOV
BRASOV 9.32 7 9 12 9.08 12 9.13 10.33
9 National College
"GHEORGHE SINCAI" BUCURESTI 9.24 11 8.94 16 9.07 13 9.08 13.33
10 National College
'ANDREI SAGUNA' BRASOV 9.2 14 8.98 14 9.05 16 9.08 14.67
11 National College
"AL.I.CUZA" FOCSANI VRANCEA 9.13 20 9.04 8 9.04 17 9.07 15.00
12 National College "B. P.
HASDEU" BUZAU 9.22 12 8.77 24 9.04 18 9.01 18.00
13 National College "EMIL
RACOVITA" CLUJ 9.31 9 9.11 7 9.04 19 9.15 11.67
14 National College
"M.KOGALNICEANU" GALATI
GALATI 9.13 18 8.91 19 9.03 20 9.02 19.00
15 Bilingual National College "GEORGE
COSBUC" BUCURESTI 9.02 28 8.81 22 9 21 8.94 23.67
16 National College
"CANTEMIR VODA" BUCURESTI 9.26 10 8.93 17 8.99 22 9.06 16.33
17 College "COSTACHE
NEGRUZZI" IASI 9.13 19 9.04 10 8.94 25 9.04 18.00
The average rank is obtained as an average of 2004, 2005 and 2006 ranks. Using
this criterion, schools are sorted ascending, resulting in an hierarchy depending on average GPA from years 2004, 2005 and 2006.
The criterion of number of medals obtained at the Olympics consists of the sum of all medals obtained at national or international Olympics, on different types of medals: gold, silver, bronze for a period of time, for example last five years. In order to
Education in the Romanian Information Society
in the Period Leading Up to EU Integration
11
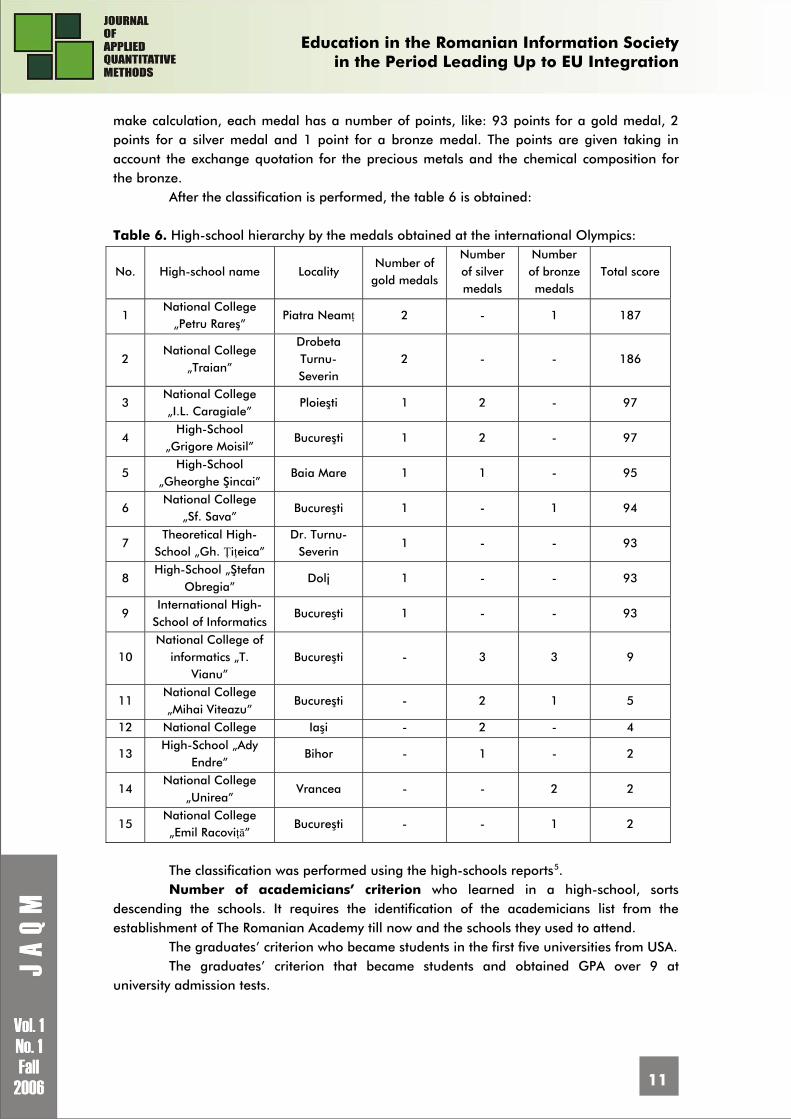
make calculation, each medal has a number of points, like: 93 points for a gold medal, 2 points for a silver medal and 1 point for a bronze medal. The points are given taking in account the exchange quotation for the precious metals and the chemical composition for the bronze.
After the classification is performed, the table 6 is obtained: Table 6. High-school hierarchy by the medals obtained at the international Olympics:
No. High-school name Locality Number of
gold medals
Number of silver medals
Number of bronze medals
Total score
1 National College
„Petru Rareş” Piatra Neamţ 2 - 1 187
2 National College
„Traian”
Drobeta Turnu-Severin
2 - - 186
3 National College „I.L. Caragiale”
Ploieşti 1 2 - 97
4 High-School
„Grigore Moisil” Bucureşti 1 2 - 97
5 High-School
„Gheorghe Şincai” Baia Mare 1 1 - 95
6 National College
„Sf. Sava” Bucureşti 1 - 1 94
7 Theoretical High-
School „Gh. Ţiţeica” Dr. Turnu-
Severin 1 - - 93
8 High-School „Ştefan
Obregia” Dolj 1 - - 93
9 International High-
School of Informatics Bucureşti 1 - - 93
10 National College of
informatics „T. Vianu”
Bucureşti - 3 3 9
11 National College „Mihai Viteazu”
Bucureşti - 2 1 5
12 National College Iaşi - 2 - 4
13 High-School „Ady
Endre” Bihor - 1 - 2
14 National College
„Unirea” Vrancea - - 2 2
15 National College „Emil Racoviţă”
Bucureşti - - 1 2
The classification was performed using the high-schools reports5. Number of academicians’ criterion who learned in a high-school, sorts
descending the schools. It requires the identification of the academicians list from the establishment of The Romanian Academy till now and the schools they used to attend.
The graduates’ criterion who became students in the first five universities from USA. The graduates’ criterion that became students and obtained GPA over 9 at
university admission tests.
Education in the Romanian Information Society
in the Period Leading Up to EU Integration
12
The criterion of the GPA obtained by the teachers at university graduating and at tests for occupying the vacancy job as a teacher.
These averages are usefully, but their representation is affected by the non-homogenous character of the terms entering in the calculation formula.
The criteria list is very big and an import decision is to extract those criteria which classify the schools in a realistic measure of their value. In order to satisfy this condition we have to take into consideration those criteria which sort schools on a base of valuable information which imply working with pupils and which express best the educative potential for those schools.
3. National Database of Education (NDBE)
For an efficient administration of data used for obtaining the procedures for
admission in high-schools, for passing the baccalaureate, for teachers’ designation and for the social programs supported by the Ministry of Education and Research, it was necessary to create a large database.
National database of education has become operative in 2006, and the data contained are generated complex analyses regarding the structure of Romanian teaching system and the evolution of pre-university school.
Information contained regards: • network school: structure, school list, high-schools, etc; • description of learning units; • number of classes; • number of pupils from each class; • number of teachers; • fixed assets;
The high-school database admission contains: • identification data for each pupil; • transcripts for each pupil, the results at national tests, GPA for V-VIII classes; • option list; • the sorting result;
Database for the baccalaureate exam contains: • identification data; • marks from IX-XII classes; • baccalaureate marks;
In order to be included in the classification process, databases content must correspond from the quality point of view.
The character of a large database implies a series of security tasks for data administration. An important operation is database loading. This operation is done automatically, or by human operators. The automatic loading implies the existence of an application which gets data from a source; for example, the system used to record dialogues from digital telephony centrals in a telephone company.
Manual loading, through operators, also supposes an application to be used by the operators, a graphical interface for example.
An important step in loading data is the data validation. For cutting back errors, validation must be well done and using more methods, such as:
Education in the Romanian Information Society
in the Period Leading Up to EU Integration
13
• validation regarding data type: numerical, character, data type, Boolean type, etc. This is the primary level of validation; all data should correspond to the associated type in database in order to load the data.
• validation applied to data following templates. For example personal numerical code has a certain format: first digit indicates if that person is a male or a female, and has 1 or 0 value, next six digits indicate date of birth, and the next six are generated using an algorithm. If in database is introduced a personal numerical code, this must be validated according to the steps presented earlier.
• validation in the context of the problem. That means that for example between two data must exist a relation, linear or non-linear, or the absence of a data implies the absence of another data. These validations are called business validation.
• validation using control keys, is necessary due to the large volume of data unprocessed Because NDE influences directly persons whom data are stored into and a series of
quality criteria must be respected: Completeness regards all schools. In each school, completeness means entering
all pupils, and for each pupil means entering data in all fields. Precision of the data means that data introduced in database must reflect reality.
What it is written in the primary documents and recognized as being correct by the parts from process, must be introduced in the same exact form in database.
Comparability is secured at national tests and at baccalaureate by unique tests and rigorous define of the criteria used for correcting the tests.
Because there are databases with similar structures, they can be used for different operations in NDE, resulting in a complete image of the pupil from gymnasium and college.
There is build a database containing information about: • persons’ identification; • GPA for V-VIII classes; • tests marks; • GPA for IX-XII classes; • Baccalaureate GPA.
This way, the premises for the study of how did the pupil prepare college admission and university admission are created.
4. Multi-criteria classification
Using multi-criteria classification, schools are sorted and information obtained is
used to define strategies for investments in every school. The 1397 high-schools are ordered using the number of pupils in scholar year
1005-2006. The list with schools sorted is obtained using data form NDE. In the future, when the number of pupils will be recorded in optimal time, there will
be calculated the average number of pupils for a period of 5 years. Using databases containing national tests results is build the high-schools hierarchy
based on admittance GPA. The candidates are filling in a list with 90 options. After the criterion of options,
high-schools Lj, j=1, 2, ..., n, are ordered using the next indicator:
Education in the Romanian Information Society
in the Period Leading Up to EU Integration
14
Rangj=j
nj
iji
n
r∑=1 , where:
- nj is the number of places for IX class in school Lj - rij is the option rank with which the pupil entered.
This criterion synthesizes numerical components, such as: • pupil preference for school performances; • pupil comprehension that the GPA allows him to occupy a place in the school; • economical considerations regarding the distance between the home and the school.
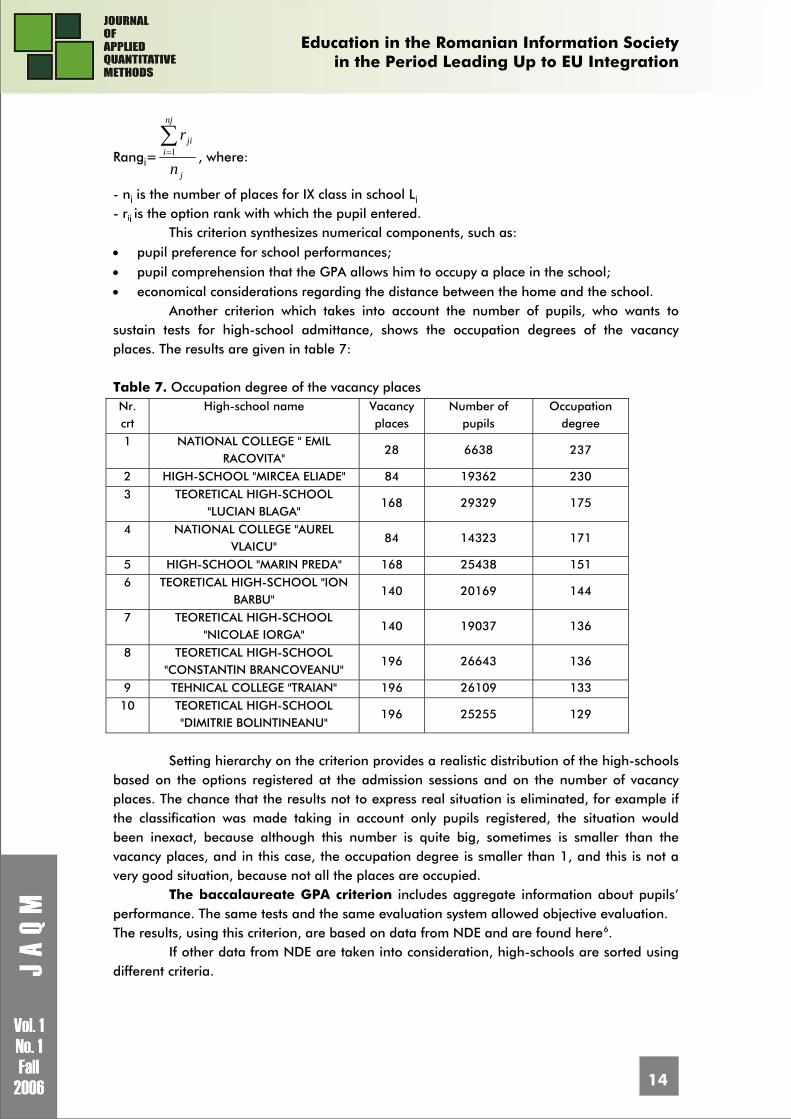
Another criterion which takes into account the number of pupils, who wants to sustain tests for high-school admittance, shows the occupation degrees of the vacancy places. The results are given in table 7: Table 7. Occupation degree of the vacancy places Nr. crt
High-school name Vacancy places
Number of pupils
Occupation degree
1 NATIONAL COLLEGE " EMIL RACOVITA"
28 6638 237
2 HIGH-SCHOOL "MIRCEA ELIADE" 84 19362 230 3 TEORETICAL HIGH-SCHOOL
"LUCIAN BLAGA" 168 29329 175
4 NATIONAL COLLEGE "AUREL VLAICU"
84 14323 171
5 HIGH-SCHOOL "MARIN PREDA" 168 25438 151 6 TEORETICAL HIGH-SCHOOL "ION
BARBU" 140 20169 144
7 TEORETICAL HIGH-SCHOOL "NICOLAE IORGA"
140 19037 136
8 TEORETICAL HIGH-SCHOOL "CONSTANTIN BRANCOVEANU"
196 26643 136
9 TEHNICAL COLLEGE "TRAIAN" 196 26109 133 10 TEORETICAL HIGH-SCHOOL
"DIMITRIE BOLINTINEANU" 196 25255 129
Setting hierarchy on the criterion provides a realistic distribution of the high-schools
based on the options registered at the admission sessions and on the number of vacancy places. The chance that the results not to express real situation is eliminated, for example if the classification was made taking in account only pupils registered, the situation would been inexact, because although this number is quite big, sometimes is smaller than the vacancy places, and in this case, the occupation degree is smaller than 1, and this is not a very good situation, because not all the places are occupied.
The baccalaureate GPA criterion includes aggregate information about pupils’ performance. The same tests and the same evaluation system allowed objective evaluation. The results, using this criterion, are based on data from NDE and are found here6.
If other data from NDE are taken into consideration, high-schools are sorted using different criteria.
Education in the Romanian Information Society
in the Period Leading Up to EU Integration
15
5. Multi-rang classification
There are considered the criteria C1, C2, ...., Cm and the high-schools L1, L2, ..., Ln. It is build the matrix B with n rows and m columns. It is completed element bij with aggregate level for characteristic Cj which corresponds to high-school Li.
If, to every criterion Cj is associated an importance coefficient pj and∑=
=m
jjp
11 ,
then the sums Si= j
m
jij pb∑
=1
, i=1,2, ..., n have the signification of an compos criterion. For a
concrete situation, are used for multi-rang classification, the criteria: C1 – GPA for high-school admittance, which has a 0.3 importance coefficient; C2 – GPA for baccalaureate test, with a 0.6 importance coefficient; C3 – number of pupils, with a 0.1 importance coefficient.
The importance coefficients are obtained experimentally, being accorded marks from a lot of 100 persons.
A homogenous lot of 250 persons with graduate studies provided marks, which allowed the correspondence between levels of quality and intervals.
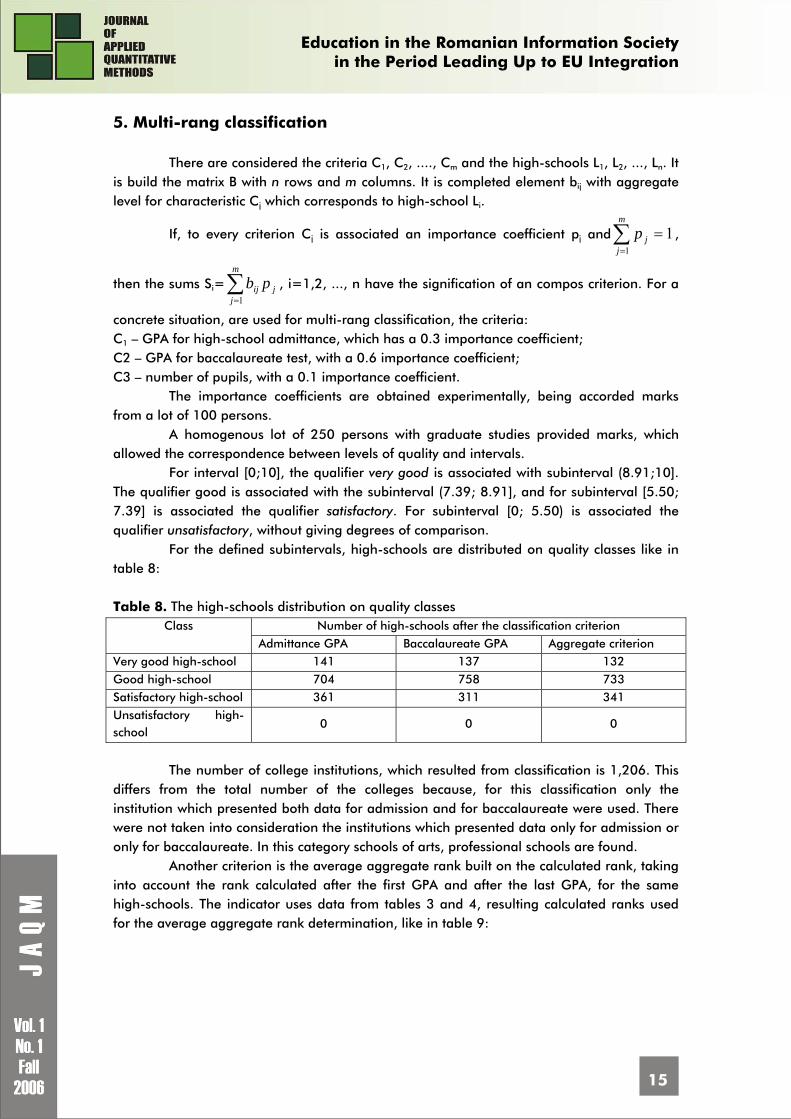
For interval [0;10], the qualifier very good is associated with subinterval (8.91;10]. The qualifier good is associated with the subinterval (7.39; 8.91], and for subinterval [5.50; 7.39] is associated the qualifier satisfactory. For subinterval [0; 5.50) is associated the qualifier unsatisfactory, without giving degrees of comparison.
For the defined subintervals, high-schools are distributed on quality classes like in table 8: Table 8. The high-schools distribution on quality classes
Number of high-schools after the classification criterion Class Admittance GPA Baccalaureate GPA Aggregate criterion
Very good high-school 141 137 132 Good high-school 704 758 733 Satisfactory high-school 361 311 341 Unsatisfactory high-school
0 0 0
The number of college institutions, which resulted from classification is 1,206. This
differs from the total number of the colleges because, for this classification only the institution which presented both data for admission and for baccalaureate were used. There were not taken into consideration the institutions which presented data only for admission or only for baccalaureate. In this category schools of arts, professional schools are found.
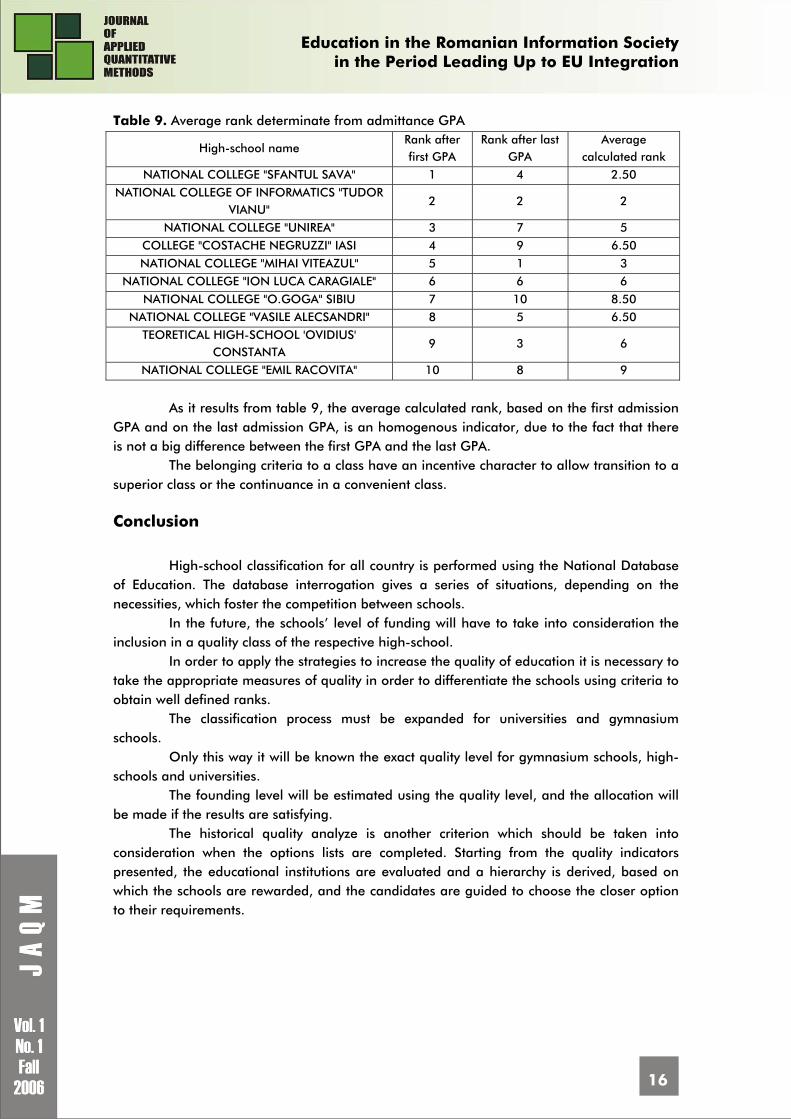
Another criterion is the average aggregate rank built on the calculated rank, taking into account the rank calculated after the first GPA and after the last GPA, for the same high-schools. The indicator uses data from tables 3 and 4, resulting calculated ranks used for the average aggregate rank determination, like in table 9:
Education in the Romanian Information Society
in the Period Leading Up to EU Integration
16
Table 9. Average rank determinate from admittance GPA
High-school name Rank after first GPA
Rank after last GPA
Average calculated rank
NATIONAL COLLEGE "SFANTUL SAVA" 1 4 2.50 NATIONAL COLLEGE OF INFORMATICS "TUDOR
VIANU" 2 2 2
NATIONAL COLLEGE "UNIREA" 3 7 5 COLLEGE "COSTACHE NEGRUZZI" IASI 4 9 6.50
NATIONAL COLLEGE "MIHAI VITEAZUL" 5 1 3 NATIONAL COLLEGE "ION LUCA CARAGIALE" 6 6 6
NATIONAL COLLEGE "O.GOGA" SIBIU 7 10 8.50 NATIONAL COLLEGE "VASILE ALECSANDRI" 8 5 6.50
TEORETICAL HIGH-SCHOOL 'OVIDIUS' CONSTANTA
9 3 6
NATIONAL COLLEGE "EMIL RACOVITA" 10 8 9
As it results from table 9, the average calculated rank, based on the first admission
GPA and on the last admission GPA, is an homogenous indicator, due to the fact that there is not a big difference between the first GPA and the last GPA.
The belonging criteria to a class have an incentive character to allow transition to a superior class or the continuance in a convenient class.
Conclusion
High-school classification for all country is performed using the National Database
of Education. The database interrogation gives a series of situations, depending on the necessities, which foster the competition between schools.
In the future, the schools’ level of funding will have to take into consideration the inclusion in a quality class of the respective high-school.
In order to apply the strategies to increase the quality of education it is necessary to take the appropriate measures of quality in order to differentiate the schools using criteria to obtain well defined ranks.
The classification process must be expanded for universities and gymnasium schools.
Only this way it will be known the exact quality level for gymnasium schools, high-schools and universities.
The founding level will be estimated using the quality level, and the allocation will be made if the results are satisfying.
The historical quality analyze is another criterion which should be taken into consideration when the options lists are completed. Starting from the quality indicators presented, the educational institutions are evaluated and a hierarchy is derived, based on which the schools are rewarded, and the candidates are guided to choose the closer option to their requirements.
Education in the Romanian Information Society
in the Period Leading Up to EU Integration
17
References 1. Ivan I., Milodin D. Data Orthogonality Metrics, Workshop Information Systems and Operations
Management, pag. 326-341, Bucuresti, 2006 2. Popa M. The system of quality characteristic, ASE, Bucharest, 2005, paper doctorate 3. Ivan I., Popa M. Text entities – development, evaluation and analyses, ASE Printing House,
Bucharest, 2005 4. Milodin D. Informatics application oriented to knowledge commerce, ASE, Bucharest, 2005 5. Ivan I, Boja C. Statistics methods in software analysis’s, ASE Printing House, Bucharest, 2004 6. Ivan I, Milodin D., Diaconu C. AMIS informatic system, The supliment of "Theoretical and
aplicated economics", no. 430, of the paper "The Economist", no. 1798 (2824), pg. I, III, 2004
7. Ivan I, Milodin D. Software for multirang classification of a collectivity components, Magazine Economics, No. 2, Bucharest, 2003, pg. 78 - 82
8. http://www.edu.ro 9. http://www.edu.ro/index.php/articles/5474
1 Ion IVAN has graduated the Faculty of Economic Computation and Economic Cybernetics in 1970, he holds a PhD diploma in Economics from 1978 and he had gone through all didactic positions since 1970 when he joined the staff of the Bucharest Academy of Economic Studies, teaching assistant in 1970, senior lecturer in 1978, assistant professor in 1991 and full professor in 1993. Currently he is full Professor of Economic Informatics within the Department of Economic Informatics at Faculty of Cybernetics, Statistics and Economic Informatics from the Academy of Economic Studies. He is the author of more than 25 books and over 75 journal articles in the field of software quality management, software metrics and informatics audit. His work focuses on the analysis of quality of software applications. He is currently studying software quality management and audit, project management of IT&C projects. He received numerous diplomas for his research activity achievements. For his entire activity, the National University Research Council granted him in 2005 with the national diploma, Opera Omnia. He has received multiple grants for research, documentation and exchange of experience at numerous universities from Greece, Ireland, Germany, France, Italy, Sweden, Norway, United States, Holland and Japan. He is distinguished member of the scientific board for the magazines and journals like: - Economic Informatics; - Economic Computation and Economic Cybernetics Studies and Research; - Romanian Journal of Statistics He has participated in the scientific committee of more than 20 Conferences on Informatics and he has coordinated the appearance of 3 proceedings volumes for International Conferences. From 1994 he is PhD coordinator in the field of Economic Informatics. He has coordinated as a director more than 15 research projects that have been financed from national and international research programs. He was member in a TEMPUS project as local coordinator and also as contractor in an EPROM project. 2 Graduated the Economy Informatics section from Cybernetics, Statistics and Economic Faculty, in 2005. In the same year, he follows “The Informatized Project Management” master program. He published a series of articles in specialized magazines, articles regarding the study of the orthogonality for the alphabets, Arabian digits, Latin alphabet, using experimental methods and techniques, and articles regarding the collectivity components classification, using different criteria. The disquisition paper in the master program follows the same research line, “The projects orthogonality, conditions for entering in the evaluation program”, proposing to define the concept of project’s orthogonality, methods for determine the degree of similarity between two projects, and to develop software products used to identify the project’s similarity. 3 Lucian NAIE graduated the Faculty of Cybernetics, Statistics and Economic Informatics, Economic Informatics specialization, within Academy of Economic Studies Bucharest in 1998. Currently he is working for IBM Romania as Senior Software Developer Engineer. Main capabilities and skills: advanced programming in C, C#, ASP.NET, PHP, .NET Web Services. Over 4 years experience in web application development. 4 http://www.edu.ro 5 http://www.edu.ro/index.php/articles/5474 6 http://www.edu.ro
Education in the Romanian Information Society
in the Period Leading Up to EU Integration
18
STUDENTS’ PERCEPTIONS REGARDING E-LEARNING
Ileana Gabriela NICULESCU-ARON PhD, University, Senior Lecturer, Statistics and Economic Forecast Department Academy of Economic Studies of Bucharest, Romania Main published books: Sampling techniques in work force analysis, Editura ASE, Bucharest, 2005 Statistical-economic analysis and valuation methods of the companies, (co-author), Editura Didactica si Pedagogica, Bucharest, 2002 E-mail: [email protected]
Constanta MIHAESCU PhD, University Professor, Statistics and Economic Forecast Department Academy of Economic Studies of Bucharest, Romania Main published books: Population and employment. Past , present and future, 2001 Quantitative methods in demography and social statistics, 2005 E-mail: [email protected]
Miruna MAZURENCU MARINESCU1 Ph.D., M.B.A., University Reader, Statistics and Economic Forecast Department Academy of Economic Studies of Bucharest, Romania Main published books: Valuation and Feasibility, Oscar Print, Bucharest, 2004 Strategies for Maximizing the Value of the Companies, Oscar Print, Bucharest, 2004 E-mail: [email protected]
Laura ASANDULUI Alexandru Ioan Cuza University, Iasi, Romania E-mail: [email protected]
Abstract: We live in an era where IC&T generates numerous transformations to the classic way of learning. The most known results of these transformations concretise in two means of learning through IC&T: e-learning and computer assisted learning. Just like the classical ones, these models assume the existence of an efficient learning process based on an efficient cooperation and a communication activity well established. Within this framework, the following question arises: „How this new method of learning is perceived and when it is best used and placed during the instruction process?” Seeking an answer to the above mentioned question, a joint academic staff from the reputed Iasi’s University Al. I. Cuza an the well-known Academy of Economic Studies of Bucharest have organized an inquiry through the students from both institutions regarding the perceptions, attitudes and expectations regarding e-learning. This paper briefly presents the main findings of this inquiry. Key words: e-learning, Internet, inquiry, sample, educational process.
Education in the Romanian Information Society
in the Period Leading Up to EU Integration
19
Setting the scene. Sampling’s objectives
Nowadays one can affirm that Internet became the arbiter of the access to education and culture and the e-learning a new way of learning to improve the growing needs for knowledge and continuous training. Its utility and also its benefits are obvious, but the main issue to be still sorted out is how to incorporate this new form of education in the already existing structures. This study was carried out based on the students’ sampling from Iasi’s University Al. I. Cuza and Academy of Economic Studies of Bucharest and had as main intention to approach this topic having as objectives, the followings:
1. To define the computer’s role in the learning process; 2. To evaluate e-learning according to specific criteria of any educational
process; 3. To place e-learning in the educational process.
Extracting the sample
In order to determine the sample’s size, questionnaire pre-testing data were used. The knowledge of the term e-learning was used as research variable, for which 24% responses were affirmative and 76% were negative. The probability was 95%, for which z = 1,96, and the maximum accepted error is 4%. Therefore, the sample volume for Academy of Economic Studies of Bucharest was 420 students and for the Al. I. Cuza University of 400 people.
The sample is random and proportionally stratified in two strata. The strata were formed using two variables, one in each stage. In the first stage we formed the strata using as variable the domain. The 2nd, 3rd, 4th and 5th year students of Al. I. Cuza University and the Academy of Economic Studies of Bucharest form the population. The population was structured in 6 strata for which the proportion of each stratum in the total population was calculated. Based on these proportions the sample size was divided in six strata.
In the second stage of the sample, the stratification variable is the study year. The units have been randomly extracted from the 6 strata, using as variable the year of study.
Data analysis and results’ interpretation
Data analysis reveals that the time spent in front of the computer by the students from the two university centres are different (see figure no. 1). The average number of hours spent in front of the computer by an ASE student is 13,8 (with a limit error of 0,82) in comparison with only 10,15 hours (with a limit error of 0,85) spent by a student from Iasi. A 95% confidence interval for the results is used.
The z statistics is used to compare the means with a calculated value of 5,982. We can affirm that the difference between the two means is statistically significant for a probability of 99,9999%.
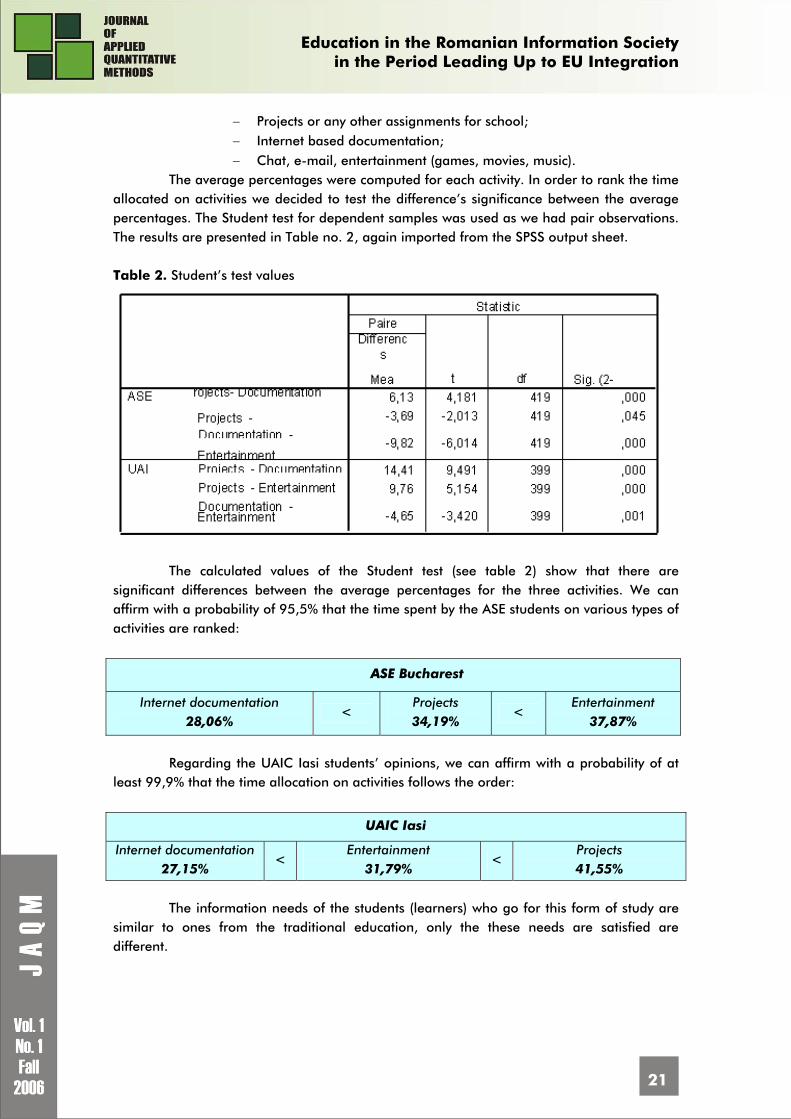
If we carefully analyse the repartition of the number of hours spent in front of the computer from figure no.1, we can affirm that the high frequencies are in the groups with 0 to 4 hours and 4 to 10 hours for Iasi University and are explained by the different behaviour of the female students from this university. Thus the 267 ASE female students are equally
Education in the Romanian Information Society
in the Period Leading Up to EU Integration
20
distributed on the four groups, function of the number of hours spent in front of the computer (the percentage varies from 20,2% to 28%). At UAIC the distribution is decreasing, 38,8% in the group 0 to 4 hours and only 13,8% in the group with over 20 hours.
Figure 1. How many hours do you spend weekly in front of the computer?
In order to highlight the importance of the “sex” variable Cramer’s V coefficient was
used. We preferred this indicator because it ranges between 0 and 1 in comparison with the contingency coefficient, for which the number of rows and columns of the contingency table gives the upper limit.
The relation for V is: )1(2 −= cnV χ , where n is the sample’s size and c is the
smallest value between the number of rows and the number of columns. The values presented in table no. 1 are imported from the SPSS output sheet.
Interpreting the results we can affirm that for ASE the „Sex” variable has a weak influence (V=0,188; significant for 99,998%) and in the case of UAIC from Iaşi the influence of this variable is stronger (V=0,357; significant for 99,9999%).
Table 1. Cramer’s test values
Then we further analysed the time spent by the students in front of the computer on
main types of activities. In order to do that the students were asked to specify in percentage terms how much of their time they allocate for the following activities:
Education in the Romanian Information Society
in the Period Leading Up to EU Integration
21
− Projects or any other assignments for school; − Internet based documentation; − Chat, e-mail, entertainment (games, movies, music).
The average percentages were computed for each activity. In order to rank the time allocated on activities we decided to test the difference’s significance between the average percentages. The Student test for dependent samples was used as we had pair observations. The results are presented in Table no. 2, again imported from the SPSS output sheet. Table 2. Student’s test values
The calculated values of the Student test (see table 2) show that there are
significant differences between the average percentages for the three activities. We can affirm with a probability of 95,5% that the time spent by the ASE students on various types of activities are ranked:
ASE Bucharest
Internet documentation 28,06%
< Projects 34,19%
< Entertainment
37,87%
Regarding the UAIC Iasi students’ opinions, we can affirm with a probability of at
least 99,9% that the time allocation on activities follows the order:
UAIC Iasi
Internet documentation 27,15%
< Entertainment
31,79% <
Projects 41,55%
The information needs of the students (learners) who go for this form of study are
similar to ones from the traditional education, only the these needs are satisfied are different.
Education in the Romanian Information Society
in the Period Leading Up to EU Integration
22
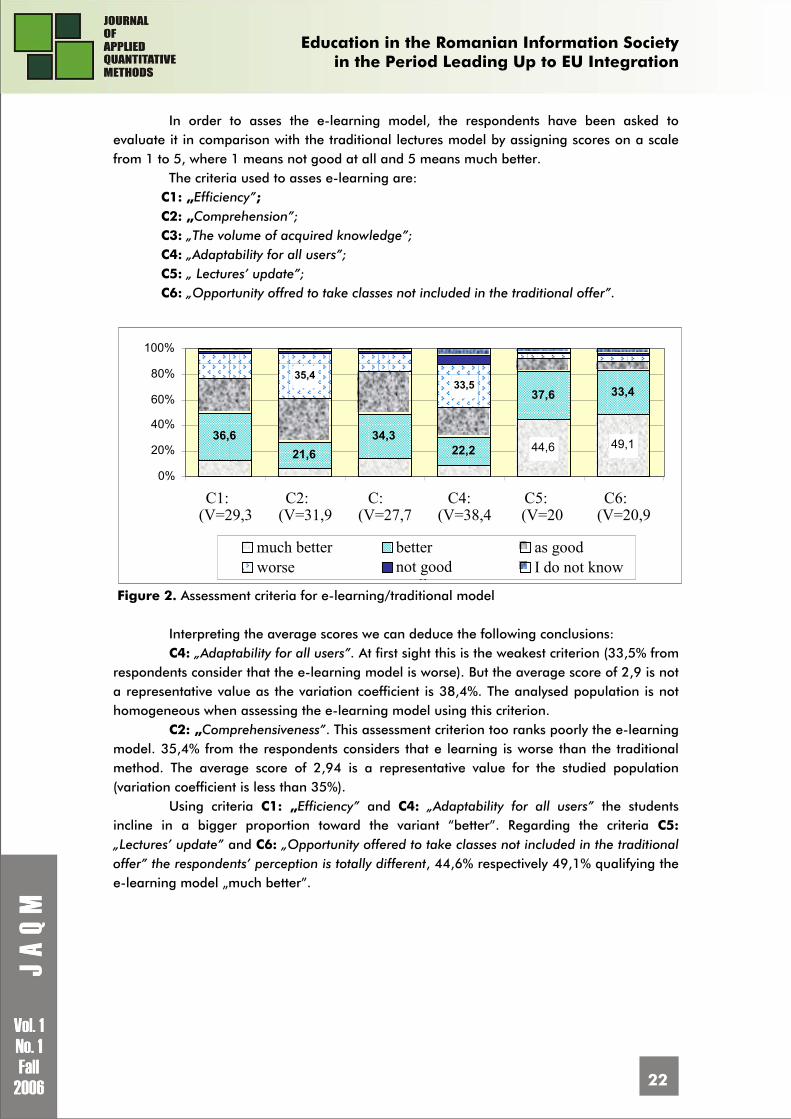
In order to asses the e-learning model, the respondents have been asked to evaluate it in comparison with the traditional lectures model by assigning scores on a scale from 1 to 5, where 1 means not good at all and 5 means much better.
The criteria used to asses e-learning are: C1: „Efficiency”; C2: „Comprehension”; C3: „The volume of acquired knowledge”; C4: „Adaptability for all users”; C5: „ Lectures’ update”; C6: „Opportunity offred to take classes not included in the traditional offer”.
49,1 36,621,6
34,322,2
37,6 33,4
44,6
35,4 33,5
0% 20% 40% 60% 80%
100%
C1: (V=29,3
C2: (V=31,9
C: (V=27,7
C4: (V=38,4
C5: (V=20
C6: (V=20,9
much better better as good worse not good
llI do not know
Figure 2. Assessment criteria for e-learning/traditional model
Interpreting the average scores we can deduce the following conclusions: C4: „Adaptability for all users”. At first sight this is the weakest criterion (33,5% from
respondents consider that the e-learning model is worse). But the average score of 2,9 is not a representative value as the variation coefficient is 38,4%. The analysed population is not homogeneous when assessing the e-learning model using this criterion.
C2: „Comprehensiveness”. This assessment criterion too ranks poorly the e-learning model. 35,4% from the respondents considers that e learning is worse than the traditional method. The average score of 2,94 is a representative value for the studied population (variation coefficient is less than 35%).
Using criteria C1: „Efficiency” and C4: „Adaptability for all users” the students incline in a bigger proportion toward the variant “better”. Regarding the criteria C5: „Lectures’ update” and C6: „Opportunity offered to take classes not included in the traditional offer” the respondents’ perception is totally different, 44,6% respectively 49,1% qualifying the e-learning model „much better”.
Education in the Romanian Information Society
in the Period Leading Up to EU Integration
23
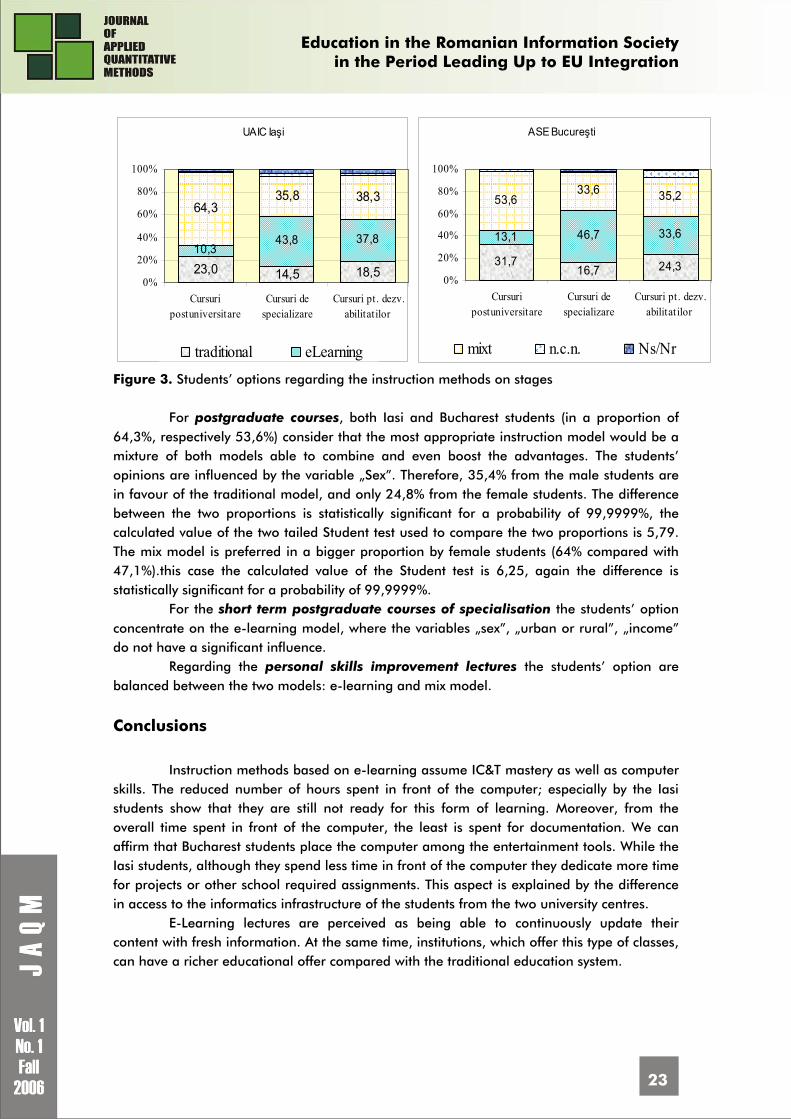
Figure 3. Students’ options regarding the instruction methods on stages
For postgraduate courses, both Iasi and Bucharest students (in a proportion of 64,3%, respectively 53,6%) consider that the most appropriate instruction model would be a mixture of both models able to combine and even boost the advantages. The students’ opinions are influenced by the variable „Sex”. Therefore, 35,4% from the male students are in favour of the traditional model, and only 24,8% from the female students. The difference between the two proportions is statistically significant for a probability of 99,9999%, the calculated value of the two tailed Student test used to compare the two proportions is 5,79. The mix model is preferred in a bigger proportion by female students (64% compared with 47,1%).this case the calculated value of the Student test is 6,25, again the difference is statistically significant for a probability of 99,9999%.
For the short term postgraduate courses of specialisation the students’ option concentrate on the e-learning model, where the variables „sex”, „urban or rural”, „income” do not have a significant influence.
Regarding the personal skills improvement lectures the students’ option are balanced between the two models: e-learning and mix model.
Conclusions
Instruction methods based on e-learning assume IC&T mastery as well as computer skills. The reduced number of hours spent in front of the computer; especially by the Iasi students show that they are still not ready for this form of learning. Moreover, from the overall time spent in front of the computer, the least is spent for documentation. We can affirm that Bucharest students place the computer among the entertainment tools. While the Iasi students, although they spend less time in front of the computer they dedicate more time for projects or other school required assignments. This aspect is explained by the difference in access to the informatics infrastructure of the students from the two university centres.
E-Learning lectures are perceived as being able to continuously update their content with fresh information. At the same time, institutions, which offer this type of classes, can have a richer educational offer compared with the traditional education system.
UAIC Iaşi
10,343,8 37,8
64,335,8 38,3
18,514,523,00%
20%
40%
60%
80%
100%
Cursuripostuniversitare
Cursuri despecializare
Cursuri pt. dezv.abilitatilor
traditional eLearning
ASE Bucureşti
31,716,7 24,3
13,1 46,7 33,6
53,633,6 35,2
0%
20%
40%
60%
80%
100%
Cursuripostuniversitare
Cursuri despecializare
Cursuri pt . dezv.abilitat ilor
mixt n.c.n. Ns/Nr
Education in the Romanian Information Society
in the Period Leading Up to EU Integration
24
Still important criteria as „Efficiency” and „Comprehension” are poorly ranked. The students do not have enough information regarding these lectures, therefore they do not perceive the following advantages of this method:
− Lectures’ flexibility given by the possibility to integrate the interactive functions;
− Time’s management flexibility by the e-Learner; − Multimedia taught classes are much more attractive for students.
These advantages prove the efficiency of the e-lectures and they stimulate the students’ understanding capacity. In time, these instruction methods will gain more and more followers and they will be included in the existing educational system and they will contribute to the training.
References 1. Niculescu-Aron I. G, eLearning, de la principii la practică, Masa Rotundă “Învăţământul
Superior Statistic şi Procesul de la Bologna”, Editura Junimea, Iaşi, 2005 2. Percepţia studenţilor asupra calităţii procesului educaţional, Sesiunea anuală de comunicări
ştiinţifice cu participare internaţională “Management şi educaţie”, Editura Universităţii Naţionale de Apărare ”Carol I, aprilie 2006
3. European training village, http://www.trainingvillage.gr/etv/ 4. Information support for eLearning: principles and practice,
www.sconul.ac.uk/pubs_stats/pubs 5. Quality and eLearning in Europe Survey report 2002, www.elearningage.co.uk
1 Miruna Mazurencu Marinescu Reader, Ph.D., M.B.A., Statistics and Economic Forecast Department Academy of Economic Studies of Bucharest Local Phare and F.A.O. expert Main published books: - Strategies for maximizing the value of the companies, Oscar Print, Bucharest, 2004 - Valuation and feasibility, Oscar Print, Bucharest, 2004 - Statistical-economic analysis and valuation methods of the companies, Gh. Vasilescu, M. Hurduzeu, F. Wagner, I. G. Niculescu-Aron. O. Zaharia, Editura Didactica si Pedagogica, Bucuresti 2002
Education in the Romanian Information Society
in the Period Leading Up to EU Integration
25
THE STUDY OF CURRICULAR DEPENDENCY
Dragos ANASTASIU1 Academy of Economic Studies, Bucharest, Romania Student of “Informatics Security” Master Program Published articles: Structured Entities Structures Building (co-author), Workshop Information Systems & Operations Systems Proceedings, 1 - 2 March 2006 E-mail: [email protected] Abstract: In the educational process, the disciplines D1, D2,...,Dn have a succession which is generated by the content and the final objective – the student formation. In this work, the disciplines are presented as structured text entities. The graph associated to the disciplines is established. A method for dependencies evaluation is proposed. The testing is done with 9 sets of representative input data. Key words: Text entity, Vocabulary, Graph, Data Structure, Dependency, Independency, Graph Drawing, Curricular, Metrics, Documentation, Progression, Consistency, Uniformity, Proportionality, Intraorthogonality, Interorthogonality, Software, Statistical, Inclusion
1. Structured text entities
Text entities are used for storing and organizing texts representing very diversified
information. The naming of entity indicates the generality of the concept, as the text represents information, which is able to be structured according to the origin and the scope which is associated to this.
The following base concepts regarding text entities are defined: • the alphabet A is a finite multitude formed of N symbols:a1, a2, … , aN; • the separator is a symbol which does not belong to the alphabet A, having the role of
delimitating two words that form a words sequence; • the word is a succession formed out of symbols which follow one another. A word cj is
characterized by its length, lg(cj) expressed as a number of characters that participate to the formation of word;
• the vocabulary VA is a multitude of different words. The length of the vocabulary VA, noted as Lgv(VA) indicates the number of words which participate to the formation of the vocabulary;
• the text vocabulary is constructed of a multitude of different words which appear in the text. The text vocabulary, VT, is included in the vocabulary VA. Sometimes, VT is identical with VA;
• the frequency of apparition for the word cj, noted as fj shows the number of apparitions for the word cj in the text T. The frequency of apparition for the symbol ai in the text T shows the number of apparitions for this symbol and it is noted as gj;
Education in the Romanian Information Society
in the Period Leading Up to EU Integration
26
• the sub-vocabulary is a part of the vocabulary constructed in such way that the intersection of any sub-vocabulary pair leads to void multitude of elements. Sub-vocabularies are disjoints multitudes of elements;
• the text T is a succession of words from vocabulary VA separated by special symbols which are called separators. The text length Lgt(T) states the number of words which form the text. The text length Lgts(T) states the number of symbols which goes into the formation of the text T.
The entities which are based on texts are actually constructions formed out of word sequences characterized by the positions of words within the text, by the grouping of words for the purpose of defining a context, by the making of a correspondence between the words and the elements, actions and real world elements, with qualitative attributes that groups concrete aspects from the reality in homogenous collectivities taking in consideration predefined criterion.
In [IVAN05]2, there are presented elements which must taken in consideration for constructing a text entity: • clear delimitation of the tackled field; • the defining of key words for the field; for a text entity developed in a field, there must
be identified those words that describe it in the most synthetic way; • the usage of the vocabulary in which the key words vocabulary is also included; • the knowledge of the concepts, techniques, methods, methodologies, technologies which
are specific for the field; • documentation regarding the detail elements and those connected to other fields of
activity; • following the rules of the syntax for each language; • following the rules regarding text entities structure, gradual tackle of the problem, usage
of standard formats for representation of text typed information. Some representative examples of text entities are: scientific, literal, cultural words,
web pages which are found on the Internet, the source code of the software products, dictionaries, phone books and any other grouping entity that exists as a text or is able to be structured as a text.
A particular case of text entity is represented by the list of disciplines within the learning system. A discipline is a text entity, formed out of a multitude of concepts that belong to it along with the definitions, demonstrations and corresponding examples.
Each text entity ET is formed out of NT components noted as SET1, SET2, … SETNT and each component has its own vocabulary, which represents a sub-vocabulary for the parent entity. The text entities structures are established based on the relations between entities, relations that are formed taking into consideration the connections between the component vocabularies, meaning the entities sub-vocabularies. In this way, for describing the entities structures and also the connections which are formed between these ones, it is necessary to analyze the base level, of words and words vocabulary.
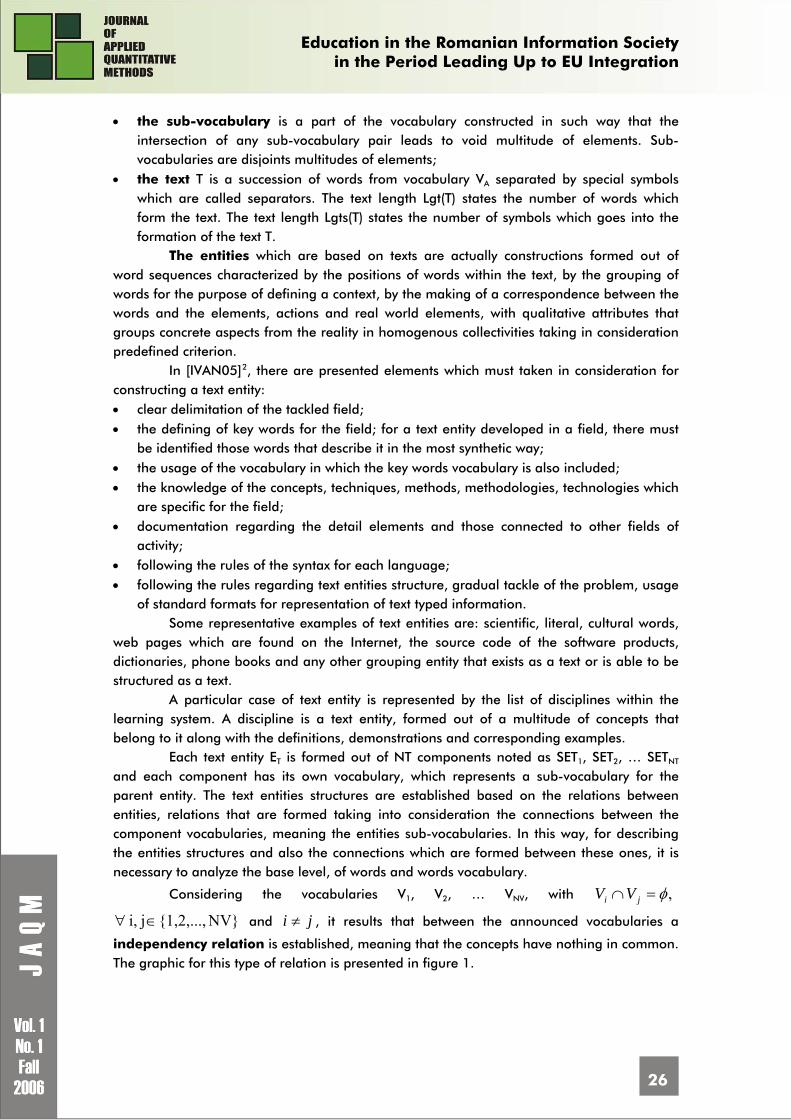
Considering the vocabularies V1, V2, … VNV, with ,φ=∩ ji VV
NV}{1,2,..., ji, ∈∀ and ji ≠ , it results that between the announced vocabularies a
independency relation is established, meaning that the concepts have nothing in common. The graphic for this type of relation is presented in figure 1.
Education in the Romanian Information Society
in the Period Leading Up to EU Integration
27
V1 V2 V3
V4
VNV
Figure 1. Independency relation between vocabularies
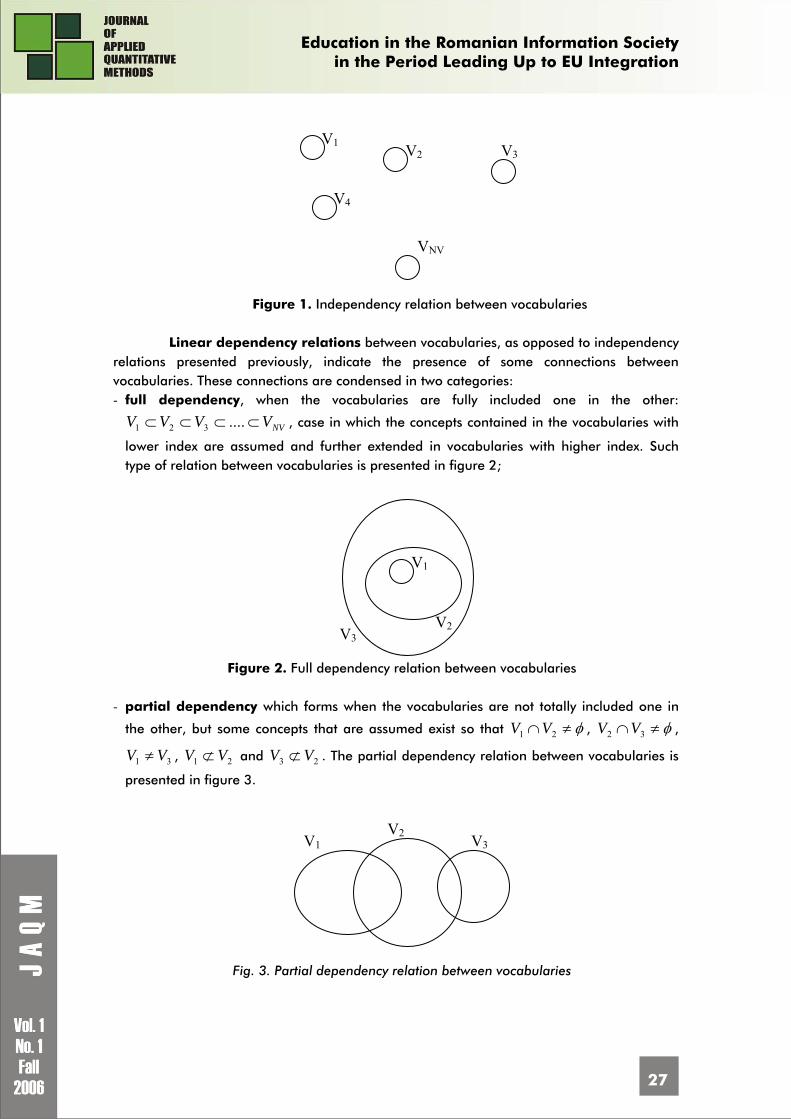
Linear dependency relations between vocabularies, as opposed to independency
relations presented previously, indicate the presence of some connections between vocabularies. These connections are condensed in two categories: - full dependency, when the vocabularies are fully included one in the other:
NVVVVV ⊂⊂⊂⊂ ....321 , case in which the concepts contained in the vocabularies with
lower index are assumed and further extended in vocabularies with higher index. Such type of relation between vocabularies is presented in figure 2;
V1
V2 V3
Figure 2. Full dependency relation between vocabularies
- partial dependency which forms when the vocabularies are not totally included one in
the other, but some concepts that are assumed exist so that φ≠∩ 21 VV , φ≠∩ 32 VV ,
31 VV ≠ , 21 VV ⊄ and 23 VV ⊄ . The partial dependency relation between vocabularies is
presented in figure 3.
V1 V2 V3
Fig. 3. Partial dependency relation between vocabularies
Education in the Romanian Information Society
in the Period Leading Up to EU Integration
28
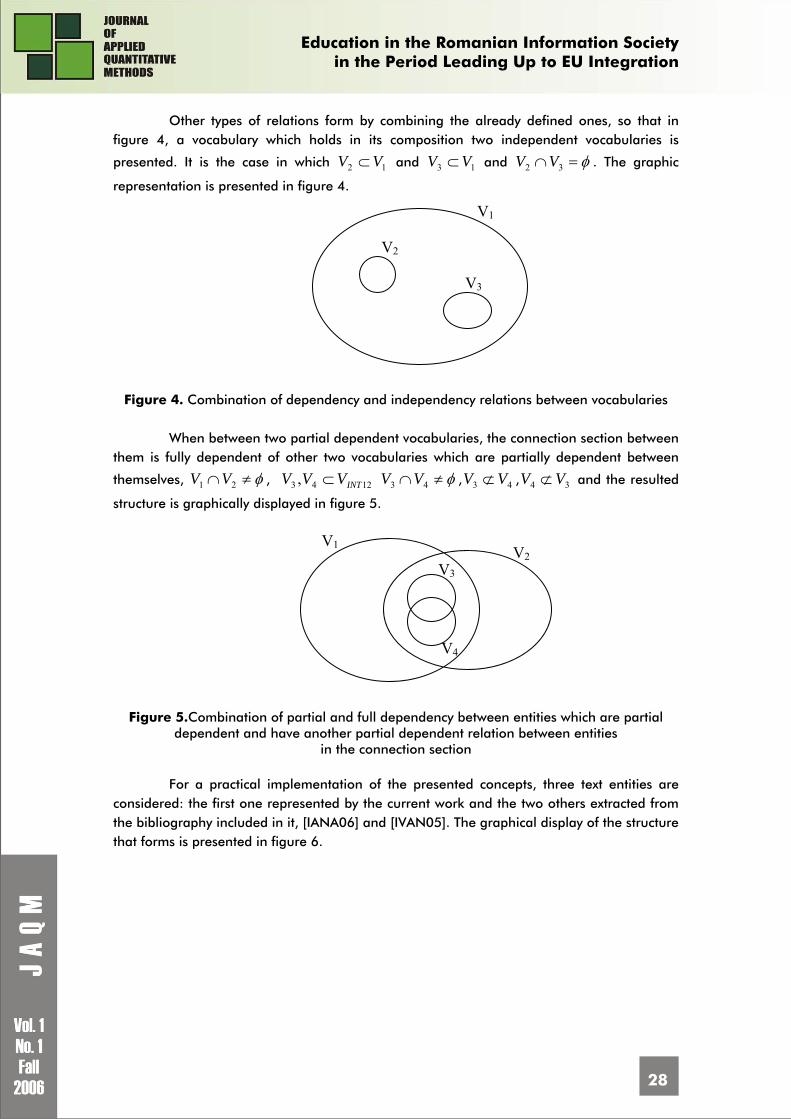
Other types of relations form by combining the already defined ones, so that in figure 4, a vocabulary which holds in its composition two independent vocabularies is
presented. It is the case in which 12 VV ⊂ and 13 VV ⊂ and φ=∩ 32 VV . The graphic
representation is presented in figure 4.
V1
V2
V3
Figure 4. Combination of dependency and independency relations between vocabularies
When between two partial dependent vocabularies, the connection section between
them is fully dependent of other two vocabularies which are partially dependent between
themselves, φ≠∩ 21 VV , 1243 , INTVVV ⊂ φ≠∩ 43 VV , 43 VV ⊄ , 34 VV ⊄ and the resulted
structure is graphically displayed in figure 5.
V1 V2
V3
V4
Figure 5.Combination of partial and full dependency between entities which are partial
dependent and have another partial dependent relation between entities in the connection section
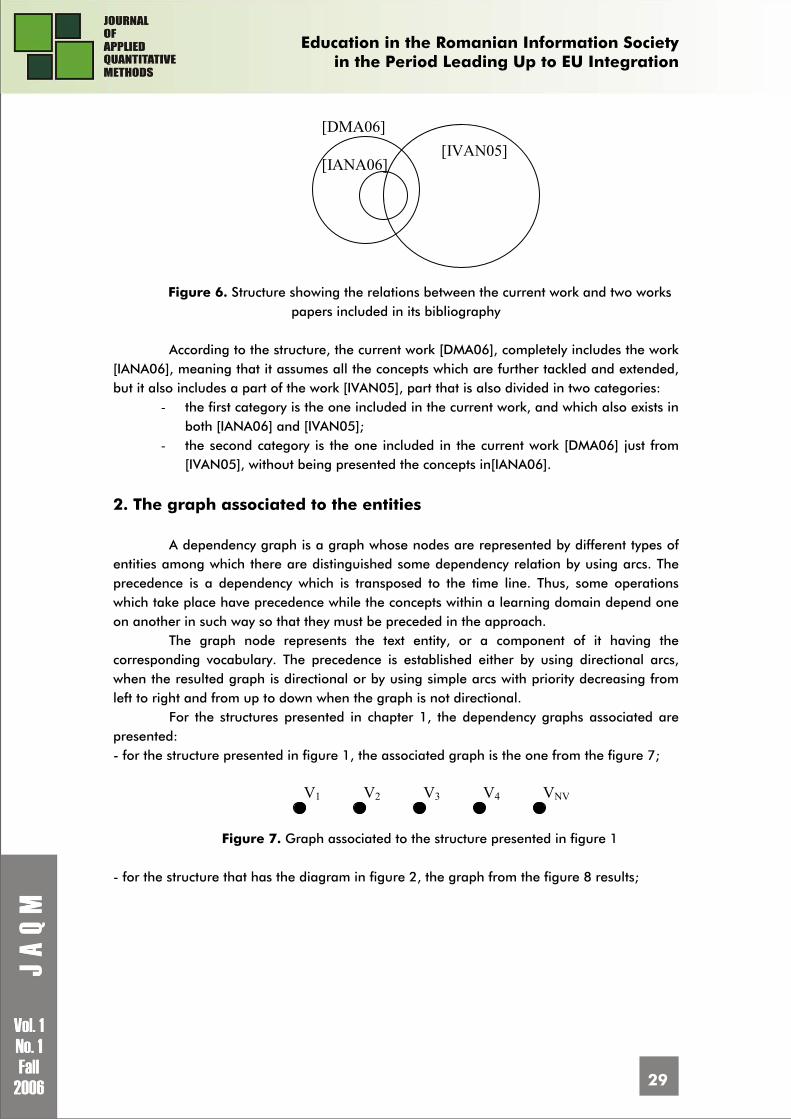
For a practical implementation of the presented concepts, three text entities are
considered: the first one represented by the current work and the two others extracted from the bibliography included in it, [IANA06] and [IVAN05]. The graphical display of the structure that forms is presented in figure 6.
Education in the Romanian Information Society
in the Period Leading Up to EU Integration
29
[DMA06]
[IANA06] [IVAN05]
Figure 6. Structure showing the relations between the current work and two works
papers included in its bibliography
According to the structure, the current work [DMA06], completely includes the work [IANA06], meaning that it assumes all the concepts which are further tackled and extended, but it also includes a part of the work [IVAN05], part that is also divided in two categories:
- the first category is the one included in the current work, and which also exists in both [IANA06] and [IVAN05];
- the second category is the one included in the current work [DMA06] just from [IVAN05], without being presented the concepts in[IANA06].
2. The graph associated to the entities
A dependency graph is a graph whose nodes are represented by different types of entities among which there are distinguished some dependency relation by using arcs. The precedence is a dependency which is transposed to the time line. Thus, some operations which take place have precedence while the concepts within a learning domain depend one on another in such way so that they must be preceded in the approach.
The graph node represents the text entity, or a component of it having the corresponding vocabulary. The precedence is established either by using directional arcs, when the resulted graph is directional or by using simple arcs with priority decreasing from left to right and from up to down when the graph is not directional.
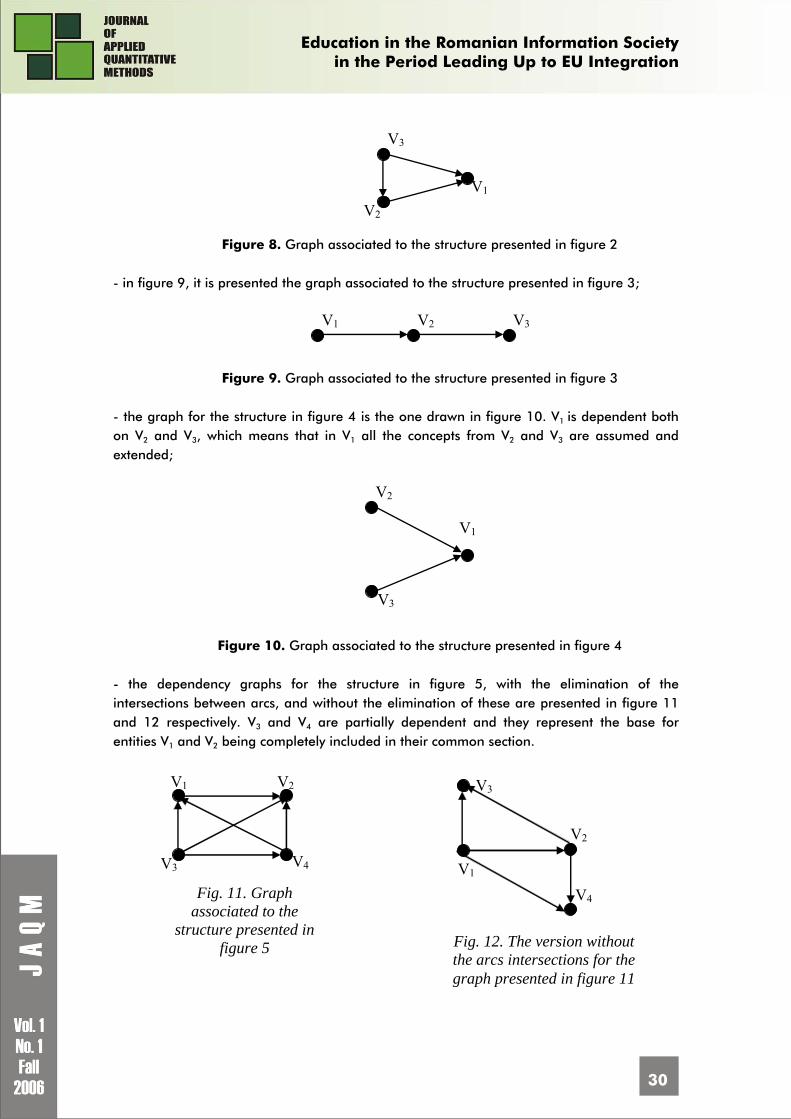
For the structures presented in chapter 1, the dependency graphs associated are presented: - for the structure presented in figure 1, the associated graph is the one from the figure 7;
V1 V2 V3 V4 VNV
Figure 7. Graph associated to the structure presented in figure 1
- for the structure that has the diagram in figure 2, the graph from the figure 8 results;
Education in the Romanian Information Society
in the Period Leading Up to EU Integration
30
V3
V2 V1
Figure 8. Graph associated to the structure presented in figure 2
- in figure 9, it is presented the graph associated to the structure presented in figure 3;
V1 V2 V3
Figure 9. Graph associated to the structure presented in figure 3
- the graph for the structure in figure 4 is the one drawn in figure 10. V1 is dependent both on V2 and V3, which means that in V1 all the concepts from V2 and V3 are assumed and extended;
V1
V2
V3
Figure 10. Graph associated to the structure presented in figure 4
- the dependency graphs for the structure in figure 5, with the elimination of the intersections between arcs, and without the elimination of these are presented in figure 11 and 12 respectively. V3 and V4 are partially dependent and they represent the base for entities V1 and V2 being completely included in their common section.
V1 V2
V3 V4
Fig. 11. Graph associated to the
structure presented in figure 5
V1
V2
V3
V4
Fig. 12. The version without the arcs intersections for the graph presented in figure 11
Education in the Romanian Information Society
in the Period Leading Up to EU Integration
31
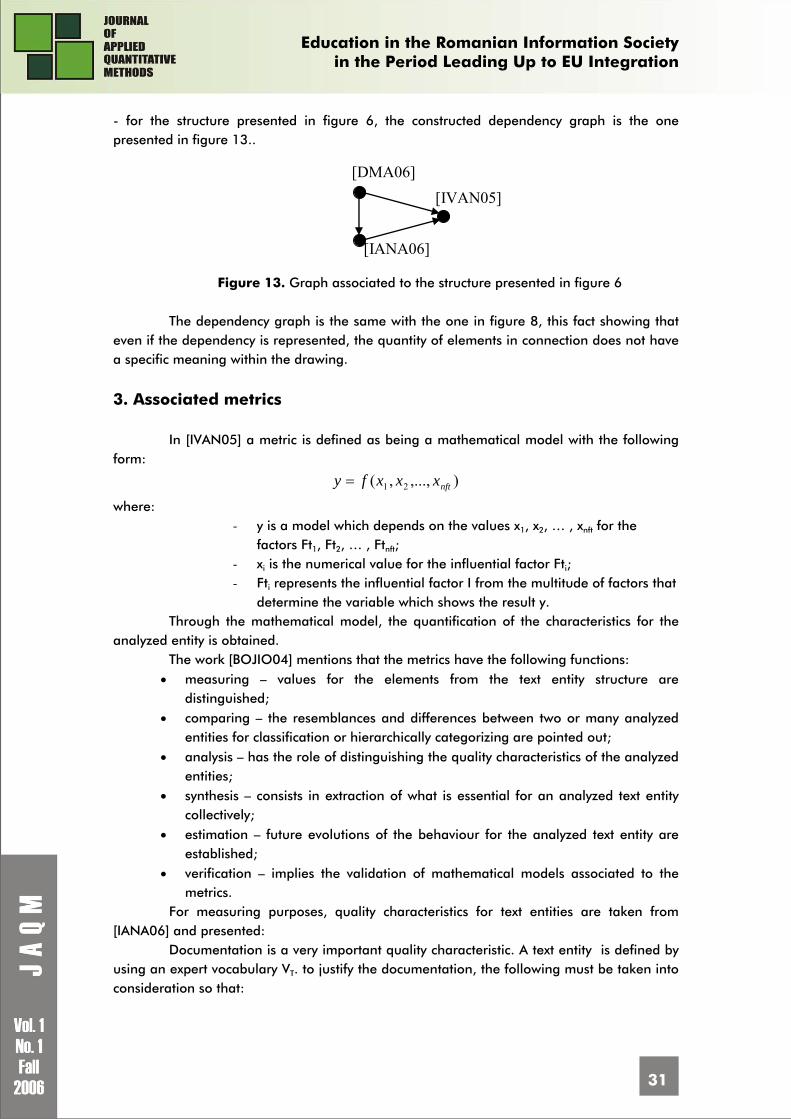
- for the structure presented in figure 6, the constructed dependency graph is the one presented in figure 13..
[DMA06]
[IANA06]
[IVAN05]
Figure 13. Graph associated to the structure presented in figure 6
The dependency graph is the same with the one in figure 8, this fact showing that
even if the dependency is represented, the quantity of elements in connection does not have a specific meaning within the drawing.
3. Associated metrics In [IVAN05] a metric is defined as being a mathematical model with the following
form:
),...,,( 21 nftxxxfy =
where: - y is a model which depends on the values x1, x2, … , xnft for the
factors Ft1, Ft2, … , Ftnft; - xi is the numerical value for the influential factor Fti; - Fti represents the influential factor I from the multitude of factors that
determine the variable which shows the result y. Through the mathematical model, the quantification of the characteristics for the
analyzed entity is obtained. The work [BOJIO04] mentions that the metrics have the following functions:
• measuring – values for the elements from the text entity structure are distinguished;
• comparing – the resemblances and differences between two or many analyzed entities for classification or hierarchically categorizing are pointed out;
• analysis – has the role of distinguishing the quality characteristics of the analyzed entities;
• synthesis – consists in extraction of what is essential for an analyzed text entity collectively;
• estimation – future evolutions of the behaviour for the analyzed text entity are established;
• verification – implies the validation of mathematical models associated to the metrics.
For measuring purposes, quality characteristics for text entities are taken from [IANA06] and presented:
Documentation is a very important quality characteristic. A text entity is defined by using an expert vocabulary VT. to justify the documentation, the following must be taken into consideration so that:
Education in the Romanian Information Society
in the Period Leading Up to EU Integration
32
• the bibliography’s article titles must have as a base a vocabulary VB included in vocabulary VT;
• the article words written by the entity authors must form a vocabulary VA included in the vocabulary VT.
The quality of progression refers to the gradual nature of the approach. The concepts are treated from closer to closer so that: • primary concepts that are clarified by examples are considered; • based on primary concepts, new concepts are defined, some of them being derived from
others; • the connections between concepts are assured by formulas, examples and diagrams; • the synthesis and analysis determine the particularization and aggregation of all the
presented elements; • the particularization is obtained from a definition of concepts to another.
The consistency implies the existence of some definitions, relations and presentations so that a logical succession is possible to be obtained. The particularization level grows with the growing text.
The uniformity consists in the usage with the same intensity of the bibliographic sources in the development of the concepts as well.
If a text entity ET aims to tackle a specific field as a synthesis, this implies that a bibliography formed out of titles G1,G2, ..., GH, where h represents the length of the bibliography expressed as a number of used works, exists.
The uniformity means that the references of the works are done in equal measure for each of them. The analysis of this quality characteristic implies the parsing of ET entity for frequencies fi computing for which the work Gih from the bibliography is referenced, i =1,2...
For the quality analysis of the entities, the following must be obtained: • the length of the entities ET in total number of words; • the length of the entity ET in total number of essential words, which is obtained by
eliminating the connection words and the words which are not modified regardless the context;
• the length of the entity vocabulary as a number of maximum orthogonal words, by regrouping the results obtained by deriving a root word;
• the frequencies for the essential words which form a vocabulary; • the frequencies fi for the totals Gi references, with i =1,2...,h; • the indicators used in determining the quality of the references, such as:
o the quantity of bibliography titles, introduced without being quoted, Ipn, that it is calculated using the relation:
h
GI
h
ii
pn
∑== 1
)(α
where ⎩⎨⎧ ≠
=otherwise ,0
0 when ,1)( i
i
fGα
o the quantity of the quoted titles, Ipc, being calculated using the relation: Ipc = 1- Ipn
o the quantity of excessively quoted titles, Ipex, calculated with the relation:
Education in the Romanian Information Society
in the Period Leading Up to EU Integration
33
h
GI
h
ii
pex
∑== 1
)(β
where ⎪⎩
⎪⎨⎧ <
= ≤≤
otherwise ,0
|}{fmax-f| when ,1)(
ih1ii εβ iG
o the list of excessively quoted titles, Gj1 Gj2 ... Gjθ for which { } ε<− |max| ii ff ;
o the list of unquoted titles, Gj1 Gj2 ... Gjr for which fjs = 0, js = {j1, j2, ... jr}. Proportionality is a very important characteristic by the sense and especially the
effects which are determined during each entity reference process. As well as all the reality is formed out of objects, processes, phenomena, beings
characterized by structures formed out of components which interact, the text entities, as a reflection of the reality, even if they are artificially constructions, also consist of interacting components.
Proportionality is represented through the attention for the real world analysis. To a complex subsystem, a subtext with a bigger length than the length of a simple subsystem must correspond. Proportionality is represented by the relation within the text entity, itself.
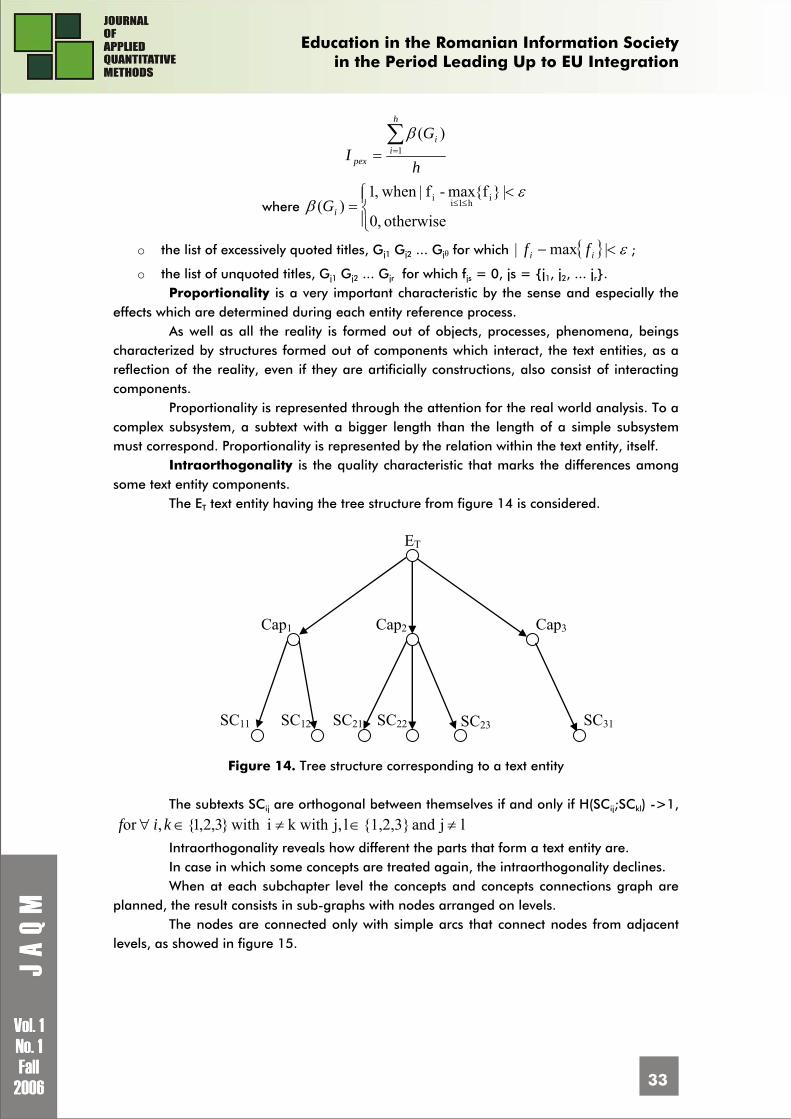
Intraorthogonality is the quality characteristic that marks the differences among some text entity components.
The ET text entity having the tree structure from figure 14 is considered.
ET
Cap1 Cap2 Cap3
SC11 SC12 SC21 SC22 SC23 SC31
Figure 14. Tree structure corresponding to a text entity
The subtexts SCij are orthogonal between themselves if and only if H(SCij;SCkl) ->1,
lj and {1,2,3}lj,k with i with }3,2,1{, or ≠∈≠∈∀ kif
Intraorthogonality reveals how different the parts that form a text entity are. In case in which some concepts are treated again, the intraorthogonality declines. When at each subchapter level the concepts and concepts connections graph are
planned, the result consists in sub-graphs with nodes arranged on levels. The nodes are connected only with simple arcs that connect nodes from adjacent
levels, as showed in figure 15.
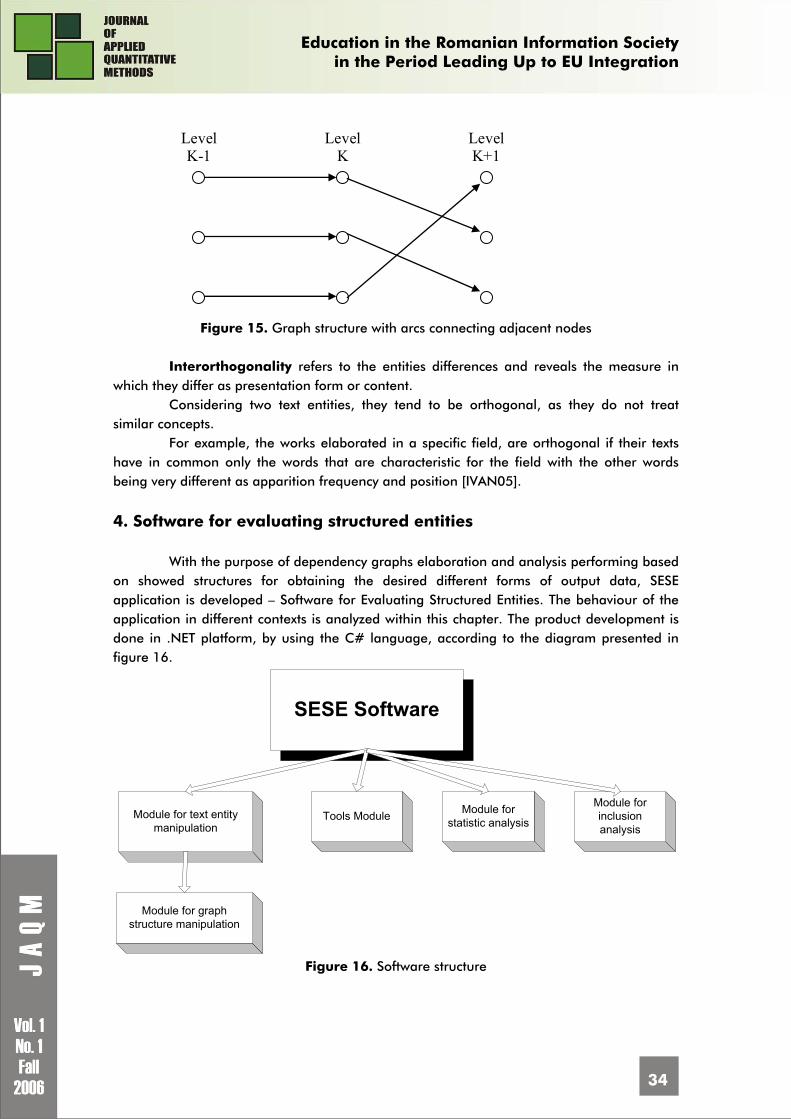
Education in the Romanian Information Society
in the Period Leading Up to EU Integration
34
Level K-1
Level K
Level K+1
Figure 15. Graph structure with arcs connecting adjacent nodes
Interorthogonality refers to the entities differences and reveals the measure in
which they differ as presentation form or content. Considering two text entities, they tend to be orthogonal, as they do not treat
similar concepts. For example, the works elaborated in a specific field, are orthogonal if their texts
have in common only the words that are characteristic for the field with the other words being very different as apparition frequency and position [IVAN05].
4. Software for evaluating structured entities With the purpose of dependency graphs elaboration and analysis performing based
on showed structures for obtaining the desired different forms of output data, SESE application is developed – Software for Evaluating Structured Entities. The behaviour of the application in different contexts is analyzed within this chapter. The product development is done in .NET platform, by using the C# language, according to the diagram presented in figure 16.
SESE Software
Module for graphstructure manipulation
Module for text entitymanipulation
Tools Module Module forstatistic analysis
Module forinclusionanalysis
Figure 16. Software structure
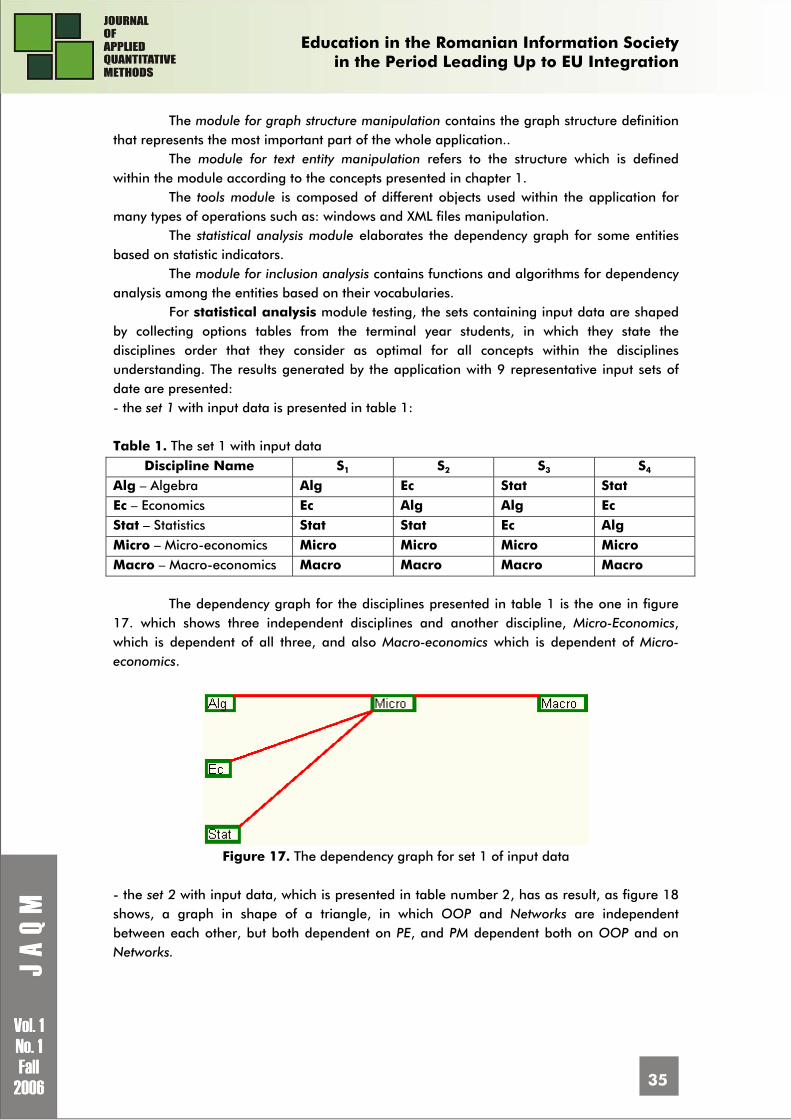
Education in the Romanian Information Society
in the Period Leading Up to EU Integration
35
The module for graph structure manipulation contains the graph structure definition that represents the most important part of the whole application..
The module for text entity manipulation refers to the structure which is defined within the module according to the concepts presented in chapter 1.
The tools module is composed of different objects used within the application for many types of operations such as: windows and XML files manipulation.
The statistical analysis module elaborates the dependency graph for some entities based on statistic indicators.
The module for inclusion analysis contains functions and algorithms for dependency analysis among the entities based on their vocabularies.
For statistical analysis module testing, the sets containing input data are shaped by collecting options tables from the terminal year students, in which they state the disciplines order that they consider as optimal for all concepts within the disciplines understanding. The results generated by the application with 9 representative input sets of date are presented: - the set 1 with input data is presented in table 1: Table 1. The set 1 with input data
Discipline Name S1 S2 S3 S4 Alg – Algebra Alg Ec Stat Stat Ec – Economics Ec Alg Alg Ec Stat – Statistics Stat Stat Ec Alg Micro – Micro-economics Micro Micro Micro Micro Macro – Macro-economics Macro Macro Macro Macro
The dependency graph for the disciplines presented in table 1 is the one in figure 17. which shows three independent disciplines and another discipline, Micro-Economics, which is dependent of all three, and also Macro-economics which is dependent of Micro-economics.
Figure 17. The dependency graph for set 1 of input data
- the set 2 with input data, which is presented in table number 2, has as result, as figure 18 shows, a graph in shape of a triangle, in which OOP and Networks are independent between each other, but both dependent on PE, and PM dependent both on OOP and on Networks.
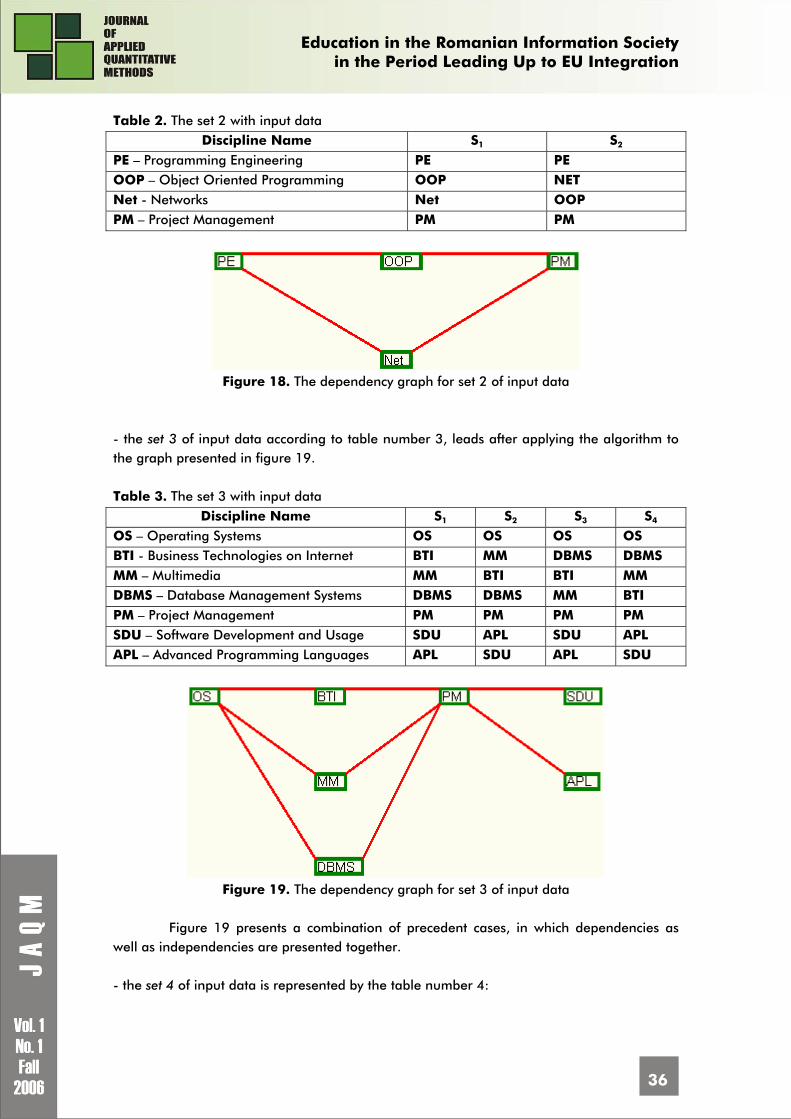
Education in the Romanian Information Society
in the Period Leading Up to EU Integration
36
Table 2. The set 2 with input data Discipline Name S1 S2
PE – Programming Engineering PE PE OOP – Object Oriented Programming OOP NET Net - Networks Net OOP PM – Project Management PM PM
Figure 18. The dependency graph for set 2 of input data
- the set 3 of input data according to table number 3, leads after applying the algorithm to the graph presented in figure 19. Table 3. The set 3 with input data
Discipline Name S1 S2 S3 S4 OS – Operating Systems OS OS OS OS BTI - Business Technologies on Internet BTI MM DBMS DBMS MM – Multimedia MM BTI BTI MM DBMS – Database Management Systems DBMS DBMS MM BTI PM – Project Management PM PM PM PM SDU – Software Development and Usage SDU APL SDU APL APL – Advanced Programming Languages APL SDU APL SDU
Figure 19. The dependency graph for set 3 of input data
Figure 19 presents a combination of precedent cases, in which dependencies as
well as independencies are presented together. - the set 4 of input data is represented by the table number 4:
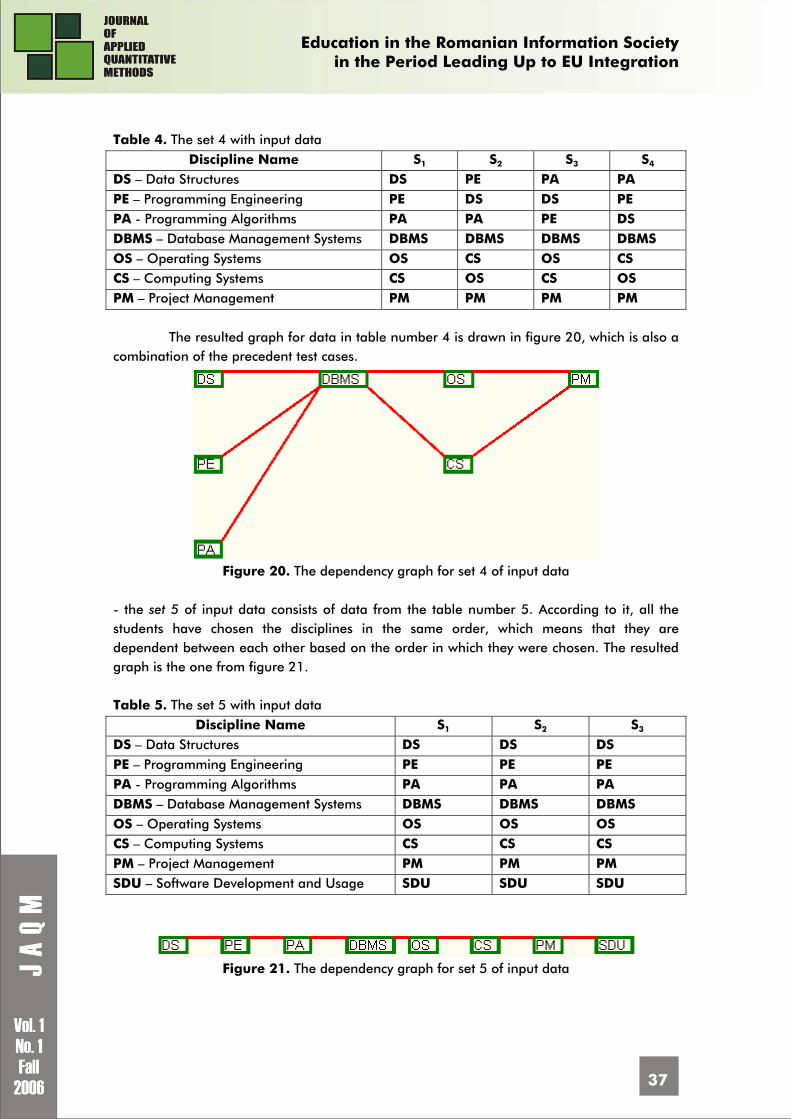
Education in the Romanian Information Society
in the Period Leading Up to EU Integration
37
Table 4. The set 4 with input data
Discipline Name S1 S2 S3 S4 DS – Data Structures DS PE PA PA PE – Programming Engineering PE DS DS PE PA - Programming Algorithms PA PA PE DS DBMS – Database Management Systems DBMS DBMS DBMS DBMS OS – Operating Systems OS CS OS CS CS – Computing Systems CS OS CS OS PM – Project Management PM PM PM PM
The resulted graph for data in table number 4 is drawn in figure 20, which is also a combination of the precedent test cases.
Figure 20. The dependency graph for set 4 of input data
- the set 5 of input data consists of data from the table number 5. According to it, all the students have chosen the disciplines in the same order, which means that they are dependent between each other based on the order in which they were chosen. The resulted graph is the one from figure 21. Table 5. The set 5 with input data
Discipline Name S1 S2 S3 DS – Data Structures DS DS DS PE – Programming Engineering PE PE PE PA - Programming Algorithms PA PA PA DBMS – Database Management Systems DBMS DBMS DBMS OS – Operating Systems OS OS OS CS – Computing Systems CS CS CS PM – Project Management PM PM PM SDU – Software Development and Usage SDU SDU SDU
Figure 21. The dependency graph for set 5 of input data
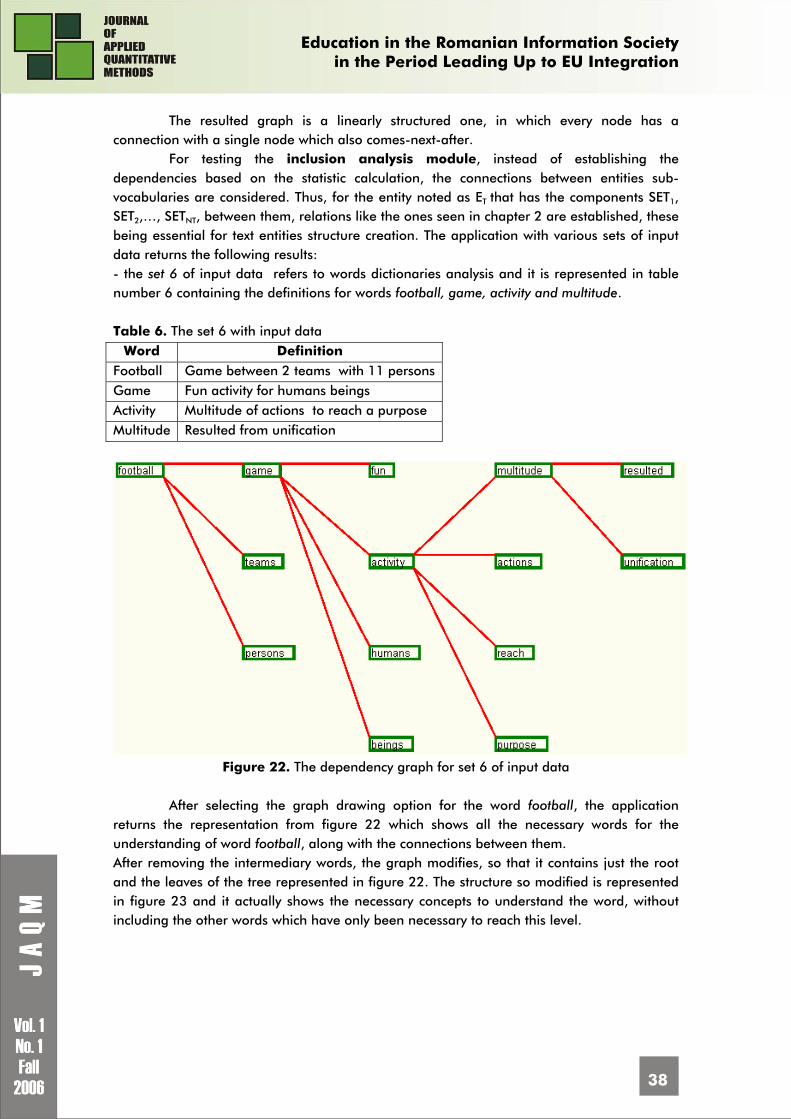
Education in the Romanian Information Society
in the Period Leading Up to EU Integration
38
The resulted graph is a linearly structured one, in which every node has a connection with a single node which also comes-next-after.
For testing the inclusion analysis module, instead of establishing the dependencies based on the statistic calculation, the connections between entities sub-vocabularies are considered. Thus, for the entity noted as ET that has the components SET1, SET2,…, SETNT, between them, relations like the ones seen in chapter 2 are established, these being essential for text entities structure creation. The application with various sets of input data returns the following results: - the set 6 of input data refers to words dictionaries analysis and it is represented in table number 6 containing the definitions for words football, game, activity and multitude. Table 6. The set 6 with input data
Word Definition Football Game between 2 teams with 11 persons Game Fun activity for humans beings Activity Multitude of actions to reach a purpose Multitude Resulted from unification
Figure 22. The dependency graph for set 6 of input data
After selecting the graph drawing option for the word football, the application
returns the representation from figure 22 which shows all the necessary words for the understanding of word football, along with the connections between them. After removing the intermediary words, the graph modifies, so that it contains just the root and the leaves of the tree represented in figure 22. The structure so modified is represented in figure 23 and it actually shows the necessary concepts to understand the word, without including the other words which have only been necessary to reach this level.
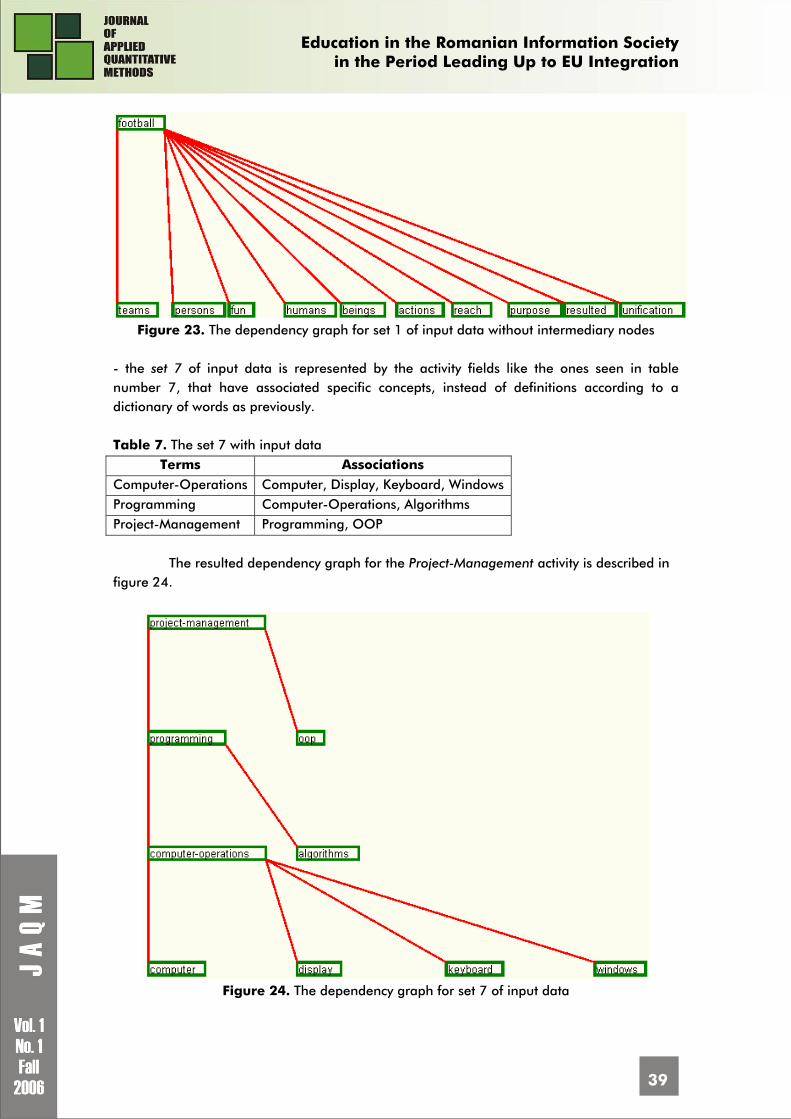
Education in the Romanian Information Society
in the Period Leading Up to EU Integration
39
Figure 23. The dependency graph for set 1 of input data without intermediary nodes
- the set 7 of input data is represented by the activity fields like the ones seen in table number 7, that have associated specific concepts, instead of definitions according to a dictionary of words as previously. Table 7. The set 7 with input data
Terms Associations Computer-Operations Computer, Display, Keyboard, Windows Programming Computer-Operations, Algorithms Project-Management Programming, OOP
The resulted dependency graph for the Project-Management activity is described in figure 24.
Figure 24. The dependency graph for set 7 of input data
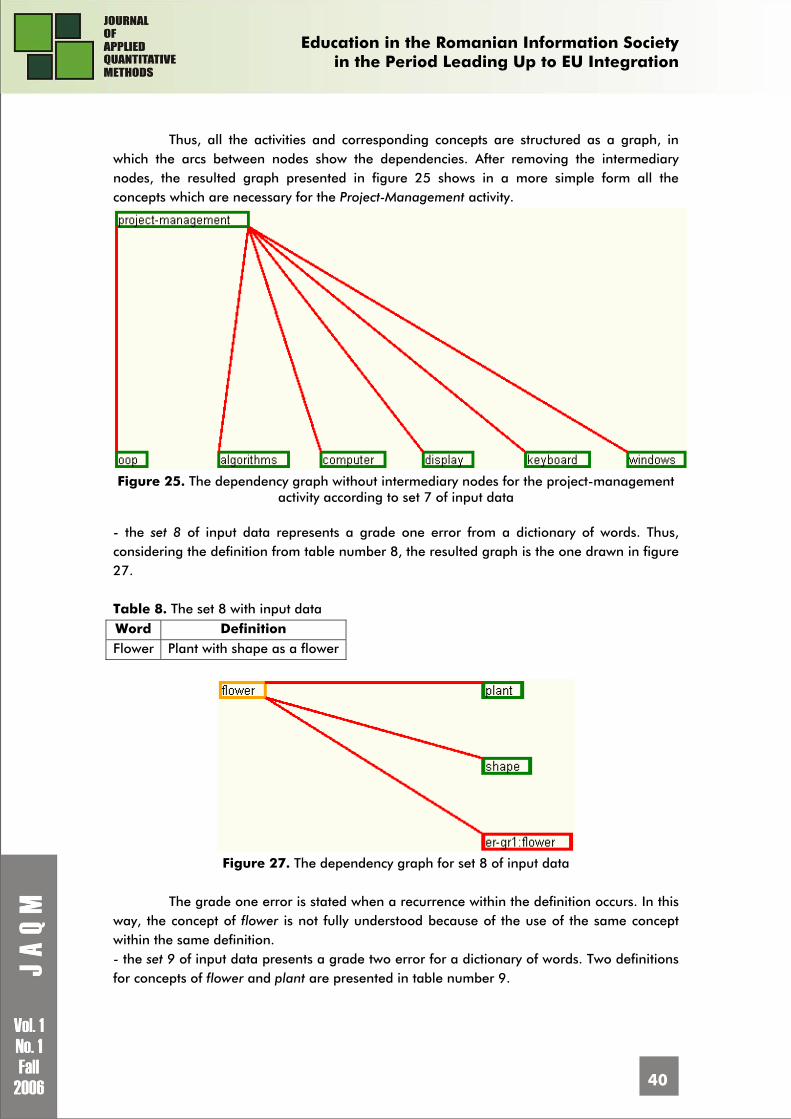
Education in the Romanian Information Society
in the Period Leading Up to EU Integration
40
Thus, all the activities and corresponding concepts are structured as a graph, in
which the arcs between nodes show the dependencies. After removing the intermediary nodes, the resulted graph presented in figure 25 shows in a more simple form all the concepts which are necessary for the Project-Management activity.
Figure 25. The dependency graph without intermediary nodes for the project-management
activity according to set 7 of input data - the set 8 of input data represents a grade one error from a dictionary of words. Thus, considering the definition from table number 8, the resulted graph is the one drawn in figure 27.
Table 8. The set 8 with input data Word Definition Flower Plant with shape as a flower
Figure 27. The dependency graph for set 8 of input data
The grade one error is stated when a recurrence within the definition occurs. In this
way, the concept of flower is not fully understood because of the use of the same concept within the same definition. - the set 9 of input data presents a grade two error for a dictionary of words. Two definitions for concepts of flower and plant are presented in table number 9.
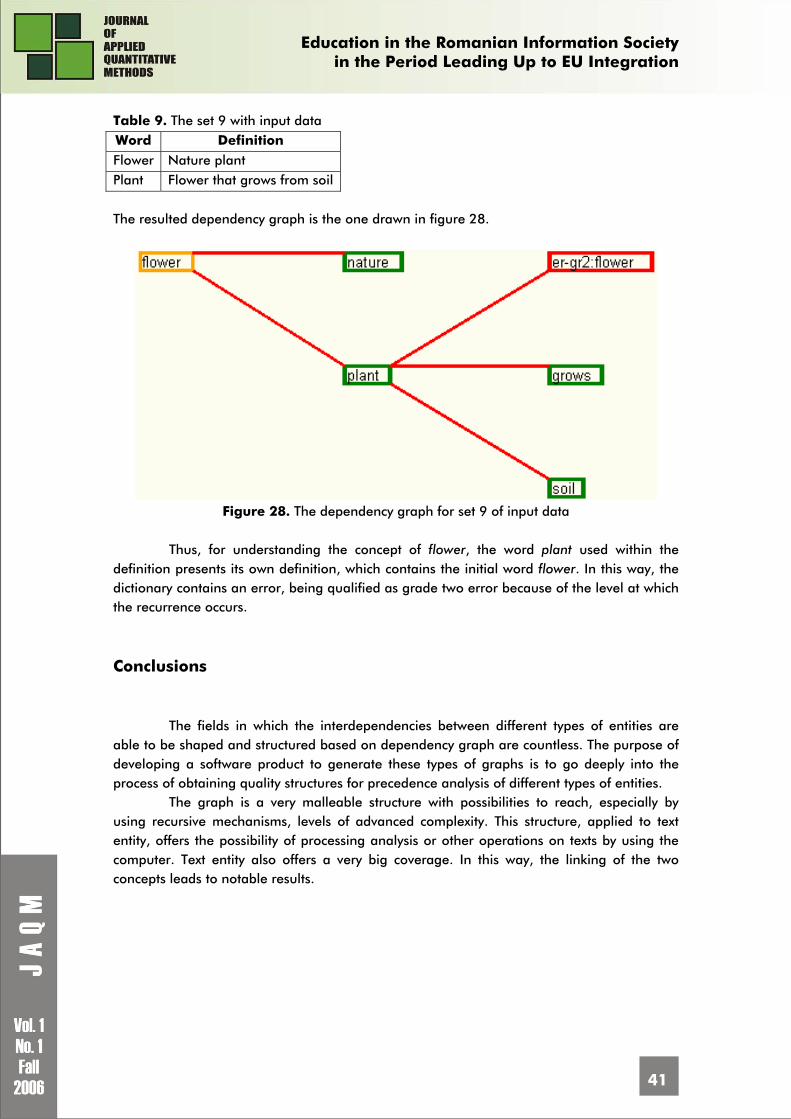
Education in the Romanian Information Society
in the Period Leading Up to EU Integration
41
Table 9. The set 9 with input data Word Definition Flower Nature plant Plant Flower that grows from soil The resulted dependency graph is the one drawn in figure 28.
Figure 28. The dependency graph for set 9 of input data
Thus, for understanding the concept of flower, the word plant used within the
definition presents its own definition, which contains the initial word flower. In this way, the dictionary contains an error, being qualified as grade two error because of the level at which the recurrence occurs.
Conclusions
The fields in which the interdependencies between different types of entities are
able to be shaped and structured based on dependency graph are countless. The purpose of developing a software product to generate these types of graphs is to go deeply into the process of obtaining quality structures for precedence analysis of different types of entities.
The graph is a very malleable structure with possibilities to reach, especially by using recursive mechanisms, levels of advanced complexity. This structure, applied to text entity, offers the possibility of processing analysis or other operations on texts by using the computer. Text entity also offers a very big coverage. In this way, the linking of the two concepts leads to notable results.
Education in the Romanian Information Society
in the Period Leading Up to EU Integration
42
Bibliography 1. Ion IVAN, Cătălin BOJA Metode statistice în analiza software, Bucharest, Publisher ASE, 2004 2. Ion IVAN, Dragoş ANASTASIU Structured Entities Structures Building, Workshop Information
Systems & Operations Systems Proceedings, 1 - 2 March 2006, Universul Juridic Printing House, Bucharest 2006, pp. 298 – 305
3. Ion IVAN, Marius POPA ENTITĂŢI TEXT, dezvoltare, evaluare, analiză, Publisher ASE, 2005, 587pg
4. Ion IVAN, Marius POPA Reprezentativitatea entităţilor text, work accepted at International Conference “The Impact of European Integration on the National Economy”, University “Babeş-Bolyai” Cluj-Napoca, 2005
5. Ion IVAN, Marius POPA Consistenţa entităţilor text, Studii si Cercetări de Calcul Economic şi Cibernetică Economică, 2005
6. Donald KNUTH The art of computing programming, Volume 1 7. Tom ARCHER, Andrew WHITECHAPEL Inside C# 8. Jesse Liberty Programming C#, Publisher O’Reilly, 2005
1 Dragos ANASTASIU is 24 years old. He graduated Academy of Economic Studies, Faculty of Cybernetics, Statistics and Economic Informatics, section Economic Informatics. He follows the Informatics Security master courses. He also carries on research in the field of text entities structures. He published an article in “Workshop Information Systems & Operations Systems Proceedings” regarding structured entities structures building. He programs using C++, C# and ASP.NET for web pages development. 2 Codification of references: [BOJIO04] Ion IVAN, Cătălin BOJA Metode statistice în analiza software, Bucharest, Publisher ASE, 2004 [IANA06] Ion IVAN, Dragoş ANASTASIU Structured Entities Structures Building, Workshop Information
Systems & Operations Systems Proceedings, 1 - 2 March 2006, Universul Juridic Printing House, Bucharest 2006, pp. 298 – 305
[IVAN05] Ion IVAN, Marius POPA ENTITĂŢI TEXT, dezvoltare, evaluare, analiză, Publisher ASE, 2005, 587pg
[IOPMA05] Ion IVAN, Marius POPA Reprezentativitatea entităţilor text, work accepted at International Conference “The Impact of European Integration on the National Economy”, University “Babeş-Bolyai” Cluj-Napoca, 2005
[IIVAN05] Ion IVAN, Marius POPA Consistenţa entităţilor text, Studii si Cercetări de Calcul Economic şi Cibernetică Economică, 2005
[KNUTH01] Donald KNUTH The art of computing programming, Volume 1 [MICRO02] Tom ARCHER, Andrew WHITECHAPEL Inside C# [LIBER01] Jesse Liberty Programming C#, Publisher O’Reilly, 2005
Education in the Romanian Information Society
in the Period Leading Up to EU Integration
43
THE INFLUENCE OF SOFTWARE COMPLEXITY ON THE MAINTENANCE EFFORT
- CASE STUDY ON SOFTWARE DEVELOPED WITHIN EDUCATIONAL PROCESS –
Iulian Ionut RADULESCU10 PhD candidate, Economic Informatics Department Academy of Economic Studies, Bucharest, Romania Published articles: Comparative analysis of the complexity of text entities generated using programming technique (co-author), ASE, Bucharest, 2006 Variations of software complexity for products developed using different programming techniques, Seventh International Conference on Informatics in Economy, Department of Informatics in Economy, ASE, May 2005. E-mail: [email protected]
Abstract: Software complexity is the most important software quality attribute and a very useful instrument in the study of software quality. Is one of the factors that affect most of the software quality characteristics, including maintainability. It is very important to quantity this influence and identify the means to keep it under control; by using quantitative methods for evaluating and analyzing it, this is possible. On the other hand, it can help in evaluating the students during education process. The complexity of the projects developed during the specialized courses, which have similar requirements, or even the same requirements, reveals students programming abilities, his know ledges about programming technique and help identifies the ones that try to cheat, by copying. Key words: software quality, software characteristics, software complexity, software maintainability, software measurement
The Complexity of Software Products
The major problem of software industry today is represented by the consequences of the extraordinary expansion of information technology, in all society areas, which now has become an information society. The attempt to model new domains of human activity has generated very complex software systems. Business domain complexity has generated complexity within the software product. New technologies have been developed to answer the new business requirements.
Software complexity is an extremely important element in software quality analysis. It influences the majority of software quality characteristics and, on the way it is controlled and monitored, depends the success of a software project.
Education in the Romanian Information Society
in the Period Leading Up to EU Integration
44
Software complexity has many aspects. Most of the times are present in the same time inside a software project, which makes it more difficult to have a pertinent analysis of the phenomenon.
The complexity related to the modelled business domain is called functional complexity or problem complexity. It is an inherited complexity from the business domain which cannot be decreased, but only controlled, in the sense of including or excluding complex functionalities from the final product. The problem complexity cannot be measured using quantitative measures.
Another type of complexity is the structural one. It is the easiest to understand and analyze, because it refers to the structure of the software product, to technical elements which makes it: modules, libraries, classes, functions. Structural complexity has the advantage to be measurable. There are numerous sets of metrics which analyze the design and the source code of a software product and offer useful information regarding their complexity. The disadvantage consists in the fact that this type of complexity is evaluated relatively later in the development cycle of a software product, within design and implementation phases.
The most difficult type to assess is cognitive complexity. It refers to the effort necessary for a programmer to understand the software product. It is highly related to the technical know ledges of the developer, to its personal abilities like wit, analytical thinking, and of course, to the structural complexity of the analyzed component. A quantitative analysis of this type of complexity is impossible to make, its nature is more psychological than technical.
Software Maintainability
A software product is not completed when all the requirements are implemented. After it is installed in real, production environments, and is used by the final users, the following situations appear:
• defects are discovered during execution in the production environments, more complex than the development and testing environments;
• the customer discovers, once is using the product that he also needs other functionalities to be implemented which become implementation requirements. These two major categories of possible situations appear during the maintenance
phase of the product. The costs associated with fixing these problems are distributed as follows:
• any defect is attributable to the software manufacturer so the costs are covered by him;
• any cost related to extensions of the functionality are covered by the customer; To minimize the costs, especially those related to defect correction, the developed
product should be easy to update, meaning: • should allow the isolation and easy correction of the defects, without major risks of
introducing new defects in the code; • should allow the addition of new functionalities, without affecting the existing ones.
The analysis of software maintainability should be done starting from the development phase, in order to minimize the future costs. Using specific metrics, it could be easily identified the components – classes, functions, modules – which can be, theoretically,
Education in the Romanian Information Society
in the Period Leading Up to EU Integration
45
hard to maintain and corrective actions can be taken in order to improve this. Is logic that a class, function or module, which is more complex, is also harder to maintain, so focus will be put on the components with high complexity. Although the relation between maintainability and complexity is obvious, is necessary to demonstrate these using quantitative methods and also to identify the type of correlation between the two.
Applied Software Metrics
In order to study software complexity, McCabe metric11, which describes the cyclomatic complexity, was chosen, for the following reasons:
• is independent from the programming language and is equally applicable, using different variations and extensions of it, to all important programming techniques: structured programming, modular programming, object-oriented programming or component-based programming;
• is offering an image of the structural complexity, of the source code, but also an image of the complexity of implemented algorithms, algorithms which are strongly connected to the functional complexity; in a way, this metric can also be used to describe, within some limits, the functional/algorithmic complexity of a software component. The indicator is based on the existence of a graph associated to any software
program, which is also called control flow graph. In such a graph, every node corresponds to a block of code from the source where the execution is sequential, and the arcs correspond to branches created because of the decision points or decision blocks. The graph has only one entry node and one exit node, and the exit node is accessible from any other node within the graph. In these conditions, the cyclomatic complexity or the cyclomatic number v(G) is calculated using the following formula:
V(G) = e – n + 2p where e is the number of arcs, n is the number of nodes, and p is the number of connected components. For a monolithic program or for a single function, the value of p is always 1, because there is only one component involved. When a function or a module contains calls to other functions, then all involved functions are considered connected components and the complexity of such a module is calculated using the relation:
∑=
=k
iiCvGv
1)()(
where Ci represents the connected component identified inside the module, including the module itself. So, if we have a module M which calls two functions A and B, then the cyclomatic complexity is given by the relation: v(M) + v(A) + v(B). The formula is applicable recursively, in case there is more than one level in function calling stack.
To simplify the things, in case we are dealing with monolithic programs or functions that do not call other functions, the cyclomatic complexity is calculates as follows:
V(G) = number of decisions inside the function or module or program + 1
Education in the Romanian Information Society
in the Period Leading Up to EU Integration
46
The number of decisions inside a function/program includes both the conditional constructions, like if…else.., switch..., and the repetitive ones: while, for…. It is also important to mention the fact that, in case the decision is compound (for example A AND B), it is actually counted as two decisions because, if the operator AND was missing, the sequence would transform in two decision blocks, respectively:
If ( A ) If ( B )
Although is relatively easy to determine the complexity, especially applying the last
formula which does not require the actual construction of the graph, the results are still obtained in the development phase. To minimize the risks in development process and to identify earlier the possible problems, is useful to obtain information about complexity as earlier as possible within the software development cycle, which means even starting with the analysis and design phases. For these, other metrics should be used, which are not in the scope of this article
Experimental Results
In order to apply the metrics and to analyze the results, a set of C programs were selected, with variable sizes, either monolithic or based on libraries of functions. The programs are developed by students of Faculty of Cybernetics, Statistics and Informatics Economics from Academy of Economic Studies Bucharest, for the Data Structures course.
The following elements were considered, during data collection process, which define the rules of selecting and recording the information:
• break statements were counted as executable statements, so they are part of NLOC indicator, measured at function/program level;
• if conditional or loop statements contains also assignment statements, like below: if ( ( f = fopen(„fisier.txt”,”r”) ) != null ) ...
then both the conditional statement (if in this case) and the assignment statement
are counted as executable statements;
• all declaration statements grouped on a single line, like in the example: int a,b,c were counted together, as a single line of code;
• if conditions are multiple, and contains the logical operator AND, then every condition is counted separately as decision point, when the cyclomatic complexity is measured. For example:
if (a && b )
is equivalent with
if ( a )
if ( b )
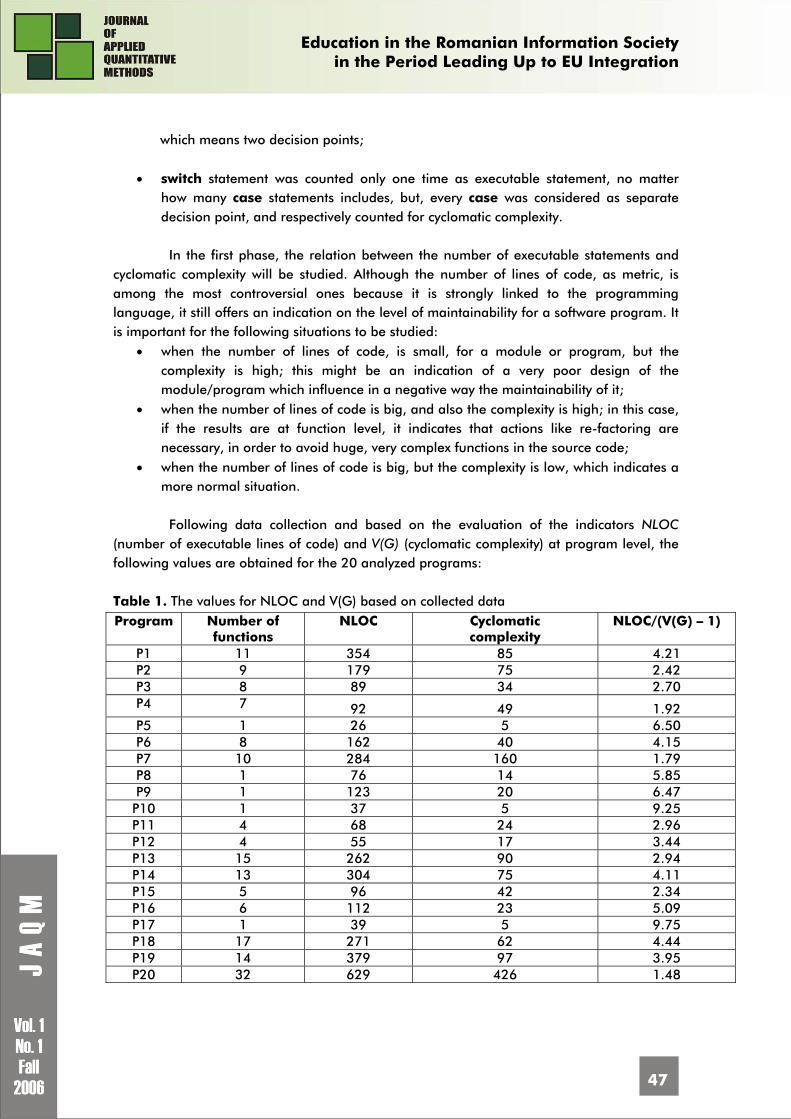
Education in the Romanian Information Society
in the Period Leading Up to EU Integration
47
which means two decision points;
• switch statement was counted only one time as executable statement, no matter how many case statements includes, but, every case was considered as separate decision point, and respectively counted for cyclomatic complexity.
In the first phase, the relation between the number of executable statements and
cyclomatic complexity will be studied. Although the number of lines of code, as metric, is among the most controversial ones because it is strongly linked to the programming language, it still offers an indication on the level of maintainability for a software program. It is important for the following situations to be studied:
• when the number of lines of code, is small, for a module or program, but the complexity is high; this might be an indication of a very poor design of the module/program which influence in a negative way the maintainability of it;
• when the number of lines of code is big, and also the complexity is high; in this case, if the results are at function level, it indicates that actions like re-factoring are necessary, in order to avoid huge, very complex functions in the source code;
• when the number of lines of code is big, but the complexity is low, which indicates a more normal situation.
Following data collection and based on the evaluation of the indicators NLOC
(number of executable lines of code) and V(G) (cyclomatic complexity) at program level, the following values are obtained for the 20 analyzed programs:
Table 1. The values for NLOC and V(G) based on collected data Program Number of
functions NLOC Cyclomatic
complexity NLOC/(V(G) – 1)
P1 11 354 85 4.21 P2 9 179 75 2.42 P3 8 89 34 2.70 P4 7 92 49 1.92 P5 1 26 5 6.50 P6 8 162 40 4.15 P7 10 284 160 1.79 P8 1 76 14 5.85 P9 1 123 20 6.47 P10 1 37 5 9.25 P11 4 68 24 2.96 P12 4 55 17 3.44 P13 15 262 90 2.94 P14 13 304 75 4.11 P15 5 96 42 2.34 P16 6 112 23 5.09 P17 1 39 5 9.75 P18 17 271 62 4.44 P19 14 379 97 3.95 P20 32 629 426 1.48
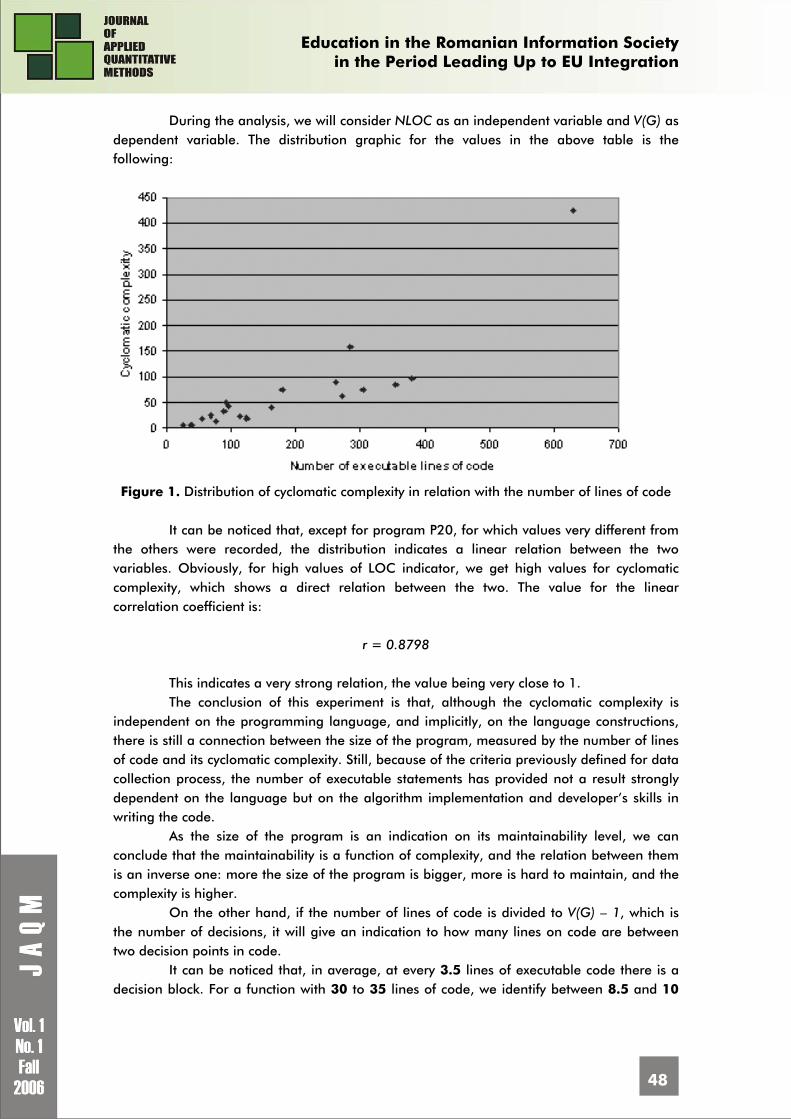
Education in the Romanian Information Society
in the Period Leading Up to EU Integration
48
During the analysis, we will consider NLOC as an independent variable and V(G) as dependent variable. The distribution graphic for the values in the above table is the following:
Figure 1. Distribution of cyclomatic complexity in relation with the number of lines of code
It can be noticed that, except for program P20, for which values very different from
the others were recorded, the distribution indicates a linear relation between the two variables. Obviously, for high values of LOC indicator, we get high values for cyclomatic complexity, which shows a direct relation between the two. The value for the linear correlation coefficient is:
r = 0.8798
This indicates a very strong relation, the value being very close to 1. The conclusion of this experiment is that, although the cyclomatic complexity is
independent on the programming language, and implicitly, on the language constructions, there is still a connection between the size of the program, measured by the number of lines of code and its cyclomatic complexity. Still, because of the criteria previously defined for data collection process, the number of executable statements has provided not a result strongly dependent on the language but on the algorithm implementation and developer’s skills in writing the code.
As the size of the program is an indication on its maintainability level, we can conclude that the maintainability is a function of complexity, and the relation between them is an inverse one: more the size of the program is bigger, more is hard to maintain, and the complexity is higher.
On the other hand, if the number of lines of code is divided to V(G) – 1, which is the number of decisions, it will give an indication to how many lines on code are between two decision points in code.
It can be noticed that, in average, at every 3.5 lines of executable code there is a decision block. For a function with 30 to 35 lines of code, we identify between 8.5 and 10
Education in the Romanian Information Society
in the Period Leading Up to EU Integration
49
decision blocks. This makes the number of possible execution paths significantly bigger and shows that the testing coverage for such a code cannot be 100%.
Student’s Evaluation based on the Quality Analysis of the Source Code
The analysis of the programs built by the students during the faculty courses, besides the fact that it serves to a better understanding of software quality and how software characteristics influence each other, it also serves in the actual evaluation of the students. So, having in mind that the project requirements have a similar functional complexity, the following situations should be tracked:
• significant variation of cyclomatic complexity between various projects; • significant variation of the size of source code between various projects; • modular design of the project: some projects are monolithic, others are based on
libraries of functions. In the program set chosen above, the followings have functional requirements with
close complexity: P1, P2, P6, P7, P9, P13, P14, P18, P19, P20. The others were chosen to be able to show how the relation between size of the sources and cyclomatic complexity evolves on a larger scale of values.
Analyzing the program subset mentioned above, it can be noticed that the values of the two metrics are quite different between projects because of:
• Attention paid to the graphical user interface; some students have preferred to go with a minimum interface for reading values and printing results, for the user. Others they went in more details, creating more professional user interfaces, though this was not a requirement in the project;
• The students ability to work more structured, creating reusable modules; • There is a certain homogeneity, regarding the indicator NLOC/(V(G) – 1), which
shows that, from the source code point of view, the average complexity is pretty much the same. On the other hand, if the requirements would have been the same for everybody,
the analysis above is useful to reveal the following aspects: • the uniqueness of the chosen solution; if the complexities are equal, the solutions
might be the identical or at least, there is a theoretical chance to be like that; • in case the solutions are completely different, from the complexity point of view, then
either some of the projects contains more elements than required, or the best solution was identified, or some of the requirements were not implemented.
Conclusions
Software complexity analysis and the way it influences the rest of software quality characteristics is very important to have a better control of the development process. Although it has the disadvantage that it cannot be used until later in the development cycle, when the code is written, the proposed metrics have still the advantage to capture several aspects and risks elements, which might affect product quality and can generate future supplementary costs. A product which is built to be easily maintained it produces minimum future costs.
Education in the Romanian Information Society
in the Period Leading Up to EU Integration
50
Also, the analysis of the complexity can serve as evaluation procedures for students or any participant to specialization courses. It can reveal information about student’s technical abilities, design and programming skills, even about personal characteristics.
Bibliography 1. Thomas J. McCabe A. Complexity Measure, IEEE Transactions on Software Engineering, VOL. SE-
2, No. 4, December 1976 2. Mary Shaw, Paul Luo Li, Jim Herbsleb Finding Predictors for Open Source Software Systems
in Commonly Available Data Sources: a Case Study for OpenBSD, Institute for Software Research International, School of Computer Science, Carnegie Mellon University, June 2005
3. V. Basili, D. Hutchens A Study of A Family of Structural Complexity Metrics, Proceedings of the ACM/NBS Nineteenth Annual Technical Symposium; “Pathways to System Integrity”, PP 13-16, June 1980
4. V. Basili Quantitative Software Complexity Models: A Panel Summary, Proceedings of the Workshop on “Quantitative Software Models for Reliability, Complexity, and Cost”, IEEE publication October 1979
5. Ion Ivan, Mihai Popescu, Panagiotis Sinioros, Felix Simion Metrici Software, Editura INFOREC, Bucureşti, 1997
6. Goutam Kuma Saha Beyond the Conventional Techniques of Software Fault Tolerance Ubiquity, Volume 4, Issue 47, Jan 28 – Feb 3 2004
10 Iulian Ionut Radulescu PhD candidate, Economics Informatics Department Academy of Economic Studies Bucharest, Romania Currently working at Intrasoft International S.A., leading company in providing software solutions for European Commission, as Senior Software Engineer/Technical Team Leader Main capabilities and skills: advanced programming in Java/J2EE (SUN Certified), advanced UML and object-oriented design, project management and team leading experience. Main published books and articles: - Comparative analysis of the complexity of text entities generated using programming technique - Iulian Radulescu, Ion Ivan, ASE, Bucharest, 2006. - Variations of software complexity for products developed using different programming techniques - Seventh International Conference on Informatics in Economy, Department of Informatics in Economy, ASE, May 2005. - Analysis of the correlation between software quality characteristics – SIMPEC Symphosium, Brasov, May 2006. 11 Thomas J. McCabe A. Complexity Measure, IEEE Transactions on Software Engineering, VOL. SE-2, No. 4, December 1976
Education in the Romanian Information Society
in the Period Leading Up to EU Integration
51
THE DEGREE OF USAGE OF SOFTWARE LICENSES IN SCHOOLS, HIGH-SCHOOLS AND UNIVERSITIES
Anrei TOMA1 PhD candidate, Economic Informatics Department Academy of Economic Studies, Bucharest, Romania E-mail: [email protected]
Gabriel IOAN System Engineer at Ministry of Education and Research, Bucharest, Romania Graduated of Faculty for Automation and Computer Science from Bucharest Polytechnic University E-mail: [email protected]
Abstract: The papers develop main aspects on the legal software usage in educational area. It will be propose indicators for measuring the degree of licences usage. Case studies are oriented to gymnasia stage. Key words: software licenses, education system, Romania, schools, high-schools, universities
1. Informatics and Education
The developments of Computer Science has had its impact on all areas of society, the educational fields notwithstanding. The appearance of new concepts, such as e-learning has raised the necessity of developing processes on informatics applications in schools, high-schools and universities.
Some directions of the process that can be identified are: • the acquisition of hardware equipment, such as computers and other devices; • the acquisition of software; • the development of training programs for teachers, students and pupils; • the supply of internet access at reduced cost;
For the accomplishment of the above mentioned objectives, important funds have been allocated.
For schools and high-schools, the SEI program has been developed. The program is planned to last from 2001 until 2008 and it is attempting to accomplish the task of having all lessons and laboratories conducted on computers for several disciplines.
Education in the Romanian Information Society
in the Period Leading Up to EU Integration
52
As for universities, there is an important number of investment programs with the goal of creating virtual university centres, on-line classes, on-line libraries etc.
2. Software and Software Licenses
The majority of schools, as well as high-schools are equipped with computer laboratories, which are using licensed software. The Romanian Government has constructed a favourable context for the use of software licenses for the most currently used software.
For example, in 2004 the Ministry of Education and Research has signed a contract for the free usage of:
• 50.000 software licenses for all learning institutions situated in districts; • 3200 laboratories are equipped with licensed software, out of which 1200 belong to
high-schools. In 2004 the contracting firm has offered, free of charge, 2500 software licenses to
the students whom had been granted money in the amount of Euro 200 for the acquisition of computers (a program through which the state stimulated the entry of computers in the students’ homes).
3. The Usage Degree of Software Licenses. A Theoretical Review
In order to analyse the efficiency of software license usage, one has to define a mathematical model with a set of indicators.
A software license has a predetermined (by the means of a contract) duration of usage N, where N stands for the duration expressed in years. The duration of the license can also be expressed in months as:
12×= ND (1) For the model’s presentation, a number of M districts where licences have been
distributed and a series of M numbers quantifying the number of licenses (L1,L2...LM), a series of maximum durations for the licenses (D1,D2...DM) as well as a series of M activation moments (T1,T2...TM), where by activation is understood the actual moment the licenses are put to use. We will also have a number of licenses for a certain district NL1,NL2...NLM, out of which only a portion have been installed. The number of installed licenses will be NIL1,NIL2...NILM
Taking into account that there are a number of licenses that are never installed, the degree of usage for a particular district will be:
i
i
NLNILUi = (2)
The total number of licences can be calculated as:
∑=
=M
iiNLNL
1 (3)
The total number of installed licences can be calculated as:
∑=
=M
iiNILNIL
1
(4)
The total usage degree will be:
Education in the Romanian Information Society
in the Period Leading Up to EU Integration
53
∑
∑
=
== M
ii
M
ii
NL
NILU
1
1 (5)
The duration of actual usage for a particular set of licenses is defined as:
iii TDDU −= (6)
The above formula is based on the fact that all the licenses in a set have the same maximum duration, as well as activation moments.
The degree in which a particular set of installed licenses were used (the simplest measurement to the efficiency of usage) is thus defined as:
i
ii D
DUPU = (7)
Thus, the total loss quotient will be:
∑
∑
=
=
×
×−= M
iii
M
iii
NLD
NILDUL
1
11 (8)
Out of this, the degree of loss generated by lack of usage is:
∑
∑
=
== M
ii
M
ii
NL
NILLU
1
1 (9)
while the degree of loss generated by partial usage is:
∑
∑
=
=
×
×−= M
iii
M
iii
NLD
NLDULP
1
11 (10)
Considering that the total cost of all the licenses is C, the monetary loss through lack of usage of the licenses will be:
CLML ×= (11)
The above model takes into account losses generated by delays in usage and losses
generated by total lack of usage. The above formulae will be applied in the next section on a short analysis of the
free distribution of licenses by the Romanian Ministry of Education and Research to its subordinated units.
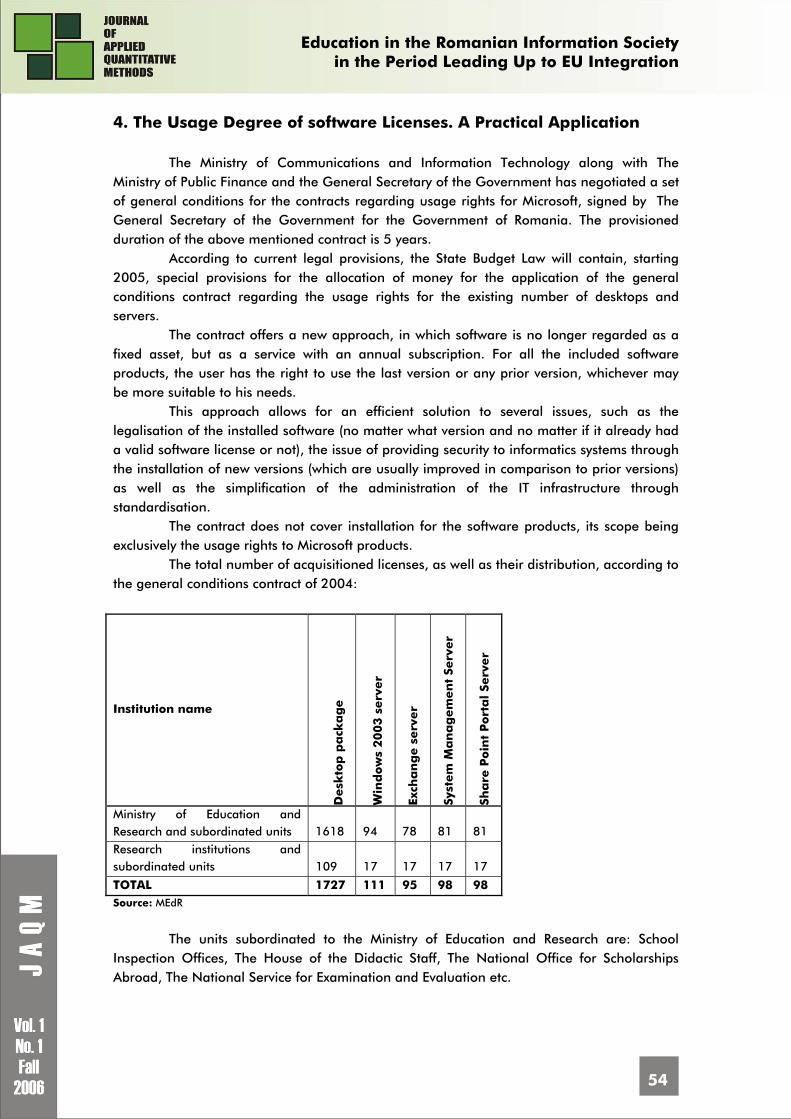
Education in the Romanian Information Society
in the Period Leading Up to EU Integration
54
4. The Usage Degree of software Licenses. A Practical Application
The Ministry of Communications and Information Technology along with The Ministry of Public Finance and the General Secretary of the Government has negotiated a set of general conditions for the contracts regarding usage rights for Microsoft, signed by The General Secretary of the Government for the Government of Romania. The provisioned duration of the above mentioned contract is 5 years.
According to current legal provisions, the State Budget Law will contain, starting 2005, special provisions for the allocation of money for the application of the general conditions contract regarding the usage rights for the existing number of desktops and servers.
The contract offers a new approach, in which software is no longer regarded as a fixed asset, but as a service with an annual subscription. For all the included software products, the user has the right to use the last version or any prior version, whichever may be more suitable to his needs.
This approach allows for an efficient solution to several issues, such as the legalisation of the installed software (no matter what version and no matter if it already had a valid software license or not), the issue of providing security to informatics systems through the installation of new versions (which are usually improved in comparison to prior versions) as well as the simplification of the administration of the IT infrastructure through standardisation.
The contract does not cover installation for the software products, its scope being exclusively the usage rights to Microsoft products.
The total number of acquisitioned licenses, as well as their distribution, according to the general conditions contract of 2004:
Institution name
Desk
top
pa
cka
ge
Win
dow
s 2
003
serv
er
Exch
an
ge s
erv
er
Syst
em
Ma
na
gem
en
t Se
rver
Sha
re P
oin
t P
ort
al Se
rver
Ministry of Education and Research and subordinated units 1618 94 78 81 81 Research institutions and subordinated units 109 17 17 17 17
TOTAL 1727 111 95 98 98 Source: MEdR
The units subordinated to the Ministry of Education and Research are: School
Inspection Offices, The House of the Didactic Staff, The National Office for Scholarships Abroad, The National Service for Examination and Evaluation etc.
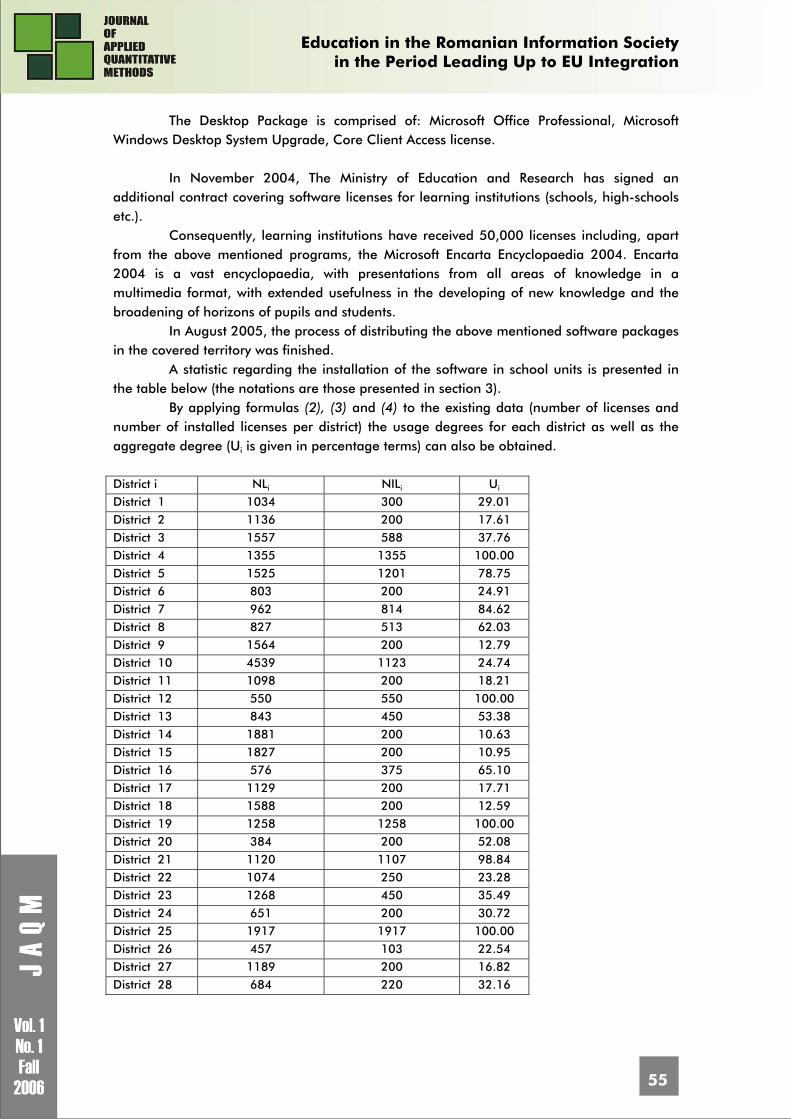
Education in the Romanian Information Society
in the Period Leading Up to EU Integration
55
The Desktop Package is comprised of: Microsoft Office Professional, Microsoft Windows Desktop System Upgrade, Core Client Access license.
In November 2004, The Ministry of Education and Research has signed an additional contract covering software licenses for learning institutions (schools, high-schools etc.).
Consequently, learning institutions have received 50,000 licenses including, apart from the above mentioned programs, the Microsoft Encarta Encyclopaedia 2004. Encarta 2004 is a vast encyclopaedia, with presentations from all areas of knowledge in a multimedia format, with extended usefulness in the developing of new knowledge and the broadening of horizons of pupils and students.
In August 2005, the process of distributing the above mentioned software packages in the covered territory was finished.
A statistic regarding the installation of the software in school units is presented in the table below (the notations are those presented in section 3).
By applying formulas (2), (3) and (4) to the existing data (number of licenses and number of installed licenses per district) the usage degrees for each district as well as the aggregate degree (Ui is given in percentage terms) can also be obtained. District i NLi NILi Ui District 1 1034 300 29.01 District 2 1136 200 17.61 District 3 1557 588 37.76 District 4 1355 1355 100.00
District 5 1525 1201 78.75 District 6 803 200 24.91 District 7 962 814 84.62 District 8 827 513 62.03 District 9 1564 200 12.79 District 10 4539 1123 24.74 District 11 1098 200 18.21 District 12 550 550 100.00 District 13 843 450 53.38
District 14 1881 200 10.63 District 15 1827 200 10.95 District 16 576 375 65.10 District 17 1129 200 17.71 District 18 1588 200 12.59 District 19 1258 1258 100.00 District 20 384 200 52.08 District 21 1120 1107 98.84 District 22 1074 250 23.28 District 23 1268 450 35.49
District 24 651 200 30.72 District 25 1917 1917 100.00 District 26 457 103 22.54 District 27 1189 200 16.82 District 28 684 220 32.16
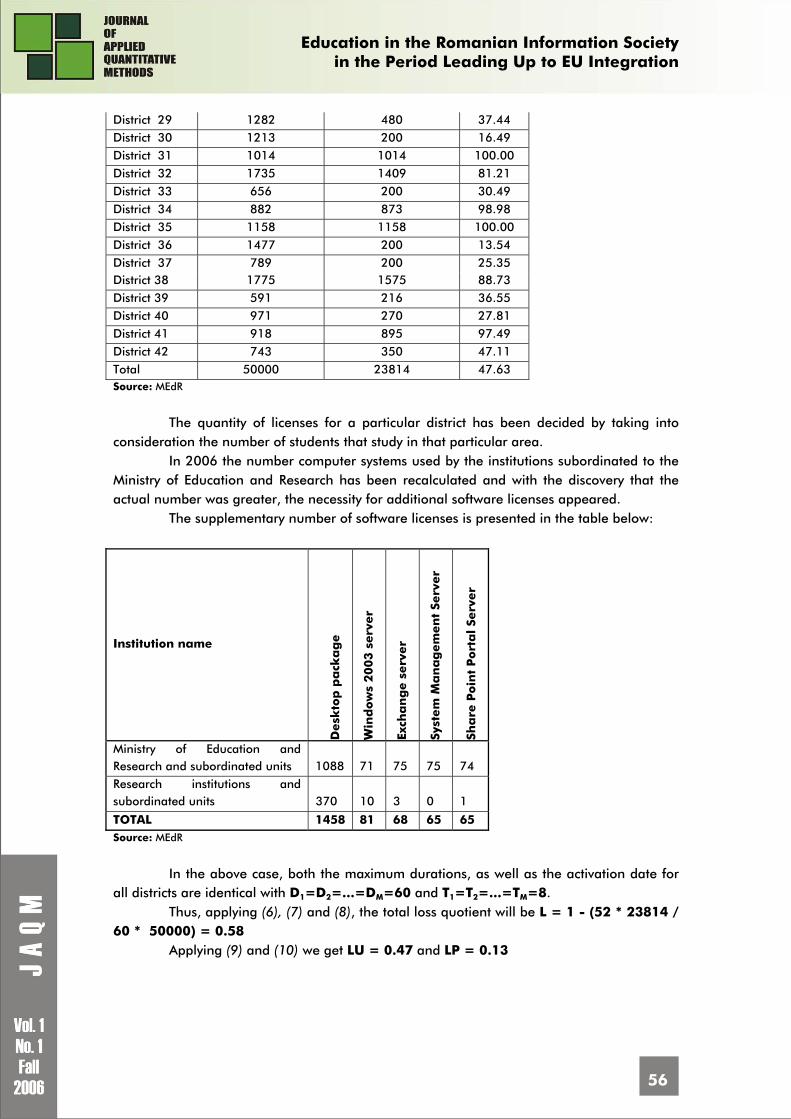
Education in the Romanian Information Society
in the Period Leading Up to EU Integration
56
District 29 1282 480 37.44 District 30 1213 200 16.49 District 31 1014 1014 100.00 District 32 1735 1409 81.21
District 33 656 200 30.49 District 34 882 873 98.98 District 35 1158 1158 100.00 District 36 1477 200 13.54 District 37 789 200 25.35 District 38 1775 1575 88.73 District 39 591 216 36.55 District 40 971 270 27.81 District 41 918 895 97.49 District 42 743 350 47.11 Total 50000 23814 47.63 Source: MEdR
The quantity of licenses for a particular district has been decided by taking into
consideration the number of students that study in that particular area. In 2006 the number computer systems used by the institutions subordinated to the
Ministry of Education and Research has been recalculated and with the discovery that the actual number was greater, the necessity for additional software licenses appeared.
The supplementary number of software licenses is presented in the table below:
Institution name
Desk
top
pa
cka
ge
Win
dow
s 2
003
serv
er
Exch
an
ge s
erv
er
Syst
em
Ma
na
gem
en
t Se
rver
Sha
re P
oin
t P
ort
al Se
rver
Ministry of Education and Research and subordinated units 1088 71 75 75 74 Research institutions and subordinated units 370 10 3 0 1
TOTAL 1458 81 68 65 65 Source: MEdR
In the above case, both the maximum durations, as well as the activation date for
all districts are identical with D1=D2=...=DM=60 and T1=T2=...=TM=8. Thus, applying (6), (7) and (8), the total loss quotient will be L = 1 - (52 * 23814 /
60 * 50000) = 0.58 Applying (9) and (10) we get LU = 0.47 and LP = 0.13
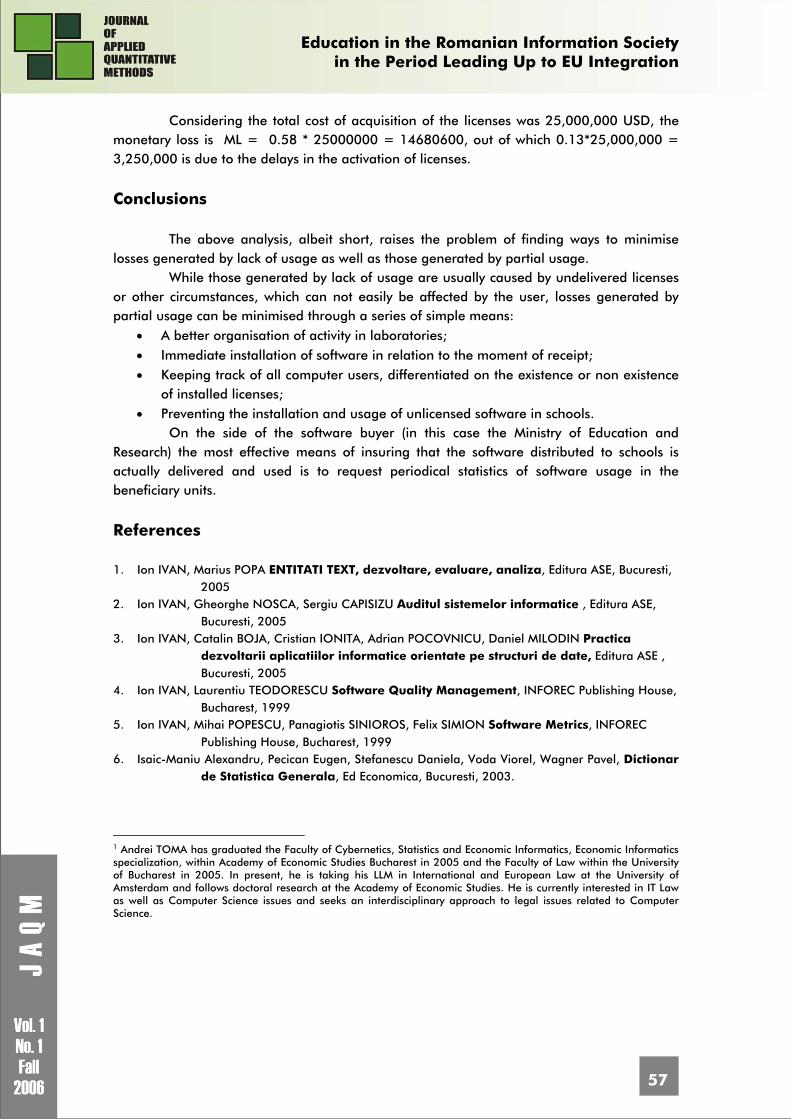
Education in the Romanian Information Society
in the Period Leading Up to EU Integration
57
Considering the total cost of acquisition of the licenses was 25,000,000 USD, the monetary loss is ML = 0.58 * 25000000 = 14680600, out of which 0.13*25,000,000 = 3,250,000 is due to the delays in the activation of licenses.
Conclusions
The above analysis, albeit short, raises the problem of finding ways to minimise losses generated by lack of usage as well as those generated by partial usage.
While those generated by lack of usage are usually caused by undelivered licenses or other circumstances, which can not easily be affected by the user, losses generated by partial usage can be minimised through a series of simple means:
• A better organisation of activity in laboratories; • Immediate installation of software in relation to the moment of receipt; • Keeping track of all computer users, differentiated on the existence or non existence
of installed licenses; • Preventing the installation and usage of unlicensed software in schools.
On the side of the software buyer (in this case the Ministry of Education and Research) the most effective means of insuring that the software distributed to schools is actually delivered and used is to request periodical statistics of software usage in the beneficiary units.
References 1. Ion IVAN, Marius POPA ENTITATI TEXT, dezvoltare, evaluare, analiza, Editura ASE, Bucuresti,
2005 2. Ion IVAN, Gheorghe NOSCA, Sergiu CAPISIZU Auditul sistemelor informatice , Editura ASE,
Bucuresti, 2005 3. Ion IVAN, Catalin BOJA, Cristian IONITA, Adrian POCOVNICU, Daniel MILODIN Practica
dezvoltarii aplicatiilor informatice orientate pe structuri de date, Editura ASE , Bucuresti, 2005
4. Ion IVAN, Laurentiu TEODORESCU Software Quality Management, INFOREC Publishing House, Bucharest, 1999
5. Ion IVAN, Mihai POPESCU, Panagiotis SINIOROS, Felix SIMION Software Metrics, INFOREC Publishing House, Bucharest, 1999
6. Isaic-Maniu Alexandru, Pecican Eugen, Stefanescu Daniela, Voda Viorel, Wagner Pavel, Dictionar de Statistica Generala, Ed Economica, Bucuresti, 2003.
1 Andrei TOMA has graduated the Faculty of Cybernetics, Statistics and Economic Informatics, Economic Informatics specialization, within Academy of Economic Studies Bucharest in 2005 and the Faculty of Law within the University of Bucharest in 2005. In present, he is taking his LLM in International and European Law at the University of Amsterdam and follows doctoral research at the Academy of Economic Studies. He is currently interested in IT Law as well as Computer Science issues and seeks an interdisciplinary approach to legal issues related to Computer Science.
Education in the Romanian Information Society
in the Period Leading Up to EU Integration
58
THE AUDIT OF THE INFORMATION TECHNOLOGIES & COMMUNICATION PROJECTS DEVELOPED BY STUDENTS
Sergiu CAPISIZU PhD, Association for Development through Science and Education, Bucharest, Romania E-mail: [email protected]
Gheorghe NOSCA1 PhD, Association for Development through Science and Education, Bucharest, Romania E-mail: [email protected]
Adriean PARLOG2 PhD, Defence National University, Bucharest, Romania E-mail: [email protected]
Abstract: The modern world is undergoing a fundamental transformation characterized by a lot of challenges, dynamism, globalization, and the increasing influence of Information and Communication Technologies (ICTs). These new technologies have implications for all aspects of the society and economy; they are changing the way of doing business, the way of learning, and almost everything is changed. The ICTs are seen as one of the core elements driving the modern world. Taken into consideration these aspects the universities has adept their curricula to the society’ needs, and the students develop ITC projects that solve some these needs. This paper refers to the audit of the ITC projects developed by students. Key words: ITC project, informatics audit, software audit, data audit, SME.
Business Informatics Speciality
The Business Informatics speciality’s goal is to train specialists in the applied informatics in economics and oriented to the business. In Romania, there is a tradition in this area since 1964 when the faculty was established. Having in view the Information Society challenges The Business Informatics Department has permanently adapted its curricula to the society’s needs. Nowadays is a very high demand for analysts, programmers, web designers, testers, and developers.
The Business Informatics Speciality economics train in domains such are Information Technoligie&Communication, economics informatics, micro- and macro-
Education in the Romanian Information Society
in the Period Leading Up to EU Integration
59
economics statistical analysis informatization, mathematical models for banking and insurance systems, economical modelling and forecasting. In the Business Informatics Department, the theory and practical activities are harmonized in order to train students in the modern programming languages like PASCAL, DELPHI, C, C++, PROLOG, JAVA, operating systems like UNIX, NOVEL, WINDOWS, data bases management systems ORACLE, SQL, ACCESS, the analysis and designing methodologies MERISE, OMT, UML. There are, also, presented Web technologies for developing E-Business distributed application development.
The statistical data published by international institutions shows that the role of Small and Medium Enterprises in the economy is more and more important. This trend is not only determined by the SMEs characteristics, but also by the whole world economic environment evolutions. These two elements define SMEs as the main economic development determinant in the upcoming period. Romania’s integration in EU opens large development perspectives in all the sectors of the social-economic life. The Romanian companies, irrespective their size will be in an everlasting competition with those from EU. The competition will be also felt on all the markets approached by the Romanian companies. Like the SMEs from the EU member states, the SMEs have an important role in the Romanian economy.
Having in view the enormous scientific potential within universities framework it is imperious necessary to improve the link between universities and SMEs. One way is to develop IT&C projects by the master students and post graduate students that will be implemented in SMEs in order to help them to stay on the market.
Information Technologie&Communication Projects
The IT&C projects are very complex construction. The collaboration between user and developer is very important for developing a successful product. To develop an IT&C project means, first of all, to set out the goal.
The TIC projects main characteristics are: structurability, clarity, consistence, completeness, complexity, and correctness.
The structurability is a quality characteristic that give the possibility to track the parts of the project that define the requirements imposed by program.
The clarity is given by the use in chapter Ci of key words that are included in the project priority list, and by introducing key words for chapter Ci . The chapter Ci uses key words from previous chapters, and does not use indefinite key words. The clarity supposes an acronyms list, a glossary containing definition of processes, materials, products, phenomena, measurement units, in order to eliminate the ambiguities.
Consistency means the existence of the all components. This quality characteristic gives the value to the project in the evaluating process.
Completeness is given by the approaching the text like a three structure. There are situations when the completeness is affected by:
- defining a list consisting of my components, and developing the texts that refer to sy components, sy < my; the missing of ny descriptions, ny = my – sy, rise some questions regarding the developer’s capacity to manage the project; for example seven activities are defined, and only five are described ;
Education in the Romanian Information Society
in the Period Leading Up to EU Integration
60
- the number of detailed elements is higher then the specified number; for example the resources and activities lists contain eight elements, and 10 elements are described;
- the elements missing in the enumerative list and in description; these elements are necessary to develop the project; for example, in the project is not specified the equipment, and the testing phase is, also, not specified;
- some phases of the developing cycle are not included in documentation; - the necessary column missing in the tables; for example in a table regarding the
salaries, are missing the work time and the salary/hour; Ortogonality is used to analyze the texts of two chapters. Two chapters Ci and Cj
are orthogonal if their texts have not identical elements. Complexity is given by the diversity of the activities, resources, models,
technologies, types of considered factors. Usually the complexity is given by comparison. A project P0, chosen according to frequency criterion, called a unit project, is considered as reference model, and the other projects are compared with P0. The choice is relative because the complexity has a dynamic character. It is changing in time that means to change the reference value.
The project correctness is given by the concordance between the accepted texts and the basic elements of the sponsored domain. The correctness refers to the denomination of processes, technologies, operations, to the using of concepts, to the presentation of models, and to the signification of the variables. There is a strong connection between correctness and the logic way of scheduling the activities, the level of consumption of resources, and the made estimations. The communication process is, also, directly influencing the project correctness.
The informatics solutions audit
The IT&C projects developed by the students are audited both as a whole, and, also, the main parts of projects are separately audited. That means the software audit and the data audit. This way gives a guarantee that a project meets requirements and can be implemented.
The Informatics Audit is an essential activity for verifying weather an Information System is capable to achieve the expected objective. The domain, stages, content and methods of the informatics audit are specified by standards. The informatics audit domain includes auditing activities for specifications, projects, software, databases, the software life cycle specifics activities, and informatics applications, Information Systems for Management, complex portals and virtual organization.
The Informatics Audit addresses an Information Systems as a whole, taking into consideration data, as in-puts, software, and outcomes as data processed according to the organization’ needs.
The IS Audit includes the activities to collect and evaluate some samples in order to establish weather the IS is secure, maintains the processed date integrity, support the organization to achieve its strategically objectives and efficiently uses the informational resources.
The most frequently activities during the Informatics Audit are the verification and evaluation of: risks, system control, hardware components, system management, informatics
Education in the Romanian Information Society
in the Period Leading Up to EU Integration
61
applications, computers network security, plans and procedure for emergent situations and for recovering in disasters case, data integrity.
The software audit main objective is to evaluate the degree of concordance between specifications and the software products.
The data audit has in view the data quality requirements such are: completeness, accuracy, homogeneity, comprehensibility, timeless, reproducibility. The auditor certifies if data set are valuable in-puts for applications in order to obtain correct outcomes.
An informatics audit has four phases: planning and preparation, the fieldwork visit, reporting, and follow-up. During the planning and preparation phase, the auditor gains an understanding of the project. Based on the scope of the audit, the auditor determines the specific questions that need to be answered, as well as the persons to be interviewed and the records and products to be examined to answer the questions. The interviews are conducted, and records and products are examined during the fieldwork.
The reporting phase consists of the exit debriefing of the audited project, the preparation of a written report on the audit, and clarifying issues and providing related information as needed. Follow-up is done by the project, as the problems and deficiencies found in the audit are remedied. Follow-up may include re-auditing to assess the adequacy of the remedies.
The activities conducted during the phases vary depending on the life cycle phase of the project being audited and the scope of the audit. The activities also vary depending on whether the audit is external or internal; an external audit requires preparation that is more extensive and should examine a more comprehensive sample of material than an internal audit.
Information system audit is increasingly becoming the focal point of the independent audit, compliance audit, and operational audits. An information system audit assists an organization to:
- improve system and process controls - prevent and detect errors and fraud; - reduce risk and enhance system security ; - plan for contingencies and disaster recovery ; - manage information and developing systems ; - valuating the effectiveness and efficiency related to the use of resources.
The Audit Informatics must be planned in such way in order to obtain the expected results by both the auditors and the audited organization. Planning the audit, the auditor must to understand the IS, and its complexity.
The source texts (cod lines) audit
To audit a software means, first of all, to audit the source text. After auditing the source text the software project is analyzed, compiled, linked and launched in execution. After these activities the software is audited as the final product.
The main objective of the audit on the text source is to analyze the way the test data has been introduced, the procedures that has been activated and to evaluate the data processing completeness. This audit finds the weak points of the source text and the unnecessary definition, without giving any solution.
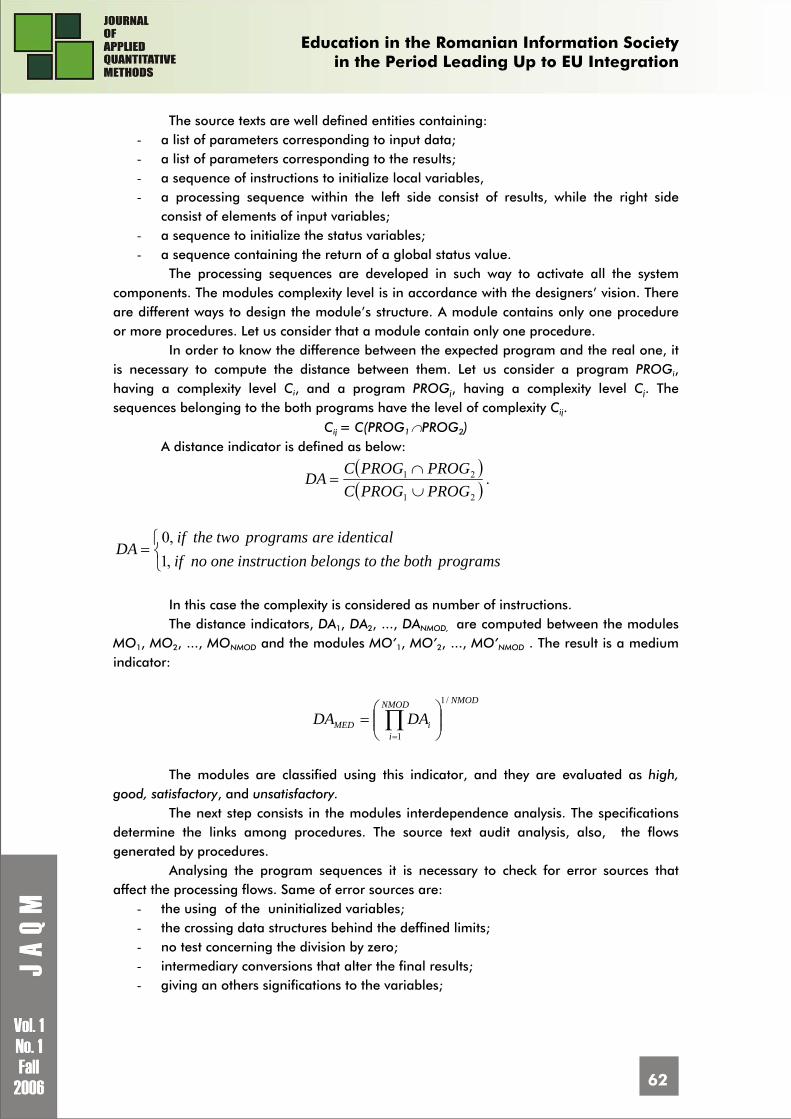
Education in the Romanian Information Society
in the Period Leading Up to EU Integration
62
The source texts are well defined entities containing: - a list of parameters corresponding to input data; - a list of parameters corresponding to the results; - a sequence of instructions to initialize local variables, - a processing sequence within the left side consist of results, while the right side
consist of elements of input variables; - a sequence to initialize the status variables; - a sequence containing the return of a global status value.
The processing sequences are developed in such way to activate all the system components. The modules complexity level is in accordance with the designers’ vision. There are different ways to design the module’s structure. A module contains only one procedure or more procedures. Let us consider that a module contain only one procedure.
In order to know the difference between the expected program and the real one, it is necessary to compute the distance between them. Let us consider a program PROGi, having a complexity level Ci, and a program PROGj, having a complexity level Cj. The sequences belonging to the both programs have the level of complexity Cij.
Cij = C(PROG1 ∩PROG2) A distance indicator is defined as below:
( )( )21
21
PROGPROGCPROGPROGCDA
∪∩
= .
⎩⎨⎧
=programsboththetobelongsninstructioonenoif
identicalareprogramstwotheifDA
,1,0
In this case the complexity is considered as number of instructions. The distance indicators, DA1, DA2, ..., DANMOD, are computed between the modules
MO1, MO2, ..., MONMOD and the modules MO’1, MO’2, ..., MO’NMOD . The result is a medium indicator:
NMODNMOD
iiMED DADA
/1
1⎟⎟⎠
⎞⎜⎜⎝
⎛= ∏
=
The modules are classified using this indicator, and they are evaluated as high,
good, satisfactory, and unsatisfactory. The next step consists in the modules interdependence analysis. The specifications
determine the links among procedures. The source text audit analysis, also, the flows generated by procedures.
Analysing the program sequences it is necessary to check for error sources that affect the processing flows. Same of error sources are:
- the using of the uninitialized variables; - the crossing data structures behind the deffined limits; - no test concerning the division by zero; - intermediary conversions that alter the final results; - giving an others significations to the variables;
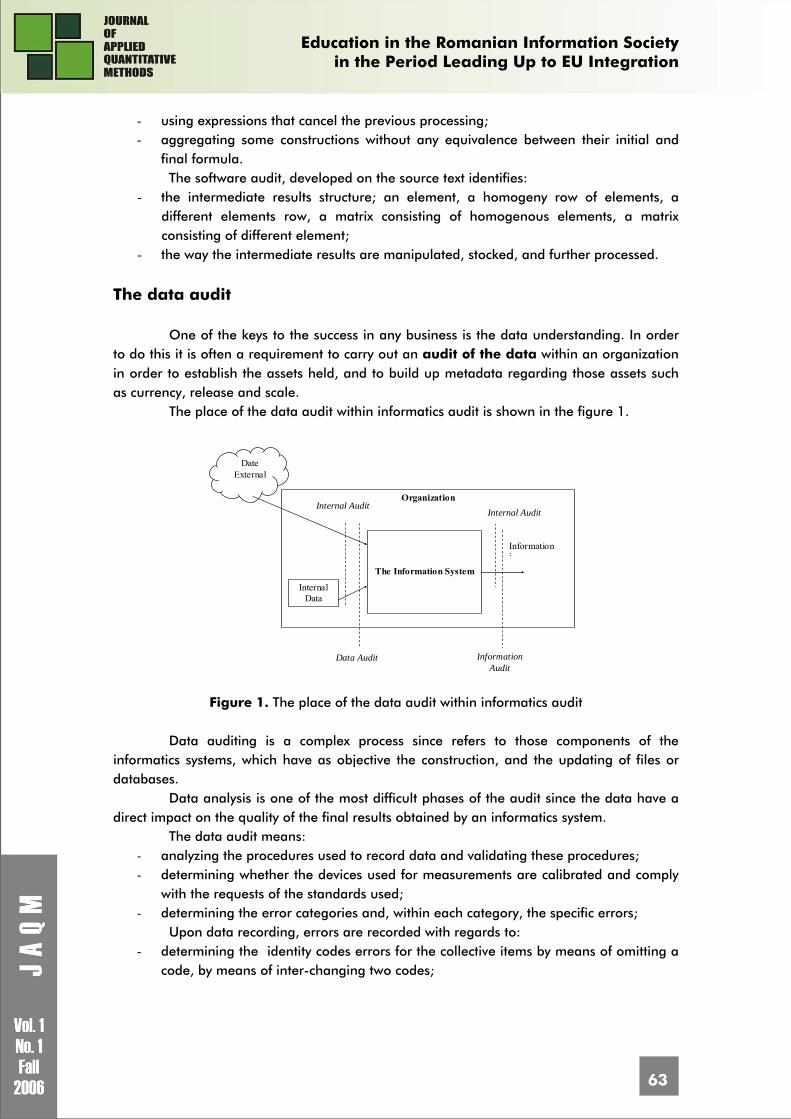
Education in the Romanian Information Society
in the Period Leading Up to EU Integration
63
- using expressions that cancel the previous processing; - aggregating some constructions without any equivalence between their initial and
final formula. The software audit, developed on the source text identifies:
- the intermediate results structure; an element, a homogeny row of elements, a different elements row, a matrix consisting of homogenous elements, a matrix consisting of different element;
- the way the intermediate results are manipulated, stocked, and further processed.
The data audit
One of the keys to the success in any business is the data understanding. In order to do this it is often a requirement to carry out an audit of the data within an organization in order to establish the assets held, and to build up metadata regarding those assets such as currency, release and scale.
The place of the data audit within informatics audit is shown in the figure 1.
Date External
Organization
Internal Data
The Information System
Data Audit
Informationi
Information Audit
Internal Audit Internal Audit
Figure 1. The place of the data audit within informatics audit
Data auditing is a complex process since refers to those components of the
informatics systems, which have as objective the construction, and the updating of files or databases.
Data analysis is one of the most difficult phases of the audit since the data have a direct impact on the quality of the final results obtained by an informatics system.
The data audit means: - analyzing the procedures used to record data and validating these procedures; - determining whether the devices used for measurements are calibrated and comply
with the requests of the standards used; - determining the error categories and, within each category, the specific errors;
Upon data recording, errors are recorded with regards to: - determining the identity codes errors for the collective items by means of omitting a
code, by means of inter-changing two codes;
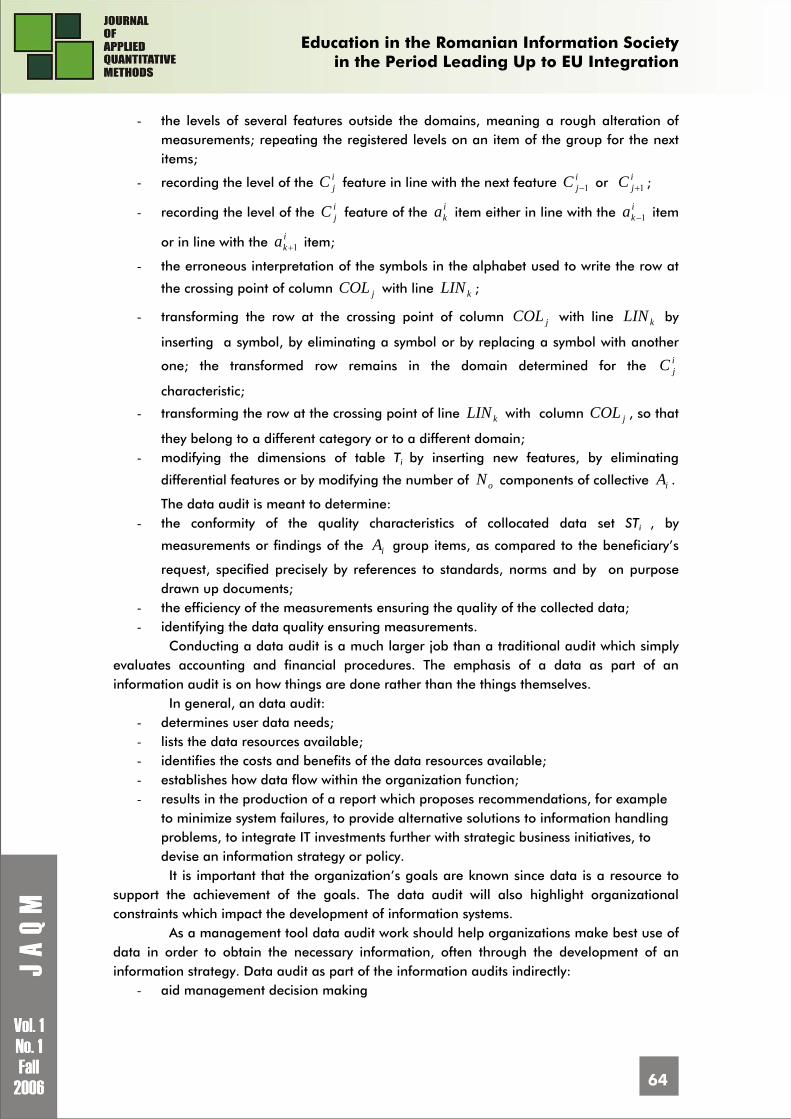
Education in the Romanian Information Society
in the Period Leading Up to EU Integration
64
- the levels of several features outside the domains, meaning a rough alteration of measurements; repeating the registered levels on an item of the group for the next items;
- recording the level of the ijC feature in line with the next feature i
jC 1− or ijC 1+ ;
- recording the level of the ijC feature of the i
ka item either in line with the ika 1− item
or in line with the ika 1+ item;
- the erroneous interpretation of the symbols in the alphabet used to write the row at
the crossing point of column jCOL with line kLIN ;
- transforming the row at the crossing point of column jCOL with line kLIN by
inserting a symbol, by eliminating a symbol or by replacing a symbol with another
one; the transformed row remains in the domain determined for the ijC
characteristic;
- transforming the row at the crossing point of line kLIN with column jCOL , so that
they belong to a different category or to a different domain; - modifying the dimensions of table Ti by inserting new features, by eliminating
differential features or by modifying the number of oN components of collective iA .
The data audit is meant to determine: - the conformity of the quality characteristics of collocated data set STi , by
measurements or findings of the iA group items, as compared to the beneficiary’s
request, specified precisely by references to standards, norms and by on purpose drawn up documents;
- the efficiency of the measurements ensuring the quality of the collected data; - identifying the data quality ensuring measurements.
Conducting a data audit is a much larger job than a traditional audit which simply evaluates accounting and financial procedures. The emphasis of a data as part of an information audit is on how things are done rather than the things themselves.
In general, an data audit: - determines user data needs; - lists the data resources available; - identifies the costs and benefits of the data resources available; - establishes how data flow within the organization function; - results in the production of a report which proposes recommendations, for example
to minimize system failures, to provide alternative solutions to information handling problems, to integrate IT investments further with strategic business initiatives, to devise an information strategy or policy. It is important that the organization’s goals are known since data is a resource to
support the achievement of the goals. The data audit will also highlight organizational constraints which impact the development of information systems.
As a management tool data audit work should help organizations make best use of data in order to obtain the necessary information, often through the development of an information strategy. Data audit as part of the information audits indirectly:
- aid management decision making
Education in the Romanian Information Society
in the Period Leading Up to EU Integration
65
- support and encourage competitive advantage - enable organizations to adapt and change - facilitate organizational communication - encourage use of, and investment in, IT - contribute to the value of manufactured products
In order to develop ah high quality audit, the auditor must know the main goals of the audited organization and to determine the concordance between realities and the expectations
The IT&C projects developed by students
In this paper are analyzed only the projects developed by graduates as licence
projects, by the students at master as dissertations, and by the students at Ph.D. studies, taken into consideration they have the necessary knowledge to develop a such kind of projects, and must of them are working with SMEs. It is, also, very important to notice the how the knowledge accumulated during the master studies and the research activities during Ph. D. period are used in improving the quality of the projects elaborated by the Ph. D. students. All these aspect help the teachers to adept the courses to the practical needs.
The projects main goal is to see how the students gain knowledge, and haw they put into practice these knowledge. In this way the students solve a problem of the organizations where they are working.
A particularity of the IT&C projects developed by students is the time of development. Having in view this aspect it is necessary that the project size and complexity to be in concordance with the developing time. In this situation the time can not be prolonged because the students must to delivery the projects in time in order to graduate. Overrunning the time means the unrealized project.
Taken into consideration the project complexity, the project is developed by a single student or by k students. The projects developed by more than one person offer the possibility to train students to work in a team that is extremely important for them in the future, in order to take part in large IT&C projects development. The goals, the method to solve the problem, the necessary tools are specified.
During the courses the students learns not only to develop such kind of projects, but the methods and techniques for auditing both the project, and the final product, as well. Knowing these aspects a student has the necessary knowledge to develop a project according to the audit requirements. This assumption is supported by the percentage of the implemented projects, as is shown in the Table 1
In order to evaluate the efficiency of the training process it is used an efficiency indicator as below:
100*Ntot
NimplIef =
where: Ntot – number of developed IT&C projects; Nimpl – number of implemented IT&C projects; Ief – efficiency indicator.
Taken into consideration the latest three years, the results are presented in the table 1.
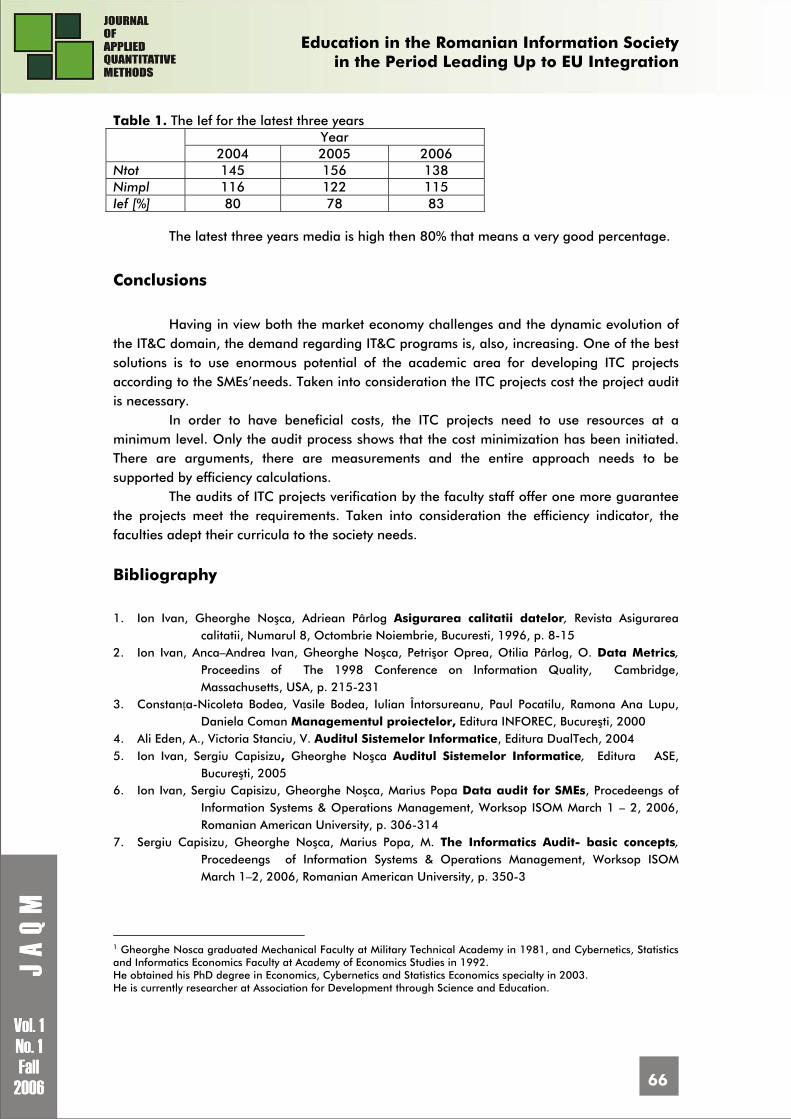
Education in the Romanian Information Society
in the Period Leading Up to EU Integration
66
Table 1. The Ief for the latest three years Year
2004 2005 2006 Ntot 145 156 138 Nimpl 116 122 115 Ief [%] 80 78 83
The latest three years media is high then 80% that means a very good percentage.
Conclusions
Having in view both the market economy challenges and the dynamic evolution of the IT&C domain, the demand regarding IT&C programs is, also, increasing. One of the best solutions is to use enormous potential of the academic area for developing ITC projects according to the SMEs’needs. Taken into consideration the ITC projects cost the project audit is necessary.
In order to have beneficial costs, the ITC projects need to use resources at a minimum level. Only the audit process shows that the cost minimization has been initiated. There are arguments, there are measurements and the entire approach needs to be supported by efficiency calculations.
The audits of ITC projects verification by the faculty staff offer one more guarantee the projects meet the requirements. Taken into consideration the efficiency indicator, the faculties adept their curricula to the society needs.
Bibliography 1. Ion Ivan, Gheorghe Noşca, Adriean Pârlog Asigurarea calitatii datelor, Revista Asigurarea
calitatii, Numarul 8, Octombrie Noiembrie, Bucuresti, 1996, p. 8-15 2. Ion Ivan, Anca–Andrea Ivan, Gheorghe Noşca, Petrişor Oprea, Otilia Pârlog, O. Data Metrics,
Proceedins of The 1998 Conference on Information Quality, Cambridge, Massachusetts, USA, p. 215-231
3. Constanţa-Nicoleta Bodea, Vasile Bodea, Iulian Întorsureanu, Paul Pocatilu, Ramona Ana Lupu, Daniela Coman Managementul proiectelor, Editura INFOREC, Bucureşti, 2000
4. Ali Eden, A., Victoria Stanciu, V. Auditul Sistemelor Informatice, Editura DualTech, 2004 5. Ion Ivan, Sergiu Capisizu, Gheorghe Noşca Auditul Sistemelor Informatice, Editura ASE,
Bucureşti, 2005 6. Ion Ivan, Sergiu Capisizu, Gheorghe Noşca, Marius Popa Data audit for SMEs, Procedeengs of
Information Systems & Operations Management, Worksop ISOM March 1 – 2, 2006, Romanian American University, p. 306-314
7. Sergiu Capisizu, Gheorghe Noşca, Marius Popa, M. The Informatics Audit- basic concepts, Procedeengs of Information Systems & Operations Management, Worksop ISOM March 1–2, 2006, Romanian American University, p. 350-3
1 Gheorghe Nosca graduated Mechanical Faculty at Military Technical Academy in 1981, and Cybernetics, Statistics and Informatics Economics Faculty at Academy of Economics Studies in 1992. He obtained his PhD degree in Economics, Cybernetics and Statistics Economics specialty in 2003. He is currently researcher at Association for Development through Science and Education.

Education in the Romanian Information Society
in the Period Leading Up to EU Integration
67
He has published (in co-operation) 3 books, 16 articles in informatics journals. He has taken part in about 20 national and international conferences and symposiums. His research interests include data quality, data quality management, software quality cost, informatics audit, and competitive intelligence. 2 Adriean Parlog graduated Economic Cybernetics and Statistics Faculty, specialized in economic cybernetics at the Academy of Economics Studies, in 1979. He obtained his Ph.D. degree in Military Science in 1994. He has also graduated post academics courses in Romania and abroad, specialized in information quality management, conflict prevention and diplomacy. He is currently associate professor at Defense National University and guest professor at Lucian Blaga University and at the National School of Political and Administrative Studies. He has published two books, more than 30 articles in scientific journals. He has taken part in about 30 national and international conferences and symposiums. He has taken part in designing and developing very complex Information Systems. His research interests include information system development, data quality, data quality management, modeling, simulation and optimization.
Education in the Romanian Information Society
in the Period Leading Up to EU Integration
68
THE EVOLUTION OF ECONOMIST'S LABOUR MARKET IN ROMANIA1
Alexandru ISAIC-MANIU PhD, University Professor, Department of Statistics and Economic Prognosis University of Economic Studies, Bucharest, Romania (Co)Author of the books: Enciclopedia calitatii (2005), Dictionar de statistica generala (2003), Statistica pentru managementul afacerilor (2000), Metoda Weibull (1983) E-mail: [email protected], Web page: http://www.amaniu.ase.ro
Claudiu HERTELIU PhD Candidate, University Assistant, Department of Statistics and Economic Prognosis University of Economic Studies, Bucharest, Romania Co-author of the books: Sistemul national de indicatori pentru educatie (2005), Finantarea invatamantului preuniversitar de stat (2000) E-mail: [email protected], Web page: http://www.hertz.ase.ro
Abstract: The modern world is undergoing a fundamental transformation characterized by a lot of challenges, dynamism, globalization, and the increasing influence of Information and Communication Technologies (ICTs). These new technologies have implications for all aspects of the society and economy; they are changing the way of doing business, the way of learning, and almost everything is changed. The ICTs are seen as one of the core elements driving the modern world. Taken into consideration these aspects the universities has adept their curricula to the society’ needs, and the students develop ITC projects that solve some these needs. This paper refers to the audit of the ITC projects developed by students. Key words: economists, labour market, education market, statistical survey, ASE Bucharest, Romania
1. General context
Under the circumstances of the well known globalization, the academic education
started with an ample program of reform for the whole system - generic known through the phrase “The Process from Bologna”, which is trying to solve the new demands, the new pressures and requirements of the economic and social environment which keeps changing.
The ensemble of the European educational politics based on constitutive and the U.E.'s expansion lead to the formation of a so called "European Area Of Higher Education". In our country beside the process of modernization and alignment to the European context is
Education in the Romanian Information Society
in the Period Leading Up to EU Integration
69
present also the problem of permanent accommodation to the requirements of the labor market, expression of the dynamics of the socio-economical systems.
On this market, the economical higher education has a specific place which we intend to estimate.
The size of the economist's labor market, as any another market, enforces the evaluation of the two major perspectives: the supply and demand.
The supply and demand in the higher economic education has two senses. The first of them coincide the entries in the educational system. In this acceptance
there are a lot of universities that provide economical education. On the other hand, the high school graduates wish to continue the studies and can choose the economical higher education. This represents the demand for the system of economical universities. Being given the rational choice of the consumer (advised by the parents, by his relatives but especially by friends) the superior quality or less superior (from viewpoint of the scholastic previous performances) of those who those that form the demand for economic preparation (d1) illustrates for a certainty the position that holds the institutions of economic higher educations in our country. Considering the preliminary results of a statistical survey2 through soundings, recently developed among the poor families that have children in the pre-university education, the parents wants for the female children to have a occupation for which ASE (Academy of Economical Studies) in proportion of 18 percent, and in the case of male children, in a way surprisingly, the proportion reaches even 22 percent. Another recent study accomplished in schools from the pre-university education3, among the professions desired by parents for their children, we can remark: 10 percent programmers, 8 percent manager / enterprising manager / managing positions, 3 percent bookkeeper, 1 percent in the financial banking area. ASE offers, therefore, specializations for 20 percent of the desired jobs by parents for their children and sometimes since the secondary school. Before 1990, the choices of young high school graduates were especially targeted to the polytechnic studies and medicine, immediately after 1990 to economic studies and law studies, and currently to P.R., journalism, politic studies and communication studies.
A second explanation of the demand (d2) and supply (s2) refers to those who are
getting out of the economic system preparation. The institutions of higher economic education “produce” graduates which constitute the primary demand on the labor market. In this case the supply is composed of economic agents that employ. There can be also identified secondary circuits generated by the universities in the pre-university education as well as to the economic field as supply (s4) in the continuous preparation programs, along the cycle of active professional life. We can also add the demand of specialized academics for the economical high schools that the pre-university education redirects to the economic universities, and vice-versa, the offer of university graduates for those jobs. Also, from the pre-university schools comes a demand (d4) to inform the specialty teachers (didactic degree I, II, etc.) with the corresponding supply (s5) in the opposite way.
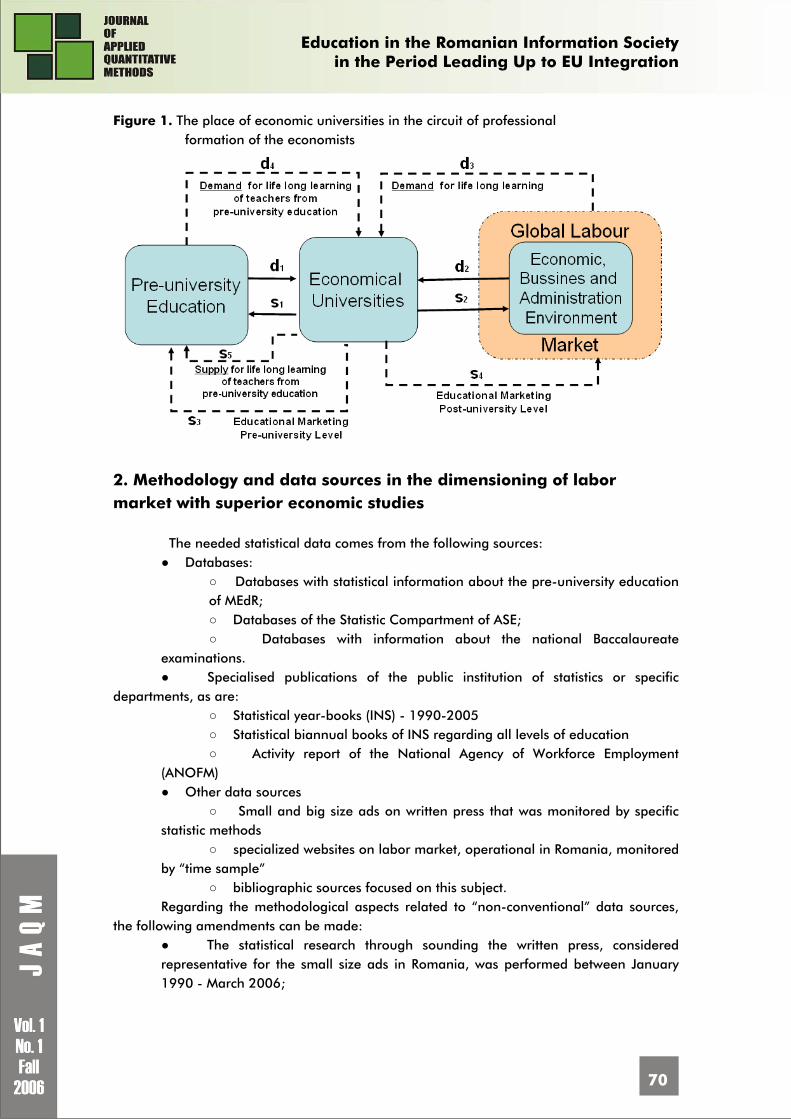
Education in the Romanian Information Society
in the Period Leading Up to EU Integration
70
Figure 1. The place of economic universities in the circuit of professional formation of the economists
2. Methodology and data sources in the dimensioning of labor market with superior economic studies
The needed statistical data comes from the following sources: ● Databases:
○ Databases with statistical information about the pre-university education of MEdR; ○ Databases of the Statistic Compartment of ASE; ○ Databases with information about the national Baccalaureate
examinations. ● Specialised publications of the public institution of statistics or specific
departments, as are: ○ Statistical year-books (INS) - 1990-2005 ○ Statistical biannual books of INS regarding all levels of education ○ Activity report of the National Agency of Workforce Employment
(ANOFM) ● Other data sources
○ Small and big size ads on written press that was monitored by specific statistic methods
○ specialized websites on labor market, operational in Romania, monitored by “time sample”
○ bibliographic sources focused on this subject. Regarding the methodological aspects related to “non-conventional” data sources,
the following amendments can be made: ● The statistical research through sounding the written press, considered representative for the small size ads in Romania, was performed between January 1990 - March 2006;
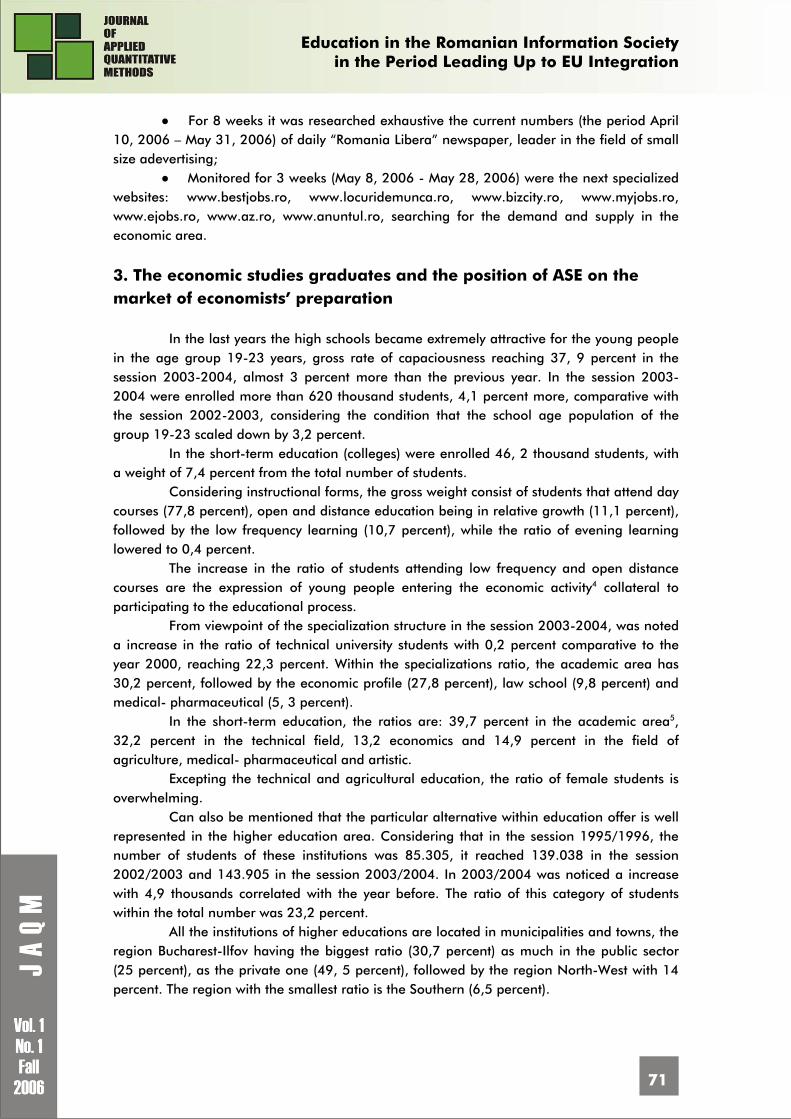
Education in the Romanian Information Society
in the Period Leading Up to EU Integration
71
● For 8 weeks it was researched exhaustive the current numbers (the period April 10, 2006 – May 31, 2006) of daily “Romania Libera” newspaper, leader in the field of small size adevertising;
● Monitored for 3 weeks (May 8, 2006 - May 28, 2006) were the next specialized websites: www.bestjobs.ro, www.locuridemunca.ro, www.bizcity.ro, www.myjobs.ro, www.ejobs.ro, www.az.ro, www.anuntul.ro, searching for the demand and supply in the economic area.
3. The economic studies graduates and the position of ASE on the market of economists’ preparation
In the last years the high schools became extremely attractive for the young people in the age group 19-23 years, gross rate of capaciousness reaching 37, 9 percent in the session 2003-2004, almost 3 percent more than the previous year. In the session 2003-2004 were enrolled more than 620 thousand students, 4,1 percent more, comparative with the session 2002-2003, considering the condition that the school age population of the group 19-23 scaled down by 3,2 percent.
In the short-term education (colleges) were enrolled 46, 2 thousand students, with a weight of 7,4 percent from the total number of students.
Considering instructional forms, the gross weight consist of students that attend day courses (77,8 percent), open and distance education being in relative growth (11,1 percent), followed by the low frequency learning (10,7 percent), while the ratio of evening learning lowered to 0,4 percent.
The increase in the ratio of students attending low frequency and open distance courses are the expression of young people entering the economic activity4 collateral to participating to the educational process.
From viewpoint of the specialization structure in the session 2003-2004, was noted a increase in the ratio of technical university students with 0,2 percent comparative to the year 2000, reaching 22,3 percent. Within the specializations ratio, the academic area has 30,2 percent, followed by the economic profile (27,8 percent), law school (9,8 percent) and medical- pharmaceutical (5, 3 percent).
In the short-term education, the ratios are: 39,7 percent in the academic area5, 32,2 percent in the technical field, 13,2 economics and 14,9 percent in the field of agriculture, medical- pharmaceutical and artistic.
Excepting the technical and agricultural education, the ratio of female students is overwhelming.
Can also be mentioned that the particular alternative within education offer is well represented in the higher education area. Considering that in the session 1995/1996, the number of students of these institutions was 85.305, it reached 139.038 in the session 2002/2003 and 143.905 in the session 2003/2004. In 2003/2004 was noticed a increase with 4,9 thousands correlated with the year before. The ratio of this category of students within the total number was 23,2 percent.
All the institutions of higher educations are located in municipalities and towns, the region Bucharest-Ilfov having the biggest ratio (30,7 percent) as much in the public sector (25 percent), as the private one (49, 5 percent), followed by the region North-West with 14 percent. The region with the smallest ratio is the Southern (6,5 percent).
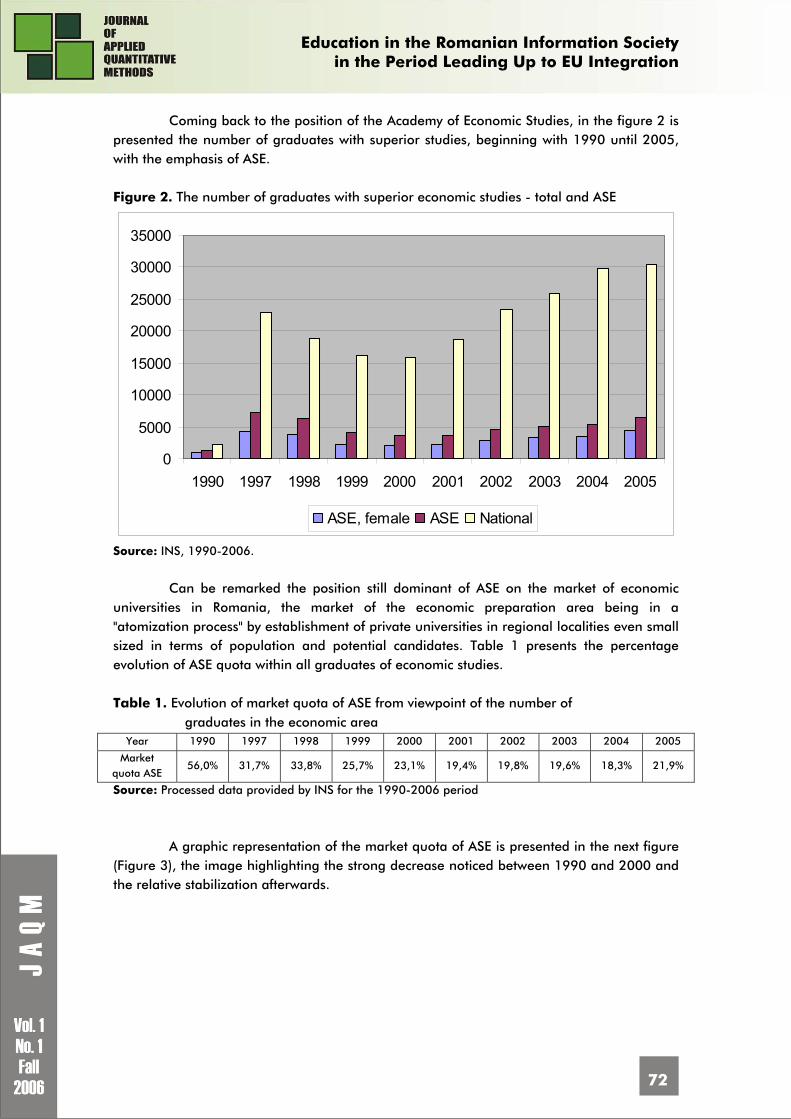
Education in the Romanian Information Society
in the Period Leading Up to EU Integration
72
Coming back to the position of the Academy of Economic Studies, in the figure 2 is presented the number of graduates with superior studies, beginning with 1990 until 2005, with the emphasis of ASE.
Figure 2. The number of graduates with superior economic studies - total and ASE
0
5000
10000
15000
20000
25000
30000
35000
1990 1997 1998 1999 2000 2001 2002 2003 2004 2005
ASE, female ASE National
Source: INS, 1990-2006.
Can be remarked the position still dominant of ASE on the market of economic
universities in Romania, the market of the economic preparation area being in a "atomization process" by establishment of private universities in regional localities even small sized in terms of population and potential candidates. Table 1 presents the percentage evolution of ASE quota within all graduates of economic studies. Table 1. Evolution of market quota of ASE from viewpoint of the number of
graduates in the economic area Year 1990 1997 1998 1999 2000 2001 2002 2003 2004 2005
Market quota ASE
56,0% 31,7% 33,8% 25,7% 23,1% 19,4% 19,8% 19,6% 18,3% 21,9%
Source: Processed data provided by INS for the 1990-2006 period
A graphic representation of the market quota of ASE is presented in the next figure
(Figure 3), the image highlighting the strong decrease noticed between 1990 and 2000 and the relative stabilization afterwards.
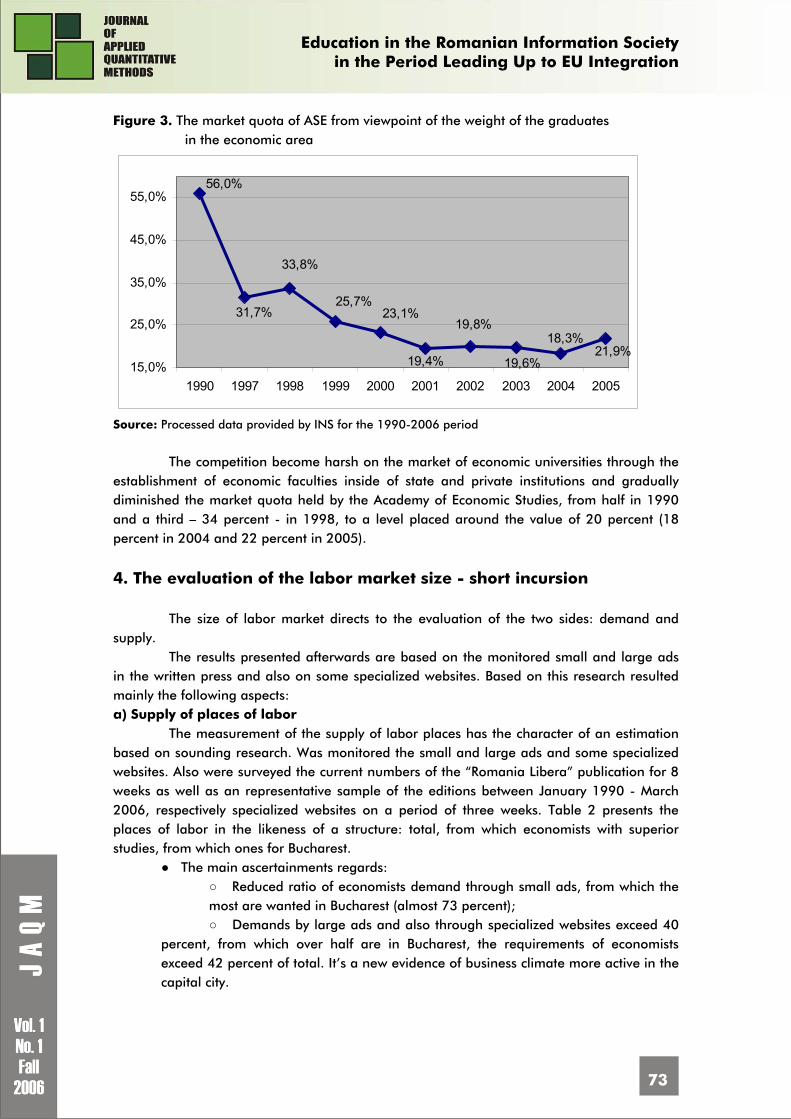
Education in the Romanian Information Society
in the Period Leading Up to EU Integration
73
Figure 3. The market quota of ASE from viewpoint of the weight of the graduates in the economic area
21,9%18,3%
19,6%
19,8%
19,4%
23,1%25,7%
33,8%
31,7%
56,0%
15,0%
25,0%
35,0%
45,0%
55,0%
1990 1997 1998 1999 2000 2001 2002 2003 2004 2005
Source: Processed data provided by INS for the 1990-2006 period
The competition become harsh on the market of economic universities through the
establishment of economic faculties inside of state and private institutions and gradually diminished the market quota held by the Academy of Economic Studies, from half in 1990 and a third – 34 percent - in 1998, to a level placed around the value of 20 percent (18 percent in 2004 and 22 percent in 2005).
4. The evaluation of the labor market size - short incursion
The size of labor market directs to the evaluation of the two sides: demand and supply.
The results presented afterwards are based on the monitored small and large ads in the written press and also on some specialized websites. Based on this research resulted mainly the following aspects: a) Supply of places of labor
The measurement of the supply of labor places has the character of an estimation based on sounding research. Was monitored the small and large ads and some specialized websites. Also were surveyed the current numbers of the “Romania Libera” publication for 8 weeks as well as an representative sample of the editions between January 1990 - March 2006, respectively specialized websites on a period of three weeks. Table 2 presents the places of labor in the likeness of a structure: total, from which economists with superior studies, from which ones for Bucharest. ● The main ascertainments regards:
○ Reduced ratio of economists demand through small ads, from which the most are wanted in Bucharest (almost 73 percent); ○ Demands by large ads and also through specialized websites exceed 40
percent, from which over half are in Bucharest, the requirements of economists exceed 42 percent of total. It’s a new evidence of business climate more active in the capital city.
Education in the Romanian Information Society
in the Period Leading Up to EU Integration
74
Table 2. Places of labor offered - general presentation
Small ads
written press (sa wp) (%)
Large ads written press
(la wp) (%)
Specialized websites
(www) (%) Total places of labor 100 100 100 - from which are economists 10,7 43,4 41,5 - from which are for Bucharest 72,8 51,9 62,7 * from which for economists 10,3 43,1 42,5
Source: Own researches 2006: written press and specialized websites
Another aspect we believe attractively is incident to the size of the large ads. Each
large add was measured from viewpoint of the length and the width in order to compare also the area, not only the frequency of appearance. Wasn’t considered if the add was polychrome or monochrome, and consequently, the average price that can be estimated may be a little underestimated6.
The average area of the ads monitored and measured was of approximately 265 cm2. Considering the listed price of a black-and-white ad means that for each appearance was paid, on the average, about 500 Euro. We can suppose that, at large, the positions announced within large ads are important and obvious the retributions are on measure. Figure 4. The structure of the offer of labor places depending on field of expertise
0%
10%
20%
30%
40%
50%
60%
70%
80%
90%
100%
small ads big ads internet ads
other jobs
economists
Source: Own researches 2006: written press and specialized websites
The “fight” between "small ads" versus "large ads" and "specialized websites"
appears natural pursuant the fact that, usually, in the large ads the positions are definitely dominated by positions corresponding to superior studies compared to the positions for unqualified or qualified workers with no superior studies which appear more frequently in the case of small ads. Regarding the specialized websites the situation looks similar if we take into consideration the profile of the surfers on the internet. Thus, for instance, a firm
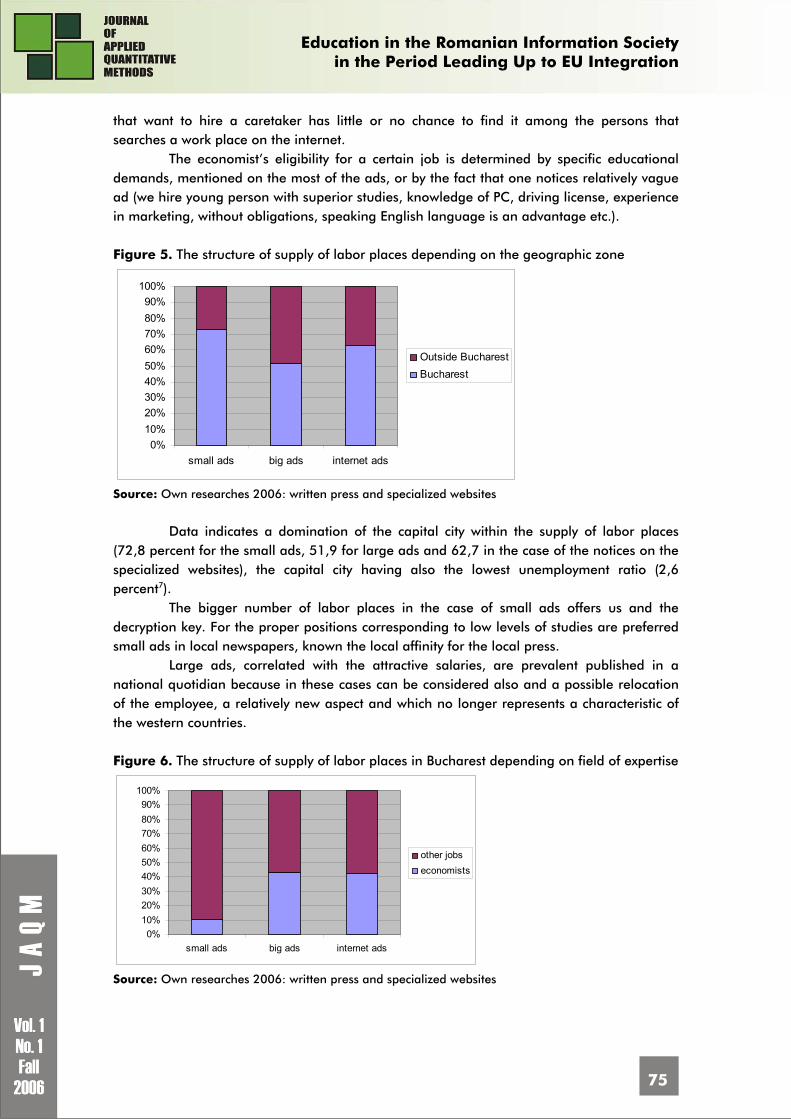
Education in the Romanian Information Society
in the Period Leading Up to EU Integration
75
that want to hire a caretaker has little or no chance to find it among the persons that searches a work place on the internet.
The economist’s eligibility for a certain job is determined by specific educational demands, mentioned on the most of the ads, or by the fact that one notices relatively vague ad (we hire young person with superior studies, knowledge of PC, driving license, experience in marketing, without obligations, speaking English language is an advantage etc.). Figure 5. The structure of supply of labor places depending on the geographic zone
0%
10%
20%
30%
40%
50%
60%
70%
80%
90%
100%
small ads big ads internet ads
Outside Bucharest
Bucharest
Source: Own researches 2006: written press and specialized websites
Data indicates a domination of the capital city within the supply of labor places
(72,8 percent for the small ads, 51,9 for large ads and 62,7 in the case of the notices on the specialized websites), the capital city having also the lowest unemployment ratio (2,6 percent7).
The bigger number of labor places in the case of small ads offers us and the decryption key. For the proper positions corresponding to low levels of studies are preferred small ads in local newspapers, known the local affinity for the local press.
Large ads, correlated with the attractive salaries, are prevalent published in a national quotidian because in these cases can be considered also and a possible relocation of the employee, a relatively new aspect and which no longer represents a characteristic of the western countries. Figure 6. The structure of supply of labor places in Bucharest depending on field of expertise
0%
10%
20%
30%
40%
50%
60%
70%
80%
90%
100%
small ads big ads internet ads
other jobs
economists
Source: Own researches 2006: written press and specialized websites
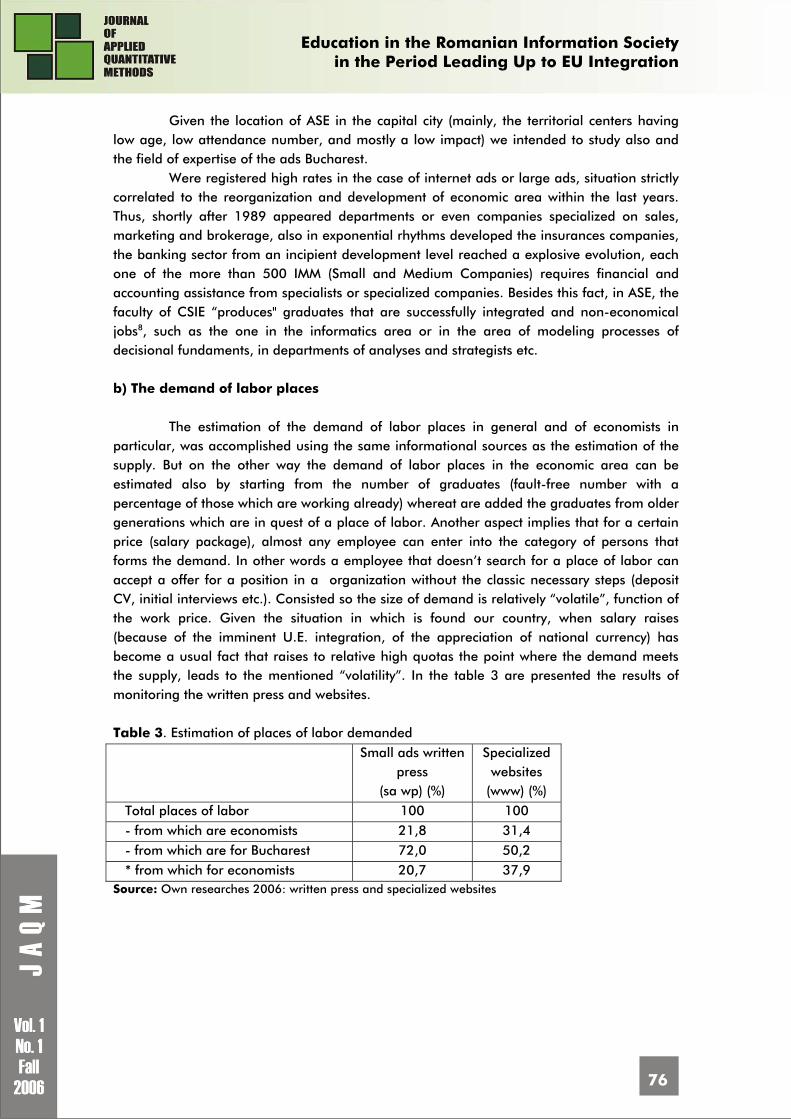
Education in the Romanian Information Society
in the Period Leading Up to EU Integration
76
Given the location of ASE in the capital city (mainly, the territorial centers having low age, low attendance number, and mostly a low impact) we intended to study also and the field of expertise of the ads Bucharest.
Were registered high rates in the case of internet ads or large ads, situation strictly correlated to the reorganization and development of economic area within the last years. Thus, shortly after 1989 appeared departments or even companies specialized on sales, marketing and brokerage, also in exponential rhythms developed the insurances companies, the banking sector from an incipient development level reached a explosive evolution, each one of the more than 500 IMM (Small and Medium Companies) requires financial and accounting assistance from specialists or specialized companies. Besides this fact, in ASE, the faculty of CSIE “produces" graduates that are successfully integrated and non-economical jobs8, such as the one in the informatics area or in the area of modeling processes of decisional fundaments, in departments of analyses and strategists etc.
b) The demand of labor places
The estimation of the demand of labor places in general and of economists in
particular, was accomplished using the same informational sources as the estimation of the supply. But on the other way the demand of labor places in the economic area can be estimated also by starting from the number of graduates (fault-free number with a percentage of those which are working already) whereat are added the graduates from older generations which are in quest of a place of labor. Another aspect implies that for a certain price (salary package), almost any employee can enter into the category of persons that forms the demand. In other words a employee that doesn’t search for a place of labor can accept a offer for a position in a organization without the classic necessary steps (deposit CV, initial interviews etc.). Consisted so the size of demand is relatively “volatile”, function of the work price. Given the situation in which is found our country, when salary raises (because of the imminent U.E. integration, of the appreciation of national currency) has become a usual fact that raises to relative high quotas the point where the demand meets the supply, leads to the mentioned “volatility”. In the table 3 are presented the results of monitoring the written press and websites.
Table 3. Estimation of places of labor demanded
Small ads written
press (sa wp) (%)
Specialized websites
(www) (%) Total places of labor 100 100 - from which are economists 21,8 31,4 - from which are for Bucharest 72,0 50,2 * from which for economists 20,7 37,9
Source: Own researches 2006: written press and specialized websites
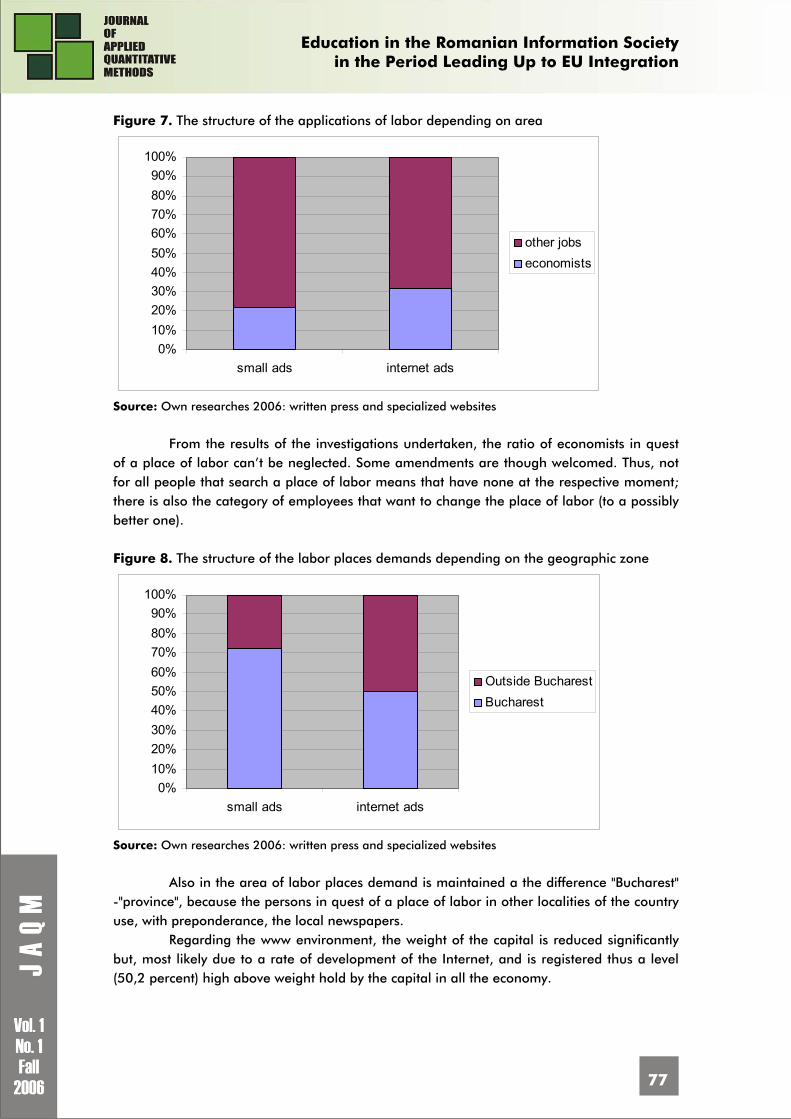
Education in the Romanian Information Society
in the Period Leading Up to EU Integration
77
Figure 7. The structure of the applications of labor depending on area
0%
10%
20%
30%
40%
50%
60%
70%
80%
90%
100%
small ads internet ads
other jobs
economists
Source: Own researches 2006: written press and specialized websites
From the results of the investigations undertaken, the ratio of economists in quest
of a place of labor can’t be neglected. Some amendments are though welcomed. Thus, not for all people that search a place of labor means that have none at the respective moment; there is also the category of employees that want to change the place of labor (to a possibly better one). Figure 8. The structure of the labor places demands depending on the geographic zone
0%
10%
20%
30%
40%
50%
60%
70%
80%
90%
100%
small ads internet ads
Outside Bucharest
Bucharest
Source: Own researches 2006: written press and specialized websites
Also in the area of labor places demand is maintained a the difference "Bucharest"
-"province", because the persons in quest of a place of labor in other localities of the country use, with preponderance, the local newspapers.
Regarding the www environment, the weight of the capital is reduced significantly but, most likely due to a rate of development of the Internet, and is registered thus a level (50,2 percent) high above weight hold by the capital in all the economy.
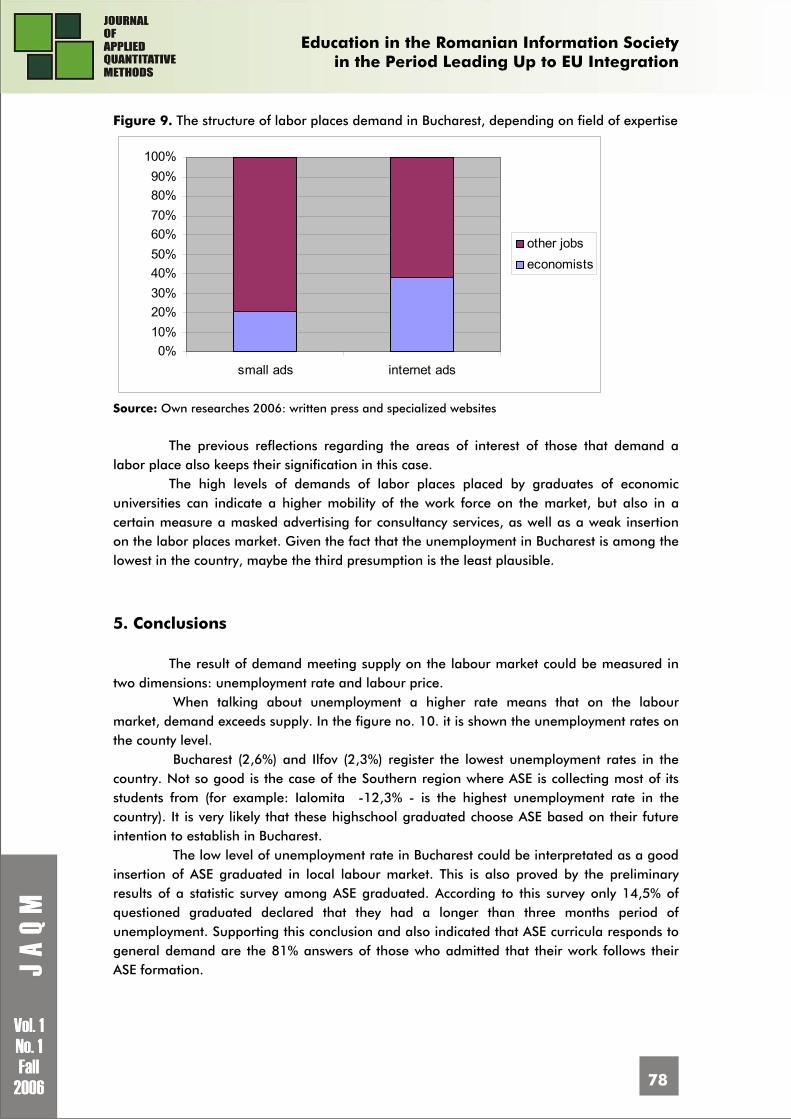
Education in the Romanian Information Society
in the Period Leading Up to EU Integration
78
Figure 9. The structure of labor places demand in Bucharest, depending on field of expertise
0%
10%
20%
30%
40%
50%
60%
70%
80%
90%
100%
small ads internet ads
other jobs
economists
Source: Own researches 2006: written press and specialized websites
The previous reflections regarding the areas of interest of those that demand a
labor place also keeps their signification in this case. The high levels of demands of labor places placed by graduates of economic
universities can indicate a higher mobility of the work force on the market, but also in a certain measure a masked advertising for consultancy services, as well as a weak insertion on the labor places market. Given the fact that the unemployment in Bucharest is among the lowest in the country, maybe the third presumption is the least plausible.
5. Conclusions
The result of demand meeting supply on the labour market could be measured in two dimensions: unemployment rate and labour price.
When talking about unemployment a higher rate means that on the labour market, demand exceeds supply. In the figure no. 10. it is shown the unemployment rates on the county level.
Bucharest (2,6%) and Ilfov (2,3%) register the lowest unemployment rates in the country. Not so good is the case of the Southern region where ASE is collecting most of its students from (for example: Ialomita -12,3% - is the highest unemployment rate in the country). It is very likely that these highschool graduated choose ASE based on their future intention to establish in Bucharest.
The low level of unemployment rate in Bucharest could be interpretated as a good insertion of ASE graduated in local labour market. This is also proved by the preliminary results of a statistic survey among ASE graduated. According to this survey only 14,5% of questioned graduated declared that they had a longer than three months period of unemployment. Supporting this conclusion and also indicated that ASE curricula responds to general demand are the 81% answers of those who admitted that their work follows their ASE formation.
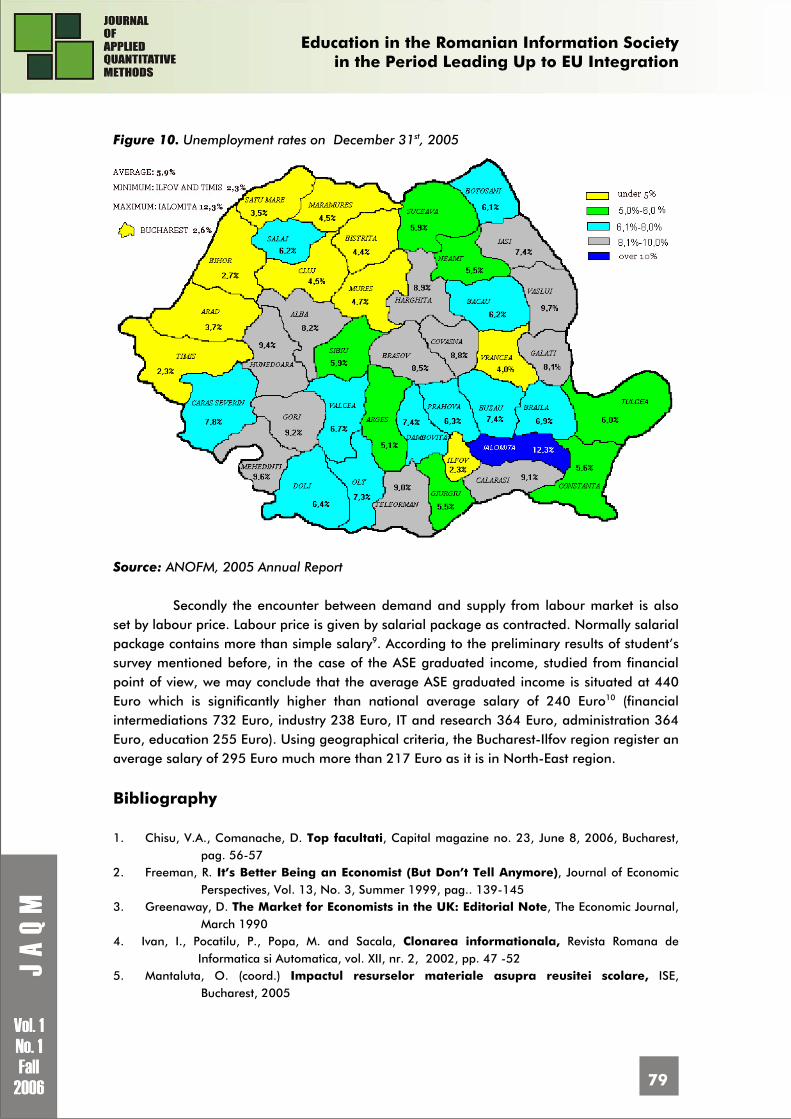
Education in the Romanian Information Society
in the Period Leading Up to EU Integration
79
Figure 10. Unemployment rates on December 31st, 2005
Source: ANOFM, 2005 Annual Report
Secondly the encounter between demand and supply from labour market is also
set by labour price. Labour price is given by salarial package as contracted. Normally salarial package contains more than simple salary9. According to the preliminary results of student’s survey mentioned before, in the case of the ASE graduated income, studied from financial point of view, we may conclude that the average ASE graduated income is situated at 440 Euro which is significantly higher than national average salary of 240 Euro10 (financial intermediations 732 Euro, industry 238 Euro, IT and research 364 Euro, administration 364 Euro, education 255 Euro). Using geographical criteria, the Bucharest-Ilfov region register an average salary of 295 Euro much more than 217 Euro as it is in North-East region.
Bibliography 1. Chisu, V.A., Comanache, D. Top facultati, Capital magazine no. 23, June 8, 2006, Bucharest,
pag. 56-57 2. Freeman, R. It’s Better Being an Economist (But Don’t Tell Anymore), Journal of Economic
Perspectives, Vol. 13, No. 3, Summer 1999, pag.. 139-145 3. Greenaway, D. The Market for Economists in the UK: Editorial Note, The Economic Journal,
March 1990 4. Ivan, I., Pocatilu, P., Popa, M. and Sacala, Clonarea informationala, Revista Romana de
Informatica si Automatica, vol. XII, nr. 2, 2002, pp. 47 -52 5. Mantaluta, O. (coord.) Impactul resurselor materiale asupra reusitei scolare, ISE,
Bucharest, 2005
Education in the Romanian Information Society
in the Period Leading Up to EU Integration
80
6. Perry, K. Statistical Relationship of Accounting and Economics, The Accounting Review, Vol. 30, No. 3, July 1955, pag. 500-506
7. Thorton, R., Ward, J. The Economist in Tort Litigation, Journal of Economic Perspectives, Vol. 13, No. 2, Spring 1999, pag. 101-112
8. Towse, R. Blaug, M. The Current State of the British Economics Profession, Royal Economic Society, 1988
9. * * *, Euro200 Impact, Ministerul Educatiei si Cercetarii, Bucharest, 2006 (preprint) 10. * * * Raport activitate ANOFM 2005, Bucharest, 2006 11. * * *, Comunicat de presa privind castigul salarial din luna aprile 2006, INS, Bucharest,
June 5, 2006
1 The scientific research activities were financial supported by ASE through “2007-2013 Strategy of Development Project”. We are grateful for constructive comments and suggestions which come from scientific research team: Ovidiu Nicolescu, Ion Verboncu, Mihai Korka, Constantin Popescu, Constantin Bratianu, Eduard Dinu, Marius Profiroiu, Ion Popa, Cristian Socol, Ionela Jianu, Andreea Dima and Sebastian Ceptureanu. 2 Ministerul Educatiei si Cercetarii, Euro200 Impact, Bucharest, 2006 (preprint). 3 Mantaluta, O. (coord.) Impactul resurselor materiale asupra reusitei scolare, ISE, Bucharest, 2005 paper available on the internet: http://portal.ise.ro/Management/tabid/83/Default.aspx 4 Preliminary results of a statistical survey among ASE students conclude that 52,9% of them have had at least one part time job and 32,7% a full time one. 5 Theoretical formation usually for pre-university education career. 6 This underestimation is due to the fact that some big employment ads are polychrome, therefore more expensive. 7 According to ANOFM 2005 annual activity report. 8 Accordingly to a recent study published in Capital magazine, Faculty of Cybernetics, Statistics and Economic Computer Science from ASE comes on the second place after Faculty of Electronics, Telecommunications and Information Technology from University Politehnica of Bucharest (Chisu, V.A., Comanache, D. Top facultati, Capital magazine no. 23 from June 8, 2006, Bucharest, pag. 56-57) in the top of the facultaties form Bucharest-Ilfov region. 9 This about health insurances, company cars, company mobile phones, paid vacations and other benefits. 10 Source: * * *, Comunicat de presa privind castigul salarial din luna aprile 2006, INS, Bucharest, June 5, 2006
Education in the Romanian Information Society
in the Period Leading Up to EU Integration
81
STORAGE OPTIMIZATION OF EDUCATIONAL SYSTEM DATA Catalin BOJA1 PhD Candidate, University Assistant, Economic Informatics Department Academy of Economic Studies, Bucharest, Romania E-mail: [email protected] Abstract: There are described methods used to minimize data files dimension. There are defined indicators for measuring size of files and databases. The storage optimization process is based on selecting from a multitude of data storage models the one that satisfies the propose problem objective, maximization or minimization of the optimum criterion that is mapped on the size of used disk memory. The paper describes different solutions that are implemented to minimize input/output file size for a software application that manages educational system data. Key words: file, database, optimization, data, educational system.
1. File and database dimension
It is considered a finite set of N elements, El1, El2, …, ElN. It is defined an optimum criterion and it is the Eli element that maximize/minimize the function associated to the optimum criterion. This defines the optimization problem in the informatics field, the framework being applied to any software quality characteristic that is included in the optimization process.
There is considered a collectivity C composed from the elements, c1, c2, ..., cN, where N represents the total number of elements. Each element ci it is described using M characteristics, A1, A2, ..., AM.
For each of the software characteristics Aj there are used values or attributes to describe measured levels of ci elements. The values or attributes are described using arrays of characters or strings. As a result, the sij characters string describes the levels of the Aj characteristic for the ci element.
The sij string is characterized by the Lij length which is represented by a number of symbols.
The problem of storing data into files or conventional databases suppose using homogenous data structures for each of the collectivity articles. To characterize the required memory space there are defined a series of indicators that will measure this dimension and that will provide a quantitative approach of the problem.
In order to determine the memory space reserved by a software application for its data, there are accomplished the next steps:
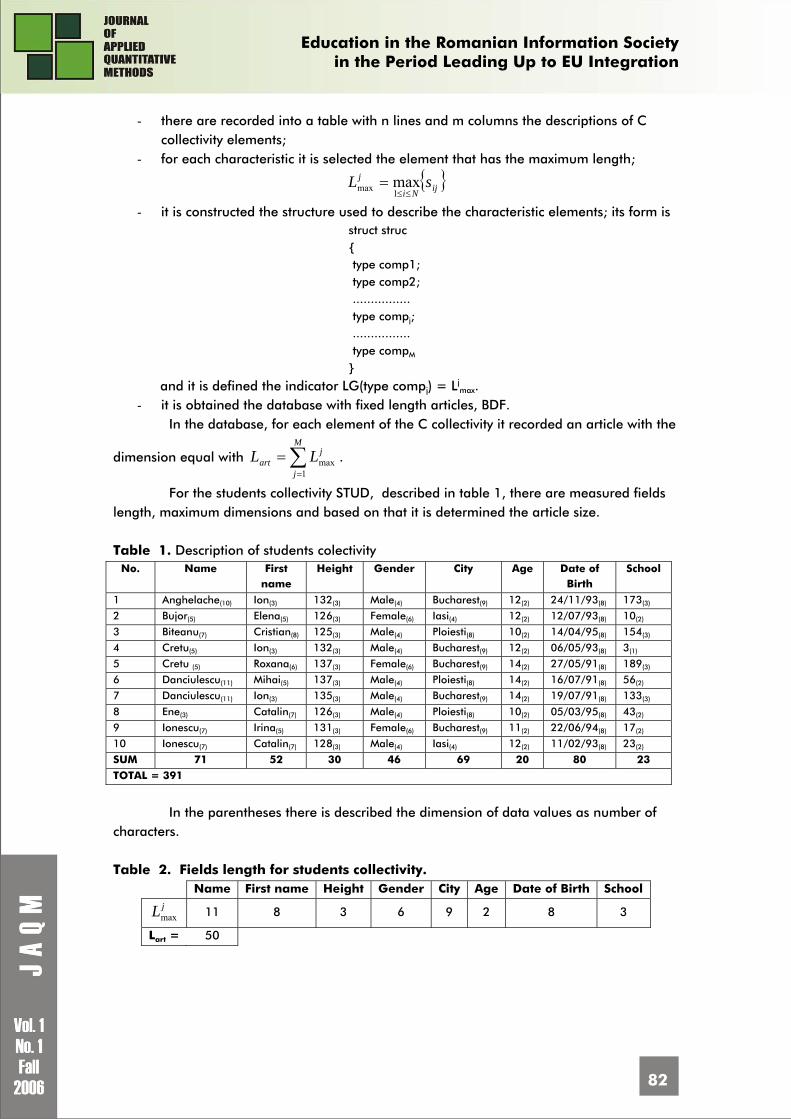
Education in the Romanian Information Society
in the Period Leading Up to EU Integration
82
- there are recorded into a table with n lines and m columns the descriptions of C collectivity elements;
- for each characteristic it is selected the element that has the maximum length;
{ }ijNi
j sL≤≤
=1max max
- it is constructed the structure used to describe the characteristic elements; its form is struct struc { type comp1; type comp2; ................ type compj; ................ type compM }
and it is defined the indicator LG(type compj) = Ljmax.
- it is obtained the database with fixed length articles, BDF. In the database, for each element of the C collectivity it recorded an article with the
dimension equal with ∑=
=M
j
jart LL
1max .
For the students collectivity STUD, described in table 1, there are measured fields length, maximum dimensions and based on that it is determined the article size. Table 1. Description of students colectivity
No. Name First name
Height Gender City Age Date of Birth
School
1 Anghelache(10) Ion(3) 132(3) Male(4) Bucharest(9) 12(2) 24/11/93(8) 173(3)
2 Bujor(5) Elena(5) 126(3) Female(6) Iasi(4) 12(2) 12/07/93(8) 10(2)
3 Biteanu(7) Cristian(8) 125(3) Male(4) Ploiesti(8) 10(2) 14/04/95(8) 154(3)
4 Cretu(5) Ion(3) 132(3) Male(4) Bucharest(9) 12(2) 06/05/93(8) 3(1)
5 Cretu (5) Roxana(6) 137(3) Female(6) Bucharest(9) 14(2) 27/05/91(8) 189(3)
6 Danciulescu(11) Mihai(5) 137(3) Male(4) Ploiesti(8) 14(2) 16/07/91(8) 56(2)
7 Danciulescu(11) Ion(3) 135(3) Male(4) Bucharest(9) 14(2) 19/07/91(8) 133(3)
8 Ene(3) Catalin(7) 126(3) Male(4) Ploiesti(8) 10(2) 05/03/95(8) 43(2)
9 Ionescu(7) Irina(5) 131(3) Female(6) Bucharest(9) 11(2) 22/06/94(8) 17(2)
10 Ionescu(7) Catalin(7) 128(3) Male(4) Iasi(4) 12(2) 11/02/93(8) 23(2)
SUM 71 52 30 46 69 20 80 23
TOTAL = 391
In the parentheses there is described the dimension of data values as number of
characters. Table 2. Fields length for students collectivity.
Name First name Height Gender City Age Date of Birth School jLmax 11 8 3 6 9 2 8 3
Lart = 50
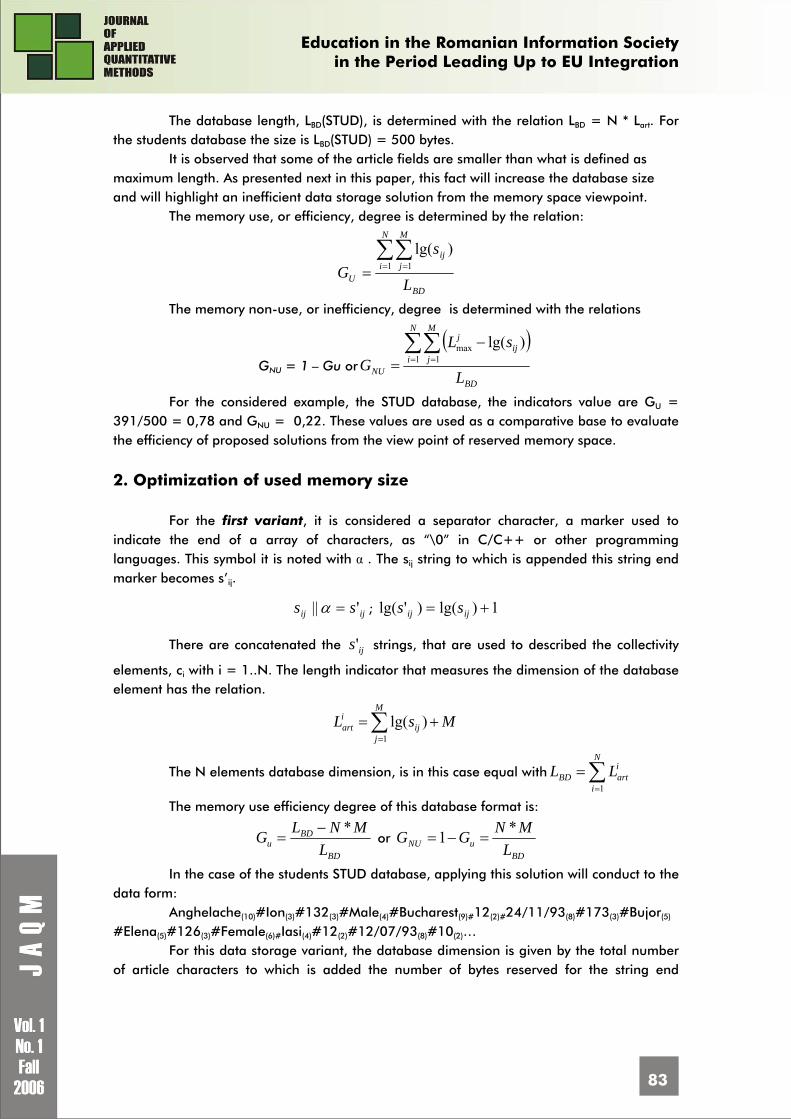
Education in the Romanian Information Society
in the Period Leading Up to EU Integration
83
The database length, LBD(STUD), is determined with the relation LBD = N * Lart. For the students database the size is LBD(STUD) = 500 bytes.
It is observed that some of the article fields are smaller than what is defined as maximum length. As presented next in this paper, this fact will increase the database size and will highlight an inefficient data storage solution from the memory space viewpoint.
The memory use, or efficiency, degree is determined by the relation:
BD
N
i
M
jij
U L
sG
∑∑= == 1 1
)lg(
The memory non-use, or inefficiency, degree is determined with the relations
GNU = 1 – Gu or
( )
BD
N
i
M
jij
j
NU L
sLG
∑∑= =
−= 1 1
max )lg(
For the considered example, the STUD database, the indicators value are GU = 391/500 = 0,78 and GNU = 0,22. These values are used as a comparative base to evaluate the efficiency of proposed solutions from the view point of reserved memory space.
2. Optimization of used memory size
For the first variant, it is considered a separator character, a marker used to indicate the end of a array of characters, as “\0” in C/C++ or other programming languages. This symbol it is noted with α . The sij string to which is appended this string end marker becomes s’ij.
ijij ss '|| =α ; 1)lg()'lg( += ijij ss
There are concatenated the ijs' strings, that are used to described the collectivity
elements, ci with i = 1..N. The length indicator that measures the dimension of the database element has the relation.
MsLM
jij
iart +=∑
=1)lg(
The N elements database dimension, is in this case equal with ∑=
=N
i
iartBD LL
1
The memory use efficiency degree of this database format is:
BD
BDu L
MNLG *−= or
BDuNU L
MNGG *1 =−=
In the case of the students STUD database, applying this solution will conduct to the data form:
Anghelache(10)#Ion(3)#132(3)#Male(4)#Bucharest(9)#12(2)#24/11/93(8)#173(3)#Bujor(5)
#Elena(5)#126(3)#Female(6)#Iasi(4)#12(2)#12/07/93(8)#10(2)… For this data storage variant, the database dimension is given by the total number
of article characters to which is added the number of bytes reserved for the string end
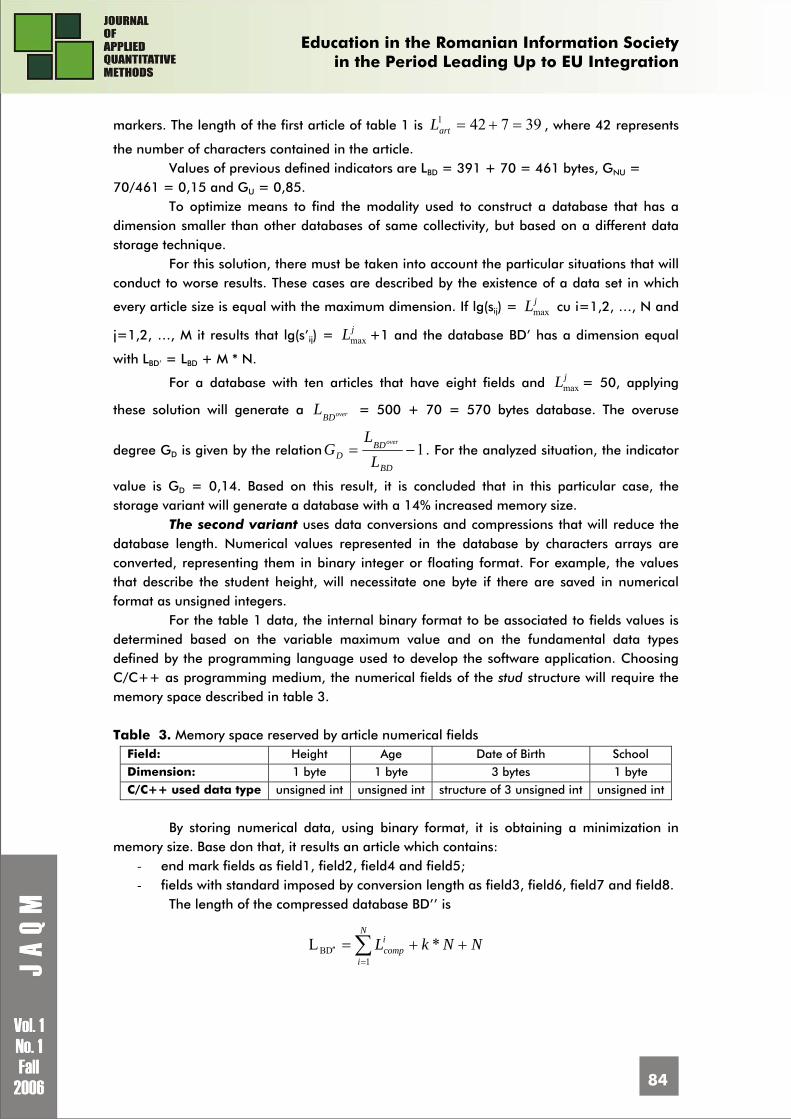
Education in the Romanian Information Society
in the Period Leading Up to EU Integration
84
markers. The length of the first article of table 1 is 397421 =+=artL , where 42 represents
the number of characters contained in the article. Values of previous defined indicators are LBD = 391 + 70 = 461 bytes, GNU =
70/461 = 0,15 and GU = 0,85. To optimize means to find the modality used to construct a database that has a
dimension smaller than other databases of same collectivity, but based on a different data storage technique.
For this solution, there must be taken into account the particular situations that will conduct to worse results. These cases are described by the existence of a data set in which
every article size is equal with the maximum dimension. If lg(sij) = jLmax cu i=1,2, …, N and
j=1,2, …, M it results that lg(s’ij) = jLmax +1 and the database BD’ has a dimension equal
with LBD’ = LBD + M * N.
For a database with ten articles that have eight fields and jLmax = 50, applying
these solution will generate a overBDL = 500 + 70 = 570 bytes database. The overuse
degree GD is given by the relation 1−=BD
BDD L
LG
over. For the analyzed situation, the indicator
value is GD = 0,14. Based on this result, it is concluded that in this particular case, the storage variant will generate a database with a 14% increased memory size.
The second variant uses data conversions and compressions that will reduce the database length. Numerical values represented in the database by characters arrays are converted, representing them in binary integer or floating format. For example, the values that describe the student height, will necessitate one byte if there are saved in numerical format as unsigned integers.
For the table 1 data, the internal binary format to be associated to fields values is determined based on the variable maximum value and on the fundamental data types defined by the programming language used to develop the software application. Choosing C/C++ as programming medium, the numerical fields of the stud structure will require the memory space described in table 3. Table 3. Memory space reserved by article numerical fields
Field: Height Age Date of Birth School Dimension: 1 byte 1 byte 3 bytes 1 byte C/C++ used data type unsigned int unsigned int structure of 3 unsigned int unsigned int
By storing numerical data, using binary format, it is obtaining a minimization in
memory size. Base don that, it results an article which contains: - end mark fields as field1, field2, field4 and field5; - fields with standard imposed by conversion length as field3, field6, field7 and field8.
The length of the compressed database BD’’ is
∑=
′′ ++=N
i
icomp NNkL
1DB *L
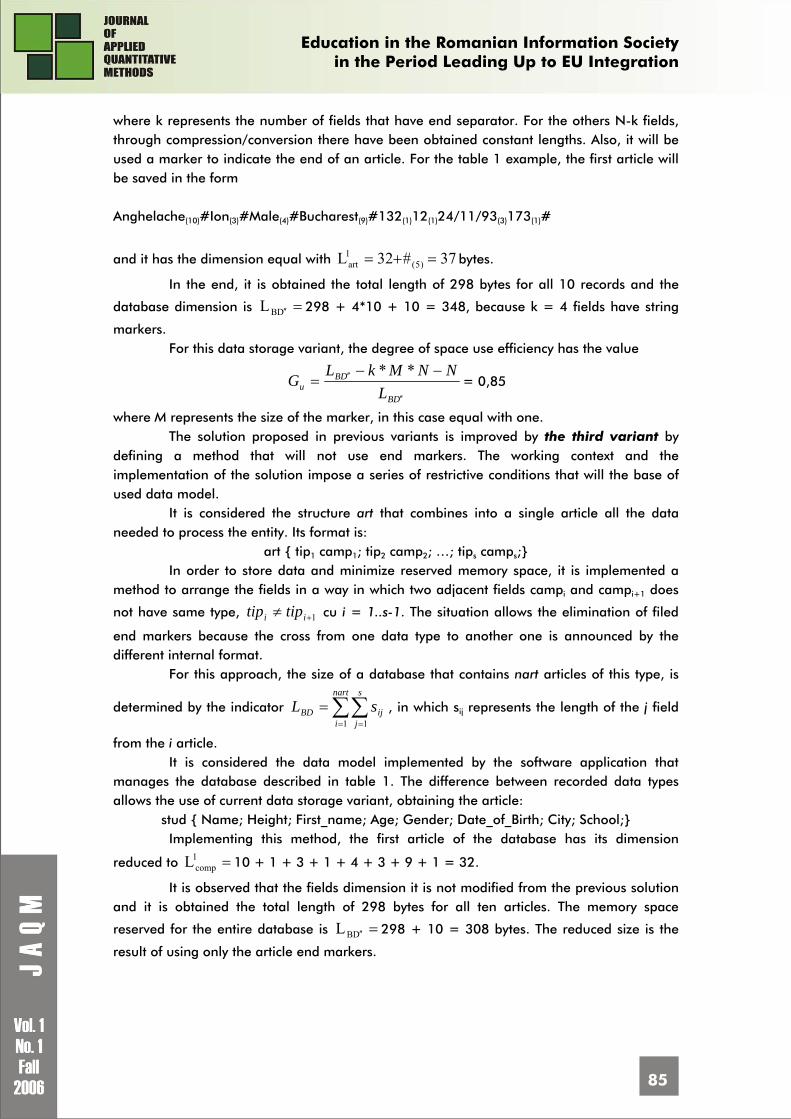
Education in the Romanian Information Society
in the Period Leading Up to EU Integration
85
where k represents the number of fields that have end separator. For the others N-k fields, through compression/conversion there have been obtained constant lengths. Also, it will be used a marker to indicate the end of an article. For the table 1 example, the first article will be saved in the form Anghelache(10)#Ion(3)#Male(4)#Bucharest(9)#132(1)12(1)24/11/93(3)173(1)#
and it has the dimension equal with 37#32L )5(1art =+= bytes.
In the end, it is obtained the total length of 298 bytes for all 10 records and the
database dimension is =′′DBL 298 + 4*10 + 10 = 348, because k = 4 fields have string
markers. For this data storage variant, the degree of space use efficiency has the value
DB
DBu L
NNMkLG′′
′′ −−=
**= 0,85
where M represents the size of the marker, in this case equal with one. The solution proposed in previous variants is improved by the third variant by
defining a method that will not use end markers. The working context and the implementation of the solution impose a series of restrictive conditions that will the base of used data model.
It is considered the structure art that combines into a single article all the data needed to process the entity. Its format is:
art { tip1 camp1; tip2 camp2; …; tips camps;} In order to store data and minimize reserved memory space, it is implemented a
method to arrange the fields in a way in which two adjacent fields campi and campi+1 does
not have same type, 1+≠ ii tiptip cu i = 1..s-1. The situation allows the elimination of filed
end markers because the cross from one data type to another one is announced by the different internal format.
For this approach, the size of a database that contains nart articles of this type, is
determined by the indicator ∑∑= =
=nart
i
s
jijBD sL
1 1, in which sij represents the length of the j field
from the i article. It is considered the data model implemented by the software application that
manages the database described in table 1. The difference between recorded data types allows the use of current data storage variant, obtaining the article:
stud { Name; Height; First_name; Age; Gender; Date_of_Birth; City; School;} Implementing this method, the first article of the database has its dimension
reduced to =1compL 10 + 1 + 3 + 1 + 4 + 3 + 9 + 1 = 32.
It is observed that the fields dimension it is not modified from the previous solution and it is obtained the total length of 298 bytes for all ten articles. The memory space
reserved for the entire database is =′′DBL 298 + 10 = 308 bytes. The reduced size is the
result of using only the article end markers.
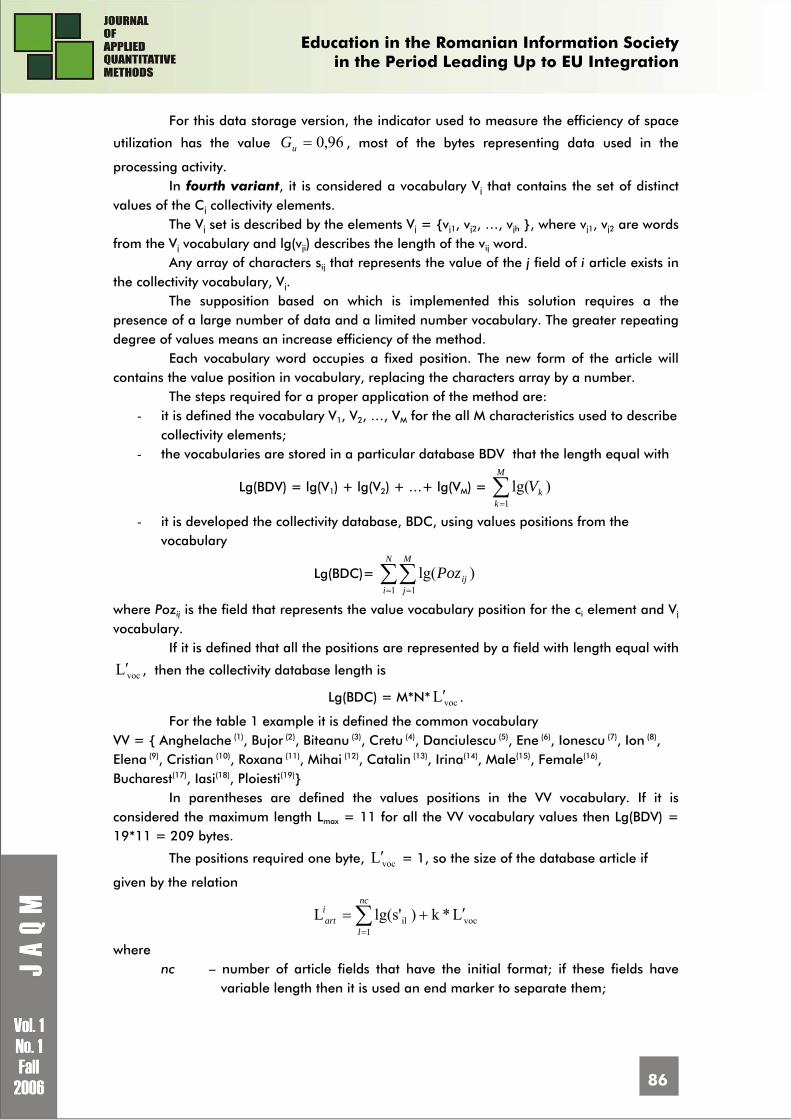
Education in the Romanian Information Society
in the Period Leading Up to EU Integration
86
For this data storage version, the indicator used to measure the efficiency of space
utilization has the value 96,0=uG , most of the bytes representing data used in the
processing activity. In fourth variant, it is considered a vocabulary Vj that contains the set of distinct
values of the Cj collectivity elements. The Vj set is described by the elements Vj = {vj1, vj2, …, vjh }, where vj1, vj2 are words
from the Vj vocabulary and lg(vji) describes the length of the vij word. Any array of characters sij that represents the value of the j field of i article exists in
the collectivity vocabulary, Vj. The supposition based on which is implemented this solution requires a the
presence of a large number of data and a limited number vocabulary. The greater repeating degree of values means an increase efficiency of the method.
Each vocabulary word occupies a fixed position. The new form of the article will contains the value position in vocabulary, replacing the characters array by a number.
The steps required for a proper application of the method are: - it is defined the vocabulary V1, V2, …, VM for the all M characteristics used to describe
collectivity elements; - the vocabularies are stored in a particular database BDV that the length equal with
Lg(BDV) = lg(V1) + lg(V2) + …+ lg(VM) = ∑=
M
kkV
1)lg(
- it is developed the collectivity database, BDC, using values positions from the vocabulary
Lg(BDC)= ∑∑= =
N
i
M
jijPoz
1 1)lg(
where Pozij is the field that represents the value vocabulary position for the ci element and Vj vocabulary.
If it is defined that all the positions are represented by a field with length equal with
vocL′ , then the collectivity database length is
Lg(BDC) = M*N* vocL′ .
For the table 1 example it is defined the common vocabulary VV = { Anghelache (1), Bujor (2), Biteanu (3), Cretu (4), Danciulescu (5), Ene (6), Ionescu (7), Ion (8), Elena (9), Cristian (10), Roxana (11), Mihai (12), Catalin (13), Irina(14), Male(15), Female(16), Bucharest(17), Iasi(18), Ploiesti(19)}
In parentheses are defined the values positions in the VV vocabulary. If it is considered the maximum length Lmax = 11 for all the VV vocabulary values then Lg(BDV) = 19*11 = 209 bytes.
The positions required one byte, vocL′ = 1, so the size of the database article if
given by the relation
voc1
il L*k)lg(s'L ′+= ∑=
nc
l
iart
where nc – number of article fields that have the initial format; if these fields have
variable length then it is used an end marker to separate them;
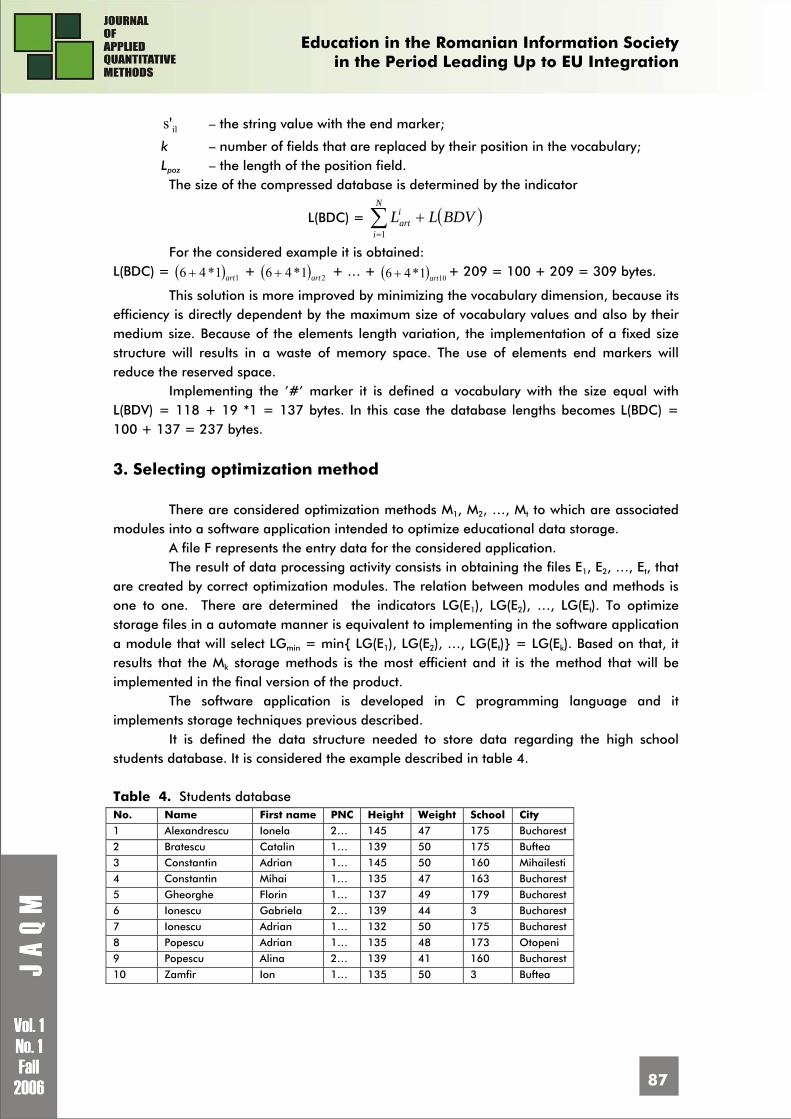
Education in the Romanian Information Society
in the Period Leading Up to EU Integration
87
ils' – the string value with the end marker;
k – number of fields that are replaced by their position in the vocabulary; Lpoz – the length of the position field. The size of the compressed database is determined by the indicator
L(BDC) = ( )BDVLLN
i
iart +∑
=1
For the considered example it is obtained: L(BDC) = ( ) 11*46 art+ + ( ) 21*46 art+ + … + ( ) 101*46 art+ + 209 = 100 + 209 = 309 bytes.
This solution is more improved by minimizing the vocabulary dimension, because its efficiency is directly dependent by the maximum size of vocabulary values and also by their medium size. Because of the elements length variation, the implementation of a fixed size structure will results in a waste of memory space. The use of elements end markers will reduce the reserved space.
Implementing the ’#’ marker it is defined a vocabulary with the size equal with L(BDV) = 118 + 19 *1 = 137 bytes. In this case the database lengths becomes L(BDC) = 100 + 137 = 237 bytes.
3. Selecting optimization method
There are considered optimization methods M1, M2, …, Mt to which are associated modules into a software application intended to optimize educational data storage.
A file F represents the entry data for the considered application. The result of data processing activity consists in obtaining the files E1, E2, …, Et, that
are created by correct optimization modules. The relation between modules and methods is one to one. There are determined the indicators LG(E1), LG(E2), …, LG(Et). To optimize storage files in a automate manner is equivalent to implementing in the software application a module that will select LGmin = min{ LG(E1), LG(E2), …, LG(Et)} = LG(Ek). Based on that, it results that the Mk storage methods is the most efficient and it is the method that will be implemented in the final version of the product.
The software application is developed in C programming language and it implements storage techniques previous described.
It is defined the data structure needed to store data regarding the high school students database. It is considered the example described in table 4. Table 4. Students database No. Name First name PNC Height Weight School City
1 Alexandrescu Ionela 2… 145 47 175 Bucharest
2 Bratescu Catalin 1… 139 50 175 Buftea
3 Constantin Adrian 1… 145 50 160 Mihailesti
4 Constantin Mihai 1… 135 47 163 Bucharest
5 Gheorghe Florin 1… 137 49 179 Bucharest
6 Ionescu Gabriela 2… 139 44 3 Bucharest
7 Ionescu Adrian 1… 132 50 175 Bucharest
8 Popescu Adrian 1… 135 48 173 Otopeni
9 Popescu Alina 2… 139 41 160 Bucharest
10 Zamfir Ion 1… 135 50 3 Buftea
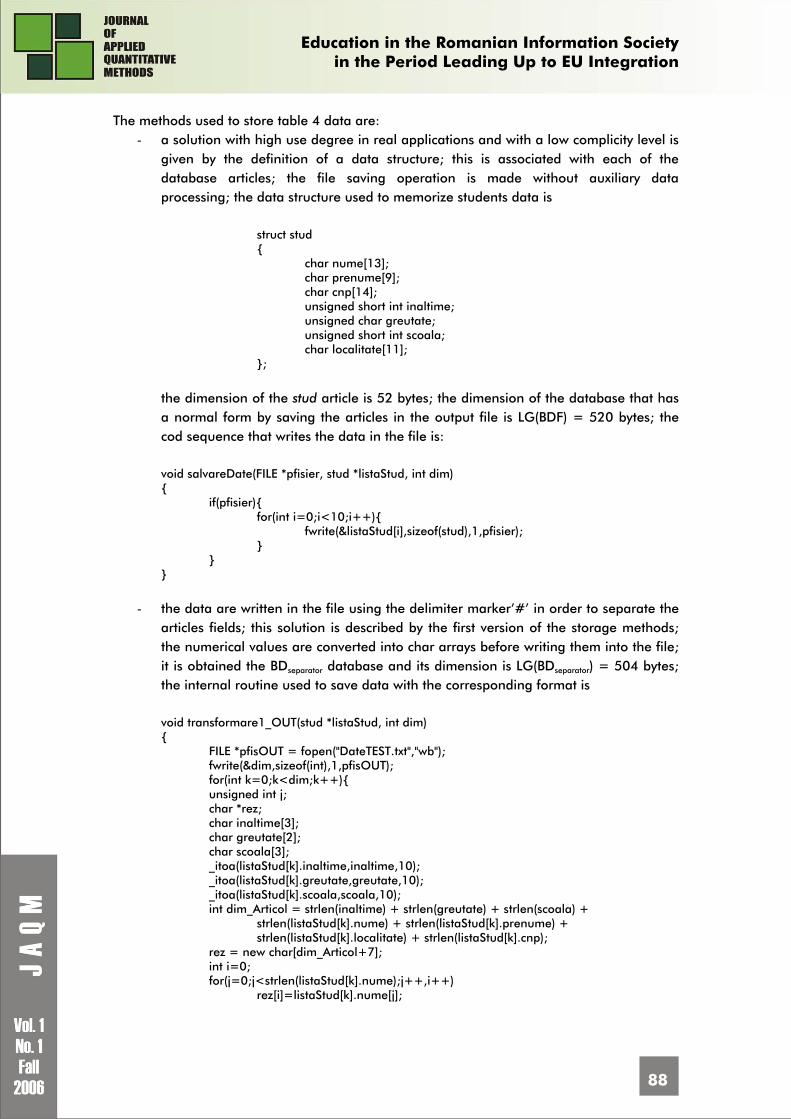
Education in the Romanian Information Society
in the Period Leading Up to EU Integration
88
The methods used to store table 4 data are: - a solution with high use degree in real applications and with a low complicity level is
given by the definition of a data structure; this is associated with each of the database articles; the file saving operation is made without auxiliary data processing; the data structure used to memorize students data is
struct stud { char nume[13]; char prenume[9]; char cnp[14]; unsigned short int inaltime; unsigned char greutate; unsigned short int scoala; char localitate[11]; };
the dimension of the stud article is 52 bytes; the dimension of the database that has a normal form by saving the articles in the output file is LG(BDF) = 520 bytes; the cod sequence that writes the data in the file is: void salvareDate(FILE *pfisier, stud *listaStud, int dim) { if(pfisier){ for(int i=0;i<10;i++){ fwrite(&listaStud[i],sizeof(stud),1,pfisier); } } }
- the data are written in the file using the delimiter marker’#’ in order to separate the articles fields; this solution is described by the first version of the storage methods; the numerical values are converted into char arrays before writing them into the file; it is obtained the BDseparator database and its dimension is LG(BDseparator) = 504 bytes; the internal routine used to save data with the corresponding format is void transformare1_OUT(stud *listaStud, int dim) { FILE *pfisOUT = fopen("DateTEST.txt","wb"); fwrite(&dim,sizeof(int),1,pfisOUT); for(int k=0;k<dim;k++){ unsigned int j; char *rez; char inaltime[3]; char greutate[2]; char scoala[3]; _itoa(listaStud[k].inaltime,inaltime,10); _itoa(listaStud[k].greutate,greutate,10); _itoa(listaStud[k].scoala,scoala,10);
int dim_Articol = strlen(inaltime) + strlen(greutate) + strlen(scoala) + strlen(listaStud[k].nume) + strlen(listaStud[k].prenume) + strlen(listaStud[k].localitate) + strlen(listaStud[k].cnp);
rez = new char[dim_Articol+7]; int i=0; for(j=0;j<strlen(listaStud[k].nume);j++,i++) rez[i]=listaStud[k].nume[j];
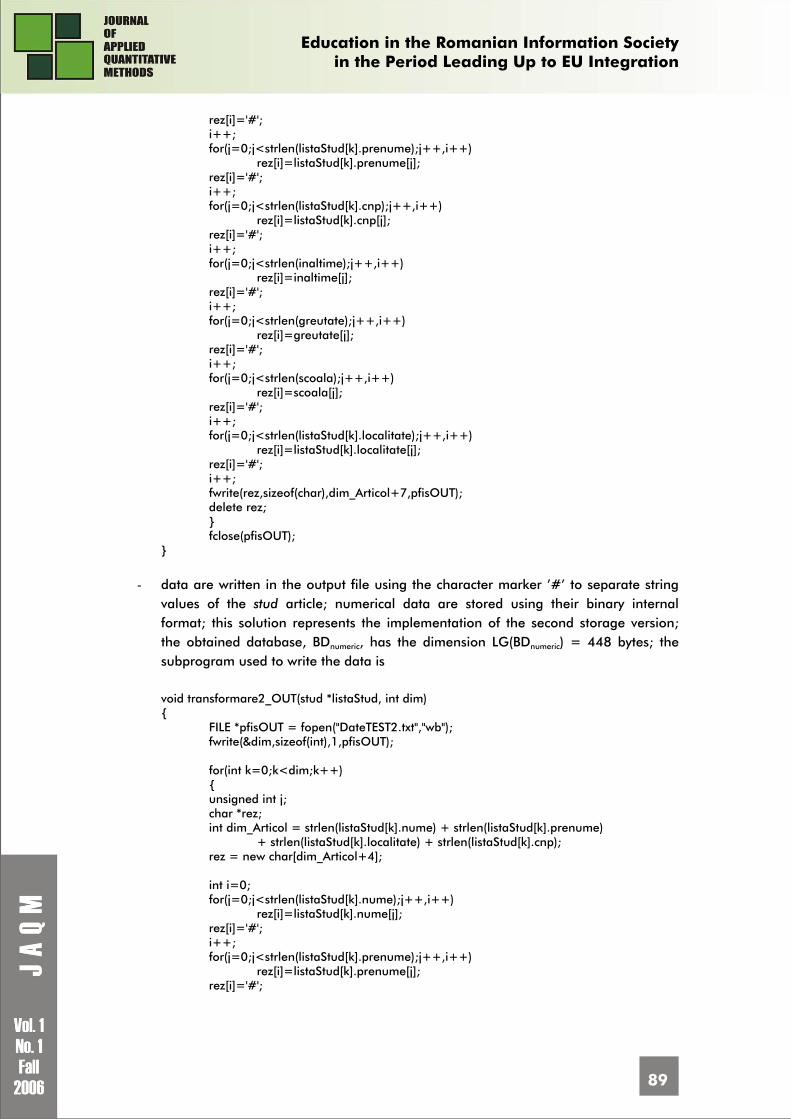
Education in the Romanian Information Society
in the Period Leading Up to EU Integration
89
rez[i]='#'; i++; for(j=0;j<strlen(listaStud[k].prenume);j++,i++) rez[i]=listaStud[k].prenume[j]; rez[i]='#'; i++; for(j=0;j<strlen(listaStud[k].cnp);j++,i++) rez[i]=listaStud[k].cnp[j]; rez[i]='#'; i++; for(j=0;j<strlen(inaltime);j++,i++) rez[i]=inaltime[j]; rez[i]='#'; i++; for(j=0;j<strlen(greutate);j++,i++) rez[i]=greutate[j]; rez[i]='#'; i++; for(j=0;j<strlen(scoala);j++,i++) rez[i]=scoala[j]; rez[i]='#'; i++; for(j=0;j<strlen(listaStud[k].localitate);j++,i++) rez[i]=listaStud[k].localitate[j]; rez[i]='#'; i++; fwrite(rez,sizeof(char),dim_Articol+7,pfisOUT); delete rez; } fclose(pfisOUT); }
- data are written in the output file using the character marker ’#’ to separate string values of the stud article; numerical data are stored using their binary internal format; this solution represents the implementation of the second storage version; the obtained database, BDnumeric, has the dimension LG(BDnumeric) = 448 bytes; the subprogram used to write the data is void transformare2_OUT(stud *listaStud, int dim) { FILE *pfisOUT = fopen("DateTEST2.txt","wb"); fwrite(&dim,sizeof(int),1,pfisOUT); for(int k=0;k<dim;k++) { unsigned int j; char *rez; int dim_Articol = strlen(listaStud[k].nume) + strlen(listaStud[k].prenume)
+ strlen(listaStud[k].localitate) + strlen(listaStud[k].cnp); rez = new char[dim_Articol+4]; int i=0; for(j=0;j<strlen(listaStud[k].nume);j++,i++) rez[i]=listaStud[k].nume[j]; rez[i]='#'; i++; for(j=0;j<strlen(listaStud[k].prenume);j++,i++) rez[i]=listaStud[k].prenume[j]; rez[i]='#';
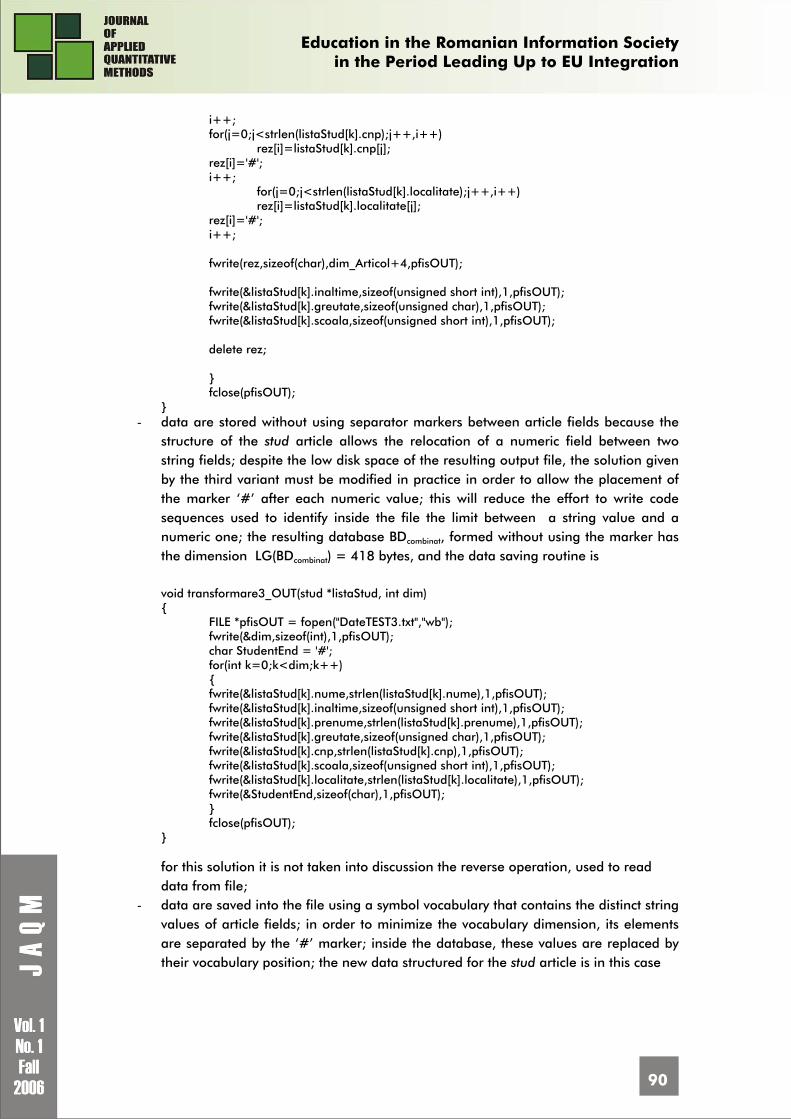
Education in the Romanian Information Society
in the Period Leading Up to EU Integration
90
i++; for(j=0;j<strlen(listaStud[k].cnp);j++,i++) rez[i]=listaStud[k].cnp[j]; rez[i]='#'; i++; for(j=0;j<strlen(listaStud[k].localitate);j++,i++) rez[i]=listaStud[k].localitate[j]; rez[i]='#'; i++; fwrite(rez,sizeof(char),dim_Articol+4,pfisOUT); fwrite(&listaStud[k].inaltime,sizeof(unsigned short int),1,pfisOUT); fwrite(&listaStud[k].greutate,sizeof(unsigned char),1,pfisOUT); fwrite(&listaStud[k].scoala,sizeof(unsigned short int),1,pfisOUT); delete rez; } fclose(pfisOUT); }
- data are stored without using separator markers between article fields because the structure of the stud article allows the relocation of a numeric field between two string fields; despite the low disk space of the resulting output file, the solution given by the third variant must be modified in practice in order to allow the placement of the marker ‘#’ after each numeric value; this will reduce the effort to write code sequences used to identify inside the file the limit between a string value and a numeric one; the resulting database BDcombinat, formed without using the marker has the dimension LG(BDcombinat) = 418 bytes, and the data saving routine is void transformare3_OUT(stud *listaStud, int dim) { FILE *pfisOUT = fopen("DateTEST3.txt","wb"); fwrite(&dim,sizeof(int),1,pfisOUT); char StudentEnd = '#'; for(int k=0;k<dim;k++) { fwrite(&listaStud[k].nume,strlen(listaStud[k].nume),1,pfisOUT); fwrite(&listaStud[k].inaltime,sizeof(unsigned short int),1,pfisOUT); fwrite(&listaStud[k].prenume,strlen(listaStud[k].prenume),1,pfisOUT); fwrite(&listaStud[k].greutate,sizeof(unsigned char),1,pfisOUT); fwrite(&listaStud[k].cnp,strlen(listaStud[k].cnp),1,pfisOUT); fwrite(&listaStud[k].scoala,sizeof(unsigned short int),1,pfisOUT); fwrite(&listaStud[k].localitate,strlen(listaStud[k].localitate),1,pfisOUT); fwrite(&StudentEnd,sizeof(char),1,pfisOUT); } fclose(pfisOUT); } for this solution it is not taken into discussion the reverse operation, used to read data from file;
- data are saved into the file using a symbol vocabulary that contains the distinct string values of article fields; in order to minimize the vocabulary dimension, its elements are separated by the ‘#’ marker; inside the database, these values are replaced by their vocabulary position; the new data structured for the stud article is in this case
Education in the Romanian Information Society
in the Period Leading Up to EU Integration
91
struct pozvocabular { unsigned char poznume; unsigned char pozprenume; unsigned char pozcnp; unsigned short int inaltime; unsigned char greutate; unsigned short int scoala; unsigned char pozloc; }; the new database dimension is BDvocabular and it is obtained by summing the vocabulary dimension and the values zone length, LG(BDvocabular) = 299 + 124 = 423 bytes; because the example dataset has reduced size, it is not highlighted this solution efficiency; the code sequence used to convert the database from the normal form to the current one is void transformare4_OUT(stud *listaStud, int dim) { vocabular *Vocabular = NULL; vocabular *VocabularEnd = NULL; int flag=0; FILE *pfisOUT = fopen("DateTEST4.txt","wb"); fwrite(&dim,sizeof(int),1,pfisOUT); // se construieste vocabularul pozvocabular elemCurent; int elemDictionar = 0; for(int k=0;k<dim;k++) { elemCurent.greutate=listaStud[k].greutate; elemCurent.inaltime=listaStud[k].inaltime; elemCurent.scoala=listaStud[k].scoala; flag = IsInVocabular(listaStud[k].nume,Vocabular); if(flag==-1) { AddVocabular(listaStud[k].nume,Vocabular, VocabularEnd); elemCurent.poznume=elemDictionar; elemDictionar++; } else elemCurent.poznume=flag; flag = IsInVocabular(listaStud[k].prenume,Vocabular); if(flag==-1) { AddVocabular(listaStud[k].prenume,Vocabular, VocabularEnd); elemCurent.pozprenume=elemDictionar; elemDictionar++; } else elemCurent.pozprenume=flag; flag = IsInVocabular(listaStud[k].cnp,Vocabular); if(flag==-1) { AddVocabular(listaStud[k].cnp,Vocabular, VocabularEnd);
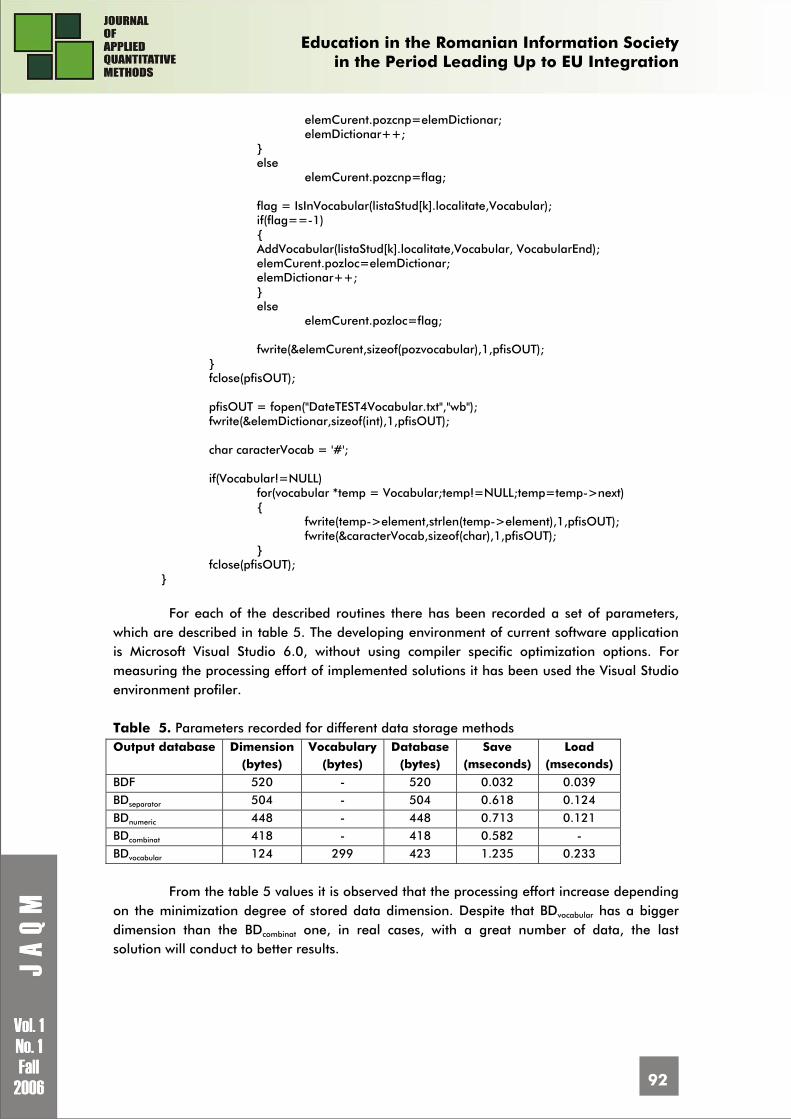
Education in the Romanian Information Society
in the Period Leading Up to EU Integration
92
elemCurent.pozcnp=elemDictionar; elemDictionar++; } else elemCurent.pozcnp=flag; flag = IsInVocabular(listaStud[k].localitate,Vocabular); if(flag==-1) { AddVocabular(listaStud[k].localitate,Vocabular, VocabularEnd); elemCurent.pozloc=elemDictionar; elemDictionar++; } else elemCurent.pozloc=flag; fwrite(&elemCurent,sizeof(pozvocabular),1,pfisOUT); } fclose(pfisOUT); pfisOUT = fopen("DateTEST4Vocabular.txt","wb"); fwrite(&elemDictionar,sizeof(int),1,pfisOUT); char caracterVocab = '#'; if(Vocabular!=NULL) for(vocabular *temp = Vocabular;temp!=NULL;temp=temp->next) { fwrite(temp->element,strlen(temp->element),1,pfisOUT); fwrite(&caracterVocab,sizeof(char),1,pfisOUT); } fclose(pfisOUT); } For each of the described routines there has been recorded a set of parameters,
which are described in table 5. The developing environment of current software application is Microsoft Visual Studio 6.0, without using compiler specific optimization options. For measuring the processing effort of implemented solutions it has been used the Visual Studio environment profiler. Table 5. Parameters recorded for different data storage methods Output database Dimension
(bytes) Vocabulary
(bytes) Database
(bytes) Save
(mseconds) Load
(mseconds)
BDF 520 - 520 0.032 0.039 BDseparator 504 - 504 0.618 0.124 BDnumeric 448 - 448 0.713 0.121 BDcombinat 418 - 418 0.582 - BDvocabular 124 299 423 1.235 0.233
From the table 5 values it is observed that the processing effort increase depending
on the minimization degree of stored data dimension. Despite that BDvocabular has a bigger dimension than the BDcombinat one, in real cases, with a great number of data, the last solution will conduct to better results.
Education in the Romanian Information Society
in the Period Leading Up to EU Integration
93
Conclusions
Real world collectivities have defined descriptions accordingly to needed objectives. From this point of view it is important to define article structures that are enough flexible so that changes in objectives will not affect them in a radical manner.
In the analysis phase, for each database and file there are developed new storage solutions, the designers’ vision having an important impact on that. Taking into discussion and promoting new solutions there are defined the premises for further development of the creative spirit into the direction of adapting all optimization instruments, techniques, methods and algorithms for particular cases. The objective is to obtain numerous different solution for storing data in order to analyze them and to select the one that gives the best results.
For each problem there are defined specific performance criteria and the procedures used to measure optimization effects, providing in this manner the base for variants comparability.
As there is accumulated more experience regarding data storage optimization there will be obtained homogenous databases that have efficient storing techniques.
Based on practical experience there are defined optimal storage procedure, specifying which storage method give best results for a database that has well defined characteristics.
Bibliography 1. Catalin BOJA Software Multicriterial Optimization, The Proceedings of the Seventh
International Conference of Informatics in Economy, Academy of Economic Studies, Bucharest, Romania, Inforec Printing House, p. 1068 – 1074, May 2005
2. Graeme C. Simsion and Graham C. Witt Data Modeling Essentials, Third Edition, Morgan Kaufmann Publishers, 2005
3. IEEE Standards Collection Software Engineering, Std. 1061-1992 IEEE standard for software quality metrics methodology, Published by The Institute of Electrical and Electronics Engineers, New York, 1994
4. ISO/IEC 9126 International Standard - Information Technology Software product evaluation - Quality characteristics and guidelines for their use, Geneve, Switzerland, 1991
5. Ion IVAN, Catalin BOJA Statistical methods in software analysis, ASE Printing House, 2004 (in Romanian)
6. Ion IVAN, Catalin BOJA Empirical Software Optimization, Economic Informatics Magazine, vol. IX, nr. 2/2005, Inforec Printing House, Bucharest, 2005 (in Romanian)
7. Ion IVAN, Catalin BOJA Global Software Optimization, p. 205 – 214, “Information Systems & Operations Management – ISOM” no. 3 Workshop, April 20 – 21, 2005 Romanian American University Master of Economic Informatics, Academy of Economic Studies Master BRIE, Bucharest, ProUniversalis Printing House, 2005
8. Ion IVAN, Catalin BOJA Optimizarea bicriteriala a produselor program, Economic Informatics Magazine, vol. 10, nr. 1/2006, p. 17 – 24
9. Ion IVAN, Gh. NOSCA, O PARLOG, S. TCACIUC Data quality, Inforec Printing House, Bucharest, 1999 (in Romanian)
Education in the Romanian Information Society
in the Period Leading Up to EU Integration
94
10. Gh. Nosca, I. Ivan, A. Parlog Data Quality Assurance, Quality Assurance Review, vol. 2, no. 8, 1998, p. 8-14
11. Laurentiu TEODORESCU, Ion IVAN Managementul Calitatii Software, Inforec Printing House, Bucharest, 2001
1 Catalin Boja is Assistant Lecturer at the Economic Informatics Department at the Academy of Economic Studies in Bucharest, Romania. In June 2004 he has graduated the Faculty of Cybernetics, Statistics and Economic Informatics at the Academy of Economic Studies in Bucharest. In March 2006 he has graduated the Informatics Project Management Master program organized by the Academy of Economic Studies of Bucharest. He is a team member in various undergoing university research projects where he applied most of his project management knowledge. Also he has received a type D IPMA certification in project management from Romanian Project Management Association which is partner of the IPMA organization. He is the author of more than 40 journal articles and scientific presentations at conferences. His work focuses on the analysis of data structures, assembler and high level programming languages. He is currently conducting a PhD study on software optimization and on improvement of software applications performance.
Education in the Romanian Information Society
in the Period Leading Up to EU Integration
95
MODELLING THE EDUCATIONAL PROCESS IN ASYMMETRIC INFORMATION
Dumitru MARIN1 PhD, University Professor, Department of Economic Cybernetics Academy of Economic Studies, Bucharest, Romania More than 30 papers and articles regarding efficiency and productivity, Pareto optimality, welfare economics, advanced microeconomics. E-mail: [email protected]
Daniela MARINESCU2 PhD, University Lecturer, Department of Economic Cybernetics Academy of Economic Studies, Bucharest, Romania More than 10 papers and articles regarding efficiency and productivity, Pareto optimality, welfare economics, advanced microeconomics E-mail: [email protected] Abstract: The level of education is highly related to the future possibilities to find a job. It is obvious that the people with university degrees have better chances that the other ones. A person with higher education degree has larger chances to go into the labour market and for a better position his well being will growth too. As well as the well being of people depending on him. Key words: modelling, education process, asymmetric information
The educational process is important not only for the main purpose to create an
intelligent labour market capable to offer highly trained people to fulfil complex requests of modern world.
The signals offered by the labour force are due to the education received and reveal skills, wishes and other types of information that help the individual to evaluate himself for all his life. They also show information to a potential employer, information that help him to compare the abilities of a large number of individuals that wishes to be hired. The employer’s opinion about an individual just form knowing a certain signal is not perfect but their recognition is used instead of interviews, tests or training period.
If an individual passes a difficult exam (mathematics) with a high grade, the fact may represent a signal strong enough so an individual can work in IT where the information changes very fast.
The problem of educational signals is not recent; it represents the subject of many debates, especially since Michael Spence published his master thesis3 in 1974. Previous papers belong to Arrow4, Fields5 and Thurov6.
A complex educational signals is made by Stiglitz7.
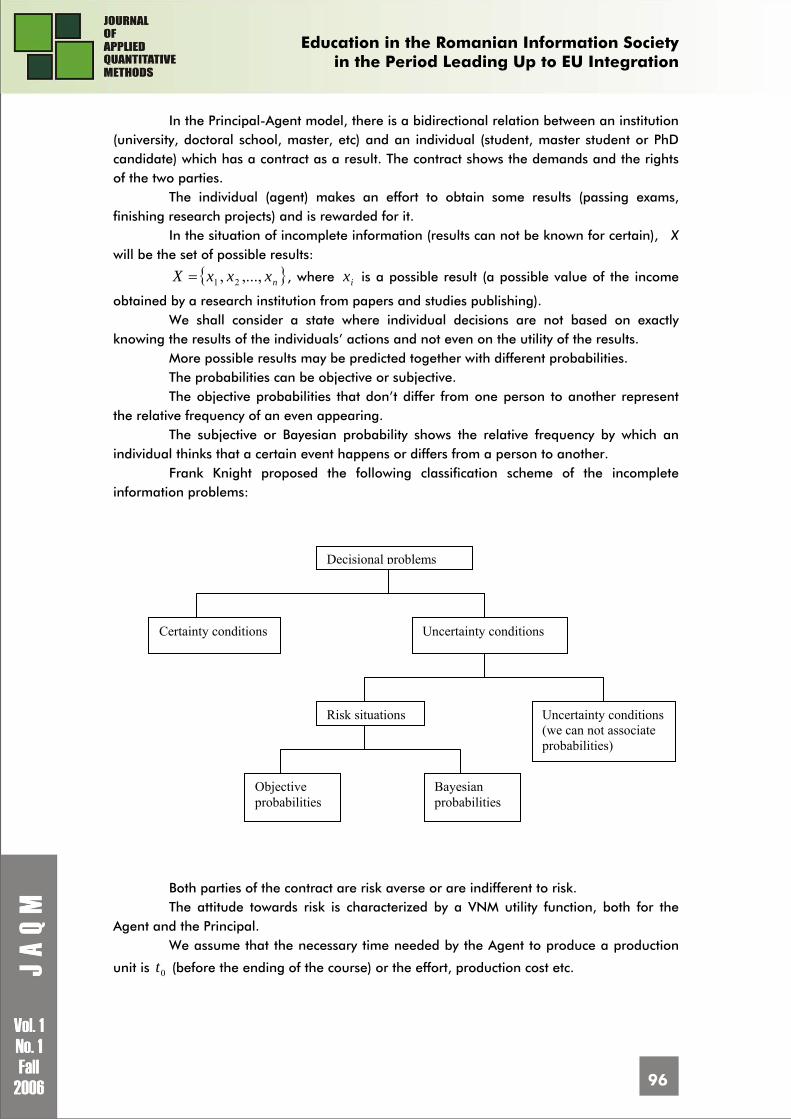
Education in the Romanian Information Society
in the Period Leading Up to EU Integration
96
In the Principal-Agent model, there is a bidirectional relation between an institution (university, doctoral school, master, etc) and an individual (student, master student or PhD candidate) which has a contract as a result. The contract shows the demands and the rights of the two parties.
The individual (agent) makes an effort to obtain some results (passing exams, finishing research projects) and is rewarded for it.
In the situation of incomplete information (results can not be known for certain), X will be the set of possible results:
{ }nxxxX ,...,, 21= , where ix is a possible result (a possible value of the income
obtained by a research institution from papers and studies publishing). We shall consider a state where individual decisions are not based on exactly
knowing the results of the individuals’ actions and not even on the utility of the results. More possible results may be predicted together with different probabilities. The probabilities can be objective or subjective. The objective probabilities that don’t differ from one person to another represent
the relative frequency of an even appearing. The subjective or Bayesian probability shows the relative frequency by which an
individual thinks that a certain event happens or differs from a person to another. Frank Knight proposed the following classification scheme of the incomplete
information problems:
Both parties of the contract are risk averse or are indifferent to risk. The attitude towards risk is characterized by a VNM utility function, both for the
Agent and the Principal. We assume that the necessary time needed by the Agent to produce a production
unit is 0t (before the ending of the course) or the effort, production cost etc.
Decisional problems
Certainty conditions Uncertainty conditions
Uncertainty conditions (we can not associate probabilities)
Risk situations
Objective probabilities
Bayesian probabilities
Education in the Romanian Information Society
in the Period Leading Up to EU Integration
97
If the Agent wishes to go to a certain school, he must pay a sum of money S (at the beginning) and then a sum of a for each monetary unit earned as a consequence of the degree held by the Agent. Let t be the necessary time to produce a unit or to earn a
monetary unit after the graduation. Obviously, we have 0tt < .
Next, we shall present a special type of contract8.
Definition1. A contract in symmetric information is given by the couple ),( aS .
The market demand )(⋅D and the agent revenue )(⋅V are expressed as functions of
average cost (or average time) denoted by x. If the price of a unit produced is )(xp , then
revenue function is written as:
))((])([)( xpDxxpxV −= (1)
Proposition 1. If )()(max)( pDxpArgxpp
−∈ , then ))(()( xpDdx
xdV−= .
Proof
The derivative of )()()( pDxppf −= is zero for )(xpp = :
0)()()(
=−= xpp
pDxpdpd
or
0))(('))(())(( =−+ xpDxxpxpD (2)
The revenue function from (1) derived with respect to x becomes:
=−+⎥⎦⎤
⎢⎣⎡ −=
dxxdpxpDxxpxpD
dxxdp
dxxdV )())(('])([))((1)()(
[ ] ))(())(()())(('))(())(( xpDxpDdx
xdpxpDxxpxpD −=−−+=
as in relation (2). The Principal’s objective is to maximize the revenues and it can be written as:
[ ])(max),(
ataDSaS
++
s.t.
)()( 0tVatVS −+≤ (3)
00
≥≥
aS
Theorem 1. The solution of the program (3) (the optimal contract under symmetric
information) is Pareto optimal and is given by the couple ( )0),()()~,~( 0tVtVaS −= .
Proof
Using Kuhn-Tucker method, the multipliers 1,λλ and 2λ are attached to the
constraints in (3). The Lagrangean function is:
[ ] aSStVatVataDSaSL 21021 )()()(),,;,( λλλλλλ ++−−++++=
Education in the Romanian Information Society
in the Period Leading Up to EU Integration
98
Searching for an interior optimum, we set the partial derivative with respect to S to zero:
0=∂∂SL
or 01 1 =+− λλ
That is: 01 1 >+= λλ
Then )()( 0tVatVS −+= (the first constraint is binding).
We can rewrite the program (3) in the following form:
[ ])()()(max 0 ataDtVatVa
++−+
This provides us:
0)(')()( =+++++− ataDatDatD
0~ =a and )()(~0tVtVS −= .
The partial derivatives of the Lagrangean function are:
λλλλ −=∂∂ 1),,;~,~( 21aSSL
0)(')('),,;~,~( 21 =+=∂∂ tVtDaS
aL λλλλ
or
)(' pDdpdV
−= (4)
(4) corresponds to the condition for Pareto optimality satisfied by the optimal contract under symmetric information.
Next, we consider the same problem, but in the case of asymmetric information, where the Agent has hidden information about the contract. For instance, he knows how important is the production plan received from the Decident. Further, we suppose that the
type of the program is good (G) - with probability π - or bad - with the probability π−1 . Definition2. A contract under asymmetric information is given by the couples:
( ) ( ){ }BBGG aSaS ,,, .
We have 00 , tttt BG << and BG tt < .
We can formulate now the Principal’s program (i.e., maximizing expected
revenues):
{ }
[ ][ ]{ })()1()(max,,,
BBBBGGGG
aSaSatDaSatDaS
BBGG++−+++ ππ
s.t.
0)()( ≥++−−+ BBGGGG SatVSatV (5)
0)()( ≥++−−+ GGBBBB FatVSatV (6)
0)()( 0 ≥−−+ GGG StVatV (7)
0)()( 0 ≥−−+ BBB StVatV (8)
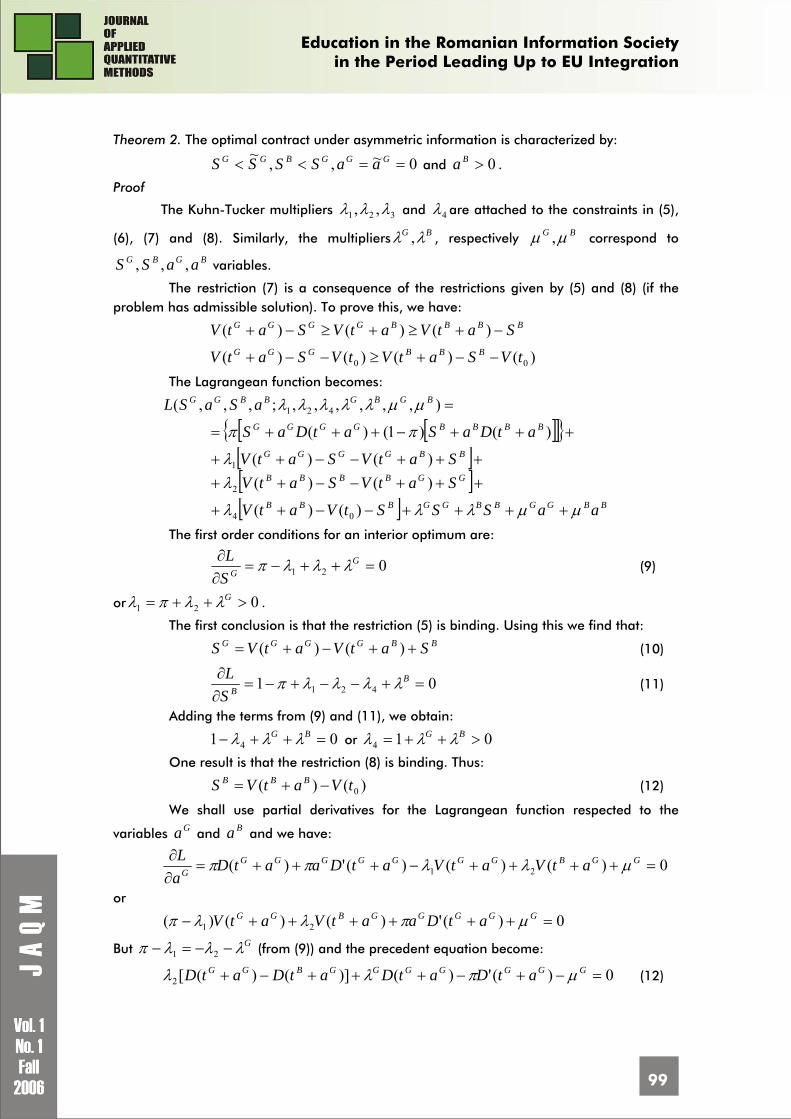
Education in the Romanian Information Society
in the Period Leading Up to EU Integration
99
Theorem 2. The optimal contract under asymmetric information is characterized by:
0~,,~==<< GGGBGG aaSSSS and 0>Ba .
Proof
The Kuhn-Tucker multipliers 321 ,, λλλ and 4λ are attached to the constraints in (5),
(6), (7) and (8). Similarly, the multipliers BG λλ , , respectively BG μμ , correspond to BGBG aaSS ,,, variables.
The restriction (7) is a consequence of the restrictions given by (5) and (8) (if the problem has admissible solution). To prove this, we have:
BBBBGGGG SatVatVSatV −+≥+≥−+ )()()(
)()()()( 00 tVSatVtVSatV BBBGGG −−+≥−−+
The Lagrangean function becomes:
=),,,,,,;,,,( 421BGBGBBGG aSaSL μμλλλλλ
[ ][ ]{ }+++−+++= )()1()( BBBBGGGG atDaSatDaS ππ
[ ]+++−−++ BBGGGG SatVSatV )()(1λ [ ]+++−−++ GGBBBB SatVSatV )()(2λ
[ ] BBGGBBGGBBB aaSSStVatV μμλλλ ++++−−++ )()( 04
The first order conditions for an interior optimum are:
021 =++−=∂∂ G
GSL λλλπ (9)
or 021 >++= Gλλπλ .
The first conclusion is that the restriction (5) is binding. Using this we find that:
BBGGGG SatVatVS ++−+= )()( (10)
01 421 =+−−+−=∂∂ B
BSL λλλλπ (11)
Adding the terms from (9) and (11), we obtain:
01 4 =++− BG λλλ or 014 >++= BG λλλ
One result is that the restriction (8) is binding. Thus:
)()( 0tVatVS BBB −+= (12)
We shall use partial derivatives for the Lagrangean function respected to the
variables Ga and Ba and we have:
0)()()(')( 21 =++++−+++=∂∂ GGBGGGGGGG
G atVatVatDaatDaL μλλππ
or
0)(')()()( 21 =++++++− GGGGGBGG atDaatVatV μπλλπ
But Gλλλπ −−=− 21 (from (9)) and the precedent equation become:
0)(')()]()([2 =−+−+++−+ GGGGGGGBGG atDatDatDatD μπλλ (12)
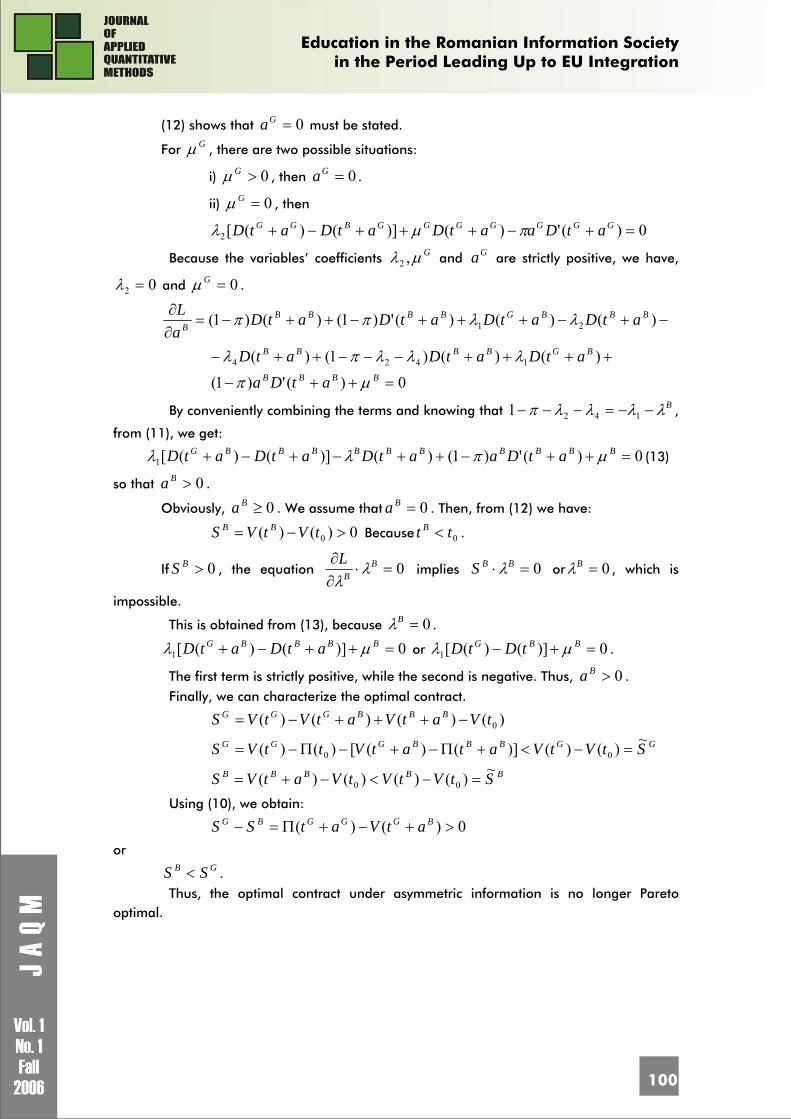
Education in the Romanian Information Society
in the Period Leading Up to EU Integration
100
(12) shows that 0=Ga must be stated.
For Gμ , there are two possible situations:
i) 0>Gμ , then 0=Ga .
ii) 0=Gμ , then
0)(')()]()([2 =+−+++−+ GGGGGGGBGG atDaatDatDatD πμλ
Because the variables’ coefficients Gμλ ,2 and Ga are strictly positive, we have,
02 =λ and 0=Gμ .
−+−+++−++−=∂∂ )()()(')1()()1( 21
BBBGBBBBB atDatDatDatD
aL λλππ
0)(')1(
)()()1()( 1424
=++−
++++−−−++−BBBB
BGBBBB
atDa
atDatDatD
μπ
λλλπλ
By conveniently combining the terms and knowing that Bλλλλπ −−=−−− 1421 ,
from (11), we get:
0)(')1()()]()([1 =++−++−+−+ BBBBBBBBBBG atDaatDatDatD μπλλ (13)
so that 0>Ba .
Obviously, 0≥Ba . We assume that 0=Ba . Then, from (12) we have:
0)()( 0 >−= tVtVS BB Because 0tt B < .
If 0>BS , the equation 0=⋅∂∂ B
B
L λλ
implies 0=⋅ BBS λ or 0=Bλ , which is
impossible.
This is obtained from (13), because 0=Bλ .
0)]()([1 =++−+ BBBBG atDatD μλ or 0)]()([1 =+− BBG tDtD μλ .
The first term is strictly positive, while the second is negative. Thus, 0>Ba .
Finally, we can characterize the optimal contract.
)()()()( 0tVatVatVtVS BBBGGG −+++−=
GGBBBGGG StVtVatatVttVS ~)()()]()([)()( 00 =−<+Π−+−Π−=
BBBBB StVtVtVatVS ~)()()()( 00 =−<−+=
Using (10), we obtain:
0)()( >+−+Π=− BGGGBG atVatSS
or GB SS < .
Thus, the optimal contract under asymmetric information is no longer Pareto optimal.
Education in the Romanian Information Society
in the Period Leading Up to EU Integration
101
References 1. Arrow K., Higher Education as a Filler, Journal of Public Economics, nr.2, 193-216, 1973 2. Fields G., Towards a Model of Education and Labour Markets in Labour Surplus
Economics, Yale University mimeo, 1973 3. Macho-Stadler I., Perez-Castrillo D., An Introduction to the Economics of Information, Oxford
University Press, 1997 4. Spence M., Job Market Signalling, Quarterly journal of Economics, nr.87, 355-379, 1973 5. Spence M., Market Signalling, Cambridge, Massachusetts, Harvard University Press, 1974 6. Stiglitz J.E., The Theory of Screening, Education and the Distribution of Income, American
Economic Review, nr.65, 283-300, 1975 7. Thurow L., Education and Economic Equality, Public Interest, nr. 20, 61-81, 1972
1 Professor Dumitru MARIN, PhD - graduated Mathematic-Mechanic Faculty, Functional Equations Department of Bucharest University in 1969 and Economic Calculation and Economics Cybernetic Faculty, Economic Cybernetics Department of ASE in 1979 - PhD in Economics from 1980, in Economic Cybernetics field - PhD adviser, in Economic Cybernetics and Statistics field - Scientific interest fields: Theory of Optimal Systems, Economic Cybernetics, Advanced Microeconomics, General Equilibrium Theory, Contracts’ Theory, Welfare Economics - more than 30 papers and articles regarding efficiency and productivity, Pareto optimality, welfare economics, advanced microeconomics 2 Lecturer Daniela MARINESCU, PhD - graduated Economics Cybernetic Faculty, Economic Mathematics Department of ASE in 1999 - PhD in Economics from 2006, in Economic Cybernetics field - Scientific interest fields: Advanced Microeconomics, Contracts' Theory, Efficiency and Productivity, General Equilibrium Theory, Welfare Economics - more than 10 papers and articles regarding efficiency and productivity, Pareto optimality, welfare economics, advanced microeconomics 3 Spence M., Market Signalling, Cambridge, Massachusetts, Harvard University Press, 1974 4 Arrow K., Higher Education as a Filler, Journal of Public Economics, nr.2, 193-216, 1973 5 Fields G., Towards a Model of Education and Labour Markets in Labour Surplus Economics, Yale University mimeo, 1973 6 Thurow L., Education and Economic Equality, Public Interest, nr. 20, 61-81, 1972 7 Stiglitz J.E., The Theory of Screening, Education and the Distribution of Income, American Economic Review, nr.65, 283-300, 1975 8 adapted from Macho-Stadler I., Perez-Castrillo D., An Introduction to the Economics of Information, Oxford University Press, 1997, p. 149
Quantitative Methods Inquiries
102
EVALUATION METHODS OF THE TEXT ENTITIES
Marius POPA1 PhD, University Lecturer, Economic Informatics Department Academy of Economic Studies, Bucharest, Romania PhD Disertation Title: Methods and techniques used in the qualitative evaluation of the data (2005) E-mail: [email protected] Abstract: The paper highlights some evaluation methods to assess the quality characteristics of the text entities. The main concepts used in building and evaluation processes of the text entities are presented. Also, some aggregated metrics for orthogonality measurements are presented. The evaluation process for automatic evaluation of the text entities is made by software application. These ones implement the metric system for text entity quality characteristic evaluation. The metrics and software application are validated through testing examples. Key words: Assessment, Quality, Text entity 1. Introduction: Concepts and definitions
In (Marius Popa, 2005), (Ivan, Popa, 2005), (Ivan, 2003), (Ivan, Popa, Boja, Toma,
2005, 43–57) some concepts used in building, analysis and evaluation of the text entities are defined and presented. The used concepts include the following elements: alphabet, word, vocabulary, subvocabulary, text, template, structured text, entity.
For each used concept, it is offered a definition, the necessity of its using, its characteristics, using forms, ways for information representation through its using, models, requirements and examples of building and using.
Through defined concepts, it is highlighted some representation and structuring forms of data. The data quality is given by the level assured for quality characteristics associated to data. The identification and quantification of data quality characteristics are critical activities in control and assurance processes of the quality.
According to definition from (Marius Popa, 2005), the text entities are constructions formed by word strings characterized by word positions in text, word grouping in order to define a context, by correspondence of the words with elements, actions and phenomenon from real world, qualitative attributes that group concrete aspects from real world in homogenous collectivities in connection with established criteria.
In (Ivan, Popa, 2005), the conditions that must be respected in building process of the text entities are established. These ones look upon the following aspects:
• A strong delimitation of the approached domain; • Key word definition for the domain; • Vocabulary used, that also includes the key word vocabulary;
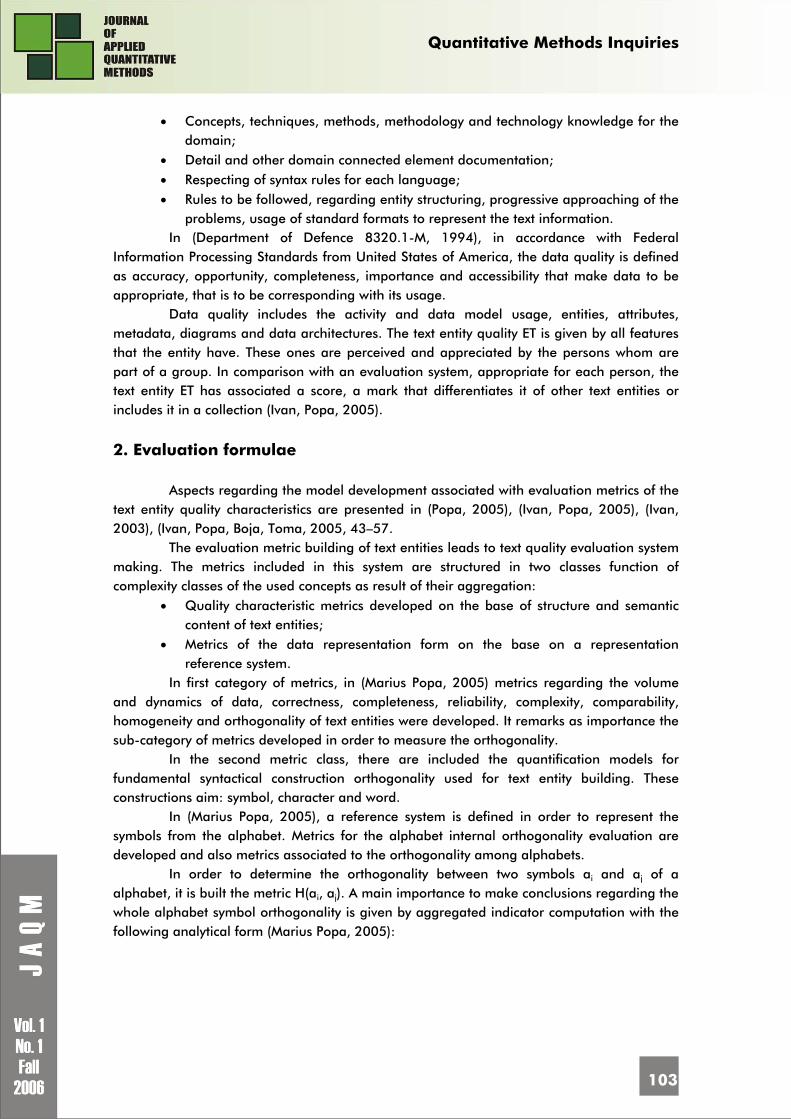
Quantitative Methods Inquiries
103
• Concepts, techniques, methods, methodology and technology knowledge for the domain;
• Detail and other domain connected element documentation; • Respecting of syntax rules for each language; • Rules to be followed, regarding entity structuring, progressive approaching of the
problems, usage of standard formats to represent the text information. In (Department of Defence 8320.1-M, 1994), in accordance with Federal
Information Processing Standards from United States of America, the data quality is defined as accuracy, opportunity, completeness, importance and accessibility that make data to be appropriate, that is to be corresponding with its usage.
Data quality includes the activity and data model usage, entities, attributes, metadata, diagrams and data architectures. The text entity quality ET is given by all features that the entity have. These ones are perceived and appreciated by the persons whom are part of a group. In comparison with an evaluation system, appropriate for each person, the text entity ET has associated a score, a mark that differentiates it of other text entities or includes it in a collection (Ivan, Popa, 2005).
2. Evaluation formulae
Aspects regarding the model development associated with evaluation metrics of the text entity quality characteristics are presented in (Popa, 2005), (Ivan, Popa, 2005), (Ivan, 2003), (Ivan, Popa, Boja, Toma, 2005, 43–57.
The evaluation metric building of text entities leads to text quality evaluation system making. The metrics included in this system are structured in two classes function of complexity classes of the used concepts as result of their aggregation:
• Quality characteristic metrics developed on the base of structure and semantic content of text entities;
• Metrics of the data representation form on the base on a representation reference system.
In first category of metrics, in (Marius Popa, 2005) metrics regarding the volume and dynamics of data, correctness, completeness, reliability, complexity, comparability, homogeneity and orthogonality of text entities were developed. It remarks as importance the sub-category of metrics developed in order to measure the orthogonality.
In the second metric class, there are included the quantification models for fundamental syntactical construction orthogonality used for text entity building. These constructions aim: symbol, character and word.
In (Marius Popa, 2005), a reference system is defined in order to represent the symbols from the alphabet. Metrics for the alphabet internal orthogonality evaluation are developed and also metrics associated to the orthogonality among alphabets.
In order to determine the orthogonality between two symbols ai and aj of a alphabet, it is built the metric H(ai, aj). A main importance to make conclusions regarding the whole alphabet symbol orthogonality is given by aggregated indicator computation with the following analytical form (Marius Popa, 2005):
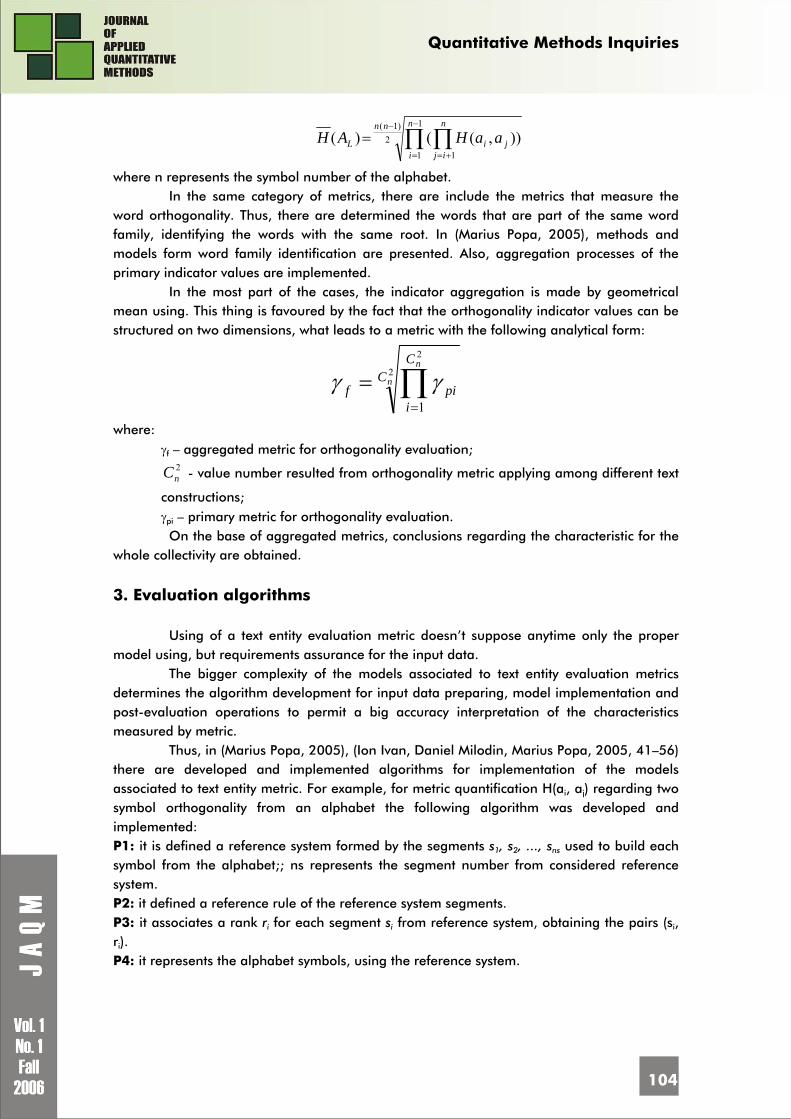
Quantitative Methods Inquiries
104
2)1( 1
1 1
)),(()(− −
= +=∏ ∏=
nn n
i
n
ijjiL aaHAH
where n represents the symbol number of the alphabet. In the same category of metrics, there are include the metrics that measure the
word orthogonality. Thus, there are determined the words that are part of the same word family, identifying the words with the same root. In (Marius Popa, 2005), methods and models form word family identification are presented. Also, aggregation processes of the primary indicator values are implemented.
In the most part of the cases, the indicator aggregation is made by geometrical mean using. This thing is favoured by the fact that the orthogonality indicator values can be structured on two dimensions, what leads to a metric with the following analytical form:
2
2
1
n
nC
C
ipif ∏
=
= γγ
where: γf – aggregated metric for orthogonality evaluation;
2nC - value number resulted from orthogonality metric applying among different text
constructions; γpi – primary metric for orthogonality evaluation. On the base of aggregated metrics, conclusions regarding the characteristic for the
whole collectivity are obtained.
3. Evaluation algorithms
Using of a text entity evaluation metric doesn’t suppose anytime only the proper model using, but requirements assurance for the input data.
The bigger complexity of the models associated to text entity evaluation metrics determines the algorithm development for input data preparing, model implementation and post-evaluation operations to permit a big accuracy interpretation of the characteristics measured by metric.
Thus, in (Marius Popa, 2005), (Ion Ivan, Daniel Milodin, Marius Popa, 2005, 41–56) there are developed and implemented algorithms for implementation of the models associated to text entity metric. For example, for metric quantification H(ai, aj) regarding two symbol orthogonality from an alphabet the following algorithm was developed and implemented: P1: it is defined a reference system formed by the segments s1, s2, ..., sns used to build each symbol from the alphabet;; ns represents the segment number from considered reference system. P2: it defined a reference rule of the reference system segments. P3: it associates a rank ri for each segment si from reference system, obtaining the pairs (si, ri). P4: it represents the alphabet symbols, using the reference system.
Quantitative Methods Inquiries
105
P5: it builds a matrix M(AL) such as the element mij = 1 if to build the symbol ai from the alphabet AL it uses the reference segment sj. If the reference segment sj is not used then mij
= 0. P6: it computes the sums on columns, Sj, to obtain the using frequencies of the segments from the reference system in symbol defining from the alphabet. P7: it computes the maximum and minimum sums, Smax and Smin. P8: it normalizes the values Sj on the base of the expression:
minmax
max
SSSS
Sn jj −
−=
The values Snj are included in [0; 1]. P9: it interchanges the columns of the matrix M(AL) to obtain an ascendant order for the values Snj. P10: it makes the correspondence of the values Snj with the segments sj from the chosen reference system. P11: it re-codifying the ranks of the reference system such as the new numbers to highlight
the using frequencies, obtaining the pairs (sj, '
ir ).
The presented algorithm is a rigorous way to evaluate the orthogonality of the symbol representations in an alphabet. The symbol representation orthogonality increasing has importance and use in building process of the text entity with symbols good differentiated.
4. Evaluation software
The determination through a software application of the quality characteristic values and text entity orthogonality metrics suppose the carrying on of the following activities:
• Application objective definition; • Input establishment on the base of quality characteristic system and metric
model study. • System architecture building; • Collecting, normalizing and organizing of the data in correspondence with metric
requirements; • Metric system implementation; • User interface designing in assistance of the process to establish the text entity
base orthogonality; • Metric system testing, tracing the software product behavior in limit cases
especially. In (Marius Popa, 2002) is presented the architecture and function of the product
Cloning Analysis Software – CAS. This software application implements the metrics for the fundamental characteristics for texts and data organized in matrixes. In figure 1, there are highlighted the modules of CAS application.
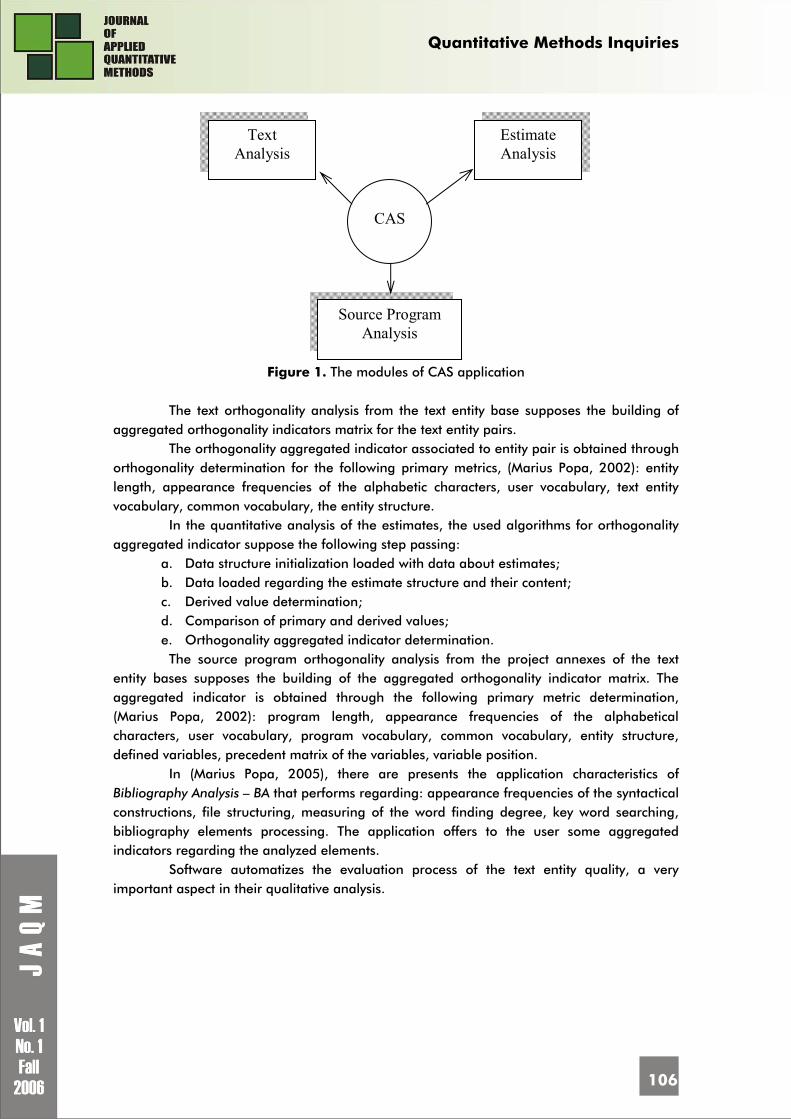
Quantitative Methods Inquiries
106
CAS
Text Analysis
Estimate Analysis
Source Program Analysis
Figure 1. The modules of CAS application
The text orthogonality analysis from the text entity base supposes the building of
aggregated orthogonality indicators matrix for the text entity pairs. The orthogonality aggregated indicator associated to entity pair is obtained through
orthogonality determination for the following primary metrics, (Marius Popa, 2002): entity length, appearance frequencies of the alphabetic characters, user vocabulary, text entity vocabulary, common vocabulary, the entity structure.
In the quantitative analysis of the estimates, the used algorithms for orthogonality aggregated indicator suppose the following step passing:
a. Data structure initialization loaded with data about estimates; b. Data loaded regarding the estimate structure and their content; c. Derived value determination; d. Comparison of primary and derived values; e. Orthogonality aggregated indicator determination. The source program orthogonality analysis from the project annexes of the text
entity bases supposes the building of the aggregated orthogonality indicator matrix. The aggregated indicator is obtained through the following primary metric determination, (Marius Popa, 2002): program length, appearance frequencies of the alphabetical characters, user vocabulary, program vocabulary, common vocabulary, entity structure, defined variables, precedent matrix of the variables, variable position.
In (Marius Popa, 2005), there are presents the application characteristics of Bibliography Analysis – BA that performs regarding: appearance frequencies of the syntactical constructions, file structuring, measuring of the word finding degree, key word searching, bibliography elements processing. The application offers to the user some aggregated indicators regarding the analyzed elements.
Software automatizes the evaluation process of the text entity quality, a very important aspect in their qualitative analysis.
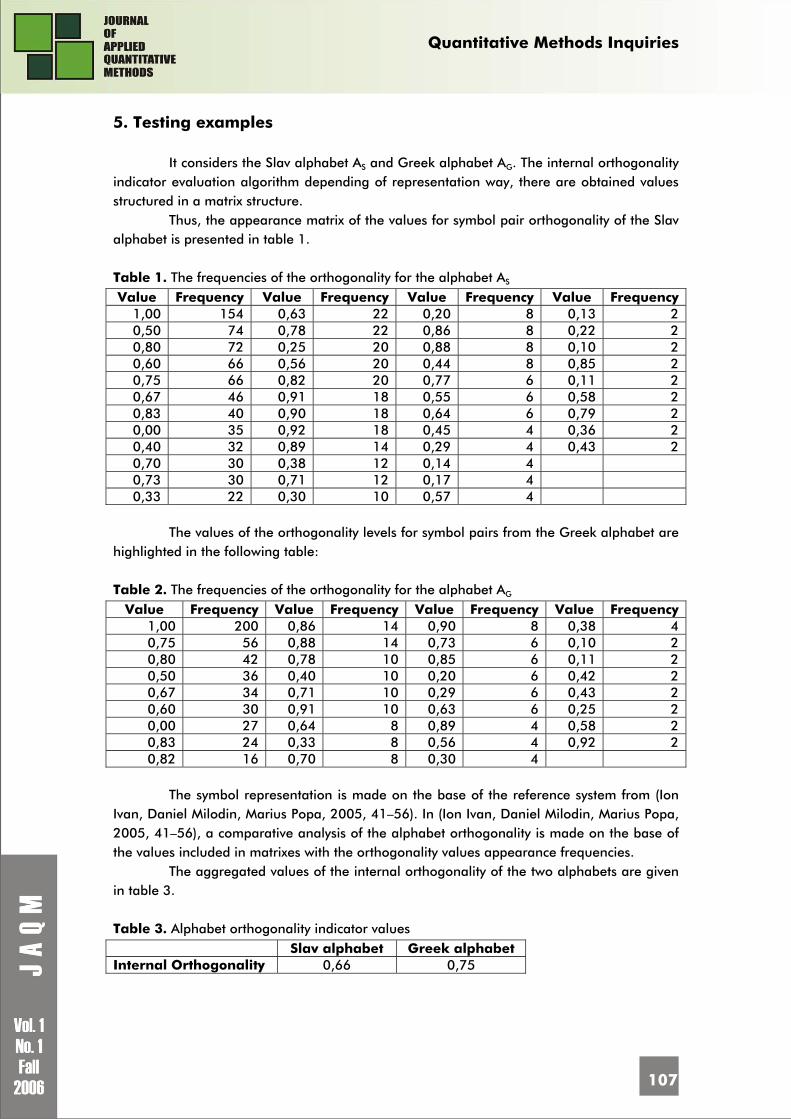
Quantitative Methods Inquiries
107
5. Testing examples
It considers the Slav alphabet AS and Greek alphabet AG. The internal orthogonality indicator evaluation algorithm depending of representation way, there are obtained values structured in a matrix structure.
Thus, the appearance matrix of the values for symbol pair orthogonality of the Slav alphabet is presented in table 1. Table 1. The frequencies of the orthogonality for the alphabet AS Value Frequency Value Frequency Value Frequency Value Frequency
1,00 154 0,63 22 0,20 8 0,13 2 0,50 74 0,78 22 0,86 8 0,22 2 0,80 72 0,25 20 0,88 8 0,10 2 0,60 66 0,56 20 0,44 8 0,85 2 0,75 66 0,82 20 0,77 6 0,11 2 0,67 46 0,91 18 0,55 6 0,58 2 0,83 40 0,90 18 0,64 6 0,79 2 0,00 35 0,92 18 0,45 4 0,36 2 0,40 32 0,89 14 0,29 4 0,43 2 0,70 30 0,38 12 0,14 4 0,73 30 0,71 12 0,17 4 0,33 22 0,30 10 0,57 4
The values of the orthogonality levels for symbol pairs from the Greek alphabet are
highlighted in the following table:
Table 2. The frequencies of the orthogonality for the alphabet AG Value Frequency Value Frequency Value Frequency Value Frequency
1,00 200 0,86 14 0,90 8 0,38 4 0,75 56 0,88 14 0,73 6 0,10 2 0,80 42 0,78 10 0,85 6 0,11 2 0,50 36 0,40 10 0,20 6 0,42 2 0,67 34 0,71 10 0,29 6 0,43 2 0,60 30 0,91 10 0,63 6 0,25 2 0,00 27 0,64 8 0,89 4 0,58 2 0,83 24 0,33 8 0,56 4 0,92 2 0,82 16 0,70 8 0,30 4
The symbol representation is made on the base of the reference system from (Ion
Ivan, Daniel Milodin, Marius Popa, 2005, 41–56). In (Ion Ivan, Daniel Milodin, Marius Popa, 2005, 41–56), a comparative analysis of the alphabet orthogonality is made on the base of the values included in matrixes with the orthogonality values appearance frequencies.
The aggregated values of the internal orthogonality of the two alphabets are given in table 3. Table 3. Alphabet orthogonality indicator values
Slav alphabet Greek alphabet Internal Orthogonality 0,66 0,75
Quantitative Methods Inquiries
108
The orthogonality analysis permits the alphabet design that increases the orthogonality. The character representation orthogonality increasing is important because the symbols from the alphabet have a better differentiation.
Conclusions The paper highlights some techniques and methods for text entity evaluation. The
emphasis is on orthogonality characteristic that allows the qualitative improvements in building and evaluation processes for the text entities.
The software products have a plus of efficiency in order to get to proposed objectives, and the testing examples contribute to proposed algorithm and developed software application validation
Bibliography 1. Anany Levitin, Thomas Redman, Data as a Resource: Properties, Implications, and
Prescriptions, Sloan Management Review, 1998, p. 89–101 2. Department of Defense 8320.1-M, Data Quality Assurance Procedures (Draft), Quality
Information for a Strong Defense, Department of Defense, 1994 3. Ion Ivan, Marius Popa, Text Entities Development, Evaluation, Analysis, Bucharest: ASE Printing
House, 2005 4. Ion Ivan et al., Information Cloning, Bucharest: ASE Printing House, 2003 5. Ion Ivan, Marius Popa, Cătălin Boja, Cristian Toma Metrics for Text Entity Similarity, Studii şi
Cercetări de Calcul Economic şi Cibernetică Economică 39, no. 4, 2005, p. 43–57 6. Ion Ivan, Daniel Milodin, Marius Popa, Alphabet Orthogonality, Revista Română de Informatică
şi Automatică 15, no. 3, 2005, p. 41–56 7. Ion Ivan, Marius Popa, Alexandru Popescu The Aggregation of the Text Entities, Economic
Computation and Economic Cybernetics Studies and Research 38, no. 1-4, 2004, p. 37–50
8. Ion Ivan, Marius Popa Text Metric Type, Studii şi Cercetări de Calcul Economic şi Cibernetică Economică 38, no. 1, 2004, p. 25–36
9. Ion Ivan, Marius Popa, Constantin Avram Similarity Degree Using in Software Fingerprint Building, Studii şi Cercetări de Calcul Economic şi Cibernetică Economică 37, no. 2, 2003, p. 39–54
10. Leo Pipino, Yang W. Lee, Richard Y. Wang Data Quality Assessment, Comunications of the ACM 45, no. 4, 2002, p. 211–218
11. Marius Popa Techniques and Methods for Data Quality Evaluation, Ph.D. dissertation, ASE Bucharest, 2005
12. Marius Popa Text Entity Quality Evaluation – Theory and Practice, Bucharest: ASE Printing House, 2005
13. Marius Popa Text Entities Metrics, Informatica Economică 9, no. 2, 2005, p. 56–60 14. Marius Popa, Software for Similarity Degree Measuring of the Archived Files, Bachelor’s
Degree, ASE Bucharest, 2002
1 Marius Popa is lecturer in Economic Informatics Department, Academy of Economic Studies of Bucharest. He published over 30 articles in journals and magazines in computer science, informatics and statistics fields, over 35 papers presented at national and international conferences, symposiums and workshops. He is the author of one book and he is coauthor of three books. In November 2005, he finished the doctoral stage, and his PhD thesis has the title Methods and techniques used in the qualitative evaluation of the data. His interest domains are: data and software quality, software engineering and project management.
Quantitative Methods Inquiries
109
ANALYSES AND QUANTITATIVE METHODS FOR INFORMATION MANAGEMENT IN MEDIUM
SIZE COMPANIES
Ioan I. ANDONE1 PhD, University Professor, ” Alexandru Ioan Cuza” University of Iasi, Romania Faculty of Economics and Business Administration Department of Business Information Systems 22, CAROL I Boulevard, 700500, IASI, Tel: +40-232-201600, E-mail: [email protected] Abstract: The important questions that confront today the executive management are: Is the financial-accounting data accessible and manageable? How quickly do you get the information you need? Are your routine reports available soon enough? Would your company’s performance improve if you have had them sooner? When you or others need the answer to a pressing business question, do you get it soon enough? Is the information you receive always reliable? How often do you find errors? Do they track allocated costs accurately? In a planning or decision-making situation, how easily can you and others in your company collaborate by sharing data and analyses? How often do two people in your organization have two different numbers for the same thing? Your answers to these questions will help you assess how pressing your company’s information management issue is. If it is typical, you get some of the financial information you need on a timely basis and some of it a little or a lot later than you would like. The purpose of this paper is to presents valuable options for quantitative methods and analyses that will make it possible to get accounting-financial information about businesses with convenable speed. Key words: information management, financial-accounting information, quantitative methods and analyses, spreadsheets problems, the software as a service approach
Introduction
In a fast-paced market, a middle size company needs to use every bit of sales,
industry, and financial information that is available to it to stay competitive. When orders come in, salespeople need immediate access to a variety of data, including inventory counts, competitive pricing, and vendor status. In addition, the executives team needs up-to-date financial information to make more informed and strategic business decisions.
A big problem for executives in middle size companies is to get information about their businesses faster and more reliably than they can today. Very likely, there are many areas where the executives have no useful information at all. They may be spending time doing one-off analyses in search of financial information that ought to be delivered routinely but that are too difficult to perform regularly. Admittedly, numbers by themselves do not solve business problems, but having timely accounting information allows people with good judgment to make better decisions more consistently. Moreover, all the time people spend
Quantitative Methods Inquiries
110
pulling information together for reports and analyses likely consumes a considerable portion of the operating costs of the company. Eliminating this work could save money; more likely, it will enable people to focus on tasks that contribute more directly to business success.
Nowadays, advances in Information Technology (IT) have reduced the cost and complexity of harnessing these capabilities, making it possible for middle size companies to increase the scope of the financial information they can collect and distribute. This potential empowerment makes it important for decision-makers, particularly for those without a background in IT, to understand the information management options that are available.
When it comes to managing business information, middle size companies face distinctive challenges. They have many of the same needs as large corporations, but can call on far fewer resources to use to satisfy them. They want information and analysis that will help them understand the current state of their business, react quickly to take advantage of changing conditions and make best use of their resources. They want the financial-accounting information that people within the company use to be consistent, and they want all parts of the business to operate in a coordinated fashion. On the technology side, the situation is improving for middle size companies. Capabilities once within the reach only of large corporations now are available to middle size companies. Instead of large-scale and expensive custom projects, now they can take advantage of packaged solutions that can be deployed quickly. What once cost millions of Euros, required analysts with special skills and took a large IT department to support is now affordable, accessible and more easily maintainable. Gaining greater access to useful information has been one of the most important reasons why companies of all sizes have invested in IT systems.
We know that companies need information for: • Financial reports to provide investors and other interested parties with an income
statement, balance sheet and statement of cash flows. • Management reports to answer questions like “How did we do in January compared
to the rest of the company and to our performance last year?” • Alerts to know, for example, when a customer’s oldest receivable has aged past 90
days. • Visibility to answer questions like “How many widgets do we have in inventory?” • Decision support to provide the information managers need to choose a course of
action, for example, “Who are our most profitable customers?” • Planning and budgeting so everyone can work with the same numbers in weighing
alternatives or analyzing what-if situations. Often, these reports are created on a regular schedule (monthly or quarterly for
financial statements, weekly or monthly for management reports, daily for alerts), but companies also produce ad-hoc reports based on specific analyses they need to perform for decision support or visibility. Some reports are static, but others allow those using them to drill deeper into the reasons behind the numbers.
A Big Issue: Transforming Data into Information
There are three stages in the process of turning data into useful information2. First, it is to capture it. Next, it is pulled together and processed by individuals or put through a routine (sometimes automated) process to provide context, focus or analysis. Finally, the resulting information is provided to consumers using any number of ICT means and methods

Quantitative Methods Inquiries
111
(paper reports, scorecards, Web-based portals, printed, pushed through e-mail or other electronic delivery, or simply available in an archive). In middle size companies, sometimes the data needed to produce these reports come from a single source – for example, certain monthly accounting system-based or financial reports alerts. These are relatively straightforward to produce. More often, though, and to an increasing degree, executive managers need to bring together information that is kept in more than one enterprise system (accounting data from the ERP package, expense allocations, transfer pricing data, numbers from the project management application, “trouble ticket” statistics from the CRM system and so on), as well as in individual spreadsheets, third-party payroll services and even handwritten reports. To produce these sorts of management reports, analysts often grab data from all of these sources and likely also perform some analysis or derive metrics and measurements from the original numbers.
Executive managers and business analysts need to be able to interact with the information to discover causes and trends. For example, they may want to calculate profitability by product or by customer or quickly back out the impact of currency changes or raw material prices. Sometimes they need to be able to insert data or correct inaccuracies. Equally important, these quantitative changes or analyses must be saved centrally to ensure that everyone will be using the same numbers. Compiling these multiple sources of information accurately and efficiently is a challenge.
Middle size companies have taken two basic approaches: individual spreadsheets and centralized business intelligence (BI) systems3. Each approach has advantages and disadvantages. The spreadsheet drove the business adoption of personal computers because it gave individuals a powerful and flexible productivity tool, freeing them from the long development cycles and rigidity associated with mainframe computers. However, the strength of the stand-alone spreadsheet is also its greatest weakness. Because it is so adaptable and open to modification to suit the individual, it can breed chaos when used in a business computing environment. BI systems have made it easier for companies with many employees to access and use data, but they require specialized IT staffs to implement and maintain and therefore have been less affordable for middle size companies. While today’s BI systems are far more adaptable than mainframes were, they are still not user-friendly enough for the average employee. Typically, we find people using reports generated by their BI systems as source data that they then copy and paste into a spreadsheet for further analysis. For these companies, stand-alone spreadsheets4 are an attractive option because almost everyone knows how to use them. In addition, they offer a great deal of flexibility for modeling and analysis, they incorporate many analytical methods and the technology of the market leader is effectively a standard.
There are, though, several downsides to using spreadsheets to solve a middle size company’s information management issues that often go unrecognized. While spreadsheets are indispensable in any organization for individual ad-hoc uses (any sort of quick-and-dirty analysis), they are poorly suited to enterprise-wide, repetitive or collaborative tasks. When used in this role, spreadsheets are prone to one of more of these problems:
• Errors: Spreadsheets are notoriously error-prone. To confirm this, simply type “spreadsheet error” in a search engine and read some of the many studies documenting the issue. People can enter data and formulas incorrectly and can change them inadvertently. There are ways to reduce the chances of this happening, but anyone trying to make a spreadsheet foolproof quickly recognizes in how many
Quantitative Methods Inquiries
112
ways errors can creep in. Making decisions based on inaccurate information is a recipe for disaster; errors can undermine the credibility of even the most fully thought-out project or business initiative.
• Inaccessible data: When a spreadsheet is stored on the hard drive of an individual computer, the numbers and analysis are inaccessible to others. This can be a serious problem when that person cannot be reached.
• Multiple versions of the truth: The flip side of inaccessibility is having data spread too widely, in multiple versions of the “same” information. This happens all too easily. Even when there are no errors in data and formulas, someone may be using an older version of the same spreadsheet or may be doing an analysis based on slightly different way of calculating information (something as simple, for example, as using 360-day years in one calculation and 365-day years in another). Conflicting spreadsheets are common in companies because there are almost limitless ways for data inconsistencies to creep into these derived instances of data. Since spreadsheets can be linked in daisy-chain fashion, it soon becomes almost impossible to track why two sets of numbers purporting to show the same thing do not agree.
• Wasted time: Doing quick-and-dirty analyses or one-off reports with a spreadsheet is fast. But when these documents become aroutine part of the information flow within a company, spreadsheets become maddeningly time-consuming. Because of possible errors and concerns about data quality and data consistency, people have to check and double-check to ensure that they are using correct, up-to-date data and using it properly. In addition, it often is impossible or infeasible to automate the process of pulling information out of enterprise software systems into spreadsheets, so whoever is responsible for creating a model or report must do it manually. Executives of middle size companies are probably unaware of the amount of staff time this consumes. The most pernicious aspect of spreadsheets sucking up uncounted hours of time is that time is one of the most precious resources mid-size companies have.
The Centralization Problem
The centralization has posed issues for middle size businesses, which often lack the people and money resources to support BI efforts. For many middle size firms this approach has proven to:
• Be too costly: Software licenses alone are pricey and since software almost never is fully usable “out of the box,” companies must pay for the consulting time needed to install it.
• Be too complex: Once deployed, a dedicated IT staff typically is required to support the software and underlying data structures.
• Require a dedicated staff: While most business users are able to create spreadsheet models, it takes technically trained and sophisticated users to build models that work with multidimensional or relational databases.
• Not be flexible enough: If they want to change formulas, add assumptions, revise or add missing data or extend or improve the model they are using, most employees must rely on the IT department, which often means getting in line and waiting for the request to be handled. Middle size companies need a way to bring together all the
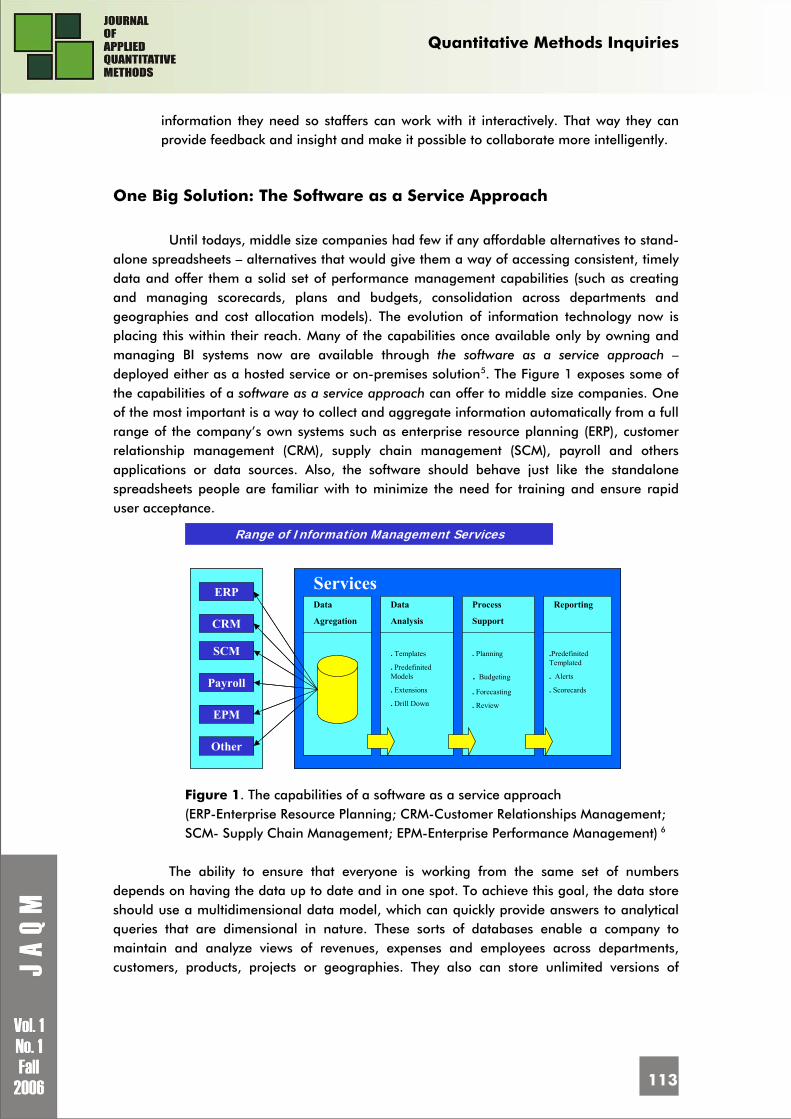
Quantitative Methods Inquiries
113
information they need so staffers can work with it interactively. That way they can provide feedback and insight and make it possible to collaborate more intelligently.
One Big Solution: The Software as a Service Approach
Until todays, middle size companies had few if any affordable alternatives to stand-
alone spreadsheets – alternatives that would give them a way of accessing consistent, timely data and offer them a solid set of performance management capabilities (such as creating and managing scorecards, plans and budgets, consolidation across departments and geographies and cost allocation models). The evolution of information technology now is placing this within their reach. Many of the capabilities once available only by owning and managing BI systems now are available through the software as a service approach – deployed either as a hosted service or on-premises solution5. The Figure 1 exposes some of the capabilities of a software as a service approach can offer to middle size companies. One of the most important is a way to collect and aggregate information automatically from a full range of the company’s own systems such as enterprise resource planning (ERP), customer relationship management (CRM), supply chain management (SCM), payroll and others applications or data sources. Also, the software should behave just like the standalone spreadsheets people are familiar with to minimize the need for training and ensure rapid user acceptance.
Figure 1. The capabilities of a software as a service approach (ERP-Enterprise Resource Planning; CRM-Customer Relationships Management; SCM- Supply Chain Management; EPM-Enterprise Performance Management) 6
The ability to ensure that everyone is working from the same set of numbers
depends on having the data up to date and in one spot. To achieve this goal, the data store should use a multidimensional data model, which can quickly provide answers to analytical queries that are dimensional in nature. These sorts of databases enable a company to maintain and analyze views of revenues, expenses and employees across departments, customers, products, projects or geographies. They also can store unlimited versions of
ERP
CRM
SCM
Payroll
EPM
Other
Services
Range of Information Management Services
Data
Agregation
Data
Analysis
Process
Support
Reporting
. Templates
. Predefinited Models
. Extensions
. Drill Down
. Planning
. Budgeting
. Forecasting
. Review
.Predefinited Templated
. Alerts
. Scorecards
ERP
CRM
SCM
Payroll
EPM
Other
Services
Range of Information Management Services
Data
Agregation
Data
Analysis
Process
Support
Reporting
. Templates
. Predefinited Models
. Extensions
. Drill Down
. Planning
. Budgeting
. Forecasting
. Review
.Predefinited Templated
. Alerts
. Scorecards
Quantitative Methods Inquiries
114
plans, monthly forecasts and other projections for later comparison, trending analysis and the like.
Middle size customers can take advantage of these tools through the software as a service approach. For data analysis, the provider should offer a flexible modeling environment that companies can access and interact with. Starting with a set of basic templates, selected users who have the appropriate security permissions should be able to extend the models by changing formulas, adding data or evaluation metrics, and updating assumptions. Being able to make these changes should require little or no training. This way, users can have access to the data they need without having to wait months, weeks or even days. A company should be able to use such a system to access and manage data for planning, budgeting, forecasting and reviews, as well as to automate analyses, alerts and report generation.
Companies also can use this kind of system to ensure that the manufacturing and sales and marketing functions are on the same page. For example, it can inform everyone in January that the special promotion Marketing is considering for June will require more product than the company currently plans to produce. For plans and budgets, the system should be able to handle any number of versions, what-if analysis and notes and annotations. It also should handle capital and operating plans. Users should be able to handle all of these tasks using systems that are as easy to work with as standalone spreadsheets. If people need to understand how to work with metadata tags or create structured query language (SQL) code to be able to get useful information, the system is too complicated to be a useful business tool for most middle size companies. The system should automate administrative tasks such as tracking who has submitted a budget, who is in the process of doing so and who has not even started. For the planning, budgeting and review cycle, the system should be able to generate models that automatically update an integrated view of actuals from the accounting system with the forward looking elements.
This approach has several advantages, including realtime data, so that changes made in one part of the business roll up into a corporate view almost instantly, variance alerts through e-mail and rapidly distribute reports. For reporting, companies should be able to create formally scheduled reports (such as financial statements or management reviews) and enable ad-hoc analysis and reports so people can make the best use of the information available. The system should allow companies to set up dashboards so employees can monitor important metrics at a glance, and alerts to ensure people are aware of conditions they should be focusing on.
From an overall management standpoint, the company should be able to administer access rights to the information contained in the model and control security at a granular level, so that, for example, some users might be able to see forward-looking salary grade information but not actual salary expenses.
Finally, companies should have the option of choosing how the service is deployed – on or off premises – and the ability to switch when the other is more appropriate. For simplicity, a company may elect initially to have its system managed and hosted by the service provider outside of the company. Over time, if its IT resources grow to the point where it is costeffective to maintain the system in-house, it should have the option to do this.
A middle size company should realize several important operating benefits through its use of the software as a service approach provider. One is having the ease of use and flexibility of spreadsheets along with a centralized data store to avoid multiple versions of the
Quantitative Methods Inquiries
115
truth. It should give users powerful analytics and easy-to-use reporting capabilities. It should make it easier to collaborate in planning and budgeting, what-if analyses, reconciliations and other accounting and financial management processes. Executives should be able to develop and maintain key performance indicators consistently across the company, and individuals and business units can track their performance relative to the rest of the company and their own objectives. By acquiring these capabilities through a hosted service, a company can reduce its up-front costs considerably as well as facilitate and speed the system’s rollout. Having a third party manage the equipment and the software means not having to have these people on staff.
Requirements for Software as Service Providers
Very likely, your customers and clients look at your track record and capabilities
before they buy from you. You should expect to ask no less from the application service providers you engage to support this process. Here are a few items that should be on every company’s list of items to investigate:
• Reliability: Ask the service provider to demonstrate redundancy to meet your system availability requirements.
• Security: Ask the service provider to demonstrate the strength of its firewall and intrusion prevention technologies. Each tenant of the system should have its own instance of the application and of the database. Each should have a unique and separate set of tables; some on-demand applications commingle rather than separating customer data.
• Administration: It should be easy to administer individual or rolebased rights to view data.
• Performance: The service provider should be able to handle your requirements even during periods of maximum use (such as the monthly or quarterly closing or budget “crunch” period).
• Integration: The purpose of an information management system is to bring together enterprise data in a single system, so the integration of your accounting and other systems into the service provider’s offering is critical. Although building and maintaining these links is not rocket science, your service provider should have demonstrable experience.
• Migration: The service provider should provide the capability to migrate between on-demand and on-premises deployments.
Conclusion Growing businesses need to keep their financial information and accounting
systems up to date. That way, when sales personnel or a member of the management team needs data, they can access it immediately. An effective financial management solution can help your company:
• Automate accounting and financial processes. • Improve employee productivity.
Quantitative Methods Inquiries
116
• Identify sales and market trends and gain insight into your business activities The main purpose of collecting financial and other data is to be able to provide the
right information to the right people at the right time7. For middle size companies, getting this tripartite focus right has proven to be a struggle. Now, however, information technology has evolved to the point where many of the benefits once enjoyed only by large organizations are also available to mid-size companies. New ways of delivering Software as a Service makes this goal affordable to acquire and maintain, and available with staffing and training components that meet the needs of middle size companies. By itself, having more information will not improve your bottom line. But having the right information at the right time enables people with good judgment to make better decisions more consistently. Setting up an efficient financial management system needs the following steps:
• Select a financial management software solution that corresponds to the needs of the company. See how software can help your organization manage financial data and processes.
• Create a more secure and well-managed infrastructure with a Server System software and learn how the Server System can be tailored to meet the IT needs of middle size company.
• Fiind additional software products for middle size businesses and see what other products and technologies for middle size companies.
References
1. Andone I., Tabără N., (Coord.), Contabilitate, tehnologie şi informatică, Editura Academiei Române, 2006
2. Dawson R., The Seven MegaTrends of professional Services, Epicor Software Corporation, 2005
3. Enterprise Financial Management Solutions: <http://techfinder.accountancyage.com/vnuaccountancyage/search/browse/1460/1460.jsp>
4. Financial Performance Analytics: <http://www.businessobjects.com/products/analyticapps/financei/default.asp>
5. Basics of business intelligence systems-an executive overview, June 2003. 6. Microsoft solutions for middle size companies: Get easy access and comprehensive insight
into company finances, 2006. 7. Dashboard development and Deployment. A Methodology for Success, Noetix Corporation,
2004. 8. Aligning Business and IT to Improve Performance, Ventana Research Europe, London, 2006 9. Walther L., Principles of accounting, 2006 online text, <http://www.principlesofaccounting.com>
1 Ioan I. Andone – PhD in Economics, university professor-- was graduated Faculty of Economic Sciences at ”Alexandru Ioan Cuza” University of Iaşi in 1971, and he worked as an assistant, and lecturer at the same high education institution. After receiving his doctorate (1984) in Accounting and Information Systems from ”Alexandru Ioan Cuza” University of Iasi, he work as a senior lecturer at the Faculty of Economics and Business Administration, Dept. of Accounting and Business Informatics (1991-1994), and professor (1994-present), at the Dept. of Business Information Systems. He was visiting professor and fellowship at the prestigious universities like Pittsburgh and CUNY (USA), Essex (UK), Paris-Dauphine (France) and participated at international scientific events and Summer Schools. He sets out his ideas on a broad swath of key topics, from accounting, to information systems, and management, to knowledge management, and knowledge technologies, to outsourcing, providing useful insights for each discipline and research projects. He is the author of 30 books and over 150 journal articles. His currently courses thaught are Business Expert Systems, and Hibrid Intelligent Systems (Undergraduate), Business Intelligent Systems (Mastership program), and Accounting Information Systems (PhD School of Economy). Experts and

Quantitative Methods Inquiries
117
colleagues in the worlds of business and academia regard Ioan Andone as the founder of the study of applied intelligent technologies in business, and accounting. Currently he is PhD faculty on Accounting and Information Systems, Director of Center of Research and Education in Business Information Systems at above mentioned institution, and coordinator of the Research Group on Business Intelligent Systems. For his accomplishments, he was awarded the Anniversary Diploma by the Dean of Faculty of Cybernetics, Statistics and Business Informatics, Academy of Economic Studies, Bucharest on May 2003, Diploma of Honour by Rector of Academy of Economic Studies of Moldova Chisinau on July 10, 2005, and „Diploma de Merit” by Rector of Academy of Economic Studies on May 2006. 2 Aligning Business and IT to Improve Performance, Ventana Research Europe, London, 2006 3 We mean “BI systems” to include repositories for storing the data as well as analytical tools, performance management applications and other software for digesting and manipulating data. 4 The term “stand-alone spreadsheet” is to distinguish the desktop productivity tool from spreadsheet-like applications (those that use either a grid or a full Excel interface connected to a central database. 5 Andone I., Tabără N., (Coord.), Contabilitate, tehnologie şi informatică, Editura Academiei Române, 2006 6 Source: Aligning Business and IT to Improve Performance, Ventana Research Europe, London, 2006 7 Walther L., Principles of accounting, 2006, online text, <http://www.principlesofaccounting.com>
Miscellanea
118
YOUNG PUBLIC MANAGER IN ROMANIA - A NEW APPROACH
Richard LUCKING PhD, PHARE Expert E-mail: [email protected]
Marius PROFIROIU PhD, Associated Professor, Public Administration and Management Department Academy of Economic Studies of Bucharest, Romania (Co)Author of books: Reforma administratiei publice in Romania in perspectiva integrarii Romaniei in Uniunea Europeana (2006), Managementul strategic al colectivitaţilor locale (2003) E-mail: [email protected]
Tudorel ANDREI Ph.D., University Professor, Statistics and Economic Forecast Department Academy of Economic Studies of Bucharest, Romania (Co)Author of books: Reforma administratiei publice in Romania in perspectiva integrarii Romaniei in Uniunea Europeana (2006), Statistica si Econometrie (2003), STATISTICA- teorie si aplicatii (2003) E-mail: [email protected] Abstract: This paper addresses issues of civil service development, in the context of public administration reform. There are, in the countries of the old and new Europes, a wide variety of approaches to training and development in the public service, and the issues raised here are based on the experience and lessons of the Young Professionals Scheme in Romania. Key words: Public Administration Reform, Young Professionals Scheme, civil service reform, public policies, Training Process.
1. Introduction
Establishing democratic and efficient public administration is the foundation of a modern democratic state. Romania is building this foundation and has made this a top priority of the Romanian Government. The goal is to achieve European standards and values of transparency, predictability, accountability, adaptability and efficiency. Romania recognizes that this is a great challenge.
Miscellanea
119
In 2001, the Government adopted a strategy for accelerating public administration reform. While some steps have been completed, the full objectives have not been attained. The objectives set then were too ambitious competing for financial and human resources with other priorities. Romania has adopted complex legislation promoting reform of the civil service, decentralization of fiscal resources and public services, and fighting corruption, and creating new institutions to prepare and apply the reforms. But many of these laws have not yet been fully implemented properly and new institutions are not yet fully operational. These problems have been included in several reports of the European Commission. Thus, further reforms of public administration remain as the most important objectives of the next three years during Romania’s accession to the European Union.
In agreement with the European Commission, the Romanian Government identified three areas in the area of Public Administration reform where significant progress must be made: civil service reform, decentralization and de-concentration of public services, and the policy formulation process.
According to the requirements of the European accession process, this diagnosis demands the following priorities for the reform of public administration:
civil service reform to ensure the creation of a professional corps of civil servants, stable and politically neutral through creating a unitary and coherent legal foundation and offering professional training and human resources management with the full commitment of ministries, agencies and all other governmental institutions.
continuing the decentralization/ deconcentration process to improve public services delivery and to create a coherent assignment of responsibilities, financial resources and rights to all levels of local governments.
strengthen the process through which public policies are formulated by creating coordinated systems and a strengthened capacity for the management of governmental structures. Beyond these three priorities, public administration reform will also focus on
accelerating the adoption of modern information management systems throughout all levels of the public administration system as well as the streamlining of administrative procedures.
In the Civil Service low quality public services, poorly motivated civil servants, corruption, and an unfavorable public image are major weaknesses that will be addressed through achieving the following medium term objectives:
• Establish recruitment, management and training procedures for civil servants through rules and norms that can be effectively implemented;
• Reform pay scales to ensure the consistent and equitable treatment of all categories of civil servants;
• Improve the image of public administration by increasing the transparency of administrative actions and enforcing strong anti-corruption measures, visible to the public. The following immediate objectives will begin the movement toward these
objectives: • Increase the financial and human resources allocated to the National Agency for
Civil Servants and the National Institute for Administration. These resources will be included in the 2005 state budget, and the two institutions be held accountable for
Miscellanea
120
achieving results. Twenty new staff positions will be added to the National Agency for Civil Servants;
• Launch an international tender for a project to design a database to support the effective management of the civil service (job descriptions, educational and training qualifications, career development, salaries and performance assessments). The estimated cost of this project is 5 million Euro. The Government of Romania commits itself to co-finance this project;
• During 2004 and 2005, recruit between 600 and 1000 high-level civil servants, based on merit and professional performance, to receive attractive salaries. This management service will also be staffed from the “Young Professionals Scheme” – an EU funded project. Participants will receive a minimum monthly salary of EUR 250 during the training period and approximately EUR 500 after completing training;
• In 2004, allocate the first cohort of graduates from the National Institute of Administration based on an inter-ministerial agreement;
• Reduce the number of annual training days for each civil servant from 7 (according to the current law) to 3, reflecting available financial and training resources;
• In 2004, create an Observatory of Civil Service, consisting of representatives of the civil society, public institutions, unions and political parties, to increase the transparency of the civil service management and the independence of the service.
2. Context
This paper addresses issues of civil service development, in the context of public administration reform. There are, in the countries of the old and new Europes, a wide variety of approaches to training and development in the public service, and the issues raised here are based on the experience and lessons of the Young Professionals Scheme in Romania. The YPS is an EU Phare funded civil service development project, which includes a large training component, and which aims to attract some of the best Romanian graduates into the civil service. The Scheme selects, trains and assesses them, and assists their placement into the civil service within a framework of a fast-track career programme.
The broader context of this project is therefore pre-accession Romanian public administration, where there is a need for far-reaching reform, to be achieved within a short time frame. It is a context where rapid reform and the management of change are critical. It is not, as yet, a context in which steady-state evolution and gradual improvement of existing practice can be relied upon. That will come in the long-term, but the short-term need is for an approach which promotes rapid, radical and rational change in the practices of public administration.
The institutional framework for this period of fast reform is not altogether obvious. Two institutions, the National Agency for Civil Servants (NACS) and the National Institute of Administration (INA) have respective and joint responsibility, under the Ministry of Administration and Interior, for the human resources management and human resources development aspects of the civil service. However, their long-term roles and associated goals reflect a stable-state mature public administration, and an important question is whether, or how far, these can be combined with the short-term mission of change management (figure 1).
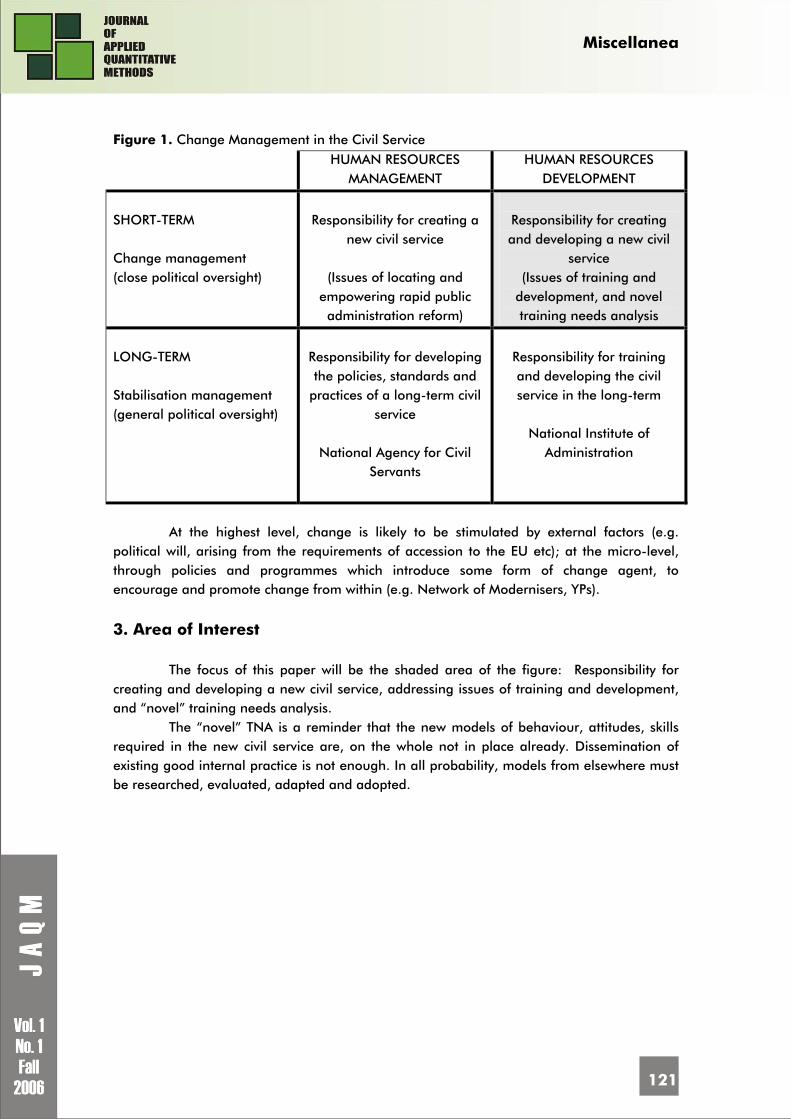
Miscellanea
121
Figure 1. Change Management in the Civil Service HUMAN RESOURCES
MANAGEMENT HUMAN RESOURCES
DEVELOPMENT
SHORT-TERM Change management (close political oversight)
Responsibility for creating a
new civil service
(Issues of locating and empowering rapid public administration reform)
Responsibility for creating and developing a new civil
service (Issues of training and
development, and novel training needs analysis
LONG-TERM Stabilisation management (general political oversight)
Responsibility for developing the policies, standards and
practices of a long-term civil service
National Agency for Civil
Servants
Responsibility for training and developing the civil service in the long-term
National Institute of
Administration
At the highest level, change is likely to be stimulated by external factors (e.g.
political will, arising from the requirements of accession to the EU etc); at the micro-level, through policies and programmes which introduce some form of change agent, to encourage and promote change from within (e.g. Network of Modernisers, YPs).
3. Area of Interest
The focus of this paper will be the shaded area of the figure: Responsibility for creating and developing a new civil service, addressing issues of training and development, and “novel” training needs analysis.
The “novel” TNA is a reminder that the new models of behaviour, attitudes, skills required in the new civil service are, on the whole not in place already. Dissemination of existing good internal practice is not enough. In all probability, models from elsewhere must be researched, evaluated, adapted and adopted.
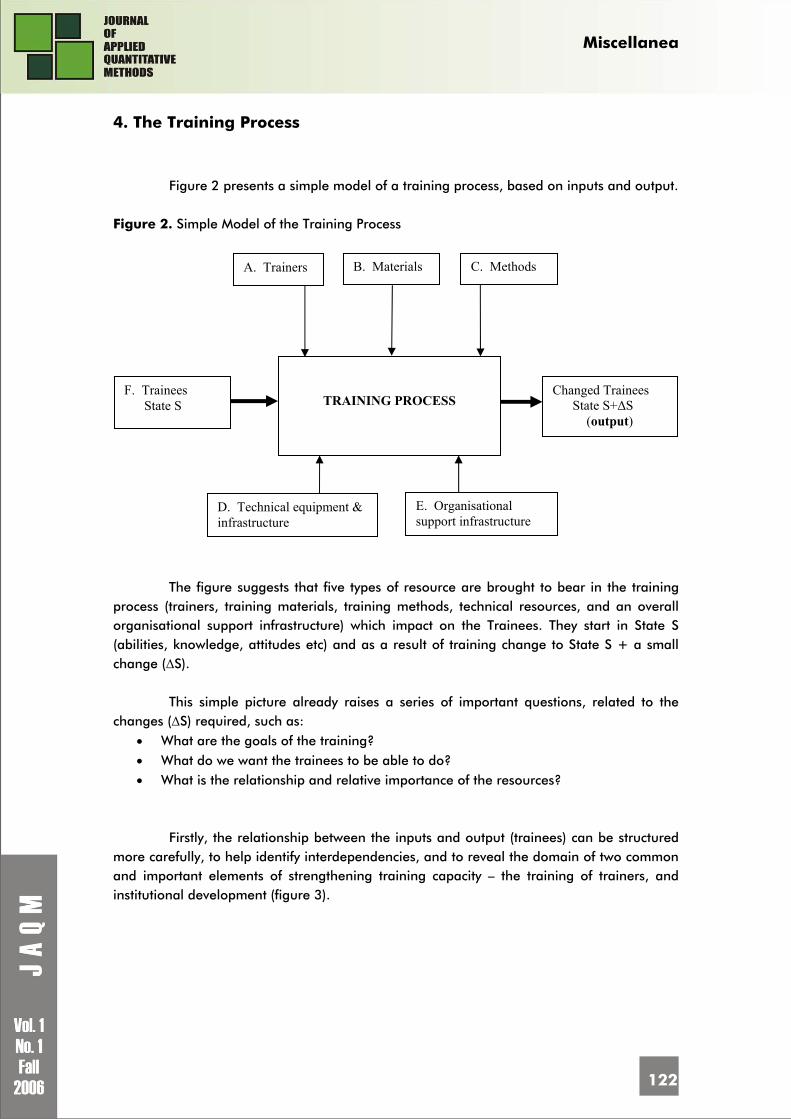
Miscellanea
122
4. The Training Process
Figure 2 presents a simple model of a training process, based on inputs and output.
Figure 2. Simple Model of the Training Process
The figure suggests that five types of resource are brought to bear in the training
process (trainers, training materials, training methods, technical resources, and an overall organisational support infrastructure) which impact on the Trainees. They start in State S (abilities, knowledge, attitudes etc) and as a result of training change to State S + a small change (ΔS).
This simple picture already raises a series of important questions, related to the
changes (ΔS) required, such as: • What are the goals of the training? • What do we want the trainees to be able to do? • What is the relationship and relative importance of the resources?
Firstly, the relationship between the inputs and output (trainees) can be structured
more carefully, to help identify interdependencies, and to reveal the domain of two common and important elements of strengthening training capacity – the training of trainers, and institutional development (figure 3).
F. Trainees State S
Changed Trainees State S+ΔS
(output)
A. Trainers B. Materials C. Methods
D. Technical equipment & infrastructure
E. Organisational support infrastructure
TRAINING PROCESS
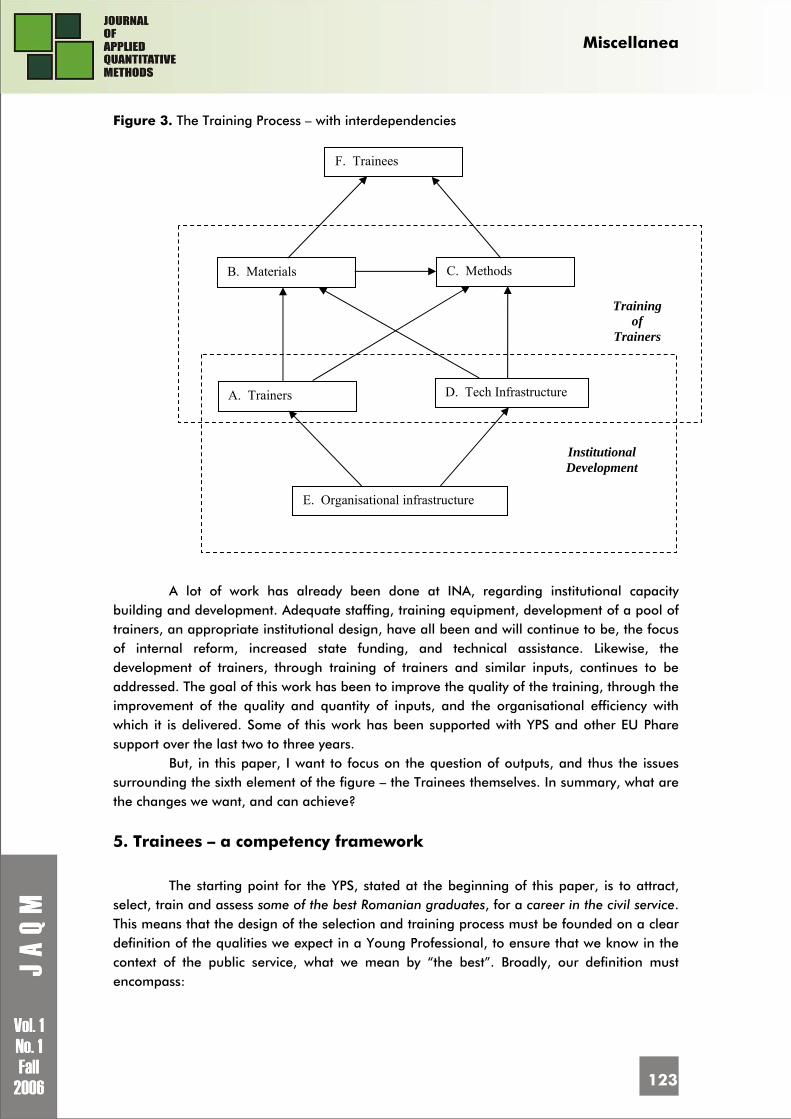
Miscellanea
123
Figure 3. The Training Process – with interdependencies
A lot of work has already been done at INA, regarding institutional capacity building and development. Adequate staffing, training equipment, development of a pool of trainers, an appropriate institutional design, have all been and will continue to be, the focus of internal reform, increased state funding, and technical assistance. Likewise, the development of trainers, through training of trainers and similar inputs, continues to be addressed. The goal of this work has been to improve the quality of the training, through the improvement of the quality and quantity of inputs, and the organisational efficiency with which it is delivered. Some of this work has been supported with YPS and other EU Phare support over the last two to three years.
But, in this paper, I want to focus on the question of outputs, and thus the issues surrounding the sixth element of the figure – the Trainees themselves. In summary, what are the changes we want, and can achieve?
5. Trainees – a competency framework
The starting point for the YPS, stated at the beginning of this paper, is to attract, select, train and assess some of the best Romanian graduates, for a career in the civil service. This means that the design of the selection and training process must be founded on a clear definition of the qualities we expect in a Young Professional, to ensure that we know in the context of the public service, what we mean by “the best”. Broadly, our definition must encompass:
F. Trainees
B. Materials C. Methods
A. Trainers D. Tech Infrastructure
E. Organisational infrastructure
Training of
Trainers
Institutional Development
Miscellanea
124
Personal qualities: qualities which are to a large degree “fixed”, or at least slow to change, and so largely unaffected by the training itself.
Behavioral attributes: qualities which determine the approach and attitude to work, also slow or difficult to change, but which feature in the requirements of a new modern public administration.
Skills: qualities which training aims to change, which in some cases (e.g. foreign language proficiency) cannot be completed through a short or medium term training programme.
Knowledge: the attribute which may be altered, through study, and requiring continual updating throughout a career. It is an important component of self-study and in-service training, but not the primary focus of pre-service training
So, it is important that we distinguish those characteristics which we want in the new civil servants – but cannot change – and which must feature as part of the selection process, from those qualities which the training can legitimately and effectively address.
The Competency Framework given in Annex 1 was developed in YPS cycle 1. This provided the basis for selecting suitable psychometric tests, to assess candidates on those personal and behavioural qualities which cannot be significantly altered through the training programme. In cycle 2, it is proposed that some of these procedures will be used in the actual selection process, in order to be confident that we are training and developing – adding value to – those candidates most likely to benefit and make good senior civil servants. The more conventional selection methods – written examinations and interviews – should also seek to identify the personal qualities and potential identified in this framework. The aim is to select the best, and train those.
Other qualities and skills are susceptible to improvement over the long term through practice and training but, given the limited timeframe of the training programme, must already be evident at the selection stage to ensure a good standard of both candidate and final graduate. Examples are analytical and critical thinking, decision-making, communication and team skills, and foreign language skills. These also need to be tested at selection, since they indicate important aspects of the long-term quality of the candidate for senior civil service status.
The third group are skills we expect to deliver and enhance through the training itself, and these include the professional skills where exposure to a combination of knowledge, practice and experience will significantly enhance the candidate’s abilities. It is least necessary to test these at the start, as these are the skills we expect to strengthen through the pre-service training, or later in in-service training, courses. Examples include accounting or budgeting skills, constitutional and legal awareness, planning and evaluation methodologies.
The competency framework may be extended to define the skills and abilities of the Trainees, to be achieved by the end of the training programme. Such a framework would be more short-term, and more flexible over time, as the training needs for the civil servants – in this case Public Managers – became clearer. In the short-term, the “novel” training needs analysis has to draw on the expectations of the public administration, regarding EU accession, client/citizen orientation, effective coordination, and the new area of public policy making in the Romanian Government.
The model of training is now modified to include the importance of competency frameworks, as shown in figure 4.
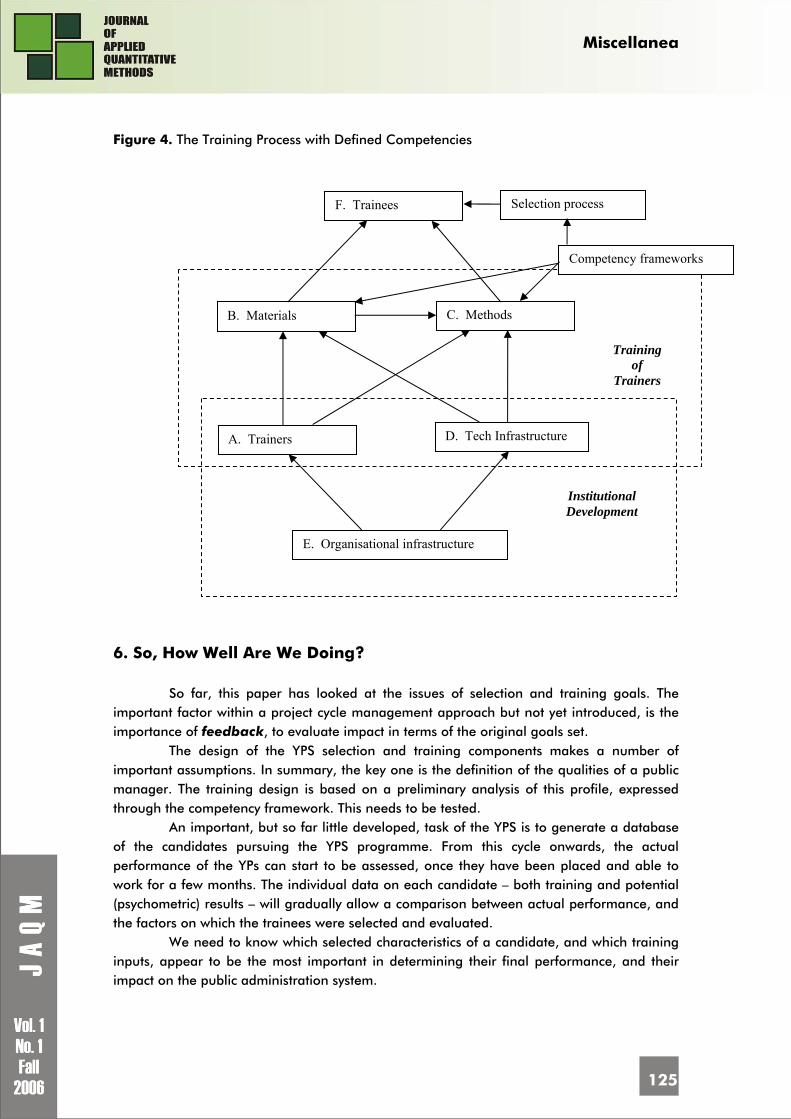
Miscellanea
125
Figure 4. The Training Process with Defined Competencies
6. So, How Well Are We Doing?
So far, this paper has looked at the issues of selection and training goals. The important factor within a project cycle management approach but not yet introduced, is the importance of feedback, to evaluate impact in terms of the original goals set.
The design of the YPS selection and training components makes a number of important assumptions. In summary, the key one is the definition of the qualities of a public manager. The training design is based on a preliminary analysis of this profile, expressed through the competency framework. This needs to be tested.
An important, but so far little developed, task of the YPS is to generate a database of the candidates pursuing the YPS programme. From this cycle onwards, the actual performance of the YPs can start to be assessed, once they have been placed and able to work for a few months. The individual data on each candidate – both training and potential (psychometric) results – will gradually allow a comparison between actual performance, and the factors on which the trainees were selected and evaluated.
We need to know which selected characteristics of a candidate, and which training inputs, appear to be the most important in determining their final performance, and their impact on the public administration system.
F. Trainees
B. Materials C. Methods
A. Trainers D. Tech Infrastructure
E. Organisational infrastructure
Training of
Trainers
Institutional Development
Selection process
Competency frameworks
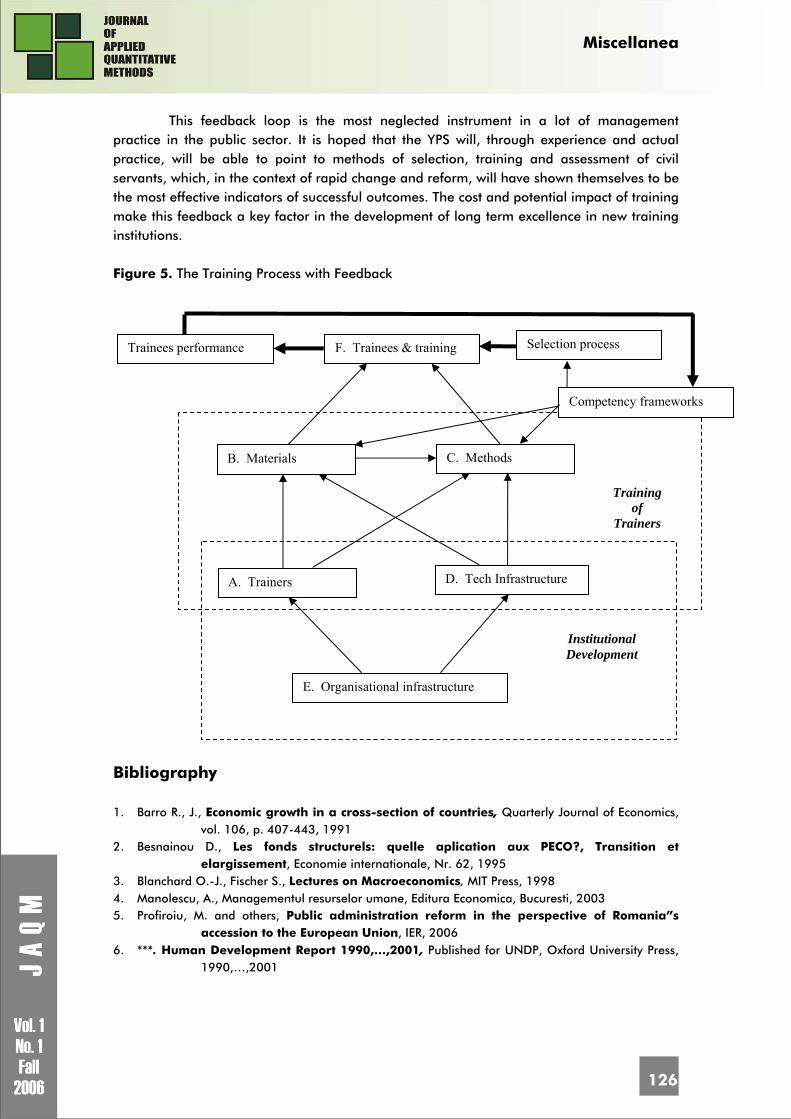
Miscellanea
126
This feedback loop is the most neglected instrument in a lot of management practice in the public sector. It is hoped that the YPS will, through experience and actual practice, will be able to point to methods of selection, training and assessment of civil servants, which, in the context of rapid change and reform, will have shown themselves to be the most effective indicators of successful outcomes. The cost and potential impact of training make this feedback a key factor in the development of long term excellence in new training institutions. Figure 5. The Training Process with Feedback
Bibliography 1. Barro R., J., Economic growth in a cross-section of countries, Quarterly Journal of Economics,
vol. 106, p. 407-443, 1991 2. Besnainou D., Les fonds structurels: quelle aplication aux PECO?, Transition et
elargissement, Economie internationale, Nr. 62, 1995 3. Blanchard O.-J., Fischer S., Lectures on Macroeconomics, MIT Press, 1998 4. Manolescu, A., Managementul resurselor umane, Editura Economica, Bucuresti, 2003 5. Profiroiu, M. and others, Public administration reform in the perspective of Romania”s
accession to the European Union, IER, 2006 6. ***. Human Development Report 1990,…,2001, Published for UNDP, Oxford University Press,
1990,…,2001
F. Trainees & training
B. Materials C. Methods
A. Trainers D. Tech Infrastructure
E. Organisational infrastructure
Training of
Trainers
Institutional Development
Selection process
Competency frameworks
Trainees performance
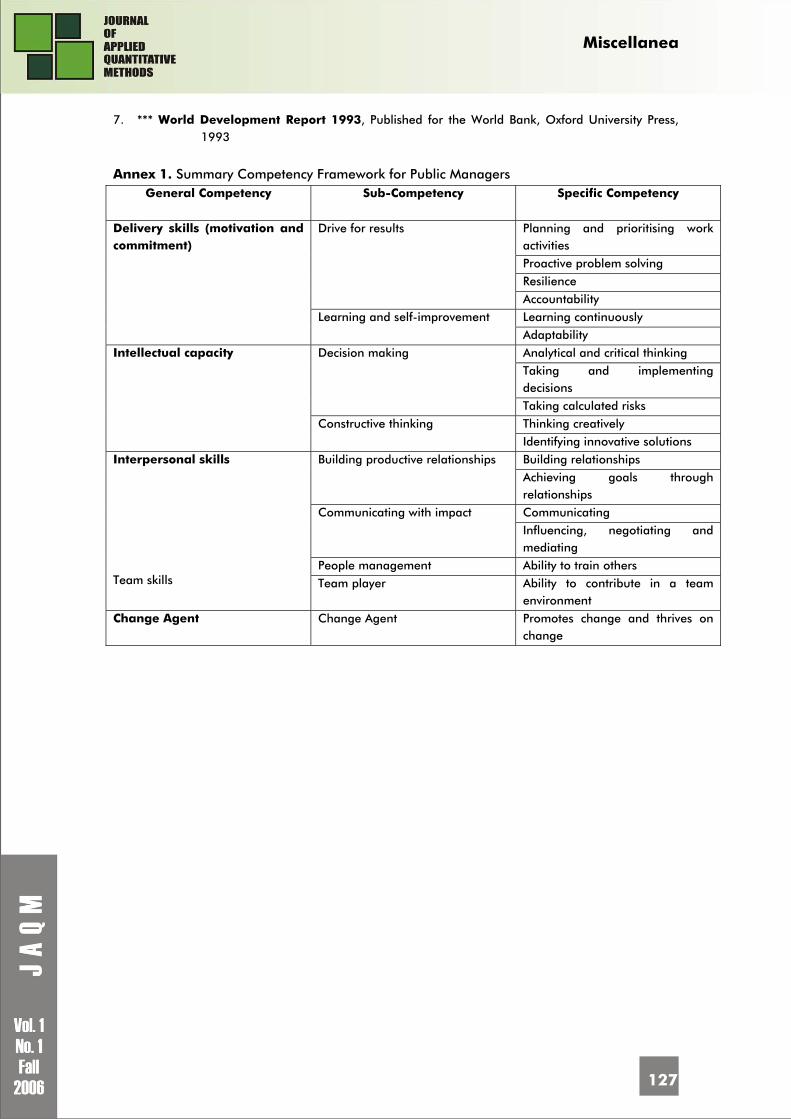
Miscellanea
127
7. *** World Development Report 1993, Published for the World Bank, Oxford University Press, 1993
Annex 1. Summary Competency Framework for Public Managers
General Competency
Sub-Competency Specific Competency
Planning and prioritising work activities Proactive problem solving Resilience
Drive for results
Accountability Learning continuously
Delivery skills (motivation and commitment)
Learning and self-improvement Adaptability
Analytical and critical thinking Taking and implementing decisions
Decision making
Taking calculated risks Thinking creatively
Intellectual capacity
Constructive thinking Identifying innovative solutions Building relationships Building productive relationships Achieving goals through relationships Communicating Communicating with impact Influencing, negotiating and mediating
People management Ability to train others
Interpersonal skills Team skills Team player Ability to contribute in a team
environment Change Agent Change Agent Promotes change and thrives on
change
Review
128
Gheorghe NOSCA1 PhD, Association for Development through Science and Education, Bucharest, Romania E-mail: [email protected] Key words: pattern analysis, chlorophyll fluorescence, signals, Marius Cosmin Codrea
PhD Thesis Review on
"PATTERN ANALYSIS OF CHLOROPHYLL FLUORESCENCE SIGNALS" by Marius Cosmin CODREA
"Pattern Analysis of Chlorophyll Fluorescence Signals" was elaborated by
Marius Cosmin CODREA in the Turku Centre of Computer Science, and presented for public criticism in Auditorium DataCity, on the 24th of May 2006, with the permission of the Faculty of Mathematics and Natural Science of the University of Turku, Finland.
The thesis’s main objectives are to plant species identification, and the fruit quality assessment relies on the chlorophyll fluorescence phenomenon that occurs in all chlorophyll containing material.
The author uses quantitative methods in order to optimize the features to be used for classification by designing and testing a particular form in a selection method. The technique is a non-destructive one, based on the reflectance imaging, observation of pre-symptomatic disorders before defect on the peal of fruit become visible for human eye.
An algorithm is proposed for filling region in digital images. The developed researches indicate the potential of the method as a practical tool for automatic fruit sorting, based on the visual inspection tasks like defect detection.
The authors’ researches are based on the results of the original experiments published in the following papers:
• Feature Learning With A Genetic Algorithm For Fluorescence Fingerprinting Of Plant Species
• Genetic Feature Learning Algorithm For Fluorescence Fingerprinting Of Plants
• On The Robustness Of Fluorescence Fingerprinting Of Plants • Classifying Apples By The Means Of Fluorescence Imaging • Classification Of Apples according To Physiological Status Measured By
Fluorescence Imaging • An Algorithm For contour-based region filling. • The structure of the thesis includes a first part SYNOPSIS and a second part
PUBLICATION REPRINTS.
Review
129
The introduction presents details about plant species identification and fruit quality control. A special chapter is dedicated to the chlorophyll a fluorescence, and the author presents chlorophyll fluorescence induction and fluorescence imaging problems. Marius Cosmin CODREA reserves a large area to the methodological background, and to the special details on basic concept in pattern recognition and feature selection.
Outline of the thesis includes the main author research results on the plant fluorescence fingerprinting, fruit quality control and plant species identification.
The bibliography contains 117 titles, books, papers and presentation in conferences proceedings.
The author has oriented his researches to new techniques and methods based on the neural networks, genetics algorithms, and fuzzy classification methods.
The experimental results use the representative data set, and the tests validate the entire hypothesis and the models built by author.
There are taken into consideration four quality levels: very good, good, bad, very bad, and are defined modalities to establish the affiliation to one of these classes.
Marius Cosmin CODREA makes a comparative analysis of two classification techniques – neural network and k-NN – using the same lots of products according to fluorescence. Using a performance criteria, accepted to be representative, it is established when each of the two methods can be used. The algorithms used for processing images, in order to obtain a classification, give the possibility to calculate a regularity coefficient using data that describes size, perimeter, circularity, elongation and localization.
The thesis includes the original and valorous results of a young researcher and it is a mark for his future as a scientist.
1 A short presentation of Gheorghe Nosca is available at p. 67 of JAQM current issue.