Embed Size (px)
Citation preview
Journal ClubRecalibration of Blood Analytes over 25 Years in the Atherosclerosis Risk in Communities Study: Impact of Recalibration on Chronic Kidney Disease Prevalence and Incidence
C.M. Parrinello, M.E. Grams, D. Couper,
C.M. Ballantyne, R.C. Hoogeveen, J.H. Eckfeldt,
E. Selvin, and J. Coresh
July 2015
www.clinchem.org/content/61/7/938.full
© Copyright 2015 by the American Association for Clinical Chemistry
2
Introduction
Background• Equivalence of laboratory measurements over time is important
for studies of trends• Small systematic differences may shift the entire distribution of
a biomarker at the population level
Objectives• Assess the equivalence of different biomarker measurements
across 5 Atherosclerosis Risk in Communities (ARIC) visits• Determine recalibration corrections for those analytes lacking
equivalence• Assess trends in each analyte before and after recalibration
3
Question
What are some potential implications of not conducting assay recalibration in a prospective cohort study with multiple measurements over time?
4
Materials & Methods
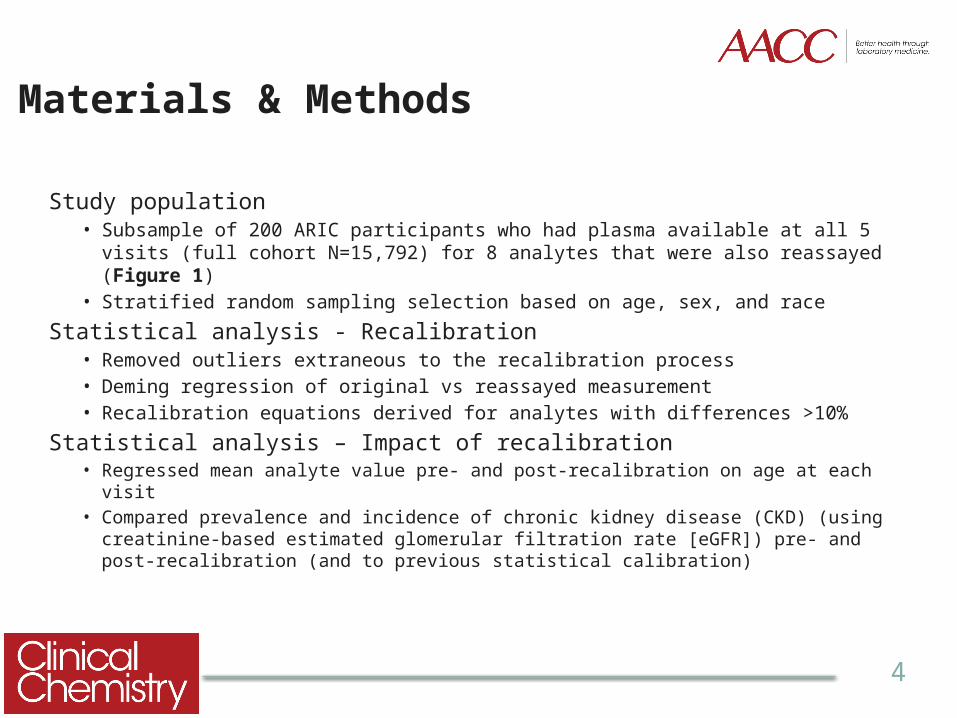
Study population• Subsample of 200 ARIC participants who had plasma available at all 5 visits (full
cohort N=15,792) for 8 analytes that were also reassayed (Figure 1)• Stratified random sampling selection based on age, sex, and race
Statistical analysis - Recalibration• Removed outliers extraneous to the recalibration process• Deming regression of original vs reassayed measurement• Recalibration equations derived for analytes with differences >10%
Statistical analysis – Impact of recalibration• Regressed mean analyte value pre- and post-recalibration on age at each visit• Compared prevalence and incidence of chronic kidney disease (CKD) (using
creatinine-based estimated glomerular filtration rate [eGFR]) pre- and post-recalibration (and to previous statistical calibration)
5
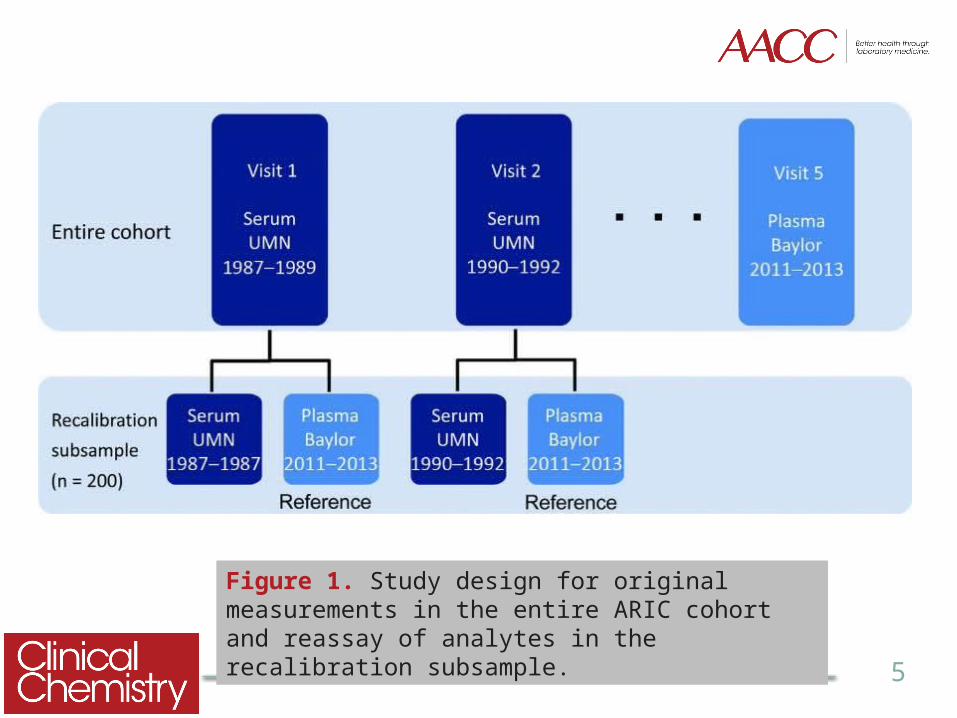
Figure 1. Study design for original measurements in the entire ARIC cohort and reassay of analytes in the recalibration subsample.
6
Question
What is the purpose of removing outliers prior to recalibration?
7
Results
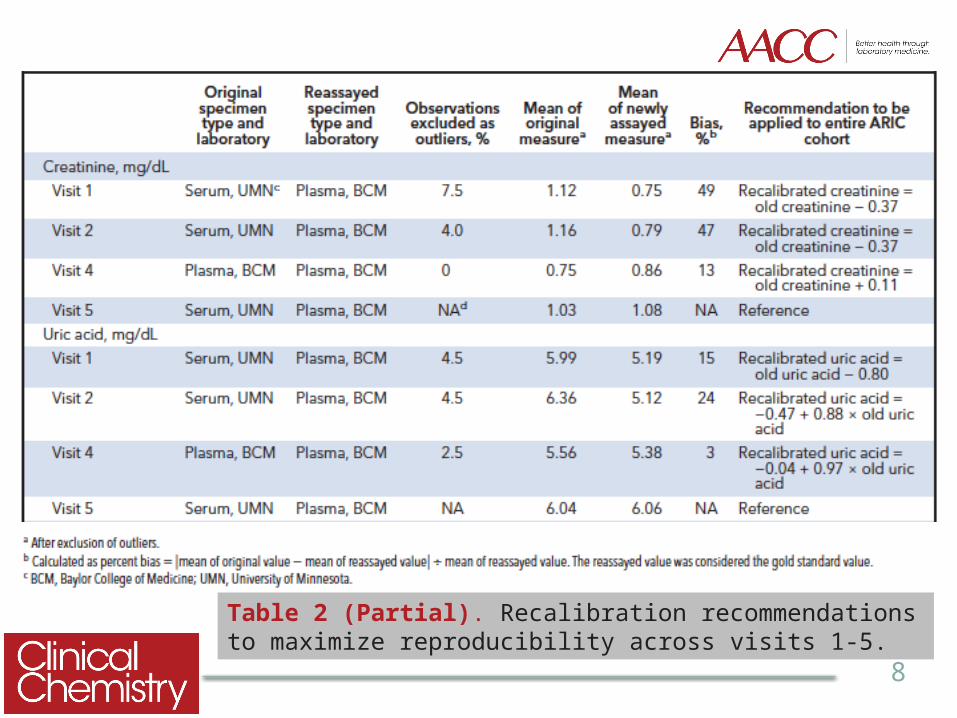
Most analytes were well-calibrated• Reassayed measurement values were highly correlated with
original values• Bias <10% for all analytes except creatinine and uric acid
(Table 2)
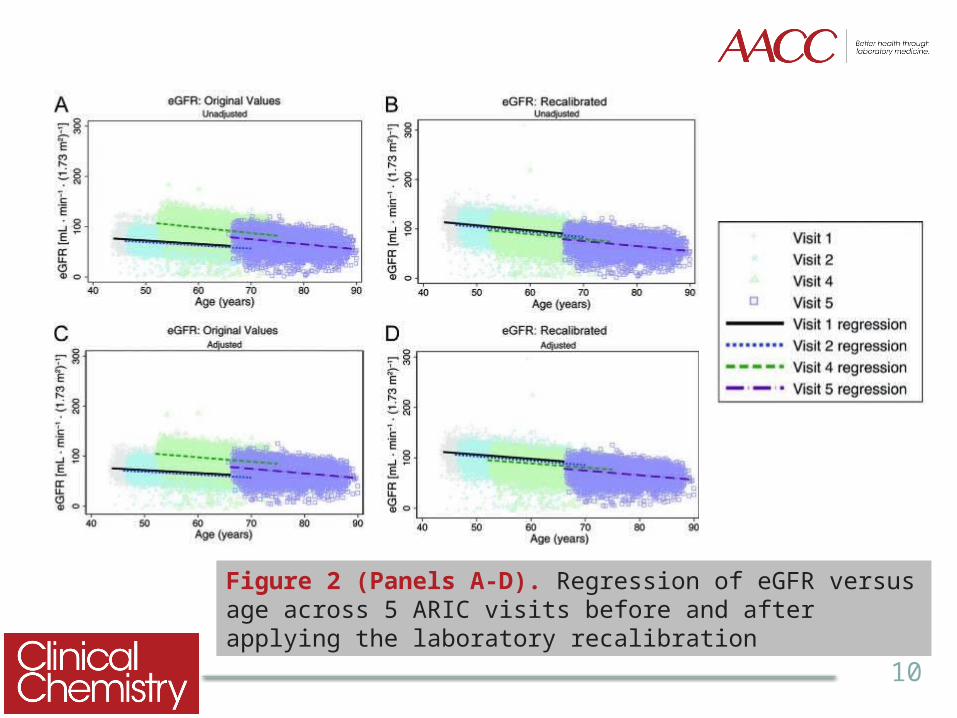
Developed recalibration equations for creatinine and uric acid and compared pre- and post-calibration results
• Trends in eGFR and uric acid were better aligned after applying equations to the entire cohort (Figure 2)
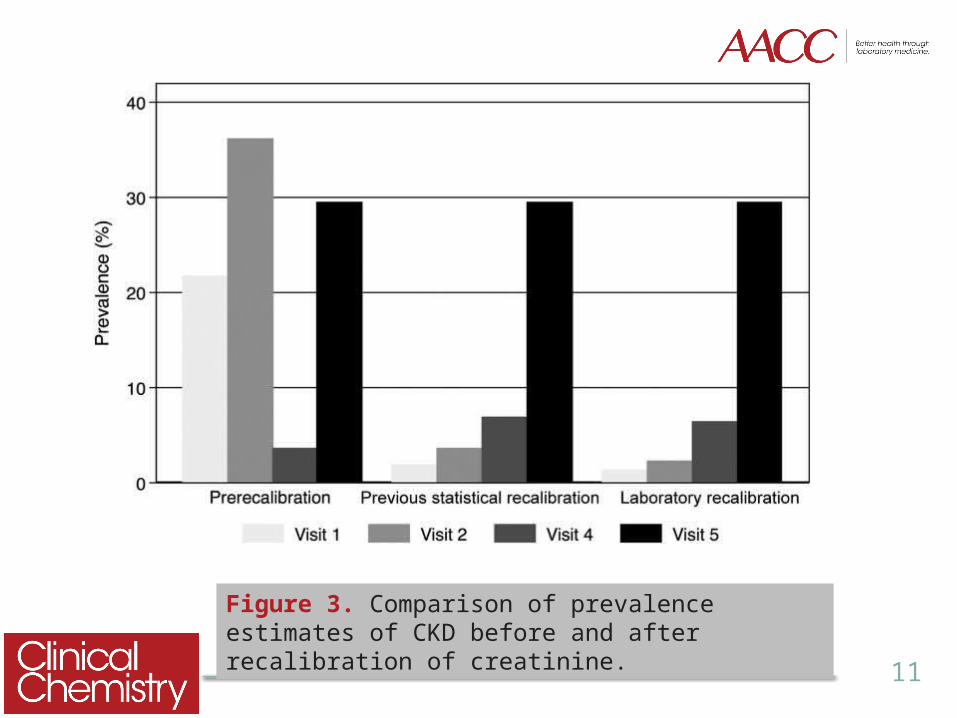
• Post-recalibration prevalence and incidence estimates of CKD determined by eGFR were more accurate (Figure 3)
8
Table 2 (Partial). Recalibration recommendations to maximize reproducibility across visits 1-5.
9
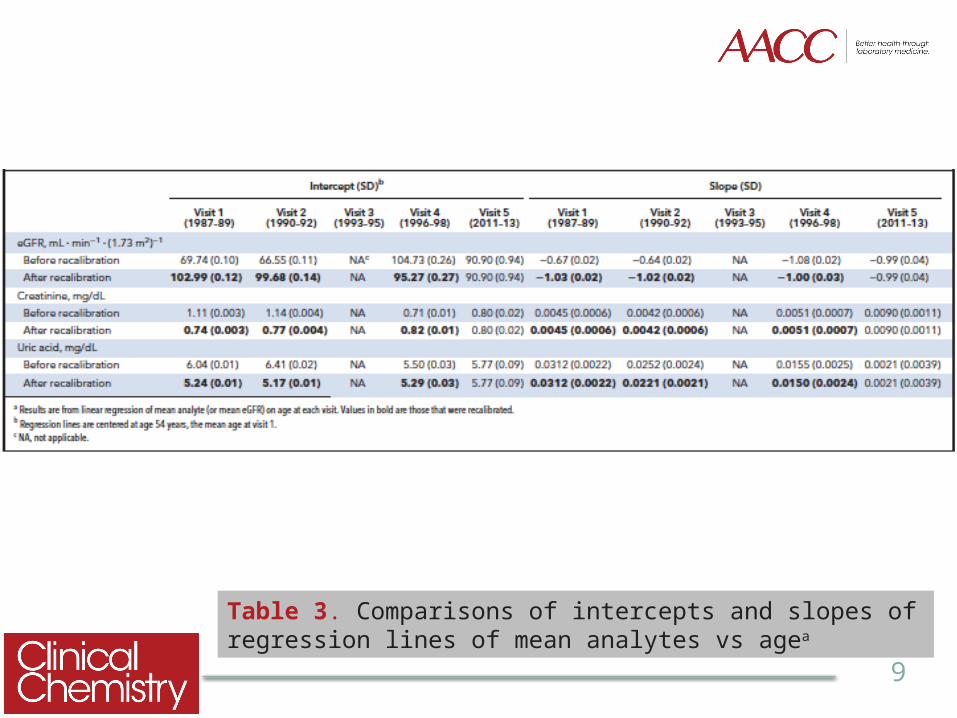
Table 3. Comparisons of intercepts and slopes of regression lines of mean analytes vs agea
10
Figure 2 (Panels A-D). Regression of eGFR versus age across 5 ARIC visits before and after applying the laboratory recalibration
11
Figure 3. Comparison of prevalence estimates of CKD before and after recalibration of creatinine.
12
Question
What other approaches could be used to assess the impact of applying a recalibration equation to full cohort data?
13
Thank you for participating in this month’sClinical Chemistry Journal Club.
Additional Journal Clubs are available atwww.clinchem.org
Download the free Clinical Chemistry app on iTunes for additional content!
Follow us