Embed Size (px)
Citation preview
Footloose and Pollution FreeJosh Edgerington, Arik Levinson and Jenny
Minier
Review of Economic and Statistics
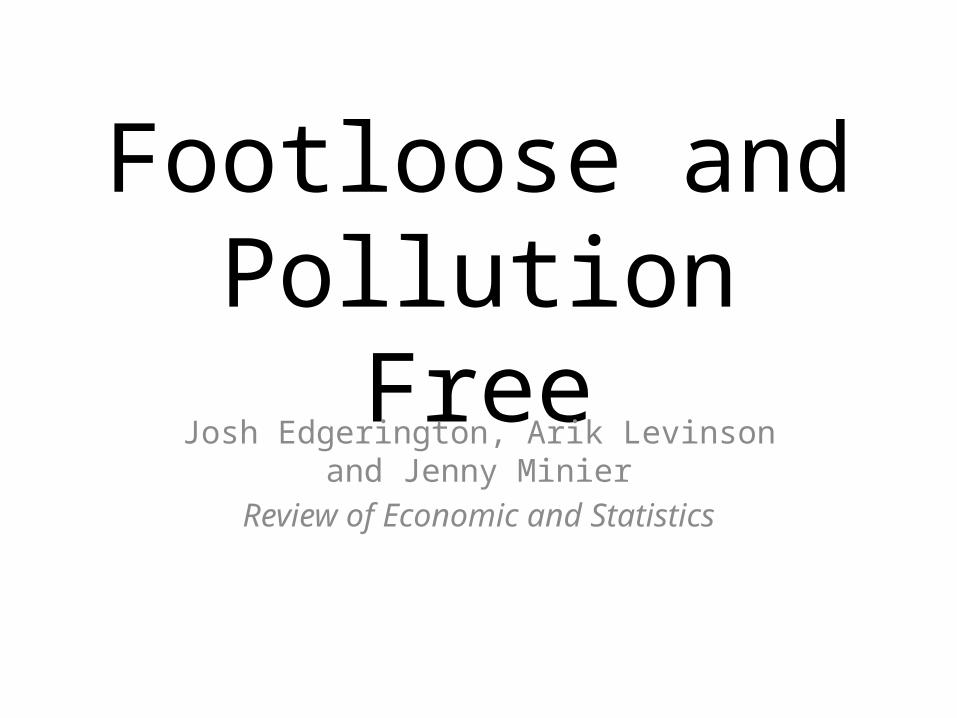
Motivation
U.S. Environmental Regulation Increases
Pollution Intensive Industries Cannot
Compete
MIGRATE ABROAD
Pollution Haven Hypothesis
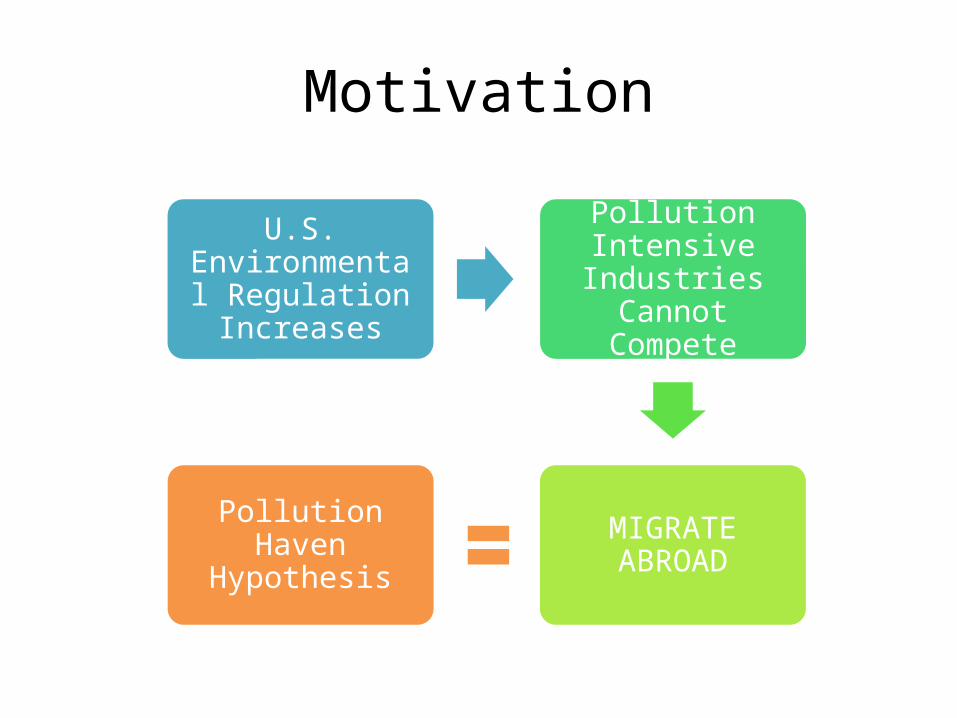
Pollution Haven Hypothesis (cont.)
Environmental Regulatory Regime Index and GDP per capita (from Esty & Porter, The GlobalCompetitiveness Report 2001-2002)
Introduction
• Do environmental regulations (ER hereafter) affect trade flows?– Little empirical evidence of a relationship– Difficult to detect
• Authors consider three hypotheses– Trading partners– Industry mobility– Regulation as a share of production costs
• Use Pollution Abatement Costs and Expenditures (PACE) survey for U.S. industries
Approach
• Underlying heterogeneity between environmental regulations and trade flows must be considered
– Industry characteristics matter– agglomeration economies– transportation costs– high fixed costs
– Less footloose industries react differently to policy– Aggregation across industries masks relationships
Three Hypotheses
1. Do the types of trade partners matter?
2. Are less footloose industries more insensitive to differences in regulatory stringency between countries?
3. Does it matter whether environmental regulation is a small or large portion of a firm’s total costs?
Baseline Empirical Specification
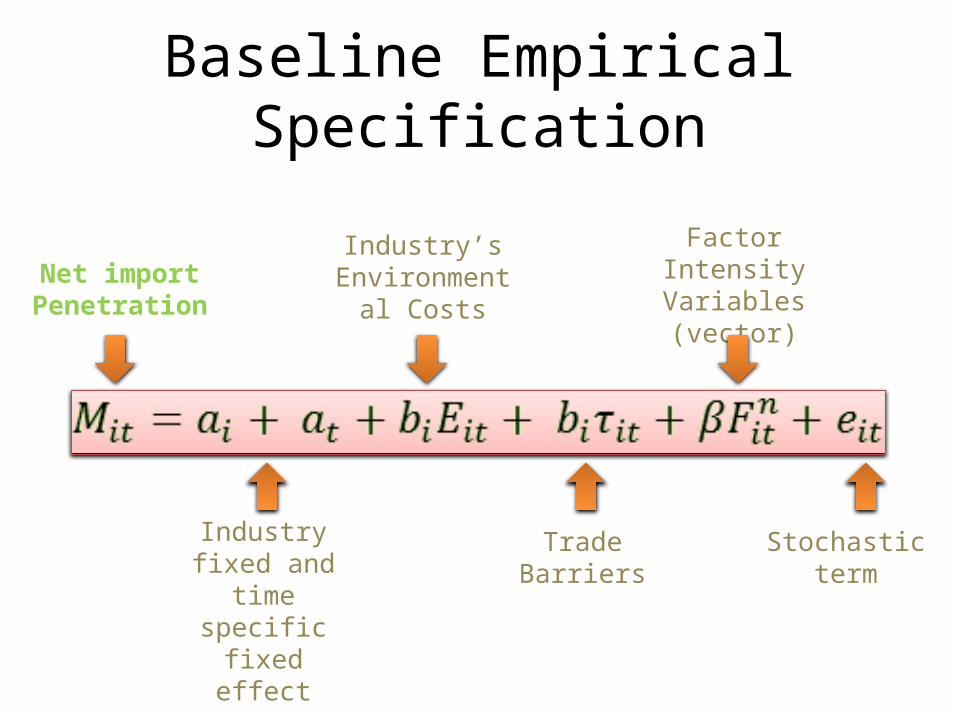
Net import Penetration
Industry fixed and time specific
fixed effect
Industry’s Environmental
Costs
Trade Barriers
Factor Intensity Variables (vector)
Stochastic term
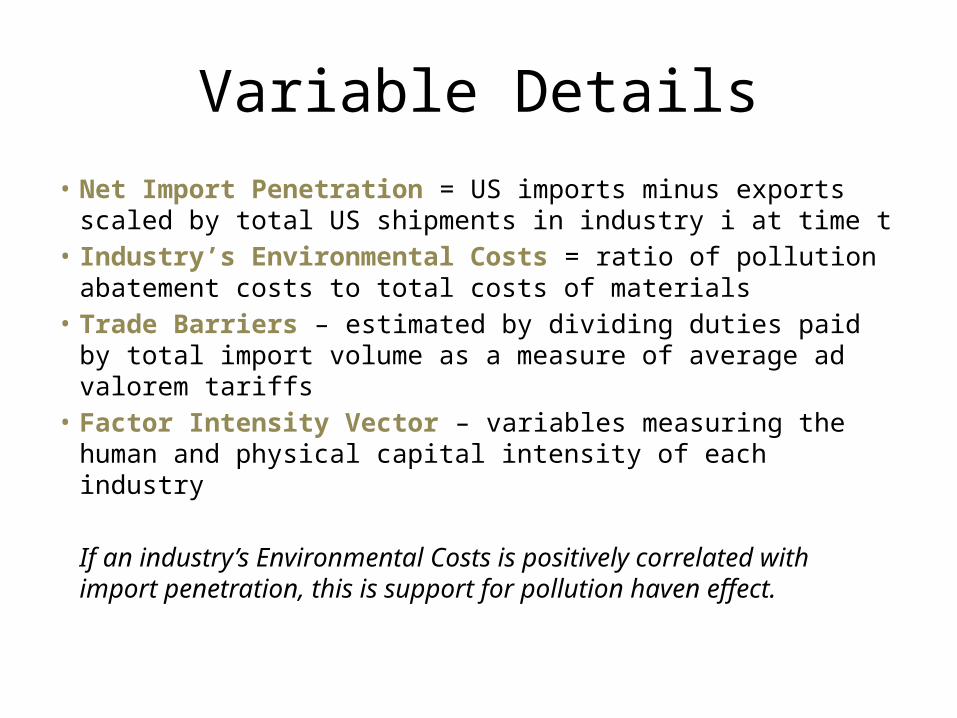
Variable Details
• Net Import Penetration = US imports minus exports scaled by total US shipments in industry i at time t
• Industry’s Environmental Costs = ratio of pollution abatement costs to total costs of materials
• Trade Barriers – estimated by dividing duties paid by total import volume as a measure of average ad valorem tariffs
• Factor Intensity Vector – variables measuring the human and physical capital intensity of each industry
If an industry’s Environmental Costs is positively correlated with import penetration, this is support for pollution haven effect.
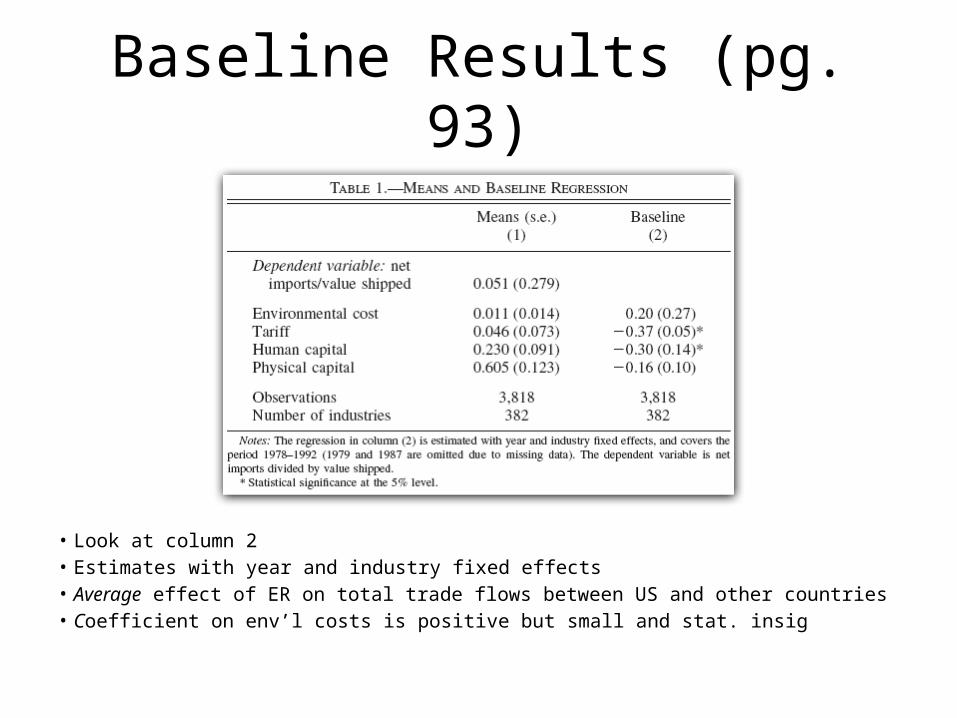
Baseline Results (pg. 93)
• Look at column 2• Estimates with year and industry fixed effects• Average effect of ER on total trade flows between US and other countries• Coefficient on env’l costs is positive but small and stat. insig
Hypothesis I: Trade with High- and Low-Standard Countries
• Does similarity in environmental standards among trading countries obscure the relationship between ER and trade flows?
• Reconstruct data to test – OECD (30 countries) vs. Non-OECD countries– Environmental Stringency Index (Eliste &
Fredriksson, 2002)• 20 High-Standard Countries• 33 Low-Standard Countries
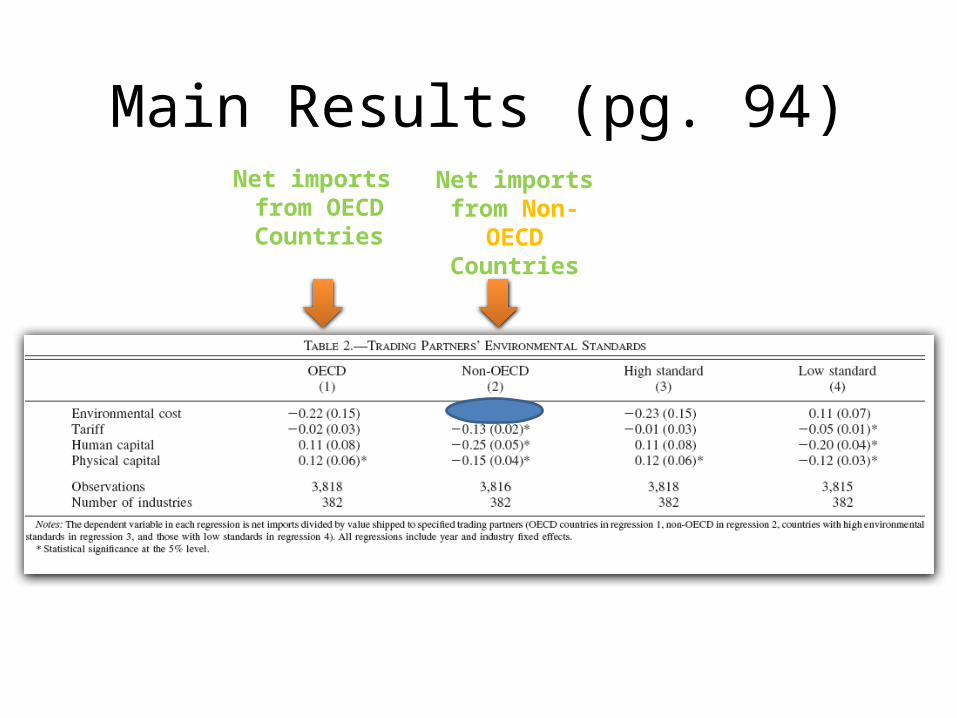
Main Results (pg. 94)Net imports from OECD
Countries
Net imports from Non-
OECD Countries
Question
• If the rich-poor partition is supposed to pick up differences in trade partner’s ER, then why don’t the authors get statistical significance in the high-low standards partition?
• Maybe what matters for firm relocation isn’t current ER abroad, but expectations re future ER abroad– expect rich countries to tighten regulations faster
• Maybe OECD ≠ High standard; perhaps what’s different about US-OECD trade is that it’s driven by something other that crude comparative advantage.
Hypothesis II: Footloose Industries
• Is the relationship between ER and trade flows obscured because pollution-intensive industries tend to be less geographically mobile (less footloose)?
• Baseline regression ignores heterogeneity of industries• Consider three potential determinants of geographical
immobility– Transportation Costs in product markets– Plant fixed costs– Agglomeration economies
Industry Mobility
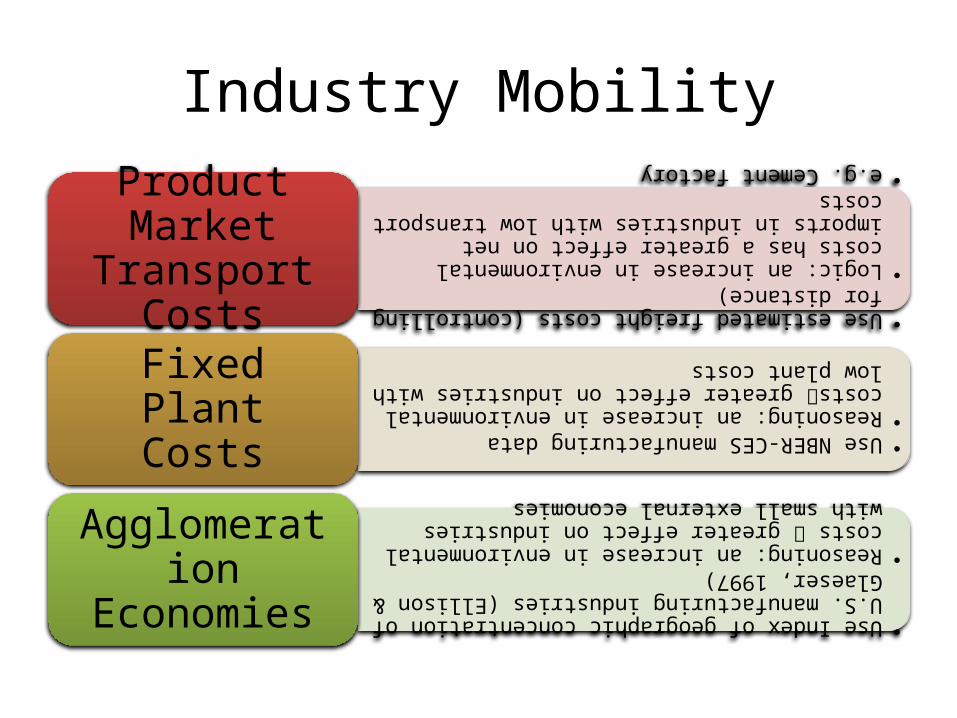
•Use estimated freight costs (controlling for distance)
•Logic: an increase in environmental costs has a greater effect on net imports in industries with low transport costs
•e.g. Cement factory
Product Market Transport Costs
•Use NBER-CES manufacturing data
•Reasoning: an increase in environmental costs greater effect on industries with low plant costs
Fixed Plant Costs
•Use Index of geographic concentration of U.S. manufacturing industries (Ellison & Glaeser, 1997)
•Reasoning: an increase in environmental costs greater effect on industries with small external economies
Agglomeration Economies
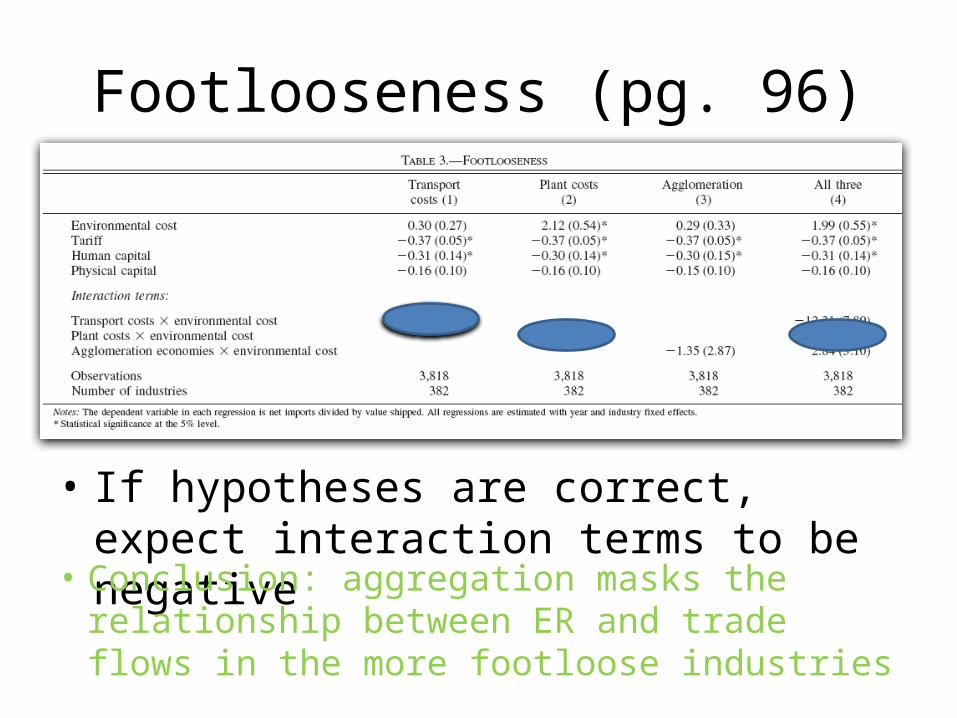
Footlooseness (pg. 96)
• If hypotheses are correct, expect interaction terms to be negative
• Conclusion: aggregation masks the relationship between ER and trade flows in the more footloose industries
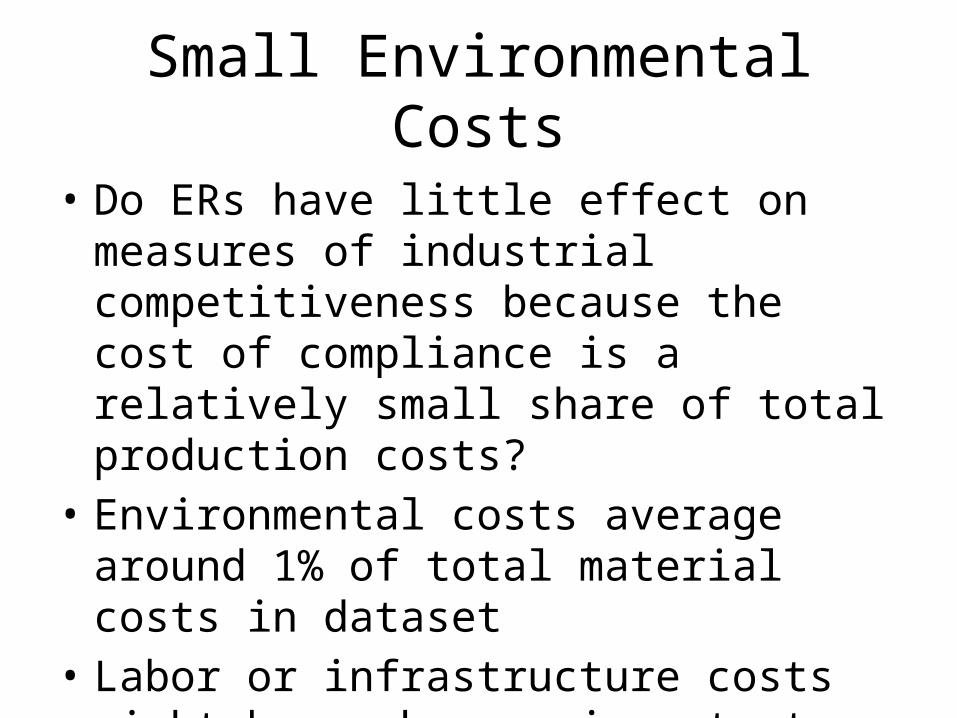
Small Environmental Costs
• Do ERs have little effect on measures of industrial competitiveness because the cost of compliance is a relatively small share of total production costs?
• Environmental costs average around 1% of total material costs in dataset
• Labor or infrastructure costs might be much more important
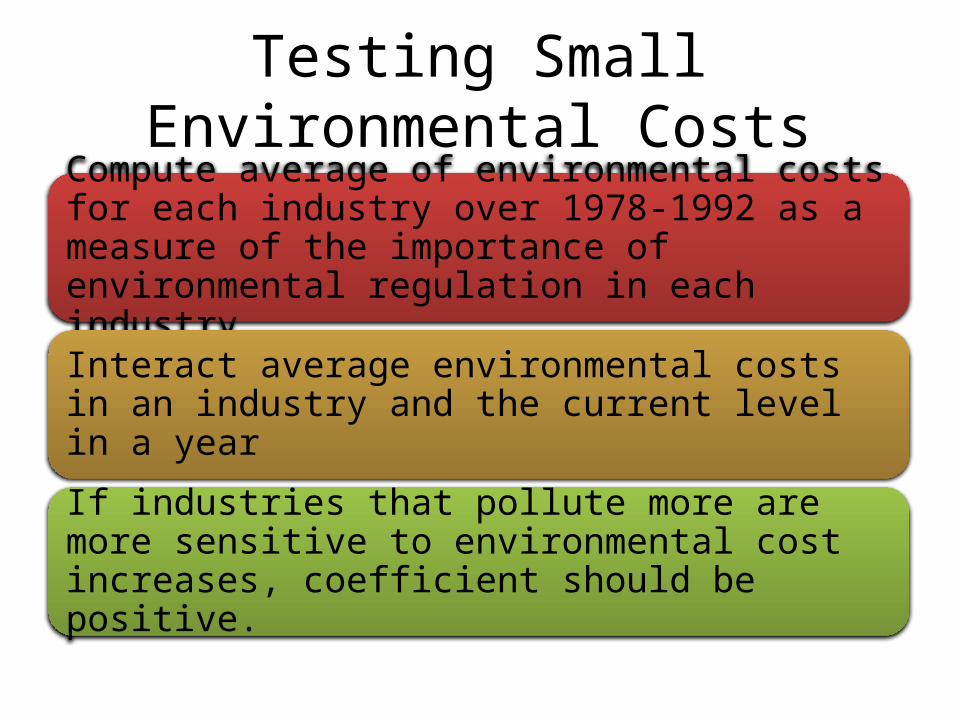
Testing Small Environmental Costs
Compute average of environmental costs for each industry over 1978-1992 as a measure of the importance of environmental regulation in each industry
Interact average environmental costs in an industry and the current level in a year
If industries that pollute more are more sensitive to environmental cost increases, coefficient should be positive.
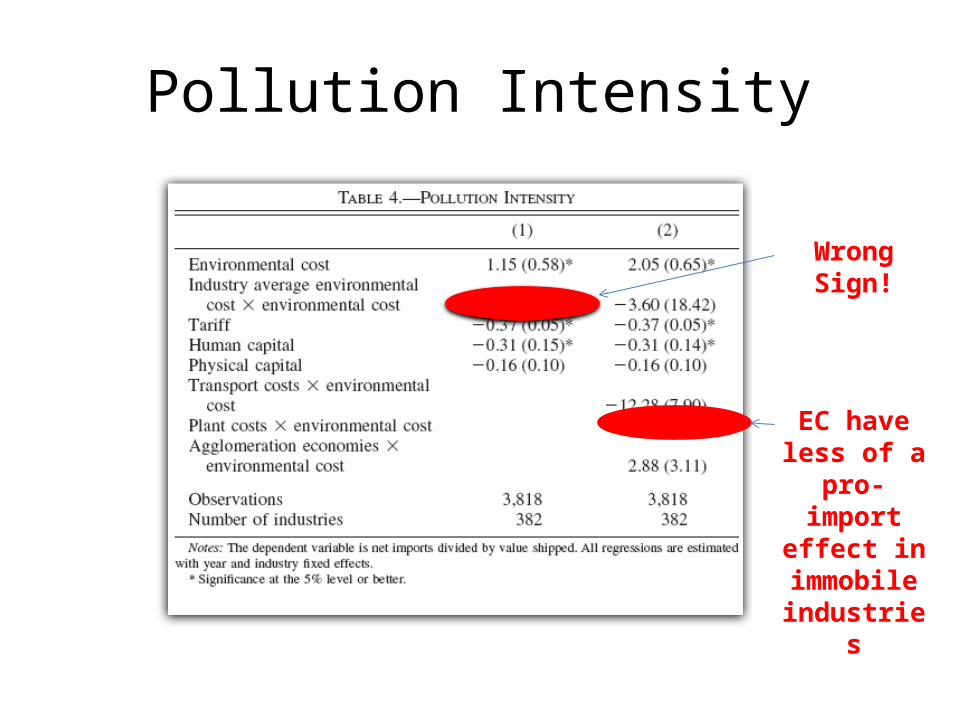
Pollution Intensity
Wrong Sign!
EC have less of a pro-
import effect in immobile industries
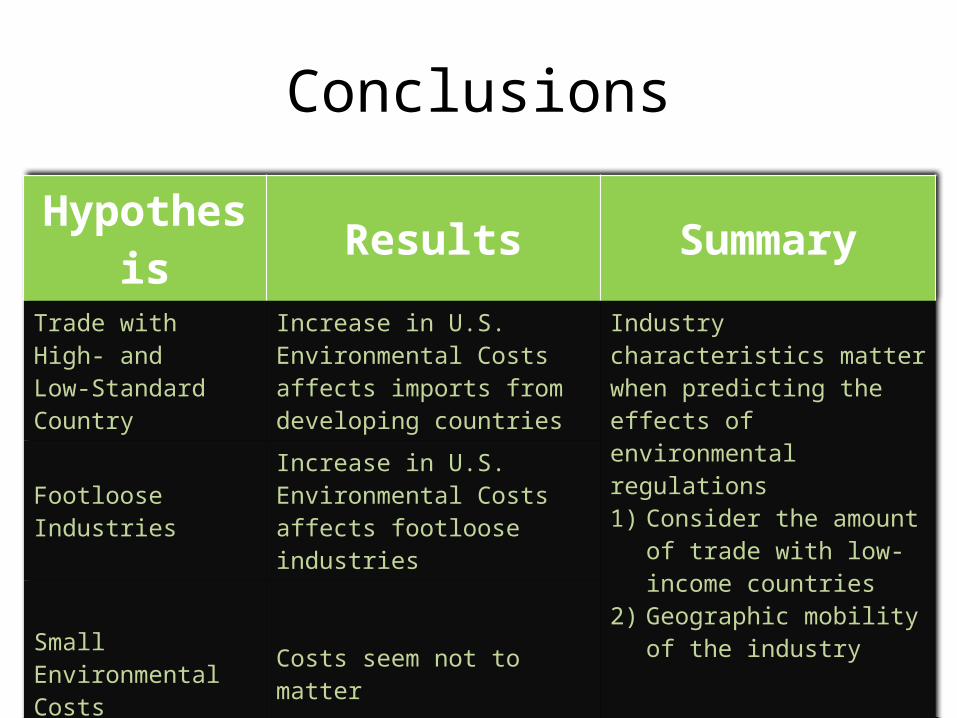
Conclusions
Hypothesis Results Summary
Trade with High- and Low-Standard Country
Increase in U.S. Environmental Costs affects imports from developing countries
Industry characteristics matter when predicting the effects of environmental regulations1) Consider the amount of
trade with low-income countries
2) Geographic mobility of the industry
Footloose Industries Increase in U.S. Environmental Costs affects footloose industries
Small Environmental Costs Costs seem not to matter