Embed Size (px)
Citation preview

ENUMERATION OF LACTIC ACID BACTERIA ON GRASS AND THE EFFECTS ON SILAGE FERMENTATION OF ADDED BACTERIA.
b y
JOSEPH PATRICK MORAN,
B.Sc. National Institute for Higher Education Dublin.
A thesis submitted for the degree of Master of Science
School of Biological Sciences, Dublin City University,
Glasnevin,Dublin 9,IRELAND.
September 1990
Dr. M. B. Crombie - Quilty,School of Biological Sciences (Supervisor).
- 0 -
D E C L A R A T I O N
I hereby declare that this thesis is my own composition and does
not include work submitted for any other degree or professional
qualification. The thesis reports the results of research carried
out by myself except where help has been acknowledged.
Joseph P Moran
July 1990

ACKNOWLEDGEMENTS
Sincere thanks to the following;
The John Flood Memorial Trust for providingfinancial assistance in undertaking this M.Sc.
Teagasc - Grange Research Centre for providingfacilities and services at my disposal.
Dr. P. O ’ Kiely for his enthusiasm, guidance, help and encouragement throughout the project.
Dr. M.B. Crombie-Qui1ty for her help, advice andsuggesti ons.
Dr. R. K. Wilson and Dr. R. E. Muck for their valuable contributions and assistance.
The staff in the Analytical Laboratory and Forage Management Department at Grange for their skilled assistance, co-operation and humour.
The school of Biological Sciences, Dublin City University for providing equipment and facilities for my use.
Dr. T. Cogan, K. Jordan and B. Walshe, Moorepark Research Centre for their help and advice.
Mary Smith for her excellent job in typing this manuscript.
Everybody at Grange for their support, help and co-operation throughout my time there.
-I-

TABLE OF CONTENTS
TITLE 0ACKNOWLEDGEMENTS ITABLE OF CONTENTS IILIST OF FIGURES AND TABLES VIILIST OF ABBREVIATIONS XABSTRACT XI
CHAPTER 1 LITERATURE REVIEW 11 .1 Introducti on 11.2 Principles of silage preservation 21.3 Characteristics of lactic acid bacteria 41.4 Main types of lactic acid bacteria associated 9
with ensilage1.5 Types and numbers of micro-organisms found 12
on temperate herbage1.6 Factors affecting the types and numbers of 14
lactic acid bacteria1.6.1 Standing crop 141 .6.1.1 Soi1 141.6.1.2 Crop 141.6.1.3 Weather/climate, season, time of day 191.6.1.4 Management 221.6.2 Harvested crop 221.6.2.1 Starting level on standing crop 231.6.2.2 Cutting and harvesting action 23
(excluding inoculation)1.6.2.3 Effect of cutting height 241.6.2.4 Inoculation by machinery 251.6.2.5 Effect of wilting 261.6.2.6 Contamination 271.6.2.7 Temperature 27
PAGE
-II-

PAGE
1.7 Methods of enumerating lactic acid bacteria 271.8 Potential for added inoculants 281.9 Objectives of research programme 35
CHAPTER 2 MATERIALS AND METHODS 372.1 Experimental Systems 37
2.1.1 Grass 372. 1.1.1 Sampling of grass pre and post 37
harvesti ng2.1.1.2 Grass shading 382.1.1.3 Plant types 392.1.1.4 Plant parts 402.1.2 Silage sampling and silo design 402.1.2.1 Test tube silos 402.1.2.2 Plastic pipe silos 412.1.2.3 Farm scale silos 412.1.3 Additives 432.1.3.1 Source 432.1.3.2 Isolation and cultivation of 43
inoculant (L. buchneri)2.1.3.3 Methods of Additive treatment 45
2.2 Enumeration of LAB 472.2.1 Grass and silage sample 47
preparati on2.2.2 Surface swabbing of farm equipment 482.2.3 Plate count methods 48
2.3 Physical and Chemical Analyses 492.3.1 Sample preparation 492.3.2 DM 502.3.3 Total Ash 502 . 3 . 4 pH 502.3.5 Lactic acid 502.3.6 VFA and Ethanol 502.3.7 NH 3 51
-III-

PAGE
2.3.8 WSC 512.3.9 CP 512.3.10 i_n vitro DMD 512.3.11 Refractometer readings 51
2.4 Bacterial Identification Procedures 522.5 Botanical Analyses 542.6 Statistical Methods 54
2.6.1 Plate count technique 542.6. 1.1 Homogenisation of sample 542.6.1.2 Sample incubation conditions 54
and type of media2.6.2 LAB enumeration 552.6.3 Effect on the silage 56
fermentation of adding abacterial inoculant under varying levels of sucrose addi ti on
2.6.4 Effect on silage fermentation 56of adding bacterial inoculafrom two sources
2.7 Meteorological Data 56
CHAPTER 3 RESULTS 573.1 Plate Count Technique 57
3.1.1 Homogenisation of sample 573.1.2 Sample incubation conditions and 58
type of media
-IV-
PAGE
3.2 LAB Enumeration 623.2. 1.1 Survey of LAB numbers on the 62
standing and harvested crops May - September 1988.
3.2.1.2 Identification of isolates 653.2.2 The enumeration of LAB on 66
six different grass generaand one clover genus
3.2.3 The enumeration of LAB on 68different plant parts
3.2.4 The enumeration of LAB on 68different parts of the cuttingand harvesting equipment
3.2.5 LAB enumeration in farm scale 70silos in the early stages ofensi1 age
3.3 The effect on silage fermentation of 71 adding a bacterial inoculant undervarying levels of sucrose addition.3.3.1 Fermentation characteristics 723.3.2 Non fermentation characteristics 843.3.3 Effluent 893.3.4 Summary of overall treatment 93
effects relative to the untreated control.
-V-

PAGE
3.4 The effect on the silage fermentation of 95adding bacterial inocula from two sources.3.4.1 Identification of L. buchneri 953.4.2 Fermentation pattern 963.4.3 Fermentation characteristics 973.4.4 Non fermentation characteristics 102
CHAPTER 4 DISCUSSION 109
CHAPTER 5 GENERAL CONCLUSIONS 129
BIBLIOGRAPHY 133APPENDICES 160
-VI-

TABLES1. Some products added to herbage at ensiling
to influence silage fermentation.2. Main products of sugar metabolism by LAB,
clostridia and yeast.3. Dry matter and energy recoveries for LAB,
clostridia and yeast fermentations.4. Types and numbers of some micro-organisms
found on fresh herbage.5. Total number of bacteria on different
kinds of plants during May and June of 19516. Total number of bacteria on the surface of
some fodder plants collected during harvesting for silage.
7. Total number of bacteria with advancement in growth period or increase in maturity of the plant.
8. Total number of bacteria (CFU/g fresh matter) on plant material at different stages of maturity.
9. Numbers of total bacteria (CFU/g) on standing green alfalfa in the morning and mid afternoon at different intervals of the season.
10. Counts of LAB (Logio CFU/g silage) at different stomacher processing times.
11. A comparison of micro-aerophilic incubation (overlay 5 to 10 ml agar) and anaerobic incubation on LAB numbers cultivated on both MRS and Rogosa agar (counts Logio CFU/ g s i1 age ).
12. A comparison of micro-aerophiIic incubation (overlay 50-60 ml) and anaerobic incubation on LAB numbers cultivated on both MRS and Rogosa agar (counts Logio CFU/g silage).
13. A comparison of MRS and Rogosa agar for the recovery of LAB from silage (Logio CFU/g si 1 age).
-VIII-

LIST OF FIGURES AND TABLES FIGURES
1. Pyrex test tube silo (100 ml capacity)2. Diagram of small scale plastic silos
(13 litre capacity) and method of assembly3. Silage core sampler4. Counts of LAB on the standing and harvested
crops over the sampling period May - September 1988.
5 . Si I age pH6. Residual Water Soluble Carbohydrate7. Lactic Acid8. Ethanol9. Acetic Acid10. Lactic : (Acetic + Ethanol)11. Lactic Acid Bacteria Counts12. Butyric Acid13. Propionic Acid14. Ammonia-N15. Dry Matter Content16. Nitrogen Content17. in vitro DMD at day 100
-VII-

14. Counts of LAB (Logio CFU/g grass) on silage under four incubation conditions.
15. Counts of LAB (Log 1 0 CFU/g grass) on grass under four incubation conditions.
16. A survey of LAB counts, WSC., DM content of grass and meteorological data between May September 1988.
17. Correlations between counts of LAB (on the standing and harvested crops), and WSC, DM and meteorological data.
18. Counts of LAB (Logio CFU/g grass) on different plant species.
19. Counts of LAB (Logio CFU/g grass) on different plant parts.
20. Counts of LAB (Logio CFU/cm2 ) on different parts of the mower and harvester.
21. Counts of LAB in (Logio CFU/g silage) large scale farm silos for three treatments over time.
22. Chemical composition of shaded perennial ryegrass (Lolium perenne).
23. Silage pH24. Residual WSC (g/kg liquid phase) in silage25. Lactic acid (g/kg liquid phase)26. Ethanol (g/kg liquid phase) in silage27. Acetic acid (g/kg liquid phase) in silage28. LAB counts (Logio CFU/g silage)29. Lactic acid : (Acetic acid + Ethanol) in
si lage30. Butyric acid (g/kg liquid phase) in silage31. Propionic acid (g/kg liquid phase) in silage32. Ammonia - Nitrogen (g/kg T N ) in silage33. Dry matter (g/kg) in silage34. Crude protein (g/kg DM) in silage35. i_n vitro dry matter digestibility (g/kg DM)
of si 1 age36. Effluent production (mis)37. Refractometer readings on silage effluent38. pH readings on silage effluent.
-IX -

39. Chemical composition of silage from whichinoculum of L. buchneri was isolated.
40. Chemical composition of Italian ryegrass(Loiium multiflorum).
41. Summary of treatment effects of noadditive, L. plantarum and L. buchneri addition (averaged over time).
42. Summary of treatment effects of no additive, L. piantarum and L. buchneri addition at day 1 0 0 .
LIST OF ABBREVIATIONSCFU Colony Forming UnitsCP Crude Proteindf Degrees of freedomDM Dry MatterDMD Drv Matter Digestibility (in vitro)FA Formic AcidLAB Lactic Acid BacteriaLb Lactobacillus buchneri
Lp Lactobacillus DlantarumNA No AdditiveNS Not SignificantPpt Precipitation*RH % Relative HumidityS4 Sucrose (4 g/kg)S8 Sucrose (8 g/kg)SD Standard DeviationSEM Standard Error of MeanSun Sunshine HoursTN Total Nitrogenuv Ultra violetVFA Volatile Fatty AcidsWSC Water Soluble CarbohydrateX Mean* = P < 0.05** = P < 0.01*** = P < 0.001
-X-

ABSTRACT
ENUMERATION OF LACTIC ACID BACTERIA ON GRASS AND THE EFFECTS ON SILAGE FERMENTATION OF ADDED BACTERIA.
JOSEPH P. MORAN.
Initial studies on the methodology of enumerating lactic acid bacteria (LAB) on grass and silage indicated that (a) varying the homogenisation time in a stomacher from 1 to 7 minutes did not effect LAB numbers, (b) MRS and Rogosa media gave similar LAB counts in silage and (c) anaerobic incubation of plates led to higher counts of LAB from silage compared to micro-aerophi1ic incubation, but similar counts from grass. A survey of LAB numbers on grass grown for silage showed pre- and post- harvest values of 3.1 x 10⁵ colony forming units (CFU)/g (range 1.40 x 10⁴ CFU/g to 1.3 x 10⁷ CFU/g.) and 3.3 x 10⁵ CFU/g (range 1.6 x10⁴ CFU/g to 5.9 x 10° CFU/g) respectively. The numbersrecorded were not related to grass dry matter or water soluble carbohydrate (WSC) content or to specific weather conditions pre- harvest. From a random selection of colonies, lactobacilli accounted for 64*, leuconostoc 25*, and streptococci 7* - of these 54* were identified as homofermentative and 32* heterofermentative. Total LAB were highest on dead material at the base of the crop (2.5 x 10⁷ CFU/g), intermediate on the lower stem and inflorescence and lowest on the leaf (6.0 x 10⁴ CFU/g) and upper stem (2.0 x 10⁵ CFU/g). Counts of LAB differedslightly across 6 grasses and one clover but were greaterthan 10® CFU/g in all cases. LAB numbers on various parts of a new harvester and mower ranged from 0 to 104 CFU/cm2. After continuous use these values generally increased, with 107/cm2 being recorded on the harvester chute. Where unwilted grass with 4 x 10⁵ CFU/g to 9 x 10s CFU/g was ensiled in large scale farm silos, values of 5 x 10⁸ CFU/g to 1 x 10⁹ CFU/g were found after 48 hours.
-XI-

When unwilted grass (6 kg/silo) of moderate (22 g WSC/ kg liquid phase) sugar level but high indigenous LAB number (1.5 x 10⁶ CFU/g) was ensiled in laboratory silos, an inoculum of Lactobaci11 us p 1antarum which added 5 x 10® CFU LAB /g grass had little effect on fermentation characteristics unless supplemented with added sugar. The combination of inoculant and added sugar gave a better fermentation than added sugar alone. Formic acid by comparison restricted the fermentation and increased the initial flow rate of effluent.
A lactic acid bacterium, isolated from a low pH (3.6) silage under Irish conditions, was investigated for use as a silage inoculum. The organism was subsequently identified as Lactobaci11 us buchneri and as might be expected with a heterofermentative organism, the inoculum did not produce a satisfactory fermentation. The inoculum was compared to an inoculum containing a homofermentative LAB L. p 1antarum. when either was added to unwilted grass (30 g WSC/kg liquid phase) with an indigenous LAB count of 2.4 x 10® CFU/g and ensiled in test tube silos. Whereas, the L. p 1antarum treatment had no detectable effect on fermentation, the L. buchneri treatment was ultimately associated with a clostridial fermentation which became evident after 7 days ensilage. L. buchneri had no detectable effect on fermentation in the initial stages of ensilage.
-XII-

1 LITERATURE REVIEW
Although silage in one form or another has been made to a limited extent in various parts of the world for three thousand years (Schukking, 1976), it is only in this century that it has been incorporated into farm practice on a significant scale. Silage was made to a very limited extent in Ireland in the first half of this century, but since the late 1950’s the quantity made has increased steadily (O’Kiely, 1984) so that at present over 20 million tonnes of silage are made annually in the Republic of Ireland (O’Kiely and Flynn, 1987). Silage accounts for 20 to 40* of the annual feed intake of cattle and cows in Ireland and is therefore a very important feed source.
Silage in Ireland is almost exclusively made from grass crops and these are frequently of variable botanical composition (O’Kiely, 1984). Grass is usually ensiled without a period of field wilting (Wheeler, Wilson and Flynn, 1983), however for reasons of avoiding silage effluent production there is a trend at present towards some wilting. Mean values for dry matter (DM), pH, crude protein and i_n vitro dry matter digestibility (DM D) for first cuts of silage between 1985 and 1988 are 191, 192, 195, 200 (g/kg); 4.17,4.24, 4.01, 3.94; 147, 142, 148, 156 (g/kg DM); 633,646, 679, 677 (g/kg DM) respectively (Wilson, 1989).
1 .1 Introducti on
1 -

In recent years approximately 60* of silage has been treated with additives, with acid and molasses being the predominant product types used. However, a small but increasing percentage of the additive market is being taken by inoculant and/or enzyme products.
Most harvester types are used for silage making and grass is ensiled exclusively in horizontal silos and normally sealed beneath two sheets of black 0.125 mm polythene.
The proportion of Irish silages which preserve well or badly can vary significantly from year to year (Wheeler, Wilson and Flynn, 1983). Unsatisfactory fermentation in farm silages can be due to poor silage making practices (i.e. not fulfilling the principles of ensilage) or due to ensiling grass which is inherently difficult to preserve. The latter, as will be described later, can be due to low levels of fermentable carbohydrate, high buffering capacity, high levels of undesirable micro-organisms or low levels of desirable micro- organisms. This thesis reports on studies which examined the levels of LAB on grass and the effects of adding LAB to grass being ensiled.
1.2 Principles of silage preservation
Silage is the product formed when grass or other material of sufficiently high moisture content (e.g. forage legumes and forage corn), liable to spoilage by aerobic micro-organisms, is stored anaerobically (Woolford, 1984). The primary objective of silage making is to preserve the forage with the minimum loss of nutrients and to maintain the nutritive value of the crop harvested. To attain this, two conditions must be met. Firstly, because ensilage is a fermentation process, anaerobic conditions must be achieved rapidly and maintained thereafter. Secondly, the undesirable activities of spoilage micro-organisms (eg.Enterobacteri aceae and Clostridia spp.) must be inhibited (Seale, 1986).
2 -

Good preservation under anaerobic conditions in unwilted silage has been attributed to the inhibitory effect of both the hydrogen ion concentration and the undissociated acids that result from a lactic acid fermentation (McDonald, Watson and Whittenbury, 1966; Whittenbury, McDonald and Bryan-Jones, 1967). With wilted silage, preservation is due to a combination of the acid effect and increased osmotic pressure (Wieringa, 1958). The latter arises due to the concentration of soluble substances in the liquid phase (Wieringa, 1958) and since fermentation is restricted by wilting, the result is a silage which preservessatisfactorily at a higher pH than with normal wellpreserved unwilted silage (Dexter, 1966; Jackson, 1968; Jackson and Forbes, 1970; Wieringa, 1969).
Assuming anaerobic conditions are achieved quickly and maintained, the direction of fermentation in anunwilted silage under a given set of environmentalconditions is largely influenced by an interactionbetween the available fermentable substrate in the crop, its buffering capacity and the particular microbial population present (McDonald and Whittenbury, 1973). Research at Grange Research Centre has shown thatconsiderable variation in the concentration of watersoluble carbohydrates (WSC) in grass (expressed as gWSC/kg grass juice) occurs. O ’Kiely, Flynn and Wilson (1986) showed considerable variability in WSC concentrations from year to year, week to week and between sward types. They also showed a strongrelationship between the amount of WSC present in the juice of grass ensiled and the ease of preserving the grass properly as silage. Silages which preserved badly appeared to have been made from grass deficient inavailable fermentable substrate.
The buffering capacity of grass has been shown to vary considerably (McDonald, 1981) and this variationcould have a significant impact on the silagefermentation pattern (Pitt, Muck and Leibensperger,1985).
3 -

The effect of the magnitude of variation in microflora on harvested grass and its significance is dealt with later.
The preservation of unwilted silage has traditionally been aided in farm practice by complete acidification (Virtanen, 1947) or by making conditions conducive to a desirable fermentation by either encouraging the growth of lactic acid bacteria or by imposing chemical treatments which suppress Clostridia (Woolford, 1984). Some products added to herbage at ensiling to influence silage fermentation are included in Table 1. This table is far from complete, but shows the wide range of categories of products used.
1.3 Characteristics of lactic acid bacteria
Successful silage fermentation depends on the presence of a population of lactic acid bacteria (LAB). The LAB are divided into two major groups depending on whether they ferment sugars homofermentatively or heterofermentative1y (Orla-Jensen, 1919). The major pathways of oxidation and fermentation of sugar by LAB are presented in Table 2. The homofermentative pathway for sugar fermentation is more desirable in ensilage than the heterofermentative pathway because it is more efficient at producing lactic acid from hexose sugars and is associated with lower dry matter losses (Woolford, 1984). As the heterofermentative pathway of fermenting fructose is less efficient than the fermentation of glucose, the fructose : glucose ratio in crops may be important. In low sugar crops the ratio is likely to be 50:50 but there is a higher proportion of fructose in high sugar crops (McKenzie and Wylam, 1957; McDonald et a_l_, 1960).
4 -

TABLE 1: Some Products Added to Herbage at Ensiling toInfluence Silage Fermentation.
APPROACH INGREDIENTS
DIRECT ACIDIFICATION(a) Complete Hydrochloric acid
Hydrochloric acid and Sulphuric acid
(b) Partial Mineral acids -Sulphuric acid
Organic acids - Formic acid
FERMENTATION INHIBITORS(a) Alone Formaldehyde
(b) With Acids Formic acid andFormaldehyde. Sulphuric acid and Formaldehyde
(c) Antibiotics Bacitracin,Penici 11 in, Ni sin
FERMENTATION STIMULANTS(a) Sugar Source Molasses
Whey
Starch and Amylase
(b) Fibrolytic EnzymesCel 1u 1 ases
(c) Microbial Lactic acidCultures bacteria
REFERENCES
Watson and Nash, 1960.
Virtanen, 1933.
O ’Kiely, Flynn and Poole, 1989.
O ’Kiely, Flynn and Poole, 1989.
WiIkins, WiIson and Woolford, 1974; Woolford, 1975a.
O ’Kiely and Flynn, 1988.Wilson and Wilkins,(1980).
Dexter, 1957; De Vuyst et al 1965
Axelsson, 1952; Weise, 1967; Budzier, 1967«; Budzier, 1967b .
Nevins and Kuhlman,1936; Allen, Watson and Ferguson, 1937b ;Dash and Voelker, 1971.
Rydin, Nilsson and Toth, 1956; Zimmer,1964.
Leatherwood, Mochrie and Thomas, 1959; Leatherwood Mochrie, Stone and Thomas, 1963; Henderson and McDonald, 1977; Henderson,McDonald and Anderson, 1982; Wilkinson, 1988 Merry and Braithwaite ( 1987 )
Woolford, 1984;Seale, 1986.
- 5 -
It is difficult to predict how much lactic acid will be produced from a herbage of a known WSC content. There are a number of reasons for this. As can be seen fromTable 2 the lactic acid bacteria can ferment sugars bydifferent pathways yielding different amounts of lactic acid. They can also produce lactic acid from thefermentation of organic acids in the crop and from the sugars released from the slow breakdown of hemice11u 1ose during ensilage. In addition available WSC can beutilised by other micro-organisms in silage and small quantities of lactic acid can be produced by the actions of Enterobacteriaceae and yeasts (McDonald,1981) and also by Baci11 us spp. (Woolford, 1977). It has been found that the concentration of sugars affect the by-products of the lactic acid bacteria. Higher acetate to lactate ratios are encountered under low sugar concentrations while under high sugar concentrations the opposite occurs (Christensen et aj_, 1958 - ref by Muck and Speckhard, 1984). Differences in the buffering capacity and moisture content of grass crops of similar WSC content will also influence the amount of lactic acid that will be produced during ensilage (Pitt, Muck & Liebensperger, 1985).
6 -

TABLE 2: Main products of sugar metabolism by LAB,___________ Clostridia and yeast_____________________
1 . LABA. Aerobic pathways1. Homofermentative
021 glucose (or 1 fructose) --- > 1 lactic acid +1 pyruvic acid + H 2O (The pyruvic acid is further oxidised to acetoin, acetic acid, formic CO 2 ).
2. HeterofermentativeO 2
Glucose (or fructose) -> 1 lactic acid + 1 acetic acid + ICO2 + 2 H 2O.
B. Anaerobic pathways1. Homofermentative
a) 1 Glucose (or 1 fructose) — > 2 lactic acid.b) 1 Pentose -> 1 lactic acid + 1 acetic acid.
2. Heterofermentativea) 1 Glucose -> 1 lactic acid + 1 ethanol + 1 CO 2 .b) 3 Fructose --- > 1 lactic acid + 2 mannitol +
1 acetic acid + 1 CO 2 .c) 2 Fructose + 1 glucose — > 1 lactic acid +
1 acetic acid + ICO2 + 2 mannitol.d) 1 Pentose --> 1 lactic acid + 1 acetic acid.
2. Clostri di a
2 lactic acid -> Butyric acid + 2CO2 + 2H 2 1 Glucose — > Butyric acid + 2CO 2 + 2H 2
3. Yeasts
A. Aerobic pathwaySugars -> CO 2 + H 2O. Under aerobic conditions, appreciable amounts of higher aliphatic alcohols are formed especially iso-pentanol.
B. Anaerobic pathway1 Glucose -> 2 Ethanol + 2CO 2 (Main products) other products are also formed, and include n-propanol,iso-butanol, iso-pentanol, acetic acid, propionic acid, butyric acid and isobutyric acid as well as some lactic acid.
Sources: McDonald et aj., 1960; Kibe and Kagura, 1976;Woolford, 1976; Edwards and McDonald, 1978;
___________ Seale. 1986._______________ ___________ ____________
7 -

TABLE 3: Dry matter and energy recoveries for LAB,Clostridia, and yeast fermentations.
Micro-organism FermentationDry
% Recovery Matter Energy
LAB Homofermentative Glucose or fructose 100 99. 3
HeterofermentativeGlucose 76 98 . 3
HeterofermentativeFructose 95.2 99
Clostridia Glucose and Lactate 48. 9 81.6
Yeast Glucose 51 99 . 8
(Source: McDonald, Henderson and Ralton, 1973;McDonald, 1981)
Table 3 illustrates the efficiency of the homofermentative LAB in % recovery of dry matter and energy over the other groups of organisms.
McDonald (1981) has listed some of the species of LAB which are important in silage. Of the genera of LAB, streptococcus and pediococcus are homofermentative, leuconostoc is heterofermentative and lactobacillus, depending on the species, can be either.
It has been found that the types of LAB present change throughout the period of fermentation. Beck in 1972 found that acidification was initiated by the homofermentative LAB, the prominent organisms being L. curvatus and L. plantarum. Four days after ensiling he noted that 85% of the lactobacilli present in the silage
- 8 -
were heterofermentative. At the end of the ensilingperiod 75% of the lactobacilli in low dry matter silage and 98% in high dry matter silage were heterofermentative species. Langston, Bouma and Connor (1962) and Moon and Henk (1980) showed that streptococci and leuconostocs initiated fermentation and were superceded by species of lactobacilli and pediococci. Studies by Fenton (1987) showed streptococci to be important throughout the silage making process, pediococci to predominate in the early stages and lactobacilli to increase in dominance during ensilage, particularly in a wilted crop.
1.4 Main types of LAB associated with ensilage
1.4.1 Lactobacilli.
The lactobacilli are Gram positive, non spore-forming rods which vary in their morphology from long and slender to short coccobacilli (Buchanan and Gibbons,1974). Even though their growth can occur in air they have a fermentative metabolism. The lactobacilli have complex nutritional requirements for amino acids, peptides, nucleic acid derivatives, vitamins, salts, fatty acids and fermentable carbohydrates. The nutritional requirements are generally characteristic for each species. Surface growth of lactobacilli on solid media is often enhanced by anaerobiosis and 5 to 10% CO 2 (Kandler and Weiss, 1986). They can withstand temperature ranges from 2 to 53°C and have an optimum generally in the range of 30 to 40°C. As the lactobacilli are aciduric they have an optimal pH in the range 5.5 to 6.2 or less (Kandler and Weiss, 1986). Species of lactobacilli important in silage include:
A. HomofermentativeLactobaci11 us casei
coryniformis curvatus Dlantarum
B. HeterofermentativeLactobaci11 us brevis
buchneri fermentum vi ridescens
(McDonald, 1981).
1.4.2 Streptococci
The streptococci are Gram positive, non spore forming cells which are spherical or ovoid in shape and less than 2 urn in diameter (Schleifer, 1986). Most are facultative anaerobes whose carbohydrate metabolism can be altered by the presence of O 2 or any other hydrogen acceptor. The growth of streptococci in the presence of O 2 results in the accumulation of H 2O 2 as an end product of carbohydrate metabolism. The temperature ranges for growth vary depending on the species, however a temperature of 37°C is generally optimal for growth (Schleifer, 1986). Examples of streptococci important in silage making include:
Streptococcus faecali s faeci urn
both of which have a homofermentative metabolism (McDonald, 1981).
- 10 -

1.4.3 Pediococci
This group of LAB are also Gram positive, non spore forming cocci which occur in pairs or in tetrads as a result of alternate division along the two perpendicular planes (Schleifer, 1986). The pediococci have anexternal requirement for nearly all the amino acids and several B vitamins. All species require nicotinic acid, pantothenic acid and biotin. The optimal temperature for growth of most species is in the range of 25 to 4 0 ° c (Schleifer, 1986). Important silage pediococci include:
Pediococcus acidilactici cerevisiae pentosaceous
all of which have a homofermentative metabolism (McDonald, 1981).
1.4.4 Leuconostocs
The final group of LAB are the leuconostocs. The shape of these bacteria may be spherical or lenticular depending on the media in which they grow. They are also Gram positive, non spore forming cells and they usually occur in pairs and chains (Schleifer, 1986). The leuconostocs are chemo-organotrophs requiring rich media and often having complex growth factor and amino acidrequirements. Nicotinic acid, thiamine, pantothenic acid and biotin are required by all species for growth. The optimum growth temperature of the leuconostocs is inthe range of 20°C - 30°C (Schleifer, 1986). Theimportant leuconostocs in silage have aheterofermentative metabolism, and include:
Leuconostoc cremorisdextranicum mesenteroi des
(McDonald, 1981).
- 11 -
1.5 Types and numbers of micro-organisms found ontemperate herbage.
The dominant type of micro-organisms found on the aerial parts of growing forage have been identified by Gibson et al in 1958 as Gram negative, pigmented, strict aerobes. The majority of these include the pseudomonades, xanthomonas, flavobacteria andcorynebacteria (Dickenson, Austin and Goodfellow, 1975). Large numbers of coliform bacteria mostly of the genus Aerobacter have also been detected (Gibson et al, 1958). In addition, the presence of yeasts and moulds have been shown, although their numbers can be variable (Seale et al, 1981; Heron, Edwards and McDonald, 1988). Ingeneral the numbers of organisms on the growing plant have been found to vary depending on the kind of plant, stage of maturity, plant part and season (Kroulik,Burkey and Wiseman, 1955*). For a summary of the typesand numbers of micro-organisms on standing fresh herbage see Table 4.
Counts of LAB on forage plants have usually beenquite low (Stirling and Whittenbury, 1963; Muck and O'Connor 1985; Fenton, 1987). LAB have been detected on the sheath at the base of grasses, on partially withered and decaying blades of grass and on damaged foliage such as aphid invested leaves of trees (Stirling and Whittenbury, 1963).
LAB can be divided into the four main groups, lactobacilli, streptococci, pediococci and leuconostocs. In an examination of over 400 plant isolates Stirling and Whittenbury (1963) found 80% of the LAB to be leuconostoc, 10% pediococci and the remainder lactobacilli.
- 12 -

TABLE 4: Types and numbers of some micro-organisms found on standing fresh herbage
Group Number Reference
L.A.B. Less than 10 per g fresh herbage
(Muck and O ’Connor,1985; Fenton, 1987)
ClostridiaandBaci 111
low or undetectable 1evels
less than 103/g fresh matter
(Allen et al. 1937a; Martos,1941 ; Gi bson et al, 1958)(Langston et al. 1962)(Heron et al, 1988 )
Yeasts and Moulds 102/g fresh (Seale et a l ,1981)herbage
1.6 x 10⁵/g fresh (Heron et a l . matter 1988)
Pseudomonads High numbers (Dickenson et al.1975)
Coliforms 10 to 102 per g herbage (Kroulik et al,1955*)
1.6 x 1 0 V g fresh (Heron et al .matter 1988)
Xanthomonas High numbers (Dickenson et al,1975).
- 13 -

1.6 Factors affecting the types and numbers of LAB
Effects on the standing (pre-cutting) and harvested crop will be considered separately.
1.6.1 Standing crop1 . 6 . 1 . 1 S o i 1
Few studies have been carried out on the affect ofsoil on the levels of LAB on the standing crop. However, it seems likely that under some environmentalconditions, soil may affect the bacterial levels on the growing plant. Stirling and Whittenbury (1963) found low levels of LAB in a number of soil samples (numbers ranging from 1 to 100 colonies per ml of suspension made by adding 1g soil to 9 mis H 2O. Muck and O ’Connor(1985) proposed that soil splash under heavy rainfall may give rise to inoculation of plant parts such as leaves and stems. They also proposed that the wet soil underneath the standing crop may keep the relativehumidity of at least the lower portion of the crop high. This would ensure a more moist environment which would be more favourable for bacterial growth (Pitt et a l . 1985).
1 .6.1.2 Cropa. Plant part
Kroulik et al (1955*) found different numbers of LAB on different parts of the same plant at a given time. It was observed that corn (Zea mays) tassel had very many more bacteria (4x10⁵ CFU/g) than did corn leaves (9x10³ CFU/g) and also that Orchard grass (Dactyl is glomerata) heads were lower in counts (5x10² CFU/g) than Orchard grass leaves (3x10³ CFU/g). Pahlow and Dinter (1987) looked at counts of LAB on maize and found that the
- 14 -

yellow parts of the maize (corn, cob) had far lower counts of LAB than on the green parts (stems, leaves, husks).
Stirling and Whittenbury (1963) in an attempt to establish the location of silage LAB on the plant, incubated intact portions of the plant tissue in acetic acid -acetate agar. They found that 1euconostocs, pediococci and lactobacilli were scarce on living undamaged tissue and that there was a complete absence of LAB on the plant inflorescence before and after seed formation. A low number of LAB were found on fresh, partially wilted, and decaying leaves of kale, beet, mangel, and cabbage. The majority of LAB colonies which developed were found on sheath material at the base of grasses, on partially withered and decaying blades of grass and on damaged foliage such as aphid infested leaves of trees.
Moon and Henk (1980) found few bacteria on the surfaces of fresh samples of either wheat or alfalfa leaves and no bacteria in the leaf interior. The surfaces of the wheat and alfalfa were covered by a protective waxy cuticle. It was proposed that the few LAB on the leaf surface may serve as an inoculum in the silage fermentation or that the bacteria are located in larger numbers at other sites on the plant.
Birkby and Preece (1987) found that the ligule of green leaves of Cocksfoot (Dactyl is glomerata) grass was an important microbial niche for both bacteria and fungi. They also found that the leaf blade adjacent to the ligule and the leaf tip had a rich microbial flora, but that the remainder of the leaf was sparsely populated.
- 15 -

b. Plant type
Little information is available on the affect of plant type on LAB numbers however, Kroulik et al (1955*) found variations in the total numbers of bacteria on different types of plants (see Table 5).
Table 5: Total number of bacteria on different types of
Nilsson and Nilsson (1956) looked at the total numbers of bacteria on the surface of some fodder plants collected during harvesting (Table 6). The number of bacteria on most material was about the same, Timothy having slightly fewer bacteria than the others.
plants during May and June of 1951
Plant Horse tail OatsOrchard Grass Thi stle White clover Wild mustard Wild onion
Bacterial Plate Count (CFU/g)4.9 x 10 5 9.8 x 10s 3.4 x 10⁵ 2.6 x 10“ 1.17 x 1072.1 x 1071.2 x 105
- 16 -

Table 6. Total number of bacteria on the surface of some fodder plants collected during harvesting for silage.
c . Stage of plant maturity
Kroulik et al (1955*) found much variation in the microbial populations on green plants, but the total numbers of bacteria increased with maturity of the plants and advancement of the season, as illustrated in Table 7.
Nilsson and Nilsson (1956) also looked at the total number of bacteria on plant material at different stages of maturity (Table 8). Samples were taken both before and after the "silage stage".
The total number of bacteria on clover showed an appreciable increase in June rising to 2 x 10° CFU/g. This Increase was not found on Lucerne or Timothy. The first colonies of LAB were detected on Tween agar (Red clover only) in July.
Fodder Plant OatsRye grass T imothy Lucerne PeasRed clover Hybrid clover Scentless mayweed
Total number of bacteria per g fresh weight
3.5 x 1052.5 x 1051.5 x 10<1.5 x 10*4.1 x 10s1.2 x 1055.0 x 10s1.6 x 10«
1 7

Table 7. Total number of bacteria (CFU/g fresh matter) with advancement in growth period or increase maturity of the plant.
No. of Bacteri alPlant Dates SamDles Plate CountsAlfalfa 1 7-30/4/51 5 1 .8 X 103
4-24/5/51 7 2.6 X 1041-27/6/51 5 6.2 X 10⁴
Oats 2/6/53 1 2.6 X 1039/6/53 1 3.3 X 10³
29/6/53 1 2.3 X 10⁴
Sour Dock 25/5/51 1 2829/5/51 1 1 X 10314/6/51 1 6.9 X 10319/6/51 1 4.8 X 10³
Table 8. Total number of bacteria (CFU/g fresh matter) on plant material at different stages of maturity.
PLANT Date of Sampling13/5 29/5 15/6 2/7 20/8
Lucerne 5x10⁴ 2.7x10⁵ 1 . 5x10 s 3.6x10»Red Clover 2.2x10 5 4.3x10 4 2.6x10s 1.57x10 8 7.2x10sTimothy 1.5x10 4 3x1 0 3 4x10 4 4.9x10« 2.5x10⁹
- 18 -

1.6.1.3 Weather/climate. season, time of day
a ) Weather/climate
Very little work has been done of the effect of weather and climate on levels of LAB. However, Weise and Wermke (1973), found that LAB prefer weather conditions to be moderately warm and mainly overcast with relatively high humidity. They also prefer calm conditions with low evaporative tendency.
Muck (1987) looked at the effects of rainfall and temperature on levels of LAB on alfalfa. They found that when precipitation in the five days before mowing exceeded 25 mm, there was a substantial increase in the number of LAB on chopped alfalfa. It was proposed that high surface moisture may provide a better environment for microbial growth in the swath. In their examination of temperature effects, Muck found that for short wilting times, increasing the temperature increased the numbers of LAB. This would be as expected, since mostLAB have optimum growth rates in the range 35 to 40°Cand are reported to stop growing between 5 and 15°C (Buchanan and Gibbons, 1974). It was found that longer wilting times of two or more days showed no correlation between temperature and bacterial numbers.
Mundt (1970) stated that reproduction and thefrequency in occurence of LAB is influenced markedly by rainfall and relative humidity. In one study bacteria were obtained from samples of selected vegetables with an average population of 1 x 10 5/CFU g tissue. During the following year when near drought conditions prevailed, these bacteria were obtained from onlytwo-thirds of the samples, with total populations at 10% those of the preceding year.
- 19 -

b ) Season
Stirling (1953) found that numbers of lactobacilli were not determined by seasonal conditions. Counts for ryegrass sampled from the same plots over a period of two years showed no correlation with the season.
Mundt (1970) stated that LAB do not thrive on plants during the cold months of the year. LAB were rarely recovered from dormant and overwintering plants. They were found with less frequency on non-succulent plant parts such as leaves, than they were from flowers and fruiting structures in the colder winter months. It is also stated that some strains of the genus Streptococcus prefer the cooler months during Spring and early Summer (e.g. S_!. faecium var casseliflavus) while others (e.g.S . faecalis var liguefaciens) prefer the warmer temperatures. The first isolations of this strain (S . faecalis) was found between June and September, after which an abrupt decrease in both numbers and incidence occurred (Mundt, 1970). The occurence of lactobacilli and pediococci on plants was proposed to be correlated to the warmer temperatures, although insufficient data was available to prove this (Mundt, 1970). Pediococci had not been isolated (in Tennessee) until the end of May (Mundt, 1970).
Weise (1973) noticed an increase in the population of lactobacilli on meadow fescue between April and September. The increase was found in theheterofermentative types with a corresponding decrease in the homofermentative types, until the former accounted for 100% of the lactic population by the end of June. Thereafter, the numbers of heterofermentative lactobacilli decreased to a similar level observed in April. The leuconostocs and streptococci did not become a significant proportion of the lactic population until the end of August. Dickenson et al (197 5) found that total bacterial populations on perennial ryegrass (Lolium perenne) in spring and summer were relatively low compared with counts obtained in September, when the
- 20 -

highest max and monthly mean air temperature was recorded. The area of leaf surface colonised rose from0.0001* in May to approximately 0.1* in September.
c) Time of day.
Kroulik et aj_ (1955a ) could not correlate variations in total numbers of bacteria on alfalfa with the time of day (Table 9). On the other hand Muck and O' Connor(1985) found that when the level of bacteria on alfalfa was low there were inconsistent trends in bacterial numbers as a function of time of day. However, when the levels of bacteria were high (ie. when bacterial levels were not affected by the forage harvester) there was a noticeable diurnal variation in the levels of LAB. The lowest bacterial numbers occurred between 1 and 3 pm. It was proposed that the primary cause of variation in bacterial numbers on chopped alfalfa was due to the Inverse relationship between numbers of LAB and diurnal variation in solar radiation.
Table 9Numbers of total bacteria (CFU/g) on standing green alfalfa in the morning and mid-afternoon at different intervals of the season.
Date Time of day Bacterial PlateCount (CFU/q)
9/5/51 9.15 A.M. 1.54 x 1039/5/51 3.15 P.M. 6.24 x 10³
1/6/51 9.30 A.M. 9.7 x 1041/6/51 3.00 P.M. 9.9 x 10⁴
16/5/51 9.30 A.M. 4.2 x 10416/5/51 3.00 P.M. 2.8 x 10⁴
- 21 -

1.6.1.4 Management
(a) Yield
Muck and O ’Connor (1985) found an increase in bacterial numbers with increasing yields of alfalfa, particularly between yields of 2 to 4 t D.M./hectare. The relationship between yield and LAB numbers was proposed to be dependent to a large extent on solarradiation. When the mown swath is thick, it isunlikely that ultraviolet radiation (UV) from the sun can penetrate through the whole swath. When the swath is thin, UV radiation could potentially sterilise the whole swath. All of the swaths examined that had undectectable levels of LAB on the bottom of the swath were from harvests where the yield was below 2.5 tons DM/hectare.
(b) Grazing
Stirling (1953) suggested that the population of lactobacilli are influenced by grazing. The bacteria were found to be more numerous in samples taken from pastures which were being grazed than from pastureswhich had been grazed but then allowed to grow forensilage.
1.6.2 Harvested Crop
The number of LAB present on harvested grass are dependent on a combination of factors:
- 22 -

1.6.2.1 Starting level on standing crop
The higher the number of LAB present on the standing crop, the higher the number that might be expected on the harvested crop, were harvesting per se not to affect LAB numbers. However, as has been stated previously, the number of LAB on the standing crop is usually low (less than 10 CFU per g fresh matter) (Stirling and Whittenbury, 1963; Muck and O ’Connor 1985; Fenton, 1987).
1.6.2.2 Cutting and harvesting action (excluding i noculation)
The cutting and harvesting machinery used could influence LAB numbers in a variety of ways, including releasing plant juices (nutrient source for LAB), facilitating consolidation (and thereby rapid achievement of anaerobiosis) and spreading LAB over plant surfaces.
Gibson et aj_ (1961) showed that the development of bacteria in silage is markedly assisted by treating the fresh herbage mechanically so that its juices are released. The outstanding bacteriological effect of liberating the plant sap supposedly was to increase the growth of LAB during the multiplication phase which followed immediately after filling the silos. If sufficient juice was available the LAB were still able to multiply when pH values were becoming low and other bacteria (ie. other than LAB) had reached the phase of decli ne.
Apart from the release of sap, mechanical treatment can assist preservation by facilitating consolidation (Gibson et al_, 1961). Greenhill ( 1964) proposed that chopping and laceration of grass would result in the rupture of only a small number of plant cells with the resultant release of small quantities of juice in comparison with such severe treatments as maceration of the plant. It was claimed that the beneficial effect of
- 23 -

these treatments is not the fact that they result in the release of juices but that they assist in bringing about more rapidly the anaerobic conditions which in turn result in cell breakdown. The result of the investigation indicated that cell breakdown and the release of plant cell juices was a necessary pre-requisite for the production of significant amounts of lactic acid during ensilage.
De Man (1952) suggested that since the stems of grass are richer in carbohydrate and poorer in protein than the leaves, an important effect of a crushing process is to secure uniformity. However, since the released plant juices permeate throughout the herbage in the silo it is unlikely that the physical mixing referred to by De Man (1952) is of importance in practice.
Another possible effect of mechanical processes is to distribute the LAB over the plant surfaces (Gibson et a l . 1961). Stirling and Whittenbury (1963) suggested that the LAB can be spread by handling when the crop is cut, especially if the plant sap is released by chopping, bruising or lacerating the material.
Seale et al (1982) concluded from his work that minced grass produced better silage than chopped grass which in turn gave better quality silage than unchopped grass.
1.6.2.3 Effect of cutting height
Stirling and Whittenbury (1963) found that since LAB predominate in the decaying herbage at the base of the plant the numbers of LAB are likely to be influenced by the amount of partially decayed material harvested. No information is available on the influence of cutting height on the numbers of LAB. However, based on the above knowledge, it would seem likely that the closer to the ground the cutting height the greater the amount of decaying plant material collected and the higher the LAB number present.
- 2 4 -

1.6.2.4 Inoculation bv machinery.
Kroulik et al (1955*) found substantial increases in total numbers of bacteria on alfalfa after harvesting. Stirling and Whittenbury (1963) in an examination of harvesting machinery, found colony counts of LAB in excess of 2 x 10³ per ml of swab water. It was also found that the number of organisms found on harvesting equipment is indicative of the ability of LAB to multiply where plant sap collects. It was therefore suggested that the equipment may be an obvious means whereby organisms may be spread.
Henderson, McDonald and Wool ford ( 1972) found that the number of LAB increased on grass immediately after forage harvesting, numbers rising from 1 x 10² CFU/g on the standing crop to 3.6 x 10² CFU/g on the harvested crop. McDonald (1976) in a similar experiment found numbers of LAB on uncut grass to be quite low (<100), however, these numbers rose substantially after harvesting up to 4.9 x 10⁵ CFU/g.
Muck and O ’ Connor (1985) in a study of bacterial levels on alfalfa found that none of the fresh samples of alfalfa developed any LAB colonies. However, after mowing (with sickle bar or rotary mowers) there were a significant, but low, number of LAB on half of the samples analyzed (average count 61 CFU/g alfalfa). It was found that the forage chopper inoculated the alfalfa passing through it, usually guaranteeing between 103 and 10 4 LAB /g alfalfa. In addition, it was noted that if the levels in the swath were higher than 103 to 104 LAB/g immediately pre-harvesting, the chopper provided no additional inoculation.
Finally, Fenton (1987) carried out an investigation into sources of LAB over 2 seasons 1983 and 1984. In her study, she found that numbers of LAB on the standing crop were low (102 CFU or less per g grass) for both seasons. It was also found that cutting the grass with the mower during the 1983 season had no effect on
- 25 -

numbers of LAB, however after the grass had passed through the forage harvester the numbers rose substantially. During the 1984 season numbers of LAB increased after mowing up to 103 per g grass, but no increase was found after the forage harvester stage. Counts of LAB during 1984 on the mower blades were found to be quite high (1010 CFU/m2 blade) which led to the conclusion that machinery could give rise to inoculation of the grass crop.
1.6.2.5 Effect of wilting
Kroullk et aj_ ( 1955*) found that the micro-organisms on green forage increased in number greatly during the period between cutting and harvesting, particularly when the forage was left to wilt in the field for two or more hours.
Henderson et al (1972) looked at the effect of wilting on numbers of LAB. It was found that numbers rose from 1.7 x 10⁴ CFU/g in morning (9.00am) to 1.1 x 10 5 CFU/g in the afternoon (3pm). In addition, the count on the grass after passing through the harvester (4pm) increased again to 7.2 x 10⁵ CFU/g. Weise (1969) found that during the wilting process all micro-organisms with the exception of coliform bacteria decreased in number. On the other hand, Muck and O ’ Connor (1985) found significant increases in LAB numbers on alfalfa as the wilting time increased. They also found that low numbers of LAB were most often associated with one-day wilting times under low yield and/or low temperatures. For wilting times longer than one day with high yields of alfalfa, the number of LAB found were high (>105 CFU/ g alfalfa)
Finally, Fenton (1987) found a small increase in numbers of LAB when grass was left to wilt in the field for 24 hours. It was found that the bacteria in the wilted grass subsequently increased in number more rapidly in the silo than the direct cut grass samples.
- 26 -

1.6.2.6 Contamination
Counts of LAB in soil have been found to be low(Stirling and Whittenbury, 1963) leading to the suggestion that soil contamination may not be a major factor effecting numbers of LAB on the harvested crop.
1.6.2.7 Temperature
Most LAB have optimal growth rates between 3 5 and 40°C (Buchanan and Gibbons, 1974). While temperatures encountered in the harvesting environment rarely reach this value under Irish conditions, it would seem probable that within the normal ranges that occur, growth rates of LAB may increase as the temperatureincreases.
1.7 Methods of enumerating LAB.
The procedure normally used for obtaining viable counts of LAB populations on grass or silage with various modifications is as follows:
A sample of the grass or silage is homogenised (Stomacher or Blender jar) with a suitable diluent. An isotonic diluent is chosen which gives maximum recovery of viable LAB. The diluents used are usually Ringers !/4 strength or peptone water (0.1 or 0.5%), (Dickenson et al, 1975; Muck and O'Connor, 1985; Fenton, 1987).
A sample of the homogenate is subsequently diluted logarithmically. Aliquots are then transferred to Petri dishes containing a solidified agar medium, whereuponeach aliquot is spread over the medium ("spread - plate technique"), or to empty Petri dishes followed by the addition of molten agar, each aliquot being thoroughly mixed into the medium prior to setting ("pour - plate technique").
- 27 -

The growth media used for the selective recovery of LAB is usually either Rogosa Agar or M.R.S. Agar. Rogosa Agar was developed as a selective agar for the recovery of 1actobaci11i, but it has also been found to recover some pediococci and leuconostocs as well (Rogosa Rogosa, Mitchell and Wiseman, 1951; Rogosa and Sharpe, 1959; Muck and O ’Connor, 1985; Fenton 1987). Similarly M.R.S. was developed for the recovery of 1actobaci11i, but it also has been found to recover some of the other three groups of LAB as well, i.e. pediococci, leuconostocs and streptococci (de Man, Rogosa and Sharpe 1960; Seale, et al, 1982). The Petri dishes containing the LAB are incubated at a temperature and for a duration best suited to the type of organisms being examined. The incubation conditions normally chosen for growth of LAB are either microaerophi1ic (overlay with another layer of medium) or anaerobic incubation (enclosed environment of CO 2 and H 2 ). Finally after the incubation the colonies of LAB on each plate are counted and numbers expressed per gram of grass or silage.
For the recovery of LAB from grass and silage, Petri dishes containing the bacteria in the appropriate media are incubated at 30°C for 3 days (Rauramma et al. 1987; Weinberg, Ashbell and Azrieli, 1988) or for 2 days (Muck and O ’Connor, 1985; Fenton, 1987). Others have incubated at 30°C for 5 days (Gibson et al. 1961; Seale et al. 1982). On the other hand, a number haveincubated at 25°C for periods varying from 3 to 7 days (Dickenson et al. 1975; Silley and Damoglou, 1985).
1.8 Potential for added bacterial inoculants
1.8.1 Required characteristics of an inoculum
The criteria which a micro-organism should satisfy for use as a silage additive are cited by Henderson ( 1987b ). These are:
- 28 -

1. It must grow vigorously and be able to compete with, and preferably dominate, other organisms.
2. It must possess a homofermentative pathway in order to produce the maximum amount of lactic acid from hexose sugars immediately available.
3. It must be acid tolerant and capable of producing a final pH of at least 4.0 as rapidly as possible to inhibit the activities of other micro-organisms.
4. It must be able to ferment glucose, fructose, sucrose, fructans, and preferably pentose sugars.
5. It must not produce dextran from sucrose because this is not preferred by silage micro-organisms, or mannitol from fructose because this of little value to the ruminant and is accompanied by a loss of dry matter as carbon dioxide.
6. It should have no action on organic acids as these will be replaced by fermentation acids with stronger buffering capacities and loss of dry matter as carbon dioxide.
7. It should possess a growth temperature range between 0 and 50°C.
8. It should be able to grow in material of low moisture content, as might arise when wilted material is ensiled.
9. It should have no proteolytic activity.
10. It should have genetic stability (Lindgren, 1984).
- 29 -

1.8.2 Inoculants
Inoculants are products which add large numbers of micro-organisms to the grass being ensiled. The principle underlying those currently in use is that the addition of homofermentative LAB in sufficient numbers would overwhelm the indigenous microbial population and ensure the rapid development of an efficient lactic acid fermentation. The development of this efficient fermentation depends on two key factors. First there must be sufficient sugar available for conversion to lactic acid to achieve a stable low pH in the silage. Second, the viability of the bacteria in the product must be preserved from the time of manufacture to the time of application so that as many live bacteria are added to grass as possible (Wilkinson, 1988). It has been found that it is necessary to have at least ten times as many bacteria from the inoculants as are present on the grass at harvest for the inoculated bacteria to have a chance of dominating the fermentation (Satter et al, 1987). The composition of an inoculant (provided it applies the optimum number of LAB/g forage), is of vital importance. Although, the criteria required for an inoculant are well known there are great variations in the species of LAB used in the inoculants.
McDonald (1981) reported that L. piantarum had been singled out by several workers as one of the most suitable micro-organisms for inoculation purposes. Bryan-Jones (1969) had recognized this and proposed an inoculum of L. piantarum and Streptococcus faecalis. He considered that as Streptococcus spp are faster growing under aerobic conditions they would be expected to dominate in the early stages of ensilage, then as the pH falls L. p ! antarum could then be expected to take over the fermentation. For similar reasons Pedi ococcus
- 30 -

acidilactici was also chosen for use in combination with L. plantarum. It too dominates early in the fermentation and is then superceded by L. plantarum as the pH falls (Lindgren et al, 1983).
Woolford and Sawczyc (1984a) investigated 21 strains of LAB for use as inoculants. None of the culturessatisfied all the criteria but three, Streptococcus durans. L. acidophilus and L. plantarum had greater potential than the others.
It is for this reason that most commercial inoculants on the market contain L. plantarum only or incombination with other LAB.
Some inoculants also contain clostridiaphage. These clostridiaphage are claimed to attack clostridial bacteria and destroy them. The objective in including clostridiaphages is therefore to reduce the population of Clostridia in the ensiled crop at the outset so reducing the risk of secondary fermentation during the storage period. No scientific independent evaluation ofthe effects of clostridiaphage on silage fermentationpatterns is yet available.
The term inoculant therefore at this stage is an "umbrella" term covering products which vary in bacterial types, numbers, viability, shelf-life, activity etc. Failure of crops to ensilesatisfactorily is often the result of a low WSC content (O' Kiely, Flynn and Wilson, 1986; O' Kiely and Flynn, 1987). Inoculants are claimed to contain bacteria selected to convert sugars efficiently to fermentation acids. It therefore seems logical to look at the effects of inoculants in situations where the WSC level was insufficient (untreated silage preserved badly) or adequate (untreated silage preserved well).
- 31 -
1.8.2.1 Insufficient WSC
In two separate series of experiments, (O’Kiely and Flynn, 1987; Haigh, Appleton, and Clench, 1987) the efficacy of a commercial inoculant as a preservative was compared with that of an acid treatment (formic acid or formic acid ± formalin) and an untreated control. The grass crop used in the experiments was of an insufficient WSC content resulting in an unsatisfactory fermentation when the grass was ensiled without an effective aid to preservation. In each case silage made using formic acid was either well preserved or considerably better preserved than the untreated silage. In both cases adding an inoculant produced silage which had undesirable chemical characteristics of preservation and was no better than untreated silage. In the experiments where these silages were fed to cattle, silage intake and animal performance clearly reflected the differences in preservation (O’Kiely and Flynn, 1987; Haigh, Appleton and Clench, 1987).
Done (1986), having reviewed experimental work on silage inoculants, concluded that with grass ensiled on a farm scale at low DM and low WSC, all untreated control silages were poorly preserved. Furthermore the inoculant treated silage showed no improvement in preservation over the control except in one trial (where the effect was slight). This was not reflected by a significant improvement in animal performance. Seale(1986) in his review of bacterial inoculants as silage preservatives concluded that if sugar (fermentable substrate) is a limiting factor then the lactic acid bacteria in an inoculant will not be able to produce sufficient lactic acid to lower the pH to a safe level. The implication of this, Seale stated, is that inoculants may be of little use for crops low in sugar. It is for this reason that interest exists in combining added sugar or fibrolytic enzymes (to release sugar) with bacterial inoculants.
- 32 -

Merry and Braithwaite (1987) investigated theaddition of plant cell wall-degrading enzymes and sugars with a homofermentative LAB inoculant on thefermentation of low WSC crops. It was found that the use of an inoculant plus supplementary energy added either directly as glucose or indirectly in the form of enzymes resulted in higher lactic acid content and a lower pH than in the untreated control or inoculated (no sugar added) silages. In addition, lower concentrations of ammonia, acetate and ethanol were detected in treated silages. Henderson, McGinn and Kerr (1987) also foundbeneficial effects of enzyme addition. They discoveredthat ensiling a lucerne crop of low WSC content with a cellulase enzyme preparation and LAB inoculant brought about a rapid fall in pH and increase in lactic acid content of the silage.
1.8.2.2 Adequate WSC
Results of test tube and small laboratory silos with temperate grasses (Perennial ryegrass and Timothy) have shown some inoculants to produce a more rapid drop in pH and to produce silages with more residual WSC and lower ammonia -N contents (Lindgren et al, 1983; Seale and Henderson, 1984). Heron et al (1988) ensiled choppedgrass of adequate WSC content in laboratory silos and demonstrated an effect of inoculation on fermentation. Inoculation of the grass at the level of 10" organisms/g forage stimulated a rapid fermentation and reduced proteolysis and amino acid degradation.
There are fewer results on the use of inoculants in farm scale silos. Where untreated silages preserved well (underwent a satisfactory fermentation) Stewart and Kennedy (1984) found that either of three inoculants or formic acid failed to improve silage preservation or performance by beef cattle. Chamberlain, Thomas and Robertson (1987) carried out similar experiments using dairy cows. No effect of inoculant treatment was noted on intake or milk production compared to the untreated
- 33 -

silage. On the other hand Gordon (1987) has shown one inoculant product (Ecosyl) capable of improving silage intake and milk yield compared to well preserved untreated or formic acid treated silage. Murphy (1988) in a similar type comparison (also using Ecosyl) obtained 6% higher milk yields with inoculant silage compared to acid treated silage. However yields of milk fat or milk protein were not different.
Satter, Woodford, Jones and Muck (1987) summarised eight lactation experiments carried out at the USDADairy Forage Research Centre in Wisconsin in which theeffects of inoculation were determined. They concluded that whereas inoculant treatments improved silage fermentation characteristics these usually did notresult in measurable improvements in DM intake or milk production. However they noted that, where inoculation added at least 10 times more lactic acid bacteria thanthe numbers of epiphytic lactic acid bacteria present and applied the inoculants in liquid suspension for better dispersion, milk production and feed intake was increased on average by 2.9 and 3.1% respectively.
In a recent experiment at Grange where good ensiling conditions prevailed (untreated silage well preserved) higher final liveweights were obtained where Charolais cross weanling heifers were offered silage made using an inoculant (Ecosyl) or formic acid compared to untreated silage. Hooper et al (1989) obtained improved intake and performance by yearling heifers fed inoculant (Pioneer Hi-bred brand 1177) treated silage compared to well preserved untreated silage.
It therefore seems that, under good ensiling conditions, some inoculant products are capable of "Making a good silage better", but that probably not all inoculants are capable of doing so. Similarly those that can give an improvement do not do so consistently. There is a need to define the circumstances under which an inoculant could "make a good silage better".
- 34 -

Objectives of research programme
The microbiology of silage has received much less investigation than its chemistry. Indeed several texts exist describing the techniques involved in chemical analyses alone (Parker, 1978, A.O.A.C., 1980; Byrne,1979). Similar texts describing microbiological analysis of silage do not exist although Seale et al (1986b) may provide this information when it is published. In addition very many different techniques are used by researchers and reported in the literature, indicating a lack of agreement of the approaches used. Consequently it was decided to study three components of the methodology for counting LAB : (a) optimumhomogenisation time when using a stomacher for the recovery of LAB from silage, (b) comparison of MRS and Rogosa agar for the growth of LAB and (c) a comparison of micro-aerophi11ic and anaerobic incubation of pour plates for the recovery of LAB.
Although other researchers (Henderson et al, 1972; Muck and O ’Connor, 1985; Fenton, 1987) have found low numbers of LAB on fresh herbage, the known climatic differences between Ireland and most other countries, together with the frequent lack of response in silage fermentation to added inoculants (O’ Kiely and Flynn, 1987) suggested that the indigenous levels of LAB might be higher in Ireland. A survey was therefore undertaken throughout the silage making season to monitor LAB numbers and types on grass pre and post harvesting. To improve the information on LAB numbers on grass the distribution of LAB on different plant species and plant parts was also investigated. An enumeration of LAB on farm machinery was also carried out to establish if the machinery gave rise to substantial inoculation of the grass as had been found elsewhere (Kroulik et a l . 1955a; Henderson, et al, 1972; Fenton, 1987). In
- 35 -

addition, the increase in LAB numbers in farm silos was monitored to compare the increase with that found in test tube silos.
Most grass in Ireland is ensiled without field wilting (Wheeler, Wilson and Flynn, 1983) and is frequently of a low WSC content (O’ Kiely, Flynn and Wilson, 1986) . The latter is often a limitation tosatisfactory fermentation. An experiment was carried out to study the effect on silage fermentation of adding an inoculum of L. piantarum to grass of limitedfermentable substrate supply. It was considered important to study this effect alone or when additional sugar was supplied. These effects were compared with astandard acid additive treatment. Small scale siloswere used to permit adequate replication and numerous sampling dates.
Microbial inocula used in Ireland do not usuallycomprise organisms isolated in Ireland. It was ofinterest therefore to investigate the performance of a lactic acid bacterium isolated under Irish conditions. There was one particular silage at Grange which was found to have unusual properties (Table 39). The pH was unusually low, 3.6 instead of the more usual 3.9. Thelevels of lactic acid were in excess of 50* higher thanusual and the levels of LAB were considerably lower (103 org./g) than would be expected (107 org./g). It was felt therefore that any lactic acid bacterium isolated fromsuch an environment and surviving such conditions wouldcompete well in a heterogeneous system. The dominant LAB isolated from the environment was found to be L.buchneri. a heterofermenter. It was decided to comparethe effect of this heterofermentative LAB with ahomofermentative strain (L. piantarum) on the fermentation pattern of grass which had an adequate fermentable substrate content.
- 36 -

2 MATERIALS AND METHODS
2.1 Experimental Systems
2.1.1 Grass
2.1.1.1 Sampling of grass pre and post harvesting.
Grass samples were collected on 19 occasions from pastures at Grange Research Centre from May toSeptember 1988. The grasses chosen represented arandom selection of pasture types, growth stages, etc. Samples of the standing crop were taken aseptically using sterile scissors, gloves etc (sterilised by swabbing with industrial alcohol) at a height of 5 cm (approx) from the ground and put in a steriledisposable bag. Immediately after sampling the standing crop, the designated plot was mown (rotary mower-Kidd Clipper 240) and harvested (precision chop-Kidd Crop Chop TL) (Kidd Farm Machinery, Knockmitten, Killeen Road, Dublin 12). The silage additive (acid) applicator on the harvester wasswitched off when grass for sampling was being harvested. Samples of the harvested crop were taken aseptically as the grass was thrown from the harvester chute. The interval between the pre mowing and post harvesting sampling was approximately 10 minutes. Samples of the standing and harvested grasses were stored and transported in an insulated ice box. The interval between sampling and arrival in the laboratory was always less than 40 minutes.
- 37 -

2.1.1.2 Grass shading
A procedure was developed whereby the WSC content of the grass could be reduced. Low sugar grass was obtained by shading a plot of perennial ryegrass(Loli um perenne) for 64 hours prior to cutting(Lindgren, Bromander and Pattersson, 1988; O ’ Kiely and Wilson, 1989). Grass was shaded using a frame covered with black 0.125 mm polythene sheeting (IS 264P 1980). This screen, which was erected approximately 1 m above the ground, blocked sunlight passing through to thegrass thereby restricting photosynthesis in the grass plant. After 48 hours the screen was removed and the plot of grass was cut (rotary mower) and harvested(precision-chop harvester) immediately.
2.1.1.3 Plant type
Six separate species of grass and one genus of clover were sampled on the same day during September of 1988. Plants sampled comprised:
1. Italian Ryegrass C Lolium multi florum - cv.Lemtal).
2. Perennial Ryegrass (Lolium perenne - cv. Talbot).3. Cocksfoot (Dactyl is glomerata).4. Yorkshire fog (Holcus 1anatus).5. Red fescue (Festuca rubra).6 . Agrostis s d p .
7. Clover (Trifolium repens).
The plants were cut at ground level and stored and transported to the laboratory in an insulated ice box. The sampling procedure took 60 minutes (approx) to complete.
- 38 -

2.1.1.4 Plant parts
Samples were obtained of the following parts of Perennial Ryegrass (Lolium perenne - cv. Talbot).
1. Inflorescence2. 1 Stem upper3. 1 Stem lower4. Leaf5. Dead material6. Whole plant
1 including leaf sheath
The individual plant parts were aseptically removed from the plants on four occasions during 1988 and were placed into sterile plastic disposable bags at the point of sampling. Aseptic precautions as previously described were used to prevent cross contamination of plant parts. Throughout the sampling procedure all samples were stored in insulated ice boxes to restrict bacterial growth. The sampling procedure took approximately 90 minutes to complete on each sampling occasion.
2.1.2 Silage Sampling and Silo Design
2.1.2.1 Test tube silos
Pyrex test tube silos (33 mm diameter 200 mm length) of 100 ml capacity were used (see figure 1). Ninety grammes of treated grass was packed into each of thesesilos and sealed with plastic fermentation locks. Thefermentation locks were filled with water which allowed silage gases to escape, but prevented the ingress of air. The silos were then stored in an insulated polystyrene box at room temperature (10-20°C).
- 39 -

F igure 1. Py r e x t e s t t u b e s i l o (100m l c a p a c i t y )

For sampling, each silo was opened on the appropriate opening date and the silage removed using previously sterilised tweezers. The silage was then mixed and representative samples taken for LAB enumeration, as well as physical and chemical analyses. Aseptic precautions were maintained throughout the entire filling and sampling procedure.
2.1.2.2 Plastic pipe silos
The silos used were of 13 litre capacity (see figure 2). These silos have been previously described by O ’ Kiely, (1988). Six kilograms of treated grass was packed into the silos, after which they were sealed and fermentation locks fitted. Effluent production from each silo was quantified by measuring and weighing the volume produced. Each silo was opened on the appropriate opening date and the contents removed by hand using aseptic precautions. The sampling procedure used was as outlined previously (test tube silos - 2 . 1 . 2 . 1 ) .
2.1.2.3 Farm scale silos
Farm scale silos sampled ranged in size from 85 tonne clamps to 300 tonne silos. Silage samples required for all methodology experiments were obtained from pits which had been opened and from which silage was being used in animal feeding experiments. The samples were collected by first removing and discarding 30 cm (approx) of silage from the "face" of the silo. The sample was then taken from the Inner portion of the pit which had not been previously exposed. Aseptic precautions were maintained throughout the sampling process.
- 41 -
FIGURE 2. Diagram of small scale plasLic silos and method ol assembly
GAS VALVE
TOP (screw on)
STEEL WEIGHT (1 0 .5 kg)
PERFORATED PLATE (on top o f s i la g e )
0 . 7 5 m
BOTTOM (screw on)
EFFLUENT TAP (g luéd to base)
- 42 -

In order to sample silage from farm scale silos in the early stages of ensiling, it was necessary to use a silage core sampler (figure 3). Samples were obtained by cutting openings in the polythene cover, discarding the first 15 cm of silage and plunging the corer into the pit. The corer was then removed and the samples collected in sterile bags. The openings were then sealed using high strength adhesive tape. The corer was swabbed using industrial alcohol between samples.
2.1.3 Additives
2.1.3.1 Source
- Lactobaci1lus plantarum (Ecosyl - Imperial Chemical Industries Ltd., Billingham, Cleveland, U.K.) was supplied by Irish Fertiliser Industries, 60 Northumberland Road, Dublin 4.
- Lactobaci11 us buchneri was isolated from silage at Grange (see 2.1.3.2).
Formic acid (850 g/kg) was supplied by Amasil -B.A.S.F. Ireland Ltd., Enterprise House, Frascati Road, Blackrock, Co. Dublin.
Sucrose - Suicre Eireann c.p.t., St. Stephen’s Green House, Dublin 2.
2.1.3.2 Isolation and cultivation of inoculant (L. buchneri).
A limited number of silages were found with pH values of 3.3 to 3.6 in farm practice. An assessment of these silages indicated that counts of LAB were lower than 1n conventional well preserved silages (103 vs 10 7 CFU/g silage). Three plates each containing between 30 and 50 colonies were taken from one low pH
- 43 -

F igure 3, S ila ge c o r e s a m p l e r
44

silage. Ten colonies were taken from each plate. The 30 isolates were purified by streaking 3 times on MRS agar. Each isolate was then tested for catalasereaction. Of the 30 isolates 17 were catalase negative. These 17 isolates were then further characterised and found to be Gram positive non motile rods. Nine isolates were then selected at random and screened for fermentation characteristics using the API 50CHL system. Results from these tests showed the isolates had similar profiles. One such culture was then chosen (see attached API profile - Appendix C16) and inoculated into MRS broth where some growth studieswere carried out at 30°C. It was identified (see section 2.4) as JL. buchneri. For the purpose of using this isolate as an inoculant, a 100 ml flask of MRSbroth was inoculated with the isolate taken from MRSagar (the isolate had been streaked out 72 hours beforehand). The flask was incubated at 30°C in an incubator shaker set at 100 revs per minute for 16.5 hours. The broth culture was then applied undiluted to the grass within 2 hours of its removal from Incubation. The culture was applied at 7.7 x 10⁸/g fresh matter which was higher than anticipated. A target of 1 x 10⁶ organisms/g of fresh matter was the desired application rate.
2.1.3.3 Methods of additive treatment
Three types of silo were used in examining the effect of additives on the silage fermentation. The methods of additive treatment for each silo type is described below :
Test tube silos : The grass used for the test tubesilo experiments was taken from a plot of Italian ryegrass (L. multiflorum). The grass was cut (rotary mower), harvested (precision-chop) and transported to the silo packing area. Representative quantities (6
- 45 -

kg) of grass were spread out in three piles on black polythene sheeting which had previously been swabbed with industrial alcohol. Each additive was applied evenly by hand using a sterile syringe taking care to mix the grass and additive thoroughly. Ninety quantities of grass were then weighed and packed into 100 ml pyrex test tubes (section 2.1.2.1). The tubes were then sealed and fitted with fermentation locks and stored in an insulated (polystyrene) container at room temperature (range 10-20°C).
Pipe silos : Grass of a low WSC content obtainedthrough shading (see section 2.1.1.2) was transported to the silo packing area, spread thickly on a polythene sheet and representative samples (7 kg) were packed into polythene bags. Ninety bags were filled in sequence taking care to collect grass from all parts of the surface of the spread out herbage. Bags of grass were allocated to the additive treatments 1 to 6 and this pattern of allocation was repeated 15 times. The fifteen groups of six were allocated at random among the replications and silo opening times. Each bag was emptied, mixed, and treated with the appropriate additive (or no additive) using aseptic precautions. Grass was spread out in a thin layer and half the required amount of additive added. Grass was again hand mixed and the remainder of the additive applied after which the grass (7 kg) was packed into polythene bags. These bags had their tops folded over and were then stored at ambient temperature in a semi-insulated area overnight. This was to simulate the delay in filling a farm silo. After approximately 20 hours, each bag of grass was emptied, hand mixed and 6 kg packed into 13 litre plastic pipe silos as previously described (section 2.1.2.2). The silos were then sealed and fitted with fermentation locks.
- 46 -

Farm scale silos : Samples of the standing crop(Italian ryegrass - Lolium multiflorum) were taken for enumeration of LAB as previously described (section 2.2). The grass was mown with a rotary mower and picked up immediately by a precision-chop harvester. Each treatment was applied to the grass by the harvester andthe silo was sealed within 30 hours of commencingharvesting. Samples from the each silage clamp were taken at three different locations after 0, 24 and 48 hours ensilage using a silage core sampler. The silage corer was swabbed with industrial alcohol before each sample was taken. The clamp samples for each treatment were composited and two duplicate samples withdrawn for LAB enumeration.
2.2 Enumeration of LAB.
2.2.1 Grass and silage sample preparation.
In the laboratory grass samples were aseptically chopped into lengths of 3 cm (approx) using a scissors. They were then mixed thoroughly and duplicate 20 g subsamples removed for LAB enumeration. Silage samples were also mixed and 20 g subsamples removed. Nofurther chopping was necessary with silage as the silage used had always been chopped into short lengths when harvested. Both grass and silage samples were then stored at 4°C until LAB enumeration was undertaken which normally took place within one hour ofsubsampling. The remainder of the grass and silage was retained for chemical analyses and stored in a freezer at -18°C. Cross contamination of samples was prevented by swabbing the cutting utensils, gloves, and bench area with industrial alcohol between samples.
- 47 -

2.2.2 Surface swabbing of farm equipment.
Swabs were taken from the mower blades, and harvester tines, auger, rollers, blades, and chute. The harvester concerned was a precision-chop harvester (K1dd Crop Chop TL) while the mower was a rotary twln-drum mower (Kidd Clipper 240). On three separate occasions a designated area (either 5 or 10 cm2) of each of the above machine parts was swabbed with a sterile cotton bandage swab moistened by placing in 100 ml of quarter strength Ringers diluent. The swab was then thoroughly rinsed with the same diluent and serial dilutions prepared from the suspension (Collins and Lyne, 1985). Swabs were taken on the machinery before use (i.e. start of season - new machinery) and twice during the season when machinery had been in use.
2.2.3 Plate count methods.
Representative samples of grass or silage (20 g) were placed in a sterile plastic Stomacher bag (Seward Medical 7" x 12") with 180 ml of sterile quarter-strength Ringer solution (Oxoid BR 52 or LAB M 100Z). The bag and sample were placed in a Stomacher (Stomacher Lab Blender 400 - Seward Medical UAC Hse,Blackfriars Rd., London SEI9UG) and homogenised for 5 minutes (unless stated otherwise). Serial dilutions were then prepared using 1 ml of the homogenised suspension in 9 ml of quarter strength Ringers solution (Harrigan and McCance, 1984). The pour plate method was used for all LAB enumeration. 1 ml aliquots of suspension were aseptically transferred to sterile Petri dishes to which approximately 15 ml of agar was then mixed with the suspension. Finally, when set, the solidified agar was overlayed with another layer of medium. The spread plate technique was used for culture isolation. Previously autoclaved MRS agar (Oxoid CM 361) or Rogosa agar (Oxoid CM 627) was used to culture the LAB. A suspension of sterile Mycostatin (Nystatin
- 48 -

Squibb and Sons, Middlesex, England) was prepared using sterile distilled water and added to the cooled agar at a concentration of 100 units/ml agar. This antibiotic was used as a yeast and fungal inhibitor.
The agar was maintained in a molten state at 45 to50°C 1n a water bath (Grant instruments model SE 15).In all experiments (unless stated otherwise) the plates were then overlayed with 50 to 60 ml of the same agar. Where anaerobic incubation was required the plates were incubated 1n anaerobic jars (Oxoid HP 11; Don Whitley Scientific 48 plate; Baird and Tatlock 402/0053) containing a low temperature catalyst (Oxoid BR 42) anaerobic CO 2 /H 2 generator kit (Oxoid BR 38) and an anaerobic indicator (Oxoid BR 55). Duplicate plates were prepared for each dilution and then Incubated at 30°C for 5 days. After incubation the number of colony forming units (C.F.U.) were recorded using a colony counter (Gallenkamp, Loughborough, England). Where possible, counts were only recorded from platescontaining between 30 and 300 colonies (Meynell, C. G.& Meynell, E. 1970). The average count of theduplicates was obtained and corrected for dilutionfactors. Counts were then expressed as C.F.U./g freshsilage or grass (or logio CFU/g fresh silage or grass).
2.3 Physical and Chemical Analyses.
2.3.1 Sample preparation : Grass and silage sampleswere stored at -18°C if analyses could not be carried out immediately. Where assays were carried out on dry material, the sampleswere dried at 40°C for 48 hours in an oven with forced air circulation. They were then passed through a mill (Christy and Norris, Retschmuckle or Tecator-cydotec 1093) fitted with a 1 mm screen. Assays on juice were carried out on the liquid fraction which was extracted from grass after freezing and
- 49 -

chopping (bowl chopper) or from silage using a hand operated press.
2.3.2 Drv matter (DM) : Dry matter content wasdetermined as the difference between fresh weight and moisture content by measuring weight loss when grass or silage was dried in an oven with forced air circulation. Grasses were dried at 98°C for 15 hours and silages at 40°C for 48 hours.
2.3.3 Total ash : This was carried out on driedground samples. The method used was a modification of the method by Isaac and Jones (1972). Organic matter was oxidised at 500°C for 5 hours rather than 4 hours.
2.3.4 fiH : pH was measured in expressed grass or silage juice with a combined glass/calomelelectrode in a Kaif model (7076) digital pHmeter. The instrument was calibrated using a standard buffer, pH 4.0 (+0.02 at 20°C - BDH chemicals).
2.3.5 Lactic acid : Lactic acid was assayed in the liquid fraction and was determined using the thin layer chromatographic method as described by Wi1 son ( 1970).
2.3.6 Volatile fatty acids (VFA) and ethanol : VFA and ethanol were assayed and expressed 1n the liquid fraction. VFA (Acetic, Propionic and N-Butyric acids) and Ethanol were measured in a Perkin-Elmer (F17) Dual flame Gas Chromatograph fitted with a flame Ionization detector. Nitrogen was used as a carrier. A column of Chromosorb WAW 80/100 mesh with 20%
Tween 80 was used.
- 50 -

2.3.7 NHa : The analysis was carried out on a"fresh" silage sample using the method of 0 ’ Keeffe and Sherrington (1983). NH 3-N wasexpressed as a proportion of Total Nitrogen (TN).
2.3.8 Total water soluble carbohydrate (WSC) : WSCwas estimated according to the method ofWilson (1978) on the liquid phase of a grassor silage sample.
2.3.9 Crude protein (CP) : CP was measured oneither dried ground samples or "wet" samples by Kjeldahl digestion and colorimetric assay of nitrogen with automated equipment (Tecator Digestion System 20 1015 dlgestor and aTecator Kjeltec auto 1030 analyzer). Crude protein was taken as Nitrogen x 6.25.
2.3.10 In vitro dry matter digestibility (DMD) :In vitro DMD was estimated on the dried ground samples by the method of Tilley and Terry (1963) using an MSE centrifuge model GF-B and New Brunswick Scientific Co. Inc.Model G25 incubator shaker. The final residue was isolated by filtration (Alexanderand McGowan (1961) rather than bycentrifugation (Filtering - Speed Vac high Vacuum pump Model ES 50 Edwards high Vacuum).
2.3.11 Refractometer Readings : These readings were taken using a refractometer (Deelingham and Stanley Ltd. England) to measure the levels of soluble solids 1n the silage effluent (Goldberg, 1965).
- 51 -

2.4 Bacterial Identification Procedures.
All cultures were isolated on MRS agar as previously described. Cultures were purified by streaking three times on MRS agar and incubating at 30°C. Broth cultures were prepared using MRS broth (Oxoid CM 359). Characterisation on 18 to 24 hour cultures was performed using the following tests.
- Colony morphology- Motility- Catalase test
All three tests were as described by Harrigan and McCance (1984)
- Gram reactionThe Gram reaction was noted using Huckers modification of the method of Gram as cited by Conn, Bartholemew and Jennison (1954). The arrangement of the cells was also noted.
- Homofermentatlve/Heterofermentative tests The gas chromatography procedure followed was as outlined by Thornhill and Cogan (1984). The hot-loop test as described by Sperber and Swan (1976) was also used.
- Additional tests were performed on some cultures using the API 50 CHL system (API System SA Montalieu - Vercieu, France).
- 52 -

- Mobility of Lactate dehydrogenase (LDH enzymes.
The procedure used, was a modification of the method outlined by Hensel et aj_ ( 1977). Three cultures, L. buchnerl (NCIB 8007), L. brevis (NCIB 1 1973) and a silage isolate (see section 2.1.3.2) were grown in MRS broth at 37°C. At the beginning of the stationary phase the organisms were cooled down to 5°C by the addition of ice and harvested by centrifugation (Sorvall RC 5 B) at 7000 rpm for 10 minutes. The cells were washed twice with 0.05M Imidazole buffer pH 6.5 and frozen 1n liquid nitrogen. The cultures were then stored at -20°C overnight. The pellets were then resuspended in 10 ml of a 0.1M acetate buffer pH 5.5 to which 0.2 mg of DNase had been added. The samples were then placed in heat sealed bags and frozen in ethanol at -30°C. The cells were then disrupted by three passages through an X-press (Type X25 AB B10X Jarfalla Sweden ). The cell debris was removed by centrifugation at 19500 RPM for 40 minutes. The supernatant was then collected and stored on ice. Samples of the supernatant were then spotted on an agarose Universal electrophoresis gel using a Ciba Corning electrophoresis kit (Corning Medical, Essex, C09 2DX England). The gel was allowed to "run" for 35 minutes, after which it was stained and incubated for 20 minutes. The pattern and mobility of the LDH enzymes could then be examined. All buffers and reagents are described in the Corning kit product 1iterature.
- 53 -

2.5 Botanical Analyses : Samples of mown grasswere collected and hand sorted into species using the identification system of Farragher (1972). Each species was dried in an oven with forced air circulation 9 98°C for 15 hours. Botanical composition was expressed as the proportion of total mown herbage DM contributed by each species.
2.6 Statistical Methods :The statistical methods used were presentedindividually for each experiment. Analysis of variance and correlation equations used were as described by Snedecor and Cochran (1962). The significance of differences between treatments was determined using least significant differences.
The data relating to all individual samples and on which the statistical analyses described below are based, are presented in Appendix Tables B1 - C15.
2.6.1 Plate count technique
2.6.1.1 Homogenisation of sampleData were analysed as a randomised blockdesign with the variance for the 4 treatments(times 1 to 7 minutes) and 5 replicationsbeing accounted for.
2.6.1.2 Sample Incubation conditions and type of media
Experiment A and B : Data were analysed forboth experiments as a 2 media and 2 incubation conditions factorial randomised block design (1e. 6 replicates pertreatment). Since there was no interaction
- 54 -

between media and incubation conditions, only the main effects of media and incubation conditions are presented. Combining data for experiment A and B, the two media (MRS and Rogosa) were analysed using one way variance analyses (completely randomised design) with 2 media by 12 replications.
Experiment C and D : Data were analysed as a randomised block design with 4 treatments (incubation conditions) by 5 replications.
2.6.2 LAB enumeration
(i) Survey of LAB on the standing andharvested cropsData for LAB counts, DM, WSC and meteorological conditions were correlated using simple linear correlation equations (Snedecor and Cochran, 1962).
(i i) Enumeration of LAB on 6 different grass genera and one clover genusData were analysed as a randomised block design with 7 treatments (plant types) and 3 replIcations.
(iii) Enumeration of LAB on 6 different plant parts Data were analysed as a randomised block design with 6 treatments (plant parts) and 4 replications.
- 55 -

2.6.3 Effect on the silage fermentation of adding abacterial inoculant under varying levels of sucrose addition.Data were analysed using two factor variance analyses with 6 additive treatments by 3 (opening times) and 5 replications. Since it was not a randomised block design, variancedue to replication could not be accountedfor. In vitro DMD data at day 45 wereanalysed using one way analyses of variance (ie. completely randomised design) with 6 additive treatments by 5 replications.
2.6.4 Effect on silage fermentation of addingbacterial inocula from two sources.Data were analysed by two factor varianceanalyses with 3 additive treatments by 8(opening times) and 4 replications. Since it was not a randomised block design, variancedue to replication could not be accountedfor. In vitro DMD data at day 100 wasanalysed by one-way variance analyses with 3 additive treatments and 4 replications.
2.7 Meteorological DataMeteorological data were recorded at aweather station located at Grange Research Centre. Sampling of grass was always carried out within two km of the station. Data were recorded for minimum and maximum temperature, precipitation (rain gauge), relative humidity(using wet and dry bulb thermometer readingsin Stevensons screen), and hours of sunshine (Campbell Stokes pattern sunshine recorder).
- 56 -

3 RESULTS
3.1 Plate Count Technique
3.1.1 Homogenisation of sample
These experiments studied the effect ofhomogenisation time with a stomacher on the LAB count. Silage was sampled from farm scale silos on five separate occasions. Each sample was mixed and divided in four. These four samples were processed in a stomacher for 1 , 3 , 5 and 7 minutes respectively.Counts of LAB were determined using Rogosa agar. The results showed (Table 10) no significant difference in numbers of LAB recovered following the various times of processing In the stomacher. It was decided to adopt a five minute stomaching time for subsequent experiments.
TABLE 10. Counts of LAB (Logio CFU/g silage) atdifferent stomacher processing times.
Time (minutes)S11 age Sample
1 3 5 7
1 5.27 5.66 5.85 6.032 5.56 5.57 5.63 5.613 6. 77 6.43 6.64 6.354 5.57 5.80 5. 76 5.815 6.64 6.50 6.53 6.42
Mean 5.96 5.99 6 .08 6.04SD 0.62 0.42 0.42 0.31SEMSig.
0.09NS
Error df = 12
- 57 -

3.1.2 Sample incubation conditions and type of media
The incubation of agar plates for the determination of LAB in silage was investigated under microaerophilic and anaerobic conditions using both MRS and Rogosa agar. The temperature of incubation in all cases was 30°C.
Silage was sampled on six occasions from a farm scale silo. On each occasion duplicate pour plates of both MRS and Rogosa agar were incubated anaerobically or microaerophilically (5-10 ml agar or 50-60 ml agar). A significant difference (P<0.001) in the numbers of LAB recovered was obtained when the plates were incubated anaerobically or with an overlay of 5 to 10 ml agar (Table 11). Counts were higher with anaerobic incubation. No interaction between incubation conditions and type of media occurred.
TABLE 11. A comparison of micro-aerophilic incubation (overlay 5-10 ml agar) and anaerobic incubation on LAB numbers cultivated on both MRS and Rogosa agar (counts LoglO CFU/cf silage) (Experiment A). .Silacre Aerar Overlay (5 to 10 ml) Anaerobic1 MRS 5. 54 6.85
2 5.50 6.743 5.77 6.75
4 5.47 6.645 5.77 6.79
6 5.69 6.731 Rogosa 5. 58 6 . 822 5.72 6.853 5.75 6.794 5.61 7.035 5.82 6.986 5.80 7.03Mean 5.67 6.83SEM 0.028Sicr ***
Error df = 15
- 58 -

When the silage was sampled on a further six occasions, again a statistically significant (P<0.001), but quite small, difference was obtainedwhen the plates were incubated anaerobically and with an overlay of 50-60 mis agar (Table 12 Experiment B). Again counts were higher with anaerobic incubation. No interaction between incubation conditions and type of medium occurred.
TABLE 12. A comparison of micro-aerophi1ic incubation (overlay 50-60 ml) and anaerobic incubation on LAB numbers cultivated on MRS and Rogosa agar (counts Logio CFU/g silage) (Experiment B).
Sample Aaar Overlay (50 to 60 ml) Anaerobi c1 MRS 7.00 7 .002 6.70 6.803 6.95 6.984 7.40 7.455 7.40 7.40
6 7.40 7.451 Rogosa 6.98 6.982 6.60 6. 803 6.91 7.044 7 .36 7.425 7.30 7 .406 7.43 7.45
Mean 7.119 7 . 181SEM 0.011Sig ***
Error df = 15
- 59 -

Using data from experiment A and B (Tables 11 and 12) a comparison of the two media MRS and Rogosa agar showed no significant difference in recovery of LAB from silage (Table 13).
MRS was used for all subsequent experiments.
TABLE 13. A comparison of MRS and Rogosa agar for the recovery of LAB from silage (Logio CFU/g silage).
MRS Rogosa
Mean 6.674 6.727
SEM 0.13
Sig NS
Error df = 46
Samples of grass from pastures and silage from farm scale silos were taken on five separate occasions. The numbers of LAB were determined using MRS agar incubated under four separate conditions -
aerobically without overlay 5-10 ml overlay 50-60 ml overlay anaerobically
Again in this experiment using silage the counts of LAB were significantly higher (P<0.001) using anaerobic conditions of incubation (Table 14 Experiment C).
In the case of grass, there was no significant difference 1n the counts of LAB under the various conditions of incubation (Table 15 Experiment D)
- 60 -

TABLE 14. Counts of LAB on si 1 âge (Logio CFU/g si 1 âge)under four incubation conditions (Experiment C)._______Si 1 age Sample
Anaerobi c No Overlay Overlay(5 to 10 m l )
Overlay(50 to 60 m l )
1 7.41 6.42 6.23 6.482 7.40 6.30 6.42 6.533 7 .49 6.36 6.44 6 . 354 7.44 6.57 6.52 6.505 7.45 6.31 6.40 6.30
Mean 7.44b 6.39* 6.41* 6.44*
SD 0.03 0.10 0.10 0.09SEMSiq.
.039***
Error df = 12
TABLE 15. Counts of LAB on grass (Logio under four incubation conditions
CFU/g grass) (Experiment D)
Grass Anaerobic No Over 1 ay Over1 ay OverlaySample (5 to 10 m l ) (50 to 60 m l )
1 5.73 5.66 6.32 5.452 5.96 6.03 6.49 5. 733 5.89 5.86 5.80 5.454 5.80 5.97 6.20 5.625 5.71 5.62 5.76 6.75
Mean 5.82 5.83 6.11 5.80
SD 0.09 0.16 0.29 0,49SEMSifl.
0.16NS
Error df = 12
- 61 -

3.2.1.1 A Survey of LAB Numbers on the Standing and Harvested Crops May - September. 1988.
Grass grown for silage was sampled 19 times during a 20 week period between May and September. The grass was sampled randomly from a variety of pastures. The variables monitored included the LAB count on the standing and harvested crop, the WSC, the DM content of the grass and meteorological data both on the day of sampling and on the day prior to sampling (Table 16). DM and WSC data were collected for 15 of the 19 sampling occasions, hence the 15 samples in Table 16. The mean LAB count (n = 19) was found to beconsistently high ranging from 104 to 107 CFU /g grass. Harvesting the grass was not seen to have an effect in increasing LAB numbers (Figure 4).
A statistical analysis of the data showed a significant (P<0.05) positive correlation between LAB numbers on the standing and harvested crops (Table 17). However no significant correlations could be found between levels of LAB on the grass and the other variables - WSC, DM and meteorological data.
3.2 LAB Enumeration
- 62 -

TABLE 16. A survey of LAB counts, WSC, DM concent of grass and meteorological data between May and September
WEEK OF SAMPLING
■Mean LAB Count 2 WSC JDM RH
PAY OF SAMPLINGMfcTERSOLOGICAL DATA
Temp__luCj. Max Min
*Ppt •Sun
StandingCrop
HarvestedCrop
2 9/Kg liquid phase3 9/Kg4 * Relative humidity* Precipitation (mm)* Sunshine hours
■ PAY-PREY1QUS. T.Q .SAMPLING
X RH T9ID0-Lo-Ç.l Max Min
Ppt
Week 1 6.12 5.61 31 .0 153 67 19.6 7.80 0 13.0 70 17.9 9.5 01 5.67 6.24 27.3 1tì2 72 1 3. 2 2.20 0 6.9 71 1 1.4 2.4 2.62 4.83 6.10 31 .7 191 70 13.6 4.90 4.8 5.6 76 15.3 9.8 7.42 4.95 4.60 25.5 135 64 14.7 3.40 0.9 5.9 66 14.5 4.0 0.93 6.18 5.75 22.9 142 81 15.9 a. 10 0 3. 1 77 15.2 9.3 1.24 5.58 5.70 22.0 200 68 16.0 1 1 .20 0 11.2 67 18.4 8.0 010 5.90 5.80 24.1 193 94 18.3 10.50 0.2 1.2 56 18.6 8.5 0.310 4.96 5.62 19.2 171 91 17.5 13. 1Ü 9.1 0 94 18.3 10.5 0.211 6.38 6.05 20.1 124 69 17.0 9.40 1.9 4.1 73 18.1 10.5 1.811 6.25 5.73 23.3 203 76 16.3 7.60 3.3 2.8 94 14.2 9.5 3.812 6. 72 6.03 21.5 140 74 22.8 13.10 5.3 1.7 76 23.3 8.5 01 2 4.88 5.43 24.4 143 83 18.7 8.50 1 .9 2.6 74 22.8 13.1 5.315 6.81 6.55 6.6 1 16 33 15.2 13.70 6.2 2.3 73 16.0 10. 1 019 5.51 5.22 20.8 186 83 17.4 1 1 .90 3.6 3.7 83 16.0 11.5 0 . 119
1 1 n n • m
4.47 5.30 26.0 133 87 13.5 7.50 o.a 4.2 83 17.4 11.9 3.6

Log-
j o CF
U/g
gras
s
FIG 4
COUNTS OF LAB ON THE STANDING AND HARVESTED CROPSOVER THE SAMPLING PERIOD MAY - SEPTEMBER 1988
A STANDING CROP a HARVESTED CROP

TABLE 17. Correlations between counts of LAB (on the standing and harvested crops) and WSC, DM, and meteorological data.
STANDING CROP1 HARVESTED CROP1
STANDING CROP1 1 .00 -HARVESTED CROP1 0.584* 1 .0WSC2 -0.488 -0.339DM2 -0.195 0.019*RH2 -0.162 0.071°C max2 0.430 0.017°C min2 0.390 0.255Ppt2 0.061 0.264Sun2 -0.032 -0.111
*RH3 -0.105 -0.026°C max3 0.047 -0.026°C min3 -0.096 -0.020Ppt3 -0.486 0.061Sun3 0.281 -0.342
* Significant (P<0.05)1 Counts of LAB (Log 1 0 CFU/g grass)2 Data on day of sampling3 Data on day prior to sampling
3.2.1.2 Identification of Isolates
A random selection of 28 LAB isolates (from the standing crop) were taken from plates throughout the sampling period. On average, one plate was taken at random every 5 weeks during the survey. From these plates 7 isolates were isolated and purified by streaking 3 times on MRS agar. The isolates were then characterised using the identification procedures outlined in 2.4. Results from the identification showed :
- 65 -

18 of the isolates to be catalase negative, Gram positive rods which were non motile. These were classified as lactobaci11i.7 of the isolates were catalase negative, Gram positive cocci which were non motile and had a heterofermentative metabolism. As leuconostocs are the only heterofermentative LAB cocci it was concluded that these isolates were leuconostocs.2 of the isolates were catalase negative Gram positive cocci which were non motile and had a homofermentative metabolism. A study of the cell morphology indicated that the organisms were streptococci and not pediococci.
One of the isolates failed to remain viable and therefore was not classified. Overall, 15 of the isolates had a homofermentative metabolism (54* of isolates), 9 had a heterofermentative metabolism (32% of isolates) and 4 were unclassified.
3.2.2 The Enumeration of LAB on Six Grass genera and One Clover genus.
Table 18 shows the counts of LAB recovered from six grass genera and one clover genus. Three separate samples were taken of each genus during September of 1988.
Counts on all grass genera and on clover were high. The magnitude of the difference in counts between the different genera was not great, however significant differences were found.
Results showed that the Agrostis s p p had significantly higher counts of LAB (P<0.01) than all other grasses with the exception of Cocksfoot. It was also significantly higher than clover (P<0.001). Counts for clover were significantly lower (P<0.01) than all grass species. No significant differences were found between Italian ryegrass, perennial ryegrass, red
- 66 -

TABLE 18. Counts of LAB (Log 1 o CFU/g grass) on different plant types.
Italian Ryegrass
RedFescue
PerennialRyegrass
Agrostis Yorkshi re Fog
Cocksfoot Clover
7.10 6.95 7.27 7.44 6.59 7.43 5.826.95 6.98 7.06 7.52 6.25 7.52 5.937.64 7.00 7.06 7.72 6.50 7.36 6.43
Mean 7.23 6.97 7.13 7.56 6.45 7.44 6.06SD 0.30 0.02 0.10 0.12 0.15 0.07 0.26SEM 0.112Sig. ***
Error df = 12
fescue or Cocksfoot. Yorkshire fog was found to be significantly lower than all other grass genera (P<0.001).
3.2.3 The Enumeration of LAB on Different Plant Parts.
Table 19 shows counts of LAB recovered from different plant parts on four separate sampling occasions (Samples 1 to 4).
Highest counts of LAB were detected in the dead material at the base of the plants (P<0.05). Counts of LAB recorded on the leaf were significantly lower (P<0.05) than all other plant parts with the exception of the upper stem. Numbers on the inflorescence were also high compared to the upper stem or the leaf (PC0.01) but were not significantly different from the lower stem or the entire plant.
3.2.4 The Enumeration of LAB on Different Parts of the Cutting and Harvesting Equipment.
Counts of LAB were enumerated on the mower blades and on different parts of the forage harvester (Table 20) before the machines were used (pre use) and during the silage season (post use).
Counts of LAB on a new unused mower and on new harvester parts prior to their use (start of season) were found to be up to 104 CFU/cm2 . Counts performed during and after the machinery was in use for a number of months showed that numbers increased substantially, especially on the harvester chute and blades as well as on the mower blades.
- 68 -

TABLE 19. Counts of LAB (1ogio CFU/g grass) on different plant parts.
Sample Inflorescence 1Stem upper 1Stem lower Leaf Dead materi al
Enti re plant
1 5.54 5.72 6.88 4.63 7.40 5.872 6.84 4.91 6.74 4.52 7.60 6.263 6.78 4.18 6.02 3.98 7.34 6.274 7.34 6.51 6.70 6.05 7.22 7.15
Mean 6.63 5.33 6.58 4.79 7.39 6.39SD 0.66 0.87 0.33 0. 77 0.14 0.47SEM Si g .
0.283***
1 including leaf sheathError df = 15

TABLE 20. Counts of LAB on different parts of the mower and harvester (Log 1 0 CFU/cm2).
Machine Part LAB countPre use Post use S D 1
Mower Blades 4.08 5 .32 -Harvester tines 0 3.21 0.39Harvester auger 2.64 3. 72 0.17Harvester roller 3.08 2.83 0.17Harvester blade 3. 78 5.75 1.17Harvester chute 2.66 7.37 0.18
1 SD for post use count only.
3.2.5 LAB Enumeration in Farm Scale Silos in the Early Stages of Ensilage.
Italian Ryegrass (Lolium multiflorum) was obtained from pastures at Grange and ensiled in large scale farm silos (85 tonne horizontal clamps) with the following treatments -
1. No treatment2. Formic acid (850 g/kg) applied at 2.5 1/tonne.3. L. plantarum (Ecosyl) applied at 3 1/tonne.
Additives were applied as already outlined(2.1.3.3). Numbers of LAB were determined on thestanding crop prior to cutting (Table 21) and on the harvested grass in the silo when it was being sealed (time 0). Counts were also determined by sampling the silos after 24 and 48 hours ensiling.
Increased counts of LAB were detected on theharvested grass crop compared to the standing crop. Numbers of LAB increased substantially on all samples from each treatment within the first forty eight hours. Treatment with formic acid was found to reduce the initial growth rate of LAB. L. plantarum addition
- 70 -

resulted in higher initial numbers of LAB but total numbers were similar to the untreated control after forty eight hours.
TABLE 21. Counts of LAB (Logio CFU/g silage) in large scale farm silos for three treatments over time.
Treatment Time (hours)0 24_______ 48
Harvested cropNo treatment 5.678 7.980 9. 134Formic acid 5.613 7 . 279 8. 732L. Dlantarum 5.997 8.872 9.037
Note : Count on the standing crop = 4.509
3.3 The Effect on Silage Fermentation of Addinga Bacterial Inoculant Under Varying Levels of Sucrose Addition.
Grass was shaded to reduce its WSC content (2.1.1.2). The chemical composition of the shaded grass used is shown in Table 22. The additive treatments investigated were -
1. No additive (NA)2. Formic acid (850 g/kg) applied at 3 ml/kg fresh
matter (FA)3. Sucrose (4 g/kg fresh matter) (S4)4. Sucrose (8 g/kg fresh matter) (S8)
- 71 -

5. L. plantarum (Ecosyl) applied as recommended by manufacturers at 4.5 x 10⁵/g grass (actual count) (Lp)
6. Sucrose (4 g/kg fresh matter) + L. piantarum (S4 + Lp)
Additives were applied as described in section 2.1.3.3. Plastic pipe silos were opened and sampled on days 3, 8 and 45. Each treatment was replicated 5 times so all values presented in tables are the mean of 5 samples.
TABLE 22. Chemical composition of shaded Perennial ryegrass (Lolium perenne).
Mean SDDry matter (g/kg) 149 1 .93
Ash (g/kg DM) 91 1.11
Crude protein (g/kg DM) 161 2.94
in vitro DMD (a/kfl DM) 755 3.81
W.S.C. (g/kg liquid phase) 22 2.40
3.3.1 Fermentation Characteristics
pHpH data at time 0 (Table 23) showed the FA treatment to bring about a rapid and significant reduction 1n pH. A reduction was also detected with the sucrose treatments but the magnitude of the decrease was not as large. After three days ensiling the pH for FA treatment increased slightly compared to time 0
- 72 -

TABLE 23. Silage pH
Days No additive Formic acid Sucrose (4g/kg)
Sucrose (8g/kg)
L. DlantarumSucrose (4 g/kg)
+L. Dlantarum
Mean
0 5.9 4.0 5.6 5.7 5.9 5.93 4.6 4.2 4.3 4.2 4.7 4.1 4.48 4.1 4.2 4.0 4.0 4.1 4.0 4.1
45 3.9 3.8 3.8 3.7 3.9 3.8 3.8
Mean 4.2 4.1 4.0 4.0 4.2 4.5
SEM (Additive treatments) = 0.031 *** SEM (Time treatments) = 0.022 ***SEM (Interaction) = 0.053 **Error df = 72

while both sucrose treatments and Lp + S4 brought about an Increased rate of pH fall. The slowest initial drop in pH occurred with the NA and Lp treatments. All values were similar at day 8 and 45.
WSCThe shaded grass used in the experiment was of a low WSC content (Table 22) which was reduced further by all treatments after ensiling (Table 24). FA resulted In a higher residual level (P<0.001 ) of WSC than all other treatments when averaged throughout the 45 days ensiling. The S4 + Lp treatment over a similar time period was significantly lower than S8 (p < 0.001), S4 (p < 0.01) and Lp (p < 0.05) but was notsignificantly different to the NA treatment.
Lactic acidLevels of lactic acid (Table 25) in the first three days of ensilage were undetectable for the FA treatment but were highest (P<0.001) for the S4 + Lp treatment. When averaged over the forty five days ensiling interval, FA resulted 1n reduced levels of lactic acid (P<0.001) while S4 + Lp gave rise to higher levels than NA (P<0.05 ) , FA (P<0.001), S4 (P<0.001), S8 (P<0.05), and Lp (P<0.001).
EthanolEthanol levels were reduced by FA in the first three days ensiling (P<0.001) (Table 26) while the S4 + Lp treatment resulted in increased levels compared to NA (P<0.01), FA (P<0.001), S4 (P<0.05) and Lp (P<0.05). By day 45 FA was now showing highest levels (P<0.001) and the Lp treatment resulted in the lowest levels
- 74 -

TABLE 24. Residual water soluble carbohydrate (WSC) (g/kg liquid phase) in silage
Days No additive Formic acid Sucrose(4g/kg)
Sucrose(8g/kg)
L. DlantarumSucrose (4 g/kg)
+L. Dlantarum
Mean
3 7.2 16.2 9.4 10
CD
00 5.2 9.4
8 5.6 17.6 6.8 7 6.4 6.8 8.445 3 4 2.4 2.4 2.4 2.6 2.8
Mean 5.3 12.6 6.2 6.5 5.8 4.9
SEM (Additive treatments) = 0.31 *** SEM (Time treatments) = 0.22 ***SEM (Interaction) = 0.53 ***Error df = 72

TABLE 25. Lactic acid (g/kg liquid phase) in silage
Days No additive Formic acid Sucrose(4g/kg)
Sucrose(8g/kg)
L. d lantarurnSucrose (4 g/kg)
+L. Dlantarum
Mean
3 5.4 0 5.4 7.4 5 12.2 5.98 13.8 0.3 14 12.8 15.6 16.4 12.2
45 19.2 8.6 17.2 22 18.4 21 .8 17.9
Mean 12.8 3.0 12.2 14.1 13.0 16.8
SEM (Additive treatments) = 0.78 *** SEM (Time treatments) = 0.55 *** SEM (Interaction) = 1.36 *Error df = 72

TABLE 26. Ethanol (g/kg liquid phase) in silage
Days No additive Formic acid Sucrose (4g/kg)
Sucrose(8g/kg)
L. DlantarumSucrose (4 g/kg)
+L. Dlantarum
Mean
3 2.1 0.7 2.3 2.6 2.3 2.9 2.38 2.5 2.2 2.7 2.7 2.7 2.8 2.7
45 3.0 9.0 3.2 3.9 1 .9 2.6 4.0
Mean 2.4 4.1 2.9 3.3 2.3 2.9
SEM (Additive treatments) = 0.17 *** SEM (Time treatments) = 0.12 *** SEM (Interaction) = 0.30 ***Error df = 72

(P<0.001). S8 also gave rise to increased levels when compared with NA (P<0.001), Lp (P<0.001), Lp + S4 (P<0.001) and S4 (P<0.01).
Acetic acidThe first eight days ensiling resulted in lower levels of acetic acid (Table 27) for the FA treatment (P<0.001) than all others. S8 gave rise to significantly higher levels when averaged over the forty five days, however there was no significant difference between the S8 and NA at day 45. Small differences were detected in other treatments.
LAB numbersSignificant differences were detectable in LAB numbers when averaged over the forty five days ensiling (Table 28). Numbers were higher at day 0 on the S8 and Lp treatments (PC0.05) but were not significantly different over the entire forty five days. FA treatment reduced numbers (P<0.001) substantially, particularly in the early stages of ensilage.
Lactic : (Acetic + Ethanol)The ratio of lactic acid to acetic acid + ethanol in general was found to be reduced (P<0.001 ) for the FA treatment and increased (PC0.01) for the Lp + S4 treatment (Table 29). No significant effect was detected with other treatments.
Butyric and Propionic acidsNo significant effects were found for any treatment on levels of butyric acid (Table 30) or propionic acid (Table 31).
- 78 -

TABLE 27. Acetic acid (g/kg liquid phase) in silage
Days No additive Formic acid Sucrose(4g/kg)
Sucrose(8g/kg)
L. DlantarumSucrose (4 g/kg)
+L. Dlantarum
Mean
3 1 .6 0.4 1 .7 2.3 1 .5 2.1 1 .78 1 .9 0.5 2.3 2.8 1 .9 2.2 2.0
45 3.4 2.8 2.9 3.3 2.9 2.5 3.1
Mean 2.5 1 .3 2.4 2.9 2.3 2.3
SEM (Additive treatments) = 0.13 *** SEM (Time treatments) = 0.09 ***SEM (Interaction) = 0.22 ***Error df = 72

TABLE 28. LAB counts (Logio C.F.U./g silage)
Days No additive Formic acid Sucrose(4g/kg)
Sucrose(8g/kg)
L DlantarumSucrose (4 g/kg)
+L. Dlantarum
Mean
0 6.54 5.58 6.63 6.73 6.80 6.323 9.15 7.72 9.25 9.11 9.06 9.088 9.11 7.60 9.08 9.09 9.07 9.05
45 8.62 8.35 8.54 8.70 8.64 8.57
Mean 8.35 7.31 8.37 8.41 8.39 8.34
Note : Three i ndependent samples were + Day 0taken on day 0 as opposed to ++ Day 3, 8, 45five for all other days
SEM (Additive treatments) = 0.04 ***SEM (Time treatments +) = 0 . 0 3 ***SEM (Time treatments ++) = 0.03 ***SEM (Interaction +) = 0 . 0 8 ***SEM (Interaction ++) = 0.07 ***Error df = 84

TABLE 29. Lactic acid : (acetic acid + ethanol) in silage
Days No additive Formic acid Sucrose(4g/kg)
Sucrose (8g/kg)
L. DlantarumSucrose (4 g/kg)
+L. Dlantarum
Mean
3 1 .4 0 1 .3 1 .5 1 .3 2.4 1.38 3.1 0.1 2.8 2.3 3.4 3.4 2.5
45 3.2 0.7 2.9 3.1 4.0 4.5 3.1
Mean 2.59 0.29 2.3 2.3 2.9 3.4
SEM (Additive treatments) = 0.17 *** SEM (Time treatments) = 0.12 ***SEM (Interaction) = 0.30 *Error df = 72

TABLE 30. Butyric acid (g/kg liquid phase) in silage
Days No additive Formic acid Sucrose(4g/kg)
Sucrose (8g/kg)
L. DlantarumSucrose (4 g/kg)
+L. Dlantarum
Mean
3 0.2 0 0.2 0.2 0.2
CM•o
0.178 0.1 0 0.2 0.2 0.2 0.2 0.15
45 0.1 0.1 0.1 0 0.1 0.1 0.08
Mean 0.13 .03 0.17 0.13 0.17 0.17
SEM (Additive treatments) = 0.03 NSSEM (Time treatments) = 0 . 0 2 NSSEM (Interaction) = 0 . 0 5 NSError df = 72

TABLE 31. Propionic acid (g/kg liquid phase) in silage
Days No additive Formic acid Sucrose(4g/kg)
Sucrose(8g/kg)
L. DlantarumSucrose (4 g/kg)
+L. Dlantarum
Mean
3 0.2 0.3 0.2 0.2
CM■o
0.1 0.28 0.1 0.3 0.2 0.1 0.1 0.1 0.15
45 0.3 0.1 0.2 0.3 0.3 0.1 0.22
Mean 0.2 0.23 0.2 0.2 0.2 0.1
SEM (Additive treatments) = 0 . 0 6 *SEM (Time treatments) = 0 . 0 4 NSSEM (Interaction) =0.11 NSError df = 72

Ammonia - NitrogenAmmonia nitrogen data presented in Table 32 showed that treatment with FA resulted in significantly lower ammonia concentration on days 3, 8 and 45 than any other treatment. The two sucrose concentrations and S4 + Lp also reduced ammonia, however Lp addition gave rise to significantly higher ammonia levels at day 45 than all treatments with the exception of NA which had the highest level.
3.3.2 Non fermentation characteristics
DMFA treatment over the first eight days resulted in a significantly higher DM than other treatments (Table 33). By day forty five it was still higher than Lp (PC0.001) but was not significantly different from other treatments. Lowest DM contents were recorded for the NA, Lp and S4 + Lp treatments over the first eight days but by day forty five values were similar for all treatments except FA.
CPCrude protein data (Table 34) showed little difference among treatments in the first 8 days ensiling. At day 45, Lp resulted in a higher value than all other treatments (P<0.05). Overall there was no significant difference among treatments.
In vitro DMDTreatment with Lp was found to reduce the in vitro DMD of the silage at day 45 (P<0.01).Values for all other treatments were similar and not significantly different (Table 35).
- 84 -

TABLE 32. Ammonia-nitrogen (g/kg TN) in silage
Days No additive Formic acid Sucrose (4g/kg)
Sucrose (8g/kg)
L. DlantarumSucrose (4 g/kg)
+L. Dlantarum
Mean
3 97.0 41.7 62.3 54.6 87.3 71 698 94.5 44.8 63 64.5 85.5 67.2 70.2
45 121 .7 71 .5 96 95.1 107.4 85.7 96.3
Mean 104 52.7 74.4 71 .4 93.4 74.7
SEM (Additive treatments) = 3.97 *** SEM (Time treatments) = 2.97 ***SEM (Interaction) = 6.78 NSError df = 72

TABLE 33. Dry matter (g/kg) in silage
Days No additive Formic acid Sucrose(4g/kg)
Sucrose(8g/kg)
L. DlantarumSucrose (4 g/kg)
+L. Dlantarum
Mean
3 146 162 156 158 146 146 1528 154 170 157 163 155 157 159
45 167 170 169 169 160 167 167
Mean 156 168 161 163 154 157
SEM (Additive treatments) = 1.81 *** SEM (Time treatments) = 1.29 ***SEM (Interaction) = 3.15 NSError df = 72

TABLE 34. Crude protein (g/kg DM) in silage
Days No additive Formic acid Sucrose(4g/kg)
Sucrose(8g/kg)
L. DlantarumSucrose (4 g/kg)
+L. Dlantarum
Mean
3 176 165 159 162 169 178 1688 167 156 168 155 162 164 162
45 153 159 151 145 171 156 156
Mean 165 160 159 154 167 166
SEM (Additive treatments) = 3 . 9 NSSEM (Time treatments) = 2 . 8 *SEM (Interaction) = 6 . 8 NSError df = 72

TABLÉ 35. in vitro dry matter digestibility (OMD) (g/kg DM) after 45 days ensiling
Days No additive Formic acid Sucrose(4g/kg)
Sucrose(8g/kg)
L. DlantarumSucrose (4 g/kg)
+L. Dlantarum
714 713 703 708 688 700
SEM (Additive treatments) = 6 . 6 NS Error df = 24

3.3.3 Eff1uentCumulative effluent production data (Table 36) show FA treatment to give rise to higher effluent production at days 3, 8 and 45(P<0.001). S8 also resulted in higher effluent production at day three compared to NA (p <0.01), S4 (p < 0.05), and Lp (p < 0.001). At day 8, S8 gave rise to higher effluent production than NA (p < 0.01) only. At day 45 all treatments (except FA) were not significantly different.
Effluent Refractometer ReadingRefractometer data (Table 37) on silage effluent showed FA to result in higher readings (P<0.001) than all treatments at days three and eight. S8 was also higher (P<0.001) than all except FA at day 3 and higher than all exceptS4 + Lp and Fa at day 8. At day 45, S8 washigher than all (P<0.001) except S4 + Lp with FA giving the lowest value of all (P<0.001). Lp resulted in the lowest readings (P<0.01) at day 3 but was similar to other treatments except S8and FA at days eight and forty five.
Effluent p HEffluent pH had reduced (P<0.001) the most at day 3 with FA treatment (Table 38). Highest readings were recorded at day 3 for the Lp and NA treatments (PC0.001). No major differences were found at day 8 or 45 fo any treatments.
- 89 -

TABLE 36. Cumulative effluent production (mis)
Days No additive Formic acid Sucrose (4g/kg)
Sucrose(8g/kg)
L. DlantarumSucrose (4 g/kg)
+L. Dlantarum
Mean
3 118 561 150 280 98 194 2348 320 771 439 472 438 432 479
45 889 1104 813 860 894 900 910
Mean 442 812 467 537 477 509
SEM (Additive treatments) = 36.81 *** SEM (Time treatments) = 26.03 ***SEM (Interaction) = 66.50 NSError df = 72

TABLE 37. Refractometer readings on silage effluent.
DAYS No additive Formic Acid Sucrose (4 g/kg)
Sucrose (8 g/kg)
L. olantarum Sucrose (4 kg) +
L. Dlantarum
Mean
3 2.41 4. 58 3.17 3.68 1 . 72 2.48 3.01
8 3.02 4.38 3.26 3. 79 3.14 3.51 3. 52
43 4.38 3.82 4.12 4. 90 4.14 4.44 4.30
Mean 3.27 4.26 3.52 4.12 3.00 3.48
SEM (Additive treatments) = 0.16 ***SEM (Time treatments) = 0.11 ***SEM (Interaction) = 0.28 ***Error df = 72

TABLE 38. pH readings on silage effluent.
DAYS No additive Formic Acid Sucrose 4 g/kg
Sucrose 8 g/kg
L. Dlantarum Sucrose+
L. Dlantarum
Mean
3 5.03 4.05 4.51 4.42 4.94 4.62 4. 59
8 4.35 4.17 4.23 4.20 4.32 4.20 4.25
43 3.96 4.06 3.86 3.82 4.03 3.88 3.94
Mean 4.45 4.09 4.2 4.15 4.43 4.23
SEM (Additive treatments) = 0.06 ***SEM (Time treatments) = 0.04 ***SEM (Interaction) = 0.09 ***Error df = 72

3 . 3 . 4 Summary o f o v e r a l l t r e a t m e n t e f f e c t s r e l a t i v e t o
the untreated control
1. Formic acidTreatment with FA significantly reduced pH (days 0 and 3), lactic acid (overall), acetic acid (overall), butyric acid (days 3 and 8), total VFA, NH3-N (overall) and counts of LAB (day 0, 3 and 8). It also gave rise toincreased levels of residual WSC (overall) and ethanol (day 45) as well as higher DM contents (days 3 and 8), higher refractometer readings on effluent (days 3 and 8) and higher effluent production (overall).
2. Sucrose (4 g/kg)S4 significantly reduced pH (day 0) and NH 3 -N (overall) values. It gave rise to significant increases in the levels of ethanol (overall) and a reduced residual level of WSC (day 45). It also resulted in higher refractometer readings on effluent (day 3).
3. Sucrose (8 g/kg)Treatment with S8 significantly reduced pH (day 0), and NH 3-N (overall) values. Itsignificantly increased ethanol (overall), acetic acid (days 3 and 8), total VFA and effluent production (days 3 and 8). It gave rise to a reduced residual level of WSC (days 3 and 8), a higher DM content (days 3 and 8) and higher refractometer readings on effluent (overal1).
- 93 -

4. L- DlantarumTreatment with Lp was found to significantly reduce the in vi tro DMD of the silage (day 45) and gave rise to lowest refractometer readings in silage effluent (day 3).
5. Lp ± S4Treatment with Lp + S4 resulted in a significantly lower pH (day 3) and NHa-N (overall) values. It also gave rise to significantly increased lactic acid (days 3 and 8) and ethanol (days 3 and 8) production as well as a higher refractometer reading on effluent produced (day 8).
- 9 4 -

3 .4 The E f f e c t on S i l a g e F e r m e n t a t i o n o f A d d in g
Bacterial Inocula from Two Sources.
The two inoculants used were L. piantarum (Ecosyl) and L. buchneri (Grange isolate). The isolation of L. buchneri has already been outlined (2.1.3.2).
3.4.1 Identification of L. buchneri.
The LAB isolate was identified using the tests outlined in 2.4. Results showed the isolate to be a catalase negative, Gram positive rod which had negative motility and a heterofermentative metabolism. Results from the API tests suggested that the isolate was L. buchneri (See API profile appendix C16). As L. buchneri is taxonomical1y identical to L. brevis (Kandler and Weise, 1986) it was necessary to confirm the identity of the isolate as L. buchneri by isolating the lactatedehydrogenase (LDH) enzymes of the isolate and then comparing the mobility of these enzymes on an agarose electrophoresis gel with those isolated from two reference strains of L. brevis (NCIB 11973) and L. buchneri (NCIB 8007). The mobility of the LDH enzymes of the Grange isolate were identical to that of the L.buchneri reference strain, both travelled 2.5 cm on the gel. The L. brevis reference strain travelled 3.20 cm. The Grange isolate was therefore confirmed to be L.buchneri. The chemical composition of the silage from which the L. buchneri strain was taken is given in Table 39 .
- 95 -

TABLE 39. Chemical composition of silage from which inoculum of L. buchneri was isolated.
Dry matter (g/kg) 191 ,.0Water soluble carbohydrate (g/kg liq. phase) 1 ,. 7Lactic acid (g/kg liq. phase) 31 ,. 0Ethanol (g/kg liq. phase) 4 . . 1Acetic acid (g/kg liq. phase) 5 , . 4
Propionic acid (g/kg liq. phase) 0 .. 3Butyric acid (g/kg liq. phase) 0.. 5
Total VFA (g/kg liq. phase) 6,, 3pH 3.. 6Crude protein (g/kg DM) 206..0Ammonia-nitrogen (g/kg Total nitrogen) 4 5 . . 5
in vitro DMD (q/kg DM) 721 ..0
3.4.2 Fermentation Pattern
The chemical composition of the grass used in this experiment indicated a high quality (Table 40). Three additives were applied to the grass to study their effects on fermentation characteristics.
No additive (water applied at 3 mls/kg fresh matter) (NA) Lactobaci11 us piantarum (3 mls/kg fresh matter - 4.76 x 10⁵ LAB/ g grass) (LP)Lactobaci11 us buchneri (10 mis undiluted broth culture /kg fresh matter - 7.7 x 10⁶ LAB/ g grass) (LB)
The treated grass was packed into test tube silos (100 ml) which were opened after 1, 2, 4, 7, 14, 21, 28, and100 days ensiling. Each treatment was replicated four times so mean values are based on four replicates for each opening time.
- 96 -

TABLE 40. Chemical composition of Italian ryegrass (Loliurn multiflorum)
Mean SDDry matter (g/kg) 141 1.85
Ash (g/kg DM) 116 1 .47
Crude protein (g/kg DM) 183 4.04
In vitro DMD (g/kg DM) 778 5.19
W.S.C. (g/kg liquid phase) 30 1.50
3.4.3 Fermentation characteristics
pHNo difference was detected for any treatment inpH data until day 21 (Figure 5). From this pointonwards the Lb treatment resulted in asignificant rise in pH (P<0.001) while the Lpand NA treatments were similar and both decreased.
WSCOverall, no significant difference was detected in residual WSC between the Lp and NA treatments however Lb resulted in a lower level (P<0.01) (Figure 6).
Lactic acidLevels of lactic acid in the first 7 days of ensiling were highest (P<0.001) for the NA treatment with no major difference between the Lp and Lb treatments (Figure 7). From day 7 to 28 no significant differences were detected in
- 97 -

g/kg
Liq
phase
FIG 5
TIME (DAYS)
□ NONE a L. plantarum o L. buchneri
FIG 6
Residual Water Soluble Carbohydrate
TIME (DAYS)
- 98 -

the NA or Lb treatment however Lp significantly increased the levels detected. At day 100 Lb treatment resulted in a substantial reduction in lactic acid (P<0.001) whereas the NA and Lp treatments remained unchanged.
EthanolNo significant difference was found (between treatments) in levels of ethanol for the NA or Lp treatments over the entire fermentation (Figure 8). Treatment with Lb gave rise to a significant increase in the first 4 days of ensiling, however from days 7 to 28, the levels detected for this treatment were lower than the other treatments (P<0.01). Finally at day 100 Lb again resulted in a higher level of ethanol being measured (PC0.001).
Acetic acidNo significant difference was found between Lp and NA treatments over the 100 days ensiling (Figure 9). Treatment with Lb resulted in a significant increase in acetic acid from day 4 onwards.
Lactic : (acetic + ethanol)No significant difference was detected between the Lp or Lb treatments in the first 14 days however the NA treatment resulted in a higher ratio (P<0.05) than the others (Figure 10). From days 21 to 100 Lb treatment resulted in a drop in the ratio value (P<0.001) while no significant difference was found between the NA or Lp treatments.
Counts of LABNo significant difference was found in counts between the NA or Lp treatments on any sampling occasion (Figure 11). Treatment with Lb gave
- 99 -

g/kg
Liq
phase
g/kg
Uq phase
FIG 7
Lact i c Acid
TIME (DAYS)
° NONE a L. plantarum o L. buchneri
FIG 8
TIME (DAYS)
- 1 0 0 -

g/kg Liq
phase
9^9 ̂
phase
Ac-etic Acid
TIME (DAYS)
° NONE a L. plantarum o L. buchneri
F1G 10
TIME (DAYS)
□ NONE a L. plantarum o L. buchneri
- 101 -

rise to higher counts on day 0 (P<0.001) and on day 100 (P<0.001).
Butyric acidNo significant differences were found between the NA or Lp treatments over the 100 days ensiling (Figure 12). A significant increase in butyric acid was detected at day 7 for the Lb treatment and the levels continued to rise significantly for the remainder of the fermentati o n .
Propionic acidNo significant differences were detectable with any treatment until day 100 when Lb gave rise to increased levels of propionic acid (P<0.001) (Figure 13).
Ammonia - NitrogenData for the first 7 days ensiling showed no significant differences between treatments (Figure 14). Between days 14 to 28, Lb wasfound to result in increased levels of ammonia (P<0.05) with no significant differences between other treatments. Data at day 100 showed Lb tohave a higher final level of ammonia (P<0.001).
3.4.4 Non fermentation characteristics
DMLb treatment resulted in a lower DM content(P<0.05) over the 100 days ensiling (Figure 15). Treatment with Lp and NA showed similar DMcontents with no significant differences between those treatments detected.
- 102-

FIG 11
LACTIC ACID BACTERIA COUNTS
TIME (DAYS)
° NONE a L. plantarum o L. buchneri
FIG 12
TIME (DAYS)
° NONE A J_. plantarum o L. buchneri
- i o -1 -

g/kg
total
N g/kg
Liq
phase
FIG 13
Propionic Acid
0 20 40 60 80 100
TIME (DAYS)
° NONE A L. plantarum o L. buchneri
FIG 14
TIME (DAYS)
- 104 -
Ni t r o g e n
No significant differences were detected in the first 14 day for any treatment (Figure 16). However from day 14 to 100, Lb treatment resulted in a higher value (P<0.001) than the Lp or NÀ treatments, both of which were found to give similar readings.
In vitro DMDLb brought about a reduction in in vitro DMD (PC0.001) while no significant difference was detected in NA or Lp (Figure 17) at day 100.
A summary of overall treatment effects is shown in Table 41 (averaged over opening times).
- 105-

DRY MATTER CONTENT
TIME (DAYS)
n NONE a L. p ’l ai'itarum o L. buchneri
FIG 1B
TIME (DAYS)
° NONE A L. plantarum o L. buchneri
- 106 -

g/kg
DM
FIG 17
in vitro DMD AT DAY 100
o" • J
m NONE L. plantaran L. buchneri

TABLE 41. Summary of averaged treatment effects of no additiveL. plantarum and L. buchneri addition (averaged over time)
NoAdditive L. Dlantarum L. buchneri SEM SIG
DRY MATTER 1 45 b 1 46 b 141 • 1 .1 **(g/kg)
pH 4 . 0b 4 . 0b 4.2» 0.01 ***WSC 1 8. 1b 8 . 2b 6.7» 0.3 **LACTIC ACID’ 1 9. 4b 18.7b 14.2« 0.7 *#*ETHANOL1 1 . 1 1 .2 1.2 0.04 NSACETIC ACID1 2. 8b 2. 9b 5.7» 0.13 ***BUTYRIC ACID1 0. 2b 0. 2b 1 .8» 0.08 ***PROPIONIC ACID1 0.19 1 .8 3.8 0.1 NS
TOTAL VOLATILE1FATTY ACIDS1 3. 2b 3. 3b 7.9» 0.3 * * *NITROGEN2 32.7 32.8 33. 7 0.52 NSAMMONIA-NITROGEN3 41 . 7b 40.6b 49 .4« 1 .58 ***
Error df = 72 Superscripts 1, 2 and 3 = g/kg liquid phase, g/kg DM and g/kg TN,respecti vely .
- I 08 -
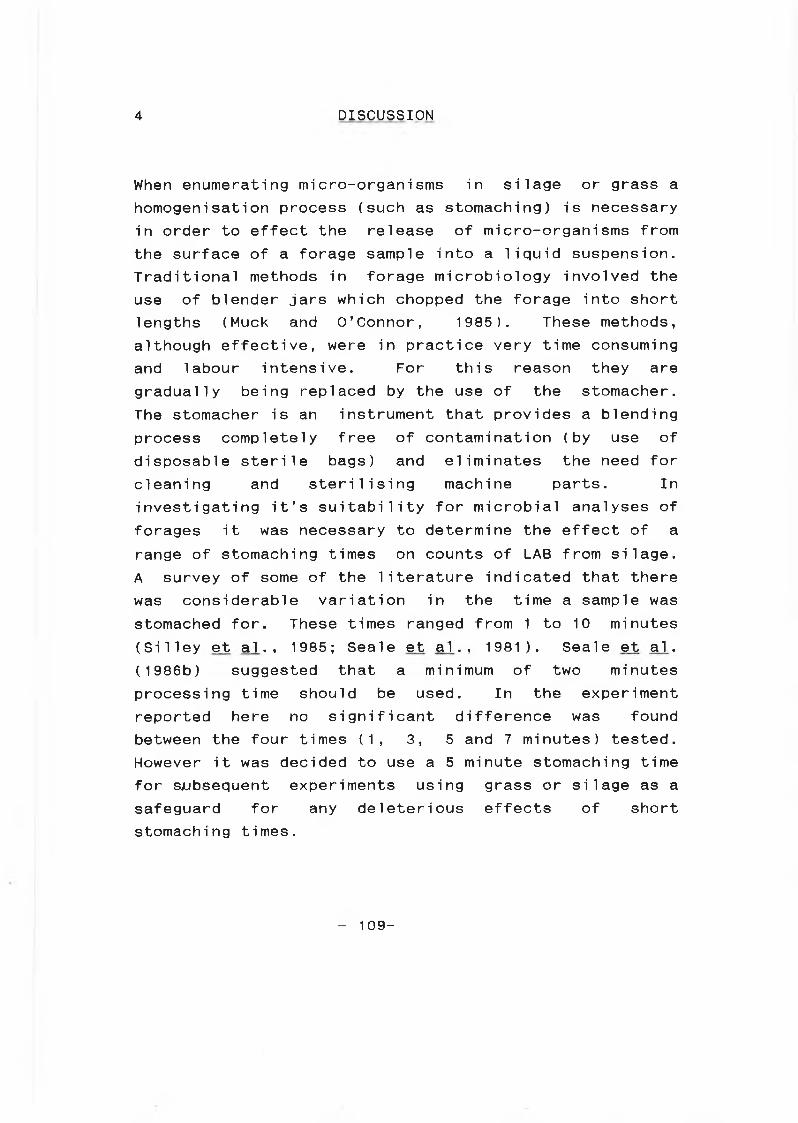
4 DISCUSSION
When enumerating micro-organisms in silage or grass a homogenisation process (such as stomaching) is necessary in order to effect the release of micro-organisms from the surface of a forage sample into a liquid suspension. Traditional methods in forage microbiology involved the use of blender jars which chopped the forage into short lengths (Muck and O ’Connor, 1985). These methods,although effective, were in practice very time consuming and labour intensive. For this reason they aregradually being replaced by the use of the stomacher. The stomacher is an instrument that provides a blending process completely free of contamination (by use of disposable sterile bags) and eliminates the need for cleaning and sterilising machine parts. Ininvestigating it’s suitability for microbial analyses of forages it was necessary to determine the effect of a range of stomaching times on counts of LAB from silage. A survey of some of the literature indicated that there was considerable variation in the time a sample was stomached for. These times ranged from 1 to 10 minutes(Silley et al., 1985; Seale e t a l .. 1981). Seale et al.(1986b) suggested that a minimum of two minutes processing time should be used. In the experimentreported here no significant difference was found between the four times (1, 3, 5 and 7 minutes) tested.However it was decided to use a 5 minute stomaching time for subsequent experiments using grass or silage as asafeguard for any deleterious effects of short stomaching times.
- 1 0 9 -

A literature review of the incubation methods used for LAB recovery indicated that there was considerable variation in the methods used. Standardisation of methods is being sought by European microbiologists and a report describing their techniques is in press (Seale et a l , 1986b). In the experiments presented herecomparisons of a number of incubation conditions were carried out using LAB recovered from both silage and grass in an effort to establish which conditions gave optimum recovery of LAB.
The combined results for all experiments using silage showed that significantly higher counts of LAB are obtained when plates are incubated anaerobically than micro-aerophi1ical1y . This might be expected since the LAB in silage may be more accustomed to a completely anaerobic environment and may have been selected accordingly during the ensilage process. The increased counts with anaerobic incubation may be due to the absence of oxygen, the presence of carbon dioxide and hydrogen or a combination of both. Surface growth of lactobacilli on solid media is generally enhanced by anaerobiosis or reduced oxygen pressure and 5 to 10 %CO 2 (Kandler and Weiss, 1986). Results with micro-aerophi1ic incubation resulted in no significant difference being found by increasing the volume of the overlay. It was hoped that by increasing the thickness of the overlay, the rate of oxygen transfer to the LAB would be reduced and so would permit optimal growth of LAB. These results differ to those of Carlile (1984) who in an effort to establish the best combination of incub'ation temperature, medium and method of oxygen restriction for the growth of a range of LAB, noted that the recoveries of 18 pure cultures of LAB were not affected by whether agar overlays or anaerobic jars were used. She also found that there was no one ’best’ combination of growth conditions, i.e. giving most satisfactory growth of a range of cultures.
- 110-

When grass was used instead of silage, no significant difference was found among the incubation conditions. LAB growing on grass might be expected to be more adapted to an aerobic environment and it was notsurprising that similar counts were obtained whetherincubation was anaerobic or micro-aerophilic.
MRS and Rogosa are two common media used for the enumeration of LAB. MRS is a general medium which allows good growth of all silage LAB. Rogosa has been found to recover three groups i.e. the lactobacilli, pediococci, and leuconostocs but not the streptococci (Pahlow as referenced by Seale et al, 1986b). On the other hand unpublished data by Dellaglio and Torriani (as referenced by Seale et aj., 1986b) showed Rogosa to be effective in the recovery of some streptococci.
Results from the experiments carried out in this research project showed no significant difference between the two media for recovery of LAB from silage. It has generally been found that the final population of LAB in silage is comprised mainly of the lactobacilli (Langston and Bouma 1960; Langston et al, 1962; Kroulik et al, 1955b; Kempton and SanClemente, 1959. For this reason it would be expected that both media would recover most of the LAB present and hence no major difference would be detected between the two media. If a large proportion of the population had been dominated by streptococci, as has been found on grass (Fenton, 1987), then MRS might show increased counts compared toRogosa. It was therefore decided to use MRS as themedium 'of choice for all subsequent experiments.
Using these refinements to the methodology LAB enumeration was undertaken on grass, silage and machine parts. Numbers of LAB recovered from both the standing and harvested crops were high, ranging from 104 to 107 CFU/g grass. The high counts of LAB detected on standing
- Ill-

crops were not in agreement with those found by Stirling and Whittenbury, (1963); or Fenton (1987) in the U.K. or Muck and O'Connor (1985) in the U.S.A. The high levels found may have been associated with weather related factors (low UV radiation, high relative humidity, etc.) crop factors (dense high moisture crops) management factors (animal manures and silage effluent applied to silage ground; silage ground grazed late in the year) or were probably due to a combination of all these factors. Weather conditions in Ireland are frequently moist overcast and cloudy resulting in a high relative humidity and low uv radiation (Appendix Table Al and A 2 ). Similar to those prevailing at Grange in the days around grass sampling during 1988. Even though no correlation was found between weather data and counts of LAB it was felt that the range of weather conditions prevailing was narrow (i.e. no extreme conditions) and as such the effects of weather were not detectable. However the conditions that did prevail were associated with high counts of LAB. Pahlow (1989) looked at the effect of climatic factors on the number and type of LAB on maize (standing crop) and found that low relative humidity with high temperature was favourable for the homolactic flora while high relative humidity as encountered during the sampling period of this experiment with low temperature doubled LAB numbers and tilted the balance in favour of the heterofermentatives. However, in contrast to the findings reported in the present work Pahlow found a significant correlation between total LAB numbers and temperature with highest counts recorded at the lowest temperatures. It was suggested that high temperature occurring together with high radiation would result in lower counts.
The WSC levels in the grass during the season were generally low (6.6 to 32 g/kg liquid phase) and associated with this narrow range in conditions no correlations could be detected between LAB numbers and grass WSC content. Assuming that no LAB existed inside
- 112-

the plant cells (Moon et al., 1980; Winters, Whittaker and Wilson, 1987) it was possible that no correlation occurred since the WSC is found inside the grass plant and therefore should not be available to the LAB, unless the plant is damaged or decaying. If the latter occurred then WSC could become available to LAB. As shown elsewhere (3.2.3), the decayed material at the base of the grass plant harbours high numbers of LAB.
Grass dry matter contents were low, ranging from 116 to 203 g/kg. Since all of these grass crops would be considered to be of low dry matter content, the range in grass dry matters was relatively narrow and it was not surprising that a significant correlation between grass DM content and LAB numbers was not detected.
Several investigators have implicated the forage harvester as a major source of inoculation of grass (Gibson et al., 1961? Henderson et al. (1972); MeDonald, (1976); Muck and O' Connor, (1985); Fenton, (1987)). Muck and O' Connor (1985) working with alfalfa suggested that inoculation by the harvester would only be effective if the number on the crop was less than 104 CFU/g alfalfa. In the experiments reported here numbers of LAB were high on the standing crop and, no effect of inoculation by the harvester on total LAB counts was detected. These findings were in agreement with those of Muck and O' Connor (1985).
The identification of a random selection of LAB colonies isolated from grass showed the homofermentative LAB to account for 54% of total isolates. Of the homofermentatives 87% belonged to the genusLactobacillus. Heterofermentative LAB accounted for 32% of total isolates with leuconostoc being the dominant species, accounting for 78% of heterofermentative isolates. Although the number of isolates was small, the information obtained from identification give possible indication of the dominant types of LAB on the standing
- 113 -

crop and also provided a check on the selectivity of MRS agar in enumerating LAB from grass. The results obtained were in agreement with Pahlow (1989) who found 55% of isolates on maize to be homofermentative LAB with lactobacilli dominating and the leuconostocs to form the largest proportion of the heterofermentatives. Fenton (1987) found the streptococci to be the predominant LAB species on the standing crop (50% of isolates), pediococci accounted for 42% while 7% of isolates were of the genus Lactobaci11 us. but leuconostocs were not detected at all.
Stirling and Whittenbury (1963) looked at counts of LAB on a range of crop leaves and found few colonies of LAB on fresh, partially wilted or decaying leaves of kale, beet, mangal or cabbage. As previously shown in theliterature review (Tables 5 and 6) Kroulik et aj_ ( 1 955a)and Nilsson et a± (1956) found high total numbers of bacteria ranging from 105 to 107 CFU/g on a range ofdifferent plants. Counts of LAB on grasses and clover inthese studies were high with Agrostis species giving rise to highest counts. The increased counts on particular genera of grass may be a genus only effect or it may be that any one of a number of other effects such as the plant growth stage, the amount of dead material on the plant (3.2.3), the local plant micro-environment, the plant morphology, or some stimulatory or inhibitory conditions/substances on the plants.
Counts of LAB on all plant parts and on the entire plant were high ranging from 104 to 107 CFU/g grass. Highest counts were found on the decaying material at the base of the plant. This finding was in agreement with that of Stirling and Whittenbury, (1963) who suggested that the presence of LAB was associated with the release of nutrients from damaged or decaying plant tissue. In addition it could also be proposed that the conditions
- 114-

prevailing at the base of the plant may encourage the growth of LAB i.e. reduced penetration by uv light, and a more moist and humid environment.
Stirling and Whittenbury, (1963) found that no LAB colonies developed on the inflorescence, before or after seed formation, however in the experiment carried out here very high numbers were detected ranging from 105 to 107 CFU/g grass. These high numbers may be as a result of the LAB locating in the micro-environments among the seeds, thus protecting them from harsh environmental conditions. High counts of LAB have also been detected on corn seed (Miskovic and Rasovic, 1972; Koch, Moruarid and Kirchgesmer 1973).
Lower numbers of LAB were detected on the leaves of the grass. This would be expected since leaves are usually orientated so as to achieve maximum interception of sunlight and hence uv radiation. For this reason the leaf provides very little protection for the LAB. These results are in agreement with Moon and Henk (1980) who found few bacteria on the surface or the interior of either wheat or alfalfa leaves. As previously mentioned Stirling and Whittenbury (1963) found few LAB on leaves of kale, beet, mangel or cabbage.
Previous work has indicated that inoculation of herbage by machinery can occur during harvesting (Muck and O' Connor, 1985; Fenton, 1987).
The high counts of LAB recovered on some parts of new, previously unused machinery in the present work were not expected. The machinery was stored in an area adjacent to where silage was stored, fed and transported regularly. It may therefore be possible that counts of LAB had been high in this general environment. Highest counts of LAB on unused machinery were detected on the mower blades. These were located close to the ground and this is because of moisture and humidity levels as well
- 115-

as nutrient (soil/dirt particles) accumulation on the blades may have provided a site for LAB survival.
The same machinery was sampled again after being in regular use throughout the silage making season. Counts of LAB had increased on all machine parts except the harvester rollers. Highest counts were detected on the harvester chute. This was expected since this area was coated with a mat of plant fragments and debris which could be a medium for LAB survival and growth. Increases in LAB numbers on machinery after use have also been found by Fenton (1987) and Stirling and Whittenbury (1963) where it was suggested that LAB multiply where plant sap collects as a result of chopping or laceration of the plant material. Having established the number and location of LAB on the raw plant material and on the machinery it was necessary to monitor the change in number of the LAB under various ensiling conditions.
Numbers of LAB were counted in large scale farm silos in the first 48 hours of ensilage. The procedure normally used for sampling the harvested crop (2.1.1.1) was such that a time interval of ten minutes (approx) occurred between sampling the standing and harvested crops. In this experiment where the profile of LAB growth in farm silos was monitored the harvested grass was sampled at the silo after a considerably longer time interval (70 minutes approx). The doubling time of LAB under optimal conditions varies from 50 to 104 minutes (approx) depending on the species and growth conditions prevailing (Pitt et al (1985)). It was therefore possible that the increase in LAB numbers between the standing and harvested crops could be partially accounted for by lactic acid bacterial growth, or it may also be possible that the harvester may have given rise to some degree of inoculation as the numbers were relatively low (104 CFU /g grass) on the standing grass on this occasion. Overall, counts of LAB were found to
- 116-

increase in a similar manner and pattern to that already seen in pipe and test tube silos. Treatment with formic acid was found to reduce the initial growth rate of LAB.This may be due to its ability to bring numbers wererelatively low (104 CFU /g grass) on the standing grass on this occasion. Overall, counts of LAB were found to increase in a similar manner and pattern to that already seen in pipe and test tube silos. Treatment with formic acid was found to reduce the initial growth rate of LAB.This may be due to its ability to bring about a rapidreduction in pH and/or its antimicrobial properties. (Saue and Breirem 1969; Woolford, 1975b). Treatment with L. plantarum resulted in a higher initial number of LAB on the harvested grass, however the numbers detected after forty eight hours were similar to those found on the untreated control. This may be explained if it is assumed that the indigenous population of LAB dominated the fermentation for this treatment and hence would give rise to similar numbers as the control silage. Alternatively the inoculated L. plantarum culture may have a similar growth profile to the indigenous population and therefore could reach similar final levels of LAB to the control.
It has already been cited that some of the main factors effecting the silage fermentation are the numbers and types of micro-organisms and the availability of substrate. Having established that numbers of LAB would not be a limiting factor it was now necessary to look at the effect of substrate (i.e. sugar levels) and inoculation on the fermentation pattern. Because fermentable sugar levels are frequently low in grass at. harvesting, acid and sugar sources are often added at ensiling (O' Kiely, Flynn and Wilson, 1986). Inoculants containing strains of homofermentative LAB are often claimed to efficiently produce adequate lactic
- 117 -

acid even under low sugar conditions. In one experiment reported here (see section 3.3) grass was ensiled and the effectiveness of various additives (including an inoculant) were examined to determine their ability to influence fermentation and improve preservation where sugar in the crop was limiting. Formic acid has been proven to be an effective silage preservative under difficult ensiling conditions (Castle and Watson, 1970; Wilson and Wilkins, 1973; Barry Cook and Wilkins, 1978; Murphy, 1981; Chamberlain and Quig, 1987; 0 ’Kiely et aj_. 1989), so it was included in the experiment as a positive control. Some of the reasons suggested for the failure to achieve good preservation are a delay in achieving anaerobic conditions (Wilson and Flynn, 1979), lack of adequate fermentable substrate (Woolford, 1984; 0 ’ Kiely, 1989), highbuffering capacity (McDonald, 1981), insufficient numbers of LAB (Fenton, 1987; Muck, 1989) or high initial numbers of undesirable bacteria (Leibensperger and Pitt, 1987). It was decided to study the effect of adding two levels of fermentable substrate to grass of low initial WSC content. Sucrose was chosen as a substrate because it is composed of equal proportions of the two hexose sugars, glucose and fructose. It was felt that supplying the substrate in this form would allow the balance between homo and heterofermentative LAB within the microbial population to express itself fully. The pathways through which substrates are fermented by LAB differ according to the species of micro-organism and may alter according to the nature of the substrate. A homolactic fermentation with 1 mole ofIglucose and 1 mole of fructose will produce 2 moles of lactate. However, a heterolactic fermentation with 1 mole of glucose will produce 1 mole lactate, 1 mole of ethanol and 1 mole of CO 2 . A heterolactic fermentation with 3 moles of fructose will produce 1 mole lactate, 1 mole acetate, 2 moles of mannitol and 1 mole of CO 2
(Woolford, 1984). By supplying the substrate in the form of glucose only or fructose only it is possible to
- 118-
alter the fermentation products. By supplying the substrate in the form of sucrose you allow the balance between the homo and heterofermentative LAB to establish itself. Grass of low WSC content was used and the effects of increased rates of sucrose addition studied.
A commercial inoculum containing a homofermentative LAB, Lactobaci11 us piantarum. was chosen as a treatment to determine if the fermentation could be affected by dominating the indigenous LAB population with an inoculum (106 CFU/g grass) of the selected strain. The inoculum was also applied in combination with sucrose (4 g/kg fresh matter) in order to provide the added bacteria with extra readily available substrate.
In order to produce grass of relatively low WSC content it was decided to try two approaches. Firstly the grass was shaded for 64 hours to restrict photosynthesis and hence reduce WSC levels (Lindgren et al, 1988). Secondly, an attempt was made to simulate the normal rate of filling a farm scale silo by packing treated grass in polythene bags overnight. The semi-anaerobic conditions achieved inside the bag should allow aerobic micro-organisms to increase in number and further reduce the WSC content of the grass. However, the level of WSC in the grass after shading was higher than anticipated (22 g/kg Liquid phase). One must therefore conclude that the period of shading was not long enough or that the grass had a very high level of WSC originally.
Although dry matter levels of grass were low (range 147-1E>1 g/kg) the overall standard of preservation for all treatments as defined by Haigh and Parker (1985) was good. Formic acid reduced grass pH directly from 6.0 to 4.0 and the resulting restricted fermentation further reduced pH to 3.8. The restricted fermentation was reflected in higher residual WSC levels and lower lactic acid and total VFA contents than other treatments, a result in agreement with other studies under adequate
- 119-

fermentable substrate conditions (Carpintero, Henderson and McDonald, 1979). These effects of formic acid have been attributed to a combination of its direct acid effect and its antimicrobial properties (Woolford 1984). Rapid attainment of acidic conditions retards proteolysis and respiration and in combination with the antimicrobial properties of formic acid, produces an environment less inhibitory to LAB than to undesirable micro-organisms. These characteristics weredemonstrated in this experiment, particularly by the low ammonia-N contents. Formic acid application did cause a very significant reduction in initial numbers of LAB on herbage, presumably for the reasons mentioned above. In addition, the 3 mis of formic acid (850 g/kg) applied per kg grass, although well mixed with the grass, could not have been mixed completely evenly, so that initially some micro-environments within the grass would have had greater concentrations of formic acid than others. This presumably would have further reduced LAB levels in these areas. Although LAB numbers on formic acid treated grass were lower than other treatments at day 0, their overall rate of increase between day 0 and day 3 was similar to other treatments. However even though total LAB levels had reached a plateau by day 3 a longer lag phase could have occurred in the formic acid treatment compared to other treatments in the very early stages of ensilage (within day 0 to day 3).
Ethanol levels were highest in formic acid treated silage, an effect attributed to yeast, activity by Hendersofi et al (1972) and Lindgren et al (1983). However increased ethanol could also be due to a heterolactic fermentation of glucose, although there is no evidence that growth of heterofermentative LAB are influenced positively or negatively by formic acid than homofermenters.
- 120-

Over the 45 day timecourse of the experiment, and particularly in the early stages, effluent flow rates were increased by formic acid use. This is consistent with Winters et al (1987) who showed that formic acid results in rapid lysis of cells and release of cell contents. However, extrapolating the data for effluent production (Table 36) could lead to the conclusion that if these silos had been left for 100 days or more, similar total effluent production might have occurred on all treatments. The main effect of treatment therefore would have been on the pattern of effluent release (and possibly its composition) (Woolford, 1984).Refractometer readings on the effluent showed greater loss of dissolved solids in the first 8 days with formic acid and sucrose treatments. The pH of the effluent was slightly higher than the silage, however both sets of readings seemed to have a good correlation.
With untreated silage, pH levels gradually dropped and lactic acid, acetic acid and ammonia-N values gradually increased over time to day 45. Presumably these end values would have altered slightly had fermentation been allowed continue to day 100. LAB increased rapidly and had reached a plateau by day 3.
Inoculation with L. plantarum immediately increased total LAB numbers but this did not increase the rate of pH decrease, or lactic acid, acetic acid or ethanolcontents in the absence of extra sugar. This suggestedthat there was a possible restriction to fermentation rate in both the no additive and L. plantarumtreatments associated with a limited supply of available fermentable substrate around day 3. This was confirmed by the much more rapid rate of pH decrease when sucrose alone was added. The latter was associated not with increased lactic acid or acetic acid production but with significantly lower ammonia production. When an inoculum of L. plantarum was added together with
- 121-

supplementary sucrose, pH values dropped very quickly in response to increased lactic acid production.
The responses reported here to the two rates of sucrose addition were in agreement with the findings of Ohyama, Masaki and Morichi (1973) who used a 2% glucose treatment on a low WSC crop. However, they also found an increase in lactic acid production. On the other hand Heron et al. (1988) using a high WSC crop (3.25% liquid phase) found no benefit from adding the same concentration of glucose. Anderson and Jackson. (1970) also using a grass with high WSC content found a decrease in volatile nitrogen and pH when molasses was applied at 8.7% (dry matter basis). It is known that extensive protein breakdown takes place in the very early stages of ensiling arising from the activities of plant proteases (Kemble, 1956) and subsequent amino acid degradation occurs as a result of clostridial growth (Ohshima and McDonald, 1978). It was also proposed by MacPherson (1952) that the extent of proteolysis was related to the rate of pH fall during fermentation and suggested that any treatment designed to encourage rapid acidification (as found in this experiment) would also encourage protein stability. This would explain the low ammonia-nitrogen values obtained with the formic acid and sucrose treatments. Sucrose treatment was also found to increase ethanol and acetic acid levels. Increased ethanol was also detected by Heron et al., (1988) using a grass of high WSC content.She found no increase in lactic acid when she combined glucose or xylose with L. plantarum, however increased ethanol 'was detected in the glucose treatment while increased acetic acid was found in the xylose treatment. It is possible that the increased ethanol levels were as a result of activity by heterolactic bacteria. An increased dry matter content and an increased rate of effluent flow was also found for the sucrose (8 g/kg)
- 122-

treatment. It is not known why this should be, but it may be due to the rapid acidification found for the treatment with a resultant increased rate of cell lysis.
When the inoculum was combined with sucrose (4 g/kg) it resulted in significantly lower pH and ammonia nitrogen values. It also significantly increased lactic acid and ethanol production. It has already been shown that sucrose addition brings about a reduction in pH, and ammonia nitrogen, as well as increased ethanol so those effects could be attributed to the sucrose addition. No increase was found in lactic acid production by either the separate sucrose or L. plantarum treatments, however when both treatments were combined, they increased lactic acid production. Other workers have found variable results when evaluating inoculants with or without substrate. Ohyama, Marichi and Masaki (1975) aerated silages to create difficult ensiling conditions and treated the herbage with glucose and glucose + L. plantarum. It was found that glucose by itself was not effective however when combined with L. plantarum it produced a good silage giving large amounts of lactic acid with no VFA other than acetic acid.
A similar fermentation pattern to that seen in present studies was found by Seale et aj. (1986a). In their experiment they ensiled lucerne of a low WSC content (49 g/kg DM) in test tube silos with or without either glucose or fructose and with or without one of two commercial inoculants (L. plantarum + P. acidilactici or L. plantarum only). The untreated control silage preserved badly due to a lack of sugar. A satisfactory fermentation was attained only in the silages to which sugar and an inoculant had been added. These silages, in a similar manner to this experiment had a lower pH, more protein-N, less ammonia-N. They also found a faster increase in counts of LAB, and decrease in counts of coliforms than other silages. It was proposed that if there is insufficient sugar in the original crop, then
- 123-

the bacteria in an inoculant will not be able to produce enough lactic acid to lower the pH to an acceptable level. This was illustrated in this experiment by substrate limitation in the control and Lp treatments resulting in reduced lactic acid production and a slower drop in pH. On the other hand if the crop is high in residual WSC then an inoculum of L. plantarum canproduce a rapid drop in pH and ammonia nitrogen as wellas higher lactic acid and residual WSC contents (Seale and Henderson, 1984).
A LAB isolated from a silage at Grange was investigated as an inoculant. It was isolated from an environment where considerable lactic acid fermentation had occurred. It was thought therefore that the organism if used as an inoculum might survive better than other LAB under fermentation conditions. The organisms did in fact survive well in a fermentation, however thefermentation was not a satisfactory one. The organism was subsequently identified as L. buchneri a heterofermenter. Homofermentative species, in particular L. plantarum, are more usually used as inocula as they best fulfil the required characteristics of inoculants which have been set out by Henderson (1987b). The performance of the Grange isolate as an inoculum was compared to that of a commercial inoculum containingL . plantarum.
The grass used was of a low DM (141 g/kg) content a high in vitro DMD (778 g/kg DM) and had an adequate WSC level (30 g/kg liquid phase). The untreated control and L. plantarum silages were well preserved as defined by Haigh and Parker (1985). Overall treatment with L. buchneri was found to bring about an unsatisfactory fermentation with high levels of ammonia and butyric acid produced.
- 124-

No significant differences were detected in DM, crude protein or in vitro DMD between the control and L. plantarum treatments, however L. buchneri brought about a significant reduction in DM and j_n vi tro DMD. The reduced DM and i_n vi tro DMD may be as a result of a clostridial fermentation taking place. A clostridial fermentation would result in greater DM loss (McDonald, Henderson and Ralton, 1973) as well as a reduction in in vi tro digestibility (Flynn, 1981). In addition, the increased volatile components in the silage could be lost in the oven drying process and a further reduction in the measured DM content of the silage would occur(Haigh and Hopkins, 1977). In addition a heterofermentative fermentation would result in greater CO 2 loss.
No significant differences were detected in fermentation products between the control or L. piantarum treatments. One conclusion may be that the L. piantarum treatmentdid not dominate the fermentation and that the fermentation effect could be attributed largely to the indigenous population of LAB. Alternatively, the indigenous population on the grass may have been dominated by organisms similar to L. piantarum and hence would bring about a similar fermentation pattern. These results are somewhat different to those found by Rooke et al (1988). They found using wilted grass of a high WSC content (74 g/kg liquid phase) that inoculation with L. piantarum (in laboratory silos) resulted in a more rapid fall in pH and a more rapid production of lactic acid. Inoculation also gave rise to lower final pH, ammoni’a-N and acetic acid as well as higher final WSC, lactic acid and ethanol levels.
The ratio of lactic to acetic acid suggested that thecontrol treatment gave rise to a more efficientfermentation than the L. piantarum treatment in the early stages of ensiling. It has been shown that the population of LAB change in the silo as the fermentation
- 125-
progresses with the streptococci and pediococci dominating initially to lower the pH and then the lactobacilli taking over to bring a final reduction in pH (Fenton, 1987). It may be possible that by inoculating a large population of L. piantarum onto the grass that the natural LAB may be overwhelmed and the disruption in the natural population may result in a reduction in the efficiency of the fermentation initial 1y .
Treatment with L. buchneri gave rise to an unsatisfactory fermentation particularly after 21 days. The pattern of the fermentation showed little difference from other treatments in the first 7 days. During the first 7 days very small effects of L. buchneri treatment was evident e.g. there was a slight increase in acetic acid at day 4. It may be possible that other effects were taking place but these were not detected in the analysis undertaken. Based on the results available it is not possible to deduce why no major effect was seen in the first 7 days. Inoculation with L. buchneri (at 7.7 x 10s CFU/g grass) added high numbers of bacteria and resulted in a higher count of LAB with this treatment at day 0. However, numbers were similar for all treatments at day 1. Levels of residual WSC were lower for the L. buchneri treatment throughout the fermentation, probably as a result of the increased initial numbers of the organism on the grass.
From day 7 to 28 significant changes in fermentation occurred in the L. buchneri treatment compared to other treatments. Levels of acetic and butyric acids started to rise and the rate of pH decline slowed. This would suggest that Clostridia were not inactivated at the low pH (3.9) butyric acid continued to rise throughout the fermentation and ultimately gave rise to an associated increase in pH.
- 1 2 6 -
It is not known why inoculation with a heterofermentative LAB would result in the development of a clostridial fermentation particularly as the pH had dropped to less than 4.0. It may be that the organism, a product of the organism or some component of the medium (MRS broth) inoculated with the organism may have encouraged the development of a clostridial fermentation or may have inhibited the epiphytic population (or components of that population) in the first seven days of the fermentation. The level of acidity at which clostridial activity is suppressed depends primarily on the DM content of the silage. It has been proposed by Woolford (1984) that in general terms a direct cut unwilted grass with a DM content of 200 g/kg will stabilise at a pH around 4.0. On the other hand Rogers and Whittier (1928) showed Clostridia to be inhibited at a pH of 4.2. Weiringa ( 1958) showed that Clostridium tyrobutyricum can grow in glucose broth at pH values as low as 4.1-4.2 when the water content is high as in present studies (140 g/kg DM) and salt concentration is low. Leibensperger and Pitt (1987) using data produced by Weiringa (1958) stated that the minimum pH for clostridial growth at a water activity of 0.97 is 4,0. In this experiment the dry matter content was low (140 g/kg) and any effluent produced could not leave the test tube silos so the Clostridia were not inactivated by the initial low pH in the L. buchneri treatment. Virtanen (1947) showed that drainage of effluent from the silo was of vital importance in high moisture crops. He showed that ensiling a high moisture fodder without effluent drainage resulted in a pH increase from 3.4 to4.5 wi'thin 4 months and up to 5.2 in 12 months. In a parallel experiment where effluent was allowed to drain off, the pH remained at 3.4 to 3.5 throughout the whole conservation. However effluent could not escape in the untreated and L. piantarum treatments and they maintained a low pH. Temperature was not considered to be a major determining factor as the temperature never
- 1 2 7 -

exceeded 20°C approx. It is not known if some other silage micro-organism other than clostridia might produce butyric acid and dominate the fermentation.
As L. buchneri is a heterofermentative LAB it would be expected to produce equimolar amounts of lactic acid and acetic acid and/or ethanol. If L. buchneri had dominated from the time of inoculation, increased levels of acetic acid or ethanol would have been expected, however acetic acid did not start to increase significantly until day 7. Ethanol levels were at a similar level for all treatments until day 28. This observation implies that L. buchneri did not alter the fermentation pattern markedly in the early stages of ensiling. From day 28 to 100, the pH continued to rise as did levels of butyric and acetic acids as well as ethanol. Lactic acid was virtually eliminated by day 100. The higher pH created conditions which would be more favourable for the proliferation of the proteolytic Clostridia. This group of bacteria can further breakdown proteins and amino acids into amines, amides and ammonia. This effect was seen at day 100 where increased levels of ammonia were detected.
Higher counts of LAB were also found at day 100 in the L- buchneri treatment. This might be expected since the pH of the silage was at 4.6 and more cells would be viable at this higher pH than at a lower one, as in the case of the other two treatments.
- 128-

5 GENERAL CONCLUSIONS
New information presented in this thesis clarified the choice of stomacher time and media. It also indicated that micro-aerophi1ic incubation could be used as an alternative to anaerobic incubation when enumerating LAB on grass but that with silage, micro-aerophi1ic incubation could lead to a slightly lower count. Other information showed that LAB levels detected on a range of grasses in Ireland was greater than previously reported elsewhere (Stirling and Whittenbury, 1963; Muck and O ’Connor, 1985; Fenton, 1987), that substrate availability can limit the ability of an added inoculant (L. plantarum) to make an obvious contribution to the silage fermentation pattern and that inoculation with a heterofermentative Lactobaci11 us sp. (L. buchneri)could predispose a silage to a clostridial fermentation.
The information provided in the experiments reported here improves our understanding of the ensilage process. The current studies indicated that
Where a poor fermentation occurs under Irish conditions it is unlikely to be due to a shortage of LAB in the early stages of ensilage, however the types and strains of LAB may be significant.
Added inocula have a major challenge to overcome (i.e. high indigenous LAB numbers) if they are to dominate the fermentation.
*Within the range of DM, WSC and weather conditions recorded in 1988, the LAB numbers were not found to be directly correlated with any of these variables.
- 129-

Harvesting of the grass did not increase the count of LAB when the indigenous levels on the grass were high.
Highest counts were LAB are found at the base of the plant in the dead or decaying material and were lowest on the leaf.
Of the isolates identified lactobacilli were the dominant bacteria on the grass (64%) with the leuconostocs accounting for 32% of isolates.
LAB can survive on new unused, cutting and harvesting machinery and are increased following use, particularly in the harvester chute.
The pattern of increase in numbers of LAB in the first 48 hours of ensiling is similar for test tube and farm scale silos.
The available substrate level can limit the ability of an added inoculant (L. plantarum) to make an obvious contribution to the fermentation pattern in a silage.
Added inocula may show improved fermentation when a readily utilisable form of substrate is supplied with an inoculum rather than the grass having a high WSC content.
- 130-
The research results in this thesis__have certai nimplications for recommendations for practical farm silage making and research in Ireland. as well as indicating some areas which require further research.
Further research should include
some further refinements of the methodology for counting LAB.
a more detailed study of the types of LAB found on grass.
the direct effects of relative humidity and uv light on LAB numbers as well as the indirect effects via yield, crop density, wilting rate, soil moisture and management practices.
determining exactly when added fermentable substrate is required and the concentration of substrate needed to bring about good preservation under difficult ensiling conditions.
more information is needed on the factors permitting clostridial growth and on the effects of some LAB on ensi1 age.
Among the implications for silage making in Ireland highlighted in this thesis are the following:
It has been proposed by Satter et aj_ ( 1987 ) that inoculants need to be applied at a rate which adds ten times more LAB than the number of indigenous LAB if they are to have the desired effect. If this is the case then most inoculants used in Ireland need greater bacterial numbers (or more aggressive/ active bacteria) and an improved viability or shelf 1 ife.
- 131-

bacterial inoculants will frequently need a source of added fermentable carbohydrate if they are to have a noticeable effect on fermentation products.
formic acid can significantly increase the effluent flow rate in the initial stages of ensilage.
silages which reach a pH of around 4.0 in the early stages of ensilage can, under unusual conditions, still undergo a bad fermentation with high levels of butyric acid and ammonia produced.
- 132-

BIBLIOGRAPHY
Allen, L.A., Harrison, J., Watson S.J., and Ferguson, W.S. (1937*).
A study of the chemical and bacteriological changes occurring in grass silage.Journal of Agricultural Science (Cambridge), 27. : 271-293.
Allen, L.A., Watson, S.J., and Ferguson, W.S. ( 19 3 7b ).The effects of the addition of various materials and bacterial cultures to grass silage at the time of making and subsequent bacterial and chemical changes.Journal of Agricultural Science (Cambridge), 27. : 294-303.
Alexander, R. H., and McGowan, M. (1961).A filtration procedure for the i_n vi tro determination of digestibility of herbage. Journal of British Grassland Society, 16. :275-276.
Anderson, B. K. and Jackson, N. (1970).Conservation of wilted and unwilted grass ensiled in air-tight metal containers with and without the addition of molasses.Journal of the Science of Food and Agriculture, 21 : 335-341.
A.O.A.C. (1980).Official Methods of analysis of the A.O.A.C., 13th ed., A.O.A.C., Arlington, VirginiA, U.S.A.
- 133-

Axe 1sson, J . ( 1952).Use of molasses, grains and other additives in making grass silage.Proceedings of the 6th International Grassland Congress, Pennsylvania State College, pp 1153 - 1158.
Barry, T. N., Cook, J.E., and Wilkins, R. J. (1978).The influence of formic acid and formaldehyde additives and type of harvesting machine on the utilisation of nitrogen in lucerne silages.1. The voluntary intake and nitrogen retention of young sheep consuming the silages with and without intraperitoneal supplements of DL- methionine.Journal of Agricultural Science, Cambridge, £1 : 701-715.
Beck, T.H. (1972).The quantitative and qualitative composition of the lactic acid bacterial population of silage. Landwirtschaftliche Forschung, 27.: 55-63.
Birky K.M. and Preece T.F. (1987).The ligules of green leaves of cocksfoot grass, Dactyl is glomerata L., are amicro-habitant for bacteria and fungi.Journal of Applied Bacteriology, 63. : 505-51 1.
Bryan-Jones, D. G. (1960).Some aspects of the microbiology of silage. Ph.D Thesis : University of Edinburgh.
Buchanan, R.E. and Gibbons, N.E. (1974).Bergeys Manual of Determinative Bacteriology, Williams and Wilkins Co., Baltimore.
- 134-

Budzier, H.H. ( 19 6 7 a ).Microbiological investigations on the question of ensilage of fodder material.Zentralblatt fur Bakteriologie, Parasitenkunde, Infektions krankheiten und Hygiene (Abteilung II), J_21 : 1-17
Budzier, H.H. ( 1967b ) .Microbiological investigations on the question of ensilage of fodder materials.Zentralblatt fur Bakteriologie, Parasitenkunde, Infektionskrankheiten and Hygiene (Abteilung II), 121: 250-268.
Byrne, E . (1979).Chemical Analysis of Agricultural Materials. Methods used at Johnstown Castle Research Centre.An Foras Taluntis, Dublin.
Carlile, F. S . (1984).Techniques for the isolation and identification of lactic acid bacteria and Clostridia in si 1 age.Paper No. 33 presented at the Seventh Silage Conference, Queens University of Belfast, Sept. 1984.
Carpintero, C.M., Henderson, A .R . and McDonald, P. (1979).The effect of some pre-treatments on proteolysis during the ensiling of herbage.
' Grass and Forage Science, 34: 311-315.
- 135-

Castle, M.E. and Watson, J. N. (1970).Silage and milk production : a comparison between wilted and unwilted grass silages made with and without formic acid.Journal of the British Grassland Society, 25 :278-284.
Chamberlain, D.G., (1988).Effect of added glucose and xylose on the fermentation of perennial ryegrass silage inoculated with Lactobaci11 us plantarum.Journal of the Science of Food and Agriculture, 46 : 129-138.
Chamberlain, D. G . , Thomas, P. C. and Robertson, S.( 1987 ) .The effects of formic acid, bacterial inoculant and enzyme additives on feed intake and milk production in cows given silage of high or moderate digestibility with two levels of supplementary concentrates.Eight Silage Conference held at I.G.A.P., Hurley, England. Paper 16, p 31-32.
Chamberlain, D. G. and Quig, J. (1987).The effects of the rate of addition of formic acid and sulphuric acid on the ensilage of perennial ryegrass in laboratory silos.Journal of the Science of Food and Agriculture, 38 : 217-228.
Christensen, M.D., Albury, M.N. and Pederson, C.S. (1958).Variation in the acetic-1actic acid ratio among the lactic acid bacteria.Applied and Environmental Microbiology, 42 : 878-885.
- 136-
C o l l i n s , C
Conn, H.
D a s h , S .K
De Man, J
De M a n , J
De Vuyst,
D e x t e r , S
. H. an d L y n e , P. M. (1985).
M i c r o b i o l o g i c a l m e t h o d s 5th e d t .
P u b l i s h e d by fiutterworth a n d Co. Ltd., 1985.
J., B a r t h o l e m e w , J. W. a n d J e n n i s o n , M. W.
(1954 ) .
S t a i n i n g m e t h o d s in the M a n u a l of M e t h o d s of
P u r e C u l t u r e .
S t u d y of B a c t e r i a . N e w Y o r k : B i o t e c h
P u b l i c a t i o n s l e a f l e t IV.
. a n d V o e l k e r , H.Ei. (1971).
E f f e c t s of d r i e d w h e y on a l f a l f a - b r o m e
h a y l a g e p r e s e r v a t i o n a n d f e e d i n g value.
J o u r n a l of D a i r y S c i e n c e , 54_: 8 0 4- 80 5.
.C. (1952 ) .
I n f l u e n c e of c r u s h i n g on the p H of g r a s s
s i l a g e .
N a t u r e , L o nd on , 1 6 9 . 246.
.C., R o g o s a , M. a n d S h a r p e , M.E. (1960).
A m e d i u m for th e c u l t i v a t i o n of the
l a c t o b a c i l l i .
J o u r n a l of A p p l i e d B a c t e r i o l o g y , 2_3_: 130.
A., V a n b e l l e , M . A r n o u l d , R., M a e s m a n s , A.
B e r v a c k , W., an d M o r e e l s , A. (1965).
A r e a n t i b i o t i c s p r o f i t a b l e as s i l a g e a d d i t i v e s ?
1. T h e v a l u e of n i s i n as a p r e s e r v a t i v e .
A g r i c u l t u r a , L o u v a i n , L3 : 3-23.
. T. (1957 ) .
Th e u s e of a n t i b i o t i c s in the m a k i n g of si la ge .
A g r o n o m y J o u r n a l , 4_9 : 4 8 3 - 4 8 5 .
- 1 3 7 -

Dexter, S.
Di ckenson,
Done, D.L.
Edwards,
Farragher,
Fenton, M.
Flynn, A.
T. ( 1 9 6 6 ) .Gas evolution from silage as a diagnostic toolfor chemical reaction and energy losses.Agronomy Journal, 58: 383-387.
C.H., Austin B. and Goodfellow, M. (1975). Quantitative and qualitative studies ofPhylloplane bacteria from Lolium perenne. Journal of General Microbiology, 91: 157-166.
, (1986).Silage inoculants - A review of experimental work.Research and Development in Agriculture, 3:83-87.
!.A . and M cDonald, P. ( 1978).In ’Fermentation of Silage - a Review’. (M.E.M cCullough, ed.)National Feed Ingredients Association, Iowa.
M. A. (1972).Common Irish grasses-identification of thevegetative phase.Department of Agriculture and Fisheries Journal Vo 1. LXIX 1972.
P. (1987),An investigation into the sources of lactic acid bacteria in grass silage.Journal of Applied Bacteriology, 62: 181-188.
V. (1981).Factors affecting the feeding value of silage. Recent advances in Animal Nutrition.Eds. Haresign, W. and Lewis, D. P.
- 138-

Gibson, T.
Gibson, T.
Goldberg,
Gordon, F .
Greenhi11,
Haigh, P.
, Stirling, A.C., Keddie, R.M. and Rosenberger, R.F. (1958).Bacteriological changes in silage made at controlled temperatures.Journal General Microbiology, J_9: 112-129.
, Stirling, A.C., Keddie, R.M. andRosenberger, R.F. (1961).Bacteriological changes in silage as affected by laceration of the fresh grass.Journal of Applied Bacteriology, 24: 60-70.
H. E. (1965).Principles of refractometry.Published by the American Optical Company. Instruments division, Buffalo, U.S.A.
J. (1987).An evaluation of an inoculant as an additive for grass silage being offered to dairy cattle. Proceedings of the Eight Silage Conference held at the Institute for Grassland and Animal Production, Hurley, 19-20, September 1987.
W.L. (1964).Plant juices in relation to silage fermentation. The role of the juice.Journal of the British Grassland Society, 19: 30-37.
M. and Hopkins, J. R. (1977).Relationship between oven and toluene dry matter in grass silage.Journal of the Science of Food and Agriculture 28 : 477-480.
- 139-

Haigh, P.
Haigh, P.
Haigh, P.
Harri gan,
Henderson
Henderson
M. and Parker, J. W. G. (1985).Effect of silage additives and wilting on silage fermentation, digestibility and intake, and on liveweight change of young cattle.Grass and Forage Science, 40 : 429-436.
1. ( 1987).The effect of dry matter content and silageadditives on the fermentation of grass silage on commercial farms.Grass and Forage Science, 42: 1-8.
I., Appleton, M. and Clench, S.F. (1987).Effect of commercial inoculant and formic acid± formalin silage additives on silagefermentation and intake and on liveweight change of young cattle.Grass and Forage Science, 42: 405-410.
W. F. and McCance, M. E. (1984).Laboratory methods in food and dairymi crobi ology.Academic Press Inc. (London) Ltd.
A .R . ( 1987a ).Grass silage in U.K. Agriculture.Journal of the Science of Food and Agriculture, 39: 2 2 1 - 2 2 2 .
A .R . ( 1987b ) .Silage Making: Biotechnology on the Farm.Outlook on Agriculture, 1_6: 89-94.
- 140-

Henderson
Henderson
Henderson
Henderson
Hensel, R
, A.R. and M cDonald, P. (1977).The effects of cellulase preparations on the chemical changes during the ensilage of grass in laboratory silos.Journal of the Science of Food and Agriculture, 28: 486-490.
, A.R., M cDonald, P. and Woolford, M.K. (1972). Chemical changes and losses during the ensilage of wilted grass treated with formic acid. Journal of the Science of Food and Agriculture, 23: 1079-1087.
, A. R., McGinn, R. and Kerr, W. D. (1987).The effect of a cellulase preparation applied with or without an inoculum of LAB on the chemical composition of lucerne ensiled in 1aboratory si 1 o s .Paper No. 15 presented to the Eight Silage Conference, I.G.A.P., Hurley, U. K.
, A. R . , Seale, D. R., Anderson, D. H., Heron, SJE. (1986).The effect of bacterial inoculants on the fermentation and nutritive value of perennial ryegrass silages.Proceedings of the Eurobac Conference (in press).
,, Mayr, U., Stetter, K. 0., and Kandler, 0. ( 1977 ) .Comparative studies of lactic aciddehydrogenases in lactic acid bacteria.Archives of Microbiology, 112 : 81-93.
- 141-

Heron, S
Isaac, R
Jackson,
Jackson,
Kandler,
Kemble,
Kempton,
.J.E., Edwards, R .A . and McDonald, P. (1988).The effects of inoculation, addition of glucose and mincing on fermentation and proteolysis in ryegrass ensiled in laboratory silos.Animal feed Science and Technology, 19: 85-96.
A. and Jones, J. B. Jr. (1972).Communications in Soil Science and Plant Analysi s 3 : 261.
N. (1968).The conservation of herbage of four different dry matter levels in sealed polythene contai ners.Records of Agricultural Research, 12: 181-188.
N. and Forbes, T.J. (1970).The voluntary intake by cattle of four silages differing in dry matter content.Animal Production, 1_2: 591-599.
0. and Weiss, N. (1986).Bergey’s Manual of Systematic Bacteriology.Vol. 2 Williams and Wilkins Co. Baltimore.
R. ( 1956).Studies on the nitrogen metabolism of the ensilage process.Journal of the Science of Food and Agriculture, I : 125-130.
A. G. and San Clemente, C. L. (1959).Chemistry and microbiology of forage - crop si 1 age.Applied Microbiology, 7 : 362-367.
- 142-
Kibe, K. and Kagura, S. (1976).Distribution of volatile componants of grass si 1 age.Journal of the Science of Food and Agriculture, 27,: 726-732.
Koch, G . , Moruarid, A., and Kirchgessner, M. (1973).The influence of micro-organisms of corn on the stability of silage.Das Wi rtschaftseigene Futter, J_9, 15-20.
Kroulik, J.T., Burkey, L.A. and Wiseman, H.G. (1955)®.The microbial populations of the green plant and of the cut forage prior to ensiling.Journal of Dairy Science, 38: 256-262.
Kroulik, J.T., Burkey, L.A., Gordon, C.H., Wiseman, H.G. and Melin, C.G. (1955)b.Microbial activities in alfalfa and orchard grass ensiled under certain conditions in experimental silos.Journal of Dairy Science, 38: 263-272.
Langston, C.W. and Bouma, C. (1960).Types and sequence change of bacteria in Orchardgrass and alfalfa silages.Journal of Dairy Science, 4̂ 3: 1575-1584.
Langston, C.W., Bouma, C. and Conner, R.M. (1962).Chemical and bacteriological changes in grass silage during the early stages of fermentation. 2 Bacteriological changes.Journal of Dairy Science, 45: 618-624.
Leatherwood, J.M., Mochrie, R.D., and Thomas, W.E. (1959) Chemical changes produced by a cellulolytic preparation added to silages.Journal of Animal Science, J_8: 1539.
- 143-

Leatherwood, J.M., Mochrie, R.D., Stone, E.J. and Thomas, W.E. (1963).Cellulose degradation by enzymes added to ensiled forages.Journal of Dairy Science, 46: 124-127.
Leibensperger, R. Y. and Pitt, R. E. (1987).A model of Clostridial dominance in ensilage. Grass and Forage Science, 42 : 297-317.
Lindgren, S., Lingvall, P., Kaspersson, A., deKartzow, A., and Rydberg, E. (1983).Effect of inoculants, grain and formic acid on silage fermentation.Swedish Journal of Agricultural Research, 13: 91-100.
Lindgren S. (1984).Silage inoculation. In Seventh Silage Conference Belfast : The Queen’s University.
MacPherson, H. T. (1952).Changes in nitrogen distribution in crop conservation.Journal of the Science of Food and Agriculture,3 : 362-367.
Martos, V . F . (1941).The lactate-fermenting anaerobic andfacultative organisms in silage.Journal of Bacteriology, 42 : 140-141.
- 144-
M cDonald,
M cDonald,
M cDonald,
M cDonald,
M cDona1d,
M cDonald.
P. (1976).Trends in silage making. In : Microbiology in Agriculture, Fisheries and Food.(Skinner, F. A. and Carr, J. E. (eds)).Society applied bacteriology, Symposium series, No. 4, pp 109-123, Academic Press, London and New York.
P. (1981).The Biochemistry of Silage,Published by John Wiley & Sons Ltd.
P., Henderson, A.R. and Ralton, I. (1973). Energy changes during ensilage.Journal of the Science of Food and Agriculture, 24: 827-834.
P., Stirling, A.C., Henderson, A.R., Dewar, W.A., Stark, G.H,, Davie, W.G., Macpherson,H. T., Reid, A.M. and Slater, J. (1960). Studies on ensilage.Edinburgh School Agriculture Technical Bulletin, 1960, No 24, p 83.
P., Stirling, A. C . , Henderson, A. R . , and Whittenbury, R. (1964).Fermentation studies on inoculated herbages. Journal of the Science of food and Agriculture 15 : 429-436.
P., Watson. S.J. and Whittenbury, R. (1966).The principles of ensilage.Z. Tierphysiol. Tierernahr, Futtermittelk, 21:103-110.
- 145-

M cDonald,
M cKenzie,
Merry, R.
Meynel1,
Mi skovi c ,
Moon, N .J
«
Muck, R.
P. and Whittenbury, R. (1973).’The ensilage process’ in Chemistry and biochemistry of herbage.Academic Press. Inc. 3: 33-60.
D.J. and Wylam, C.B. (1957).Analytical studies on the carbohydrate composition during the growth of perenial ryegrass.Journal of the Science of Food and Agriculture, 8: 38-45.
J. and Braithwaite G. D. (1987).The effect of enzymes and inoculants on the chemical and microbiological composition of grass and legume silages.Paper No. 14 presented to the Eight Silage Conference I.G.A.P., Hurley, U. K.
C. G. and Meynell, E. (1970).Theory and practice in experimental bacteriology. Cambridge University Press, Cambri dge.
K. and Rasovic, B. (1972).Sauremena poljoprivreda, 20 : 45-54.
. and Henk, W.G. (1980).Progression of epiphytic microflora in wheat, corn and alfalfa silages as observed by scanning electron microscopy.Applied and Environmental Microbiology, 40, 1122-1129.
E. (1989).Initial bacterial numbers on lucerne prior to ensi1i ng.Grass and Forage Science, 44 : 19-25.
- 146-

Muck, R.
Muck, R.
Muck, R.
Mundt, J
Murphy,
Nev+ns,
E. (1987).Factors affecting numbers of Lactic Acid Bacteria on Lucerne prior to ensiling 8th Silage Conference, Hurley, Summary of pages, 3-4.
E. and O ’Connor, P.L. (1985).Initial Bacterial numbers on alfalfa prior to ensi1ing.Paper no. 85-1538 at the Winter meeting of the American Society of Agricultural Engineers, December 17-20, 1985.
E. and Speckhard, M. W. (1984).Moisture levels effects on alfalfa silage quali ty.Paper number 84-1532 at the Winter meeting of the American Society of Agricultural Engineers. December 11-14, 1984.
.0. (1970).Lactic acid bacteria associated with raw plant food material.Journal of Milk Food Technology, 33: 550-553.
J. J. (1981).A comparison of additives for silage for dairy cows.Irish Journal of Agricultural Research, 25 :1- 1 0 .
W.B. and Kuhlman, A .F . (1936).Alfalfa silage.Journal of Dairy Science, J_9: 611-617.
- 147-

Muck, R. E. (1987).Factors affecting numbers of Lactic Acid Bacteria on Lucerne prior to ensiling 8th Silage Conference, Hurley, Summary of pages, 3-4.
Muck, R.E. and O ’Connor, P.L. (1985).Initial Bacterial numbers on alfalfa prior to ensiling.Paper no. 85-1538 at the Winter meeting of the American Society of Agricultural Engineers, December 17-20, 1985.
Muck, R. E. and Speckhard, M. W. (1984).Moisture levels effects on alfalfa silage quali ty.Paper number 84-1532 at the Winter meeting of the American Society of Agricultural Engineers. December 11-14, 1984.
Mundt, J.O. ( 1 9 7 0 ) .Lactic acid bacteria associated with raw plant food material.Journal of Milk Food Technology, 33: 5 5 0 - 5 5 3 .
Murphy, J . J . ( 1 9 8 1 ) .A comparison of additives for silage for dairy cows.Irish Journal of Agricultural Research, 25 :1- 1 0 .
Nevins, W.B. and Kuhlman, A.F. ( 1 9 3 6 ) .Alfalfa silage.Journal of Dairy Science, 1_9: 6 1 1 - 6 1 7 .
- 147-

Ni1sson,
Ohshi ma,
Ohyama, Y
Ohyama, Y
O ’Keeffe,
O ’Kiely,
3. and Nilsson, P.E. (1956).The microflora on the surface of some fodder plants at different stages of maturity.Archiv fur Mikrobiologie, 24; 412-422.
v|. , and M cDonald, P. ( 1978).A review of the changes in nitrogenous compounds of herbage during ensilage.Journal of the Science of Food and Agriculture, 29 : 497-505.
., Masaki, S., and Morichi, T. (1973).Effects of temperature and glucose addition on the process of silage fermentation.Japanese Journal of Zootech. Science, 44 :59-67.
., Morichi, T., and Masaki, S. (1975).The effect of inoculation with Lactobaci11 us plantarum and addition of glucose at ensiling on the quality of aerated silages.Journal of the Science of Food and Agriculture, 26 : 1001-1008.
M. and Sherrington, J. (1983).Comparison of three methods for thedetermination of urea in compound feed andsi 1 age.Analyst 108 : 1374.
3. (1984).Silage in Ireland.From ’Papers and Proceedings of a joint Agricultural and Hydrogeological meeting inIreland.Published by Irish National Committee of the International Hydrogeological Programme, P. 87-122, June, 1984.
- 148-

O ’Kiely, P., Flynn, A.V. and Wilson, R.K. (1986).Predicting the requirement of silage for preservati ve.Farm and Food Research, J_7_: 42-44.
O ’Kiely, P. and Flynn, A.V. (1987).’Grass Silage’ in Beef Series No. 5, published by An Foras Taluntais, Dublin.
O ’Kiely, P. (1988).New silage research - experiments on molasses. Farm and Food Research, Published by An Foras Taluntais, J_9 : 8-10.
O ’Kiely, P. and Flynn, A. V. (1988).Comparison of formic acid and a mixture of formic acid and formaldehyde as preservatives for silage for beef cattle.Irish Journal of Agricultural Research, 27. :1 1 1 - 1 2 2 .
O ’Kiely, P. (1989).Review of factors affecting the silage fermentati o n .Irish Grassland and Animal Production Association Journal 23 : (in press).
0 ’ Kiely, P. and Flynn, A. V., and Poole, D.B.R. (1989a). Sulphuric Acid as a Silage Preservative.1. Silage preservation, animal performance and copper status.Irish Journal of Agricultural Research, 28 : 1-9.
Orla-Jensen, S. (1919).The Lactic Acid Bacteria.Copenhagen: Andreas, Fred, Host, 196 pp.
- 149-

Pahlow, G. (1989).Ecological studies of epiphytic lactic acidbacteria (LAB) on whole plant maize and ininoculated silage.Proceedings of the Second Forage Symposium,Pioneer Hi-Bred International, Inc.Microbial Genetics Division, May 23-25, 1989.
Pahlow, G. and B. Dinter, (1987).Epiphytic Lactic Acid Bacteria of forages : methods of evaluation and first results. 8th Silage Conference, Hurley, Summary of pages,1- 2 .
Parker, R . B . (1978).Methodology for Determining Quality of Silage. Published by the National Feed Ingredients Association. West Des Moines, Iowa, U.S.A.
Pitt, R.E., Muck, R.E. and Leibensperger, R.Y. (1985).A quantitative model of the ensilage process in lactate silages.Grass and Forage Science, 40: 279-303.
Rauramaa, A., Setala, J., Moisio, T., Sivela, S. Heikkila, T. and Lampila, M. (1987).The effect of inoculants and cellulase on the fermentation and microbiological composition of grass silage.II Microbiological changes in the silages. Journal of Agricultural Science in Finland, 59: 371-377.
Rogers, L. A. and Whittier, E. O. (1928).Limiting factor in the lactic fermentation. Journal of Bacteriology, J_6 : 21 1-229.
- 150-

Rogosa,
Rogosa,
Rooke, J
Rooke, J
Rydin, C
Satter,
“1. and Mitchell, J.A. and Wiseman, R.F. (1951).A Selective Medium for the Isolation andenumeration of oral and fecal Lactobacilli. Journal of Bacteriology, 62: 132-133.
A. and Sharpe, E. (1959).An Approach to the Classification of theLactobaci11i.Journal of Applied Bacteriology, 22: 329-340.
.A. and Armstrong, D.G. (1987).Recent developments in silage additives.Journal of the Science of Food and Agriculture, 39: 225-226.
. A., Maya, F. M . , Arnold, J. A., and Armstrong, D. G. (1988).The chemical composition and nutritive value of grass silages prepared with no additive or with the application of additives containing either L. piantarum or formic acid.Grass and Forage Science, 43 : 87-95.
. Nilsson, R. and Toth, L. (1956).Studies on fermentation processes in silage. The effect of various carbohydrates as supplements.Archiv fur Mikrobiologie, 23: 376-384.
D., Woodford, J. A., Jones, B. A., and Muck, R. E. (1987).Effect of bacterial inoculants on silage quality and animal performance.Eight Silage Conference held at IGAP, Hurley, Engl and.Paper 11, p 21-22.
- 151-

Saue, 0. and Breirem, K. (1969).Formic acid as a silage additive.Proceedings of the 3rd General Meeting of the European Grassland Federation, Braunschweig, pp 161-172.
Schleifer, K. H. (1986).In : Bergeys Manual of Systematic Bacteriology Vol. 2, p 999.Williams and Wilkins Co., Baltimore.
Schukking, S. (1976).The History of Silage making.Stikstof, 19: 2-11.
Seale, D.R. (1986).Bacterial Inoculants as Silage Additives. Journal of Applied Bacteriology Symposium Supplement, 9S-26S.
Seale, D.R., Henderson, A.R., Pettersson, K.O. and Lowe, J.F. (1986a).
The effect of addition of sugar and inoculation with two commercial inoculants on the fermentation of lucerne silage in laboratory silos .
Grass and Forage Science, 41_: 61-70.
Seale, D. R., Pahlow, G . , Spoelstra, S. F., Lindgren, S., Dellaglio, F., and Lowe, J. F. (1986b).Methods for the Microbiological analysis of silages.Proceedings of the Eurobac conference 1986 (in press).
- 152-

Seale, D.
Seale, D.
Seale, D.
Silley, P
Snedecor,
R., Quinn, C.M., Whittaker, P.A. and Wilson, R.K. (1981).Microbiological and chemical changes during the first 22 days of ensilage of different grasses. Irish Journal Agricultural Research, 20: 61-70.
R., Quinn, C.M., Whittaker, P.A., Wilson, R.K. (1982).The microbiological and chemical changes during the ensilage of long, chopped and minced grass. Irish Journal of Agricultural Research, 21 : 147-158.
R. and Henderson, A. R. (1984).Effect of Inoculation with Homofermentative and Heterfermentative Lactic Acid Bacteria onSilage Fermentation.Paper Number 2.Seventh Silage Conference.Summary of papers at The Queens University of Belfast, 1984.
. and Damoglou, A.P. (1985).The effect of three commercial silage additives on numbers of Lactobacilli entering the silo at the onset of fermentation.FEMS Microbiology Letters, 30: 107-110.
G. W. and Cochran, W. G. (1962).Statistical Methods Applied to Experiments in Agriculture and Biology.Published by Iowa State University Press Ames, Iowa, U.S.A.
- 153-

Sperber,
Stewart,
Sti r1i ng,
Sti r1i ng,
Thornhi11
Thranl, P.
M. H . and Swan, J. (1976).Hot loop test for the determination of carbon dioxide production from glucose by lactic acid bacteri a.Applied and Environmental Microbiology, 3J_ :990-991 .
T.A. and Kennedy, S.J. (1984).A comparison of 3 inoculants and formic acid as additives on ’easy to ensile’ first cut grass. Reports on Silage Additive Inoculant Trial - 1, 1984. Greenmount Agricultural and Horticultural College, Antrim, Northern Ireland.
A .C . (1953).Lactobacilli and silage-making.Proceedings of the Society for Applied Bacteriology, J_6: 27-29.
A.C. and Whittenbury, R. (1963).Sources of lactic acid bacteria occurring in si 1 age.Journal of Applied Bacteriology, 26: 86-92.
, P. J. and Cogan, T. M. (1984).Use of gas liquid chromatography to determine the end products of growth of lactic acid bacteri a .Applied and Environmental Microbiology, 47. :1250-1254.
, and Broekhuizen, S. (1965).Agro-ecological Atlas of cereal growing in Europe. Vol 1 - Agro-dimatic Atlas of europe.
- 154-

Tilley, J
V i rtanen,
Vi rtanen,
Watson, S
Wei nberg,
Weise, F.
Weise, F.
. M. A. and Terry, R. A. (1963).A two-stage technique for the j_n vi tro digestion of forage crops.Journal of the British Grassland Society, 18 :104-111.
A.I. (1933).The A.I.V. method of processing fresh fodder. Empire Journal of Experimental Agriculture, 1: 143-155.
A. I. (1947).Silage by the AIV method.Economic Proceedings of the Royal Dublin Society, 3 : 311-342.
.J. and Nash, M.J. (1960).The Conservation of Grass and Forage Crops. Edinburgh: Oliver and Boyd, 758 pp.
Z.G. Ashbell, G. and Azrieli, A. (1988).The effect of applying lactic bacteria at ensilage on the chemical and microbiological composition of vetch, wheat, and alfalfa si 1 ages.Journal of Applied Bacteriology, 64: 1-7.
( 1967 ) .(The action of feed quality sugar as a safety additive for grass silage).Landwirtschaft1iche Forschung, 20: 171-184.
( 1969).The influence of initial plant microbial populations on the course of fermentation. Proceedings of the 3rd General Meeting of the European Grassland Federation, Braunschweig, p 221-227.
- 155-
Weise, F. (1973).Acid production potential and Economy of sugar utilisation by Lactobacilli.Landbauforschung Volkenrode, 23: 71-77.
Weise, F. and Wermke, M. (1973).The effect of weather on the epiphytic micro-organisms of smooth stalked meadow fescue (Poa pratense L.)Das Wi rtschaftseigene Futter, 1_9: 290-299.
Wheeler, B., Wilson, R.K. and Flynn, A.V. (1983).Chemical composition of Irish farm silage.Irish Journal of Agricultural Research, 22: 149-160.
Whittenbury, R., M cDonald, P. and Bryan-Jones, D.G. ( 1967).A short review of some biochemical and microbiological aspects of ensilage.Journal of the Science of Food and Agriculture, 18: 441-444.
Wieringa, G.W. (1958).The effect of wilting on butyric acid fermentation in silage.Netherlands Journal of Agricultural Science, 6: 204-210.
Wieringa, G. W. (1969).Influence of moisture and nutrient content of
' forage plants on fermentation processes.Proceedings of 3rd General Meeting of European Grassland Federation, Braunschweig, p. 133-137.
- 156-

Wi1ki ns,
Wi1ki nson
Willi ams,
Wi1 son, R
Wilson, R
Wilson, R
.J., Wilson, R.F. and Woolford, M.K. (1974).The effect of formaldehyde on the silage fermentation. Vaxtodling, 29.Proceedings of the 5th General Meeting of the European Grassland Federation, Uppsala, pp 197-201.
M. (1988).Si 1 age U.K.Chalcombe Publications, Marlow, U.K.
R.A.D., and Shah, H. N. (1986)."Enzyme patterns in classification" in Impact of Modern Methods on Classification and Identification.Society for Applied Bacteriology Symposium series No. 8.
F. and Wilkins, R. J. (1973).Formic acid as a silage additive for wet crops of cocksfoot and lucerne.Journal of Agricultural Science, Cambridge, 80 : 225-231.
F. and Wilkins, R. J. (1980).The effect of mixtures of formalin and acid on silage fermentation.Proceedings of the 13th International Grassland Congress, Leipzig, pp 1289-1292.
K. (1970).A TLC method for the determination of lactic acid in silage.Irish Journal of Agricultural Research, 9 :276-277 .
- 157-

Wi1 son,
Wilson, R
Wilson, R
Wi nters,
Wool ford,
!. K. ( 1978).Estimation of water soluble and individual carbohydrates in grass samples.Proceedings Euroanalysis, Dublin, Ireland. 3 : 46.
. K. (1989).Analytical Results for Irish Farm Silages 1985-1988.Irish Journal of Agricultural Research, 28 :106.
. K. and Flynn, A. V. (1979).Effects of fertiliser N, wilting and delayed sealing on the chemical composition of grass silages made in laboratory silos.Irish Journal of Agricultural Research, J_8 : 13-23.
A. L., Whittaker, P. A. and Wilson, R. K. ( 1987 ).Microscopic and chemical changes during the first 22 days in Italian ryegrass and cocksfoot silages made in laboratory silos.Grass and Forage Science, 42 : 191-196.
M.K. (1975a).Microbiological screening of foodpreservatives, cold sterilants and specific antimicrobial agents as potential silage additives.Journal of the Science of Food and Agriculture, 26: 229-237.
- 158-

Wool ford,
Wool ford,
Wool ford,
Wool ford,
Wool ford,
Zimmer, E
M. K. (1975b).Microbiological screening of the straight chain fatty acids (Ci - C 1 2 ) as potential silages addi ti ves.Journal of the Science of Food and Agriculture, 26 : 219-228.
M.K. (1976).A preliminary investigation into the role of yeasts in the ensiling process.Journal of Appplied Bacteriology, 4J_: 29-36.
M.K. (1977).Studies on the significance of three Baci11 us species to the ensiling process.Journal of Applied Bacteriology, 43: 447-452.
M.K. (1984).’The Silage Fermentation’, Microbiology series; Volume 14.Marcel Dekker, INC. New York and Basle.
M. K. and Swwczyc, M. K. (1984a).An investigation into the effect of cultures of lactic acid bacteria on fermentation in silage.1. Strain selection.Grass and Forage Science, 39 : 139-148.
. (1964).Cereal grist and malt as additives in silage maki n g .Das Wirtschaftseigene Futter, 10: 257-261.
- 159-

160
APPENDIX TABLE NO.Al Meteorological conditions in Ireland and N.W. Europe during the sunnier months (20 year averages)
AVERAGE MONTHLY AIR TEMPERATURE(C) AVERAGE MONTHLY RELATIVE HUMIDITY
May June July
Location
Mallin Head 9.6 11.8 13.9Claremorris 10.5 12.7 14.3Valentia Observatory 11.3 13.5 15.0Birr 10.6 13.6 15.4Dublin Airport 11.6 14.2 15.8Belfast Airport 10.6 13.2 14.9
Edinburgh 9.4 12.3 14.3London Airport 12.6 15.3 17.2
Cherbourg 10.8 12.8 15.4Limoges 13.4 17.0 19.3
Oslo 10.5 15.6 17.3Stockholm 8.8 14.1 16.8Helsinki 8.2 13.0 16.8Copenhagen 10.4 14.7 16.7Dunkerque 12.1 14.8 16.9Zurich 13.2 15.9 17.6Hamburg 12.3 15.4 17.1Munich 12.9 15.9 17.8
(AS MEASURED AT 2.00 P.M.)Aug. Sept. May June July Aug. Sepl
13.7 12.4 84 84 85 85 8414.1 12.2 76 78 81 81 7815.1 13.5 74 77 79 80 7914.6 12.7 6B 70 75 75 8015.3 13.3 « —
14.5 12.4 68 74 77 77 77
13.9 11.9 81 80 82 84 8316.8 14.2 57 57 55 58 -
15.2 13.6 74 75 75 75 7519.1 16.1 60 60 - 54 61
15.5 11.3 51 54 57 61 6515.2 11.7 54 55 59 64 6815.0 10.6 62 60 63 69 7215.5 12.9 60 61 63 6717.2 15.2 74 74 73 72 7317.0 13.8 56 — « 56 59 6416.2 13.6 55 56 65 67 6819.1 13.5 53 54 53 55 60

APPENDIX TABLE No. A?
AVERAGE MONTHLY PRECIPITATION (rwn) AVERAGE NO. OF DAYS WITH PRECIPITATION (=s 0.1 mm EXCEPT FOR* WHERE > 0.3 wn)
•
May June July Aug. Sept. May June July Aug. Sept.
Location
Mallin Head 67 73 94 97 99 * 18 17 20 22 18Claremorris 63 85 105 112 110 * 18 17 21 21 20Valentia Observatory 80 80 107 115 108 * 18 16 21 22 19Birr 63 68 85 88 80Dublin Airport 67 50 70 75 70 _
Belfast Airport 63 60 84 86 82 * 15 19 19 20 21
Edinburgh 92 91 113 129 125 * 15 15 17 17 16London Airport 44 38 57 54 43 * 13 11 13 13 13Cherbourg 49 45 47 79 74 13 8 11 14 13Li noges 69 72 61 70 67 14 10 12 13 11Oslo 45 60 72 95 63Stockholm 41 47 70 80 53Helsinki 48 50 57 82 70 _
Copenhagen 37 43 59 71 45 11 11 13 16 14Dunkerque 58 61 50 71 64 12 10 11 10 13Zurich 92 110 110 108 88 * 18 14 13 12 11Hamburg 54 66 85 87 61 15 15 17 18 15Munich 93 117 128 102 89 17«
17 17 17 15
Agro-ecological Atlas of Cereal Growing in Europe
Volume 1 - Agro-climatic Atlas of Europe - Thram, P and Broekhuizen, S. (1965)

APPENDIX TABLE B1 (expt. 3.3)
GRASS COMPOSITION
DRY MATTER (g/kg) 143.5149145.5150.5154.5
MEAN IASASH (g/kg DM) 91
9293 9387
MEAN 91CRUDE PROTEIN (g/kg DM) 166
161169159152
MEAN J_61± 0 vitro D.M.D. (g/kg DM) 743
756767754754
MEAN 755WSC (g/kg liquid phase) 18
21311821
MEAN 22
9
S.D.
1 .93
1.11
2.94
3.81
2.40
- 1 6 2 -

APPENDIX TABLE B2 (expt 3.3) PH
T R E A T M E N T D A Y 3 D A Y 8 D A Y 4 5
NO T R E A T M E N T 5 . 1 1 . 3 4 . 11 . 3 4 ■ 1 3 . 84 . 5 1 . 1 3 . 84 . 5 4 . 1 3 . 94.4 4 . 1 3 . 8
M E A N 4.6 4.1 3 . 9F O R M I C 4 . 2 4 . 1 3 . 8
4 . 2 1 . 2 3 . 84 . 2 4 . 2 3 . 91 . 1 i . 2 3 . 74 . 3 4.2 3.9
M E A N 4 . 2 4.2 3 . 8S U C R O S E (4 g /k g ) 4 . 3 4 . 0 3 . 7
4 . 3 3 . 9 3 . 74 . 4 4 . 0 3 . 84 . 3 4.0 3 . 84.4 4.1 3 . 9
M E A N 4 . 3 4.0 3 . 8S U C R O S E (8g/kg) 4 . 2 4 . 0 3 . 7
i . 2 4 . 0 3 . 74 . 2 4 . 0 3 . 74 . 2 4 . 0 3 . 74 . 3 4.0 3 . 8
M E A N 4 . 2 4. 0 3 . 7L. p l a n t a r u m 4.6 4 . 0 3 . 8
4 . 5 4. 1 4 . 15 . 1 4 . 2 3 . 94 . 5 4 . 0 3 . 94.8 4 . 1 4.0
M E A N 4 . 7 4 . 1 3 . 9S U C R O S E (4g/kg) 4 . 1 4 . 0 3 . 8+ L. p l a n t a r u m 4 . 0 4 . 0 3 . 7
4 . 1 3.9 3 . 84 . 1 4.0 3 . 84.2 4 . 1 3 . 8
• M E A N 4.1 4 . 0 3 . 8
- 163 -

APPENDIX TABLE B3 (expt. 3.3)WATER SOLUBLE CARBOHYDRATE (WSC’) (g/kg liquid phase)
TREATMENT DAY 3 DAY 8 DAY 15
NO TREATMENT (j 6 37 5 37 6 37 5 39 6 3
MEAN 7,2 5.6 3FORMIC 17 19 5
15 19 417 15 315 20 417 15 4
MEAN 1 6 . 2 17.6 4SUCROSE 14g/kg) 10 f.i 2
9 8 39 6 .3
10 7 29 7 2
MEAN 9 . 1 6 . 8 2 . 4SUCROSE (8g/kg ) 12 7 2
9 7 313 7 37 9 29 5 2
MEAN 10 7 2.4L. p i a n t a r u m 9 5 3
9 9 i)
9 6 37 7 29 5 2
MEAN 8.6 6 . 4 2.1SUCROSE (4g/kg)+ L. p l a n t a r u m 6 6 3
D r> 35 6 35 9 2
* 5 8 2MEAN 0.2 6.8 2.6
- 164 -

APPENDIX TABLE B4 (expt. 3.3)LACTIC ACID (g/kg liquid phase)
TREATMENT DAY 3 DAY 8 DAY 45
NO TREATMENT 3 1 1 214 12 196 14 176 12 19a 20 20
MEAN 5.4 13.8 19.2FORMIC 0 0 >9
0 0 100 0.4 60 1 90 0 9
MEAN 0 0.3 8.6SUCROSE (4g/kg) 7 15 16
1 16 184 1 1 168 11 187 17 18
MEAN 5.4 14 17.2SUCROSE (8g/kg) 7 13 25
4 12 285 9 16
1 1 1 1 1910 19 22
MEAN 7.4 12.8 22L. Dlantarum 5 15 17
5 15 214 1 7 126 14 1 75 1 7 25
MEAN 5 15.6 18.4SUCROSE (4g/kg) + L. Dlantarum 15 13 24
7 16 2613 16 1213 16 20
i 13 21 27MEAN 12.2 16.4 21 .8
- 165 -

APPENDIX TABLE B5 (expt. 3.3)ETHANOL (g/kg liquid phase)
TREATMENT DAY 3 DAY 8 DAY 45
NO TREATMENT 1 2.4 1 .42.3 2.4 3.32. 1 2.2 3. 12.4 2.4 3.12.6 2.9 4.0
MEAN 2. 1 2.5 3.0FORMIC 0.6 1 .8 fe.6
0.7 2.4 9 . 50.8 2. 1 9.60.7 2.0 8.40.7 2.5 9.0
MEAN 0.7 2.2 9.0SUCROSE (4g/kg) 2. 1 2.8 1 .6
8 20 202. 1 2.6 32.6 2.5 3.42.6 2.9 2.6
MEAN 2.3 2.7 3.2SUCROSE (8g/kg) 2.7 2.8 4.2
2.8 2.6 3.72.5 2.6 5.22.4 2.6 2.72.7 3.0 3.7
MEAN 2.6 2.7 3.9L. Dlantarum 2.2 2.6 1 .3
2.5 2.7 2.42.3 2.5 0.92.2 3. 1 2.62.3 2.4 2.4
MEAN 2.3 2.7 1 .9SUCROSE (4g/kg) + L. Dlantarum 3.6 2.7 3.9
2 . 3 3.2 3.02.7 2.6 1 .63.2 2.7 1 .82.8 2.7 2.5
MEAN 2.9 2.8 2.6
- 166 -

APPENDIX TABLE B6 (expt. 3.3)ACETIC ACID (g/kg liquid phase)
TREATMENT DAY 3 DAY 8 DAY 45
NO TREATMENT 1 .9 1 .9 2.51 .5 1 .9 3.81 .7 1 .9 4.31 .5 1 .8 3.81 .4 2. 1 2.7
MEAN 1 .6 1 .9 3.4FORMIC 0.4 0.4 2.5
0.4 0.5 2.60.5 0.4 3.10.4 0.5 2.8
MEAN 0.4 0.5 2.8SUCROSE (4g/kg) 1 .6 2.3 2.8
1 . 7 2.7 3.31 .6 2.2 2.82 2.1 3.11 .5 2 2.5
MEAN 1 .7 2 . 3 2.9SUCROSE (8g/kg) 2.4 3 3.5
2.3 2.9 3.42.3 2.7 3.42.1 2.5 2.82.5 2.7 3.5
MEAN 2.3 2.8 3.3L. Dlantarum 1 . 5 1 .9 2.2
1 .6 1 . 8 3.51 .6 2.2 1 .61 .8 1 .9 3.71 .2 1 .7 3.5
MEAN 1 .5 1 .9 2.9SUCROSE (4g/kg) + L. Dlantarum 2.5 1 .9 3.8
1 .6 2.8 3. 12.2 2.2 1 .82 2. 1 2. 12 1 .8 1 .8
MEAN 2.1 2.2 2.5
- 167 -

APPENDIX TABLE B7 (expt. 3.3)LACTIC ACID/ACETIC ACID + ETHANOL
TREATMENT DAY 3 DAY 8 DAY 45
1.1 2.8 2.81.6 3.4 2.31.5 2.9 2.72. 0___________4.0 3.0
MEAN 1 .4 ______ 3.1____________ 3j_2.FORMIC 0 0 0.8
0 0 0.80 0.2 0.50 0.4 0.8
0 0__ 0.8MEAN 0______________0̂ .1____________OJ.
SUCROSE (4g/kg) 1.9 2.4 3.60.3 3.0 2.01.1 2.3 2.81.9 2.4 2.81.7 3.5_____________3 ■ 5
MEAN 1,3____ 2.8____________2.9SUCROSE (8g/kg) 1.0 2.2 3.5
0.8 2.2 3.91.4 3.3 1.92.4 2.2 3.2
1. 9___________1 ̂ 7_____________3 . 1MEAN __1 . 5___________ 2,3_____ _ 3.1_
L. Dlantarum 1.5 3.3 4.91.2 3.3 3.61.0 3.6 4.81.4 2.8 4.21 .4 ________ 4.1 2.7
MEAN K 3 ______ A+A____________4j_0SUCROSE (4g/kg)+ L. d 1antarum 2.5 2.8 3.5
1.8 2.7 4.32.7 3.3 3.12.5 3.3 5.12.7 _______ 4^7__________ 6^3
• MEAN _2^4______ 3 r4 A f 5
- 168 -

APPENDIX TABLE B8 (expt. 3.3)LAB counts (Logio C.F.U./g silage)
TREATMENT DAY 0 DAY 3 DAY 8 DAY 45
STANDING CROP NO TREATMENT
6.18186.40146.65806.5623
8.9009 9.1004 9. 1139 9.4166 9.1931
9.0827 9.0569 9.1199 9 . 2227 9.1038
8.8293 8.5820 8.6075 8.5976 8.4593
MEAN 6.541 9. 145 9.11 8.615FORMIC 5. 5453
5.5563 5.6618
7 .4166 8.0934 7.3159 8.05617.7139
7.4517 7.8020 7.5877 7 . 17327.9647
8.23298.35988.24218.40148.5158
MEAN 5.578 7.719 7 .596 8.350SUCROSE (4 g/kg) 6.4727
6.6532 6.7604
9.2380 9.2528 9.1614 9 . 3927 9.1959
9. 1238 9. 1492 8.9916 9 . 1335 8.9795
8.5276 8.5927 8.5038 8.3927 8.6902
MEAN 6.629 9.248 9.076 8.541SUCROSE (8 g/kg) 6.9390
6.6304 6.6075
9.2430 9.0595 9 .0334 9.0569 9.1553
9.0864 9.1332 9.0406 9.0224 9.1553
8. 7737 8.5976 8.6981 8.6304 8.8055
MEAN 6. 726 9.110 9.088 8. 701L. Dlantarum 6.6618
6.9647 6.7701
9.06829.09.07929.07819.0934
9.0334 9.0715 9.0212 9.0149 9. 1959
8.4857 8.6571 8.7058 8.6117 8.7243
MEAN 6. 799 9.064 9.067 8.637SUCROSE (4 g/kg) + L. Dlantarum
ff
6.52766.54536.8909
8.95629.07489.06459.09349.2304
9.02129.07199.09349.03349.0453
8.6263 8.5611 8.6483 8.5390 8.4517
MEAN 6.321 9.084 9.053 8. 565
- 16 9 -

APPENDIX TABLE B9 (expt. 3.3)BUTYRIC ACID (g/kg liquid phase)
TREATMENT DAY 3 DAY 8 DAY 45
NO TREATMENT 0.4 0. 1 0.50.2 0.2 00.2 0.2 00.2 0.2 00.2 0 0
MEAN 0.2 0.1 0.1FORMIC 0 0 0
0 0 0. 10 0 00 0. 1 00 0 0.2
MEAN 0 0 0. 1SUCROSE (4g/kg) 0.2 0.2 0
0.2 0.3 0.20.3 0.2 00.2 0.2 00.2 0 0.2
MEAN 0.2 0.2 0.1SUCROSE (8g/kg) 0.2 0.2 0
0.2 0.3 00.2 0.3 0.20.2 0.2 00 0 0
MEAN 0.2 0.2 0L. Dlantarum 0.2 0.2 0
0.2 0. 1 0.20.2 0.3 00.4 0.2 0.30 0 0
MEAN 0.2 0.2 0.1SUCROSE (4g/kg) + L. Dlantarum 0.2 0.2 0
0.2 0.3 0.20.2 0.2 00.2 0.2 0
I 0 0 0.2MEAN 0.2 0.2 0. 1
- 170 -

APPENDIX TABLE B10 (expt. 3.3)PROPIONIC ACID (g/kg liquid phase)
TREATMENT DAY 3 DAY 8 DAY 45
NO TREATMENT 0.4 0. 1 0.90.2 0.2 0.20.2 0. 1 0.20.2 0 0. 10.2 0 0.1
MEAN 0.2 0.1 0.3FORMIC 0.4 0.3 0
0.3 0.5 0.10.5 0.3 0.20.5 0.5 00.4 0 0. 1
MEAN 0.3 0.3 0.1SUCROSE (4g/kg) 0.2 0.2 0.2
0.2 0.3 0.20.4 0.1 0.30.2 0.2 0.20.2 0 0.2
MEAN 0.2 0.2 0.2SUCROSE (8g/kg) 0.2 0. 1 0.2
0.2 0.2 0.20.3 0.1 0.30.2 0.2 0.30 0 0.3
MEAN 0.2 0.1 0.3L. Dlantarum 0. 1 0. 1 0.2
0.2 0.2 0.40.2 0.2 0.30.4 0.2 0.50 0 0.3
MEAN 0.2 0.1 0.3SUCROSE (4g/kg)+ L. Dlantarum 0. 1 0 0.1
0. 1 0.3 0.20. 1 0.1 0.10 0.2 0.1
f 0 0 0.2MEAN 0.1 0.1 0.1
- 17 I -

APPENDIX TABLE B11 (expt. 3.3)TOTAL VOLATILE FATTY ACIDS (g/kg liquid phase)
TREATMENT DAY 3 DAY 8 DAY 45
NO TREATMENT 2.7 2. 1 3.81 .8 2.2 42. 1 2.2 4.61 .9 1 .9 3.91 . 7 2.1 2.8
MEAN 2.0 2.1 3.8FORMIC 0.8 0.7 2.5
0.7 1 2.81 . 1 0.8 3.30.8 1 .2 30.7 0.5 3. 1
MEAN 0.8 0.8 2.9SUCROSE (4g/kg) 2 2.8 3
2. 1 3.2 3.72.3 2.5 3. 12 . 5 2.5 3.31 .9 2 3
MEAN 2.2 2.6 3.2SUCROSE (8g/kg) 2.8 3.4 3.7
2.8 3.4 3.72.9 3. 1 3.92.5 2.9 3.12.5 2.7 3.8
MEAN 2.7 3. 1 3.6L. D l a n t a r u m 1 .8 2. 1 2.4
2 2. 1 4. 12 2.7 1 .92.6 2.3 4.51 .2 1 .7 3.8
MEAN 1 .9 2.2 3.3SUCROSE (4g/kg) + L. D l a n t a r u m 2.9 2. 1 3.9
1 .9 3.4 3.52.5 2.6 1 .92.2 2.5 2.2
9 2 1 .8 2.2MEAN 2.3 2.5 2.7
- 172 -

APPENDIX TABLE B12 (expt. 3.3)AMMONIA - NITROGEN (g/kg T N )
TREATMENT DAY 3 DAY 8 DAY 45
NO TREATMENT 141 .0 131.1 167.778. 1 88.8 99.3
111.8 102.7 148.882.9 80.6 108.371.3 69.5 84.2
MEAN 97 .02 94.5 121 .7FORMIC 51 . 8 45. 3 »75.5
38.9 47.9 62.941 .0 45.4 85.340 . 2 46. 1 65.236.4 39.3 68.6
MEAN 41 .7 44.8 71 .5SUCROSE (4g/kg) 71.3 62.9 104.9
70.5 64.6 89.658.8 63.2 97.358.0 62.9 82.253. 1 61 .3 106.7
MEAN 62.3 63 96SUCROSE (8g/kg) 58. 9 72 87
58.9 64.4 114.251 .4 49.5 90. 357 .4 70. 8 108.846.5 66 75. 3
MEAN 54.6 64.5 95. 12L. D l a n t a r u m 78.3 81 .3 96. 3
84. 1 87.7 111.5105 . 7 111.0 104. 7105 71.7 123.363.5 76.0 101 .3
MEAN 87.3 85.5 107.4SUCROSE (4g/kg) + L. D l a n t a r u m 72 75.5 89.9
83.6 60.5 81 . 764.9 65.6 9471 .3 72.2 83.5
9 63.3 62. 3 79.4MEAN 71 67.2 85.7
- 173 -

APPENDIX TABLE B13 DRY MATTER ia/ka)
(expt. 3.3)
TREATMENT DAY 3 DAY 8 DAY 45
NO TREATMENT 124 138 162144 1 50 166152 152 1 70158 172 166154 158 1 70
MEAN 146 154 167FORMIC 154 162 176
166 162 1 66160 1 74 170164 172 172166 178 168
MEAN 162 170 170SUCROSE (4g/kg) 158 156 170
140 158 174160 150 174158 156 168164 166 160
MEAN 156 157 169SUCROSE (8g/kg) 158 166 168
156 162 170158 166 172150 154 168168 166 166
MEAN 158 163 169L. Dlantarum 140 148 164
140 152 160146 160 162140 156 158164 160 158
MEAN 146 155 160SUCROSE (4g/kg) + L. Dlantarum 142 158 172
140 154 170148 164 172152 152 160146 156 162
* MEAN 146 157 167
- 174 -

APPENDIX TABLE B14 lexpt. 3.3)CRUDE PROTEIN (g/kg DM)________TREATMENT DAY 3 DAY 8 DAY 45
NO TREATMENT 208 181 168184 169 164168 177 118151 155 162167 153 156
MEAN 176 167 153FORMIC 169 166 157
177 1 70 179168 151 139156 149 173155 143 146
MEAN 165 156 159SUCROSE (4g/kg) 167 169 155
177 174 154159 188 147151 176 160141 133 141
MEAN 159 168 151SUCROSE (8g/kg) 170 148 151
170 155 131158 152 145163 168 138148 152 158
MEAN 162 155 145L. Dlantarum 192 177 169
186 157 191166 152 179143 166 157158 156 160
MEAN 169 162 171SUCROSE (4g/kg) + L. Dlantarum 174 166 160
187 207 1 53193 152 146167 165 165168 130 157
» MEAN 178 164 156
- 175 -

TREATMENT DAY 45
NO TREATMENT 695699728722726
APPENDIX TABLE B15 (expt. 3.3)in vitro DRY MATTER DIGESTIBILITY (DMD) (g/kg DM)
MEANL. plantarum
f
MEAN 714FORMIC 728
712695720708
MEAN 713SUCROSE (4g/kg) 676
703708716712
MEAN 703SUCROSE (8g/kg) 716
716718695697
MEAN 688SUCROSE (4g/kg)+ L.plantarum 716
697 688 703
69 Z_MEAN 700
- 176 -

APPENDIX TABLE B16 (expt. 3.3) EFFLUENT PRODUCTION (mis)
TREATMENT DAY 3 DAY 8 DAY 45
NO TREATMENT 10 265 455218 320 365210 400 60560 320 61590 295 230
MEAN 118 320 454FORMIC 690 805 800
645 775 930525 810 805515 710 670430 755 265
MEAN 561 771 694SUCROSE (4g/kg) 115 248 570
260 595 615125 310 585115 695 32035 345 165
MEAN 150 439 451SUCROSE (8g/kg) 455 675 550
330 490 435310 340 610195 490 640110 365 450
MEAN 280 472 537L. Dlantarum 118 595 815
156 360 67535 395 495175 365 190
8 475 290MEAN 98 438 493
SUCROSE (4g/kg) + L. Dlantarum 210 520 565
205 560 595165 510 830220 380 440
9 170 190 245MEAN 194 432 535
- 177 -

APPENDIX TABLE C1 (expt. 3.4)
GRASS COMPOSITION SD
DRY MATTER (g/kg) 145145135 1.85141140
MEAN 141ASH (g/kg DM) 117
112115 1.47117121
MEAN H ICRUDE PROTEIN (g/kg DM) 192
168187 4.04184185
MEAN 183in vitro D.M.D. (g/kg DM) 779
786758 5.19785783
MEAN 778W.S.C. (g/kg liquid phase) 35
2630 1.5028 29
MEAN 30
- 178 -

APPENDIX TABLE C2 (expt. 3.4) PH
TREATMENTS * TIME (DAYS) X
1 2 4 7 14 21 28 100
NO ADDITIVE 4.7 4.4 4. 1 4.0 3.8 3.8 3.8 3.74.6 4.3 4. 1 3.9 3.9 3.8 3.8 3.7 4.04.7 4.4 4.1 3.9 3.9 3.9 3.8 3.74.7 4.3 4. 1 3.9 3.9 3.8 3.8 3.74.7 4.3 4. 1 3 . 9 3.9 3.8 3.8 3.7
L. Dlantarum 4.3 4.4 4.1 3.9 3.9 3.8 3.8 3.74.8 4.3 4.0 3.9 3.9 3.8 3.8 3.74.8 4.3 4.1 3.9 3.9 3.8 3.8 3.7 4.04.7 4.3 4. 1 3.9 3.9 3.8 3.8 3.74.6 4.3 4.1 3.9 3.9 3.8 3.8 3.7
L. buchneri 4.7 4.3 4.1 4.0 3.9 3.9 4.0 4.64.7 4.3 4.0 4.0 4.0 3.9 4.0 4.6 4.24.8 4.3 4.0 4.0 3.9 3.9 4.0 4.74.6 4.3 4.1 4.0 3.9 3.9 4.0 4.64.7 4.3 4.1 4.0 3.9 3.9 4.0 4.6
X 4.7 4.3 4.1 4.0 3.9 3.9 3.9 4.0
SEM (Additive treatments) = 0.011 ***SEM (Time treatments) = 0.02 ***SEM (Interaction) = 0.03 ***Error df = 72

APPENDIX TABLE C3 (expt. 3.4)Water soluble carbohydrate (WSC) (g/kg liquid phase)
TREATMENTS • TIME (DAYS) X
1 2 4 7 14 21 28 100
NO ADDITIVE 14.8 9.7 6.7 7.0 4.8 3.5 4.7 1 .716.6 11.4 8.4 7.3 3.9 5.2 5.7 4.0 8.120. 7 13.4 6.0 8.2 3.9 4.2 6.5 3.821 .3 15.0 11.3 9.3 5.4 7.6 4.5 2.718.4 12.4 8.1 8.0 4.5 5. 1 5.4 3. 1
L. Dlantarum 15.2 10.7 6.8 9.5 5.6 4.0 4.2 3.215.6 12.6 8.9 10.6 4.2 6.0 6. 1 2.8 8.220. 9 9.6 9.0 8.8 6.1 4.6 6.4 3.520. 3 12.4 8.1 9.1 5.9 3.6 4.2 2.618.0 11.3 8.2 9.5 5.5 4.6 5.2 3.0
L. buchneri 13.4 8.6 5.4 5.7 3 . 9 3.6 3.2 1 .521 .5 9.1 9.6 7.4 3.6 3.4 3.9 1 .6 6.720.5 10.8 6.5 5.6 4.2 6.7 3.8 2.910.6 6.9 9 6.1 5.0 3.5 3,8 2.416.5 8.9 7.6 6.2 4.2 4.3 3.7 2. 1
X 17.6 10.9 o00 7.9 4.7 4.7 4.8 2.7
SEM (Additive treatments) = 0.33 **SEM (Time treatments) = 0.54 ***SEM (Interaction) = 0.93 NSError df = 72

APPENDIX TABLE C4 (expt. 3.4)Lactic acid (g/kg liquid phase)
TREATMENTS « TIME (DAYS) X
1 2 4 7 14 21 28 100
NO ADDITIVE 0.1 12 9 22 18 24 17 271 .0 17 13 16 20 25 26 325.0 13 18 25 23 26 34 32 19.44.0 19 21 19 24 29 23 282.5 15.3 15.3 20. 5 21 .3 26 25 30
L. Dlantarum 0.4 5 13 20 25 25 25 292 1 1 1 1 21 25 23 29 287 7 13 1 1 32 32 21 24 18.77 10 14 17 32 24 25 294. 1 8.3 12.8 17. 3 28. 5 26 25 28
L. buchneri 0 4 7 12 23 16 35 0.18 10 10 15 25 23 18 0.48 15 14 24 21 21 29 1 14.28 14 17 20 16 19 21 16.0 10.8 12 17. 8 21 .3 19.8 25.8 0.63
X 4.2 11.4 13.3 18. 5 23. 7 23.9 25.3 19.3
SEM (Additive treatments) = 0.71 ***SEM (Time treatments) = 1.16 ***SEM (Interaction) = 2.00 ***Error df = 72

APPENDIX TABLE C5 (expt. 3.4)Ethanol (g/kg liquid phase)
TREATMENTS « TIME (DAYS) X
1 2 4 7 14 21 28 100
NO ADDITIVE 0.7 .5 .5 .9 1 .6 1 .5 1 .6 2.00.6 .5 .7 1 .4 1 .2 1 .8 1 .7 1 .90.6 .5 . 7 1 .2 1 .6 1 .2 1 .4 1 .5 1 . 10.7 .6 . 9 1 .0 1 .0 1 . 5 1 .3 1 .80.6 0.53 0.7 1 . 1 1 .4 1 .5 1 .5 1 .8
L. Dlantarum .5 .5 .7 1 .2 1 .5 1 .4 1 . 9 2.1. 6 . 5 . 5 1 . 2 1 .7 2.0 1 . 7 2.0.5 .5 .9 1 . 1 1 .4 1 . 7 1 .6 1 .7 1 .2.6 .5 . 6 .8 1 .4 1 .7 1 .0 1 .3
0.55 0.5 0.68 1 . 1 1 .5 1 .7 1 .6 1 .8L. buchneri .6 .7 .8 . 7 .9 .9 1 .2 2.9
.7 .7 .7 .9 1 .2 1 .3 1 .2 2.5
.6 .7 1 .0 . 9 1 . 1 1 .3 1 .3 2.6 1 .2
.7 .8 . 8 1 . 1 1 . 1 2.5 1 .0 2.70.65 0. 73 0.83 0.9 1 . 1 1 .5 1 .2 2.7
X 0.62 0.58 0.73 1 .0 1 .3 1 .6 1 .4 2. 1
SEM (Additive treatments) = 0.04 NSSEM (Time treatments) = 0.07 ***SEM (Interaction) = 0.12 ***Error df = 72

APPENDIX TABLE C6 (expt. 3.4)Acetic acid (g/kg liquid phase)
TREATMENTS * TIME (DAYS) X
1 2 4 7 14 21 28 100
NO ADDITIVE 2.8 2.0 2.4 2.5 2.5 3.4 3.2 4.51 .7 1 .9 3.0 3.0 3.2 3.2 3.3 4.21 .6 1 .6 2.0 2.6 2.9 3.7 3.5 4.7 2.81 .4 1 .8 2.7 3.0 0.3 3.5 3.4 4.61 .9 1 .8 2.5 2.8 2.2 3.5 3.4 4.5
L. Dlantarum 1 .7 2.0 2.4 2.9 2.7 2.9 2.7 4.21 .4 1 .6 2.2 2.3 2.8 4.4 3.6 4.21 .2 1 . 6 2.8 3.2 2.8 4.1 4.5 4.1 2.91 .4 2. 1 2.4 3.2 3. 1 3.4 4.0 4.01 .4 1 .8 2,5 2.9 2.9 3.7 4.0 4. 1
L. buchneri 1 .7 2.4 3.2 3.9 4.6 5.0 7.7 15.11 .8 1 .8 2.9 4.1 5.2 6.4 8.2 16.31 .5 2.1 2.8 4.6 4.4 7.2 6.5 15.6 5.71 .6 2.0 2.7 4.3 5.3 10.8 6.1 141 .7 2.1 2.9 4.2 4.9 7.4 7.1 15.3
X 1 .65 1 .9 2.6 3.3 3.3 4.8 4.8 8.0
SEM (Additive treatments) = 0.13 ***SEM (Time treatments) = 0.20 ***SEM (Interaction) = 0.35 ***Error df = 72

APPENDIX TABLE C7 (expt. 3.4)Lactic : (acetic + ethanol) (Liquid Phase)
TREATMENTS TIME (DAYS) X
1 2 4 7 14 21 28 100
NO ADDITIVE 0.029 4.8 3.1 6.5 4.4 4.9 3.5 4.20.43 7. 1 3.5 3.6 4.5 5.0 5.2 5.22.27 6.2 6.7 6.6 5 . 1 5.3 6.9 5.21 .9 7.9 5.8 4.8 18.5 5.8 4.9 4.41 . 2 6.5 4.8 5.4 8 . 1 5.3 5.1 4.7 5.1
L. Dlantarum 0.18 2.0 4.2 4.9 6 . 0 5.8 4.5 4.61 . 0 5 . 2 4. 1 6.0 5.6 3.6 5.5 4.54.1 3.3 3.5 2.6 7.6 5.5 3.4 4. 13.5 3.8 4.7 4.3 7.1 4.7 5.0 5.52.2 3.6 4.1 4.4 6.6 4.9 4.6 4.7 4.4
L. buchneri 0 1 .3 1 .8 2.6 4.2 2.7 3.9 .013.2 4.0 2.8 3.0 3.9 3.0 1 . 9 .023.8 5.4 3.7 4.4 3.8 2.5 3.7 .053.5 5.0 4.9 3.7 2.5 1 .4 3.0 .062.6 3.9 3.3 3.4 3.6 2.4 3. 1 .04 2 . 8
X 2.0 4.7 4.1 4.4 6.1 4.2 4.3 t*> • ro
SEM (Additive treatments) = 0.32 ***SEM (Time treatments) = 0.53 ***SEM (Interaction) =0.81 NSError df = 72

APPENDIX TABLE C8 (expt. 3.4)Counts of LAB (Log 1 0 CFU/g silage)
TREATMENTS * TIME (DAYS)
0 1 2 4 100 X
NO ADDITIVE 6.74 9.13 9.40 9.24 7.056.93 9.20 9.42 9.24 7.116.93 9.16 9.54 9. 14 7.196.97 9.21 9.16 9.21 7.01
MEAN 6.90 9.17 9.40 9.21 7.09 8.35L. Dlantarum 6.87 9.25 9.37 9.14 6.75
6.64 9.05 9.33 9.20 7.317.03 9.30 9.48 9.08 7.316.85 9.25 9.45 9.08 7.16
MEAN 6.87 9.22 9.42 9.13 7.13 8.35L. buchneri 7.16 9.26 9.29 9.21 9.98
7.11 9.19 9.29 9.27 8.887.17 9.12 9.39 9.27 8.907.67 9.40 9.37 9.28 9.03
MEAN 7.28 9.25 9. 34 9.26 9.20 8.86X 7.04 9.21 9.39 9.20 7.62
SEM (Additive treatments) = 0.04 ***SEM (Time treatments) = 0.05 ***SEM (Interaction) = 0.09 ***Error df = 45

APPENDIX TABLE C9 (expt. 3.4)Butyric acid (g/kg liquid phase)
TREATMENTS TIME (DAYS) X
1 2 4 7 14 21 28 100
NO ADDITIVE .7 .2 1 .5 . 1 .3 .2 .3. 1 . 1 .4 . 1 . 1 .2 . 1 .5. 1 0 0 . 1 . 1 . 1 . 1 .2 .22. 1 0 . 1 . 1 .3 . 1 .2 .3.25 .08 .5 . 1 .2 .18 .15 .33
L. Dlantarum .1 .5 . 1 .4 . 1 0 . 1 .20 0 . 1 0 . 7 . 1 .2
. 1 0 . 1 . 1 .2 .2 1 .9 .3 .2
. 1 .2 . 1 . 1 . 1 . 1 . 1 . 1
.08 .18 o CD .18 . 1 .25 .55 .2L. buchneri .1 . 1 . 1 .6 1 .4 2.2 3.4 5.2
. 1 0 .2 .6 2.0 2.4 3.6 6.3
. 1 .2 . 1 .7 1 .2 2.6 2.9 5.5 1 .8
. 1 . 1 . 1 .8 1 .8 5.2 2.4 4.7
. 1 . 1 . 13 .68 1 .6 3.1 3.1 5.4X .14 .12 .23 .32 .62 1 .2 1 .3 2.0
SEM (Additive treatments) = 0.08 ***SEM (Time treatments) = 0.13 ***SEM (Interaction) = 0.22 ***Error df = 72

APPENDIX TABLE C10 (expt. 3.4)Propionic acid (g/kg liquid phase)
TREATMENTS TIME (DAYS) X
1 2 4 7 14 21 28 100
NO ADDITIVE 1 .1 .3 .2 . 1 0 . 2 . 1 00.3 .2 .6 .2 . 1 . 1 . 1 . 1
.3 .2 .2 .2 .2 . 1 . 1 . 1 .19
.3 .2 .2 . 1 . 1 . 1 . 1 00.5 .23 .3 .15 . 1 .13 . 1 .05
L. Dlantarum .4 .3 .2 . 1 . 1 . 1 0.4 .2 .2 . 1 . 1 . 1.2 . 2 .3 . 1 . 1 . 1 . 1 . 1 .18.3 .2 .2 . 1 . 1 . 1 . 1 . 1.33 .23 .23 .13 .13 .25 . 1 .08
L. buchneri .4 .3 .2 0 . 1 . 1 i 1 ,6.3 .2 .2 . 1 .8 . 1 . 1 .5.2 .2 . 1 . 1 . 1 0 . 1 .7 .38.2 . 1 . 1 . 1 5.3 . 1 .5.28 .2 .15 . 1 .28 1 .4 . 1 .58
X .37 .22 .23 .13 .17 .58 .23
SEM (Additive treatments) = 0.10 NSSEM (Time treatments) = 0.16 NSSEM (Interaction) = 0.28 NSError df = 72

APPENDIX TABLE C11 (expt. 3.4)Total volatile fatty acids (g/kg liquid phase)
TREATMENTS TIME (DAYS) X
1 2 4 7 14 21 28 100
NO ADDITIVE 4.5 2.4 4. 1 2.7 2.7 3.8 3.4 4.82.2 2.3 4.0 3.3 3.5 3.5 3.6 4.72.0 1 .8 2.2 2.9 3.2 3.9 3.7 5.0
CMCO
1 .9 2.0 3.0 3. 1 0.7 3.7 3.7 4.92.7 2.1 3.3
oCO 2.5 3.7 3.6 4.9L. Dlantarum 2.1 2.7 2.7 3.6 2.9 3.0 3.9 4.4
1 .8 1 .8 2.5 2.4 2.9 5.9 3.7 4.41 .5 1 .8 3.2 3.4 3.0 4.3 6.5 4.5 3.31 .8 2.5 2.7 3.4 3.3 3.6 4. 1 4.21 .8
CMCM COCM 3.2
oCO 4.2 4.6 4.4L. buchneri 2.3 2.8 3.5 4.5 6.1 7.2 11.1 21
2.1 2.0 3.3 4.9 8.0 8.9 11.9 23. 11 .8 2.5 3.1 5.4 5.8 9 . 8 9.5 21 . 8 7.92.0 2.2 3.0 5.3 7.2 21 .3 8.6 19.22.1 2.4 CMCO Ol o
CO(D 11.8 10.3 21 .3X 2.2
CMCM 3. 1
r-CO 4.1 6.6 6.1 10.2
SEM (Additive treatments) = 0.27 ***SEM (Time treatments) = 0.44 ***SEM (Interaction) = 0.76 ***Error df = 72

APPENDIX TABLE C12 (expt. 3.4)Ammonia - nitrogen (g/kg Total Nitrogen)
TREATMENTS TIME (DAYS) X
1 2 4 7 14 21 28 100
NO ADDITIVE 30.64 28.39 20.35 21 .04
46.05 23.08 29. 16 35.44
48.6517.0323.3535 .40
72. 76 29.89 38.7932.29
35.3338.2532.4733.90
43.76 33. 19 46.37 40.96
57.2774.8943.4443.63
75.0380.4762.6260.07
41 .7
25. 1 33.4 31 . 1 43.4 35 41 . 1 54.8 69.5L. Dlantarum 27.00
55.3722.7722.32
35.8328.6827.6225.06
51 .98 31 .55 28.43 24. 18
38.2133.3133.8529.47
40.4134.42 39. 1 137. 13
46.2538.7343.2248. 73
43.6968.3342.847.07
61 .29 67.36 66.7757.82
40.6
31 .9 29.3 34 33.7 37.8 44.2 50.5 63.3L. buchneri 28.53
27.7727.9426.89
37.6933.8730.6321 .9
36.73 34. 78 31 . 636.97
43.97 45.41 38.06 43. 61
50.21 45 .82 56.8848.67
29.96 48.70 43. 18 48.91
53.83 55.91 56. 1958. 77
117.84 104.21 110.87103.26
49 .4
27 .8 31 35 42.8 50.4 42.7 56.2 109X 28.3 31 .3 33.4 40 41 . 1 42.7 53.8 80.6
SEM (Additive treatments) - 1 ,,6 ***SEM (Time treatments) = 2,.6 ***SEM (Interaction) = 4.,5 ***Error df = 72

APPENDIX TABLE C13 (expt. 3.4)Dry matter (g/kg)
TREATMENTS TIME (DAYS) X
1 2 4 7 14 21 28 100
NO ADDITIVE 140 153 148 137 137 133 147 136150 143 153 143 150 149 136 140 145160 156 150 140 142 148 142 148153 147 138 152 140 140 147 150151 150 147 143 142 143 143 144
L. Dlantarum 153 153 145 150 140 132 144 150147 157 147 140 148 139 143 155 146156 157 153 140 144 140 141 143147 148 150 140 148 143 146 145151 154 149 142 145 139 143 148
L. buchneri 150 150 155 142 148 145 133 145147 147 141 137 133 133 138 128 141154 148 146 138 133 127 133 155138 137 140 143 142 128 137 133147 146 146 140 139 133 135 140
x 150 150 147 142 142 138 141 144
SEM (Additive treatments) = 1 .10 **SEM (Time treatments) = 1 .80 * * *SEM (Interaction) = 3. 10 NSError df = 72

APPENDIX TABLE C14 (expt. 3.4)Nitrogen (g/kg DM) (CP = N x 6.25)
TREATMENTS • TIME (DAYS) X SEM
1 2 4 7 14 21 28 100
NO ADDITIVE 33 31 30 35 36 33 26 2933 37 35 35 32 32 33 3235 27 34 33 36 31 33 30 3334 30 31 31 39 36 35 3034 31 32 34 36 33 32 30
L. Dlantarum 32 32 30 32 32 32 32 3036 31 34 32 36 38 35 3032 32 34 34 30 35 36 30 33 .5233 33 33 34 36 31 31 3333 32 33 33 33 34 33 31
L. buchneri 30 31 32 31 29 29 38 2933 34 30 33 37 38 38 3637 30 35 35 33 45 33 31 3437 38 32 29 32 38 34 3534 33 32 32 33 37 36 33
X 34 32 32 33 34 35 34 31SEM .84 1 .5
SEM (Additive treatments) = 0.52 NSSEM (Time treatments) = 0.84 NSSEM (Interaction) = 1 . 5 NSError df = 72

TABLE NO. C15in vitro dry matter digestibility at day 45
DMD SEM735728733754
MEAN 238 5.62752 737 756 752
MEAN 749669 699 692 679
MEAN 685
Error df = 9.0
f
- 19 2 -
TREATMENT NO ADDITIVE
L. Dlantarum
L . buchneri
SIG
* * *

APPENDIX C 16
j o p i 50 CHO rlglnarSourc*
Dal* m i M
Daot./Sarvica
AUTRESJOTH6A TESTS AUTRESK)THen TESTS
3ENTIFICATI0N
' ■ O u c U nc.fi
—\ /■Tam ptraiwa d'lncubatlon Incubation ïampariluia
Mlllau d'lnoeulailon Inoculation rnadlum
9 I » ] « i « 7 > > 10 11 11 11 1« 13 1« 17 1» 1» iZ J X U M A iA in . IL lU J i Jt jr.ju.äQ J - Ü -.Q 5 i r f 0 Q ¿11.1 0 0 0 t ? Q o 0 o n I n 0 0 0 0 0 < 0 I l O O i o O o C Q Q Q \ 6 .c .c n < o S o0 0 0 Q i + f J o i SS UOQQoOOt o r o o o o c o t o < v j o rt-oo o c?
XM l I
IIil
4»
- 193 -
O 4
1.0
01
4