Embed Size (px)
Citation preview
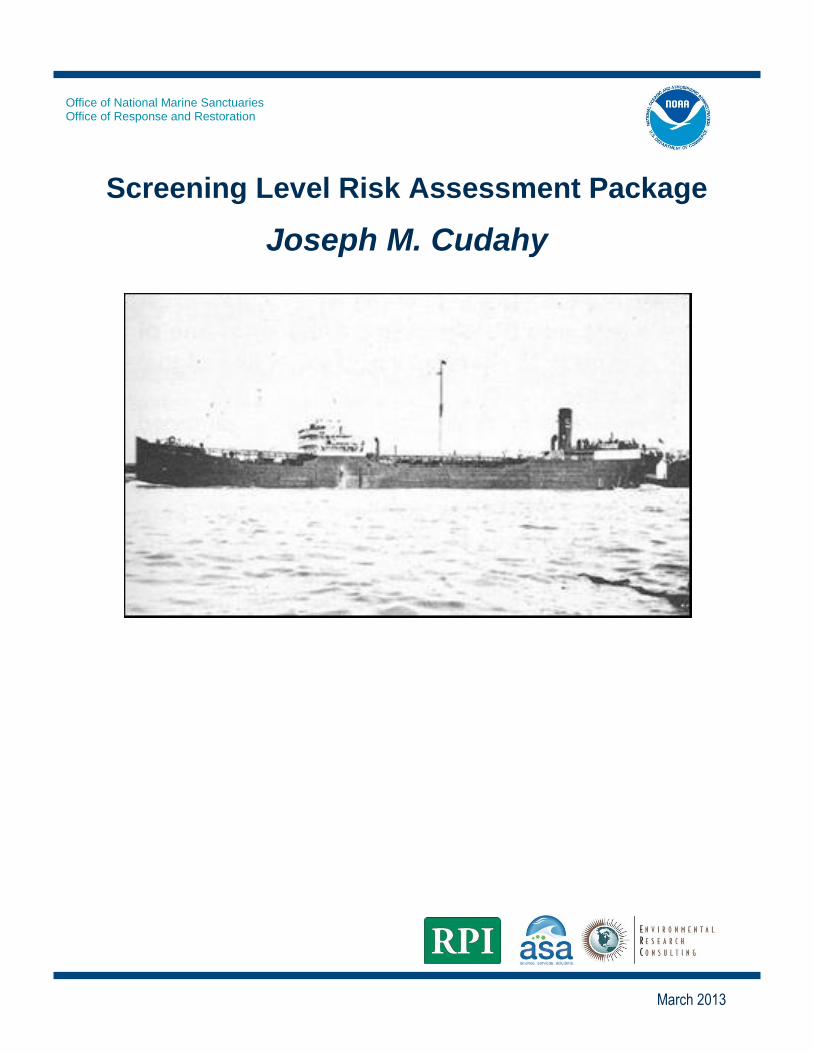
Office of National Marine Sanctuaries Office of Response and Restoration
Screening Level Risk Assessment Package
Joseph M. Cudahy
March 2013
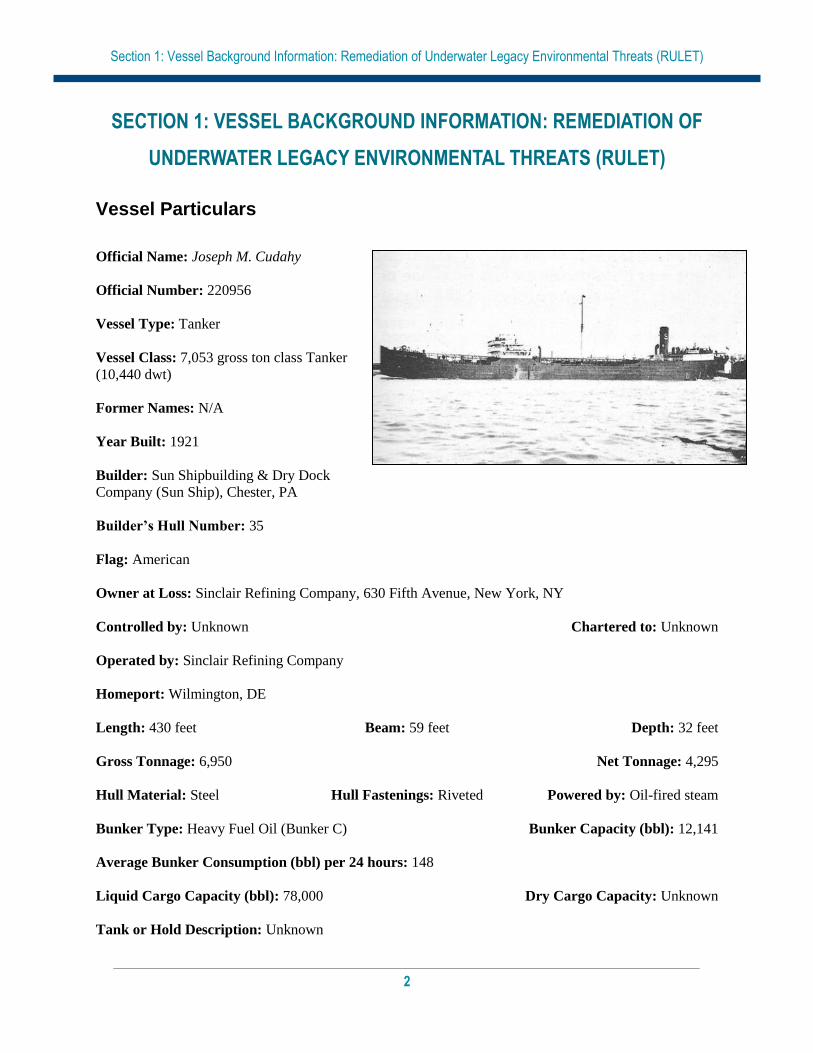
National Oceanic and Atmospheric Administration Office of National Marine Sanctuaries Daniel J. Basta, Director Lisa Symons John Wagner Office of Response and Restoration Dave Westerholm, Director Debbie Payton Doug Helton Photo: Photograph of Joseph M. Cudahy Courtesy of The Mariners’ Museum Library, Newport News, VA
i
Table of Contents
Project Background .......................................................................................................................................ii
Executive Summary ......................................................................................................................................1
Section 1: Vessel Background Information: Remediation of Underwater Legacy Environmental Threats (RULET) .....................................................................................................2
Vessel Particulars .........................................................................................................................................2 Casualty Information .....................................................................................................................................3 Wreck Location .............................................................................................................................................4 Casualty Narrative ........................................................................................................................................4 General Notes ..............................................................................................................................................5 Wreck Condition/Salvage History ................................................................................................................5 Archaeological Assessment .........................................................................................................................6 Assessment ..................................................................................................................................................6 Background Information References ............................................................................................................8 Vessel Risk Factors ......................................................................................................................................8
Section 2: Environmental Impact Modeling ...............................................................................................15
Release Scenarios Used in the Modeling ...................................................................................................15 Oil Type for Release ...................................................................................................................................16 Oil Thickness Thresholds ............................................................................................................................16 Potential Impacts to the Water Column .......................................................................................................17 Potential Water Surface Slick ......................................................................................................................18 Potential Shoreline Impacts.........................................................................................................................21
Section 3: Ecological Resources At Risk ..................................................................................................24
Ecological Risk Factors ...............................................................................................................................26
Section 4: Socio-Economic Resources At Risk ........................................................................................32
Socio-Economic Risk Factors .....................................................................................................................35
Section 5: Overall Risk Assessment and Recommendations for Assessment,
Monitoring, or Remediation ..........................................................................................................40

ii
Project Background The past century of commerce and warfare has left a legacy of thousands of sunken vessels along the U.S.
coast. Many of these wrecks pose environmental threats because of the hazardous nature of their cargoes,
presence of munitions, or bunker fuel oils left onboard. As these wrecks corrode and decay, they may
release oil or hazardous materials. Although a few vessels, such as USS Arizona in Hawaii, are well-
publicized environmental threats, most wrecks, unless they pose an immediate pollution threat or impede
navigation, are left alone and are largely forgotten until they begin to leak.
In order to narrow down the potential sites for inclusion into regional and area contingency plans, in
2010, Congress appropriated $1 million to identify the most ecologically and economically significant
potentially polluting wrecks in U.S. waters. This project supports the U.S. Coast Guard and the Regional
Response Teams as well as NOAA in prioritizing threats to coastal resources while at the same time
assessing the historical and cultural significance of these nonrenewable cultural resources.
The potential polluting shipwrecks were identified through searching a broad variety of historical sources.
NOAA then worked with Research Planning, Inc., RPS ASA, and Environmental Research Consulting to
conduct the modeling forecasts, and the ecological and environmental resources at risk assessments.
Initial evaluations of shipwrecks located within American waters found that approximately 600-1,000
wrecks could pose a substantial pollution threat based on their age, type and size. This includes vessels
sunk after 1891 (when vessels began being converted to use oil as fuel), vessels built of steel or other
durable material (wooden vessels have likely deteriorated), cargo vessels over 1,000 gross tons (smaller
vessels would have limited cargo or bunker capacity), and any tank vessel.
Additional ongoing research has revealed that 87 wrecks pose a potential pollution threat due to the
violent nature in which some ships sank and the structural reduction and demolition of those that were
navigational hazards. To further screen and prioritize these vessels, risk factors and scores have been
applied to elements such as the amount of oil that could be on board and the potential ecological or
environmental impact.

1
Executive Summary: Joseph M. Cudahy
The tanker Joseph M. Cudahy, torpedoed and
sunk during World War II northwest of Key
West, Florida in 1942, was identified as a
potential pollution threat, thus a screening-
level risk assessment was conducted. The
different sections of this document summarize
what is known about the Joseph M. Cudahy,
the results of environmental impact modeling
composed of different release scenarios, the
ecological and socio-economic resources that
would be at risk in the event of releases, the
screening-level risk scoring results and overall
risk assessment, and recommendations for
assessment, monitoring, or remediation.
Based on this screening-level assessment, each
vessel was assigned a summary score calculated
using the seven risk criteria described in this report.
For the Worst Case Discharge, Joseph M. Cudahy
scores High with 16 points; for the Most Probable
Discharge (10% of the Worse Case volume), Joseph
M. Cudahy also scores High with 15 points. Given
these scores and the higher level of data certainty
for the Joseph M. Cudahy, NOAA recommends that
this site be reflected within the Area Contingency
Plans and be considered for further assessment to
determine the vessel condition, amount of oil
onboard, and feasibility of oil removal action. At a
minimum, an active monitoring program should be
implemented to detect possible leakage. Outreach
efforts with the technical and recreational dive
community as well as commercial and recreational
fishermen who frequent the area would be helpful to
gain awareness of changes in the site.
Vessel Risk Factors Risk Score
Pollution Potential Factors
A1: Oil Volume (total bbl)
Med
A2: Oil Type
B: Wreck Clearance
C1: Burning of the Ship
C2: Oil on Water
D1: Nature of Casualty
D2: Structural Breakup
Archaeological Assessment
Archaeological Assessment Not Scored
Operational Factors
Wreck Orientation
Not Scored
Depth
Confirmation of Site Condition
Other Hazardous Materials
Munitions Onboard
Gravesite (Civilian/Military)
Historical Protection Eligibility
WCD MP (10%)
Ecological Resources
3A: Water Column Resources Low Low
3B: Water Surface Resources High High
3C: Shore Resources High Med
Socio-Economic Resources
4A: Water Column Resources Low Low
4B: Water Surface Resources High High
4C: Shore Resources High High
Summary Risk Scores 16 15
The determination of each risk factor is explained in the document.
This summary table is found on page 41.
Section 1: Vessel Background Information: Remediation of Underwater Legacy Environmental Threats (RULET)
2
SECTION 1: VESSEL BACKGROUND INFORMATION: REMEDIATION OF
UNDERWATER LEGACY ENVIRONMENTAL THREATS (RULET)
Vessel Particulars
Official Name: Joseph M. Cudahy
Official Number: 220956
Vessel Type: Tanker
Vessel Class: 7,053 gross ton class Tanker
(10,440 dwt)
Former Names: N/A
Year Built: 1921
Builder: Sun Shipbuilding & Dry Dock
Company (Sun Ship), Chester, PA
Builder’s Hull Number: 35
Flag: American
Owner at Loss: Sinclair Refining Company, 630 Fifth Avenue, New York, NY
Controlled by: Unknown Chartered to: Unknown
Operated by: Sinclair Refining Company
Homeport: Wilmington, DE
Length: 430 feet Beam: 59 feet Depth: 32 feet
Gross Tonnage: 6,950 Net Tonnage: 4,295
Hull Material: Steel Hull Fastenings: Riveted Powered by: Oil-fired steam
Bunker Type: Heavy Fuel Oil (Bunker C) Bunker Capacity (bbl): 12,141
Average Bunker Consumption (bbl) per 24 hours: 148
Liquid Cargo Capacity (bbl): 78,000 Dry Cargo Capacity: Unknown
Tank or Hold Description: Unknown
Section 1: Vessel Background Information: Remediation of Underwater Legacy Environmental Threats (RULET)
3
Casualty Information
Port Departed: Houston, TX Destination Port: Marcus Hook, PA
Date Departed: May 1, 1942 Date Lost: May 4, 1942
Number of Days Sailing: ≈ 4 Cause of Sinking: Act of War (Torpedoes)
Latitude (DD): 25.0228 Longitude (DD): -82.7563
Nautical Miles to Shore: 25 Nautical Miles to NMS: 15
Nautical Miles to MPA: 6 Nautical Miles to Fisheries: Unknown
Approximate Water Depth (Ft): 145 Bottom Type: Sand
Is There a Wreck at This Location? Yes, the wreck at this location (known as the “Oil Wreck”) has not
been positively identified but has been tentatively labeled the wreck of Joseph M. Cudahy by recreational
divers
Wreck Orientation: Resting on its starboard side
Vessel Armament: None (if actually the wreck of Joseph M. Cudahy)
Cargo Carried when Lost: 78,000 bbl of oil (one half lubricating and one half fuel oil or crude oil
depending on the report)
Cargo Oil Carried (bbl): 78,000 Cargo Oil Type: Multiple Types
Probable Fuel Oil Remaining (bbl): Unknown ≤ 12,000 Fuel Type: Heavy Fuel Oil (Bunker C)
Total Oil Carried (bbl): ≤ 90,000 Dangerous Cargo or Munitions: No
Munitions Carried: None
Demolished after Sinking: No Salvaged: No
Cargo Lost: Yes, partially Reportedly Leaking: Yes, has been for past 60+ years
Historically Significant: Yes Gravesite: Yes (if actually the wreck of Joseph M. Cudahy)
Salvage Owner: Murel Goodell of Houston, TX

Section 1: Vessel Background Information: Remediation of Underwater Legacy Environmental Threats (RULET)
4
Wreck Location
Chart Number: 411
Casualty Narrative
"At 04.15 hours on 5 May 1942, the unescorted and unarmed Joseph M. Cudahy (Master Walter Edmund
Reed) was torpedoed by U-507 about 125 miles west of Naples, Florida. Lookouts on the tanker had
spotted the burning Munger T. Ball, which had been torpedoed by the same U-boat at 01.32 hours, 74
miles northwest of the Dry Tortugas Light and the master changed course for Tampa and steered a zigzag
pattern at 11 knots. One torpedo struck at the waterline on the starboard side at the #4 main tank, just after
the third officer had spotted the conning tower and saw the torpedo track about 20 feet from the tanker.
The explosion blew a large hole in the side and started a fire in the midships house. The master steered
into the wind to allow the crew of eight officers and 29 crewmen to abandon ship. The master and eight
men on the forepart of the tanker left in one lifeboat and were sighted by PBY Catalina aircraft of the U.S.
Navy. A fishing schooner offered to help the men, but they declined. These men were picked up by a
PBY about 12 hours after the attack and taken to Key West, Florida. One other survivor was picked up by
another PBY the same morning and also taken to Key West. Three officers and 24 crewmen were lost.
On 7 May, the gutted and still burning Joseph M. Cudahy was sighted by the American patrol yacht USS
Coral (PY 15) in 24°57N/84°10W and was sunk by gunfire, because she was beyond salvage and a
menace to navigation."
-http://www.uboat.net/allies/merchants/ships/1605.html
Section 1: Vessel Background Information: Remediation of Underwater Legacy Environmental Threats (RULET)
5
Under Captain Walter Edmund Reed, the Cudahy sailed from Houston, TX to Marcus Hook, PA. She was
torpedoed by U-507 (Schact) 74 miles northwest of Dry Tortugas Light. One torpedo struck at the
waterline on the starboard side at the #4 main tank. An explosion blew a hole in the ships side. 27 were
lost.
-B.M. Browing Jr., "U.S. Merchant Vessel War Casualties of World War II", (Naval Institute Press,
1996), 90-91.
The Cudahy was on a trip from Galveston to Philadelphia according to Hocking.
-C. Hocking, "Dictionary of Disasters at Sea During the Age of Steam: Including sailing ships and ships
of war lost in action 1824-1962" (Lloyd's Register of Shipping, 1969), 364.
At 6pm, U-507 commander Harro Schact hit the Cudahy with a torpedo. The ship exploded and burst into
flames. After resurfacing, the sub saw that part of the tanker was still afloat, but it sank quickly. The sea
all around the ship was burning, and "a giant mushroom could of smoke" rose above. The U.S. Coast
Guard recorded on the 5th of May that the ship was burning and would sink.
---- M. Wiggins "Torpedoes in the Gulf: Galveston and the U-Boats 1942-1943" Texas A&M University
Press, College Station (1995), 24, 52.
General Notes
Known as Joseph M. Cuda in AWOIS.
AWOIS Data: 00102
HISTORY
LNM23/83--WK SUNK IN 1942 STILL PRESENT IN APPROX. LAT.25-57N, LONG.83-57W.
DESCRIPTION
24 NO.542; TANKER, 6950 GT; 5/5/42 BY SUBMARINE; POSITION ACCURACY 1-3 MILES.
27 NO.511; 4295 NT, SUNK 5/5/42 IN 50 FATHOMS. NAME: JOSEPH M. CUDAHY
SURVEY REQUIREMENTS
NOT DETERMINED
Wreck Condition/Salvage History
"The “Oil Wreck” was an oil tanker that was sunk on May 5, 1942 by the U-507 during WWII. The ship
was transporting oil in its large cargo holds when it was sunk. Still today, and for the past 60+ years, the
wreck leaks its cargo oil marking the surface with an oil slick and giving the wreck it’s name, “Oil
Wreck,” because the official name of the wreck is still unknown.
The wreck lies on the bottom with a 120-degree list to starboard, almost upside down. The starboard side
is buried in the sand, with the port side rising enough off the bottom that divers can enter the wreck. The
bow is mostly intact but damaged. Amidships, the wreck is broken in two just in front of the boilers. One
of the boilers is dislodged and now sits upright in the wreckage, while the other sits as it did when the
Section 1: Vessel Background Information: Remediation of Underwater Legacy Environmental Threats (RULET)
6
ship was in service. From the boiler area to the stern, the ship is badly broken up. The hull still rises off
the bottom, but the superstructure is broken and scattered. The engine room area is open allowing access
and a swim-through. One blade of the prop still exists and both windlasses are visible, one lying in the
sand next to the wreck and the other still on the ship.
Due to the location of the wreck being in the shrimp grounds, nets drape parts of the wreck. Sea turtle
remains are stuck in the nets, revealing just how deadly these nets can be to all wildlife in the sea."
-http://wreckdiveguide.com/oil-wreck/
The tanker was sighted 5 days later on May 7th gutted and still burning, so USS Coral (PY-15) sank her
by gunfire. Wreck is known by divers as the "oil wreck."
-B.M. Browing Jr., "U.S. Merchant Vessel War Casualties of World War II", (Naval Institute Press,
1996), 90-91.
Archaeological Assessment
The archaeological assessment provides additional primary source based documentation about the sinking
of vessels. It also provides condition-based archaeological assessment of the wrecks when possible. It
does not provide a risk-based score or definitively assess the pollution risk or lack thereof from these
vessels, but includes additional information that could not be condensed into database form.
Where the current condition of a shipwreck is not known, data from other archaeological studies of
similar types of shipwrecks provide the means for brief explanations of what the shipwreck might look
like and specifically, whether it is thought there is sufficient structural integrity to retain oil. This is more
subjective than the Pollution Potential Tree and computer-generated resource at risk models, and as such
provides an additional viewpoint to examine risk assessments and assess the threat posed by these
shipwrecks. It also addresses questions of historical significance and the relevant historic preservation
laws and regulations that will govern on-site assessments.
In some cases where little additional historic information has been uncovered about the loss of a vessel,
archaeological assessments cannot be made with any degree of certainty and were not prepared. For
vessels with full archaeological assessments, NOAA archaeologists and contracted archivists have taken
photographs of primary source documents from the National Archives that can be made available for
future research or on-site activities.
Assessment
The tanker Joseph M. Cudahy has been listed as a higher priority shipwreck because it is one of the
shipwrecks in U.S. Coast Guard District 7 that NOAA has confirmed contains oil. Local divers and
boaters know the shipwreck as the “oil wreck” due to an oil sheen that has commonly been observed
above the wreck for over 60 years. Although the ship is known to contain oil and was carrying a cargo of
78,000 bbl of oil (half lubricating oil and half fuel oil or crude oil depending on the report) and had a
bunker capacity of 12,141 bbl of Bunker C fuel oil, the violent nature in which the tanker was lost makes
it appear unlikely that much recoverable oil remains.

Section 1: Vessel Background Information: Remediation of Underwater Legacy Environmental Threats (RULET)
7
On the night of 4 May 1942, the tanker was hit by one torpedo in the number four starboard tank (Fig. 1-
1), which was loaded with lubricating oil. At the torpedo impact point, hull plates were blown outwards
and a fire broke out amidships. As the surviving members of the crew abandoned ship, the fire spread
across the entire length of the vessel and caused multiple explosions in tanks five through nine, which
were carrying fuel oil or crude oil. Three days later, on 7 May 1942, USS Coral spotted the tanker
“completely gutted and burning” and sank it with gunfire because it was a hazard to navigation and
beyond salvage.
Figure 1-1: U.S. Coast Guard diagram of the location of torpedo impact and fires aboard Joseph M. Cudahy (Image
courtesy of National Archives, Washington, DC).
Today the wreck believed to be Joseph M. Cudahy (the wreck has never been positively identified) lies
almost completely upside down but is propped up enough that divers report it is possible to enter the
inverted cargo tanks. The bow section is reportedly unremarkable, but the stern offers divers with a view
of the engines and the boilers. Although divers have not reported where the oil on the wreck is located,
there are reports that the surface sheen is often larger after a storm or after divers enter the wreck and their
bubbles seemingly stir up oil remaining in the tanks. Other reports have also mentioned that oil is
sometimes found on SCUBA diving equipment after divers complete a penetration dive into the
shipwreck.
From these reports, it appears likely that any oil remaining in the shipwreck is residue that has been
trapped in the inverted tanks of the wreck and is stirred up by storms and diving activity. A determination
of how much oil could remain inside the tanker cannot be made with any degree of accuracy without an in
water examination. Based on how often SCUBA divers and fishing charter boats visit this site, it may be
more reasonable and practical for the U.S. Coast Guard to continue to engage with these communities to
obtain additional information about the wreck than to conduct an in-water assessment of the vessel. The
shallow depth and relatively good visibility on the site may make it a good candidate for a simple site
reconnaissance and survey.
It should be noted that this vessel is of historic significance and will require appropriate actions be taken
under the National Historic Preservation Act (NHPA) and possibly the Sunken Military Craft Act
(SMCA) prior to any actions that could impact the integrity of the vessel. This vessel may be eligible for
Section 1: Vessel Background Information: Remediation of Underwater Legacy Environmental Threats (RULET)
8
listing on the National Register of Historic Places. The site is also considered a war grave and appropriate
actions should be undertaken to minimize disturbance to the site.
Background Information References
Vessel Image Sources: Mariners Museum Library, Newport News, VA)
Construction Diagrams or Plans in RULET Database? Yes, midship section plan
Text References:
http://www.uboat.net/allies/merchants/ships/1605.html
http://wreckdiveguide.com/oil-wreck/
http://uwex.us/061907.htm
AWOIS database No. 102
NIMA database WK_No 36012
Global Wrecks database NSS_ID 549503
Coast Guard database ID 5728
B.M. Browing Jr., "U.S. Merchant Vessel War Casualties of World War II", (Naval Institute Press, 1996),
90-91.
C. Hocking, "Dictionary of Disasters at Sea During the Age of Steam: Including sailing ships and ships of
war lost in action 1824-1962" (Lloyd's Register of Shipping, 1969), 364
M. Wiggins "Torpedoes in the Gulf: Galveston and the U-Boats 1942-1943" Texas A&M University
Press, College Station (1995), 24, 52.
Vessel Risk Factors
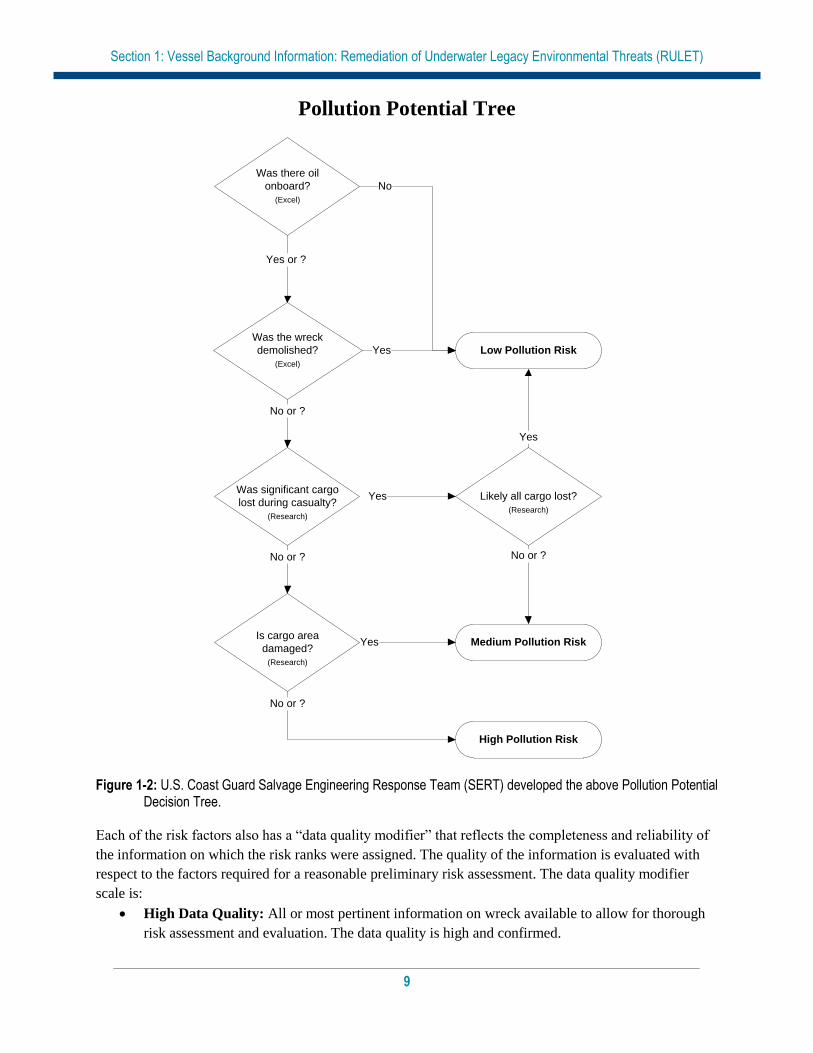
In this section, the risk factors that are associated with the vessel are defined and then applied to the
Joseph M. Cudahy based on the information available. These factors are reflected in the pollution
potential risk assessment development by the U.S. Coast Guard Salvage Engineering Response Team
(SERT) as a means to apply a salvage engineer’s perspective to the historical information gathered by
NOAA. This analysis reflected in Figure 1-2 is simple and straightforward and, in combination with the
accompanying archaeological assessment, provides a picture of the wreck that is as complete as possible
based on current knowledge and best professional judgment. This assessment does not take into
consideration operational constraints such as depth or unknown location, but rather attempts to provide a
replicable and objective screening of the historical date for each vessel. SERT reviewed the general
historical information available for the database as a whole and provided a stepwise analysis for an initial
indication of Low/Medium/High values for each vessel.
In some instances, nuances from the archaeological assessment may provide additional input that will
amend the score for Section 1. Where available, additional information that may have bearing on
operational considerations for any assessment or remediation activities is provided.
Each risk factor is characterized as either High, Medium, or Low Risk or a category-appropriate
equivalent such as No, Unknown, Yes, or Yes Partially. The risk categories correlate to the decision
points reflected in Figure 1-2.
Section 1: Vessel Background Information: Remediation of Underwater Legacy Environmental Threats (RULET)
9
Pollution Potential Tree
Figure 1-2: U.S. Coast Guard Salvage Engineering Response Team (SERT) developed the above Pollution Potential Decision Tree.
Each of the risk factors also has a “data quality modifier” that reflects the completeness and reliability of
the information on which the risk ranks were assigned. The quality of the information is evaluated with
respect to the factors required for a reasonable preliminary risk assessment. The data quality modifier
scale is:
High Data Quality: All or most pertinent information on wreck available to allow for thorough
risk assessment and evaluation. The data quality is high and confirmed.
Was there oil
onboard?
(Excel)
Was the wreck
demolished?
(Excel)
Yes or ?
Low Pollution Risk
No
Yes
Medium Pollution Risk
High Pollution Risk
No or ?
Was significant cargo
lost during casualty?
(Research)
Yes
Is cargo area
damaged?
(Research)
No or ?
No or ?
Yes
Likely all cargo lost?
(Research)
No or ?
Yes
Section 1: Vessel Background Information: Remediation of Underwater Legacy Environmental Threats (RULET)
10
Medium Data Quality: Much information on wreck available, but some key factor data are
missing or the data quality is questionable or not verified. Some additional research needed.
Low Data Quality: Significant issues exist with missing data on wreck that precludes making
preliminary risk assessment, and/or the data quality is suspect. Significant additional research
needed.
In the following sections, the definition of low, medium, and high for each risk factor is provided. Also,
the classification for the Joseph M. Cudahy is provided, both as text and as shading of the applicable
degree of risk bullet.
Pollution Potential Factors
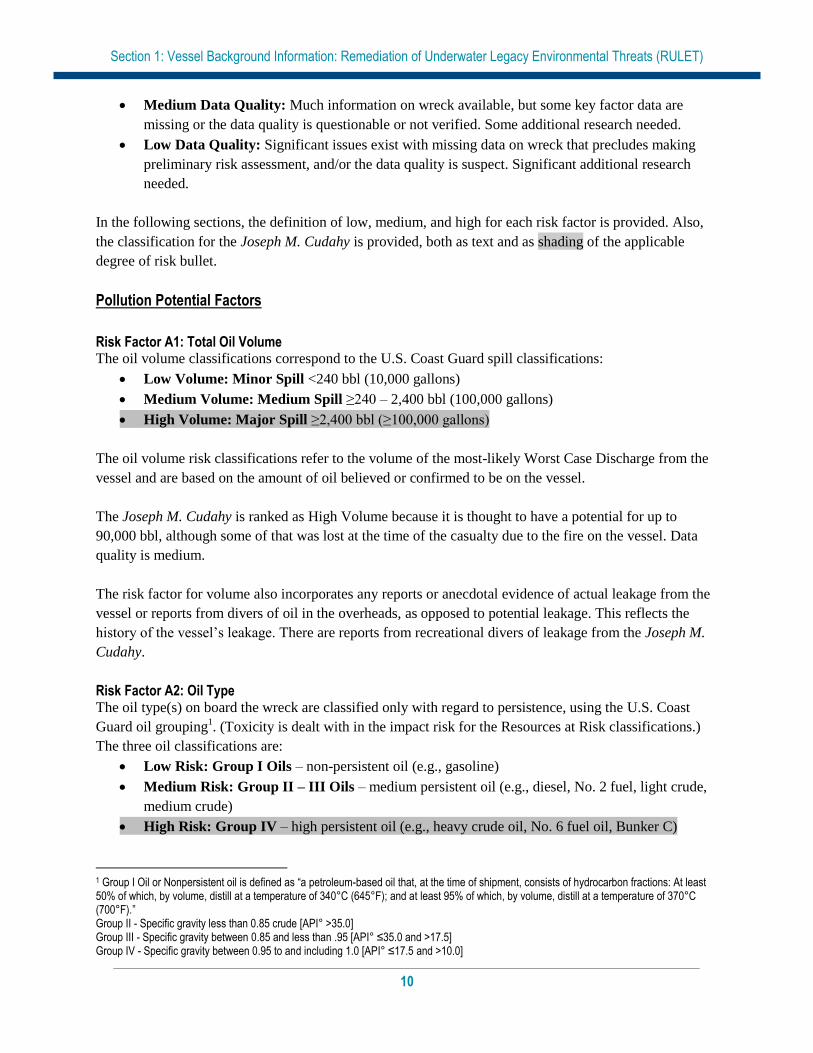
Risk Factor A1: Total Oil Volume The oil volume classifications correspond to the U.S. Coast Guard spill classifications:
Low Volume: Minor Spill <240 bbl (10,000 gallons)
Medium Volume: Medium Spill ≥240 – 2,400 bbl (100,000 gallons)
High Volume: Major Spill ≥2,400 bbl (≥100,000 gallons)
The oil volume risk classifications refer to the volume of the most-likely Worst Case Discharge from the
vessel and are based on the amount of oil believed or confirmed to be on the vessel.
The Joseph M. Cudahy is ranked as High Volume because it is thought to have a potential for up to
90,000 bbl, although some of that was lost at the time of the casualty due to the fire on the vessel. Data
quality is medium.
The risk factor for volume also incorporates any reports or anecdotal evidence of actual leakage from the
vessel or reports from divers of oil in the overheads, as opposed to potential leakage. This reflects the
history of the vessel’s leakage. There are reports from recreational divers of leakage from the Joseph M.
Cudahy.
Risk Factor A2: Oil Type The oil type(s) on board the wreck are classified only with regard to persistence, using the U.S. Coast
Guard oil grouping1. (Toxicity is dealt with in the impact risk for the Resources at Risk classifications.)
The three oil classifications are:
Low Risk: Group I Oils – non-persistent oil (e.g., gasoline)
Medium Risk: Group II – III Oils – medium persistent oil (e.g., diesel, No. 2 fuel, light crude,
medium crude)
High Risk: Group IV – high persistent oil (e.g., heavy crude oil, No. 6 fuel oil, Bunker C)
1 Group I Oil or Nonpersistent oil is defined as “a petroleum-based oil that, at the time of shipment, consists of hydrocarbon fractions: At least 50% of which, by volume, distill at a temperature of 340°C (645°F); and at least 95% of which, by volume, distill at a temperature of 370°C (700°F).” Group II - Specific gravity less than 0.85 crude [API° >35.0] Group III - Specific gravity between 0.85 and less than .95 [API° ≤35.0 and >17.5] Group IV - Specific gravity between 0.95 to and including 1.0 [API° ≤17.5 and >10.0]
Section 1: Vessel Background Information: Remediation of Underwater Legacy Environmental Threats (RULET)
11
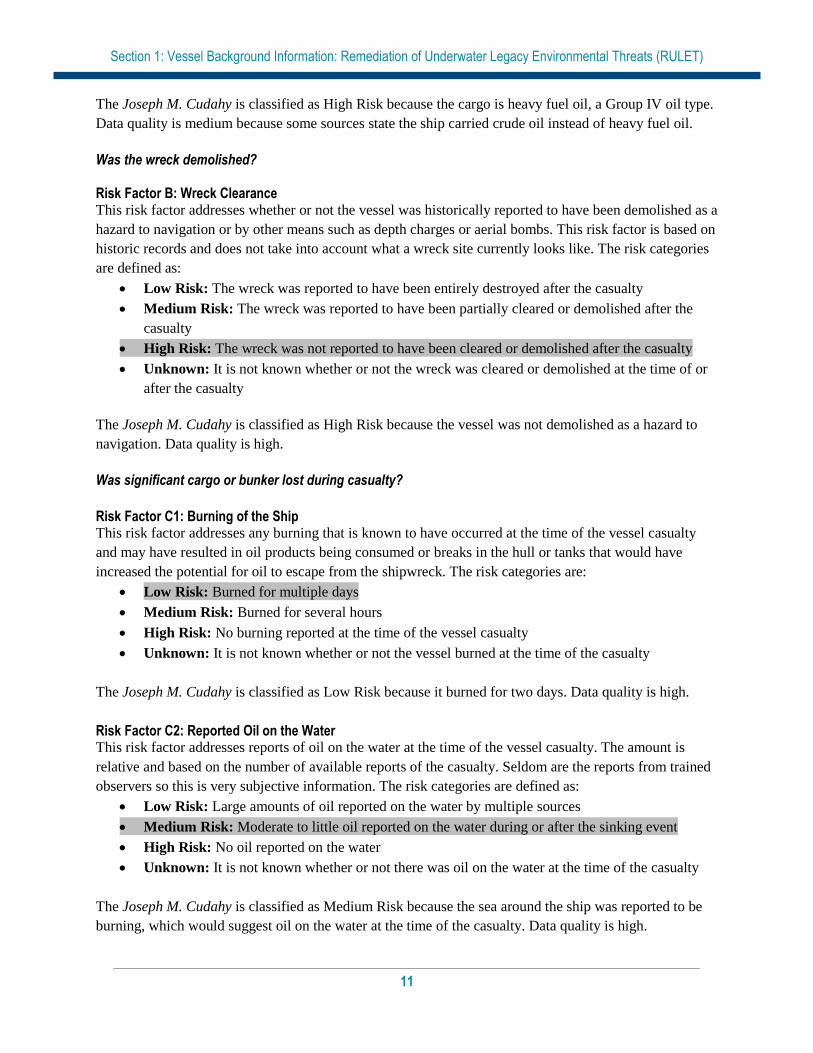
The Joseph M. Cudahy is classified as High Risk because the cargo is heavy fuel oil, a Group IV oil type.
Data quality is medium because some sources state the ship carried crude oil instead of heavy fuel oil.
Was the wreck demolished?
Risk Factor B: Wreck Clearance This risk factor addresses whether or not the vessel was historically reported to have been demolished as a
hazard to navigation or by other means such as depth charges or aerial bombs. This risk factor is based on
historic records and does not take into account what a wreck site currently looks like. The risk categories
are defined as:
Low Risk: The wreck was reported to have been entirely destroyed after the casualty
Medium Risk: The wreck was reported to have been partially cleared or demolished after the
casualty
High Risk: The wreck was not reported to have been cleared or demolished after the casualty
Unknown: It is not known whether or not the wreck was cleared or demolished at the time of or
after the casualty
The Joseph M. Cudahy is classified as High Risk because the vessel was not demolished as a hazard to
navigation. Data quality is high.
Was significant cargo or bunker lost during casualty?
Risk Factor C1: Burning of the Ship This risk factor addresses any burning that is known to have occurred at the time of the vessel casualty
and may have resulted in oil products being consumed or breaks in the hull or tanks that would have
increased the potential for oil to escape from the shipwreck. The risk categories are:
Low Risk: Burned for multiple days
Medium Risk: Burned for several hours
High Risk: No burning reported at the time of the vessel casualty
Unknown: It is not known whether or not the vessel burned at the time of the casualty
The Joseph M. Cudahy is classified as Low Risk because it burned for two days. Data quality is high.
Risk Factor C2: Reported Oil on the Water This risk factor addresses reports of oil on the water at the time of the vessel casualty. The amount is
relative and based on the number of available reports of the casualty. Seldom are the reports from trained
observers so this is very subjective information. The risk categories are defined as:
Low Risk: Large amounts of oil reported on the water by multiple sources
Medium Risk: Moderate to little oil reported on the water during or after the sinking event
High Risk: No oil reported on the water
Unknown: It is not known whether or not there was oil on the water at the time of the casualty
The Joseph M. Cudahy is classified as Medium Risk because the sea around the ship was reported to be
burning, which would suggest oil on the water at the time of the casualty. Data quality is high.

Section 1: Vessel Background Information: Remediation of Underwater Legacy Environmental Threats (RULET)
12
Is the cargo area damaged?
Risk Factor D1: Nature of the Casualty This risk factor addresses the means by which the vessel sank. The risk associated with each type of
casualty is determined by the how violent the sinking event was and the factors that would contribute to
increased initial damage or destruction of the vessel (which would lower the risk of oil, other cargo, or
munitions remaining on board). The risk categories are:
Low Risk: Multiple torpedo detonations, multiple mines, severe explosion
Medium Risk: Single torpedo, shellfire, single mine, rupture of hull, breaking in half, grounding
on rocky shoreline
High Risk: Foul weather, grounding on soft bottom, collision
Unknown: The cause of the loss of the vessel is not known
The Joseph M. Cudahy is classified as Low Risk because there were two torpedo detonations, and an
explosion. Data quality is high.
Risk Factor D2: Structural Breakup This risk factor takes into account how many pieces the vessel broke into during the sinking event or
since sinking. This factor addresses how likely it is that multiple components of a ship were broken apart
including tanks, valves, and pipes. Experience has shown that even vessels broken in three large sections
can still have significant pollutants on board if the sections still have some structural integrity. The risk
categories are:
Low Risk: The vessel is broken into more than three pieces
Medium Risk: The vessel is broken into two-three pieces
High Risk: The vessel is not broken and remains as one contiguous piece
Unknown: It is currently not known whether or not the vessel broke apart at the time of loss or
after sinking
The Joseph M. Cudahy is classified as Medium Risk because it is in two pieces. Data quality is high.
Factors That May Impact Potential Operations
Orientation (degrees) This factor addresses what may be known about the current orientation of the intact pieces of the wreck
(with emphasis on those pieces where tanks are located) on the seafloor. For example, if the vessel turtled,
not only may it have avoided demolition as a hazard to navigation, but it has a higher likelihood of
retaining an oil cargo in the non-vented and more structurally robust bottom of the hull.
The Joseph M. Cudahy lies on the bottom with a 120-degree list to starboard, almost upside down. Data
quality is high.
Depth Depth information is provided where known. In many instances, depth will be an approximation based on
charted depths at the last known locations.
The depth for Joseph M. Cudahy is 145 feet. Data quality is high.
Section 1: Vessel Background Information: Remediation of Underwater Legacy Environmental Threats (RULET)
13
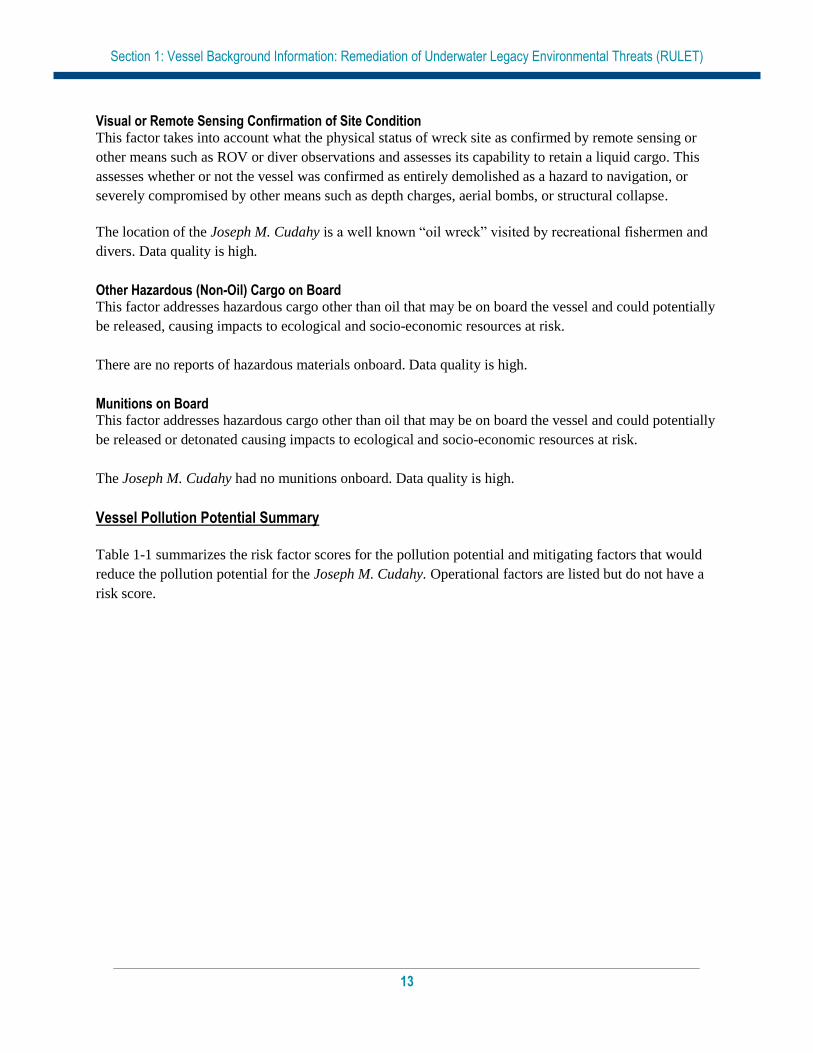
Visual or Remote Sensing Confirmation of Site Condition This factor takes into account what the physical status of wreck site as confirmed by remote sensing or
other means such as ROV or diver observations and assesses its capability to retain a liquid cargo. This
assesses whether or not the vessel was confirmed as entirely demolished as a hazard to navigation, or
severely compromised by other means such as depth charges, aerial bombs, or structural collapse.
The location of the Joseph M. Cudahy is a well known “oil wreck” visited by recreational fishermen and
divers. Data quality is high.
Other Hazardous (Non-Oil) Cargo on Board This factor addresses hazardous cargo other than oil that may be on board the vessel and could potentially
be released, causing impacts to ecological and socio-economic resources at risk.
There are no reports of hazardous materials onboard. Data quality is high.
Munitions on Board This factor addresses hazardous cargo other than oil that may be on board the vessel and could potentially
be released or detonated causing impacts to ecological and socio-economic resources at risk.
The Joseph M. Cudahy had no munitions onboard. Data quality is high.
Vessel Pollution Potential Summary
Table 1-1 summarizes the risk factor scores for the pollution potential and mitigating factors that would
reduce the pollution potential for the Joseph M. Cudahy. Operational factors are listed but do not have a
risk score.

Section 1: Vessel Background Information: Remediation of Underwater Legacy Environmental Threats (RULET)
14
Table 1-1: Summary matrix for the vessel risk factors for the Joseph M. Cudahy color-coded as red (high risk), yellow (medium risk), and green (low risk).
Vessel Risk Factors Data
Quality Score
Comments Risk
Score
Pollution Potential Factors
A1: Oil Volume (total bbl) Medium Maximum of 90,000 bbl, reported to be leaking
Med
A2: Oil Type Medium Bunker C or combination of Bunker C and fuel or lubricating oil (possibly crude instead of fuel oil)
B: Wreck Clearance High Not cleared
C1: Burning of the Ship High Burned for two days
C2: Oil on Water High Water around ship burned, therefore oil in the water
D1: Nature of Casualty High Hit by two torpedoes, explosion
D2: Structural Breakup High In two sections
Archaeological Assessment
Archaeological Assessment High Detailed sinking records and site reports exist, assessment is believed to be very accurate
Not Scored
Operational Factors
Wreck Orientation High 120-degree list
Not Scored
Depth High 145 feet
Visual or Remote Sensing Confirmation of Site Condition
High Recreational dive site, recreational fishing site
Other Hazardous Materials Onboard
High No
Munitions Onboard High No
Gravesite (Civilian/Military) High Yes
Historical Protection Eligibility (NHPA/SMCA)
High NHPA and possibly SMCA
Section 2: Environmental Impact Modeling
15
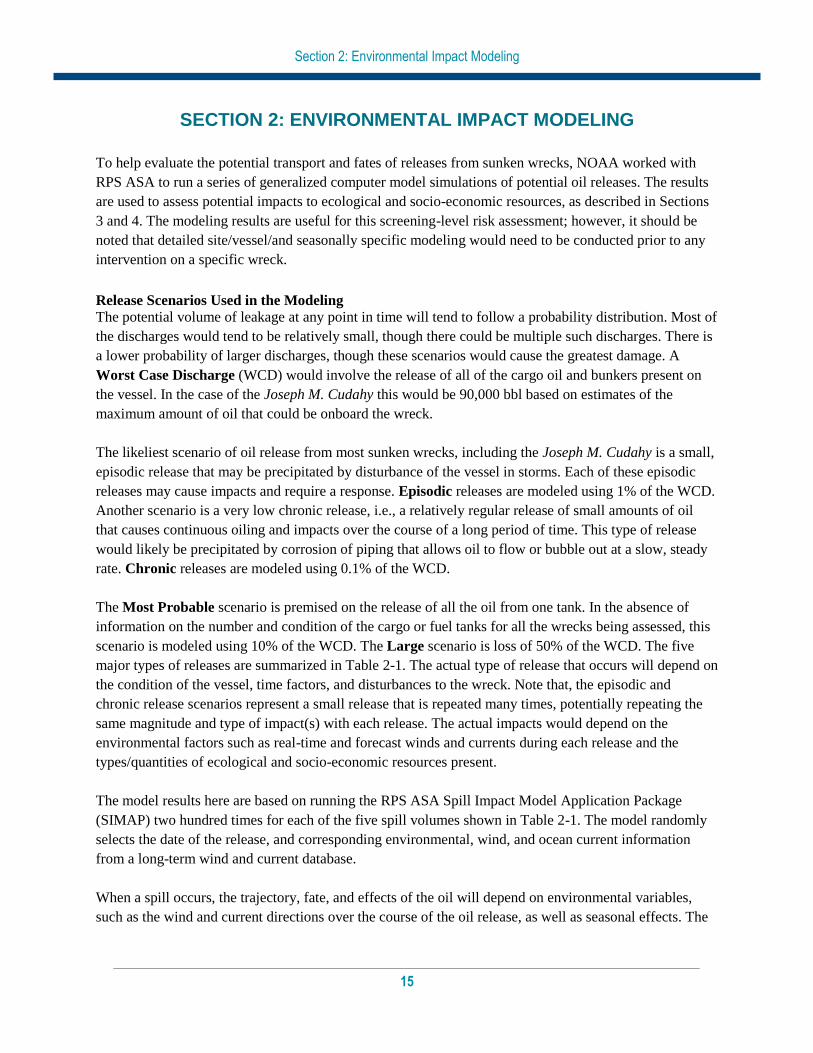
SECTION 2: ENVIRONMENTAL IMPACT MODELING
To help evaluate the potential transport and fates of releases from sunken wrecks, NOAA worked with
RPS ASA to run a series of generalized computer model simulations of potential oil releases. The results
are used to assess potential impacts to ecological and socio-economic resources, as described in Sections
3 and 4. The modeling results are useful for this screening-level risk assessment; however, it should be
noted that detailed site/vessel/and seasonally specific modeling would need to be conducted prior to any
intervention on a specific wreck.
Release Scenarios Used in the Modeling
The potential volume of leakage at any point in time will tend to follow a probability distribution. Most of
the discharges would tend to be relatively small, though there could be multiple such discharges. There is
a lower probability of larger discharges, though these scenarios would cause the greatest damage. A
Worst Case Discharge (WCD) would involve the release of all of the cargo oil and bunkers present on
the vessel. In the case of the Joseph M. Cudahy this would be 90,000 bbl based on estimates of the
maximum amount of oil that could be onboard the wreck.
The likeliest scenario of oil release from most sunken wrecks, including the Joseph M. Cudahy is a small,
episodic release that may be precipitated by disturbance of the vessel in storms. Each of these episodic
releases may cause impacts and require a response. Episodic releases are modeled using 1% of the WCD.
Another scenario is a very low chronic release, i.e., a relatively regular release of small amounts of oil
that causes continuous oiling and impacts over the course of a long period of time. This type of release
would likely be precipitated by corrosion of piping that allows oil to flow or bubble out at a slow, steady
rate. Chronic releases are modeled using 0.1% of the WCD.
The Most Probable scenario is premised on the release of all the oil from one tank. In the absence of
information on the number and condition of the cargo or fuel tanks for all the wrecks being assessed, this
scenario is modeled using 10% of the WCD. The Large scenario is loss of 50% of the WCD. The five
major types of releases are summarized in Table 2-1. The actual type of release that occurs will depend on
the condition of the vessel, time factors, and disturbances to the wreck. Note that, the episodic and
chronic release scenarios represent a small release that is repeated many times, potentially repeating the
same magnitude and type of impact(s) with each release. The actual impacts would depend on the
environmental factors such as real-time and forecast winds and currents during each release and the
types/quantities of ecological and socio-economic resources present.
The model results here are based on running the RPS ASA Spill Impact Model Application Package
(SIMAP) two hundred times for each of the five spill volumes shown in Table 2-1. The model randomly
selects the date of the release, and corresponding environmental, wind, and ocean current information
from a long-term wind and current database.
When a spill occurs, the trajectory, fate, and effects of the oil will depend on environmental variables,
such as the wind and current directions over the course of the oil release, as well as seasonal effects. The
Section 2: Environmental Impact Modeling
16
magnitude and nature of potential impacts to resources will also generally have a strong seasonal
component (e.g., timing of bird migrations, turtle nesting periods, fishing seasons, and tourism seasons).
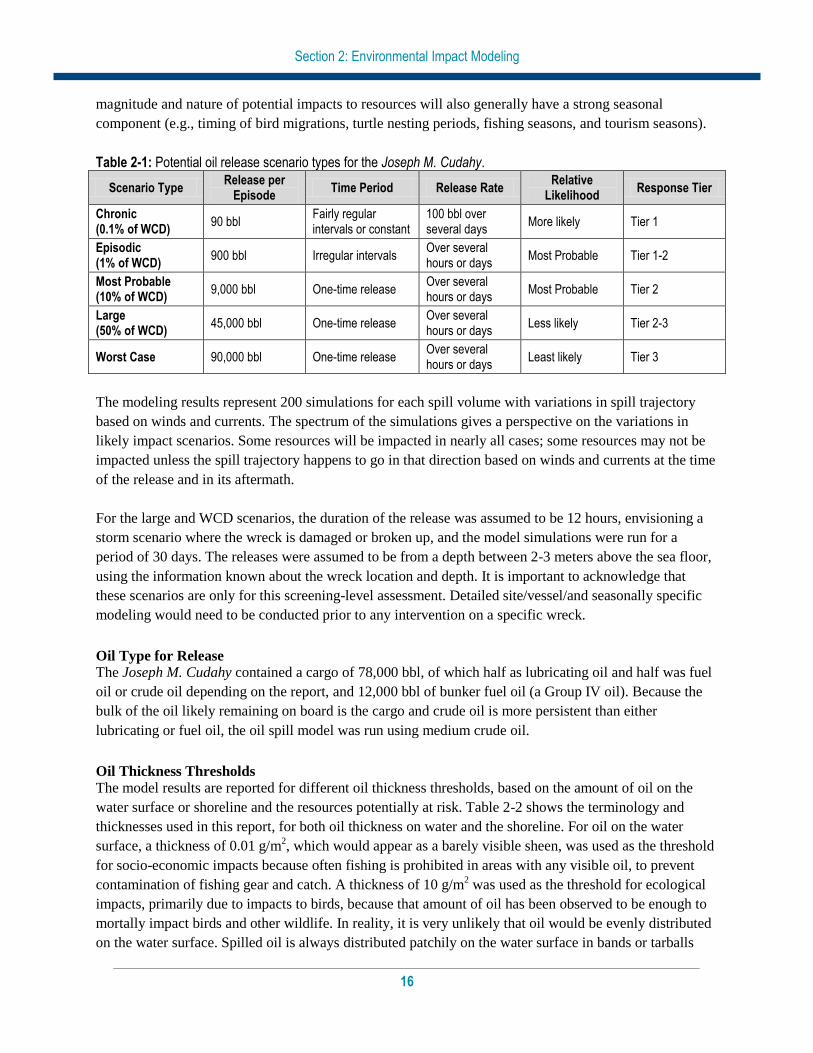
Table 2-1: Potential oil release scenario types for the Joseph M. Cudahy.
Scenario Type Release per
Episode Time Period Release Rate
Relative Likelihood
Response Tier
Chronic (0.1% of WCD)
90 bbl Fairly regular intervals or constant
100 bbl over several days
More likely Tier 1
Episodic (1% of WCD)
900 bbl Irregular intervals Over several hours or days
Most Probable Tier 1-2
Most Probable (10% of WCD)
9,000 bbl One-time release Over several hours or days
Most Probable Tier 2
Large (50% of WCD)
45,000 bbl One-time release Over several hours or days
Less likely Tier 2-3
Worst Case 90,000 bbl One-time release Over several hours or days
Least likely Tier 3
The modeling results represent 200 simulations for each spill volume with variations in spill trajectory
based on winds and currents. The spectrum of the simulations gives a perspective on the variations in
likely impact scenarios. Some resources will be impacted in nearly all cases; some resources may not be
impacted unless the spill trajectory happens to go in that direction based on winds and currents at the time
of the release and in its aftermath.
For the large and WCD scenarios, the duration of the release was assumed to be 12 hours, envisioning a
storm scenario where the wreck is damaged or broken up, and the model simulations were run for a
period of 30 days. The releases were assumed to be from a depth between 2-3 meters above the sea floor,
using the information known about the wreck location and depth. It is important to acknowledge that
these scenarios are only for this screening-level assessment. Detailed site/vessel/and seasonally specific
modeling would need to be conducted prior to any intervention on a specific wreck.
Oil Type for Release
The Joseph M. Cudahy contained a cargo of 78,000 bbl, of which half as lubricating oil and half was fuel
oil or crude oil depending on the report, and 12,000 bbl of bunker fuel oil (a Group IV oil). Because the
bulk of the oil likely remaining on board is the cargo and crude oil is more persistent than either
lubricating or fuel oil, the oil spill model was run using medium crude oil.
Oil Thickness Thresholds
The model results are reported for different oil thickness thresholds, based on the amount of oil on the
water surface or shoreline and the resources potentially at risk. Table 2-2 shows the terminology and
thicknesses used in this report, for both oil thickness on water and the shoreline. For oil on the water
surface, a thickness of 0.01 g/m2, which would appear as a barely visible sheen, was used as the threshold
for socio-economic impacts because often fishing is prohibited in areas with any visible oil, to prevent
contamination of fishing gear and catch. A thickness of 10 g/m2 was used as the threshold for ecological
impacts, primarily due to impacts to birds, because that amount of oil has been observed to be enough to
mortally impact birds and other wildlife. In reality, it is very unlikely that oil would be evenly distributed
on the water surface. Spilled oil is always distributed patchily on the water surface in bands or tarballs
Section 2: Environmental Impact Modeling
17
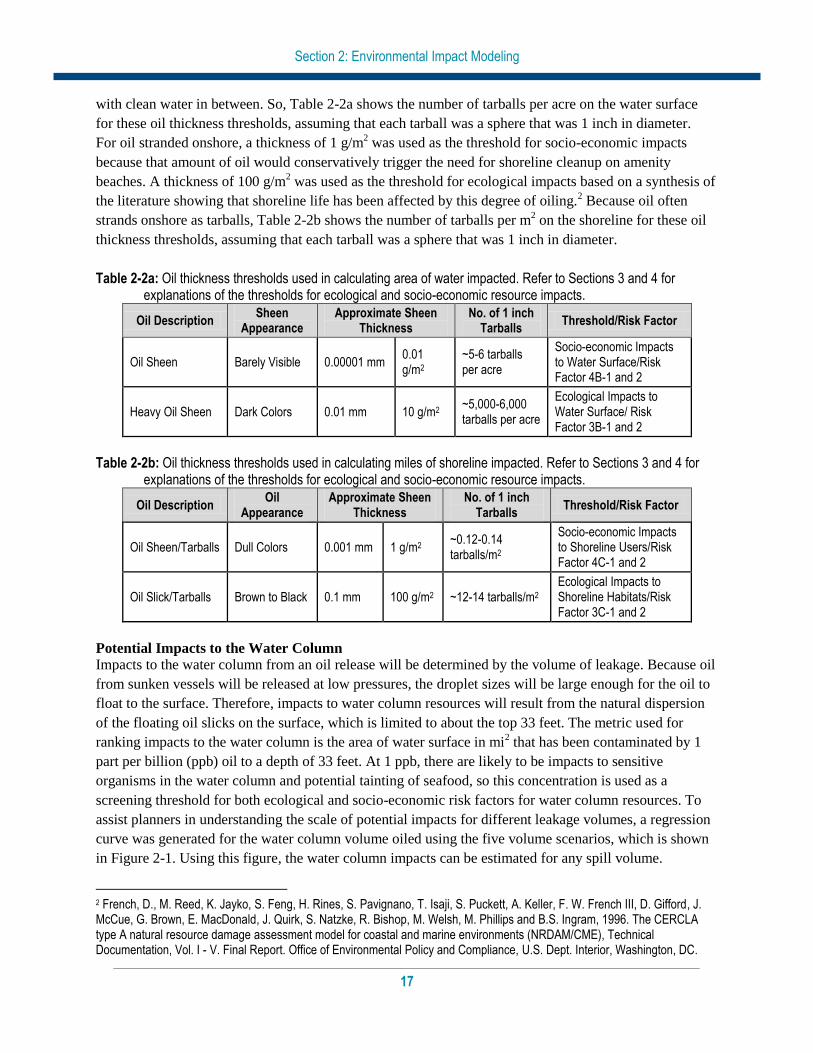
with clean water in between. So, Table 2-2a shows the number of tarballs per acre on the water surface
for these oil thickness thresholds, assuming that each tarball was a sphere that was 1 inch in diameter.
For oil stranded onshore, a thickness of 1 g/m2 was used as the threshold for socio-economic impacts
because that amount of oil would conservatively trigger the need for shoreline cleanup on amenity
beaches. A thickness of 100 g/m2 was used as the threshold for ecological impacts based on a synthesis of
the literature showing that shoreline life has been affected by this degree of oiling.2 Because oil often
strands onshore as tarballs, Table 2-2b shows the number of tarballs per m2 on the shoreline for these oil
thickness thresholds, assuming that each tarball was a sphere that was 1 inch in diameter.
Table 2-2a: Oil thickness thresholds used in calculating area of water impacted. Refer to Sections 3 and 4 for explanations of the thresholds for ecological and socio-economic resource impacts.
Oil Description Sheen
Appearance Approximate Sheen
Thickness No. of 1 inch
Tarballs Threshold/Risk Factor
Oil Sheen Barely Visible 0.00001 mm 0.01 g/m2
~5-6 tarballs per acre
Socio-economic Impacts to Water Surface/Risk Factor 4B-1 and 2
Heavy Oil Sheen Dark Colors 0.01 mm 10 g/m2 ~5,000-6,000 tarballs per acre
Ecological Impacts to Water Surface/ Risk Factor 3B-1 and 2
Table 2-2b: Oil thickness thresholds used in calculating miles of shoreline impacted. Refer to Sections 3 and 4 for explanations of the thresholds for ecological and socio-economic resource impacts.
Oil Description Oil
Appearance Approximate Sheen
Thickness No. of 1 inch
Tarballs Threshold/Risk Factor
Oil Sheen/Tarballs Dull Colors 0.001 mm 1 g/m2 ~0.12-0.14 tarballs/m2
Socio-economic Impacts to Shoreline Users/Risk Factor 4C-1 and 2
Oil Slick/Tarballs Brown to Black 0.1 mm 100 g/m2 ~12-14 tarballs/m2 Ecological Impacts to Shoreline Habitats/Risk Factor 3C-1 and 2
Potential Impacts to the Water Column
Impacts to the water column from an oil release will be determined by the volume of leakage. Because oil
from sunken vessels will be released at low pressures, the droplet sizes will be large enough for the oil to
float to the surface. Therefore, impacts to water column resources will result from the natural dispersion
of the floating oil slicks on the surface, which is limited to about the top 33 feet. The metric used for
ranking impacts to the water column is the area of water surface in mi2 that has been contaminated by 1
part per billion (ppb) oil to a depth of 33 feet. At 1 ppb, there are likely to be impacts to sensitive
organisms in the water column and potential tainting of seafood, so this concentration is used as a
screening threshold for both ecological and socio-economic risk factors for water column resources. To
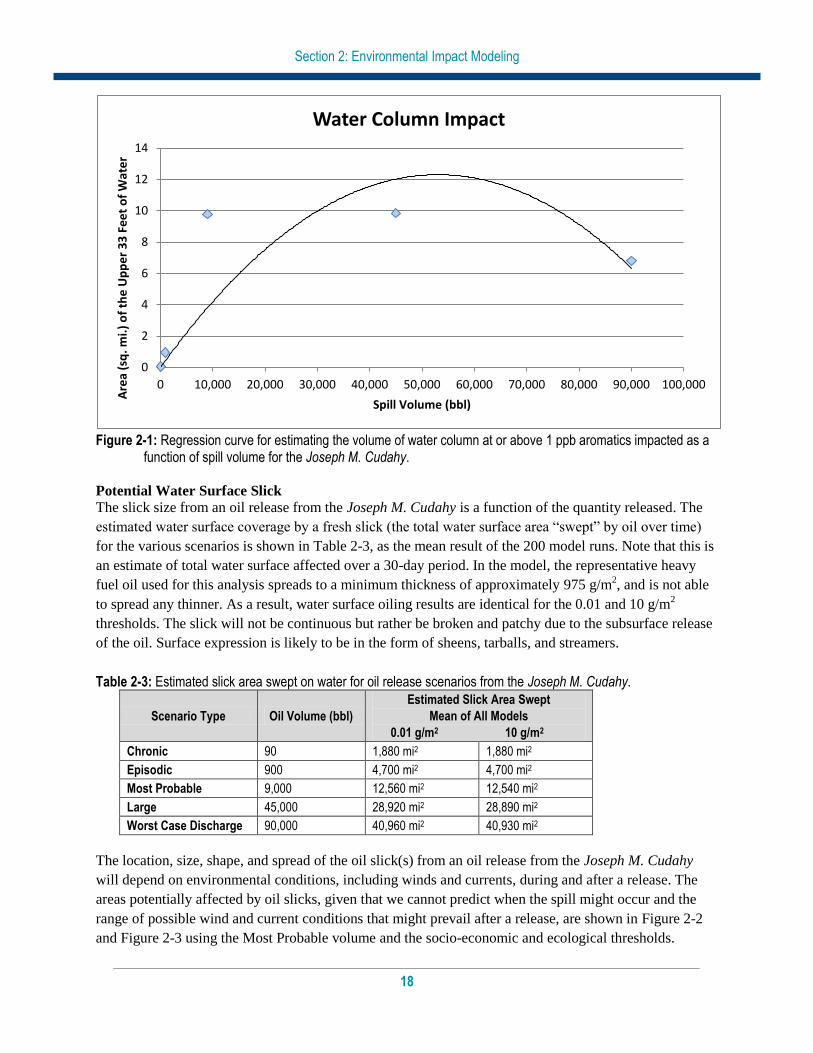
assist planners in understanding the scale of potential impacts for different leakage volumes, a regression
curve was generated for the water column volume oiled using the five volume scenarios, which is shown
in Figure 2-1. Using this figure, the water column impacts can be estimated for any spill volume.
2 French, D., M. Reed, K. Jayko, S. Feng, H. Rines, S. Pavignano, T. Isaji, S. Puckett, A. Keller, F. W. French III, D. Gifford, J. McCue, G. Brown, E. MacDonald, J. Quirk, S. Natzke, R. Bishop, M. Welsh, M. Phillips and B.S. Ingram, 1996. The CERCLA type A natural resource damage assessment model for coastal and marine environments (NRDAM/CME), Technical Documentation, Vol. I - V. Final Report. Office of Environmental Policy and Compliance, U.S. Dept. Interior, Washington, DC.
Section 2: Environmental Impact Modeling
18
Figure 2-1: Regression curve for estimating the volume of water column at or above 1 ppb aromatics impacted as a
function of spill volume for the Joseph M. Cudahy.
Potential Water Surface Slick
The slick size from an oil release from the Joseph M. Cudahy is a function of the quantity released. The
estimated water surface coverage by a fresh slick (the total water surface area “swept” by oil over time)
for the various scenarios is shown in Table 2-3, as the mean result of the 200 model runs. Note that this is
an estimate of total water surface affected over a 30-day period. In the model, the representative heavy
fuel oil used for this analysis spreads to a minimum thickness of approximately 975 g/m2, and is not able
to spread any thinner. As a result, water surface oiling results are identical for the 0.01 and 10 g/m2
thresholds. The slick will not be continuous but rather be broken and patchy due to the subsurface release
of the oil. Surface expression is likely to be in the form of sheens, tarballs, and streamers.
Table 2-3: Estimated slick area swept on water for oil release scenarios from the Joseph M. Cudahy.
Scenario Type Oil Volume (bbl)
Estimated Slick Area Swept
Mean of All Models
0.01 g/m2 10 g/m2
Chronic 90 1,880 mi2 1,880 mi2
Episodic 900 4,700 mi2 4,700 mi2
Most Probable 9,000 12,560 mi2 12,540 mi2
Large 45,000 28,920 mi2 28,890 mi2
Worst Case Discharge 90,000 40,960 mi2 40,930 mi2
The location, size, shape, and spread of the oil slick(s) from an oil release from the Joseph M. Cudahy
will depend on environmental conditions, including winds and currents, during and after a release. The
areas potentially affected by oil slicks, given that we cannot predict when the spill might occur and the
range of possible wind and current conditions that might prevail after a release, are shown in Figure 2-2
and Figure 2-3 using the Most Probable volume and the socio-economic and ecological thresholds.
0
2
4
6
8
10
12
14
0 10,000 20,000 30,000 40,000 50,000 60,000 70,000 80,000 90,000 100,000
Are
a (s
q. m
i.)
of
the
Up
pe
r 3
3 F
ee
t o
f W
ate
r
Spill Volume (bbl)
Water Column Impact

Section 2: Environmental Impact Modeling
19
Figure 2-2: Probability of surface oil (exceeding 0.01 g/m2) from the Most Probable spill of 9,000 bbl of crude oil from
the Joseph M. Cudahy at the threshold for socio-economic resources at risk.
Figure 2-3: Probability of surface oil (exceeding 10 g/m2) from the Most Probable spill of 9,000 bbl of crude oil from
the Joseph M. Cudahy at the threshold for ecological resources at risk.
Section 2: Environmental Impact Modeling
20
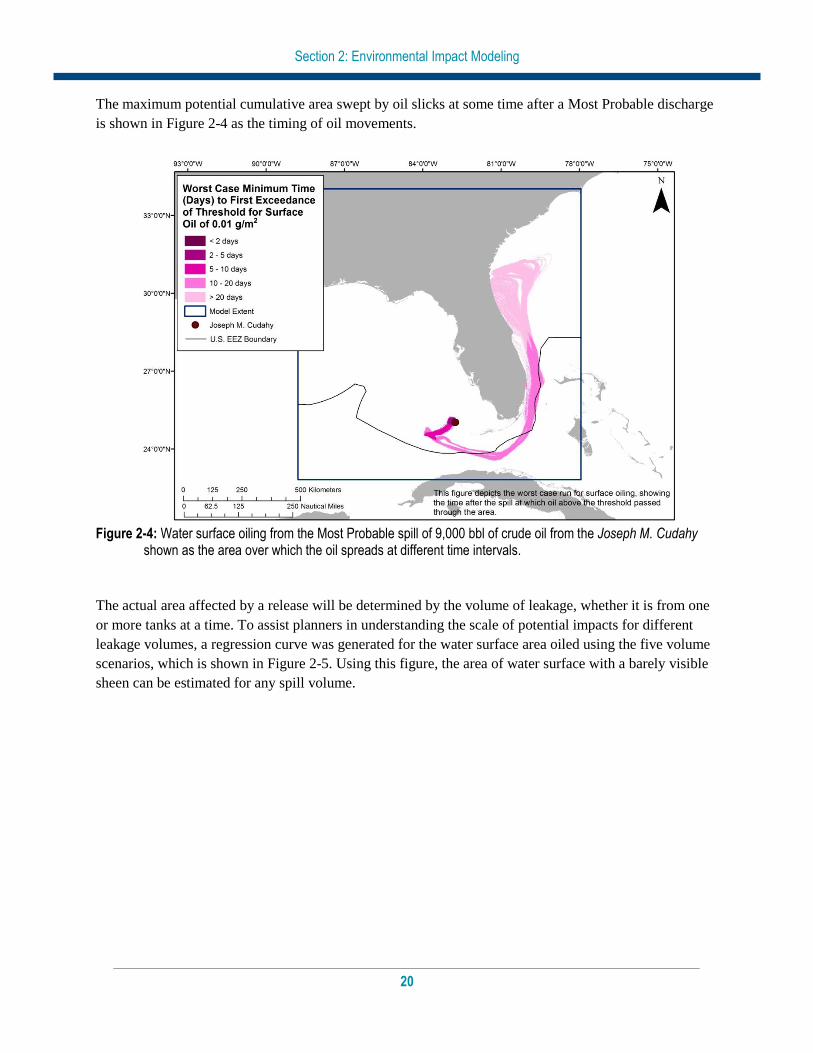
The maximum potential cumulative area swept by oil slicks at some time after a Most Probable discharge
is shown in Figure 2-4 as the timing of oil movements.
Figure 2-4: Water surface oiling from the Most Probable spill of 9,000 bbl of crude oil from the Joseph M. Cudahy
shown as the area over which the oil spreads at different time intervals.
The actual area affected by a release will be determined by the volume of leakage, whether it is from one
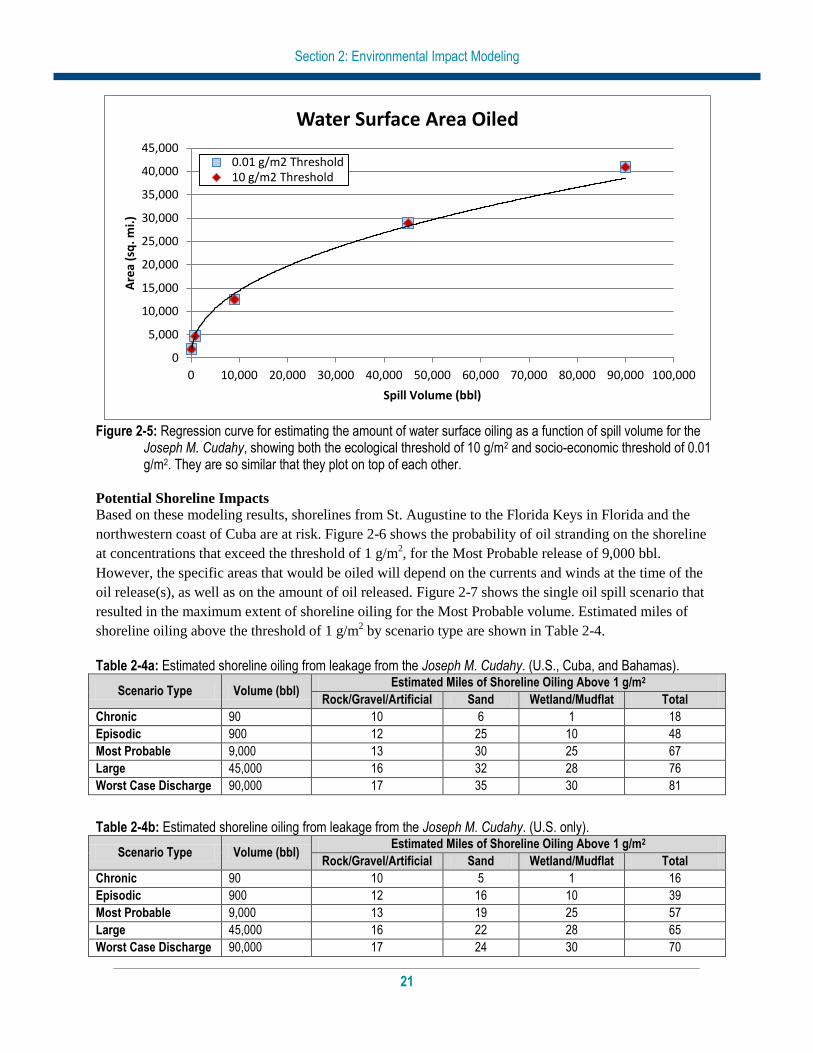
or more tanks at a time. To assist planners in understanding the scale of potential impacts for different
leakage volumes, a regression curve was generated for the water surface area oiled using the five volume
scenarios, which is shown in Figure 2-5. Using this figure, the area of water surface with a barely visible
sheen can be estimated for any spill volume.
Section 2: Environmental Impact Modeling
21
Figure 2-5: Regression curve for estimating the amount of water surface oiling as a function of spill volume for the
Joseph M. Cudahy, showing both the ecological threshold of 10 g/m2 and socio-economic threshold of 0.01 g/m2. They are so similar that they plot on top of each other.
Potential Shoreline Impacts
Based on these modeling results, shorelines from St. Augustine to the Florida Keys in Florida and the
northwestern coast of Cuba are at risk. Figure 2-6 shows the probability of oil stranding on the shoreline
at concentrations that exceed the threshold of 1 g/m2, for the Most Probable release of 9,000 bbl.
However, the specific areas that would be oiled will depend on the currents and winds at the time of the
oil release(s), as well as on the amount of oil released. Figure 2-7 shows the single oil spill scenario that
resulted in the maximum extent of shoreline oiling for the Most Probable volume. Estimated miles of
shoreline oiling above the threshold of 1 g/m2 by scenario type are shown in Table 2-4.
Table 2-4a: Estimated shoreline oiling from leakage from the Joseph M. Cudahy. (U.S., Cuba, and Bahamas).
Scenario Type Volume (bbl) Estimated Miles of Shoreline Oiling Above 1 g/m2
Rock/Gravel/Artificial Sand Wetland/Mudflat Total
Chronic 90 10 6 1 18
Episodic 900 12 25 10 48
Most Probable 9,000 13 30 25 67
Large 45,000 16 32 28 76
Worst Case Discharge 90,000 17 35 30 81
Table 2-4b: Estimated shoreline oiling from leakage from the Joseph M. Cudahy. (U.S. only).
Scenario Type Volume (bbl) Estimated Miles of Shoreline Oiling Above 1 g/m2
Rock/Gravel/Artificial Sand Wetland/Mudflat Total
Chronic 90 10 5 1 16
Episodic 900 12 16 10 39
Most Probable 9,000 13 19 25 57
Large 45,000 16 22 28 65
Worst Case Discharge 90,000 17 24 30 70
0
5,000
10,000
15,000
20,000
25,000
30,000
35,000
40,000
45,000
0 10,000 20,000 30,000 40,000 50,000 60,000 70,000 80,000 90,000 100,000
Are
a (s
q. m
i.)
Spill Volume (bbl)
Water Surface Area Oiled
0.01 g/m2 Threshold 10 g/m2 Threshold

Section 2: Environmental Impact Modeling
22
Figure 2-6: Probability of shoreline oiling (exceeding 1.0 g/m2) from the Most Probable Discharge of 9,000 bbl of
crude oil from the Joseph M. Cudahy.
Figure 2-7: The extent and degree of shoreline oiling from the single model run of the Most Probable Discharge of
9,000 bbl of crude oil from the Joseph M. Cudahy that resulted in the greatest shoreline oiling.
Section 2: Environmental Impact Modeling
23
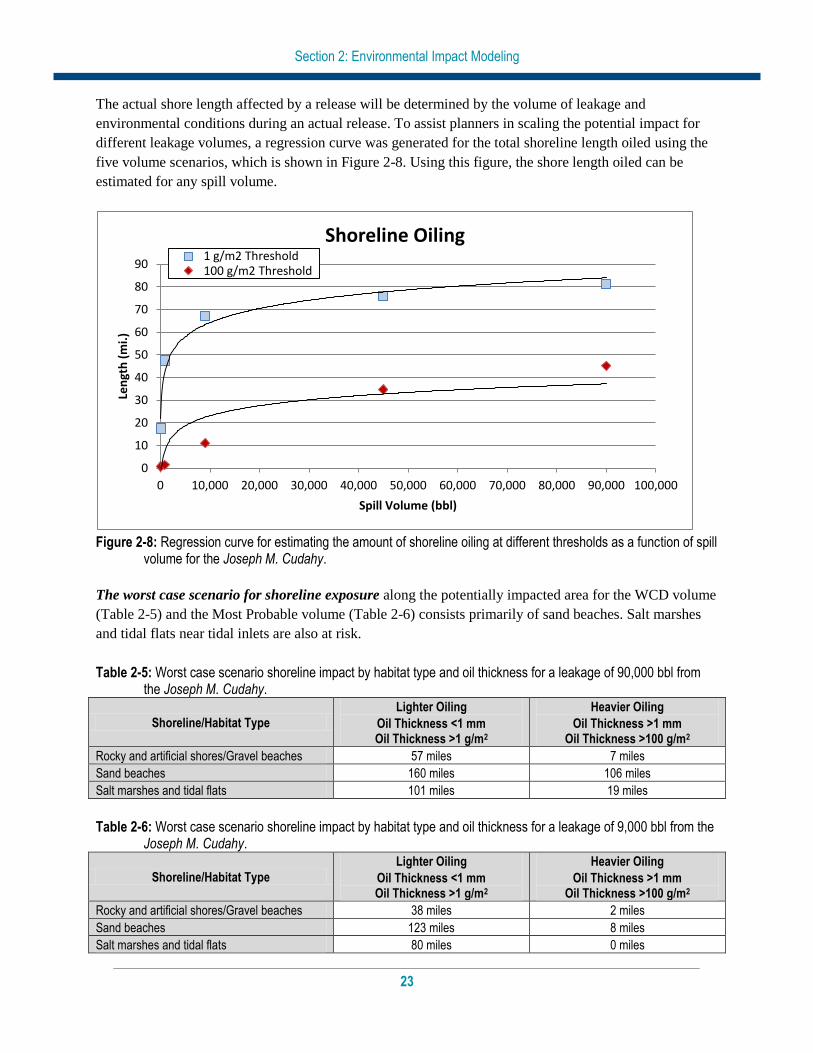
The actual shore length affected by a release will be determined by the volume of leakage and
environmental conditions during an actual release. To assist planners in scaling the potential impact for
different leakage volumes, a regression curve was generated for the total shoreline length oiled using the
five volume scenarios, which is shown in Figure 2-8. Using this figure, the shore length oiled can be
estimated for any spill volume.
Figure 2-8: Regression curve for estimating the amount of shoreline oiling at different thresholds as a function of spill
volume for the Joseph M. Cudahy.
The worst case scenario for shoreline exposure along the potentially impacted area for the WCD volume
(Table 2-5) and the Most Probable volume (Table 2-6) consists primarily of sand beaches. Salt marshes
and tidal flats near tidal inlets are also at risk.
Table 2-5: Worst case scenario shoreline impact by habitat type and oil thickness for a leakage of 90,000 bbl from the Joseph M. Cudahy.
Shoreline/Habitat Type
Lighter Oiling
Oil Thickness <1 mm Oil Thickness >1 g/m2
Heavier Oiling
Oil Thickness >1 mm Oil Thickness >100 g/m2
Rocky and artificial shores/Gravel beaches 57 miles 7 miles
Sand beaches 160 miles 106 miles
Salt marshes and tidal flats 101 miles 19 miles
Table 2-6: Worst case scenario shoreline impact by habitat type and oil thickness for a leakage of 9,000 bbl from the Joseph M. Cudahy.
Shoreline/Habitat Type
Lighter Oiling
Oil Thickness <1 mm Oil Thickness >1 g/m2
Heavier Oiling
Oil Thickness >1 mm Oil Thickness >100 g/m2
Rocky and artificial shores/Gravel beaches 38 miles 2 miles
Sand beaches 123 miles 8 miles
Salt marshes and tidal flats 80 miles 0 miles
0
10
20
30
40
50
60
70
80
90
0 10,000 20,000 30,000 40,000 50,000 60,000 70,000 80,000 90,000 100,000
Len
gth
(m
i.)
Spill Volume (bbl)
Shoreline Oiling 1 g/m2 Threshold 100 g/m2 Threshold
Section 3: Ecological Resources at Risk
24
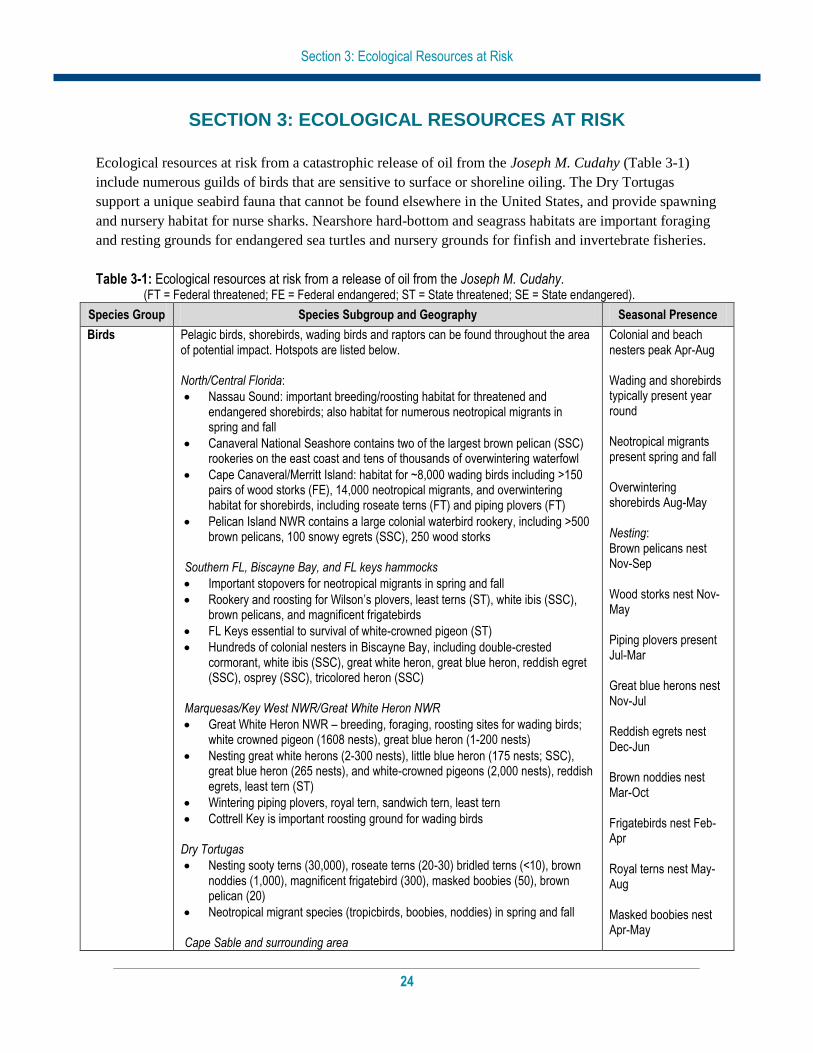
SECTION 3: ECOLOGICAL RESOURCES AT RISK
Ecological resources at risk from a catastrophic release of oil from the Joseph M. Cudahy (Table 3-1)
include numerous guilds of birds that are sensitive to surface or shoreline oiling. The Dry Tortugas
support a unique seabird fauna that cannot be found elsewhere in the United States, and provide spawning
and nursery habitat for nurse sharks. Nearshore hard-bottom and seagrass habitats are important foraging
and resting grounds for endangered sea turtles and nursery grounds for finfish and invertebrate fisheries.
Table 3-1: Ecological resources at risk from a release of oil from the Joseph M. Cudahy. (FT = Federal threatened; FE = Federal endangered; ST = State threatened; SE = State endangered).
Species Group Species Subgroup and Geography Seasonal Presence
Birds Pelagic birds, shorebirds, wading birds and raptors can be found throughout the area of potential impact. Hotspots are listed below. North/Central Florida:
Nassau Sound: important breeding/roosting habitat for threatened and endangered shorebirds; also habitat for numerous neotropical migrants in spring and fall
Canaveral National Seashore contains two of the largest brown pelican (SSC) rookeries on the east coast and tens of thousands of overwintering waterfowl
Cape Canaveral/Merritt Island: habitat for ~8,000 wading birds including >150 pairs of wood storks (FE), 14,000 neotropical migrants, and overwintering habitat for shorebirds, including roseate terns (FT) and piping plovers (FT)
Pelican Island NWR contains a large colonial waterbird rookery, including >500 brown pelicans, 100 snowy egrets (SSC), 250 wood storks
Southern FL, Biscayne Bay, and FL keys hammocks
Important stopovers for neotropical migrants in spring and fall
Rookery and roosting for Wilson’s plovers, least terns (ST), white ibis (SSC), brown pelicans, and magnificent frigatebirds
FL Keys essential to survival of white-crowned pigeon (ST)
Hundreds of colonial nesters in Biscayne Bay, including double-crested cormorant, white ibis (SSC), great white heron, great blue heron, reddish egret (SSC), osprey (SSC), tricolored heron (SSC)
Marquesas/Key West NWR/Great White Heron NWR
Great White Heron NWR – breeding, foraging, roosting sites for wading birds; white crowned pigeon (1608 nests), great blue heron (1-200 nests)
Nesting great white herons (2-300 nests), little blue heron (175 nests; SSC), great blue heron (265 nests), and white-crowned pigeons (2,000 nests), reddish egrets, least tern (ST)
Wintering piping plovers, royal tern, sandwich tern, least tern
Cottrell Key is important roosting ground for wading birds
Dry Tortugas
Nesting sooty terns (30,000), roseate terns (20-30) bridled terns (<10), brown noddies (1,000), magnificent frigatebird (300), masked boobies (50), brown pelican (20)
Neotropical migrant species (tropicbirds, boobies, noddies) in spring and fall Cape Sable and surrounding area
Colonial and beach nesters peak Apr-Aug Wading and shorebirds typically present year round Neotropical migrants present spring and fall Overwintering shorebirds Aug-May Nesting: Brown pelicans nest Nov-Sep Wood storks nest Nov-May Piping plovers present Jul-Mar Great blue herons nest Nov-Jul Reddish egrets nest Dec-Jun Brown noddies nest Mar-Oct Frigatebirds nest Feb-Apr Royal terns nest May-Aug Masked boobies nest Apr-May
Section 3: Ecological Resources at Risk
25
Species Group Species Subgroup and Geography Seasonal Presence
Least tern, white-crowned pigeon, wood stork nesting in Whitewater Bay
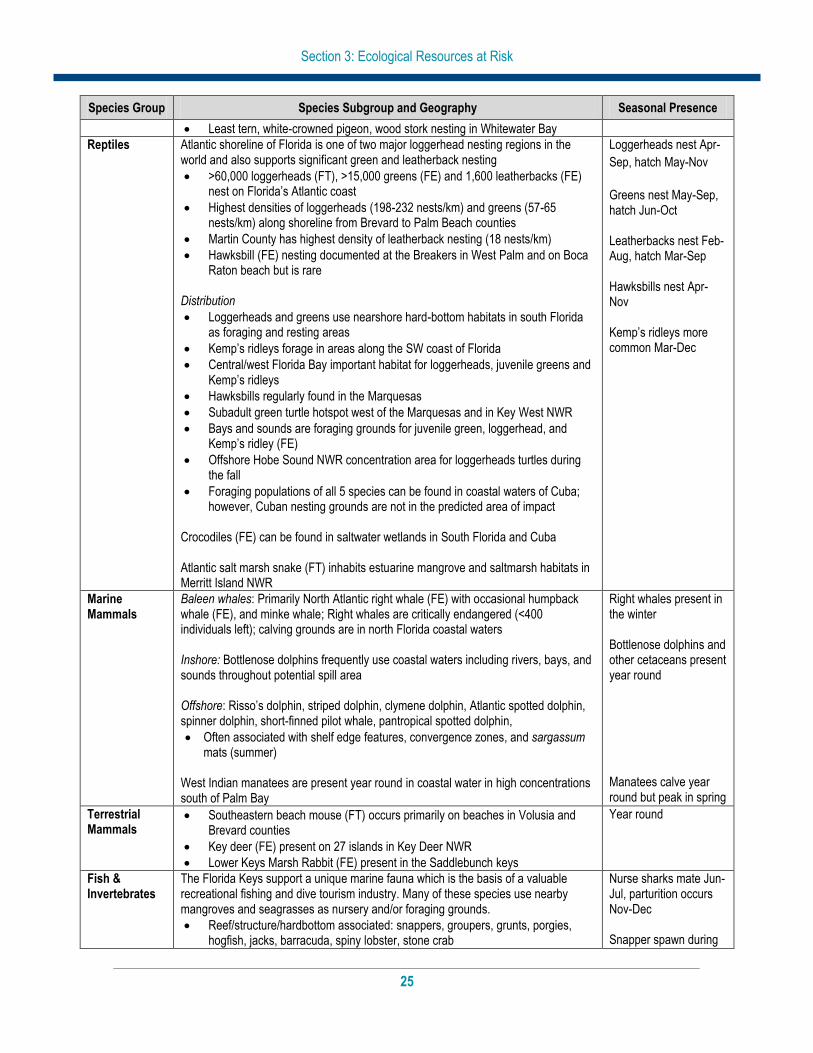
Reptiles Atlantic shoreline of Florida is one of two major loggerhead nesting regions in the world and also supports significant green and leatherback nesting
>60,000 loggerheads (FT), >15,000 greens (FE) and 1,600 leatherbacks (FE) nest on Florida’s Atlantic coast
Highest densities of loggerheads (198-232 nests/km) and greens (57-65 nests/km) along shoreline from Brevard to Palm Beach counties
Martin County has highest density of leatherback nesting (18 nests/km)
Hawksbill (FE) nesting documented at the Breakers in West Palm and on Boca Raton beach but is rare
Distribution
Loggerheads and greens use nearshore hard-bottom habitats in south Florida as foraging and resting areas
Kemp’s ridleys forage in areas along the SW coast of Florida
Central/west Florida Bay important habitat for loggerheads, juvenile greens and Kemp’s ridleys
Hawksbills regularly found in the Marquesas
Subadult green turtle hotspot west of the Marquesas and in Key West NWR
Bays and sounds are foraging grounds for juvenile green, loggerhead, and Kemp’s ridley (FE)
Offshore Hobe Sound NWR concentration area for loggerheads turtles during the fall
Foraging populations of all 5 species can be found in coastal waters of Cuba; however, Cuban nesting grounds are not in the predicted area of impact
Crocodiles (FE) can be found in saltwater wetlands in South Florida and Cuba Atlantic salt marsh snake (FT) inhabits estuarine mangrove and saltmarsh habitats in Merritt Island NWR
Loggerheads nest Apr-
Sep, hatch May-Nov
Greens nest May-Sep, hatch Jun-Oct Leatherbacks nest Feb-Aug, hatch Mar-Sep Hawksbills nest Apr-Nov Kemp’s ridleys more common Mar-Dec
Marine Mammals
Baleen whales: Primarily North Atlantic right whale (FE) with occasional humpback whale (FE), and minke whale; Right whales are critically endangered (<400 individuals left); calving grounds are in north Florida coastal waters
Inshore: Bottlenose dolphins frequently use coastal waters including rivers, bays, and sounds throughout potential spill area Offshore: Risso’s dolphin, striped dolphin, clymene dolphin, Atlantic spotted dolphin, spinner dolphin, short-finned pilot whale, pantropical spotted dolphin,
Often associated with shelf edge features, convergence zones, and sargassum mats (summer)
West Indian manatees are present year round in coastal water in high concentrations south of Palm Bay
Right whales present in the winter Bottlenose dolphins and other cetaceans present year round Manatees calve year round but peak in spring
Terrestrial Mammals
Southeastern beach mouse (FT) occurs primarily on beaches in Volusia and Brevard counties
Key deer (FE) present on 27 islands in Key Deer NWR
Lower Keys Marsh Rabbit (FE) present in the Saddlebunch keys
Year round
Fish & Invertebrates
The Florida Keys support a unique marine fauna which is the basis of a valuable recreational fishing and dive tourism industry. Many of these species use nearby mangroves and seagrasses as nursery and/or foraging grounds.
Reef/structure/hardbottom associated: snappers, groupers, grunts, porgies, hogfish, jacks, barracuda, spiny lobster, stone crab
Nurse sharks mate Jun-Jul, parturition occurs Nov-Dec Snapper spawn during

Section 3: Ecological Resources at Risk
26
Species Group Species Subgroup and Geography Seasonal Presence
Inshore: snook, red drum, tarpon, spotted seatrout, cobia, bonefish, queen conch
Pelagic/offshore: mackerels, tunas, wahoo, dolphinfish, sailfish, marlins Important concentration/conservation areas:
Smalltooth sawfish (FE) are most common throughout the keys and the west coast of Florida. Estuarine areas are important juvenile habitat for these species and have been designated critical habitat
Shallow waters are important mating, pupping and nursery grounds for lemon, nurse and bull sharks o Nurse sharks aggregate to mate in the Dry Tortugas and Marquesas and
pup in shallow waters of Florida Bay
Tortugas Ecological Reserve contains important reef fish spawning habitat o Riley’s Hump and Pulley Ridge have been identified as spawning grounds
for some snapper species
Sargassum is important habitat for juvenile of some pelagic fish species (i.e. dolphinfish, jacks, triggerfish)
Florida Keys National Marine Sanctuary includes much of the nearshore waters of the Keys
Queen conch aggregate at various sites throughout the keys reef tract. Higher abundances and densities are found in the lower keys
Tortugas waters support a valuable pink shrimp fishery
the summer Grouper spawn during the winter Lobster spawn Apr-Sep Maximum conch aggregation densities in May and Oct Lemon sharks pup May-Jun Bull sharks pup Jun-Jul
Benthic Habitats
Benthic habitats include abundant seagrass and hardbottom sites
Hardbottom habitats are common in the neritic zone from Vero Beach south
Keys reef tract stretches from the Marquesas to Key Biscayne and is the third longest contiguous barrier reef in the world, only living barrier reef in the U.S.
Expansive seagrass beds are present in coastal waters south of Biscayne Bay and into Florida Bay. Johnson’s seagrass (FE, SE) can be found near Jupiter Inlet and in northern Biscayne Bay Large mangrove forests are important habitats for juvenile fish
Live corals spawn late summer Habitats present year round
The Environmental Sensitivity Index (ESI) atlases for the potentially impacted coastal areas from a leak
from the Joseph M. Cudahy are generally available at each U.S. Coast Guard Sector. They can also be
downloaded at: http://response.restoration.noaa.gov/esi. These maps show detailed spatial information on
the distribution of sensitive shoreline habitats, biological resources, and human-use resources. The tables
on the back of the maps provide more detailed life-history information for each species and location. The
ESI atlases should be consulted to assess the potential environmental resources at risk for specific spill
scenarios. In addition, the Geographic Response Plans within the Area Contingency Plans prepared by the
Area Committee for each U.S. Coast Guard Sector have detailed information on the nearshore and
shoreline ecological resources at risk and should be consulted.
Ecological Risk Factors
Risk Factor 3: Impacts to Ecological Resources at Risk (EcoRAR)
Ecological resources include plants and animals (e.g., fish, birds, invertebrates, and mammals), as well as
the habitats in which they live. All impact factors are evaluated for both the Worst Case and the Most
Section 3: Ecological Resources at Risk
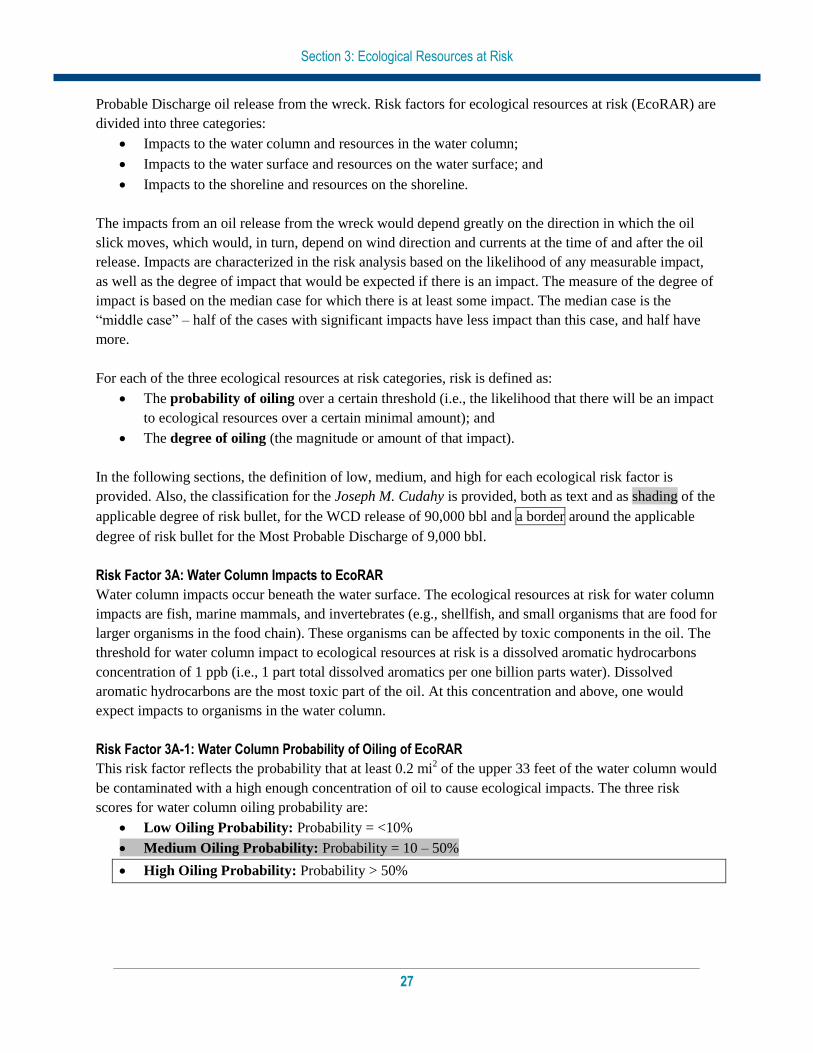
27
Probable Discharge oil release from the wreck. Risk factors for ecological resources at risk (EcoRAR) are
divided into three categories:
Impacts to the water column and resources in the water column;
Impacts to the water surface and resources on the water surface; and
Impacts to the shoreline and resources on the shoreline.
The impacts from an oil release from the wreck would depend greatly on the direction in which the oil
slick moves, which would, in turn, depend on wind direction and currents at the time of and after the oil
release. Impacts are characterized in the risk analysis based on the likelihood of any measurable impact,
as well as the degree of impact that would be expected if there is an impact. The measure of the degree of
impact is based on the median case for which there is at least some impact. The median case is the
“middle case” – half of the cases with significant impacts have less impact than this case, and half have
more.
For each of the three ecological resources at risk categories, risk is defined as:
The probability of oiling over a certain threshold (i.e., the likelihood that there will be an impact
to ecological resources over a certain minimal amount); and
The degree of oiling (the magnitude or amount of that impact).
In the following sections, the definition of low, medium, and high for each ecological risk factor is
provided. Also, the classification for the Joseph M. Cudahy is provided, both as text and as shading of the
applicable degree of risk bullet, for the WCD release of 90,000 bbl and a border around the applicable
degree of risk bullet for the Most Probable Discharge of 9,000 bbl.
Risk Factor 3A: Water Column Impacts to EcoRAR
Water column impacts occur beneath the water surface. The ecological resources at risk for water column
impacts are fish, marine mammals, and invertebrates (e.g., shellfish, and small organisms that are food for
larger organisms in the food chain). These organisms can be affected by toxic components in the oil. The
threshold for water column impact to ecological resources at risk is a dissolved aromatic hydrocarbons
concentration of 1 ppb (i.e., 1 part total dissolved aromatics per one billion parts water). Dissolved
aromatic hydrocarbons are the most toxic part of the oil. At this concentration and above, one would
expect impacts to organisms in the water column.
Risk Factor 3A-1: Water Column Probability of Oiling of EcoRAR
This risk factor reflects the probability that at least 0.2 mi2 of the upper 33 feet of the water column would
be contaminated with a high enough concentration of oil to cause ecological impacts. The three risk
scores for water column oiling probability are:
Low Oiling Probability: Probability = <10%
Medium Oiling Probability: Probability = 10 – 50%
High Oiling Probability: Probability > 50%
Section 3: Ecological Resources at Risk
28
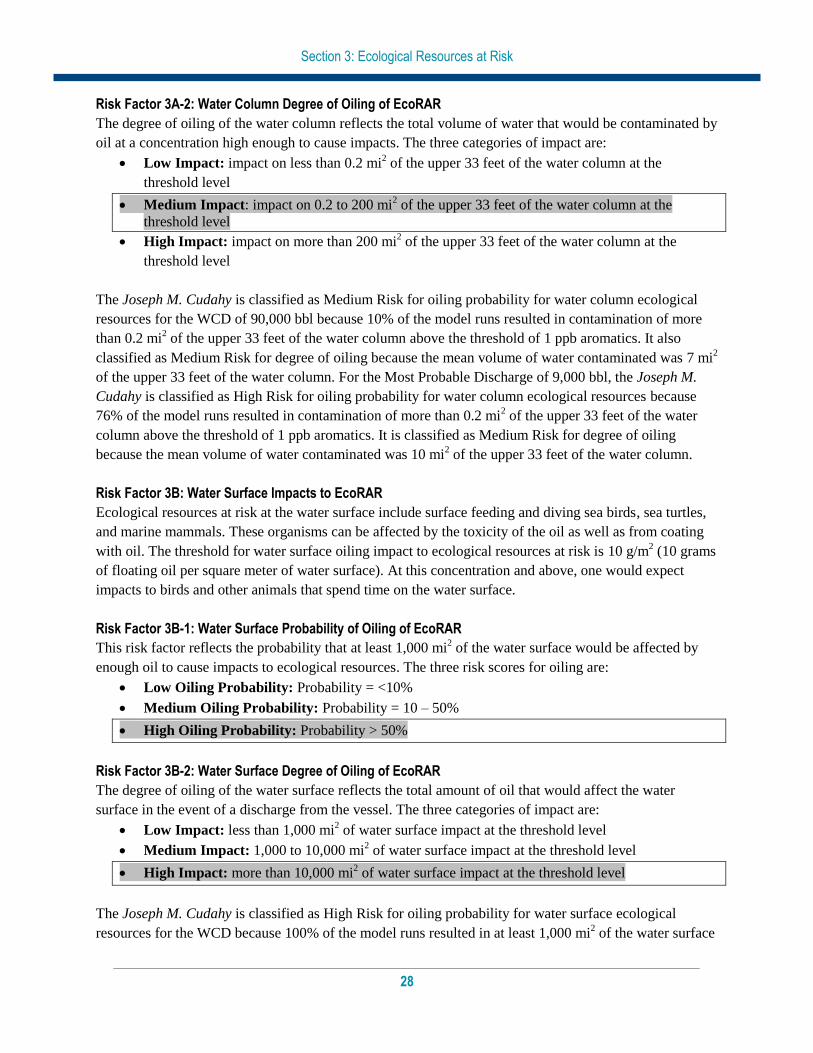
Risk Factor 3A-2: Water Column Degree of Oiling of EcoRAR
The degree of oiling of the water column reflects the total volume of water that would be contaminated by
oil at a concentration high enough to cause impacts. The three categories of impact are:
Low Impact: impact on less than 0.2 mi2 of the upper 33 feet of the water column at the
threshold level
Medium Impact: impact on 0.2 to 200 mi2 of the upper 33 feet of the water column at the
threshold level
High Impact: impact on more than 200 mi2 of the upper 33 feet of the water column at the
threshold level
The Joseph M. Cudahy is classified as Medium Risk for oiling probability for water column ecological
resources for the WCD of 90,000 bbl because 10% of the model runs resulted in contamination of more
than 0.2 mi2 of the upper 33 feet of the water column above the threshold of 1 ppb aromatics. It also
classified as Medium Risk for degree of oiling because the mean volume of water contaminated was 7 mi2
of the upper 33 feet of the water column. For the Most Probable Discharge of 9,000 bbl, the Joseph M.
Cudahy is classified as High Risk for oiling probability for water column ecological resources because
76% of the model runs resulted in contamination of more than 0.2 mi2 of the upper 33 feet of the water
column above the threshold of 1 ppb aromatics. It is classified as Medium Risk for degree of oiling
because the mean volume of water contaminated was 10 mi2 of the upper 33 feet of the water column.
Risk Factor 3B: Water Surface Impacts to EcoRAR
Ecological resources at risk at the water surface include surface feeding and diving sea birds, sea turtles,
and marine mammals. These organisms can be affected by the toxicity of the oil as well as from coating
with oil. The threshold for water surface oiling impact to ecological resources at risk is 10 g/m2 (10 grams
of floating oil per square meter of water surface). At this concentration and above, one would expect
impacts to birds and other animals that spend time on the water surface.
Risk Factor 3B-1: Water Surface Probability of Oiling of EcoRAR
This risk factor reflects the probability that at least 1,000 mi2 of the water surface would be affected by
enough oil to cause impacts to ecological resources. The three risk scores for oiling are:
Low Oiling Probability: Probability = <10%
Medium Oiling Probability: Probability = 10 – 50%
High Oiling Probability: Probability > 50%
Risk Factor 3B-2: Water Surface Degree of Oiling of EcoRAR
The degree of oiling of the water surface reflects the total amount of oil that would affect the water
surface in the event of a discharge from the vessel. The three categories of impact are:
Low Impact: less than 1,000 mi2 of water surface impact at the threshold level
Medium Impact: 1,000 to 10,000 mi2 of water surface impact at the threshold level
High Impact: more than 10,000 mi2 of water surface impact at the threshold level
The Joseph M. Cudahy is classified as High Risk for oiling probability for water surface ecological
resources for the WCD because 100% of the model runs resulted in at least 1,000 mi2 of the water surface
Section 3: Ecological Resources at Risk
29
affected above the threshold of 10 g/m2. It is classified as High Risk for degree of oiling because the mean
area of water contaminated was 40,930 mi2. The Joseph M. Cudahy is classified as High Risk for oiling
probability for water surface ecological resources for the Most Probable Discharge because 100% of the
model runs resulted in at least 1,000 mi2 of the water surface affected above the threshold of 10 g/m
2. It is
classified as High Risk for degree of oiling because the mean area of water contaminated was 12,540 mi2.
Risk Factor 3C: Shoreline Impacts to EcoRAR
The impacts to different types of shorelines vary based on their type and the organisms that live on them.
In this risk analysis, shorelines have been weighted by their degree of sensitivity to oiling. Wetlands are
the most sensitive (weighted as “3” in the impact modeling), rocky and gravel shores are moderately
sensitive (weighted as “2”), and sand beaches (weighted as “1”) are the least sensitive to oil impacts.
Risk Factor 3C-1: Shoreline Probability of Oiling of EcoRAR
This risk factor reflects the probability that the shoreline would be coated by enough oil to cause impacts
to shoreline organisms. The threshold for shoreline oiling impacts to ecological resources at risk is 100
g/m2 (i.e., 100 grams of oil per square meter of shoreline). The three risk scores for oiling are:
Low Oiling Probability: Probability = <10%
Medium Oiling Probability: Probability = 10 – 50%
High Oiling Probability: Probability > 50%
Risk Factor 3C-2: Shoreline Degree of Oiling of EcoRAR
The degree of oiling of the shoreline reflects the length of shorelines oiled by at least 100 g/m2 in the
event of a discharge from the vessel. The three categories of impact are:
Low Impact: less than 10 miles of shoreline impacted at the threshold level
Medium Impact: 10 - 100 miles of shoreline impacted at the threshold level
High Impact: more than 100 miles of shoreline impacted at the threshold level
The Joseph M. Cudahy is classified as High Risk for oiling probability for shoreline ecological resources
for the WCD because 77% of the model runs resulted in shorelines affected above the threshold of 100
g/m2. It is classified as Medium Risk for degree of oiling because the mean weighted length of shoreline
contaminated was 76 miles. The Joseph M. Cudahy is classified as High Risk for oiling probability to
shoreline ecological resources for the Most Probable Discharge because 74% of the model runs resulted
in shorelines affected above the threshold of 100 g/m2. It is classified as Medium Risk for degree of oiling
because the mean weighted length of shoreline contaminated was 16 miles.
Section 3: Ecological Resources at Risk
30
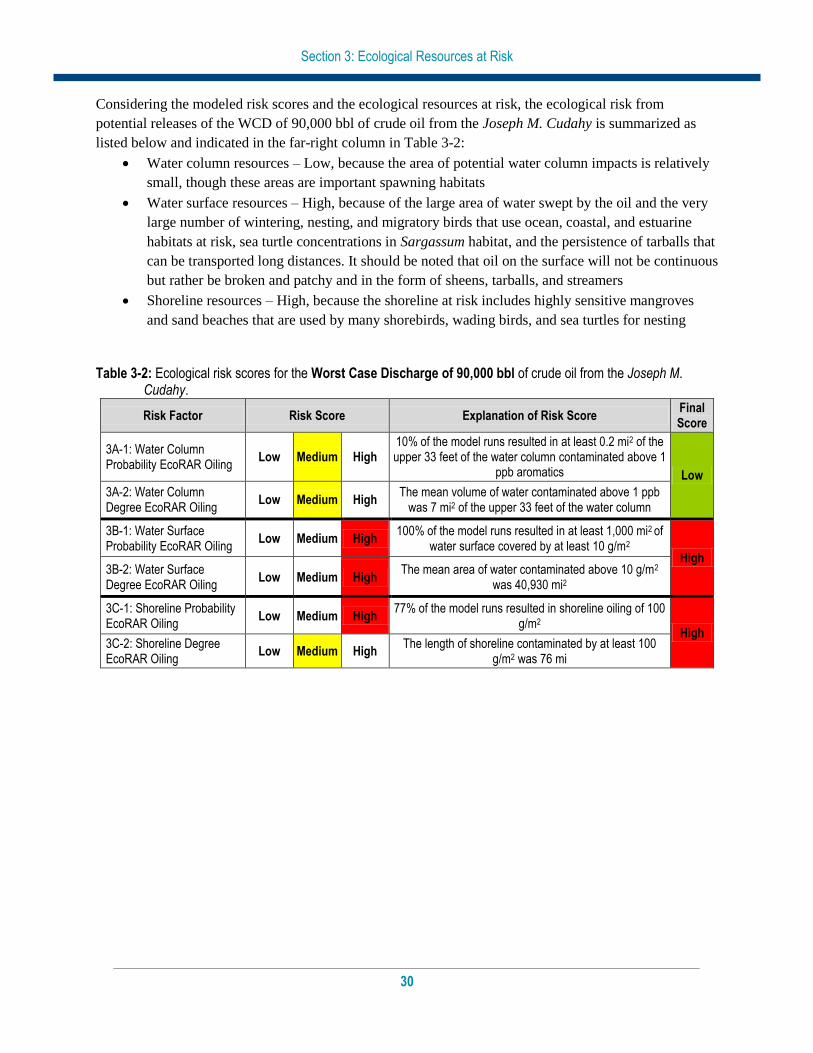
Considering the modeled risk scores and the ecological resources at risk, the ecological risk from
potential releases of the WCD of 90,000 bbl of crude oil from the Joseph M. Cudahy is summarized as
listed below and indicated in the far-right column in Table 3-2:
Water column resources – Low, because the area of potential water column impacts is relatively
small, though these areas are important spawning habitats
Water surface resources – High, because of the large area of water swept by the oil and the very
large number of wintering, nesting, and migratory birds that use ocean, coastal, and estuarine
habitats at risk, sea turtle concentrations in Sargassum habitat, and the persistence of tarballs that
can be transported long distances. It should be noted that oil on the surface will not be continuous
but rather be broken and patchy and in the form of sheens, tarballs, and streamers
Shoreline resources – High, because the shoreline at risk includes highly sensitive mangroves
and sand beaches that are used by many shorebirds, wading birds, and sea turtles for nesting
Table 3-2: Ecological risk scores for the Worst Case Discharge of 90,000 bbl of crude oil from the Joseph M. Cudahy.
Risk Factor Risk Score Explanation of Risk Score Final Score
3A-1: Water Column Probability EcoRAR Oiling
Low Medium High 10% of the model runs resulted in at least 0.2 mi2 of the upper 33 feet of the water column contaminated above 1
ppb aromatics Low
3A-2: Water Column Degree EcoRAR Oiling
Low Medium High The mean volume of water contaminated above 1 ppb
was 7 mi2 of the upper 33 feet of the water column
3B-1: Water Surface Probability EcoRAR Oiling
Low Medium High 100% of the model runs resulted in at least 1,000 mi2 of
water surface covered by at least 10 g/m2 High
3B-2: Water Surface Degree EcoRAR Oiling
Low Medium High The mean area of water contaminated above 10 g/m2
was 40,930 mi2
3C-1: Shoreline Probability EcoRAR Oiling
Low Medium High 77% of the model runs resulted in shoreline oiling of 100
g/m2 High
3C-2: Shoreline Degree EcoRAR Oiling
Low Medium High The length of shoreline contaminated by at least 100
g/m2 was 76 mi
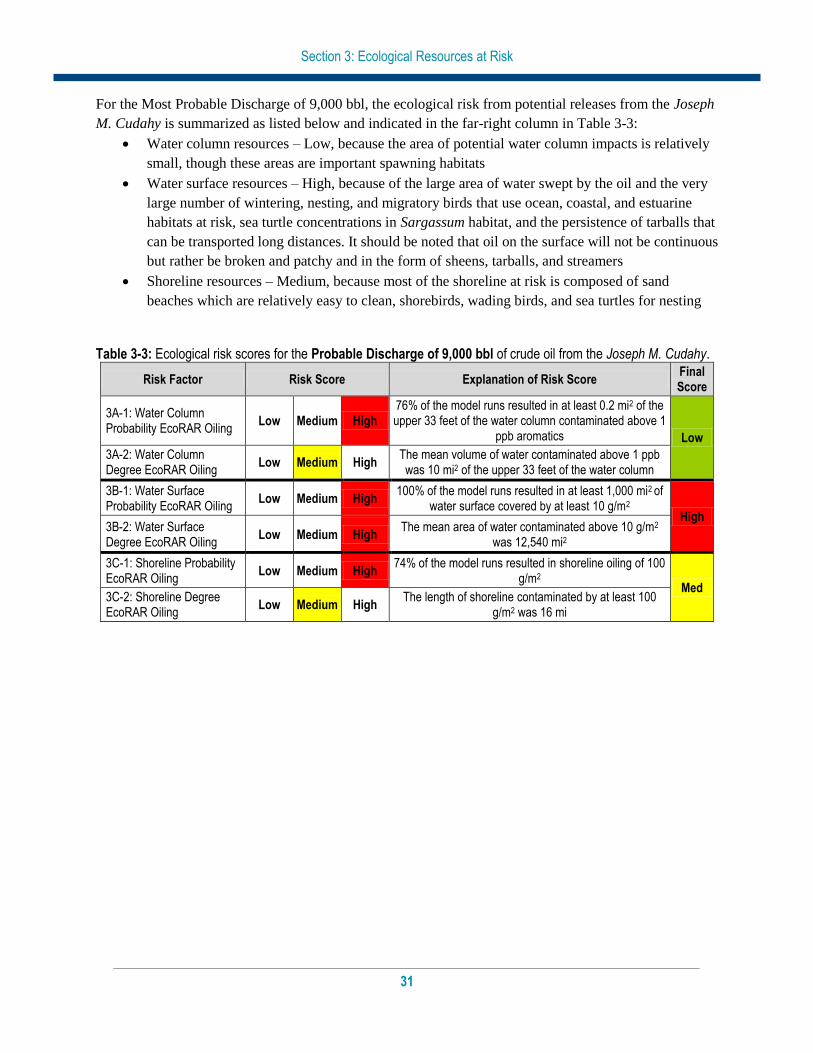
Section 3: Ecological Resources at Risk
31
For the Most Probable Discharge of 9,000 bbl, the ecological risk from potential releases from the Joseph
M. Cudahy is summarized as listed below and indicated in the far-right column in Table 3-3:
Water column resources – Low, because the area of potential water column impacts is relatively
small, though these areas are important spawning habitats
Water surface resources – High, because of the large area of water swept by the oil and the very
large number of wintering, nesting, and migratory birds that use ocean, coastal, and estuarine
habitats at risk, sea turtle concentrations in Sargassum habitat, and the persistence of tarballs that
can be transported long distances. It should be noted that oil on the surface will not be continuous
but rather be broken and patchy and in the form of sheens, tarballs, and streamers
Shoreline resources – Medium, because most of the shoreline at risk is composed of sand
beaches which are relatively easy to clean, shorebirds, wading birds, and sea turtles for nesting
Table 3-3: Ecological risk scores for the Probable Discharge of 9,000 bbl of crude oil from the Joseph M. Cudahy.
Risk Factor Risk Score Explanation of Risk Score Final Score
3A-1: Water Column Probability EcoRAR Oiling
Low Medium High 76% of the model runs resulted in at least 0.2 mi2 of the upper 33 feet of the water column contaminated above 1
ppb aromatics Low
3A-2: Water Column Degree EcoRAR Oiling
Low Medium High The mean volume of water contaminated above 1 ppb was 10 mi2 of the upper 33 feet of the water column
3B-1: Water Surface Probability EcoRAR Oiling
Low Medium High 100% of the model runs resulted in at least 1,000 mi2 of
water surface covered by at least 10 g/m2 High
3B-2: Water Surface Degree EcoRAR Oiling
Low Medium High The mean area of water contaminated above 10 g/m2
was 12,540 mi2
3C-1: Shoreline Probability EcoRAR Oiling
Low Medium High 74% of the model runs resulted in shoreline oiling of 100
g/m2 Med
3C-2: Shoreline Degree EcoRAR Oiling
Low Medium High The length of shoreline contaminated by at least 100
g/m2 was 16 mi

Section 4: Socio-Economic Resources at Risk
32
SECTION 4: SOCIO-ECONOMIC RESOURCES AT RISK
In addition to natural resource impacts, spills from sunken wrecks have the potential to cause significant
social and economic impacts. Socio-economic resources potentially at risk from oiling are listed in Table
4-1 and shown in Figures 4-1 and 4-2. The potential economic impacts include disruption of coastal
economic activities such as commercial and recreational fishing, boating, vacationing, commercial
shipping, and other activities that may become claims following a spill.
Socio-economic resources in the areas potentially affected by a release from the Joseph M. Cudahy
include very highly utilized recreational beaches from eastern Florida to the Florida Keys during summer,
but also during spring and fall for shore fishing. One national seashore and one national park would
potentially be affected. Many areas along the entire potential spill zone are widely popular seaside resorts
and support recreational activities such as boating, diving, sightseeing, sailing, fishing, and wildlife
viewing. The Florida Keys National Marine Sanctuary would also potentially be affected, along with a
large number of coastal state parks.
There are shipping lanes to several ports that could be impacted by a release with a total of over 6,600
annual port calls annually with a total of over 140 million tonnage. Commercial fishing is economically
important to the region. Regional commercial landings for 2010 exceeded $72 million with fishing fleets
from Florida potentially impacted by a release.
In addition to the ESI atlases, the Geographic Response Plans within the Area Contingency Plans
prepared by the Area Committee for each U.S. Coast Guard Sector have detailed information on
important socio-economic resources at risk and should be consulted.
Spill response costs for a release of oil from the Joseph M. Cudahy would be dependent on volume of oil
released and specific areas impacted. The specific shoreline impacts and spread of the oil would
determine the response required and the costs for that response.
Table 4-1: Socio-economic resources at risk from a release of oil from the Joseph M. Cudahy.
Resource Type Resource Name Economic Activities
Tourist Beaches Fernandina Beach, FL Atlantic Beach, FL St. Augustine Beach, FL Daytona Beach, FL Palm Coast, FL Melbourne Beach, FL Cocoa Beach, FL Vero Beach, FL Key Largo, FL Miami Beach, FL Fort Lauderdale, FL Boca Raton, FL Boynton Beach, FL Palm Beach, FL Pompano Beach, FL
Potentially affected beach resorts and beach-front communities in eastern Florida and the Florida keys provide recreational activities (e.g., swimming, boating, recreational fishing, wildlife viewing, nature study, sports, dining, camping, and amusement parks) with substantial income for local communities and state tax income. Much of the coast is lined with economically-valuable beach resorts and residential communities. Many of these recreational activities are limited to or concentrated into the late spring through the early fall months.

Section 4: Socio-Economic Resources at Risk
33
Resource Type Resource Name Economic Activities
Coral Gables, FL Key West, FL
National Marine Sanctuary
Florida Keys National Marine Sanctuary (FL)
The Florida Keys National Marine Sanctuary has the only barrier coral reef in North America. Visitors to the sanctuary take advantage of many recreational activities, including world-class diving, swimming, snorkeling, and fishing.
National Seashores
Canaveral National Seashore, FL National seashores provide recreation for local and tourist populations while preserving and protecting the nation’s natural shoreline treasures. National seashores are coastal areas federally designated as being of natural and recreational significance as a preserved area.
National Parks Biscayne National Park, FL Two coastal national historic monuments provide education in Civil War history. The Biscayne National Park provides snorkeling in coral reefs among other recreational activities.
National Wildlife Refuges
Merritt Island NWR Archie Carr NWR Pelican Island NWR Hobe Sound NWR A.R. Marshall-Loxahatchee NWR Crocodile Lake NWR National Key Deer NWR Great White Heron NWR Key West NWR
National wildlife refuges in Florida maybe impacted. These federally-managed and protected lands provide refuges and conservation areas for sensitive species and habitats.
State Parks Bulow Plantation Ruins SP, FL Washington Oaks Gardens SP, FL Amelia Island SP, FL Fort Clinch SP, FL Guana River SP, FL Anastastia SP, FL Faver-Dykes SP, FL Green Mound Archaeological SP, FL Bulow Creek SP, FL Tomoka SP, FL Sebastian Inlet SP, FL Fort Pierce Inlet SP, FL St. Lucie Inlet Preserve SP, FL John D. MacArthur Beach SP, FL Hugh Taylor Birch SP, FL John U. Lloyd Beach SP, FL Bill Baggs Cape Florida SP, FL John Pennkamp Coral Reef SP, FL Indian Key Historic SP, FL San Pedro Underwater Arch. SP, FL Bahia Honda SP, FL Fort Zachary Taylor Historic SP, FL
Coastal state parks are significant recreational resources for the public (e.g., swimming, boating, recreational fishing, wildlife viewing, nature study, sports, dining, camping, and amusement parks). Some of Florida’s state parks offer unique opportunities for wildlife viewing and snorkeling. They provide income to the states. Many of these recreational activities are limited to or concentrated into the late spring into early fall months.
Commercial Fishing
A number of fishing fleets use potentially affected waters for commercial fishing.
Cape Canaveral, FL Total Landings (2010): $6.5M
Fernandina Beach, FL Total Landings (2010): $4.7M
Mayport, FL Total Landings (2010): $11.0M
Fort Pierce-St. Lucie, FL Total Landings (2010): $2.6M
Key West Total Landings (2010): $50.0M
Ports There are a number of significant commercial ports along the Atlantic coast that could potentially be impacted by spillage and spill response activities. The port call numbers below are for large vessels only. There are many more, smaller vessels (under 400 GRT) that also use these ports.

Section 4: Socio-Economic Resources at Risk
34
Resource Type Resource Name Economic Activities
Fernandina, FL 3 port calls annually
Jacksonville, FL 1,641 port calls annually
Port Canaveral, FL 38 port calls annually
Savannah, GA 2,406 port calls annually
Miami, FL 1,030 port calls annually
Palm Beach, FL 126 port calls annually
Port Everglades, FL 1,386 port calls annually
Figure 4-1: Tribal lands, ports, and commercial fishing fleets at risk from a release from the Joseph M. Cudahy.
(Note that there are no tribal lands at risk.)
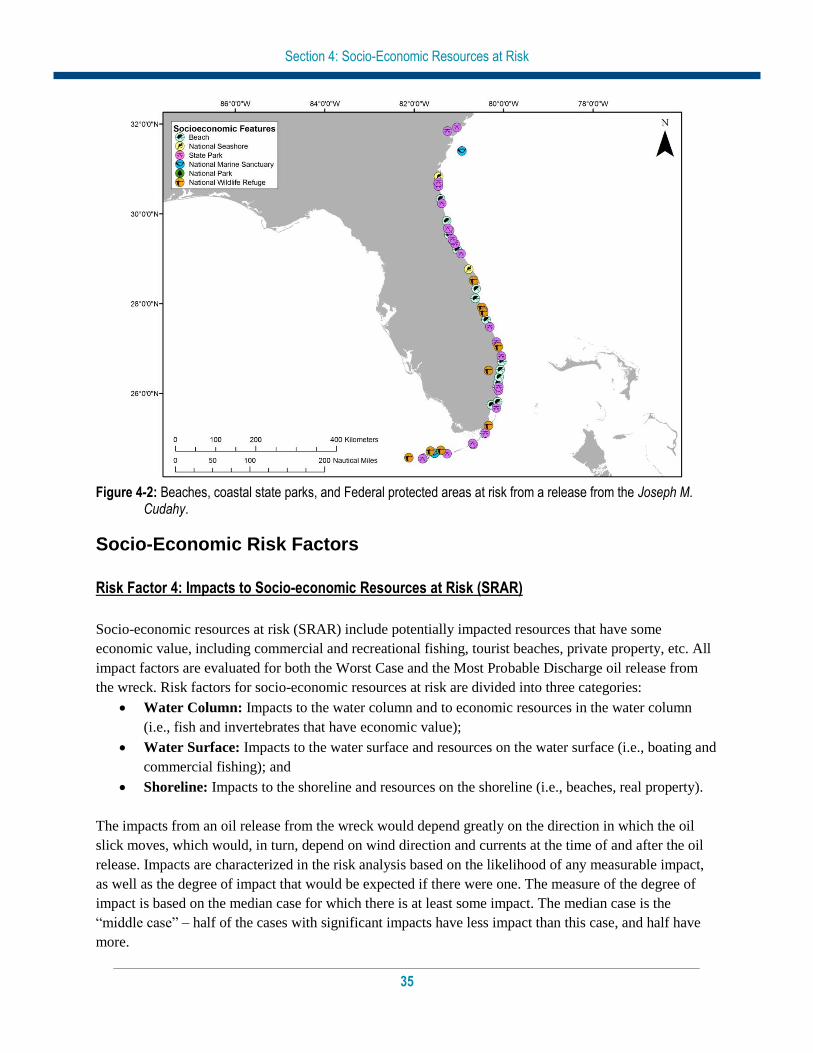
Section 4: Socio-Economic Resources at Risk
35
Figure 4-2: Beaches, coastal state parks, and Federal protected areas at risk from a release from the Joseph M.
Cudahy.
Socio-Economic Risk Factors
Risk Factor 4: Impacts to Socio-economic Resources at Risk (SRAR)
Socio-economic resources at risk (SRAR) include potentially impacted resources that have some
economic value, including commercial and recreational fishing, tourist beaches, private property, etc. All
impact factors are evaluated for both the Worst Case and the Most Probable Discharge oil release from
the wreck. Risk factors for socio-economic resources at risk are divided into three categories:
Water Column: Impacts to the water column and to economic resources in the water column
(i.e., fish and invertebrates that have economic value);
Water Surface: Impacts to the water surface and resources on the water surface (i.e., boating and
commercial fishing); and
Shoreline: Impacts to the shoreline and resources on the shoreline (i.e., beaches, real property).
The impacts from an oil release from the wreck would depend greatly on the direction in which the oil
slick moves, which would, in turn, depend on wind direction and currents at the time of and after the oil
release. Impacts are characterized in the risk analysis based on the likelihood of any measurable impact,
as well as the degree of impact that would be expected if there were one. The measure of the degree of
impact is based on the median case for which there is at least some impact. The median case is the
“middle case” – half of the cases with significant impacts have less impact than this case, and half have
more.
Section 4: Socio-Economic Resources at Risk
36
For each of the three socio-economic resources at risk categories, risk is classified with regard to:
The probability of oiling over a certain threshold (i.e., the likelihood that there will be exposure
to socio-economic resources over a certain minimal amount known to cause impacts); and
The degree of oiling (the magnitude or amount of that exposure over the threshold known to
cause impacts).
In the following sections, the definition of low, medium, and high for each socio-economic risk factor is
provided. Also, in the text classification for the Joseph M. Cudahy shading indicates the degree of risk for
the WCD release of 90,000 bbl and a border indicates degree of risk for the Most Probable Discharge of
9,000 bbl.
Risk Factor 4A-1: Water Column: Probability of Oiling of SRAR
This risk factor reflects the probability that at least 0.2 mi2 of the upper 33 feet of the water column would
be contaminated with a high enough concentration of oil to cause socio-economic impacts. The threshold
for water column impact to socio-economic resources at risk is an oil concentration of 1 ppb (i.e., 1 part
oil per one billion parts water). At this concentration and above, one would expect impacts and potential
tainting to socio-economic resources (e.g., fish and shellfish) in the water column; this concentration is
used as a screening threshold for both the ecological and socio-economic risk factors.
The three risk scores for oiling are:
Low Oiling Probability: Probability = <10%
Medium Oiling Probability: Probability = 10 – 50%
High Oiling Probability: Probability > 50%
Risk Factor 4A-2: Water Column Degree of Oiling of SRAR
The degree of oiling of the water column reflects the total amount of oil that would affect the water
column in the event of a discharge from the vessel. The three categories of impact are:
Low Impact: impact on less than 0.2 mi2 of the upper 33 feet of the water column at the
threshold level
Medium Impact: impact on 0.2 to 200 mi2 of the upper 33 feet of the water column at the
threshold level
High Impact: impact on more than 200 mi2 of the upper 33 feet of the water column at the
threshold level
The Joseph M. Cudahy is classified as Medium Risk for both oiling probability and degree of oiling for
water column socio-economic resources for the WCD of 90,000 bbl because 10% of the model runs
resulted in contamination of more than 0.2 mi2 of the upper 33 feet of the water column above the
threshold of 1 ppb aromatics, and the mean volume of water contaminated was 7 mi2 of the upper 33 feet
of the water column. For the Most Probable Discharge of 9,000 bbl, the Joseph M. Cudahy is classified as
High Risk for oiling probability for water column socio-economic resources because 76% of the model
runs resulted in contamination of more than 0.2 mi2 of the upper 33 feet of the water column above the
threshold of 1 ppb aromatics. It is classified as Medium Risk for degree of oiling because the mean
volume of water contaminated was 10 mi2 of the upper 33 feet of the water column.
Section 4: Socio-Economic Resources at Risk
37
Risk Factor 4B-1: Water Surface Probability of Oiling of SRAR
This risk factor reflects the probability that at least 1,000 mi2 of the water surface would be affected by
enough oil to cause impacts to socio-economic resources. The three risk scores for oiling are:
Low Oiling Probability: Probability = <10%
Medium Oiling Probability: Probability = 10 – 50%
High Oiling Probability: Probability > 50%
The threshold level for water surface impacts to socio-economic resources at risk is 0.01 g/m2 (i.e., 0.01
grams of floating oil per square meter of water surface). At this concentration and above, one would
expect impacts to socio-economic resources on the water surface.
Risk Factor 4B-2: Water Surface Degree of Oiling of SRAR
The degree of oiling of the water surface reflects the total amount of oil that would affect the water
surface in the event of a discharge from the vessel. The three categories of impact are:
Low Impact: less than 1,000 mi2 of water surface impact at the threshold level
Medium Impact: 1,000 to 10,000 mi2 of water surface impact at the threshold level
High Impact: more than 10,000 mi2 of water surface impact at the threshold level
The Joseph M. Cudahy is classified as High Risk for both oiling probability and for degree of oiling for
water surface socio-economic resources for the WCD because 100% of the model runs resulted in at least
1,000 mi2 of the water surface affected above the threshold of 0.01 g/m
2, and the mean area of water
contaminated was 41,000 mi2. The Joseph M. Cudahy is classified as High Risk for both oiling
probability and degree of oiling for water surface socio-economic resources for the Most Probable
Discharge because 100% of the model runs resulted in at least 1,000 mi2 of the water surface affected
above the threshold of 0.01 g/m2, and the mean area of water contaminated was 12,600 mi
2.
Risk Factor 4C: Shoreline Impacts to SRAR
The impacts to different types of shorelines vary based on economic value. In this risk analysis, shorelines
have been weighted by their degree of sensitivity to oiling. Sand beaches are the most economically
valued shorelines (weighted as “3” in the impact analysis), rocky and gravel shores are moderately valued
(weighted as “2”), and wetlands are the least economically valued shorelines (weighted as “1”). Note that
these values differ from the ecological values of these three shoreline types.
Risk Factor 4C-1: Shoreline Probability of Oiling of SRAR
This risk factor reflects the probability that the shoreline would be coated by enough oil to cause impacts
to shoreline users. The threshold for impacts to shoreline SRAR is 1 g/m2 (i.e., 1 gram of oil per square
meter of shoreline). The three risk scores for oiling are:
Low Oiling Probability: Probability = <10%
Medium Oiling Probability: Probability = 10 – 50%
High Oiling Probability: Probability > 50%
Risk Factor 4C-2: Shoreline Degree of Oiling of SRAR
The degree of oiling of the shoreline reflects the total amount of oil that would affect the shoreline in the
event of a discharge from the vessel. The three categories of impact are:
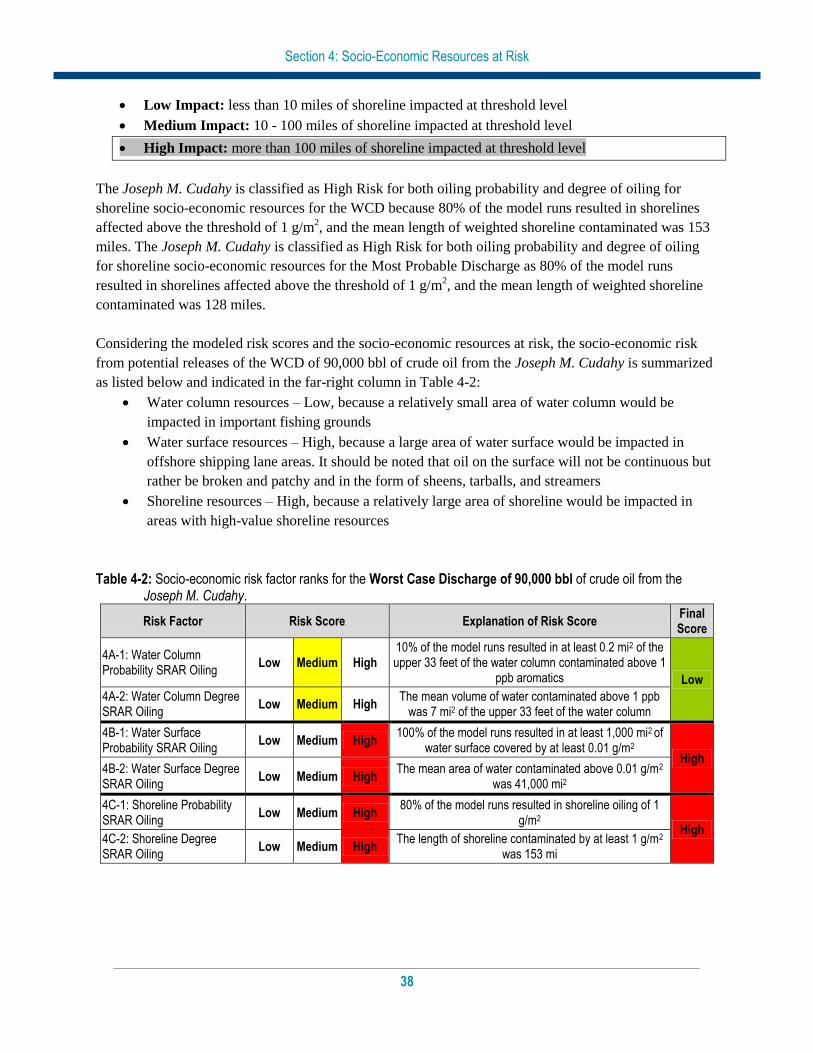
Section 4: Socio-Economic Resources at Risk
38
Low Impact: less than 10 miles of shoreline impacted at threshold level
Medium Impact: 10 - 100 miles of shoreline impacted at threshold level
High Impact: more than 100 miles of shoreline impacted at threshold level
The Joseph M. Cudahy is classified as High Risk for both oiling probability and degree of oiling for
shoreline socio-economic resources for the WCD because 80% of the model runs resulted in shorelines
affected above the threshold of 1 g/m2, and the mean length of weighted shoreline contaminated was 153
miles. The Joseph M. Cudahy is classified as High Risk for both oiling probability and degree of oiling
for shoreline socio-economic resources for the Most Probable Discharge as 80% of the model runs
resulted in shorelines affected above the threshold of 1 g/m2, and the mean length of weighted shoreline
contaminated was 128 miles.
Considering the modeled risk scores and the socio-economic resources at risk, the socio-economic risk
from potential releases of the WCD of 90,000 bbl of crude oil from the Joseph M. Cudahy is summarized
as listed below and indicated in the far-right column in Table 4-2:
Water column resources – Low, because a relatively small area of water column would be
impacted in important fishing grounds
Water surface resources – High, because a large area of water surface would be impacted in
offshore shipping lane areas. It should be noted that oil on the surface will not be continuous but
rather be broken and patchy and in the form of sheens, tarballs, and streamers
Shoreline resources – High, because a relatively large area of shoreline would be impacted in
areas with high-value shoreline resources
Table 4-2: Socio-economic risk factor ranks for the Worst Case Discharge of 90,000 bbl of crude oil from the Joseph M. Cudahy.
Risk Factor Risk Score Explanation of Risk Score Final Score
4A-1: Water Column Probability SRAR Oiling
Low Medium High 10% of the model runs resulted in at least 0.2 mi2 of the upper 33 feet of the water column contaminated above 1
ppb aromatics Low
4A-2: Water Column Degree SRAR Oiling
Low Medium High The mean volume of water contaminated above 1 ppb
was 7 mi2 of the upper 33 feet of the water column
4B-1: Water Surface Probability SRAR Oiling
Low Medium High 100% of the model runs resulted in at least 1,000 mi2 of
water surface covered by at least 0.01 g/m2 High
4B-2: Water Surface Degree SRAR Oiling
Low Medium High The mean area of water contaminated above 0.01 g/m2
was 41,000 mi2
4C-1: Shoreline Probability SRAR Oiling
Low Medium High 80% of the model runs resulted in shoreline oiling of 1
g/m2 High
4C-2: Shoreline Degree SRAR Oiling
Low Medium High The length of shoreline contaminated by at least 1 g/m2
was 153 mi

Section 4: Socio-Economic Resources at Risk
39
For the Most Probable Discharge of 9,000 bbl, the socio-economic risk from potential releases of heavy
fuel oil from the Joseph M. Cudahy is summarized as listed below and indicated in the far-right column in
Table 4-3:
Water column resources – Low, because a relatively small area of water column would be
impacted in important fishing grounds
Water surface resources – High, because a large area of water surface would be impacted in
offshore shipping lane areas. It should be noted that oil on the surface will not be continuous but
rather be broken and patchy and in the form of sheens, tarballs, and streamers
Shoreline resources – High, because a relatively large area of shoreline would be impacted in
areas with high-value shoreline resources
Table 4-3: Socio-economic risk factor ranks for the Most Probable Discharge of 9,000 bbl of crude oil from the Joseph M. Cudahy.
Risk Factor Risk Score Explanation of Risk Score Final Score
4A-1: Water Column Probability SRAR Oiling
Low Medium High 76% of the model runs resulted in at least 0.2 mi2 of the upper 33 feet of the water column contaminated above 1
ppb aromatics Low
4A-2: Water Column Degree SRAR Oiling
Low Medium High The mean volume of water contaminated above 1 ppb was 10 mi2 of the upper 33 feet of the water column
4B-1: Water Surface Probability SRAR Oiling
Low Medium High 100% of the model runs resulted in at least 1,000 mi2 of
water surface covered by at least 0.01 g/m2 High
4B-2: Water Surface Degree SRAR Oiling
Low Medium High The mean area of water contaminated above 0.01 g/m2
was 12,560 mi2
4C-1: Shoreline Probability SRAR Oiling
Low Medium High 80% of the model runs resulted in shoreline oiling of 1
g/m2 High
4C-2: Shoreline Degree SRAR Oiling
Low Medium High The length of shoreline contaminated by at least 1 g/m2
was 128 mi
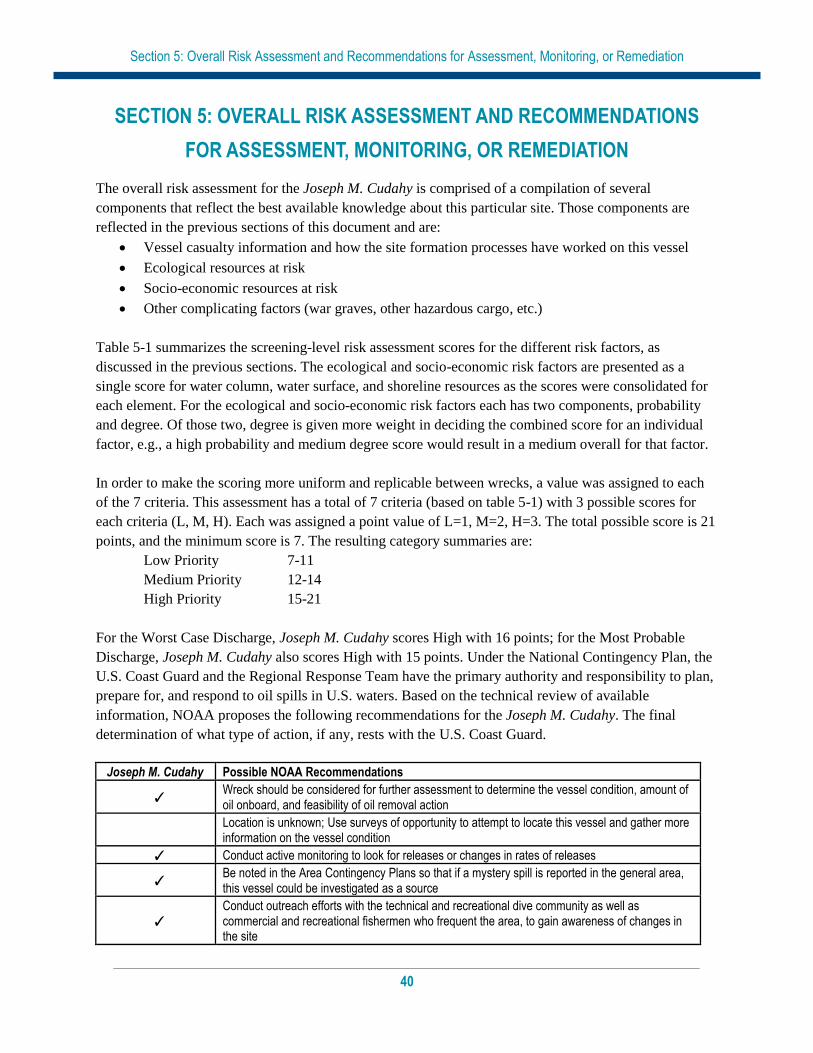
Section 5: Overall Risk Assessment and Recommendations for Assessment, Monitoring, or Remediation
40
SECTION 5: OVERALL RISK ASSESSMENT AND RECOMMENDATIONS
FOR ASSESSMENT, MONITORING, OR REMEDIATION
The overall risk assessment for the Joseph M. Cudahy is comprised of a compilation of several
components that reflect the best available knowledge about this particular site. Those components are
reflected in the previous sections of this document and are:
Vessel casualty information and how the site formation processes have worked on this vessel
Ecological resources at risk
Socio-economic resources at risk
Other complicating factors (war graves, other hazardous cargo, etc.)
Table 5-1 summarizes the screening-level risk assessment scores for the different risk factors, as
discussed in the previous sections. The ecological and socio-economic risk factors are presented as a
single score for water column, water surface, and shoreline resources as the scores were consolidated for
each element. For the ecological and socio-economic risk factors each has two components, probability
and degree. Of those two, degree is given more weight in deciding the combined score for an individual
factor, e.g., a high probability and medium degree score would result in a medium overall for that factor.
In order to make the scoring more uniform and replicable between wrecks, a value was assigned to each
of the 7 criteria. This assessment has a total of 7 criteria (based on table 5-1) with 3 possible scores for
each criteria (L, M, H). Each was assigned a point value of L=1, M=2, H=3. The total possible score is 21
points, and the minimum score is 7. The resulting category summaries are:
Low Priority 7-11
Medium Priority 12-14
High Priority 15-21
For the Worst Case Discharge, Joseph M. Cudahy scores High with 16 points; for the Most Probable
Discharge, Joseph M. Cudahy also scores High with 15 points. Under the National Contingency Plan, the
U.S. Coast Guard and the Regional Response Team have the primary authority and responsibility to plan,
prepare for, and respond to oil spills in U.S. waters. Based on the technical review of available
information, NOAA proposes the following recommendations for the Joseph M. Cudahy. The final
determination of what type of action, if any, rests with the U.S. Coast Guard.
Joseph M. Cudahy Possible NOAA Recommendations
✓ Wreck should be considered for further assessment to determine the vessel condition, amount of oil onboard, and feasibility of oil removal action
Location is unknown; Use surveys of opportunity to attempt to locate this vessel and gather more information on the vessel condition
✓ Conduct active monitoring to look for releases or changes in rates of releases
✓ Be noted in the Area Contingency Plans so that if a mystery spill is reported in the general area, this vessel could be investigated as a source
✓ Conduct outreach efforts with the technical and recreational dive community as well as commercial and recreational fishermen who frequent the area, to gain awareness of changes in the site

Section 5: Overall Risk Assessment and Recommendations for Assessment, Monitoring, or Remediation
41
Table 5-1: Summary of risk factors for the Joseph M. Cudahy.
Vessel Risk Factors Data
Quality Score
Comments Risk
Score
Pollution Potential Factors
A1: Oil Volume (total bbl) Medium Maximum of 90,000 bbl, reported to be leaking
Med
A2: Oil Type Medium Bunker C or combination of Bunker C and fuel or lubricating oil (possibly crude instead of fuel oil)
B: Wreck Clearance High Not cleared
C1: Burning of the Ship High Burned for two days
C2: Oil on Water High Water around ship burned, therefore oil in the water
D1: Nature of Casualty High Hit by two torpedoes, explosion
D2: Structural Breakup High In two sections
Archaeological Assessment
Archaeological Assessment
High Detailed sinking records and site reports exist, assessment is believed to be very accurate
Not Scored
Operational Factors
Wreck Orientation High 120-degree list
Not Scored
Depth High 145 feet
Visual or Remote Sensing Confirmation of Site Condition
High Recreational dive site, recreational fishing site
Other Hazardous Materials Onboard
High No
Munitions Onboard High No
Gravesite (Civilian/Military) High Yes
Historical Protection Eligibility (NHPA/SMCA)
High NHPA and possibly SMCA
WCD Most
Probable
Ecological Resources
3A: Water Column Resources
High Potential impact areas are not large but include sensitive spawning habitats
Low Low
3B: Water Surface Resources
High Surface oil sweeps through large areas which include bird, sea turtle, and marine mammal concentration areas
High High
3C: Shore Resources High Impacted shorelines include sensitive mangroves and sand beaches important for bird and turtle nesting
High Med
Socio-Economic Resources
4A: Water Column Resources
High A relatively small area of water column would be impacted in important fishing grounds.
Low Low
4B: Water Surface Resources
High A large area of water surface would be impacted in offshore shipping lane areas.
High High
4C: Shore Resources High A relatively large area of shoreline would be impacted in areas with high-value shoreline resources
High High
Summary Risk Scores 16 15


![Ninomiya Cudahy[1]](https://img.pdfslide.us/doc/110x75/577cdc7c1a28ab9e78aaacf1/ninomiya-cudahy1.jpg)