Embed Size (px)
Citation preview
EVALUATION OF THE EFFECTS OF MEXICAN TRADE POLICY ON THE MEXICAN MAIZE MARKET
José A. García Salazar Gary W. Williams*
TAMRC International Market Research Report No. IM-01-02R
Revised May 2004
* Associate Research Professor, Colegio de Postgraduados, Montecillo, Edo. de
México, México and Professor of Agricultural Economics and Director, Texas Agribusiness Market Research Center, Department of Agricultural Economics, Texas A&M University, College Station, Texas 77843-2124.
EVALUATION OF THE EFFECTS OF MEXICAN
TRADE POLICY ON THE MAIZE MARKET
Texas Agricultural Market Research Center (TAMRC) International Market Research Report No. IM-01-02R, Revised May 2004 by José A. García Salazar and Gary W. Williams ABSTRACT This study is an analysis of the effects of alternate trade policies (NAFTA, completely free trade, and actual policy followed by the Mexican Government) on the production, consumption, and prices of maize in Mexico. The study also analyzes how changes in the Peso/$US exchange rate and in the costs of transportation from Mexican ports of entry to internal points of consumption affect the Mexican maize market. Finally, the study provides a forecast of the supply and demand conditions in the Mexican maize market in the year 2008. A model of spatial and temporal distribution of the Mexican maize market is developed and used for the various analyses. ACKNOWLEDGMENTS The authors wish to thank Stephen W. Fuller for helpful comments on an earlier version of this manuscript. The Texas Agribusiness Market Research Center (TAMRC) has been providing timely, unique, and professional research on a wide range of issues relating to agricultural and agribusiness markets and products of importance to Texas and the nation for thirty-five years. TAMRC is a market research service of the Texas Agricultural Experiment Station and the Texas Agricultural Extension Service. The main TAMRC objective is to conduct research leading to expanded and more efficient markets for Texas and U.S. agricultural and food products. Major TAMRC research divisions include International Market Research, Consumer and Product Market Research, Commodity Market Research, and Contemporary Market Issues Research.
EVALUATION OF THE EFFECTS OF MEXICAN
TRADE POLICY ON THE MAIZE MARKET
EXECUTIVE SUMMARY
The Mexican government practice of allowing duty-free imports of maize beyond the quota limits set under NAFTA has been severely criticized in Mexico. This practice has been widely blamed for a wide variety of problems in Mexican maize markets. According to this study, the practice of allowing the additional duty-free imports had a negative impact on producer welfare in the 1998/2000 period compared to what would have been the case if maize imports had been limited as allowed under NAFTA. Nevertheless, the practice increased net national welfare because the increased imports generated lower prices and higher consumption. Thus, the loss suffered by producers has been more than offset by the gain to consumers resulting in a net national welfare gain. Further, this study finds that the market effects of that practice fell short of those that would have occurred under a completely free trade policy. Under free trade, imports would have been 25% higher, prices 8% lower, and producer welfare 7% lower than actually occurred with the additional duty-free imports allowed by the government. This study also explores the sensitivity of maize imports to exchange rate changes and finds that a 25% devaluation of the Mexican peso relative to the U.S. dollar, for example, would place imports at a level close to the quota limits set by NAFTA. The implication is that the Mexican maize market is heavily influenced by Mexican macroeconomic policy. As Mexican maize markets continue to open under NAFTA, transportation costs could become increasingly important in determining both the levels and flows of Mexican maize imports from the United States. This study, however, finds that while increases in costs of transportation from the various ports of entry to internal consumption points in Mexico would not have substantial effects on the level of maize consumption, production, imports, or prices in Mexico, the flow of imports through the various ports would be considerably altered. Increases in transportation costs from the Gulf ports to internal consumption points, for example, would reduce the flow of maize imports through the Gulf and increase the flow through northern border ports of entry. In contrast, an increase in transportation costs for shipping maize from northern border ports to internal points of consumption in Mexico would reduce the flow of maize imports through those ports and increase the flow through Mexican Pacific ports while having little impact on the flow through Mexican Gulf ports. Finally, the results of using the model to forecast the levels of Mexican maize supply, demand, and price suggest that Mexican maize imports will be higher and domestic prices lower in the year 2008 than forecast by the U.S. Department of Agriculture (USDA).
iii
TABLE OF CONTENTS
Abstract ............................................................................................................................................ i
Acknowledgments............................................................................................................................ i
Executive Summary ........................................................................................................................ ii
Objectives ....................................................................................................................................... 3
Data and Methodology .................................................................................................................... 4 Data ............................................................................................................................................ 4 Model ......................................................................................................................................... 7 Model Validation ..................................................................................................................... 10
Scenario Analysis.......................................................................................................................... 10 Scenario 1: Mexican Enforcement of NAFTA Import Restrictions on Maize ........................ 10 Scenario 2: Effects of Free Trade............................................................................................ 12 Scenario 3: Sensitivity of Mexican Maize Imports to Exchange Rate Changes ...................... 14 Scenario 4: Sensitivity of Trade Flows to Changes in Transportation Costs ........................... 16
Forecast of Mexican Maize Market Situation in the Year 2008 ................................................... 18
Summary and Conclusions ........................................................................................................... 21
References ..................................................................................................................................... 22
Appendix ....................................................................................................................................... 25
LIST OF FIGURES
Figure 1: Mexican Maize Regions and Ports of Entry ................................................................... 9
LIST OF TABLES
Table 1: Validation of Maize Model, 1998/2000 ......................................................................... 11 Table 2: Effects of NAFTA on the Mexican Maize Market, 1998/2000 ..................................... 13 Table 3: Effects of Free Trade on the Mexican Maize Market, 1998/2000 ................................. 15 Table 4: Effects of Exchange Rate Changes on the Mexican Maize Market, 1998/2000 ........... 17 Table 5: Effect of Transportation Cost Increases on the Mexican Maize Market, 1998/2000 .... 18 Table 6: Mexican Maize Market Forecast, 2007/2009 ................................................................ 20
EVALUATION OF THE EFFECTS OF MEXICAN
TRADE POLICY ON THE MAIZE MARKET
In the mid-1980s, the government of Mexico abandoned the interventionist model of import substitution in favor of free trade through a unilateral opening of its markets to the world. The reforms included trade liberalization through trade agreements with several countries in Europe and in North and South America, the elimination of subsidies, the sale of government-owned enterprises, and a suspension of price controls. In the agricultural sector, the economic reforms included the elimination of the guaranteed price system for staple foods. The Compañía Nacional de Subsistencias Populares (CONASUPO), which operated the price support system and managed the agricultural production surpluses, was shut down. Government input, credit, and insurance subsidies were replaced by direct aid to producers and marketing subsidies. In 1994, NAFTA established a plan for Mexico to liberalize trade over 10 to 15 years for many of the most sensitive farm products such as maize. A tariff-quota replaced the maize import licensing system with an ad valorem duty of 215% or a fixed duty of $206 per ton to be reduced gradually reduced over 15 years and an import quota of 2.5 million mt for the U.S. and 1,000 metric tons (mt) for Canada to be increased by 3% every year over the 15 year period (SECOFI, 1994). Even before NAFTA was signed, predictions of a free-trade instigated demise of the Mexican maize industry abounded (e.g., Levy and van Wijnbergen; STPS; and Calva). Contrary to these dire predictions, Mexican maize production increased considerably after the signing of NAFTA. The average annual production of maize in Mexico jumped from an annual average of 14.8 million mt between 1990 and 1993 to 18.1 million mt between 1994 and 2000. Several factors explain this growth including the direct aid granted to farmers through the PROCAMPO Program (Programa de Apoyos al Campo) and new marketing subsidies administered by ASERCA (Apoyos y Servicios a la Comercialización Agropecuaria). Despite the increase in maize production during the late 1990s, Mexican maize imports exceeded the quota set by the agreement in some years. In 1993, Mexico imported 1.5 million mt of maize and 2.2 million mt in 1994. An increase in consumption, low international prices in 1994, and a low exchange rate explain the increase in imports despite an increase in domestically available supplies. The devaluation of the Mexican Peso at the end of 1994 and the rise in international prices significantly increased the estimated cost of imports in 1995. As a consequence, maize imports did not exceed the quota that year. Between 1995 and 1996, however, the feed use of maize rose sharply from 6.7 million mt to 8.3 million mt pushing imports passed the established quota by 3 million mt. Imports only reached 2.5 million mt in 1997 but exceeded 5 million mt in 1998, 1999, and 2000 (SECOFI, 2001).
2
Along with the increase in the production and importation of maize between the pre-NAFTA years and the late 1990s, Mexican maize consumption also grew from an average 16.6 million mt to an average 22.2 million mt over the same time period. Besides a steadily growing population, the most important factor behind the growth in maize consumption was the dramatic increase in the demand for maize for animal feed purposes. Despite the considerable gain in maize production in the years since the implementation of NAFTA, some have argued that the Mexican grain market, including maize, has suffered the most as a result of NAFTA because of the increase in imports (Cámara de Diputados; Senado de la República). The growth in maize imports beyond the NAFTA quota levels which have also been exempted from the duties established under NAFTA has been the source of growing criticism of the Mexican government. The NAFTA critics in Mexico argue that sovereignty and food self-sufficiency, traditional goals of Mexican agricultural policy, have been abandoned in favor of free trade. Further, they argue that within three years of the signing of NAFTA, Mexican policymakers had decided to eliminate the protections afforded the Mexican maize sector under NAFTA through 2008 because of its political and economic importance and force the sector to become competitive or face extinction. For example, in 1996 Mexico was obligated under NAFTA to allow entry of at least 2.7 million mt of duty-free maize from the United States. Imports over that level could be assessed a duty of 189.2%. Nevertheless, the Mexican government allowed the duty-free importation of 5.6 million mt of maize from the United States that year. Moreover, duty- free imports of maize were also allowed that year from South Africa (155,000 mt) and China (27,000 mt) which are not members of NAFTA. Total Mexican maize imports that year far surpassed not only the quota for that year but also the quota level for as far out as the year 2008 (3.7 million mt). Obviously the internal Mexican maize supply and demand situation would be different if the NAFTA quota had been enforced and the over-quota tariffs had been charged on maize imports over the years. However, to what degree have Mexican government actions stimulated domestic maize consumption? By how much has production been lowered because the tariff and quota were not enforced as agreed on under NAFTA? With the inelasticity that generally characterizes food production and consumption, the greater level of imports could plausibly have had little effect on the Mexican maize sector. On the other hand, if the impact of the higher imports has been small, then the policy of open markets and free trade may achieve little of the anticipated economic welfare benefits. To some in Mexico, the sharp increase in imports and the social problems that have surfaced from Mexican maize trade policies indicates that the Mexican maize market is a NAFTA loser. Is this the case? To answer these and related questions requires an analysis and comparison of the effects of NAFTA rules, the effects of the actual import policy followed by the Mexican Government, and the effects of completely free trade on the Mexican maize market. Given the high costs of grain transportation from U.S. ports all the way to Mexican consumption points along with the low elasticity that generally characterizes the supply and demand for maize, the effects of total trade liberalization on the production, consumption, and imports of maize are not likely to be large.
3
The U.S. Department of Agriculture forecasts that sales of U.S. maize to Mexico will increase to 6.5 million mt by the year 2008 (USDA, 1999) suggesting that meeting the demand for maize in Mexico over time will require a growing level of imports. The realization of the forecast, however, will be affected by changes in other market conditions such as the exchange rate and the costs of transportation as they impact domestic production and consumption, imports, and prices. Historically severe devaluations of the Mexican peso relative to the U.S. dollar have been accompanied by substantial impacts on Mexican foreign trade so that future changes in the Peso/$US exchange rate are likely to have an impact on Mexican imports of U.S. maize.
Objectives The main objective of this study is to analyze the effects of alternate trade policies (NAFTA, completely free trade, and actual policy followed by the Mexican Government) on the production, consumption, and prices of maize in Mexico and on U.S.-Mexico maize trade. A second objective is to analyze how changes in the Peso/$US exchange rate and in the costs of transportation from Mexican ports of entry to internal points of consumption affect the Mexican maize market. A third objective is to provide a forecast of the supply and demand conditions in the Mexican maize market in the year 2008. To achieve the first two objectives, a model of spatial and temporal distribution of the Mexican maize market, including production, consumption, prices, and imports by port of entry, is first estimated and validated for the “average year” of 1998/2000. In this base model, the trade policy implemented by the Mexican government that allows duty-free entrance of maize imports beyond the quota established by NAFTA is considered and introduced into the model by restricting imports to the levels registered in 1998/2000. Several scenarios are then examined and compared with the results of the base model. The trade policy established by NAFTA is introduced into the model by restricting imports in accordance with the NAFTA-established quota levels. The free trade policy is introduced into the model by eliminating any restrictions on maize imports. To examine the exchange-rate sensitivity of Mexican maize imports, the Peso/$US exchange rate is increased by 15%, 20%, and 25% assuming free trade (i.e., no trade restrictions on imports). To examine the sensitivity of maize imports to changes in transportation costs, the costs of insurance, ocean freight, and domestic transportation from the various ports of entry (northern border entry points, Gulf ports, and Pacific ports) to internal consumption points were separately increased by 20%. In these scenarios, imports at the average year of 1998/2000 were considered. The model solutions represent: (1) the effects of NAFTA; (2) the effects of free trade; (3) the effects of increases in the Peso/$US exchange rate assuming free trade; and (4) the effects of an increase in domestic transportation costs. The results were compared to the base model solutions to calculate impact on Mexican flow patterns, imports, production, consumption, and prices. The third objective is achieved by validating the model based on data assumptions for the “average year” of 2007/2009.
4
Data and Methodology This section reviews the model and the data used for the analysis and then discuss the validation of the model for the analyses that follow.
Data To develop the spatial and intertemporal model of the Mexican maize market, numerous data series were needed, included Mexican maize demand and supply, maize international prices, truck and train transportation costs from domestic supplier regions and entry borders/ports to internal points of consumption, and maize storage costs. The supply and demand functions in the model were calculated using the estimated supply and demand price elasticities, producer and consumer prices, and quantities supplied and demanded (Kawaguchi, Suzuki, and Kaiser, 1997). In the model, the 8 demand and supply regions are individually represented by inverse demand and supply equations for each of the 12 months of the year. The price elasticities of food and feed demand were taken from García who econometrically estimated a model of simultaneous equations comprising six supply equations, two demand equations, four equations of price transmission, and three identities. García reported price elasticities for food and feed demand of -0.041 and -1.29, respectively, for the period 1994-1996. These elasticities are used in the model for all regions and time periods. The industrial demand price elasticity was assumed to be the same as the food demand price elasticity. The domestic maize supply price elasticity also came from García who reported coefficients for three regions of Mexico (North, Center and South) for the spring-summer season (0.56, 0.51, and 0.44 for the three regions, respectively) and for the fall-winter season (0.83, 0.36, and 0.21 for the three regions, respectively). The demand and supply price elasticities at the national level reported by García (-0.32 and 0.55, respectively) are very close to those found by Sullivan, Wainio, and Roningen (-0.35 and 0.58, respectively). The indicators used in the model refer to the average of three years. All values for October to December are averages of the corresponding data in 1997, 1998, and 1999. From January to September, all values are averages over 1998, 1999, and 2000. The year that runs from October of the first year to September of the following year is referred to as “average year 1998/2000.” Maize production by region and month from October 1997 to September 2000 came from monthly estimates of plantings and harvests by SAGARPA (2001). In 1998/2000, the primary maize production regions were the West, South, Center, and Northwest with annual average production of 4.72, 3.96, 3.69, and 2.36 million mt, respectively. Maize inventories available at the beginning of October were calculated assuming one month of food consumption, 15 days of feed consumption, and two months of industrial consumption (SAGAR). The regional monthly consumption for food, feed, and industrial uses was calculated using the method proposed by García for each state. Feed use of maize was calculated with data on
5
livestock production by state and ratios of feed conversion. Food and industrial consumption was estimated using data on industrial production of nixtamal (hominy-like kernels of corn that have swelled and acquired a new savor by soaking in an alkali solution such as calcium hydroxide), milling, tortillas, and starch. The information necessary for this calculation was obtained from SAGARPA (2001), SECOFI (2001), INEGI (1995), CANACINTRA, and Fuller and Gutierrez. In 1998/2000 the food, feed, and industrial consumption were 12.9, 8.0, and 2.1 million mt, respectively. The leading maize consumption regions were Central, West, and North at 7.1, 5.2, and 2.5 million mt, respectively. The regional prices paid by consumers and received by producers were calculated using the international price of maize at Mexican ports of entry. Shipping costs from each port to internal points of consumption were added to the international price to obtain consumer prices. The maize average annual prices in the consuming regions ranged from $1,207/mt to $1,398/mt. Producer prices in each region were assumed to be equal to consumer prices minus a marketing margin for transporting the grain from the farm to the points of consumption. The marketing margins for each region were calculated using the difference between the maize wholesale price in the wholesale markets and the average price received by producers. Data for the average producer price was obtained from SAGARPA (2000). The maize prices in the wholesale market are from the Sistema Nacional de Información Integral de Mercados (SNIIM). The maize average annual prices in the supply regions ranged from $1,051/mt to $1,196/mt. Monthly and annual domestic import data by port of entry are from SECOFI (2001). In 1998/2000, Mexican maize imports were 5.1 million mt, 55.7% of which entered Mexico through Gulf ports (Veracruz, Tampico, and Progreso), 43.4% through U.S./Mexico borders (Nuevo Laredo, Piedras Negras, Ciudad Juarez, Nogales, and Mexicali), and only 0.9% through Pacific ports (Guaymas, Mazatlan, and Manzanillo). International prices were computed from U.S. Census data for the quantity and value of U.S. exports to Mexico by border crossing locations and marine ports as reported by the U.S. International Trade Commission (USITC). The international price of maize was calculated by taking into account the exchange rate, insurance, ocean freight rates, cost of international financing, and entry costs. The import duty established by NAFTA was not included in the base model since it has never been applied. The average annual international price for maize was $1,207/mt for Gulf ports, $1,256/mt for Pacific ports, $1,046/mt for Ciudad Juárez, $1,178/mt for Nuevo Laredo and Piedras Negras, and $1,813/mt for Nogales and Mexicali. Data for insurance and ocean freight costs from U.S. Gulf ports to Mexican Gulf ports as well as entry costs at all Mexican ports and borders were obtained from ASERCA. Monthly insurance and ocean freight costs ranged from $99/mt to $108/mt. The average annual entry costs were $41/mt for Gulf ports, $43/mt for Pacific ports, $48/mt for Mexicali, and $42/mt for Nuevo Laredo, Piedras Negras and Ciudad Juárez. The data on insurance and ocean freight costs from U.S. Gulf ports to Mexican Pacific ports were obtained from the U.S. Department of Agriculture (Westcott). In the latter case, monthly insurance and ocean freight costs ranged from $133/mt to $162/mt. To calculate the cost of international financing, the libor rate was used, assuming 15 days for entry through ports and one month for entry through land borders. The libor rate and the
6
exchange rate were obtained from INEGI (1999 and 2000). The monthly libor rate ranged from 5.5% to 5.9% and the exchange rate ranged from 9.1 to 9.6 Pesos/$US. Mexican trucking costs were based on average fees paid to truckers during 1999 and 2000 (Dirección General de Tarifas). The trucking transportation costs from production regions and ports of entry to internal points of consumption were estimated using a distance matrix and an average tariff of $0.5492 per mt/km. Trucking costs from the Northwest, North, Northeast, South, and Peninsula regions to the Central Region were $903/mt, $991/mt, $652/mt, $726/mt, and $1,025/mt, respectively. Trucking costs from Gulf and West regions to the Central region were $291/mt and $393/mt, respectively. The trucking costs from Nuevo Laredo, Piedras Negras, and Ciudad Juarez to the Central region were $809/mt, $895/mt, and $1,246/mt. Trucking costs from Veracruz and Tampico to the Central region were $291/mt and $357/mtn, respectively. The cost of shipping by rail from producing regions to consuming regions included the freight costs charged during 1999 and 2000 (Dirección General de Tarifas). Rail transportation costs from supply regions to internal points of consumption were estimated using a distance matrix and an average tariff of $0.2908 per mt/km. Rail transportation costs from the Northwest, North, Northeast, South, and Peninsula regions to the Central region were $408/mt, $464/mt, $268/mt, $347/mt, and $468/mt, respectively. Rail costs from West and Gulf regions to the Central region were $173/mt and $122/mt, respectively. Rail costs from ports of entry to internal consumption points were estimated using a distance matrix with data from Lavin. Rail costs from the Nuevo Laredo, Piedras Negras, and Ciudad Juárez regions to the Central region were $303/mt, $319/mt, and $499/mt. Rail costs from the Veracruz and Tampico regions to the Central region were $169/mt and $266/mt, respectively. The following tariffs were applied to the rail costs: $0.463/mt/km from Nuevo Laredo to the Northeast region; $0.2531/mt/km from Nuevo Laredo to the West region; $0.2551/mt/km from Nuevo Laredo to the Central region; $0.4039/mt/km from Veracruz to the Central region; $0.2932/mt/km from Veracruz to the West region; $0.2945/mt/km from Tampico to the West region; and $0.3056/mt/km from Tampico to the Central region. Finally, storage costs for importers and producers, which include handling at entry and exit points, were obtained from Ferra Luna. A storage cost of $52/mt is used in the model for all regions, ports of entry, and time periods. For the forecast scenario analysis, data on annual Mexican domestic maize consumption and production for the years 2007, 2008, and 2009 come from USDA (1999 and 2001). The annual data were used to calculate monthly regional consumption and production levels assuming the spatial and temporal distribution in the year 1998/2000. According to the USDA data, Mexican maize consumption and production will average 27.0 and 20.5 million mt, respectively, between 2007 and 2009 The international price projections used to calculate domestic consumer and producer prices were obtained from the Food and Agricultural Policy Research Institute (FAPRI). Because FAPRI only reports annual prices, a monthly seasonal index of the international maize price was calculated to obtain the monthly international price in the years 2007, 2008, and 2009 from
7
which the monthly Mexican consumer and producer prices were calculated. The maize average annual price in the demand regions ranged from $1,440/mt to $1,656/mt. The annual rate of change in transportation costs between 1998/2000 and 2007/2009 was assumed to equal that of the international maize price. Also, the exchange rate, entry costs, international financing costs, and storage costs were all assumed to remain at their average 1998/2000 level.
Model To be capable of evaluating alternate trade policies for the maize market in Mexico, a model must include several elements. The first necessary element is spatial segregation, the notion that production and consumption occur in separate places within the country and that the transportation of grain necessarily implies a cost. Although maize is produced and consumed in all 32 states of the country, most is consumed in Mexico City and the surrounding metropolitan areas while most of the tradable surplus is concentrated in the northwestern and southern regions. The relatively large distances between the main producer-supplier regions and the main internal points of consumption emphasize the potential importance of transportation costs. The second element is the seasonal nature of production. About 75% of the Mexican supply of corn is harvested in November, December, January, and February. In contrast, consumption is relatively uniform throughout the year. Thus, the cost of storage is an important element in marketing maize in Mexico. The degree of segregation of the market constitutes a third element. Producers, consumers, and importers are all agents along the maize supply chain. Segregating the different agents that exist in a market is important because each group likely responds differently to market stimuli. If so, then a given policy will have different effects on each of the agents. For example, trade barriers generally affect producers and consumers in opposite ways. Segregating the different groups within a given set of agents may also be important for the same reason. For example, the consumption of maize in Mexico can be classified by how it is used: (1) food, (2) feed, and (3) industrial, which includes seed use and shrinkage losses. Each group of consumers may respond differently to the same change in market conditions. The fourth element is the link between the domestic and international markets since a large share of the maize consumed in Mexico originates in the U.S. and elsewhere outside Mexico. Because nearly 100% of Mexican maize imports come from the U.S., focusing on the connections of internal points of consumption to domestic supplier regions and to U.S.-Mexico ports of entry without including the rest of the world will likely have little effect on the analysis (Bivings). A number of empirical studies have analyzed the effects of policy on Mexican markets using one of the three following types of distribution models: (1) linear models of production and distribution; (2) spatial equilibrium models; and (3) spatial and intertemporal equilibrium models. Nicholson uses a linear model of production and distribution to analyze trade liberalization in the Mexican milk sector. Cramer, Wailes, and Shui studied the impacts of trade liberalization on the international market of rice. Boyd, Doroodian, and Abdul-Latif discussed the effects of free trade among the U.S., Mexico, and Canada on wood production and trade
8
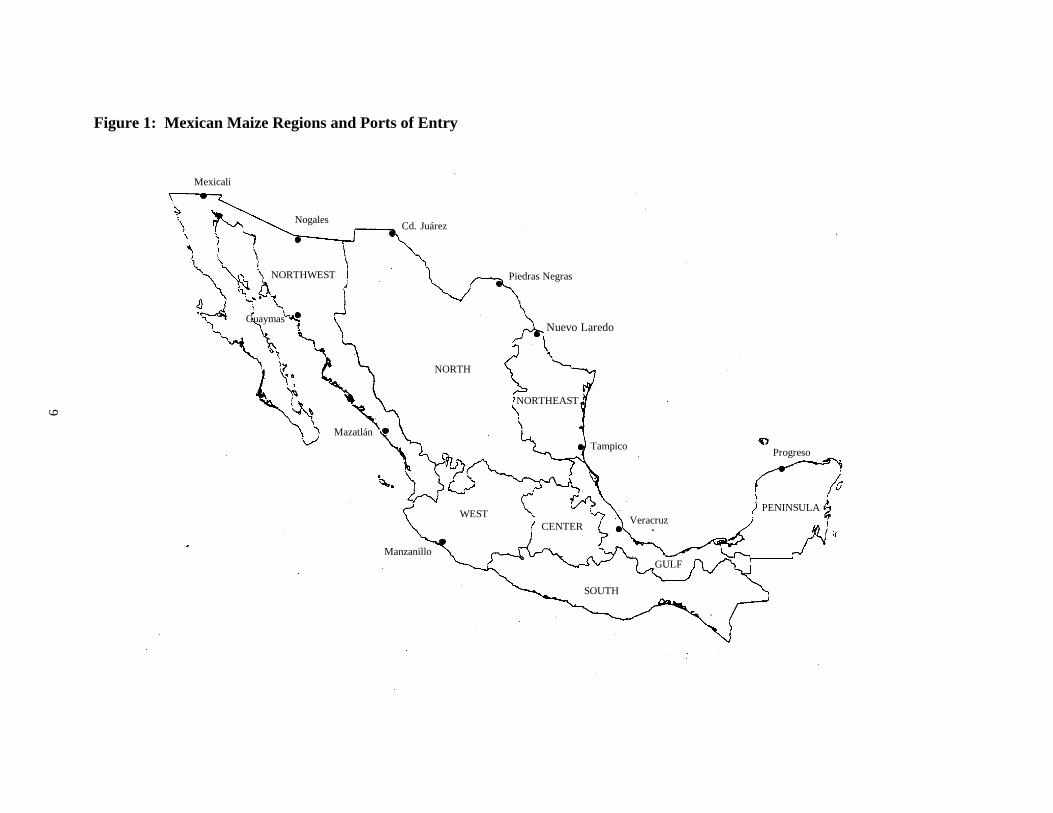
flows. Bivings studied the effects of Mexican trade liberalization on the Mexican sorghum market (production, demand, and imports) using a spatial and intertemporal equilibrium model. Fellin, Fuller, and Salin analyzed the effects of liberalization on the U.S.-Mexico rice trade using a multi-product spatial equilibrium model. Gillis analyzed the economic effects of liberalization on the Mexico-U.S. onion trade using a spatial equilibrium model. Given the spatial and temporal characteristics of the Mexican maize market, a spatial and intertemporal transportation model was constructed to evaluate the effects of different trade policies on that market. Based on Takayama and Judge, the objective function of the model maximizes Net Social Payoff (NSP) which is equal to the areas below the demand curves minus the areas below the supply curves minus the value of the imports minus costs of transportation and storage. The quadratic programming model generates interregional trade flows and prices that result from maximizing the NSP. The model includes information on regional supplies and demands. On the supply side, the production of maize is divided into 8 regions. Imports of maize through the various Mexican ports of entry are allowed. On the demand side, food, feed, and industrial use (including seed use and shrinkage losses) are included in the model. Both production and consumption enter as endogenous variables into the model. Linear supply and demand functions are assumed. Also, supply and demand are assumed to be intertemporally separable in price. In other words, the supply and demand for maize in one period does not depend on the price in other periods. An excess of supply in one production region is linked to points of consumption through costs of transportation by truck or rail. The supply of maize available in the U.S. is linked in the same way to Mexican points of consumption. The temporal analysis was done over a 12 month period. The model includes 8 supply and demand regions as shown in Figure 1: (1) Northwest, (2) North, (3) Northeast, (4) West, (5) Central, (6) South, (7) Gulf, and (8) Peninsula. The model also includes 11 international ports of entry as also shown in Figure 1: (1) Progreso, (2) Veracruz, (3)Tampico, (4) Nuevo Laredo, (5) Piedras Negras, (6) Ciudad Juárez, (7) Nogales, (8) Mexicali, (9) Guaymas, (10) Mazatlán, and (11) Manzanillo1. Because maize production is characterized by extreme seasonality with consumption 12 months of the year, storage costs in maize production regions are important. Due to the lack of information on regional maize inventories, however, an estimation of beginning inventories for the year was made and assumed equal to ending inventories. Although storage of imported maize is also allowed at ports of entry, inventories at the ports were assumed to be zero because maize imports must move fairly rapidly through the ports of entry to their final destination.
1 Northwest includes Baja California, South Baja California, Sonora, Sinaloa, and Nayarit; North includes Chihuahua, Coahuila, Durango, Zacatecas and San Luis Potosí; Northeast includes Nuevo León and Tamaulipas; West includes Jalisco, Michoacán, Colima, Aguascalientes and Guanajuato; Center includes State of Mexico, Federal District, Morelos, Hidalgo, Puebla, Tlaxcala and Querétaro; South includes Oaxaca, Chiapas and Guerrero; Gulf includes Veracruz and Tabasco; Peninsula includes Yucatán, Campeche and Quintana Roo.
9
Figure 1: Mexican Maize Regions and Ports of Entry
Mexicali
NogalesCd. Juárez
Piedras Negras
Nuevo Laredo
NORTHWEST
Tampico
Veracruz
GULF
Progreso
WEST
SOUTH
CENTER
PENINSULA
Manzanillo
NORTH
Mazatlán
Guaymas
NORTHEAST
10
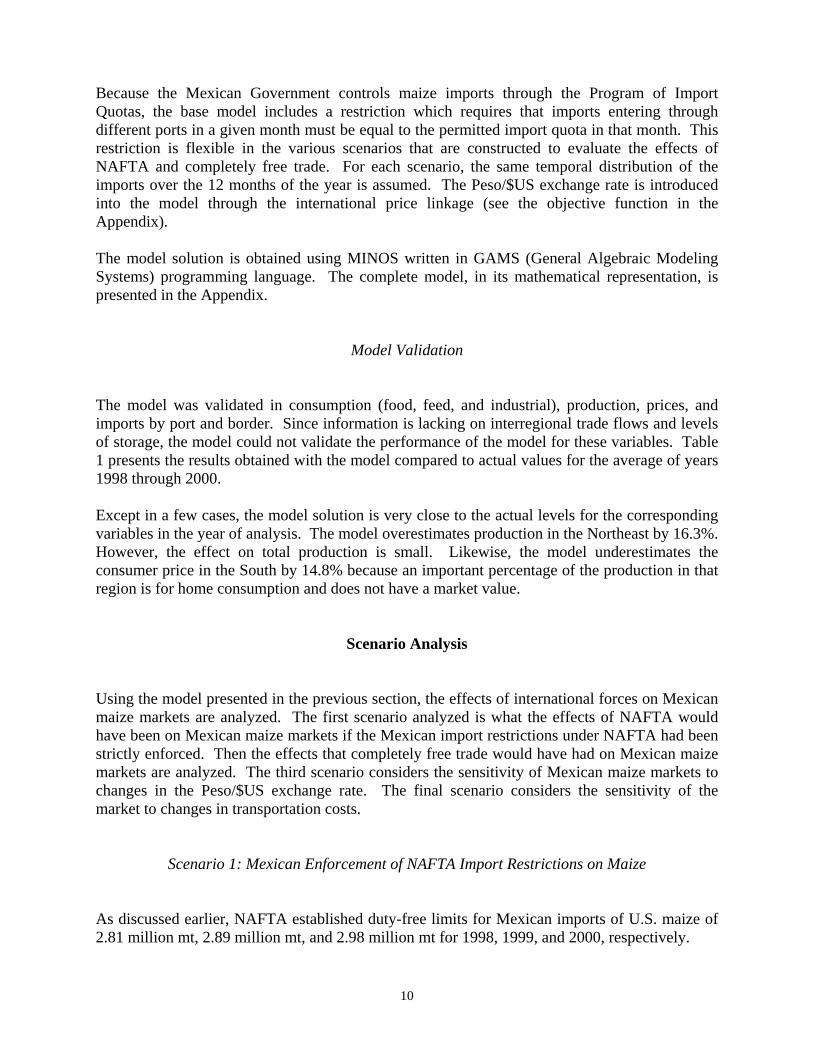
Because the Mexican Government controls maize imports through the Program of Import Quotas, the base model includes a restriction which requires that imports entering through different ports in a given month must be equal to the permitted import quota in that month. This restriction is flexible in the various scenarios that are constructed to evaluate the effects of NAFTA and completely free trade. For each scenario, the same temporal distribution of the imports over the 12 months of the year is assumed. The Peso/$US exchange rate is introduced into the model through the international price linkage (see the objective function in the Appendix). The model solution is obtained using MINOS written in GAMS (General Algebraic Modeling Systems) programming language. The complete model, in its mathematical representation, is presented in the Appendix.
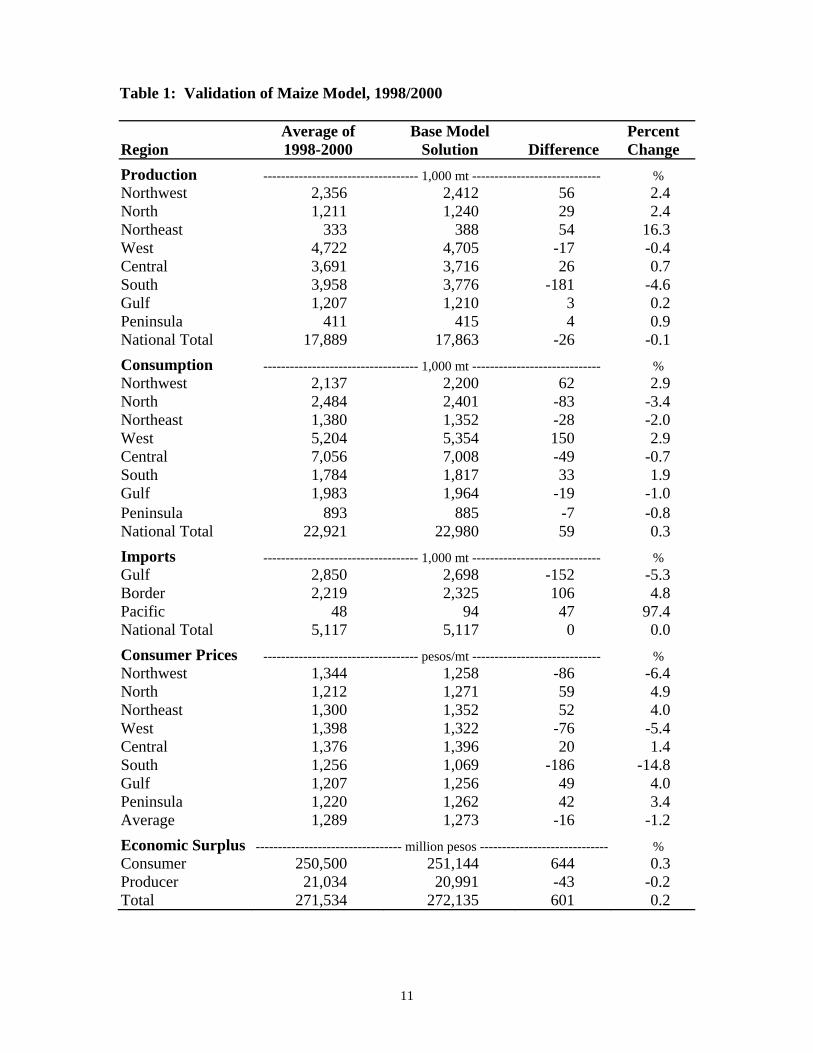
Model Validation The model was validated in consumption (food, feed, and industrial), production, prices, and imports by port and border. Since information is lacking on interregional trade flows and levels of storage, the model could not validate the performance of the model for these variables. Table 1 presents the results obtained with the model compared to actual values for the average of years 1998 through 2000. Except in a few cases, the model solution is very close to the actual levels for the corresponding variables in the year of analysis. The model overestimates production in the Northeast by 16.3%. However, the effect on total production is small. Likewise, the model underestimates the consumer price in the South by 14.8% because an important percentage of the production in that region is for home consumption and does not have a market value.
Scenario Analysis Using the model presented in the previous section, the effects of international forces on Mexican maize markets are analyzed. The first scenario analyzed is what the effects of NAFTA would have been on Mexican maize markets if the Mexican import restrictions under NAFTA had been strictly enforced. Then the effects that completely free trade would have had on Mexican maize markets are analyzed. The third scenario considers the sensitivity of Mexican maize markets to changes in the Peso/$US exchange rate. The final scenario considers the sensitivity of the market to changes in transportation costs.
Scenario 1: Mexican Enforcement of NAFTA Import Restrictions on Maize As discussed earlier, NAFTA established duty-free limits for Mexican imports of U.S. maize of 2.81 million mt, 2.89 million mt, and 2.98 million mt for 1998, 1999, and 2000, respectively.
11
Table 1: Validation of Maize Model, 1998/2000
Region
Average of 1998-2000
Base Model Solution
Difference
Percent Change
Production ----------------------------------- 1,000 mt ----------------------------- % Northwest 2,356 2,412 56 2.4 North 1,211 1,240 29 2.4 Northeast 333 388 54 16.3 West 4,722 4,705 -17 -0.4 Central 3,691 3,716 26 0.7 South 3,958 3,776 -181 -4.6 Gulf 1,207 1,210 3 0.2 Peninsula 411 415 4 0.9 National Total 17,889 17,863 -26 -0.1
Consumption ----------------------------------- 1,000 mt ----------------------------- % Northwest 2,137 2,200 62 2.9 North 2,484 2,401 -83 -3.4 Northeast 1,380 1,352 -28 -2.0 West 5,204 5,354 150 2.9 Central 7,056 7,008 -49 -0.7 South 1,784 1,817 33 1.9 Gulf 1,983 1,964 -19 -1.0 Peninsula 893 885 -7 -0.8 National Total 22,921 22,980 59 0.3
Imports ----------------------------------- 1,000 mt ----------------------------- % Gulf 2,850 2,698 -152 -5.3 Border 2,219 2,325 106 4.8 Pacific 48 94 47 97.4 National Total 5,117 5,117 0 0.0
Consumer Prices ----------------------------------- pesos/mt ----------------------------- % Northwest 1,344 1,258 -86 -6.4 North 1,212 1,271 59 4.9 Northeast 1,300 1,352 52 4.0 West 1,398 1,322 -76 -5.4 Central 1,376 1,396 20 1.4 South 1,256 1,069 -186 -14.8 Gulf 1,207 1,256 49 4.0 Peninsula 1,220 1,262 42 3.4 Average 1,289 1,273 -16 -1.2
Economic Surplus --------------------------------- million pesos ----------------------------- % Consumer 250,500 251,144 644 0.3 Producer 21,034 20,991 -43 -0.2 Total 271,534 272,135 601 0.2
12
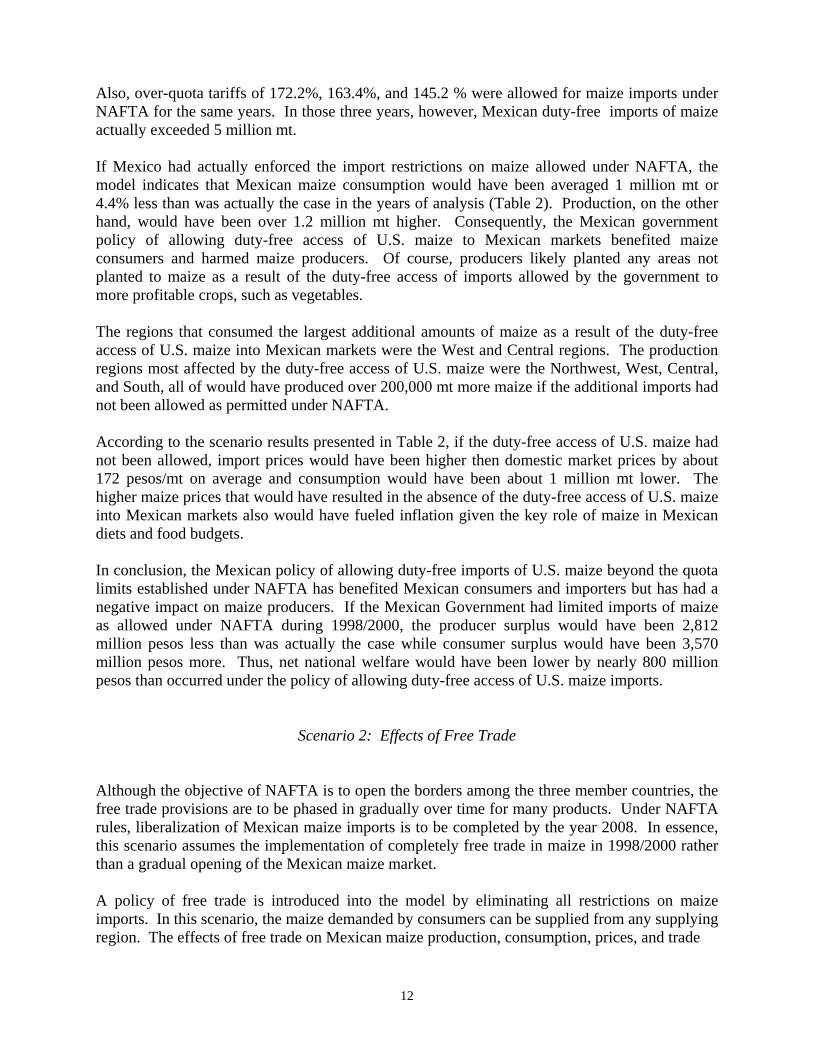
Also, over-quota tariffs of 172.2%, 163.4%, and 145.2 % were allowed for maize imports under NAFTA for the same years. In those three years, however, Mexican duty-free imports of maize actually exceeded 5 million mt. If Mexico had actually enforced the import restrictions on maize allowed under NAFTA, the model indicates that Mexican maize consumption would have been averaged 1 million mt or 4.4% less than was actually the case in the years of analysis (Table 2). Production, on the other hand, would have been over 1.2 million mt higher. Consequently, the Mexican government policy of allowing duty-free access of U.S. maize to Mexican markets benefited maize consumers and harmed maize producers. Of course, producers likely planted any areas not planted to maize as a result of the duty-free access of imports allowed by the government to more profitable crops, such as vegetables. The regions that consumed the largest additional amounts of maize as a result of the duty-free access of U.S. maize into Mexican markets were the West and Central regions. The production regions most affected by the duty-free access of U.S. maize were the Northwest, West, Central, and South, all of would have produced over 200,000 mt more maize if the additional imports had not been allowed as permitted under NAFTA. According to the scenario results presented in Table 2, if the duty-free access of U.S. maize had not been allowed, import prices would have been higher then domestic market prices by about 172 pesos/mt on average and consumption would have been about 1 million mt lower. The higher maize prices that would have resulted in the absence of the duty-free access of U.S. maize into Mexican markets also would have fueled inflation given the key role of maize in Mexican diets and food budgets. In conclusion, the Mexican policy of allowing duty-free imports of U.S. maize beyond the quota limits established under NAFTA has benefited Mexican consumers and importers but has had a negative impact on maize producers. If the Mexican Government had limited imports of maize as allowed under NAFTA during 1998/2000, the producer surplus would have been 2,812 million pesos less than was actually the case while consumer surplus would have been 3,570 million pesos more. Thus, net national welfare would have been lower by nearly 800 million pesos than occurred under the policy of allowing duty-free access of U.S. maize imports.
Scenario 2: Effects of Free Trade Although the objective of NAFTA is to open the borders among the three member countries, the free trade provisions are to be phased in gradually over time for many products. Under NAFTA rules, liberalization of Mexican maize imports is to be completed by the year 2008. In essence, this scenario assumes the implementation of completely free trade in maize in 1998/2000 rather than a gradual opening of the Mexican maize market. A policy of free trade is introduced into the model by eliminating all restrictions on maize imports. In this scenario, the maize demanded by consumers can be supplied from any supplying region. The effects of free trade on Mexican maize production, consumption, prices, and trade
13
Table 2: Effects of NAFTA on the Mexican Maize Market, 1998/2000
Region
Base Model Solution
NAFTA Solution
Difference
Percent Change
Production ----------------------------------- 1,000 mt ----------------------------- % Northwest 2,412 2,626 214 8.9 North 1,240 1,327 87 7.0 Northeast 388 429 41 10.6 West 4,705 4,930 224 4.8 Central 3,716 3,982 266 7.1 South 3,776 4,059 283 7.5 Gulf 1,210 1,276 66 5.5 Peninsula 415 451 36 8.8 National Total 17,863 19,080 1,217 6.8
Consumption ----------------------------------- 1,000 mt ----------------------------- % Northwest 2,200 2,077 -122 -5.6 North 2,401 2,211 -190 -7.9 Northeast 1,352 1,261 -91 -6.8 West 5,354 5,119 -235 -4.4 Central 7,008 6,762 -246 -3.5 South 1,817 1,784 -33 -1.8 Gulf 1,964 1,903 -61 -3.1 Peninsula 885 858 -27 -3.1 National Total 22,980 21,973 -1,006 -4.4
Imports ----------------------------------- 1,000 mt ----------------------------- % Gulf 2,698 1,566 -1132 -42.0 Border 2,325 1,271 -1054 -45.3 Pacific 94 57 -38 -39.9 National Total 5,117 2,893 -2,224 -43.5
Consumer Prices ----------------------------------- pesos/mt ----------------------------- % Northwest 1,258 1,416 158 12.5 North 1,271 1,420 148 11.6 Northeast 1,352 1,552 199 14.7 West 1,322 1,427 105 7.9 Central 1,396 1,571 175 12.6 South 1,069 1,244 174 16.3 Gulf 1,256 1,456 200 15.9 Peninsula 1,262 1,478 217 17.2 Average 1,273 1,445 175 13.5
Economic Surplus --------------------------------- million pesos ----------------------------- % Consumer 251,144 247,574 -3,570 -1.4 Producer 20,991 23,803 2,812 13.4 Total 272,135 271,377 758 0.3
14
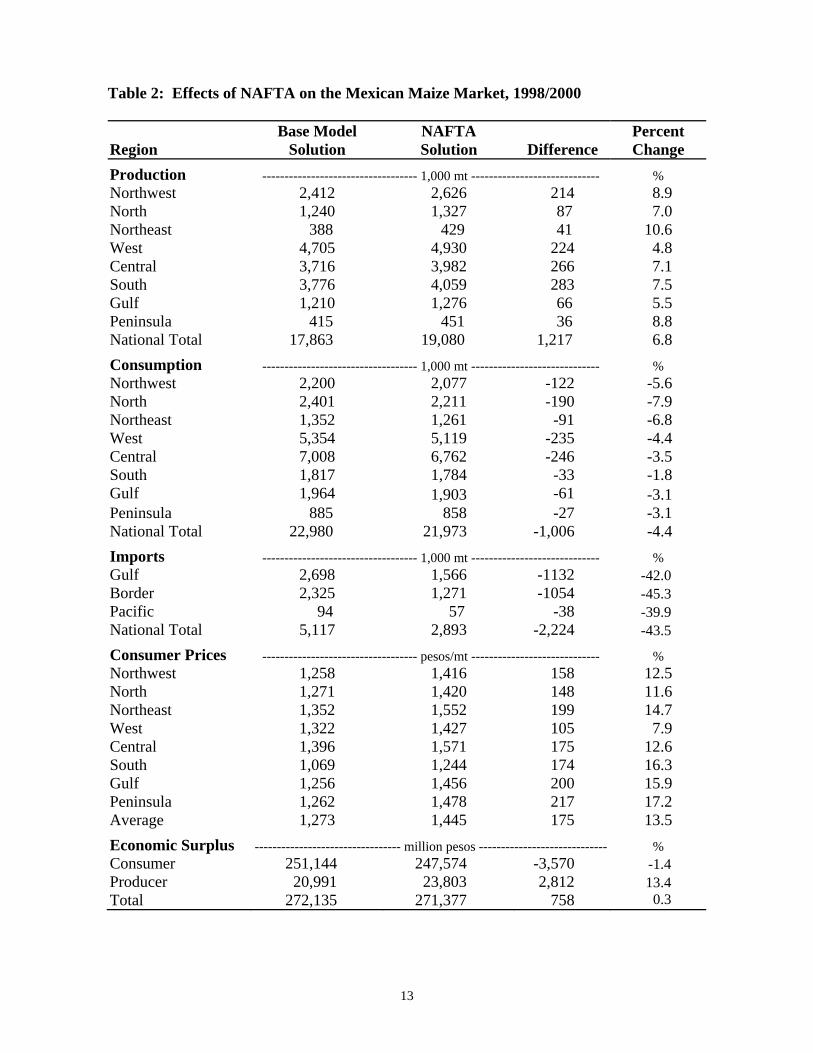
obviously would be expected to be opposite those of the import limitations allowed under NAFTA. Free trade, of course, would be expected to lead to greater consumption given greater access to cheap imports while production would be expected to drop as predicted for maize under NAFTA by some authors (e.g., Levy and van Wijnbergen; STPS; Calva). The scenario results indicate, however, that the effects of fully free trade would not have been much different than what actually occurred with the Mexican policy of allowing duty-free access of NAFTA maize rather than implementing the maize import restrictions allowed under NAFTA. In the free trade scenario, Mexican maize production would have been only 693,000 mt (3.9%) less than what was actually observed in 1998/200, the average year used in this analysis (Table 3). The implication is that the Mexican policy of allowing duty-free imports of U.S. maize created near-free-trade conditions for the Mexican maize market. The scenario results further indicate that under completely free trade, domestic maize prices would have averaged about 8.1% lower than was actually the case. The effects on a regional level would varied somewhat from a 7% drop in the Northwest to a 10% drop in the South. Several factors may explain these differences but the most important are the relative distances of the production regions from the points of major consuming regions in the model. The scenario results also indicate that the lower prices under completely free trade would have permitted 623,000 mt more maize to be consumed in Mexico in the year of analysis than was actually the case with the largest additional amounts being consumed in the more populous Central, North, and West regions. With lower domestic production and higher domestic consumption, imports under the free trade scenario are 1.3 million mt (25.7%) higher than actually occurred in the average year of 1998/2000. Of the imports, 52.3% would have entered through ports located on the Gulf of Mexico and 43.9% through the northern borders. Interestingly, the USDA (2001) estimates that Mexico will import 6.5 million mt per year by the year 2008, almost exactly what the results of this scenario suggest would be the case in 1998/2000 under completely free trade. In welfare terms, the analysis indicates that completely free trade in 1998/2000 would have resulted in a 3.7 billion peso net national increase in economic surplus from a 2.3 billion peso gain for consumers and a 1.5 billion peso loss for Mexican producers.
Scenario 3: Sensitivity of Mexican Maize Imports to Exchange Rate Changes Measuring the effects of NAFTA on Mexican imports of U.S. maize is complicated by the fact that the relationship between the U.S. dollar and the Mexican peso changed drastically in late 1994 and early 1995, almost a year after NAFTA had been implemented. Because changes in the exchange rate affect the relative prices of traded commodities, the effects of NAFTA and the effects of the 1994 Mexican peso devaluation against the U.S. are difficult to separate. The objective of this scenario is to determine how sensitive Mexican maize imports are to the Peso/$US exchange rate to better understand how much of the change in Mexican maize imports since NAFTA was implemented is due to NAFTA and how much is due to the peso devaluation.
15
Table 3: Effects of Free Trade on the Mexican Maize Market, 1998/2000
Region
Base Model Solution
Free Trade Solution
Difference
Percent Change
Production ----------------------------------- 1,000 mt ----------------------------- % Northwest 2,412 2,317 -95 -4.0 North 1,240 1,171 -69 -5.6 Northeast 388 368 -20 -5.1 West 4,705 4,602 -103 -2.2 Central 3,716 3,549 -167 -4.5 South 3,776 3,596 -181 -4.8 Gulf 1,210 1,169 -41 -3.4 Peninsula 415 399 -16 -3.8 National Total 17,863 17,170 -693 -3.9
Consumption ----------------------------------- 1,000 mt ----------------------------- % Northwest 2,200 2,267 67 3.0 North 2,401 2,547 147 6.1 Northeast 1,352 1,404 52 3.9 West 5,354 5,476 122 2.3 Central 7,008 7,171 164 2.3 South 1,817 1,838 21 1.2 Gulf 1,964 1,999 35 1.8 Peninsula 885 900 14 1.6 National Total 22,980 23,603 623 2.7
Imports ----------------------------------- 1,000 mt ----------------------------- % Gulf 2,698 3,365 667 24.7 Border 2,325 2,824 500 21.5 Pacific 94 243 149 157.8 National Total 5,117 6,432 1,316 25.7
Consumer Prices ----------------------------------- pesos/mt ----------------------------- % Northwest 1,258 1,172 -87 -6.9 North 1,271 1,157 -115 -9.0 Northeast 1,352 1,238 -115 -8.5 West 1,322 1,267 -55 -4.2 Central 1,396 1,280 -116 -8.3 South 1,069 958 -111 -10.4 Gulf 1,256 1,140 -116 -9.2 Peninsula 1,262 1,152 -109 -8.7 Average 1,273 1,170 -103 -8.1
Economic Surplus --------------------------------- million pesos ----------------------------- % Consumer 251,144 253,426 2,282 0.9 Producer 20,991 19,454 -1,537 -7.3 Total 272,135 275,880 3,745 1.4
16
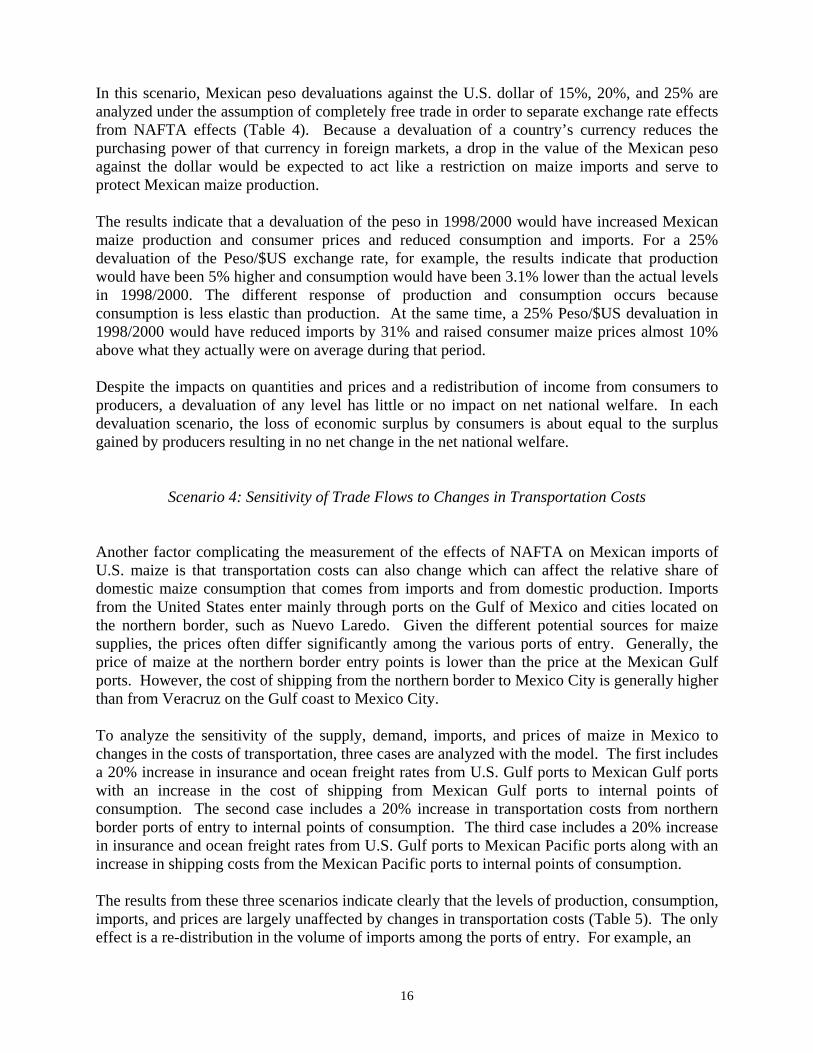
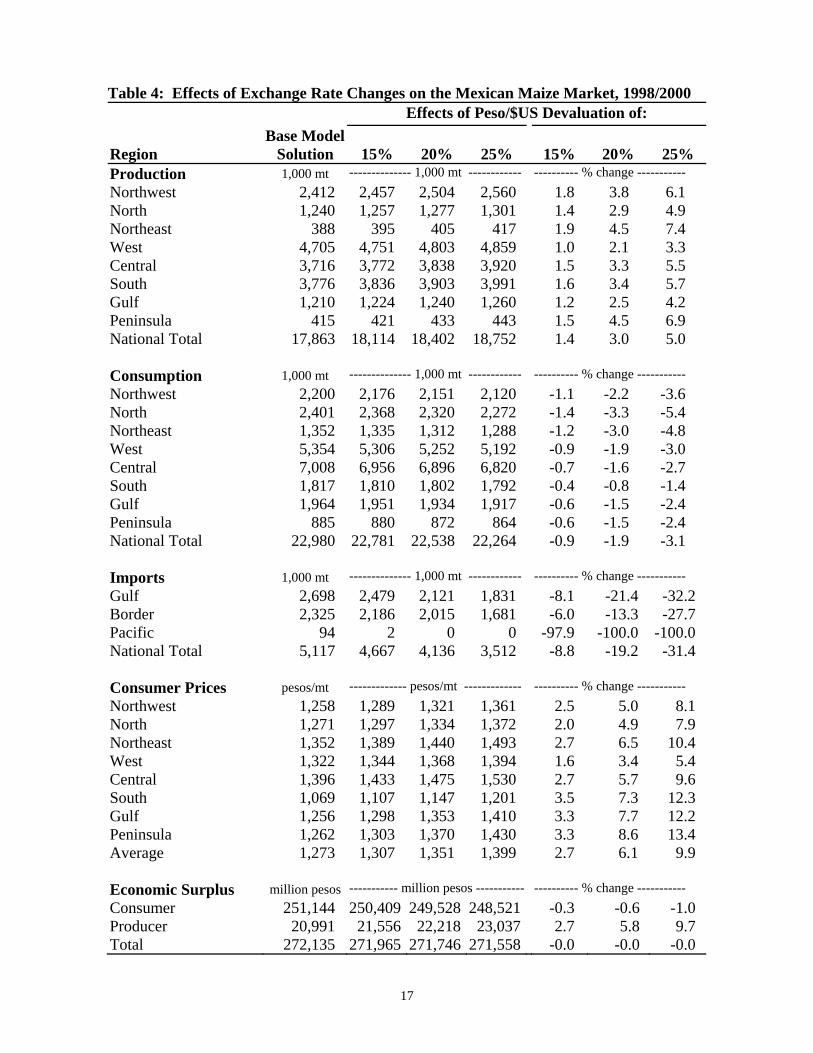
In this scenario, Mexican peso devaluations against the U.S. dollar of 15%, 20%, and 25% are analyzed under the assumption of completely free trade in order to separate exchange rate effects from NAFTA effects (Table 4). Because a devaluation of a country’s currency reduces the purchasing power of that currency in foreign markets, a drop in the value of the Mexican peso against the dollar would be expected to act like a restriction on maize imports and serve to protect Mexican maize production. The results indicate that a devaluation of the peso in 1998/2000 would have increased Mexican maize production and consumer prices and reduced consumption and imports. For a 25% devaluation of the Peso/$US exchange rate, for example, the results indicate that production would have been 5% higher and consumption would have been 3.1% lower than the actual levels in 1998/2000. The different response of production and consumption occurs because consumption is less elastic than production. At the same time, a 25% Peso/$US devaluation in 1998/2000 would have reduced imports by 31% and raised consumer maize prices almost 10% above what they actually were on average during that period. Despite the impacts on quantities and prices and a redistribution of income from consumers to producers, a devaluation of any level has little or no impact on net national welfare. In each devaluation scenario, the loss of economic surplus by consumers is about equal to the surplus gained by producers resulting in no net change in the net national welfare.
Scenario 4: Sensitivity of Trade Flows to Changes in Transportation Costs Another factor complicating the measurement of the effects of NAFTA on Mexican imports of U.S. maize is that transportation costs can also change which can affect the relative share of domestic maize consumption that comes from imports and from domestic production. Imports from the United States enter mainly through ports on the Gulf of Mexico and cities located on the northern border, such as Nuevo Laredo. Given the different potential sources for maize supplies, the prices often differ significantly among the various ports of entry. Generally, the price of maize at the northern border entry points is lower than the price at the Mexican Gulf ports. However, the cost of shipping from the northern border to Mexico City is generally higher than from Veracruz on the Gulf coast to Mexico City. To analyze the sensitivity of the supply, demand, imports, and prices of maize in Mexico to changes in the costs of transportation, three cases are analyzed with the model. The first includes a 20% increase in insurance and ocean freight rates from U.S. Gulf ports to Mexican Gulf ports with an increase in the cost of shipping from Mexican Gulf ports to internal points of consumption. The second case includes a 20% increase in transportation costs from northern border ports of entry to internal points of consumption. The third case includes a 20% increase in insurance and ocean freight rates from U.S. Gulf ports to Mexican Pacific ports along with an increase in shipping costs from the Mexican Pacific ports to internal points of consumption. The results from these three scenarios indicate clearly that the levels of production, consumption, imports, and prices are largely unaffected by changes in transportation costs (Table 5). The only effect is a re-distribution in the volume of imports among the ports of entry. For example, an
17
Table 4: Effects of Exchange Rate Changes on the Mexican Maize Market, 1998/2000 Effects of Peso/$US Devaluation of:
Region
Base ModelSolution
15%
20%
25%
15%
20%
25%
Production 1,000 mt -------------- 1,000 mt ------------ ---------- % change -----------
Northwest 2,412 2,457 2,504 2,560 1.8 3.8 6.1 North 1,240 1,257 1,277 1,301 1.4 2.9 4.9 Northeast 388 395 405 417 1.9 4.5 7.4 West 4,705 4,751 4,803 4,859 1.0 2.1 3.3 Central 3,716 3,772 3,838 3,920 1.5 3.3 5.5 South 3,776 3,836 3,903 3,991 1.6 3.4 5.7 Gulf 1,210 1,224 1,240 1,260 1.2 2.5 4.2 Peninsula 415 421 433 443 1.5 4.5 6.9 National Total 17,863 18,114 18,402 18,752 1.4 3.0 5.0 Consumption 1,000 mt -------------- 1,000 mt ------------ ---------- % change -----------
Northwest 2,200 2,176 2,151 2,120 -1.1 -2.2 -3.6 North 2,401 2,368 2,320 2,272 -1.4 -3.3 -5.4 Northeast 1,352 1,335 1,312 1,288 -1.2 -3.0 -4.8 West 5,354 5,306 5,252 5,192 -0.9 -1.9 -3.0 Central 7,008 6,956 6,896 6,820 -0.7 -1.6 -2.7 South 1,817 1,810 1,802 1,792 -0.4 -0.8 -1.4 Gulf 1,964 1,951 1,934 1,917 -0.6 -1.5 -2.4 Peninsula 885 880 872 864 -0.6 -1.5 -2.4 National Total 22,980 22,781 22,538 22,264 -0.9 -1.9 -3.1 Imports 1,000 mt -------------- 1,000 mt ------------ ---------- % change -----------
Gulf 2,698 2,479 2,121 1,831 -8.1 -21.4 -32.2 Border 2,325 2,186 2,015 1,681 -6.0 -13.3 -27.7 Pacific 94 2 0 0 -97.9 -100.0 -100.0 National Total 5,117 4,667 4,136 3,512 -8.8 -19.2 -31.4 Consumer Prices pesos/mt ------------- pesos/mt ------------- ---------- % change -----------
Northwest 1,258 1,289 1,321 1,361 2.5 5.0 8.1 North 1,271 1,297 1,334 1,372 2.0 4.9 7.9 Northeast 1,352 1,389 1,440 1,493 2.7 6.5 10.4 West 1,322 1,344 1,368 1,394 1.6 3.4 5.4 Central 1,396 1,433 1,475 1,530 2.7 5.7 9.6 South 1,069 1,107 1,147 1,201 3.5 7.3 12.3 Gulf 1,256 1,298 1,353 1,410 3.3 7.7 12.2 Peninsula 1,262 1,303 1,370 1,430 3.3 8.6 13.4 Average 1,273 1,307 1,351 1,399 2.7 6.1 9.9 Economic Surplus million pesos ----------- million pesos ----------- ---------- % change -----------
Consumer 251,144 250,409 249,528 248,521 -0.3 -0.6 -1.0 Producer 20,991 21,556 22,218 23,037 2.7 5.8 9.7 Total 272,135 271,965 271,746 271,558 -0.0 -0.0 -0.0
18
Table 5: Effect of Transportation Cost Increases on the Mexican Maize Market, 1998/2000
Base Model
Solution
20% increase in transport costs of imports that enter through:
Gulf Border Pacific Gulf Border Pacific
---------------- 1,000 mt ---------------- ---------------% change -----------
--- Production 17,863 17,889 17,858 17,862 0.1 0.0 0.0 Consumption 22,980 23,006 22,975 22,979 0.1 0.0 0.0 Imports 5,117 5,117 5,117 5,117 0.0 0.0 0.0 Gulf 2,698 2,405 2,709 2,718 -10.8 0.4 0.7 Border 2,325 2,681 1,866 2,394 15.3 -19.7 3.0 Pacific 94 30 542 5 -67.9 474.6 -94.9 Economic Surplus
-------------------- million pesos -------------------- ---------------% change ------------
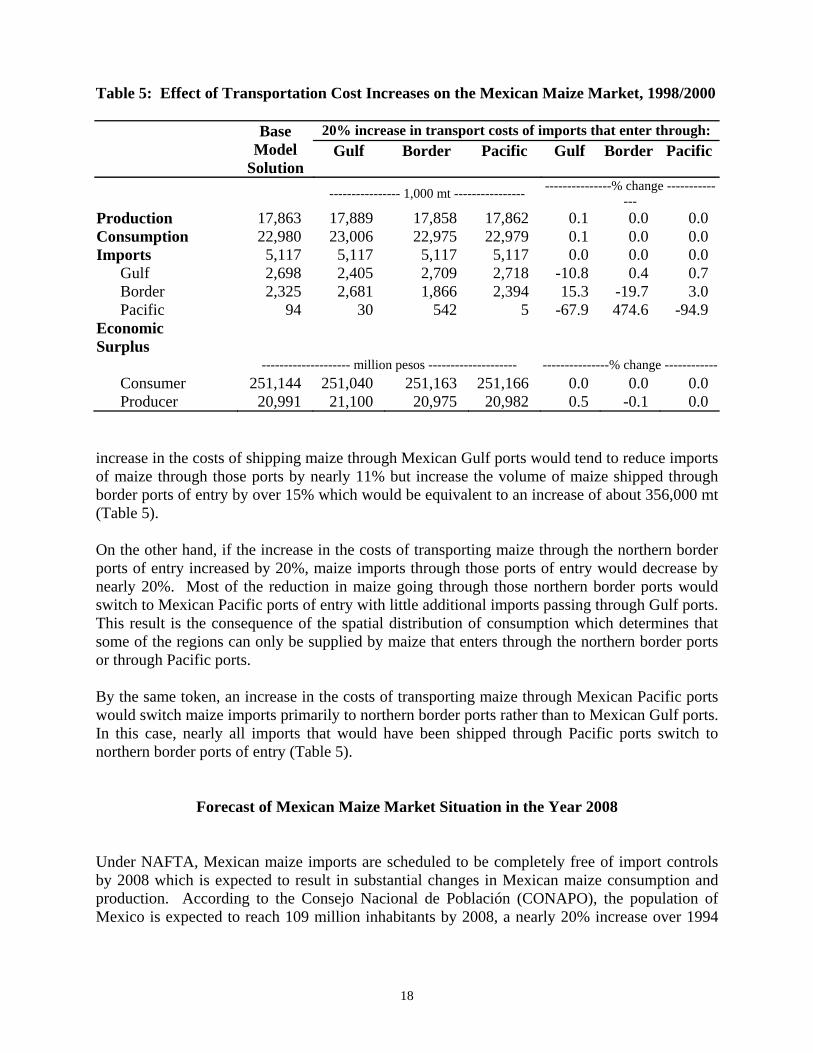
Consumer 251,144 251,040 251,163 251,166 0.0 0.0 0.0 Producer 20,991 21,100 20,975 20,982 0.5 -0.1 0.0 increase in the costs of shipping maize through Mexican Gulf ports would tend to reduce imports of maize through those ports by nearly 11% but increase the volume of maize shipped through border ports of entry by over 15% which would be equivalent to an increase of about 356,000 mt (Table 5). On the other hand, if the increase in the costs of transporting maize through the northern border ports of entry increased by 20%, maize imports through those ports of entry would decrease by nearly 20%. Most of the reduction in maize going through those northern border ports would switch to Mexican Pacific ports of entry with little additional imports passing through Gulf ports. This result is the consequence of the spatial distribution of consumption which determines that some of the regions can only be supplied by maize that enters through the northern border ports or through Pacific ports. By the same token, an increase in the costs of transporting maize through Mexican Pacific ports would switch maize imports primarily to northern border ports rather than to Mexican Gulf ports. In this case, nearly all imports that would have been shipped through Pacific ports switch to northern border ports of entry (Table 5).
Forecast of Mexican Maize Market Situation in the Year 2008 Under NAFTA, Mexican maize imports are scheduled to be completely free of import controls by 2008 which is expected to result in substantial changes in Mexican maize consumption and production. According to the Consejo Nacional de Población (CONAPO), the population of Mexico is expected to reach 109 million inhabitants by 2008, a nearly 20% increase over 1994
19
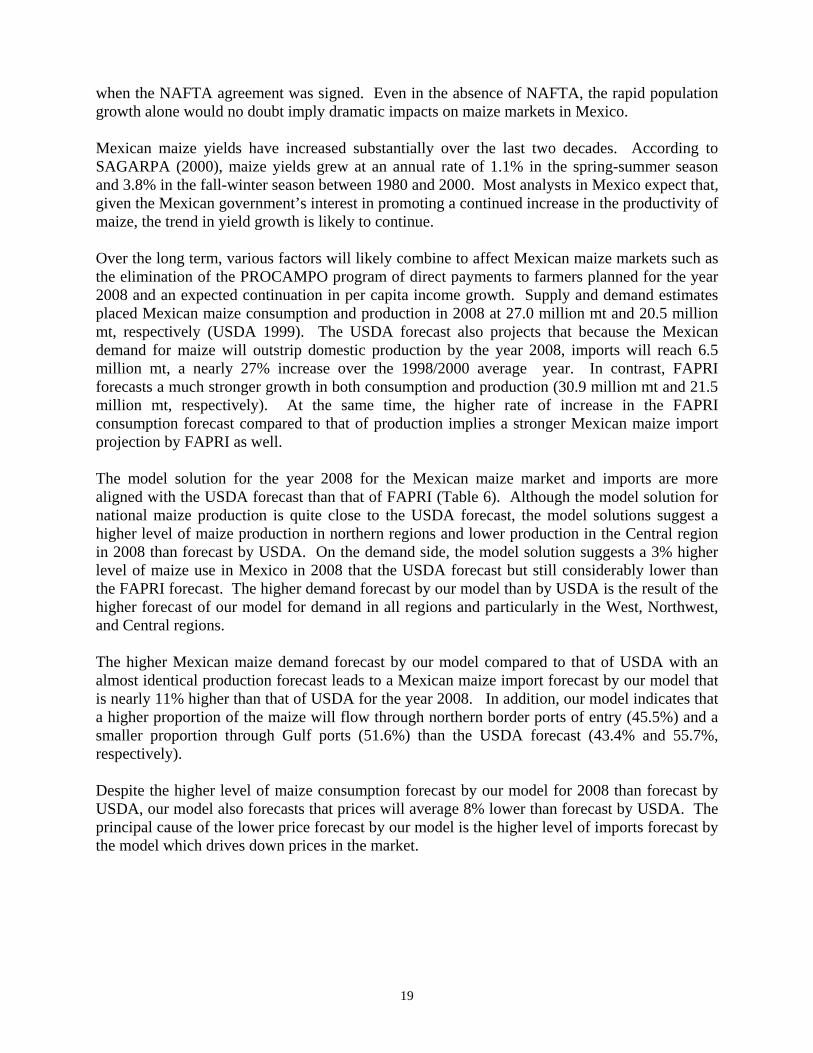
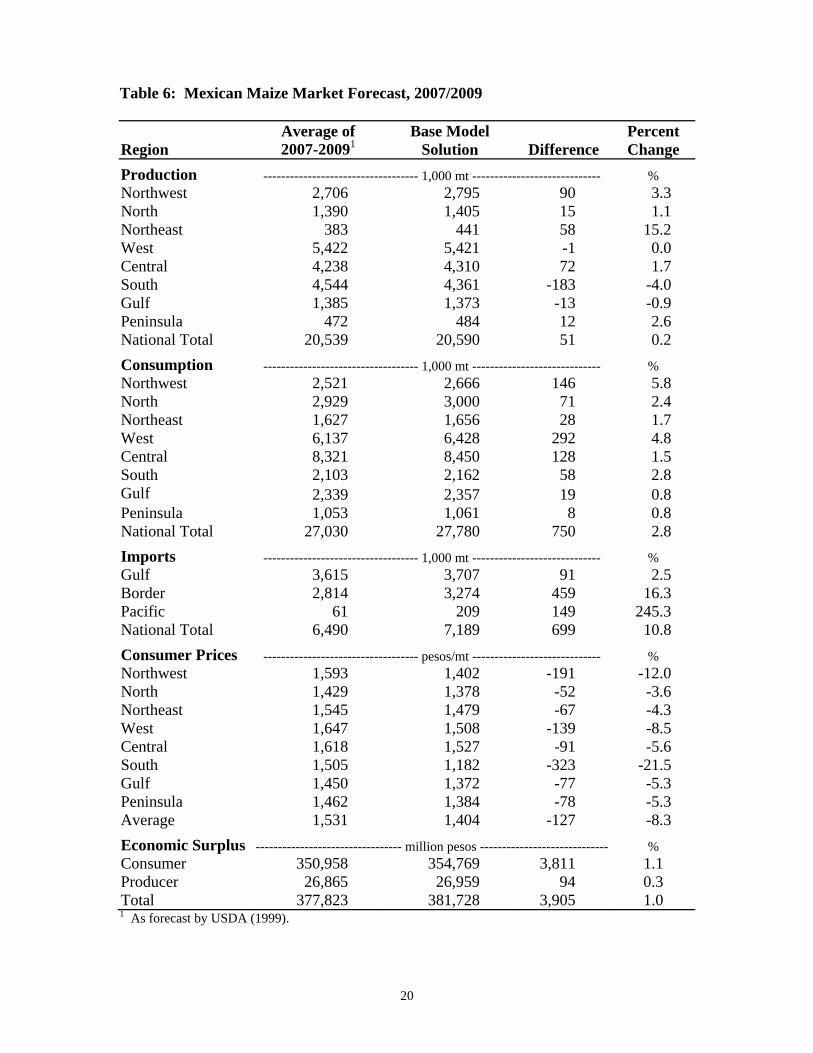
when the NAFTA agreement was signed. Even in the absence of NAFTA, the rapid population growth alone would no doubt imply dramatic impacts on maize markets in Mexico. Mexican maize yields have increased substantially over the last two decades. According to SAGARPA (2000), maize yields grew at an annual rate of 1.1% in the spring-summer season and 3.8% in the fall-winter season between 1980 and 2000. Most analysts in Mexico expect that, given the Mexican government’s interest in promoting a continued increase in the productivity of maize, the trend in yield growth is likely to continue. Over the long term, various factors will likely combine to affect Mexican maize markets such as the elimination of the PROCAMPO program of direct payments to farmers planned for the year 2008 and an expected continuation in per capita income growth. Supply and demand estimates placed Mexican maize consumption and production in 2008 at 27.0 million mt and 20.5 million mt, respectively (USDA 1999). The USDA forecast also projects that because the Mexican demand for maize will outstrip domestic production by the year 2008, imports will reach 6.5 million mt, a nearly 27% increase over the 1998/2000 average year. In contrast, FAPRI forecasts a much stronger growth in both consumption and production (30.9 million mt and 21.5 million mt, respectively). At the same time, the higher rate of increase in the FAPRI consumption forecast compared to that of production implies a stronger Mexican maize import projection by FAPRI as well. The model solution for the year 2008 for the Mexican maize market and imports are more aligned with the USDA forecast than that of FAPRI (Table 6). Although the model solution for national maize production is quite close to the USDA forecast, the model solutions suggest a higher level of maize production in northern regions and lower production in the Central region in 2008 than forecast by USDA. On the demand side, the model solution suggests a 3% higher level of maize use in Mexico in 2008 that the USDA forecast but still considerably lower than the FAPRI forecast. The higher demand forecast by our model than by USDA is the result of the higher forecast of our model for demand in all regions and particularly in the West, Northwest, and Central regions. The higher Mexican maize demand forecast by our model compared to that of USDA with an almost identical production forecast leads to a Mexican maize import forecast by our model that is nearly 11% higher than that of USDA for the year 2008. In addition, our model indicates that a higher proportion of the maize will flow through northern border ports of entry (45.5%) and a smaller proportion through Gulf ports (51.6%) than the USDA forecast (43.4% and 55.7%, respectively). Despite the higher level of maize consumption forecast by our model for 2008 than forecast by USDA, our model also forecasts that prices will average 8% lower than forecast by USDA. The principal cause of the lower price forecast by our model is the higher level of imports forecast by the model which drives down prices in the market.
20
Table 6: Mexican Maize Market Forecast, 2007/2009
Region
Average of 2007-20091
Base Model Solution
Difference
Percent Change
Production ----------------------------------- 1,000 mt ----------------------------- % Northwest 2,706 2,795 90 3.3 North 1,390 1,405 15 1.1 Northeast 383 441 58 15.2 West 5,422 5,421 -1 0.0 Central 4,238 4,310 72 1.7 South 4,544 4,361 -183 -4.0 Gulf 1,385 1,373 -13 -0.9 Peninsula 472 484 12 2.6 National Total 20,539 20,590 51 0.2
Consumption ----------------------------------- 1,000 mt ----------------------------- % Northwest 2,521 2,666 146 5.8 North 2,929 3,000 71 2.4 Northeast 1,627 1,656 28 1.7 West 6,137 6,428 292 4.8 Central 8,321 8,450 128 1.5 South 2,103 2,162 58 2.8 Gulf 2,339 2,357 19 0.8 Peninsula 1,053 1,061 8 0.8 National Total 27,030 27,780 750 2.8
Imports ----------------------------------- 1,000 mt ----------------------------- % Gulf 3,615 3,707 91 2.5 Border 2,814 3,274 459 16.3 Pacific 61 209 149 245.3 National Total 6,490 7,189 699 10.8
Consumer Prices ----------------------------------- pesos/mt ----------------------------- % Northwest 1,593 1,402 -191 -12.0 North 1,429 1,378 -52 -3.6 Northeast 1,545 1,479 -67 -4.3 West 1,647 1,508 -139 -8.5 Central 1,618 1,527 -91 -5.6 South 1,505 1,182 -323 -21.5 Gulf 1,450 1,372 -77 -5.3 Peninsula 1,462 1,384 -78 -5.3 Average 1,531 1,404 -127 -8.3
Economic Surplus --------------------------------- million pesos ----------------------------- % Consumer 350,958 354,769 3,811 1.1 Producer 26,865 26,959 94 0.3 Total 377,823 381,728 3,905 1.0 1 As forecast by USDA (1999).
21
Summary and Conclusions The Mexican government practice of allowing duty-free imports of maize beyond the quota limits set under NAFTA has been severely criticized in Mexico. This practice has been widely blamed for a wide variety of problems in Mexican maize markets. The results of this study clearly indicate that the practice of allowing the additional duty-free imports had a negative impact on producer welfare in the 1998/2000 period compared to what would have been the case if maize imports had been limited as allowed under NAFTA. At the same time, however, the study emphasizes that net national welfare increased as a result because of the lower prices and higher level of consumption allowed by the practice. Thus, while the Mexican government practice of allowing additional duty-free imports has been detrimental to producers, the loss suffered by producers has been more than offset by the gain to consumers resulting in a net national welfare gain. Even though the Mexican government has operated a more liberal maize import policy than allowed for under NAFTA, this study finds that the market effects of that policy fell short of those that would have occurred under a completely free trade policy. Under free trade, imports would have been 25% higher, prices 8% lower, and producer welfare 7% lower than actually occurred with the additional duty-free imports allowed by the government. At the same time, while production would have been lower under free trade than actually occurred, this study indicates that the level of production achieved even under free trade (17.1 million mt) would have been higher than the level of maize production in 1994. In other words, the practice of allowing additional duty-free imports reduced the rate of growth but not the absolute level of maize production in Mexico. Even a policy of free trade would not have turned the growth rate of domestic maize production negative. Although Mexican maize production may have some comparative advantage in some regions of Mexico over imports, more likely the direct subsidies to producers through the PROCAMPO policy along with ASERCA marketing subsidies play an important role in sustaining production levels despite growing imports. Given the instability in the Peso/$US exchange rate in recent years, particularly in the year following the signing of NAFTA, this study also explored the sensitivity of maize imports to exchange rate changes. The study finds that a 25% devaluation of the Mexican peso relative to the U.S. dollar, for example, would place imports at a level close to the quota limit levels set by NAFTA. An implication of this finding is that the Mexican maize market is heavily influenced by macroeconomic policy. Large swings in the value of the Mexican peso against the U.S. dollar would be highly disruptive to U.S.-Mexico maize trade. As trade liberalization under NAFTA continues, the Mexican economy will be more closely tied to the U.S. economy which should provide some economic stability in Mexico. However, independence of the Mexican monetary authority, continuing Mexican debt and economic growth problems, and a tendency towards a high rate of inflation prodded by a rapid expansion of the Mexican monetary base will continue to expose the Peso/$US exchange rate to a great deal of variability. As Mexican maize markets continue to open under NAFTA, transportation costs could become increasingly important in determining both the levels and flows of Mexican maize imports from the United States. The results of this study, however, indicate that while increases in transportation costs from the various ports of entry to internal consumption points in Mexico
22
would not have substantial effects on the level of maize consumption, production, imports, or prices in Mexico, the flow of imports through the various ports would be considerably altered. Increases in transportation costs from the Gulf ports to internal consumption points, for example, would reduce the flow of maize through the Gulf and increase the flow through northern border ports of entry. In contrast, an increase in transportation costs for shipping maize from northern border ports to internal points of consumption in Mexico would reduce the flow of maize through those ports and increase the flow through Mexican Pacific ports while having little impact on the flow through Mexican Gulf ports. These results are the consequence of the spatial distribution of consumption which requires some regions like the West and Northwest to be supplied with maize through northern border or Pacific ports rather than Gulf ports at reasonable relative levels of transportation costs because of the relatively large distances involved. Finally, the results of using the model to forecast the levels of Mexican maize supply, demand, and price suggest that Mexican maize imports will be higher and domestic prices lower in the year 2008 than forecast by USDA.
REFERENCES Apoyos y Servicios a la Comercialización Agropecuaria (ASERCA ), “Boletín de Precios de
Indiferencia,” México, D.F., 2000. Bivings, E. L., “The Seasonal and Spatial Dimensions of Sorghum Market Liberalization in
Mexico,” American Journal of Agricultural Economics 79:383-393, 1997. Boyd, R., K. Doroodian, and S. Abdul-Latif, “The Effects Of Tariff Removals On The North
American Lumber Trade,” Canadian Journal of Agricultural Economics 41:311-328, 1993. Calva, José Luis, “Razones y principios de una política integral incluyente de los campesinos,”
En Ernesto Moreno et al., El Sistema de Poscosecha de Granos en el Medio Rural: Problemática y Propuestas, Programa Universitario de Alimentos de la UNAM. México, D.F., 1995.
Cámara de Diputados, “¿Cuánta liberalización aguanta la agricultura? Impacto del TLCAN en el
sector agroalimentario,” Comisión de Agricultura de la Cámara de Diputados, LVII Legislatura, México, D.F., 2000.
Cámara Nacional de la Industria de la Transformación (CANACINTRA), “La industria
alimenticia animal en México,” México, D.F., 1996. Consejo Nacional de Población (CONAPO), “Estimación de la población base y proyecciones de
población, 1990-2030,” México, D.F., 1995. Cramer, Gail L., E. J. Wailes, and S. Shui, “Impacts of Liberalizing Trade in the World Rice
Market,” American Journal of Agricultural Economics 75:219-226, 1993.
23
Dirección General de Tarifas, Transporte Ferroviario y Multimodal, “Competitividad de los servicios de transporte para maíz en México,” Paper presented in the Supply Chain Forum, Colegio de Postgraduados, Montecillo, Mexico, 2000.
Fellin, L., S.W. Fuller, and V. Salin, “U.S./Mexico Rice Trade: An Economic Analysis of factors
Influencing Future Trade,” International Market Research Report No. IM-1-00, Texas Agricultural Market Research Center, Department of Agricultural Economics, Texas A&M University, College Station, Texas, February 2000.
Ferra Luna, Ulises, Personal communication, Dirección General de Operaciones Financieras,
Apoyos y Servicios a la Comercialización Agropecuaria (ASERCA ), June 2001. Food and Agricultural Policy Research Institute (FAPRI), “U.S. and World Agricultural Outlook
2001,” www.fapri.org/Outlook2001/PageMker/outlk2001CG.pdf, December 2001. Fuller, S. W. and N. Gutierrez, “Grain and Soybean Surpluses/Deficits of Mexican States, 1989-
90,” Contract Report AMS-1, Department of Agricultural Economics, Texas A&M University System, College Station, Texas, 1990.
García S., J. A., “Distribución Espacial E Intertemporal De La Producción De Maíz en México,”
Ph.D. dissertation, Colegio de Postgraduados, Montecillo, Mexico, 1999. Gillis, M., “The Economic Effects of Liberalized U.S.-Mexico Dry Onion Trade,” M.S. Thesis,
Department of Agricultural Economics, Texas AM University, College Station, Texas, 1993.
Instituto Nacional de Estadística Geografía e Informática (INEGI), “XIV Censo Industrial, XI
Censo Comercial y XI Censo de Servicios, Aguascalientes, Mexico, 1995. _____________, “Cuaderno de Información Oportuna,” Aguascalientes, Mexico, 1999 and
2000. Kawaguchi, T., N. Suzuki, and H. M. Kaiser, “A Spatial Equilibrium Model for Imperfectly
Competitive Milk Markets,” American Journal of Agricultural Economics 79: 851-859, 1997.
Lavin, A.A., Personal Communication, Transportación Ferroviaria Mexicana, November 2001. Levy, S. and S. van Wijnbergen, “Maize and the Free Trade Agreement Between Mexico and the
United States,” World Bank Economic Review 6:481-502, 1992. Nicholson, C.F., “Economic Liberalization, Free Trade, and Structural Change: A Spatial
Economic Analysis of Mexico’s Dairy Sector,” Ph.D. dissertation, Cornell University, Ithaca, New York, 1996.
Secretaría de Agricultura, Ganadería y Desarrollo Rural (SAGAR), “Anuario Estadístico de
Producción y Comercialización de Maíz,” México, D.F., 1998.
24
Secretaría de Agricultura, Ganadería, Desarrollo Rural, Alimentación y Pesca (SAGARPA),
“Anuario Estadístico de la Producción Agrícola de los Estados Unidos Mexicanos,” México, D.F., 2000.
_____________, “Avances de Siembras y Cosechas,” México, D.F., 2001. Secretaría de Comercio y Fomento Industrial (SECOFI), “Fracciones Arancelarias y Plazos de
Desgravación, Tratado de Libre Comercio de América del Norte,” México, D.F., 1994. _____________, “Reporte de Series de las Importaciones Definitivas por Fracción,” México, D.
F., 2001. Senado de la República, “Análisis de los Efectos del Tratado de Libre Comercio de América del
Norte en la Economía Mexicana: Una Visión Sectorial a Cinco Años de Distancia” Tomo I, México, D.F., 2000.
Secretaría del Trabajo y Previsión Socia (STPS), “Efectos de las Reformas Económicas y Jurídicas
Sobre el Empleo de Mano de Obra en el Sector Agropecuario,” Subsecretaría "B", México, D.F., 1994.
Sistema Nacional de Información Integral de Mercados (SNIIM), “Mercados Nacionales: Granos
y Semillas,” www.secofi-sniim.gob.mx/nuevo/index.html, November 2001. Sullivan, J., J. Wainio, and V. Roningen, “A Database for Trade Liberalization Studies,” U.S.
Department of Agriculture, Agricultural and Trade Analysis Division, Washington, D.C., 1989.
Takayama, T. and G. G. Judge. Spatial and Temporal Price and Allocation Models. North-
Holland Publishing Company: Amsterdam, The Netherlands, 1971. U.S. Department of Agriculture (USDA), “Agricultural Baseline Projections to 2008,”
Interagency Agricultural Projections Committee, Staff Report WAOB-99-1, Washington, D.C., 1999.
_____________, “USDA Agricultural Baseline Projections to 2010,” Interagency Agricultural
Projections Committee, Staff Report WAOB-2001-1, Washington, D.C., 2001. _____________, “Marketing and Transportation Analysis: Grain Transportation Report,”
www.ams.usda.gov/tmd/grain.htm, November 2001. United States International Trade Commission (USITC), “Interactive Tariff and Trade
DataWeb,” Corn: FAS general customs value/general first unit of quantity by HTS number for Mexico, http://dataweb.usitc.gov/scripts, October 2001.
Westcott, P., Personal communication, Economic Research Service, U.S. Department of
Agriculture, November 2001.
25
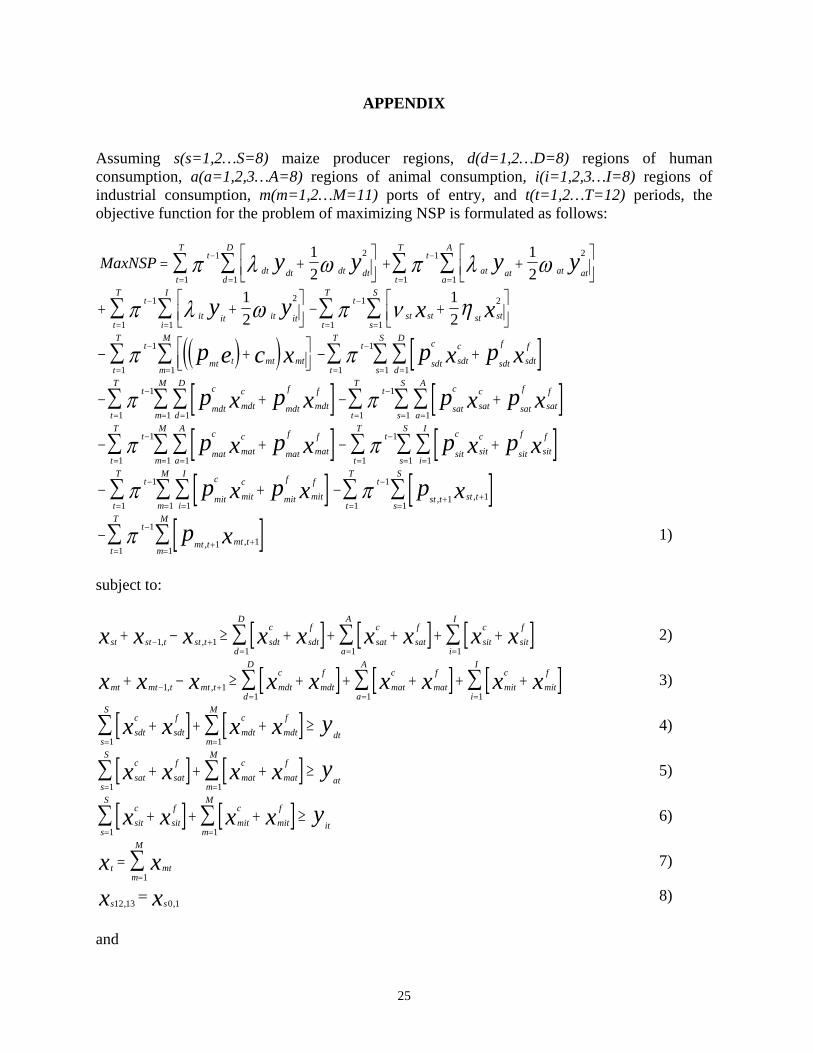
APPENDIX Assuming s(s=1,2…S=8) maize producer regions, d(d=1,2…D=8) regions of human consumption, a(a=1,2,3…A=8) regions of animal consumption, i(i=1,2,3…I=8) regions of industrial consumption, m(m=1,2…M=11) ports of entry, and t(t=1,2…T=12) periods, the objective function for the problem of maximizing NSP is formulated as follows:
MaxNSPt
dt dt dt dtd
D
t
T
y y
1 2
11
1
2
t
at at at ata
A
t
T
y y1 2
11
1
2
t
it it it iti
I
t
T
y y1 2
11
1
2
t
st st st sts
S
t
T
x x1 2
11
1
2
t
mt t mt mtm
M
t
T
p e c x1
11
t
t
T
sdt
c
sdt
c
sdt
f
sdt
f
d
D
s
S
p x p x1
1 11
t
t
T
mdt
c
mdt
c
mdt
f
mdt
f
d
D
m
M
p x p x1
1 11
t
t
T
sat
c
sat
c
sat
f
sat
f
a
A
s
S
p x p x1
1 11
t
t
T
mat
c
mat
c
mat
f
mat
f
a
A
m
M
p x p x1
1 11
t
t
T
sit
c
sit
c
sit
f
sit
f
i
I
s
S
p x p x1
1 11
t
t
T
mit
c
mit
c
mit
f
mit
f
i
I
m
M
p x p x1
1 11
t
st t st ts
S
t
T
p x1
1 111
, ,
t
mt t mt tm
M
t
T
p x1
1 111
, , 1)
subject to:
st st t st t sdt
c
sdt
f
d
D
sat
c
sat
f
a
A
sit
c
sit
f
i
I
x x x x x x x x x 1 1
1 1 1, ,
2)
mt mt t mt t mdt
c
mdt
f
d
D
mat
c
mat
f
a
A
mit
c
mit
f
i
I
x x x x x x x x x 1 1
1 1 1, ,
3)
sdt
c
sdt
f
mdt
c
mdt
f
m
M
s
S
dtx x x x y
11
4)
sat
c
sat
f
s
S
mat
c
mat
f
m
M
atx x x x y
1 1
5)
sit
c
sit
f
s
S
mit
c
mit
f
m
M
itx x x x y
1 1
6)
t mtm
M
x x
1
7)
xx ss 1,013,12 8)
and
26
dt at it st mt sdt
c
sdt
f
mit
f
st t mt ty y y x x x x x x x, , , , , ,......, , ,, ,
1 1 0 9)
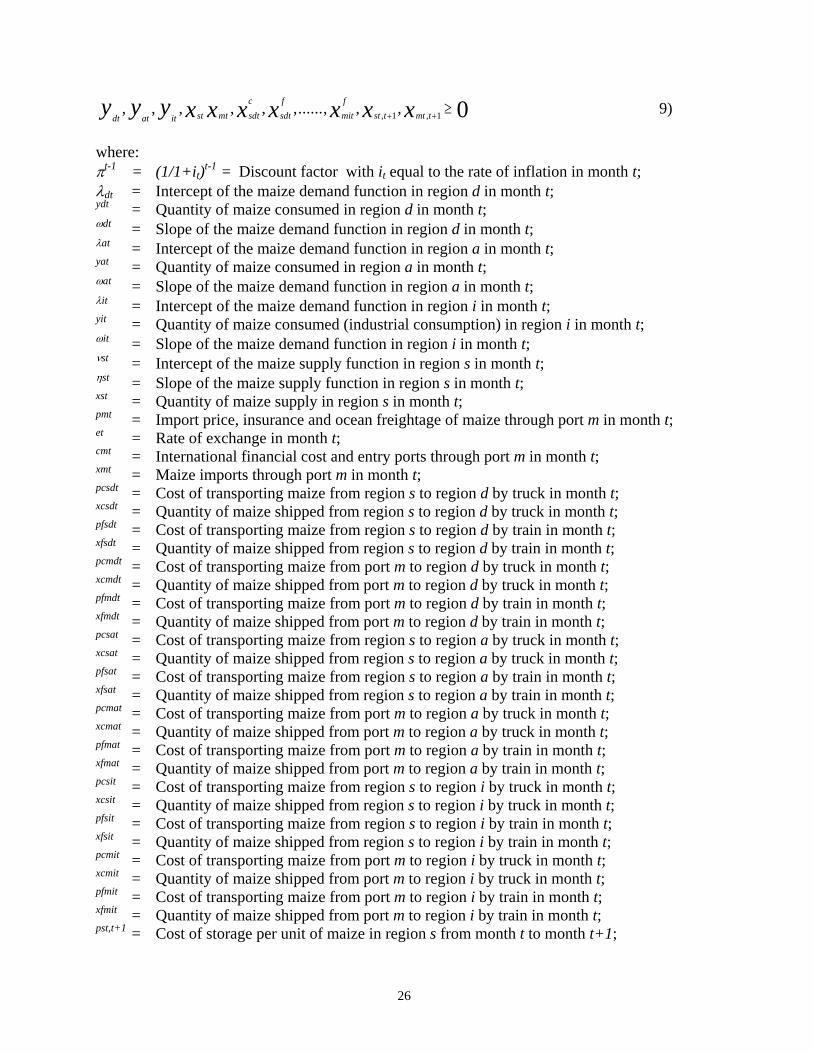
where: t-1 = (1/1+it)
t-1 = Discount factor with it equal to the rate of inflation in month t; dt = Intercept of the maize demand function in region d in month t;
ydt = Quantity of maize consumed in region d in month t;
dt = Slope of the maize demand function in region d in month t; at = Intercept of the maize demand function in region a in month t;
yat = Quantity of maize consumed in region a in month t; at = Slope of the maize demand function in region a in month t;
it = Intercept of the maize demand function in region i in month t; yit = Quantity of maize consumed (industrial consumption) in region i in month t; it = Slope of the maize demand function in region i in month t; st = Intercept of the maize supply function in region s in month t; st = Slope of the maize supply function in region s in month t;
xst = Quantity of maize supply in region s in month t; pmt = Import price, insurance and ocean freightage of maize through port m in month t; et = Rate of exchange in month t; cmt = International financial cost and entry ports through port m in month t; xmt = Maize imports through port m in month t; pcsdt = Cost of transporting maize from region s to region d by truck in month t;
xcsdt = Quantity of maize shipped from region s to region d by truck in month t; pfsdt = Cost of transporting maize from region s to region d by train in month t; xfsdt = Quantity of maize shipped from region s to region d by train in month t;
pcmdt = Cost of transporting maize from port m to region d by truck in month t; xcmdt = Quantity of maize shipped from port m to region d by truck in month t; pfmdt = Cost of transporting maize from port m to region d by train in month t; xfmdt = Quantity of maize shipped from port m to region d by train in month t; pcsat = Cost of transporting maize from region s to region a by truck in month t; xcsat = Quantity of maize shipped from region s to region a by truck in month t; pfsat = Cost of transporting maize from region s to region a by train in month t; xfsat = Quantity of maize shipped from region s to region a by train in month t; pcmat = Cost of transporting maize from port m to region a by truck in month t; xcmat = Quantity of maize shipped from port m to region a by truck in month t; pfmat = Cost of transporting maize from port m to region a by train in month t; xfmat = Quantity of maize shipped from port m to region a by train in month t; pcsit = Cost of transporting maize from region s to region i by truck in month t; xcsit = Quantity of maize shipped from region s to region i by truck in month t; pfsit = Cost of transporting maize from region s to region i by train in month t; xfsit = Quantity of maize shipped from region s to region i by train in month t; pcmit = Cost of transporting maize from port m to region i by truck in month t; xcmit = Quantity of maize shipped from port m to region i by truck in month t; pfmit = Cost of transporting maize from port m to region i by train in month t; xfmit = Quantity of maize shipped from port m to region i by train in month t; pst,t+1 = Cost of storage per unit of maize in region s from month t to month t+1;
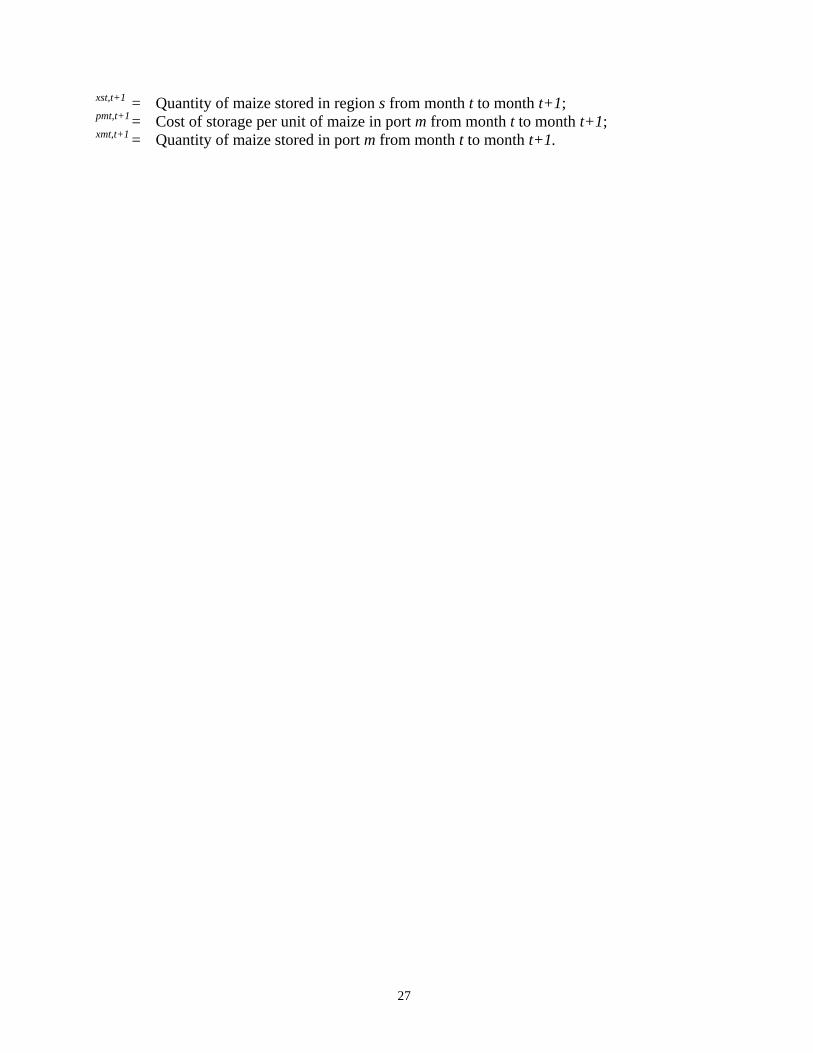
27
xst,t+1 = Quantity of maize stored in region s from month t to month t+1; pmt,t+1 = Cost of storage per unit of maize in port m from month t to month t+1; xmt,t+1 = Quantity of maize stored in port m from month t to month t+1.