Embed Size (px)
Citation preview

João Paulo Soares dos Reis Pires
PRELIMINARY MINERAL PROSPECTING ON THE CULOCAU
RIVER BASIN
BARIQUE-NATARBORA (EAST TIMOR)
Dissertation in the scope of the Master of Geoscience, advisors by Doctor João António
Mendes Serra Pratas and Doctor Fernando Antunes Gaspar Pita, and presented to the
Department of Earth Sciences of the Faculty of Science and Technology of the University of
Coimbra
September 2019
ii
João Paulo Soares dos Reis Pires
PRELIMINARY MINERAL PROSPECTING ON THE CULOCAU RIVER BASIN
BARIQUE-NATARBORA (EAST TIMOR)
Master in Geoscience
Scientific Advisors
Doutor João António Mendes Serra Pratas,
Prof. Doutor Fernando Antunes Gaspar Pita
UNIVERSIDADE DE COIMBRA
FACULDADE DE CIÊNCIAS E TECNOLOGIA
Departamento Ciências da Terra
September, 2019

iii
Acknowledgement
Firstly, All the gratitude to Almighty God for blessings, grace, so that the writing of this
dissertation can be carried out from beginning to end.
I would like to thank and appreciate both of my supervisors: Professor João António
Mendes Pratas and Fernando Antunes Gaspar Pita, who have contributed a great deal of
support and invaluable assistance for formulating the research topic, methodology, results
and conclusions of this dissertation.
Many thanks to Professor Nelson Rodrigues, who has taken care of all needs
administratively during the study related to the magister program in geoscience.
Then, the I would like to express deepest gratitude to beloved parents, wife and childrens
and the whole family for moral support and prayer for during and the success of study.
furthermore, on this special occasion, the I would like to express the deepest gratitude to:
The Instituto do Petróleo e Geologia (IPG) - Timor Leste and its all management for their
full support for this magister program study
The Universidade de Coimbra - Faculdade de Ciências e Tecnologia, specially the
Departamento de Ciências da Terra (DCT) and its all management, lecturers and staffs.
Finally, I would like to have more feedback to improve the writing of this dissertation and
hopefully this report can be useful for everyone who will read, thank you.
iv
Abstract
The prospecting by conducting geochemical surveys and panned heavy mineral
concentrates sample (Stream sediment or drainage surveys), are based on the concept that
fluvial and chemical processes carry metals and minerals from within a drainage catchment
(watershed) to a site of mineral either base metals or precious metals accumulation. This
technique has been commonly applied for precious metals, gems and other dense minerals
with economic importance which can be identified in the field. More recently, multi-
elemental chemical analysis of heavy minerals has become widely used. This study is to
evaluate and identify sub-basins that may be anomalous for some minerals with economic
interest through chemical analysis of the stream sediments or panned concentrates, to
locate the primary mineral deposits that may be present on the study area, to predict the
geochemical environment of the geological formations present in the study area and their
relationships and to establish the regional mineralogical and metallogenic characteristics by
studying the heavy minerals present in panned concentrates and also with geochemical
analysis of the fine fraction of stream sediments.
The prospecting method was conducted with field observations for watershed as catchment
area of materials, sample collection referred to watershed determination. Then, chemical
analysis of X-ray fluorescence (XRF) and inductively coupled plasma mass spectrometry
(ICP-MS) were applied for those collected sample that represented each of
watersheds.Furthermore, the data were resulted from chemical analyses then applied with
statistical data to classify thresholds values that separate the defined value ranges from
the background and the anomalous values
There have been two basins are considered to have mineralization anomaly with the
watersheds. Therefore, it is recommended that a detailed geological and geochemical study
could be carried out in areas upstream, principally from sites of anomalous values of
metals. This is necessary to confirm the presence or otherwise of the different suspected
metallic mineralizations in the area.
Keywords: Barique-Narabora (Timor); geochemical prospecting; sediments; anomaly,
mineralizations.
v
Resumo
A prospecção através da realização de levantamentos geoquímicos e amostras de
concentrados de minerais pesados de bateia, baseia-se no conceito de que, numa dada
bacia de drenagem, processos químicos e fluviais transportam minerais e metais, comuns
ou preciosos, podendo levar à sua deposição e acumulação. Essa técnica tem sido
comumente aplicada a metais preciosos, gemas e outros minerais densos com importância
económica. Mais recentemente, a análise química multi-elementar de minerais pesados
tornou-se amplamente utilizada.
Este estudo visa avaliar e identificar sub-bacias que possam conter concentrações
anómalas de alguns minerais com potencial interesse económico. Sua relação com as
formações geológicas presentes na área de estudo.
O método de prospecção foi conduzido com observações de campo da bacia hidrográfica
da área de captação do material, coleta de 32 amostras de sedimentos em linhas de água,
com posterior concentração em bateia no campo, sendo depois em laboratório submetidas
a separação magnética e análise química.
Os dados resultantes de análises químicas e seu tratamento estatístico, permitiu identificar
as zonas com concentrações de alguns dos elementos químicos. Houve duas bacias
hidrográficas com concentrações anómalas de mineralização. Recomenda-se que um
estudo geológico e geoquímico detalhado possa ser realizado em áreas a montante,
principalmente a partir de locais com valores anómalos de metais. Isso é necessário para
confirmar a presença ou não das diferentes mineralizações metálicas suspeitas na área.
Palavras-chave: Barique-Narabora (Timor); prospecção geoquímica; sedimentos;
anomalia, mineralizações.
vi
Index
Cover sheet ……………………………………………………………………………………..….. ii
Acknowledgement …………………………………………………………………….….……….. iii
Abstract …………………………………………………………………………...…….…...…….. iv
Resumo ………………………………………………………..…………….…………….……….. v
Index ……………………………………………………………………………………….……….. vi
Chapter I Introduction
1.1. Background ……………………………………..…………………………………………. 1
1.2. Objectives …………………………………………………………..……..………………. 2
1.3. Methodology …………………………………………………..……..……………………. 2
1.4. Orgazation of work …………………………………………………..……………...……. 2
Chapter II Study area and regional geology ……………………..............…………………… 3
2.1. Study Area …………………………..…………………………………………………….. 3
2.2. Regional Geology ………………………..……………………………………………….. 3
2.3. Regionl stratigraphy ………………………………..…………………………………….. 6
2.3.1. Lolotoi complex ………………………………………….……………………... 7
2.3.2. Barique formation ……………………………………………………………… 8
2.4 Previous study ………………………………….……………………………..…………… 9
2.4.1 Metallogeny and mineral potential of Timor island and adjacent areas …... 9
2.4.2. Metallic mineral occurrences of Timor Leste ………………………….…… 12
Chapter III Methodology ………………………………………………………………………… 13
3.1 Preliminary study ………………………………………………………………………… 13
3.2 Time frame and field work ……………………………...……………………………… 13
3.3. Site selection …………………………………………………………………………….. 13
3.4 Sample collection ………………………………………………………………………… 15
3.5 Field observations ……………………………………………………………………….. 18
3.6 Sample preparation ……………………………………………………………………… 19

vii
3.7 Geochemistry statistical prospection ………………….……….……………………. 22
3.7.1 Modified z score test ……………………………………..……………..…… 23
3.7.2 Pearson's correlation coefficient ………………………………….………… 24
Chapter IV Results and discussion …………………………….……………………………… 26
4.1 Lithology Unit ……………………………………………………….....…………….…… 26
4.2 Pan concentrates ……………………………………………………...…………….…… 29
4.2 Geochemical analyses ............................................................................................. 35
4.2.1 Anomaly classification ………………………………………………………... 37
4.2.2. Correlation coefficient ………………………….…………………………….. 41
4.2.3. Anomaly map on watershed ………………………………………………… 42
Chapter V Conclusions ………………………………………….……………………………… 53
References ……………………………………………………………………………………….. 54
Appendix ………………………………………………………………………………………….. 55

viii
Index of figures
Figure 2.1 The area of study is located at Barique and Abat Oan Villages (Suco) -
Barique/Natarbora Subdistrict, Manatuto Municipality ………………………..…. 3
Figure 2.2 Digital elevation model of the Banda Arc region ………………………………...… 4
Figure 2.3 Geological Map of Portuguese Timor (Audley Charles,1968) …………………... 6
Figure 2.4. Generalized geologic map of Timor taken mostly from Audley-Charles (1968)
and Harris et al. (2000) ………………………………………………..……………. 7
Figure 3.1. Designated Sample site location and watershed from (a) topography map,
b).3-D DEM image………………………………………………………………….. 14
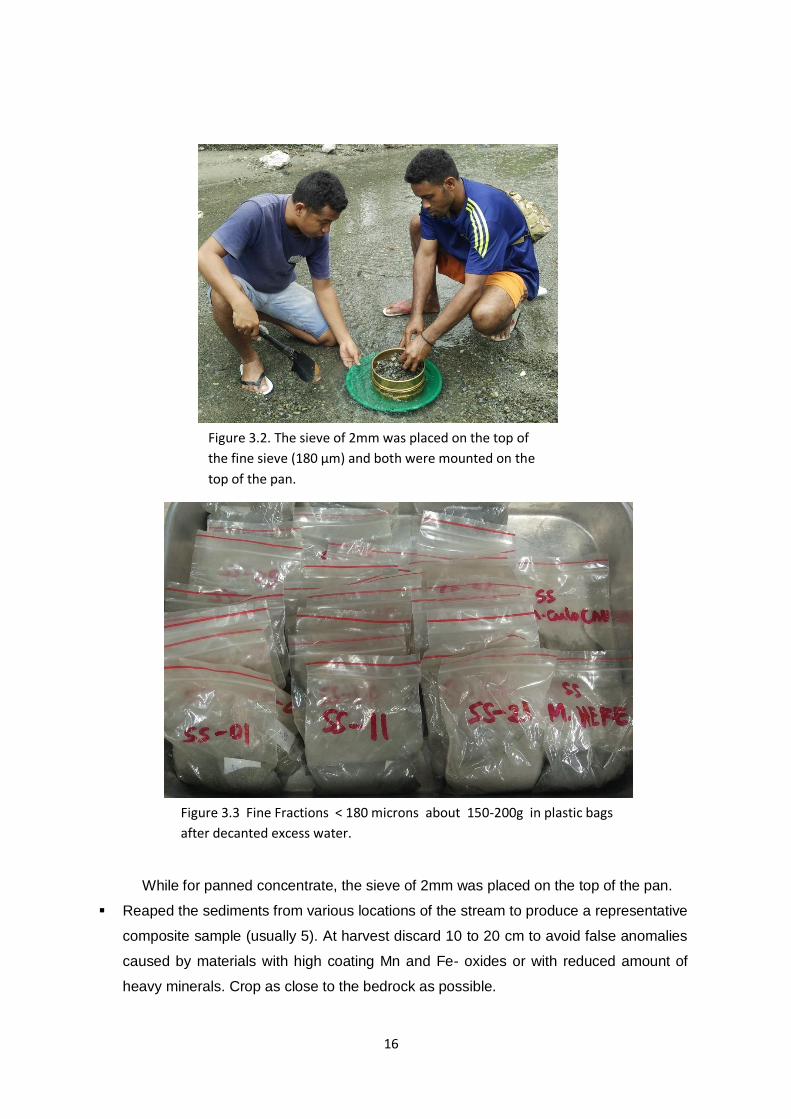
Figure 3.2. The sieve of 2mm was placed on the top of the fine sieve (180 µm) and both
were mounted on the top of the pan …………………………………………...… 16
Figure 3.3 Fine Fractions < 180 microns about 150-200g in plastic bags after
decanted excess water ……………………………………………………..…..…. 16
Figure 3.4. Sieve the sediments on screen, remove the large clastic and rub the material
to promote disaggregation ……………………………………………...…………..17
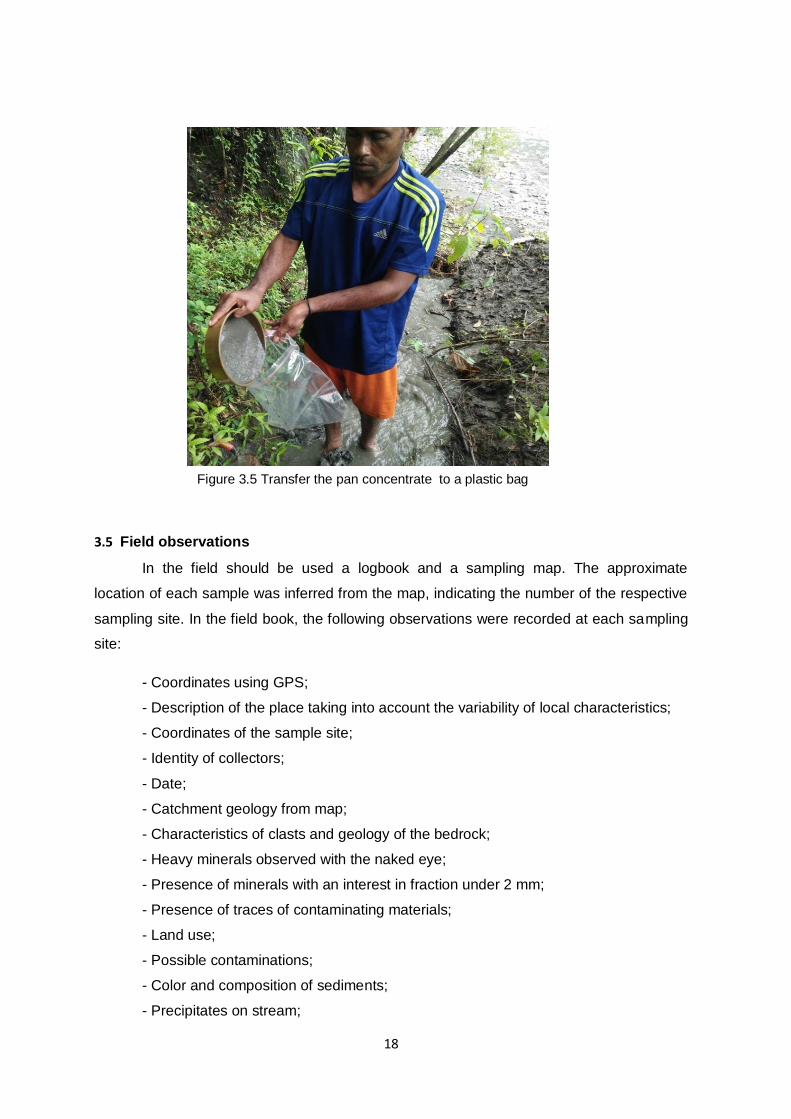
Figure 3.5 Transfer the pan concentrate to a plastic bag …………………………………... 18
Figure 3.6. Frantz magnetic separator (Laboratory DCT-Coimbra University, 2019) …….. 20
Figure 3.7. X-Ray Fluorescence (Laboratory DCT-Coimbra University, 2019) ………….... 21
Figure 3.8. The ICP-MS workflow includes sample preparation and introduction, data -
acquisition and processing, and experimental analysis (source: Thermo -
Fisher Scientific, 2019) …………………………………………………………….. 21
Figure 4.1 Outcrop R106 …………………………………...…………………………………… 26
Figure 4.2 Outcrop R51 …………………………..………...…………………………………… 26
Figure 4.3 Outcrop R84 …………………………..………...…………………………………… 27
Figure 4.4 Culocau river´s alluvial deposit ………………………………..…………………… 27
Figure 4.5 Simplified Lithology map …………………….……………………………………… 28
Figure 4.6. Trajectory Map, showing geochemical stream sediment and pan concentrate
sample are overlied with rock sample point ………...…………………………..… 29
Figure 4.1 Anomaly map of Ag in ppm ………………………………………………………… 43
Figure 4.2 Anomaly map of AS in ppm ………………………………………………………… 44
Figure 4.3 Anomaly map of Au in ppb …………………………………………………………. 45
Figure 4.4 Anomaly map of Co in ppm ………………………………………………………… 46
Figure 4.5 Anomaly map of Cu in ppm ………………………………………………………… 47
Figure 4.6 Anomaly map of Eu in ppm ………………………………………………………… 48
Figure 4.7 Anomaly map of Ni in ppm …………………………………………………………. 49
Figure 4.8 Anomaly map of S in percent ………………………………………………………. 50

ix
Figure 4.9 Anomaly map of Sb in ppm ………………………………………………………… 51
Figure 4.10 Anomaly map of Se in ppm ……………………………………………………….. 52
Figure 4.1 Anomaly map of Ag in ppm ……………………………………………………….... 53
x
Index of tables
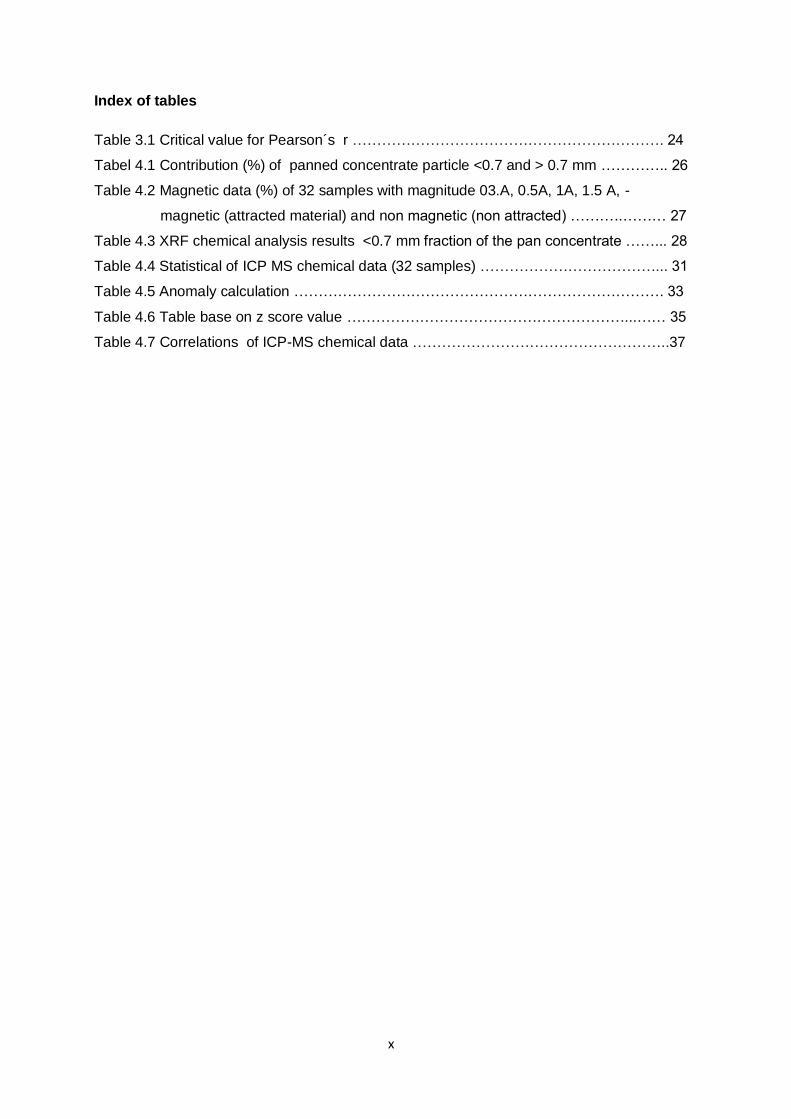
Table 3.1 Critical value for Pearson´s r ………………………………………………………. 24
Tabel 4.1 Contribution (%) of panned concentrate particle <0.7 and > 0.7 mm ………….. 26
Table 4.2 Magnetic data (%) of 32 samples with magnitude 03.A, 0.5A, 1A, 1.5 A, -
magnetic (attracted material) and non magnetic (non attracted) ………..……… 27
Table 4.3 XRF chemical analysis results <0.7 mm fraction of the pan concentrate ……... 28
Table 4.4 Statistical of ICP MS chemical data (32 samples) ………………………………... 31
Table 4.5 Anomaly calculation …………………………………………………………………. 33
Table 4.6 Table base on z score value …………………………………………………...…… 35
Table 4.7 Correlations of ICP-MS chemical data ……………………………………………..37
1
Chapter I Introduction
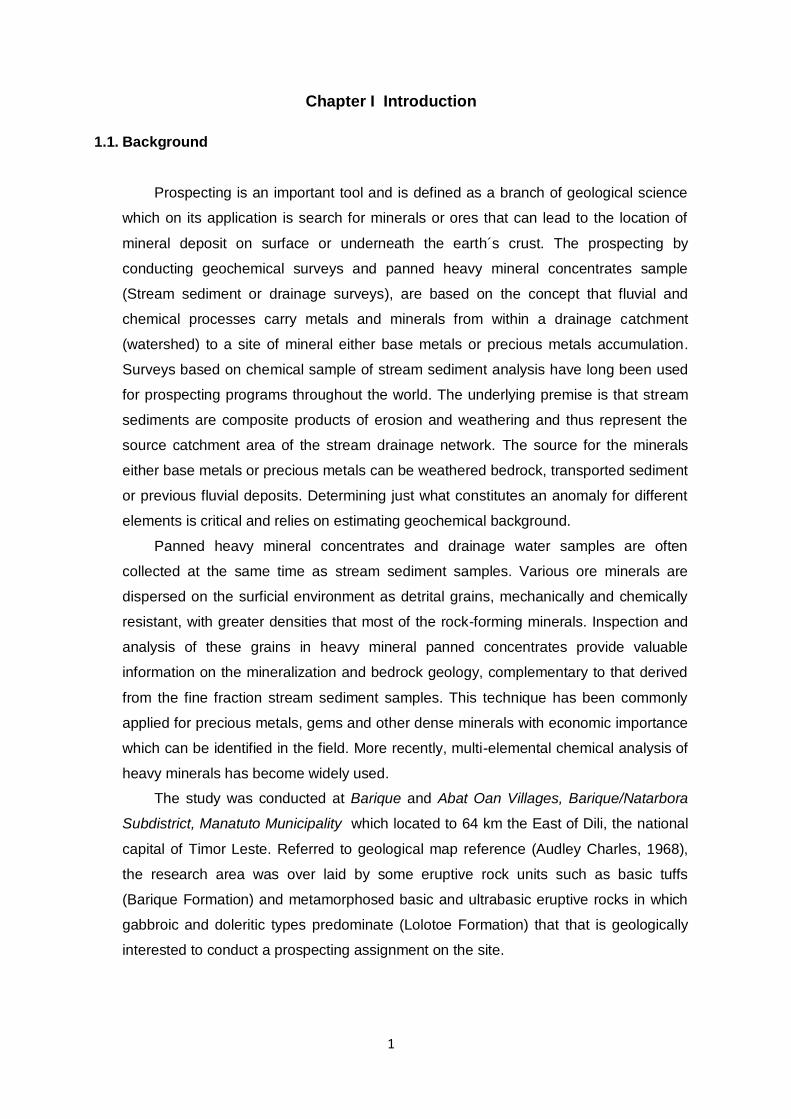
1.1. Background
Prospecting is an important tool and is defined as a branch of geological science
which on its application is search for minerals or ores that can lead to the location of
mineral deposit on surface or underneath the earth´s crust. The prospecting by
conducting geochemical surveys and panned heavy mineral concentrates sample
(Stream sediment or drainage surveys), are based on the concept that fluvial and
chemical processes carry metals and minerals from within a drainage catchment
(watershed) to a site of mineral either base metals or precious metals accumulation.
Surveys based on chemical sample of stream sediment analysis have long been used
for prospecting programs throughout the world. The underlying premise is that stream
sediments are composite products of erosion and weathering and thus represent the
source catchment area of the stream drainage network. The source for the minerals
either base metals or precious metals can be weathered bedrock, transported sediment
or previous fluvial deposits. Determining just what constitutes an anomaly for different
elements is critical and relies on estimating geochemical background.
Panned heavy mineral concentrates and drainage water samples are often
collected at the same time as stream sediment samples. Various ore minerals are
dispersed on the surficial environment as detrital grains, mechanically and chemically
resistant, with greater densities that most of the rock-forming minerals. Inspection and
analysis of these grains in heavy mineral panned concentrates provide valuable
information on the mineralization and bedrock geology, complementary to that derived
from the fine fraction stream sediment samples. This technique has been commonly
applied for precious metals, gems and other dense minerals with economic importance
which can be identified in the field. More recently, multi-elemental chemical analysis of
heavy minerals has become widely used.
The study was conducted at Barique and Abat Oan Villages, Barique/Natarbora
Subdistrict, Manatuto Municipality which located to 64 km the East of Dili, the national
capital of Timor Leste. Referred to geological map reference (Audley Charles, 1968),
the research area was over laid by some eruptive rock units such as basic tuffs
(Barique Formation) and metamorphosed basic and ultrabasic eruptive rocks in which
gabbroic and doleritic types predominate (Lolotoe Formation) that that is geologically
interested to conduct a prospecting assignment on the site.

2
1.2. Objectives
To evaluate and identify sub-basins that may be anomalous for some minerals with
economic interest through chemical analysis of the stream sediments or panned
concentrates.
To locate the primary mineral deposits that may be present on the study area.
To predict the geochemical environment of the geological formations present in the
study area and their relationships
To establish the regional mineralogical and metallogenic characteristics by studying
the heavy minerals present in panned concentrates and also with geochemical
analysis of the fine fraction of stream sediments.
1.3 Methodology
The present work is contemplated of several stages:
The first phase is consisted of bibliographic research of studies on the thematic topic.
The second phase consisted of field work and field data information. Describe the fieldwork:
32 waterline samples of fine grade material for chemical analysis were collected and as
well, 32 waterline samples that were subjected to bulk concentration which sieving to
eliminate material with greater than approximately 2 mm and eliminating the lowest density
material.
Third phase laboratory work on Departamento de Ciências da Terra (DCT) – Faculdade de
Ciências e Tecnologia da Universidade de Coimbra: magnetic separation and XRF for
panned concentrates, while ICP-MS chemical analysis for fine fractions grade, was run by
Actlabs laboratory, Canada.
1.4. Organization of work
This dissertation is divided into five chapters, as follows:
This first chapter: Introduction, provides slight introduction to the work theme, the objectives
of the dissertation, methodology and how it is organized.
The second chapter: The study area and geological setting, providing information regarding
the where area the study was taken place and describing its regional geology .
The third chapter: Methodology, describes methods that used in the study, initiated from
bibliographic research of studies, field work and laboratory phase.
The fourth chapter: explaining the results obtained from analyses and discussion.
The fifth chapter: Conclusion, resumes all the results of the research and analysis and
provides suggestions and predictions for the future as well.
3
Chapter II Study area and Regional Geology
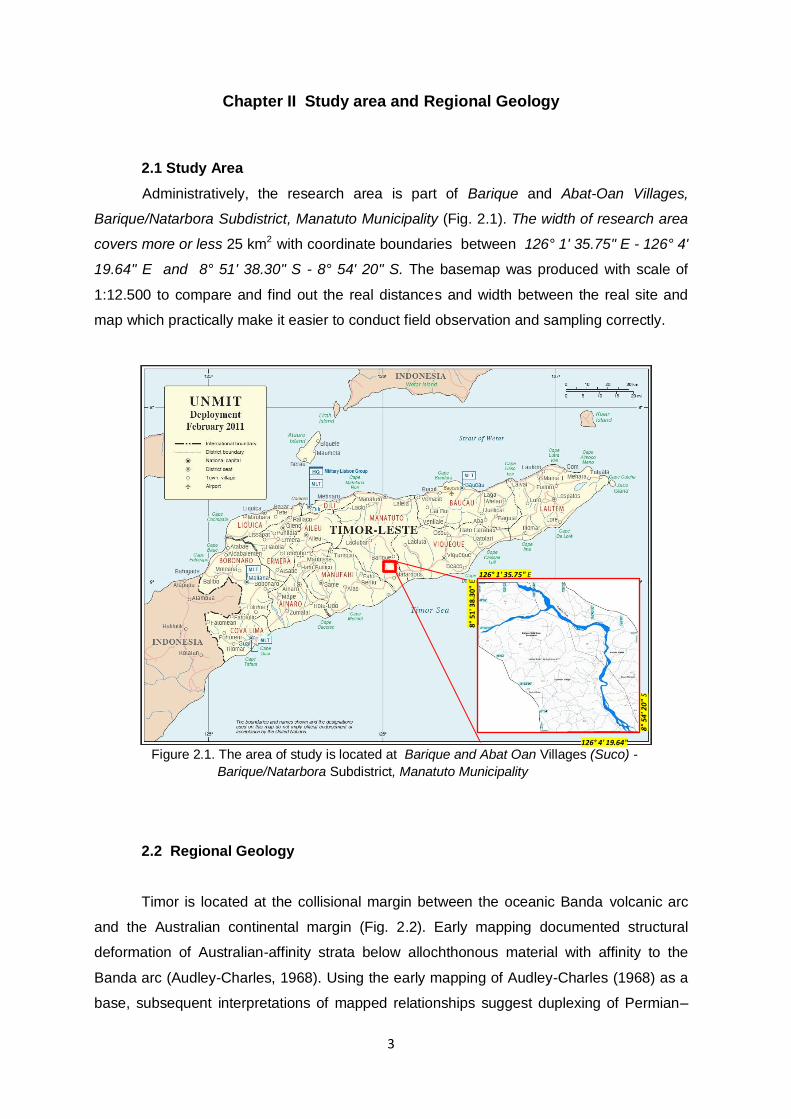
2.1 Study Area
Administratively, the research area is part of Barique and Abat-Oan Villages,
Barique/Natarbora Subdistrict, Manatuto Municipality (Fig. 2.1). The width of research area
covers more or less 25 km2 with coordinate boundaries between 126° 1' 35.75" E - 126° 4'
19.64" E and 8° 51' 38.30" S - 8° 54' 20" S. The basemap was produced with scale of
1:12.500 to compare and find out the real distances and width between the real site and
map which practically make it easier to conduct field observation and sampling correctly.
2.2 Regional Geology
Timor is located at the collisional margin between the oceanic Banda volcanic arc
and the Australian continental margin (Fig. 2.2). Early mapping documented structural
deformation of Australian-affinity strata below allochthonous material with affinity to the
Banda arc (Audley-Charles, 1968). Using the early mapping of Audley-Charles (1968) as a
base, subsequent interpretations of mapped relationships suggest duplexing of Permian–
Figure 2.1. The area of study is located at Barique and Abat Oan Villages (Suco) -
Barique/Natarbora Subdistrict, Manatuto Municipality
126° 1' 35.75" E
8°
54' 2
0"
S
8°
51' 3
8.3
0"
E
126° 4' 19.64" E

4
Jurassic Australian sedimentary strata below an overthrust oceanic Banda forearc klippe,
with Cretaceous and younger Australian strata deformed at the front of the Banda klippe
(Carter et al., 1976; Harris, 1991, 2006; Zobell, 2007).
However, the locations of duplex faults and the stratigraphy involved in duplexing
have not been documented in detail. This is a key element of our study, since it is essential
information to determine the amount of shortening and continental subduction. To place the
amount of continental subduction in its plate kinematic context, it is imperative to know the
age of collision, which is debated. Stratigraphic constraints require orogenesis at Timor
after 9.8 Ma, the ages of youngest Australian passive margin strata within the thrust belt on
Timor- Leste (Keep and Haig, 2010), and before 5.6–5.2 Ma, the oldest synorogenic
sediments deposited on a tectonic mélange that formed during orogenesis (Harris et al.,
1998; Haig and McCartain, 2007). 40Ar/39Ar thermochronology suggests earliest
exhumation of under plated Australian continental material at 7.13 ± 0.25 Ma (Tate et al.,
2015) or ca. 7.5–8 Ma (Berry and McDougall, 1986). Some debate remains over whether
these cooling ages reflect processes within the Banda forearc or initial collision between the
Banda forearc and the distal-most Australian margin. Detrital zircon ages of ca. 290 Ma
have been used to argue that these units with 40Ar/39Ar ages >7 Ma belong to fragments
Figure 2.2. Digital elevation model of the Banda Arc region. Active faults are shown in yellow, red triangles are active volcanoes, pink areas are regions of mafic and ultramafic rocks. The Makassar Strait, Gulf of Bone and Banda Sea occupy a region that was formerly the Cretaceous to Paleogene Great Indonesian Arc. Arc fragments, known as the Banda Terrane (Harris, 2006) are found in Sulawesi, the Banda Ridges, Sumba, Savu, Rote, Timor, and the volcanic islands around
Flores and Wetar (Standley, C.E., and Harris, R. (2009)

5
of the Sula Spur (a continental ribbon that rifted off Australia in the Mesozoic) that were
incorporated within the Banda forearc before Banda-Australia collision (Ely et al., 2014).
However, because similar detrital zircon peaks of 254–358 Ma have been found within
other Australian-affinity units of the Gondwana Sequence (Zobell, 2007), a derivation from
the Sula Spur is not required. The continuation of volcanism at Wetar until 3 Ma (Abbott and
Chamalaun, 1981) or even 2.4 Ma (Herrington et al., 2011) and at Ataúro until 3.3 Ma (Ely
et al., 2011) has been used as an argument against initial collision of the distal Australian
margin with the Banda arc before 4 Ma (Audley-Charles, 2011). However, He, Pb, and Sr
isotopic signals from Banda arc volcanics demonstrate contamination of the magma source
with continental material, supporting subduction of continental material to depths of magma
generation from 5 to 2.4 Ma (Elburg et al., 2004; Herrington et al., 2011) and therefore initial
collision of the Banda forearc and Australian margin even earlier. Thermochronologic and
sedimentologic observations also constrain the age of emergence and the rate of continued
deformation on Timor. The emergence of Timor-Leste above water is suggested to be
shortly before 4.45 Ma by Nguyen et al. (2013) as indicated by increased clastic input and
increased mangrove and lowland rainforest pollen in synorogenic deposits.
Tate et al. (2015) use low-temperature thermochronology to document an extremely
heterogeneous history of exhumation across the map area of this paper, with apatite and
zircon (U-Th)/He ages ranging from 1.5 to 5.5 Ma with larger exhumation magnitudes and
faster exhumation rates in the hinterland slate belt compared to the more foreland fold-
thrust belt in the south and east. Continued rapid uplift on Timor and the Banda arc is also
evident, with Quaternary coral terraces uplifted up to 700 m on Ataúro (Ely et al., 2011) and
with similar coral terraces present on the north coast of Timor-Leste (Audley-Charles, 1968;
Cox, 2009). Significant debate remains as to the active mode of deformation on Timor
today, with various interpretations spanning active duplexing of Australian strata (Tate et
al., 2015), arc-parallel extrusion along transtensional faults (Duffy et al., 2013), and
extension driven by slab breakoff and isostatic rebound (Keep and Haig, 2010). Plate
reconstructions and GPS measurements both indicate that Australia is moving north
relative to the Sunda arc and South Banda arc at ~7 cm/yr (Nugroho et al., 2009; Spakman
and Hall, 2010; Seton et al., 2012). Modern convergence is oblique, with ~53 mm/yr of
convergence perpendicular to the Timor Trough (the deformation front of the Timor orogen)
(Nugroho et al., 2009). Along the trend of Timor this convergence is partitioned between the
Timor Trough and the Wetar Thrust, with ~20 mm/yr of convergence partitioned between
Australia and Timor and ~33 mm/yr of convergence accommodated between Wetar and the
Sunda block (Nugroho et al., 2009). It appears, therefore, that plate boundary
reorganization may be under way at Timor. Another argument to that end comes from
seismological observations that a seismic gap exists in the downgoing slab below Wetar

6
that may indicate ongoing or recent slab breakoff (McCaffrey et al., 1985; Sandiford, 2008;
Ely and Sandiford, 2010). We note, however, that such a seismic gap does not uniquely
indicate slab breakoff, since a similar seismic gap below Taiwan is attributed to the
subduction of continental material that would lack the water content necessary for typical
slab dehydration earthquakes (Chen et al., 2004). In addition, seismic tomography does not
image a gap in the slab below Wetar (Spakman and Hall, 2010).
2.3 Regional Stratigraphy
The study area refers to the regional geology map (Audley Charles, 1968) (Fig. 2.3),
is overlaid by two formations that consist of Lolotoe complex and Barique formations that
which are derived from Banda Terrane group (Charles 1968 and Harris 2006).
Figure 2.3. Geological Map of Portuguese Timor (Audley
Charles,1968)
7
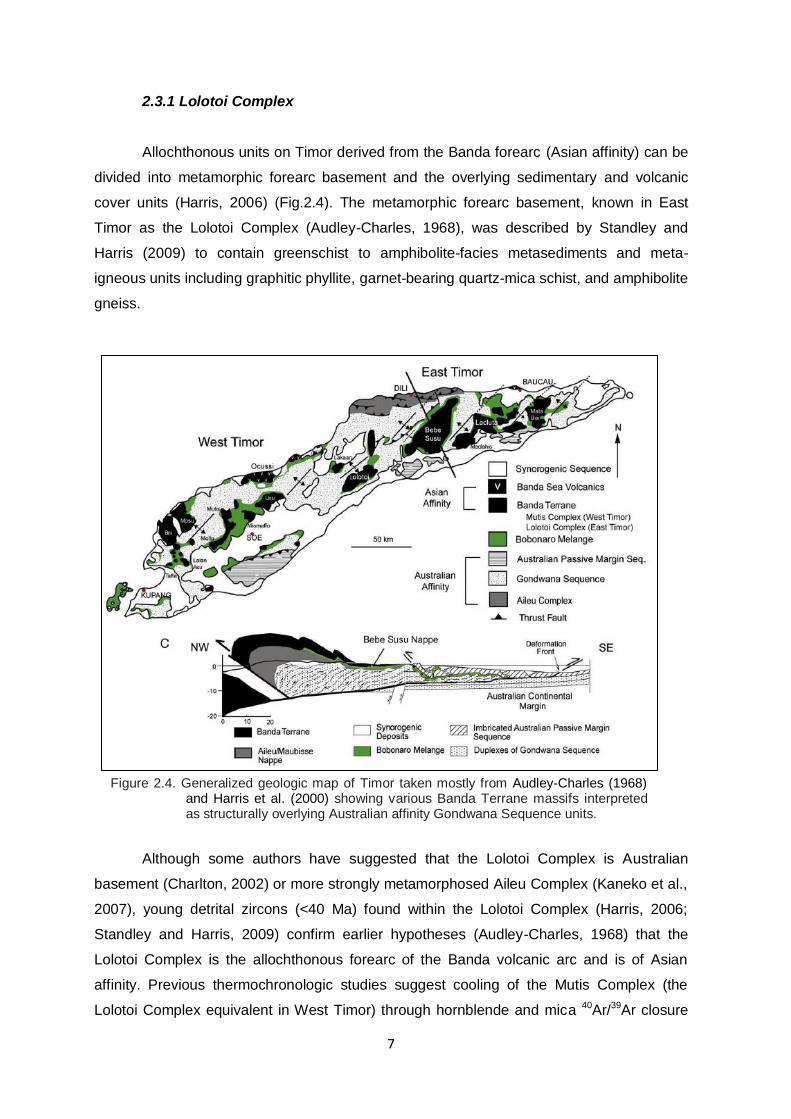
2.3.1 Lolotoi Complex
Allochthonous units on Timor derived from the Banda forearc (Asian affinity) can be
divided into metamorphic forearc basement and the overlying sedimentary and volcanic
cover units (Harris, 2006) (Fig.2.4). The metamorphic forearc basement, known in East
Timor as the Lolotoi Complex (Audley-Charles, 1968), was described by Standley and
Harris (2009) to contain greenschist to amphibolite-facies metasediments and meta-
igneous units including graphitic phyllite, garnet-bearing quartz-mica schist, and amphibolite
gneiss.
Although some authors have suggested that the Lolotoi Complex is Australian
basement (Charlton, 2002) or more strongly metamorphosed Aileu Complex (Kaneko et al.,
2007), young detrital zircons (<40 Ma) found within the Lolotoi Complex (Harris, 2006;
Standley and Harris, 2009) confirm earlier hypotheses (Audley-Charles, 1968) that the
Lolotoi Complex is the allochthonous forearc of the Banda volcanic arc and is of Asian
affinity. Previous thermochronologic studies suggest cooling of the Mutis Complex (the
Lolotoi Complex equivalent in West Timor) through hornblende and mica 40Ar/39Ar closure
Figure 2.4. Generalized geologic map of Timor taken mostly from Audley-Charles (1968) and Harris et al. (2000) showing various Banda Terrane massifs interpreted as structurally overlying Australian affinity Gondwana Sequence units.

8
between 31 and 38 Ma (Harris, 2006) and cooling of the Lolotoi Complex at the town of
Laclubar through zircon (U-Th)/He closure at 25.7 ± 1.5 Ma (Tate et al., 2014). This cooling
history, coupled with the presence of unmetamorphosed sedimentary units deposited
unconformably on the metamorphic Lolotoi Complex prior to the Miocene (Audley-Charles,
1968), suggests significant exhumation in this portion of the Banda forearc prior to collision
at Timor.
2.3.2 Barique Formation
Grunau (1953, 1956, 1957A) and Gageonnet & Lemoine (1958) did not distinguish
this formation, but grouped part of it with the Dartollu Limestone , part with the overthrust
rocks of Permian age (Maubisse Formation in this Memoir), part with the overthrust
crystalline rocks (Lolotoi Complex in this Memoir), and part with what are now recognized
as exotic blocks in the Bobonaro Scaly Clay (Audley-Charles 1965A). In all instances they
regarded these eruptive rocks as allochthonous. The stratigraphical unity of these rocks
was first recognized by I. B. Freytag (unpublished report dated 1959) in central eastern
Timor, who called them the Barique Volcanics, and showed that they were autochthonous.
The author has found Freytag's interpretation to be correct throughout eastern Timor. The
composition of the larger clastic particles is variable, and includes Eocene limestones that
can be matched locally as well as eruptive rocks resembling those found at higher levels in
the Barique Formation. The matrix of the basal conglomerates is tuffaceous. The type-
section is composed of a series of tufts with an occasional lava. Basic tufts predominate
and consist largely of fragments of basalts and serpentinites; zeolites are common. The
acid (possibly mostly dacitic) tufts are composed mainly of feldspar laths with quartz,
pumice and glass, which is usually considerably altered. Some tufts contain Foraminifera,
and some contain large rounded quartz grains probably derived from sedimentary non-
volcanic rocks. A few crystal tufts have been found, Interbedded with the tufts are some
foraminiferal quartz-sandstones containing less than 25 per cent of igneous rock-fragments.
The greatest development of sandstones is found south of Mt Cablac, where they are about
20m thick. The principal lavas in the type-locality are basalts varying in composition and
texture. Thickness. The formation is estimated to be about 300m thick in the type-locality,
elsewhere it is less. Stratigraphical position. In the type-locality the formation is faulted near
the base, which is not exposed. North-east of the type-locality, around Lacluta village, the
Barique Formation is unconformable on the Lolotoi Complex, which was overthrust to its
present position during the Lower Eocene. The youngest rocks on which the Barique
Formation rests are the Middle and Upper Eocene Dartollu Limestone near Fehuc Reen,
where the contact is unconformable. The base of this formation is everywhere

9
unconformable and generally rests on the Dartollu Limestone or the Lolotoi Complex, but in
places it rests on the Aitutu Formation or the Wai Luli Formation. The Barique Formation is
usually overlain unconformably by the Lower Miocene Cablac Limestone, but in places is
overlain by younger formations. Thus, from its stratigraphical relations the Barique
Formation must have been erupted and deposited during the time-interval between late Tb
(Upper Eocene) and early Te (Lower Miocene).
2.4 Previous Study
2.4.1 Metallogeny and mineral potential of Timor Island and adjacent areas
The orogenic history of Timor plays a critical role in defining the location of its
metallic minerals occurrences, notably copper, gold, silver, chromite, manganese and a
number of important non-metallic minerals such as limestone, marble, bentonite and
phosphate. The northern edge of Timor-Leste is located near the Inner Banda Arc, the site
of a Miocene subduction zone. Oceanic rocks of the Eurasian plate were thrust onto Timor-
Leste by tectonic processes, which are poorly understood. Consequently, the northern edge
of Timor Island is host to a number of important mineral occurrences, e.g. copper, chromite,
gold, silver and manganese. One of the potentially richest copper zones is the north edge of
Oecussi district was explored by a multinational company in the 1980s. The base metals
are concentrated in ultramafic rocks, which are parts of an ophiolite suite. Large parts of
Timor-Leste are underlain by cratonic rocks derived from Northwest Australia. These rocks
too are notably endowed with a wide variety of economic mineral occurrences. Precious
metals such as gold and silver were also deposited in and adjacent to volcanic centers in
the Inner Banda Arc as a result of epithermal activity. One of the islands of this Arc, Atauro,
belongs to Timor-Leste. Atauro has a number of gold and silver occurrences. Some
important copper occurrences are also located in southern Baucau and north central
Viqueque districts. Less significant deposits of chromite, manganese and iron sand
deposits occur in Manatuto, Baucau and Lautern districts andon Atauro Island of Dili
district. The widespread occurrences of limestone and marl, especially in the eastern and
western coastal areas of Timor-Leste, are important and are amongst the few minerals that
have been exploited for many years. House foundation materials almost always consist of
rock walls made of local rocks cemented with lime made from marl. Important phosphate
and bentonite occurrences are located in central Baucau district although these have not
yet been exploited. There is a potential for the development of ornamental stones from the
numerous good quality marble occurrences in Manatuto district east of Dili. Argillic
alteration has resulted in the development of a red to white clay complex in the Aileu
10
Formation. The alteration has changed phyllites and schists to kaolin in a number of places
near Aileu town. The alteration zone occurs over a wide belt beginning a few kilometers
east of Dili and extending eastward to include much of Aileu district. This belt contains an
almost unlimited amount of clay, including some possibly high grade kaolin deposits.
Moreover, the argillic alteration may be a guide to the occurrence of base and precious
metals beneath the cover. River valleys throughout the country include a wide range of
sand and gravel deposits some of which have already been used to make concrete blocks.
Every major town exploits its own local sand and gravel deposits creating a rather lucrative
small scale mining industry for a large number of entrepreneurs. None of these non-metallic
mineral deposits have been evaluated for their technical characteristics. The most attractive
mineral potential of Timor-Leste is in base metals, mainly copper, and associated gold and
silver. This potential is in the occurrence of so-called Cyprus type volcanogenic massive
sulfides related to ophiolite sequences. This style of mineralization can be observed in
outcrop in the Ossu area of the Viqueque District. Geological reasoning and extrapolation
allow for the conclusion that similar mineralization will be found in other locations where
ophiolite sequences are found in the territory. Chromite, vein gold and certain non-metallic
minerals are also found and may have potential. Timor Island is a part of the non-volcanic
outer Banda arc. It occupies a suture or collision zone between the Asian and the
Australian plates. Formed by mechanical accretion of under thrust or collided Australian
continental margin material, the island is covered by several autochtonous sequences.
Ophiolites, the so-called Banda terrane, and a clay mélange are the main overlying
sequences. Two other important aspects of the geology and geologic evolution that
influence the metallogeny are the Australian northwest shelf and the active tectonics and
the continuing uplift of the territory. Ophiolite is a stratified group of three separate rock
types. The lowermost member consist of peridotites and dunites, above which are layered
to massive gabbros that in turn are source to and overlain by a volcanic member composed
of sheeted dikes and pillow basalts. While the individual basic to ultrabasic rocks of this
sequence have been mapped by the Allied Mining Corp. (1937.), the recognition of these
rocks as an ophiolite series was first clearly mentioned by van Bemmelen (1947). “Schist-
Ophiolite Complex is probably widely distributed and it forms the overthrust unit of theNorth
Coast Schist-Manufahi Diabase Complex.” Van Bemmelen based his descriptions on the
earlier work of Dutch geologists, particularly that of de Roever (1940) and the Allied Mining
Corp. (1937). A geological sketch by van Bemmelen clearly shows that large areas in
Timor-Leste are underlain by ophiolites. Possibly the best and most complete description of
the ophiolitic rocks, though not under the term ophiolite, is found in the annotation to the
geologic map of the Kupang – Atambua Quadrangle in West Timor (Rosidi, 1978). In this
annotation, the Manamas Formation (Tmm.) corresponds to the upper section of the
11
accepted ophiolite sequence, while the Ultra Basic Unit (UB) forms the lower part and
completes the sequence. Ore deposits in ophiolites (Coleman, 1977; Cox and Singer, 1986)
include massive sulfides as stratabound bodies in the pillow lavas, mainly as copper-
bearing massive pyrite lenses with some gold and silver. At times, these lenses also carry
lead and zinc values. These Cyprus Type volcanogenic massive sulfides are usually
between 500,000 tons and a few million tons in size, though larger deposits exist. They
account for significant ancient and modern mining in Cyprus, Oman, Turkey, Greece, the
Philippines and elsewhere and, with copper grades between 1 per cent and 10 per cent, are
attractive exploration targets. Manganese and manganese-iron-silica formations overly this
type sulphide deposits. They are mostly low grade accumulations of manganese oxides and
silicates. Chromite occurs in ophiolites, in podiform chromite deposits and as schlieren.
Ophioliterelated chromite deposits include some of the most important deposits in the
world, such as those in the Islamic Republic of Iran, Greece, Turkey, the Philippines and
New Caledonia.
Nickel deposits can form secondary concentrations in laterite weathering profiles on the
dunites and peridotites of ophiolitic sequences. Most notable are the examples from New
Caledonia where huge lateritic nickel concentrations exist. The ultrabasic rocks of Timor-
Leste contain approximately 2000 ppm Ni (Harris, 2000) and could, therefore, in theory also
be the source rock for the formation of concentrations of lateritic nickel. Field observations
however seem to indicate the absence of deep laterite weathering profiles, probably due to
the constant uprising of the island, and, therefore, no evidence exists for the occurrence of
this type of mineral concentration. The occurrence of platinum group minerals (PGMs)
related to ophiolites has been reported from Oman where platinum group minerals have
been found in the Samail ophiolite (BRGM, 1995) and from the Islamic Republic of Iran. No
indication exists that these may also occur in Timor-Leste, but excluding the possibility is,
as always in exploration, risky.
The Bobonaro Mélange (Harris, 2000), and the Bobonaro Scaly Clay (Charles, 1968) or the
Sonnebait Series by the older Dutch workers, covers large parts of Timor island and about
60 per cent of the territory of Timor-Leste. The unit consists of soft scaly clay with exotic
blocks and lenses of rocks of all ages and sizes in it, sometimes dominating the landscape
as abrupt outcrops as in Laleia, where a huge knoll of limestone with no apparent roots and
surrounded by mélange stands towering over the city.
The clay itself has probably been derived from the sub-marine weathering of volcanic ash
material and has been structurally interpreted as marking the collision suture between the
Australian lower plate and the Asian upper plate (Harris and others, 2000). Much of the clay
in the mélange is bentonitic in nature with a dominance of smectite clay minerals. Raised
beaches, reefs and alluvial terraces including the occurrence of raised reef material at
12
altitudes of 500 metres and more above, clearly indicate that the recent and probably
ongoing tectonic movements cause continuous uplift of the island. One of the
consequences of this uplift is the likely absence of any thick accumulations of deep tropical
weathering, and thus the probable absence of large nickel laterites. The upliftresults in
aggressive erosion and the possible formation of concentrations of mineral sands. Large
concentrations of ordinary sand and gravel will result, though these concentrations may be
„bouldery‟ and unsorted (ESCAP, UN (2003).
2.4.2. Metallic mineral occurrences of Timor Leste.
Several copper, copper-gold and gold occurrences have been reported all associated with a
suite of basic to ultrabasic rocks. The geological setting in all areas is dominated by
ultrabasic units, with extensive serpentinite alteration, and intrusive diorite/diabase rocks.
These basic/ultra basic units are in many places covered by more recent marine sediments
and, therefore, their total extent in each individual area is unknown. Some of these areas
are already on record as having either copper or copper/gold indications (Vemasse/Ossuala
and Virac, both in the Baucau District). Other ophiolite localities are in Covalima, Manufahi,
Manatuto and Lautem districts. Gold has been observed in quartz veins that occur as
lenticular bodies in shales and schists. Quartz–calcite veins occur in altered diabase and at
the contact between diabase and black shales. They are mineralized with disseminated
chalcopyrite, pyrite and gold.
Chromite occurrences are reported from Baucau, Manatuto and Manufahi districts.
Typically these chromite deposits occur in highly deformed dunite and harzburgite units of
ophiolite complexes. Chromite occurs in the Hili Manu subdistrict of Manatuto district. The
occurrences are located south of the village of Behada at km 53 on the main coastal road
(ESCAP, UN (2003).
13
CHAPTER III. METHODOLOGY
The following methodology stages were conducted in the prospecting mineral from
earliest step to finish;
3.1 Preliminary Study
This was including revision of some publications by previous researchers who have
done investigations on the research area and expected to gain better understanding about
regional geology and other related informations such as accessibility and geographical
conditions of the study area.
3.2 Time Frame and Field Work
The field work was conducted during more less a couple of weeks, dated 5 – 22
March 2019. It was conducted by a Geologist (João Paulo) and assisted by a driver and two
local guides.
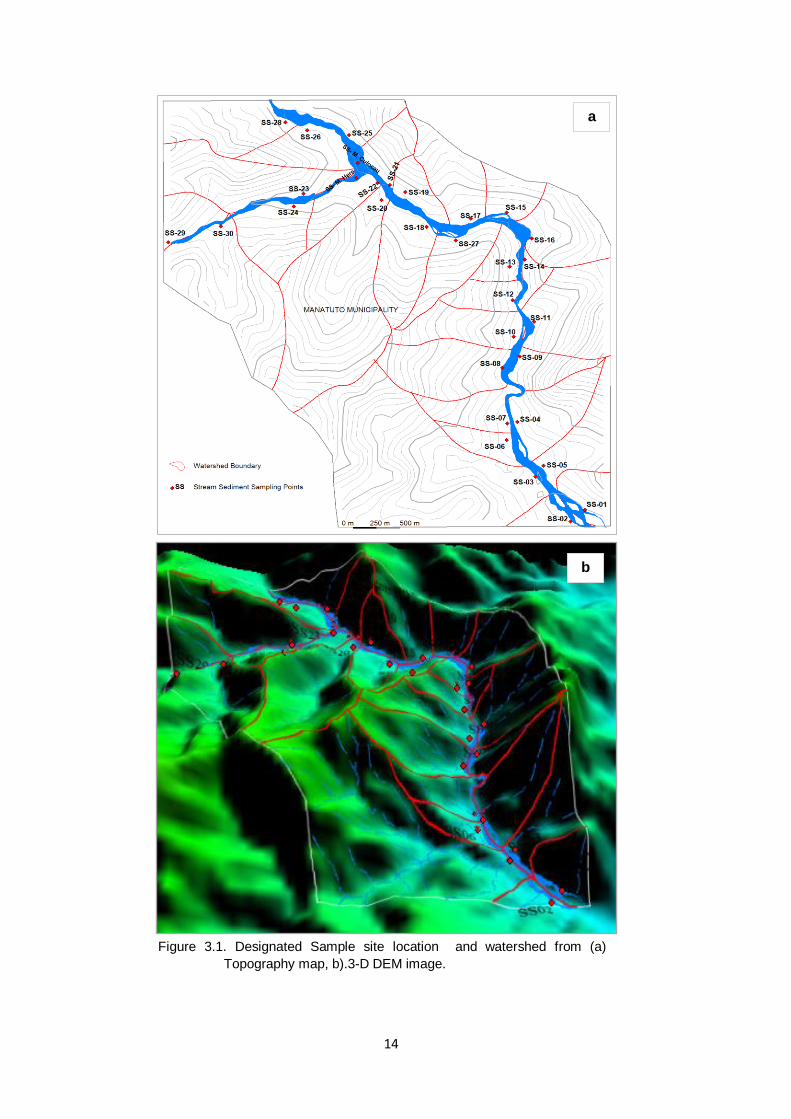
3.3. Site selection
The sampling points were collected base of the catchment area or watershed
(fig.3.1a). There were 32 total of samples collected from site which divided into 30
watersheds that collected from each tributary within each watershed and 2 additional
samples that collected from two main rivers i.e. Culocau and Here rivers. The watershed
boundaries were determined referring to catchment area that interpreted manually by
contour lines basemap and the 3D of Digital elevation model (DEM) image (fig 3.1.a-b)
14
Figure 3.1. Designated Sample site location and watershed from (a)
Topography map, b).3-D DEM image.
b
a
15
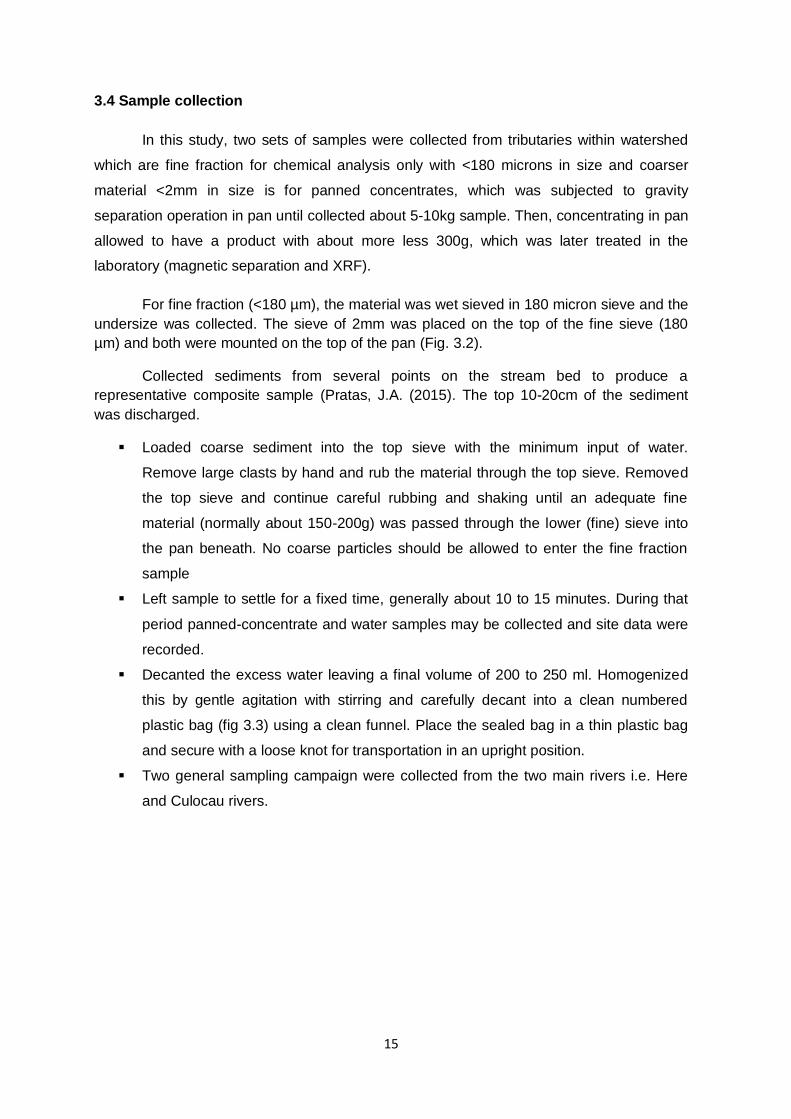
3.4 Sample collection
In this study, two sets of samples were collected from tributaries within watershed
which are fine fraction for chemical analysis only with <180 microns in size and coarser
material <2mm in size is for panned concentrates, which was subjected to gravity
separation operation in pan until collected about 5-10kg sample. Then, concentrating in pan
allowed to have a product with about more less 300g, which was later treated in the
laboratory (magnetic separation and XRF).
For fine fraction (<180 µm), the material was wet sieved in 180 micron sieve and the
undersize was collected. The sieve of 2mm was placed on the top of the fine sieve (180
µm) and both were mounted on the top of the pan (Fig. 3.2).
Collected sediments from several points on the stream bed to produce a
representative composite sample (Pratas, J.A. (2015). The top 10-20cm of the sediment
was discharged.
Loaded coarse sediment into the top sieve with the minimum input of water.
Remove large clasts by hand and rub the material through the top sieve. Removed
the top sieve and continue careful rubbing and shaking until an adequate fine
material (normally about 150-200g) was passed through the lower (fine) sieve into
the pan beneath. No coarse particles should be allowed to enter the fine fraction
sample
Left sample to settle for a fixed time, generally about 10 to 15 minutes. During that
period panned-concentrate and water samples may be collected and site data were
recorded.
Decanted the excess water leaving a final volume of 200 to 250 ml. Homogenized
this by gentle agitation with stirring and carefully decant into a clean numbered
plastic bag (fig 3.3) using a clean funnel. Place the sealed bag in a thin plastic bag
and secure with a loose knot for transportation in an upright position.
Two general sampling campaign were collected from the two main rivers i.e. Here
and Culocau rivers.
16
While for panned concentrate, the sieve of 2mm was placed on the top of the pan.
Reaped the sediments from various locations of the stream to produce a representative
composite sample (usually 5). At harvest discard 10 to 20 cm to avoid false anomalies
caused by materials with high coating Mn and Fe- oxides or with reduced amount of
heavy minerals. Crop as close to the bedrock as possible.
Figure 3.3 Fine Fractions < 180 microns about 150-200g in plastic bags
after decanted excess water.
Figure 3.2. The sieve of 2mm was placed on the top of
the fine sieve (180 µm) and both were mounted on the
top of the pan.

17
Sieved the sediments on screen, remove the large clastic and rub the material to
promote disaggregation (fig 3.4). Did not let coarse particles with the fine fraction. The
material should be removed from the side as close to bedrock as possible.
Then, continued to do this until filling the pan up to the mark with under 2mm sediment
(about 5 liters).
Washed the sediments to remove the clay fraction and organic material with plenty of
water until the water coming out will become clear.
Started panning process washing vigorously the sediments with water to promote the
sinking of the heavier minerals. The panning is performed with circulatory movements
and back and forth, causing water to come out from the front. When the water is
directed to the front drags a surface layer of light sediment that overflow out by regular
intervals, especially during the early stages of concentration, shaked vigorously with
circulatory movements, remaining sediments in order to promote settling of the dense
mineral grains at the base of pan.
Continued to panning thoroughly until to obtain a final concentrate which should have
about 150 ml.
Transfer the material to a plastic bag, properly labelled, and place this in a plastic bag
to be carried to the laboratory (figure 3.5).
Two general sampling campaign were collected from the two main rivers i.e. Here and
Culocau rivers.
Figure 3.4. Sieve the sediments on screen,
remove the large clastic and rub the material to
promote disaggregation
18
3.5 Field observations
In the field should be used a logbook and a sampling map. The approximate
location of each sample was inferred from the map, indicating the number of the respective
sampling site. In the field book, the following observations were recorded at each sampling
site:
- Coordinates using GPS;
- Description of the place taking into account the variability of local characteristics;
- Coordinates of the sample site;
- Identity of collectors;
- Date;
- Catchment geology from map;
- Characteristics of clasts and geology of the bedrock;
- Heavy minerals observed with the naked eye;
- Presence of minerals with an interest in fraction under 2 mm;
- Presence of traces of contaminating materials;
- Land use;
- Possible contaminations;
- Color and composition of sediments;
- Precipitates on stream;
Figure 3.5 Transfer the pan concentrate to a plastic bag
19
- Weather conditions;
- Stream-flow conditions.
3.6 Sample preparation
There were two types of samples as fine fractions <180 microns for chemical
analysis and panned concentrates <2mm for heavy mineral analysis.
Chemical samples <180 microns with total of 32 samples were sent to Actlabs
Laboratory-Canada as both for preparation and ICP-MS analysis at once. While, the same
total of 32 panned concentrate samples <2mm were brought to Laboratory DCT- Coimbra
University to be subjected to magnetic separator and XRF separation operations.
Magnetic separation is a process that separates particles according to their
magnetic susceptibility. What defines the magnetic susceptibility, or magnetization, of a
material is its behavior when subjected to a magnetic field. The magnetic susceptibility of a
mineral represents the mineral's response to an external magnetic field. Materials have
magnetic susceptibility that can be positive (paramagnetic) or negative (diamagnetic).
Paramagnetic materials when subjected to a magnetic field tend to be attracted to the
higher intensity field zone, while diamagnetic materials when subjected to a magnetic field
tend to be repelled to the lower intensity zone. Within paramagnetic materials are
considered ferromagnetic materials which have a high susceptibility, such as magnetite.
Galopim de Carvalho (2005) presents a table with the most common sedimentary minerals
organized by decreasing magnetic susceptibility as a function of the parameters used in the
Frantz separator.
The field separation concentrate was subjected to magnetic separation at the
Geophysics, Geotechnics and Ore Treatment Laboratory of the Earth Sciences Department
of the University of Coimbra. The equipment used was a Frantz separator, which has an
electromagnet with two elongated poles. It allows to separate mineral particles according to
their magnetic susceptibility. A vibrating, inclined rail parallel to the poles allows materials to
cross the magnetic field. Mineral particles are discharged with an adjustable flow rate at the
upper end of the rail sliding to its lower end. The separator allows you to adjust the front
slope of the slope as well as a normal lateral slope to the tilt. The frontal inclination of the
gutter was 15º, while the lateral inclination was 12º.
In a first phase the sample was passed with a natural strong magnet to withdraw
ferromagnetic fraction. The remaining sample was separated with the aid of a Franz
magnetic separator, adjusted to different champ intensities (0.3A, 0.5A, 1A, and maximum

20
intensity in this case study preparation was 1.5A) (Fig. 3.6). Once you separate the different
fractions of each sample were weighed and labeled for quantifying heavy minerals.
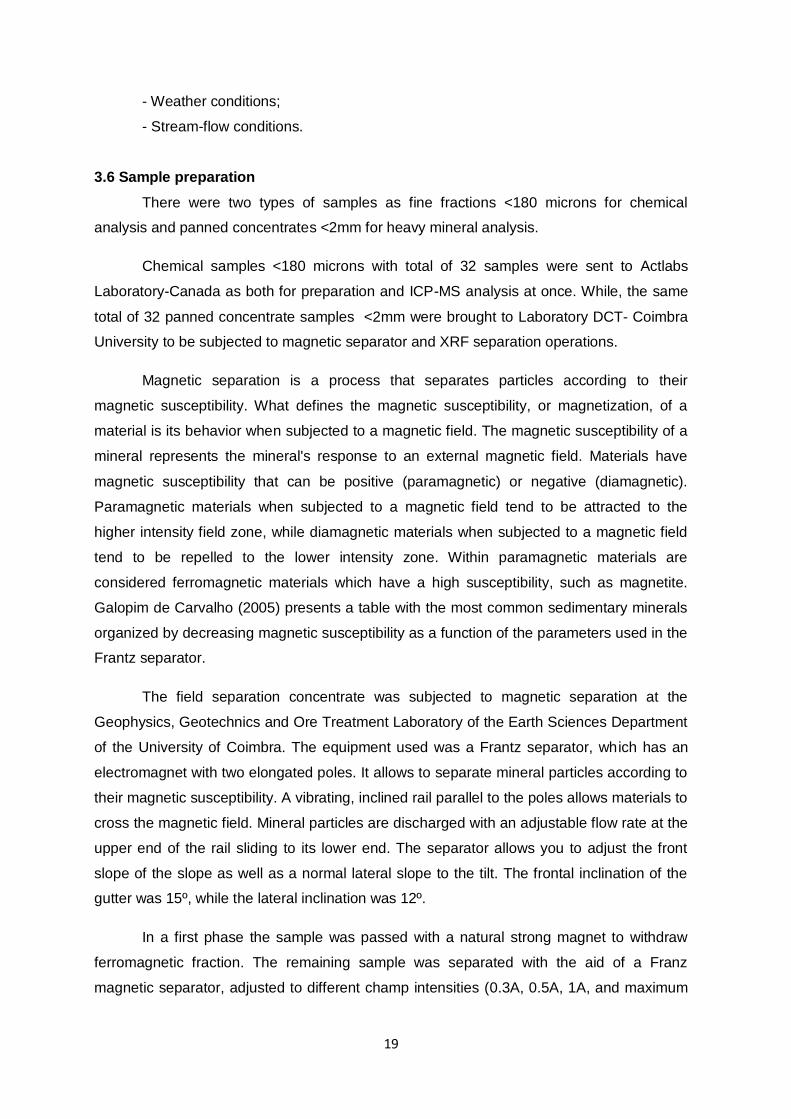
X-Ray Fluorescence (XRF) is a lab-based technique used for bulk chemical
analysis of rock, mineral, sediment, and fluid samples. The technique depends on the
fundamental principles of x-ray interactions with solid materials, similar to XRD analysis.
XRF analysis is one of the most commonly used techniques for major and trace element
analysis, due to the relative ease and low cost of sample preparation (fig.3.7)
Figure 3.6. Frantz magnetic separator (Laboratory DCT-Coimbra University, 2019)
21
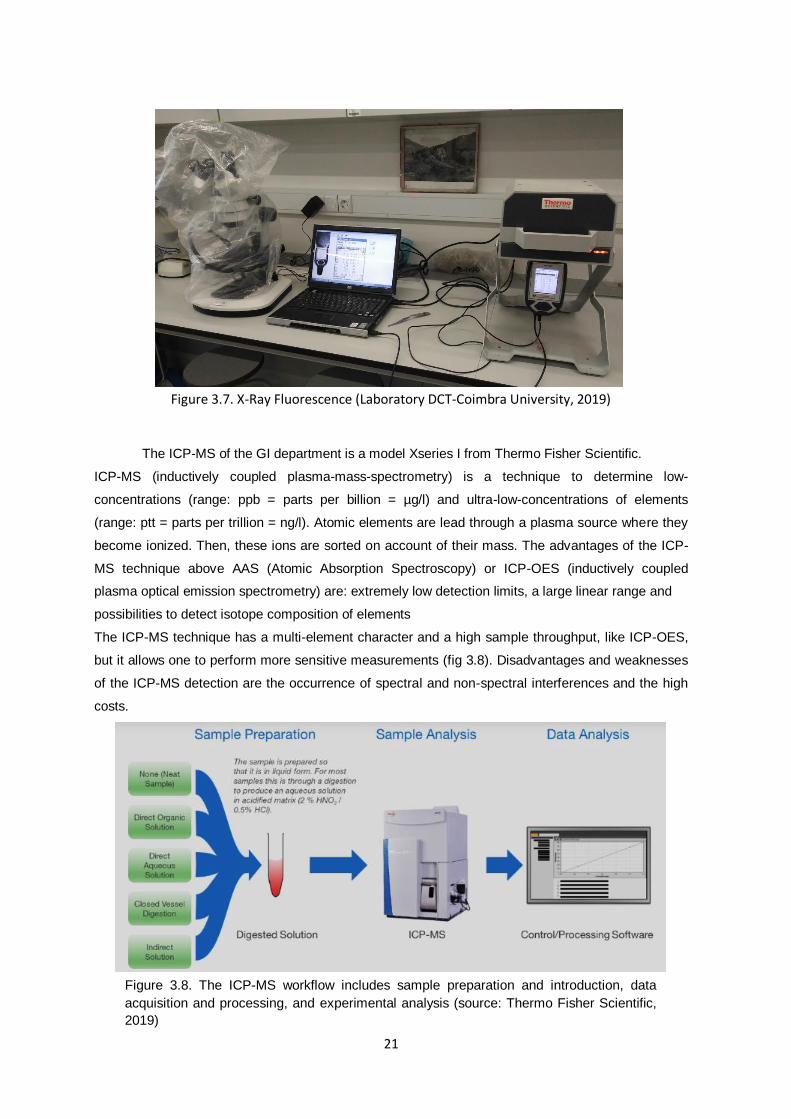
The ICP-MS of the GI department is a model Xseries I from Thermo Fisher Scientific.
ICP-MS (inductively coupled plasma-mass-spectrometry) is a technique to determine low-
concentrations (range: ppb = parts per billion = µg/l) and ultra-low-concentrations of elements
(range: ptt = parts per trillion = ng/l). Atomic elements are lead through a plasma source where they
become ionized. Then, these ions are sorted on account of their mass. The advantages of the ICP-
MS technique above AAS (Atomic Absorption Spectroscopy) or ICP-OES (inductively coupled
plasma optical emission spectrometry) are: extremely low detection limits, a large linear range and
possibilities to detect isotope composition of elements
The ICP-MS technique has a multi-element character and a high sample throughput, like ICP-OES,
but it allows one to perform more sensitive measurements (fig 3.8). Disadvantages and weaknesses
of the ICP-MS detection are the occurrence of spectral and non-spectral interferences and the high
costs.
Figure 3.7. X-Ray Fluorescence (Laboratory DCT-Coimbra University, 2019)
Figure 3.8. The ICP-MS workflow includes sample preparation and introduction, data
acquisition and processing, and experimental analysis (source: Thermo Fisher Scientific,
2019)

22
3.7 Geochemistry Statistical Prospection
The common present problem in interpreting data generated in geochemical
prospecting campaigns (in various sampling means) is the determination of thresholds,
values that separate the defined value ranges from the background and the anomalous
values. In addition to the most commonly used statistics measures, such as variance and
standard deviation, other measures express the variability of attributes, some of which are
commented below. The coefficient of variation (CV) is the result of dividing the standard
deviation by the arithmetic mean (averages).
and its value shows how much larger (or smaller) the standard deviation is from the mean.
This is a useful quantity for comparing different unit distributions. In general, when CV>1 it
is advisable to do logarithmic transformation of the data. The coefficient of variation gives
an idea of the regularity or homogeneity of the samples being studied. High values, in
practice greater than about one, represent samples with great heterogeneity, and values
below about 0.4 reflect sample homogeneity. Among the latter would be sedimentary layer
thicknesses and principal oxide contents in rocks, as well as several cases of soils in so-
called high-grade mineral deposits. Measure levels decrease or the geological complexity
of the process of formation of the accumulation studied increases the value of the CV (ie
the heterogeneity) tends to increase in the case of metallic elements and Rare elements in
nature. Another measure of variability is Median Absolute Deviation (MAD),
which is a measure less affected by extreme values, since the median is not influenced by
the extreme data as the average; For this reason, data with extreme valueshave a more
stable estimate of variability than measures using mean, variance and standard deviation.
In the determination of the MAD, the concept of the median is used twice, once directly on
the original data and once on the differences between them and the respective median, that
is, on the residuals obtained from the median of the data. Standard deviation is a useful
measure for normally distributed data, and deviations from normality deviate it from the best
condition for representing data variability. Using the median and the MAD does not require
the data to fit any distribution model. Some authors propose to set the threshold value to
twice the value of the MAD (Median Absolute Deviation) from the median. The MAD
MAD = Median (|X - Median of original data|)
23
approach is best applied when data contains less than 10% of outliers. Usually the method
(median + 2 MAD) gives the lowest threshold, identifying the highest number of outliers,
followed by the boxplot. The threshold set by the boxplot is in many cases close (but lower)
than that obtained from logtransformed data using the rule (mean + 2 standard deviations).
Thus, by using the rule (median + 2 MAD) the lowest threshold is obtained, using the
boxplot it is higher and applying the classic rule (mean padrão standard deviations) the
threshold is even higher.
3.7.1 Modified z score test
This test has been used more extensively than the test that considers as outlier
simply the values that exceed the sum of the arithmetic mean with three standard
deviations, or the average minus three standard deviations, since both the mean and the
standard deviation are, already, affected by the presence of the outlier. The modified z-
score test uses robust estimators such as the median, which ensures that the values used
to define an outlier affected by it were not used. Through an example (table below) we will
set up a check for the presence of an outlier with this test.
1st step - calculates the median of raw data.
2nd step - determine the column with the values of the absolute deviations, defined by:
│Xi - Xm│
3rd step - the arithmetic mean of the absolute deviations (MAD) is determined, values that
appear in the column created in the previous step.
Step 4 - Calculates the modified z values or each observation, generating column three of
the previous table; this value is represented by z * i, which is worth:
z * i = 0.6745 (Xi - Xm) / MAD
5th step - outliers are considered values of │z * i │> 3.5, ie, in the case studied, the values
larger than 3.5 are considered outliers.
24
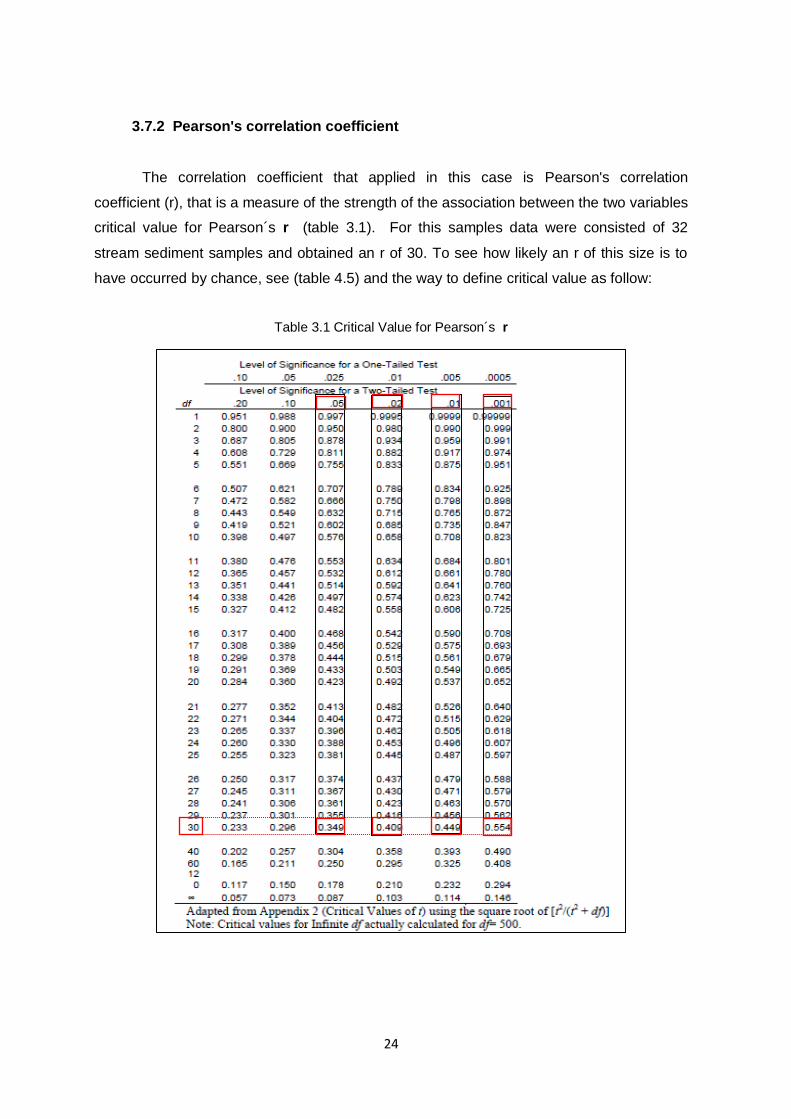
3.7.2 Pearson's correlation coefficient
The correlation coefficient that applied in this case is Pearson's correlation
coefficient (r), that is a measure of the strength of the association between the two variables
critical value for Pearson´s r (table 3.1). For this samples data were consisted of 32
stream sediment samples and obtained an r of 30. To see how likely an r of this size is to
have occurred by chance, see (table 4.5) and the way to define critical value as follow:
Table 3.1 Critical Value for Pearson´s r
25
To use the chart of critical values for Pearson‟s r, note that the formula for degrees
of freedom is N – 2. Find the appropriate row of values using the degrees of freedom;
identify the critical value of r by identifying the appropriate column depending on whether
alpha was set at .05, .01, or .001.
For this samples data were consisted of 32 stream sediment samples, N value=
32 and obtained an r of 30. To see how likely an r of this size is to have occurred by
chance, use the table. It shoud be 32-2 = 30 degrees of freedom (df). Obtaining r with
critical significance level (α) which was set from α=0.5 (95%), α=0.2 (98%), α=0.1 (99%)
and α= 0.01 (99.99%) as the result is highlighted with red boxes on table 4.5 above. For
details, the results for level of significance as follows:
Refers to the data above, r critical value with df=30 is larger than 0.349 for α=
0.01 (99.99%), 0.409 for α=0.2 (98%) and 0.449 for α= 0.1 (99%) but NOT equal to or
larger than 0.554 for α= 0.01 (99.99%). Thus, can be considered that an r critical values
for this 32 samples (df=30) are likely to occur by chance with a p<0.01.
Total of samples size N = 32
Degrees of freedom (df) = (N-2)
= 32-2
= 30
α=0.5 for critical value (r) = 0.349
α=0.2, for critical value (r) = 0.409
α=0.1 for critical value (r) = 0.449
α=0.01 for critical value (r) = 0.554
26
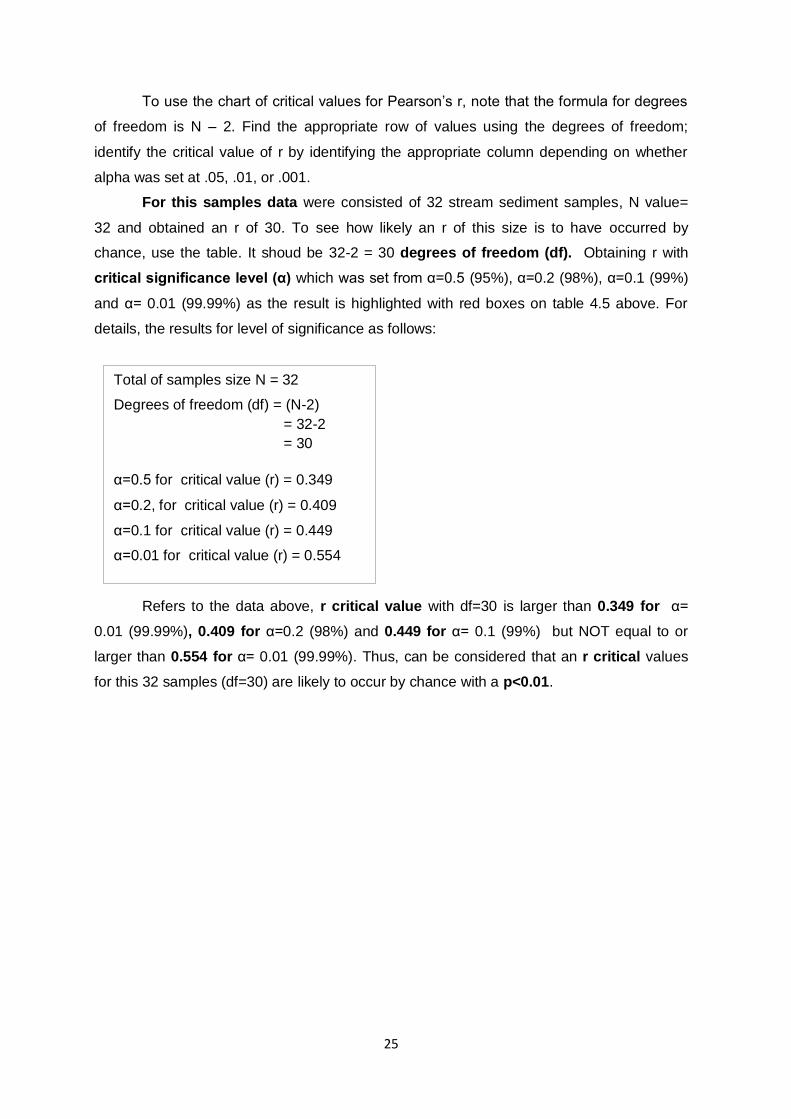
Chapter IV Results and Discussion
The results will consist of lithology observation and laboratory result of pan
concentrates and geochemical analysis.
4.1 Lithology Unit
Base on the Lithological field observation from 63 selected outcrops, the lithology
type is divided into 4 units, i.e: Green schist, Black Phyllite, Metabasic, and alluvial deposit.
The lithology types are classified according to texture and mineral compositions by
megascopic (included by loupe) only. It can be seen on the Lithology map below :
Figure 4.1. a - b) Outcrop R106, Green Schist with foliation direction N50E/32, Brownish green
weathered and green fresh color, foliated texture, schistose structure, medium to coarse
grained, there mostly mica and chlorite minerals and quartz vein.
a b
Figure 4.2.a-b) Outcrop R51, It has blackish grey weathered and blackish gray fresh color,
foliated texture, homoblastic, lepidoblastic, hipidioblastik, phyllitic structure. Fractures are filled
with quartz veins.The mineral composition is dominated by mediun grain muscovite, graphite
and quartz.
a b

27
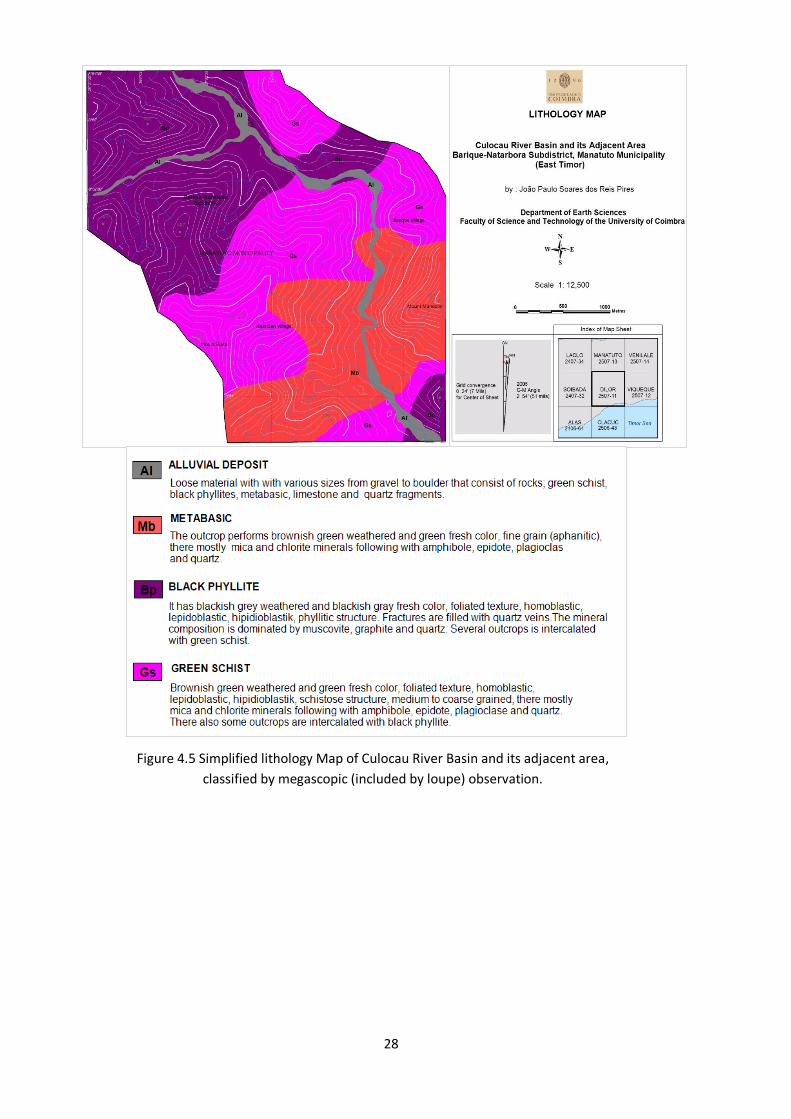
According to type of lithology found, a simplified of lithology map is performed on figure
4.5 below;
Figure 4.4a. Culocau river, alluvial deposit, loose material with various sizes from gravel to boulder
that consist of rock fragments; green schist, black phyllites, metabasic, quartz, b). Limestone
boulder that probably considered as exotic block with the basin due to deformation affection.
b a
Figure 4.3a-b) Outcrop R84, has showh brownish green weathered and green fresh color, fine
grain (aphanitic),there mostly mica and chlorite minerals following with amphibole, epidote,
plagioclas and quartz.
b a
28
Figure 4.5 Simplified lithology Map of Culocau River Basin and its adjacent area,
classified by megascopic (included by loupe) observation.
29
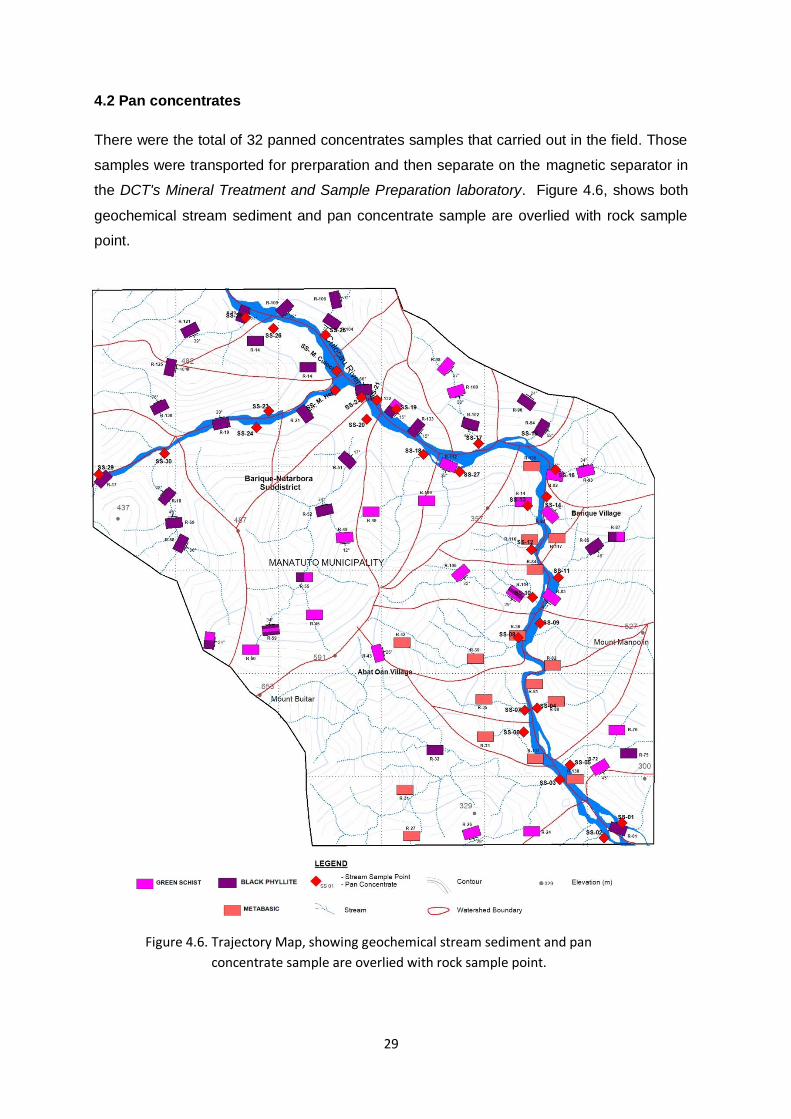
4.2 Pan concentrates
There were the total of 32 panned concentrates samples that carried out in the field. Those
samples were transported for prerparation and then separate on the magnetic separator in
the DCT's Mineral Treatment and Sample Preparation laboratory. Figure 4.6, shows both
geochemical stream sediment and pan concentrate sample are overlied with rock sample
point.
Figure 4.6. Trajectory Map, showing geochemical stream sediment and pan
concentrate sample are overlied with rock sample point.
30
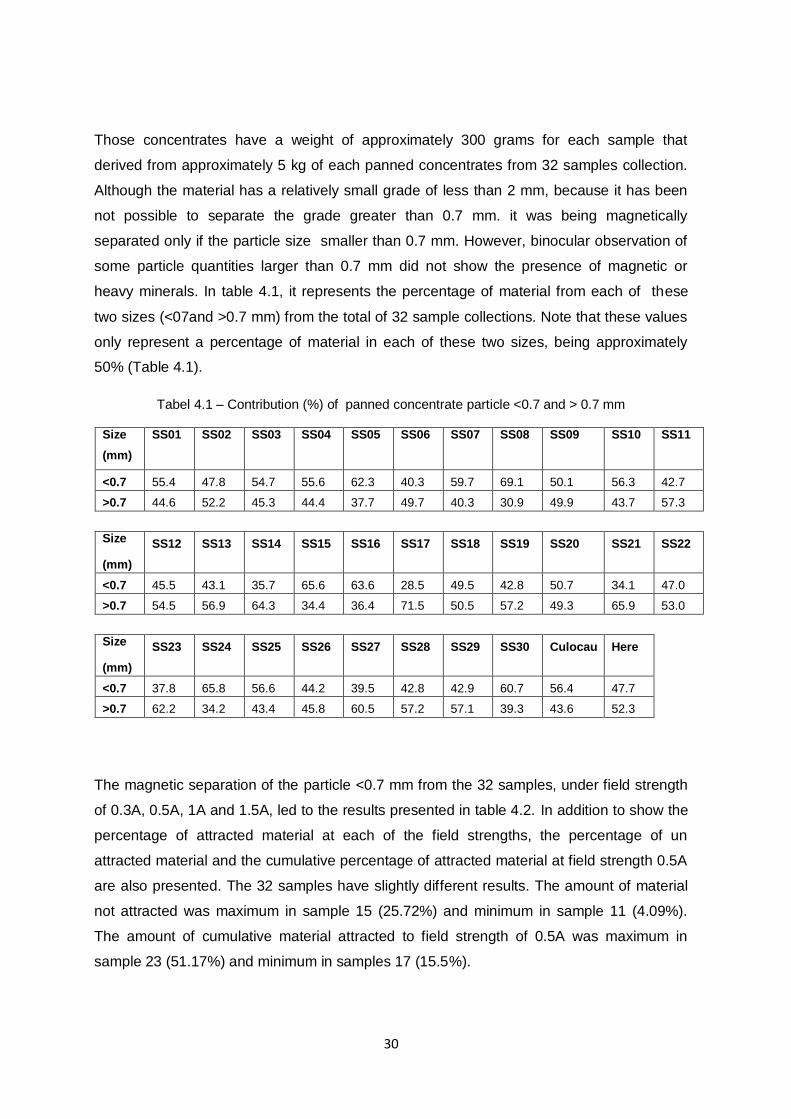
Those concentrates have a weight of approximately 300 grams for each sample that
derived from approximately 5 kg of each panned concentrates from 32 samples collection.
Although the material has a relatively small grade of less than 2 mm, because it has been
not possible to separate the grade greater than 0.7 mm. it was being magnetically
separated only if the particle size smaller than 0.7 mm. However, binocular observation of
some particle quantities larger than 0.7 mm did not show the presence of magnetic or
heavy minerals. In table 4.1, it represents the percentage of material from each of these
two sizes (<07and >0.7 mm) from the total of 32 sample collections. Note that these values
only represent a percentage of material in each of these two sizes, being approximately
50% (Table 4.1).
Tabel 4.1 – Contribution (%) of panned concentrate particle <0.7 and > 0.7 mm
Size
(mm)
SS01 SS02 SS03 SS04 SS05 SS06 SS07 SS08 SS09 SS10 SS11
<0.7 55.4 47.8 54.7 55.6 62.3 40.3 59.7 69.1 50.1 56.3 42.7
>0.7 44.6 52.2 45.3 44.4 37.7 49.7 40.3 30.9 49.9 43.7 57.3
Size
(mm)
SS12 SS13 SS14 SS15 SS16 SS17 SS18 SS19 SS20 SS21 SS22
<0.7 45.5 43.1 35.7 65.6 63.6 28.5 49.5 42.8 50.7 34.1 47.0
>0.7 54.5 56.9 64.3 34.4 36.4 71.5 50.5 57.2 49.3 65.9 53.0
Size
(mm)
SS23 SS24 SS25 SS26 SS27 SS28 SS29 SS30 Culocau Here
<0.7 37.8 65.8 56.6 44.2 39.5 42.8 42.9 60.7 56.4 47.7
>0.7 62.2 34.2 43.4 45.8 60.5 57.2 57.1 39.3 43.6 52.3
The magnetic separation of the particle <0.7 mm from the 32 samples, under field strength
of 0.3A, 0.5A, 1A and 1.5A, led to the results presented in table 4.2. In addition to show the
percentage of attracted material at each of the field strengths, the percentage of un
attracted material and the cumulative percentage of attracted material at field strength 0.5A
are also presented. The 32 samples have slightly different results. The amount of material
not attracted was maximum in sample 15 (25.72%) and minimum in sample 11 (4.09%).
The amount of cumulative material attracted to field strength of 0.5A was maximum in
sample 23 (51.17%) and minimum in samples 17 (15.5%).
31
Table 4.2 – Magnetic data (%) of 32 samples with magnitude 03.A, 0.5A, 1A, 1.5 A, Magnetic
(attracted material) and Non magnetic (non attracted).
Field
strength (A)
SS01 SS02 SS03 SS04 SS05 SS06 SS07 SS08 SS09 SS10 SS11
0.3 M 1,65 6,43 6,04 0,90 3,18 3,37 2,10 1,48 5,01 2,44 3,39
0.5 M 30,58 35,80 23,82 33,29 14,64 19,33 39,41 31,88 29,15 42,22 43,92
1.0 M 46,67 39,91 57,78 55,26 65,79 60,72 47,48 53,20 41,91 40,94 43,51
1.5 M 6,82 7,01 1,03 3,45 6,17 5,48 4,81 7,81 16,87 5,34 5,08
1.5 Nm 14,28 10,85 11,33 7,11 10,21 11,10 6,19 5,63 7,06 9,06 4,09
<0.5 M 32,22 42,23 29,86 34,18 17,83 22,69 41,51 33,36 34,17 44,66 47,31
SS12 SS13 SS14 SS15 SS16 SS17 SS18 SS19 SS20 SS21 SS22
0.3 M 5,70 6,32 1,87 1,49 6,88 2,39 3,82 5,98 7,12 3,36 1,20
0.5 M 29,89 29,84 31,12 36,64 41,64 12,90 37,69 25,16 42,06 39,66 22,14
1.0 M 41,17 35,06 54,12 29,67 40,97 50,81 39,73 45,46 34,66 33,55 47,89
1.5 M 15,21 15,47 6,55 6,48 3,88 13,44 7,57 8,68 7,19 3,54 13,67
1.5 Nm 8,04 13,31 6,34 25,72 6,63 20,45 11,19 14,72 8,98 19,88 15,09
<0.5 M 35,58 36,16 32,99 38,13 48,52 15,29 41,51 31,14 49,17 43,02 23,34
SS23 SS24 SS25 SS26 SS27 SS28 SS29 SS30 Culoc Here
0.3 M 2,06 1,06 4,62 4,41 2,31 1,26 1,01 3,78 1,38 5,30
0.5 M 49,11 21,76 31,39 35,18 39,07 18,86 42,39 39,42 34,72 22,31
1.0 M 35,80 48,14 45,30 38,39 42,24 47,38 37,14 37,59 39,82 41,76
1.5 M 3,16 14,86 7,56 8,78 9,44 19,84 5,32 8,53 10,29 11,99
1.5 Nm 9,86 14,18 11,13 13,25 6,94 12,66 14,14 10,68 13,79 18,65
<0.5 M 51,17 22,82 36,01 39,58 41,38 20,12 43,40 43,20 36,10 27,61
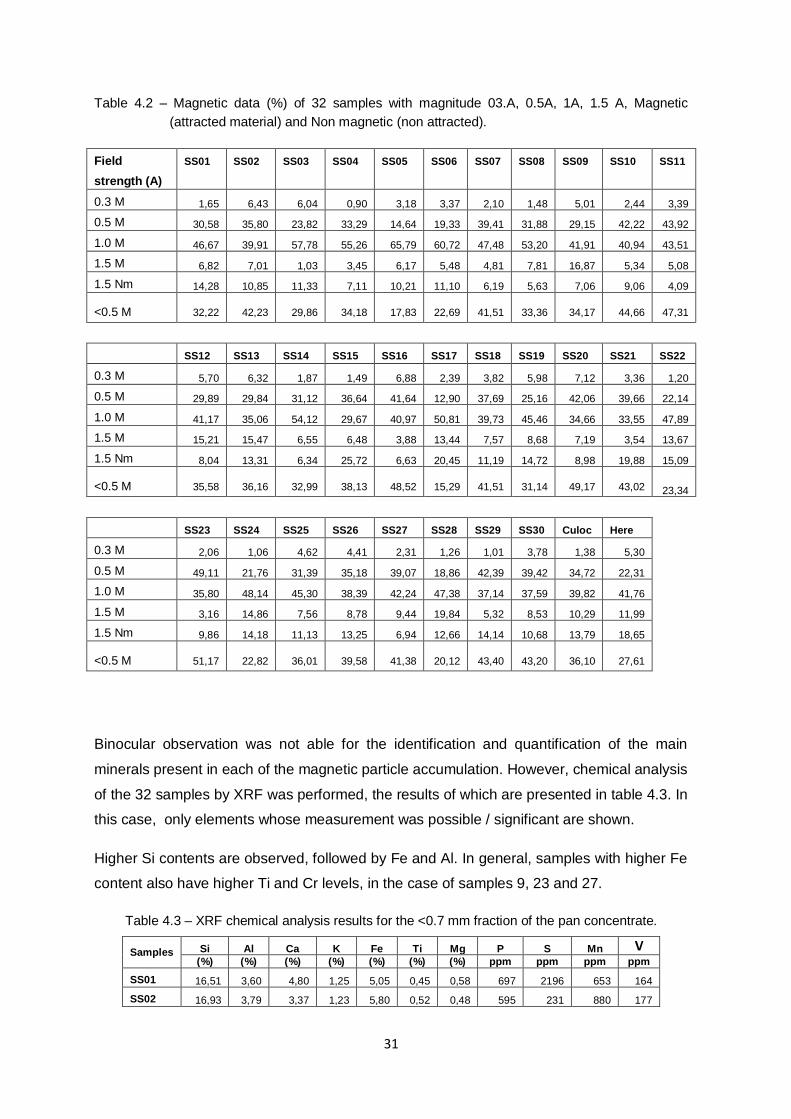
Binocular observation was not able for the identification and quantification of the main
minerals present in each of the magnetic particle accumulation. However, chemical analysis
of the 32 samples by XRF was performed, the results of which are presented in table 4.3. In
this case, only elements whose measurement was possible / significant are shown.
Higher Si contents are observed, followed by Fe and Al. In general, samples with higher Fe
content also have higher Ti and Cr levels, in the case of samples 9, 23 and 27.
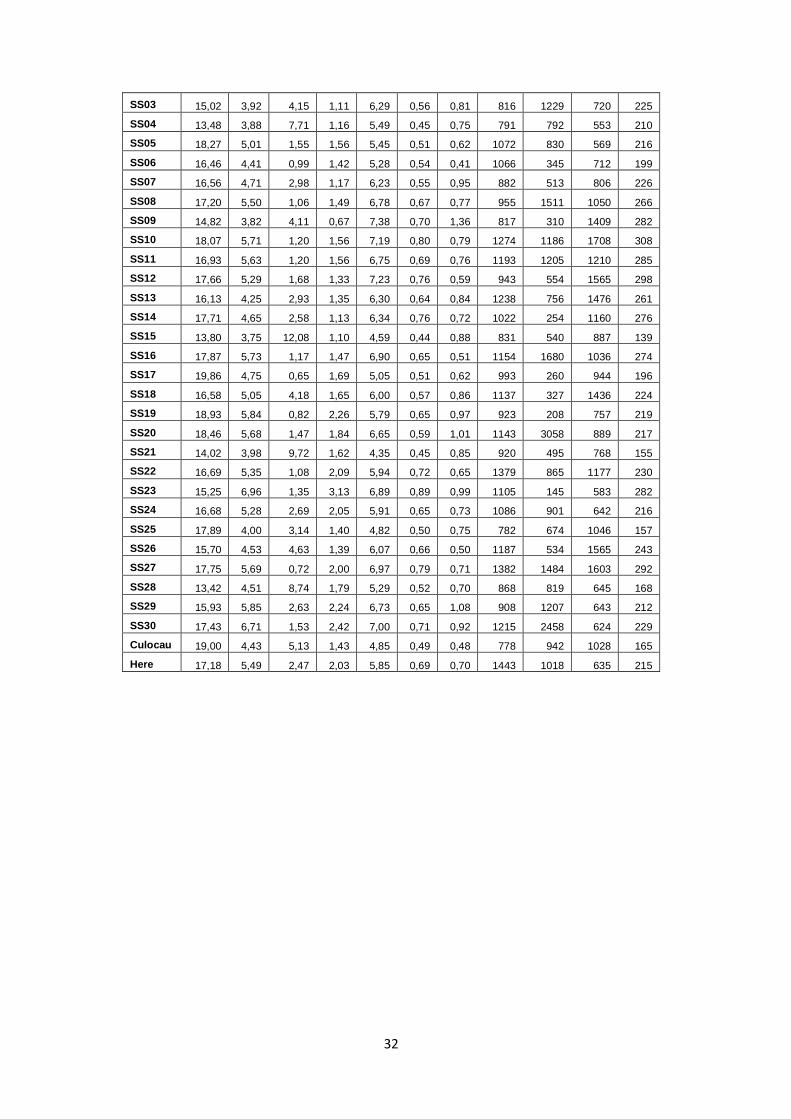
Table 4.3 – XRF chemical analysis results for the <0.7 mm fraction of the pan concentrate.
Samples Si Al Ca K Fe Ti Mg P S Mn V (%) (%) (%) (%) (%) (%) (%) ppm ppm ppm ppm
SS01 16,51 3,60 4,80 1,25 5,05 0,45 0,58 697 2196 653 164
SS02 16,93 3,79 3,37 1,23 5,80 0,52 0,48 595 231 880 177
32
SS03 15,02 3,92 4,15 1,11 6,29 0,56 0,81 816 1229 720 225
SS04 13,48 3,88 7,71 1,16 5,49 0,45 0,75 791 792 553 210
SS05 18,27 5,01 1,55 1,56 5,45 0,51 0,62 1072 830 569 216
SS06 16,46 4,41 0,99 1,42 5,28 0,54 0,41 1066 345 712 199
SS07 16,56 4,71 2,98 1,17 6,23 0,55 0,95 882 513 806 226
SS08 17,20 5,50 1,06 1,49 6,78 0,67 0,77 955 1511 1050 266
SS09 14,82 3,82 4,11 0,67 7,38 0,70 1,36 817 310 1409 282
SS10 18,07 5,71 1,20 1,56 7,19 0,80 0,79 1274 1186 1708 308
SS11 16,93 5,63 1,20 1,56 6,75 0,69 0,76 1193 1205 1210 285
SS12 17,66 5,29 1,68 1,33 7,23 0,76 0,59 943 554 1565 298
SS13 16,13 4,25 2,93 1,35 6,30 0,64 0,84 1238 756 1476 261
SS14 17,71 4,65 2,58 1,13 6,34 0,76 0,72 1022 254 1160 276
SS15 13,80 3,75 12,08 1,10 4,59 0,44 0,88 831 540 887 139
SS16 17,87 5,73 1,17 1,47 6,90 0,65 0,51 1154 1680 1036 274
SS17 19,86 4,75 0,65 1,69 5,05 0,51 0,62 993 260 944 196
SS18 16,58 5,05 4,18 1,65 6,00 0,57 0,86 1137 327 1436 224
SS19 18,93 5,84 0,82 2,26 5,79 0,65 0,97 923 208 757 219
SS20 18,46 5,68 1,47 1,84 6,65 0,59 1,01 1143 3058 889 217
SS21 14,02 3,98 9,72 1,62 4,35 0,45 0,85 920 495 768 155
SS22 16,69 5,35 1,08 2,09 5,94 0,72 0,65 1379 865 1177 230
SS23 15,25 6,96 1,35 3,13 6,89 0,89 0,99 1105 145 583 282
SS24 16,68 5,28 2,69 2,05 5,91 0,65 0,73 1086 901 642 216
SS25 17,89 4,00 3,14 1,40 4,82 0,50 0,75 782 674 1046 157
SS26 15,70 4,53 4,63 1,39 6,07 0,66 0,50 1187 534 1565 243
SS27 17,75 5,69 0,72 2,00 6,97 0,79 0,71 1382 1484 1603 292
SS28 13,42 4,51 8,74 1,79 5,29 0,52 0,70 868 819 645 168
SS29 15,93 5,85 2,63 2,24 6,73 0,65 1,08 908 1207 643 212
SS30 17,43 6,71 1,53 2,42 7,00 0,71 0,92 1215 2458 624 229
Culocau 19,00 4,43 5,13 1,43 4,85 0,49 0,48 778 942 1028 165
Here 17,18 5,49 2,47 2,03 5,85 0,69 0,70 1443 1018 635 215
33
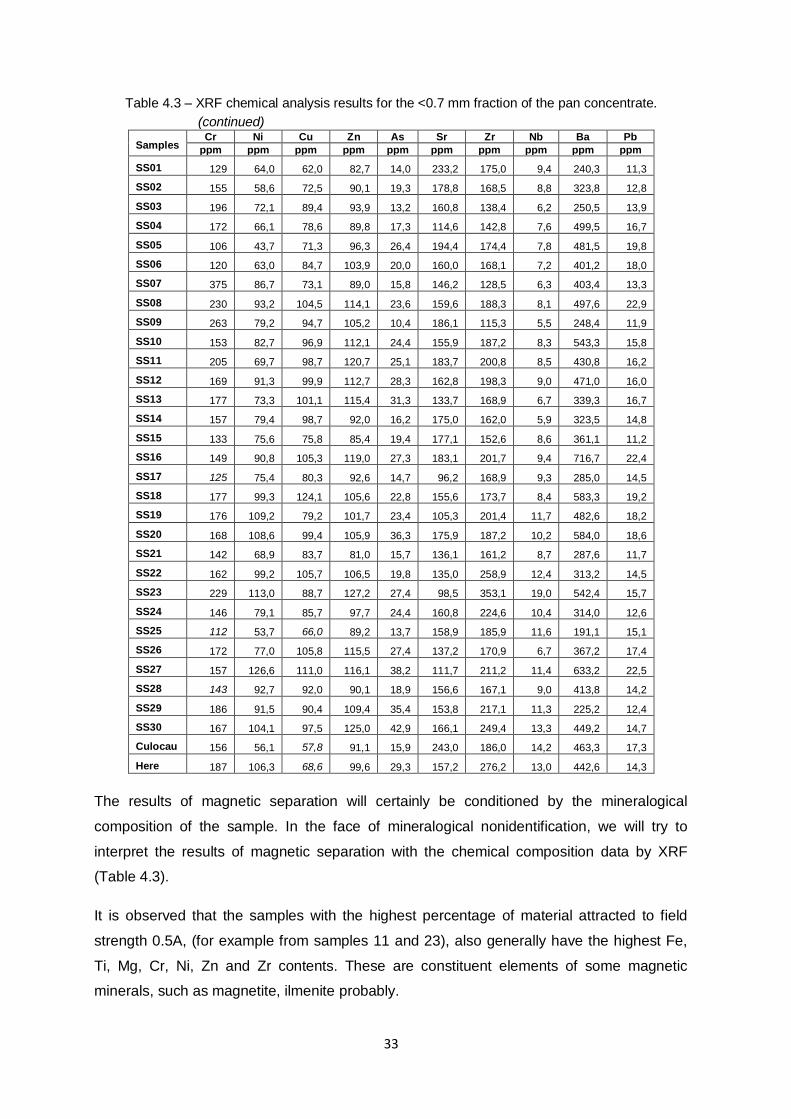
Table 4.3 – XRF chemical analysis results for the <0.7 mm fraction of the pan concentrate.
(continued)
Samples Cr Ni Cu Zn As Sr Zr Nb Ba Pb
ppm ppm ppm ppm ppm ppm ppm ppm ppm ppm
SS01 129 64,0 62,0 82,7 14,0 233,2 175,0 9,4 240,3 11,3
SS02 155 58,6 72,5 90,1 19,3 178,8 168,5 8,8 323,8 12,8
SS03 196 72,1 89,4 93,9 13,2 160,8 138,4 6,2 250,5 13,9
SS04 172 66,1 78,6 89,8 17,3 114,6 142,8 7,6 499,5 16,7
SS05 106 43,7 71,3 96,3 26,4 194,4 174,4 7,8 481,5 19,8
SS06 120 63,0 84,7 103,9 20,0 160,0 168,1 7,2 401,2 18,0
SS07 375 86,7 73,1 89,0 15,8 146,2 128,5 6,3 403,4 13,3
SS08 230 93,2 104,5 114,1 23,6 159,6 188,3 8,1 497,6 22,9
SS09 263 79,2 94,7 105,2 10,4 186,1 115,3 5,5 248,4 11,9
SS10 153 82,7 96,9 112,1 24,4 155,9 187,2 8,3 543,3 15,8
SS11 205 69,7 98,7 120,7 25,1 183,7 200,8 8,5 430,8 16,2
SS12 169 91,3 99,9 112,7 28,3 162,8 198,3 9,0 471,0 16,0
SS13 177 73,3 101,1 115,4 31,3 133,7 168,9 6,7 339,3 16,7
SS14 157 79,4 98,7 92,0 16,2 175,0 162,0 5,9 323,5 14,8
SS15 133 75,6 75,8 85,4 19,4 177,1 152,6 8,6 361,1 11,2
SS16 149 90,8 105,3 119,0 27,3 183,1 201,7 9,4 716,7 22,4
SS17 125 75,4 80,3 92,6 14,7 96,2 168,9 9,3 285,0 14,5
SS18 177 99,3 124,1 105,6 22,8 155,6 173,7 8,4 583,3 19,2
SS19 176 109,2 79,2 101,7 23,4 105,3 201,4 11,7 482,6 18,2
SS20 168 108,6 99,4 105,9 36,3 175,9 187,2 10,2 584,0 18,6
SS21 142 68,9 83,7 81,0 15,7 136,1 161,2 8,7 287,6 11,7
SS22 162 99,2 105,7 106,5 19,8 135,0 258,9 12,4 313,2 14,5
SS23 229 113,0 88,7 127,2 27,4 98,5 353,1 19,0 542,4 15,7
SS24 146 79,1 85,7 97,7 24,4 160,8 224,6 10,4 314,0 12,6
SS25 112 53,7 66,0 89,2 13,7 158,9 185,9 11,6 191,1 15,1
SS26 172 77,0 105,8 115,5 27,4 137,2 170,9 6,7 367,2 17,4
SS27 157 126,6 111,0 116,1 38,2 111,7 211,2 11,4 633,2 22,5
SS28 143 92,7 92,0 90,1 18,9 156,6 167,1 9,0 413,8 14,2
SS29 186 91,5 90,4 109,4 35,4 153,8 217,1 11,3 225,2 12,4
SS30 167 104,1 97,5 125,0 42,9 166,1 249,4 13,3 449,2 14,7
Culocau 156 56,1 57,8 91,1 15,9 243,0 186,0 14,2 463,3 17,3
Here 187 106,3 68,6 99,6 29,3 157,2 276,2 13,0 442,6 14,3
The results of magnetic separation will certainly be conditioned by the mineralogical
composition of the sample. In the face of mineralogical nonidentification, we will try to
interpret the results of magnetic separation with the chemical composition data by XRF
(Table 4.3).
It is observed that the samples with the highest percentage of material attracted to field
strength 0.5A, (for example from samples 11 and 23), also generally have the highest Fe,
Ti, Mg, Cr, Ni, Zn and Zr contents. These are constituent elements of some magnetic
minerals, such as magnetite, ilmenite probably.
34
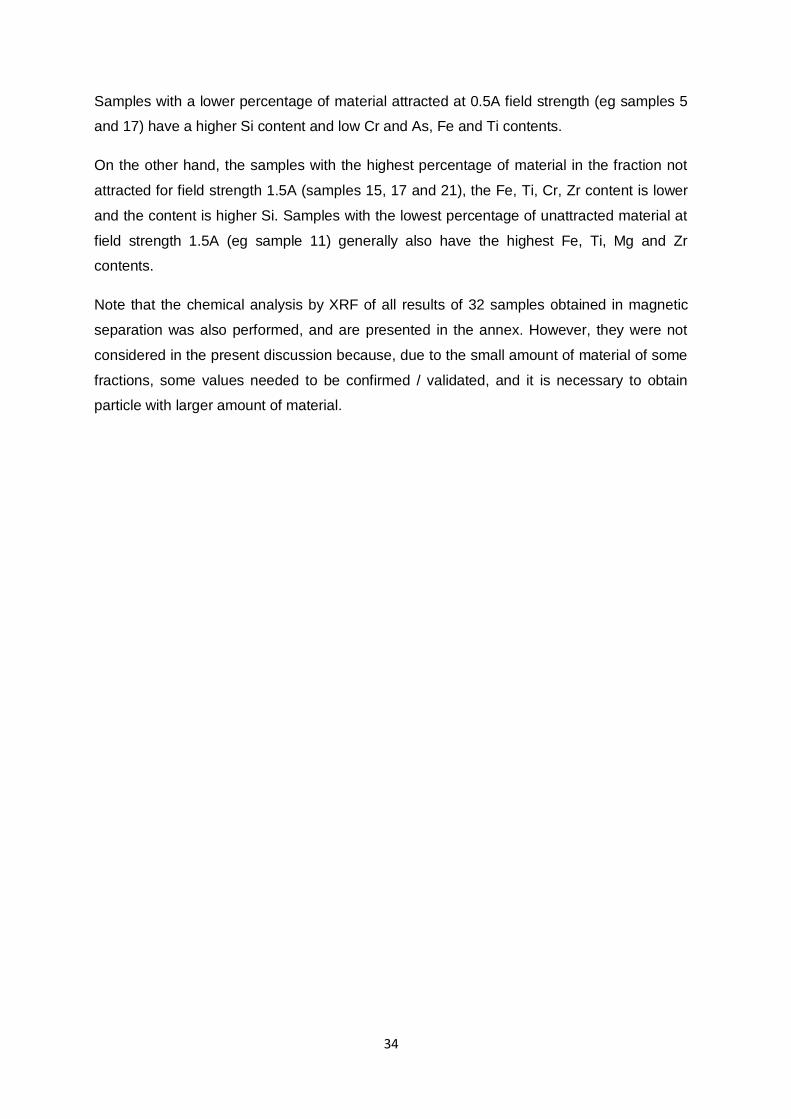
Samples with a lower percentage of material attracted at 0.5A field strength (eg samples 5
and 17) have a higher Si content and low Cr and As, Fe and Ti contents.
On the other hand, the samples with the highest percentage of material in the fraction not
attracted for field strength 1.5A (samples 15, 17 and 21), the Fe, Ti, Cr, Zr content is lower
and the content is higher Si. Samples with the lowest percentage of unattracted material at
field strength 1.5A (eg sample 11) generally also have the highest Fe, Ti, Mg and Zr
contents.
Note that the chemical analysis by XRF of all results of 32 samples obtained in magnetic
separation was also performed, and are presented in the annex. However, they were not
considered in the present discussion because, due to the small amount of material of some
fractions, some values needed to be confirmed / validated, and it is necessary to obtain
particle with larger amount of material.
35
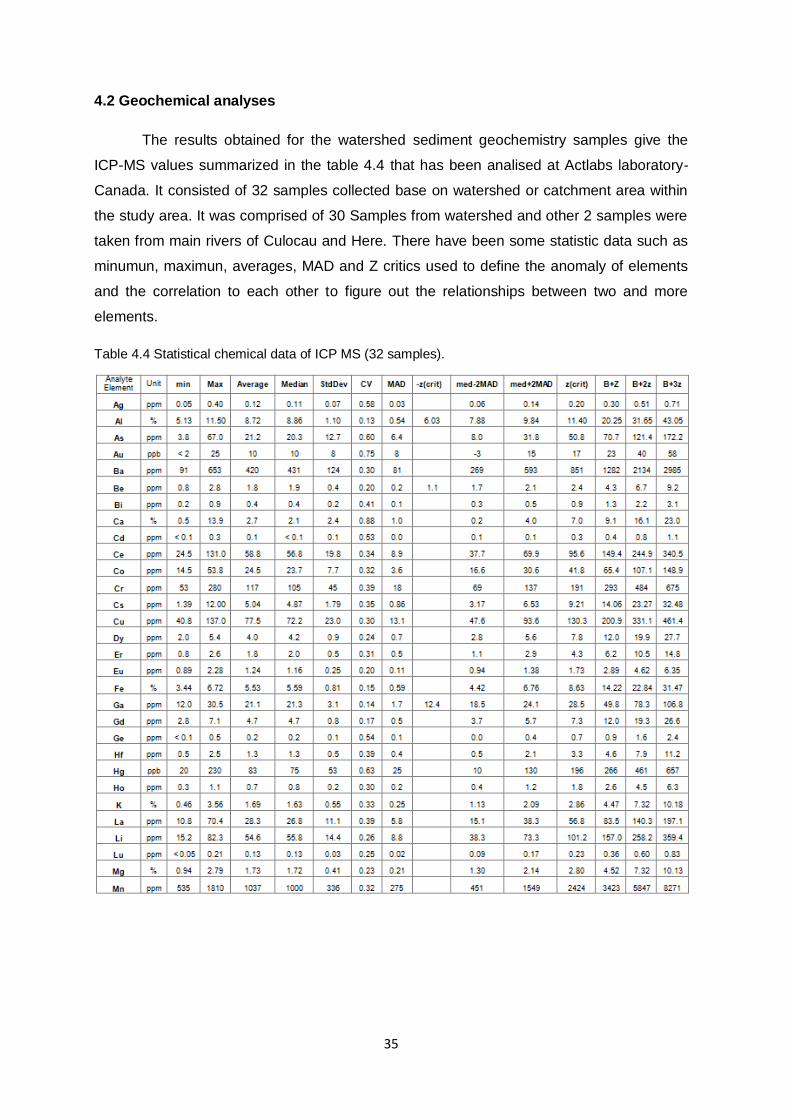
4.2 Geochemical analyses
The results obtained for the watershed sediment geochemistry samples give the
ICP-MS values summarized in the table 4.4 that has been analised at Actlabs laboratory-
Canada. It consisted of 32 samples collected base on watershed or catchment area within
the study area. It was comprised of 30 Samples from watershed and other 2 samples were
taken from main rivers of Culocau and Here. There have been some statistic data such as
minumun, maximun, averages, MAD and Z critics used to define the anomaly of elements
and the correlation to each other to figure out the relationships between two and more
elements.
Table 4.4 Statistical chemical data of ICP MS (32 samples).

36
Table 4.4 Statistical of ICP MS chemical data (32 samples)
(Continued)
Also for these samples chemical analyzes were performed by XRF in the DCT
Laboratory. However the results obtained by these two methods were slightly different. This
discussion considers only the results obtained by ICP performed in the Canadian
Laboratory (Table 4.4). Nevertheless, considering only the mean values obtained by the
two processes of the 32 samples, we can observe the similarity of the mean values of some
elements obtained by ICP and XRF. For example, the Fe, Cu, Pb, Zn and As content
determined by ICP (5.53%, 77.5ppm, 18.8ppm, 112 ppm and 21.2ppb respectively) are
similar to those obtained by XRF (respectively 6.0%, 88.8ppm, 17.7ppm, 102.4 and
23.1ppm). However for other elements, such as for Ti, Mg, Cr and S the content determined
by ICP (0.26%, 1.73%, 117ppm, and 0.25% respectively) presents values different from
those obtained by XRF (respectively 0.62% 0.76%, 172ppm and 0.094%).
37
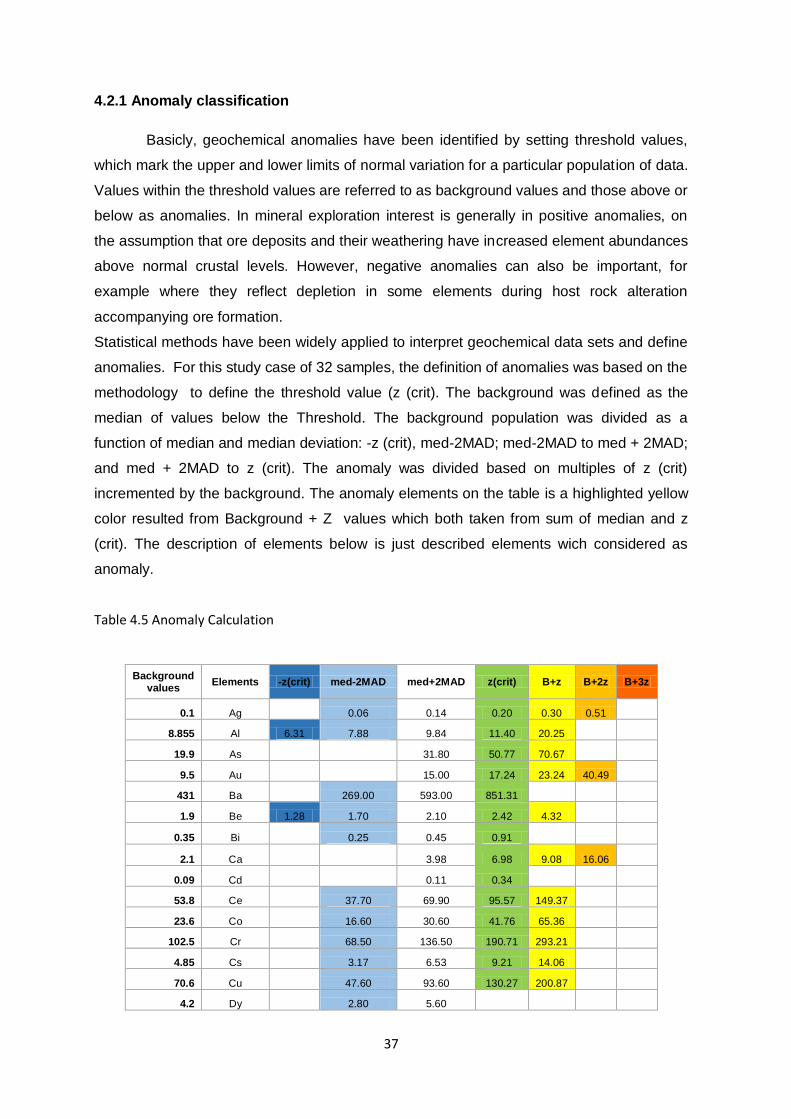
4.2.1 Anomaly classification
Basicly, geochemical anomalies have been identified by setting threshold values,
which mark the upper and lower limits of normal variation for a particular population of data.
Values within the threshold values are referred to as background values and those above or
below as anomalies. In mineral exploration interest is generally in positive anomalies, on
the assumption that ore deposits and their weathering have increased element abundances
above normal crustal levels. However, negative anomalies can also be important, for
example where they reflect depletion in some elements during host rock alteration
accompanying ore formation.
Statistical methods have been widely applied to interpret geochemical data sets and define
anomalies. For this study case of 32 samples, the definition of anomalies was based on the
methodology to define the threshold value (z (crit). The background was defined as the
median of values below the Threshold. The background population was divided as a
function of median and median deviation: -z (crit), med-2MAD; med-2MAD to med + 2MAD;
and med + 2MAD to z (crit). The anomaly was divided based on multiples of z (crit)
incremented by the background. The anomaly elements on the table is a highlighted yellow
color resulted from Background + Z values which both taken from sum of median and z
(crit). The description of elements below is just described elements wich considered as
anomaly.
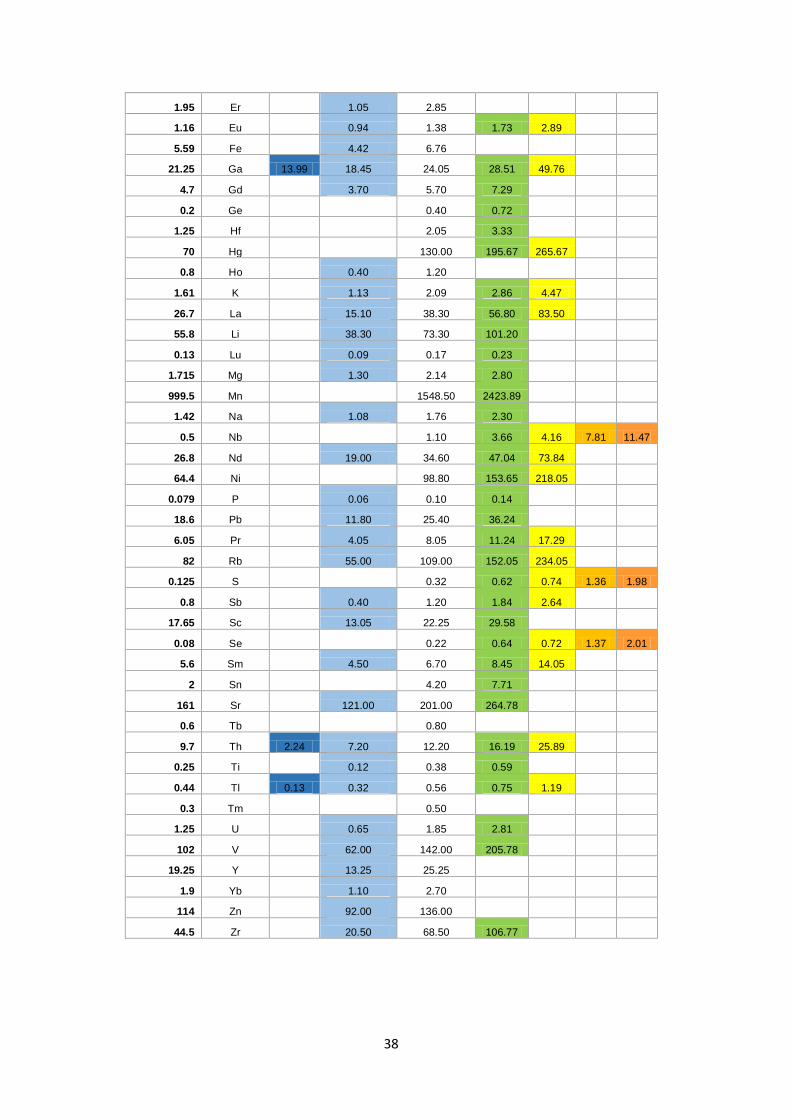
Table 4.5 Anomaly Calculation
Background values
Elements -z(crit) med-2MAD med+2MAD z(crit) B+z B+2z B+3z
0.1 Ag 0.06 0.14 0.20 0.30 0.51
8.855 Al 6.31 7.88 9.84 11.40 20.25
19.9 As 31.80 50.77 70.67
9.5 Au 15.00 17.24 23.24 40.49
431 Ba 269.00 593.00 851.31
1.9 Be 1.28 1.70 2.10 2.42 4.32
0.35 Bi 0.25 0.45 0.91
2.1 Ca 3.98 6.98 9.08 16.06
0.09 Cd 0.11 0.34
53.8 Ce 37.70 69.90 95.57 149.37
23.6 Co 16.60 30.60 41.76 65.36
102.5 Cr 68.50 136.50 190.71 293.21
4.85 Cs 3.17 6.53 9.21 14.06
70.6 Cu 47.60 93.60 130.27 200.87
4.2 Dy 2.80 5.60
38
1.95 Er 1.05 2.85
1.16 Eu 0.94 1.38 1.73 2.89
5.59 Fe 4.42 6.76
21.25 Ga 13.99 18.45 24.05 28.51 49.76
4.7 Gd 3.70 5.70 7.29
0.2 Ge 0.40 0.72
1.25 Hf 2.05 3.33
70 Hg 130.00 195.67 265.67
0.8 Ho 0.40 1.20
1.61 K 1.13 2.09 2.86 4.47
26.7 La 15.10 38.30 56.80 83.50
55.8 Li 38.30 73.30 101.20
0.13 Lu 0.09 0.17 0.23
1.715 Mg 1.30 2.14 2.80
999.5 Mn 1548.50 2423.89
1.42 Na 1.08 1.76 2.30
0.5 Nb 1.10 3.66 4.16 7.81 11.47
26.8 Nd 19.00 34.60 47.04 73.84
64.4 Ni 98.80 153.65 218.05
0.079 P 0.06 0.10 0.14
18.6 Pb 11.80 25.40 36.24
6.05 Pr 4.05 8.05 11.24 17.29
82 Rb 55.00 109.00 152.05 234.05
0.125 S 0.32 0.62 0.74 1.36 1.98
0.8 Sb 0.40 1.20 1.84 2.64
17.65 Sc 13.05 22.25 29.58
0.08 Se 0.22 0.64 0.72 1.37 2.01
5.6 Sm 4.50 6.70 8.45 14.05
2 Sn 4.20 7.71
161 Sr 121.00 201.00 264.78
0.6 Tb 0.80
9.7 Th 2.24 7.20 12.20 16.19 25.89
0.25 Ti 0.12 0.38 0.59
0.44 Tl 0.13 0.32 0.56 0.75 1.19
0.3 Tm 0.50
1.25 U 0.65 1.85 2.81
102 V 62.00 142.00 205.78
19.25 Y 13.25 25.25
1.9 Yb 1.10 2.70
114 Zn 92.00 136.00
44.5 Zr 20.50 68.50 106.77
39
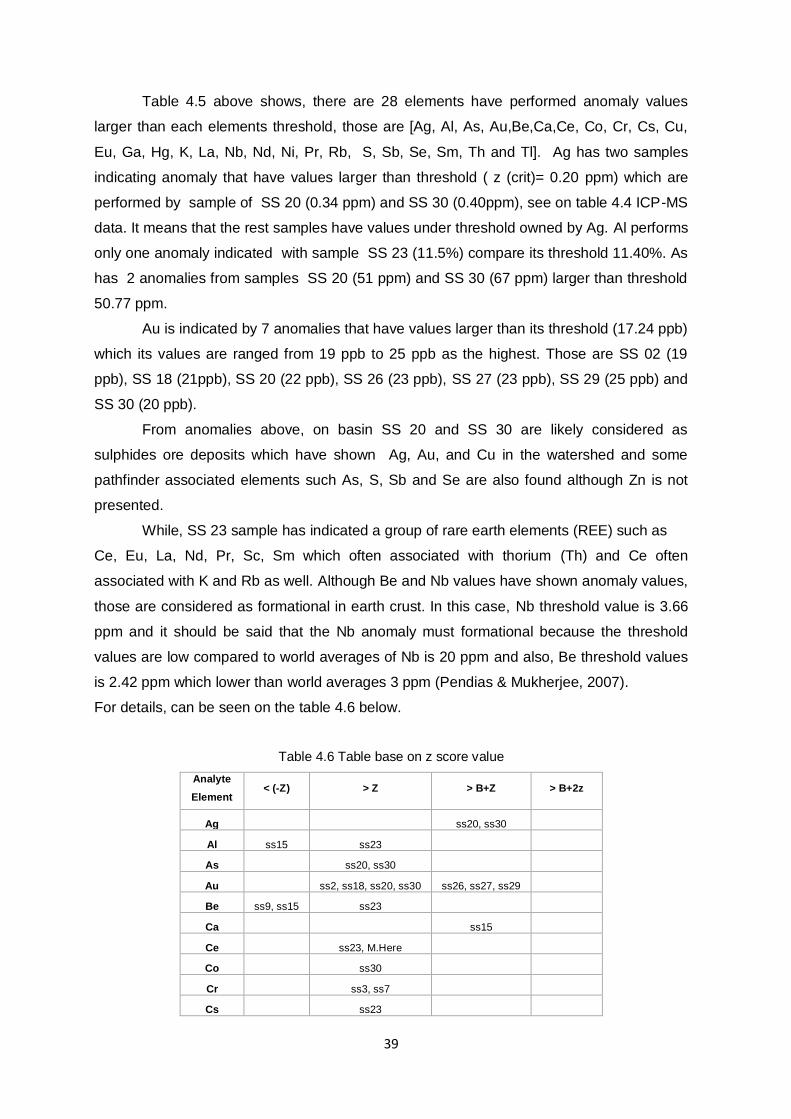
Table 4.5 above shows, there are 28 elements have performed anomaly values
larger than each elements threshold, those are [Ag, Al, As, Au,Be,Ca,Ce, Co, Cr, Cs, Cu,
Eu, Ga, Hg, K, La, Nb, Nd, Ni, Pr, Rb, S, Sb, Se, Sm, Th and Tl]. Ag has two samples
indicating anomaly that have values larger than threshold ( z (crit)= 0.20 ppm) which are
performed by sample of SS 20 (0.34 ppm) and SS 30 (0.40ppm), see on table 4.4 ICP-MS
data. It means that the rest samples have values under threshold owned by Ag. Al performs
only one anomaly indicated with sample SS 23 (11.5%) compare its threshold 11.40%. As
has 2 anomalies from samples SS 20 (51 ppm) and SS 30 (67 ppm) larger than threshold
50.77 ppm.
Au is indicated by 7 anomalies that have values larger than its threshold (17.24 ppb)
which its values are ranged from 19 ppb to 25 ppb as the highest. Those are SS 02 (19
ppb), SS 18 (21ppb), SS 20 (22 ppb), SS 26 (23 ppb), SS 27 (23 ppb), SS 29 (25 ppb) and
SS 30 (20 ppb).
From anomalies above, on basin SS 20 and SS 30 are likely considered as
sulphides ore deposits which have shown Ag, Au, and Cu in the watershed and some
pathfinder associated elements such As, S, Sb and Se are also found although Zn is not
presented.
While, SS 23 sample has indicated a group of rare earth elements (REE) such as
Ce, Eu, La, Nd, Pr, Sc, Sm which often associated with thorium (Th) and Ce often
associated with K and Rb as well. Although Be and Nb values have shown anomaly values,
those are considered as formational in earth crust. In this case, Nb threshold value is 3.66
ppm and it should be said that the Nb anomaly must formational because the threshold
values are low compared to world averages of Nb is 20 ppm and also, Be threshold values
is 2.42 ppm which lower than world averages 3 ppm (Pendias & Mukherjee, 2007).
For details, can be seen on the table 4.6 below.
Table 4.6 Table base on z score value
Analyte
Element < (-Z) > Z > B+Z > B+2z
Ag
ss20, ss30
Al ss15 ss23
As
ss20, ss30
Au
ss2, ss18, ss20, ss30 ss26, ss27, ss29
Be ss9, ss15 ss23
Ca
ss15
Ce
ss23, M.Here
Co
ss30
Cr
ss3, ss7
Cs
ss23
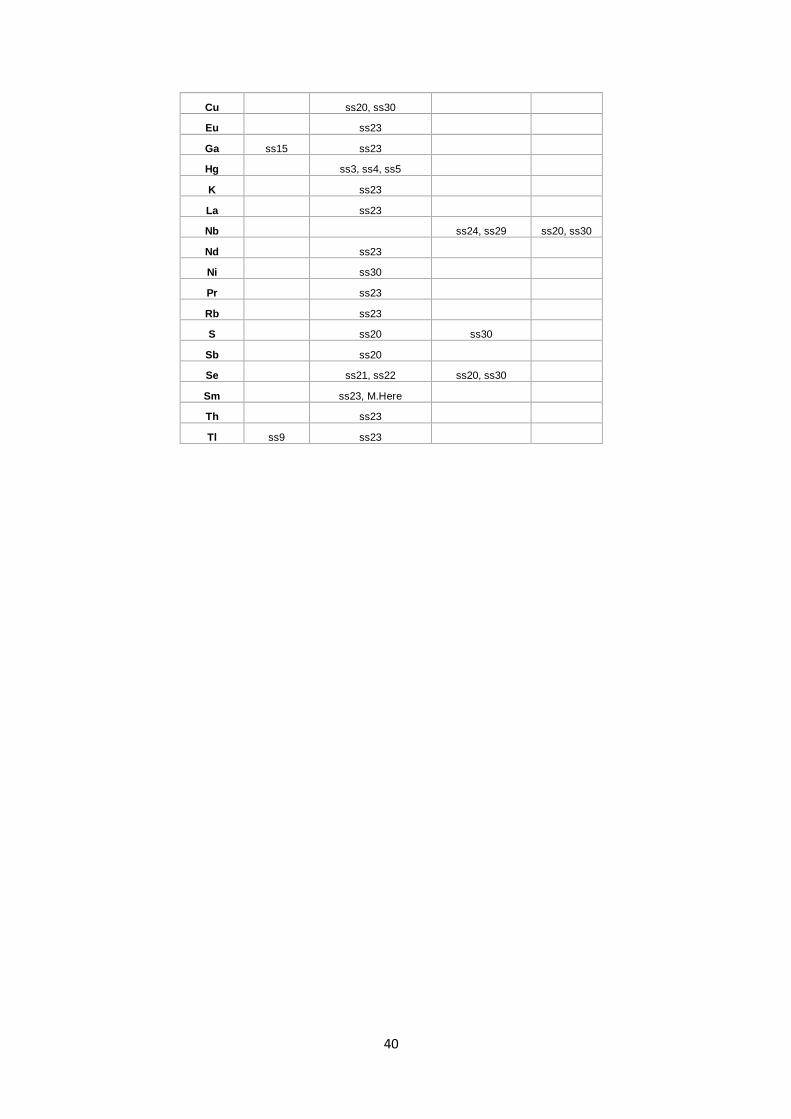
40
Cu
ss20, ss30
Eu
ss23
Ga ss15 ss23
Hg
ss3, ss4, ss5
K
ss23
La
ss23
Nb
ss24, ss29 ss20, ss30
Nd
ss23
Ni
ss30
Pr
ss23
Rb
ss23
S
ss20 ss30
Sb
ss20
Se
ss21, ss22 ss20, ss30
Sm
ss23, M.Here
Th
ss23
Tl ss9 ss23

41
4.2.2. Correlation coefficient
Correlation is a technique for investigating the relationship between two quantitative, continuous variables, for example, in this case is
the relationship between ores elements with their associated mineral from geochemical stream sediment sample. Table 4.7 is performed only
those element that have been observed on catchment basin (watershed) SS 23 that has various of elements found and the two others i.e SS 20
and SS 20 are the principal basins that considered in this data as anomaly for mineralization such Ag, Au and Cu, etc.
Table 4.7 Correlations of ICP-MS chemical data
Ag Al As Au Be Ca Ce Co Cr Cs Cu Eu Ga Hg K La Nb Nd Ni Pr Rb S Sb Se Sm Th Tl
Ag 1
Al 0.291 1
As 0.896 0.483 1
Au 0.546 0.128 0.570 1
Be 0.315 0.726 0.499 0.188 1
Ca -0.266 -0.770 -0.392 -0.196 -0.675 1
Ce 0.393 0.594 0.538 0.287 0.778 -0.423 1
Co 0.714 0.377 0.766 0.397 0.116 -0.206 0.277 1
Cr -0.067 0.200 -0.092 -0.065 -0.137 -0.006 0.029 0.195 1
Cs 0.302 0.547 0.393 0.205 0.769 -0.433 0.857 0.141 0.041 1
Cu 0.713 0.432 0.791 0.554 0.243 -0.427 0.207 0.728 -0.110 0.051 1
Eu 0.349 0.608 0.504 0.177 0.600 -0.358 0.847 0.528 0.247 0.709 0.263 1
Ga 0.209 0.957 0.442 0.106 0.729 -0.685 0.622 0.401 0.161 0.566 0.383 0.674 1
Hg -0.258 0.082 -0.257 -0.255 0.158 -0.160 -0.260 -0.416 0.154 -0.175 -0.290 -0.290 -0.019 1
K 0.431 0.678 0.559 0.321 0.817 -0.492 0.889 0.263 -0.006 0.937 0.246 0.742 0.676 -0.205 1
La 0.371 0.537 0.485 0.252 0.738 -0.365 0.992 0.244 0.055 0.876 0.128 0.848 0.565 -0.267 0.883 1
Nb 0.928 0.173 0.801 0.513 0.162 -0.115 0.325 0.702 -0.015 0.259 0.544 0.303 0.111 -0.336 0.349 0.324 1
Nd 0.365 0.624 0.511 0.230 0.763 -0.413 0.991 0.291 0.087 0.865 0.182 0.878 0.649 -0.230 0.890 0.988 0.306 1
Ni 0.772 0.449 0.768 0.509 0.288 -0.308 0.530 0.804 0.435 0.452 0.605 0.638 0.412 -0.362 0.538 0.520 0.744 0.531 1
Pr 0.378 0.601 0.514 0.255 0.762 -0.412 0.996 0.274 0.063 0.870 0.178 0.861 0.625 -0.244 0.892 0.994 0.322 0.997 0.528 1
Rb 0.444 0.581 0.517 0.327 0.787 -0.450 0.882 0.202 -0.009 0.943 0.163 0.710 0.571 -0.187 0.978 0.893 0.378 0.873 0.530 0.884 1
S 0.934 0.240 0.859 0.420 0.233 -0.188 0.268 0.740 0.010 0.130 0.712 0.296 0.163 -0.109 0.264 0.238 0.842 0.253 0.722 0.254 0.259 1
Sb 0.638 0.427 0.688 0.420 0.534 -0.551 0.372 0.370 -0.260 0.272 0.683 0.184 0.364 0.085 0.403 0.306 0.419 0.334 0.379 0.347 0.377 0.611 1
Se 0.749 0.096 0.606 0.411 0.068 -0.114 0.227 0.563 0.091 0.081 0.585 0.284 0.006 -0.238 0.206 0.213 0.659 0.219 0.604 0.222 0.210 0.733 0.496 1
Sm 0.366 0.646 0.523 0.276 0.777 -0.437 0.960 0.343 0.092 0.840 0.209 0.887 0.681 -0.201 0.864 0.952 0.290 0.967 0.534 0.964 0.839 0.271 0.342 0.250 1
Th 0.394 0.626 0.508 0.272 0.869 -0.503 0.952 0.187 -0.034 0.899 0.163 0.766 0.638 -0.096 0.914 0.948 0.306 0.939 0.460 0.949 0.924 0.254 0.422 0.178 0.922 1
Tl 0.453 0.633 0.565 0.352 0.881 -0.564 0.879 0.198 -0.042 0.917 0.236 0.683 0.617 -0.049 0.949 0.871 0.353 0.864 0.500 0.874 0.964 0.305 0.495 0.201 0.835 0.950 1
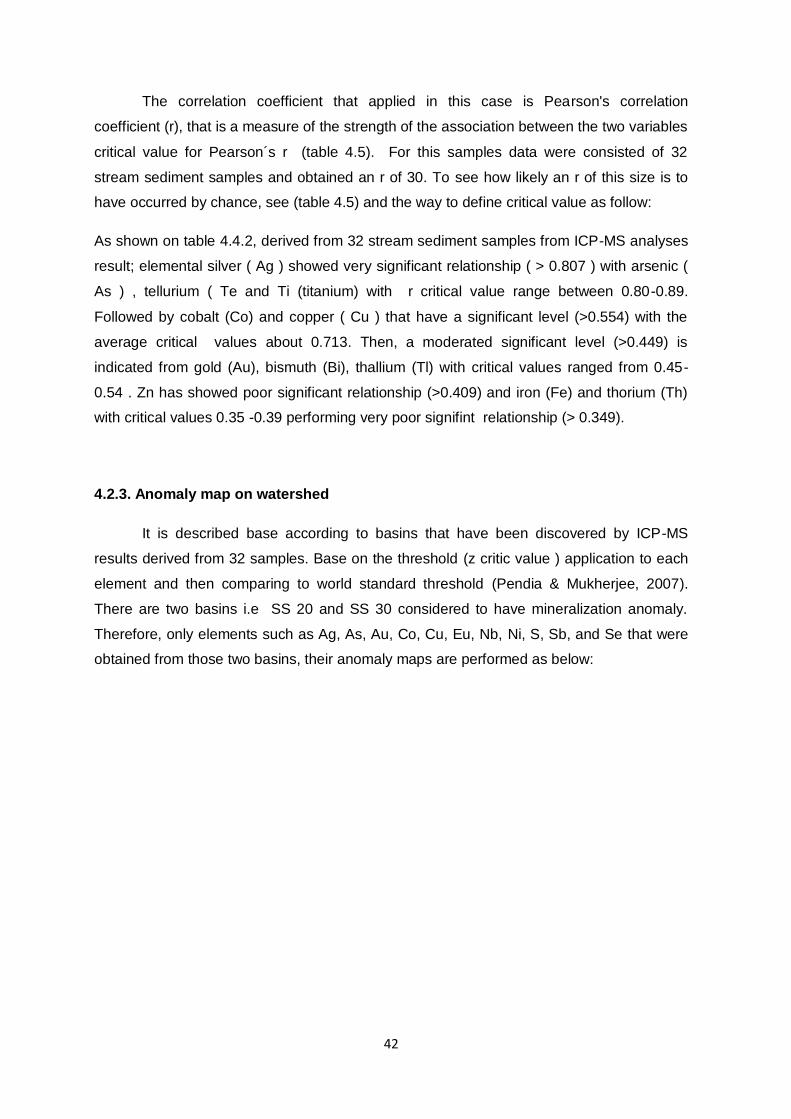
42
The correlation coefficient that applied in this case is Pearson's correlation
coefficient (r), that is a measure of the strength of the association between the two variables
critical value for Pearson´s r (table 4.5). For this samples data were consisted of 32
stream sediment samples and obtained an r of 30. To see how likely an r of this size is to
have occurred by chance, see (table 4.5) and the way to define critical value as follow:
As shown on table 4.4.2, derived from 32 stream sediment samples from ICP-MS analyses
result; elemental silver ( Ag ) showed very significant relationship ( > 0.807 ) with arsenic (
As ) , tellurium ( Te and Ti (titanium) with r critical value range between 0.80-0.89.
Followed by cobalt (Co) and copper ( Cu ) that have a significant level (>0.554) with the
average critical values about 0.713. Then, a moderated significant level (>0.449) is
indicated from gold (Au), bismuth (Bi), thallium (Tl) with critical values ranged from 0.45-
0.54 . Zn has showed poor significant relationship (>0.409) and iron (Fe) and thorium (Th)
with critical values 0.35 -0.39 performing very poor signifint relationship (> 0.349).
4.2.3. Anomaly map on watershed
It is described base according to basins that have been discovered by ICP-MS
results derived from 32 samples. Base on the threshold (z critic value ) application to each
element and then comparing to world standard threshold (Pendia & Mukherjee, 2007).
There are two basins i.e SS 20 and SS 30 considered to have mineralization anomaly.
Therefore, only elements such as Ag, As, Au, Co, Cu, Eu, Nb, Ni, S, Sb, and Se that were
obtained from those two basins, their anomaly maps are performed as below:
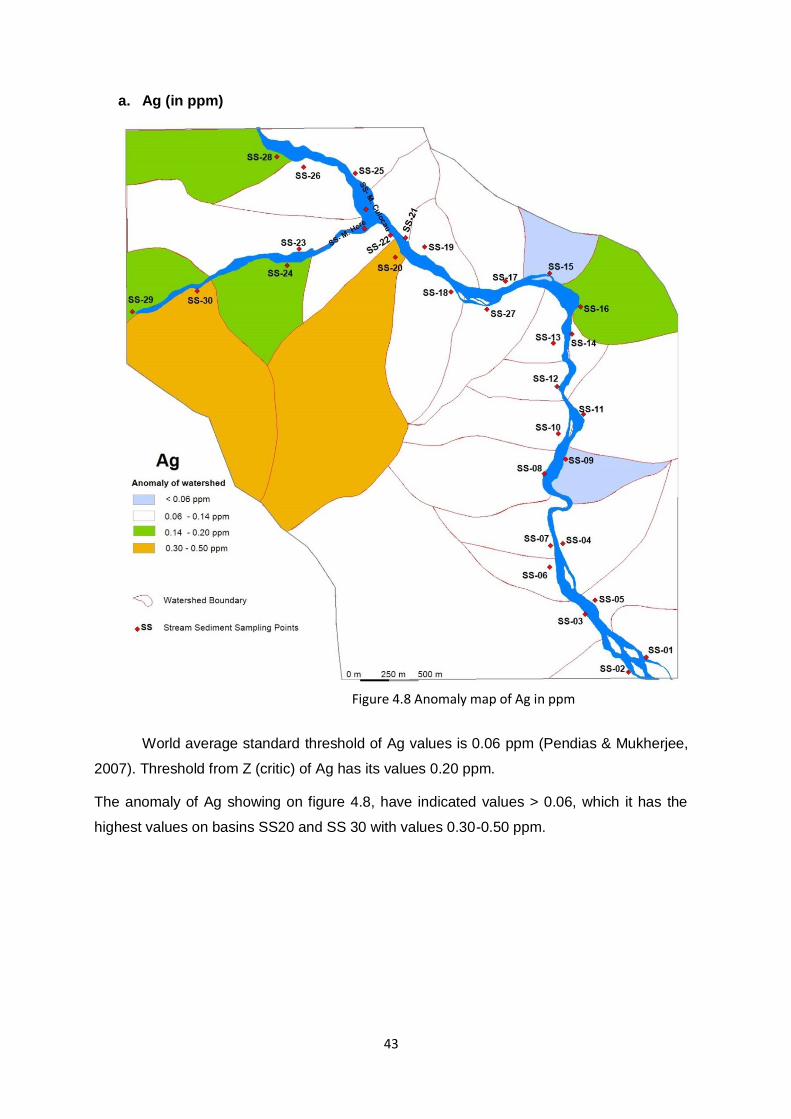
43
a. Ag (in ppm)
World average standard threshold of Ag values is 0.06 ppm (Pendias & Mukherjee,
2007). Threshold from Z (critic) of Ag has its values 0.20 ppm.
The anomaly of Ag showing on figure 4.8, have indicated values > 0.06, which it has the
highest values on basins SS20 and SS 30 with values 0.30-0.50 ppm.
Figure 4.8 Anomaly map of Ag in ppm

44
b. As (in ppm)
World average standard threshold of As values is 1.8 ppm (Pendias & Mukherjee, 2007).
Threshold from Z (critic) of As has its values 50.77 ppm. The anomaly of As showing on
figure 4.9, have indicated values > 1.8, which it has the highest values on basin SS 30 with
values 50.77-70.67 ppm, that can be considered as mineral anomaly.
Figure 4.9 Anomaly map of As in ppm
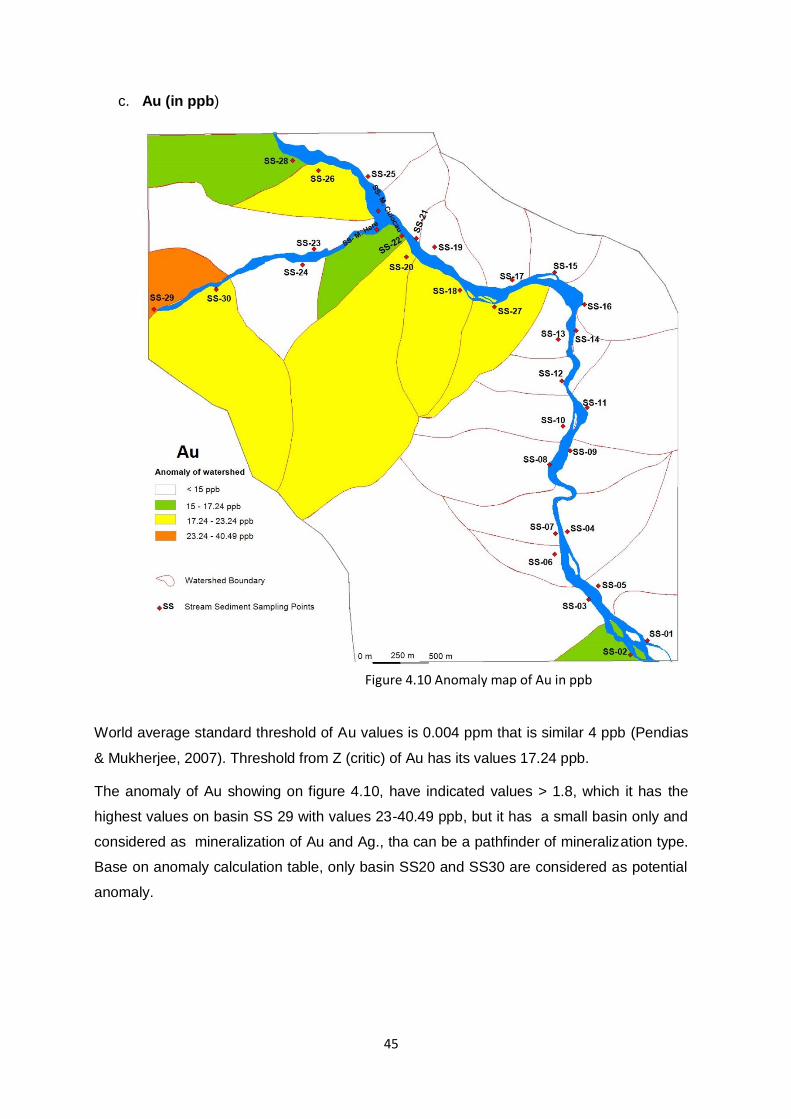
45
c. Au (in ppb)
World average standard threshold of Au values is 0.004 ppm that is similar 4 ppb (Pendias
& Mukherjee, 2007). Threshold from Z (critic) of Au has its values 17.24 ppb.
The anomaly of Au showing on figure 4.10, have indicated values > 1.8, which it has the
highest values on basin SS 29 with values 23-40.49 ppb, but it has a small basin only and
considered as mineralization of Au and Ag., tha can be a pathfinder of mineralization type.
Base on anomaly calculation table, only basin SS20 and SS30 are considered as potential
anomaly.
Figure 4.10 Anomaly map of Au in ppb

46
d. Co (in ppm)
World average standard threshold of Co values is 10 ppm (Pendias & Mukherjee, 2007).
Threshold from Z (critic) of Co has its values 41.76 ppm.
Figure 4.11 Anomaly map of Co in ppm
47
e. Cu (in ppm)
World average standard threshold of Cu values is 55 ppm (Pendias & Mukherjee, 2007).
Threshold from Z (critic) of Cu has its values 130.27 ppm.
Figure 4.12 Anomaly map of Cu in ppm
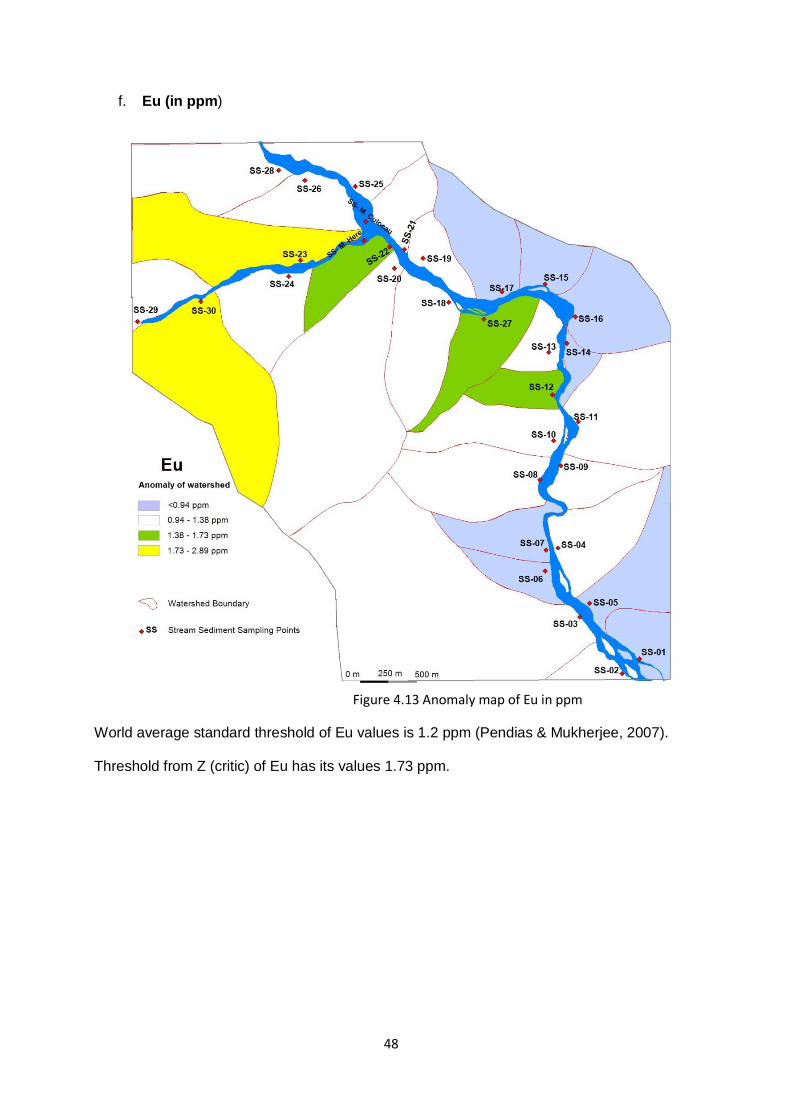
48
f. Eu (in ppm)
World average standard threshold of Eu values is 1.2 ppm (Pendias & Mukherjee, 2007).
Threshold from Z (critic) of Eu has its values 1.73 ppm.
Figure 4.13 Anomaly map of Eu in ppm

49
g. Ni (in ppm)
World average standard threshold of Ni values is 20 ppm (Pendias & Mukherjee, 2007).
Threshold from Z (critic) of Ni, has its values 153.65 ppm.
Figure 4.14 Anomaly map of Ni in ppm
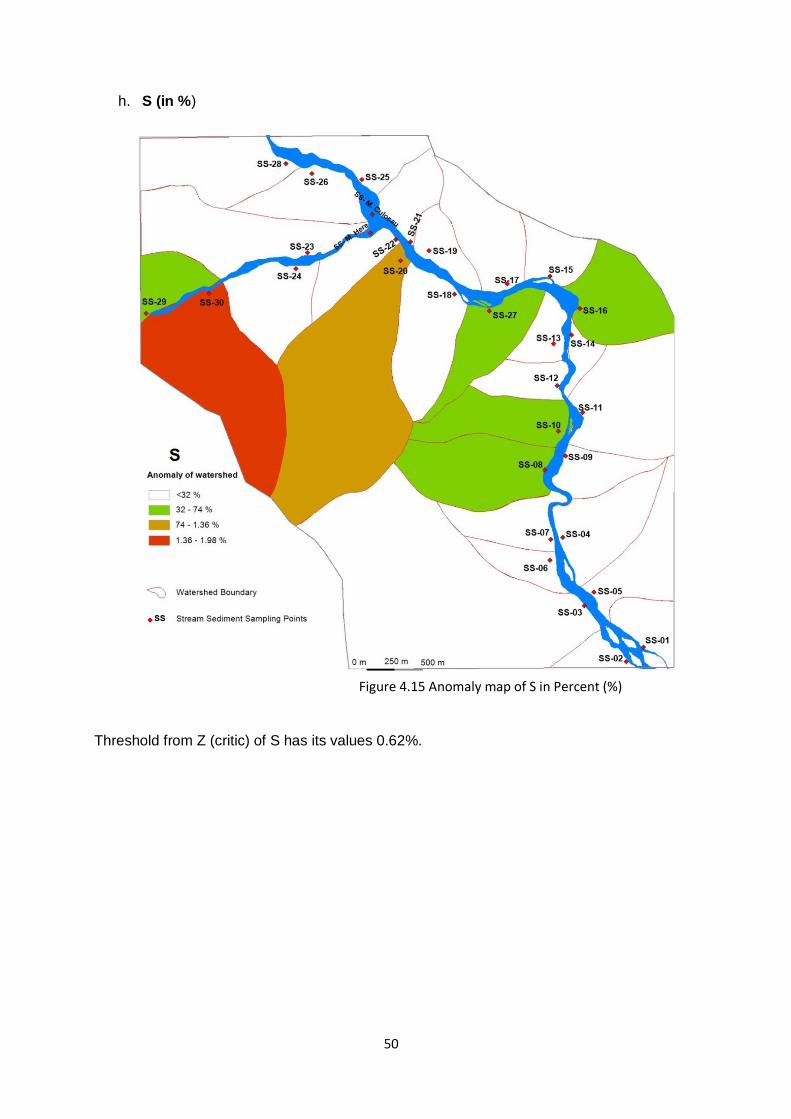
50
h. S (in %)
Threshold from Z (critic) of S has its values 0.62%.
Figure 4.15 Anomaly map of S in Percent (%)

51
i. Sb (in ppm)
World average standard threshold of Sb values is 0.2 ppm (Pendias & Mukherjee, 2007).
Threshold from Z (critic) of Sb has its values 1.84 ppm.
Figure 4.16 Anomaly map of Sb in ppm

52
j. Se (in ppm)
World average standard threshold of Se values is 0.02 ppm (Pendias & Mukherjee, 2007).
Threshold from Z (critic) of Se has its values 0.64 ppm.
Figure 4.17 Anomaly map of Se in ppm

53
Chapter IV Conclusions
Results obtained by these two methods i.e XRF and ICP-MS were slightly different,
but considering only the mean values obtained by the two processes of the 32
samples, we can observe the similarity of the mean values of some elements
obtained by ICP and XRF suach as example, the Fe, Cu, Pb, Zn and As content
are similar to those obtained by XRF (respectively 6.0%, 88.8ppm, 17.7ppm, 102.4
and 23.1ppm).
There have been two basins i.e SS 20 and SS 30 considered to have mineralization
anomaly, mostly for ores Ag, Au, Cu which associated with As, Co, Eu, Nb, Ni, S,
Sb, and Se.
The anomaly of basin SS 20 and SS 30 are likely considered as sulphide ore
deposit which have shown Ag, Au, and Cu in the watershed and some pathfinder
associated elements such As, S, Sb and Se are also found although Zn is not
presented.
Quartz veins occur the disseminated ores bearing of Ag, Au, and Cu with
probably black phyllite unit if reffered to mineralization on basin SS 20 & SS 30 (as
shown on lithology map).
Therefore, it is recommended that a detailed geological and geochemical study
could be carried out in areas upstream of SS 20 and SS30 basins that indicate
mineralization anomalous such sulphide ore deposit, perhaps vein of quartz vein
with gold bearing or others ores have been completely weathered and residual as
placer deposit during sedimentary processes.
54
References:
Charles , Audley ( 1968). The Geology of Portuguese Timor. Geol. Soc.Lond., Mem. 4, 76.
ESCAP, UN (2003). Atlas of Mineral Resources of The Escap Region.Volume 17. Geology
And Mineral Resources of Timor-Leste, UN New York.
Pratas, J.A. (2015). Stream Sediments Sampling. Manual Book.
Pendias, A.K-Mukherjee , A.B (2007). Trace Element From Soils to Human. Springer-
Verlag, Berlin Heidelberg
Standley, C.E., and Harris, R. (2009). Tectonic Evolution of Forearc Nappes of The Active
Banda Arc-Continent Collision: Origin, Age, Metamorphic History And Structure of The
Lolotoi Complex, East Timor. Tectonophysics, v. 479, no. 1–2.
Tate et al (2015). Australia going down under: Quantifying continental subduction during
arc-continent accretion in Timor-Leste.Geosphere: v11, no. 6.
Andrioti, Jose (2010). Interpretação de Dados de Prospecção Geoquímica Com Auxílio de
Estatística. Ministério de Minas e Energia Secretaria de Geologia, Mineração e
Transformação Mineral Serviço Geológico do Brasil - CPRM Diretoria de Relações
Institucionais e Desenvolvimento Superintendência Regional de Porto Alegre.
Sites Visit:
Laerd Statistics, Lund Research Ltd [online]. Perason´s Correlation using Stata. © 2018
[Viewed: 25 August 2019, 15.00]. Available from: https://statistics.laerd.com/stata-
tutorials/pearsons-correlation-using-stata.php.
University of the West of England, Bristol [online]. ©2019. Pearson´s Correlation Coefficient
[viewed: 16 August 2019]. Available from:
http://learntech.uwe.ac.uk/da/Default.aspx?pageid=1442.
Radboud University (2019). Faculty of Sciences.General Instrumentation. [Viewed: 7
September 2019]. Available from: https://www.ru.nl/science/gi/facilities-activities/elemental-
analysis/icp-oes/
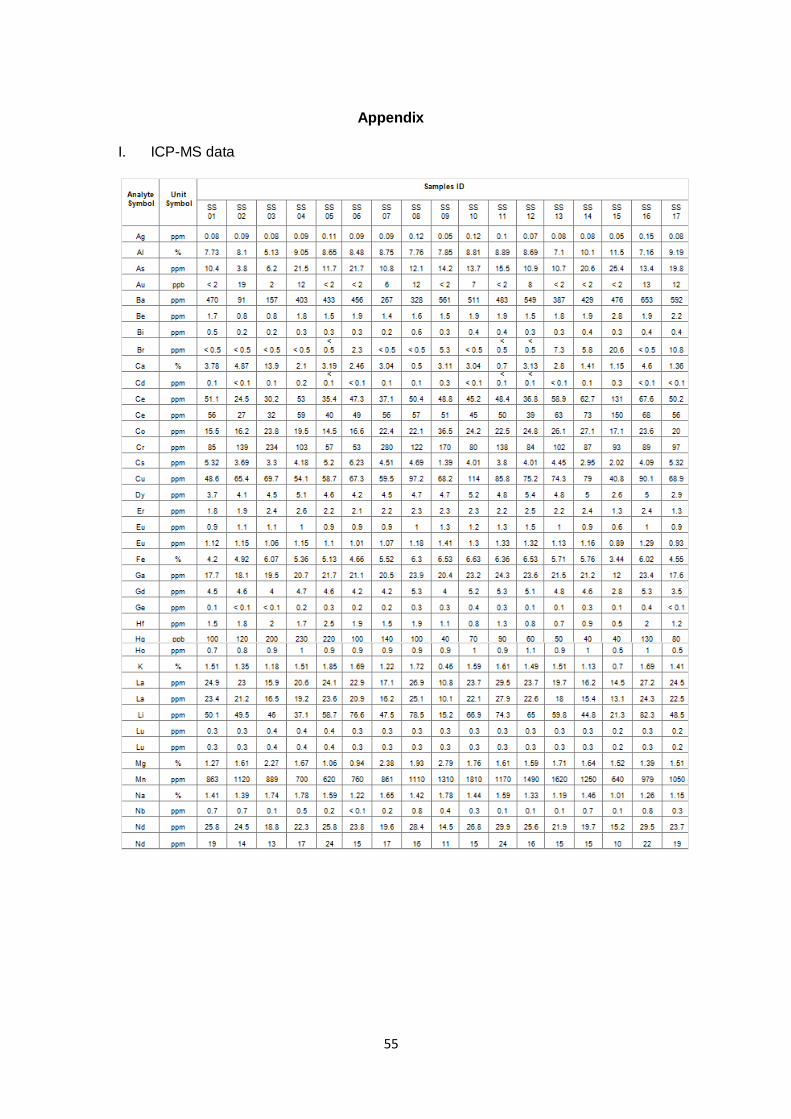
55
Appendix
I. ICP-MS data
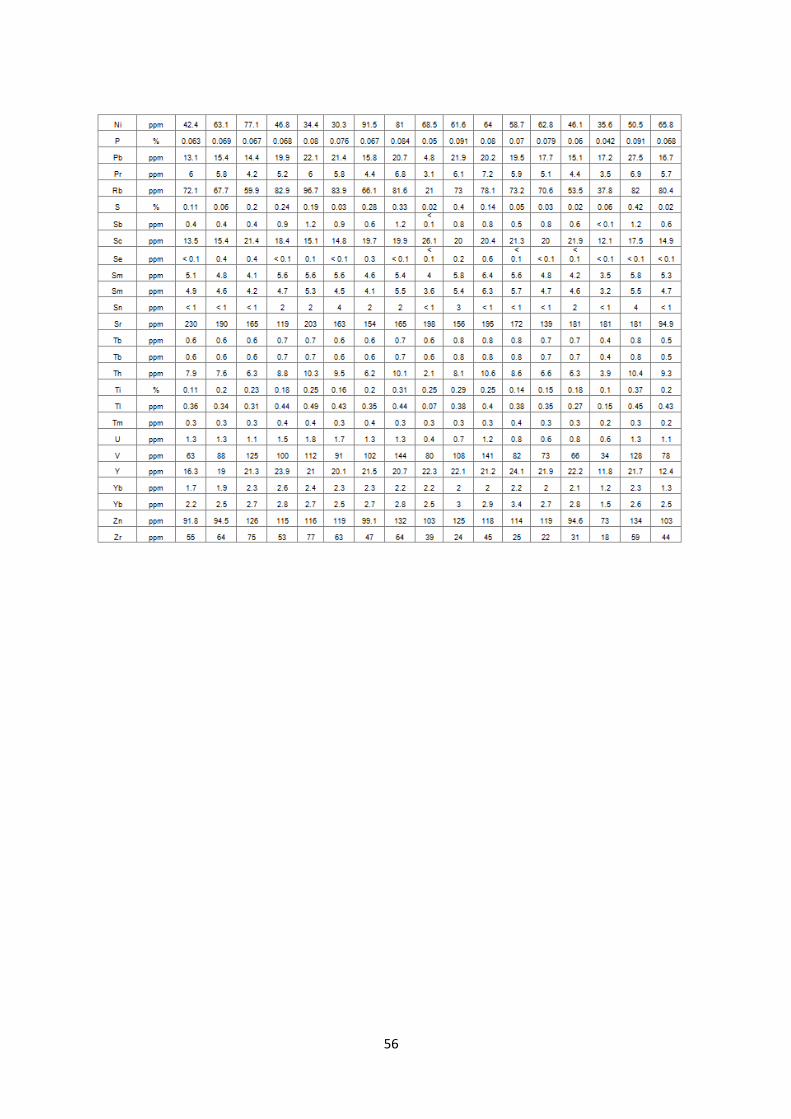
56
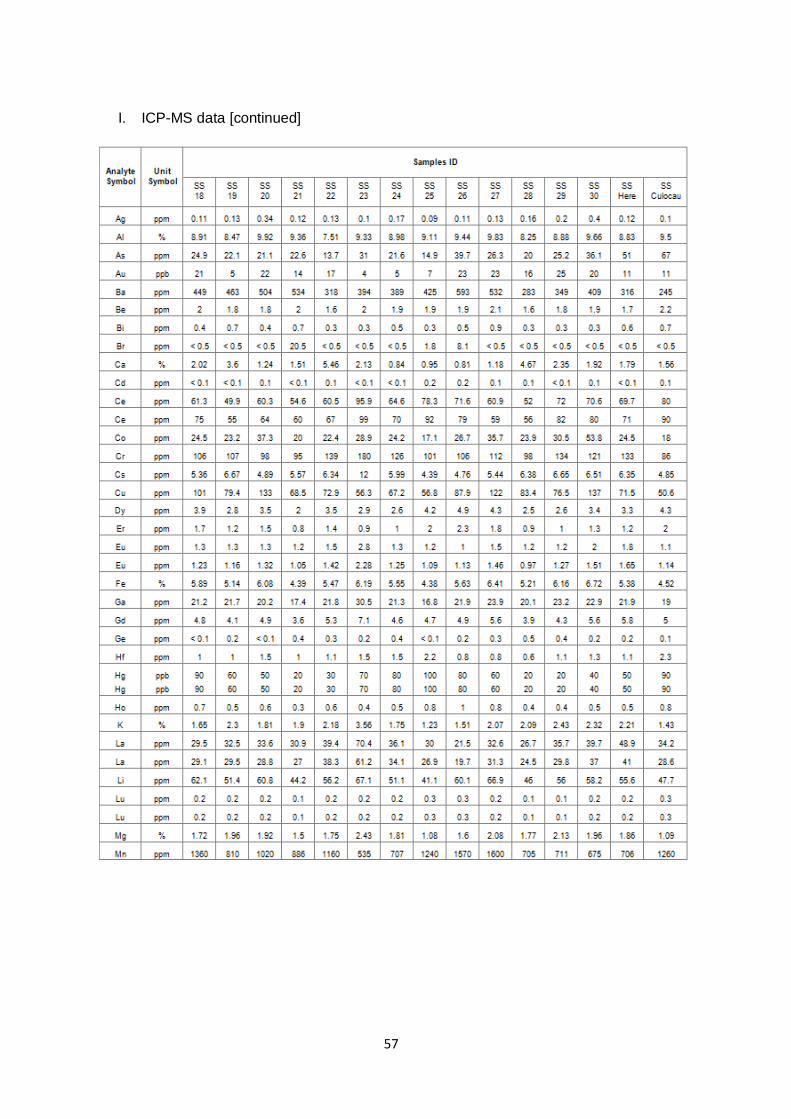
57
I. ICP-MS data [continued]
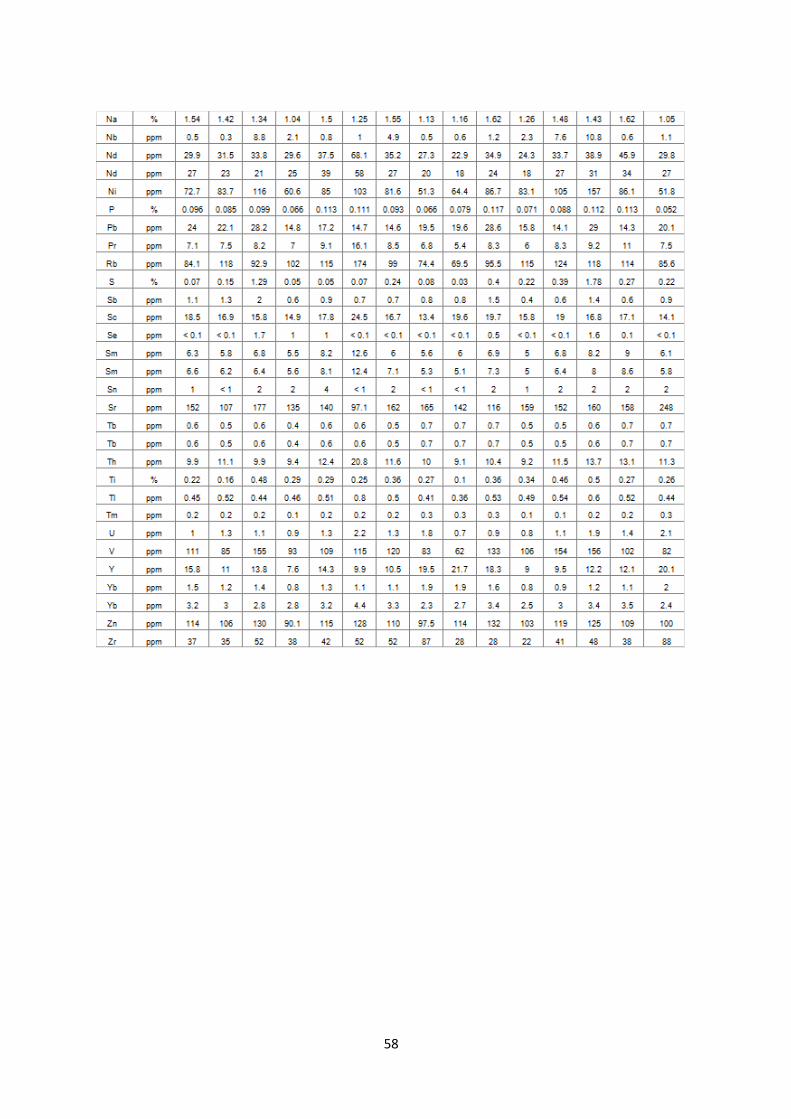
58
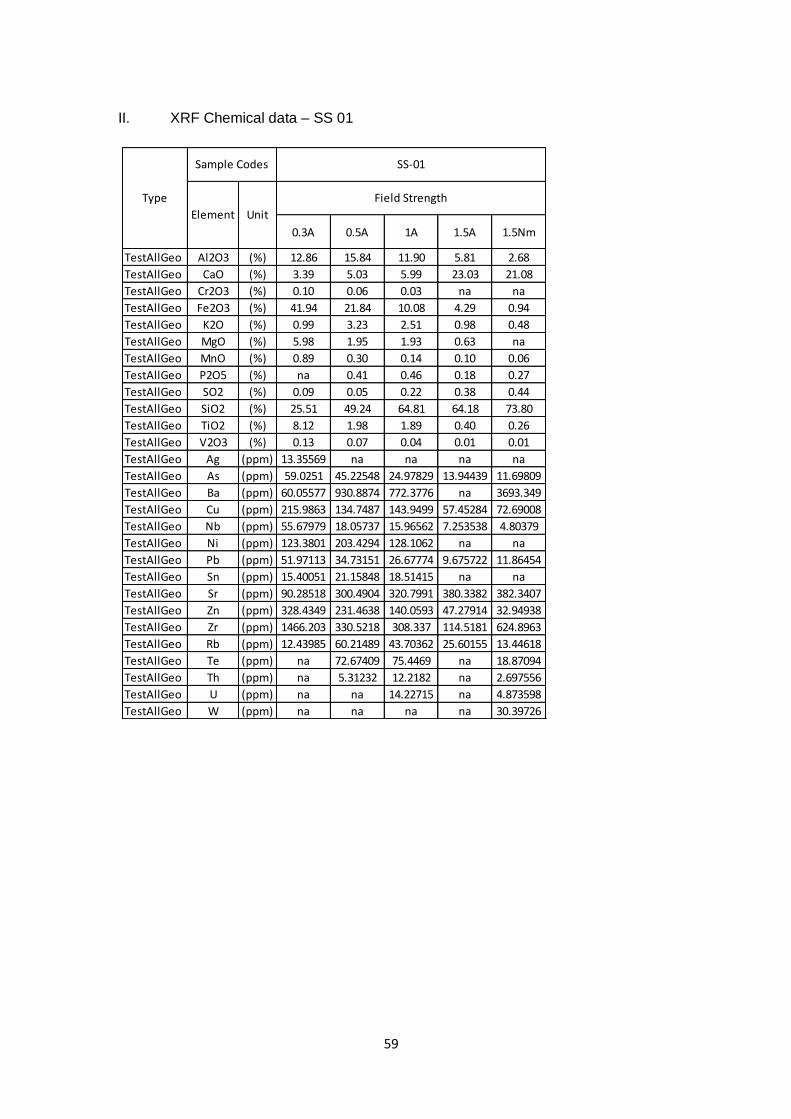
59
II. XRF Chemical data – SS 01
0.3A 0.5A 1A 1.5A 1.5Nm
TestAllGeo Al2O3 (%) 12.86 15.84 11.90 5.81 2.68
TestAllGeo CaO (%) 3.39 5.03 5.99 23.03 21.08
TestAllGeo Cr2O3 (%) 0.10 0.06 0.03 na na
TestAllGeo Fe2O3 (%) 41.94 21.84 10.08 4.29 0.94
TestAllGeo K2O (%) 0.99 3.23 2.51 0.98 0.48
TestAllGeo MgO (%) 5.98 1.95 1.93 0.63 na
TestAllGeo MnO (%) 0.89 0.30 0.14 0.10 0.06
TestAllGeo P2O5 (%) na 0.41 0.46 0.18 0.27
TestAllGeo SO2 (%) 0.09 0.05 0.22 0.38 0.44
TestAllGeo SiO2 (%) 25.51 49.24 64.81 64.18 73.80
TestAllGeo TiO2 (%) 8.12 1.98 1.89 0.40 0.26
TestAllGeo V2O3 (%) 0.13 0.07 0.04 0.01 0.01
TestAllGeo Ag (ppm) 13.35569 na na na na
TestAllGeo As (ppm) 59.0251 45.22548 24.97829 13.94439 11.69809
TestAllGeo Ba (ppm) 60.05577 930.8874 772.3776 na 3693.349
TestAllGeo Cu (ppm) 215.9863 134.7487 143.9499 57.45284 72.69008
TestAllGeo Nb (ppm) 55.67979 18.05737 15.96562 7.253538 4.80379
TestAllGeo Ni (ppm) 123.3801 203.4294 128.1062 na na
TestAllGeo Pb (ppm) 51.97113 34.73151 26.67774 9.675722 11.86454
TestAllGeo Sn (ppm) 15.40051 21.15848 18.51415 na na
TestAllGeo Sr (ppm) 90.28518 300.4904 320.7991 380.3382 382.3407
TestAllGeo Zn (ppm) 328.4349 231.4638 140.0593 47.27914 32.94938
TestAllGeo Zr (ppm) 1466.203 330.5218 308.337 114.5181 624.8963
TestAllGeo Rb (ppm) 12.43985 60.21489 43.70362 25.60155 13.44618
TestAllGeo Te (ppm) na 72.67409 75.4469 na 18.87094
TestAllGeo Th (ppm) na 5.31232 12.2182 na 2.697556
TestAllGeo U (ppm) na na 14.22715 na 4.873598
TestAllGeo W (ppm) na na na na 30.39726
Sample Codes
Type Field Strength
UnitElement
SS-01
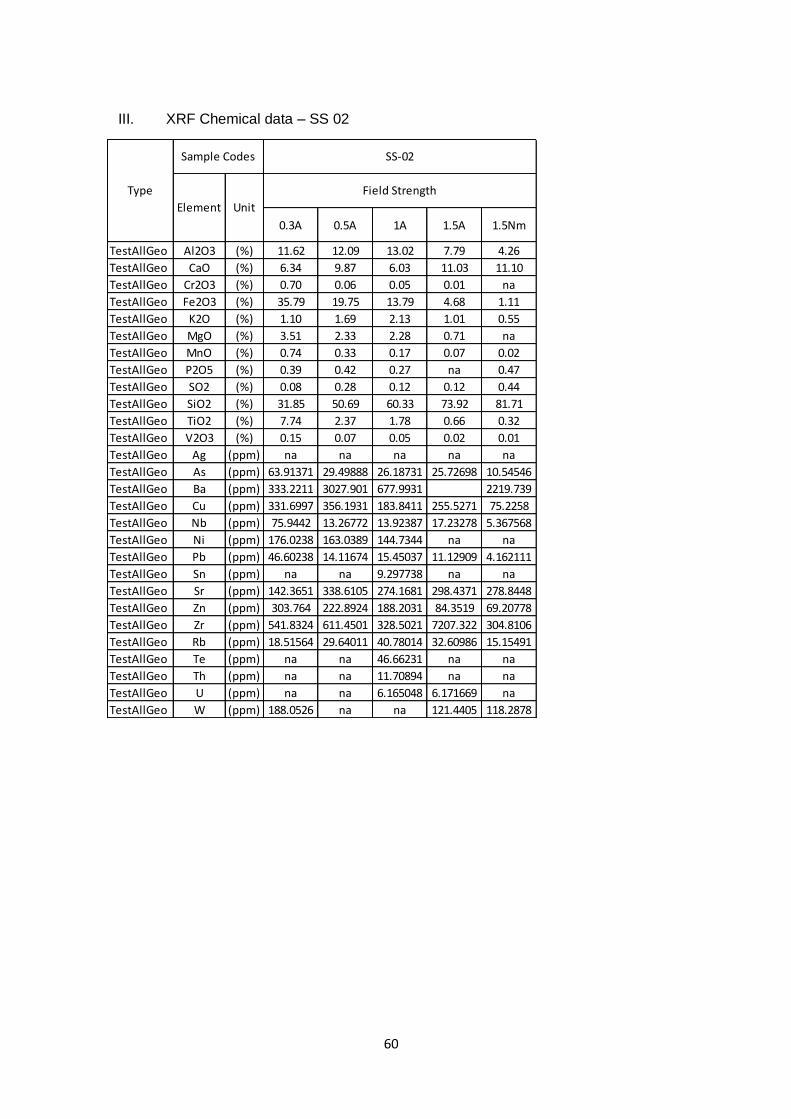
60
III. XRF Chemical data – SS 02
0.3A 0.5A 1A 1.5A 1.5Nm
TestAllGeo Al2O3 (%) 11.62 12.09 13.02 7.79 4.26
TestAllGeo CaO (%) 6.34 9.87 6.03 11.03 11.10
TestAllGeo Cr2O3 (%) 0.70 0.06 0.05 0.01 na
TestAllGeo Fe2O3 (%) 35.79 19.75 13.79 4.68 1.11
TestAllGeo K2O (%) 1.10 1.69 2.13 1.01 0.55
TestAllGeo MgO (%) 3.51 2.33 2.28 0.71 na
TestAllGeo MnO (%) 0.74 0.33 0.17 0.07 0.02
TestAllGeo P2O5 (%) 0.39 0.42 0.27 na 0.47
TestAllGeo SO2 (%) 0.08 0.28 0.12 0.12 0.44
TestAllGeo SiO2 (%) 31.85 50.69 60.33 73.92 81.71
TestAllGeo TiO2 (%) 7.74 2.37 1.78 0.66 0.32
TestAllGeo V2O3 (%) 0.15 0.07 0.05 0.02 0.01
TestAllGeo Ag (ppm) na na na na na
TestAllGeo As (ppm) 63.91371 29.49888 26.18731 25.72698 10.54546
TestAllGeo Ba (ppm) 333.2211 3027.901 677.9931 2219.739
TestAllGeo Cu (ppm) 331.6997 356.1931 183.8411 255.5271 75.2258
TestAllGeo Nb (ppm) 75.9442 13.26772 13.92387 17.23278 5.367568
TestAllGeo Ni (ppm) 176.0238 163.0389 144.7344 na na
TestAllGeo Pb (ppm) 46.60238 14.11674 15.45037 11.12909 4.162111
TestAllGeo Sn (ppm) na na 9.297738 na na
TestAllGeo Sr (ppm) 142.3651 338.6105 274.1681 298.4371 278.8448
TestAllGeo Zn (ppm) 303.764 222.8924 188.2031 84.3519 69.20778
TestAllGeo Zr (ppm) 541.8324 611.4501 328.5021 7207.322 304.8106
TestAllGeo Rb (ppm) 18.51564 29.64011 40.78014 32.60986 15.15491
TestAllGeo Te (ppm) na na 46.66231 na na
TestAllGeo Th (ppm) na na 11.70894 na na
TestAllGeo U (ppm) na na 6.165048 6.171669 na
TestAllGeo W (ppm) 188.0526 na na 121.4405 118.2878
Element Unit
Field StrengthType
Sample Codes SS-02
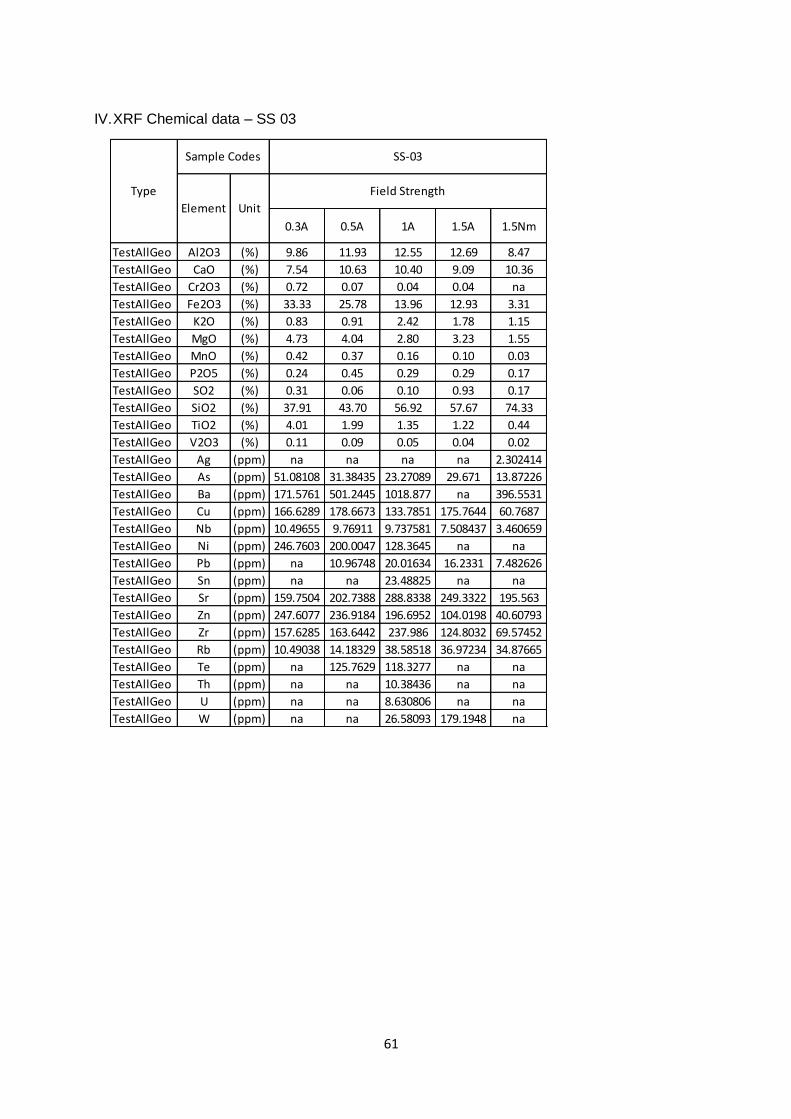
61
IV. XRF Chemical data – SS 03
0.3A 0.5A 1A 1.5A 1.5Nm
TestAllGeo Al2O3 (%) 9.86 11.93 12.55 12.69 8.47
TestAllGeo CaO (%) 7.54 10.63 10.40 9.09 10.36
TestAllGeo Cr2O3 (%) 0.72 0.07 0.04 0.04 na
TestAllGeo Fe2O3 (%) 33.33 25.78 13.96 12.93 3.31
TestAllGeo K2O (%) 0.83 0.91 2.42 1.78 1.15
TestAllGeo MgO (%) 4.73 4.04 2.80 3.23 1.55
TestAllGeo MnO (%) 0.42 0.37 0.16 0.10 0.03
TestAllGeo P2O5 (%) 0.24 0.45 0.29 0.29 0.17
TestAllGeo SO2 (%) 0.31 0.06 0.10 0.93 0.17
TestAllGeo SiO2 (%) 37.91 43.70 56.92 57.67 74.33
TestAllGeo TiO2 (%) 4.01 1.99 1.35 1.22 0.44
TestAllGeo V2O3 (%) 0.11 0.09 0.05 0.04 0.02
TestAllGeo Ag (ppm) na na na na 2.302414
TestAllGeo As (ppm) 51.08108 31.38435 23.27089 29.671 13.87226
TestAllGeo Ba (ppm) 171.5761 501.2445 1018.877 na 396.5531
TestAllGeo Cu (ppm) 166.6289 178.6673 133.7851 175.7644 60.7687
TestAllGeo Nb (ppm) 10.49655 9.76911 9.737581 7.508437 3.460659
TestAllGeo Ni (ppm) 246.7603 200.0047 128.3645 na na
TestAllGeo Pb (ppm) na 10.96748 20.01634 16.2331 7.482626
TestAllGeo Sn (ppm) na na 23.48825 na na
TestAllGeo Sr (ppm) 159.7504 202.7388 288.8338 249.3322 195.563
TestAllGeo Zn (ppm) 247.6077 236.9184 196.6952 104.0198 40.60793
TestAllGeo Zr (ppm) 157.6285 163.6442 237.986 124.8032 69.57452
TestAllGeo Rb (ppm) 10.49038 14.18329 38.58518 36.97234 34.87665
TestAllGeo Te (ppm) na 125.7629 118.3277 na na
TestAllGeo Th (ppm) na na 10.38436 na na
TestAllGeo U (ppm) na na 8.630806 na na
TestAllGeo W (ppm) na na 26.58093 179.1948 na
Element Unit
Field StrengthType
Sample Codes SS-03
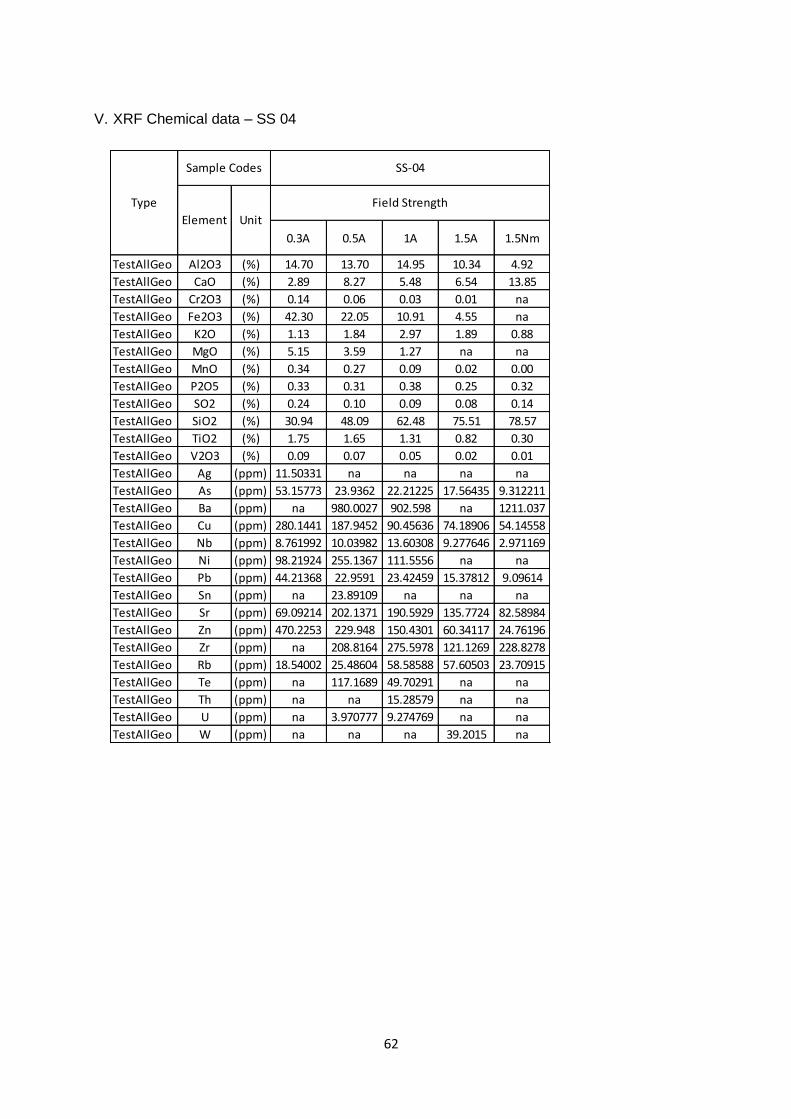
62
V. XRF Chemical data – SS 04
0.3A 0.5A 1A 1.5A 1.5Nm
TestAllGeo Al2O3 (%) 14.70 13.70 14.95 10.34 4.92
TestAllGeo CaO (%) 2.89 8.27 5.48 6.54 13.85
TestAllGeo Cr2O3 (%) 0.14 0.06 0.03 0.01 na
TestAllGeo Fe2O3 (%) 42.30 22.05 10.91 4.55 na
TestAllGeo K2O (%) 1.13 1.84 2.97 1.89 0.88
TestAllGeo MgO (%) 5.15 3.59 1.27 na na
TestAllGeo MnO (%) 0.34 0.27 0.09 0.02 0.00
TestAllGeo P2O5 (%) 0.33 0.31 0.38 0.25 0.32
TestAllGeo SO2 (%) 0.24 0.10 0.09 0.08 0.14
TestAllGeo SiO2 (%) 30.94 48.09 62.48 75.51 78.57
TestAllGeo TiO2 (%) 1.75 1.65 1.31 0.82 0.30
TestAllGeo V2O3 (%) 0.09 0.07 0.05 0.02 0.01
TestAllGeo Ag (ppm) 11.50331 na na na na
TestAllGeo As (ppm) 53.15773 23.9362 22.21225 17.56435 9.312211
TestAllGeo Ba (ppm) na 980.0027 902.598 na 1211.037
TestAllGeo Cu (ppm) 280.1441 187.9452 90.45636 74.18906 54.14558
TestAllGeo Nb (ppm) 8.761992 10.03982 13.60308 9.277646 2.971169
TestAllGeo Ni (ppm) 98.21924 255.1367 111.5556 na na
TestAllGeo Pb (ppm) 44.21368 22.9591 23.42459 15.37812 9.09614
TestAllGeo Sn (ppm) na 23.89109 na na na
TestAllGeo Sr (ppm) 69.09214 202.1371 190.5929 135.7724 82.58984
TestAllGeo Zn (ppm) 470.2253 229.948 150.4301 60.34117 24.76196
TestAllGeo Zr (ppm) na 208.8164 275.5978 121.1269 228.8278
TestAllGeo Rb (ppm) 18.54002 25.48604 58.58588 57.60503 23.70915
TestAllGeo Te (ppm) na 117.1689 49.70291 na na
TestAllGeo Th (ppm) na na 15.28579 na na
TestAllGeo U (ppm) na 3.970777 9.274769 na na
TestAllGeo W (ppm) na na na 39.2015 na
Element Unit
Field StrengthType
Sample Codes SS-04
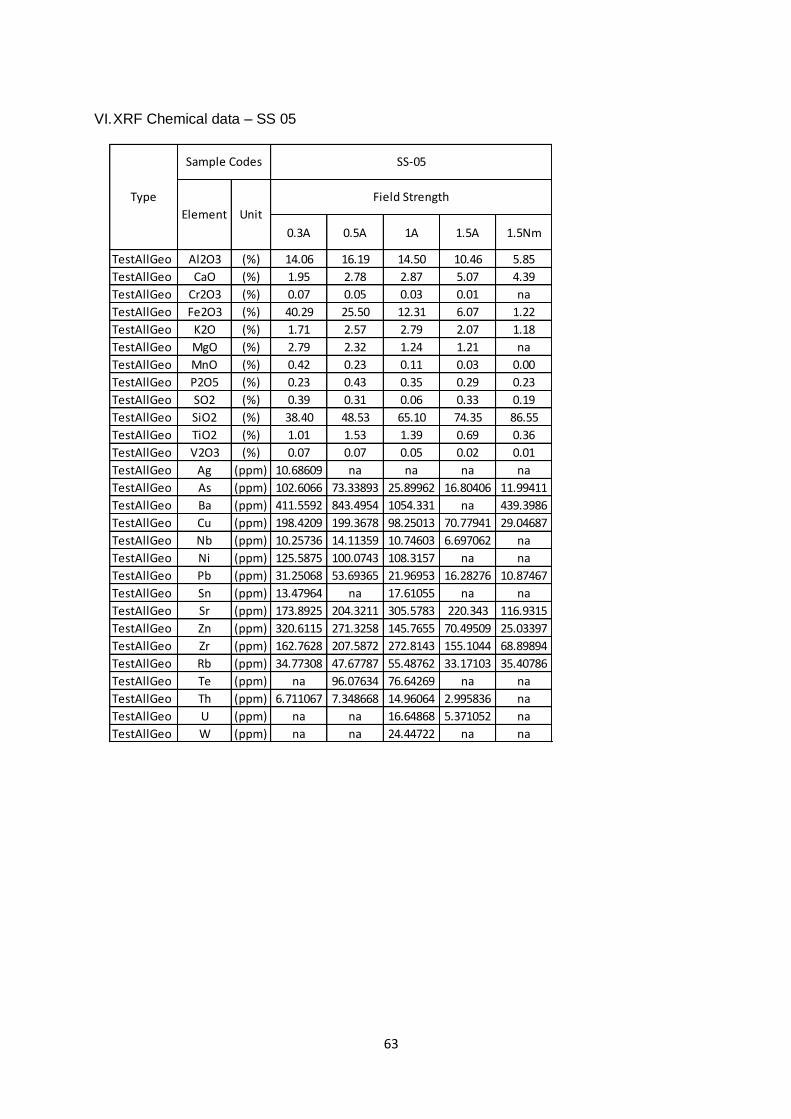
63
VI. XRF Chemical data – SS 05
0.3A 0.5A 1A 1.5A 1.5Nm
TestAllGeo Al2O3 (%) 14.06 16.19 14.50 10.46 5.85
TestAllGeo CaO (%) 1.95 2.78 2.87 5.07 4.39
TestAllGeo Cr2O3 (%) 0.07 0.05 0.03 0.01 na
TestAllGeo Fe2O3 (%) 40.29 25.50 12.31 6.07 1.22
TestAllGeo K2O (%) 1.71 2.57 2.79 2.07 1.18
TestAllGeo MgO (%) 2.79 2.32 1.24 1.21 na
TestAllGeo MnO (%) 0.42 0.23 0.11 0.03 0.00
TestAllGeo P2O5 (%) 0.23 0.43 0.35 0.29 0.23
TestAllGeo SO2 (%) 0.39 0.31 0.06 0.33 0.19
TestAllGeo SiO2 (%) 38.40 48.53 65.10 74.35 86.55
TestAllGeo TiO2 (%) 1.01 1.53 1.39 0.69 0.36
TestAllGeo V2O3 (%) 0.07 0.07 0.05 0.02 0.01
TestAllGeo Ag (ppm) 10.68609 na na na na
TestAllGeo As (ppm) 102.6066 73.33893 25.89962 16.80406 11.99411
TestAllGeo Ba (ppm) 411.5592 843.4954 1054.331 na 439.3986
TestAllGeo Cu (ppm) 198.4209 199.3678 98.25013 70.77941 29.04687
TestAllGeo Nb (ppm) 10.25736 14.11359 10.74603 6.697062 na
TestAllGeo Ni (ppm) 125.5875 100.0743 108.3157 na na
TestAllGeo Pb (ppm) 31.25068 53.69365 21.96953 16.28276 10.87467
TestAllGeo Sn (ppm) 13.47964 na 17.61055 na na
TestAllGeo Sr (ppm) 173.8925 204.3211 305.5783 220.343 116.9315
TestAllGeo Zn (ppm) 320.6115 271.3258 145.7655 70.49509 25.03397
TestAllGeo Zr (ppm) 162.7628 207.5872 272.8143 155.1044 68.89894
TestAllGeo Rb (ppm) 34.77308 47.67787 55.48762 33.17103 35.40786
TestAllGeo Te (ppm) na 96.07634 76.64269 na na
TestAllGeo Th (ppm) 6.711067 7.348668 14.96064 2.995836 na
TestAllGeo U (ppm) na na 16.64868 5.371052 na
TestAllGeo W (ppm) na na 24.44722 na na
Field Strength
Element Unit
SS-05
Type
Sample Codes
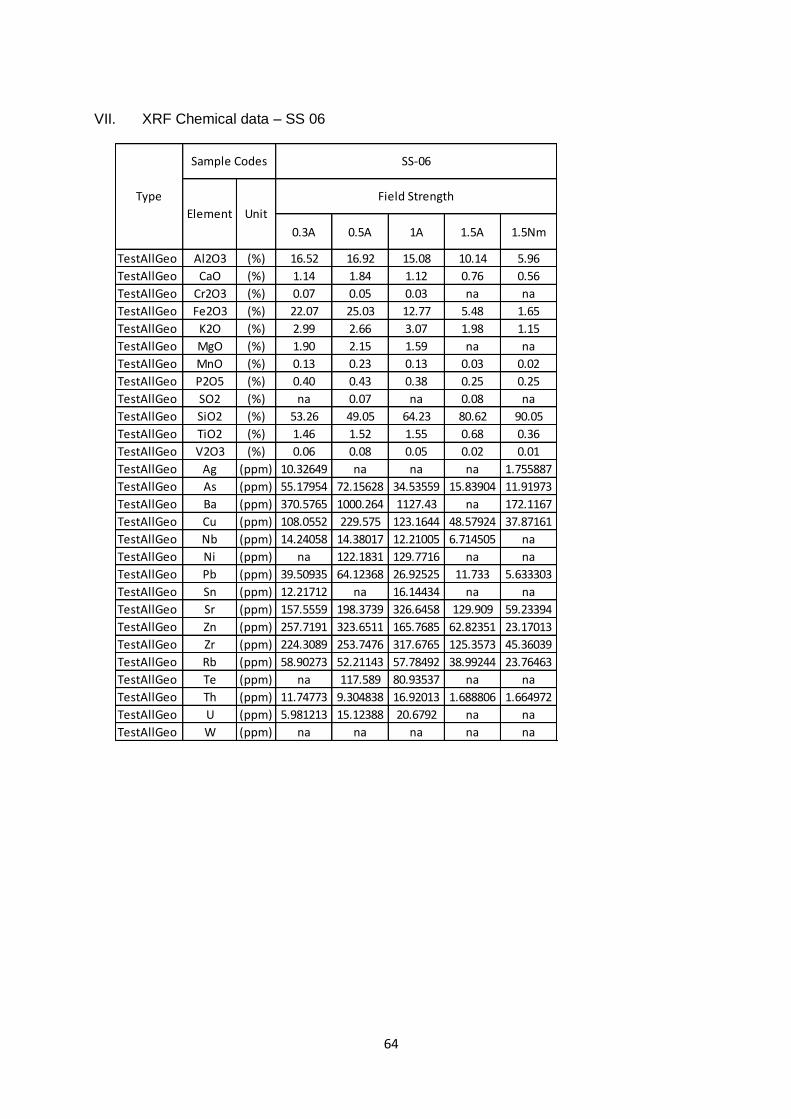
64
VII. XRF Chemical data – SS 06
0.3A 0.5A 1A 1.5A 1.5Nm
TestAllGeo Al2O3 (%) 16.52 16.92 15.08 10.14 5.96
TestAllGeo CaO (%) 1.14 1.84 1.12 0.76 0.56
TestAllGeo Cr2O3 (%) 0.07 0.05 0.03 na na
TestAllGeo Fe2O3 (%) 22.07 25.03 12.77 5.48 1.65
TestAllGeo K2O (%) 2.99 2.66 3.07 1.98 1.15
TestAllGeo MgO (%) 1.90 2.15 1.59 na na
TestAllGeo MnO (%) 0.13 0.23 0.13 0.03 0.02
TestAllGeo P2O5 (%) 0.40 0.43 0.38 0.25 0.25
TestAllGeo SO2 (%) na 0.07 na 0.08 na
TestAllGeo SiO2 (%) 53.26 49.05 64.23 80.62 90.05
TestAllGeo TiO2 (%) 1.46 1.52 1.55 0.68 0.36
TestAllGeo V2O3 (%) 0.06 0.08 0.05 0.02 0.01
TestAllGeo Ag (ppm) 10.32649 na na na 1.755887
TestAllGeo As (ppm) 55.17954 72.15628 34.53559 15.83904 11.91973
TestAllGeo Ba (ppm) 370.5765 1000.264 1127.43 na 172.1167
TestAllGeo Cu (ppm) 108.0552 229.575 123.1644 48.57924 37.87161
TestAllGeo Nb (ppm) 14.24058 14.38017 12.21005 6.714505 na
TestAllGeo Ni (ppm) na 122.1831 129.7716 na na
TestAllGeo Pb (ppm) 39.50935 64.12368 26.92525 11.733 5.633303
TestAllGeo Sn (ppm) 12.21712 na 16.14434 na na
TestAllGeo Sr (ppm) 157.5559 198.3739 326.6458 129.909 59.23394
TestAllGeo Zn (ppm) 257.7191 323.6511 165.7685 62.82351 23.17013
TestAllGeo Zr (ppm) 224.3089 253.7476 317.6765 125.3573 45.36039
TestAllGeo Rb (ppm) 58.90273 52.21143 57.78492 38.99244 23.76463
TestAllGeo Te (ppm) na 117.589 80.93537 na na
TestAllGeo Th (ppm) 11.74773 9.304838 16.92013 1.688806 1.664972
TestAllGeo U (ppm) 5.981213 15.12388 20.6792 na na
TestAllGeo W (ppm) na na na na na
Field Strength
Element Unit
SS-06
Type
Sample Codes

65
VIII. XRF Chemical data – SS 07
0.3A 0.5A 1A 1.5A 1.5Nm
TestAllGeo Al2O3 (%) 9.59 12.30 14.39 10.49 6.31
TestAllGeo CaO (%) 5.89 9.28 5.44 11.75 12.21
TestAllGeo Cr2O3 (%) 2.36 0.09 0.03 0.02 na
TestAllGeo Fe2O3 (%) 34.17 22.45 12.81 5.78 1.33
TestAllGeo K2O (%) 0.88 1.62 2.71 1.31 0.90
TestAllGeo MgO (%) 7.14 3.98 1.85 1.66 na
TestAllGeo MnO (%) 0.55 0.27 0.09 0.04 0.00
TestAllGeo P2O5 (%) 0.23 0.29 0.31 0.13 0.15
TestAllGeo SO2 (%) 0.18 0.19 0.33 0.47 0.24
TestAllGeo SiO2 (%) 32.21 47.43 60.93 67.79 78.63
TestAllGeo TiO2 (%) 6.63 2.02 1.06 0.58 0.21
TestAllGeo V2O3 (%) 0.15 0.08 0.04 0.02 0.01
TestAllGeo Ag (ppm) 8.406116 3.762463 na na na
TestAllGeo As (ppm) 38.4875 30.30525 26.43864 13.37401 9.822547
TestAllGeo Ba (ppm) 110.7803 194.5648 na na 1080.584
TestAllGeo Cu (ppm) 153.7122 151.903 97.5614 60.88212 100.808
TestAllGeo Nb (ppm) 17.57874 12.34104 12.44093 8.116478 3.738946
TestAllGeo Ni (ppm) 753.1999 167.0697 na na na
TestAllGeo Pb (ppm) 17.96125 17.4083 15.55755 8.433956 9.5304
TestAllGeo Sn (ppm) 11.73445 11.55898 na na na
TestAllGeo Sr (ppm) 64.30859 321.7039 252.3926 201.4996 132.3316
TestAllGeo Zn (ppm) 412.4345 192.1007 125.7364 50.35198 54.5863
TestAllGeo Zr (ppm) 125.5581 235.5563 210.9748 84.84188 38.4518
TestAllGeo Rb (ppm) 14.75559 36.6932 43.91951 48.58065 22.71484
TestAllGeo Te (ppm) na na na na na
TestAllGeo Th (ppm) na na 3.668383 na na
TestAllGeo U (ppm) na na na na na
TestAllGeo W (ppm) 50.9583 na na 70.50619 na
Field Strength
Element Unit
SS-07
Type
Sample Codes
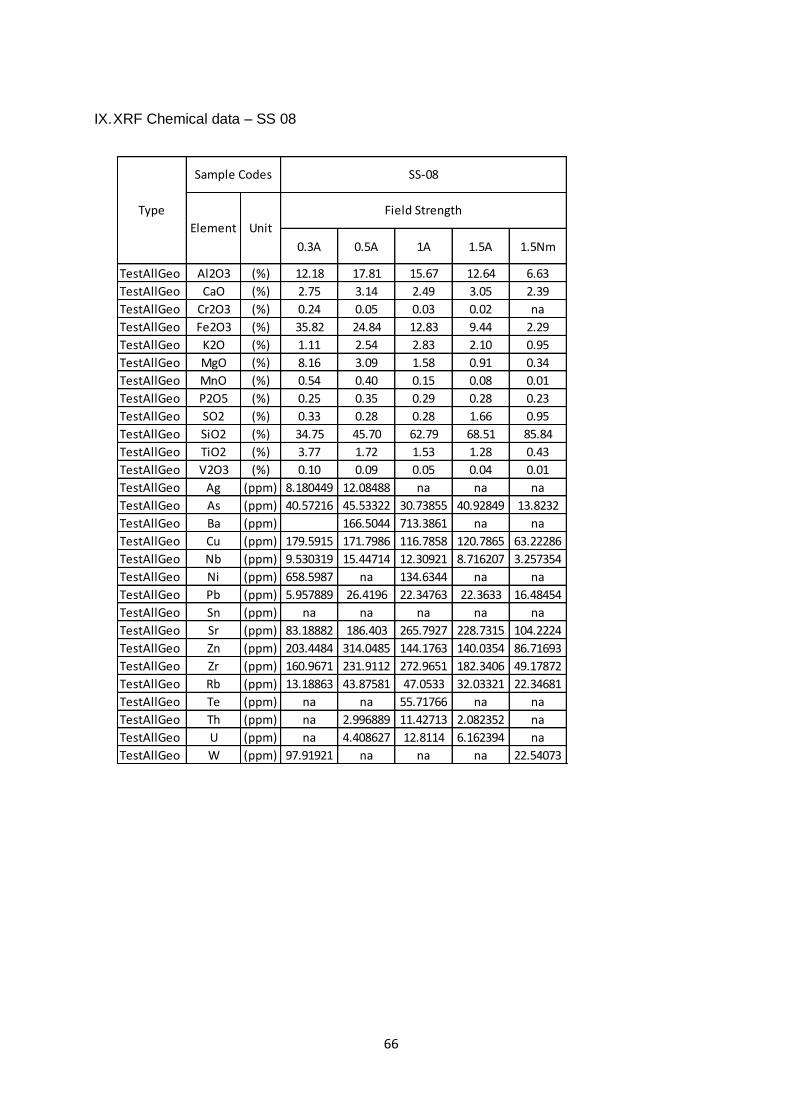
66
IX. XRF Chemical data – SS 08
0.3A 0.5A 1A 1.5A 1.5Nm
TestAllGeo Al2O3 (%) 12.18 17.81 15.67 12.64 6.63
TestAllGeo CaO (%) 2.75 3.14 2.49 3.05 2.39
TestAllGeo Cr2O3 (%) 0.24 0.05 0.03 0.02 na
TestAllGeo Fe2O3 (%) 35.82 24.84 12.83 9.44 2.29
TestAllGeo K2O (%) 1.11 2.54 2.83 2.10 0.95
TestAllGeo MgO (%) 8.16 3.09 1.58 0.91 0.34
TestAllGeo MnO (%) 0.54 0.40 0.15 0.08 0.01
TestAllGeo P2O5 (%) 0.25 0.35 0.29 0.28 0.23
TestAllGeo SO2 (%) 0.33 0.28 0.28 1.66 0.95
TestAllGeo SiO2 (%) 34.75 45.70 62.79 68.51 85.84
TestAllGeo TiO2 (%) 3.77 1.72 1.53 1.28 0.43
TestAllGeo V2O3 (%) 0.10 0.09 0.05 0.04 0.01
TestAllGeo Ag (ppm) 8.180449 12.08488 na na na
TestAllGeo As (ppm) 40.57216 45.53322 30.73855 40.92849 13.8232
TestAllGeo Ba (ppm) 166.5044 713.3861 na na
TestAllGeo Cu (ppm) 179.5915 171.7986 116.7858 120.7865 63.22286
TestAllGeo Nb (ppm) 9.530319 15.44714 12.30921 8.716207 3.257354
TestAllGeo Ni (ppm) 658.5987 na 134.6344 na na
TestAllGeo Pb (ppm) 5.957889 26.4196 22.34763 22.3633 16.48454
TestAllGeo Sn (ppm) na na na na na
TestAllGeo Sr (ppm) 83.18882 186.403 265.7927 228.7315 104.2224
TestAllGeo Zn (ppm) 203.4484 314.0485 144.1763 140.0354 86.71693
TestAllGeo Zr (ppm) 160.9671 231.9112 272.9651 182.3406 49.17872
TestAllGeo Rb (ppm) 13.18863 43.87581 47.0533 32.03321 22.34681
TestAllGeo Te (ppm) na na 55.71766 na na
TestAllGeo Th (ppm) na 2.996889 11.42713 2.082352 na
TestAllGeo U (ppm) na 4.408627 12.8114 6.162394 na
TestAllGeo W (ppm) 97.91921 na na na 22.54073
Field Strength
Element Unit
SS-08
Type
Sample Codes

67
X. XRF Chemical data – SS 09
TypeSample
CodesSS-09
Element UnitField
Strength
0.3A 0.5A 1A 1.5A 1.5Nm
TestAllGeo Al2O3 (%) 10.37 11.29 11.69 11.66 9.24
TestAllGeo CaO (%) 9.14 15.22 12.07 11.07 12.19
TestAllGeo Cr2O3 (%) 0.11 0.08 0.06 0.05 na
TestAllGeo Fe2O3 (%) 34.86 23.15 16.81 15.40 3.98
TestAllGeo K2O (%) 0.37 0.29 0.53 0.45 0.44
TestAllGeo MgO (%) 4.16 3.83 3.63 3.14 0.72
TestAllGeo MnO (%) 0.39 0.29 0.24 0.21 0.05
TestAllGeo P2O5 (%) 0.22 0.21 0.19 0.18 0.12
TestAllGeo SO2 (%) na na na na na
TestAllGeo SiO2 (%) 37.88 43.76 52.83 56.28 72.91
TestAllGeo TiO2 (%) 2.38 1.80 1.89 1.50 0.33
TestAllGeo V2O3 (%) 0.12 0.09 0.06 0.05 0.01
TestAllGeo Ag (ppm) 7.844416 4.349859 2.932591 na na
TestAllGeo As (ppm) 18.98206 17.50963 14.18909 10.83407 7.684303
TestAllGeo Ba (ppm) na na na na na
TestAllGeo Cu (ppm) 231.0333 130.4514 112.7287 129.8568 49.53402
TestAllGeo Nb (ppm) 12.02041 8.678185 8.619041 9.718355 2.838134
TestAllGeo Ni (ppm) 49.57716 na 91.86082 62.07471 na
TestAllGeo Pb (ppm) na na na na na
TestAllGeo Sn (ppm) 19.99904 na na na na
TestAllGeo Sr (ppm) 194.3484 317.4115 352.1281 291.6449 170.0433
TestAllGeo Zn (ppm) 344.3942 168.1993 149.999 156.2809 48.36129
TestAllGeo Zr (ppm) 135.0295 126.9478 169.9501 155.3291 48.68751
TestAllGeo Rb (ppm) na na 9.890725 7.168796 7.020019
TestAllGeo Te (ppm) na na na na na
TestAllGeo Th (ppm) na na na na na
TestAllGeo U (ppm) na na na na na
TestAllGeo W (ppm) na na na na na

68
XI. XRF Chemical data – SS 10
TypeSample
Codes
Element Unit
0.3A 0.5A 1A 1.5A 1.5Nm
TestAllGeo Al2O3 (%) 9.55 16.17 13.70 7.12 2.84
TestAllGeo CaO (%) 5.17 5.25 3.12 1.15 0.94
TestAllGeo Cr2O3 (%) 0.09 0.05 0.03 na na
TestAllGeo Fe2O3 (%) 31.22 25.87 15.00 9.78 3.55
TestAllGeo K2O (%) 0.69 2.18 2.51 0.97 0.41
TestAllGeo MgO (%) 5.00 3.13 1.63 na na
TestAllGeo MnO (%) 1.11 0.52 0.25 0.09 0.04
TestAllGeo P2O5 (%) 0.36 0.50 0.76 0.34 0.20
TestAllGeo SO2 (%) 0.39 0.17 0.92 2.91 3.15
TestAllGeo SiO2 (%) 26.07 43.15 60.04 77.01 88.39
TestAllGeo TiO2 (%) 20.13 2.89 1.98 0.61 0.47
TestAllGeo V2O3 (%) 0.23 0.12 0.06 0.02 0.01
TestAllGeo Ag (ppm) na na na na na
TestAllGeo As (ppm) 64.04686 39.4091 41.52473 35.24012 18.63216
TestAllGeo Ba (ppm) 380.2544 556.2068 507.8283 na 1633.307
TestAllGeo Cu (ppm) 251.2039 200.8657 132.4804 90.60883 65.32855
TestAllGeo Nb (ppm) 16.00695 12.35662 11.16126 6.38934 2.460526
TestAllGeo Ni (ppm) 149.97 120.0019 125.5428 na na
TestAllGeo Pb (ppm) na 10.58142 34.79705 24.39883 26.44282
TestAllGeo Sn (ppm) na 16.03268 na na na
TestAllGeo Sr (ppm) 77.5166 191.6928 238.8148 99.5436 109.8858
TestAllGeo Zn (ppm) 256.6919 255.0121 148.0659 247.6324 30.96239
TestAllGeo Zr (ppm) 408.1996 210.5622 233.4618 58.71356 30.81286
TestAllGeo Rb (ppm) 13.08498 37.54304 38.41037 24.32367 7.55111
TestAllGeo Te (ppm) 115.6529 na na na na
TestAllGeo Th (ppm) na na 5.742103 na na
TestAllGeo U (ppm) na na 7.448953 na na
TestAllGeo W (ppm) 59.94577 54.37072 na 49.46159 na
Field Strength
SS-10

69
XII. XRF Chemical data – SS 11
TypeSample
Codes
Element Unit
0.3A 0.5A 1A 1.5A 1.5Nm
TestAllGeo Al2O3 (%) 12.28 16.00 14.14 5.42 7.81
TestAllGeo CaO (%) 5.58 4.42 3.29 4.71 5.37
TestAllGeo Cr2O3 (%) 1.25 0.05 0.02 na na
TestAllGeo Fe2O3 (%) 35.16 21.72 11.36 1.93 4.72
TestAllGeo K2O (%) 0.61 2.18 2.49 0.49 0.91
TestAllGeo MgO (%) 5.29 2.20 1.86 0.51
TestAllGeo MnO (%) 0.73 0.34 0.11 0.02 0.04
TestAllGeo P2O5 (%) 0.21 0.35 0.33 na 0.18
TestAllGeo SO2 (%) 0.07 0.14 0.13 0.67 0.26
TestAllGeo SiO2 (%) 29.21 50.67 65.03 86.57 80.01
TestAllGeo TiO2 (%) 9.42 1.86 1.18 0.18 0.32
TestAllGeo V2O3 (%) 0.19 0.07 0.04 0.01 0.01
TestAllGeo Ag (ppm) 10.99448 6.192714 na na na
TestAllGeo As (ppm) 39.70627 45.12683 27.12263 19.03215 9.642141
TestAllGeo Ba (ppm) na 294.5283 208.4425 416.6988 na
TestAllGeo Cu (ppm) 200.0928 194.0812 114.156 32.18498 56.71955
TestAllGeo Nb (ppm) 13.53387 12.60528 9.994677 4.828059 4.246046
TestAllGeo Ni (ppm) 274.1956 102.1046 na na na
TestAllGeo Pb (ppm) na 15.98259 17.57109 129.7613 21.76531
TestAllGeo Sn (ppm) 11.18131 na na na na
TestAllGeo Sr (ppm) 70.56448 306.3128 349.0005 106.8789 195.7799
TestAllGeo Zn (ppm) 298.0839 205.5744 125.1206 19.55788 43.28022
TestAllGeo Zr (ppm) 97.84881 279.5141 232.7107 25.31185 58.02957
TestAllGeo Rb (ppm) 6.483021 37.244 39.3325 12.22313 24.71228
TestAllGeo Te (ppm) na na na na na
TestAllGeo Th (ppm) na na na na na
TestAllGeo U (ppm) na na na na na
TestAllGeo W (ppm) na na na 43.23858 50.91228
Field Strength
SS-11
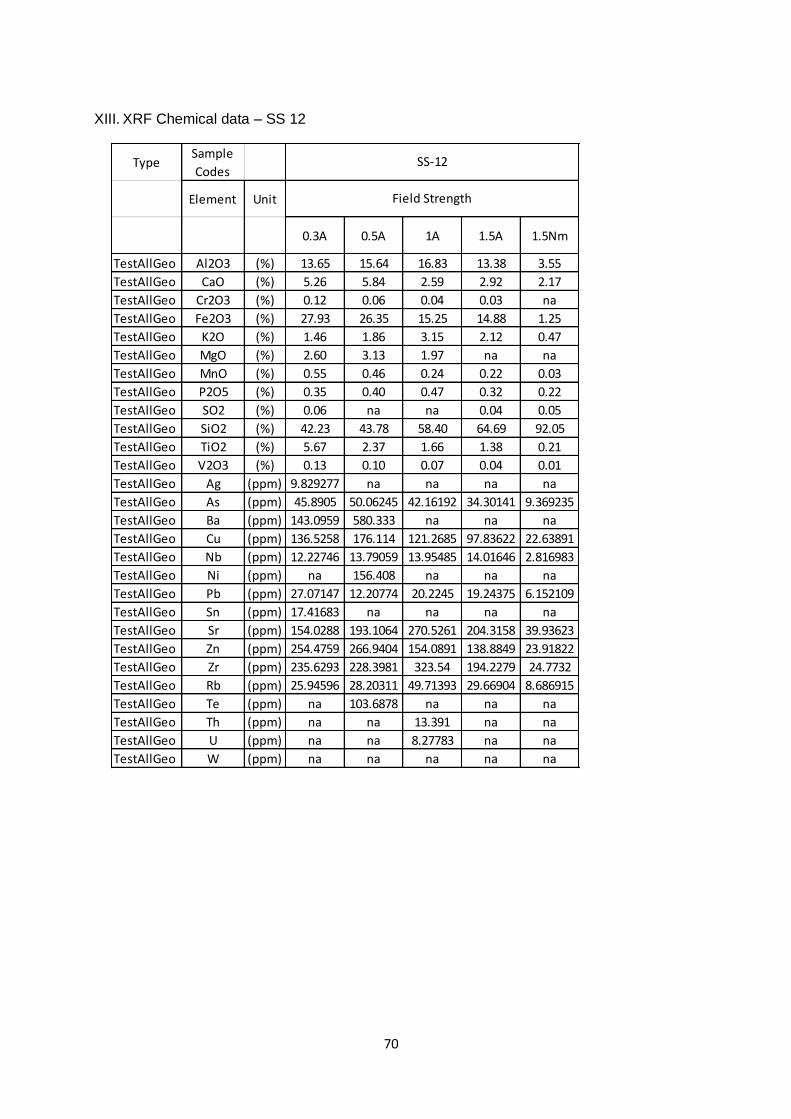
70
XIII. XRF Chemical data – SS 12
TypeSample
Codes
Element Unit
0.3A 0.5A 1A 1.5A 1.5Nm
TestAllGeo Al2O3 (%) 13.65 15.64 16.83 13.38 3.55
TestAllGeo CaO (%) 5.26 5.84 2.59 2.92 2.17
TestAllGeo Cr2O3 (%) 0.12 0.06 0.04 0.03 na
TestAllGeo Fe2O3 (%) 27.93 26.35 15.25 14.88 1.25
TestAllGeo K2O (%) 1.46 1.86 3.15 2.12 0.47
TestAllGeo MgO (%) 2.60 3.13 1.97 na na
TestAllGeo MnO (%) 0.55 0.46 0.24 0.22 0.03
TestAllGeo P2O5 (%) 0.35 0.40 0.47 0.32 0.22
TestAllGeo SO2 (%) 0.06 na na 0.04 0.05
TestAllGeo SiO2 (%) 42.23 43.78 58.40 64.69 92.05
TestAllGeo TiO2 (%) 5.67 2.37 1.66 1.38 0.21
TestAllGeo V2O3 (%) 0.13 0.10 0.07 0.04 0.01
TestAllGeo Ag (ppm) 9.829277 na na na na
TestAllGeo As (ppm) 45.8905 50.06245 42.16192 34.30141 9.369235
TestAllGeo Ba (ppm) 143.0959 580.333 na na na
TestAllGeo Cu (ppm) 136.5258 176.114 121.2685 97.83622 22.63891
TestAllGeo Nb (ppm) 12.22746 13.79059 13.95485 14.01646 2.816983
TestAllGeo Ni (ppm) na 156.408 na na na
TestAllGeo Pb (ppm) 27.07147 12.20774 20.2245 19.24375 6.152109
TestAllGeo Sn (ppm) 17.41683 na na na na
TestAllGeo Sr (ppm) 154.0288 193.1064 270.5261 204.3158 39.93623
TestAllGeo Zn (ppm) 254.4759 266.9404 154.0891 138.8849 23.91822
TestAllGeo Zr (ppm) 235.6293 228.3981 323.54 194.2279 24.7732
TestAllGeo Rb (ppm) 25.94596 28.20311 49.71393 29.66904 8.686915
TestAllGeo Te (ppm) na 103.6878 na na na
TestAllGeo Th (ppm) na na 13.391 na na
TestAllGeo U (ppm) na na 8.27783 na na
TestAllGeo W (ppm) na na na na na
Field Strength
SS-12
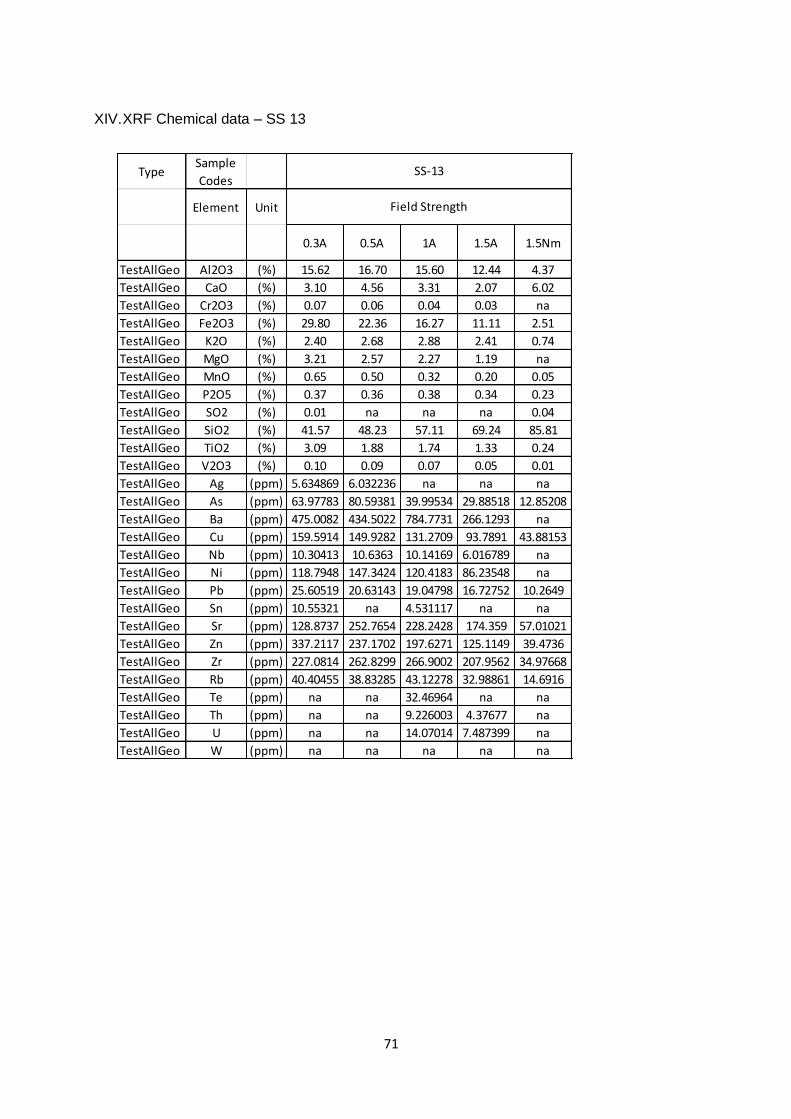
71
XIV. XRF Chemical data – SS 13
TypeSample
Codes
Element Unit
0.3A 0.5A 1A 1.5A 1.5Nm
TestAllGeo Al2O3 (%) 15.62 16.70 15.60 12.44 4.37
TestAllGeo CaO (%) 3.10 4.56 3.31 2.07 6.02
TestAllGeo Cr2O3 (%) 0.07 0.06 0.04 0.03 na
TestAllGeo Fe2O3 (%) 29.80 22.36 16.27 11.11 2.51
TestAllGeo K2O (%) 2.40 2.68 2.88 2.41 0.74
TestAllGeo MgO (%) 3.21 2.57 2.27 1.19 na
TestAllGeo MnO (%) 0.65 0.50 0.32 0.20 0.05
TestAllGeo P2O5 (%) 0.37 0.36 0.38 0.34 0.23
TestAllGeo SO2 (%) 0.01 na na na 0.04
TestAllGeo SiO2 (%) 41.57 48.23 57.11 69.24 85.81
TestAllGeo TiO2 (%) 3.09 1.88 1.74 1.33 0.24
TestAllGeo V2O3 (%) 0.10 0.09 0.07 0.05 0.01
TestAllGeo Ag (ppm) 5.634869 6.032236 na na na
TestAllGeo As (ppm) 63.97783 80.59381 39.99534 29.88518 12.85208
TestAllGeo Ba (ppm) 475.0082 434.5022 784.7731 266.1293 na
TestAllGeo Cu (ppm) 159.5914 149.9282 131.2709 93.7891 43.88153
TestAllGeo Nb (ppm) 10.30413 10.6363 10.14169 6.016789 na
TestAllGeo Ni (ppm) 118.7948 147.3424 120.4183 86.23548 na
TestAllGeo Pb (ppm) 25.60519 20.63143 19.04798 16.72752 10.2649
TestAllGeo Sn (ppm) 10.55321 na 4.531117 na na
TestAllGeo Sr (ppm) 128.8737 252.7654 228.2428 174.359 57.01021
TestAllGeo Zn (ppm) 337.2117 237.1702 197.6271 125.1149 39.4736
TestAllGeo Zr (ppm) 227.0814 262.8299 266.9002 207.9562 34.97668
TestAllGeo Rb (ppm) 40.40455 38.83285 43.12278 32.98861 14.6916
TestAllGeo Te (ppm) na na 32.46964 na na
TestAllGeo Th (ppm) na na 9.226003 4.37677 na
TestAllGeo U (ppm) na na 14.07014 7.487399 na
TestAllGeo W (ppm) na na na na na
Field Strength
SS-13

72
XV. XRF Chemical data – SS 14
TypeSample
Codes
Element Unit
0.3A 0.5A 1A 1.5A 1.5Nm
TestAllGeo Al2O3 (%) 12.95 13.54 14.34 10.25 4.45
TestAllGeo CaO (%) 2.84 8.70 6.34 3.25 1.96
TestAllGeo Cr2O3 (%) 0.44 0.05 0.03 na na
TestAllGeo Fe2O3 (%) 24.75 23.78 13.13 5.25 1.09
TestAllGeo K2O (%) 1.56 1.24 2.10 1.22 0.48
TestAllGeo MgO (%) 2.02 3.23 2.13 na na
TestAllGeo MnO (%) 0.49 0.33 0.18 0.05 0.02
TestAllGeo P2O5 (%) 0.36 0.40 0.27 0.25 0.22
TestAllGeo SO2 (%) 0.04 na na 0.07 na
TestAllGeo SiO2 (%) 46.34 46.14 60.22 79.15 91.57
TestAllGeo TiO2 (%) 9.08 2.48 1.22 0.54 0.20
TestAllGeo V2O3 (%) 0.14 0.10 0.05 0.02 0.01
TestAllGeo Ag (ppm) 8.711188 4.528935 na na na
TestAllGeo As (ppm) 33.10761 26.7514 24.71223 10.47511 7.840626
TestAllGeo Ba (ppm) 162.1859 200.7976 265.9767 na na
TestAllGeo Cu (ppm) 102.4942 145.5965 131.4547 49.08194 32.97504
TestAllGeo Nb (ppm) 11.37713 8.187349 5.934169 3.277736 na
TestAllGeo Ni (ppm) na na 67.94424 na na
TestAllGeo Pb (ppm) 31.61211 11.36337 15.40195 2.565925 na
TestAllGeo Sn (ppm) na na na na na
TestAllGeo Sr (ppm) 131.099 271.7783 344.1653 130.8595 38.5458
TestAllGeo Zn (ppm) 180.646 193.7411 123.2984 45.82769 12.68997
TestAllGeo Zr (ppm) 225.9629 181.417 215.4618 74.83915 19.66125
TestAllGeo Rb (ppm) 32.86483 14.48508 27.63735 24.6558 6.457765
TestAllGeo Te (ppm) na na na na na
TestAllGeo Th (ppm) na na na na na
TestAllGeo U (ppm) na na na na na
TestAllGeo W (ppm) na na na 27.5768 na
Field Strength
SS-14
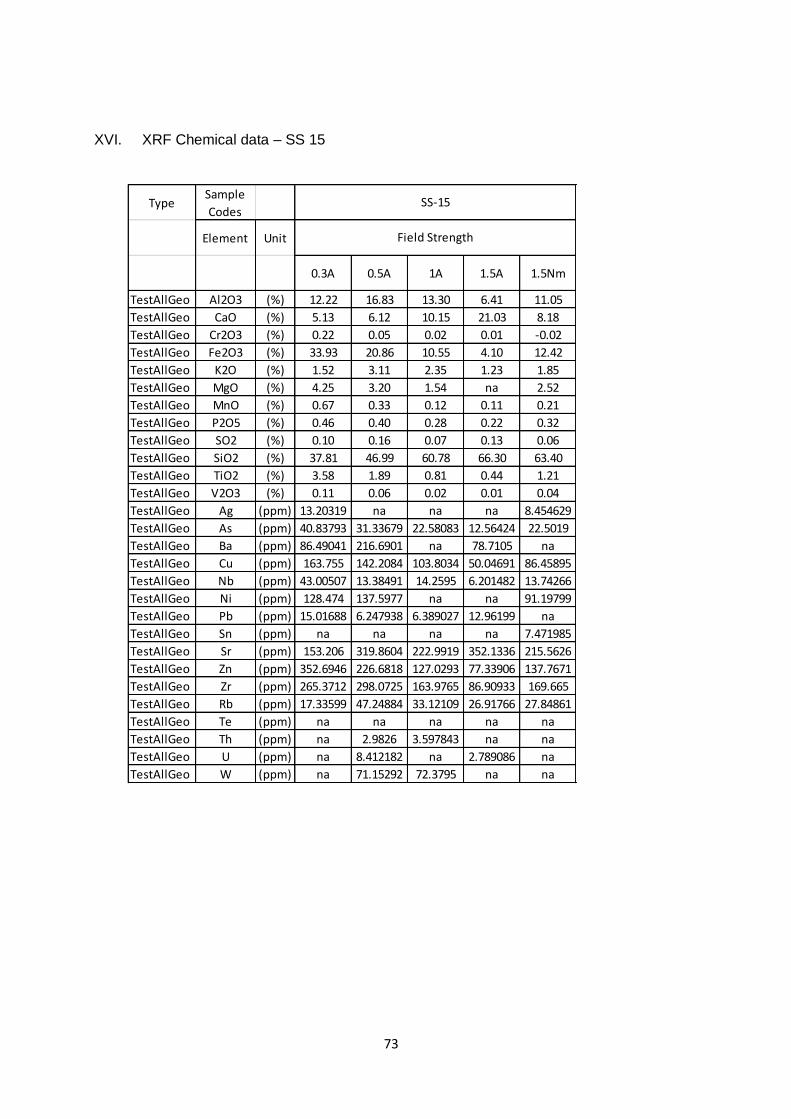
73
XVI. XRF Chemical data – SS 15
TypeSample
Codes
Element Unit
0.3A 0.5A 1A 1.5A 1.5Nm
TestAllGeo Al2O3 (%) 12.22 16.83 13.30 6.41 11.05
TestAllGeo CaO (%) 5.13 6.12 10.15 21.03 8.18
TestAllGeo Cr2O3 (%) 0.22 0.05 0.02 0.01 -0.02
TestAllGeo Fe2O3 (%) 33.93 20.86 10.55 4.10 12.42
TestAllGeo K2O (%) 1.52 3.11 2.35 1.23 1.85
TestAllGeo MgO (%) 4.25 3.20 1.54 na 2.52
TestAllGeo MnO (%) 0.67 0.33 0.12 0.11 0.21
TestAllGeo P2O5 (%) 0.46 0.40 0.28 0.22 0.32
TestAllGeo SO2 (%) 0.10 0.16 0.07 0.13 0.06
TestAllGeo SiO2 (%) 37.81 46.99 60.78 66.30 63.40
TestAllGeo TiO2 (%) 3.58 1.89 0.81 0.44 1.21
TestAllGeo V2O3 (%) 0.11 0.06 0.02 0.01 0.04
TestAllGeo Ag (ppm) 13.20319 na na na 8.454629
TestAllGeo As (ppm) 40.83793 31.33679 22.58083 12.56424 22.5019
TestAllGeo Ba (ppm) 86.49041 216.6901 na 78.7105 na
TestAllGeo Cu (ppm) 163.755 142.2084 103.8034 50.04691 86.45895
TestAllGeo Nb (ppm) 43.00507 13.38491 14.2595 6.201482 13.74266
TestAllGeo Ni (ppm) 128.474 137.5977 na na 91.19799
TestAllGeo Pb (ppm) 15.01688 6.247938 6.389027 12.96199 na
TestAllGeo Sn (ppm) na na na na 7.471985
TestAllGeo Sr (ppm) 153.206 319.8604 222.9919 352.1336 215.5626
TestAllGeo Zn (ppm) 352.6946 226.6818 127.0293 77.33906 137.7671
TestAllGeo Zr (ppm) 265.3712 298.0725 163.9765 86.90933 169.665
TestAllGeo Rb (ppm) 17.33599 47.24884 33.12109 26.91766 27.84861
TestAllGeo Te (ppm) na na na na na
TestAllGeo Th (ppm) na 2.9826 3.597843 na na
TestAllGeo U (ppm) na 8.412182 na 2.789086 na
TestAllGeo W (ppm) na 71.15292 72.3795 na na
Field Strength
SS-15
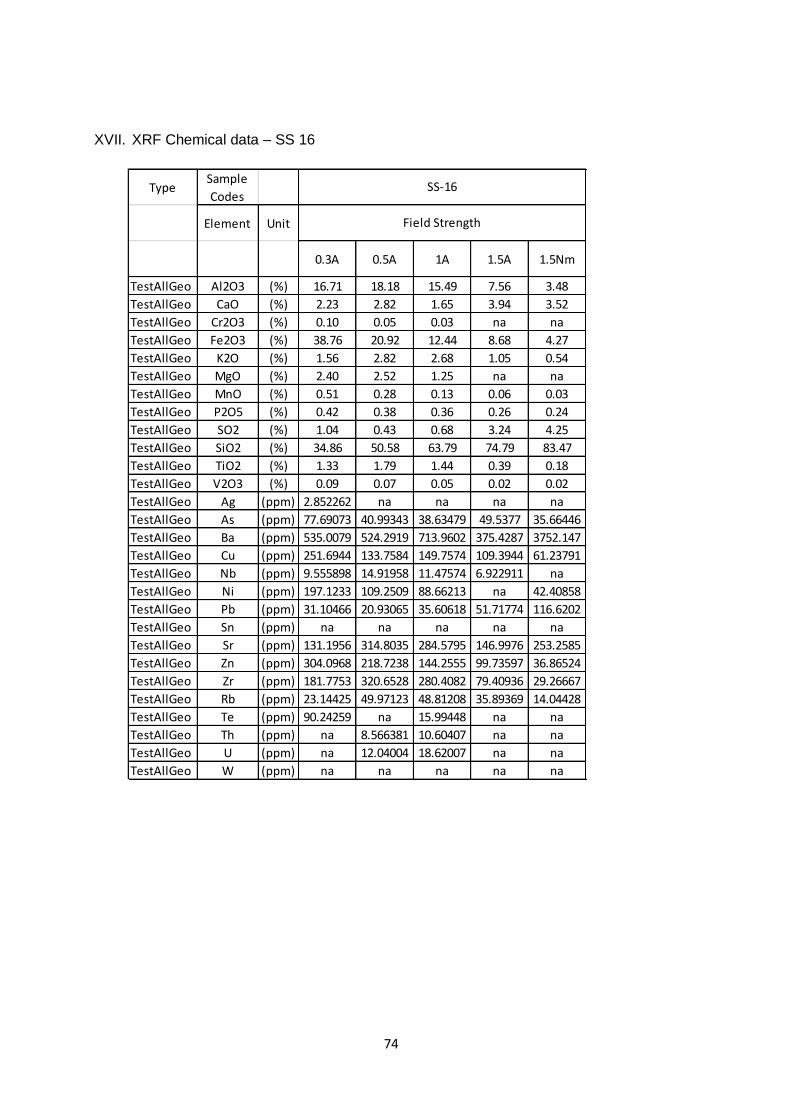
74
XVII. XRF Chemical data – SS 16
TypeSample
Codes
Element Unit
0.3A 0.5A 1A 1.5A 1.5Nm
TestAllGeo Al2O3 (%) 16.71 18.18 15.49 7.56 3.48
TestAllGeo CaO (%) 2.23 2.82 1.65 3.94 3.52
TestAllGeo Cr2O3 (%) 0.10 0.05 0.03 na na
TestAllGeo Fe2O3 (%) 38.76 20.92 12.44 8.68 4.27
TestAllGeo K2O (%) 1.56 2.82 2.68 1.05 0.54
TestAllGeo MgO (%) 2.40 2.52 1.25 na na
TestAllGeo MnO (%) 0.51 0.28 0.13 0.06 0.03
TestAllGeo P2O5 (%) 0.42 0.38 0.36 0.26 0.24
TestAllGeo SO2 (%) 1.04 0.43 0.68 3.24 4.25
TestAllGeo SiO2 (%) 34.86 50.58 63.79 74.79 83.47
TestAllGeo TiO2 (%) 1.33 1.79 1.44 0.39 0.18
TestAllGeo V2O3 (%) 0.09 0.07 0.05 0.02 0.02
TestAllGeo Ag (ppm) 2.852262 na na na na
TestAllGeo As (ppm) 77.69073 40.99343 38.63479 49.5377 35.66446
TestAllGeo Ba (ppm) 535.0079 524.2919 713.9602 375.4287 3752.147
TestAllGeo Cu (ppm) 251.6944 133.7584 149.7574 109.3944 61.23791
TestAllGeo Nb (ppm) 9.555898 14.91958 11.47574 6.922911 na
TestAllGeo Ni (ppm) 197.1233 109.2509 88.66213 na 42.40858
TestAllGeo Pb (ppm) 31.10466 20.93065 35.60618 51.71774 116.6202
TestAllGeo Sn (ppm) na na na na na
TestAllGeo Sr (ppm) 131.1956 314.8035 284.5795 146.9976 253.2585
TestAllGeo Zn (ppm) 304.0968 218.7238 144.2555 99.73597 36.86524
TestAllGeo Zr (ppm) 181.7753 320.6528 280.4082 79.40936 29.26667
TestAllGeo Rb (ppm) 23.14425 49.97123 48.81208 35.89369 14.04428
TestAllGeo Te (ppm) 90.24259 na 15.99448 na na
TestAllGeo Th (ppm) na 8.566381 10.60407 na na
TestAllGeo U (ppm) na 12.04004 18.62007 na na
TestAllGeo W (ppm) na na na na na
Field Strength
SS-16
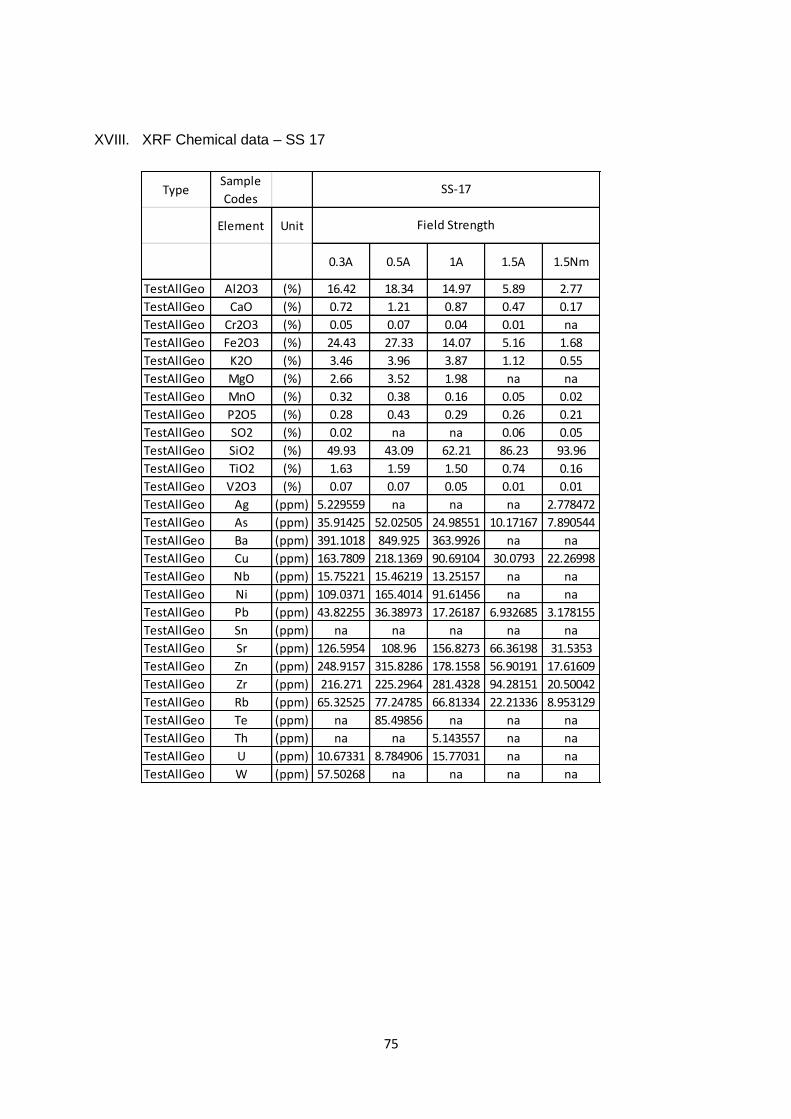
75
XVIII. XRF Chemical data – SS 17
TypeSample
Codes
Element Unit
0.3A 0.5A 1A 1.5A 1.5Nm
TestAllGeo Al2O3 (%) 16.42 18.34 14.97 5.89 2.77
TestAllGeo CaO (%) 0.72 1.21 0.87 0.47 0.17
TestAllGeo Cr2O3 (%) 0.05 0.07 0.04 0.01 na
TestAllGeo Fe2O3 (%) 24.43 27.33 14.07 5.16 1.68
TestAllGeo K2O (%) 3.46 3.96 3.87 1.12 0.55
TestAllGeo MgO (%) 2.66 3.52 1.98 na na
TestAllGeo MnO (%) 0.32 0.38 0.16 0.05 0.02
TestAllGeo P2O5 (%) 0.28 0.43 0.29 0.26 0.21
TestAllGeo SO2 (%) 0.02 na na 0.06 0.05
TestAllGeo SiO2 (%) 49.93 43.09 62.21 86.23 93.96
TestAllGeo TiO2 (%) 1.63 1.59 1.50 0.74 0.16
TestAllGeo V2O3 (%) 0.07 0.07 0.05 0.01 0.01
TestAllGeo Ag (ppm) 5.229559 na na na 2.778472
TestAllGeo As (ppm) 35.91425 52.02505 24.98551 10.17167 7.890544
TestAllGeo Ba (ppm) 391.1018 849.925 363.9926 na na
TestAllGeo Cu (ppm) 163.7809 218.1369 90.69104 30.0793 22.26998
TestAllGeo Nb (ppm) 15.75221 15.46219 13.25157 na na
TestAllGeo Ni (ppm) 109.0371 165.4014 91.61456 na na
TestAllGeo Pb (ppm) 43.82255 36.38973 17.26187 6.932685 3.178155
TestAllGeo Sn (ppm) na na na na na
TestAllGeo Sr (ppm) 126.5954 108.96 156.8273 66.36198 31.5353
TestAllGeo Zn (ppm) 248.9157 315.8286 178.1558 56.90191 17.61609
TestAllGeo Zr (ppm) 216.271 225.2964 281.4328 94.28151 20.50042
TestAllGeo Rb (ppm) 65.32525 77.24785 66.81334 22.21336 8.953129
TestAllGeo Te (ppm) na 85.49856 na na na
TestAllGeo Th (ppm) na na 5.143557 na na
TestAllGeo U (ppm) 10.67331 8.784906 15.77031 na na
TestAllGeo W (ppm) 57.50268 na na na na
Field Strength
SS-17
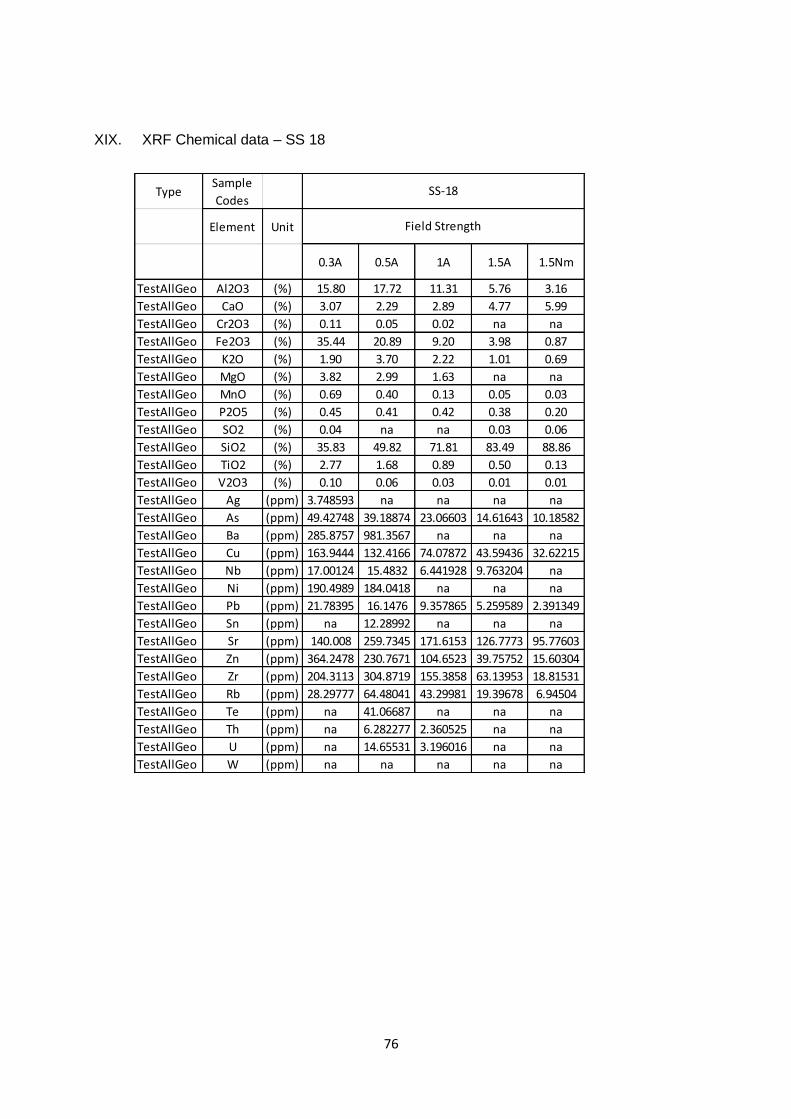
76
XIX. XRF Chemical data – SS 18
TypeSample
Codes
Element Unit
0.3A 0.5A 1A 1.5A 1.5Nm
TestAllGeo Al2O3 (%) 15.80 17.72 11.31 5.76 3.16
TestAllGeo CaO (%) 3.07 2.29 2.89 4.77 5.99
TestAllGeo Cr2O3 (%) 0.11 0.05 0.02 na na
TestAllGeo Fe2O3 (%) 35.44 20.89 9.20 3.98 0.87
TestAllGeo K2O (%) 1.90 3.70 2.22 1.01 0.69
TestAllGeo MgO (%) 3.82 2.99 1.63 na na
TestAllGeo MnO (%) 0.69 0.40 0.13 0.05 0.03
TestAllGeo P2O5 (%) 0.45 0.41 0.42 0.38 0.20
TestAllGeo SO2 (%) 0.04 na na 0.03 0.06
TestAllGeo SiO2 (%) 35.83 49.82 71.81 83.49 88.86
TestAllGeo TiO2 (%) 2.77 1.68 0.89 0.50 0.13
TestAllGeo V2O3 (%) 0.10 0.06 0.03 0.01 0.01
TestAllGeo Ag (ppm) 3.748593 na na na na
TestAllGeo As (ppm) 49.42748 39.18874 23.06603 14.61643 10.18582
TestAllGeo Ba (ppm) 285.8757 981.3567 na na na
TestAllGeo Cu (ppm) 163.9444 132.4166 74.07872 43.59436 32.62215
TestAllGeo Nb (ppm) 17.00124 15.4832 6.441928 9.763204 na
TestAllGeo Ni (ppm) 190.4989 184.0418 na na na
TestAllGeo Pb (ppm) 21.78395 16.1476 9.357865 5.259589 2.391349
TestAllGeo Sn (ppm) na 12.28992 na na na
TestAllGeo Sr (ppm) 140.008 259.7345 171.6153 126.7773 95.77603
TestAllGeo Zn (ppm) 364.2478 230.7671 104.6523 39.75752 15.60304
TestAllGeo Zr (ppm) 204.3113 304.8719 155.3858 63.13953 18.81531
TestAllGeo Rb (ppm) 28.29777 64.48041 43.29981 19.39678 6.94504
TestAllGeo Te (ppm) na 41.06687 na na na
TestAllGeo Th (ppm) na 6.282277 2.360525 na na
TestAllGeo U (ppm) na 14.65531 3.196016 na na
TestAllGeo W (ppm) na na na na na
Field Strength
SS-18
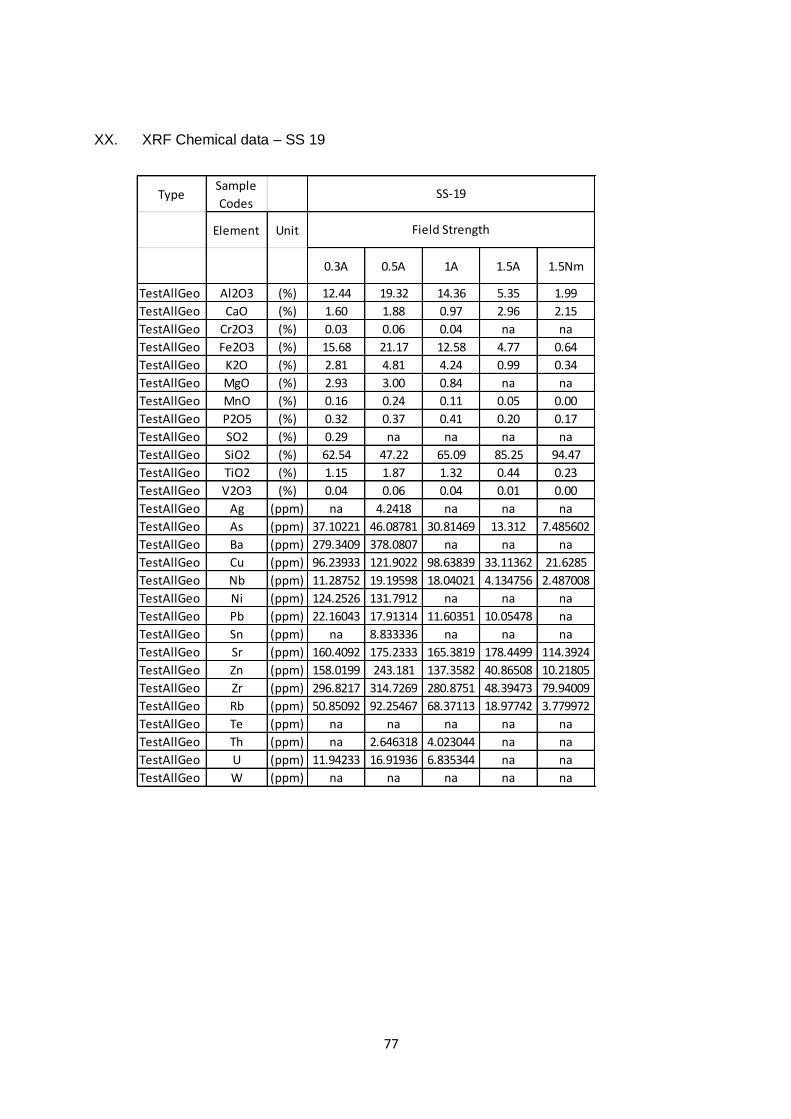
77
XX. XRF Chemical data – SS 19
TypeSample
Codes
Element Unit
0.3A 0.5A 1A 1.5A 1.5Nm
TestAllGeo Al2O3 (%) 12.44 19.32 14.36 5.35 1.99
TestAllGeo CaO (%) 1.60 1.88 0.97 2.96 2.15
TestAllGeo Cr2O3 (%) 0.03 0.06 0.04 na na
TestAllGeo Fe2O3 (%) 15.68 21.17 12.58 4.77 0.64
TestAllGeo K2O (%) 2.81 4.81 4.24 0.99 0.34
TestAllGeo MgO (%) 2.93 3.00 0.84 na na
TestAllGeo MnO (%) 0.16 0.24 0.11 0.05 0.00
TestAllGeo P2O5 (%) 0.32 0.37 0.41 0.20 0.17
TestAllGeo SO2 (%) 0.29 na na na na
TestAllGeo SiO2 (%) 62.54 47.22 65.09 85.25 94.47
TestAllGeo TiO2 (%) 1.15 1.87 1.32 0.44 0.23
TestAllGeo V2O3 (%) 0.04 0.06 0.04 0.01 0.00
TestAllGeo Ag (ppm) na 4.2418 na na na
TestAllGeo As (ppm) 37.10221 46.08781 30.81469 13.312 7.485602
TestAllGeo Ba (ppm) 279.3409 378.0807 na na na
TestAllGeo Cu (ppm) 96.23933 121.9022 98.63839 33.11362 21.6285
TestAllGeo Nb (ppm) 11.28752 19.19598 18.04021 4.134756 2.487008
TestAllGeo Ni (ppm) 124.2526 131.7912 na na na
TestAllGeo Pb (ppm) 22.16043 17.91314 11.60351 10.05478 na
TestAllGeo Sn (ppm) na 8.833336 na na na
TestAllGeo Sr (ppm) 160.4092 175.2333 165.3819 178.4499 114.3924
TestAllGeo Zn (ppm) 158.0199 243.181 137.3582 40.86508 10.21805
TestAllGeo Zr (ppm) 296.8217 314.7269 280.8751 48.39473 79.94009
TestAllGeo Rb (ppm) 50.85092 92.25467 68.37113 18.97742 3.779972
TestAllGeo Te (ppm) na na na na na
TestAllGeo Th (ppm) na 2.646318 4.023044 na na
TestAllGeo U (ppm) 11.94233 16.91936 6.835344 na na
TestAllGeo W (ppm) na na na na na
Field Strength
SS-19
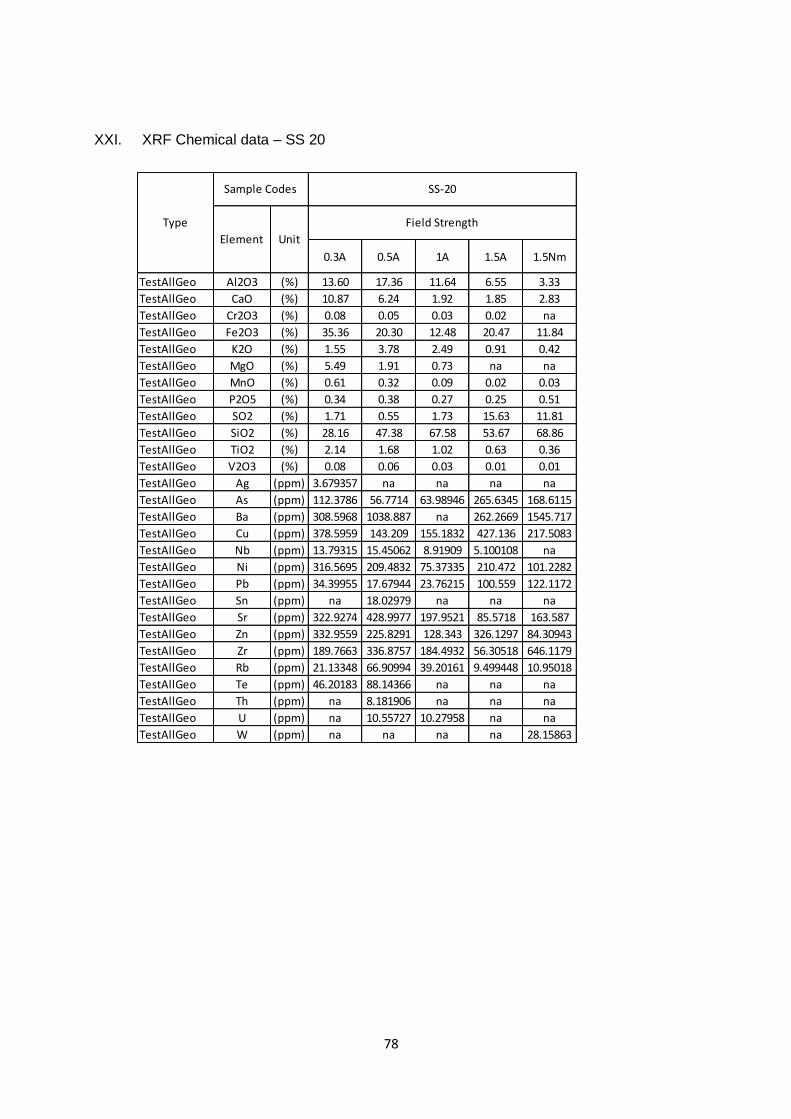
78
XXI. XRF Chemical data – SS 20
0.3A 0.5A 1A 1.5A 1.5Nm
TestAllGeo Al2O3 (%) 13.60 17.36 11.64 6.55 3.33
TestAllGeo CaO (%) 10.87 6.24 1.92 1.85 2.83
TestAllGeo Cr2O3 (%) 0.08 0.05 0.03 0.02 na
TestAllGeo Fe2O3 (%) 35.36 20.30 12.48 20.47 11.84
TestAllGeo K2O (%) 1.55 3.78 2.49 0.91 0.42
TestAllGeo MgO (%) 5.49 1.91 0.73 na na
TestAllGeo MnO (%) 0.61 0.32 0.09 0.02 0.03
TestAllGeo P2O5 (%) 0.34 0.38 0.27 0.25 0.51
TestAllGeo SO2 (%) 1.71 0.55 1.73 15.63 11.81
TestAllGeo SiO2 (%) 28.16 47.38 67.58 53.67 68.86
TestAllGeo TiO2 (%) 2.14 1.68 1.02 0.63 0.36
TestAllGeo V2O3 (%) 0.08 0.06 0.03 0.01 0.01
TestAllGeo Ag (ppm) 3.679357 na na na na
TestAllGeo As (ppm) 112.3786 56.7714 63.98946 265.6345 168.6115
TestAllGeo Ba (ppm) 308.5968 1038.887 na 262.2669 1545.717
TestAllGeo Cu (ppm) 378.5959 143.209 155.1832 427.136 217.5083
TestAllGeo Nb (ppm) 13.79315 15.45062 8.91909 5.100108 na
TestAllGeo Ni (ppm) 316.5695 209.4832 75.37335 210.472 101.2282
TestAllGeo Pb (ppm) 34.39955 17.67944 23.76215 100.559 122.1172
TestAllGeo Sn (ppm) na 18.02979 na na na
TestAllGeo Sr (ppm) 322.9274 428.9977 197.9521 85.5718 163.587
TestAllGeo Zn (ppm) 332.9559 225.8291 128.343 326.1297 84.30943
TestAllGeo Zr (ppm) 189.7663 336.8757 184.4932 56.30518 646.1179
TestAllGeo Rb (ppm) 21.13348 66.90994 39.20161 9.499448 10.95018
TestAllGeo Te (ppm) 46.20183 88.14366 na na na
TestAllGeo Th (ppm) na 8.181906 na na na
TestAllGeo U (ppm) na 10.55727 10.27958 na na
TestAllGeo W (ppm) na na na na 28.15863
Field Strength
SS-20
Type
Sample Codes
Element Unit
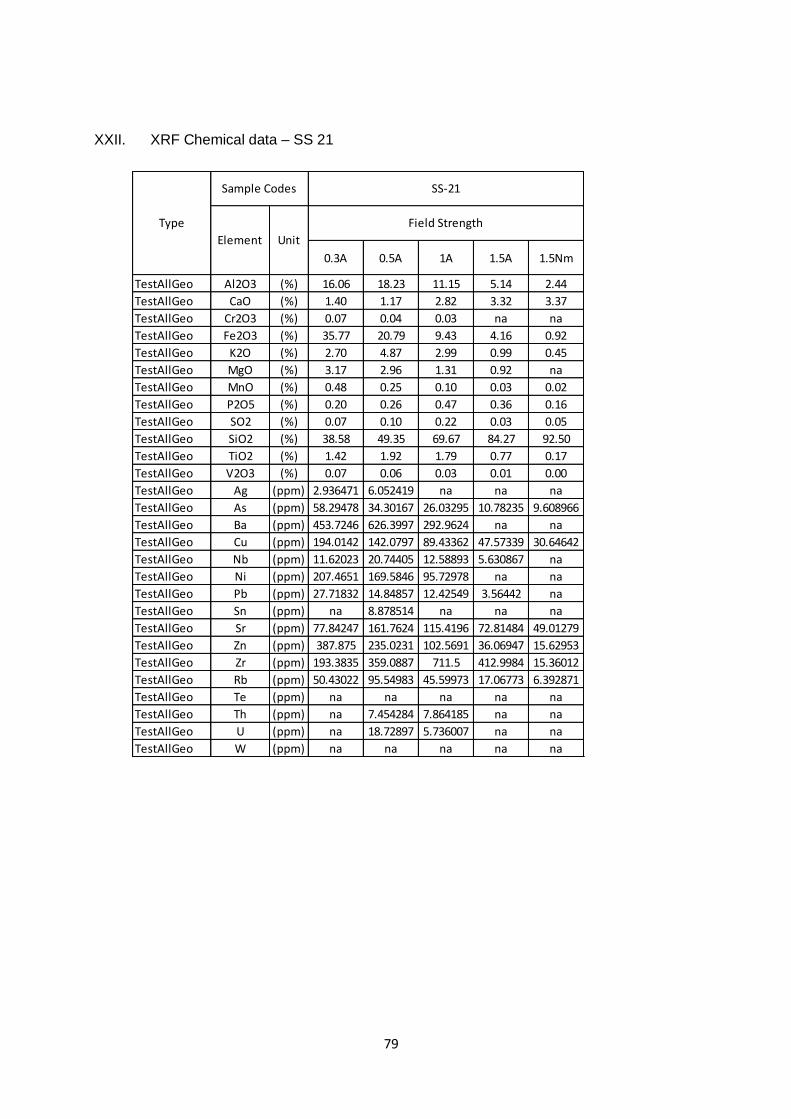
79
XXII. XRF Chemical data – SS 21
0.3A 0.5A 1A 1.5A 1.5Nm
TestAllGeo Al2O3 (%) 16.06 18.23 11.15 5.14 2.44
TestAllGeo CaO (%) 1.40 1.17 2.82 3.32 3.37
TestAllGeo Cr2O3 (%) 0.07 0.04 0.03 na na
TestAllGeo Fe2O3 (%) 35.77 20.79 9.43 4.16 0.92
TestAllGeo K2O (%) 2.70 4.87 2.99 0.99 0.45
TestAllGeo MgO (%) 3.17 2.96 1.31 0.92 na
TestAllGeo MnO (%) 0.48 0.25 0.10 0.03 0.02
TestAllGeo P2O5 (%) 0.20 0.26 0.47 0.36 0.16
TestAllGeo SO2 (%) 0.07 0.10 0.22 0.03 0.05
TestAllGeo SiO2 (%) 38.58 49.35 69.67 84.27 92.50
TestAllGeo TiO2 (%) 1.42 1.92 1.79 0.77 0.17
TestAllGeo V2O3 (%) 0.07 0.06 0.03 0.01 0.00
TestAllGeo Ag (ppm) 2.936471 6.052419 na na na
TestAllGeo As (ppm) 58.29478 34.30167 26.03295 10.78235 9.608966
TestAllGeo Ba (ppm) 453.7246 626.3997 292.9624 na na
TestAllGeo Cu (ppm) 194.0142 142.0797 89.43362 47.57339 30.64642
TestAllGeo Nb (ppm) 11.62023 20.74405 12.58893 5.630867 na
TestAllGeo Ni (ppm) 207.4651 169.5846 95.72978 na na
TestAllGeo Pb (ppm) 27.71832 14.84857 12.42549 3.56442 na
TestAllGeo Sn (ppm) na 8.878514 na na na
TestAllGeo Sr (ppm) 77.84247 161.7624 115.4196 72.81484 49.01279
TestAllGeo Zn (ppm) 387.875 235.0231 102.5691 36.06947 15.62953
TestAllGeo Zr (ppm) 193.3835 359.0887 711.5 412.9984 15.36012
TestAllGeo Rb (ppm) 50.43022 95.54983 45.59973 17.06773 6.392871
TestAllGeo Te (ppm) na na na na na
TestAllGeo Th (ppm) na 7.454284 7.864185 na na
TestAllGeo U (ppm) na 18.72897 5.736007 na na
TestAllGeo W (ppm) na na na na na
Field Strength
SS-21
Type
Sample Codes
Element Unit
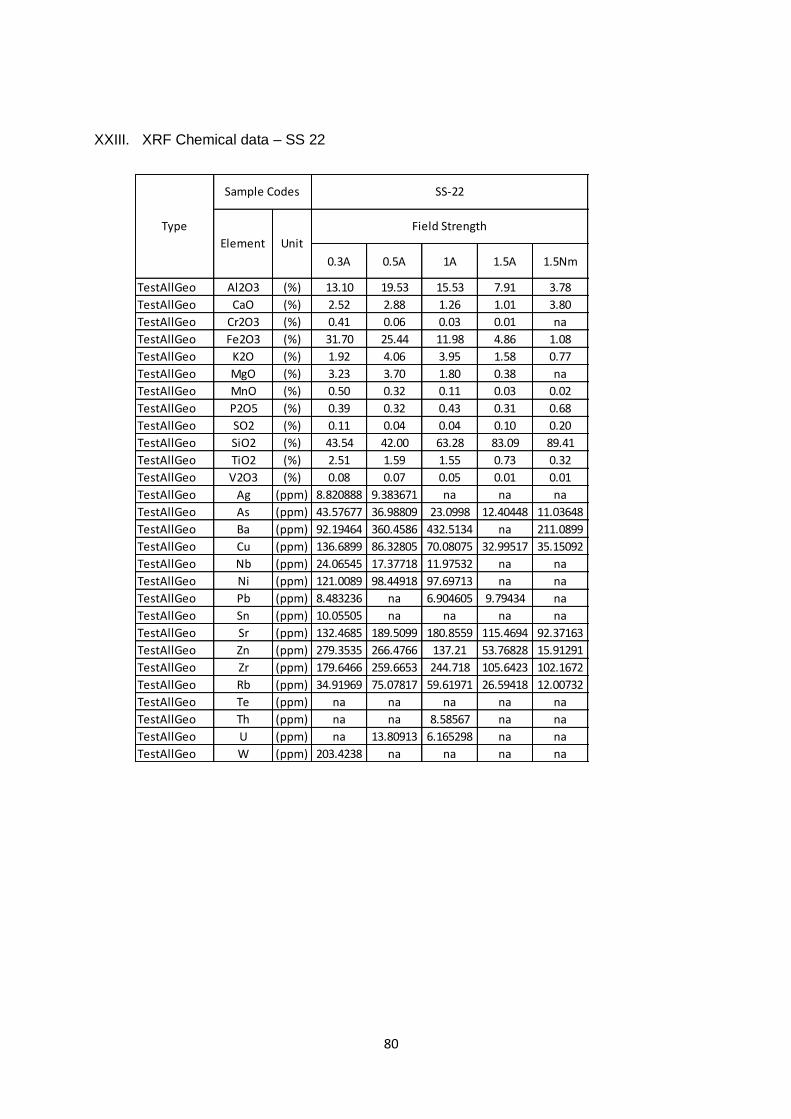
80
XXIII. XRF Chemical data – SS 22
0.3A 0.5A 1A 1.5A 1.5Nm
TestAllGeo Al2O3 (%) 13.10 19.53 15.53 7.91 3.78
TestAllGeo CaO (%) 2.52 2.88 1.26 1.01 3.80
TestAllGeo Cr2O3 (%) 0.41 0.06 0.03 0.01 na
TestAllGeo Fe2O3 (%) 31.70 25.44 11.98 4.86 1.08
TestAllGeo K2O (%) 1.92 4.06 3.95 1.58 0.77
TestAllGeo MgO (%) 3.23 3.70 1.80 0.38 na
TestAllGeo MnO (%) 0.50 0.32 0.11 0.03 0.02
TestAllGeo P2O5 (%) 0.39 0.32 0.43 0.31 0.68
TestAllGeo SO2 (%) 0.11 0.04 0.04 0.10 0.20
TestAllGeo SiO2 (%) 43.54 42.00 63.28 83.09 89.41
TestAllGeo TiO2 (%) 2.51 1.59 1.55 0.73 0.32
TestAllGeo V2O3 (%) 0.08 0.07 0.05 0.01 0.01
TestAllGeo Ag (ppm) 8.820888 9.383671 na na na
TestAllGeo As (ppm) 43.57677 36.98809 23.0998 12.40448 11.03648
TestAllGeo Ba (ppm) 92.19464 360.4586 432.5134 na 211.0899
TestAllGeo Cu (ppm) 136.6899 86.32805 70.08075 32.99517 35.15092
TestAllGeo Nb (ppm) 24.06545 17.37718 11.97532 na na
TestAllGeo Ni (ppm) 121.0089 98.44918 97.69713 na na
TestAllGeo Pb (ppm) 8.483236 na 6.904605 9.79434 na
TestAllGeo Sn (ppm) 10.05505 na na na na
TestAllGeo Sr (ppm) 132.4685 189.5099 180.8559 115.4694 92.37163
TestAllGeo Zn (ppm) 279.3535 266.4766 137.21 53.76828 15.91291
TestAllGeo Zr (ppm) 179.6466 259.6653 244.718 105.6423 102.1672
TestAllGeo Rb (ppm) 34.91969 75.07817 59.61971 26.59418 12.00732
TestAllGeo Te (ppm) na na na na na
TestAllGeo Th (ppm) na na 8.58567 na na
TestAllGeo U (ppm) na 13.80913 6.165298 na na
TestAllGeo W (ppm) 203.4238 na na na na
Field Strength
SS-22
Type
Sample Codes
Element Unit
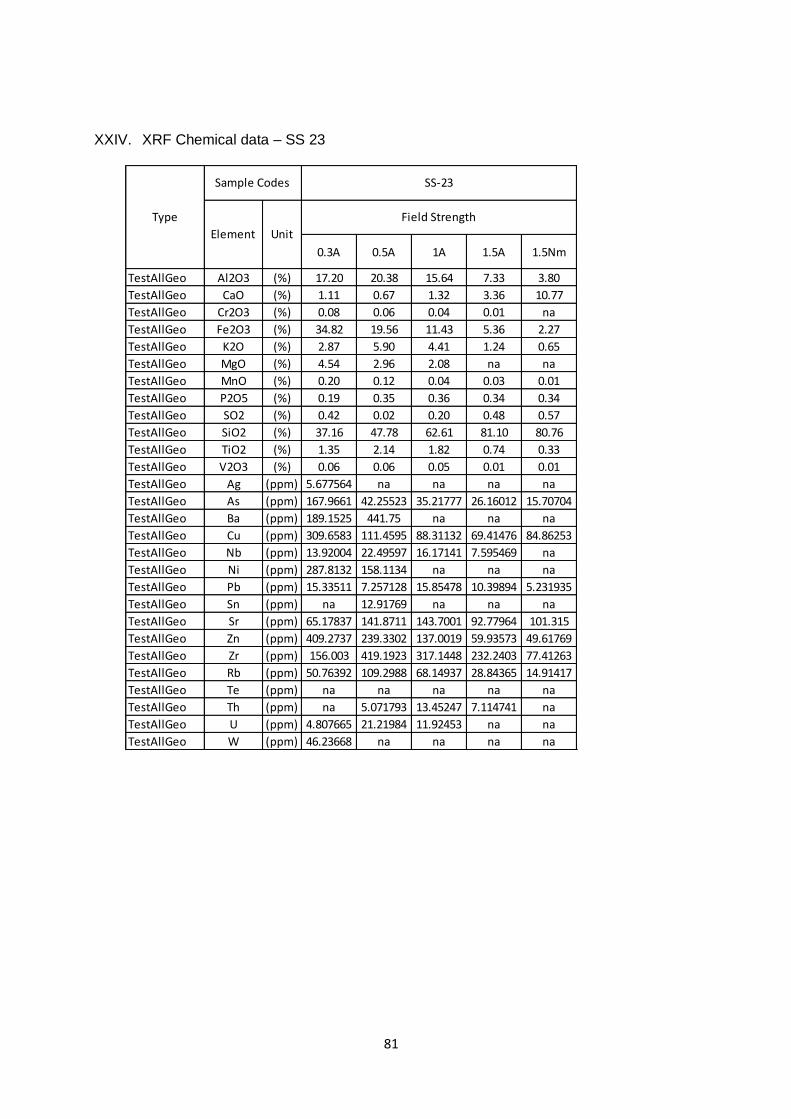
81
XXIV. XRF Chemical data – SS 23
0.3A 0.5A 1A 1.5A 1.5Nm
TestAllGeo Al2O3 (%) 17.20 20.38 15.64 7.33 3.80
TestAllGeo CaO (%) 1.11 0.67 1.32 3.36 10.77
TestAllGeo Cr2O3 (%) 0.08 0.06 0.04 0.01 na
TestAllGeo Fe2O3 (%) 34.82 19.56 11.43 5.36 2.27
TestAllGeo K2O (%) 2.87 5.90 4.41 1.24 0.65
TestAllGeo MgO (%) 4.54 2.96 2.08 na na
TestAllGeo MnO (%) 0.20 0.12 0.04 0.03 0.01
TestAllGeo P2O5 (%) 0.19 0.35 0.36 0.34 0.34
TestAllGeo SO2 (%) 0.42 0.02 0.20 0.48 0.57
TestAllGeo SiO2 (%) 37.16 47.78 62.61 81.10 80.76
TestAllGeo TiO2 (%) 1.35 2.14 1.82 0.74 0.33
TestAllGeo V2O3 (%) 0.06 0.06 0.05 0.01 0.01
TestAllGeo Ag (ppm) 5.677564 na na na na
TestAllGeo As (ppm) 167.9661 42.25523 35.21777 26.16012 15.70704
TestAllGeo Ba (ppm) 189.1525 441.75 na na na
TestAllGeo Cu (ppm) 309.6583 111.4595 88.31132 69.41476 84.86253
TestAllGeo Nb (ppm) 13.92004 22.49597 16.17141 7.595469 na
TestAllGeo Ni (ppm) 287.8132 158.1134 na na na
TestAllGeo Pb (ppm) 15.33511 7.257128 15.85478 10.39894 5.231935
TestAllGeo Sn (ppm) na 12.91769 na na na
TestAllGeo Sr (ppm) 65.17837 141.8711 143.7001 92.77964 101.315
TestAllGeo Zn (ppm) 409.2737 239.3302 137.0019 59.93573 49.61769
TestAllGeo Zr (ppm) 156.003 419.1923 317.1448 232.2403 77.41263
TestAllGeo Rb (ppm) 50.76392 109.2988 68.14937 28.84365 14.91417
TestAllGeo Te (ppm) na na na na na
TestAllGeo Th (ppm) na 5.071793 13.45247 7.114741 na
TestAllGeo U (ppm) 4.807665 21.21984 11.92453 na na
TestAllGeo W (ppm) 46.23668 na na na na
Field Strength
SS-23
Type
Sample Codes
Element Unit
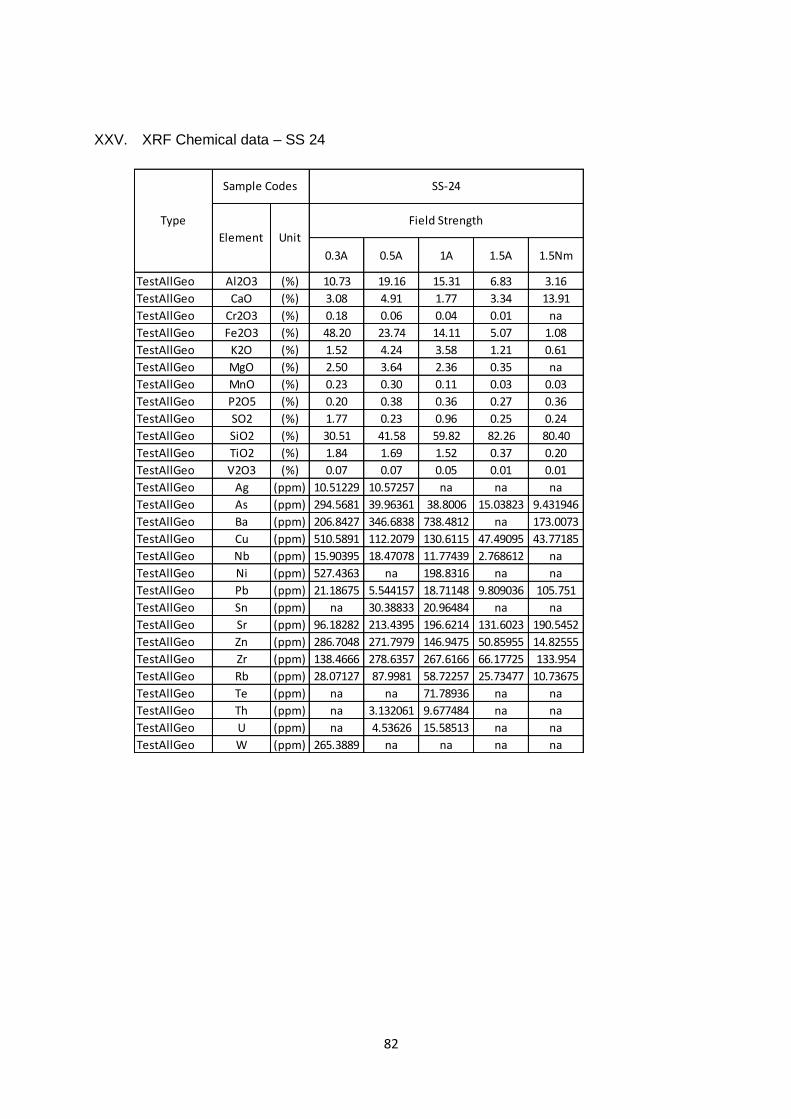
82
XXV. XRF Chemical data – SS 24
0.3A 0.5A 1A 1.5A 1.5Nm
TestAllGeo Al2O3 (%) 10.73 19.16 15.31 6.83 3.16
TestAllGeo CaO (%) 3.08 4.91 1.77 3.34 13.91
TestAllGeo Cr2O3 (%) 0.18 0.06 0.04 0.01 na
TestAllGeo Fe2O3 (%) 48.20 23.74 14.11 5.07 1.08
TestAllGeo K2O (%) 1.52 4.24 3.58 1.21 0.61
TestAllGeo MgO (%) 2.50 3.64 2.36 0.35 na
TestAllGeo MnO (%) 0.23 0.30 0.11 0.03 0.03
TestAllGeo P2O5 (%) 0.20 0.38 0.36 0.27 0.36
TestAllGeo SO2 (%) 1.77 0.23 0.96 0.25 0.24
TestAllGeo SiO2 (%) 30.51 41.58 59.82 82.26 80.40
TestAllGeo TiO2 (%) 1.84 1.69 1.52 0.37 0.20
TestAllGeo V2O3 (%) 0.07 0.07 0.05 0.01 0.01
TestAllGeo Ag (ppm) 10.51229 10.57257 na na na
TestAllGeo As (ppm) 294.5681 39.96361 38.8006 15.03823 9.431946
TestAllGeo Ba (ppm) 206.8427 346.6838 738.4812 na 173.0073
TestAllGeo Cu (ppm) 510.5891 112.2079 130.6115 47.49095 43.77185
TestAllGeo Nb (ppm) 15.90395 18.47078 11.77439 2.768612 na
TestAllGeo Ni (ppm) 527.4363 na 198.8316 na na
TestAllGeo Pb (ppm) 21.18675 5.544157 18.71148 9.809036 105.751
TestAllGeo Sn (ppm) na 30.38833 20.96484 na na
TestAllGeo Sr (ppm) 96.18282 213.4395 196.6214 131.6023 190.5452
TestAllGeo Zn (ppm) 286.7048 271.7979 146.9475 50.85955 14.82555
TestAllGeo Zr (ppm) 138.4666 278.6357 267.6166 66.17725 133.954
TestAllGeo Rb (ppm) 28.07127 87.9981 58.72257 25.73477 10.73675
TestAllGeo Te (ppm) na na 71.78936 na na
TestAllGeo Th (ppm) na 3.132061 9.677484 na na
TestAllGeo U (ppm) na 4.53626 15.58513 na na
TestAllGeo W (ppm) 265.3889 na na na na
Field Strength
SS-24
Type
Sample Codes
Element Unit
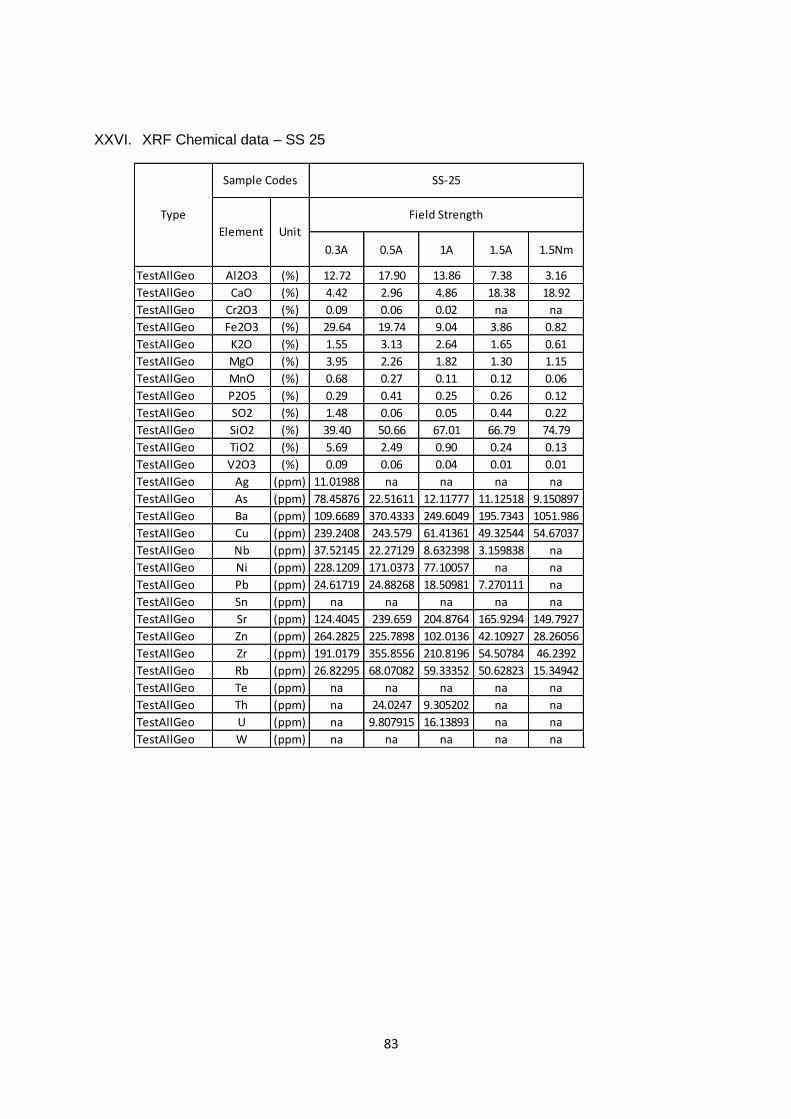
83
XXVI. XRF Chemical data – SS 25
0.3A 0.5A 1A 1.5A 1.5Nm
TestAllGeo Al2O3 (%) 12.72 17.90 13.86 7.38 3.16
TestAllGeo CaO (%) 4.42 2.96 4.86 18.38 18.92
TestAllGeo Cr2O3 (%) 0.09 0.06 0.02 na na
TestAllGeo Fe2O3 (%) 29.64 19.74 9.04 3.86 0.82
TestAllGeo K2O (%) 1.55 3.13 2.64 1.65 0.61
TestAllGeo MgO (%) 3.95 2.26 1.82 1.30 1.15
TestAllGeo MnO (%) 0.68 0.27 0.11 0.12 0.06
TestAllGeo P2O5 (%) 0.29 0.41 0.25 0.26 0.12
TestAllGeo SO2 (%) 1.48 0.06 0.05 0.44 0.22
TestAllGeo SiO2 (%) 39.40 50.66 67.01 66.79 74.79
TestAllGeo TiO2 (%) 5.69 2.49 0.90 0.24 0.13
TestAllGeo V2O3 (%) 0.09 0.06 0.04 0.01 0.01
TestAllGeo Ag (ppm) 11.01988 na na na na
TestAllGeo As (ppm) 78.45876 22.51611 12.11777 11.12518 9.150897
TestAllGeo Ba (ppm) 109.6689 370.4333 249.6049 195.7343 1051.986
TestAllGeo Cu (ppm) 239.2408 243.579 61.41361 49.32544 54.67037
TestAllGeo Nb (ppm) 37.52145 22.27129 8.632398 3.159838 na
TestAllGeo Ni (ppm) 228.1209 171.0373 77.10057 na na
TestAllGeo Pb (ppm) 24.61719 24.88268 18.50981 7.270111 na
TestAllGeo Sn (ppm) na na na na na
TestAllGeo Sr (ppm) 124.4045 239.659 204.8764 165.9294 149.7927
TestAllGeo Zn (ppm) 264.2825 225.7898 102.0136 42.10927 28.26056
TestAllGeo Zr (ppm) 191.0179 355.8556 210.8196 54.50784 46.2392
TestAllGeo Rb (ppm) 26.82295 68.07082 59.33352 50.62823 15.34942
TestAllGeo Te (ppm) na na na na na
TestAllGeo Th (ppm) na 24.0247 9.305202 na na
TestAllGeo U (ppm) na 9.807915 16.13893 na na
TestAllGeo W (ppm) na na na na na
Field Strength
SS-25
Type
Sample Codes
Element Unit
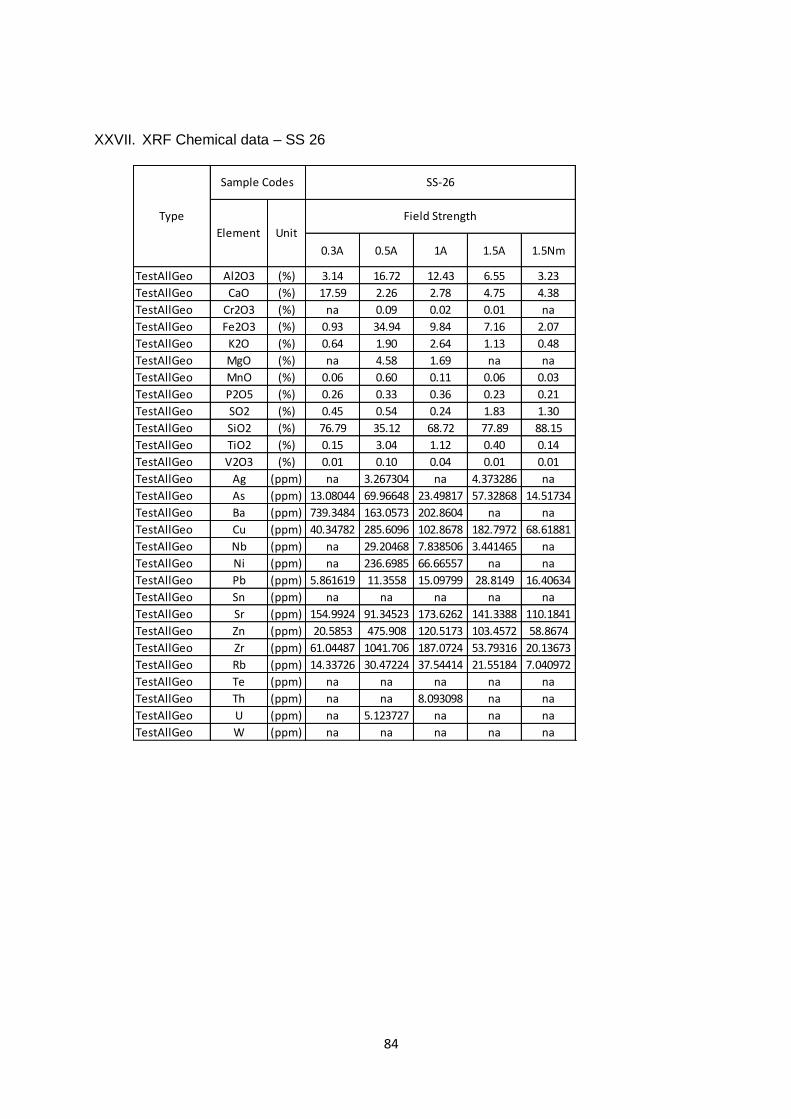
84
XXVII. XRF Chemical data – SS 26
0.3A 0.5A 1A 1.5A 1.5Nm
TestAllGeo Al2O3 (%) 3.14 16.72 12.43 6.55 3.23
TestAllGeo CaO (%) 17.59 2.26 2.78 4.75 4.38
TestAllGeo Cr2O3 (%) na 0.09 0.02 0.01 na
TestAllGeo Fe2O3 (%) 0.93 34.94 9.84 7.16 2.07
TestAllGeo K2O (%) 0.64 1.90 2.64 1.13 0.48
TestAllGeo MgO (%) na 4.58 1.69 na na
TestAllGeo MnO (%) 0.06 0.60 0.11 0.06 0.03
TestAllGeo P2O5 (%) 0.26 0.33 0.36 0.23 0.21
TestAllGeo SO2 (%) 0.45 0.54 0.24 1.83 1.30
TestAllGeo SiO2 (%) 76.79 35.12 68.72 77.89 88.15
TestAllGeo TiO2 (%) 0.15 3.04 1.12 0.40 0.14
TestAllGeo V2O3 (%) 0.01 0.10 0.04 0.01 0.01
TestAllGeo Ag (ppm) na 3.267304 na 4.373286 na
TestAllGeo As (ppm) 13.08044 69.96648 23.49817 57.32868 14.51734
TestAllGeo Ba (ppm) 739.3484 163.0573 202.8604 na na
TestAllGeo Cu (ppm) 40.34782 285.6096 102.8678 182.7972 68.61881
TestAllGeo Nb (ppm) na 29.20468 7.838506 3.441465 na
TestAllGeo Ni (ppm) na 236.6985 66.66557 na na
TestAllGeo Pb (ppm) 5.861619 11.3558 15.09799 28.8149 16.40634
TestAllGeo Sn (ppm) na na na na na
TestAllGeo Sr (ppm) 154.9924 91.34523 173.6262 141.3388 110.1841
TestAllGeo Zn (ppm) 20.5853 475.908 120.5173 103.4572 58.8674
TestAllGeo Zr (ppm) 61.04487 1041.706 187.0724 53.79316 20.13673
TestAllGeo Rb (ppm) 14.33726 30.47224 37.54414 21.55184 7.040972
TestAllGeo Te (ppm) na na na na na
TestAllGeo Th (ppm) na na 8.093098 na na
TestAllGeo U (ppm) na 5.123727 na na na
TestAllGeo W (ppm) na na na na na
Field Strength
SS-26
Type
Sample Codes
Element Unit
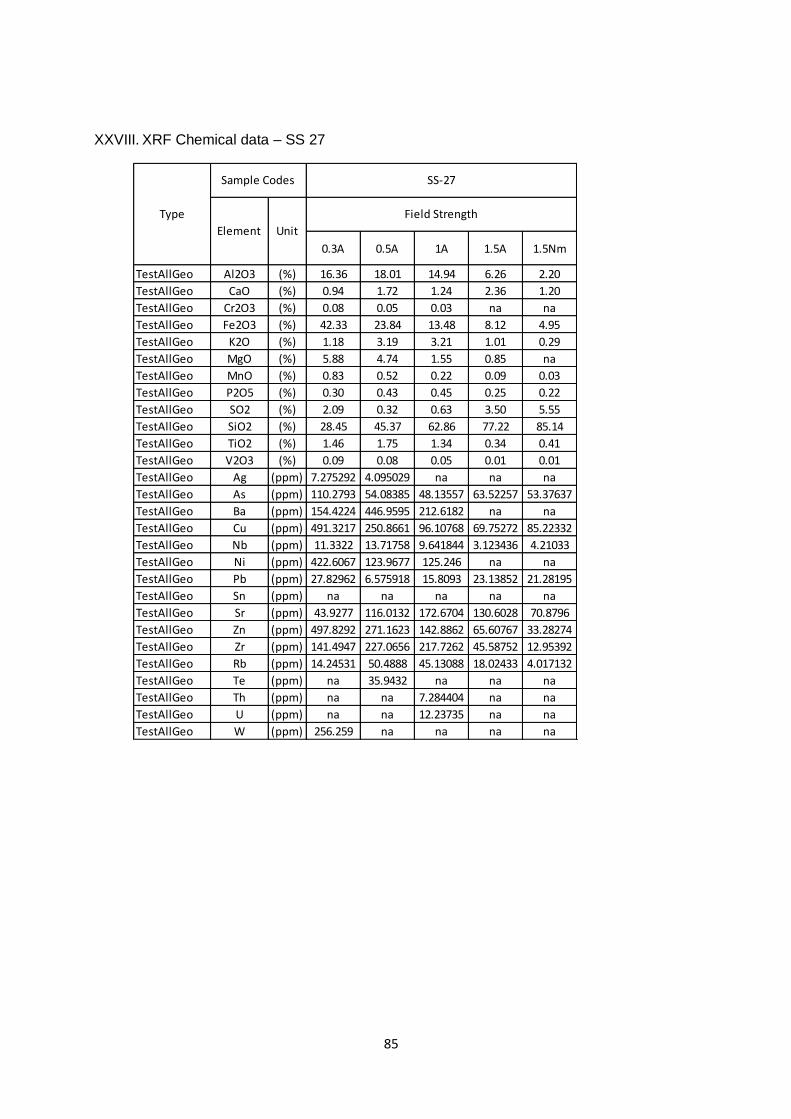
85
XXVIII. XRF Chemical data – SS 27
0.3A 0.5A 1A 1.5A 1.5Nm
TestAllGeo Al2O3 (%) 16.36 18.01 14.94 6.26 2.20
TestAllGeo CaO (%) 0.94 1.72 1.24 2.36 1.20
TestAllGeo Cr2O3 (%) 0.08 0.05 0.03 na na
TestAllGeo Fe2O3 (%) 42.33 23.84 13.48 8.12 4.95
TestAllGeo K2O (%) 1.18 3.19 3.21 1.01 0.29
TestAllGeo MgO (%) 5.88 4.74 1.55 0.85 na
TestAllGeo MnO (%) 0.83 0.52 0.22 0.09 0.03
TestAllGeo P2O5 (%) 0.30 0.43 0.45 0.25 0.22
TestAllGeo SO2 (%) 2.09 0.32 0.63 3.50 5.55
TestAllGeo SiO2 (%) 28.45 45.37 62.86 77.22 85.14
TestAllGeo TiO2 (%) 1.46 1.75 1.34 0.34 0.41
TestAllGeo V2O3 (%) 0.09 0.08 0.05 0.01 0.01
TestAllGeo Ag (ppm) 7.275292 4.095029 na na na
TestAllGeo As (ppm) 110.2793 54.08385 48.13557 63.52257 53.37637
TestAllGeo Ba (ppm) 154.4224 446.9595 212.6182 na na
TestAllGeo Cu (ppm) 491.3217 250.8661 96.10768 69.75272 85.22332
TestAllGeo Nb (ppm) 11.3322 13.71758 9.641844 3.123436 4.21033
TestAllGeo Ni (ppm) 422.6067 123.9677 125.246 na na
TestAllGeo Pb (ppm) 27.82962 6.575918 15.8093 23.13852 21.28195
TestAllGeo Sn (ppm) na na na na na
TestAllGeo Sr (ppm) 43.9277 116.0132 172.6704 130.6028 70.8796
TestAllGeo Zn (ppm) 497.8292 271.1623 142.8862 65.60767 33.28274
TestAllGeo Zr (ppm) 141.4947 227.0656 217.7262 45.58752 12.95392
TestAllGeo Rb (ppm) 14.24531 50.4888 45.13088 18.02433 4.017132
TestAllGeo Te (ppm) na 35.9432 na na na
TestAllGeo Th (ppm) na na 7.284404 na na
TestAllGeo U (ppm) na na 12.23735 na na
TestAllGeo W (ppm) 256.259 na na na na
Field Strength
SS-27
Type
Sample Codes
Element Unit
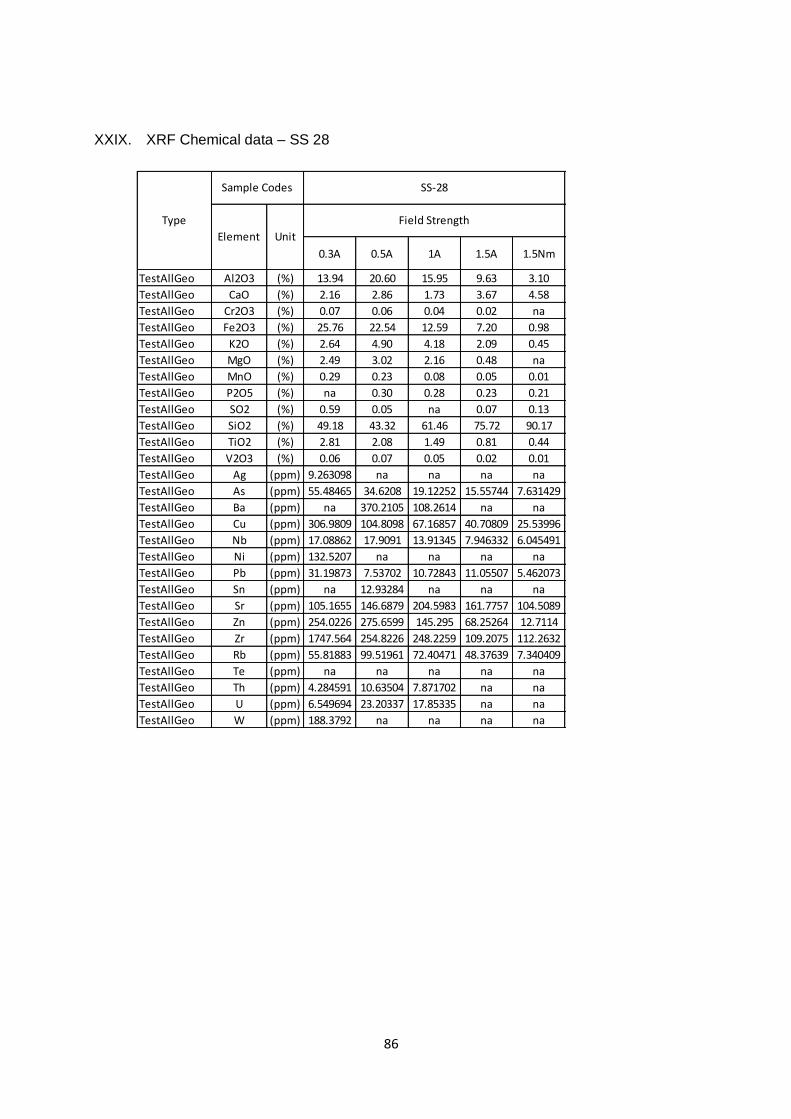
86
XXIX. XRF Chemical data – SS 28
0.3A 0.5A 1A 1.5A 1.5Nm
TestAllGeo Al2O3 (%) 13.94 20.60 15.95 9.63 3.10
TestAllGeo CaO (%) 2.16 2.86 1.73 3.67 4.58
TestAllGeo Cr2O3 (%) 0.07 0.06 0.04 0.02 na
TestAllGeo Fe2O3 (%) 25.76 22.54 12.59 7.20 0.98
TestAllGeo K2O (%) 2.64 4.90 4.18 2.09 0.45
TestAllGeo MgO (%) 2.49 3.02 2.16 0.48 na
TestAllGeo MnO (%) 0.29 0.23 0.08 0.05 0.01
TestAllGeo P2O5 (%) na 0.30 0.28 0.23 0.21
TestAllGeo SO2 (%) 0.59 0.05 na 0.07 0.13
TestAllGeo SiO2 (%) 49.18 43.32 61.46 75.72 90.17
TestAllGeo TiO2 (%) 2.81 2.08 1.49 0.81 0.44
TestAllGeo V2O3 (%) 0.06 0.07 0.05 0.02 0.01
TestAllGeo Ag (ppm) 9.263098 na na na na
TestAllGeo As (ppm) 55.48465 34.6208 19.12252 15.55744 7.631429
TestAllGeo Ba (ppm) na 370.2105 108.2614 na na
TestAllGeo Cu (ppm) 306.9809 104.8098 67.16857 40.70809 25.53996
TestAllGeo Nb (ppm) 17.08862 17.9091 13.91345 7.946332 6.045491
TestAllGeo Ni (ppm) 132.5207 na na na na
TestAllGeo Pb (ppm) 31.19873 7.53702 10.72843 11.05507 5.462073
TestAllGeo Sn (ppm) na 12.93284 na na na
TestAllGeo Sr (ppm) 105.1655 146.6879 204.5983 161.7757 104.5089
TestAllGeo Zn (ppm) 254.0226 275.6599 145.295 68.25264 12.7114
TestAllGeo Zr (ppm) 1747.564 254.8226 248.2259 109.2075 112.2632
TestAllGeo Rb (ppm) 55.81883 99.51961 72.40471 48.37639 7.340409
TestAllGeo Te (ppm) na na na na na
TestAllGeo Th (ppm) 4.284591 10.63504 7.871702 na na
TestAllGeo U (ppm) 6.549694 23.20337 17.85335 na na
TestAllGeo W (ppm) 188.3792 na na na na
Field Strength
SS-28
Type
Sample Codes
Element Unit

87
XXX. XRF Chemical data – SS 29
0.3A 0.5A 1A 1.5A 1.5Nm
TestAllGeo Al2O3 (%) 14.89 20.38 14.06 7.47 4.38
TestAllGeo CaO (%) 3.07 3.58 2.72 7.51 6.27
TestAllGeo Cr2O3 (%) 0.06 0.06 0.03 0.01 0.01
TestAllGeo Fe2O3 (%) 40.23 19.74 9.94 4.10 1.96
TestAllGeo K2O (%) 1.50 4.84 3.21 1.52 0.88
TestAllGeo MgO (%) 3.92 3.04 2.05 1.16 na
TestAllGeo MnO (%) 0.29 0.19 0.06 0.03 0.03
TestAllGeo P2O5 (%) 0.19 0.41 0.29 0.26 0.87
TestAllGeo SO2 (%) 1.31 0.18 0.33 0.33 0.05
TestAllGeo SiO2 (%) 32.80 45.46 66.12 77.94 84.35
TestAllGeo TiO2 (%) 1.68 2.07 1.15 0.44 1.18
TestAllGeo V2O3 (%) 0.07 0.06 0.03 0.01 0.01
TestAllGeo Ag (ppm) 12.73192 na na na na
TestAllGeo As (ppm) 112.5229 50.07901 32.88666 22.46014 14.30225
TestAllGeo Ba (ppm) na 524.6617 na na na
TestAllGeo Cu (ppm) 421.7811 91.04756 57.2776 28.87099 39.19867
TestAllGeo Nb (ppm) 15.36235 19.48584 12.06519 4.181918 3.450156
TestAllGeo Ni (ppm) 398.2764 175.5744 na na na
TestAllGeo Pb (ppm) 18.3996 15.3538 12.20556 9.844175 9.668494
TestAllGeo Sn (ppm) na na na na na
TestAllGeo Sr (ppm) 110.3728 263.8824 180.0249 192.8692 134.6251
TestAllGeo Zn (ppm) 381.779 227.3003 110.2024 41.55422 29.7204
TestAllGeo Zr (ppm) 130.1707 361.5325 205.7481 77.28491 192.1229
TestAllGeo Rb (ppm) 25.34519 88.48902 44.01742 31.20701 15.88145
TestAllGeo Te (ppm) na na na na na
TestAllGeo Th (ppm) na 12.71501 6.898314 na 2.458218
TestAllGeo U (ppm) na 22.57649 10.71339 na na
TestAllGeo W (ppm) 234.1932 na na na na
Field Strength
SS-29
Type
Sample Codes
Element Unit

88
XXXI. XRF Chemical data – SS 30
0.3A 0.5A 1A 1.5A 1.5Nm
TestAllGeo Al2O3 (%) 15.42 19.24 13.61 6.78 3.87
TestAllGeo CaO (%) 11.46 3.89 2.19 3.50 6.08
TestAllGeo Cr2O3 (%) 0.06 0.05 0.03 0.01 na
TestAllGeo Fe2O3 (%) 32.52 17.90 10.63 8.10 5.71
TestAllGeo K2O (%) 1.99 4.64 2.96 1.15 0.63
TestAllGeo MgO (%) 3.88 2.62 1.36 0.34 na
TestAllGeo MnO (%) 0.47 0.18 0.05 0.02 0.02
TestAllGeo P2O5 (%) 0.36 0.41 0.38 0.27 0.31
TestAllGeo SO2 (%) 0.93 0.29 0.83 4.75 4.73
TestAllGeo SiO2 (%) 31.12 48.84 66.74 74.65 76.37
TestAllGeo TiO2 (%) 1.72 1.88 1.17 0.43 2.27
TestAllGeo V2O3 (%) 0.07 0.06 0.04 0.01 0.02
TestAllGeo Ag (ppm) 12.08776 na na na na
TestAllGeo As (ppm) 120.0414 38.22162 24.12312 49.00845 36.40249
TestAllGeo Ba (ppm) na 480.4325 na na na
TestAllGeo Cu (ppm) 306.7968 132.261 114.2655 95.07345 167.644
TestAllGeo Nb (ppm) 15.76511 17.33735 9.191349 3.26905 5.950562
TestAllGeo Ni (ppm) 144.0812 119.2855 66.04932 53.75111 na
TestAllGeo Pb (ppm) 34.1383 15.29945 16.23321 23.77207 13.34868
TestAllGeo Sn (ppm) 14.68697 na na na na
TestAllGeo Sr (ppm) 336.5259 298.0518 182.0715 156.0475 160.6236
TestAllGeo Zn (ppm) 437.2996 211.685 133.0374 61.35703 65.0387
TestAllGeo Zr (ppm) 200.0309 357.637 199.7037 68.54363 104.1608
TestAllGeo Rb (ppm) 31.01922 83.49026 41.5853 20.83833 12.57904
TestAllGeo Te (ppm) na na na na na
TestAllGeo Th (ppm) na 14.44587 na 2.09706 na
TestAllGeo U (ppm) na 21.61304 15.82091 na na
TestAllGeo W (ppm) na na na na na
Field Strength
SS-30
Type
Sample Codes
Element Unit
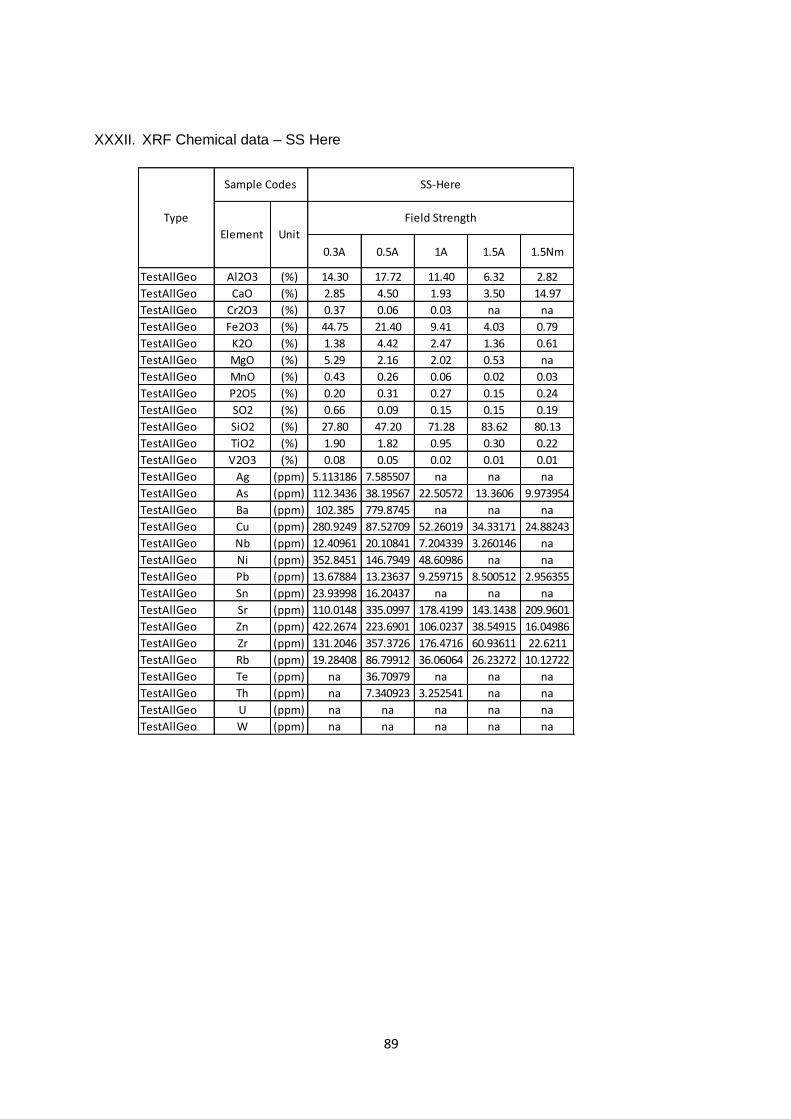
89
XXXII. XRF Chemical data – SS Here
0.3A 0.5A 1A 1.5A 1.5Nm
TestAllGeo Al2O3 (%) 14.30 17.72 11.40 6.32 2.82
TestAllGeo CaO (%) 2.85 4.50 1.93 3.50 14.97
TestAllGeo Cr2O3 (%) 0.37 0.06 0.03 na na
TestAllGeo Fe2O3 (%) 44.75 21.40 9.41 4.03 0.79
TestAllGeo K2O (%) 1.38 4.42 2.47 1.36 0.61
TestAllGeo MgO (%) 5.29 2.16 2.02 0.53 na
TestAllGeo MnO (%) 0.43 0.26 0.06 0.02 0.03
TestAllGeo P2O5 (%) 0.20 0.31 0.27 0.15 0.24
TestAllGeo SO2 (%) 0.66 0.09 0.15 0.15 0.19
TestAllGeo SiO2 (%) 27.80 47.20 71.28 83.62 80.13
TestAllGeo TiO2 (%) 1.90 1.82 0.95 0.30 0.22
TestAllGeo V2O3 (%) 0.08 0.05 0.02 0.01 0.01
TestAllGeo Ag (ppm) 5.113186 7.585507 na na na
TestAllGeo As (ppm) 112.3436 38.19567 22.50572 13.3606 9.973954
TestAllGeo Ba (ppm) 102.385 779.8745 na na na
TestAllGeo Cu (ppm) 280.9249 87.52709 52.26019 34.33171 24.88243
TestAllGeo Nb (ppm) 12.40961 20.10841 7.204339 3.260146 na
TestAllGeo Ni (ppm) 352.8451 146.7949 48.60986 na na
TestAllGeo Pb (ppm) 13.67884 13.23637 9.259715 8.500512 2.956355
TestAllGeo Sn (ppm) 23.93998 16.20437 na na na
TestAllGeo Sr (ppm) 110.0148 335.0997 178.4199 143.1438 209.9601
TestAllGeo Zn (ppm) 422.2674 223.6901 106.0237 38.54915 16.04986
TestAllGeo Zr (ppm) 131.2046 357.3726 176.4716 60.93611 22.6211
TestAllGeo Rb (ppm) 19.28408 86.79912 36.06064 26.23272 10.12722
TestAllGeo Te (ppm) na 36.70979 na na na
TestAllGeo Th (ppm) na 7.340923 3.252541 na na
TestAllGeo U (ppm) na na na na na
TestAllGeo W (ppm) na na na na na
Field Strength
SS-Here
Type
Sample Codes
Element Unit
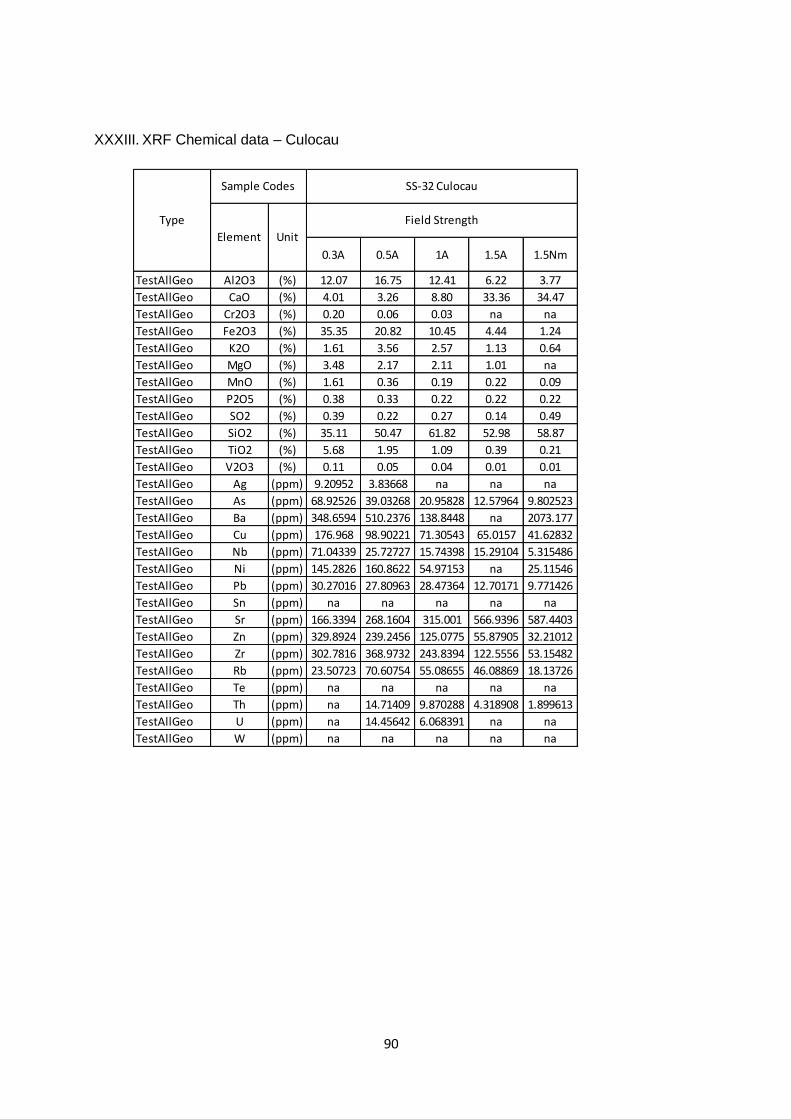
90
XXXIII. XRF Chemical data – Culocau
0.3A 0.5A 1A 1.5A 1.5Nm
TestAllGeo Al2O3 (%) 12.07 16.75 12.41 6.22 3.77
TestAllGeo CaO (%) 4.01 3.26 8.80 33.36 34.47
TestAllGeo Cr2O3 (%) 0.20 0.06 0.03 na na
TestAllGeo Fe2O3 (%) 35.35 20.82 10.45 4.44 1.24
TestAllGeo K2O (%) 1.61 3.56 2.57 1.13 0.64
TestAllGeo MgO (%) 3.48 2.17 2.11 1.01 na
TestAllGeo MnO (%) 1.61 0.36 0.19 0.22 0.09
TestAllGeo P2O5 (%) 0.38 0.33 0.22 0.22 0.22
TestAllGeo SO2 (%) 0.39 0.22 0.27 0.14 0.49
TestAllGeo SiO2 (%) 35.11 50.47 61.82 52.98 58.87
TestAllGeo TiO2 (%) 5.68 1.95 1.09 0.39 0.21
TestAllGeo V2O3 (%) 0.11 0.05 0.04 0.01 0.01
TestAllGeo Ag (ppm) 9.20952 3.83668 na na na
TestAllGeo As (ppm) 68.92526 39.03268 20.95828 12.57964 9.802523
TestAllGeo Ba (ppm) 348.6594 510.2376 138.8448 na 2073.177
TestAllGeo Cu (ppm) 176.968 98.90221 71.30543 65.0157 41.62832
TestAllGeo Nb (ppm) 71.04339 25.72727 15.74398 15.29104 5.315486
TestAllGeo Ni (ppm) 145.2826 160.8622 54.97153 na 25.11546
TestAllGeo Pb (ppm) 30.27016 27.80963 28.47364 12.70171 9.771426
TestAllGeo Sn (ppm) na na na na na
TestAllGeo Sr (ppm) 166.3394 268.1604 315.001 566.9396 587.4403
TestAllGeo Zn (ppm) 329.8924 239.2456 125.0775 55.87905 32.21012
TestAllGeo Zr (ppm) 302.7816 368.9732 243.8394 122.5556 53.15482
TestAllGeo Rb (ppm) 23.50723 70.60754 55.08655 46.08869 18.13726
TestAllGeo Te (ppm) na na na na na
TestAllGeo Th (ppm) na 14.71409 9.870288 4.318908 1.899613
TestAllGeo U (ppm) na 14.45642 6.068391 na na
TestAllGeo W (ppm) na na na na na
Field Strength
SS-32 Culocau
Type
Sample Codes
Element Unit


![[Pires H. Abdullah] - web.uod.acweb.uod.ac/documents/545/Pires-C.V..pdf · Certification This is to certify that Mr. Pires Husamuldeen Abdullah has successfúlly passed the English](https://img.pdfslide.us/doc/110x75/5fda441099a989635c44ee71/pires-h-abdullah-webuodacwebuodacdocuments545pires-cvpdf-certification.jpg)