Embed Size (px)
Citation preview

Jon Krosnick: Good morning. I think we can start. So we have a little shuffling of the cast of characters, some folks had to move back into their obligations of life and we have some new people with us today. And we have some people on the computer who will be with us. Our first presentation this morning is by me and it’s about questionnaire design. What I am going to do during this presentation is to keep with the themes of the conference and sort of convey a couple of general messages. One is that we know a lot about best practices with regard to questionnaire design but there is also a lot we don’t know and lots of future research that is needed.
Let me say there are people here with us today who are experts in
all of these issues and those who know this literature in detail know that everything I will tell you today has controversy behind it. There are a limited number of studies on each of these points, we need more, but we need to design questionnaires today and tomorrow and the next day before those studies are done. So taking a look at the literature that exists allows us to reach some conclusions about good ways of designing questionnaires as best we can based on current knowledge, but we need more work in lots of ways.
One of the ways I know that we need more work, especially with
the help of NSF is this question right here, which I found on the Xerox machine recycle bin at my office at Ohio State some years ago when it was back in the old days where you printed out your manuscript, went to the Xerox machine, put it in the feeder and made ten, stapled copies that you can send to people. As I am standing there waiting I saw this was in somebody’s questionnaire. When I saw this, I realized how much help the field needs. At least according to my reading of the literature, just about everything that can be suboptimal about this question is suboptimal about this question, the length of the rating scale, the approach to labeling the points, the general approach here, the use of words. And the truth of the matter is, how would this person who is in my office building know that these were bad decisions, where do you look to see that? We haven’t had a single consolidated resource that provides the kind of guide I think we need.
Today I am just going to run through very, very quickly the high
points of some of what I take the literature to suggest about a series of practical decisions. We’ll start with a general set of introductory remarks. We’ll talk about open verses closed questions for measuring some phenomenon. We won’t talk about rating verses ranking today; I meant to take that out. We’ll talk about the design of rating scales, how many points to put on the

scale and how to label them. We’ll talk about acquiescence, response bias, the impact of the order of answer choices, whether to offer a don’t know option or not, briefly about question order effects, attitude recall questions, asking why questions and I am going to end with a longer discussion of question wording. I have come to the view that’s where the crises is at the moment. That’s where we need emergency surgery help so we’ll spend some time on that.
Just by way of introduction, I bring to this literature three goals in
evaluating questions and trying to identify the best ways to ask questions. The first is, all other things equal, I would like to minimize administration difficulty. That is, I would like to ask a question that can asked and answered as quickly as possible and I would like respondents to make the fewest completion errors possible. So if we ask them to pick a point on a rating scale on a paper questionnaire we don’t want them circling two or three points saying, “I am somewhere in this range, but I don’t know where”. And lastly all other things equal, we would like respondents to say they enjoyed answering the question and they weren’t very frustrated by it. But, all else is not equal.
When push comes to shove I am happy to compromise all of these
things, I am willing to go longer and have respondents be frustrated if I can maximize the reliability and validity of the measurements.
In most cases we have not seen that kind of tension. The literature
seems to suggest that what goes quickly and easy for respondents also produces the most accurate data, so that’s kind of a nice have your cake and eat it too. That’s frustrating, maybe Dave you can re-angle this because we will have this problem again, just to lower the projector a bit. The goal I would say underlining all the work I am going to tell you is when people answer a question, let’s say we’re trying to measure an attitude, ideally we would like the answer to be driven exclusively by the attitude itself. But we know from this literature that there’s contamination from at least three other sources. Sometimes other constructs from the attitude we care about influence the judgment. If we ask for example, do you approve or disapprove of the Health Care Act passed in 2010 that President Obama proposed? By mentioning him, we get evaluations of him contaminated in the answer in addition to evaluations of the Act.
We would like as little method bias as possible. For example, a
question say, you do like the Health Care Act, don’t you? We
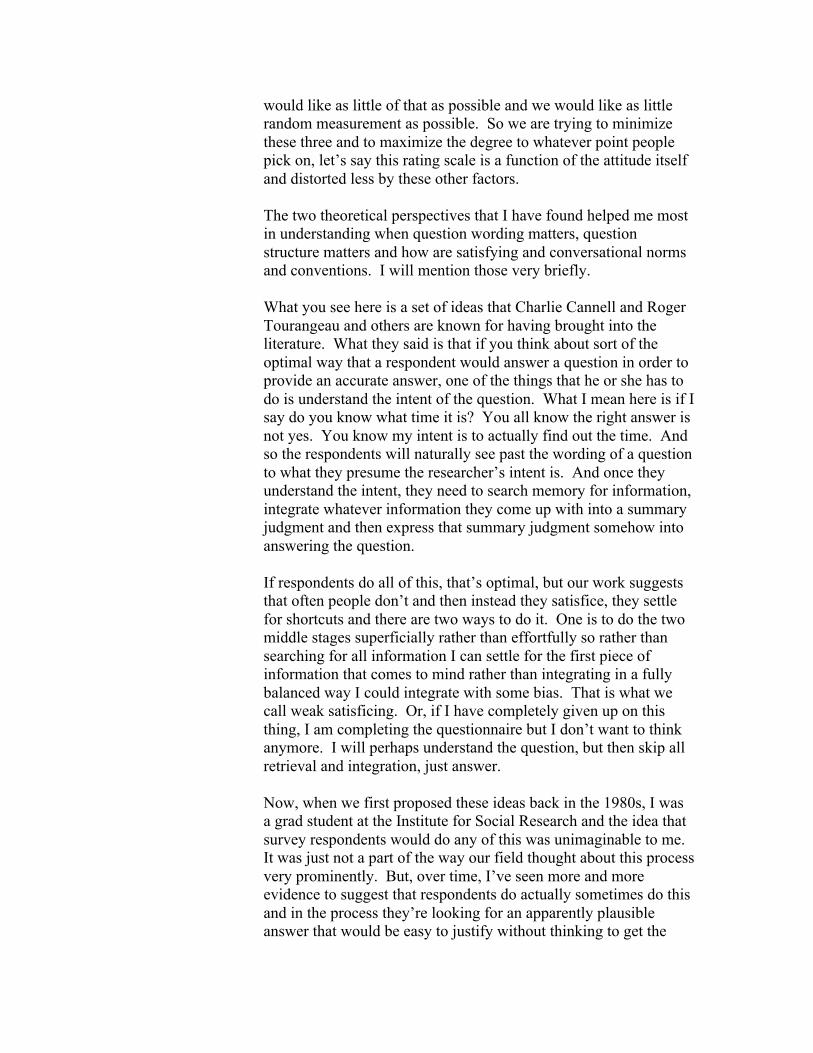
would like as little of that as possible and we would like as little random measurement as possible. So we are trying to minimize these three and to maximize the degree to whatever point people pick on, let’s say this rating scale is a function of the attitude itself and distorted less by these other factors.
The two theoretical perspectives that I have found helped me most
in understanding when question wording matters, question structure matters and how are satisfying and conversational norms and conventions. I will mention those very briefly.
What you see here is a set of ideas that Charlie Cannell and Roger
Tourangeau and others are known for having brought into the literature. What they said is that if you think about sort of the optimal way that a respondent would answer a question in order to provide an accurate answer, one of the things that he or she has to do is understand the intent of the question. What I mean here is if I say do you know what time it is? You all know the right answer is not yes. You know my intent is to actually find out the time. And so the respondents will naturally see past the wording of a question to what they presume the researcher’s intent is. And once they understand the intent, they need to search memory for information, integrate whatever information they come up with into a summary judgment and then express that summary judgment somehow into answering the question.
If respondents do all of this, that’s optimal, but our work suggests that often people don’t and then instead they satisfice, they settle for shortcuts and there are two ways to do it. One is to do the two middle stages superficially rather than effortfully so rather than searching for all information I can settle for the first piece of information that comes to mind rather than integrating in a fully balanced way I could integrate with some bias. That is what we call weak satisficing. Or, if I have completely given up on this thing, I am completing the questionnaire but I don’t want to think anymore. I will perhaps understand the question, but then skip all retrieval and integration, just answer. Now, when we first proposed these ideas back in the 1980s, I was a grad student at the Institute for Social Research and the idea that survey respondents would do any of this was unimaginable to me. It was just not a part of the way our field thought about this process very prominently. But, over time, I’ve seen more and more evidence to suggest that respondents do actually sometimes do this and in the process they’re looking for an apparently plausible answer that would be easy to justify without thinking to get the

interview over with. In order to understand and master this, we’ve proposed that it might happen as a result of three classes of factors, people who find it difficult to think might be inclined to shortcut. People who might be motivated to think might be inclined to shortcut and when we give people a difficult task, they might be inclined to shortcut. That’s the satisficing perspective. The conversational norms and conventions perspective says the following, that a questionnaire is of course a script for a conversation and yet respondents don’t realize that the rules of this conversation are different than the rules of normal conversation, particularly if there is an interviewing sitting in their living room, they think this is a normal human speaking normal English with them in a normal conversation. And, respondents assume that the same rules apply so they’re assuming speakers usually follow the rules and that listeners assume speakers are following the rules. And yet, if questions violate those rules, respondents can be mislead or confused because they misinterpret and this is the real reality of it, that our questions routinely violate the rules of every day conversation. And interestingly, the more effort the respondent devotes to thinking about the questions, the more mislead or confused it appears that he or she will be. These are just a few of the violations that are rampant in the work that we do. In a normal conversation, if I said to you, “How are you doing today?” You said, “Good”. I wouldn’t say, “How are you doing today?” after that. After having asked that once, I wouldn’t ask it again. And yet in surveys, we routinely use multiple questions to measure the same construct, self-esteem, battery of 15 or more items, lots of others that you know. So, what would a respondent do in a situation like that? They say if they ask you 15 questions that are all measuring the same thing, they would say okay, why would you do that? But, if we don’t tell them that, it will be natural for them to think in every day conversation no normal person would do that so these must not be 15 questions asking the same thing, they must be 15 questions designed to ask different things. So respondents would struggle to find ways to interpret them so as to produce those gaps. Another one is, all information provided is relevant and necessary in a conversation. If I am going to tell you some information and ask you to make a judgment in every day conversation I would only tell you information I think is relevant. In a survey, we could describe a VCR, a DVD player that consumers might consider
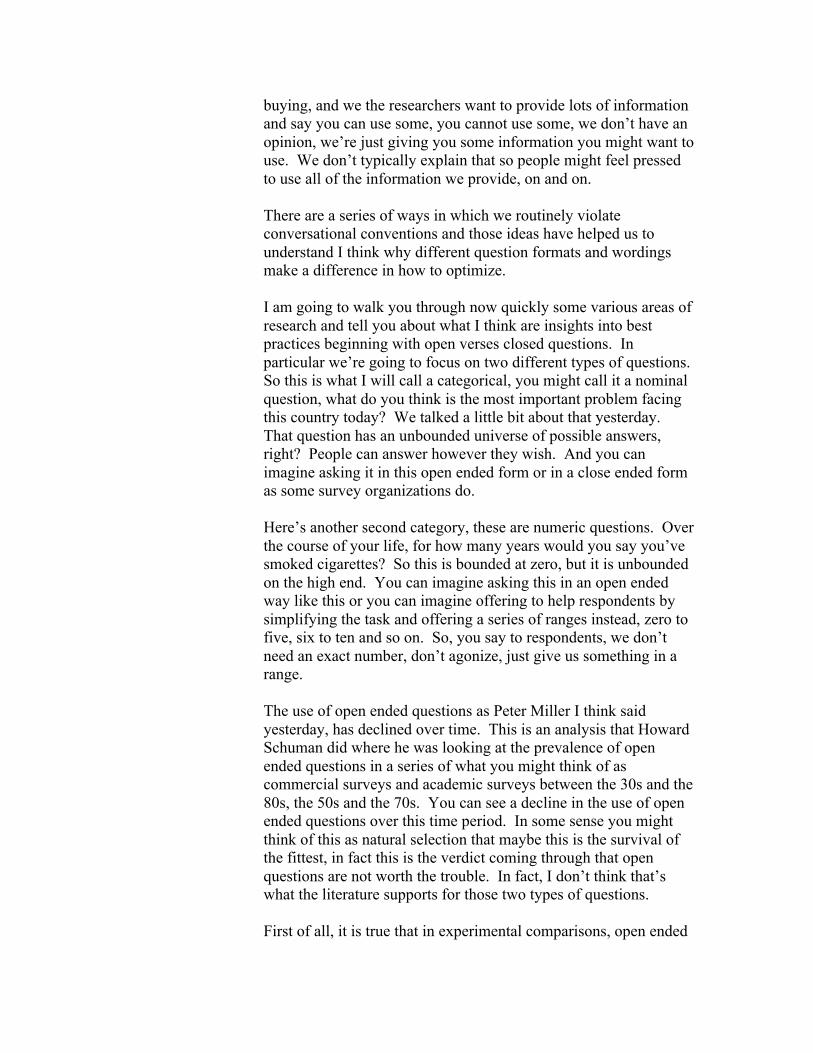
buying, and we the researchers want to provide lots of information and say you can use some, you cannot use some, we don’t have an opinion, we’re just giving you some information you might want to use. We don’t typically explain that so people might feel pressed to use all of the information we provide, on and on. There are a series of ways in which we routinely violate conversational conventions and those ideas have helped us to understand I think why different question formats and wordings make a difference in how to optimize. I am going to walk you through now quickly some various areas of research and tell you about what I think are insights into best practices beginning with open verses closed questions. In particular we’re going to focus on two different types of questions. So this is what I will call a categorical, you might call it a nominal question, what do you think is the most important problem facing this country today? We talked a little bit about that yesterday. That question has an unbounded universe of possible answers, right? People can answer however they wish. And you can imagine asking it in this open ended form or in a close ended form as some survey organizations do. Here’s another second category, these are numeric questions. Over the course of your life, for how many years would you say you’ve smoked cigarettes? So this is bounded at zero, but it is unbounded on the high end. You can imagine asking this in an open ended way like this or you can imagine offering to help respondents by simplifying the task and offering a series of ranges instead, zero to five, six to ten and so on. So, you say to respondents, we don’t need an exact number, don’t agonize, just give us something in a range. The use of open ended questions as Peter Miller I think said yesterday, has declined over time. This is an analysis that Howard Schuman did where he was looking at the prevalence of open ended questions in a series of what you might think of as commercial surveys and academic surveys between the 30s and the 80s, the 50s and the 70s. You can see a decline in the use of open ended questions over this time period. In some sense you might think of this as natural selection that maybe this is the survival of the fittest, in fact this is the verdict coming through that open questions are not worth the trouble. In fact, I don’t think that’s what the literature supports for those two types of questions. First of all, it is true that in experimental comparisons, open ended
questions take, on average, about twice as long to answer as closed questions and respondents prefer closed questions. On practical grounds it might appear that closed questions are preferable. In studies of reliability, open questions prove to be more reliable than closed questions and in lots of different studies of validity, open questions prove to be superior to close questions across the board using these various different methods of assessing validity. This is the remarkable thing I think about this literature and there are actually behind it a series of insights about why. A series of studies have looked at potential problems, limitations with open questions, maybe why things would go wrong. One concern was articulation ability. Maybe there are some people who just aren’t so good at talking. They can pick a choice, but actually expressing their point of view verbally spontaneously might be difficult, that appears to have no empirical support at all. A second concern was that open questions might be particularly susceptible to salience effects. If I ask you what’s the most important problem facing the country and you happened to have seen a news story about crime on television last night maybe that enhances the likelihood that you would retrieve crime as a potential problem to answer with whereas, with a closed question on a list, maybe that salience effect may be minimized. That also appears to have no support. In fact, salience appeared to affect open and closed questions about equally. Lastly, there is concern about frame of reference effects. That is if I ask you what’s the most important problem facing the country, you need to understand what counts as a problem, what is an acceptable answer? That can be ambiguous with open questions whereas with closed questions if you offer a set of choices, what is an acceptable choice is made explicit. There is evidence that in some cases the open ended question stem is ambiguous enough that the frame of reference is not established. I would say that’s not necessarily an inherent problem with open questions, but it an inherent problem with some open questions that might better be solved in other ways. With regard to closed questions, it turns out that a series of concerns have been articulated, all of which do have empirical support. One support is non-attitudes, that by offering people options, people select choices without actually having substance behind them. Secondly, with regard to the numeric options, if I am offering ranges of zero to five hours, six to ten hours and so on, the way I choose those ranges sends a signal to a respondent about
what an acceptable and normal answer would be. The answers in the middle of the range are what people assume to be what a normal person would pick so there is some gravitation toward the middle. As a result, better not to offer them. Lastly, there is the idea that if I say to you, what’s the most important problem facing the country, is it the federal budget deficit, crime, inflation, unemployment or something else, it’s the other option. That will cover us. In an unbound universe of potential problems, as long as I put the other option there, then that will solve the incomplete nature of the list. That turns out to be a serious problem. In fact, it appears from studies dating back 70 years or more that offering that other option does almost nothing. People almost never select it and they think what you’re asking instead of saying what’s the most important problem facing the country, they’re asking which of the following is the most important problem facing the country? If you insist on picking something else you can, but we prefer that you don’t so that seems not to work. There’s one last argument I think in support of this perspective, which goes like this, close questions make respondents do more work than open questions. The first thing is if you say to them, what is the most important problem facing the country? They have to first answer the open question in their own mind, right? They have to say well, I think its unemployment. Then they have to look at the list and see which answer choice maps on to unemployment. Similarly, if you say how many years did you smoke cigarettes? The first thing they’ve got to do is answer that open question and then choose an answer choice to express it. It’s not that the close question is somehow simpler, it’s actually more work for respondents. It’s less work and more likely to be accurate if we ask respondents to answer the relevant open ended question and it looks like if professional coders do the coding, even maybe not so well in the past, they produce more reliable and valid results than having the respondents do our work. Let me just illustrate for you. This is a question that NSF asked us to evaluate for them, that Curtis Cobb talked a little bit about yesterday. This is asking people what’s the field in which your Bachelor’s degree is. These are the one, two, three, four, five, six, seven choices of the closed question. Just looking at this slide should make your head hurt, right? If I say to you, what did you major in and you say math, that’s an easy judgment to make. Now you have to look at this list and find a place to go. Let’s see,

related sciences, math is related, no, let me keep going. Health, no, not that, engineering and computing, oh, here’s math, great. So I’ve finally found me. You see how there’s a bunch of work that gets done and there are words like or related sciences where you have to make a judgment, what is a related science? You get the basic idea. The conclusion is, what I take this literature to suggest is that we should ask open ended questions, you can’t be sure of the universe of possible answer to a categorical question and the other specify option does not work. The only way to be sure that we know the universe is to pre-test, ask open questions from the population we care about, build the big list, offer it to people and we could do that, but it’s so much work we might as well as the open ended question in the real survey. And lastly, if we’re looking for a number we should just ask for the number. That is what I take that literature to suggest and I don’t know if that’s really widely recognized and followed. With regard to the number of points on a rating scale, you can imagine lots of variation. You don’t have to imagine it, there is lots of variation in surveys, including in the American National Elections studies, everything from a two point scale, do you approve or disapprove of the president’s job performance, up to 101 point scales that take lots of texts to explain a feeling thermometer to people where they’re providing ratings on a scale from zero to 100. Theoretically, there are a variety of principles you might imagine bringing to bear here to try to guess what the best length of a rating scale be. In order to understand as much as we can about respondents and to make the process of mapping your feelings on to a ratings scale easier, maybe more points is better. However, if you offer too many points on a rating scale, you can imagine respondents might get confused. What’s the difference between 75 and 79 for example? And, we were concerned when we started our work on satisficing that offering a middle alternative on a ratings scale might be an invitation to satisfice, like, dislike, neither like nor dislike. Maybe that’s a way to grab an option without thinking much that would undermine the process. On the other hand, maybe people need that option in order to accurately report neutrality. So we could make a prediction based on theory alone, increasing precision of ratings, validity and reliability as lengthen a scale to some length and after that length we’ve gained information while some people understand the scale, but as it gets longer and longer,
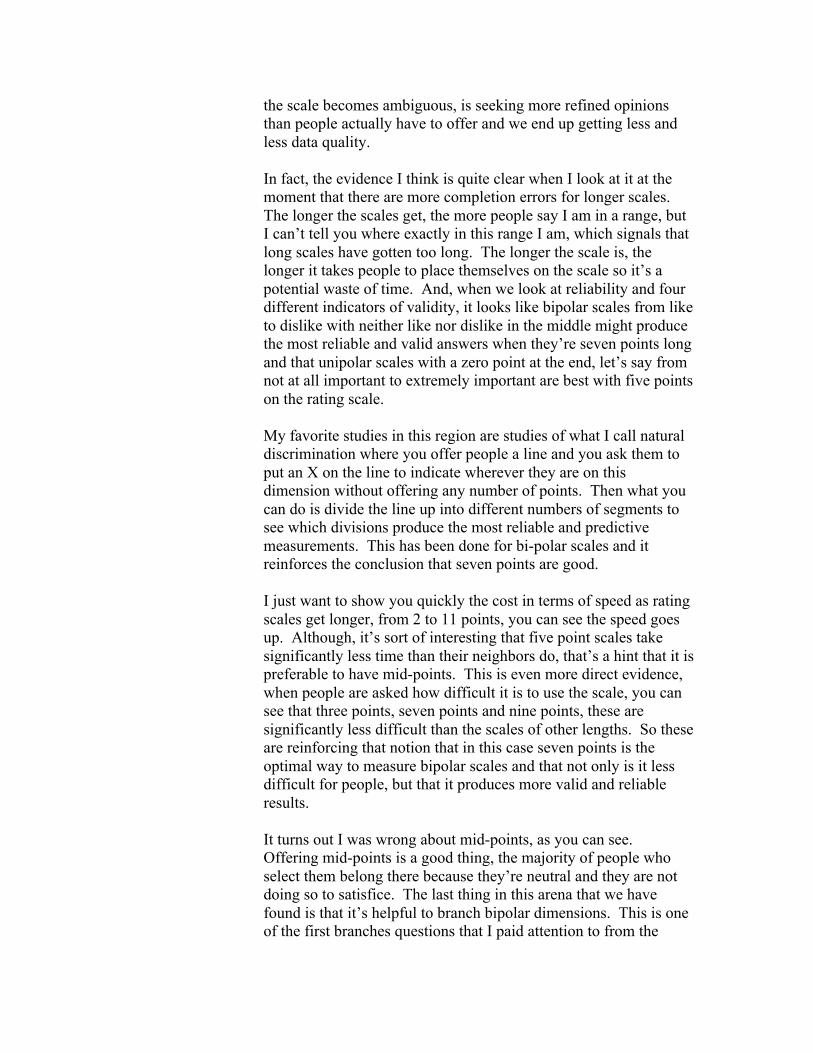
the scale becomes ambiguous, is seeking more refined opinions than people actually have to offer and we end up getting less and less data quality. In fact, the evidence I think is quite clear when I look at it at the moment that there are more completion errors for longer scales. The longer the scales get, the more people say I am in a range, but I can’t tell you where exactly in this range I am, which signals that long scales have gotten too long. The longer the scale is, the longer it takes people to place themselves on the scale so it’s a potential waste of time. And, when we look at reliability and four different indicators of validity, it looks like bipolar scales from like to dislike with neither like nor dislike in the middle might produce the most reliable and valid answers when they’re seven points long and that unipolar scales with a zero point at the end, let’s say from not at all important to extremely important are best with five points on the rating scale. My favorite studies in this region are studies of what I call natural discrimination where you offer people a line and you ask them to put an X on the line to indicate wherever they are on this dimension without offering any number of points. Then what you can do is divide the line up into different numbers of segments to see which divisions produce the most reliable and predictive measurements. This has been done for bi-polar scales and it reinforces the conclusion that seven points are good. I just want to show you quickly the cost in terms of speed as rating scales get longer, from 2 to 11 points, you can see the speed goes up. Although, it’s sort of interesting that five point scales take significantly less time than their neighbors do, that’s a hint that it is preferable to have mid-points. This is even more direct evidence, when people are asked how difficult it is to use the scale, you can see that three points, seven points and nine points, these are significantly less difficult than the scales of other lengths. So these are reinforcing that notion that in this case seven points is the optimal way to measure bipolar scales and that not only is it less difficult for people, but that it produces more valid and reliable results. It turns out I was wrong about mid-points, as you can see. Offering mid-points is a good thing, the majority of people who select them belong there because they’re neutral and they are not doing so to satisfice. The last thing in this arena that we have found is that it’s helpful to branch bipolar dimensions. This is one of the first branches questions that I paid attention to from the

national lecture studies, generally speaking do you consider yourself to be a Republican, a Democrat, an independent or what and Republicans and Democrats are asked if they’re strong or not very strong. The independents are asked if they lean one way or another. You can produce seven-point scale like this. If you do it in those two steps up here it goes more quickly and it produces more valid and reliable results rather than presenting all seven of these, which people have to slog through and place themselves on. There are two ways to branch. One is if you have a precise mid-point, so for example if you say, should defense spending be increased, decreased or kept the same? If the mid-point is precise, it turns out that asking people, do you lean one way or another actually adds noise. In order to produce the seven-point scale, the people who place themselves at a precise mid-point like this belong there. We shouldn’t branch the mid-point, instead we should branch the end points into three categories. So the people who say increase should be asked, do you want it increased a little, a moderate amount or a great deal? But, there are other questions that offer a fuzzy mid-point, keep it about the same. And in cases like that, the fuzzy mid-point grabs some people who are truly off that mid-point. So, branching those mid-point people whether they lean toward more or less is a good way of splitting them up and the end point people should be branched into two categories instead. So that’s number of scale points and branching. With regard to verbal labels of scale points, you can imagine presenting let’s say a five point scale like this with numbers on all points and words only on the ends or we could put words and numbers on all of the points or we could get rid of the numbers and just have words on each of the points. As you think about selecting those labels, you might imagine a series of goals are worth pursuing. One is that we would like respondents to find it easy to interpret the meaning of all the scale points, we don’t want them struggling. After they’re done interpreting them, we would like them to say that the meanings are clear. That is, we don’t want them to go through a process whereby they say, okay I’ve done the work I need to interpret and I’m still confused about what it means. Third, we want all respondents to interpret the meanings of the scale points identically. That is, we don’t want different people interpreting the scale points differently from each other. Fourth,
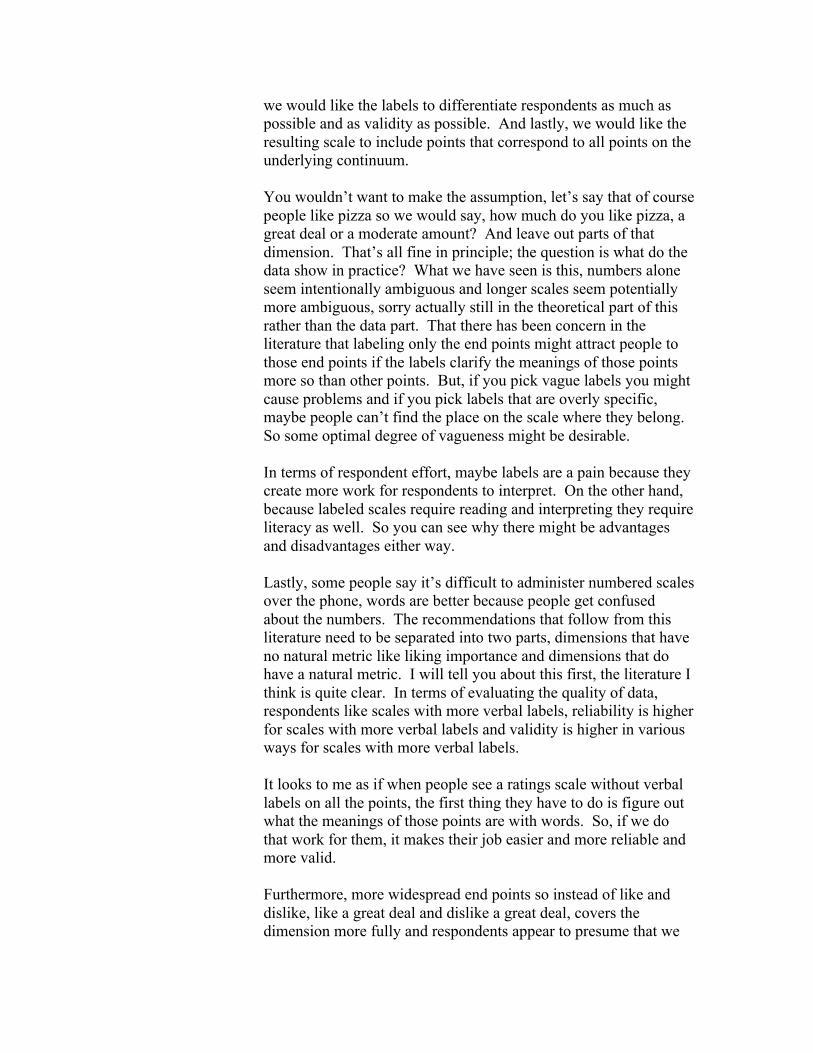
we would like the labels to differentiate respondents as much as possible and as validity as possible. And lastly, we would like the resulting scale to include points that correspond to all points on the underlying continuum. You wouldn’t want to make the assumption, let’s say that of course people like pizza so we would say, how much do you like pizza, a great deal or a moderate amount? And leave out parts of that dimension. That’s all fine in principle; the question is what do the data show in practice? What we have seen is this, numbers alone seem intentionally ambiguous and longer scales seem potentially more ambiguous, sorry actually still in the theoretical part of this rather than the data part. That there has been concern in the literature that labeling only the end points might attract people to those end points if the labels clarify the meanings of those points more so than other points. But, if you pick vague labels you might cause problems and if you pick labels that are overly specific, maybe people can’t find the place on the scale where they belong. So some optimal degree of vagueness might be desirable. In terms of respondent effort, maybe labels are a pain because they create more work for respondents to interpret. On the other hand, because labeled scales require reading and interpreting they require literacy as well. So you can see why there might be advantages and disadvantages either way. Lastly, some people say it’s difficult to administer numbered scales over the phone, words are better because people get confused about the numbers. The recommendations that follow from this literature need to be separated into two parts, dimensions that have no natural metric like liking importance and dimensions that do have a natural metric. I will tell you about this first, the literature I think is quite clear. In terms of evaluating the quality of data, respondents like scales with more verbal labels, reliability is higher for scales with more verbal labels and validity is higher in various ways for scales with more verbal labels. It looks to me as if when people see a ratings scale without verbal labels on all the points, the first thing they have to do is figure out what the meanings of those points are with words. So, if we do that work for them, it makes their job easier and more reliable and more valid. Furthermore, more widespread end points so instead of like and dislike, like a great deal and dislike a great deal, covers the dimension more fully and respondents appear to presume that we
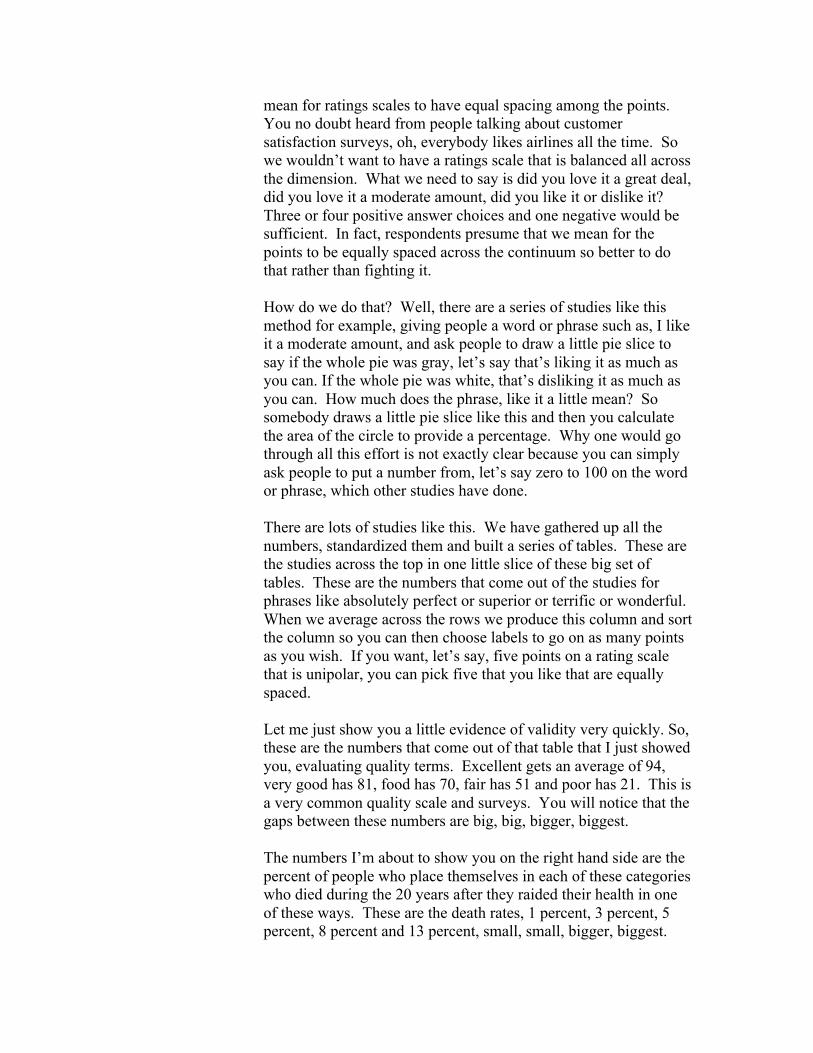
mean for ratings scales to have equal spacing among the points. You no doubt heard from people talking about customer satisfaction surveys, oh, everybody likes airlines all the time. So we wouldn’t want to have a ratings scale that is balanced all across the dimension. What we need to say is did you love it a great deal, did you love it a moderate amount, did you like it or dislike it? Three or four positive answer choices and one negative would be sufficient. In fact, respondents presume that we mean for the points to be equally spaced across the continuum so better to do that rather than fighting it. How do we do that? Well, there are a series of studies like this method for example, giving people a word or phrase such as, I like it a moderate amount, and ask people to draw a little pie slice to say if the whole pie was gray, let’s say that’s liking it as much as you can. If the whole pie was white, that’s disliking it as much as you can. How much does the phrase, like it a little mean? So somebody draws a little pie slice like this and then you calculate the area of the circle to provide a percentage. Why one would go through all this effort is not exactly clear because you can simply ask people to put a number from, let’s say zero to 100 on the word or phrase, which other studies have done. There are lots of studies like this. We have gathered up all the numbers, standardized them and built a series of tables. These are the studies across the top in one little slice of these big set of tables. These are the numbers that come out of the studies for phrases like absolutely perfect or superior or terrific or wonderful. When we average across the rows we produce this column and sort the column so you can then choose labels to go on as many points as you wish. If you want, let’s say, five points on a rating scale that is unipolar, you can pick five that you like that are equally spaced. Let me just show you a little evidence of validity very quickly. So, these are the numbers that come out of that table that I just showed you, evaluating quality terms. Excellent gets an average of 94, very good has 81, food has 70, fair has 51 and poor has 21. This is a very common quality scale and surveys. You will notice that the gaps between these numbers are big, big, bigger, biggest. The numbers I’m about to show you on the right hand side are the percent of people who place themselves in each of these categories who died during the 20 years after they raided their health in one of these ways. These are the death rates, 1 percent, 3 percent, 5 percent, 8 percent and 13 percent, small, small, bigger, biggest.
This to me is evidence of validity in the sense that if we had taken this five point rating scale and done what many people do, that is code it five, four, three, two, one and try to predict death rates, we would have gotten some positive significant coefficient. But, by capturing these gaps in meaning, in the numbers if we coded it instead 94, 81, 70, 51, 21 and predicted death rates, we would do significantly better. So, that’s just a little bit of evidence to suggest that I think these numbers do have validity. Now, with regard to dimensions that have a natural metric, so for example I could ask you how often do you go to the movies, very often, often, sometimes, rarely or never? I’m not going to take the time to go through all of the evidence on this so forgive me for just skipping this. What I can tell you is what this literature says is using those kinds of what you might think of as vague quantifiers actually cause many more problems than they solve. And so it’s if you want is a number just ask for the number. Other than saying, how often do you go to the movies you ask people in the last month how many times did you go to the movies; you can get around that problem. One illustration of how our instincts about labels have gone wrong, this is a set of integration about the kind of numbers I showed you earlier for frequency terms like these. You can see very often, this is the scale I described to you, seeing often in surveys, very often, often, sometimes rarely or never. This is 88, 78, 20, 5, and 0 so nowhere near what you might think of as equal spacing across that dimension. But if you have a survey that has a rating scale like this, you can analyze it using numbers like this and I think do better than you might otherwise do. Because Hector just told me I have ten minutes left, what I want to do is skip all these things and get into what I want to illustrate for you is the question wording stuff where I think the crisis is at the moment. Sorry, wouldn’t this have been fun? I was so optimistic last night. Okay, so we’ll talk about question wording. Here’s the conventional wisdom about question wording in research design textbooks. First of all, use simple, direct and comprehensible words, everybody says that. And they say, don’t use jargon and they say be specific in your question and avoid ambiguous words and avoid double barreled questions that ask two things at the same time and avoid negations if you can avoid the word not. Avoid leading questions, include filter questions, we’ll come back to this in a second. The common sense version is don’t ask people what brand of car you have if they might not have a car.
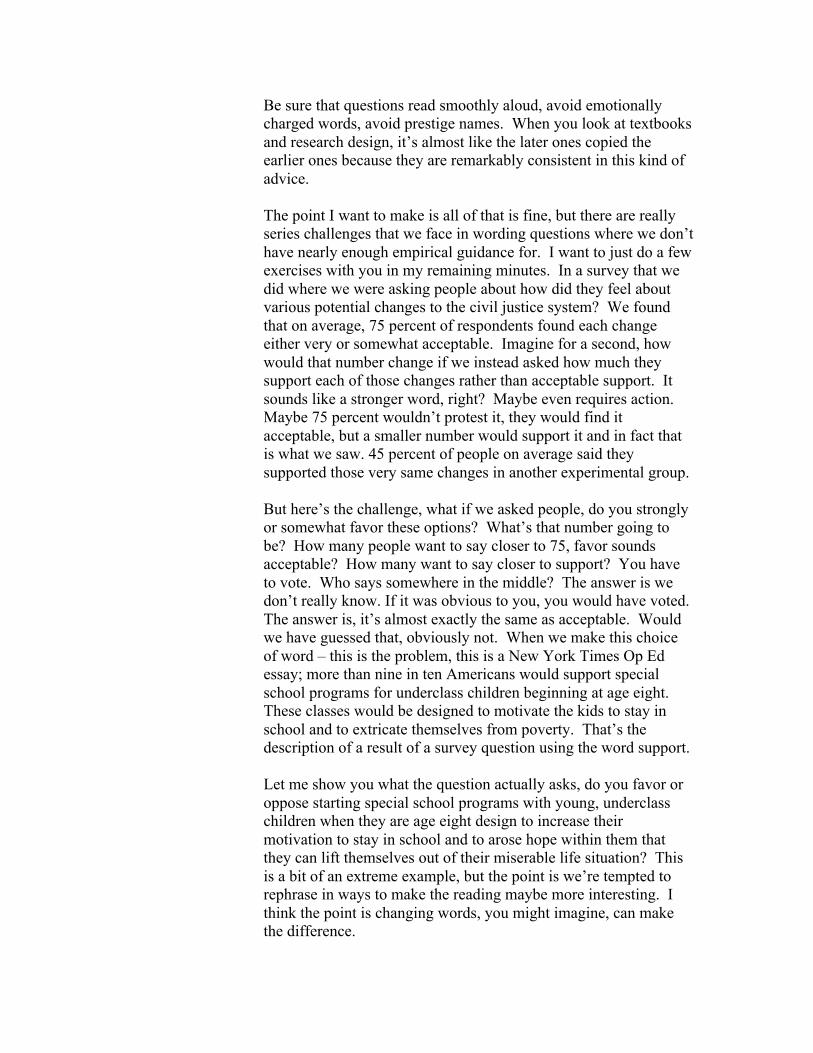
Be sure that questions read smoothly aloud, avoid emotionally charged words, avoid prestige names. When you look at textbooks and research design, it’s almost like the later ones copied the earlier ones because they are remarkably consistent in this kind of advice. The point I want to make is all of that is fine, but there are really series challenges that we face in wording questions where we don’t have nearly enough empirical guidance for. I want to just do a few exercises with you in my remaining minutes. In a survey that we did where we were asking people about how did they feel about various potential changes to the civil justice system? We found that on average, 75 percent of respondents found each change either very or somewhat acceptable. Imagine for a second, how would that number change if we instead asked how much they support each of those changes rather than acceptable support. It sounds like a stronger word, right? Maybe even requires action. Maybe 75 percent wouldn’t protest it, they would find it acceptable, but a smaller number would support it and in fact that is what we saw. 45 percent of people on average said they supported those very same changes in another experimental group. But here’s the challenge, what if we asked people, do you strongly or somewhat favor these options? What’s that number going to be? How many people want to say closer to 75, favor sounds acceptable? How many want to say closer to support? You have to vote. Who says somewhere in the middle? The answer is we don’t really know. If it was obvious to you, you would have voted. The answer is, it’s almost exactly the same as acceptable. Would we have guessed that, obviously not. When we make this choice of word – this is the problem, this is a New York Times Op Ed essay; more than nine in ten Americans would support special school programs for underclass children beginning at age eight. These classes would be designed to motivate the kids to stay in school and to extricate themselves from poverty. That’s the description of a result of a survey question using the word support. Let me show you what the question actually asks, do you favor or oppose starting special school programs with young, underclass children when they are age eight design to increase their motivation to stay in school and to arose hope within them that they can lift themselves out of their miserable life situation? This is a bit of an extreme example, but the point is we’re tempted to rephrase in ways to make the reading maybe more interesting. I think the point is changing words, you might imagine, can make the difference.
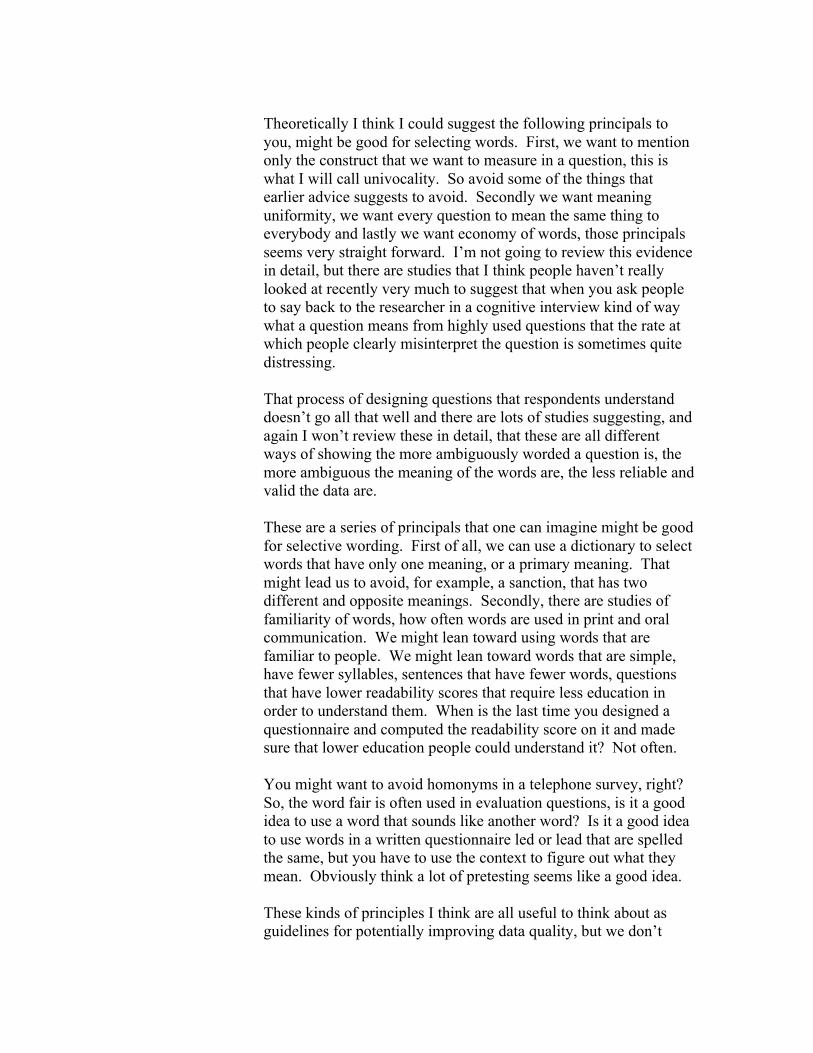
Theoretically I think I could suggest the following principals to you, might be good for selecting words. First, we want to mention only the construct that we want to measure in a question, this is what I will call univocality. So avoid some of the things that earlier advice suggests to avoid. Secondly we want meaning uniformity, we want every question to mean the same thing to everybody and lastly we want economy of words, those principals seems very straight forward. I’m not going to review this evidence in detail, but there are studies that I think people haven’t really looked at recently very much to suggest that when you ask people to say back to the researcher in a cognitive interview kind of way what a question means from highly used questions that the rate at which people clearly misinterpret the question is sometimes quite distressing. That process of designing questions that respondents understand doesn’t go all that well and there are lots of studies suggesting, and again I won’t review these in detail, that these are all different ways of showing the more ambiguously worded a question is, the more ambiguous the meaning of the words are, the less reliable and valid the data are. These are a series of principals that one can imagine might be good for selective wording. First of all, we can use a dictionary to select words that have only one meaning, or a primary meaning. That might lead us to avoid, for example, a sanction, that has two different and opposite meanings. Secondly, there are studies of familiarity of words, how often words are used in print and oral communication. We might lean toward using words that are familiar to people. We might lean toward words that are simple, have fewer syllables, sentences that have fewer words, questions that have lower readability scores that require less education in order to understand them. When is the last time you designed a questionnaire and computed the readability score on it and made sure that lower education people could understand it? Not often. You might want to avoid homonyms in a telephone survey, right? So, the word fair is often used in evaluation questions, is it a good idea to use a word that sounds like another word? Is it a good idea to use words in a written questionnaire led or lead that are spelled the same, but you have to use the context to figure out what they mean. Obviously think a lot of pretesting seems like a good idea. These kinds of principles I think are all useful to think about as guidelines for potentially improving data quality, but we don’t

know. There’s actually, I don’t believe, a body of research even begun to explore the impact of the kinds of common sense decisions I just suggested to you to see if they in fact improve data quality. What I want to do is to end though with a series of studies that have shown how I think remarkably important question wording is, not only in terms of reducing burden, but how much research we really need to do in order to guide these decisions. For example, imagine these two questions, during the last month have you seen a movie? Or, during the last month have you seen one or more movies? Do you think that might make a difference? This was Charlie shaking his head yes, you think, what?
Audience Member: I think more people would [inaudible]. Jon Krosnick: That turns out not to be true. The percent less is not significantly
different, but yet our instinct was maybe it would, right? So we need to think carefully about these kinds of things. How about this, during the last month how many times have you seen a movie or during the last month what’s the total number of times you have seen a movie? Should that make a difference? It’s a lot more words in the section case, right? Do they really mean the same thing? No they don’t, Andy says no, they are different. How are they different?
Audience Member: [inaudible] Jon Krosnick: Okay, the first one could be different movies where the second one
could be how many times would you re-watch the same movie? Could be so it does make a difference – excuse me, there is not a significant difference between these two. That turns out not to matter whether we’re asking about seeing movies or going out to movies.
Another example, a direct question, how many times have you
seen a movie or gone out to a movie? Verses a filter question, in the last month have you seen a movie and if so, how many times? So that turns out, it does make a difference that when we ask how many times have you gone out or see a movie, you get a larger number, significantly larger than if you asked the filter question first, in the last month did you see a movie and if so, how many?
The argument that people make is that the reason why this
difference happens is that the direct question how many times have you seen a movie in the last month seems to imply that of course
you have seen a movie and pushes people in the affirmative direction. Whereas asking have you seen a movie as a filter doesn’t do that pushing as much.
To test that hypothesis, you can do an experiment like this. Some
people could be asked, how many times have you seen a movie and these other two question forms take away that suggestion. Some people see movies often, other people see movies occasionally and still other people never see movies, during the last month, how many times have you seen a movie? Clearly we’re suggesting its okay for people to not have seen a movie, or this last one, how many times, if any, have you seen a movie? Both of these are designed to accomplish with this question what this filter is thought to have accomplished. When we compare answers to the three, we should see fewer movies being reported for these two than this one, right? Except there are no differences.
What we’ve learned there I think is yes, this form produces more
than this form, but it’s not that explanation that is addressed here. I can walk you through lots more experiments like this and go through this exercise of asking you to guess whether wording would make a difference or not and sometimes we’d be right, sometimes we wouldn’t be right, but there are lots of decisions like this that need to be made. Unfortunately, the reason we need to make these decisions carefully and the reason I call this a crises at the moment is because of patterns of data like this.
I am going to end with this, this is the percent of Americans who
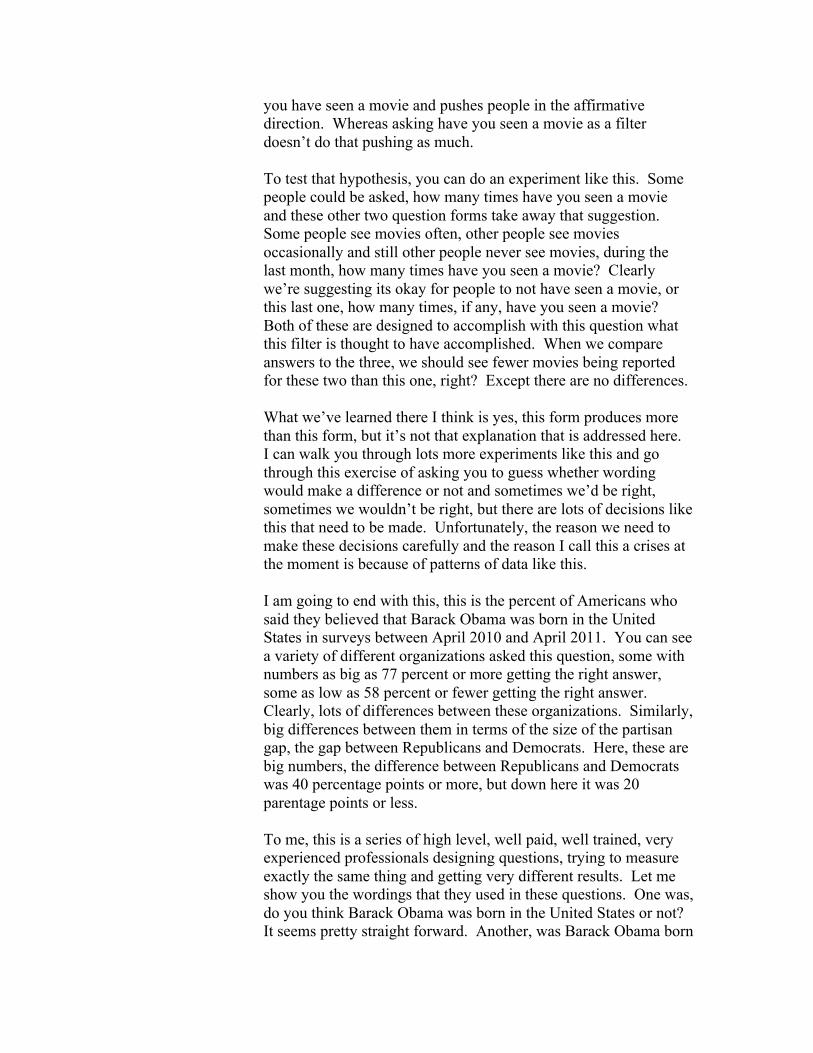
said they believed that Barack Obama was born in the United States in surveys between April 2010 and April 2011. You can see a variety of different organizations asked this question, some with numbers as big as 77 percent or more getting the right answer, some as low as 58 percent or fewer getting the right answer. Clearly, lots of differences between these organizations. Similarly, big differences between them in terms of the size of the partisan gap, the gap between Republicans and Democrats. Here, these are big numbers, the difference between Republicans and Democrats was 40 percentage points or more, but down here it was 20 parentage points or less.
To me, this is a series of high level, well paid, well trained, very experienced professionals designing questions, trying to measure exactly the same thing and getting very different results. Let me show you the wordings that they used in these questions. One was, do you think Barack Obama was born in the United States or not? It seems pretty straight forward. Another, was Barack Obama born
in the United States or was he born in another country? Now, this is more explicit than here and notice the word think is up here, but not here. It is possible now to combine these by asking do you think Barack Obama was born in the United States or do you think he was born in another country? Now we’ve combined the two. Or, do you think Barack Obama was definitely born in the United States, probably born in the United States, probably born in another country or definitely born in another country?
If you put together the definitely and the probably on the two sides,
you get notably different results than you get up here, but there are even longer ones. As you may know, some people have suggested that President Obama was not born in the United States, do you think that Obama (notice, no president there) was not born in the U.S., was born in the U.S. or it’s not clear whether Obama was born in the U.S. or not? So now we’re adding into this not clear thing. We’re not referring to him as President Obama. Notice back here its Barack Obama on this whole screen. Is saying the word Barack, does that maybe do something?
Why would you begin by suggesting what some people think and
not what other people think? The folks that wrote this question said the reason they did it was to cover themselves. In other words they and the news media believe this is a non-issue and we’re embarrassed to even be asking this question. So they wanted to explain to certain respondents why they thought it was sensible to ask it. Okay, maybe, but is it a survey question, a place to explain why you’re asking a question?
Yet another one, according to the Constitution, American
Presidents must be natural born citizens, I don’t know how the telephone interviewers say the quotes. Some people say Barack Obama was not born in the United States, but was born in another country. Now, we’re again making this point, but we’ve explained even more why this is of significance. Do you think Barack Obama was born in the United States or do you think he was born in another country?
My point is this, if you and I were sitting at a desk and looked at
any one of these questions, without seeing the rest of them, we might think it’s reasonable to ask this, there’s a basis, there’s a justification for it. But the fact is, we as a profession are not guided by a single set of principles to lead us to a single optimal wording and as a result we publish results that look like these and I don’t think this is good for us. This is one of the many places where I am hopeful that NSF will be able to consider supporting
more research to help us to begin to grapple with language and to help us figure out how to get on the same page. The idea is not to say what’s good is to have lots of researchers out there asking lots of different questions producing lots of different results and eventually we’ll figure out, you know, it’s probably better to get organized.
Let me just summarize quickly what I hope you get from this very,
very brief and much too superficial skimming across of this literature. First, lots and lots of studies are done that help us to inform the issues of questionnaire design and yet there is much more work to be done, especially with regard to language. I think we understand a lot about structure, but we understand much less about language. There is also an issue of dissemination.
NSF of course has commitment not only to making discoveries, but also to disseminating those discoveries through educational efforts and outreach. I think there is a real opportunity here because there are lots of people who don’t know it’s a bad idea to offer a don’t know option. There are lots of people who don’t know the order of answer choices and close questions matter and how to handle that. There are lots and lots of people who think it’s fine to ask agree/disagree questions so a major educational outreach effort to disseminate the findings of this literature would help. Thank you. Comments, questions, arguments, Paul?
Paul Biemer: I wanted to ask a question about the satisficing. I’ve been a
reviewer on a number of papers the last couple of years, we’ve worked on experiments to try to show that satisficing was happening in a questionnaire. One method they used was look at straight lining. Not every questionnaire lends themselves to that kind of analysis. My question is what would be your idea of sort of an ideal experiment where one could determine whether or not a question that had poor reliability was being affected by satisficing more than just other issues with the question? Is there a need for research in that area?
Jon Krosnick: Absolutely, I think there is a need for lots of research on satisficing. I don’t think I have begun to see it in operation the way I hoped to before I am dead. The point that you’re making is an important one because I actually don’t think that there is a definitive indicator of satisficing. In other words, we could say – let me explain to people what straight lining is because I didn’t talk about that.
Imagine that we offer people a set of ratings, like please evaluate the quality of these politicians on this scale from 0 to 100 and people give a whole bunch of them in 80. That is straight lining, giving identical ratings to each of a series of objects rather than thinking carefully about them and differentiating.
We could look to the extent to which a sample of people draws a
straight line by computing, let’s say a variance. We can look at whether the factors that we think predict it, like respondent ability, respond of motivation, task difficulty, predict the extent of straight lining. That’s kind of the nature of the work that has happened so far is to look at whether the response patterns, straight lining, selecting a don’t know option, selecting a first option presented in a list, agreeing with assertions, those are all thought to be results of satisficing and they’re thought to be results of ability, motivation and task difficulty.
What we do is relate the causes to those behaviors so far in the
literature and say yep, that looks like it’s the case. That is as far as we have gotten. I don’t think we can take a respondent who draws a straight line and say, that’s a satisficing respondent because they could genuinely evaluate all of those objects equivalently. Or, we can’t take a respondent who selects a don’t know option and say, that’s a satisficing respondent because it could very well be what they’re telling is I have never heard of John Roberts, I don’t know who John Roberts is.
I think trying to get past the barrier of looking at predictors and
looking at those behaviors would be exciting for future research. I don’t know that I have the idea about how to do that, but Roger might.
Roger Tourangeau: This is Roger Tourangeau. I really like your table where you show
the mean ratings that are associated with different words and I’d like to know where it is published, that’s number one. But number two is, I think that those tables are probably very, very context dependent. For example, take frequencies. If you sneeze often you might sneeze six times a day, but if you experienced tornadoes often, you might experience one a year. A lot of those terms are you know tremendously context driven. Do you see that in your analysis? That is my second question.
Jon Krosnick: Yes. I went way too fast in this talk and that little part of it I went
too fast. What I said at that point was that with regard to dimensions that have a natural metric like how many times you sneeze or how many tornadoes you’ve seen, use of those verbal

phrases seems like a huge mistake. Like there’s lots of studies showing exactly what you just said and more, there are all kinds of contaminants to that.
On the other hand, there is not evidence that I have seen for the
dimensions that have no natural metric. If we are going to say how much do you like it, we’re going to be forced to use words because there is no set of numbers we can use. Those ratings – the one way to look at the impact of context is across different studies, right? Some studies ask people to evaluate good in the context of one set of words. Other studies ask people to evaluate good in the context of other words. It looks quite reliable across studies in terms of those results.
Could we distort it by having, let’s say, a five point scale, where
we pick a set of words that aren’t equally spaced according to those tables and now we’re sending the signal to people we think they are equally spaced, but we picked words that aren’t, is that going to cause a distortion of meaning? Absolutely. So that’s fighting their instinct.
First of all, they’re going to be in the book, which I am going to
finish on my sabbatical next year and second of all, as far as I can tell, they are remarkably resistant to context.
Audience Member: This is also about the words because I also would love to see the
listing. There’s an alternative way. The one you put up was excellent, very good, good and then fair and poor so good was not really a middle, I think in the way we interpret good. And then poor was way below.
If you took the frequency with which people answered it, you can
then rate the differences by the frequencies of answers. This wasn’t frequencies of answers, this was on a scale of 1 to 100. I’ve been using this rash scoring for the use of education, something that is very infrequent gets placed different from something that is, you know – for all of us the big things is good to excellent and it is odd it gets poor. That puts a weight that puts it far away, a percentile. ____ does it by the frequency with some distribution of something. Could you say some more about this because I think this is very important. People often go one, two, three, four, five and then they do regressions or something else and this just seems to have much better validity.
Jon Krosnick: I think you’re absolutely right that this suggests a very unbalanced
scale. You’re also right that for most evaluations I’ve looked at

people rarely use fair and poor. You can imagine customer satisfaction. If a company was getting ratings of poor often, they wouldn’t be able to afford to do customer satisfaction surveys, not to mention stay in business long enough to be rated by anybody. There probably is a selection bias in the world such that the experiences that we rate tend to be on the good end of things. And that’s what leads some people to think this kind of scale is a good idea. You actually have more options because good is not a mid-point, that’s a more positive evaluation than moderate. In fact, there is evidence to show in an experimental comparison, if you want to predict quality outcomes either you use numbers like this or, better yet, excellent, good, fair, poor, very poor. Those cover the dimension about equally and it seems odd. People say, we don’t get the kind of differentiation at the high end that we would like with this kind of scale. In fact, in many of these cases it’s not meaningful differentiation at all, it’s trying to slice up people into bins that they do unreliably for outcome.
Audience Member: This is good, I look forward to your book and using it in class. I
want to argument your pledge for more research on language and wording to not forget that not everyone speaks English. It seems that if you are, in particular with respect to the answer scales, focus a lot on making this perfect you might be doing this now, but all languages used has changed over time. It’s outdated the minute you publish it and the number of people who are interviewed who are not English is also increasing.
I wonder, you sort of brushed over the magnitude scaling, the line as in that can be chalked up as seven is the best and let’s try to find the best label for the scales. It seems that if it is the case that language is used over time differently and if it is the case we need to have more languages then maybe we should focus research on these magnitude scales. They have been forgotten a little or dismissed often. The fact that they are non-verbal could help.
Jon Krosnick: That’s a nice argument in favor of that. I haven’t thought of that,
but that’s a nice argument in favor of using that. Unfortunately, you’re treading into territory where I have both good news and bad news. The good news is in the very small amount of work that I’ve done, those ratings of quality terms and frequency terms, all that kind of stuff, the studies go back to the 1930s and the results are amazingly consistent for American English. Even like a study of college students in Alabama, a representative sample of Americans, a study of doctors in Minnesota. There is even a study of CIA analyst’s at one point. They are remarkably consistent over time.
The only other little tidbit I have is word frequencies that you
might imagine that word frequencies would change a lot, but the average correlation we found between the frequency of words in 1994 and the frequency of words in 1932 is .88 let’s say. The words that are used a lot have always been used, so that’s the good news.
I am sure you’re right and I am sure that there are cross sub
cultural differences in the use of languages within a single country. The biggest problem, and this is really where I get depressed is international comparisons. Setting aside the international socials survey effort and other academic efforts to be international, the commercial world has long jumped full force into cross national surveyor with the idea that somehow we can design a ratings scale that is comparable across countries so we can compare and say the Japanese actually do like it more than the Chinese do.
Audience Member: I think even in the U.S. Jon Krosnick: Oh, absolutely. The place I have become depressed is that I am
sure you right within the U.S., but I have just completely given up on the international. I can’t figure out a principle for assuring that a question means the same thing in all these countries and the answer choices are somehow comparable. You know, when people say the people from this country they are very critical, they don’t like anything or Hispanics, they love everything, it’s a response by us. How do we know it’s a response by us, maybe they truly do love everything? I am pretty depressed about that. I need like therapy from NSF on that. Okay, one more and then we’ll stop.
Audience Member: In terms of the open ended questions, it strikes me that open ended
questions are much more likely to have interviewer facts associated with them than close ended questions because you have to do probing and you have to do other things and there may be judgments. The interviewer is actually making the mapping. Sometimes they map things to pre-existing categories that are not provided to the respondent, but they see, depending on how the survey is designed. Have you looked at the impact of the interviewers on reliability and validity?
Jon Krosnick: Yeah. So you’re referring to what I sometimes call pre-coded open
ended questions. The question sounds open ended to the respondent, but then the interviewer is asked to code it in real time as they listen to it. That idea scares me because I know how
difficult coding is to do when all you’re doing is coding. The idea of listening and coding is not a territory that I personally want to get into. I have not evaluated it though so that’s just my guess.
In terms of the impact of interviewers on open ended questions,
that’s one of the principle reasons people worried about open questions over time. That maybe asking the question is not so hard, but the probing is an issue and the transcribing is also a major issue. I guess maybe you’re putting your finger on one of the areas where we do need to do more research because you saw Hector’s discoveries yesterday. I can tell you, I am reading through open ended transcriptions after begging interviewers to be literal and they’re not.
So how is it that the open questions have done so well in these past
studies? Well, many of them are self-administered to people are actually typing their own answers and they do a better job than interviewers so. I think you’re highlighting the idea that open questions administered by an interviewer that require careful probing might actually do less well than open questions answered by a respondent where they’re typing themselves and so on. That’s again, an interesting direction. I will do this one more question.
Vicky Freeman: Just following up on that, Vicky Freeman from the University of
Michigan. We did a time diary study as an add on to the panel study in dynamics in 2009. We found that you could train interviewers, we did the lab work and did test, retest with interviewers to take open ended with what people did yesterday and pre-code it into one of nine categories if the task was simple enough. We worked with them in the lab and we trained them and we had actors and we knew how they should be coded. But you have to make the task simple enough and you have to spend a fair amount of time training on it. We devoted maybe a couple of hours how to pre-code over and over again on this one task.
I think one of the statements – I think we need to be careful to
generalizing to every task and not if you think about how to teach and train, it might be possible in some situations to do it well. I just want us to be careful about over generalizing.
Jon Krosnick: Yeah, that’s a wonderful theme to end on. I think this entire
presentation that I’ve given you is over generalizing. There is no doubt that every principal I have said you can find situations where it definitely doesn’t hold so I am glad you pointed that out. Yet, at the same time, when we’re making decisions in advance about how to design this question on the basis of literature, maybe we are

forced to over generalize from what we have in the past. That doesn’t mean we shouldn’t do more research, that doesn’t mean we shouldn’t be humble and we will continue to do that.


![Jon Schmidt - Piano Solos Vol. II[1]](https://img.pdfslide.us/doc/110x75/55240cb24a7959da488b45a7/jon-schmidt-piano-solos-vol-ii1.jpg)


![Jon scieszka author study[1]](https://img.pdfslide.us/doc/110x75/55630d33d8b42a81528b469a/jon-scieszka-author-study1.jpg)
