Embed Size (px)
Citation preview

Joint Shear? or Column-to-Beam Strength Ratio? Which is a key parameter for seismic design of RC Beam-column joints - Test Series on Interior Joints
Hitoshi Shiohara & Fumio Kusuhara The University of Tokyo, Japan
SUMMARY: Tests on one third scale, reinforced concrete interior beam-column joint subassemblages are reported. The effects of the design parameters of joints on lateral capacity and post yielding behaviour are investigated. Three major parameters of the test program are (1) amount of longitudinal reinforcement, (2) column-to-beam flexural strength ratio, and (3) column-to-beam depth ratio. Maximum story shear of some specimens fell 5% to 30% short of the story shear calculated from the flexural strength of the beam or the column, although the joints have some margin of the nominal joint shear strength by 0% to 50% compared to the calculated values by a current seismic provision. The extent of insufficiency in the story shear is larger if the column-to-beam strength ratio is unit or close to unit, and if the column-to-beam depth ratio is larger than 1.0. This kind of combination of design parameters is allowed by current seismic codes and common feature for huge stock of existing RC buildings in the world. So serious attention should be addressed to this experimental results.
Keywords: reinforced concrete, beam-column joint, joint failure, joint shear, column-to-beam strength ratio
1. INTRODUCTION
The current building codes in high seismic zone are with provisions for design of reinforced concrete beam-column joints to preclude joint shear failure. They are based on an observation that a joint shear failure occurs before the flexural yielding of beams or columns, if excessive tensile force in longitudinal reinforcing bars passing through a joint needs to be developed in too small horizontal section of the joint. So equations joint shear capacity are adopted in the seismic provisions. They are empirically derived from selected set of tests on beam-column joints which are with heavily reinforced beams as well as columns to assess a potential of joint shear resistance. The effects of design parameters on the joint shear resistance have been regarded too complicate and the most of the current provisions for shear strength of beam-column joint consider only the effect of concrete compressive strength. On the contrary, little attention has been paid to the actual strength and post-yielding behavior of commonly designed beam-column joints, which are usually moderately longitudinally reinforced in practice. However, it has been believed that the frame with the joint could achieve a story shear predicted by the flexural strength of the beam or the columns and they show rich post-yielding behavior with fat hysteresis loops provided the joint shear demand is smaller than the nominal joint capacity specified in the codes and shear failures of beams and columns are prevented.
One of the authors (Shiohara 2012) has revealed recently that the flexural strength of the section of beams nor columns framed int a joint may not be achieved if the column-to-beam flexural strength ratio are unit or close to unit, despite of the ratio of joint shear demand to joint shear capacity, based on a prediction of a theoretical model of beam-column joints introduced. But few test of such beam-column joints has not been reported in the past, which might be used for a validation of the model. Hence, an experimental program was planed. This is a report of the tests. It focuses on the investigation of the effects of the three major design parameters, including (1) joint shear strength margin, (2) column-to-beam flexural strength ratio, and (3) column-to-beam depth ratio. The validity of current design concepts are discussed with respect to the attained maximum story shear.

2. TEST PROGRAM
Test result of twenty specimens are selected and reported here. The specimens are 1/3 scale beam-column joint subassemblages of a crucial form. Table. 1 summarizes the arrangement of the reinforcements and other properties of the specimens. The depth of the columns and the beams are 240 mm in common for Series B and Series C, whereas the depths of column and beam are 340 mm and 170 mm for Series D. The width of all the beams and the columns is 240 mm in common. Figure 1 shows the geometry and dimensions of the specimens. The hoops and the stirrups of all the specimen are of rectangular shape of D6 deformed bars at spacing of 50 mm. Two sets of rectangular hoops of D6 deformed bars are provided in the horizontal direction in a joint of all the specimen. The joint shear reinforcement ratio is approximately 0.3% and satisfies the minimum requirement of the AIJ Guidelines (1999).
2.1. Test Parameters
Four test parameters are actually included in the specimens selected in this report. They are (1) ratio of joint shear demand to joint shear capacity; 0.55-1.50, where joint shear demand and capacity are calculated based on the AIJ Guidelines (1999), (2) column-to-beam flexural strength ratio evaluated at the center of a joint; 0.72-2.24, (3) column-to-beam depth ratio; 1.0 or 2.0, and (4) longitudinal reinforcing bar distant ratio; 0.5-0.8, which is the ratio of distance of tensile and compressive reinforcements to the full depth of a cross section.
2.2. Material Properties
The specimens are made of normal strength concrete and normal strength deformed mild steel bars. Concrete compressive strengths were tested by a 100 mm by 200 mm cylinder. They are 29.0 MPa,
700 700
700
700
Pspherical washer
sphericalbush
specimen
load cell
PC rod
reaction floor
reaction frame
oil jackfixture
fixture
Figure 2. Loading Setup
240
240
120240
240
700 700700 700unit in mm unit in mmunit in mm
Hoops or Stirrups□-D6@50 (SD295A)
C01 C03
Joint HoopsTwo sets□-D6 (SD295A)
Joint HoopsTwo sets□-D6 (SD295A)
Joint HoopsTwo sets□-D6 (SD295A)
700
700
Hoops or Stirrups□-D6@50 (SD295A)
Column
240
340
Column
240
170 Beam
240
240
Column
240
240
BeamBeam
(a) Series B (b) Series C (c) Series D700 700
Loading point
700
700
700
700
Figure 1. Geometry of Specimens

31.0 MPa and 32.4 MPa for Series A, B and C respectively. The yield points by tensile tests of reinforcing bars are 399 MPa, 378 MPa, 425 MPa, and 374MPa for deformed bars, D6, D13, D16 (SD390) and D16 (SD345) respectively.
2.3. Loading Setups
The loading setup are shown in Figure 2. The upper horizontal loading beam is supported with two vertical loading columns with a pinned joint at the both ends. The vertical loading columns are connected to a lower horizontal loading beam with a pinned joint. The lower loading beam is fixed to a testing floor. A specimen is connected to a loading steel frame with a set of horizontal and vertical PC rods. The distance of the loading points at the end of the beams and the ends of columns is 1400 mm in common. By applying a horizontal displacement by a oil jack to the upper loading beam, a
Table 1. Properties of Specimens(a) Series B
Specimens B01 B02 B03 B04 B05 B06 B07 B08 B09 B10
concrete compressive strength in MPa 29.0beam width ! depth in mm 240 ! 24 40
longitudinal reinforcing bars 4-D13 5-D13 5-D16 4-D13 5-D13 4-D13 5-D16 SD345 SD390 SD345 SD390
longitudinal reinforcing bar distant ratio
0.8 0.65 0.5 0.65 0.5
tensile reinforcement ratio % 0.98 1.22 1.92 0.98 1.22 1.22 1.07 1.18 2.09 2.30column section in mm 240 ! 24 40
longitudinal reinforcing bars 4-D13 5-D13 5-D16 6-D13 5-D132-D13
5-D135-D13
4-D13 5-D16
SD345 SD390 SD345 SD390longitudinal reinforcing bar distant ratio
0.8 0.8 &0.5
0.8 &0.5
0.65 0.5 0.65 0.5
tensile reinforcement ratio % 0.98 1.22 1.92 1.47 1.80 2.67 1.07 1.18 2.09 2.30joint joint hoops □-D6(S SD295) 2 sets joint shea ar capacity margin 1.29 1.03 0.57 1.29 1.03 1.26 1.24 0.56 0.55column-t to-beam flexural strength ratio 1.00 1.48 1.35 1.78 1.00
(b) Series C & D
Specimens C01 C03 D01 D02 D03 D04 D05 D06 D07 D08
concrete c compressive strength in MPa 31.0 32.4
beam width ! depth in mm 120 !240
240 ! 240 240 ! 17 70
longitudinal reinforcing bar distant ratio
0.8 &0.5
0.72
longitudinal reinforcing bars3-D13+22-D13 5-D13 7-D13 7-D16longitudinal reinforcing barsSD345 SD345 """"""""
tensile reinforcement ratio % 1.31 2.62 1.81 2.54 3.98 column width ! depth in mm 240 ! 24 40 240 ! 34 40
longitudinal reinforcing bars5-D13 2-D13 3-D13 5-D13 2-D13 3-D13 4-D13 4-D13
2-D13 3-D16g g
SD345
longitudinal reinforcing bar distant ratio 0.8 0.8 0.86 0.86
0.65 0.86
tensile reinforcement ratio % 1.22 0.33 0.50 0.84 0.33 0.50 0.67 1.04 0.79 joint joint hoops □-D6(S SD295) 2 sets
joint shea ar capacity margin 1.08 0.80 1.41 1.000 0.56
column-to to-beam flexural strength ratio 1.03 1.10 0.99 1.42 2.23 0.72 1.03 1.33 1.70 0.98

beam-column joint specimen is forced to deform like in a moment resisting frame.
2.4. Loading Cycles and Measurements
Statically cyclic lateral load reversals with an increasing amplitude were applied to the specimens to get load-deformation relationships. The first cycle is load controlled before cracking. Then two reversals with displacement control are applied at each story drift ratio of 0.25%, 0.5%, 1.0%, 1.5%, 2.0% and 3.0%. In Series D, loading cycles with 4.0% story drift ratio are added. No axial force in the columns and beams are applied during the test in all specimens. Shear story is measured from the force reading by load cells which are installed at the end of vertical PC rods. Story drift ratio is measured as the difference of lateral displacement at the two inflection points in the column divided by the distance of the inflection points (=1400 mm). The strain on the longitudinal reinforcing bars in beams and columns as well as in joints are measured by strain gauges. The strain at the column face as well as in the joint on the point of diagonal of the joint are measured.
3. TEST RESULTS 3.1. Overall Behavior
Photo 1 shows typical appearance at story drift ratio of 3%. In all the specimen, diagonal cracks at the corner occurred at story shear around 5 kN in loading cycles of both directions. Diagonal cracks at the center of the joint were observed at story shear around 30 kN. As the number of loading cycles repeated, the number of cracks increased and the width of the diagonal cracks increased. At the load cycles with story drift ratio of 2.0%, concrete crush at the center of the joint initiated and cover concrete spalled off at the load cycle with story drift ratio of 3.0% or more. In all the specimens, significant cracks are observed on the beam-column joints but on beams nor columns. While the flexural cracks on the beam or column ends are observed, their crack width remained small compared to the cracks on the beam-column joints.
3.2. Yielding of Reinforcement
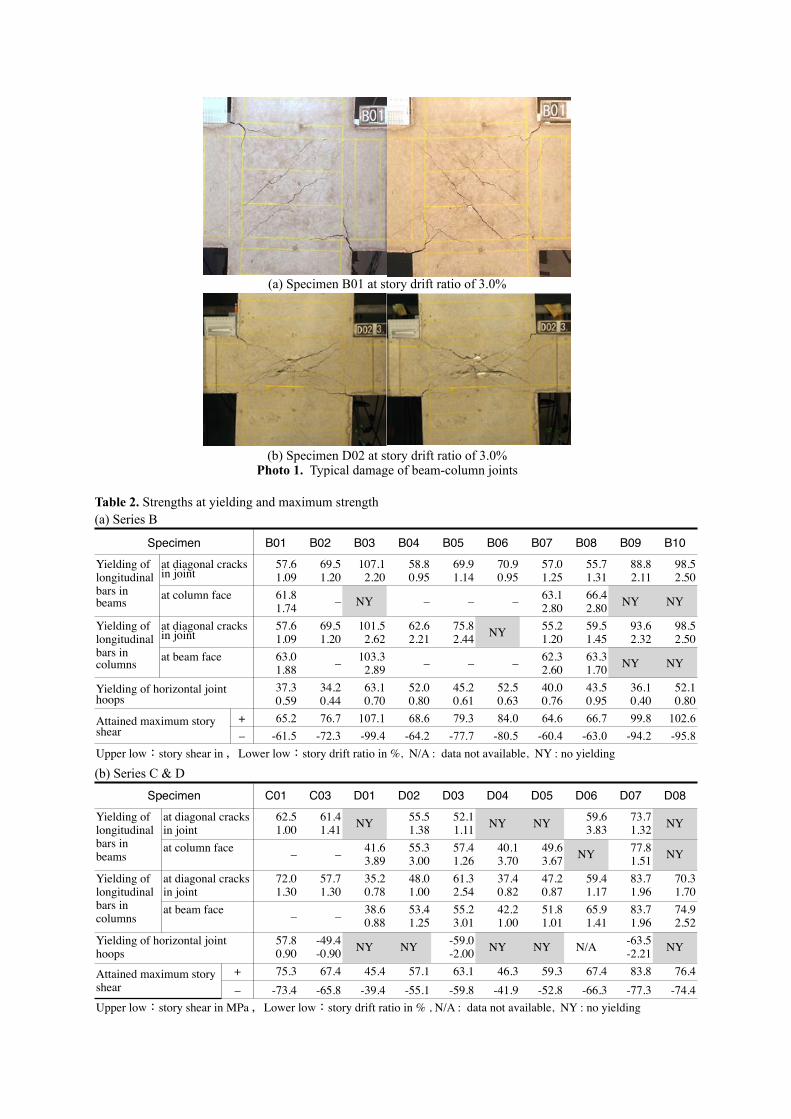
The story shear-story drift ratio relations are shown in Figure 3. The marks in the figures show the sequence of the yielding of reinforcing bars. Table 2 lists the location of strain gauges and the story shear at which yielding of the reinforcing bars are observed. In all specimens except specimen D08, longitudinal bars in beams yielded before the specimens attained its maximum story shear. In all specimens yielding of longitudinal bars in columns occurred except in specimens B06. The story shear at first yielding, attained maximum story shear and the story drift ratio are also listed in Table 2. It should be noted that yielding of beam bars was observed also in most of the specimen with nominal joint shear demand higher than code specification, and the yielding of column bars was observed in most of the specimens, even if the value of column-to-beam strength ratio is much larger than 1.0. The joint hoops yielded before the first yielding of longitudinal reinforcement in all the specimen in Series B and C. On the contrary, the yielding of joint hoops in Series D is not necessary observed in all the specimens.
3.3. Maximum Story Shear
Calculated story shear by the flexural theory is shown as horizontal dotted line in Figure 3. The values are also listed in Table 3. Results of material test are used for the calculation. The maximum story shear are not be attained in the tests except a few specimens. In some specimens, the calculated maximum story shear overestimate 5% to 30% the test results. The exceptions in Series B are specimen B04, B05, and B06, which have columns the flexural strength of which are larger than that of beam by 48%, 35% and 78%, and specimen B07 and B08, in which the distance ratio of reinforcement of beams is 0.65 and 0.5, whereas these values are smaller than ordinary reinforced concrete beams in practice. The exception in Series D are Specimens D03 and D07, the flexural strength of the column of which are larger than that of the beams by 124% and 72%. So it is concluded that beam-column joints, the story shear calculated based of flexural theory of the section sometimes overestimate, if the flexural strength of beams and columns are identical or near. So it is

B03B01 B04
0
0
-25-50-75
-100
255075
100
0-25-50-75
-100
255075
100
0.0 1.0 2.0 3.0-1.0-2.0-3.0
B05
-25-50-75
-100
255075
100
0.0 1.0 2.0 3.0-1.0-2.0-3.0
B020.0 1.0 2.0 3.0-1.0-2.0-3.0
0-25-50-75
-100
255075
100
B060.0 1.0 2.0 3.0-1.0-2.0-3.0
0-25-50-75
-100
255075
100
0.0 1.0 2.0 3.0-1.0-2.0-3.0
B08
0-25-50-75
-100
255075
100
0.0 1.0 2.0 3.0-1.0-2.0-3.0B07
0-25-50-75
-100
255075
100
0.0 1.0 2.0 3.0-1.0-2.0-3.0
0
-50
-100
-150
50
100
150
0.0 1.0 2.0 3.0-1.0-2.0-3.0
B10
0
-50
-100
-150
50
100
150
0.0 1.0 2.0 3.0-1.0-2.0-3.0B09
0
-50
-100
-150
50
100
150
0.0 1.0 2.0 3.0-1.0-2.0-3.0
Calcualted story shear at flexural capacity of beamYielding of joint hoopYielding of longitudinal bar in beam (at diagonal crack)Yielding of longitudinal bar in beam (at face)Yielding of longitudinal bar in column (at diatonal crack)
Maximum story shear
Legend :
Story
shea
r , kN
Story
shea
r , kN
Story
shea
r , kN
Story drift ratio , % Story drift ratio , %
Story drift ratio , % Story drift ratio , %
(a) Series B
-100
-80
-60
-40
-20
0
20
40
60
80
100
-4 -3 -2 -1 0 1 2 3 4
Maximum story shear: 75.3kN Maximum story shear: 67.4kN
Maximum story shear: -65.8kN
-100
-80
80
-60
-40
-20
0
20
40
60
100
-4 -3 -2 -1 0 1 2 3 4
Stor
y sh
ear ,
kN
Stor
y sh
ear ,
kN
Story drift ratio , %
Maximum story shear: -73.4 kN
Story drift ratio , %
Specimen C01 Specimen C03
Calcualted story shear at flexural capacity of beamYielding of joint hoopYielding of longitudinal bar in beam (first layer)Yielding of longitudinal bar in beam (second layer)Yielding of longitudinal bar in column
Legend :
(a) Series C
-4 -3 -2 -1 0 1 2 3 4
-60-50-40-30-20-10
0102030405060
Specimen D01
-4 -3 -2 -1 0 1 2 3 4
-60-50-40-30-20-10
0102030405060
Specimen D03
-4 -3 -2 -1 0 1 2 3 4
-60-50-40-30-20-10
0102030405060
Specimen D02
-4 -3 -2 -1 0 1 2 3 4
-60-50-40-30-20-10
0102030405060
Specimen D04
-4 -3 -2 -1 0 1 2 3 4
-80
-60
-40
-20
0
20
40
60
80
Specimen D05
-4 -3 -2 -1 0 1 2 3 4
-80
-60
-40
-20
0
20
40
60
80
Specimen D06
-4 -3 -2 -1 0 1 2 3 4
-80
-60
-40
-20
0
20
40
60
80
Specimen D07
-4 -3 -2 -1 0 1 2 3 4
-120-100
-80-60-40-20
020406080
100120
Specimen D08
Calcualted story shear at flexural capacity of beamYielding of joint hoopYielding of longitudinal bar in beam (at diagonal crack)Yielding of longitudinal bar in beam (at column face)Yielding of longitudinal bar in column (at diagonal crack)Yielding of longitudinal bar in column (at beam face)
Maximum story shear
Legend :
Story
shea
r , kN
Story
shea
r , kN
Story
shea
r , kN
Story drift ratio , % Story drift ratio , %
Story drift ratio , %
(c) Series DFigure 3. Story shear-story drift relations
(a) Specimen B01 at st tory drift ratio of 3.0%
(b) Specimen D02 at st Photo 1. Typical damag
tory drift ratio of 3.0% ge of beam-column joints
Table 2. Strengths at yielding and maximum strength(a) Series B
Sppecimen B01 B02 B03 B04 B05 B06 B07 B08 B09 B10Yielding of longitudinal b i
at diagonal cra in joint
acks
57.61.09
69.51.20
107.12.20
58.80.95
69.91.14
70.90.95
57.01.25
55.71.31
88.82.11
98.52.50
bars in beams at column face e 61.8
1.74 – NY – – – 63.12.80
66.42.80 NY NY
Yielding of longitudinal b i
at diagonal cra in joint
acks
57.61.09
69.51.20
101.52.62
62.62.21
75.82.44 NY 55.2
1.2059.51.45
93.62.32
98.52.50
bars in columns at beam face 63.0
1.88 – 103.32.89 – – – 62.3
2.6063.31.70 NY NY
Yielding of ho hoops
horizontal joint 37.30.59
34.20.44
63.10.70
52.00.80
45.20.61
52.50.63
40.00.76
43.50.95
36.10.40
52.10.80
Attained max h
ximum story + 65.2 76.7 107.1 68.6 79.3 84.0 64.6 66.7 99.8 102.6 shear
y – -61.5 -72.3 -99.4 -64.2 -77.7 -80.5 -60.4 -63.0 -94.2 -95.8
Upper low:s story shear in , Low wer low: :story drif ift ratio in n %, N/A : data no ot availabl le, NY : n no yieldin ng
(b) Series C & D
Sppecimen C01 C03 D01 D02 D03 D04 D05 D06 D07 D08Yielding of longitudinal b i
at diagonal c in joint
cracks
62.51.00
61.41.41 NY 55.5
1.38 52.1 1.11 NY NY 59.6
3.83 73.7 1.32 NY
bars in beams
at column fa ace – – 41.6 3.89
55.3 3.00
57.4 1.26
40.1 3.70
49.6 3.67 NY 77.8
1.51 NY
Yielding of longitudinal b i
at diagonal c in joint
cracks
72.01.30
57.71.30
35.2 0.78
48.0 1.00
61.3 2.54
37.4 0.82
47.2 0.87
59.4 1.17
83.7 1.96
70.3 1.70
bars in columns
at beam face e – – 38.6 0.88
53.4 1.25
55.2 3.01
42.2 1.00
51.8 1.01
65.9 1.41
83.7 1.96
74.9 2.52
Yielding of ho hoops
orizontal join nt 57.80.90
-49.4-0.90 NY NY -59.0
-2.00 NY NY N/A -63.5 -2.21 NY
Attained maxi imum story + 75.3 67.4 45.4 57.1 63.1 46.3 59.3 67.4 83.8 76.4 shear
– -73.4 -65.8 -39.4 -55.1 -59.8 -41.9 -52.8 -66.3 -77.3 -74.4
Upper low:s story shear in n MPa , ,Lower l low:stor ry drift ra atio in % , , N/A : da ata not ava vailable, N NY : no yi ielding

concluded that the column-to-beam strength ratio is an important factor which affects strength of reinforced concrete beam-column joints.
3.4. Post-yielding Behavior
Post-yielding hysteresis relation of beam-column joint subassemblages are compared in Figure 3. All the specimens show poor hysteresis curves with little energy dissipation and severe slip shape. No significant strength degradation are observed within the range of displacement reversals. No sudden strength degradation are observed instead the some of the specimen are predicted that joint shear failure is precluded by current seismic design provisions. Strength degradation ratio due to cyclic loading of same amplitude are estimated 20-30% in most of the specimens within the story drift ratio less than 3.0%.
4. DISCUSSION
4.1. Mechanical Reinforcement Ratio in Beam
The attained maximum moment at the center of the joint normalized by the width of the beam section b, square of beam depth D2 and concrete compressive strength f’c are plotted against the mechanical reinforcement ration of beam for the specimens the column-to-beam flexural strength ratio of which is 1.0 in Figure 4. The break lines drawn in the figure are the prediction by the current design equations for comparison. They correspond to the calculated moment at flexural strength of beams and calculated moment at joint shear nominal strength based on the equations adopted in the AIJ Guidelines (1999). In Series B, the both current design equations for flexural failure and joint shear failure overestimate the test results of specimen B01 and B02, while the joint shear strength of specimen B03 is underestimated. In series D, the current design equations both for flexural strength and joint shear strength overestimate the test results. Therefore, it is concluded that the current design equations underestimate lateral capacity of beam-column joint subassemblages with moderately reinforced beam-column joint. In particular, the insufficiency of strength of beam-column joints is significant if the depth of beam is smaller than that of column. An approximate line fitting the test results are also shown for each series in Figure 4. The approximate lines for Series B and D seems to coincide.
4.2. Ratio of Flexural Strength of Column to Flexural Strength of Beam
The attained maximum nodal moment normalized by the beam width b, square of beam depth D2 and concrete compressive strength f’c are plotted against the column-to-beam strength ratio in Figure 5. The lines representing flexural strength of the columns and the beams are also drawn. The plot of test results are not on the calculated lines but locates beneath the lines. In Series B, the test values are smaller when the column-to-beam strength ratio is near 1.0. The specimens with larger column-to-beam strength ratio than 1.3 are well predicted by the flexural theory. In Series D, the deficiency in strength is more evident than Series B. The specimens with larger column-to-beam strength ratio than
0.30
0.25
0.20
0.15
0.10
0.05
0.000.30.20.10.0
B01B02
B03
Calculated moment evaluated at the center of the joint from the flexural strength of beamCalculated moment evaluated at the center of the joint from the joint shear nominal strength (AIJ Guidelines) Tests (in positive and netative directional loading)Approximate line fitting to strength of joints
0.40.30.20.10.00.00
0.10
0.20
0.30
0.40
D01D05
D08
Nor
mal
ized
max
imum
mom
ent*
1
Nor
mal
ized
max
imum
mom
ent
Σat fybbDb ʹfc
Mechanical reinforcement ratio Σat fybbDb ʹfc
Mechanical reinforcement ratio
*1 Moment evaluated at the center of joint normalizedwith respect to the beam width bb, square of the beam depth Db2 and concrete compressive strength
M j
bbDb2 fc
M j
bbDb2 fc
Series B Series D
fc
Figure 4. Effect of mechanical reinforcement ratio on strength

1.7 are well predicted by the flexural theory. In all these specimen in Series B and D, the line fitting to the test results seems to be on the straight line parallel to the average slope of the beam flexural strength and the column flexural strength.
5. CONLUSIONS
Results of seismic test on twenty interior reinforced concrete beam-column joint were reported. Story shear capacity of some specimens fell 5% to 30% short of the story shear predicted by the flexural strength of the beam or the column, although the joints have enough margin for nominal joint shear capacity by 0% to 50% based on current seismic provisions. In such specimens, the calculated flexural strength of the column are found to be fallen in the range of 70% to 140% of the flexural strength of the beam. The extent of insufficiency in the story shear is larger if the flexural strength of the column is equal or nearer to the flexural strength of the beam, and if the depth of the column is larger than that of the column. This kind of combination of design parameters is not a rare feature but is rather seen frequently in existing reinforced concrete buildings. This means that current seismic provisions for RC beam-column joints are deficient and can not secure the lateral strength of moment resisting frames predicted by the flexural theory of RC sections. Hence a large number of existing moment resisting frame reinforced concrete structures may be more vulnerable than we expect. So serious attention should be addressed to this experimental results. Development of mathematical models suitable for codes are important. The results of the investigation should be reflected to the seismic design of building codes, and to the seismic vulnerability assessment methods for existing reinforced concrete buildings.
AKCNOWLEDGEMENTThe authors acknowledge the supports by the Grant-in-aid for researches on the building codes improvement by Ministry of Land, Infrastructure, Transport and Tourism, Japan, was awarded to a research proposal entitled “Research on design parameters of RC reinforced concrete beam-column joint necessary for ductile behavior of building structures (PI: Hitoshi Shiohara),” FY2008.
REFERENCES
Architectural Institute of Japan. (1999). Guidelines for Earthquake Resistant Reinforced Concrete Building Based on Inelastic Displacement Concept. AIJ. (in Japanese)
Hitoshi Shiohara. (2012). Reinforced Concrete Beam-column Joints : An Overlooked Failure Mechanism. ACI Structural Journal, 109:1, 65-74.
0.20
0.15
0.10
0.05
0.002.52.01.51.00.5
B01 B04
0.20
0.15
0.10
0.05
0.002.52.01.51.00.5
B02B05 B06
! !
0.40
0.30
0.20
0.10
0.002.52.01.51.00.5
D07D06
D05D04
! !
0.40
0.30
0.20
0.10
0.002.52.01.51.00.5
D01D02 D03
Flexural strength ratio Flexural Strength ratio
Nor
mal
ized
mom
ent*
3N
orm
aliz
ed m
omen
t
Muc Mub Muc Mub
Flexural strength ratio Flexural strength ratioMuc Mub Muc Mub
Muc
Mub
Mub
Muc
Muc
Muc
Mub
Mub
Calculated moment at the center of joint from flexural strength at the joint facesCalculated moment at the center of joint from joint shear nominal strength (AIJ Guidelines)Tests (in positive and netative directional loading)Average of the flexural strengths of beam and column at the joint facesApproximate line fitting to strength of joints
*1 Sum of ultimate flexural strength of columns framing into the joint evaluated at the center of joint
*1 *2
*2 Sum of ultimate flexural strength of beams framing into the joint evaluated at the center of joint
*3 Moment evaluated at the center of joint normalized with respect to the beam width b, square of the beam depth D2 and concrete compressive strength
*1
*2
Series B Series B
Series D
Series D
M j
bD2 fc
M j
bD2 fc
fc
Figure 5. Effect of ratio of flexural capacity of column to flexural capacity of beam