Embed Size (px)
Citation preview
Joint Polar Satellite System (JPSS)
www.jpss.noaa.gov
The Contribution of Operational and Research Applications from the Joint Polar Satellite System to Societal Benefits
Mitch Goldberg, Program Scientist Joint Polar Satellite System National Environmental Satellite, Data, and Information Service U.S. National Oceanic and Atmospheric Administration U.S. Department of Commerce
6th AOMSUC Tokyo , Japan
Funny River Fire – Alaska - May 20, 2014
VIIRS
Integrating various satellite data and and other info are critical for decisons
Landsat 8
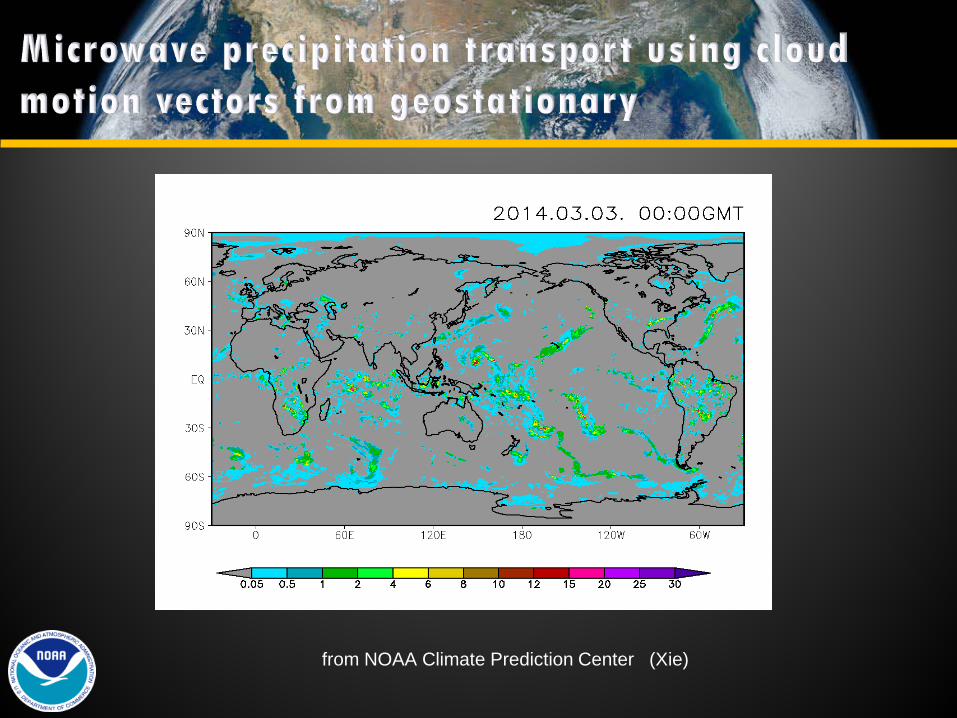
from NOAA Climate Prediction Center (Xie)
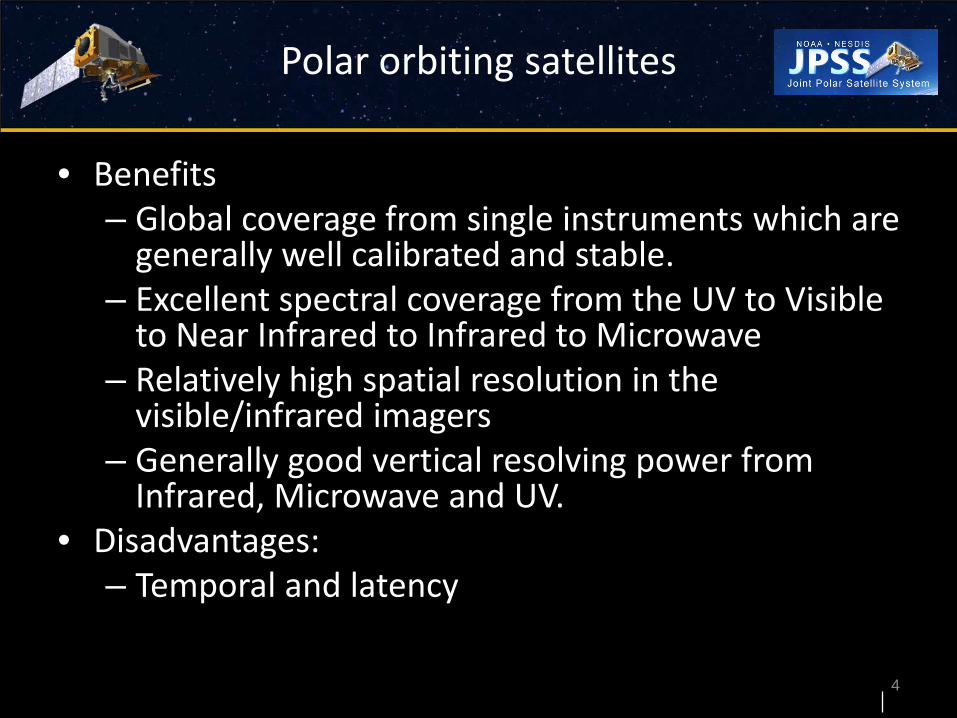
Polar orbiting satellites
• Benefits – Global coverage from single instruments which are
generally well calibrated and stable. – Excellent spectral coverage from the UV to Visible
to Near Infrared to Infrared to Microwave – Relatively high spatial resolution in the
visible/infrared imagers – Generally good vertical resolving power from
Infrared, Microwave and UV. • Disadvantages:
– Temporal and latency
4
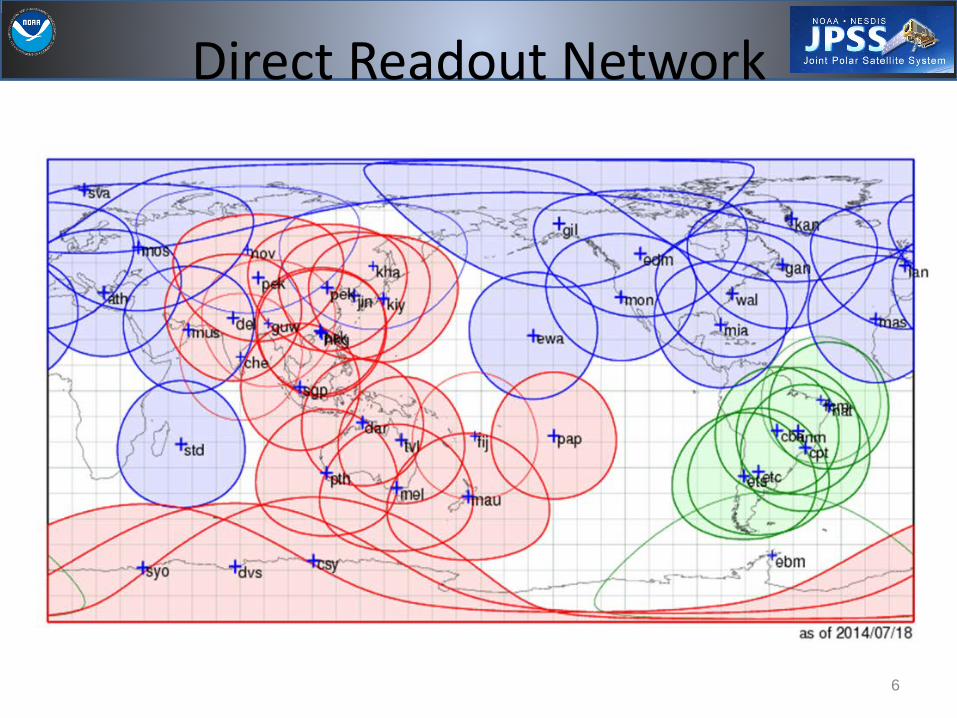
Direct Readout Network
6
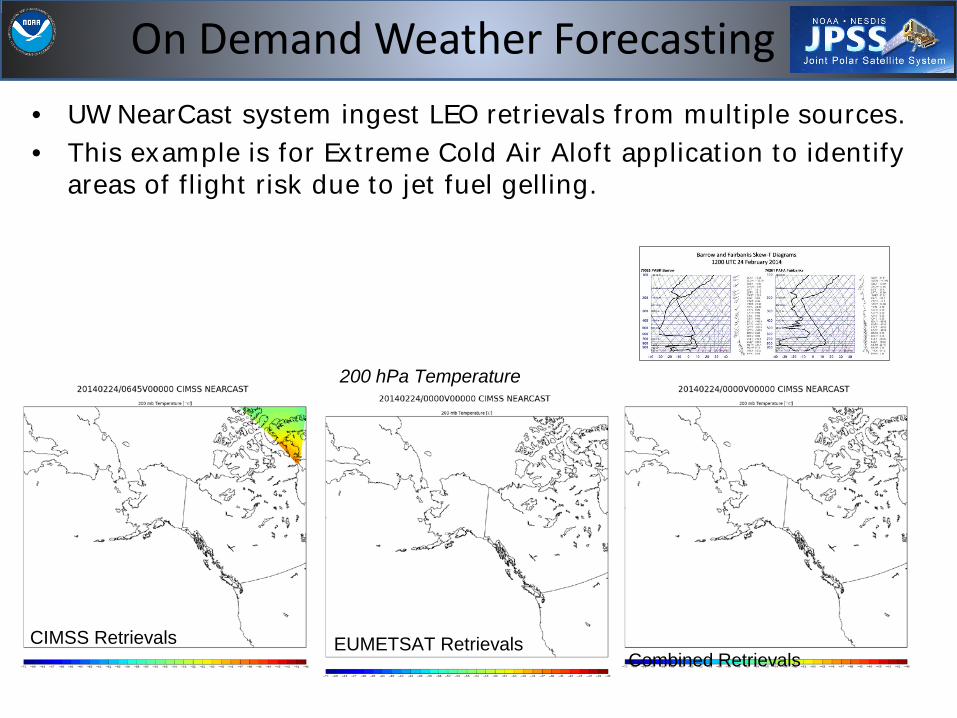
On Demand Weather Forecasting • UW NearCast system ingest LEO retrievals from multiple sources.
• This example is for Extreme Cold Air Aloft application to identify areas of flight risk due to jet fuel gelling.
CIMSS Retrievals EUMETSAT Retrievals Combined Retrievals
200 hPa Temperature
Societal Benefits
• Society benefits from information which enables decisions to improve the quality of life and reduce the impact of extreme events
• Information must flow from government to local - from experts to ordinary citizens.
8
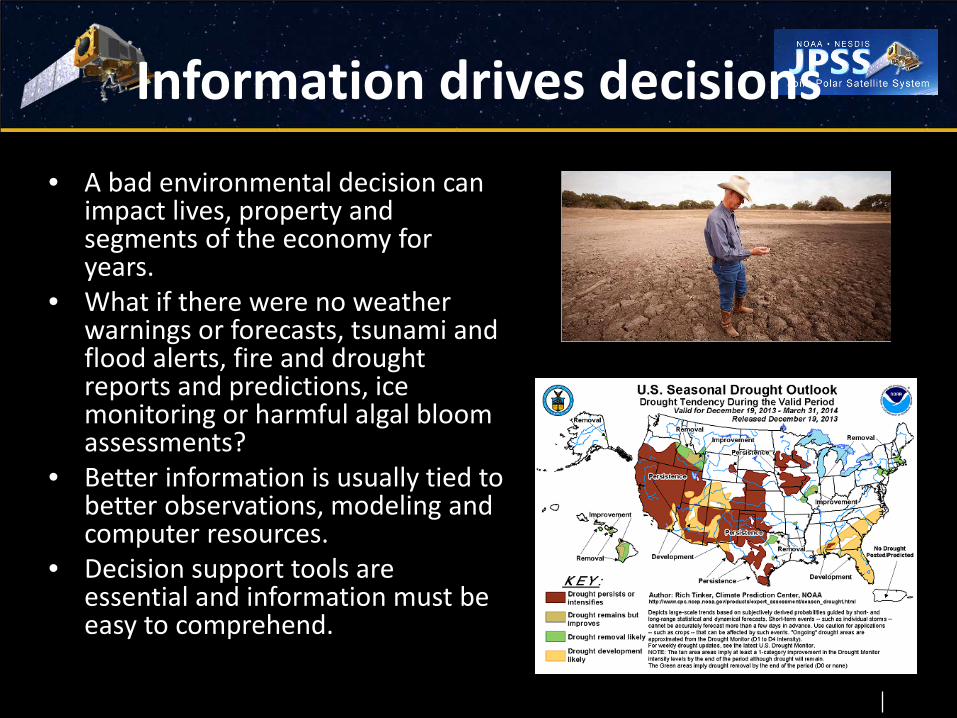
Information drives decisions
• A bad environmental decision can impact lives, property and segments of the economy for years.
• What if there were no weather warnings or forecasts, tsunami and flood alerts, fire and drought reports and predictions, ice monitoring or harmful algal bloom assessments?
• Better information is usually tied to better observations, modeling and computer resources.
• Decision support tools are essential and information must be easy to comprehend.
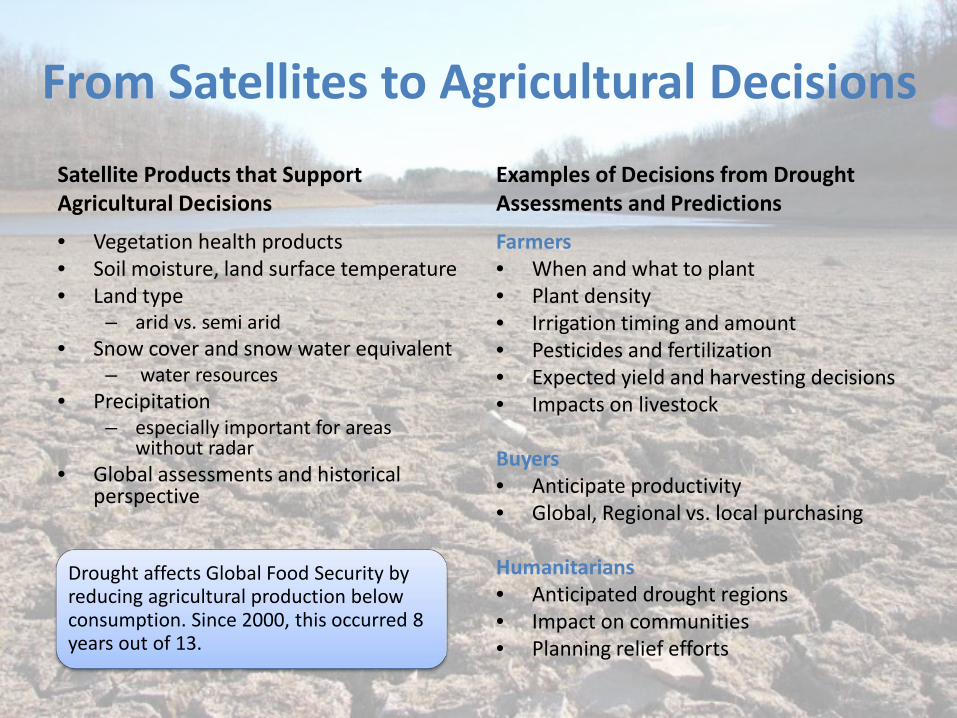
From Satellites to Agricultural Decisions Satellite Products that Support Agricultural Decisions
• Vegetation health products • Soil moisture, land surface temperature • Land type
– arid vs. semi arid • Snow cover and snow water equivalent
– water resources • Precipitation
– especially important for areas without radar
• Global assessments and historical perspective
Examples of Decisions from Drought Assessments and Predictions
Farmers • When and what to plant • Plant density • Irrigation timing and amount • Pesticides and fertilization • Expected yield and harvesting decisions • Impacts on livestock
Buyers • Anticipate productivity • Global, Regional vs. local purchasing
Humanitarians • Anticipated drought regions • Impact on communities • Planning relief efforts
Drought affects Global Food Security by reducing agricultural production below consumption. Since 2000, this occurred 8 years out of 13.

Vegetation Health from AVHRR IMPACTS: U.S. corn production in 2010 Hit a record high. Wheat was down 27% in Russia, 32% in Kazakhstan, and 19% in the Ukraine. Texas cotton production fell by more than half, from 7.84 million bales in 2010 to 3.5 million in 2011.
July 2010
July 2011
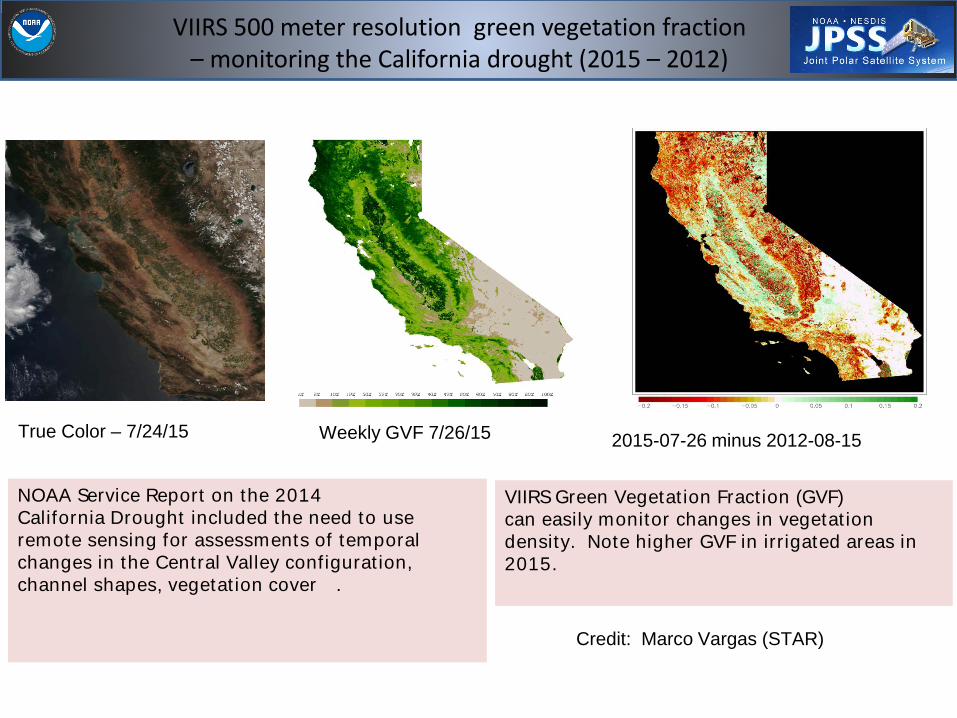
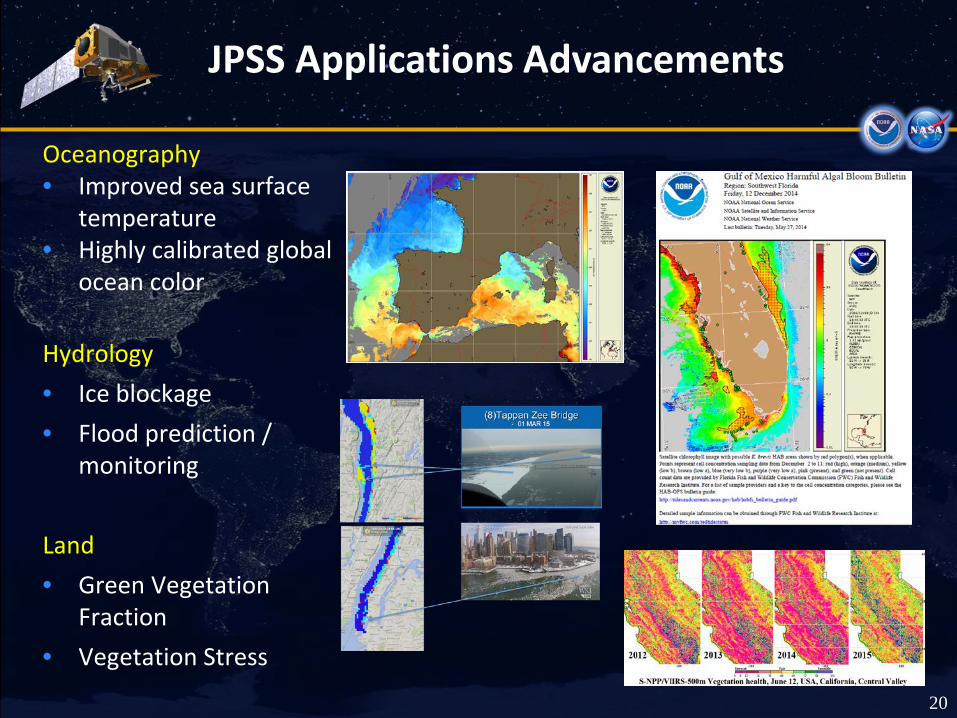
VIIRS 500 meter resolution green vegetation fraction – monitoring the California drought (2015 – 2012)
NOAA Service Report on the 2014 California Drought included the need to use remote sensing for assessments of temporal changes in the Central Valley configuration, channel shapes, vegetation coverÖ.
2015-07-26 minus 2012-08-15
VIIRS Green Vegetation Fraction (GVF) can easily monitor changes in vegetation density. Note higher GVF in irrigated areas in 2015.
Credit: Marco Vargas (STAR)
True Color – 7/24/15 Weekly GVF 7/26/15
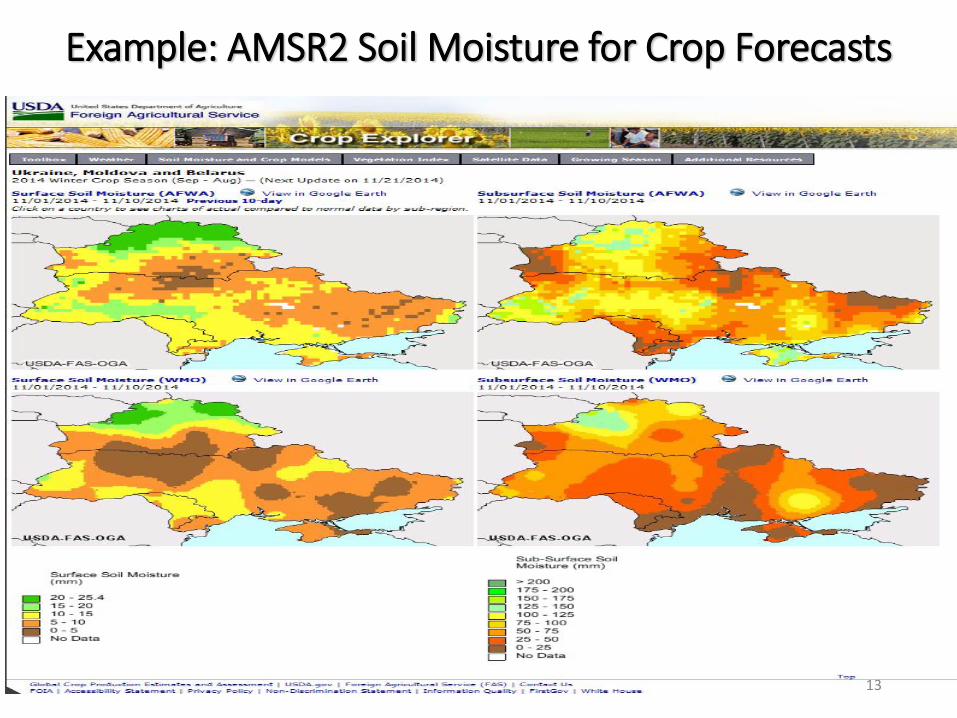
Example: AMSR2 Soil Moisture for Crop Forecasts
13
14
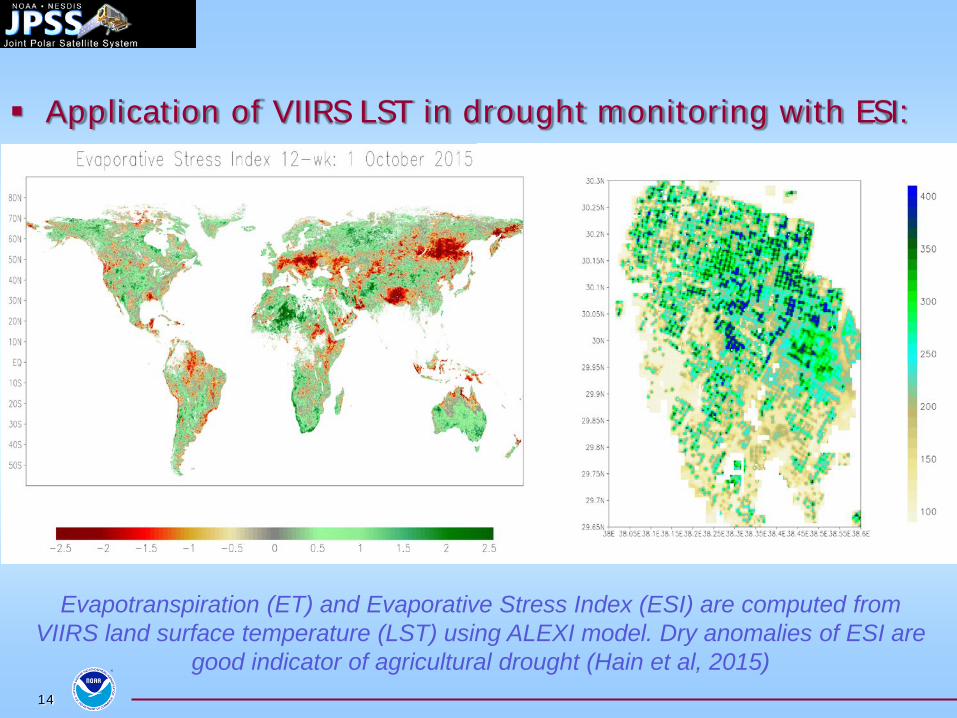
Application of VIIRS LST in drought monitoring with ESI:
Evapotranspiration (ET) and Evaporative Stress Index (ESI) are computed from VIIRS land surface temperature (LST) using ALEXI model. Dry anomalies of ESI are
good indicator of agricultural drought (Hain et al, 2015)
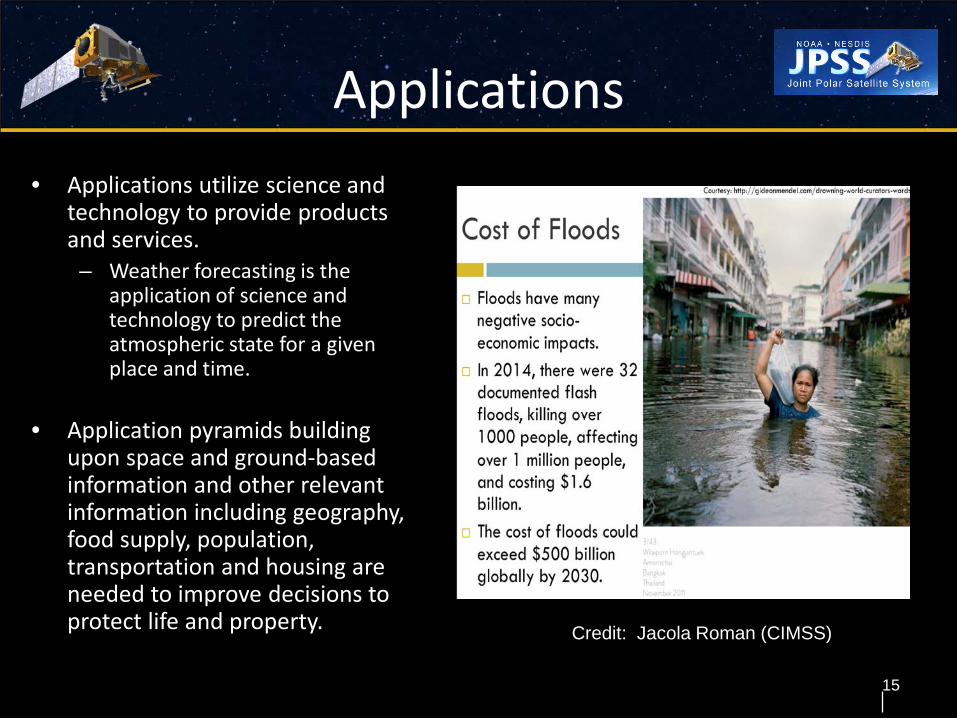
Applications • Applications utilize science and
technology to provide products and services. – Weather forecasting is the
application of science and technology to predict the atmospheric state for a given place and time.
• Application pyramids building upon space and ground-based information and other relevant information including geography, food supply, population, transportation and housing are needed to improve decisions to protect life and property.
15
Credit: Jacola Roman (CIMSS)
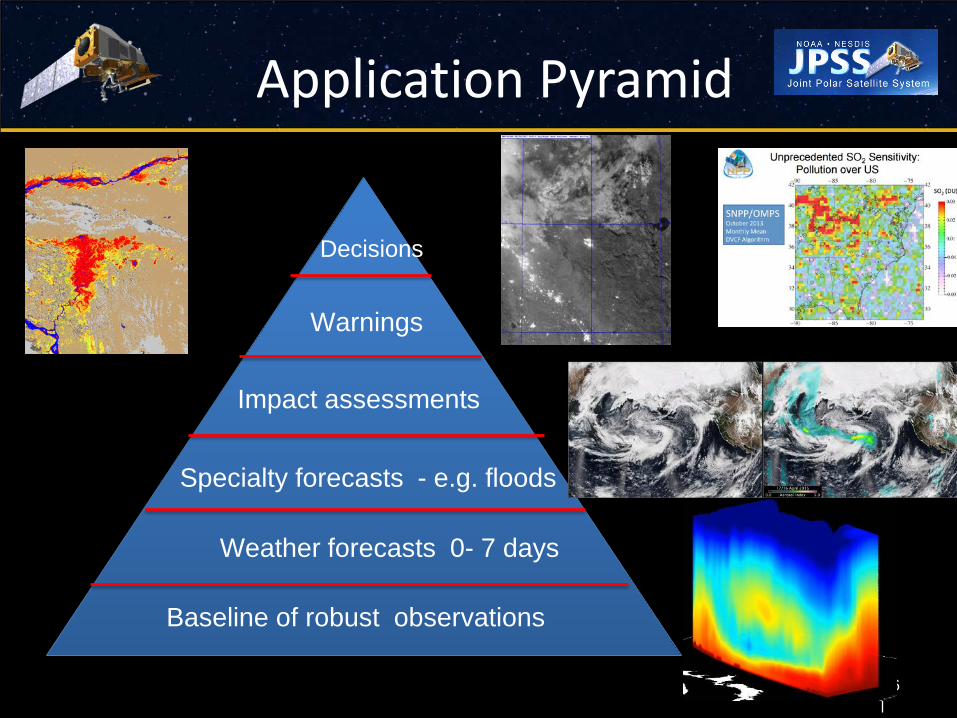
Application Pyramid
16
Baseline of robust observations
Weather forecasts 0- 7 days
Specialty forecasts - e.g. floods
Impact assessments
Warnings
Decisions
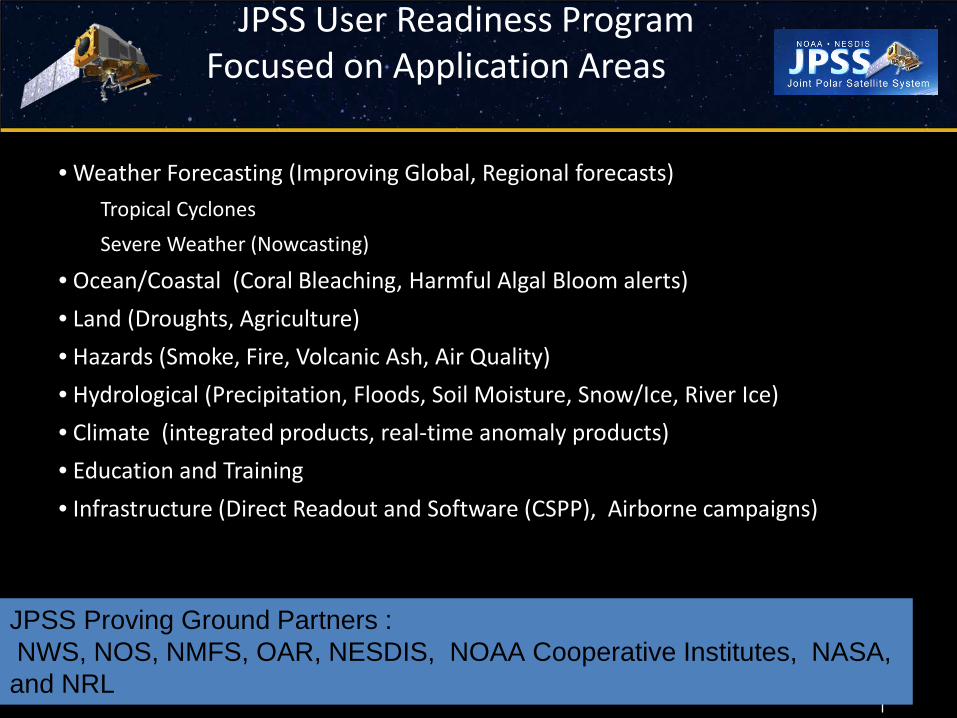
JPSS User Readiness Program Focused on Application Areas
• Weather Forecasting (Improving Global, Regional forecasts) Tropical Cyclones Severe Weather (Nowcasting)
• Ocean/Coastal (Coral Bleaching, Harmful Algal Bloom alerts) • Land (Droughts, Agriculture) • Hazards (Smoke, Fire, Volcanic Ash, Air Quality) • Hydrological (Precipitation, Floods, Soil Moisture, Snow/Ice, River Ice) • Climate (integrated products, real-time anomaly products) • Education and Training • Infrastructure (Direct Readout and Software (CSPP), Airborne campaigns)
JPSS Proving Ground Partners : NWS, NOS, NMFS, OAR, NESDIS, NOAA Cooperative Institutes, NASA, and NRL
JPSS Applications Advancements
18
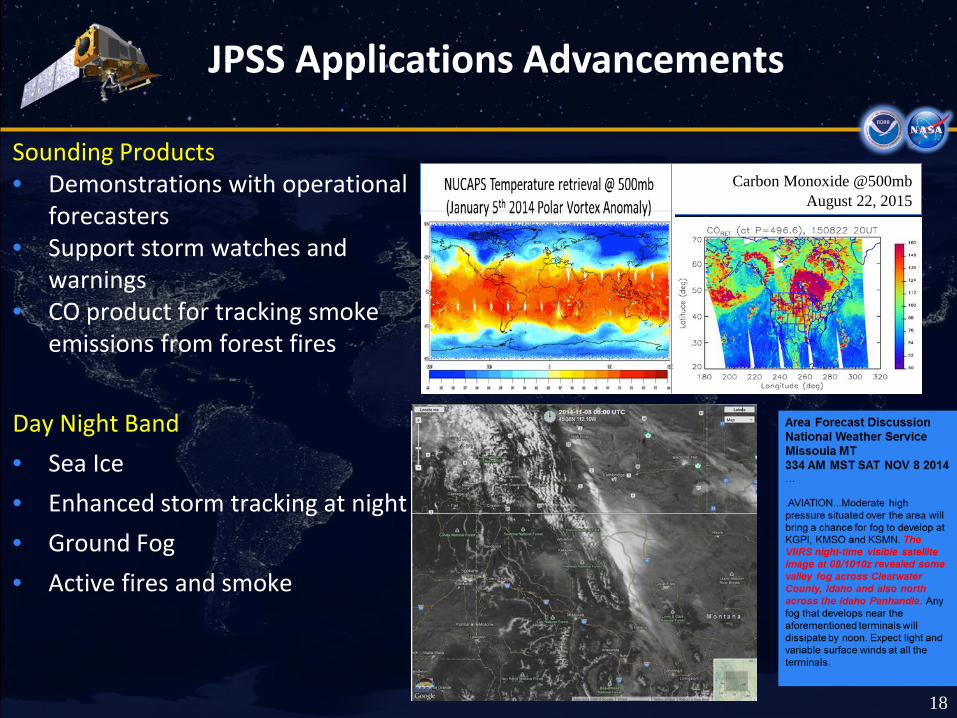
Sounding Products • Demonstrations with operational
forecasters • Support storm watches and
warnings • CO product for tracking smoke
emissions from forest fires Day Night Band • Sea Ice • Enhanced storm tracking at night • Ground Fog • Active fires and smoke
Carbon Monoxide @500mb August 22, 2015
JPSS Applications Advancements
19
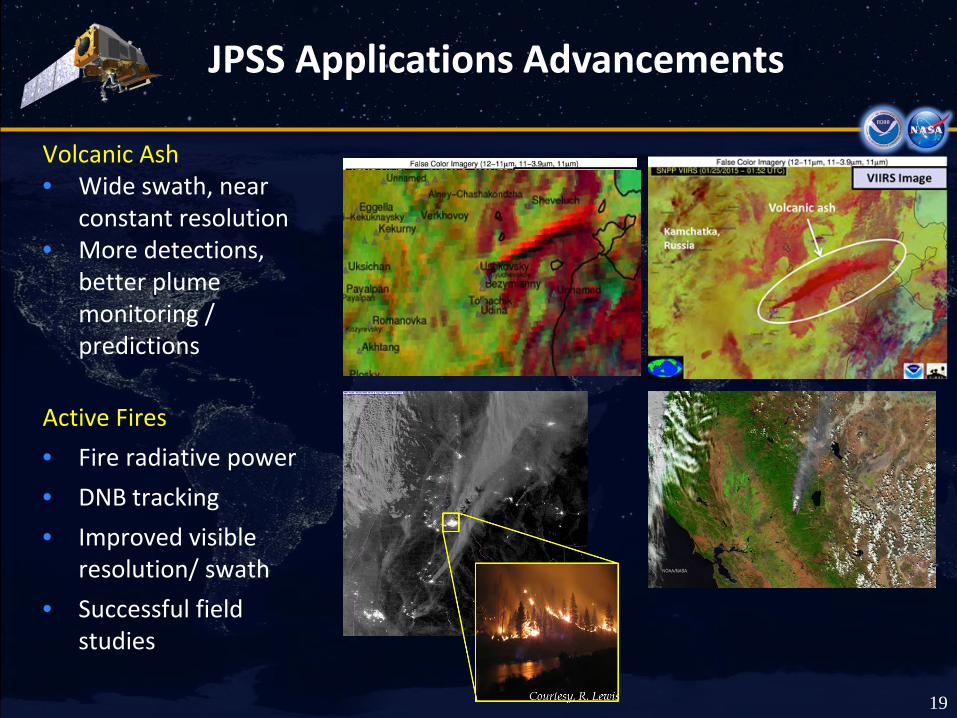
Volcanic Ash • Wide swath, near
constant resolution • More detections,
better plume monitoring / predictions
Active Fires • Fire radiative power • DNB tracking • Improved visible
resolution/ swath • Successful field
studies
JPSS Applications Advancements
20
Oceanography • Improved sea surface
temperature • Highly calibrated global
ocean color
Hydrology • Ice blockage • Flood prediction /
monitoring
Land • Green Vegetation
Fraction • Vegetation Stress
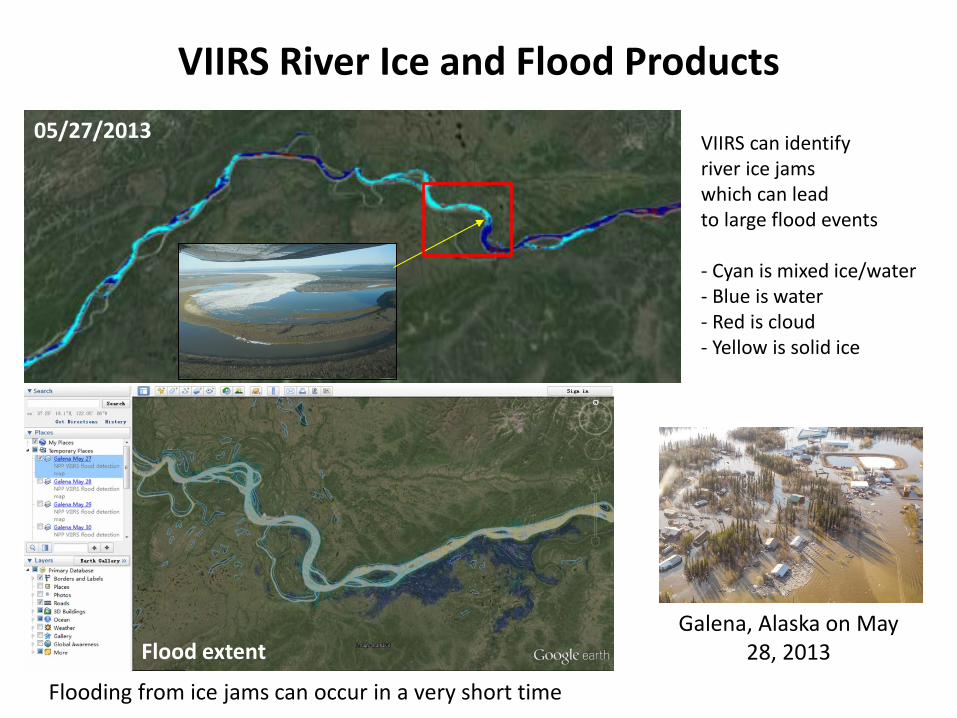
VIIRS River Ice and Flood Products
VIIRS can identify river ice jams which can lead to large flood events - Cyan is mixed ice/water - Blue is water - Red is cloud - Yellow is solid ice
Flooding from ice jams can occur in a very short time
Galena, Alaska on May 28, 2013
05/27/2013
Flood extent
22
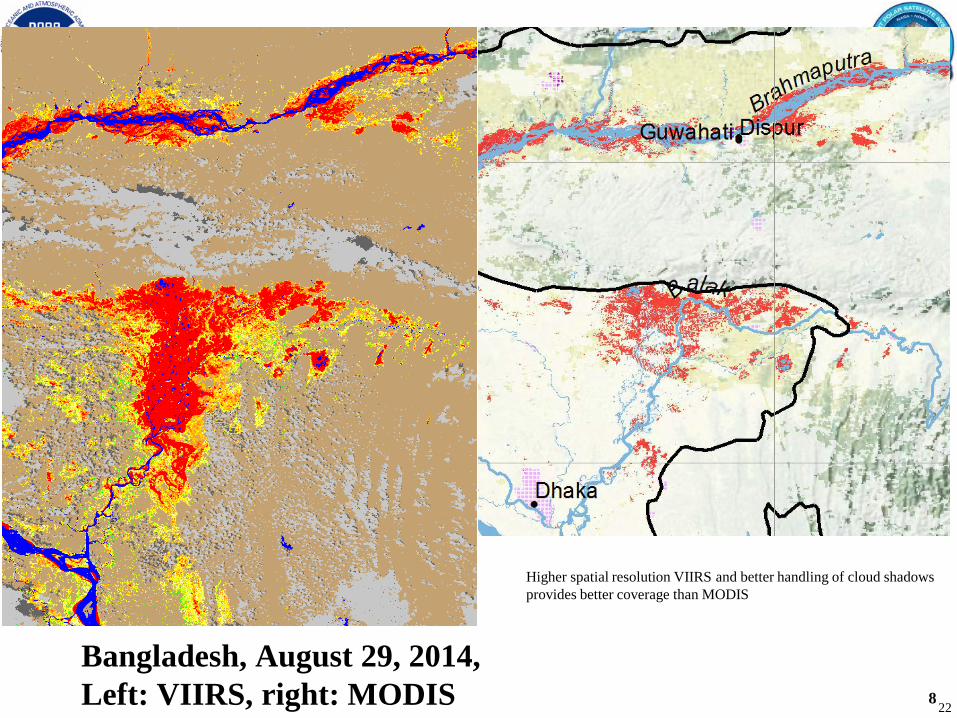
Bangladesh, August 29, 2014, Left: VIIRS, right: MODIS
Higher spatial resolution VIIRS and better handling of cloud shadows provides better coverage than MODIS
8
23
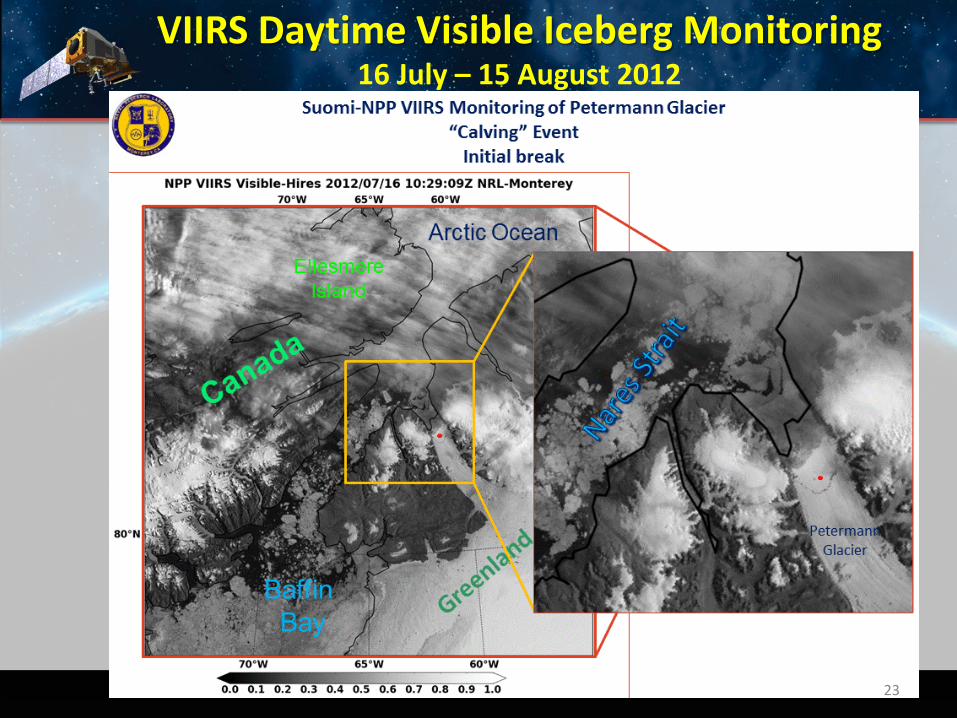
VIIRS Daytime Visible Iceberg Monitoring 16 July – 15 August 2012
24
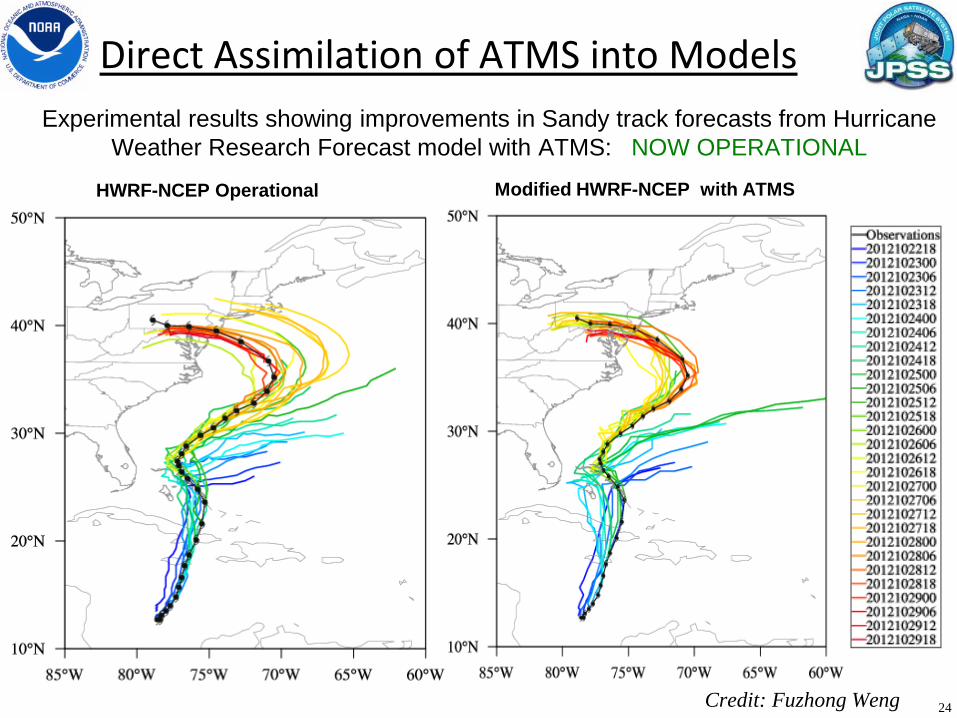
HWRF-NCEP Operational Modified HWRF-NCEP with ATMS
Direct Assimilation of ATMS into Models
Credit: Fuzhong Weng
Experimental results showing improvements in Sandy track forecasts from Hurricane Weather Research Forecast model with ATMS: NOW OPERATIONAL
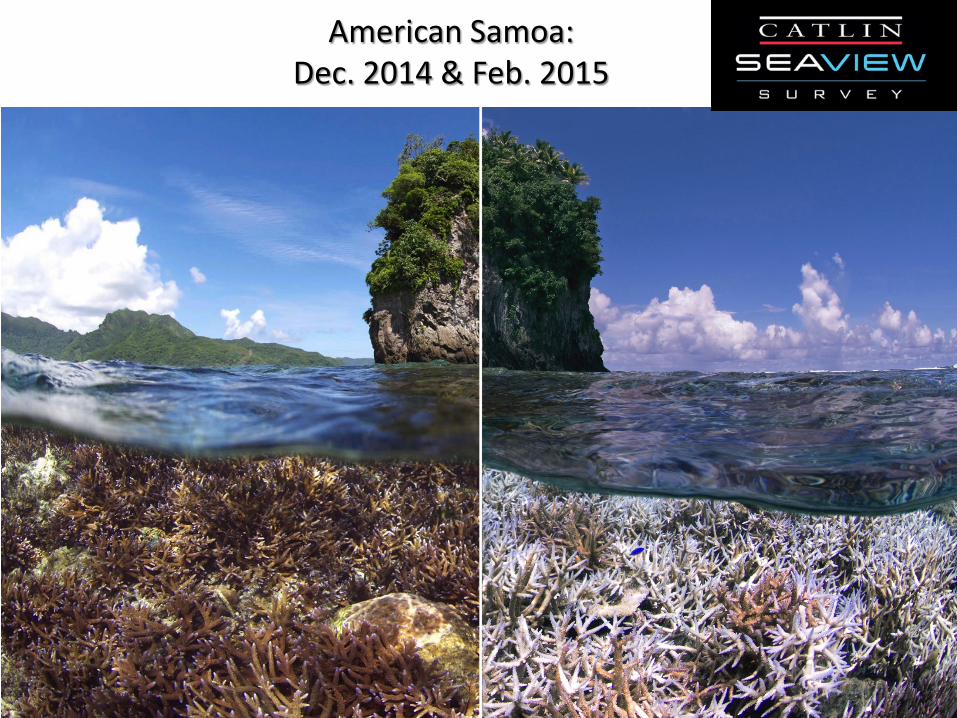
American Samoa: Dec. 2014 & Feb. 2015
26
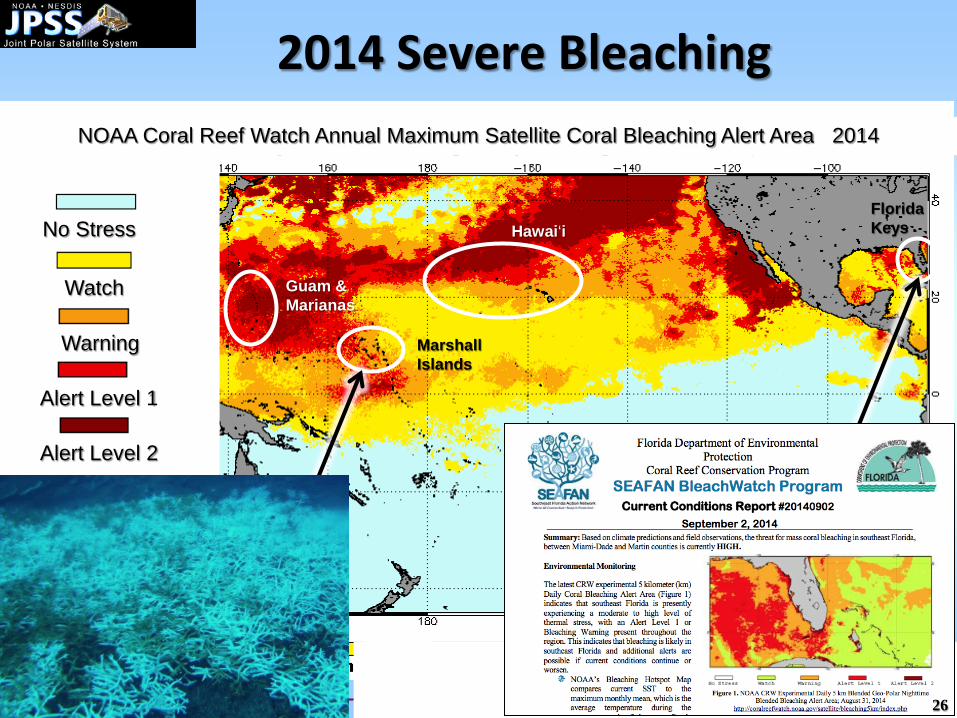
2014 Severe Bleaching
Hawai‘i
Guam & Marianas
Marshall Islands
Florida Keys
NOAA Coral Reef Watch Annual Maximum Satellite Coral Bleaching Alert Area 2014
Watch
Warning
Alert Level 1
Alert Level 2
26
Watch
No Stress
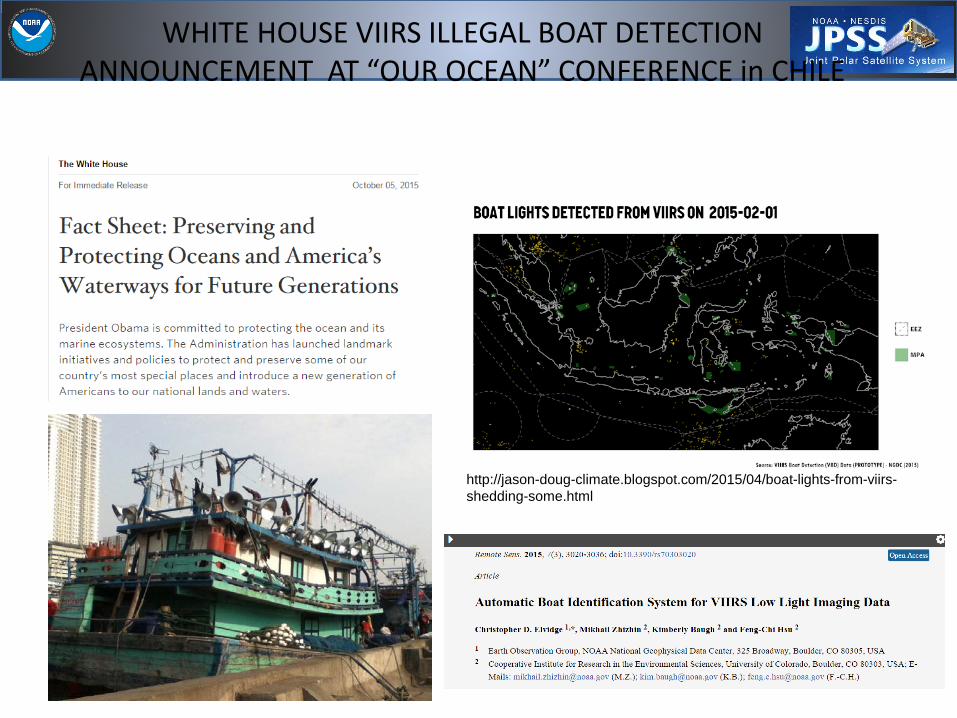
WHITE HOUSE VIIRS ILLEGAL BOAT DETECTION ANNOUNCEMENT AT “OUR OCEAN” CONFERENCE in CHILE
August 22, 2015
August 23, 2015 http://jason-doug-climate.blogspot.com/2015/04/boat-lights-from-viirs-shedding-some.html
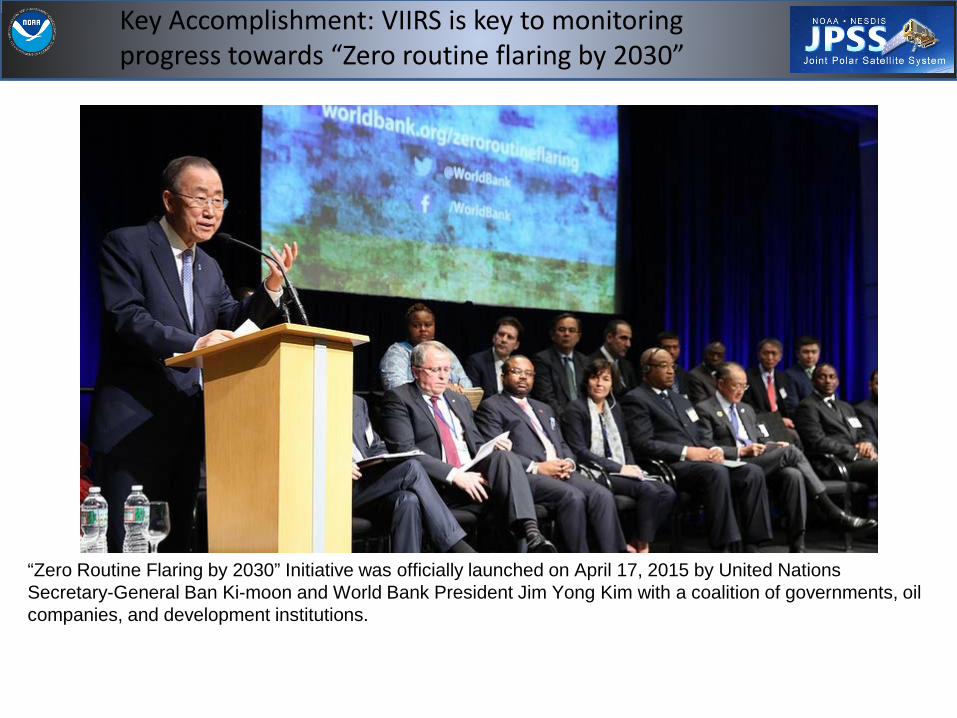
Key Accomplishment: VIIRS is key to monitoring progress towards “Zero routine flaring by 2030”
“Zero Routine Flaring by 2030” Initiative was officially launched on April 17, 2015 by United Nations Secretary-General Ban Ki-moon and World Bank President Jim Yong Kim with a coalition of governments, oil companies, and development institutions.
29
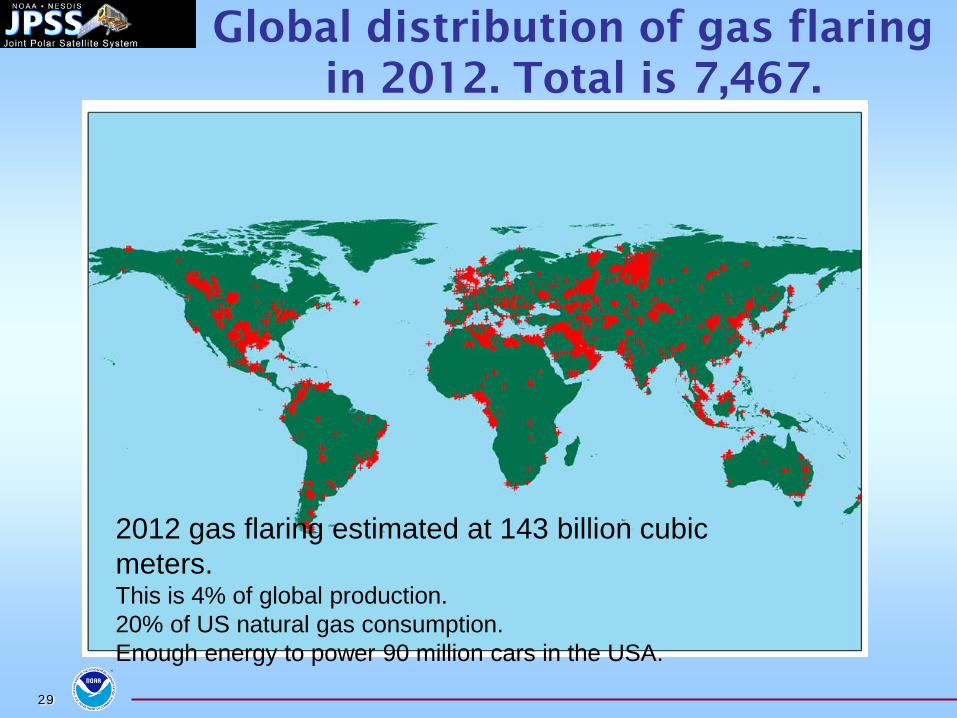
Global distribution of gas flaring in 2012. Total is 7,467.
2012 gas flaring estimated at 143 billion cubic meters. This is 4% of global production. 20% of US natural gas consumption. Enough energy to power 90 million cars in the USA.
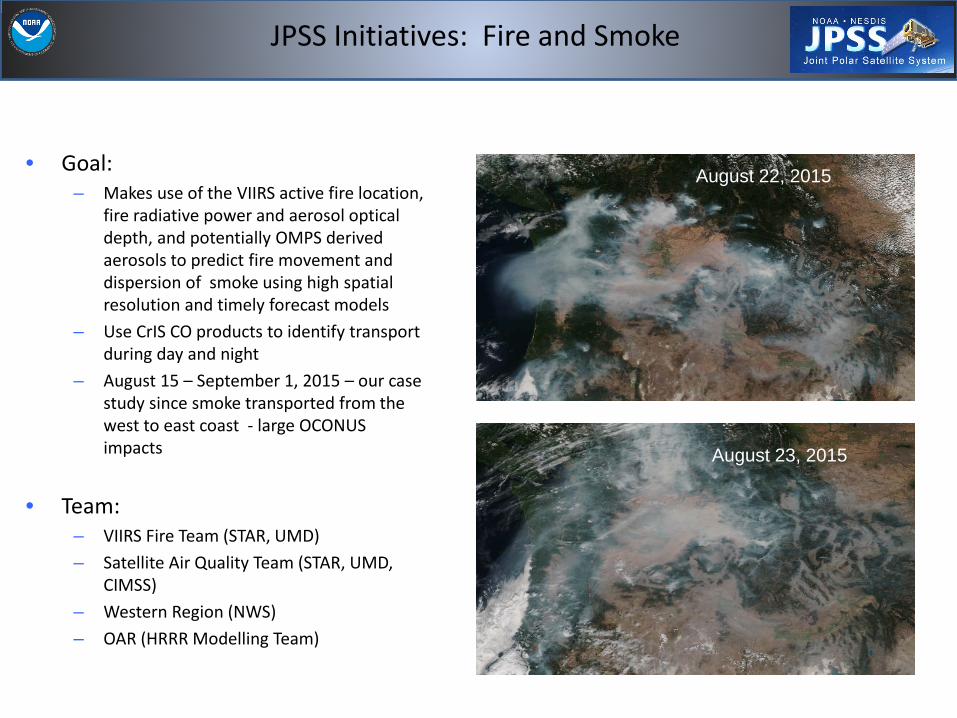
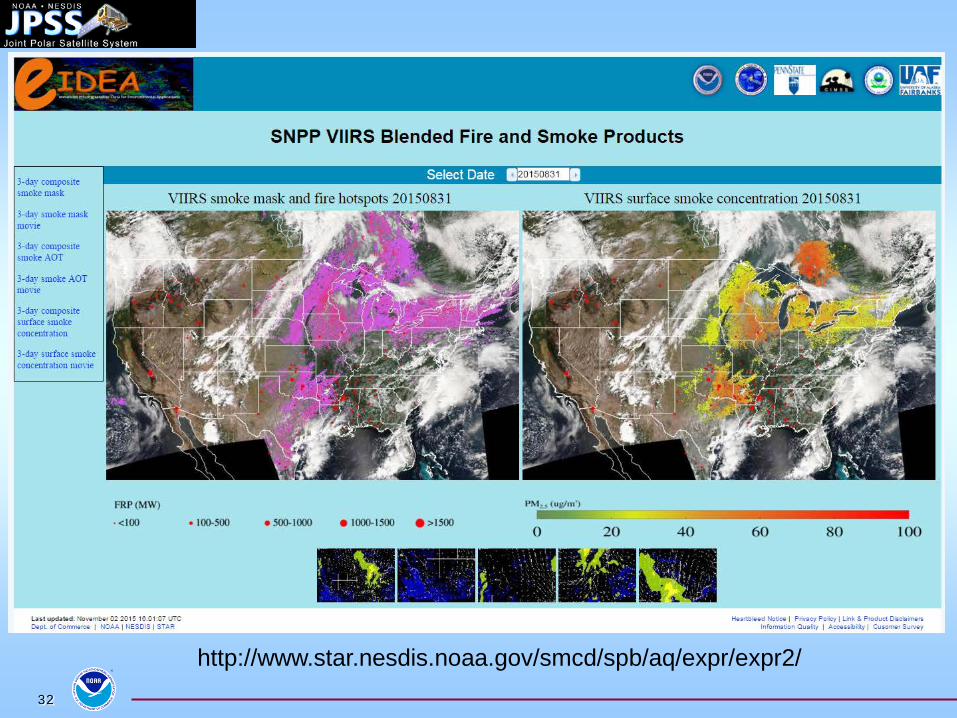
JPSS Initiatives: Fire and Smoke
• Goal: – Makes use of the VIIRS active fire location,
fire radiative power and aerosol optical depth, and potentially OMPS derived aerosols to predict fire movement and dispersion of smoke using high spatial resolution and timely forecast models
– Use CrIS CO products to identify transport during day and night
– August 15 – September 1, 2015 – our case study since smoke transported from the west to east coast - large OCONUS impacts
• Team: – VIIRS Fire Team (STAR, UMD) – Satellite Air Quality Team (STAR, UMD,
CIMSS) – Western Region (NWS) – OAR (HRRR Modelling Team)
August 22, 2015
August 23, 2015
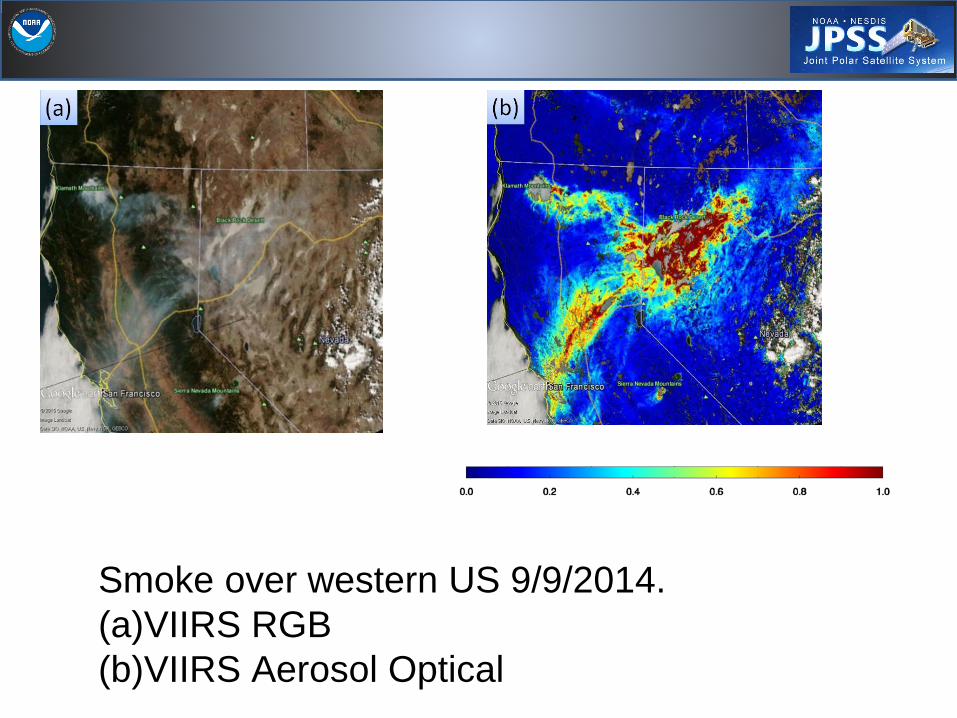
Smoke over western US 9/9/2014. (a)VIIRS RGB (b)VIIRS Aerosol Optical
32
http://www.star.nesdis.noaa.gov/smcd/spb/aq/expr/expr2/
33
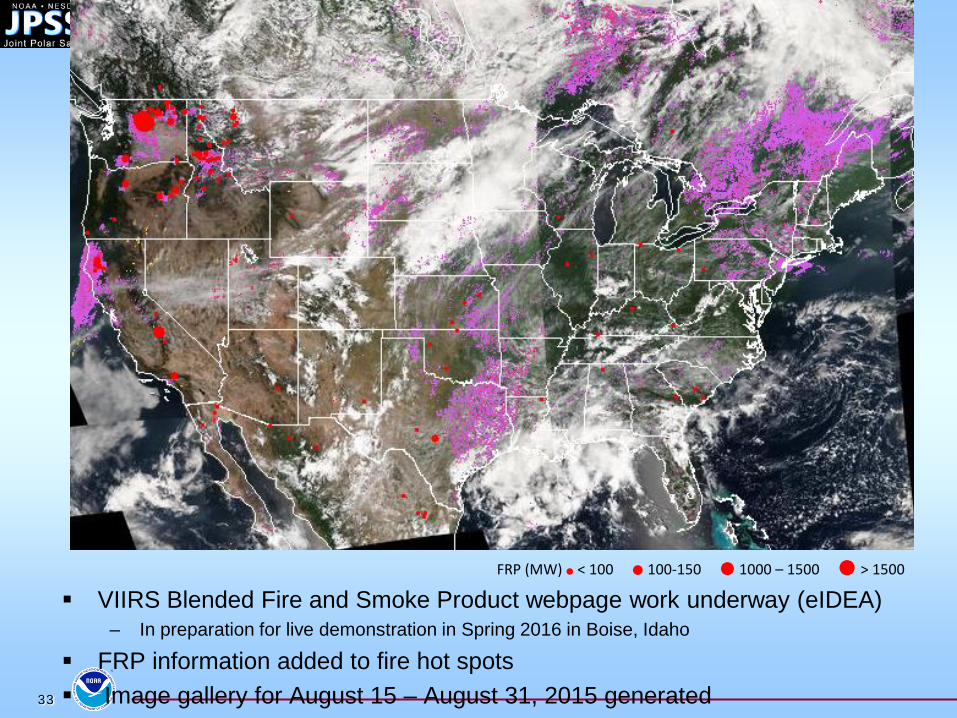
VIIRS Blended Fire and Smoke Product webpage work underway (eIDEA) – In preparation for live demonstration in Spring 2016 in Boise, Idaho
FRP information added to fire hot spots Image gallery for August 15 – August 31, 2015 generated
FRP (MW) ● < 100 ● 100-150 ● 1000 – 1500 ● > 1500
34
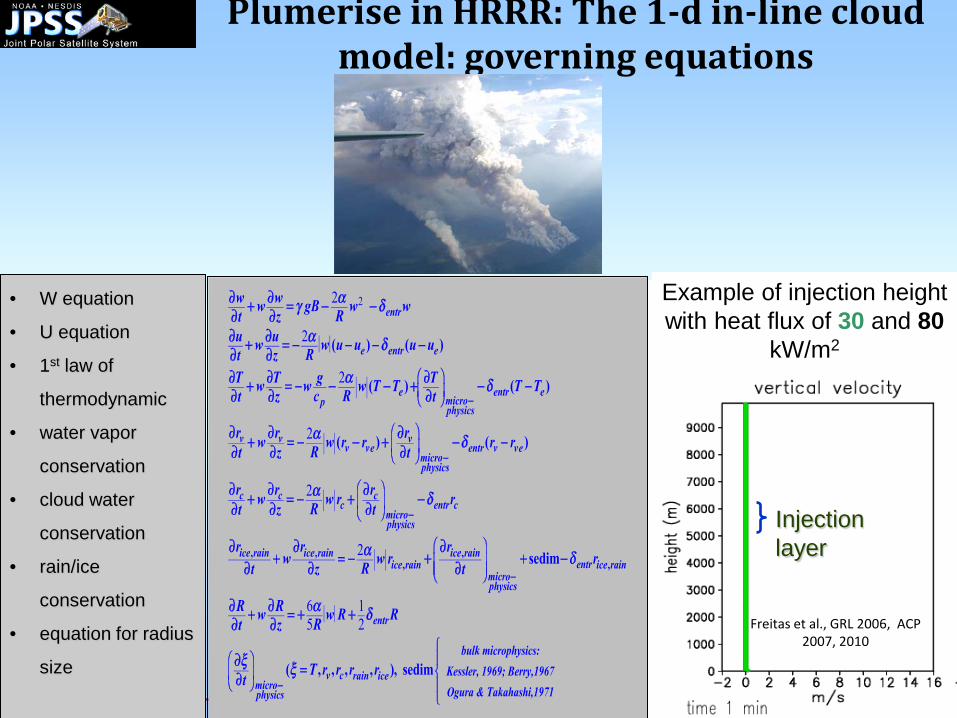
Plumerise in HRRR: The 1-d in-line cloud model: governing equations
ここ
• W equation
• U equation
• 1st law of
thermodynamic
• water vapor
conservation
• cloud water
conservation
• rain/ice
conservation
• equation for radius
size
Injection layer
Freitas et al., GRL 2006, ACP 2007, 2010
Example of injection height with heat flux of 30 and 80
kW/m2

Want to learn more?
• 2013 and 2014 Annual Science Digests are available
• 2012-2015, and 2015-2018 Portfolios are available
• Join our monthly JPSS Science Seminars http://www.jpss.noaa.gov/science-seminars.html
• Check out the JPSS Website http://www.jpss.noaa.gov/science.html
Summary
36
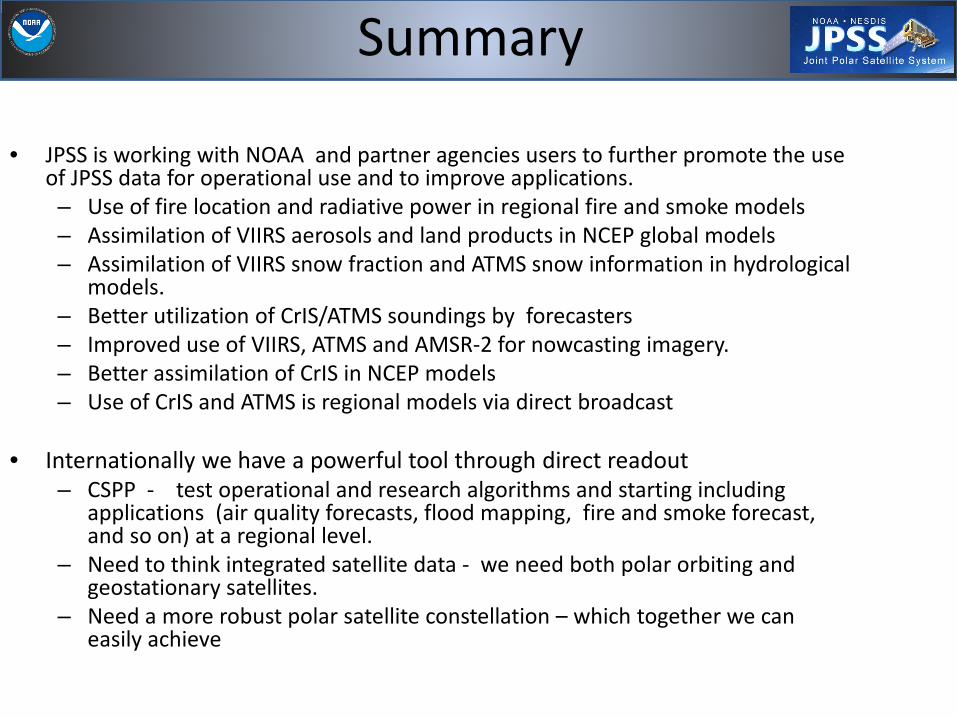
• JPSS is working with NOAA and partner agencies users to further promote the use
of JPSS data for operational use and to improve applications. – Use of fire location and radiative power in regional fire and smoke models – Assimilation of VIIRS aerosols and land products in NCEP global models – Assimilation of VIIRS snow fraction and ATMS snow information in hydrological
models. – Better utilization of CrIS/ATMS soundings by forecasters – Improved use of VIIRS, ATMS and AMSR-2 for nowcasting imagery. – Better assimilation of CrIS in NCEP models – Use of CrIS and ATMS is regional models via direct broadcast
• Internationally we have a powerful tool through direct readout
– CSPP - test operational and research algorithms and starting including applications (air quality forecasts, flood mapping, fire and smoke forecast, and so on) at a regional level.
– Need to think integrated satellite data - we need both polar orbiting and geostationary satellites.
– Need a more robust polar satellite constellation – which together we can easily achieve