Embed Size (px)
Citation preview

JPSS Overview
www.jpss.noaa.gov
Mitch Goldberg, JPSS Program Scientist Joint Polar Satellite System National Environmental Satellite, Data, and Information Service National Oceanic and Atmospheric Administration September 30, 2014 - WGCV

JPSS Overview
• JPSS is NOAA’s next generation operational polar orbiting satellites
• JPSS consists of three satellites (Suomi NPP, JPSS-1, JPSS-2), ground system and operations through 2025 – JPSS mission is to provide global imagery and atmospheric
measurements using polar-orbiting satellites
• JPSS is a partnership between NOAA and NASA – NOAA has final decision authority and is responsible for overall
program commitment – NASA is the acquisition agent for the flight system (satellite,
instruments and launch vehicle), ground system, leads program systems engineering, and program safety and mission assurance
– NOAA is responsible for operations, science, data exploitation and archiving, infrastructure
JPSS Integral to 3-Orbit Global Polar Coverage
JPSS implements US civil
commitment, interagency and
international agreements to afford 3-orbit
global coverage.
Suomi NPP / JPSS-1/JPSS-2
DMSP DoD
Follow-on
METOP
Local Equatorial Crossing Time
JAXA GCOM-W
JPSS is also a partnership with DOD, EUMETSAT and JAXA
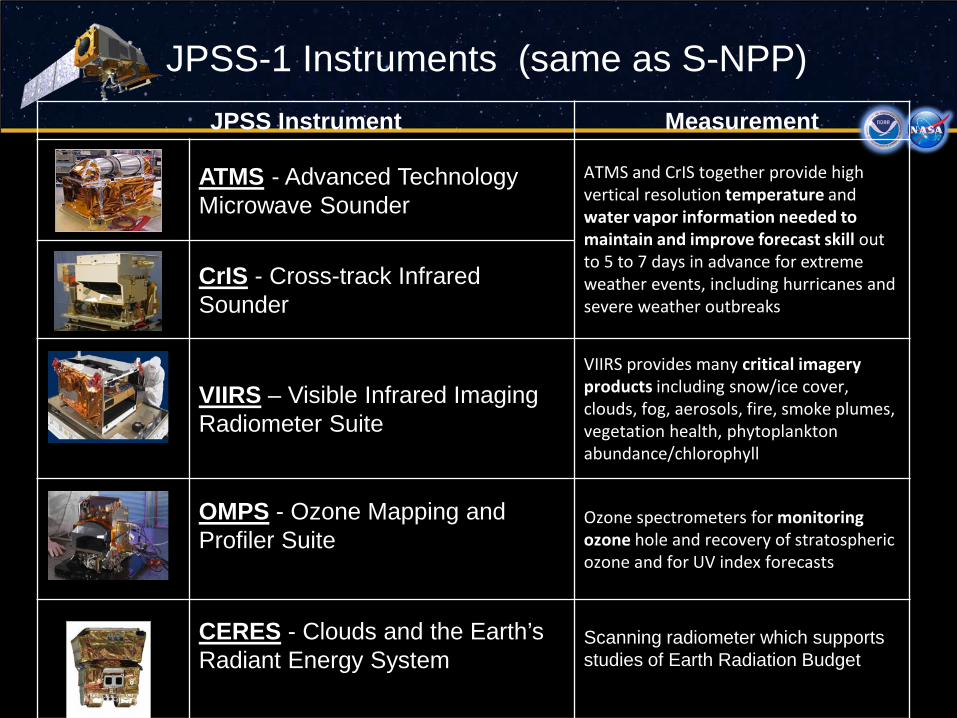
JPSS-1 Instruments (same as S-NPP) JPSS Instrument Measurement
ATMS - Advanced Technology Microwave Sounder
ATMS and CrIS together provide high vertical resolution temperature and water vapor information needed to maintain and improve forecast skill out to 5 to 7 days in advance for extreme weather events, including hurricanes and severe weather outbreaks
CrIS - Cross-track Infrared Sounder
VIIRS – Visible Infrared Imaging Radiometer Suite
VIIRS provides many critical imagery products including snow/ice cover, clouds, fog, aerosols, fire, smoke plumes, vegetation health, phytoplankton abundance/chlorophyll
OMPS - Ozone Mapping and Profiler Suite
Ozone spectrometers for monitoring ozone hole and recovery of stratospheric ozone and for UV index forecasts
CERES - Clouds and the Earth’s Radiant Energy System
Scanning radiometer which supports studies of Earth Radiation Budget

JPSS provides a wide range of capabilities • Microwave – provides temperature and
moisture soundings in cloudy conditions and rainfall rates, sea ice, snow, surface temperature
• Infrared – provides high vertical resolution temperature and moisture soundings in clear and cloud corrected regions; atmospheric chemistry - CO, CH4, SO2, … and cloud products
• Visible (day & night) and Infrared Imagery (including deep blue channels) – chlorophyll, cloud imagery, cloud products, SST, Active Fires, Smoke, Aerosols, land products, Snow, Ice,
oil spills… at exceptional resolution/global coverage
• UV - ozone - Aerosols over bright
surfaces, SO2 plumes, NOx (air quality)…
Temperature X-Section Polar Vortex
Algae in Lake Erie
DNB Ice detection
OMPS Aerosols from Fires
OMP- Volcano SO2 degassing

S-NPP and JPSS Data Products From NOAA available in real-time
GCOM AMSR-2 (11) CLOUD LIQUID WATER PRECIPITATION TYPE/RATE PRECIPITABLE WATER SEA SURFACE WINDS SPEED
SOIL MOISTURE SNOW WATER EQUIVALENT IMAGERY SEA ICE CHARACTERIZATION SNOW COVER/DEPTH SEA SURFACE TEMPERATURE SURFACE TYPE
VIIRS (24) ALBEDO (SURFACE) CLOUD BASE HEIGHT CLOUD COVER/LAYERS CLOUD EFFECTIVE PART SIZE CLOUD OPTICAL THICKNESS CLOUD TOP HEIGHT CLOUD TOP PRESSURE CLOUD TOP TEMPERATURE ICE SURFACE TEMPERATURE OCEAN COLOR/CHLOROPHYLL SUSPENDED MATTER VEGETATION INDEX, FRACTION,
HEALTH AEROSOL OPTICAL THICKNESS AEROSOL PARTICLE SIZE ACTIVE FIRES POLAR WINDS IMAGERY SEA ICE CHARACTERIZATION SNOW COVER SEA SURFACE TEMPERATURE LAND SURFACE TEMP SURFACE TYPE
CrIS/ATMS (3) ATM VERT MOIST PROFILE ATM VERT TEMP PROFILE CARBON (CO2, CH4, CO)
OMPS (2) O3 TOTAL COLUMN O3 NADIR PROFILE SO2 and Aerosol Index
ATMS (11) CLOUD LIQUID WATER PRECIPITATION RATE PRECIPITABLE WATER LAND SURFACE EMISSIVITY ICE WATER PATH LAND SURFACE TEMPERATURE SEA ICE CONCENTRATION SNOW COVER SNOW WATER EQUIVALENT ATM TEMPERATURE PROFILE ATM MOISTURE PROFILE
Joint Polar Satellite System 7

8
NSO
JPSS-1 Mission Architecture
Space Segment
WSC T&C (S-band)
SMD (Ka-band)
TDRSS
Launch Segment
Field Terminal Users Infra
Ingest
Data Del
Infra
Ingest
Data Del
Mission Data Command and Telemetry Key:
Space/Ground Communications Node Polar Ground Stations
(Svalbard, Fairbanks, McMurdo, Troll)
NSO
ESPC
Ingest
Product Distribution
Product Generation
Data Mgt Data Mgt
Cal/Val Node (GRAVITE)
J1 Simulator Node
(FVTS)
NSOF CBU NSOF MMC
CBU MMC
Ground Network Node
Management & Ops Node
Data Processing Node (IDPS) NAVY
FNMOC/ NAVOCEANO
NOAA (NWS and
NOS)
Ground Segment
Ancillary Data
Science Data
Segment CLASS
(Archive)
User Community
JPSS Ground System
JPSS-1
AFWA
GPS
JPSS SMD
Hub at CBU
JPSS SMD Hub
at NSOF
J1 Field Terminal Support Node
(FTS)
Mission Support Data
NDE
NSOF
CBU
PDA


10
Direct Readout
• SNPP/JPSS data is widely used by the direct readout community.
• NOAA has a long practice of providing open and free data – direct readout provides anyone, with a ~$300,000 dual
L-X band antenna, with access to full SNPP/JPSS data and POES/METOP data.
• Community Satellite Processing Package (CSPP) Software is available from NOAA’s Cooperative Institute at University of Wisconsin and Direct Readout Lab. – Configuration controlled software originates from JPSS
Ground Segment (IDPS and NDE) – NOAA sponsored users generally use CSPP
• A single antenna cover a large domain (see next slide)

11
Coverage of from one antenna at Madison, Wi.

12
CSPP Users 23 January 2013
More than 250 people have registered to download some part of the CSPP suite of products representing 33 different countries.

Operational Use of S-NPP Data S-NPP is now NOAA’s Primary Satellite
• May 1, 2012, VIIRS imagery used to support local warning and forecast operations throughout the NWS Alaska Region.
• May 22, 2012, the Advanced Technology Microwave Sounder (ATMS) radiances were operationally assimilated in the National Centers for Environmental Prediction’s (NCEP)/ NWS Global Forecast System (GFS).
• September 25, 2012, ATMS data was assimilated operationally into the European Centre for Medium-Range Weather Forecasts (ECMWF) weather forecast models.
• April 2013, the United Kingdom Meteorology Office began assimilating operational data from the Cross-track Imaging Radiometer Suite (CrIS) and ATMS into its weather forecast models.
• August 20, 2013, NCEP began incorporating S-NPP CrIS satellite data operationally into the GFS.
• October 31, 2013, NCEP/CPC started to use OMPS Ozone operationally
• November, 2013, NRL started to use ATMS operationally in their global forecast model.
Joint Polar Satellite System

JPSS Next Generation Instruments NPP VIIRS NOAA-19
AVHRR
VIIRS RGB (True Color), 11-22-2011 R: M05 (0.672 µm), G: M04 (0.555 µm), B: M02 (0.445 µm)
The Visible Infrared Imaging Radiometer Suite offers more spectral bands, higher resolution, wider swath and greater accuracy, resulting in a large number of products.
Entire Antarctica observed in 12 hrs.

15
Nadir End of ScanM1 0.412 0.742 x 0.259 1.60 x 1.58 Ocean Color
AerosolsM2 0.445 0.742 x 0.259 1.60 x 1.58 Ocean Color
AerosolsM3 0.488 0.742 x 0.259 1.60 x 1.58 Ocean Color
AerosolsM4 0.555 0.742 x 0.259 1.60 x 1.58 Ocean Color
AerosolsI1 0.640 0.371 x 0.387 0.80 x 0.789 ImageryM5 0.672 0.742 x 0.259 1.60 x 1.58 Ocean Color
AerosolsM6 0.746 0.742 x 0.776 1.60 x 1.58 Atmospheric Corr'nI2 0.865 0.371 x 0.387 0.80 x 0.789 NDVIM7 0.865 0.742 x 0.259 1.60 x 1.58 Ocean Color
AerosolsDNB 0.7 0.742 x 0.742 0.742 x 0.742 Imagery
M8 1.24 0.742 x 0.776 1.60 x 1.58 Cloud Particle SizeM9 1.378 0.742 x 0.776 1.60 x 1.58 Cirrus/Cloud CoverI3 1.61 0.371 x 0.387 0.80 x 0.789 Binary Snow Map
M10 1.61 0.742 x 0.776 1.60 x 1.58 Snow FractionM11 2.25 0.742 x 0.776 1.60 x 1.58 CloudsI4 3.74 0.371 x 0.387 0.80 x 0.789 Imagery Clouds
M12 3.70 0.742 x 0.776 1.60 x 1.58 SST M13 4.05 0.742 x 0.259 1.60 x 1.58 SST
Fires
M14 8.55 0.742 x 0.776 1.60 x 1.58 Cloud Top Properties M15 10.763 0.742 x 0.776 1.60 x 1.58 SST I5 11.450 0.371 x 0.387 0.80 x 0.789 Cloud Imagery
M16 12.013 0.742 x 0.776 1.60 x 1.58 SST
Driving EDRs
CCD
Horiz Sample Interval(km Downtrack x Crosstrack)Band
No.Wave-length (µm)
VIS
/NIR
FP
ASi
licon
PIN
Dio
des
S/M
WIR
PV H
gCdT
e (H
CT)
PV H
CT
LWIR
VIIRS: Next Gen Operational Polar Orbiting Imaging Radiometer
● 22 spectral bands – Visible to LWIR – Spatially registered
● Better spatial resolution – Reduced variation over
scan – Higher resolution imaging
bands
● High radiometric accuracy – NIST-traceable – Supported by on-board
calibrators

VIIRS I-band 1 (375-m) image of Pine Island Glacier – 21 January 2013
Pine Island Glacier, with a large crack evident via satellite
Image courtesy of Dan Lindsey, RAMMB/CIRA

17

Comparing MODIS (250m) to VIIRS (375m) Edge of Scan

19
VIIRS Long-term Trending
Initial degradation >2% per week
•RTA degradation leveling off •For M7, initially > 2% per week; Currently ~0.1% per week

20
BEFORE accounting for SRF difference AFTER accounting for SRF difference
Cao
VIIRS and MODIR RSB Inter-comparison at SNO-x ( over desert)

JPSS Next Generation Instruments Cross-track Infrared Sounder Advanced Technology Microwave Sounder
Resolution: OMPS vs SBUV/2
Ozone Mapping Profiler Suite
Higher resolution, wider swath, smaller gaps 6x more vertical
resolving power
Provides global coverage ozone monitoring

22
ATMS vs AMSU noise performance
AMSU equivalent field of view reduce by factor of 3 ~ .09 K
AMSU instrument temperature varies more due to solar hearing causing seasonal noise effect
23
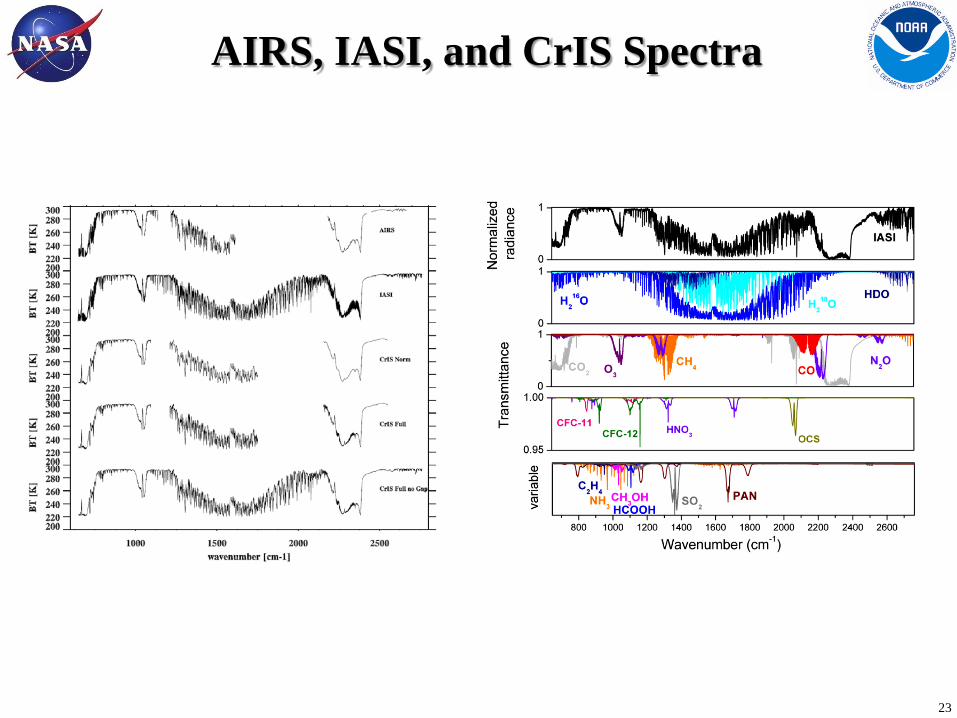
AIRS, IASI, and CrIS Spectra

24
Source: Ben Ruston (Personal Comm.)

25
JPSS PGRR Deep-Dive Validation First S-NPP ER-2 Aircraft Campaign to provide
validation for CrIS, ATMS and VIIRS
NIST traceable absolute calibration for CrIS
ER-2 with aircraft validation sensors under flies Suomi NPP sensors. In the case of CrIS, the validation sensor in this example is from the Scanning High-resolution Interferometer Sounder (S-HIS) which has been tied to a NIST traceable calibration source. Quick look comparisons show excellent agreement. Significance – NIST traceable validation is critical for uncertainty analysis needed to fully assess data quality of S-NPP and JPSS sensors.
May 10, 2013 – first look

Achieving 0.1 K absolute calibration is important for verifying real climate trends
• Through detail validation we have demonstrated that both CrIS and IASI have achieved a high level climate monitoring performance capability.
• Climate monitoring performance allows you to minimize the time to detect a real climate trend from natural variability.
• In the figure to the right, we see that a trend of 0.1 K per decade would take 20 years to confirm with perfect observations.
• While a calibration accuracy of 0.1 would take about 25-27 years
• While a calibration accuracy of 0.3 would take about 50 years.
• This chart would imply that CrIS and IASI are not good for monitoring trends. The accuracy noted in the chart for IASI, AIRS, CRIS are from the specification
• Good news - CrIS and IASI are approaching 0.1 K - beating the specification by significant margins
26
Wielicki, Bruce A., and Coauthors, 2013: Achieving Climate Change Absolute Accuracy in Orbit. Bull. Amer. Meteor. Soc., 94, 1519–1539. doi: http://dx.doi.org/10.1175/BAMS-D-12-00149.1

27
• 10/23-24/2012
NPP SDR Provisional Product Review 27
Atmospheric absorption above the aircraft
Window channels

28
SNO Results between CrIS and IASI/Metop-B from 10 months’ reprocessed CrIS SDR (2013/02-12)
28
South Pole (783) North Pole (774)
Bias: CrIS-IASI
STDEV: CrIS-IASI
Bias: CrIS-IASI
STDEV: CrIS-IASI

Conclusion
29
• Current suite of instruments on Suomi NPP will be flown on JPSS-1 satellite mission and offer significant improvements in observational capability from the legacy POES satellite series and continue and improve upon NASA EOS research capabilities.
• The JPSS mission is critical to provide the U.S. and international community with operational continuity of key weather , ecosystems. climate observations established by NOAA and NASA.
• The NOAA satellite climate data records from 1970s will be continued by JPSS.
• JPSS is on track, on budget and schedule for upcoming JPSS-1 satellite mission in early 2017.
• JPSS Proving Ground promotes improve applications and user engagement and feedback

Additional slides
30

Rainfall rates during Hurricane Sandy
31
AMSU vs ATMS
ATMS offers more channels, better resolution and a wider swath than previous legacy microwave instruments. This improves the accuracy of short- and medium-term forecasting, storm tracking and, with continued measurements over time, climate prediction models. It helps collect essential data for accurate near-term weather predictions needed for farming, commercial and defense aircraft flight path planning, terrestrial extreme weather preparedness and oceanographic inputs for civilian and defense ships. ATMS measurements also provide rainfall rates, snow and ice information.
Advance Technology Microwave Sounder (ATMS)

The CrIS is the first in a series of advanced operational sounders that provides more accurate, detailed atmospheric temperature and moisture observations for weather and climate applications. CrIS provides temperature and moisture profiles with 6x more vertical resolving power than previous NOAA infrared sounders. A single hyperspectral IR sounder provides the largest improvement to the forecast skill than any other instrument.
32 CrIS long-wave surface temperature channel
Cross-track Infrared Sounder (CrIS)

OMPS tracks the health of the ozone layer and measures the concentration of ozone in the Earth's atmosphere. Data from OMPS continues three decades of total ozone and ozone profile records, which fulfill the U.S. treaty obligation to monitor ozone concentrations for the Montreal Protocol. This important data is used by ozone assessment researchers and policy makers to create global climate models.
33
Ozone Mapping and Profiler Suite (OMPS)
Total Ozone for APR 18, 2012 Credit: NOAA/NASA

CERES measures reflected sunlight and thermal radiation emitted by the Earth and helps provide measurements of the spatial and temporal distribution of Earth's Radiation Budget (ERB) components. Measurements from CERES help scientists understand the links between the Earth's incoming and outgoing energy and the properties of the atmosphere that affect that energy. The observations from CERES FM6 help measure the effect of clouds on the energy balance, which strongly influences both weather and climate.
34
Clouds and the Earth’s Radiant Energy System (CERES)