Embed Size (px)
Citation preview

Joint Hurricane Testbed: Final Report
Objective and Automated Assessment of Operational Global Forecast Model Predictions of Tropical Cyclone Formation and Life Cycle
Principal Investigator: Patrick A. Harr
Naval Postgraduate School Monterey, CA 93943
SUMMARY: The objective of this Joint Hurricane Testbed (JHT) project is to deliver an operational product that objectively identifies tropical cyclone precursor circulations in analyzed and forecast fields from operational global numerical forecast models. Additionally, analyzed and forecast physical characteristics that are relevant to tropical cyclone formation are identified with respect to each precursor circulation. Model traits that are related to each current analyzed and/or forecast circulation are summarized at each analysis time. Upon the completion of a circulation’s life cycle as either a non-developing (with respect to tropical cyclone formation) or developing system, a comprehensive summary of the model performance is made and cataloged for comparison with future circulations.
TABLE OF CONTENTS 1.0 INTRODUCTION ………………………………………………….. 2 2.0 SYSTEM OVERVIEW …………………………………………….. 2 2.1 Tropical Cyclone Vortex Tracking Program (TCVTP)…… . 3 2.2 VORTRACK Web Interface ………………………………. 4 2.2.1 System Overview ………………………………. 5 2.2.2 MySQL Database Description ………………….. 5 2.2.3 MySQL Database Operation ……………………. 6 2.2.4 PHP Application ………………………………… 7 2.2.5 PHP Database Administration ………………….. 8 3.0 VORTRACK OPERATION ……………………………………………… 8 3.1 View Current Model Outputs ………………………………. 9 3.2 View Previous Model Outputs …………………………….. 12 3.3 View Previous Vortices ……………………………………. 15 3.4 Calculate Error Statistics …………………………………… 17 4.0 DATABASE MAINTENENACE …………………………………… 20 4.1 Administer Model Output ………………………………….. 21 4.2 Administer Vortices ………………………………………… 22 4.3 Archive Old and Unmatched Tracks ……………………….. 24 4.4 Repair and Optimize Database ……………………………... 24 5.0 ANALYSIS ………………………………………………………….. 24 5.1 Forecasts of Tropical Cyclone Formation: Season ………… 27 5.2 Forecasts of Tropical Cyclone Formation: Individual Cases . 28 6.0 SUMMARY ………………………………………………………….. 34 Appendix 1: Database Details ……………………………………………. 35 Appendix 2: Scripts for Database Creation ………………………………. 40 Appendix 3: Scripts for Uploading Data to the Database ………………… 43 Appendix 4: Scripts for Database Backup ………………………………... 45
1

1.0 INTRODUCTION The VORTRACK application has been developed so that output from numerical weather models can be reviewed as part of a process to forecast the intensification of tropical lows into tropical storms. Initially, a prototype system was developed to operate at the Naval Postgraduate School during the 2004 Atlantic and eastern North Pacific hurricane season. Details of the implementation and configuration of the TCVTP and its output were provided in an interim report (January 2004) and are summarized in this report. Although the components have not changed since the original proposal, there are additional details supplied here. Based on several demonstrations and meetings with National Hurricane Center (NHC) hurricane specialists and staff, several modifications were made to the prototype system. These were implemented in a test system that was run at NHC and at the Naval Postgraduate School during the 2005 hurricane season. 2.0 SYSTEM OVERVIEW There are two primary components to the VORTRACK system. The main data processing portion (Fig. 1) ingests grids generated by several operational global numerical forecast models (Table 1) that are received at NHC. The model fields are processed by a tropical cyclone vorticity tracking program (TCVTP) developed by the Meteorology Department of the Naval Postgraduate School. The program outputs the tracks of all eligible tropical vortices as well as environmental parameters (Table 2) defined relative to each tropical vortex. The results, which consist of an ASCII text file are then stored in several files based on the type of vortex. If the vortex appears in the analysis field, the parameters associated with that vortex are stored in a location for
Forecast M odel A nalyses and Forecast FieldsForecast M odel A nalyses and Forecast Fields
Tropical C ycloneV ortex TrackingProgram (TC V T P)
Tropical C ycloneV ortex TrackingProgram (TC V T P)
Forecast D ata BaseC irculations
forecast to occur
Forecast D ata BaseC irculations
forecast to occur
A nalyzed D ata BaseC urrent tropical
circulations
A nalyzed D ata BaseC urrent tropical
circulations
Current circulation sum m aries/ verifications
Current circulation sum m aries/ verifications
F inal C irculation Catalogsum m aries/verifications
F inal C irculation Catalogsum m aries/verifications
Catalog of False A larm s
Catalog of False A larm s
Fig. 1 Schematic of the components of the primary processing component of the VORTRACK system. This component identifies, tracks, and catalogs all eligible tropical vortices contained in several operational global numerical forecast models.
2

currently active vortices. If the vortex does not appear in the current analysis, but first appears in a forecast field, the parameters are stored in a location for vortices that are forecast to occur. The interface to the output data and various summary displays and statistics is via a series of web pages, which constitutes the second component of the VORTRACK system. The displays include: vortex tracks, time series graphs of individual parameters, single storm error statistics, multiple storm error statistics, and inter model track and parameter comparisons. The interface is based upon a MySQL data base that contains the catalog of analyzed and forecast tropical vortex characteristics for each model.
Source Model National Centers for Environmental
Prediction (NCEP) Global Forecast System (GFS
Fleet Numerical Meteorological and Oceanographic Center (FNMOC)
Naval Operational Global Atmospheric Prediction System (NOGAPS)
United Kingdom Meteorological Office (UMMO)
UKMO Global Model
Canadian Meteorological Center (CMC_ CMC Global Model Table 1. Operational global forecast models processed by the TCVTP/VORTRACK system 2.1 Tropical Cyclone Vorticity Tracking Program (TCVTP) The initial component of the VORTRACK system processes the global model fields, identifies all tropical vortices in the domain of the eastern North Pacific Ocean and the North Atlantic Ocean, defines the relative environmental parameters, and writes the text summary files that will be uploaded to the MySQL data base. This component of the system is written entirely in FORTRAN and operates in a Linux environment. Initially, the global model fields are input as GEMPAK files, which are used operationally at NHC. Subsets of the global model parameters (Table 3) are converted to FORTRAN binary files and stored temporarily for use in the TCVTP program. All processing is on the original GEMPAK data grid of 1o lat. /long. The first step in the TCVTP program is to identify all valid tropical vortices. To be identified and tracked, a vortex must have a minimum 850 hPa relative vorticity of 1.5*10-5 s-1. Additionally, if the relative vorticity value less than 3*10-5 s-1, it is required that the curvature vorticity be greater than the shear vorticity. All eligible vortices are assigned a unique name, which consists of the basin (i.e., ATL for Atlantic or EPC for eastern North Pacific), the date-time-group (DTG) of the current analysis, and the latitude and longitude of the vortex center. All vortices in the current analysis are examined to determine whether they are continuations of vortices from the most recent past analysis. If a vortex is a continuation, then it is assigned the name of the parent vortex. After the analysis field is processed, the
3

valid tropical vortices are identified in each forecast field. The forecast fields extend to 120 h in 6-h increments. At each forecast time, every vortex is examined to determine if it is a continuation of a vortex from the previous forecast or analysis in the case of the 6-h forecast. If so, the vortex is assigned the name of the parent vortex. Otherwise, a new name is assigned. If a vortex first appears in a forecast field, the naming convention is as defined above with the addition of the forecast time in which the vortex first appears. The output of the TCVTP program consists of one text file that contains the track (lat., long.) and environmental parameters (Table 2) for each vortex. The name of each file is the same as the name of the vortex. 850 hPa relative vorticity Sea-level pressure minimum (mb) Shallow vertical wind shear (850-500 hPa) Deep vertical wind shear (850-200 hPa) 850-200 hPa geopotential height thickness 700-500 hPa warm core
Vertical motion at 500 hPa 700-400 hPa warm core 700-500 hPa Vapor pressure 700-300 hPa warm core
850-500 hPa average relative vorticity Sea-level pressure difference between the vortex and the environment
Total Precipitation Convective Precipitation
Table 2. Analyzed and forecast quantities used to identify physical characteristics associated with each tropical vortex. Warm core measurements are defined as a temperature difference between the vortex and the environment. A directory structure is required such that files for all vortices that currently exist (i.e., are contained in analysis fields) reside in one directory (labeled “astrm”) and files for vortices that are forecast to form (i.e., are only contained in forecast fields with no corresponding vortex in an analysis field) are stored in a separate directory (labeled “fstrm”). The files in the “astrm” directory for current vortices remain in the directory until the vortex is no longer identifiable in the analysis. At this time, the catalog is moved to a directory for storage of all finalized vortices. The data files for each forecast vortex remain in the “fstrm” directory until they are matched to an analyzed vortex. If they are never matched, they remain in this data base and are a potential false alarm. All data that pertain to a current analyzed vortex are stored in the Analyzed Data Base. The final task performed in the TCVTP component is to define the files that are uploaded to the MySQL database. These files place the vortex name, track, and environmental parameters in the proper format for the upload process, which is described in Section 2.2. 2.2 VORTRACK Web Interface The interface to the TCVTP is via a web-based system labeled VORTRACK. The system is designed to interface with the MySQL data base for display of tracks, time series of individual parameters (i.e., warm core, sea-level pressure, etc.), forecast error statistics that pertain to a single vortex or collections of vortices, and inter-model track and parameter comparisons.
4
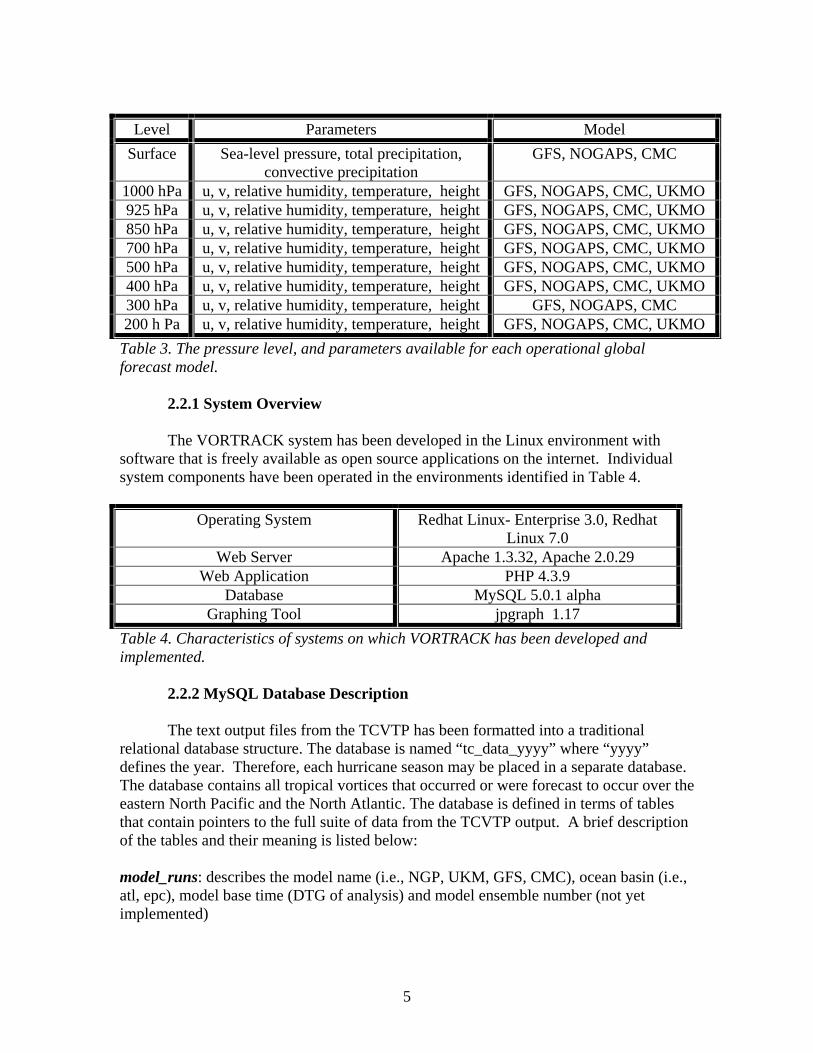
Level Parameters Model
Surface Sea-level pressure, total precipitation, convective precipitation
GFS, NOGAPS, CMC
1000 hPa u, v, relative humidity, temperature, height GFS, NOGAPS, CMC, UKMO 925 hPa u, v, relative humidity, temperature, height GFS, NOGAPS, CMC, UKMO 850 hPa u, v, relative humidity, temperature, height GFS, NOGAPS, CMC, UKMO 700 hPa u, v, relative humidity, temperature, height GFS, NOGAPS, CMC, UKMO 500 hPa u, v, relative humidity, temperature, height GFS, NOGAPS, CMC, UKMO 400 hPa u, v, relative humidity, temperature, height GFS, NOGAPS, CMC, UKMO 300 hPa u, v, relative humidity, temperature, height GFS, NOGAPS, CMC 200 h Pa u, v, relative humidity, temperature, height GFS, NOGAPS, CMC, UKMO
Table 3. The pressure level, and parameters available for each operational global forecast model. 2.2.1 System Overview The VORTRACK system has been developed in the Linux environment with software that is freely available as open source applications on the internet. Individual system components have been operated in the environments identified in Table 4.
Operating System Redhat Linux- Enterprise 3.0, Redhat Linux 7.0
Web Server Apache 1.3.32, Apache 2.0.29 Web Application PHP 4.3.9
Database MySQL 5.0.1 alpha Graphing Tool jpgraph 1.17
Table 4. Characteristics of systems on which VORTRACK has been developed and implemented. 2.2.2 MySQL Database Description The text output files from the TCVTP has been formatted into a traditional relational database structure. The database is named “tc_data_yyyy” where “yyyy” defines the year. Therefore, each hurricane season may be placed in a separate database. The database contains all tropical vortices that occurred or were forecast to occur over the eastern North Pacific and the North Atlantic. The database is defined in terms of tables that contain pointers to the full suite of data from the TCVTP output. A brief description of the tables and their meaning is listed below: model_runs: describes the model name (i.e., NGP, UKM, GFS, CMC), ocean basin (i.e., atl, epc), model base time (DTG of analysis) and model ensemble number (not yet implemented)
5

model_ouputs: describes the model parameters associated with each vortex at each time step, and includes all of the model output fields. model_ouputs_in_tracks: links model output with model track names. Track names are identified by basin, model, DTG, and location of the vortex model_vortices: describes the model vortices identified by the TCVTP program model_tracks_in_runs: links model track names with model runs that the tracks have been observed in. model_tracks_in_vortices: links model track names with model vortices. A full description of the database fields is in Appendix 1 In MySQL, views are defined to allow access to a set of relations (tables) as if it were a single table, Views can also be used to restrict access to rows (a subset of a particular table). Two views are contained in the VORTRACK database: model_outputs_in_runs: links model output with model runs model_ouputs_in_vortices: links model output with model vortices. 2.2.3 MySQL Database Operations . 2.2.3.1 Database creation Appendix 2 contains a listing of the scripts used to create a database. During creation, two user accounts are defined. The first account is labeled “anonymous” and provides for general access to the data via the web interface. The second account is labeled “process” and is used to upload data to the database and minor database administration tasks. 2.2.3.2 Loading data into the database Appendix 3 contains a listing of the scripts used to upload data to the database. These scripts assume a conventional directory structure and file names. If these are altered, then the script references to the directories and files should also be changed. The data to be uploaded is created in the TCVTP component and placed in text files. The files are loaded into temporary database tables then uploaded to the online database in association with some verification. 2.2.3.3 Database backup The scripts that perform a backup of the database are listed in Appendix 4. The backup operation results in a binary file that is provided a unique name due to
6

placement of a stamp based on the time of the backup operation. The database may be restored with the restore script listed in Appendix 4. Because of limitations within MySQL any views in the table structure need to be dropped prior to backing up the database, and then restored after the backup procedure has completed. This may result in a momentary loss in external data access. 2.2.4 PHP Applications All application files that access the database utilize the PHP interface to MySQL. The PHP interface is used for operations such as extracting data from the database based on queries defined in scripts and performing calculations on the extracted data. While the database interface utilizes PHP, the web page formatting applications are in plain HTML. All graphs are generated by the jpgraph software as defined in Table 1. The following is a summary of the web page/database interface routines: tcvtp_index.html: home page tcvtp_top.php: displays current and past model dates, enables selection of model, year and domain tcvtp_page.php: displays available vortices in selected model and domain. tcvtp_help.htm: displays VORTRACK help tcvtp_display.php: displays all environmental parameters for the current vortex tcvtp_display_line.php: plots an environmental parameter for a single track tcvtp_display_multiline.php: plots an environmental parameter for multiple tracks tcvtp_display_multiline_model.php: plots an environmental parameter for the latest base time of a range of models tcvtp_errors.php: form for entering criteria for error statistic calculation tcvtp_forecast_errors.php: displays error statistics using form values as selection criteria tcvtp_display_errorline.php: plots error statistics using form values as selection criteria tcvtp_display_errors.php: displays error statistics for the current vortex tcvtp_display_multitrack.php: plots all tracks associated with the current vortex tcvtp_display_multitrack_model.php: plots the latest track for the current base time over a range of models
7

tcvtp_display_multibox.ph: generates a box and whiskers plot of forecast performance relative to the peak vorticity of storms vortrack_css.css – style sheet for VORTRACK 2.2.5 PHP Database Administration The MySQL “tc_data_yyyy” database can be administered via a PHP interface. Complete model runs can be removed from the database, tracks can be assigned or removed from vortices, and individual field values can be modified. The database administration web interface is under password protection. A brief summary of the database administration web pages are as follows: tcvtp_adm.php: home page for administration tcvtp_adm_add_track.php: add a track - confirm tcvtp_adm_add_track_2.php: add a track – implement tcvtp_adm_fix_value.php: fix a value – confirm (note that entering NULL will enter a null value) tcvtp_adm_fix_value_2.php: fix a value – implement tcvtp_adm_remove_model.php: remove a model from the database – confirm tcvtp_adm_remove_model_2.php: remove a model from the database – implement tcvtp_adm_remove_track.php: remove a track from a vortex - confirm tcvtp_adm_remove_track_2.php – remove a track from a vortex - implement 3.0 VORTRACK Operation The two components of VORTRACK operate to provide examination of model representations of tropical vortices based on constraints defined in Section 2.1 The TCVTP component identifies and tracks valid vortices plus defines analyzed and forecast environmental parameters (Table 2). The data defined by the TCVTP component are uploaded to the database that the use interfaces with via the PHP routines in the VORTRACK component. Operation of the system requires the TCVTP software to execute as each set of operational model products are received at NHC. Once the data are uploaded to the
8

database, the web interface allows inspection of each model’s characteristics associated with each tropical vortex being tracked. The VORTRACK web interface is designed to accommodate four modes of operation: i) view current model output; ii) view previous model outputs; iii) view previous vortices; and iv) calculate error statistics. The modes are identifiable via choices on the VORTRACK home page (Fig. 2). 3.1 View Current Model Outputs For the option to view current model output, a web page (Fig. 3) is used that allows a choice of model and geographic domain. Once these parameters are chosen, the web page displays the most recent DTG that has been processed for that model and domain. The “view current model outputs” page contains four sections. The top section provides animations of various model fields. The animation to display TCVTP animated fields (left-most option) allows inspection of the analyzed and forecast 850 hPa vorticity overlaid with the tracks defined by the TCVTP program. This display is most useful for examining the output and assessing the evolution of each vortex in the forecast sequence. The other two display options in the top section display various model fields and forecast While the animation capabilities exist, they are not implemented in the NHC version of VORTRACK as that capability exists through other operational products.
Fig. 2 The VORTRACK web home page The second section of the “view current model outputs” page lists any tropical cyclones that exist at that DTG. These are defined by any tropical vortices for which advisories are being written. The third section lists any vortices that correspond to an
9

area identified as being suspect or an “invest” for potential tropical cyclone formation. The fourth section lists all other active tropical vortices. Each vortex is listed by the
Fig. 3 The web page that corresponds to the “View Current Model Outputs” option in Fig. 2. Each light blue colored section corresponds to specific views of the current model output (see text). unique name assigned in the TCVTP component. The name identifies the ocean basin, the model, the DTG that the vortex first appeared in the analysis, and the lat./long. at which the vortex first appeared. For every vortex that is listed in either the tropical cyclone section, the invest section, or the listing of remaining vortices, there are several entries that allow examination of various characteristics of the respective vortex in the chosen model’s analysis and forecast fields. As defined above, the first column identifies the vortex. In the tropical cyclone section, the identifier is the number or name of the storm. In the invest section, the invest number is used to identify the vortex. For the remaining vortices, the TCVTP name is used as defined above. In all sections, the second column displays the current analyzed location of the vortex. The third column provides an option to display the data associated with the vortex (Fig. 4). The data are listed from most recent model DTG to the time that the vortex first began to appear in forecast fields. Each column of the data displays values of the 14 environmental parameters for each analysis and forecast time of each model run. The column headings are links to displays of the parameters for the total history of the vortex (Fig. X) and the values for each analysis time are links to displays of the parameter for the respective model run. The fourth column in the entry for each vortex provides a link to the most recent available set of forecast errors (Fig. 5). The forecast errors are listed for each parameter and are computed as forecast value minus observed value. The errors are listed as the
10

average bias error (top section in the display) and the average absolute error (bottom section in the display).
Fig. 4 Display of the data table for a tropical vortex chosen from the web page in Fig. 3.
Fig. 5 Display of the forecast errors table for a tropical vortex chosen from the web page in Fig. 3.
11

The fifth and sixth columns present options to plot the track of the chosen vortex (Fig. 6). On the plot all tracks display, all previous analysis positions are marked as points on a solid black line and all forecast positions are plotted with alternating colors for each model run. The most recent forecast is circled. If the analysis or forecast position is displayed as a hurricane symbol, then that vortex is either analyzed to be a tropical cyclone or forecast to become a tropical cyclone based on a set of criteria that include the relative vorticity value and the magnitudes of the three warm core measurements. The plot last track option only displays the most recent forecast track. However, the tracks from other models are also displayed (Fig. 7). The seventh column provides a drop-down list (Fig. 8) of the environmental parameters with respect to the vortex. Once a parameter is chosen a plot is constructed to display the time evolution of the analyzed value and all forecast values (Fig. 9). As with the track plot, the analyzed values are displayed along a solid black line and forecast values are displayed with alternating colors. The eighth column defines a plot of the most recent forecast for the chosen model and other models. As described with the track plot, this allows for inter-model comparisons of the tropical vortex characteristics. 3.2 View Previous Model Outputs This choice from the VORTRACK home page (Fig. 2) provides the exact same capability and options as defined under the View Current Model Outputs section, except a drop-down menu is provided such that one may inspect the model output from any previous time (Fig. 10). In this case, a user can inspect past model output, model performance, or analyzed and forecast environmental conditions associated with a tropical cyclone, invest area, or general tropical vortex. The options contained in each row of the vortices in this option produce the same types of displays as defined in Section 3.1
Fig. 6 Plot of analyzed (black line) and forecast positions for a chosen vortex defined by the name and model listed above the plot. Forecasts from different model runs are
12

displayed with alternating colors defined by the legend to the right of the plot. Hurricane symbols are used whenever the analyzed of forecast characteristics indicate that the relative vorticity and measurements of the warm core have increased beyond threshold values.
Fig. 7 As in Fig. 6 except only the most recent forecast is plotted and the forecasts from the UKM and NOGAPS models are displayed.
13

Fig. 8 The current model output web page as in Fig. 3 with the drop-down menu associated with the option of plotting the fourteen model parameters with respect to the chosen vortex
Fig. 9 A plot that results from the choice highlighted in Fig. 8. A time history of the chosen parameter (850-500 hPa integrated relative vorticity) is displayed with analyzed values on the black line and forecasts displayed with alternating colors and symbols defined by the legend to the left.
14

Fig. 10 The web page associated with the View Previous Model Outputs Option from the VORTRACK home page (Fig. 2). 3.3 View Previous Vortices To facilitate inspection of model performance with respect to all tropical vortices
that became tropical cyclones, the View Previous Vortices option from the VORTRACK home page provides a link to all tropical cyclones in the database (Fig. 11). At the top of this page, there are options to choose the ocean basin, the year, and the model. Each tropical cyclone is listed by number and name. Along each row for each tropical cyclone, are options to display the data, display model errors, display the forecast and analyzed tracks (Fig. 12), and display the environmental parameters (Fig. 13). Unlike the view previous model outputs option, the data in this section are valid for the entire life of the tropical cyclone. A tropical cyclone will not appear in this table until it no longer exists in each model analysis field. One difference between the View Previous Vortices and View Current or View Past Model Outputs is in the display of model errors. When the model errors option is chosen in the View Previous Vortices page, the table of model errors (Fig. 14) contains links to plot model bias error and model absolute error (Fig. 15) for each parameter. In the View Current Model Outputs and View Previous Model Outputs options, only a table is provided without a plot option.
Fig. 11 The web page associated with the View Previous Vortices option on the VORTRACK home page (Fig. 2). The drop-down list of model choices is displayed.
15

Fig. 12 The UKMO model analysis (black line) and forecast tracks of Hurricane Katrina plotted after the All Tracks option was chosen for Hurricane Katrina in Fig. 11.
Fig. 13 The time evolution of UKMO analyzed (black line) and forecast 850-500 hPa integrated relative vorticity for Hurricane Katrina.
16

Fig. 14 Table of UKMO forecast model errors for Hurricane Katrina
Fig. 15 Plot of the UKMO forecast errors for 850-500 hPa integrated relative vorticity for Hurricane Katrina. This plot is produced when the integrated vorticity option is chosen from the table in Fig. 14. 3.4 Calculate Error Statistics The final option available from the VORTRACK home page is the calculation and display of model forecast errors for various summaries of data (Fig. 16). This option
17

is divided into four sections and each section contains several options. The first four columns of each option allow the user to define a geographic area for which error statistics should be calculated. All tropical vortex positions in the chosen area will be used to calculate the errors. The fifth column allows definition of the earliest date to be used in the error calculations. The sixth column allows for definition of the latest date to be used. The seventh column provides an option to use only tropical cyclones for computation of all errors. The eighth column defines the option to choose the model. In the top section, a table (Fig. 17) is produced to display the results of the database query set up by the options defined by the values chosen in each column. In the second section, the same options are provided, except a plot of the error calculations is produced (Fig. 18). The drop-down menu in this section allows for choice of the parameter to be plotted. In both of the sections, all errors are computed relative to forecast interval. In the final two sections, the forecast interval is chosen by the user and errors are computed relative to the time of the first advisory. In section three of the Calculate Error Statistics, web page, an output table is produced and in the bottom section a plot is produced (Fig. 19).
Fig. 16 The web page that results from the Calculate Error Statistics option on the VORTRACK home page (Fig. 2).
18

Fig. 17 Table of forecast errors based on the options chosen in the first section of the Calculate Error Statistics web page (Fig. 16). In this example, default values as defined in Fig. 16 were used and the NOGAPS model was chosen.
Fig. 18 Plot of NOGAPS model bias error (blue line) and absolute error (red line) produced by choosing the 850-500 hPa average vorticity column in Fig. 17.
19

Fig. 19 Plot of the NOGAPS bias error (blue line) and absolute error (red line) for 72-h forecasts of 850-500 hPa integrated vorticity for all tropical cyclones relative to the time of the first advisory (labeled 0 on the x axis). For example, the values at -12 are errors in 72-h forecasts that verified 12 h before the first advisory time. 4.0 Database Maintenance As defined in Section 2, there is a web interface to the database that allows for database administrations, correction, and optimization (Fig. 20). This capability is reserved for the administrator of the database and the homepage is password protected.
Fig. 20 The database administration home page.
20

As in the primary VORTRACK component, there are several options available for database maintenance and administration. Each option allows for a web interface into the database such that model runs may be removed, vortex parameters that may be in error may be fixed, tropical cyclone names and invests may be numbered, and the time of first advisory entered into the database. Several of these capabilities may be available without requiring administrator access, but this page provides for an option to manually enter specific data values (i.e., hurricane name). 4.1 Administer Model Output The administer model output option (Fig. 21) allows the administer to choose a basin, year, and model. Once these are set, the first section allows for removal of a model run. The specific model run is identified by the drop-down menu in this section that lists all DTGs for the chosen model. In the second section, it is possible to add a track to a vortex. A track is defined as the path of a vortex in a model run. And a vortex consists of a string of tracks. When a track is added to a vortex, all of the associated parameters are also added to the vortex.
Fig. 21 The Administer Model Output web page. The drop-down menu associated with parameters that may be fixed manually is displayed. This allows for manual linking of a track to a vortex if the automated system failed to properly link the data. In the third section, a track may be removed from a vortex. In each of the above two sections, drop-down menus are used to choose the desired vortex and the desired track. Only unclaimed tracks are available for addition to a vortex.
21

In the final section, it is possible to fix a track value, which is any of the environmental parameters defined in the drop-down menu (Fig. 21). In this option, the parameter that is chosen is displayed for all points in the track (Fig. 22). An option is provided to enter a new value, or delete the entire row. This provides for repair of instances when the automated tracking may have followed an incorrect vortex.
Fig. 22 The display associated with fixing a track value. 4.2 Administer Vortices In the Administer Vortices section (Fig. 23) of the VORTRACK database administration, it is possible to define vortices as being an invest or a tropical cyclone. In VORTRACK, a disturbance is defined as a vortex that has special characteristics such that it has been identified as an invest vortex that is thought to have potential for development into a tropical cyclone, or it is a tropical cyclone and advisories are being issued on the vortex by NHC. In either of these cases, it is desirable to link the internal TCVTP vortex name (defined above) with the tropical cyclone number and name, and the invest number. There are several options that are allowed for this process. One option is to automatically provide the link by accessing files produced for the Automated Tropical Cyclone Forecast (ATCF) System. The web interface defined in Fig. 23 allows for
Fig 23 The web page associated with the Administer Vortices option in Fig. 20. manual entry of the information to the table defined in Fig. 24. If an invest is being identified, the number is entered and the invest is defined as being active. If an invest has ended without becoming a tropical cyclone, then this option is used to de-activate the
22

invest. It will no longer appear in the invest section of Fig. 3. If a tropical cyclone has formed, then the number is entered in column three, the name (or number) in column four, the active flag is set in column five and the time of first advisory is entered in column six.
Fig. 24 Options available in the Create a Disturbance section of Fig. 23. In the normal course of tropical cyclone evolution, it may be that a an invest is declared, then a tropical depression forms such that it is assigned a number, then a name is assigned when it intensifies to a tropical storm. The Change a Disturbance section (Fig. 25) provides for an option to change the name or change the activity status of a disturbance. The sections to create a disturbance define an entry in the database with the disturbance or invest characteristics (i.e., number, active or inactive, name, etc.) However, it does not link a TCVTP vortex with the disturbance or invest. This is done via the Change Model Vortices section in Fig. 23. In this section, the name of the disturbance is entered. It may be chosen from a list of disturbances in the drop-down menu. Then a table is provided to link TCVTP vortices to the disturbance (Fig. 26). This re-defines the TCVTP vortex name as the name of the disturbance, which is listed in the appropriate sections of the VORTRACK View Current Model Outputs (Fig. 3) and View Previous Model Outputs (Fig. 10) sections.
Fig. 25 Options available in the Change a Disturbance section of Fig. 23.
Fig. 26 Options available in the Change Model Vortices option of Fig. 23. In this example the listed TCVTP vortices associated with each model is linked to Hurricane Ophelia.
23

4.3 Archive Older Unmatched Tracks As defined in the TCVTP overview, there are two primary types of vortex files. Vortices that exist in the current analysis are defined separately from vortices that are forecast to occur. As each analysis is processed, all vortices that have been forecast to occur are searched to determine if they match any vortex in the current analysis. If they match (based on distance and verification time), the forecast track is attached to the analyzed vortex. Forecast vortices that never get matched to an analyzed vortex are a type of false alarm. These vortices also accumulate in the database and may reduce the processing efficiency. Therefore, this option is provided to archive unmatched vortices for which there is no longer any possibility that they will match an analyzed vortex. 4.4 Repair and Optimize Database It may happen that there are issues with the server on which the database resides, or PHP queries may be abandoned or terminated abnormally. In these cases, the database may become corrupted or empty tables or views may be formed. This often results in reduced efficiency in processing queries and delayed response times. This option examines the database to repair damaged tables and views and allow for optimized access to the database. 5.0 ANALYSIS In this Section, examples of the types of analysis made possible by the VORTRACK database structure are provided. As the system executed and data are uploaded to the MySQL database, it is possible to construct queries to select data based on a variety of criteria. The primary motivation for development of VORTRACK was to assess the performance of operational global forecast models with respect to tropical cyclone formation. Therefore, examination of the database via several queries are described to give one view of model performance. The framework for examination of forecast performance is defined in Fig. 27. The total VORTRACK database compiled based on data from 1 June 2005 to 31 October 2005 is split into four individual databases labeled as tables based on Fig. 27. Table 1 contains all forecasts that were initiated after a vortex was defined to be a tropical cyclone, based on the start of official advisories (Blue circles in Fig. 27). Table 2 contains the forecasts in Table 1 plus all forecasts initiated from analysis in which the tropical vortex existed prior to becoming a tropical cyclone, but verified after becoming a tropical cyclone (Green circles with black outlines and blue circles in Fig. 27). Table 3 contains all forecasts in Tables 1 and 2 with the addition of all forecasts that verified prior
24

Table 1 Table 2
Table 4
Fig. 27 Schematic sea-level pressure (ordinate) trace for a tropical vortex that was identified as a tropical cyclone at T0 (abscissa). The black circles connected with the black line define the analyzed sea-level pressure. Colored circles represent forecast sea-level pressure values in 12-h increments. Blue circles represent forecasts initiated at and following the tropical cyclone formation time (T0). Green circles represent forecasts initiated from times when the tropical vortex existed in the model analysis but was not yet a tropical cyclone. And red circles represent forecast sea-level pressures initiated at times before the vortex existed in the analysis. to the vortex becoming a tropical cyclone (All Green and Blue circles in Fig. 27). Table 4 contains all forecasts that pertain to the tropical vortex (Red, Green, and Blue circles in Fig. 27). To define each Table, the queries are written to the VORTRACK database. To ease design, testing, and implementation of the queries to the MySQL database, Microsoft Access is used to access the database. To link Access to the VORTRACK database, an Open Database Connectivity (ODBC) link is made to the server that contains the MySQL data base. This is provided via a freely downloadable link for the MySQL ODBC driver 3.51 at http://dev.mysql.com/downloads/connector/odbc/3.51.html. Table 4 is most suited for examination of forecasts associated with tropical cyclone formation, which is a primary purpose of VORTRACK. Tables 1-3 are defined to allow a full range of forecast evaluations throughout the lifecycle of the vortex. Construction of Table 4 is based on queries (Fig. 28) to several tables in the original MySQL database. Once Table 4 is created, then various examinations of the data are possible. The contents of Table 4 are not limited to tropical cyclones as are tables 1 and 2, which have some dependence on the time of the first advisory as defined by NHC.
T0 T12 T24 T36 T48 T60 T72 T84 T96 T120T-12T-24T-36T-48T-60
P R E S S U R E
Table 3
25

Therefore, Table 4 contains the most complete representation of the VORTRACK database. To examine forecast characteristics associated with all vortices that became tropical cyclones, an additional query is written to examine Table 4 and create a new table. This new table is labeled “All_distrubances_with_track_data.” This table will be utilized for the purpose of the analysis contained in this report. The time of the first advisory issued by NHC is used to defined the formation time for each tropical cyclone in the Atlantic and eastern North Pacific basins between 1
Fig. 28 The query design view from Microsoft Access that constructs Table 4 (see text and Fig. 27). June 2005 – 31 October 2005. Based on the analyses from the NOGAPS, UKMO, and GFS models, threshold values of each of the 14 parameters associated with each vortex in the VORTRACK database may be assigned to be associated with tropical cyclone formation. The values associated with the 850-500 hPa averaged vorticity, and 700-500 hPa warm core are listed in Table 5. If the first advisory was issued at a time when a model analysis was not available, then the closest analysis time was used in the computation of the threshold. The threshold values are relatively similar for each model. For the purpose of this analysis, these threshold values will be used such that if model forecast or analyzed values exceed these values, then it will be determined that the model has identified the vortex as a tropical cyclone.
Model 850-500 hPa relative vorticity (s-1) 700-500 hPa warm core (K)NOGAPS 3.1 0.18 UKMO 3.8 0.18
GFS 3.2 0.21
Table 5. Threshold values of parameters listed in the table based on the average analyzed value for each model at the time of the first NHC advisory.
26
A query to the database was written to examine whether the model had forecast and analyzed a tropical cyclone at the time of the first NHC advisory. This query identified the time of the first advisory associated with each observed tropical cyclone, all forecasts that verify at that time, and the values of the 850-500 hPa relative vorticity and 700-500 hPa warm core. The frequency associated with the number of times a verifying model forecast and the analysis at the time of the first advisory met or exceeded the threshold. The results are defined as a set of bar charts that represent each model and all forecast intervals that contain a verifying forecast. The output of the query is defined as a pivot table and pivot chart in Access that allows a choice (Fig. 29) of model, tropical cyclone (Fig. 29b, i.e., all, single by name, or subset by name). Based on these choices, the appropriate data summary is produced as a bar chart.
Fig. 29 Screen capture of the pivot chart for the query examining Table 4 with respect to forecasts associated with the first NHC advisory time to highlight the (left) choice of model, and (right) the choice of tropical cyclone. 5.1 Forecasts of Tropical Cyclone Formation: Season The frequency with each model forecast the vorticity and warm core values to be above the threshold at the observed time of tropical cyclone formation is examined with respect to the occurrence of vorticity exceeding the threshold, warm core exceeding the threshold, and both parameters exceeding the threshold (Fig. 30). In this data sample, 38 tropical cyclones are included. Several times are missing due to the variability in receipt of model data at the Naval Postgraduate School. In terms of the frequency of occurrence, the GFS model was most successful in forecasting a tropical cyclone at the time that the tropical cyclone was observed to form. While the UKMO model did not always forecast or analyze a tropical vortex to exceed the threshold, it did have many verifying forecasts. Therefore, the model did indicate the presence of a vortex, but had not indicated it was a tropical cyclone. The NOGAPS model contained the fewest number of verifying forecasts in which the tropical cyclone threshold parameters were exceeded. The forecast model error associated with each parameter that verifies at the time of the first NHC advisory is easily computed and summarized from the VORTRACK database. For example, the average 850-500 hPa vorticity errors (Fig. 31) indicate the
27

model vortices are too weak at all forecast intervals, with the GFS error being smallest. However, the boxplots of Fig. 31 indicate that there are several extreme errors in the GFS model with forecast vorticity values that are much too large. Therefore, there is a tendency for the model to be too active with respect to tropical cyclone formation. This is a trait that should be examined with a more systematic examination of the database. 5.2 Forecasts of Tropical Cyclone formation: Individual cases Much of the utility in the VORTRACK database is to allow quick examinations of the data. Therefore, the data in Fig. 30 were examined with respect to two individual events; the formations of Hurricane Emily (Fig. 32) and Irene (Fig. 33). In these cases, the bars of each bar chart are one unit high as there is one verifying forecast and one analysis pertaining to the initial NHC advisory for Emily and Irene. It is clear, that none of the models forecast the formation of Hurricane Emily very well (Fig. 32). While they all had forecasts of a vortex, no forecasts that were longer than 24 h indicated that the vortex would be a tropical cyclone. However, the GFS and UKMO models did forecast the formation of Irene with lead times of 72 h for the GFS and 96 h for the UKMO (Fig. 33). While NOGAPS forecast the occurrence of a vortex at long lead times, it was not forecast to be a tropical cyclone. The examples of Hurricane Irene and Emily illustrate the utility of the data in the VORTRACK database to identify traits associated with specific events such that they may be examined to diagnose model characteristics that may broadcast an accurate or inaccurate forecast. For example, the 700-500 hPa average vapor pressure forecasts from the UKMO were examined for the Emily and Irene cases (Fig. 34). It is clear, that forecasts of the pre-Emily vortex repeatedly dried the middle troposphere too much. The forecasts of Irene correctly predicted a moist middle troposphere that represented a favorable condition for intensification of the vortex. Similar traits were seen in the GFS model, while no such differences existed in the NOGAPS model.
28

Fig. 30 Bar charts of frequencies associated with the number of times each verifying forecast from (a) GFS), (b) UKMO, and (c) NOGAPS exceeded the vorticity threshold (blue bar), the warm core threshold (yellow bar), and both thresholds
(B)
(A)
(C)
(maroon bar). The total number of forecasts and analyses are defined by the cyan bars.
29

Fig. 31 Boxplots of forecast error (ordinate) by forecast interval (abscissa) for all forecasts of 850-500 hPa average vorticity from (top) GFS, (middle) UKMO, and (bottom) NOGAPS models that verify at the time of the initial NHC advisory for tropical cyclones that formed between 1 June – 31 October 2005 in the Atlantic and eastern North Pacific basins.
30

Fig. 31 As in Fig. 30, except for all forecasts of the formation of Hurricane Emily.
31
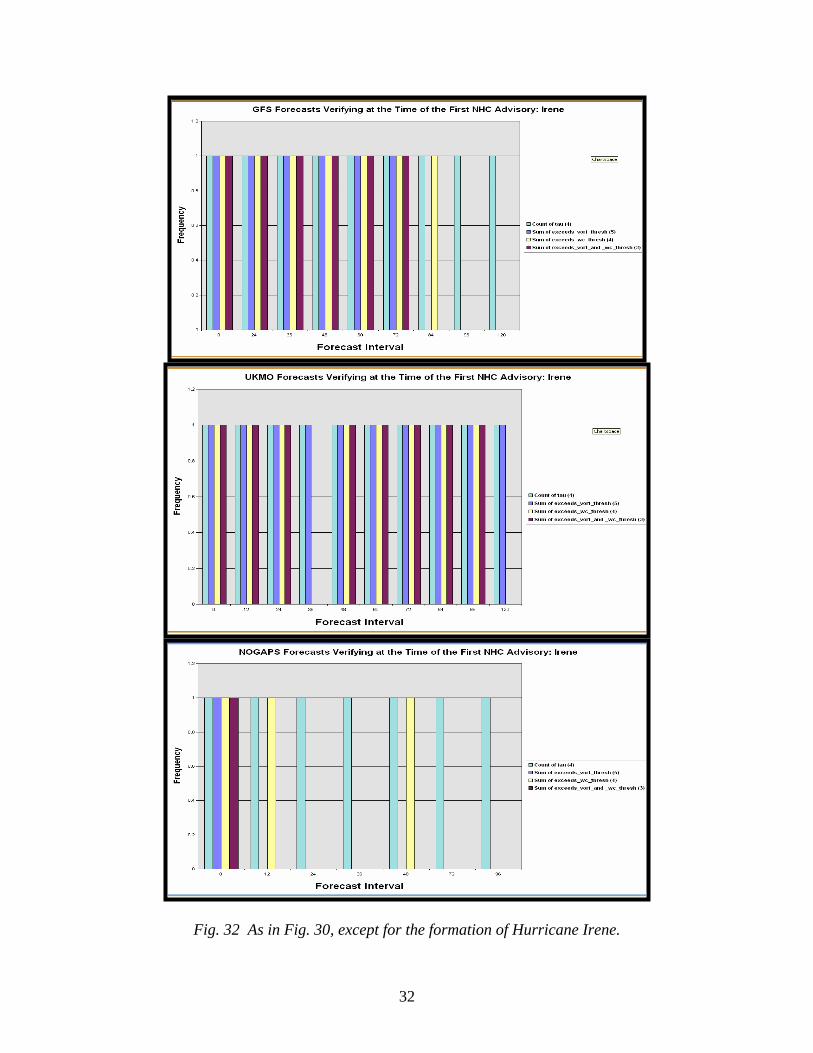
Fig. 32 As in Fig. 30, except for the formation of Hurricane Irene.
32
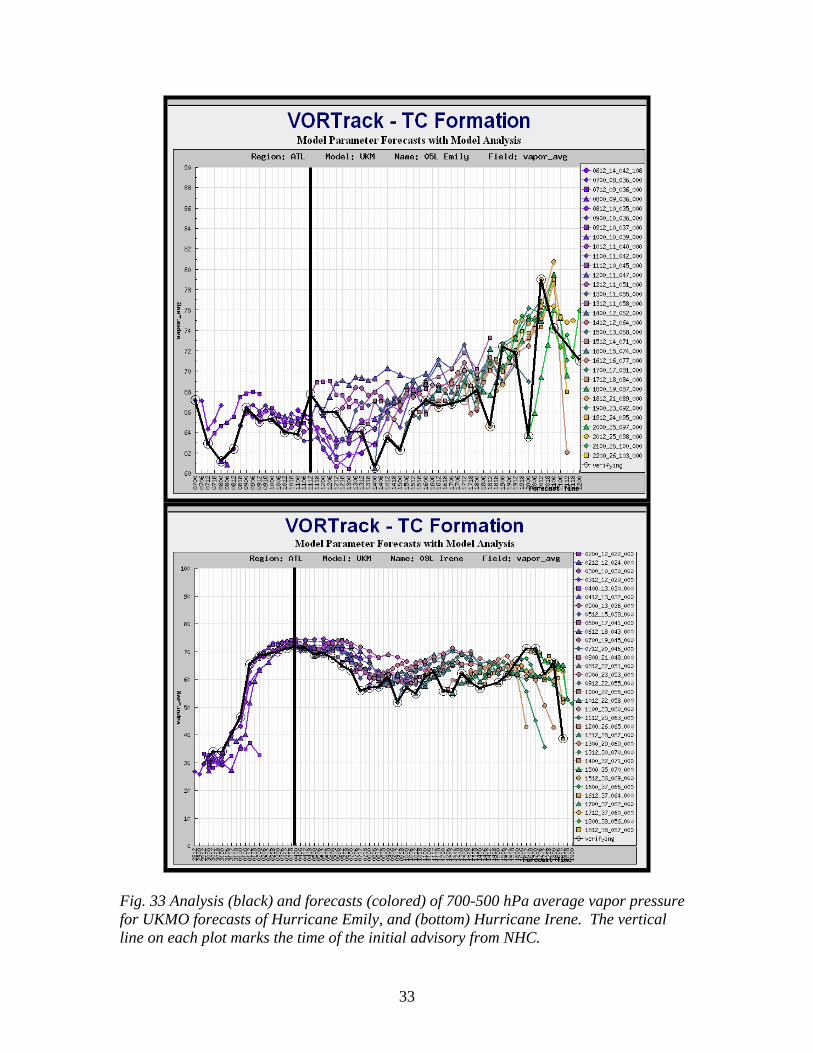
Fig. 33 Analysis (black) and forecasts (colored) of 700-500 hPa average vapor pressure for UKMO forecasts of Hurricane Emily, and (bottom) Hurricane Irene. The vertical line on each plot marks the time of the initial advisory from NHC.
33

6.0 Summary The VORTRACK system provides a means for objective identification and tracking of tropical vortices in operational global forecast models. A set of 14 parameters associated with forecasts and analyses of each tropical vortex is collected and cataloged in a comprehensive relational database. The database is constructed, maintained, and analyzed in the framework of the MySQL database system, which is freely available software. The interface with the database during operations is via a web interface that utilizes PHP and HTML code. The primary seasonal summary analyses are defined by queries to the database via an ODBC link with Microsoft Access. This also allows export of database queries to Microsoft Excel. The VORTRACK system provides for a daily summary of all active tropical vortices, a summary with respect to an individual vortices, or a summary of a collection of vortices over time and area. In this report, a simple example of the type of analysis that is possible with the VORTRACK database. It is evident that careful examination of the database will allow identification of model traits and biases with respect to tropical cyclone formation. While the example in Section 5 examined the frequency of “hits” with respect to forecasts of tropical cyclone formation, characteristics associated with false alarms are easily identified. Since summaries associated with each vortex are easily and quickly generated, the identification of individual cases that exhibit model traits is possible. These types of examinations (i.e., the differences associated with the failed forecasts of the formation of Emily and successful forecasts of the formation of Irene) will allow increased utility of the model output as a guide for tropical cyclone formation forecasts.
34
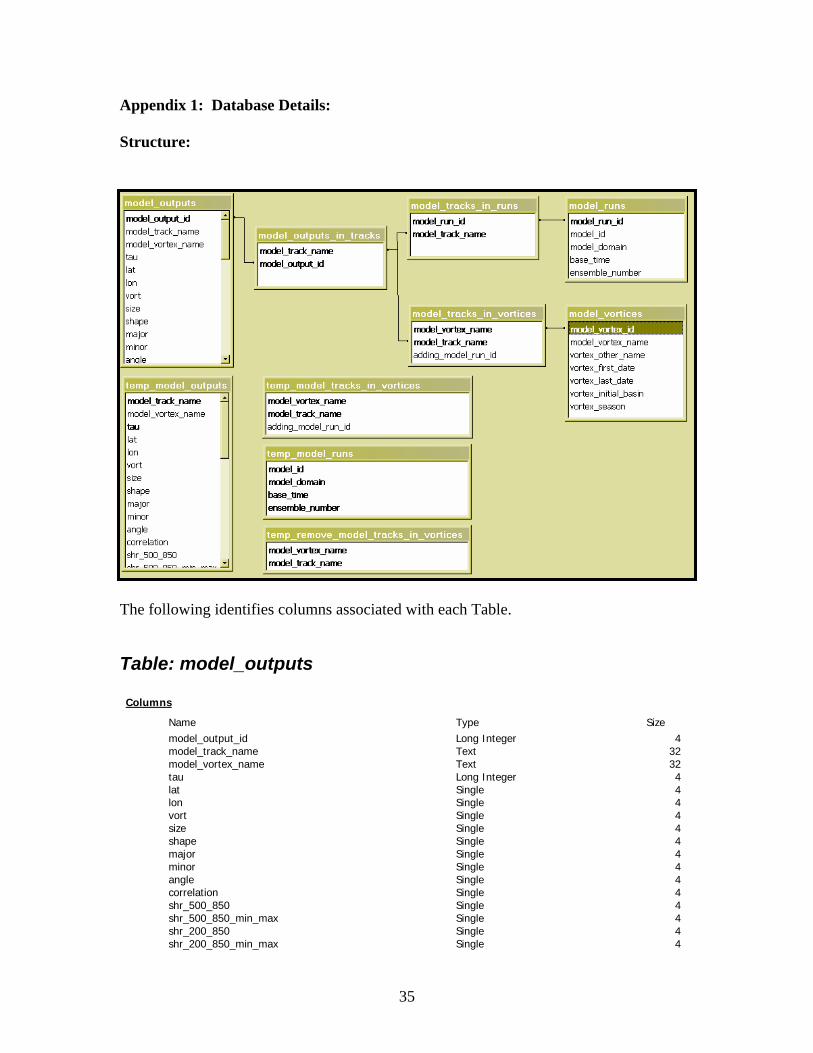
Appendix 1: Database Details: Structure:
The following identifies columns associated with each Table.
Table: model_outputs Columns Name Type Size model_output_id Long Integer 4 model_track_name Text 32 model_vortex_name Text 32 tau Long Integer 4 lat Single 4 lon Single 4 vort Single 4 size Single 4 shape Single 4 major Single 4 minor Single 4 angle Single 4 correlation Single 4 shr_500_850 Single 4 shr_500_850_min_max Single 4 shr_200_850 Single 4 shr_200_850_min_max Single 4
35
thickness Single 4 thickness_min_max Single 4 warm_core Single 4 warm_core_min_max Single 4 conv_pcp Single 4 conv_pcp_min_max Single 4 total_pcp Single 4 total_pcp_min_max Single 4 omega Single 4 omega_min_max Single 4 vapor Single 4 vapor_min_max Single 4 slp Single 4 slp_min_max Single 4 spd_925 Single 4 spd_925_min_max Single 4 spd_700 Single 4 spd_700_min_max Single 4 spd_500 Single 4 spd_500_min_max Single 4
Table: model_outputs_in_tracks Columns Name Type Size model_track_name Text 32 model_output_id Long Integer 4
Table: model_runs
Columns Name Type Size model_run_id Long Integer 4 model_id Text 16 model_domain Text 16 base_time Date/Time 8 ensemble_number Long Integer 4
Table: model_tracks_in_runs Columns Name Type Size model_run_id Long Integer 4 model_track_name Text 32
Table: model_tracks_in_vortices Columns Name Type Size model_vortex_name Text 32 model_track_name Text 32
36

adding_model_run_id Long Integer 4
37

Table: model_vortices Columns Name Type Size model_vortex_id Long Integer 4 model_vortex_name Text 32 vortex_other_name Text 32 vortex_first_date Date/Time 8 vortex_last_date Date/Time 8 vortex_initial_basin Text 8 vortex_season Long Integer 4
Table: temp_model_outputs Columns Name Type Size model_track_name Text 32 model_vortex_name Text 32 tau Long Integer 4 lat Single 4 lon Single 4 vort Single 4 size Single 4 shape Single 4 major Single 4 minor Single 4 angle Single 4 correlation Single 4 shr_500_850 Single 4 shr_500_850_min_max Single 4 shr_200_850 Single 4 shr_200_850_min_max Single 4 thickness Single 4 thickness_min_max Single 4 warm_core Single 4 warm_core_min_max Single 4 conv_pcp Single 4 conv_pcp_min_max Single 4 total_pcp Single 4 total_pcp_min_max Single 4 omega Single 4 omega_min_max Single 4 vapor Single 4 vapor_min_max Single 4 slp Single 4 slp_min_max Single 4 spd_925 Single 4 spd_925_min_max Single 4 spd_700 Single 4 spd_700_min_max Single 4 spd_500 Single 4 spd_500_min_max Single 4
38

Table: temp_model_runs Columns Name Type Size model_id Text 16 model_domain Text 16 base_time Date/Time 8 ensemble_number Long Integer 4
Table: temp_model_tracks_in_vortices Columns Name Type Size model_vortex_name Text 32 model_track_name Text 32 adding_model_run_id Long Integer 4
Table: temp_remove_model_tracks_in_vortices Columns Name Type Size model_vortex_name Text 32 model_track_name Text 32
39
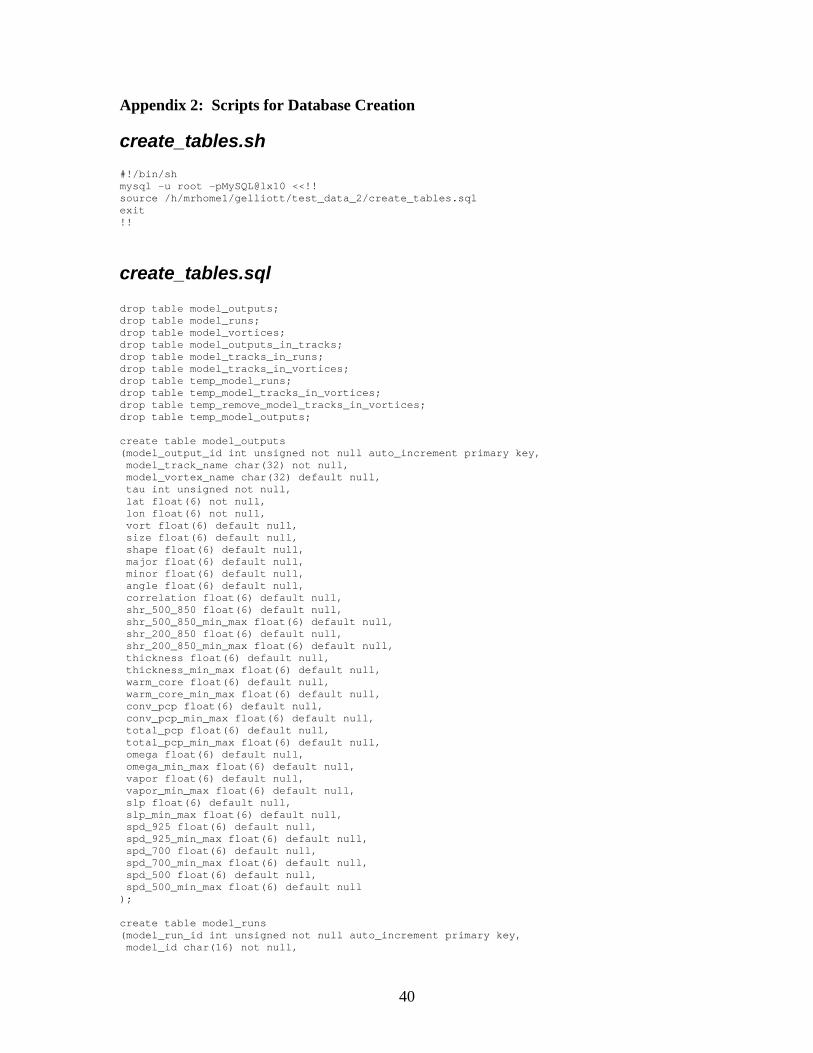
Appendix 2: Scripts for Database Creation
create_tables.sh #!/bin/sh mysql -u root -pMySQL@lx10 <<!! source /h/mrhome1/gelliott/test_data_2/create_tables.sql exit !!
create_tables.sql drop table model_outputs; drop table model_runs; drop table model_vortices; drop table model_outputs_in_tracks; drop table model_tracks_in_runs; drop table model_tracks_in_vortices; drop table temp_model_runs; drop table temp_model_tracks_in_vortices; drop table temp_remove_model_tracks_in_vortices; drop table temp_model_outputs; create table model_outputs (model_output_id int unsigned not null auto_increment primary key, model_track_name char(32) not null, model_vortex_name char(32) default null, tau int unsigned not null, lat float(6) not null, lon float(6) not null, vort float(6) default null, size float(6) default null, shape float(6) default null, major float(6) default null, minor float(6) default null, angle float(6) default null, correlation float(6) default null, shr_500_850 float(6) default null, shr_500_850_min_max float(6) default null, shr_200_850 float(6) default null, shr_200_850_min_max float(6) default null, thickness float(6) default null, thickness_min_max float(6) default null, warm_core float(6) default null, warm_core_min_max float(6) default null, conv_pcp float(6) default null, conv_pcp_min_max float(6) default null, total_pcp float(6) default null, total_pcp_min_max float(6) default null, omega float(6) default null, omega_min_max float(6) default null, vapor float(6) default null, vapor_min_max float(6) default null, slp float(6) default null, slp_min_max float(6) default null, spd_925 float(6) default null, spd_925_min_max float(6) default null, spd_700 float(6) default null, spd_700_min_max float(6) default null, spd_500 float(6) default null, spd_500_min_max float(6) default null ); create table model_runs (model_run_id int unsigned not null auto_increment primary key, model_id char(16) not null,
40

model_domain char(16) not null, base_time timestamp not null, ensemble_number int unsigned ); create table model_tracks_in_runs (model_run_id int unsigned not null, model_track_name char(32) not null, constraint m_t_i_r primary key (model_run_id, model_track_name) ); create table model_outputs_in_tracks (model_track_name char(32) not null, model_output_id int unsigned not null, constraint m_o_i_t primary key (model_track_name, model_output_id) ); create table model_vortices (model_vortex_id int unsigned not null auto_increment primary key, model_vortex_name char(32) not null, vortex_other_name char(32), vortex_first_date date, vortex_last_date date, vortex_initial_basin char(8), vortex_season int unsigned ); create table model_tracks_in_vortices (model_vortex_name char(32) not null, model_track_name char(32) not null, adding_model_run_id int unsigned default null, constraint m_t_i_v primary key (model_track_name, model_vortex_name) ); alter table model_outputs add index (model_track_name); alter table model_vortices add index (model_vortex_name); create table temp_model_runs (model_id char(16) not null, model_domain char(16) not null, base_time timestamp not null, ensemble_number int unsigned ); create table temp_model_tracks_in_vortices (model_vortex_name char(32) not null, model_track_name char(32) not null, adding_model_run_id int unsigned default null ); create table temp_remove_model_tracks_in_vortices (model_vortex_name char(32) not null, model_track_name char(32) not null ); create table temp_model_outputs (model_track_name char(32) not null, model_vortex_name char(32) default null, tau int unsigned not null, lat float(6) not null, lon float(6) not null, vort float(6) default null, size float(6) default null, shape float(6) default null, major float(6) default null, minor float(6) default null, angle float(6) default null, correlation float(6) default null, shr_500_850 float(6) default null,
41
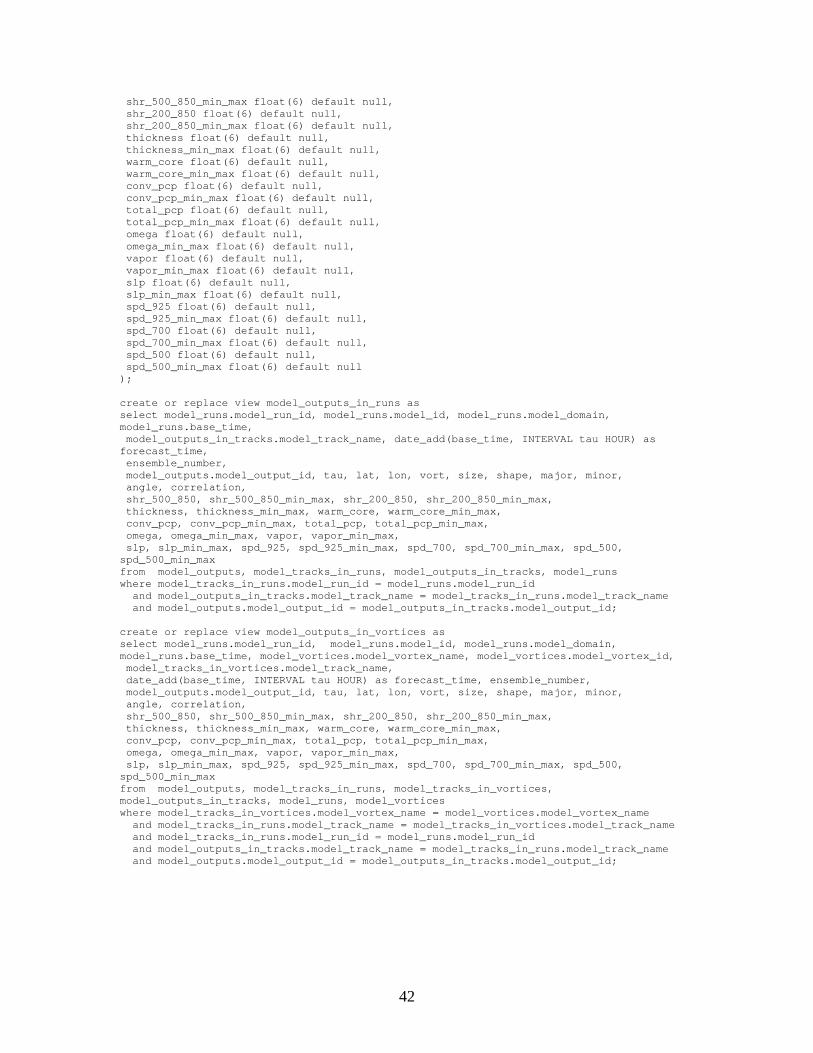
shr_500_850_min_max float(6) default null, shr_200_850 float(6) default null, shr_200_850_min_max float(6) default null, thickness float(6) default null, thickness_min_max float(6) default null, warm_core float(6) default null, warm_core_min_max float(6) default null, conv_pcp float(6) default null, conv_pcp_min_max float(6) default null, total_pcp float(6) default null, total_pcp_min_max float(6) default null, omega float(6) default null, omega_min_max float(6) default null, vapor float(6) default null, vapor_min_max float(6) default null, slp float(6) default null, slp_min_max float(6) default null, spd_925 float(6) default null, spd_925_min_max float(6) default null, spd_700 float(6) default null, spd_700_min_max float(6) default null, spd_500 float(6) default null, spd_500_min_max float(6) default null ); create or replace view model_outputs_in_runs as select model_runs.model_run_id, model_runs.model_id, model_runs.model_domain, model_runs.base_time, model_outputs_in_tracks.model_track_name, date_add(base_time, INTERVAL tau HOUR) as forecast_time, ensemble_number, model_outputs.model_output_id, tau, lat, lon, vort, size, shape, major, minor, angle, correlation, shr_500_850, shr_500_850_min_max, shr_200_850, shr_200_850_min_max, thickness, thickness_min_max, warm_core, warm_core_min_max, conv_pcp, conv_pcp_min_max, total_pcp, total_pcp_min_max, omega, omega_min_max, vapor, vapor_min_max, slp, slp_min_max, spd_925, spd_925_min_max, spd_700, spd_700_min_max, spd_500, spd_500_min_max from model_outputs, model_tracks_in_runs, model_outputs_in_tracks, model_runs where model_tracks_in_runs.model_run_id = model_runs.model_run_id and model_outputs_in_tracks.model_track_name = model_tracks_in_runs.model_track_name and model_outputs.model_output_id = model_outputs_in_tracks.model_output_id; create or replace view model_outputs_in_vortices as select model_runs.model_run_id, model_runs.model_id, model_runs.model_domain, model_runs.base_time, model_vortices.model_vortex_name, model_vortices.model_vortex_id, model_tracks_in_vortices.model_track_name, date_add(base_time, INTERVAL tau HOUR) as forecast_time, ensemble_number, model_outputs.model_output_id, tau, lat, lon, vort, size, shape, major, minor, angle, correlation, shr_500_850, shr_500_850_min_max, shr_200_850, shr_200_850_min_max, thickness, thickness_min_max, warm_core, warm_core_min_max, conv_pcp, conv_pcp_min_max, total_pcp, total_pcp_min_max, omega, omega_min_max, vapor, vapor_min_max, slp, slp_min_max, spd_925, spd_925_min_max, spd_700, spd_700_min_max, spd_500, spd_500_min_max from model_outputs, model_tracks_in_runs, model_tracks_in_vortices, model_outputs_in_tracks, model_runs, model_vortices where model_tracks_in_vortices.model_vortex_name = model_vortices.model_vortex_name and model_tracks_in_runs.model_track_name = model_tracks_in_vortices.model_track_name and model_tracks_in_runs.model_run_id = model_runs.model_run_id and model_outputs_in_tracks.model_track_name = model_tracks_in_runs.model_track_name and model_outputs.model_output_id = model_outputs_in_tracks.model_output_id;
42

Appendix 3: Scripts for Uploading Data to the Database
upload_data.sh #!/bin/sh if [ $# = 3 ] then cp /d/trop5/harr/tcvtp/$1/$2/$3/final_dbase_model_definition_file /d/trop5/harr/tcvtp/final_dbase_model_definition_file cp /d/trop5/harr/tcvtp/$1/$2/$3/final_dbase_file2 /d/trop5/harr/tcvtp/final_dbase_file2 cp /d/trop5/harr/tcvtp/$1/$2/$3/final_dbase_file3 /d/trop5/harr/tcvtp/final_dbase_file3 cp /d/trop5/harr/tcvtp/$1/$2/$3/final_dbase_file4 /d/trop5/harr/tcvtp/final_dbase_file4 sed -e 's/ *//g' < /d/trop5/harr/tcvtp/final_dbase_file2 > /d/trop5/harr/tcvtp/final_dbase_file2a ssh lx10.met.nps.navy.mil mysql -u process -pprocess@lx10 <<!! source /h/mrhome1/gelliott/load_db/upload_data_import.sql source /h/mrhome1/gelliott/load_db/upload_data_insert.sql exit !! else echo "Usage: ./upload_data.sh hemisphere year model" echo "For example ./upload_data.sh SH 2004 NGP" fi
upload_data_import.sql use tc_data; delete from temp_model_runs; delete from temp_remove_model_tracks_in_vortices; delete from temp_model_tracks_in_vortices; delete from temp_model_outputs; load data infile "/d/trop5/harr/tcvtp/final_dbase_model_definition_file" into table temp_model_runs fields terminated by ','; load data infile "/d/trop5/harr/tcvtp/final_dbase_file2a" into table temp_model_outputs fields terminated by ','; load data infile "/d/trop5/harr/tcvtp/final_dbase_file3" into table temp_model_tracks_in_vortices fields terminated by ','; load data infile "/d/trop5/harr/tcvtp/final_dbase_file4" into table temp_remove_model_tracks_in_vortices fields terminated by ',';
upload_data_insert.sql use tc_data; insert into model_runs ( model_id , model_domain, base_time, ensemble_number) select trim(model_id), trim(model_domain),
43
base_time, ensemble_number from temp_model_runs; insert into model_outputs ( model_track_name, model_vortex_name, tau, lat, lon, vort, size, shape, major, minor, angle, correlation, shr_500_850, shr_500_850_min_max, shr_200_850, shr_200_850_min_max, thickness, thickness_min_max, warm_core, warm_core_min_max, conv_pcp, conv_pcp_min_max, total_pcp, total_pcp_min_max, omega, omega_min_max, vapor, vapor_min_max, slp, slp_min_max, spd_925, spd_925_min_max, spd_700, spd_700_min_max, spd_500, spd_500_min_max) select trim(model_track_name), trim(model_vortex_name), tau, lat, lon, vort, size, shape, major, minor, angle, correlation, shr_500_850, shr_500_850_min_max, shr_200_850, shr_200_850_min_max, thickness, thickness_min_max, warm_core, warm_core_min_max, conv_pcp, conv_pcp_min_max, total_pcp, total_pcp_min_max, omega, omega_min_max, vapor, vapor_min_max, slp, slp_min_max, spd_925, spd_925_min_max, spd_700, spd_700_min_max, spd_500, spd_500_min_max from temp_model_outputs; insert into model_tracks_in_runs (model_track_name) select distinct trim(model_track_name) from temp_model_outputs; update model_tracks_in_runs set model_run_id = (select max(b.model_run_id) from model_runs b) where model_run_id is null or model_run_id=0; insert into model_outputs_in_tracks (model_track_name, model_output_id) select model_track_name, model_output_id from model_outputs where model_track_name in (select distinct trim(model_track_name) from temp_model_outputs); insert into model_vortices (model_vortex_name) select distinct trim(model_vortex_name) from temp_model_tracks_in_vortices where model_vortex_name not in (select distinct model_vortex_name from model_vortices); delete model_tracks_in_vortices.* from model_tracks_in_vortices,temp_remove_model_tracks_in_vortices where model_tracks_in_vortices.model_track_name = trim(temp_remove_model_tracks_in_vortices.model_track_name) and model_tracks_in_vortices.model_vortex_name = trim(temp_remove_model_tracks_in_vortices.model_vortex_name); update temp_model_tracks_in_vortices set adding_model_run_id = (select max(b.model_run_id) from model_runs b); insert into model_tracks_in_vortices Select trim(model_vortex_name), trim(model_track_name), adding_model_run_id from temp_model_tracks_in_vortices;
44

delete from temp_model_runs; delete from temp_remove_model_tracks_in_vortices; delete from temp_model_tracks_in_vortices; delete from temp_model_outputs; Appendix 4: Script for Database Backup #!/bin/sh if [ $# = 2 ] then ./drop_views.sh $1 $2 mysqldump --lock-tables $1 > $1_`date +%Y%m%d%H%M`.sql -u root -p$2 chmod 775 $1_`date +%Y%m%d%H%M`.sql ./create_views.sh $1 $2 else echo "Usage: backup_db.sh database_name root_password" fi
45


![Documento Ummo D52 [IU1], Concepto de Simetria](https://img.pdfslide.us/doc/110x75/55cf8a9555034654898bffc7/documento-ummo-d52-iu1-concepto-de-simetria.jpg)