Embed Size (px)
Citation preview
05/04/2016
Joint Advisory Group on GI Endoscopy
2015 GRS Census – Analysis of Responses
2
The Strategy Unit Midlands and Lancashire CSU www.midlandsandlancashirecsu.nhs.uk
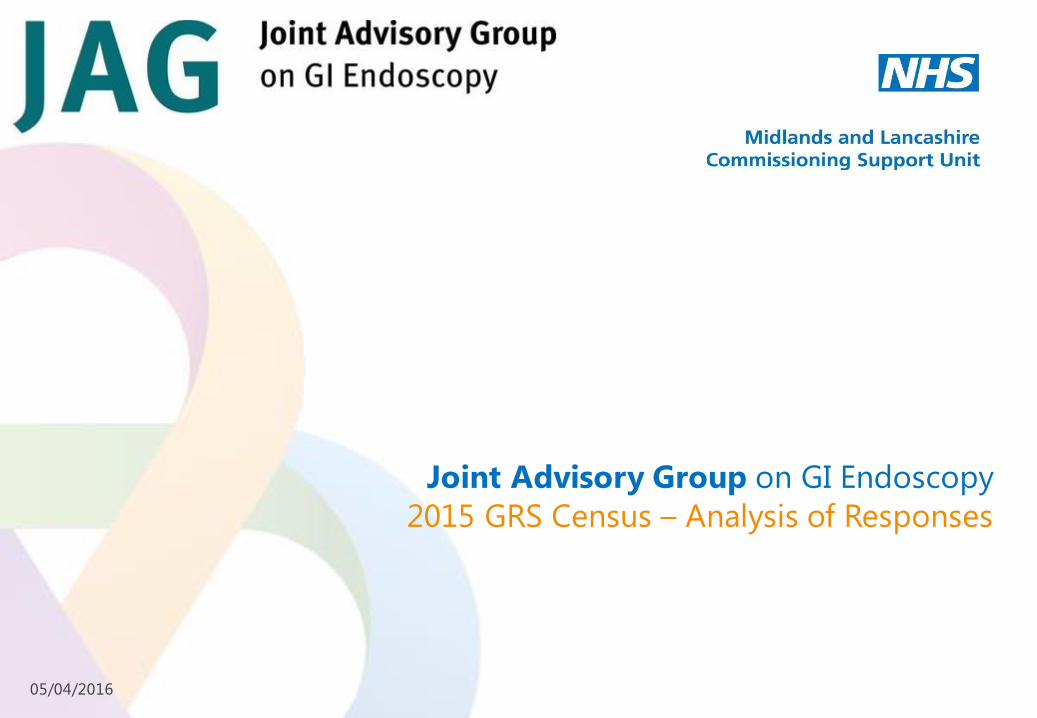
Background
Annual Census of Endoscopy Units
Conducted during April and May 2015
477 units invited to participate.
Note : An organisation may have many units.
Four Parts
1 Unit Profile and Capacity
2 GRS Timeliness
3 Activity within Endoscopy Unit
4 Workforce Delivering the endoscopy Service
Plus weblink to additional survey containing
CRUK research questions.
3
The Strategy Unit Midlands and Lancashire CSU www.midlandsandlancashirecsu.nhs.uk
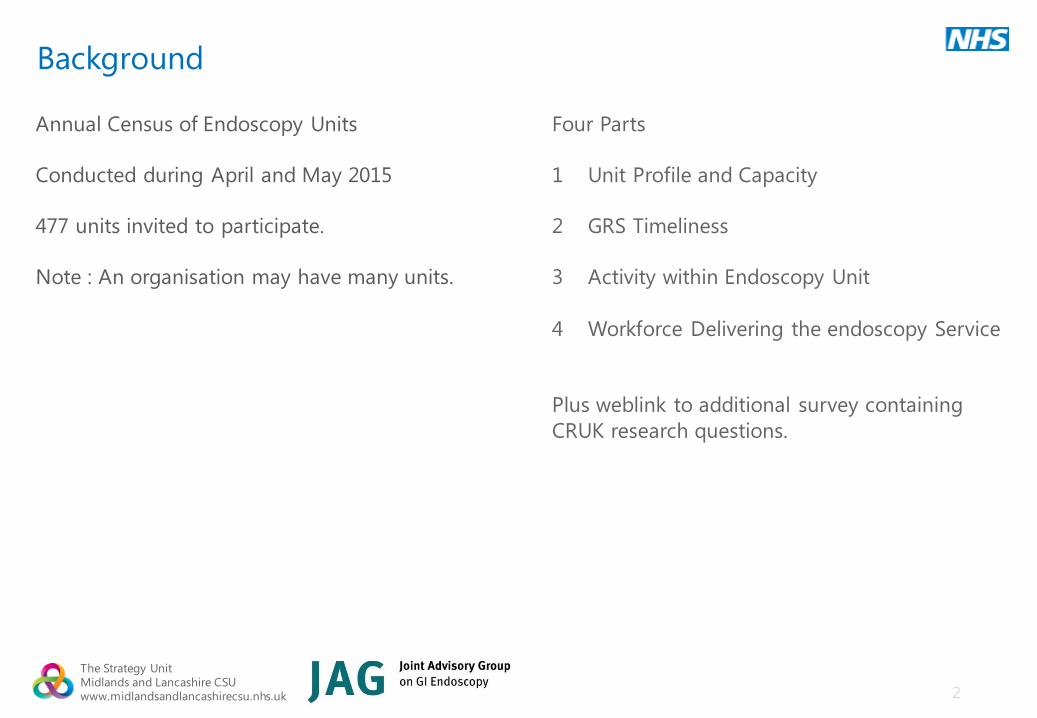
Response Rates 79% of units completed the census. Higher response rate amongst England Acute Trusts (89%).
Completed
Signed-Off
Pending
Sign-Off
Partial
Response
No
Response Total
England – acute n 189 6 12 14 221
% (86%) (3%) (5%) (6%)
England – community n 25 1 1 22 49
% (51%) (2%) (2%) (45%)
England - independent sector n 99 6 3 10 118
% (84%) (5%) (3%) (8%)
Northern Ireland n 13 1 1 2 17
% (76%) (6%) (6%) (12%)
Scotland n 23 1 11 17 52
% (44%) (2%) (21%) (33%)
Wales n 15 1 4 0 20
% (75%) (5%) (20%) (0%)
Total n 364 16 32 65 477
% (76%) (3%) (7%) (14%)
All remaining slides relate only to responses
from England Acute Trust Units.
4
The Strategy Unit Midlands and Lancashire CSU www.midlandsandlancashirecsu.nhs.uk
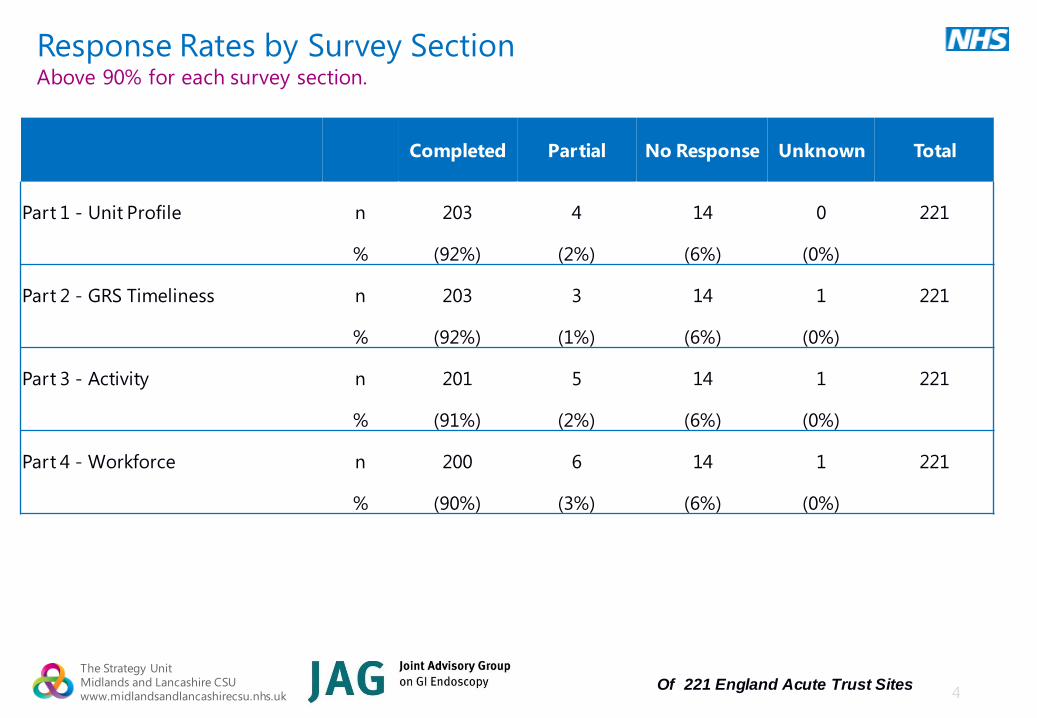
Response Rates by Survey Section Above 90% for each survey section.
Completed Partial No Response Unknown Total
Part 1 - Unit Profile n 203 4 14 0 221
% (92%) (2%) (6%) (0%)
Part 2 - GRS Timeliness n 203 3 14 1 221
% (92%) (1%) (6%) (0%)
Part 3 - Activity n 201 5 14 1 221
% (91%) (2%) (6%) (0%)
Part 4 - Workforce n 200 6 14 1 221
% (90%) (3%) (6%) (0%)
Of 221 England Acute Trust Sites
5
The Strategy Unit Midlands and Lancashire CSU www.midlandsandlancashirecsu.nhs.uk
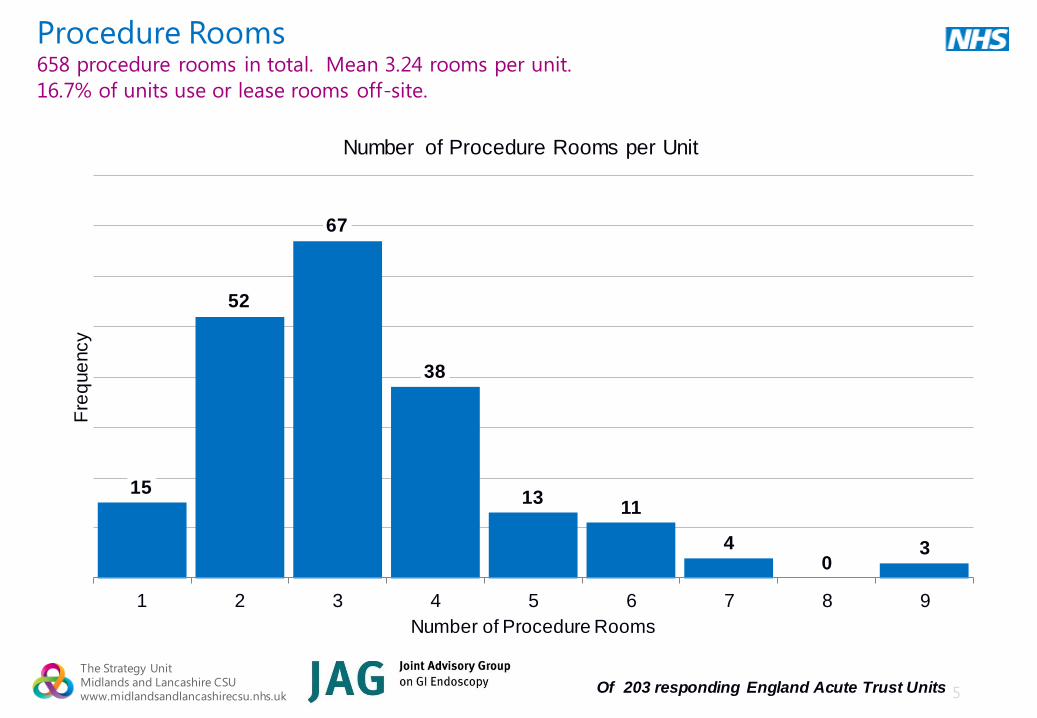
Procedure Rooms 658 procedure rooms in total. Mean 3.24 rooms per unit.
16.7% of units use or lease rooms off-site.
15
52
67
38
13 11
4 0
3
1 2 3 4 5 6 7 8 9
Fre
que
ncy
Number of Procedure Rooms
Number of Procedure Rooms per Unit
Of 203 responding England Acute Trust Units
6
The Strategy Unit Midlands and Lancashire CSU www.midlandsandlancashirecsu.nhs.uk
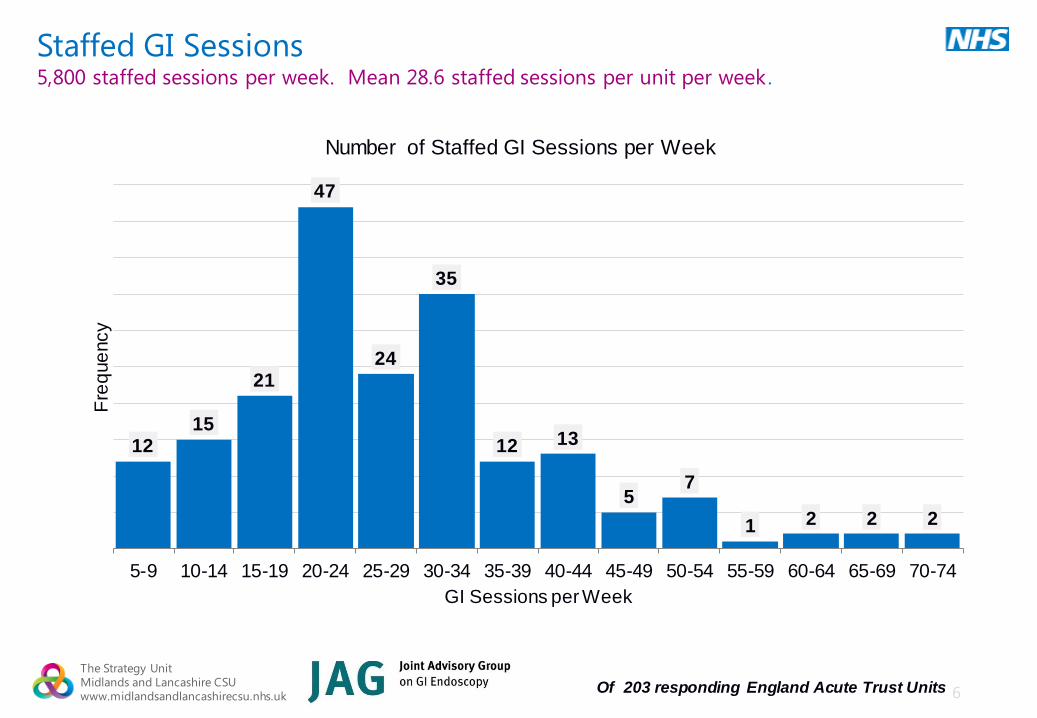
Staffed GI Sessions 5,800 staffed sessions per week. Mean 28.6 staffed sessions per unit per week.
12 15
21
47
24
35
12 13
5 7
1 2 2 2
5-9 10-14 15-19 20-24 25-29 30-34 35-39 40-44 45-49 50-54 55-59 60-64 65-69 70-74
Fre
que
ncy
GI Sessions per Week
Number of Staffed GI Sessions per Week
Of 203 responding England Acute Trust Units
7
The Strategy Unit Midlands and Lancashire CSU www.midlandsandlancashirecsu.nhs.uk
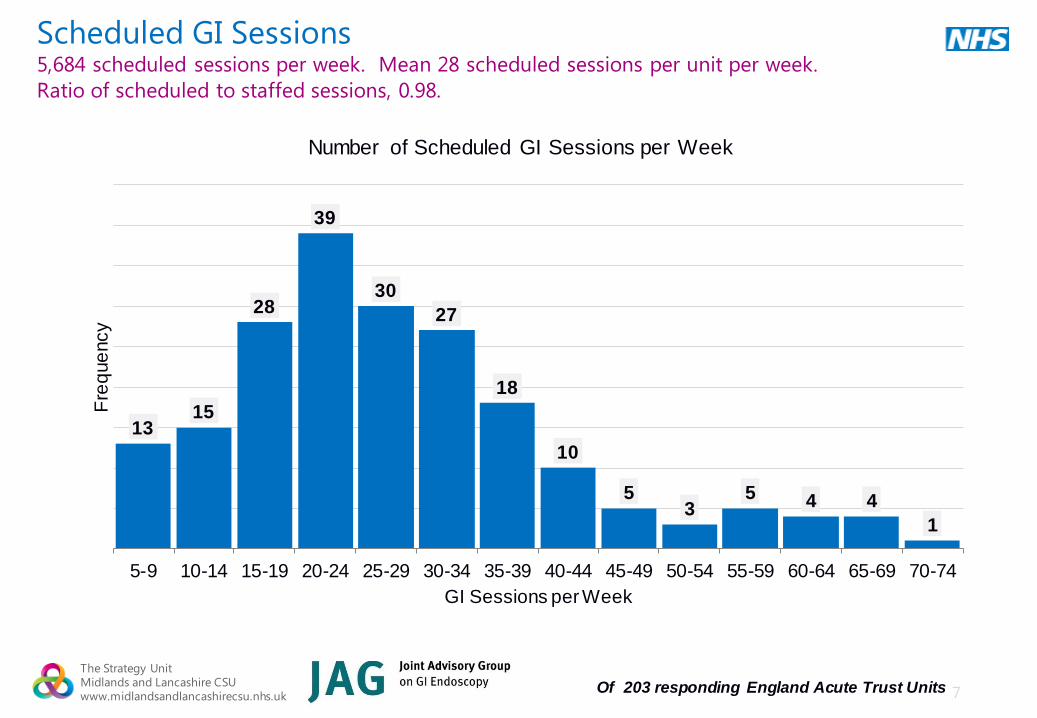
Scheduled GI Sessions 5,684 scheduled sessions per week. Mean 28 scheduled sessions per unit per week.
Ratio of scheduled to staffed sessions, 0.98.
13 15
28
39
30
27
18
10
5 3
5 4 4
1
5-9 10-14 15-19 20-24 25-29 30-34 35-39 40-44 45-49 50-54 55-59 60-64 65-69 70-74
Fre
que
ncy
GI Sessions per Week
Number of Scheduled GI Sessions per Week
Of 203 responding England Acute Trust Units
8
The Strategy Unit Midlands and Lancashire CSU www.midlandsandlancashirecsu.nhs.uk
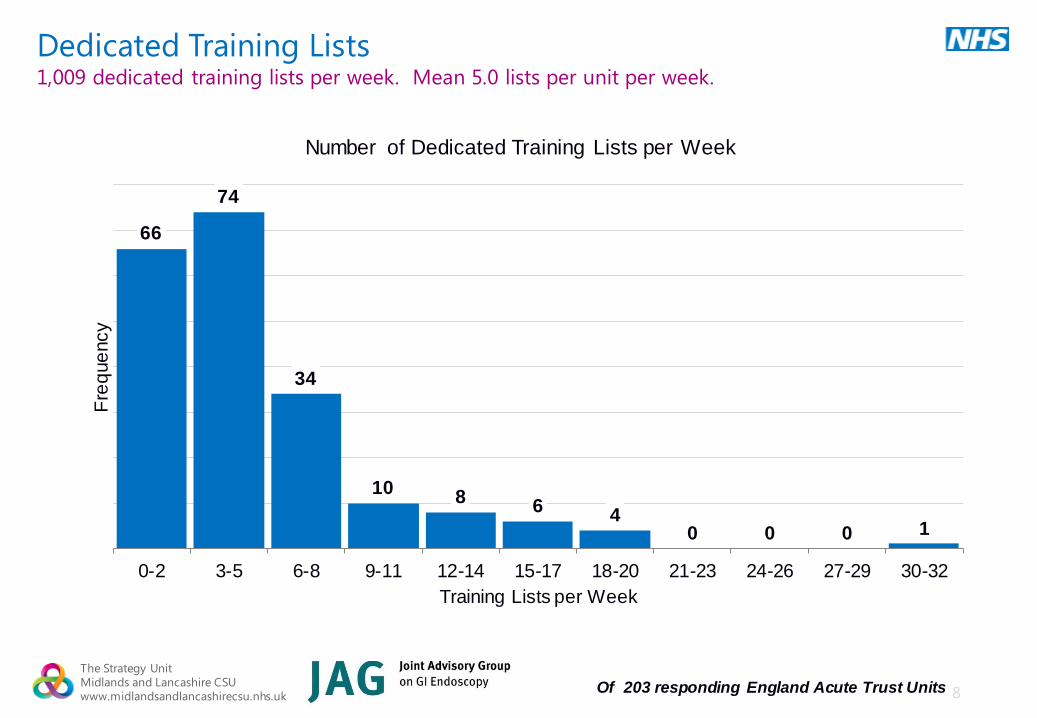
Dedicated Training Lists 1,009 dedicated training lists per week. Mean 5.0 lists per unit per week.
66
74
34
10 8
6 4
0 0 0 1
0-2 3-5 6-8 9-11 12-14 15-17 18-20 21-23 24-26 27-29 30-32
Fre
que
ncy
Training Lists per Week
Number of Dedicated Training Lists per Week
Of 203 responding England Acute Trust Units
9
The Strategy Unit Midlands and Lancashire CSU www.midlandsandlancashirecsu.nhs.uk
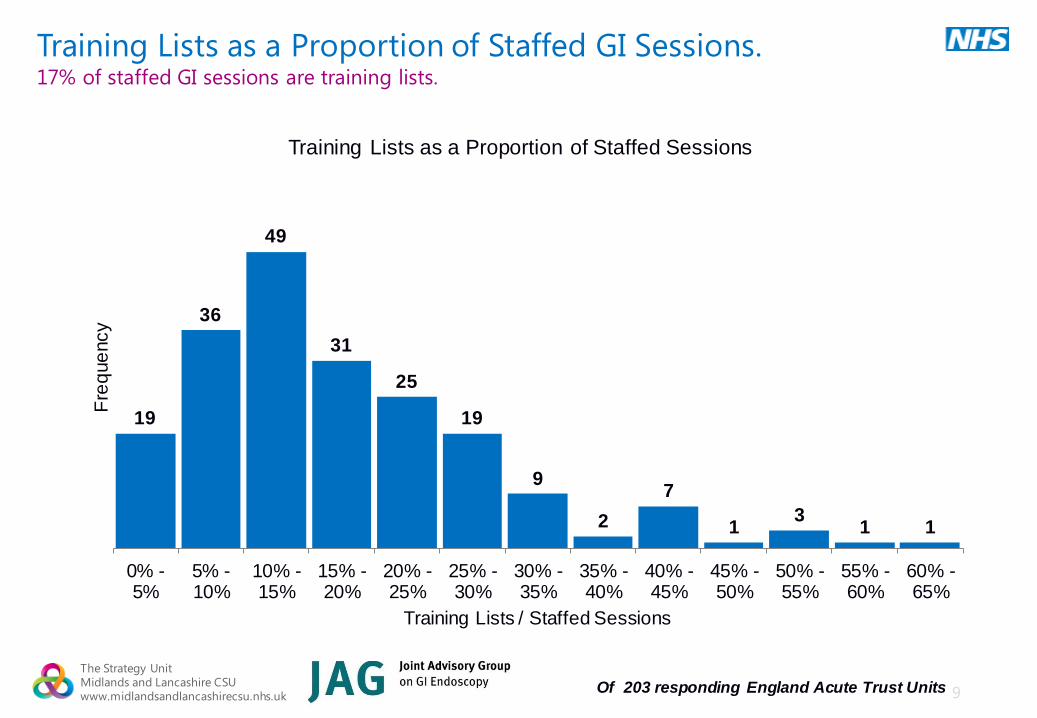
Training Lists as a Proportion of Staffed GI Sessions. 17% of staffed GI sessions are training lists.
19
36
49
31
25
19
9
2
7
1 3
1 1
0% -5%
5% -10%
10% -15%
15% -20%
20% -25%
25% -30%
30% -35%
35% -40%
40% -45%
45% -50%
50% -55%
55% -60%
60% -65%
Fre
que
ncy
Training Lists / Staffed Sessions
Training Lists as a Proportion of Staffed Sessions
Of 203 responding England Acute Trust Units
10
The Strategy Unit Midlands and Lancashire CSU www.midlandsandlancashirecsu.nhs.uk
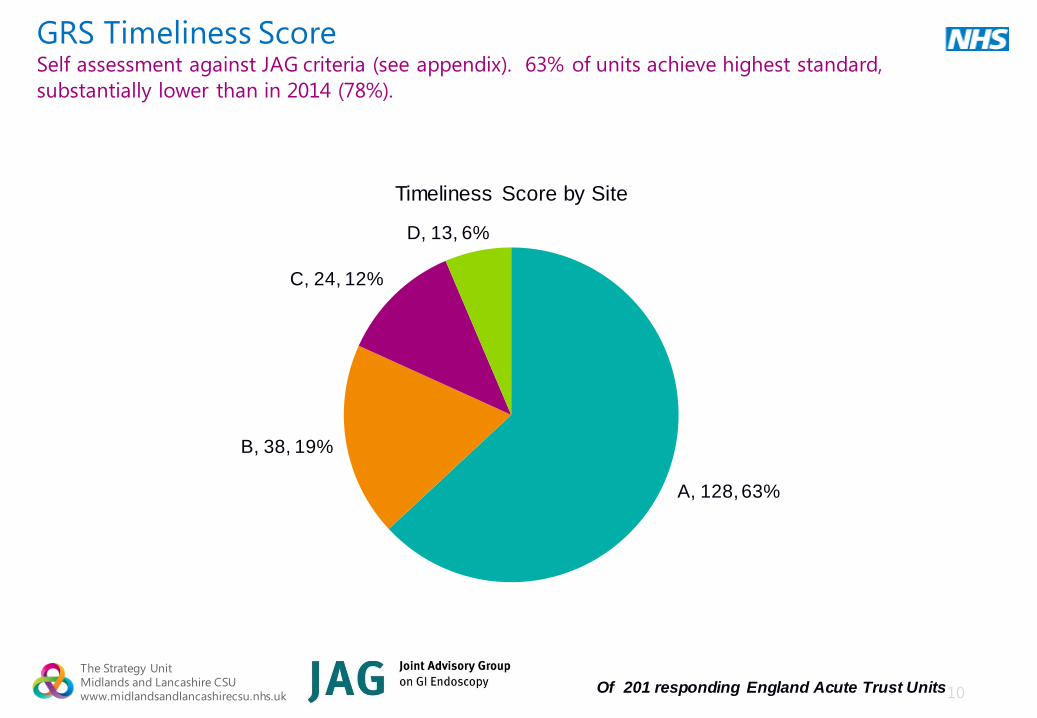
GRS Timeliness Score Self assessment against JAG criteria (see appendix). 63% of units achieve highest standard,
substantially lower than in 2014 (78%).
A, 128, 63%
B, 38, 19%
C, 24, 12%
D, 13, 6%
Timeliness Score by Site
Of 201 responding England Acute Trust Units
11
The Strategy Unit Midlands and Lancashire CSU www.midlandsandlancashirecsu.nhs.uk
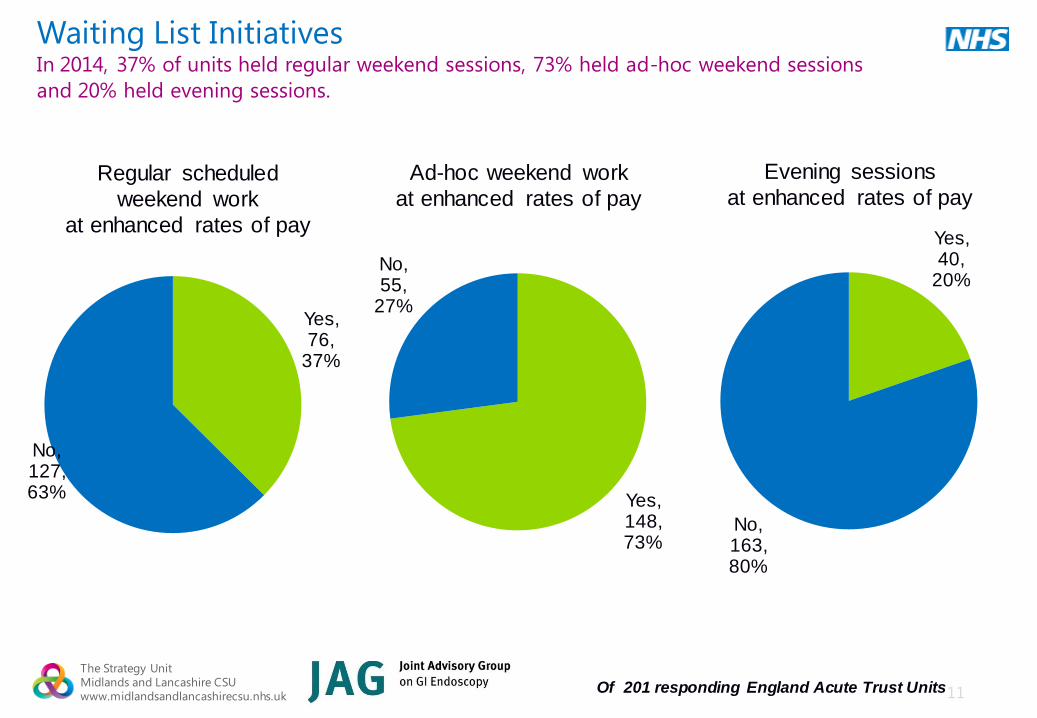
Waiting List Initiatives In 2014, 37% of units held regular weekend sessions, 73% held ad-hoc weekend sessions
and 20% held evening sessions.
Yes, 76,
37%
No, 127, 63%
Regular scheduled
weekend work
at enhanced rates of pay
Yes, 148, 73%
No, 55,
27%
Ad-hoc weekend work
at enhanced rates of pay
Yes, 40,
20%
No, 163, 80%
Evening sessions
at enhanced rates of pay
Of 201 responding England Acute Trust Units
12
The Strategy Unit Midlands and Lancashire CSU www.midlandsandlancashirecsu.nhs.uk
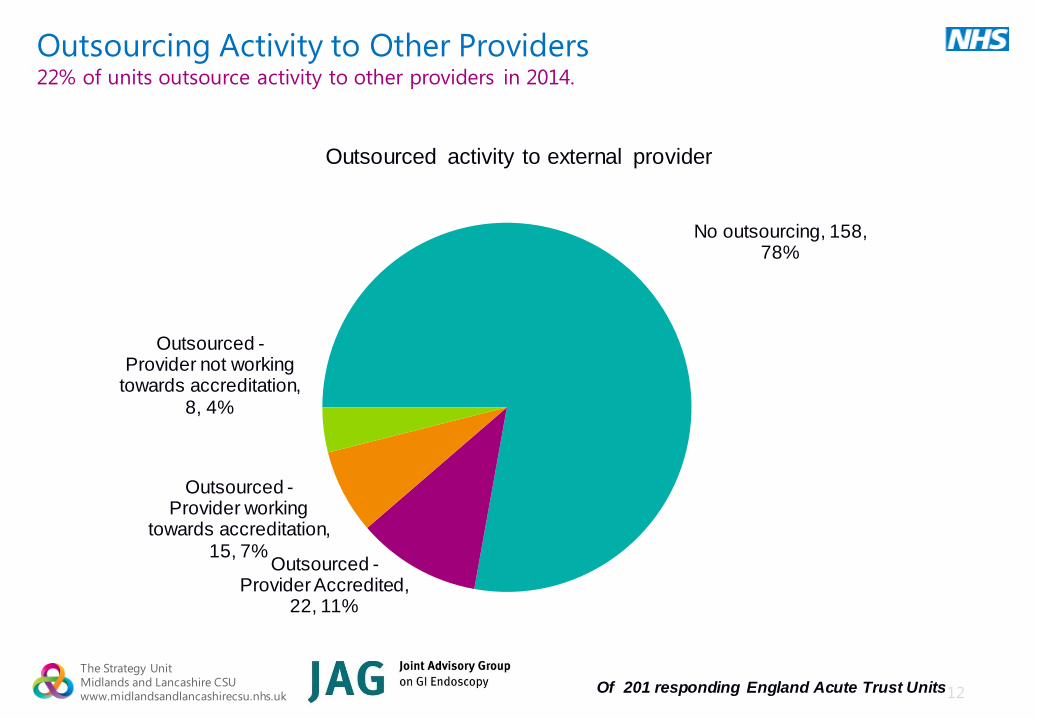
Outsourcing Activity to Other Providers 22% of units outsource activity to other providers in 2014.
No outsourcing, 158, 78%
Outsourced - Provider Accredited,
22, 11%
Outsourced - Provider working
towards accreditation, 15, 7%
Outsourced - Provider not working
towards accreditation, 8, 4%
Outsourced activity to external provider
Of 201 responding England Acute Trust Units
13
The Strategy Unit Midlands and Lancashire CSU www.midlandsandlancashirecsu.nhs.uk
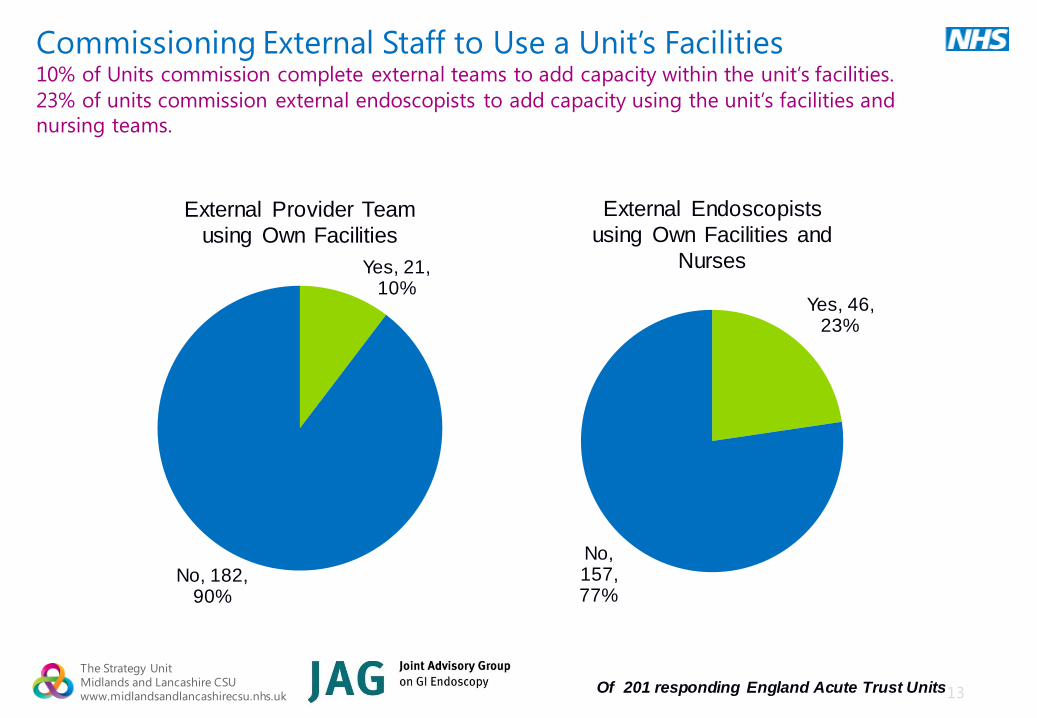
Commissioning External Staff to Use a Unit’s Facilities 10% of Units commission complete external teams to add capacity within the unit’s facilities.
23% of units commission external endoscopists to add capacity using the unit’s facilities and
nursing teams.
Yes, 21, 10%
No, 182, 90%
External Provider Team
using Own Facilities
Yes, 46, 23%
No, 157, 77%
External Endoscopists
using Own Facilities and
Nurses
Of 201 responding England Acute Trust Units
14
The Strategy Unit Midlands and Lancashire CSU www.midlandsandlancashirecsu.nhs.uk
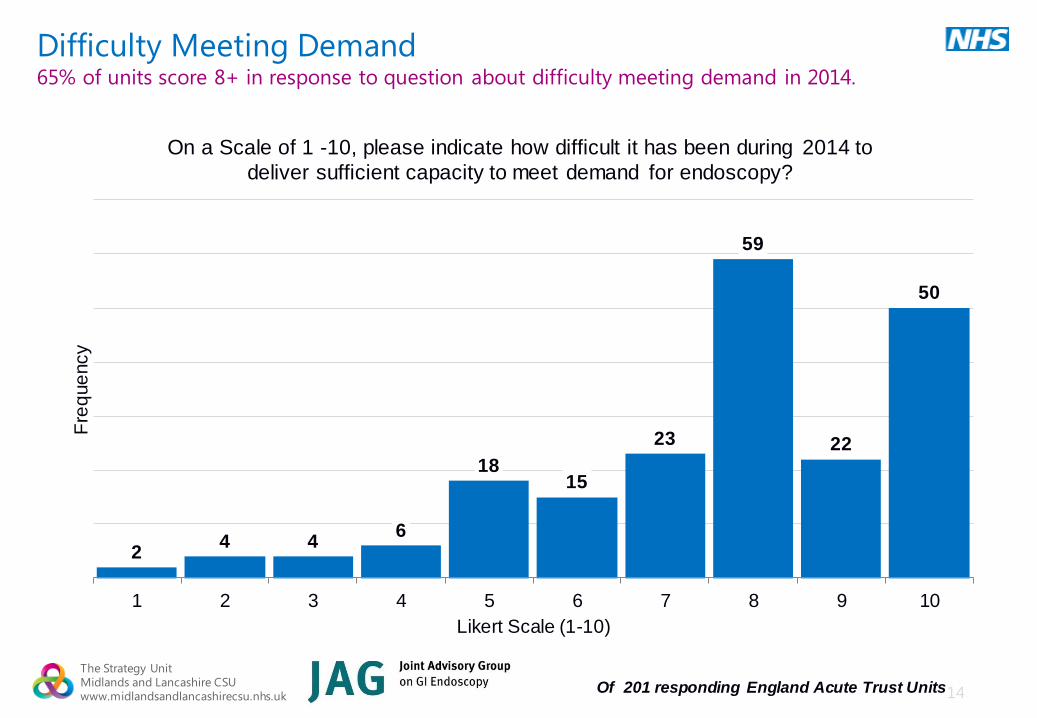
Difficulty Meeting Demand 65% of units score 8+ in response to question about difficulty meeting demand in 2014.
2 4 4
6
18 15
23
59
22
50
1 2 3 4 5 6 7 8 9 10
Fre
que
ncy
Likert Scale (1-10)
On a Scale of 1 -10, please indicate how difficult it has been during 2014 to
deliver sufficient capacity to meet demand for endoscopy?
Of 201 responding England Acute Trust Units
15
The Strategy Unit Midlands and Lancashire CSU www.midlandsandlancashirecsu.nhs.uk
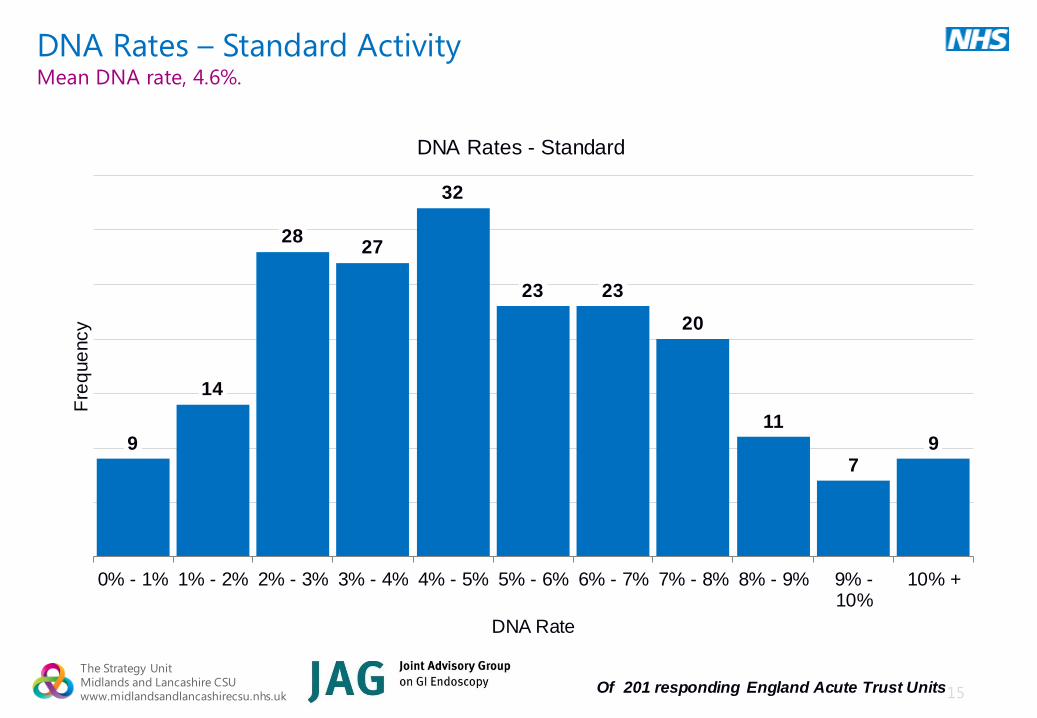
DNA Rates – Standard Activity Mean DNA rate, 4.6%.
9
14
28 27
32
23 23
20
11
7 9
0% - 1% 1% - 2% 2% - 3% 3% - 4% 4% - 5% 5% - 6% 6% - 7% 7% - 8% 8% - 9% 9% -10%
10% +
Fre
que
ncy
DNA Rate
DNA Rates - Standard
Of 201 responding England Acute Trust Units
16
The Strategy Unit Midlands and Lancashire CSU www.midlandsandlancashirecsu.nhs.uk
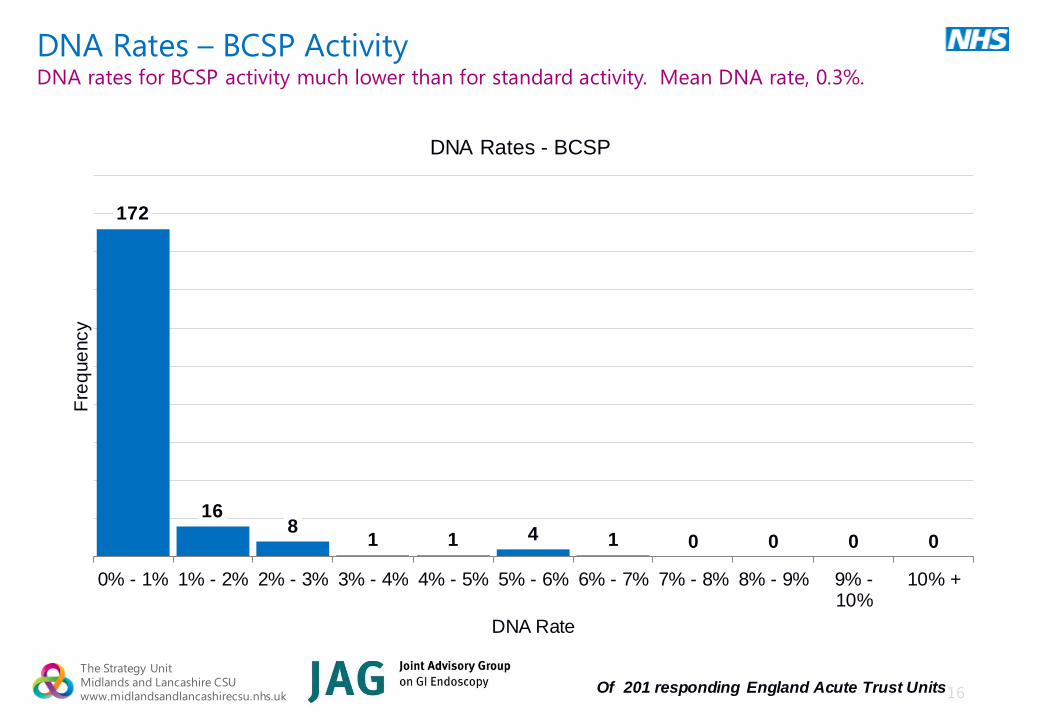
DNA Rates – BCSP Activity DNA rates for BCSP activity much lower than for standard activity. Mean DNA rate, 0.3%.
172
16 8
1 1 4 1 0 0 0 0
0% - 1% 1% - 2% 2% - 3% 3% - 4% 4% - 5% 5% - 6% 6% - 7% 7% - 8% 8% - 9% 9% -10%
10% +
Fre
que
ncy
DNA Rate
DNA Rates - BCSP
Of 201 responding England Acute Trust Units
17
The Strategy Unit Midlands and Lancashire CSU www.midlandsandlancashirecsu.nhs.uk
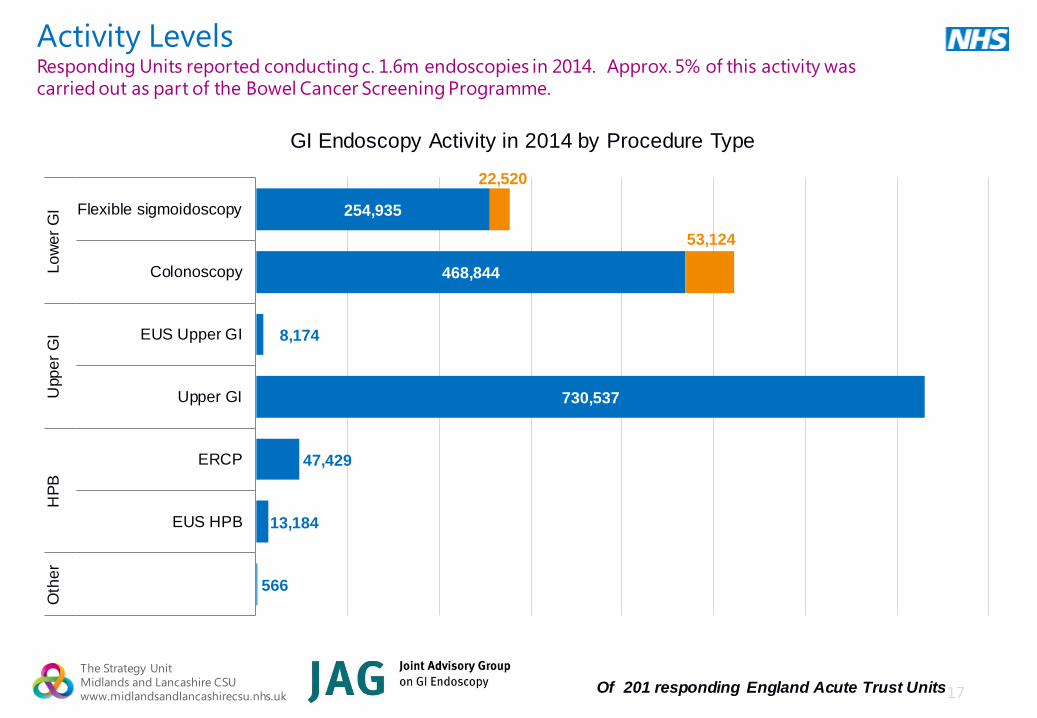
Activity Levels Responding Units reported conducting c. 1.6m endoscopies in 2014. Approx. 5% of this activity was carried out as part of the Bowel Cancer Screening Programme.
254,935
468,844
8,174
730,537
47,429
13,184
566
22,520
53,124
Flexible sigmoidoscopy
Colonoscopy
EUS Upper GI
Upper GI
ERCP
EUS HPB
Lo
we
r G
IU
pp
er
GI
HP
BO
the
r
GI Endoscopy Activity in 2014 by Procedure Type
Of 201 responding England Acute Trust Units
18
The Strategy Unit Midlands and Lancashire CSU www.midlandsandlancashirecsu.nhs.uk
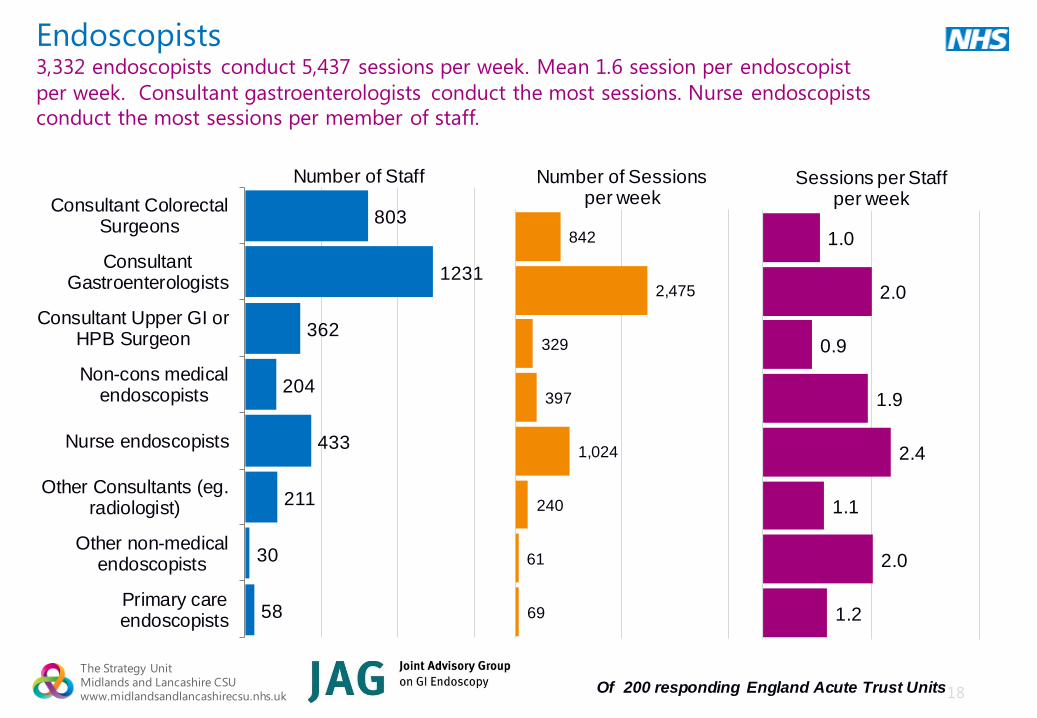
Endoscopists 3,332 endoscopists conduct 5,437 sessions per week. Mean 1.6 session per endoscopist
per week. Consultant gastroenterologists conduct the most sessions. Nurse endoscopists
conduct the most sessions per member of staff.
803
1231
362
204
433
211
30
58
Consultant ColorectalSurgeons
ConsultantGastroenterologists
Consultant Upper GI orHPB Surgeon
Non-cons medicalendoscopists
Nurse endoscopists
Other Consultants (eg.radiologist)
Other non-medicalendoscopists
Primary careendoscopists
Number of Staff
842
2,475
329
397
1,024
240
61
69
Number of Sessions per week
1.0
2.0
0.9
1.9
2.4
1.1
2.0
1.2
Sessions per Staff per week
Of 200 responding England Acute Trust Units
19
The Strategy Unit Midlands and Lancashire CSU www.midlandsandlancashirecsu.nhs.uk
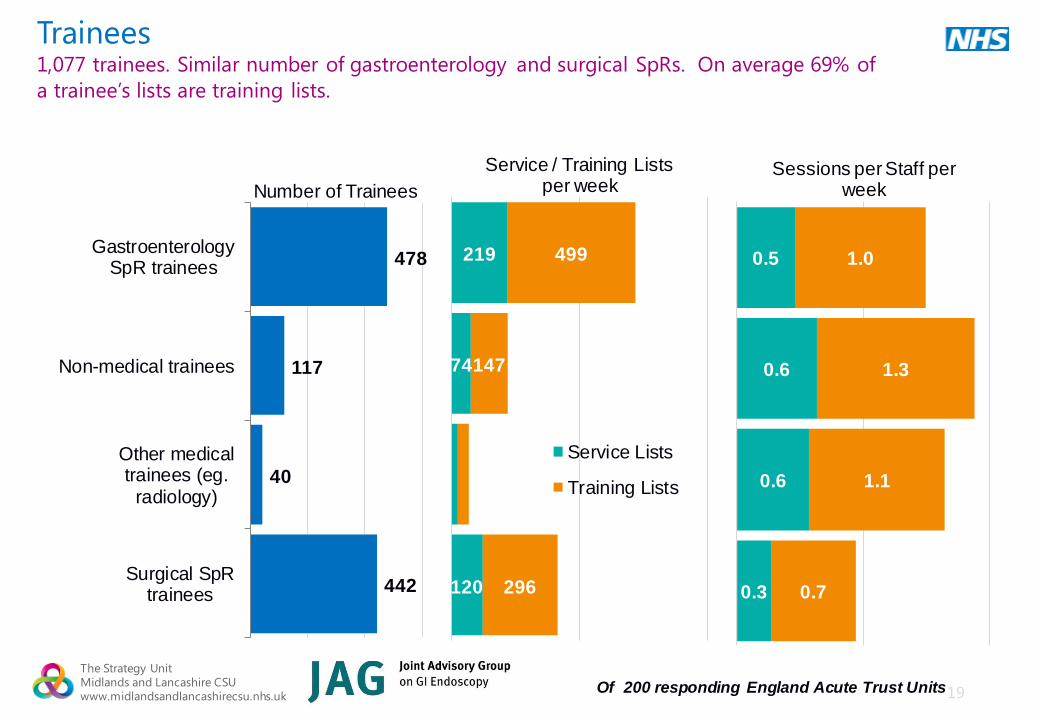
Trainees 1,077 trainees. Similar number of gastroenterology and surgical SpRs. On average 69% of
a trainee’s lists are training lists.
478
117
40
442
GastroenterologySpR trainees
Non-medical trainees
Other medicaltrainees (eg.
radiology)
Surgical SpRtrainees
Number of Trainees
219
74
120
499
147
296
Service / Training Lists per week
Service Lists
Training Lists
Of 200 responding England Acute Trust Units
0.5
0.6
0.6
0.3
1.0
1.3
1.1
0.7
Sessions per Staff per week
20
The Strategy Unit Midlands and Lancashire CSU www.midlandsandlancashirecsu.nhs.uk
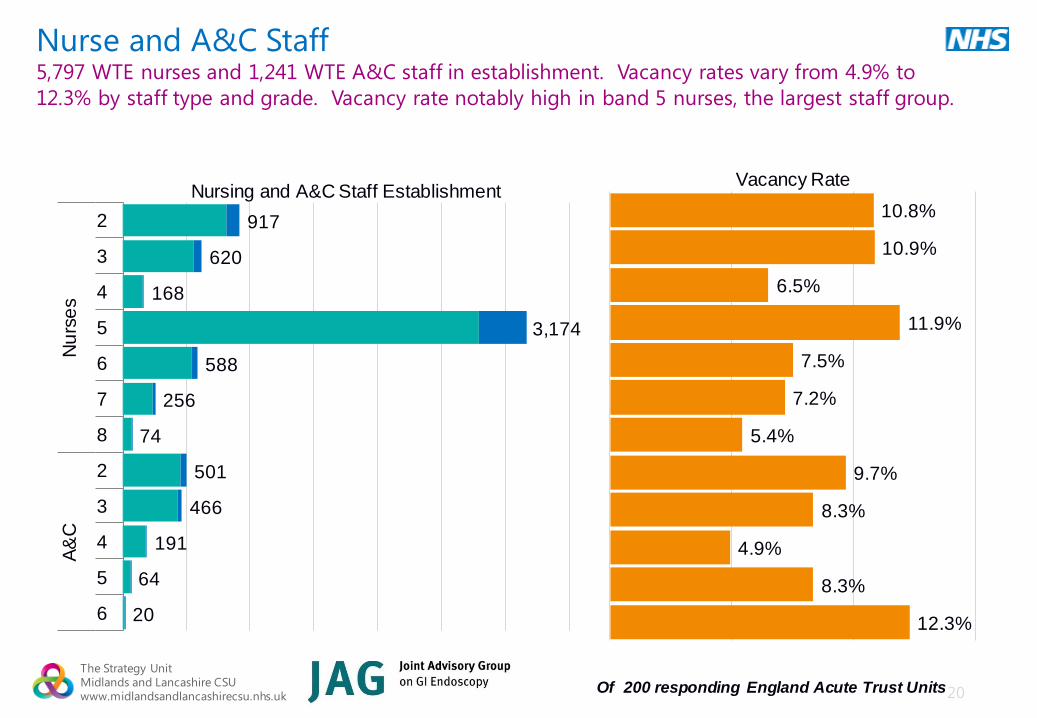
Nurse and A&C Staff 5,797 WTE nurses and 1,241 WTE A&C staff in establishment. Vacancy rates vary from 4.9% to
12.3% by staff type and grade. Vacancy rate notably high in band 5 nurses, the largest staff group.
917
620
168
3,174
588
256
74
501
466
191
64
20
2
3
4
5
6
7
8
2
3
4
5
6
Nu
rse
sA
&C
Nursing and A&C Staff Establishment 10.8%
10.9%
6.5%
11.9%
7.5%
7.2%
5.4%
9.7%
8.3%
4.9%
8.3%
12.3%
Vacancy Rate
Of 200 responding England Acute Trust Units
21
The Strategy Unit Midlands and Lancashire CSU www.midlandsandlancashirecsu.nhs.uk
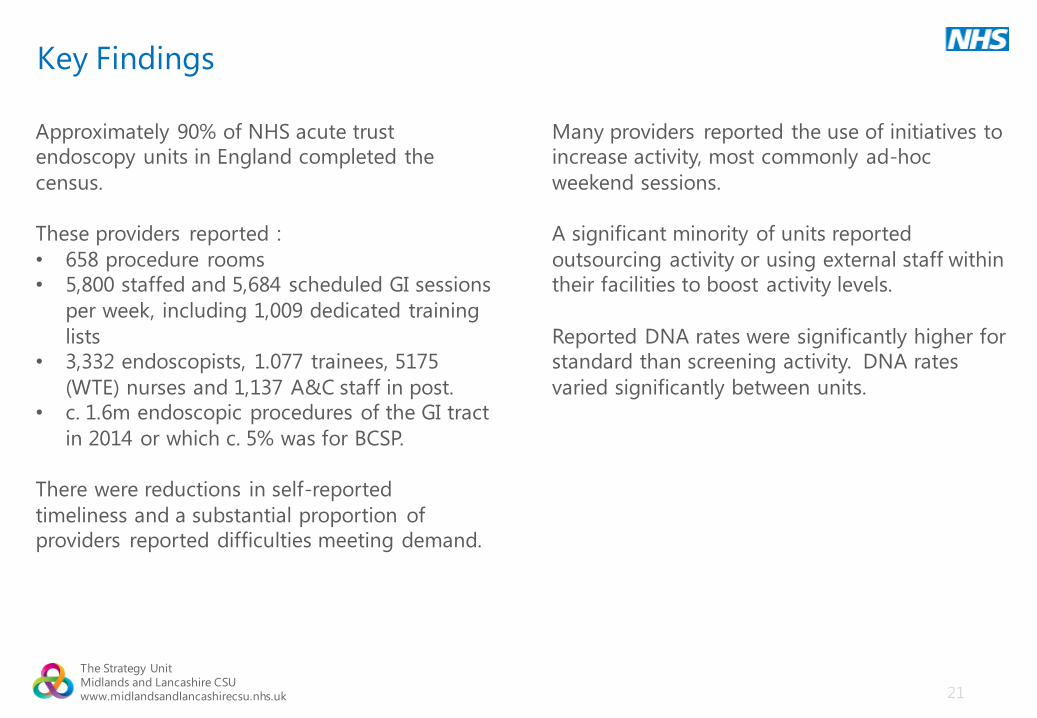
Key Findings
Approximately 90% of NHS acute trust
endoscopy units in England completed the
census.
These providers reported :
• 658 procedure rooms
• 5,800 staffed and 5,684 scheduled GI sessions
per week, including 1,009 dedicated training
lists
• 3,332 endoscopists, 1.077 trainees, 5175
(WTE) nurses and 1,137 A&C staff in post.
• c. 1.6m endoscopic procedures of the GI tract
in 2014 or which c. 5% was for BCSP.
There were reductions in self-reported
timeliness and a substantial proportion of
providers reported difficulties meeting demand.
Many providers reported the use of initiatives to
increase activity, most commonly ad-hoc
weekend sessions.
A significant minority of units reported
outsourcing activity or using external staff within
their facilities to boost activity levels.
Reported DNA rates were significantly higher for
standard than screening activity. DNA rates
varied significantly between units.
22
The Strategy Unit Midlands and Lancashire CSU www.midlandsandlancashirecsu.nhs.uk
Contact
For questions about the survey, please contact:
Raphael Broughton
Accreditation e-systems manager and analyst
Care Quality Improvement Department
Royal College of Physicians
11 St Andrews Place | London NW1 4LE
Tel:+44 (0)20 3075 1372
Email: [email protected]
For questions about this analysis, please contact:
Steven Wyatt
Head of Strategic Analytics
The Strategy Unit
NHS Midlands and Lancashire CSU
438-450 High Street | Kingston House | B70 9LD
Tel: 0121 612 3872
Email: [email protected]
23
The Strategy Unit Midlands and Lancashire CSU www.midlandsandlancashirecsu.nhs.uk
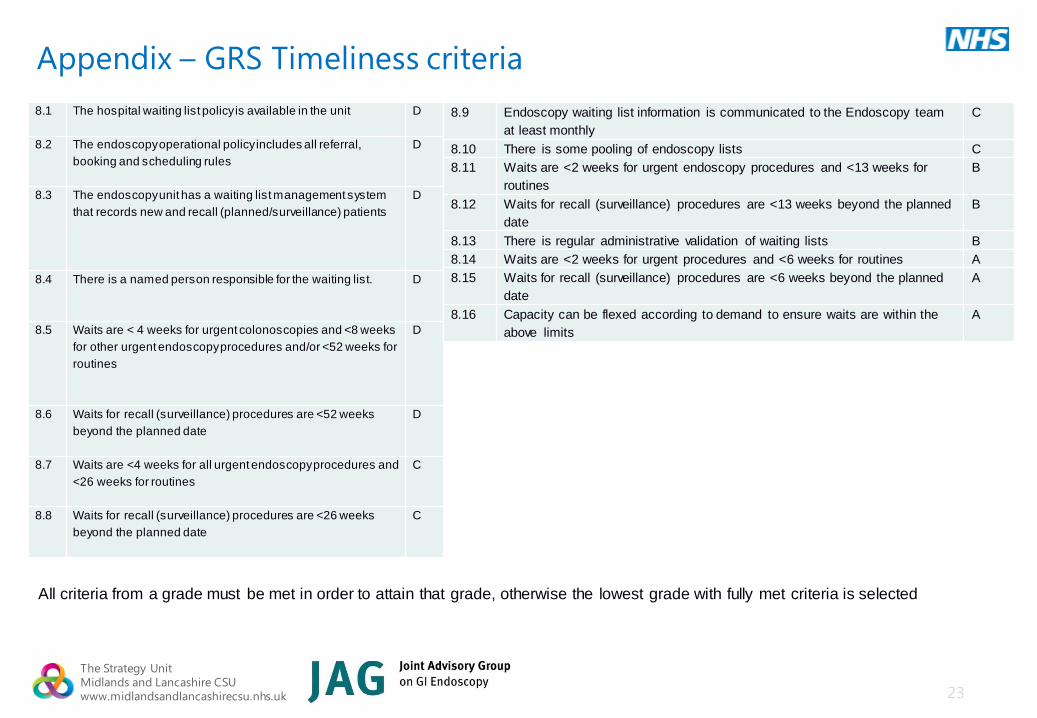
Appendix – GRS Timeliness criteria
8.1 The hospital waiting list policy is available in the unit D
8.2 The endoscopy operational policy includes all referral,
booking and scheduling rules
D
8.3 The endoscopy unit has a waiting list management system
that records new and recall (planned/surveillance) patients
D
8.4 There is a named person responsible for the waiting list. D
8.5 Waits are < 4 weeks for urgent colonoscopies and <8 weeks
for other urgent endoscopy procedures and/or <52 weeks for
routines
D
8.6 Waits for recall (surveillance) procedures are <52 weeks
beyond the planned date
D
8.7 Waits are <4 weeks for all urgent endoscopy procedures and
<26 weeks for routines
C
8.8 Waits for recall (surveillance) procedures are <26 weeks
beyond the planned date
C
8.9 Endoscopy waiting list information is communicated to the Endoscopy team
at least monthly
C
8.10 There is some pooling of endoscopy lists C
8.11 Waits are <2 weeks for urgent endoscopy procedures and <13 weeks for
routines
B
8.12 Waits for recall (surveillance) procedures are <13 weeks beyond the planned
date
B
8.13 There is regular administrative validation of waiting lists B
8.14 Waits are <2 weeks for urgent procedures and <6 weeks for routines A
8.15 Waits for recall (surveillance) procedures are <6 weeks beyond the planned
date
A
8.16 Capacity can be flexed according to demand to ensure waits are within the
above limits
A
All criteria from a grade must be met in order to attain that grade, otherwise the lowest grade with fully met criteria is selected