Embed Size (px)
Citation preview

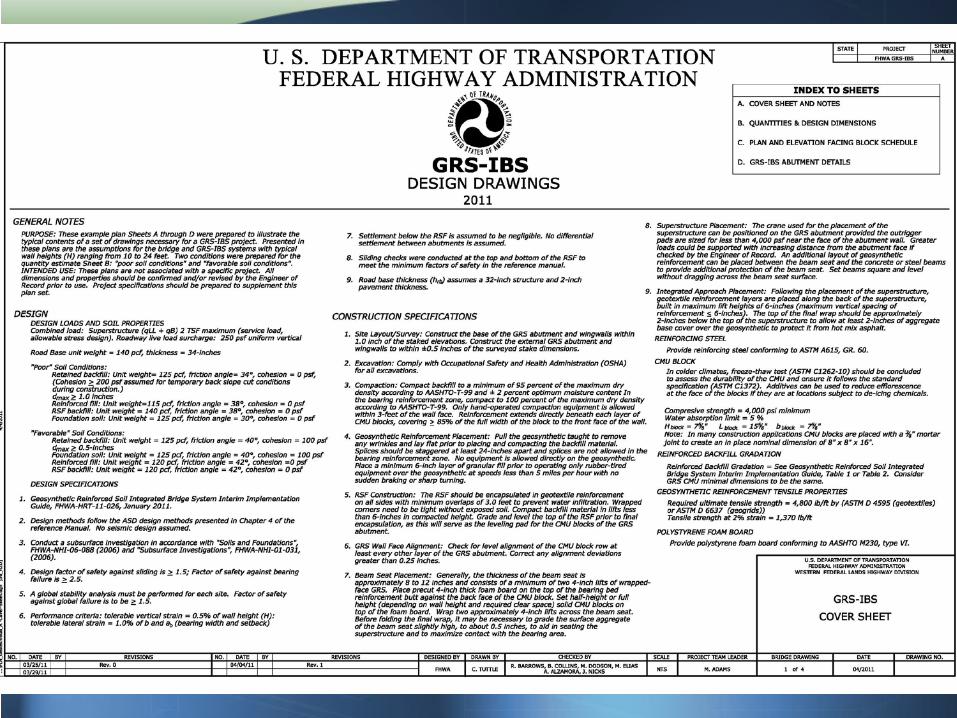
GEOSYNTHETIC REINFORCED SOIL INTEGRATED BRIDGE SYSTEM
Michael Adams, Daniel Alzamora, Jennifer Nicks
Introduction
• Daniel Alzamora, P.E. – FHWA Geotechnical Engineer – Office of Technical Services – Resource Center – GRS-IBS Implementation Lead – 720-963-3214 – [email protected]
Introduction
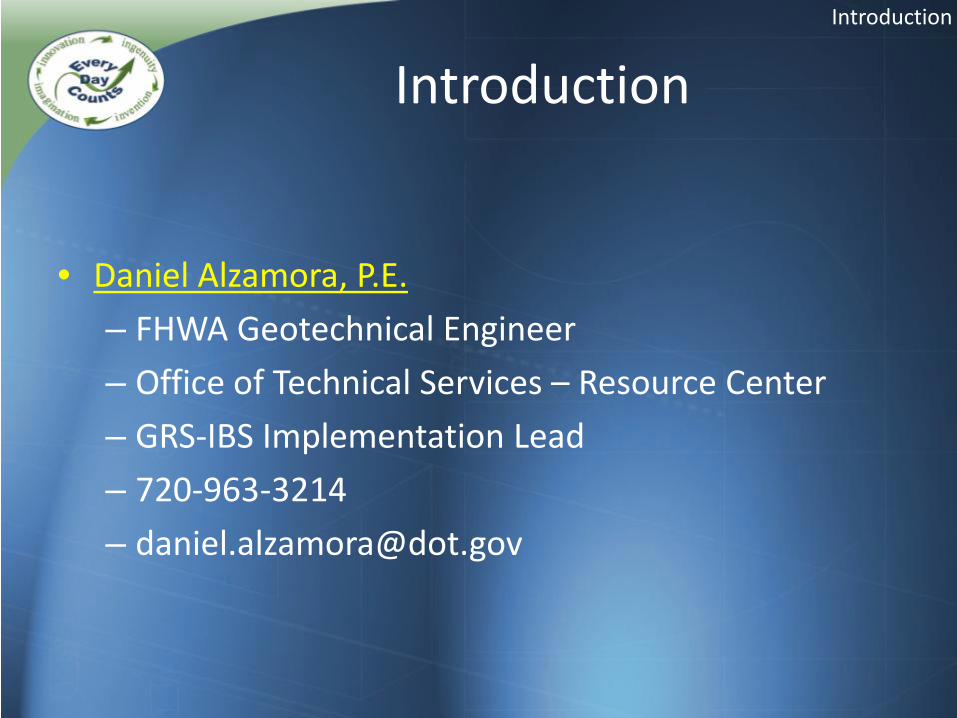
EDC Web Site www.fhwa.dot.gov/everydaycounts
• Taking effective, proven and market–ready technologies and getting them into widespread use
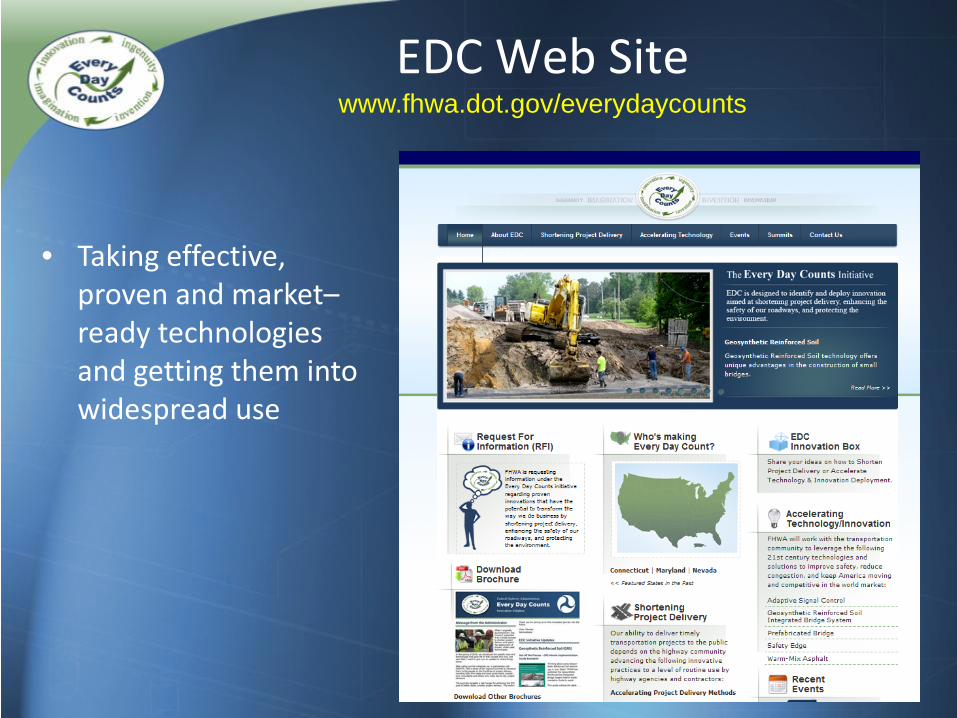
2012 Deployment Goals
• December 2012: – 30 bridges have been designed and/or
constructed using GRS-IBS on the NHS within 20 states
– 75 bridges have been designed and/or constructed using GRS-IBS off the NHS
Steps to Move Forward
The Current Bridge Situation
• Approximately 600,000 bridges in the U.S. • Many have functional or structural
deficiencies • Most are small single span • Budgets don’t meet demand – Build more
bridges for your dollar
Technology Overview
GRS FUNDAMENTALS
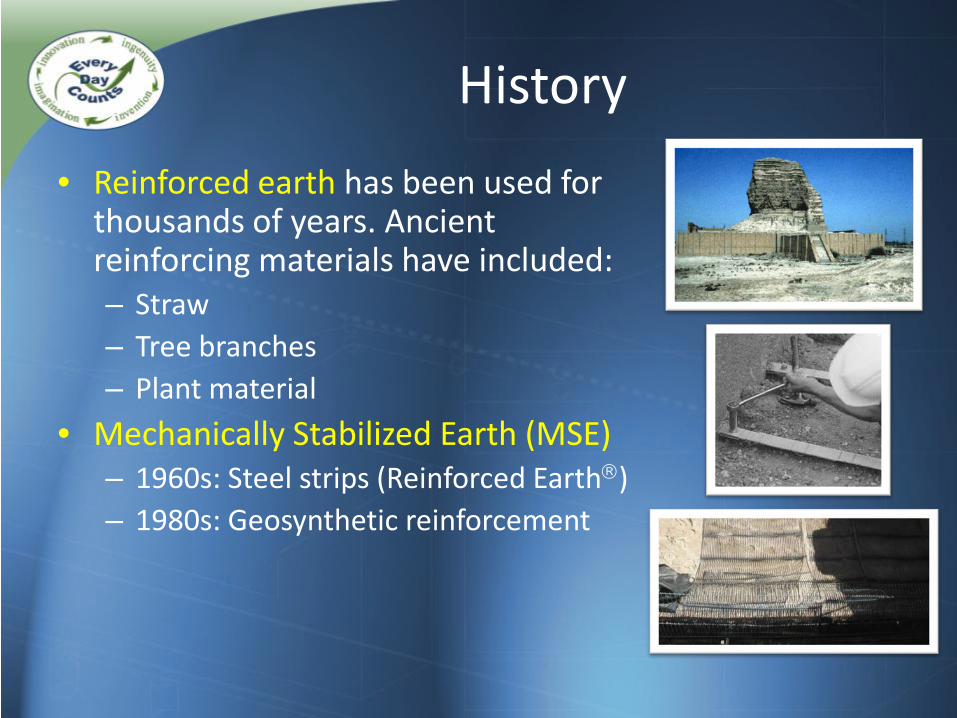
History • Reinforced earth has been used for
thousands of years. Ancient reinforcing materials have included: – Straw – Tree branches – Plant material
• Mechanically Stabilized Earth (MSE) – 1960s: Steel strips (Reinforced Earth) – 1980s: Geosynthetic reinforcement
Definitions
• GRS - Geosynthetic Reinforced Soil – An engineered fill of closely spaced (< 12” )
alternating layers of compacted granular fill material and geosynthetic reinforcement
• IBS - Integrated Bridge System – A fast, cost-effective method of bridge support that
blends the roadway into the superstructure using GRS technology
GRS Fundamentals
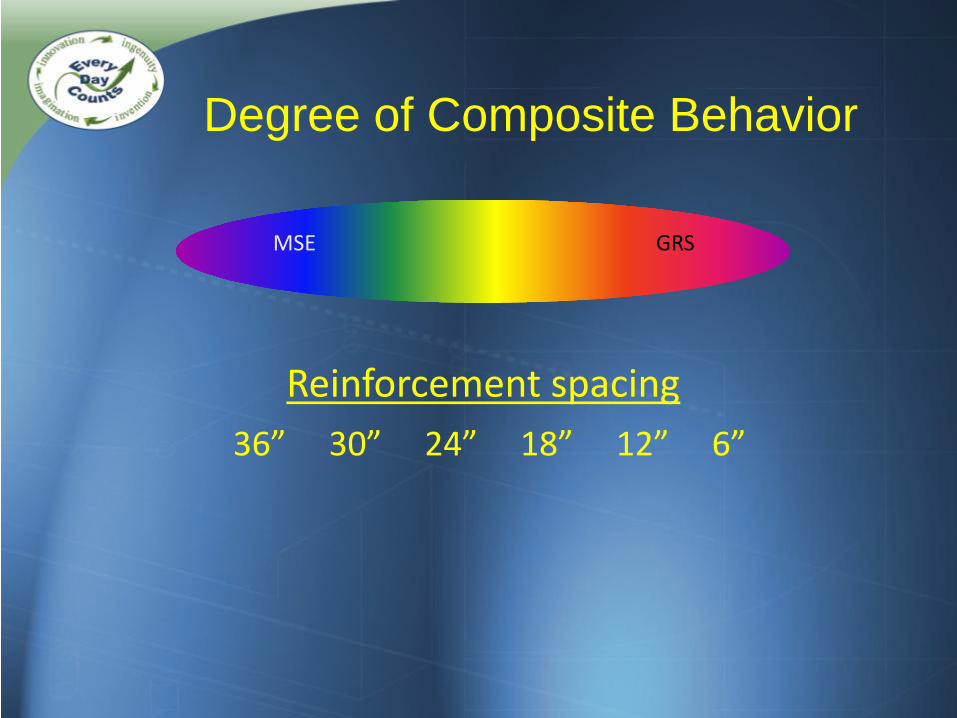
GRS MSE
Reinforcement spacing 36” 30” 24” 18” 12” 6”
Degree of Composite Behavior
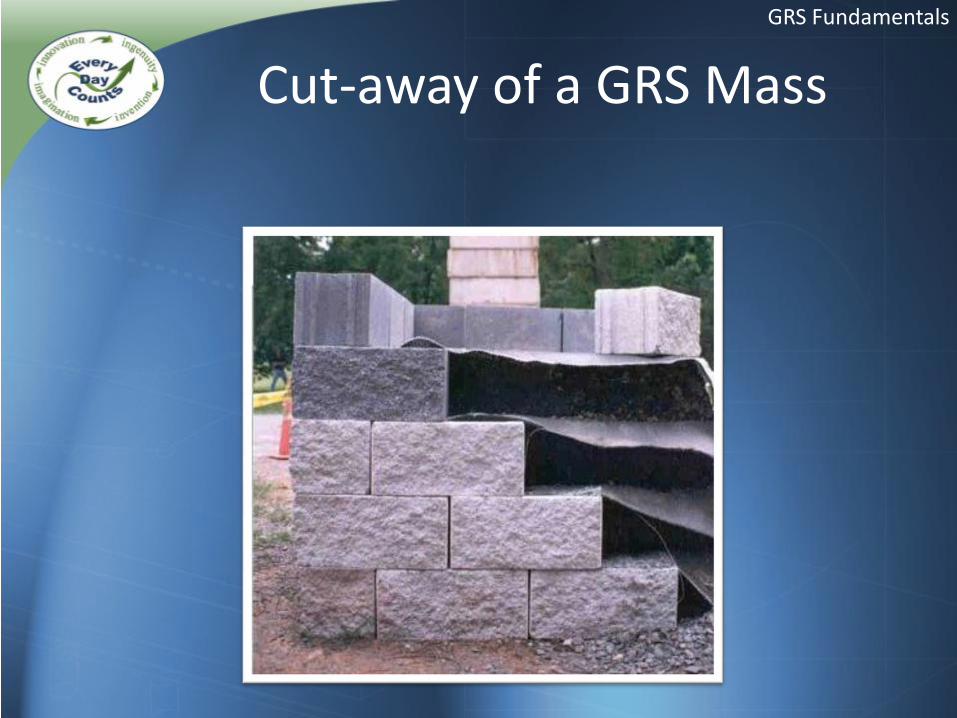
Cut-away of a GRS Mass GRS Fundamentals
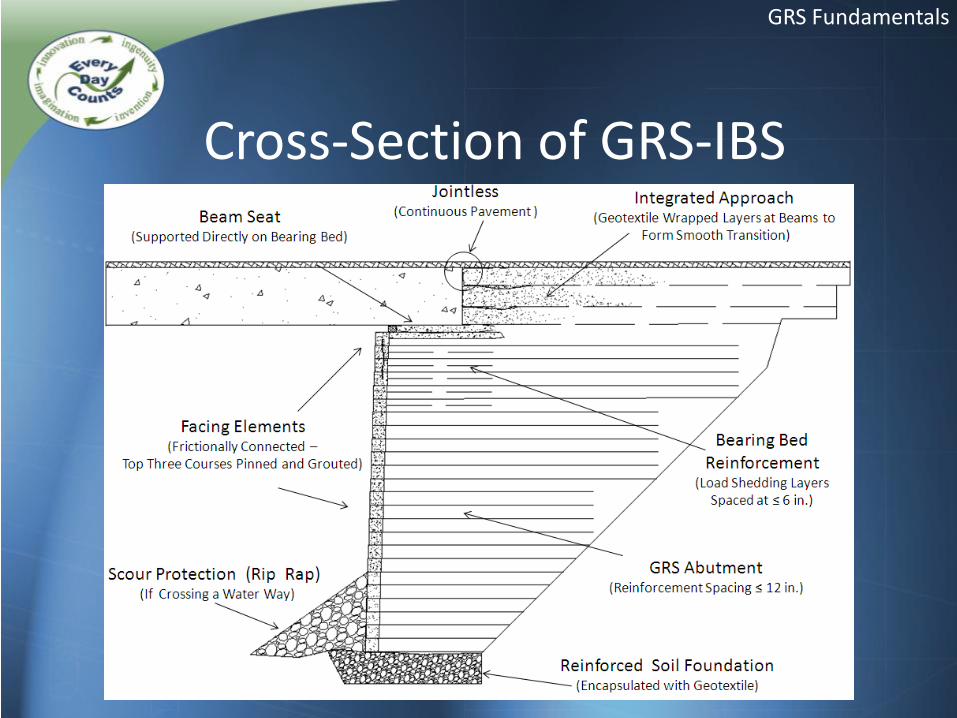
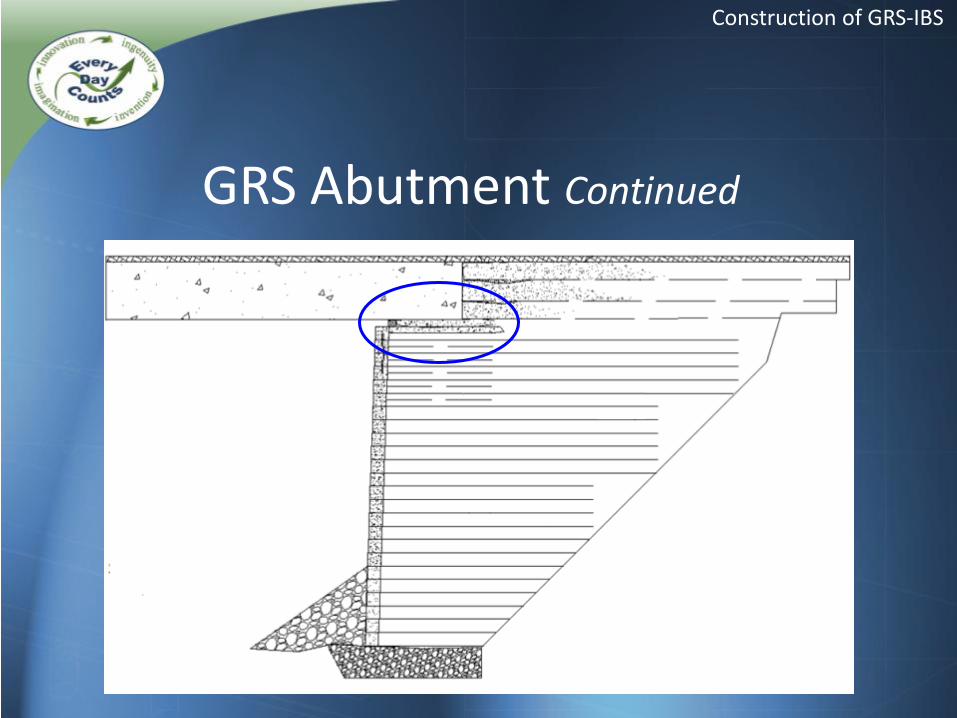
Cross-Section of GRS-IBS
GRS Fundamentals
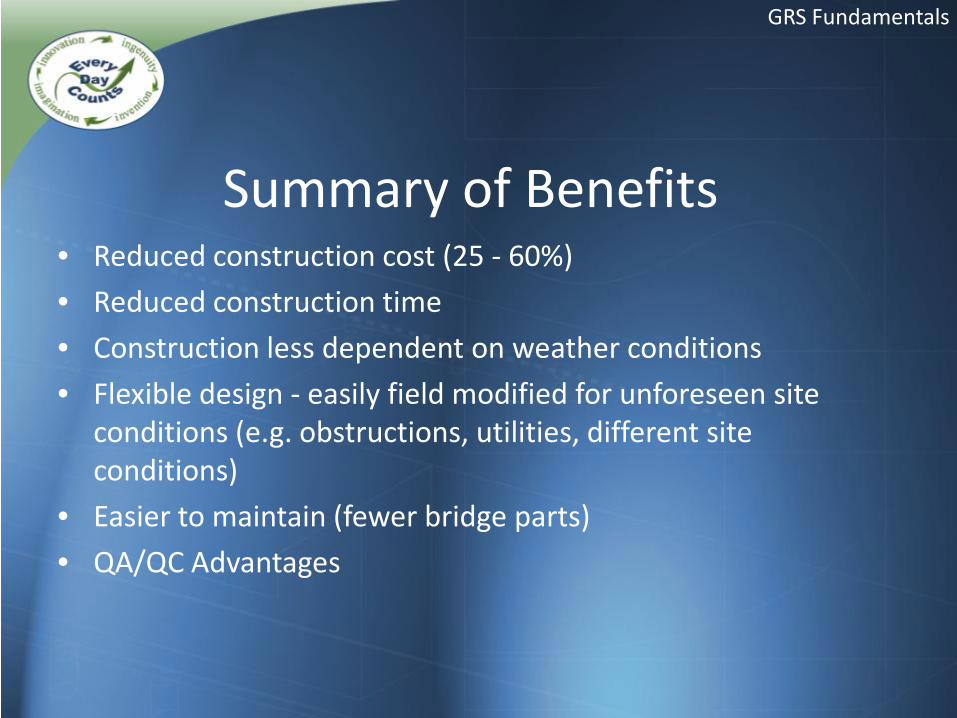
Summary of Benefits • Reduced construction cost (25 - 60%) • Reduced construction time • Construction less dependent on weather conditions • Flexible design - easily field modified for unforeseen site
conditions (e.g. obstructions, utilities, different site conditions)
• Easier to maintain (fewer bridge parts) • QA/QC Advantages
GRS Fundamentals
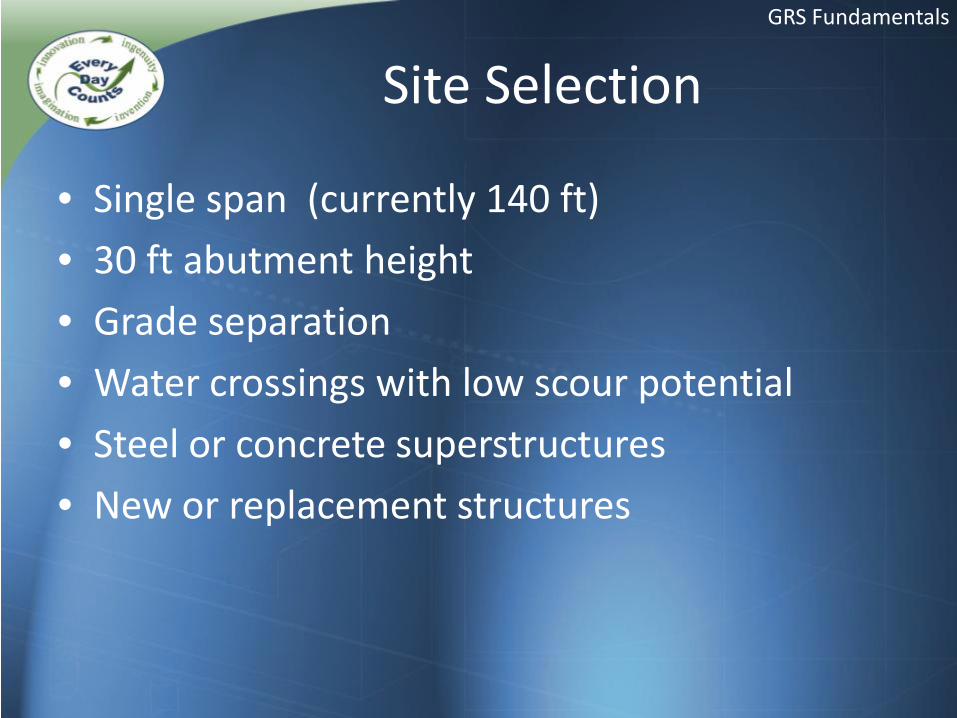
Site Selection
• Single span (currently 140 ft) • 30 ft abutment height • Grade separation • Water crossings with low scour potential • Steel or concrete superstructures • New or replacement structures
GRS Fundamentals
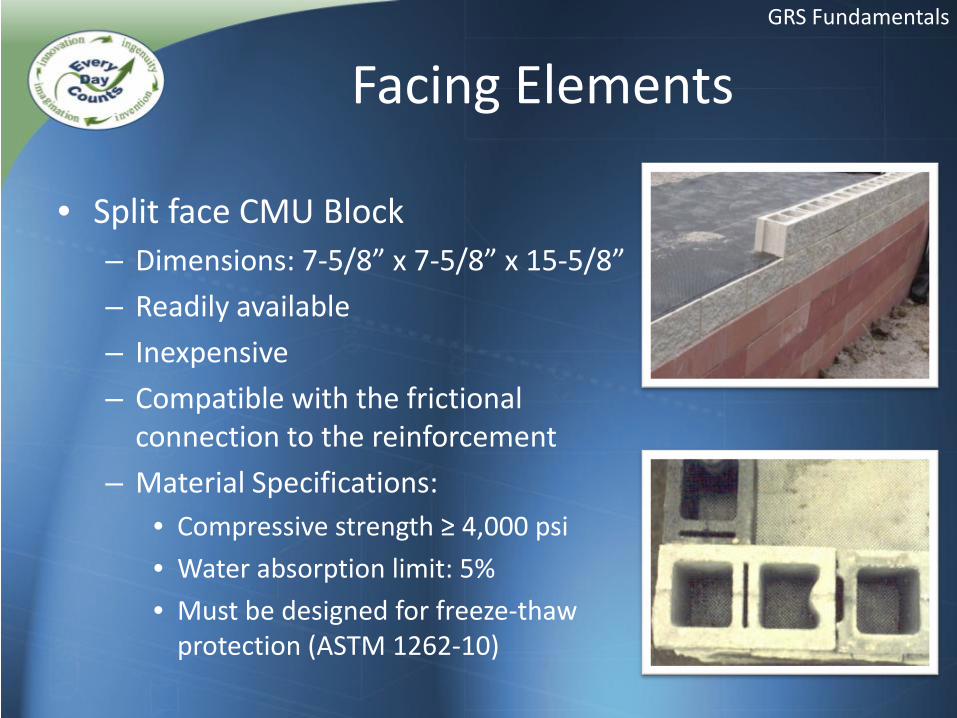
Facing Elements
• Split face CMU Block – Dimensions: 7-5/8” x 7-5/8” x 15-5/8” – Readily available – Inexpensive – Compatible with the frictional
connection to the reinforcement – Material Specifications:
• Compressive strength ≥ 4,000 psi • Water absorption limit: 5% • Must be designed for freeze-thaw
protection (ASTM 1262-10)
GRS Fundamentals
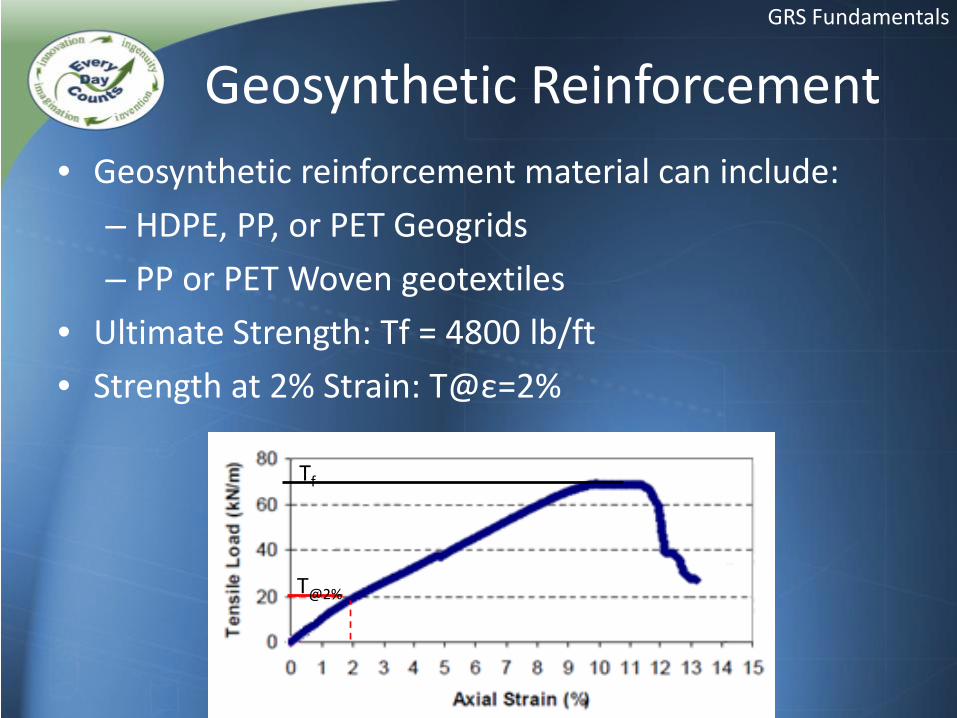
Geosynthetic Reinforcement • Geosynthetic reinforcement material can include:
– HDPE, PP, or PET Geogrids – PP or PET Woven geotextiles
• Ultimate Strength: Tf = 4800 lb/ft • Strength at 2% Strain: T@ε=2%
GRS Fundamentals
Tf
T@2%
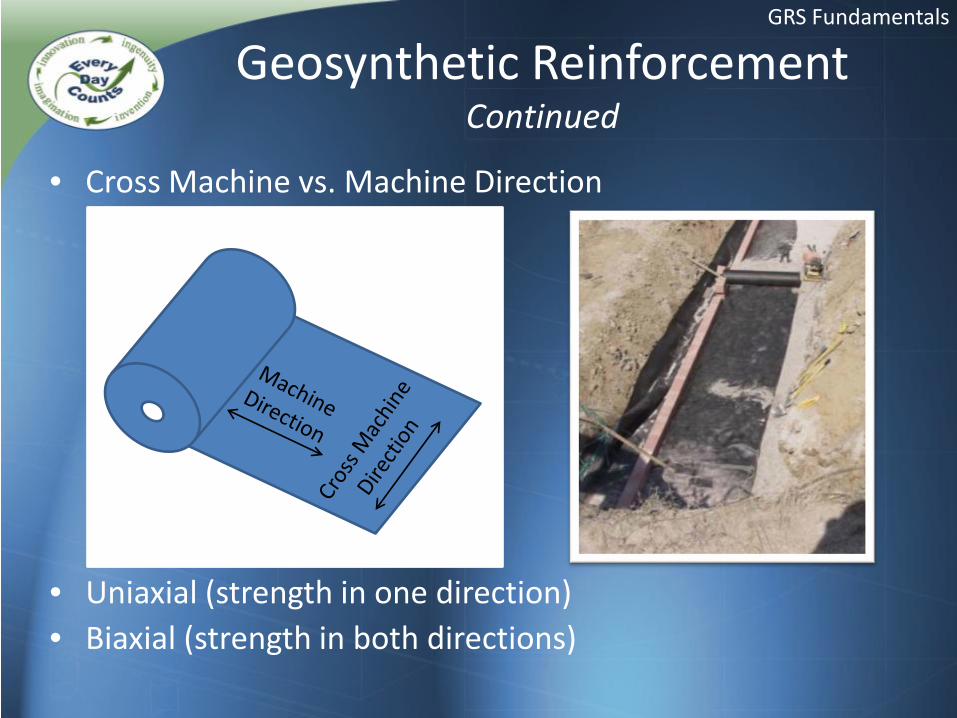
Geosynthetic Reinforcement Continued
• Cross Machine vs. Machine Direction
• Uniaxial (strength in one direction) • Biaxial (strength in both directions)
GRS Fundamentals
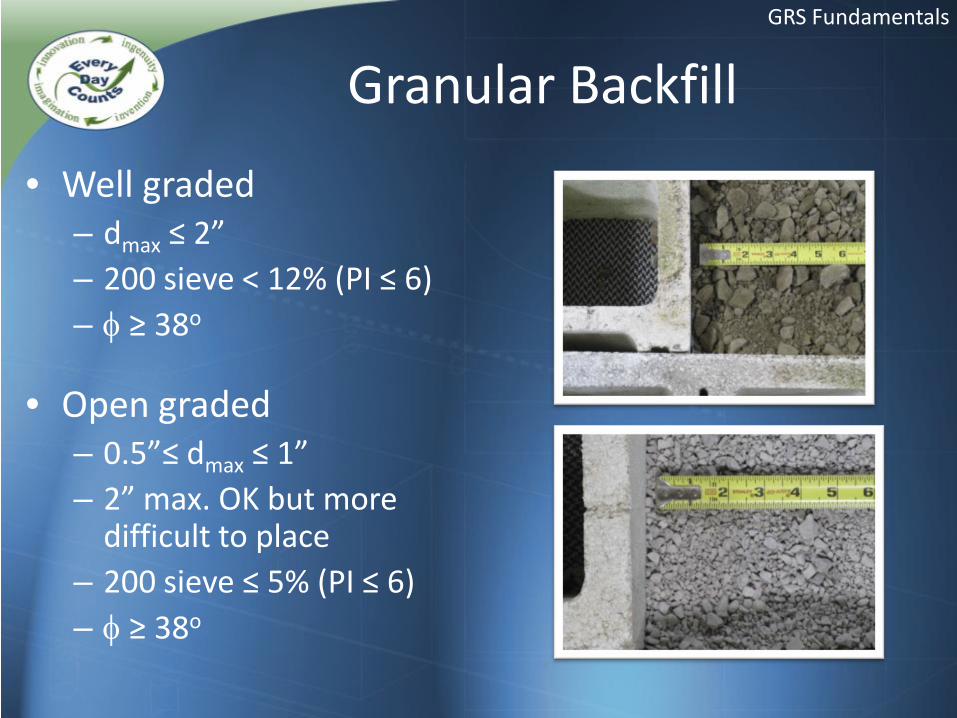
Granular Backfill
• Well graded – dmax ≤ 2” – 200 sieve < 12% (PI ≤ 6) – φ ≥ 38o
• Open graded – 0.5”≤ dmax ≤ 1” – 2” max. OK but more
difficult to place – 200 sieve ≤ 5% (PI ≤ 6) – φ ≥ 38o
GRS Fundamentals
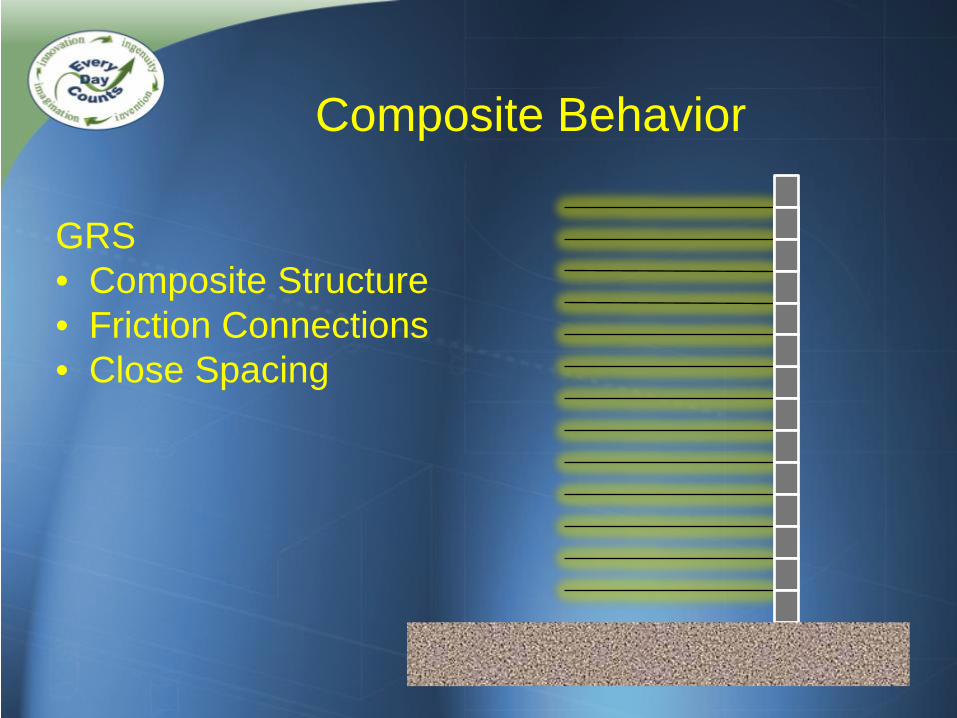
GRS • Composite Structure • Friction Connections • Close Spacing
Composite Behavior
PERFORMANCE Testing and Monitoring
Performance Tests
• Also known as “Mini-Pier” experiments • Provides material strength properties of a
particular GRS composite • Procedure involves axially loading the GRS
mass to measure lateral and vertical deformation
GRS Fundamentals
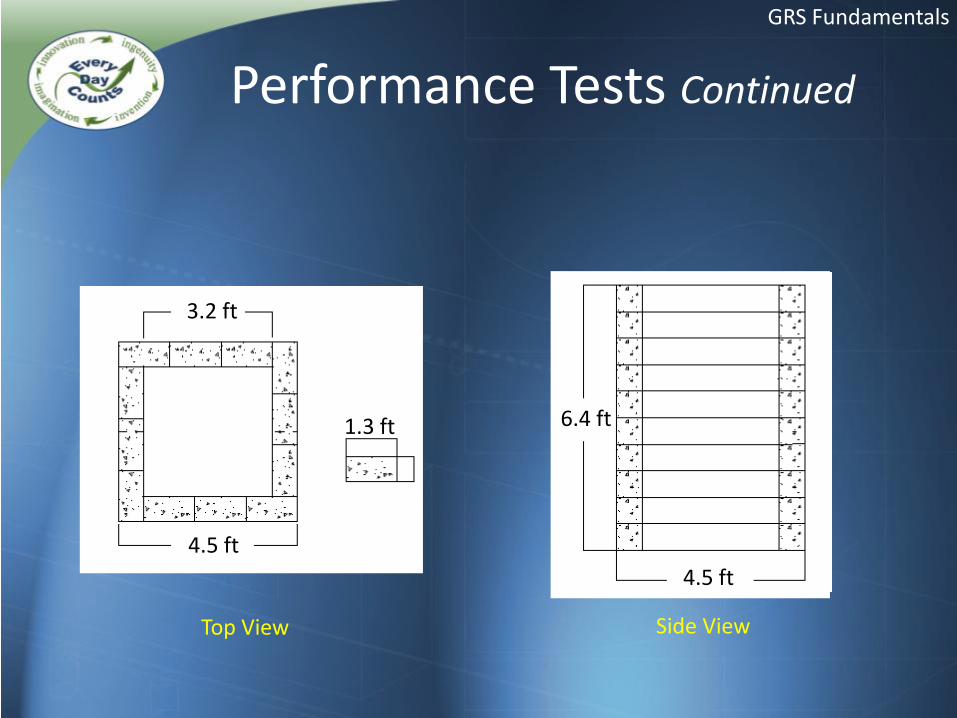
Performance Tests Continued
4.5 ft
3.2 ft
1.3 ft
4.5 ft
6.4 ft
Top View Side View
GRS Fundamentals
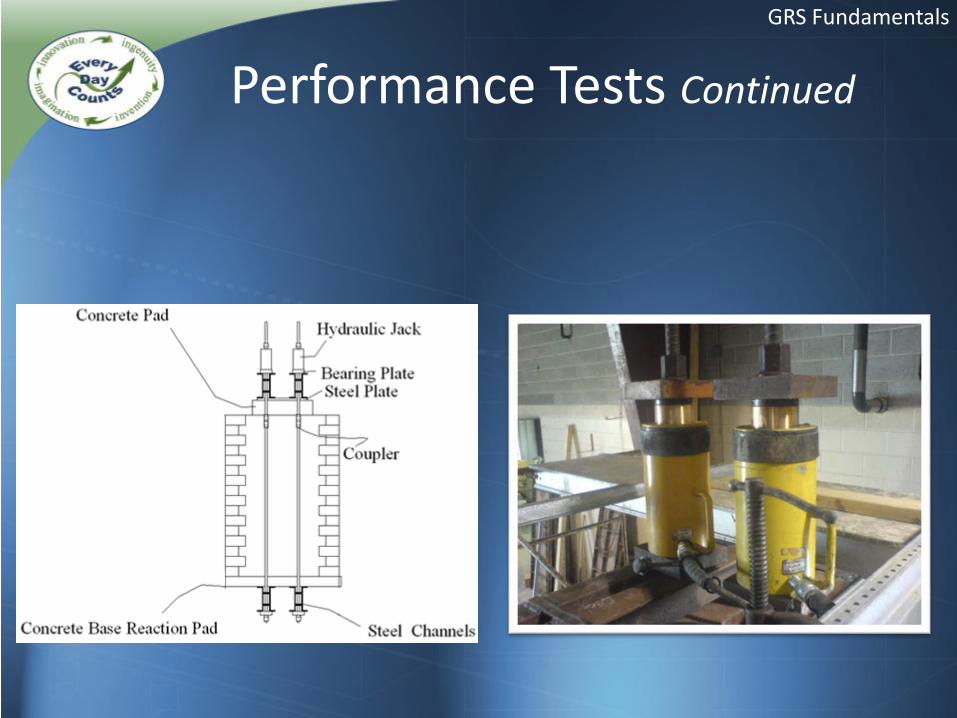
Performance Tests Continued
GRS Fundamentals
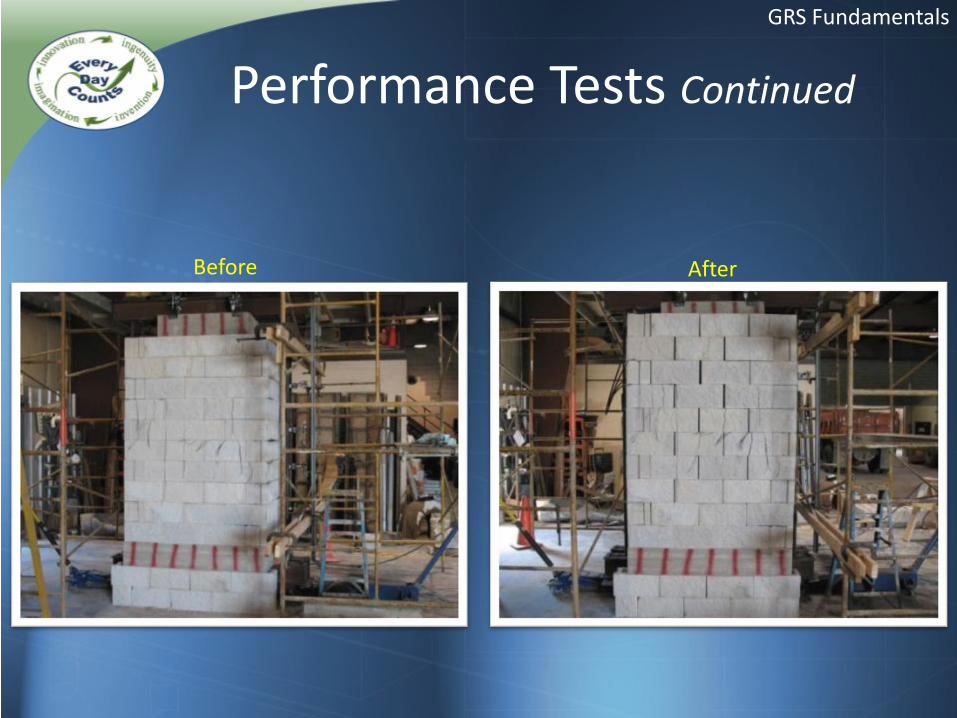
Performance Tests Continued
Before After
GRS Fundamentals
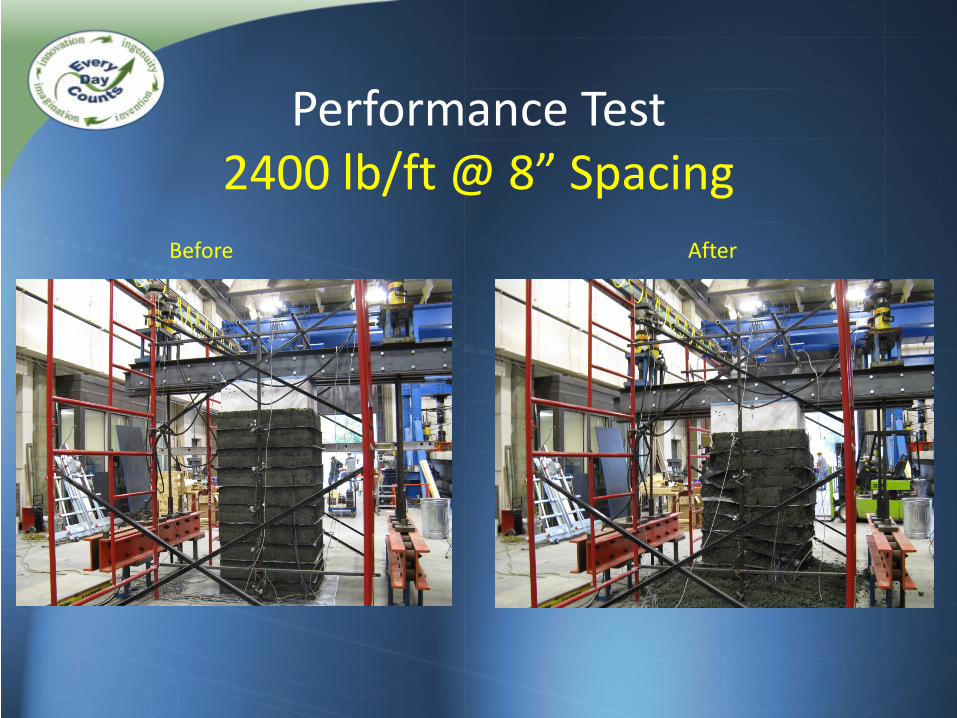
Performance Test 2400 lb/ft @ 8” Spacing
Before After
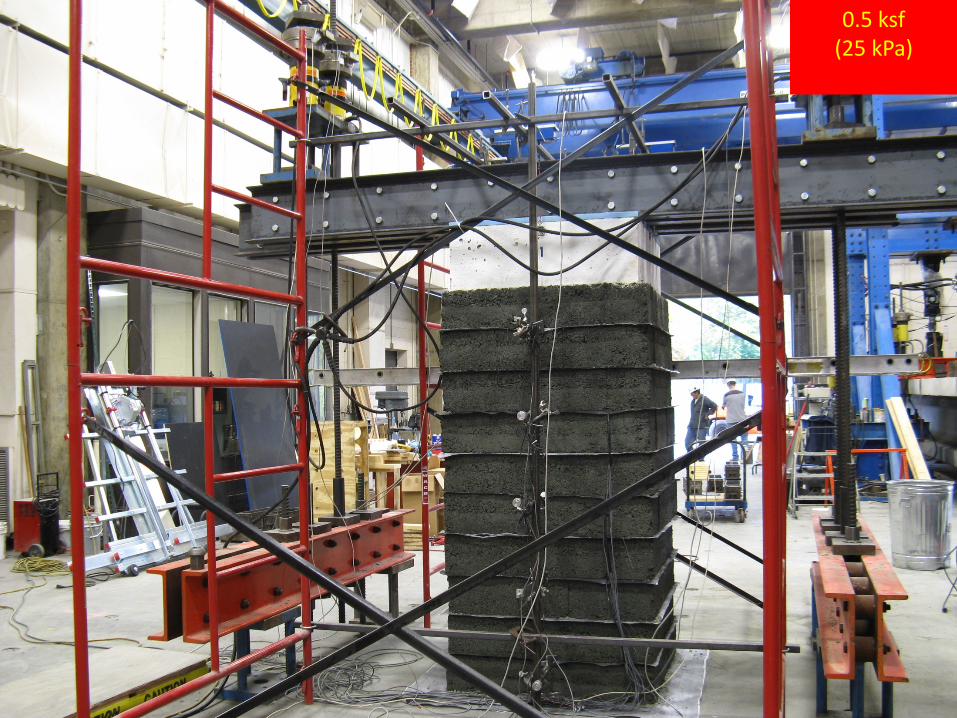
0.5 ksf (25 kPa)
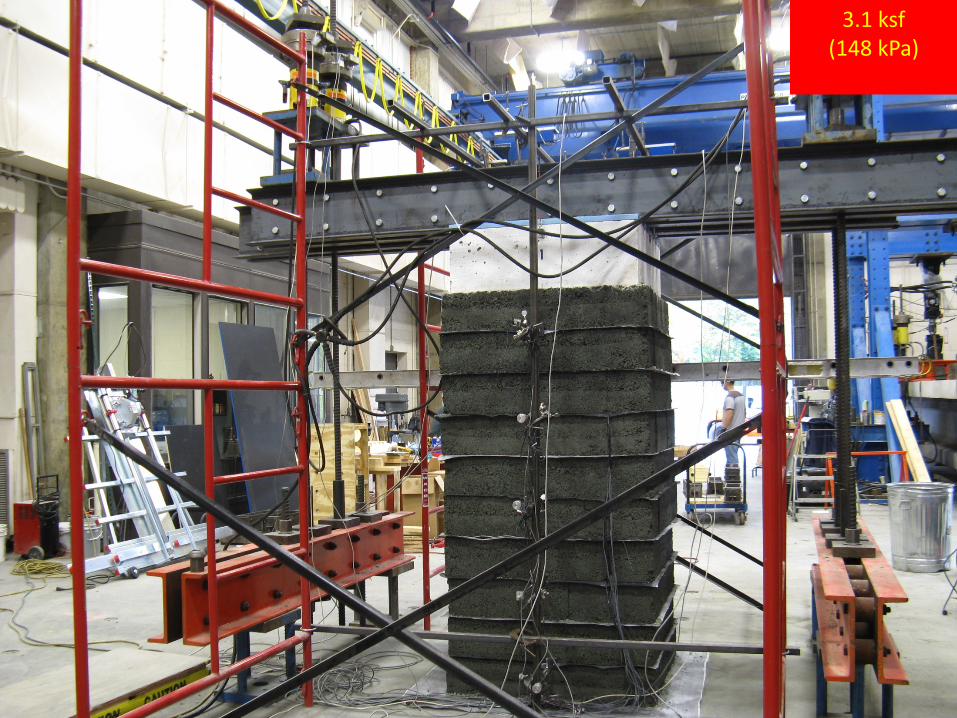
3.1 ksf (148 kPa)
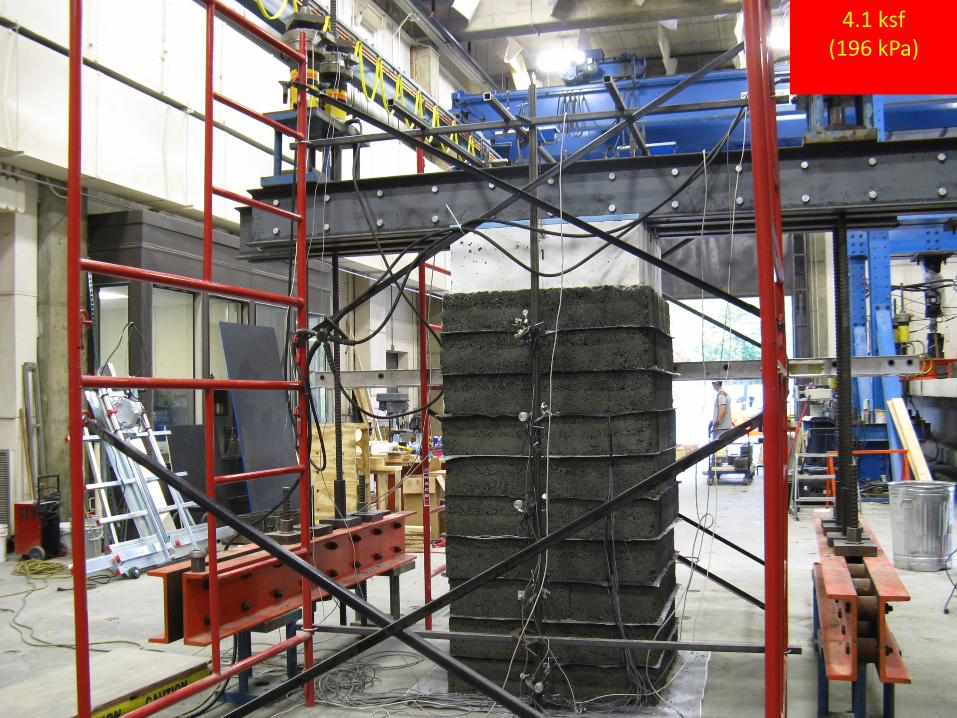
4.1 ksf (196 kPa)

4.9 ksf (235 kPa)

5.9 ksf (282 kPa)
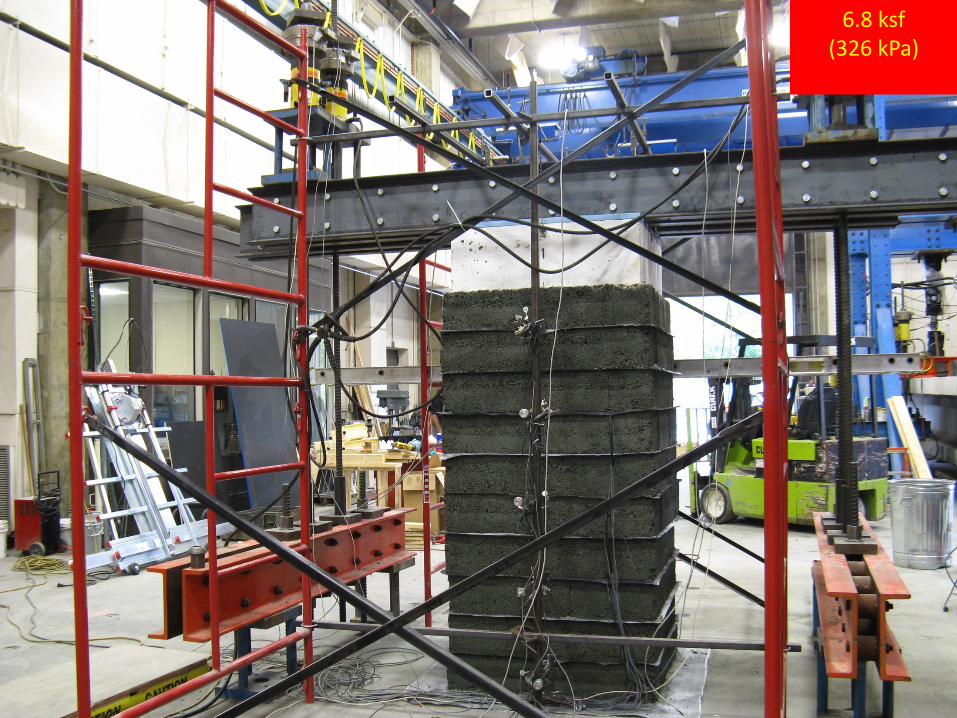
6.8 ksf (326 kPa)
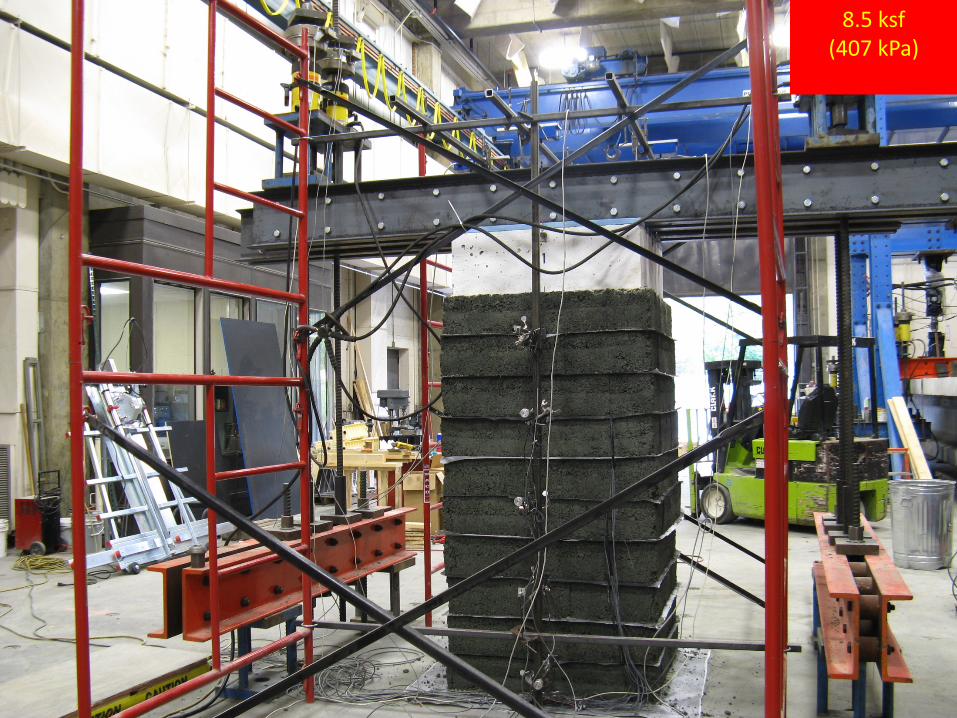
8.5 ksf (407 kPa)
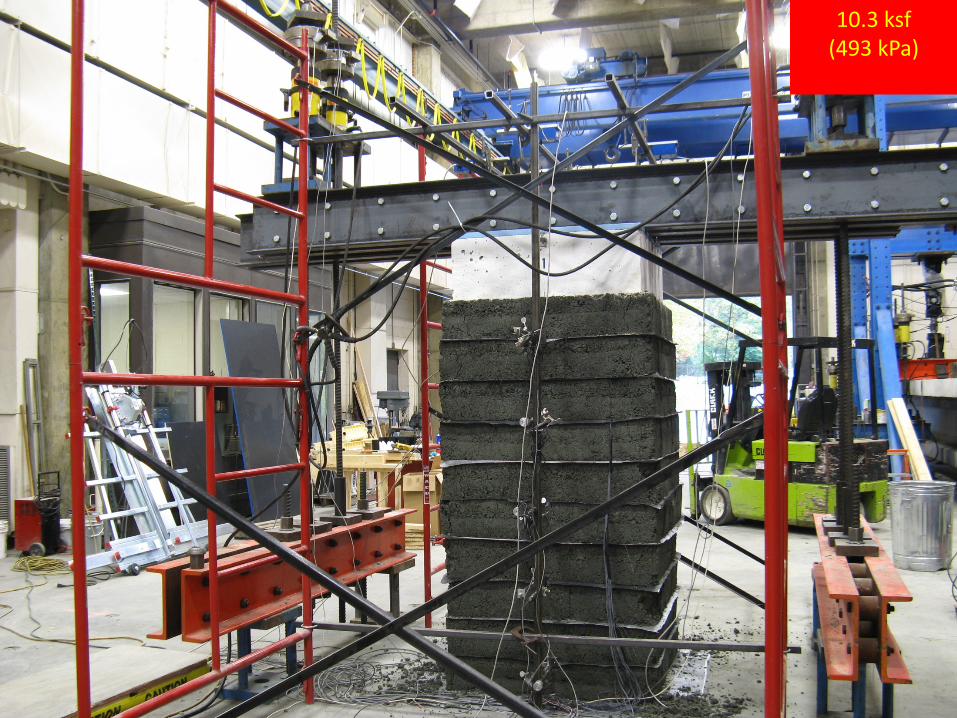
10.3 ksf (493 kPa)
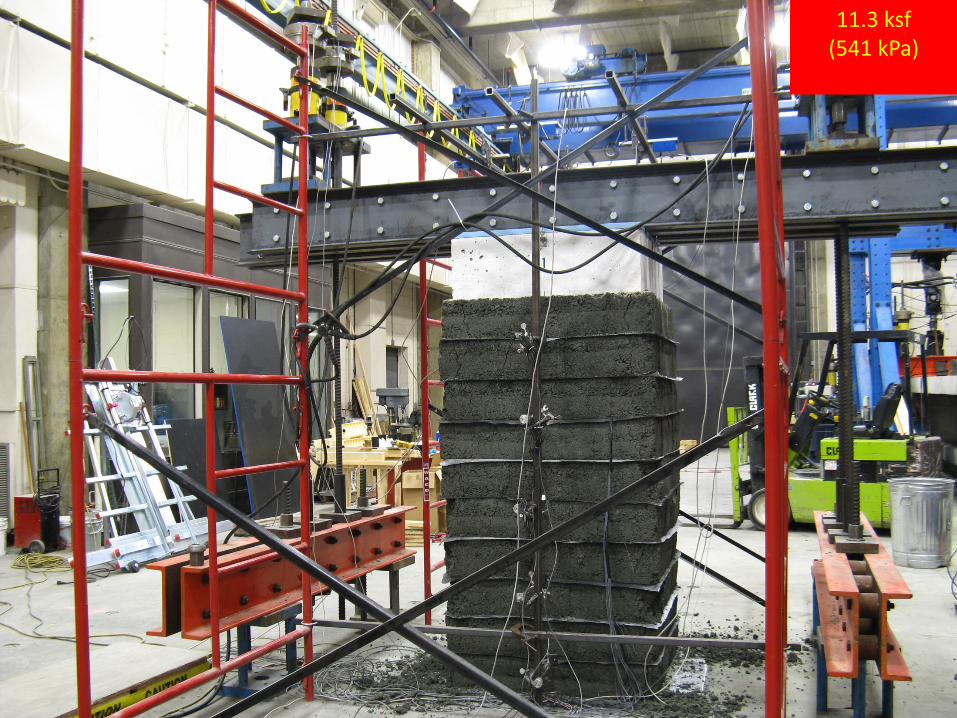
11.3 ksf (541 kPa)
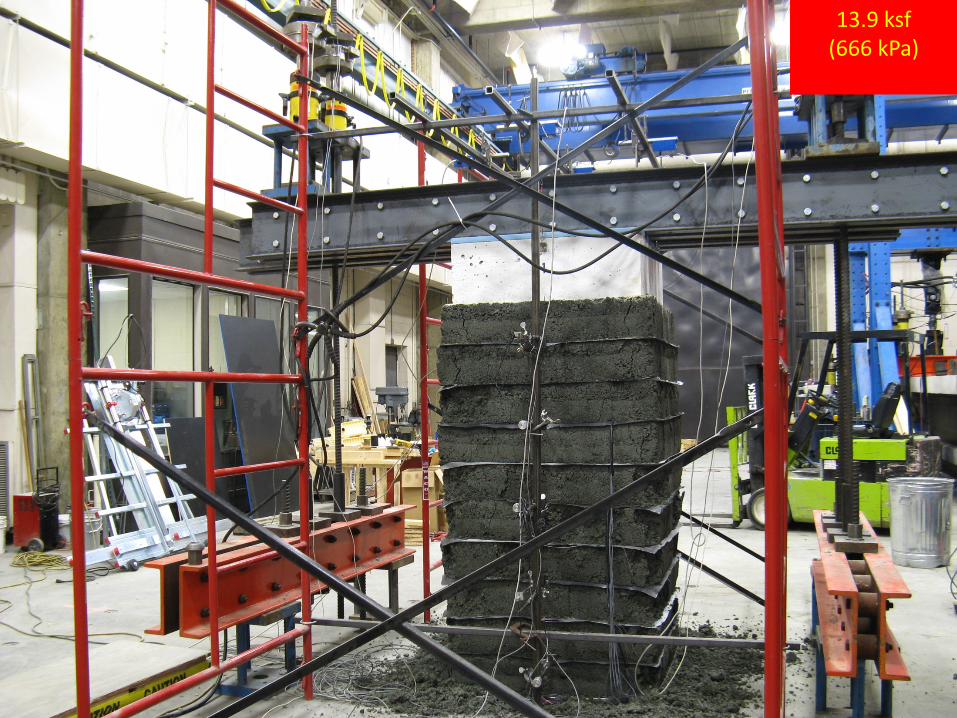
13.9 ksf (666 kPa)
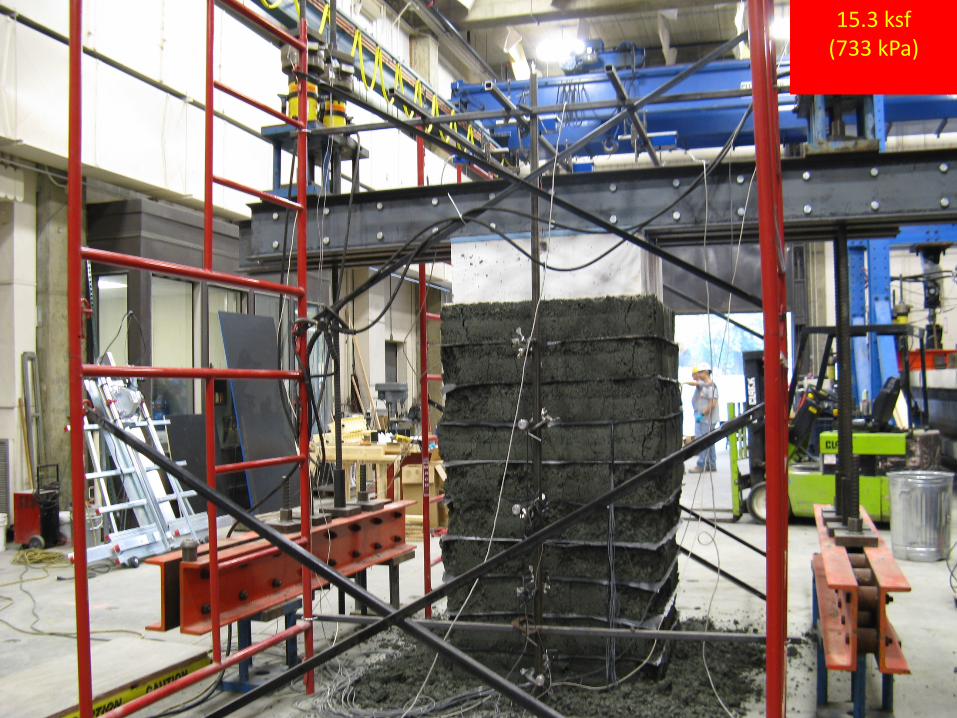
15.3 ksf (733 kPa)
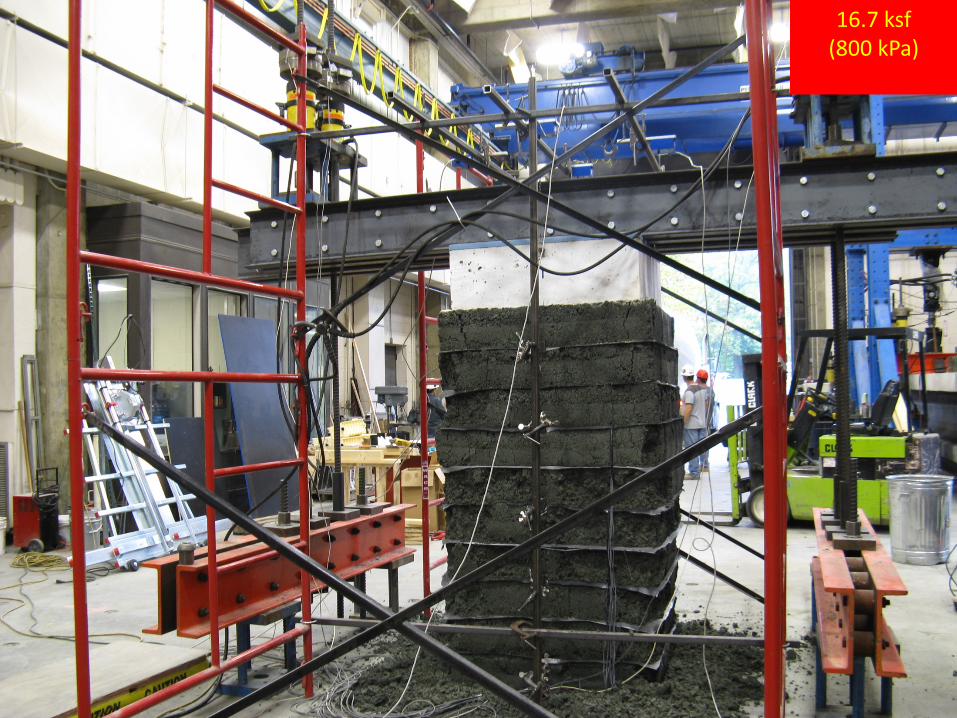
16.7 ksf (800 kPa)
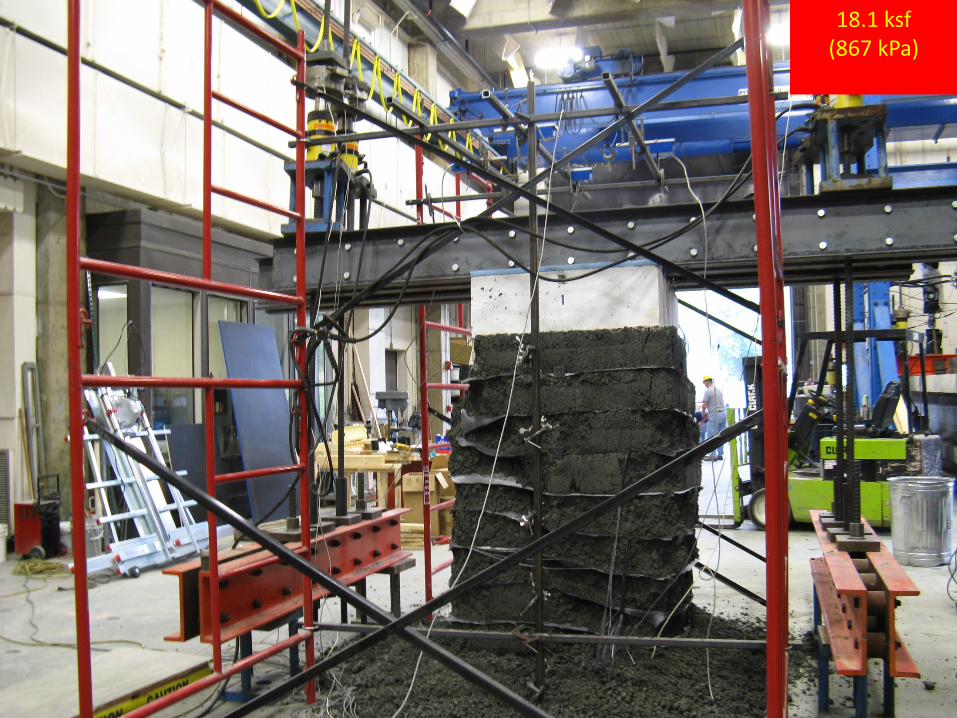
18.1 ksf (867 kPa)
0
2
4
6
8
10
12
14
16
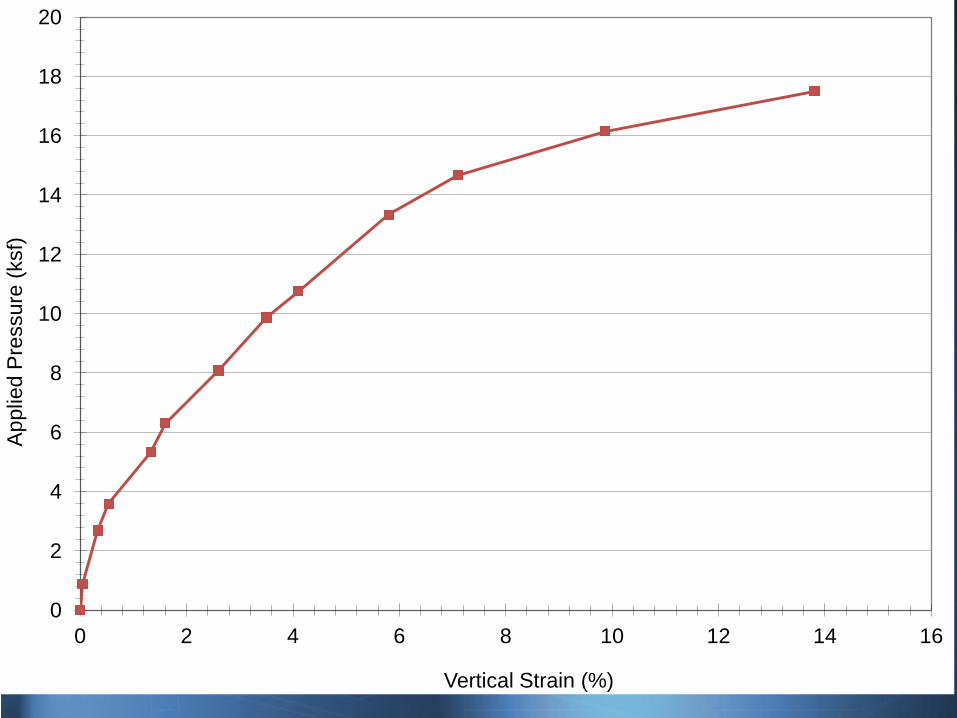
18
20
0 2 4 6 8 10 12 14 16
App
lied
Pre
ssur
e (k
sf)
Vertical Strain (%)
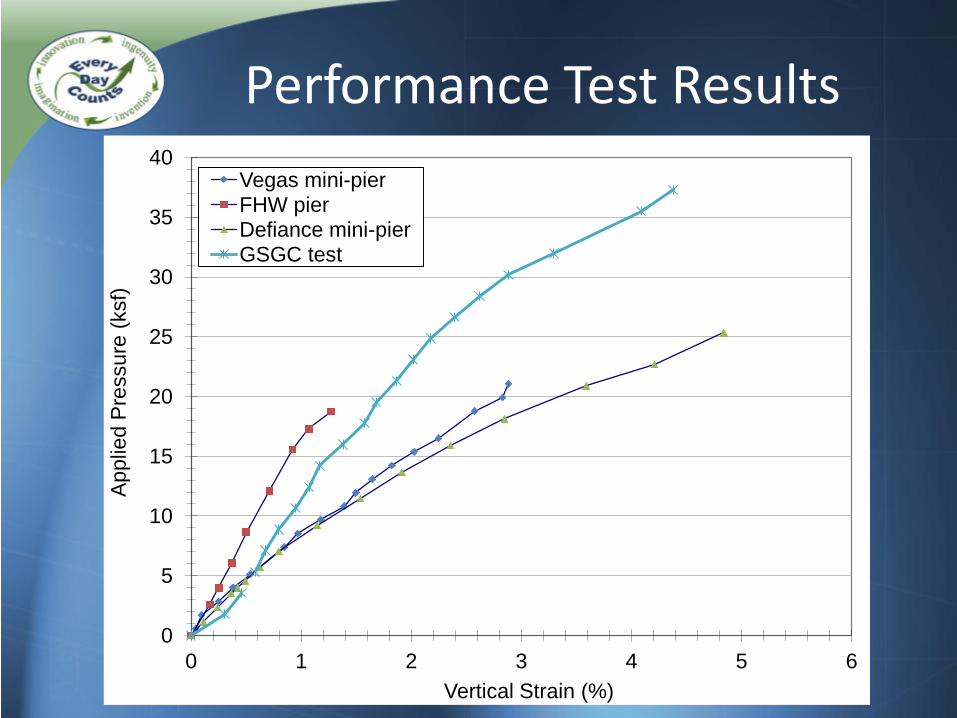
Performance Test Results
0
5
10
15
20
25
30
35
40
0 1 2 3 4 5 6
App
lied
Pre
ssur
e (k
sf)
Vertical Strain (%)
Vegas mini-pier FHW pier Defiance mini-pier GSGC test
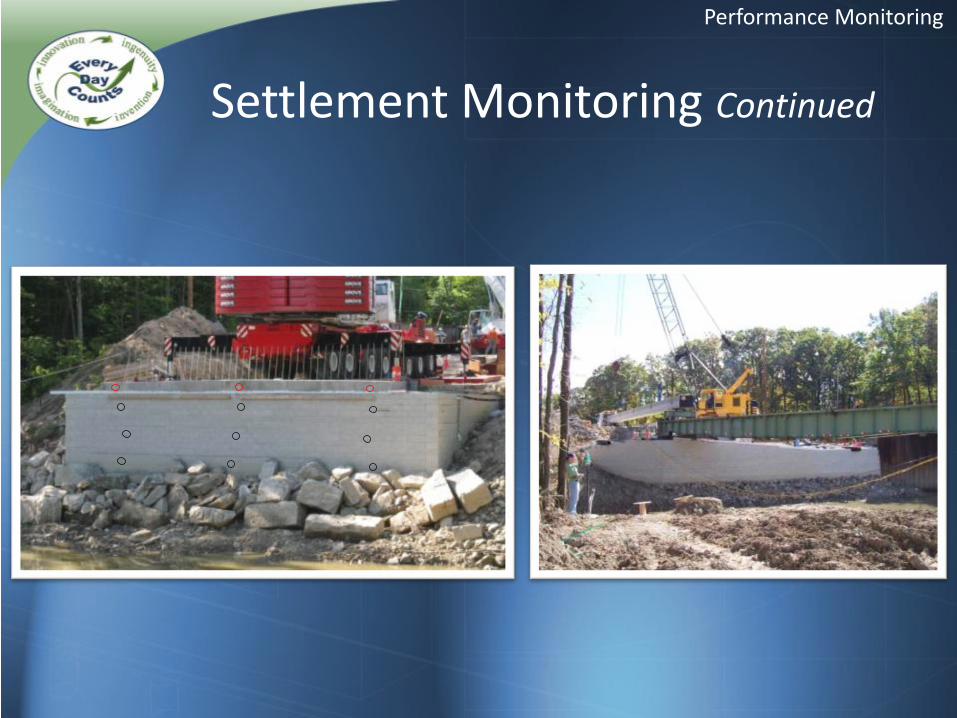
Settlement Monitoring Continued
Performance Monitoring
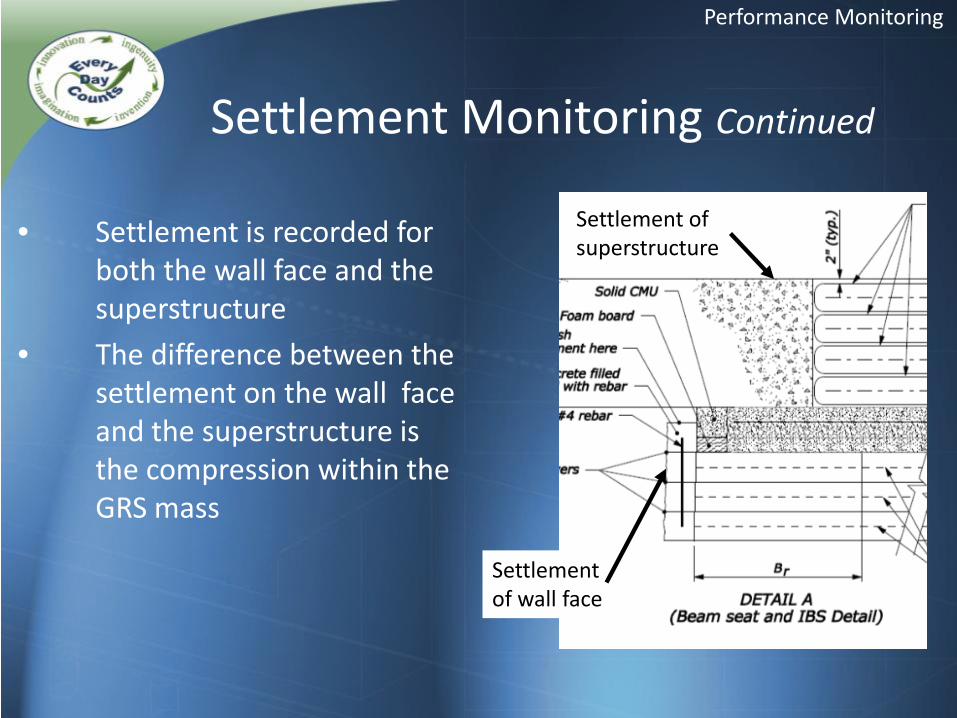
Settlement Monitoring Continued
• Settlement is recorded for both the wall face and the superstructure
• The difference between the settlement on the wall face and the superstructure is the compression within the GRS mass
Performance Monitoring
Settlement of superstructure
Settlement of wall face
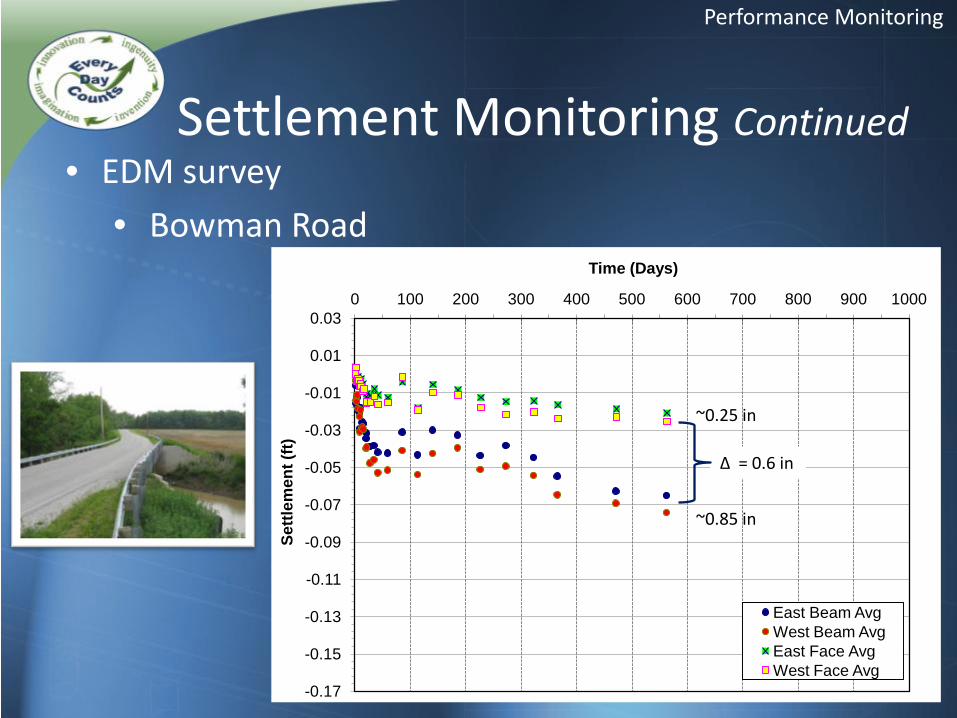
Settlement Monitoring Continued
-0.17
-0.15
-0.13
-0.11
-0.09
-0.07
-0.05
-0.03
-0.01
0.01
0.03 0 100 200 300 400 500 600 700 800 900 1000
Settl
emen
t (ft)
Time (Days)
East Beam Avg West Beam Avg East Face Avg West Face Avg
Δ = 0.6 in
• EDM survey • Bowman Road
Performance Monitoring
~0.85 in
~0.25 in
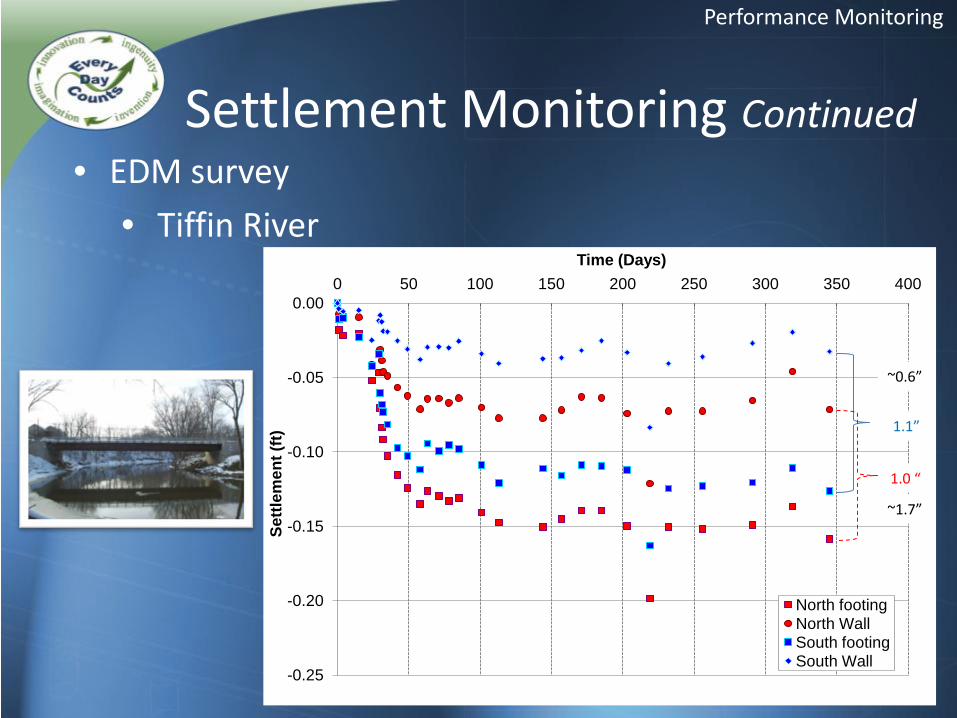
Settlement Monitoring Continued
-0.25
-0.20
-0.15
-0.10
-0.05
0.00 0 50 100 150 200 250 300 350 400
Settl
emen
t (ft)
Time (Days)
North footing North Wall South footing South Wall
1.0 “
1.1”
• EDM survey
• Tiffin River
Performance Monitoring
~0.6”
~1.7”
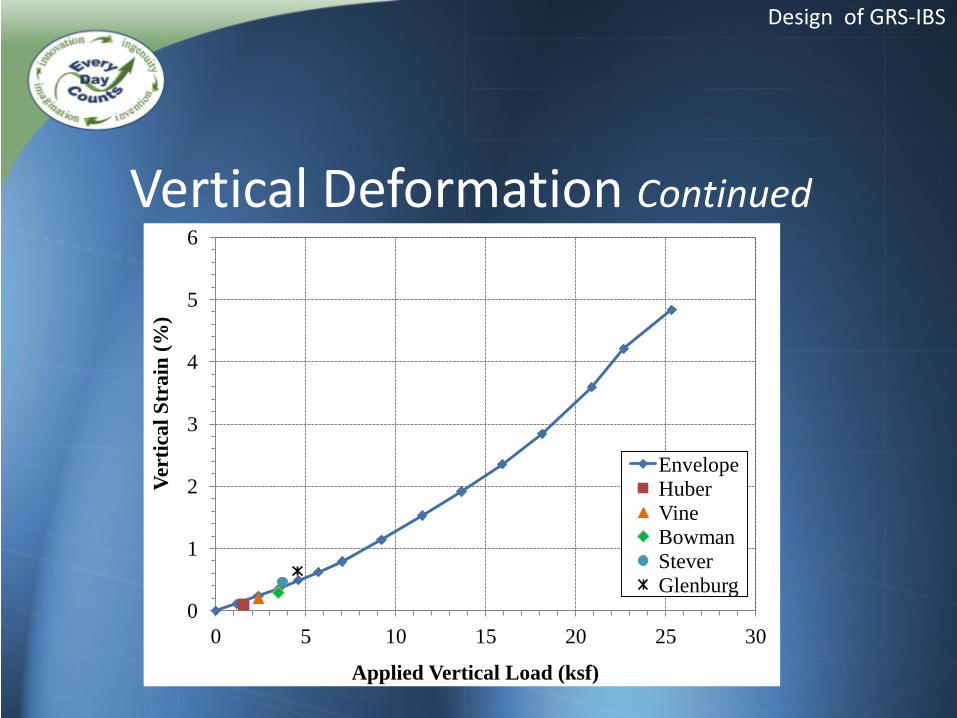
Vertical Deformation Continued
0
1
2
3
4
5
6
0 5 10 15 20 25 30
Vert
ical
Str
ain
(%)
Applied Vertical Load (ksf)
Envelope Huber Vine Bowman Stever Glenburg
Design of GRS-IBS
Lateral Deformation
• Estimated – Theoretically assuming no loss in volume
• Measured – Not frequently measured on bridges – Can use EDM, Slope inclinometer, etc.
• Lateral strain limited to 1% (of bearing area + setback)
Performance Monitoring
Lateral Deformation Continued
Performance Monitoring
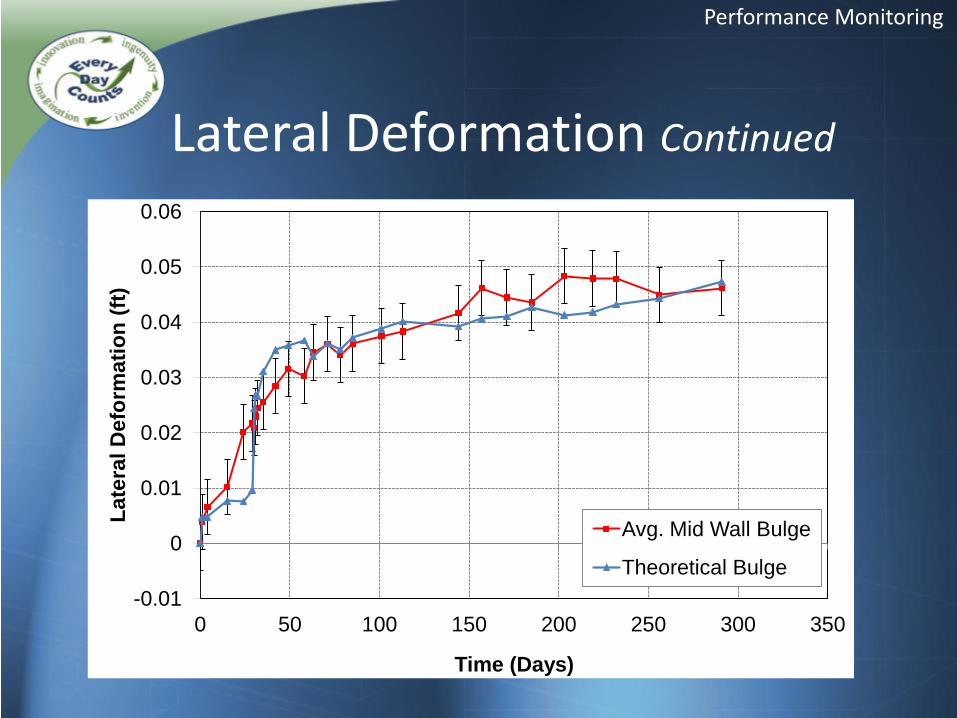
-0.01
0
0.01
0.02
0.03
0.04
0.05
0.06
0 50 100 150 200 250 300 350
Late
ral D
efor
mat
ion
(ft)
Time (Days)
Avg. Mid Wall Bulge
Theoretical Bulge
Lateral Deformation Continued
Performance Monitoring
Thermal Cycles
• Compatible with thermal cycles • Integrated transition behind the beam ends • The wrapped face of the integrated approach:
– Confines the soil – Prevents soil sloughing behind the beam ends – Limits development of excess pressures behind the
beams
Performance Monitoring
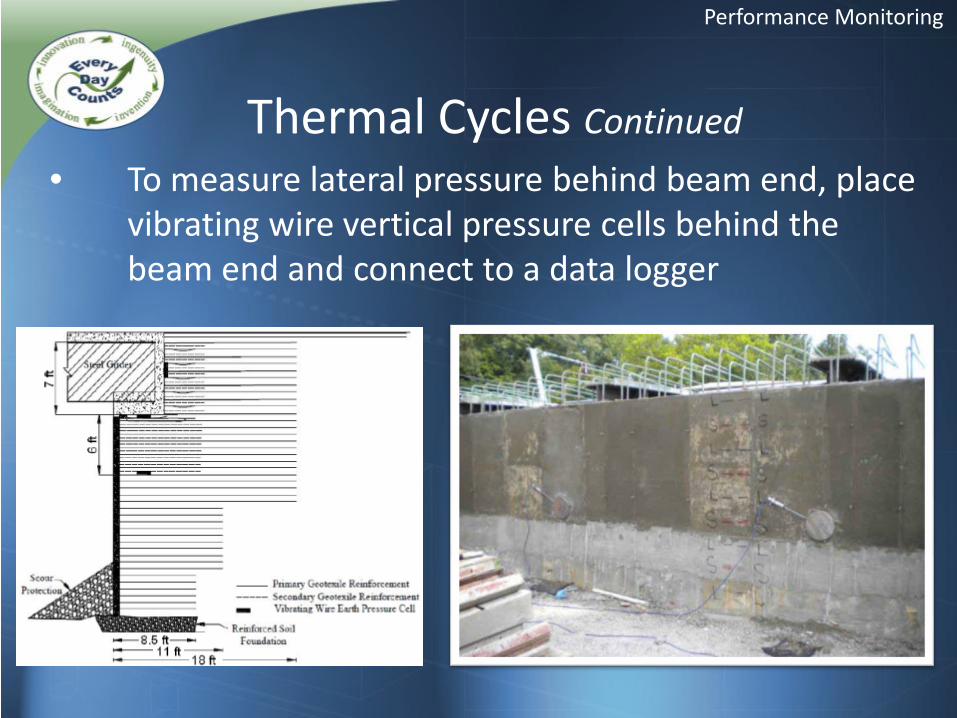
Thermal Cycles Continued • To measure lateral pressure behind beam end, place
vibrating wire vertical pressure cells behind the beam end and connect to a data logger
Performance Monitoring
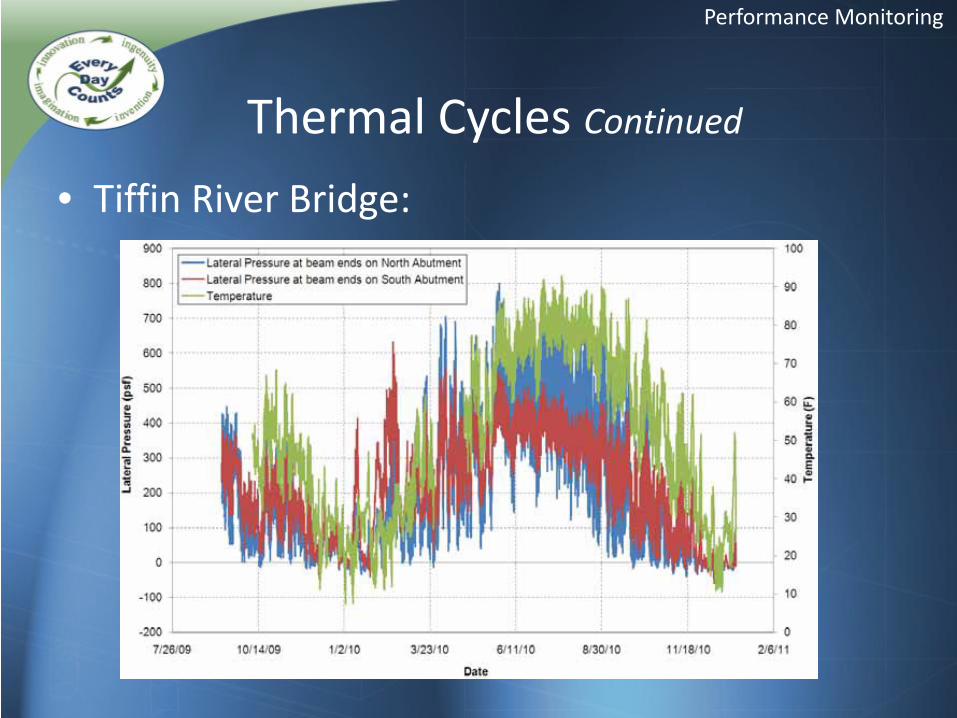
• Tiffin River Bridge:
Thermal Cycles Continued
Performance Monitoring
CONSTRUCTION OF GRS-IBS
Quality Assurance/Quality Control
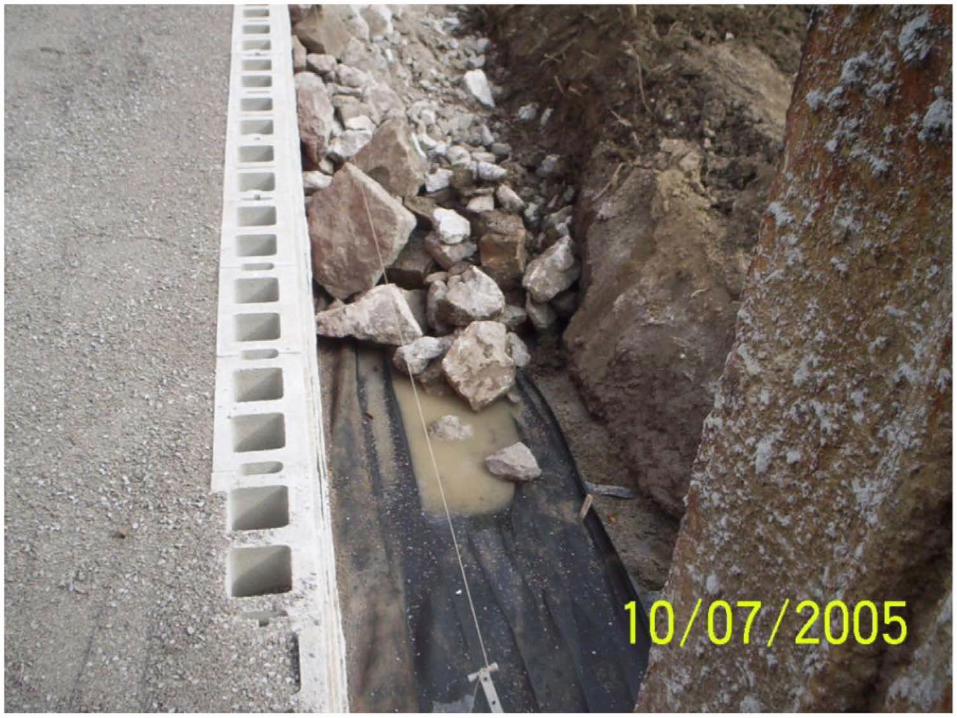
• Block alignment • Compaction • Reinforcement placement • Quality of construction materials • Scour protection • Drainage details
Construction of GRS-IBS
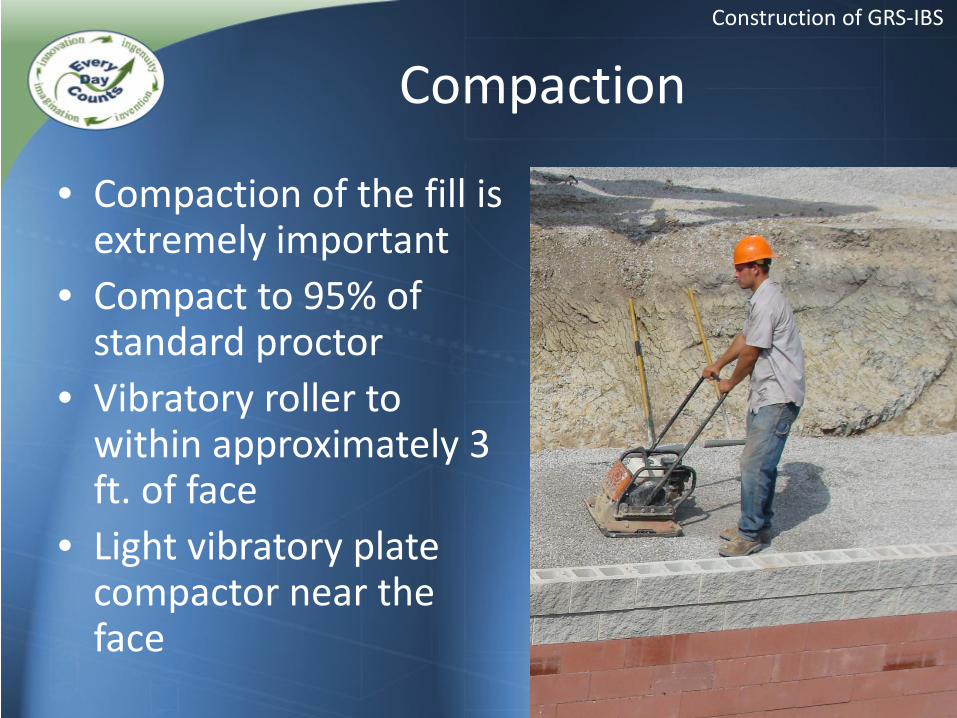
Compaction
• Compaction of the fill is extremely important
• Compact to 95% of standard proctor
• Vibratory roller to within approximately 3 ft. of face
• Light vibratory plate compactor near the face
Construction of GRS-IBS
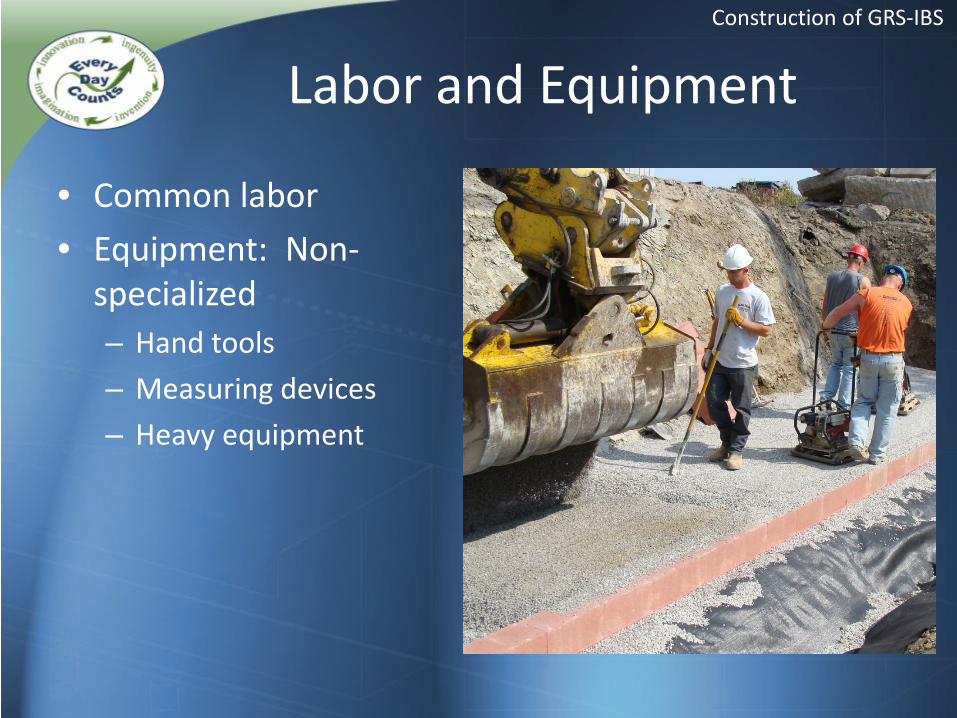
Labor and Equipment
• Common labor • Equipment: Non-
specialized – Hand tools – Measuring devices – Heavy equipment
Construction of GRS-IBS
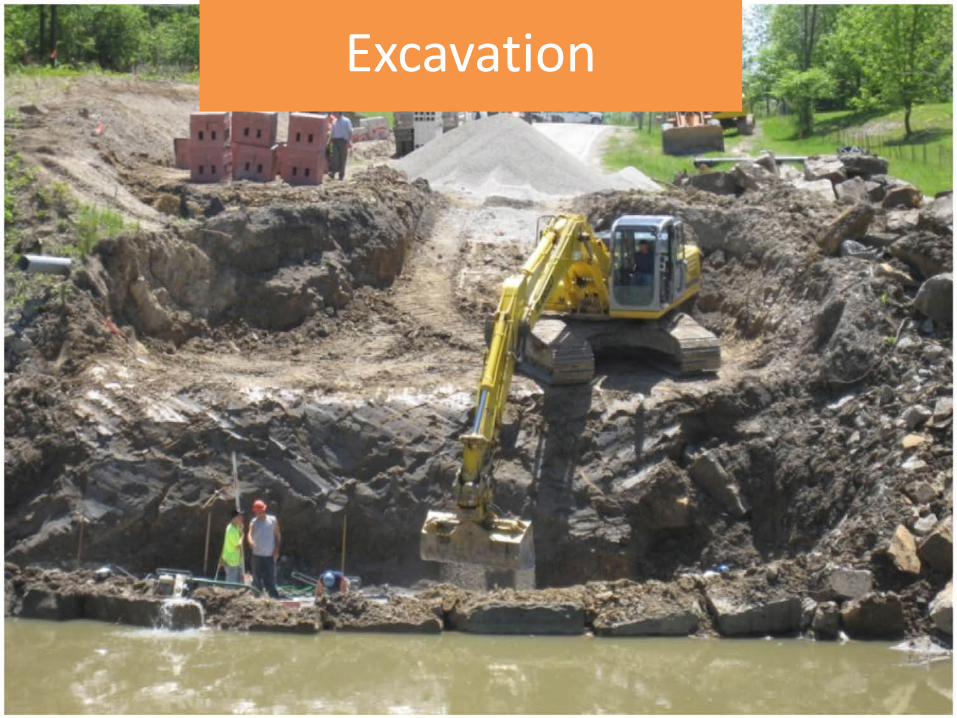
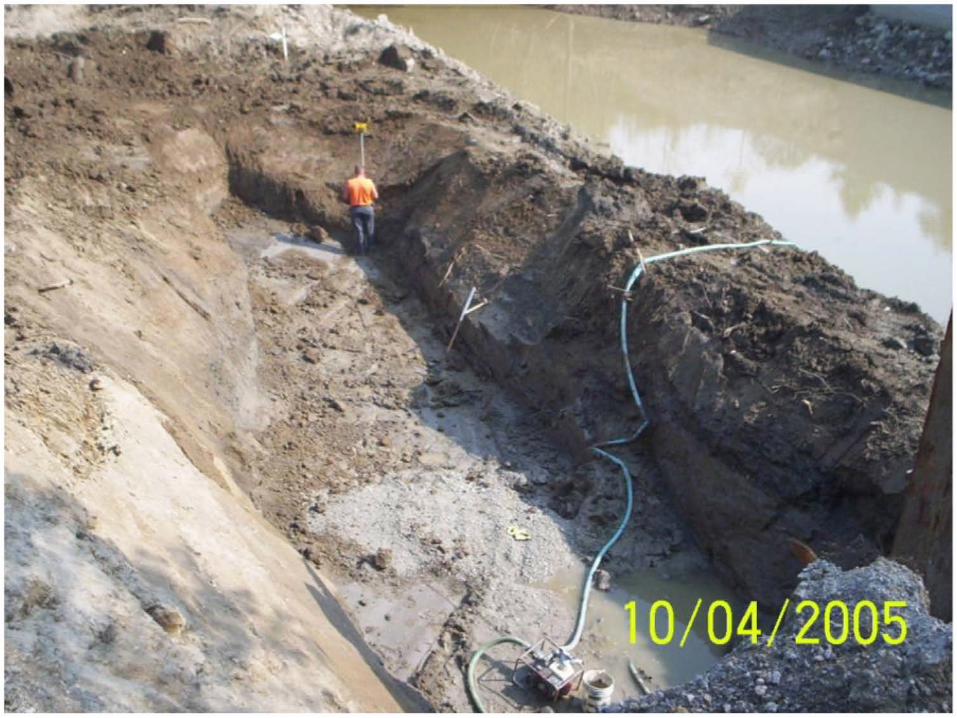
Excavation
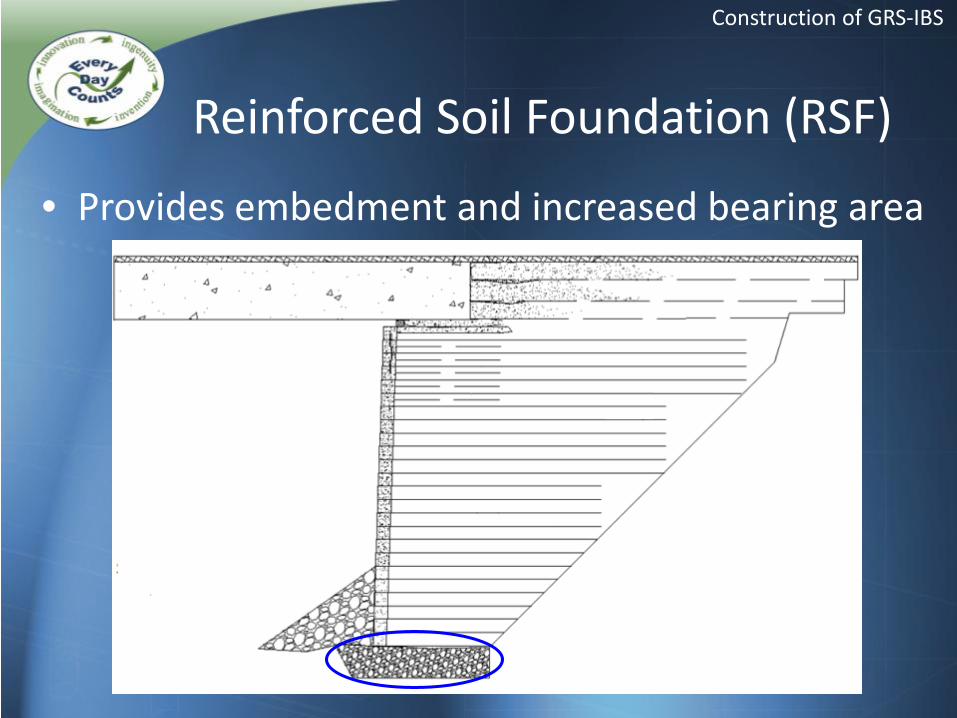
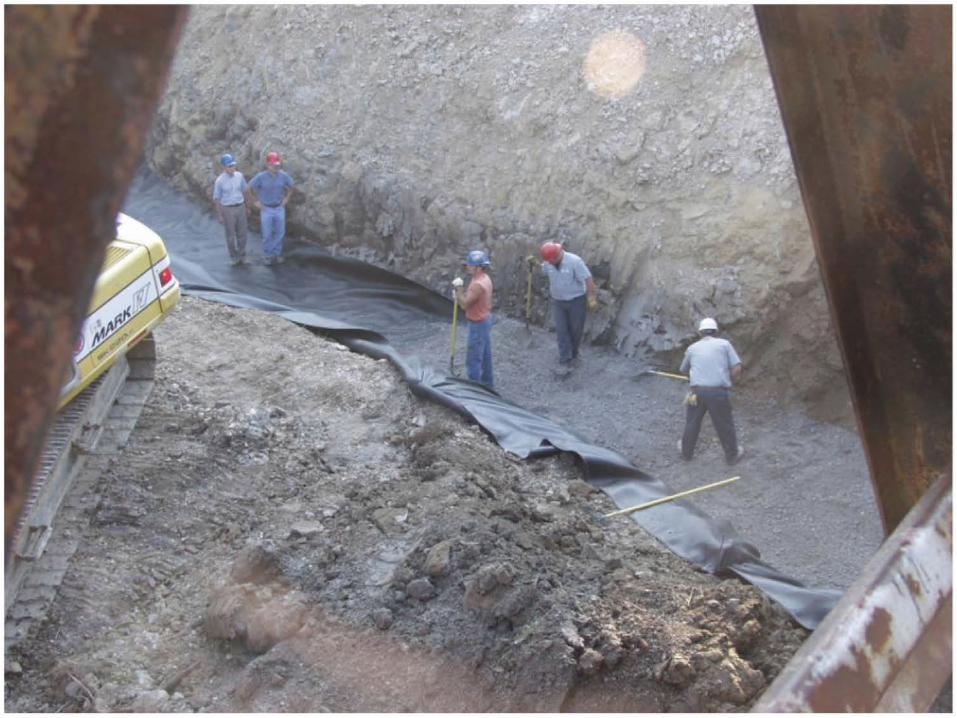
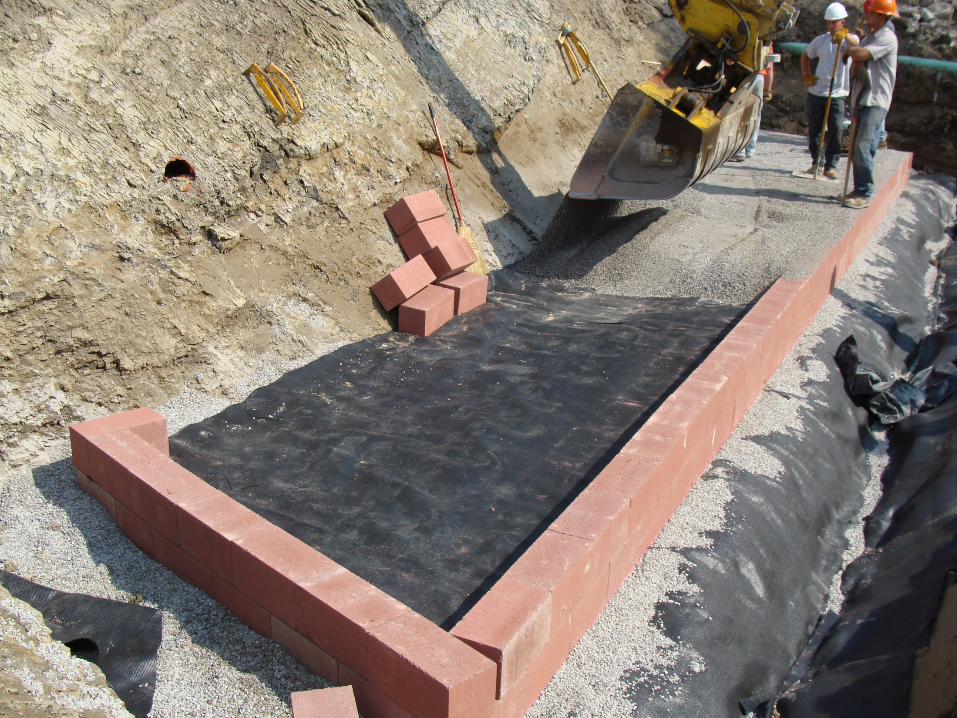
Reinforced Soil Foundation (RSF)
• Provides embedment and increased bearing area
Construction of GRS-IBS
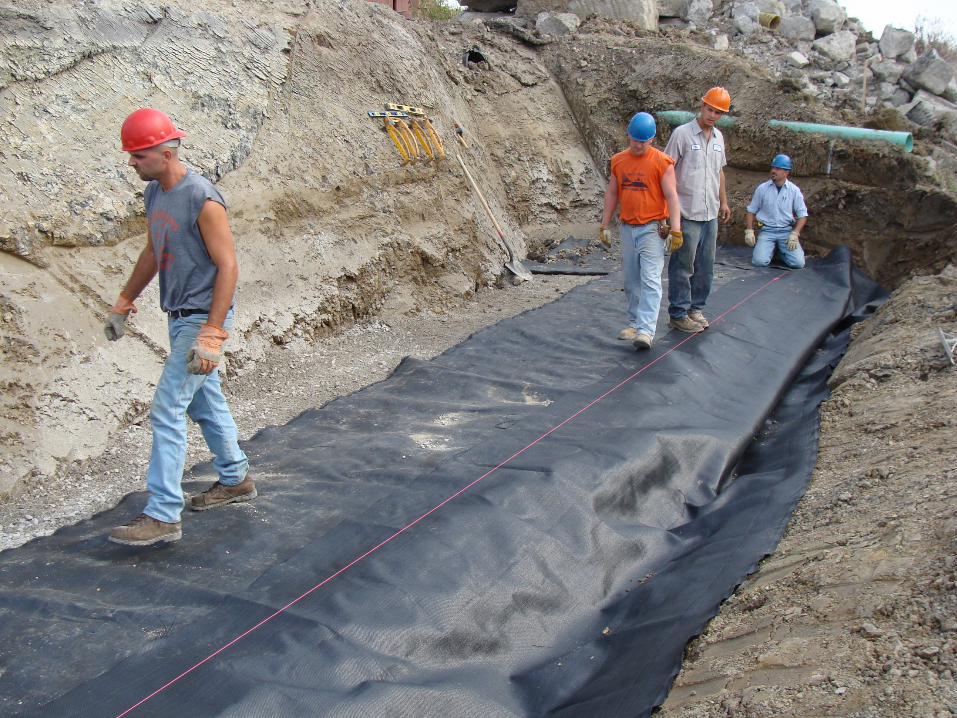
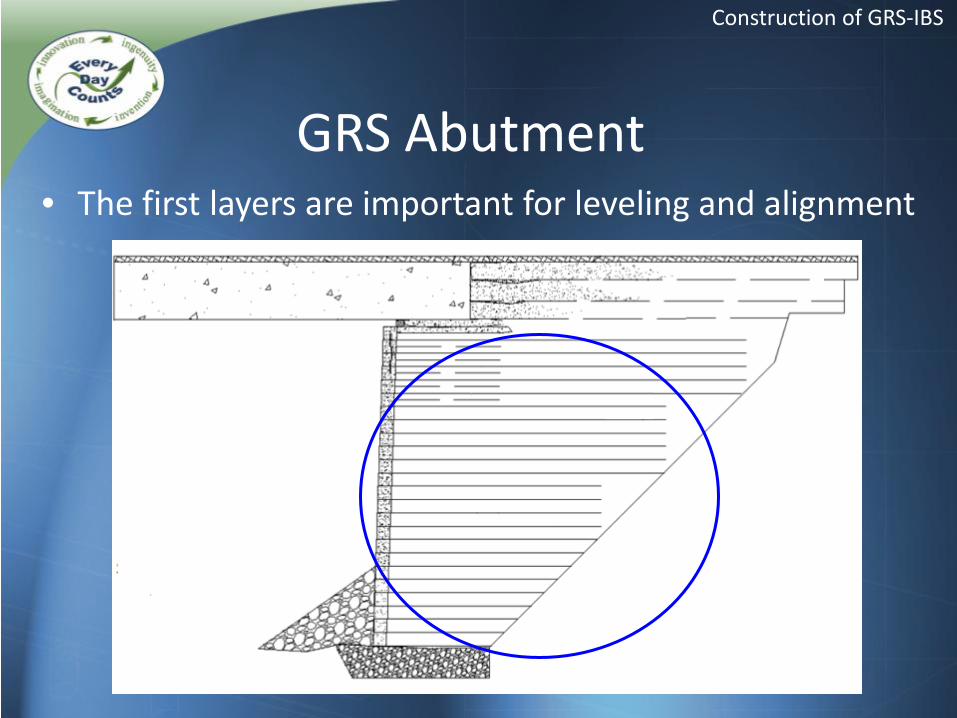
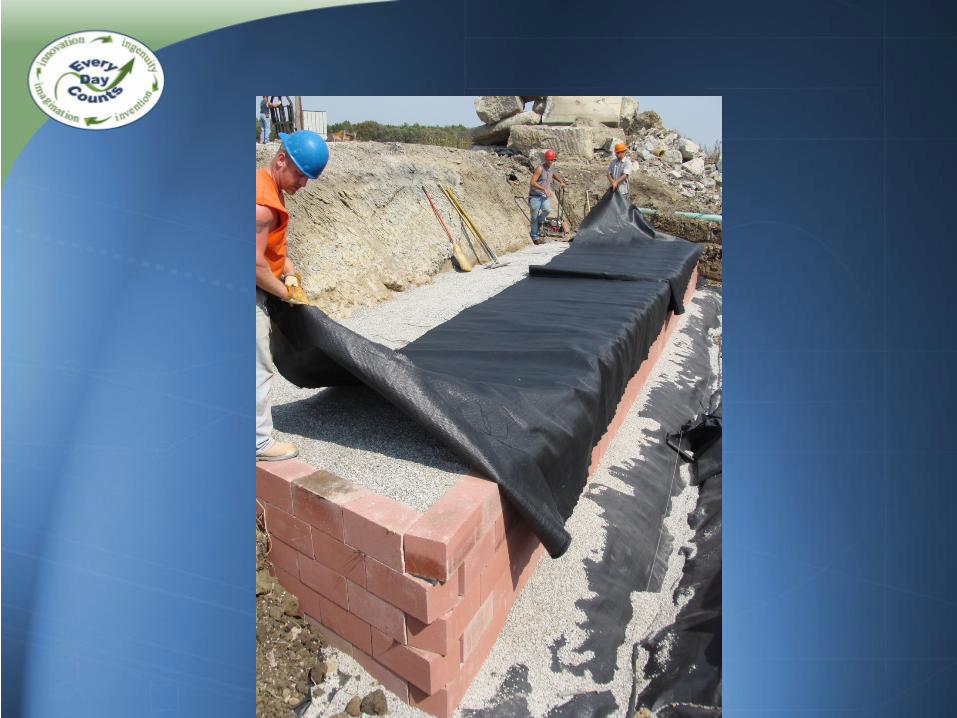
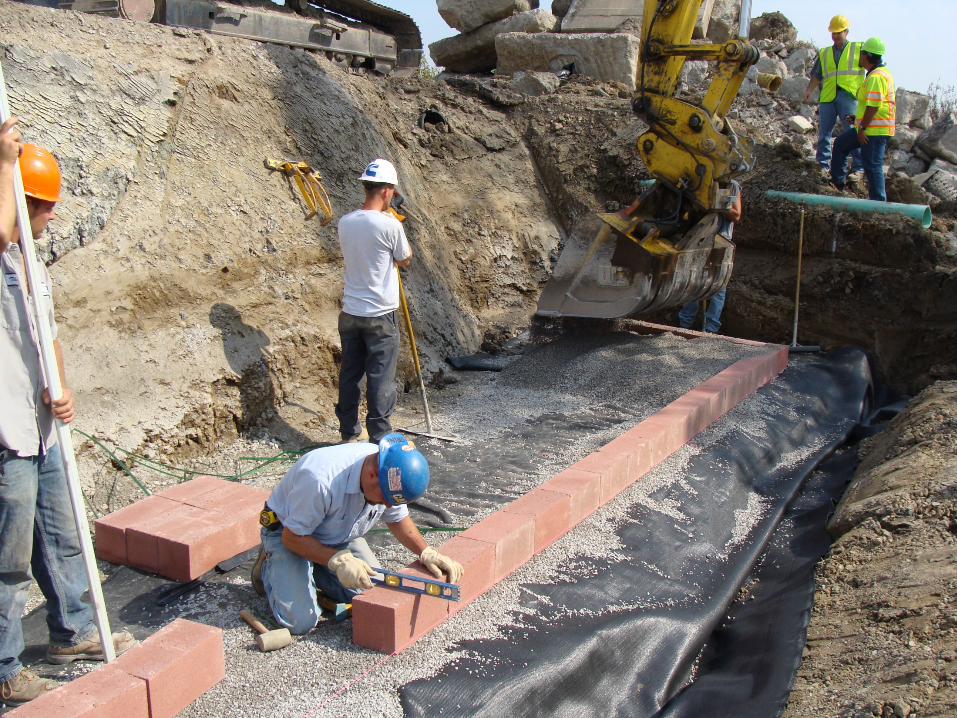
GRS Abutment • The first layers are important for leveling and alignment
Construction of GRS-IBS
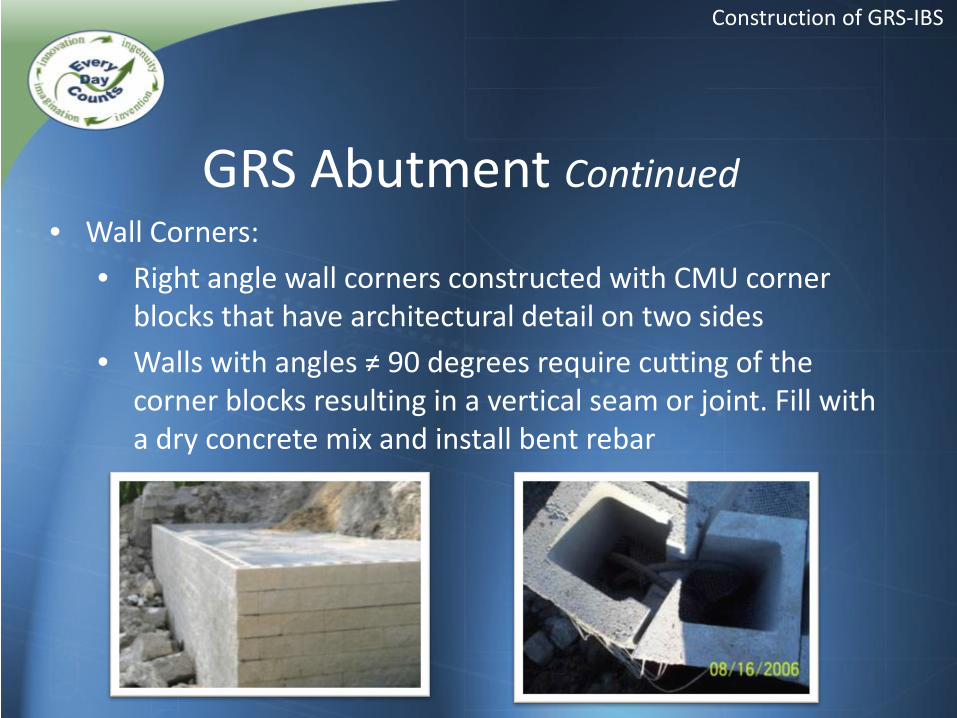
• Wall Corners: • Right angle wall corners constructed with CMU corner
blocks that have architectural detail on two sides • Walls with angles ≠ 90 degrees require cutting of the
corner blocks resulting in a vertical seam or joint. Fill with a dry concrete mix and install bent rebar
GRS Abutment Continued
Construction of GRS-IBS
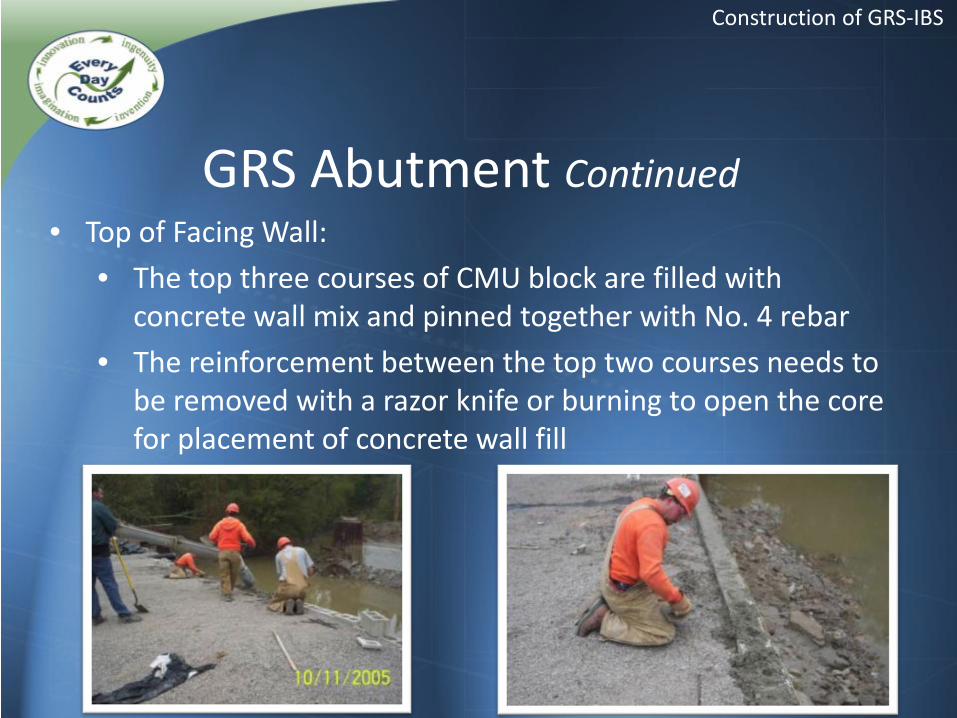
• Top of Facing Wall: • The top three courses of CMU block are filled with
concrete wall mix and pinned together with No. 4 rebar • The reinforcement between the top two courses needs to
be removed with a razor knife or burning to open the core for placement of concrete wall fill
GRS Abutment Continued
Construction of GRS-IBS
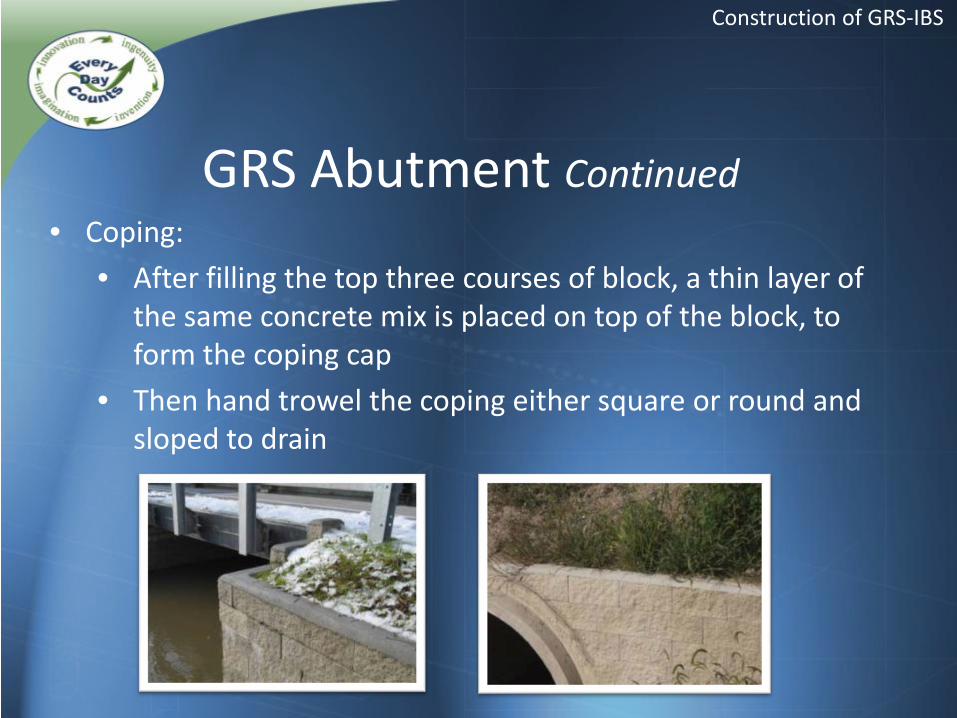
• Coping: • After filling the top three courses of block, a thin layer of
the same concrete mix is placed on top of the block, to form the coping cap
• Then hand trowel the coping either square or round and sloped to drain
GRS Abutment Continued
Construction of GRS-IBS
GRS Abutment Continued
Construction of GRS-IBS
Construction of GRS-IBS
GRS Abutment Continued
Construction of GRS-IBS
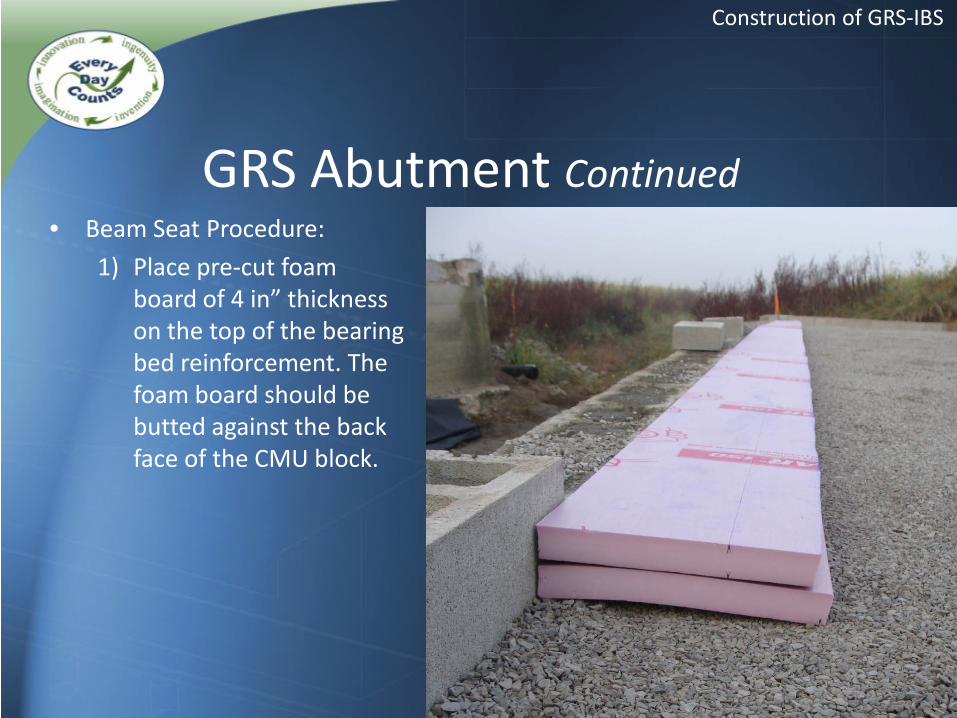
• Beam Seat Procedure: 1) Place pre-cut foam
board of 4 in” thickness on the top of the bearing bed reinforcement. The foam board should be butted against the back face of the CMU block.
GRS Abutment Continued
Construction of GRS-IBS
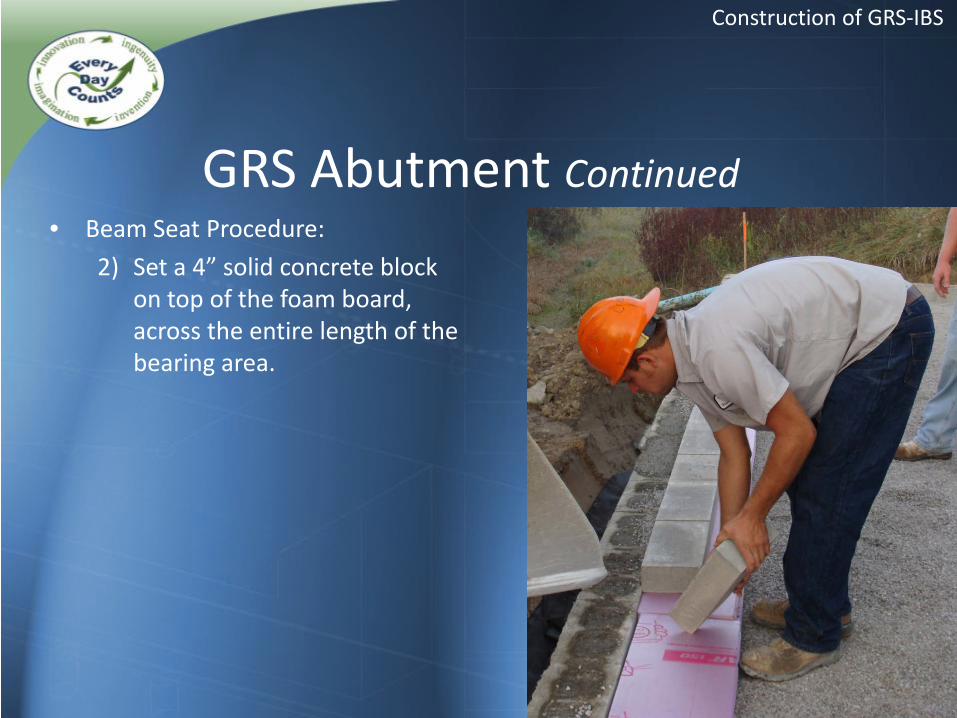
• Beam Seat Procedure: 2) Set a 4” solid concrete block
on top of the foam board, across the entire length of the bearing area.
GRS Abutment Continued
Construction of GRS-IBS
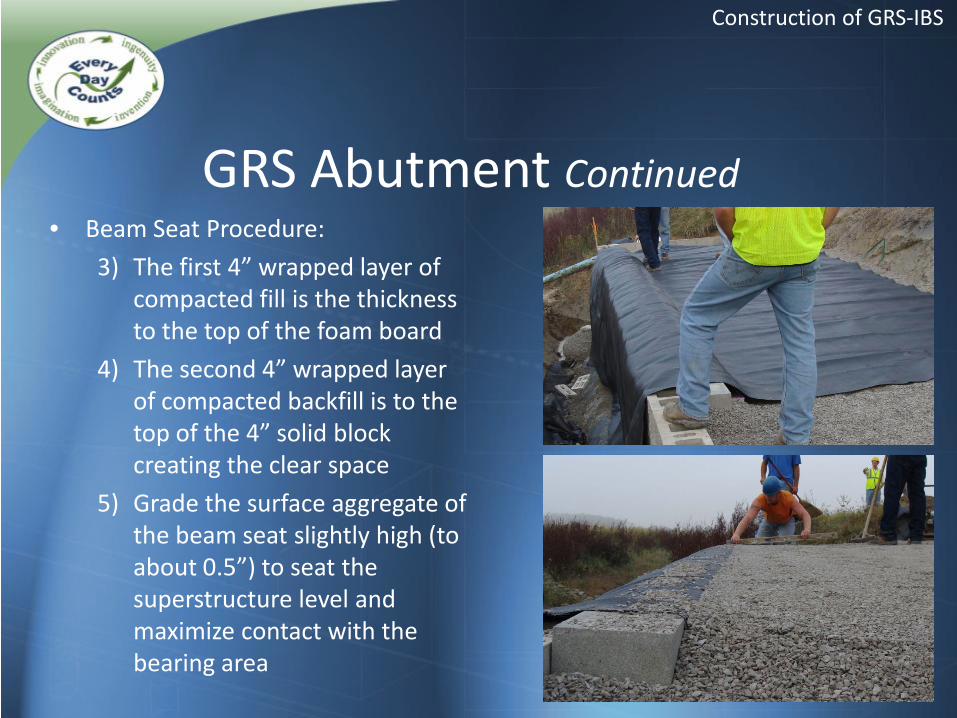
• Beam Seat Procedure: 3) The first 4” wrapped layer of
compacted fill is the thickness to the top of the foam board
4) The second 4” wrapped layer of compacted backfill is to the top of the 4” solid block creating the clear space
5) Grade the surface aggregate of the beam seat slightly high (to about 0.5”) to seat the superstructure level and maximize contact with the bearing area
GRS Abutment Continued
Construction of GRS-IBS
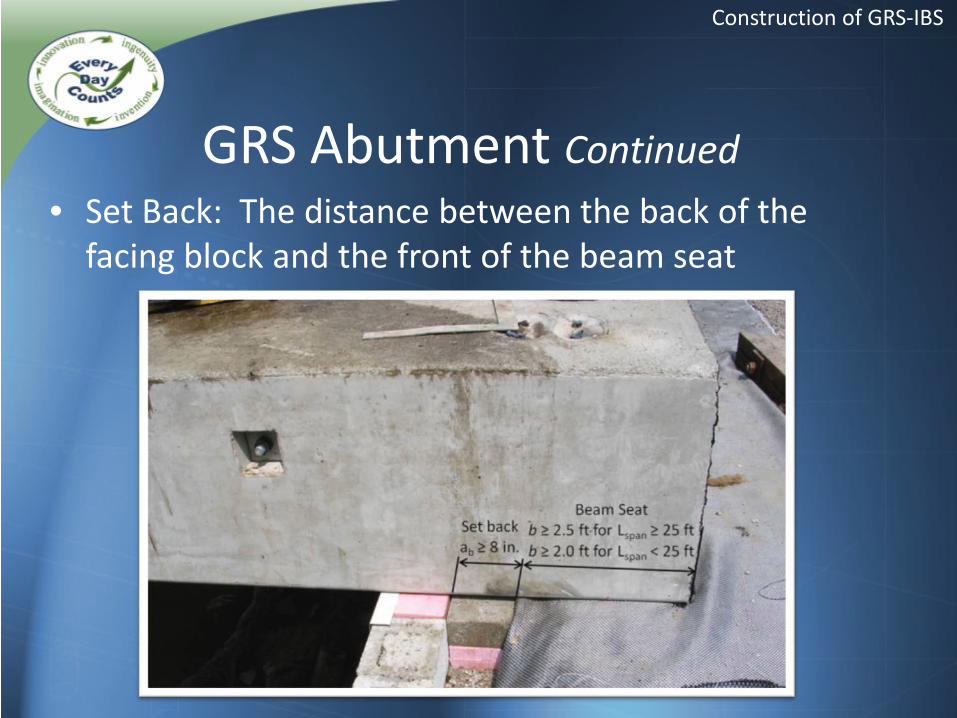
• Set Back: The distance between the back of the facing block and the front of the beam seat
GRS Abutment Continued
Construction of GRS-IBS
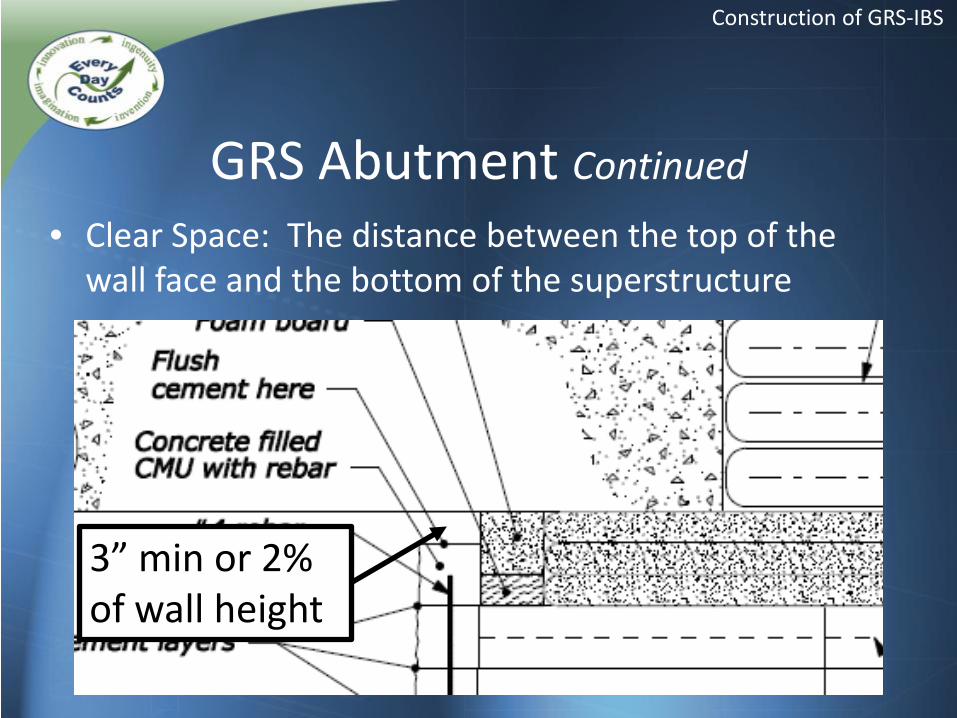
• Clear Space: The distance between the top of the wall face and the bottom of the superstructure
GRS Abutment Continued
Construction of GRS-IBS
3” min or 2% of wall height
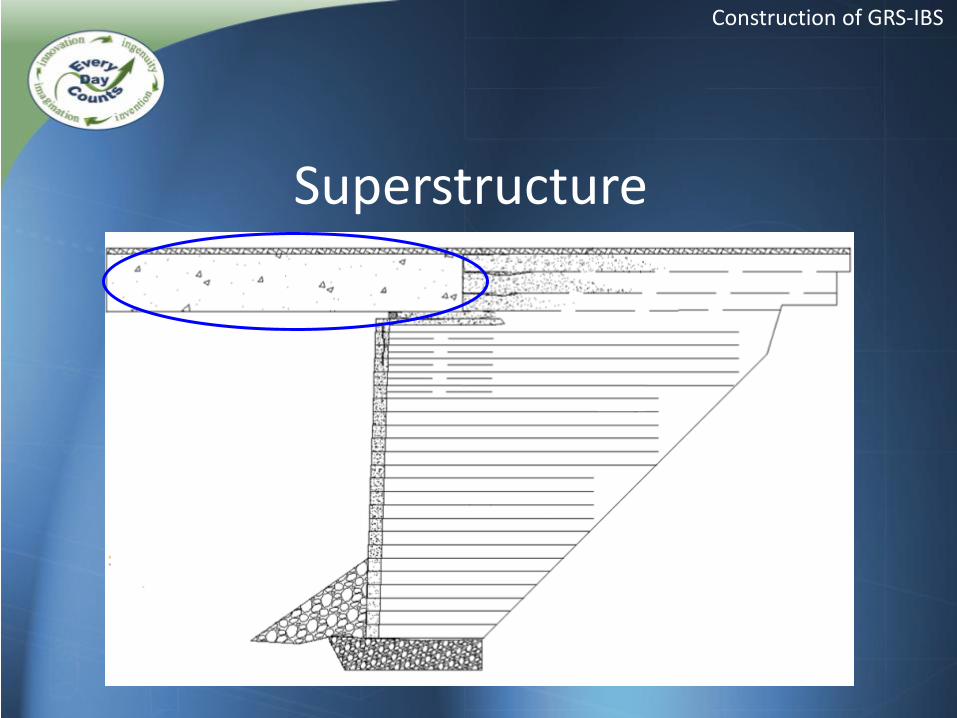
Superstructure
Construction of GRS-IBS
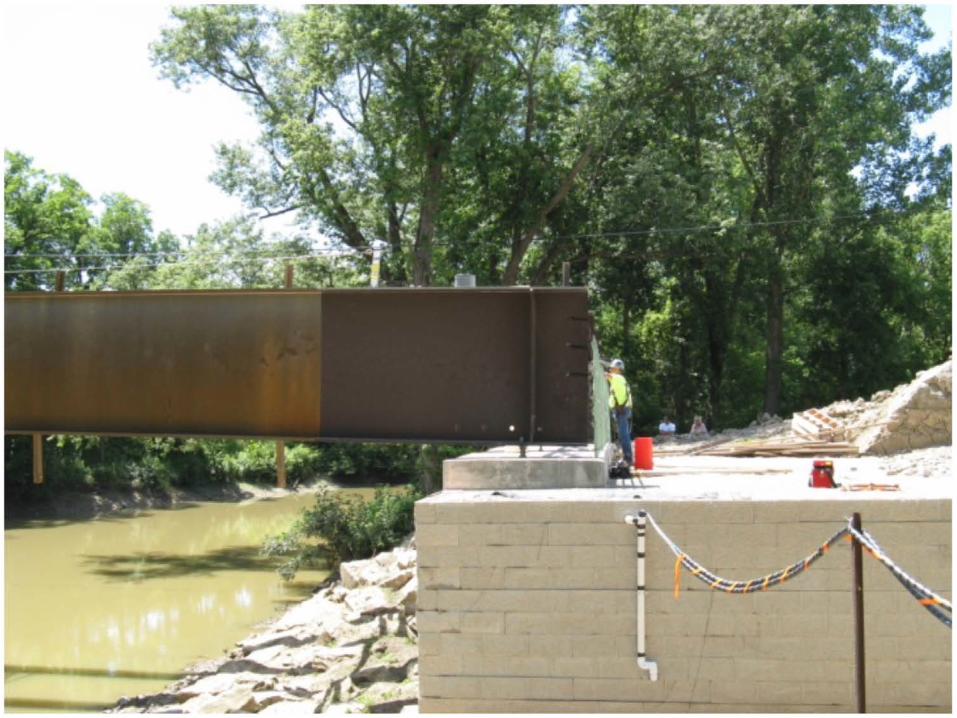
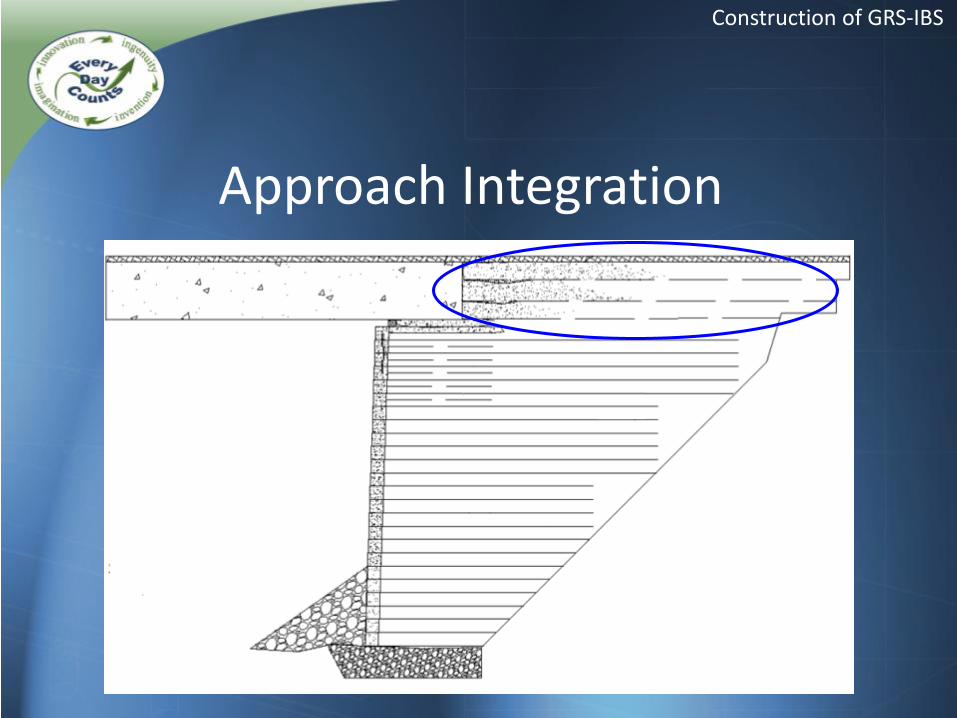
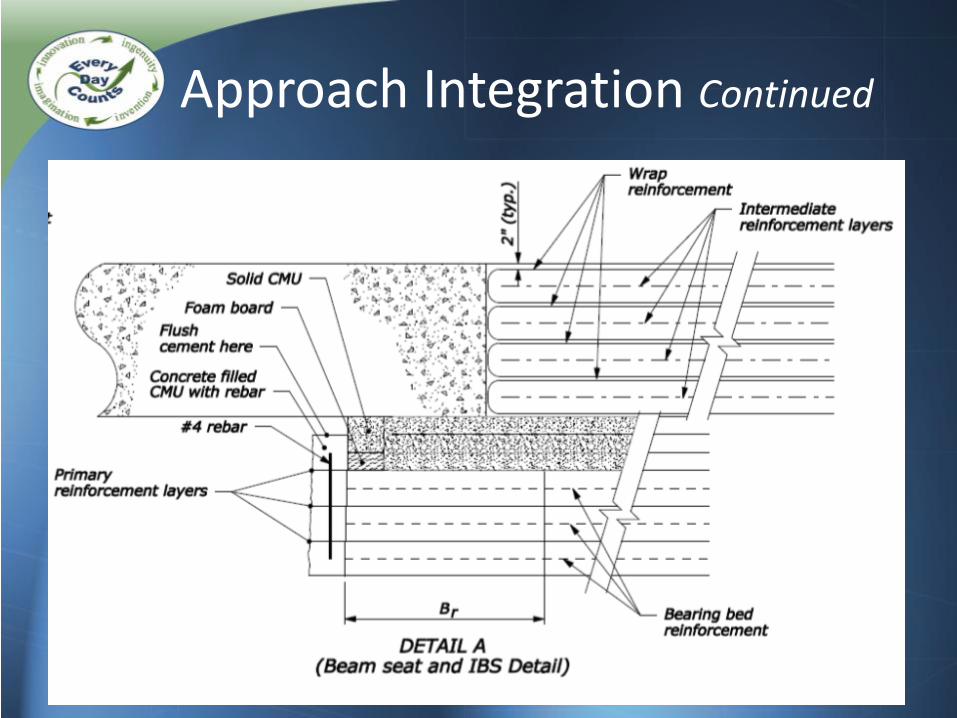
Approach Integration
Construction of GRS-IBS
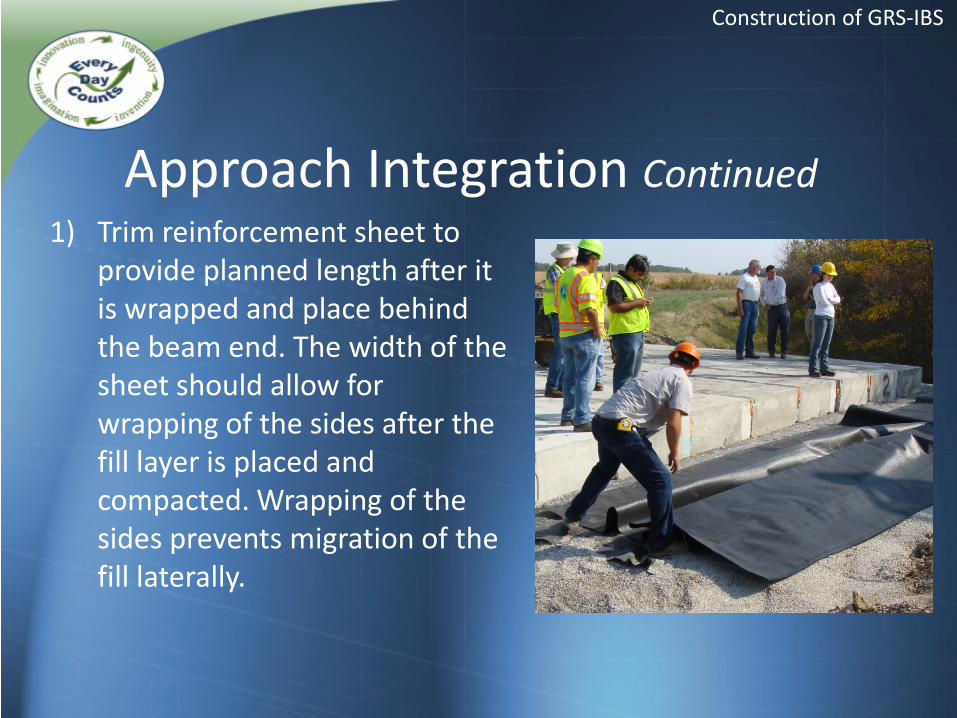
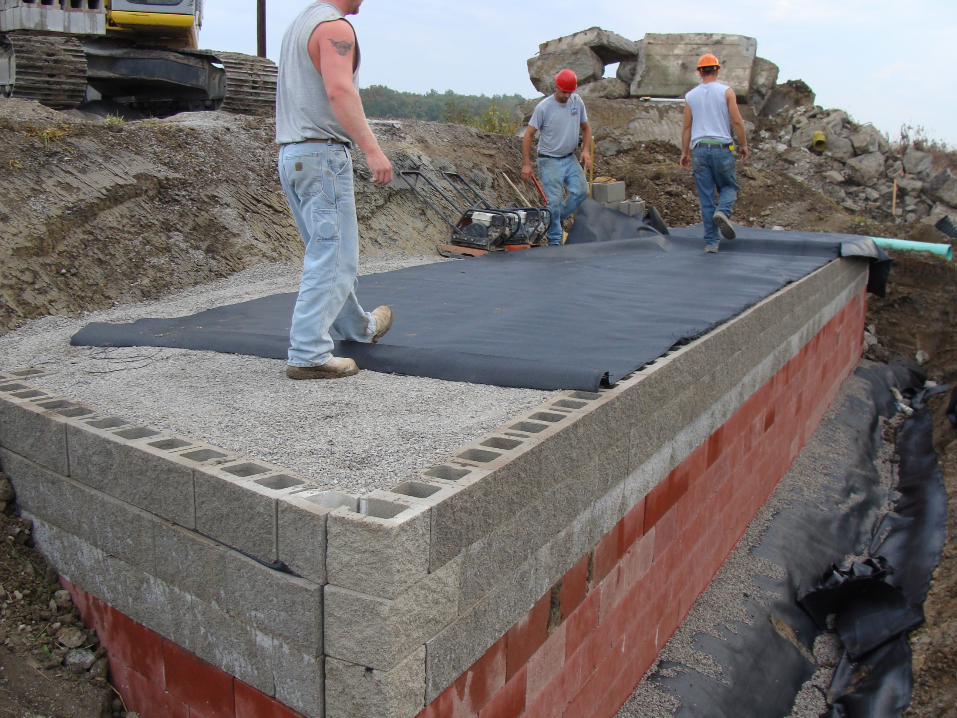
1) Trim reinforcement sheet to provide planned length after it is wrapped and place behind the beam end. The width of the sheet should allow for wrapping of the sides after the fill layer is placed and compacted. Wrapping of the sides prevents migration of the fill laterally.
Approach Integration Continued
Construction of GRS-IBS
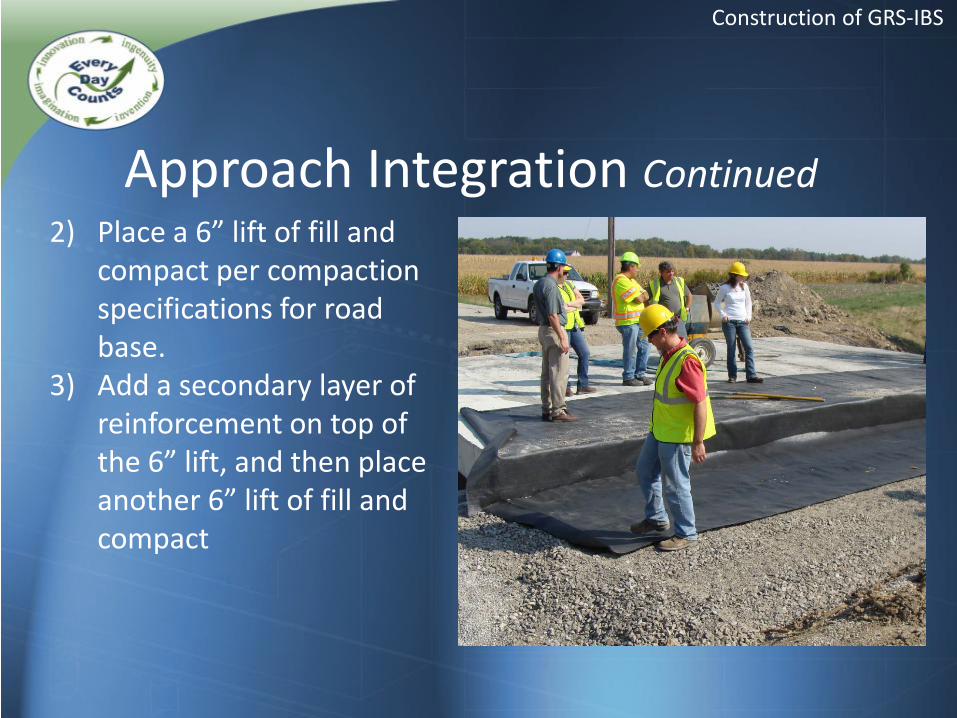
2) Place a 6” lift of fill and compact per compaction specifications for road base.
3) Add a secondary layer of reinforcement on top of the 6” lift, and then place another 6” lift of fill and compact
Approach Integration Continued
Construction of GRS-IBS
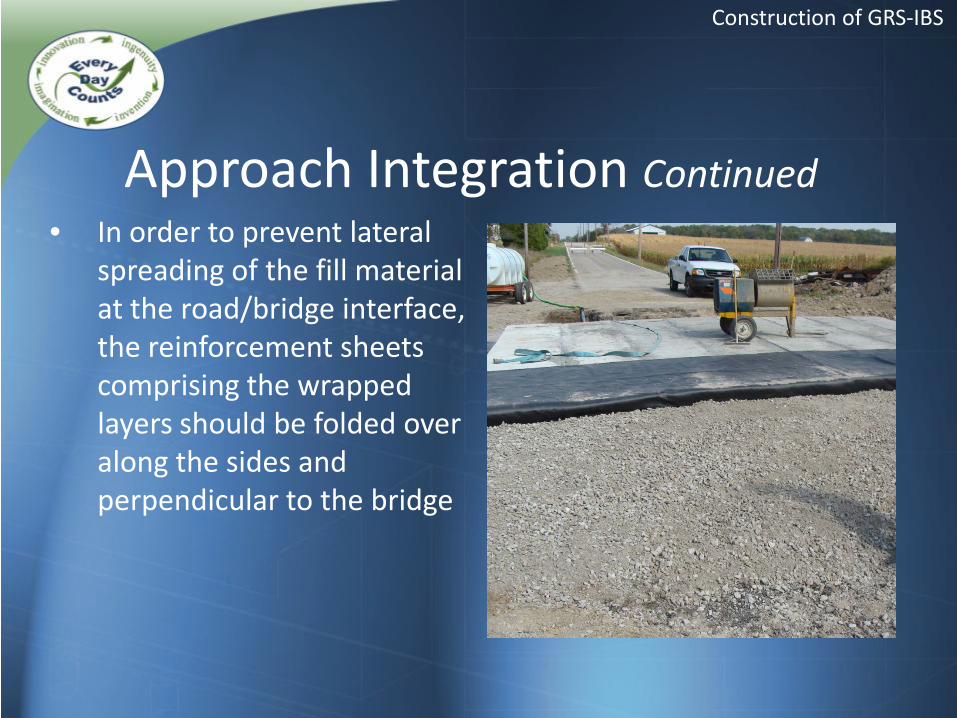
• In order to prevent lateral spreading of the fill material at the road/bridge interface, the reinforcement sheets comprising the wrapped layers should be folded over along the sides and perpendicular to the bridge
Approach Integration Continued
Construction of GRS-IBS
Approach Integration Continued
Construction Video
DESIGN OF GRS-IBS
GRS IBS Reports
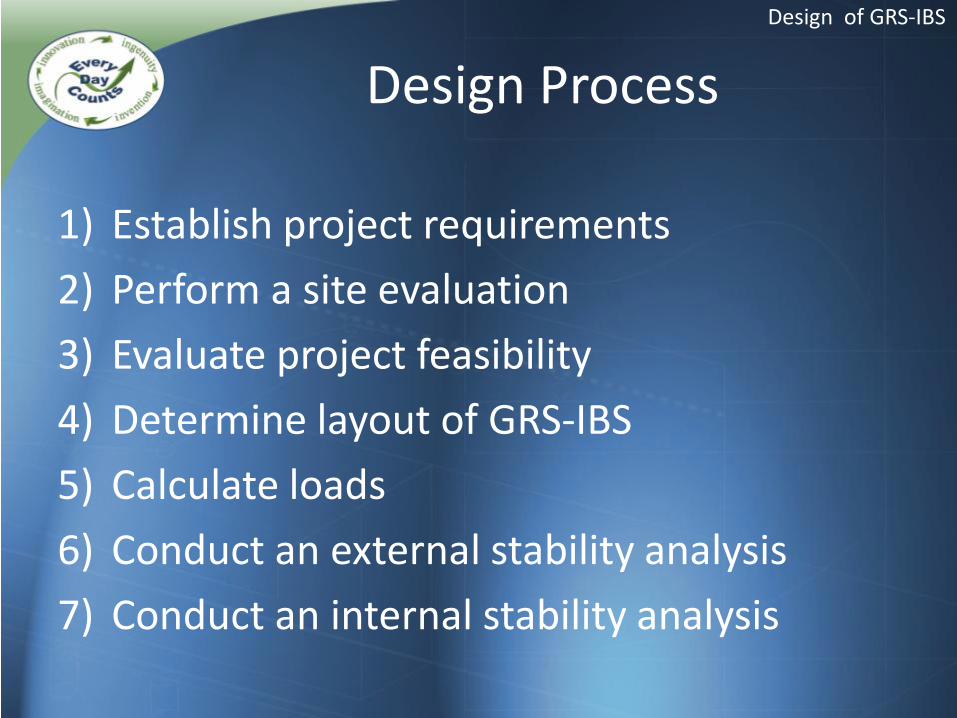
Design Process
1) Establish project requirements 2) Perform a site evaluation 3) Evaluate project feasibility 4) Determine layout of GRS-IBS 5) Calculate loads 6) Conduct an external stability analysis 7) Conduct an internal stability analysis
Design of GRS-IBS

DESIGN OF GRS-IBS Step 1: Establish Project Requirements
Design of GRS-IBS
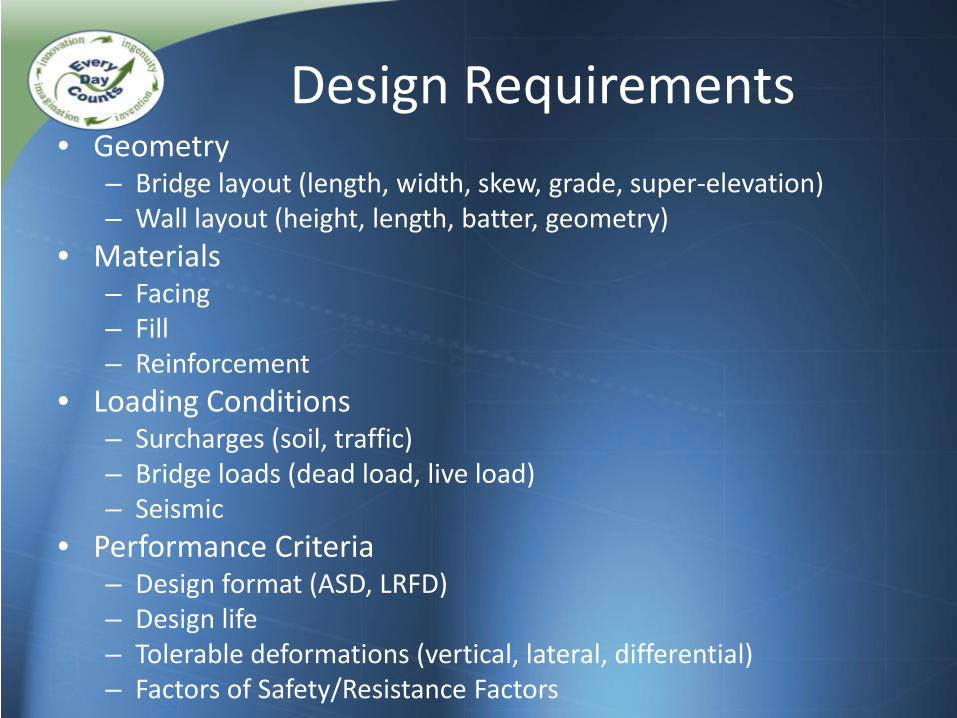
Design Requirements • Geometry
– Bridge layout (length, width, skew, grade, super-elevation) – Wall layout (height, length, batter, geometry)
• Materials – Facing – Fill – Reinforcement
• Loading Conditions – Surcharges (soil, traffic) – Bridge loads (dead load, live load) – Seismic
• Performance Criteria – Design format (ASD, LRFD) – Design life – Tolerable deformations (vertical, lateral, differential) – Factors of Safety/Resistance Factors

DESIGN OF GRS-IBS Step 2: Perform a Site Evaluation
Design of GRS-IBS
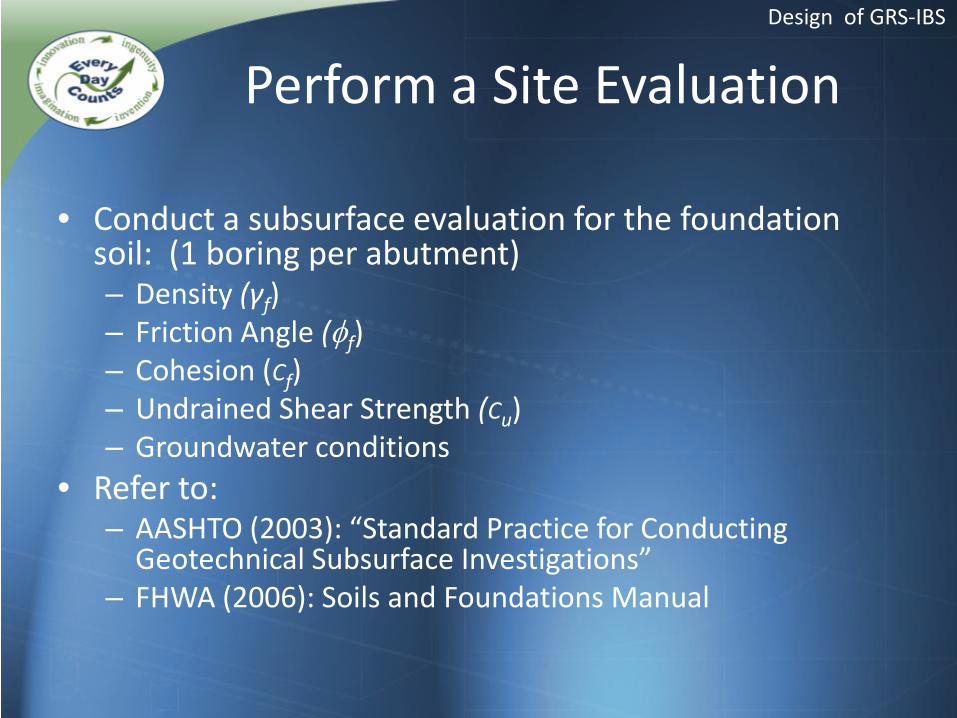
Perform a Site Evaluation
• Conduct a subsurface evaluation for the foundation soil: (1 boring per abutment) – Density (γf) – Friction Angle (φf) – Cohesion (Cf) – Undrained Shear Strength (Cu) – Groundwater conditions
• Refer to: – AASHTO (2003): “Standard Practice for Conducting
Geotechnical Subsurface Investigations” – FHWA (2006): Soils and Foundations Manual
Design of GRS-IBS
Perform a Site Evaluation Continued
• Evaluate soil properties for the retained earth (soil behind the abutment) – Density (γb ) – Friction Angle (φb)
– Cohesion (Cb)
Design of GRS-IBS
Perform a Site Evaluation Continued
• Evaluate soil properties for the reinforced fill – Density (γr ) – Friction Angle (φr)
– Cohesion (Cr): Assume cohesionless soil – Maximum aggregate size: (dmax)
Design of GRS-IBS
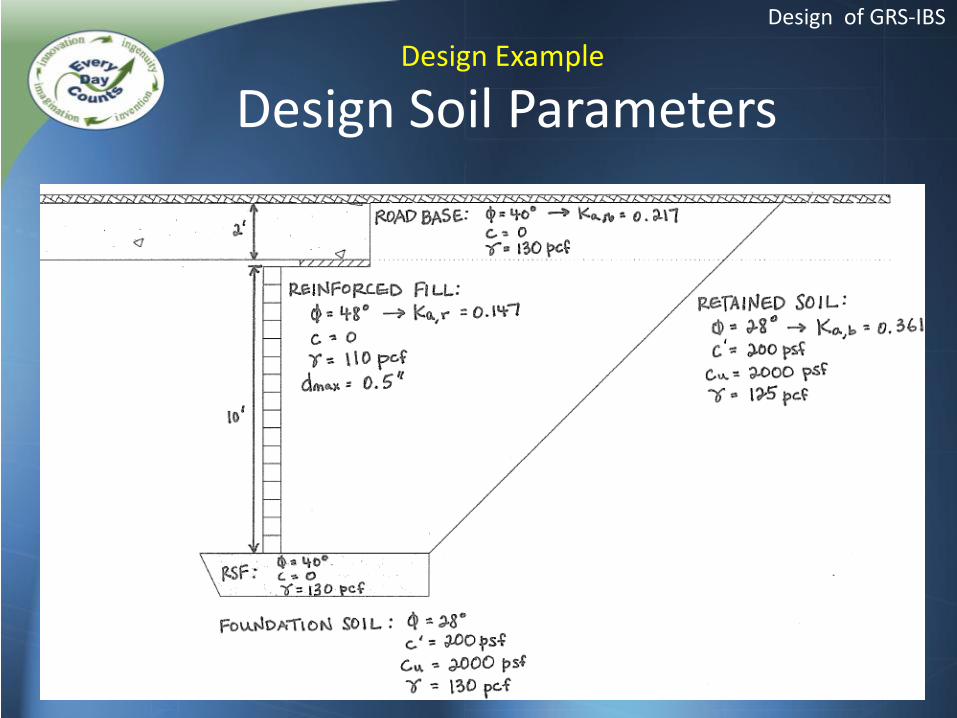
Design Soil Parameters
Design of GRS-IBS
Design Example
DESIGN OF GRS-IBS Step 3: Evaluate Project Feasibility
Design of GRS-IBS
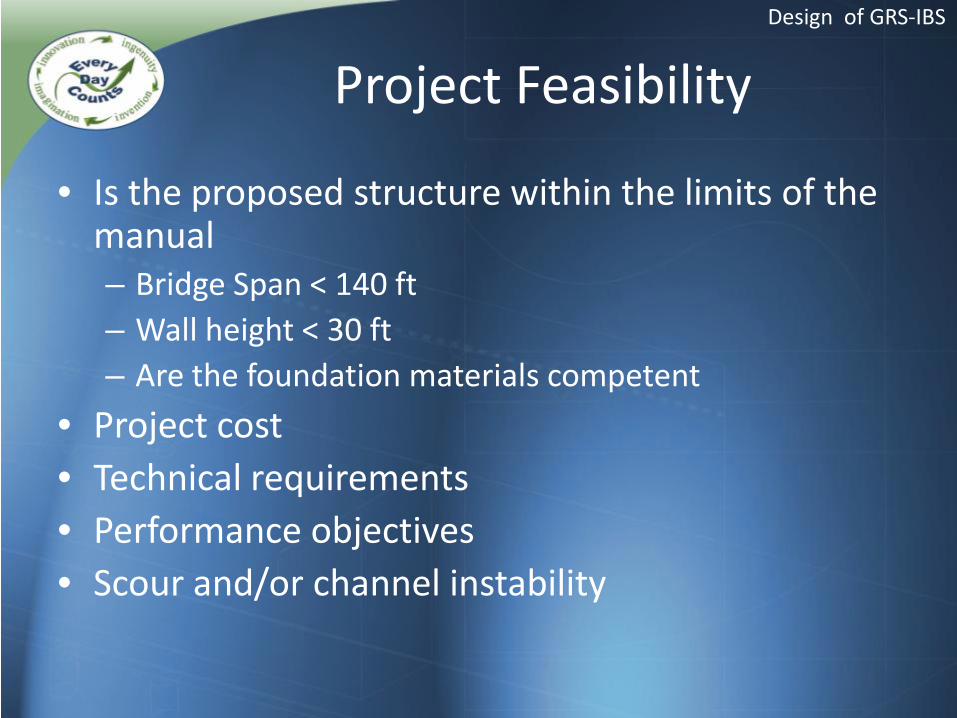
Project Feasibility
• Is the proposed structure within the limits of the manual – Bridge Span < 140 ft – Wall height < 30 ft – Are the foundation materials competent
• Project cost • Technical requirements • Performance objectives • Scour and/or channel instability
Design of GRS-IBS
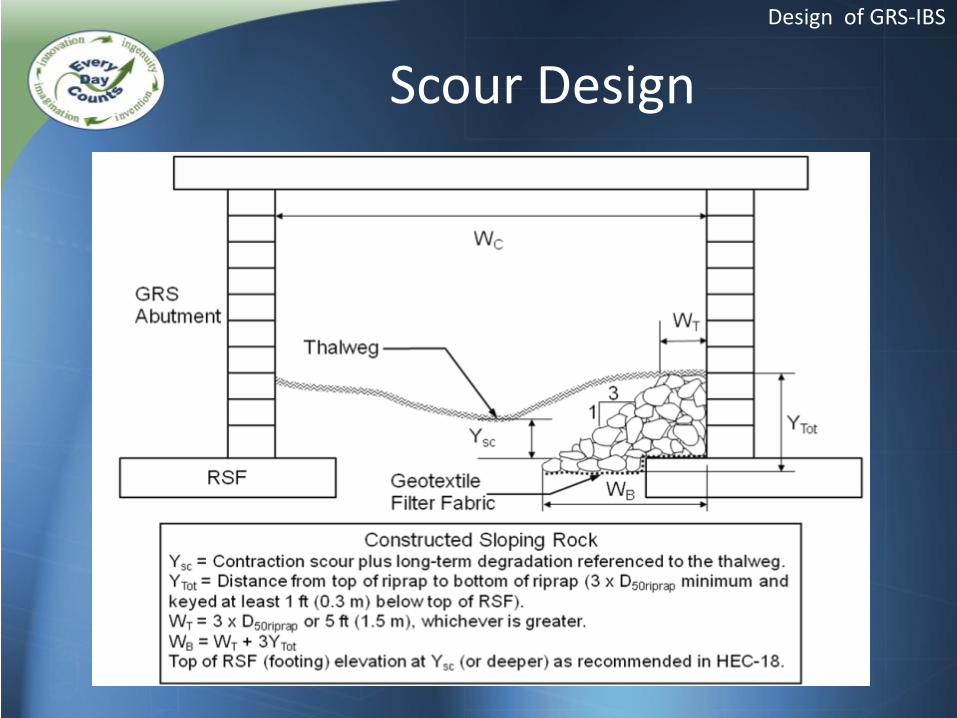
Scour Design Design of GRS-IBS
DESIGN OF GRS-IBS Step 4: Determine Layout of GRS-IBS
Design of GRS-IBS
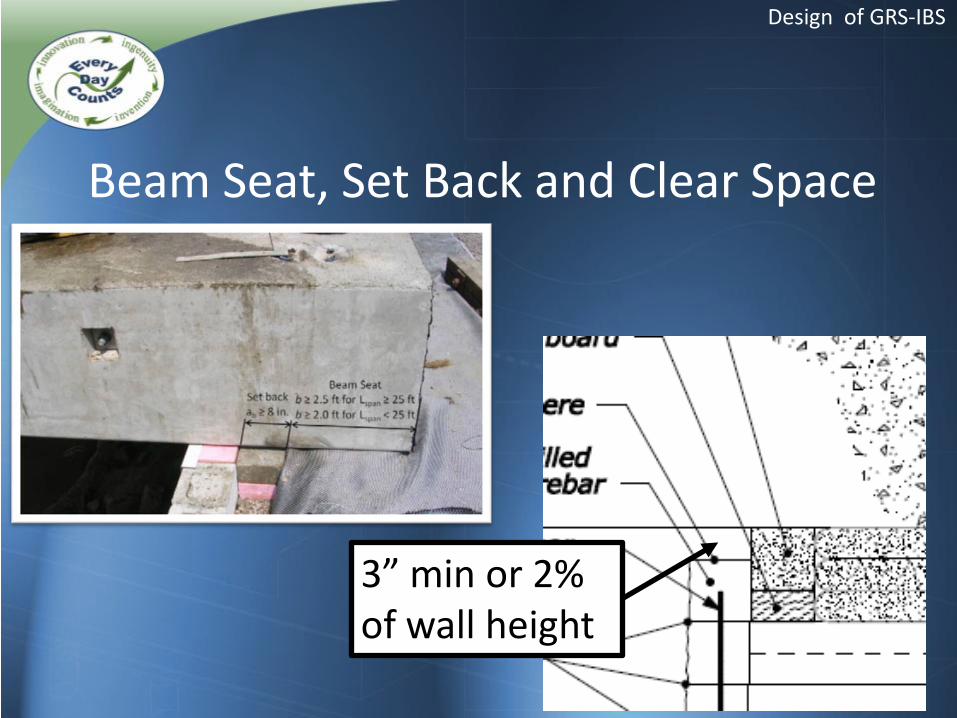
Beam Seat, Set Back and Clear Space
Design of GRS-IBS
3” min or 2% of wall height
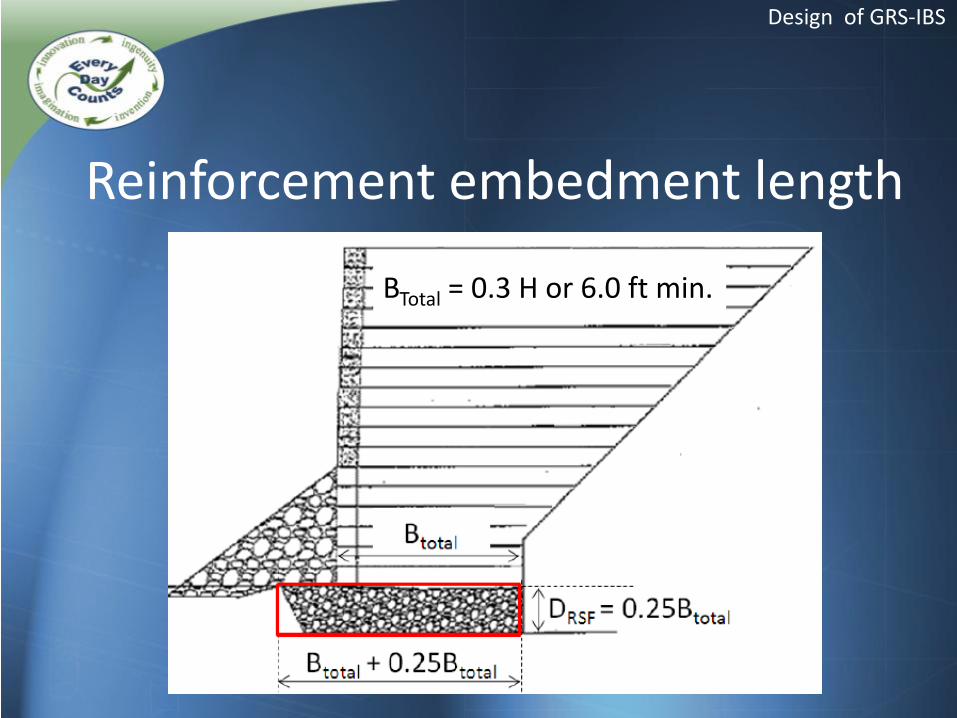
Reinforcement embedment length
Design of GRS-IBS
BTotal = 0.3 H or 6.0 ft min.
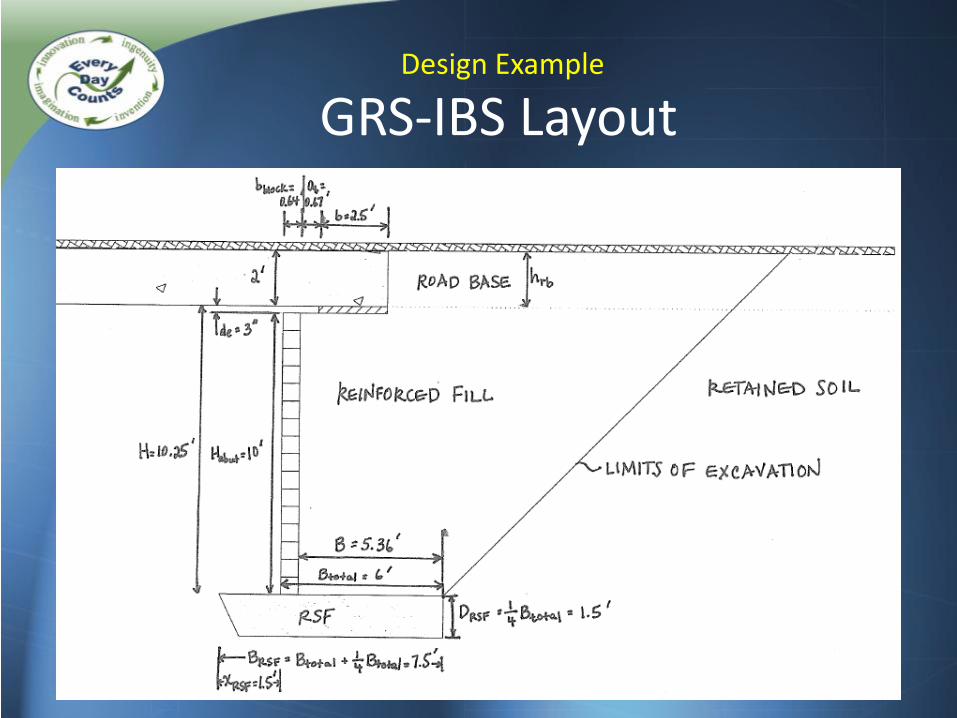
GRS-IBS Layout Design Example
DESIGN OF GRS-IBS Step 5: Calculate Applicable Loads
Design of GRS-IBS
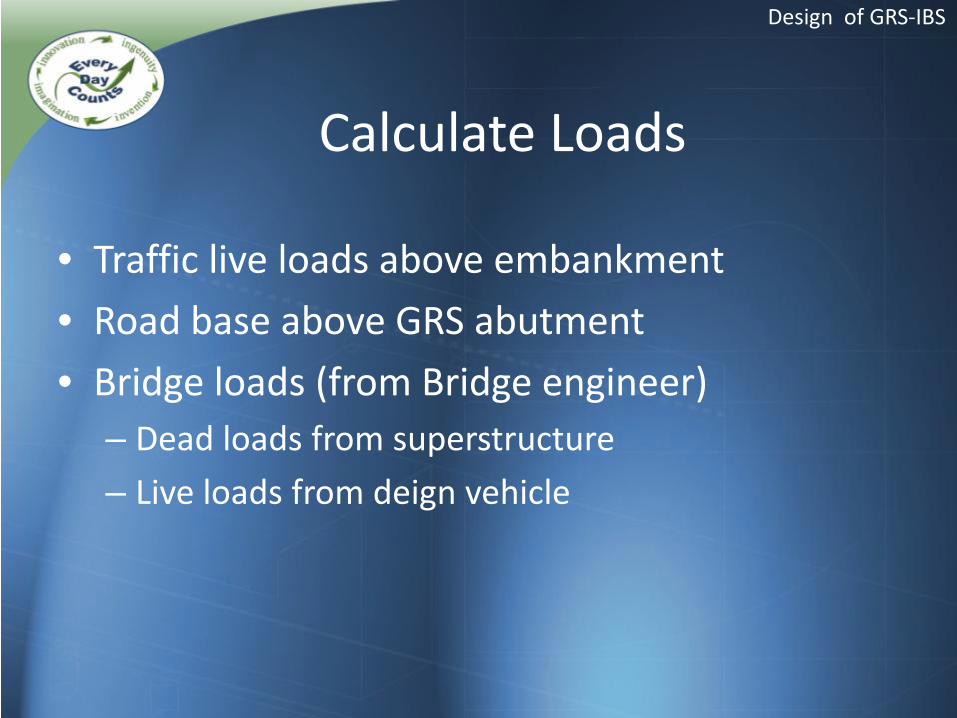
Calculate Loads
• Traffic live loads above embankment • Road base above GRS abutment • Bridge loads (from Bridge engineer)
– Dead loads from superstructure – Live loads from deign vehicle
Design of GRS-IBS
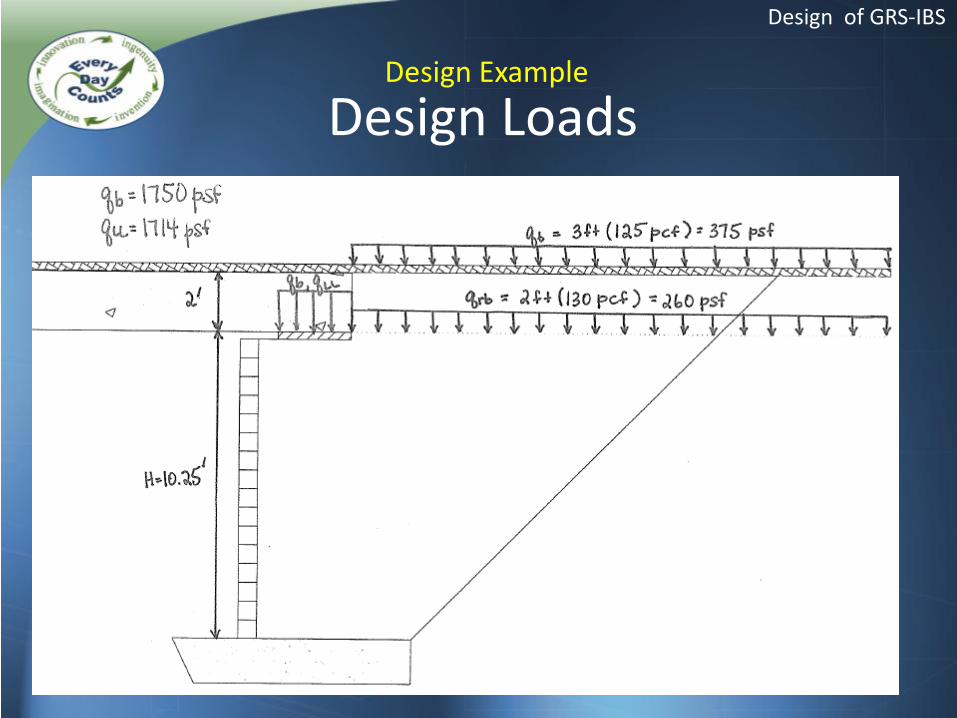
Design Loads
Design of GRS-IBS
Design Example
DESIGN OF GRS-IBS Step 6: Conduct an External Stability
Analysis
Design of GRS-IBS
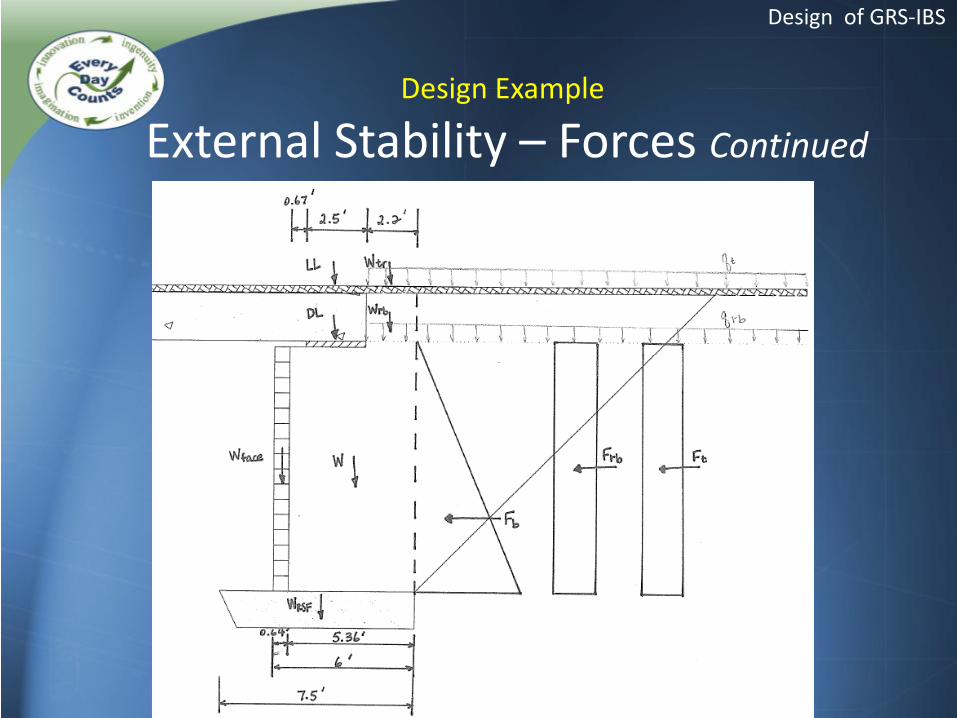
External Stability – Forces Continued
Design of GRS-IBS
Design Example
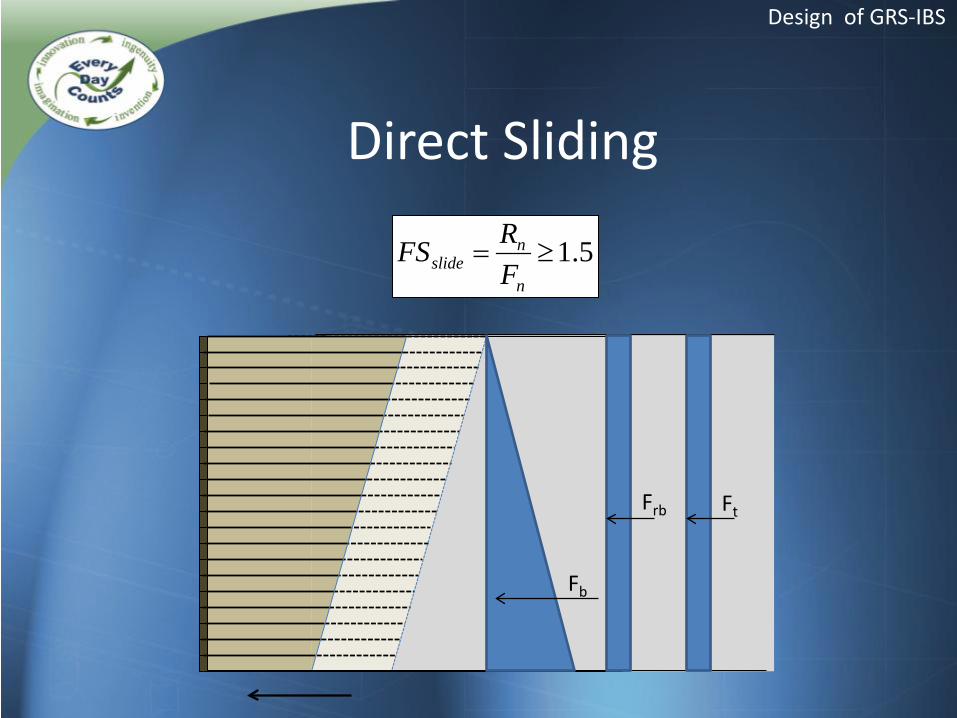
Direct Sliding
5.1≥=n
nslide F
RFS
Design of GRS-IBS
Fb
Ft Frb
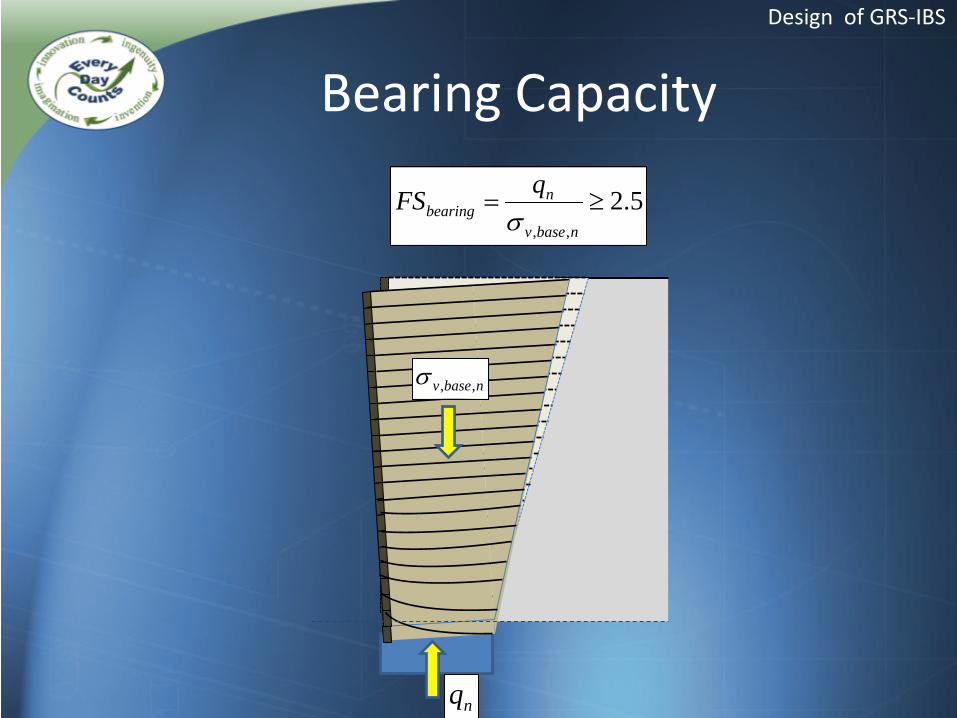
Bearing Capacity
5.2,,
≥=nbasev
nbearing
qFSσ
Design of GRS-IBS
nq
nbasev ,,σ
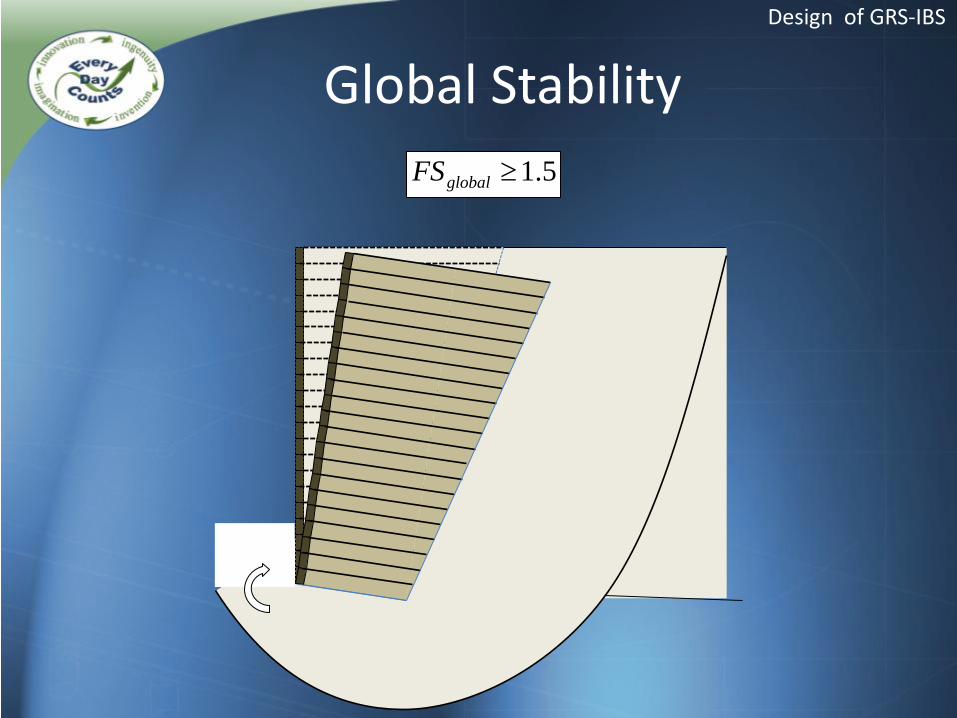
Global Stability 5.1≥globalFS
Design of GRS-IBS
Global Stability Continued
Design of GRS-IBS
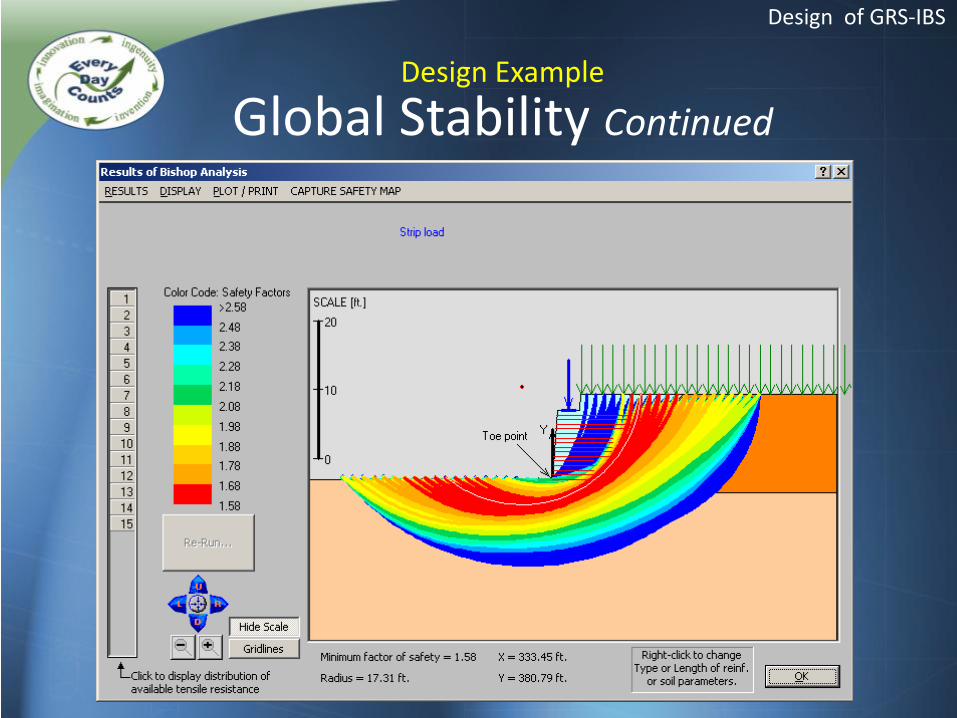
Design Example
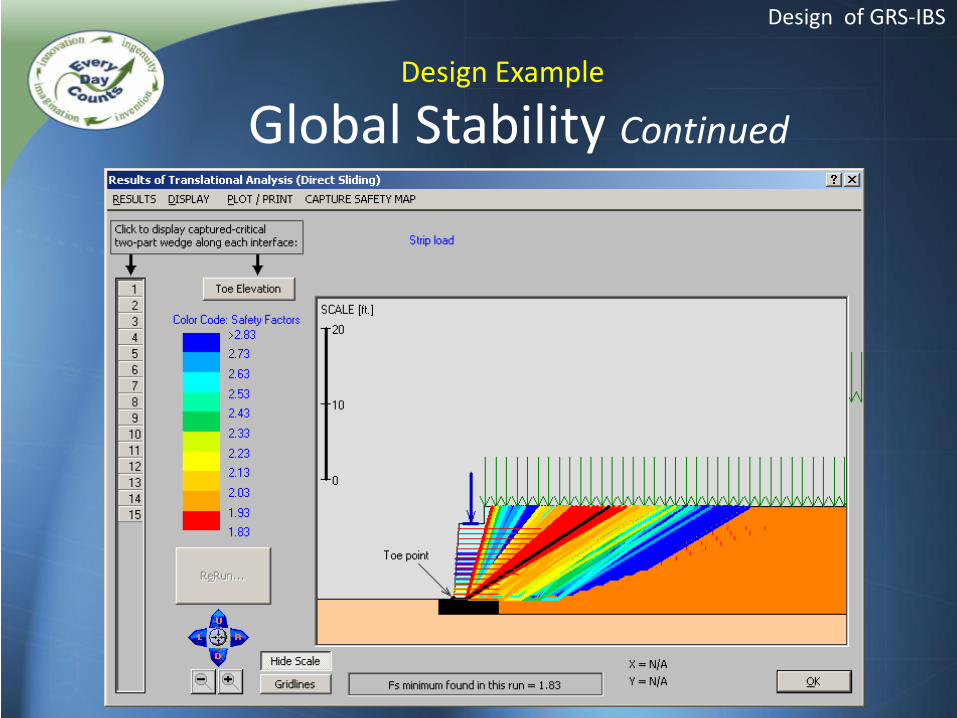
Global Stability Continued
Design of GRS-IBS
Design Example
DESIGN OF GRS-IBS Step 7: Conduct an Internal Stability
Analysis
Design of GRS-IBS
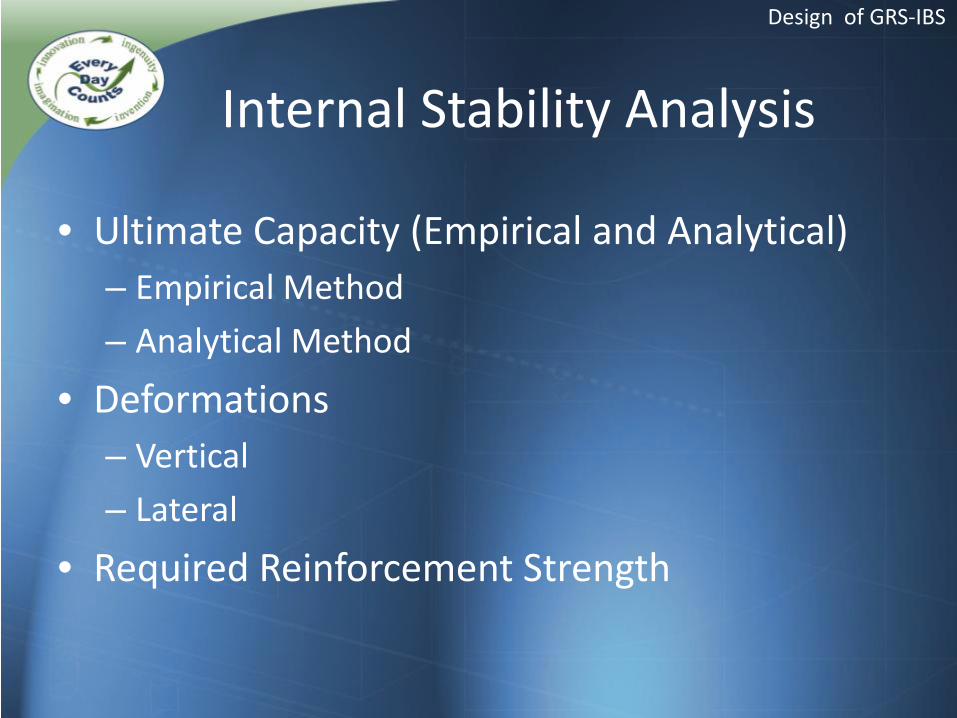
Internal Stability Analysis
• Ultimate Capacity (Empirical and Analytical) – Empirical Method – Analytical Method
• Deformations – Vertical – Lateral
• Required Reinforcement Strength
Design of GRS-IBS
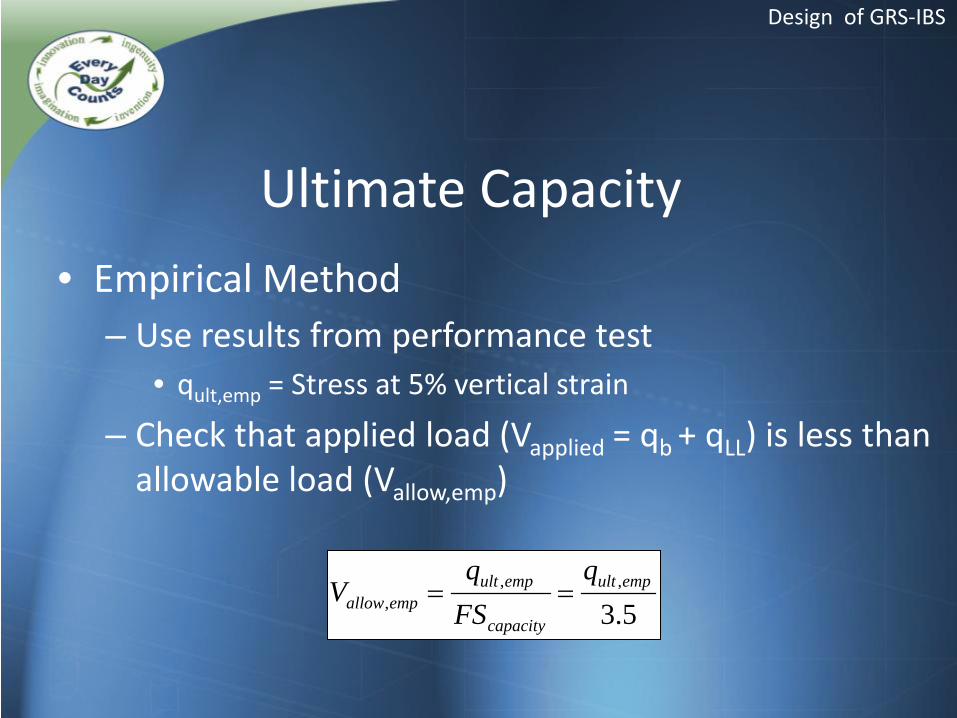
• Empirical Method – Use results from performance test
• qult,emp = Stress at 5% vertical strain
– Check that applied load (Vapplied = qb + qLL) is less than allowable load (Vallow,emp)
Ultimate Capacity
5.3,,
,empult
capacity
empultempallow
qFSq
V ==
Design of GRS-IBS
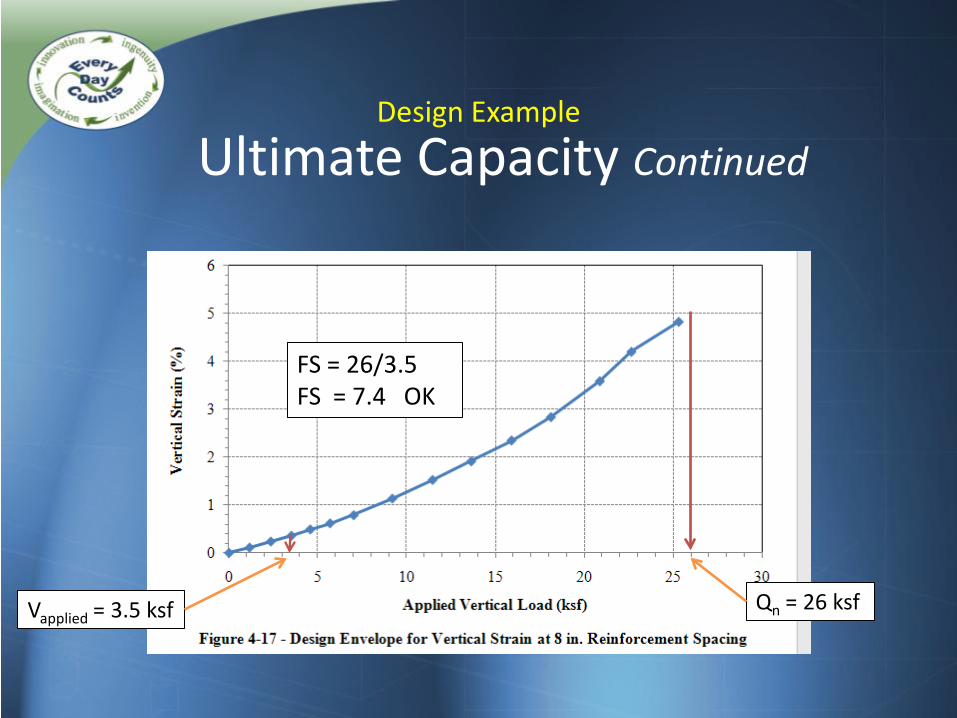
Qn = 26 ksf Vapplied = 3.5 ksf
FS = 26/3.5 FS = 7.4 OK
Ultimate Capacity Continued Design Example
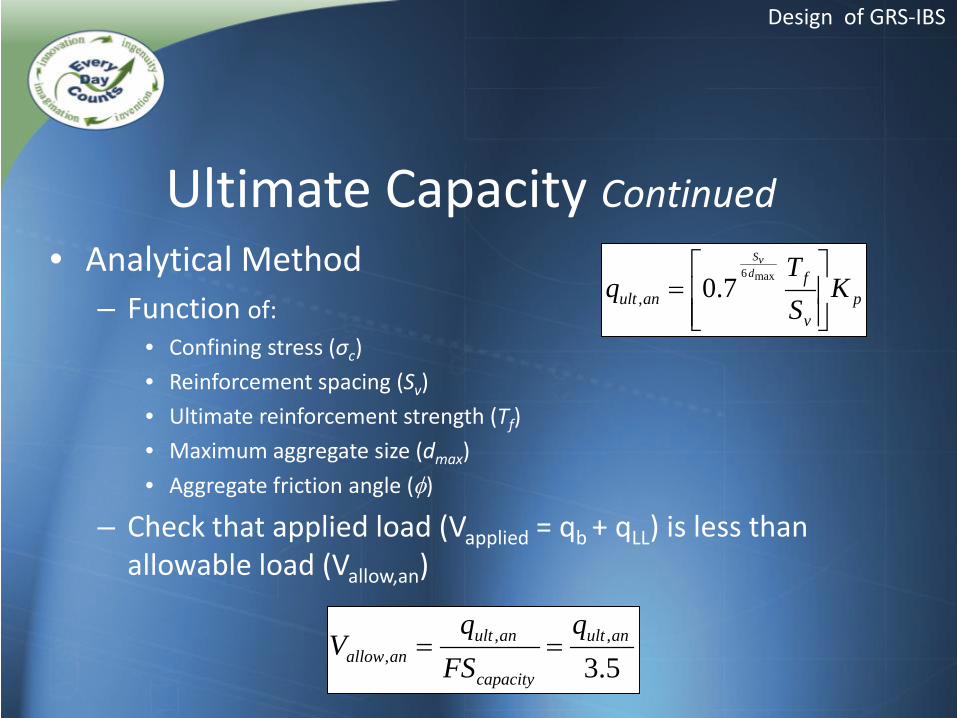
• Analytical Method – Function of:
• Confining stress (σc) • Reinforcement spacing (Sv) • Ultimate reinforcement strength (Tf) • Maximum aggregate size (dmax) • Aggregate friction angle (φ)
– Check that applied load (Vapplied = qb + qLL) is less than allowable load (Vallow,an)
pv
fanult K
ST
qd
vS
=
max6
7.0,
Ultimate Capacity Continued
5.3,,
,anult
capacity
anultanallow
qFS
qV ==
Design of GRS-IBS
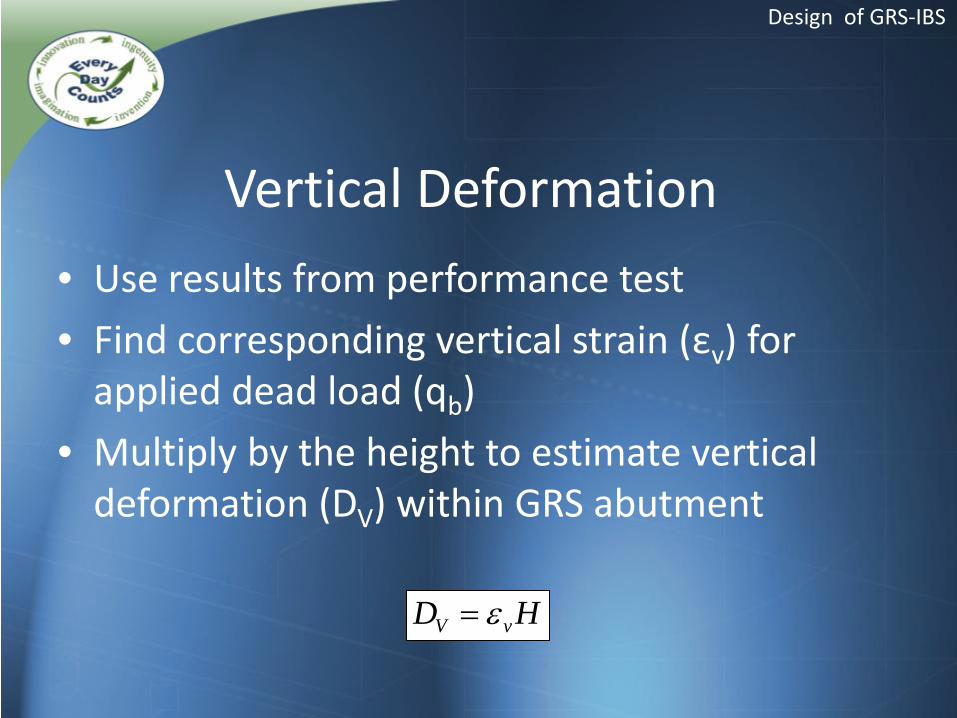
• Use results from performance test • Find corresponding vertical strain (εv) for
applied dead load (qb) • Multiply by the height to estimate vertical
deformation (DV) within GRS abutment
Vertical Deformation
HD vV ε=
Design of GRS-IBS
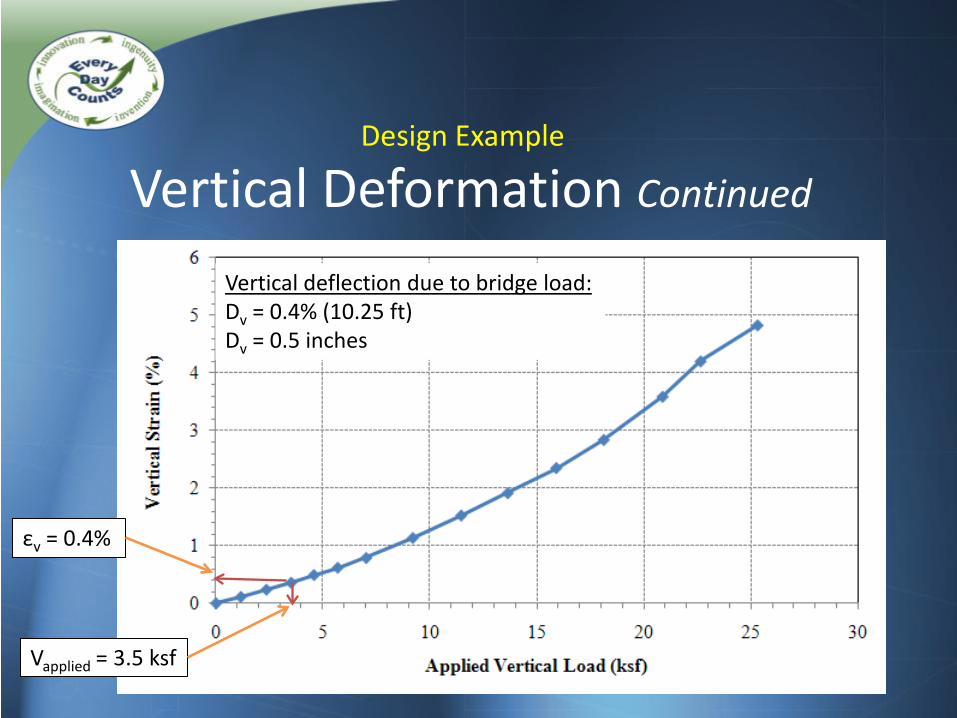
Vapplied = 3.5 ksf
εv = 0.4%
Vertical deflection due to bridge load: Dv = 0.4% (10.25 ft) Dv = 0.5 inches
Vertical Deformation Continued Design Example
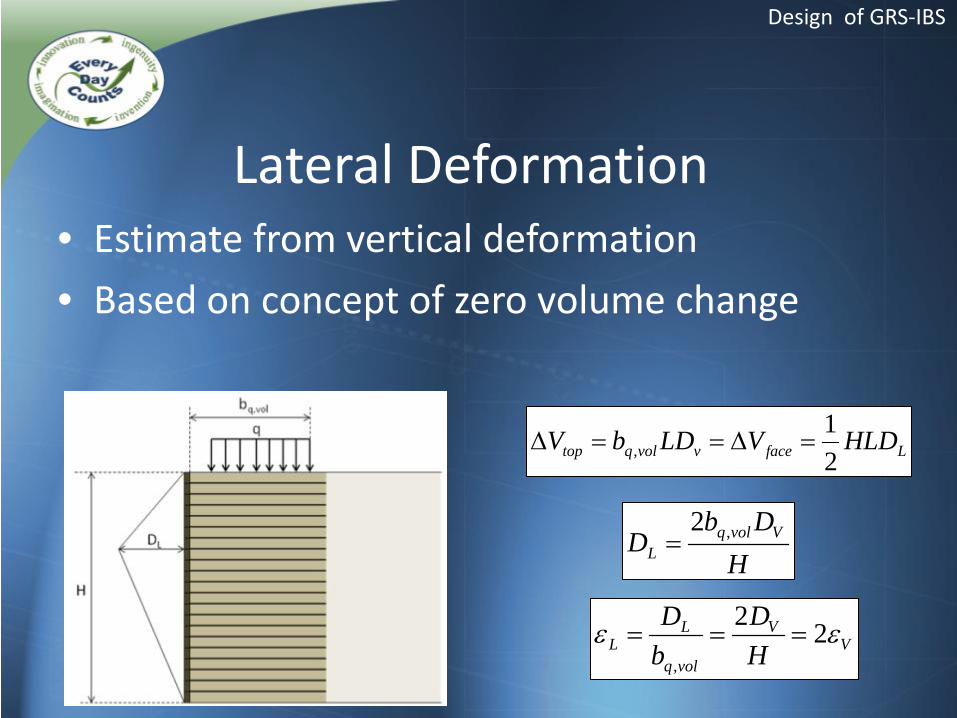
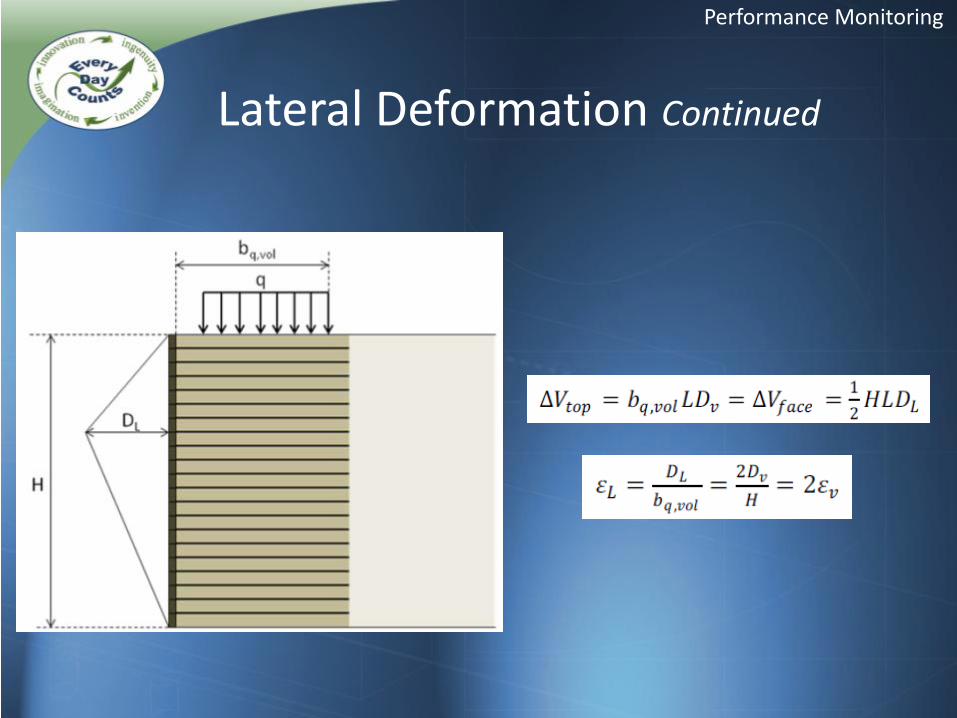
• Estimate from vertical deformation • Based on concept of zero volume change
Lateral Deformation
HDb
D VvolqL
,2=
Lfacevvolqtop HLDVLDbV21
, =∆==∆
Design of GRS-IBS
VV
volq
LL H
DbD εε 22
,
===
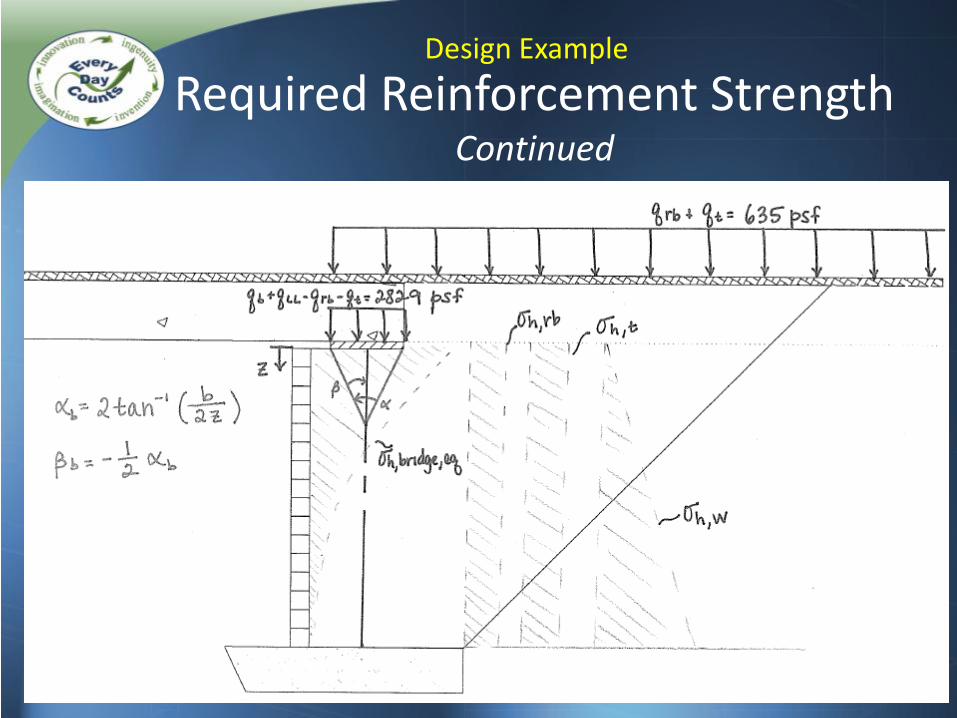
Required Reinforcement Strength Continued
Design Example
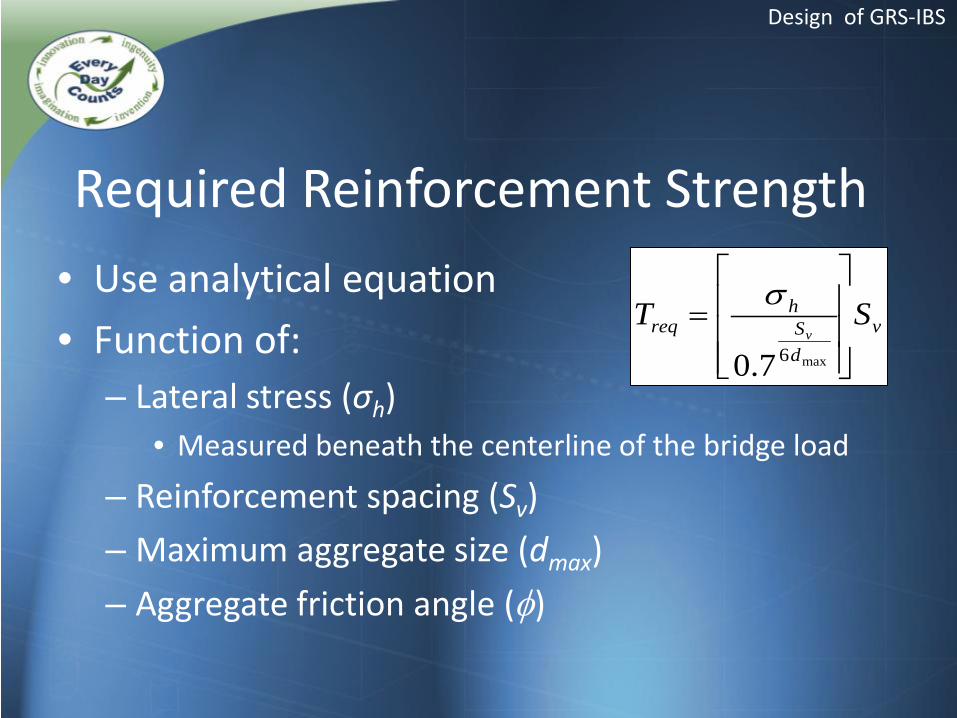
• Use analytical equation • Function of:
– Lateral stress (σh) • Measured beneath the centerline of the bridge load
– Reinforcement spacing (Sv) – Maximum aggregate size (dmax) – Aggregate friction angle (φ)
Required Reinforcement Strength
vdS
hreq ST
v
=
max67.0
σ
Design of GRS-IBS
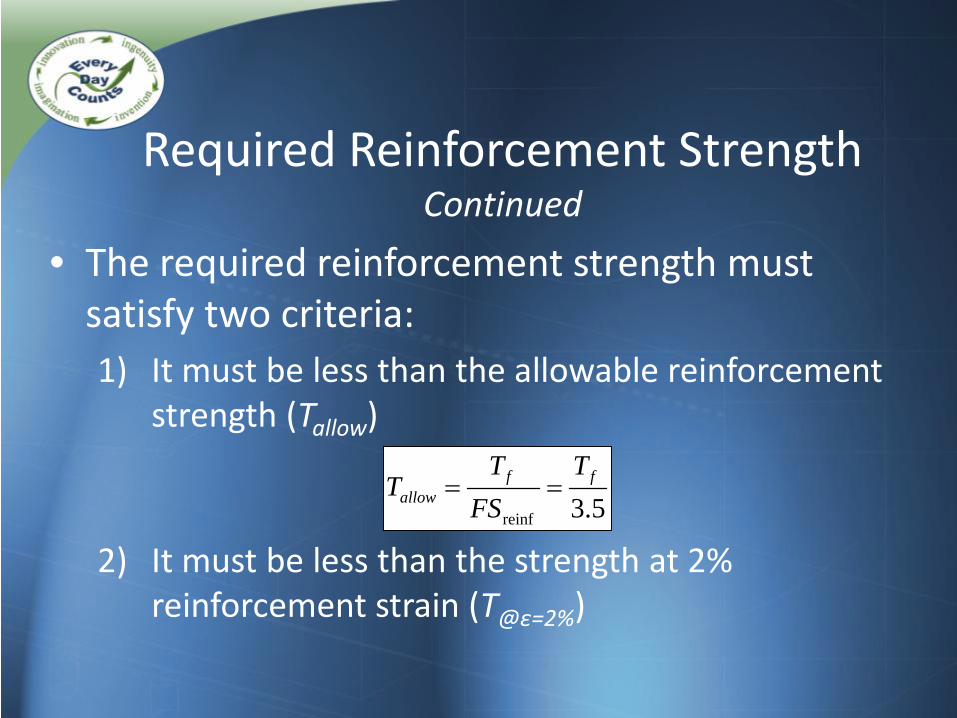
Required Reinforcement Strength Continued
• The required reinforcement strength must satisfy two criteria: 1) It must be less than the allowable reinforcement
strength (Tallow)
2) It must be less than the strength at 2% reinforcement strain (T@ε=2%)
5.3reinf
ffallow
TFS
TT ==
Standard Plans
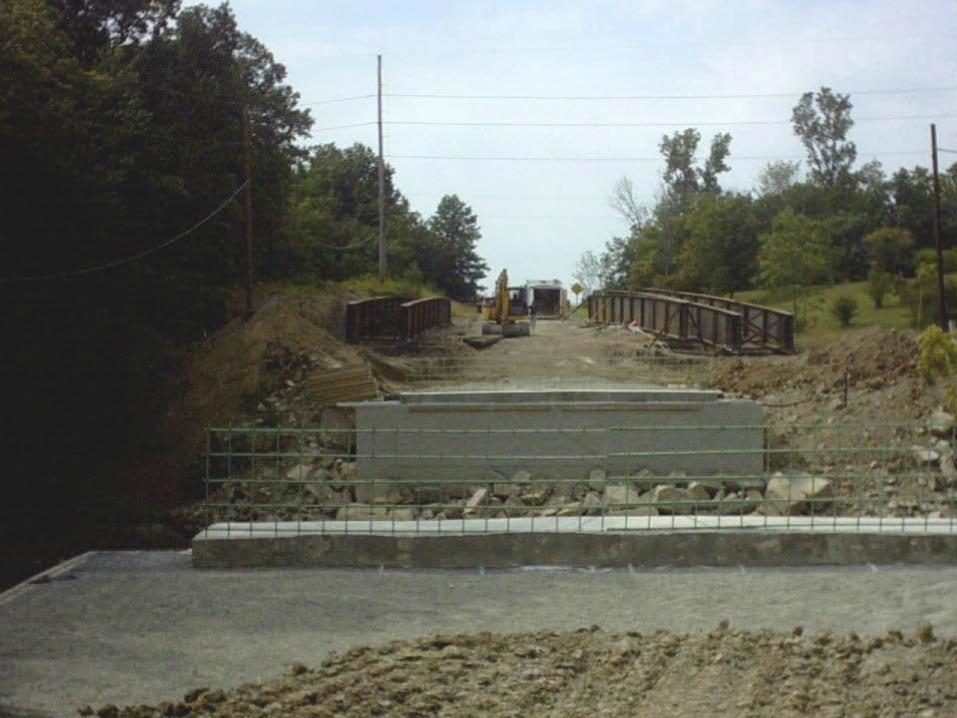
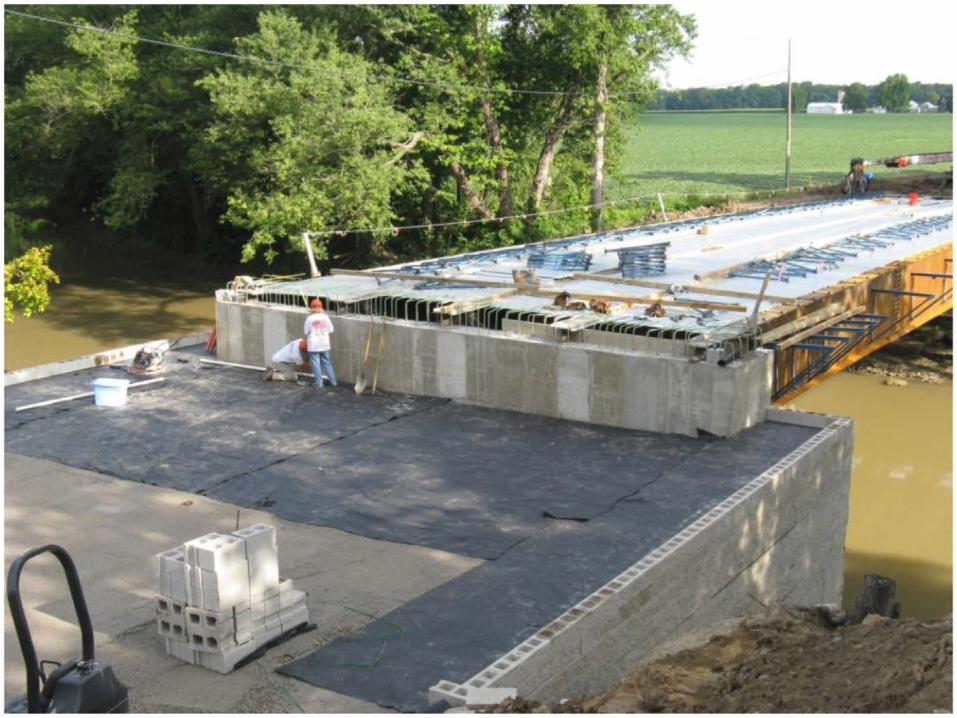
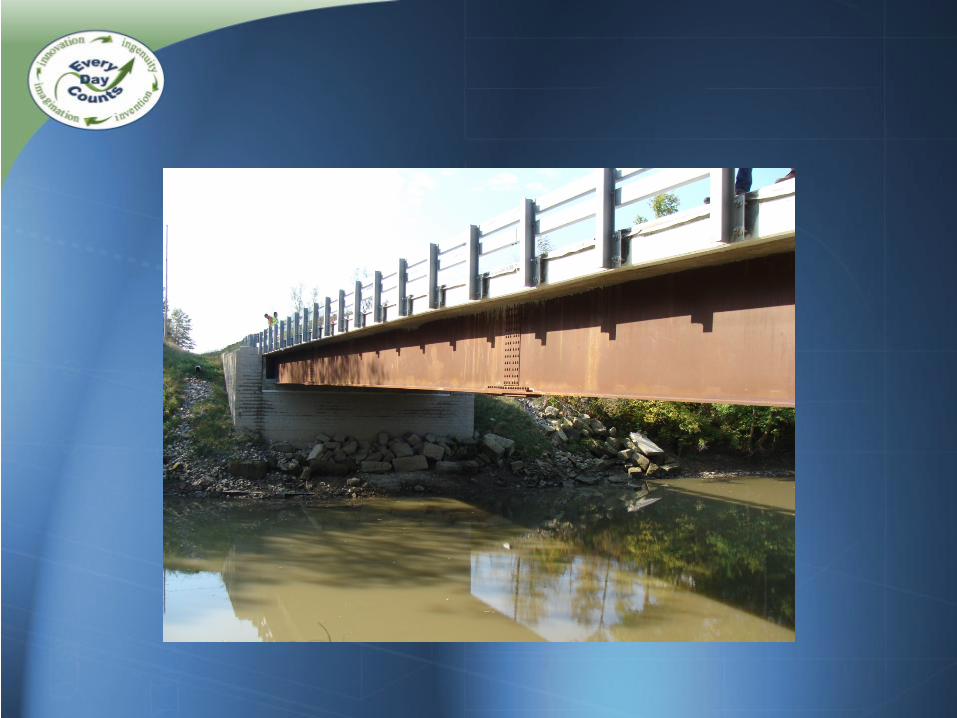
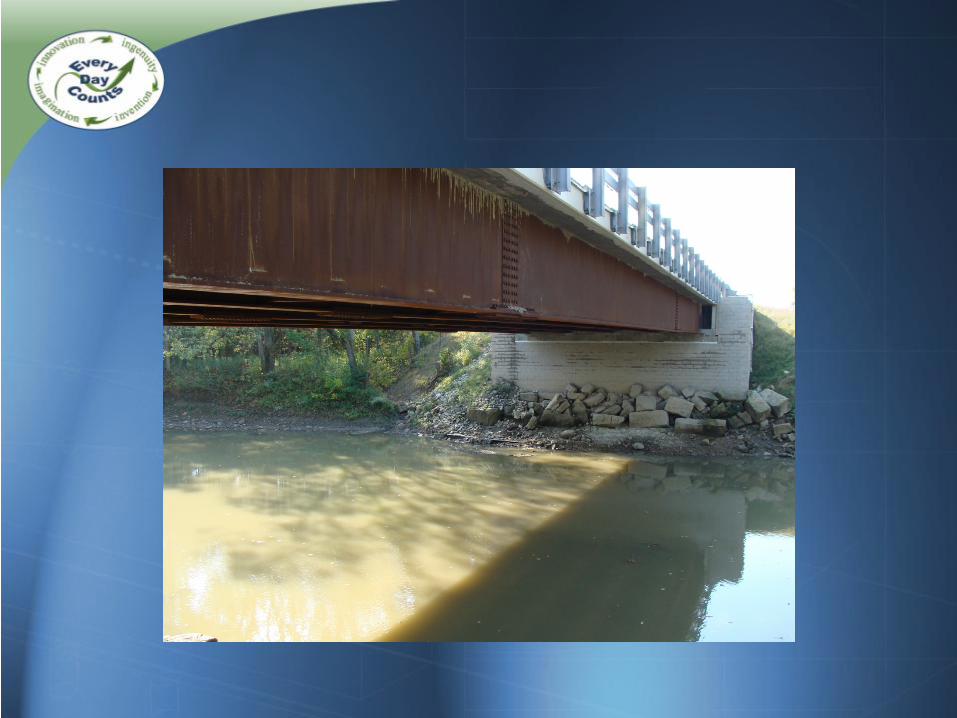
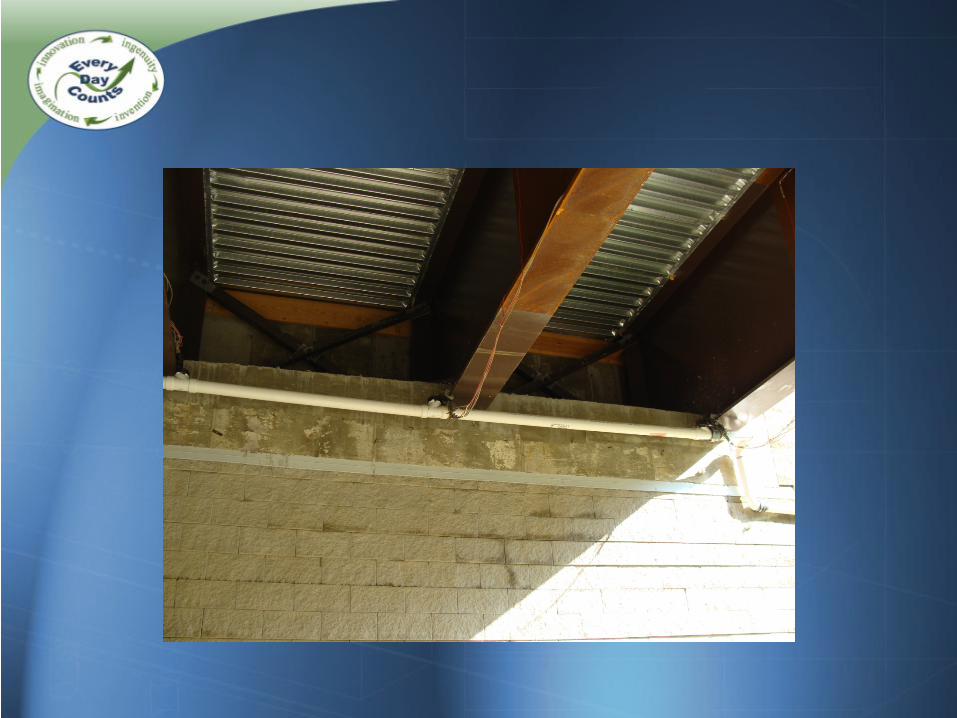
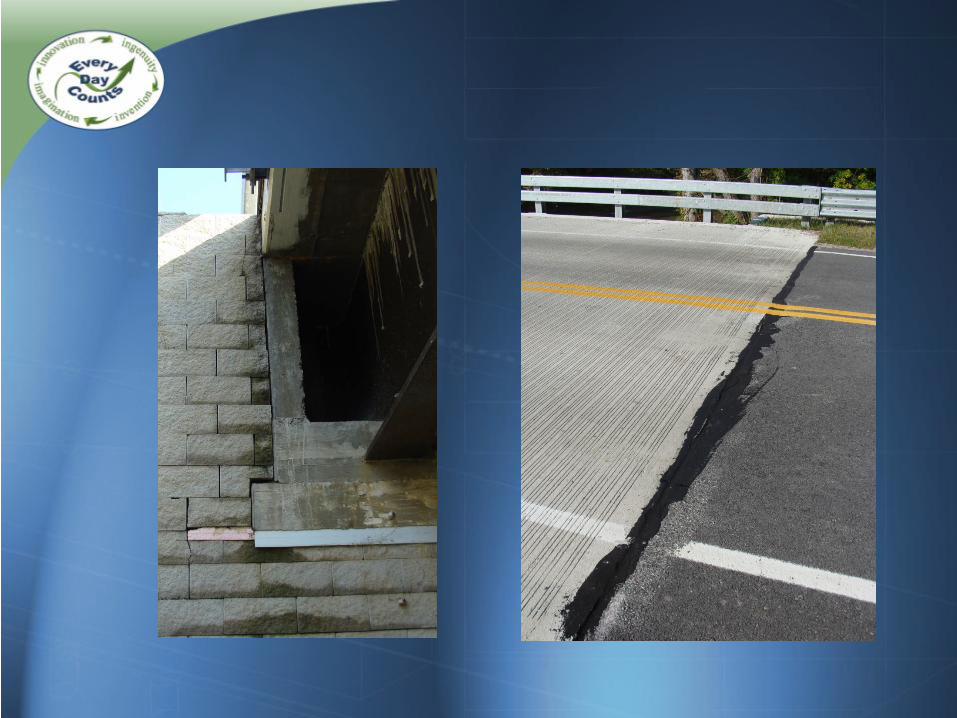
User Perspective Defiance County, Ohio
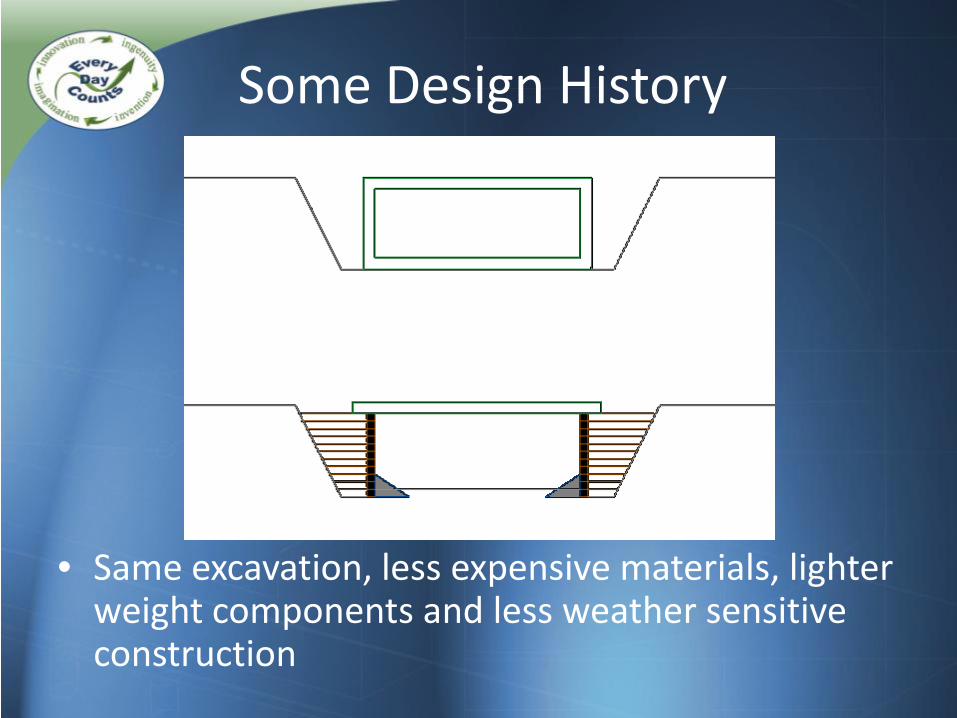
Some Design History
• Same excavation, less expensive materials, lighter
weight components and less weather sensitive construction
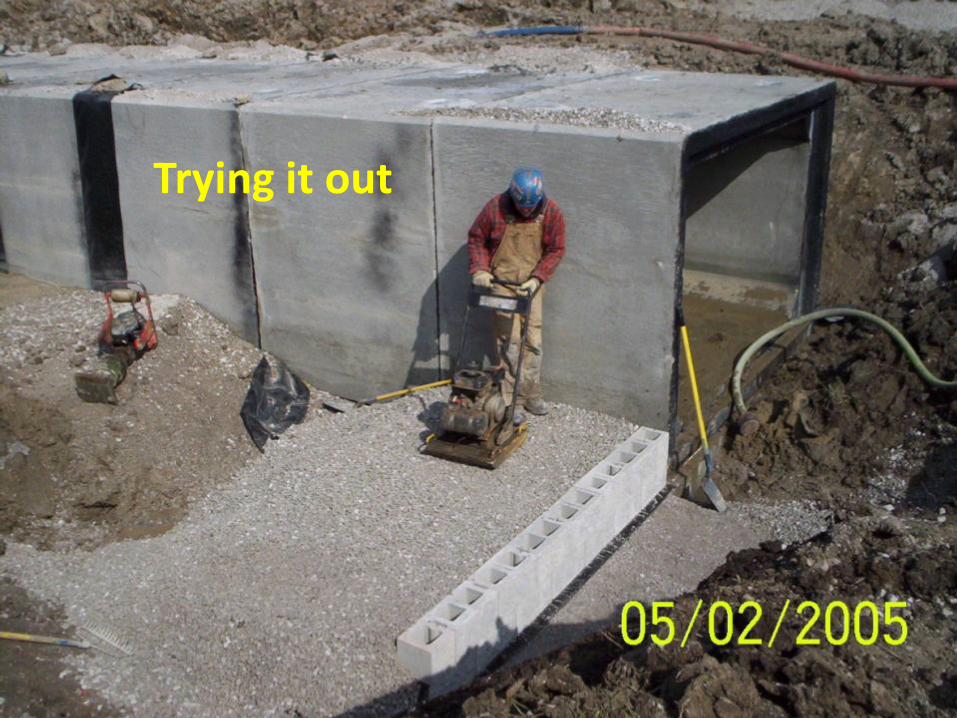
Trying it out
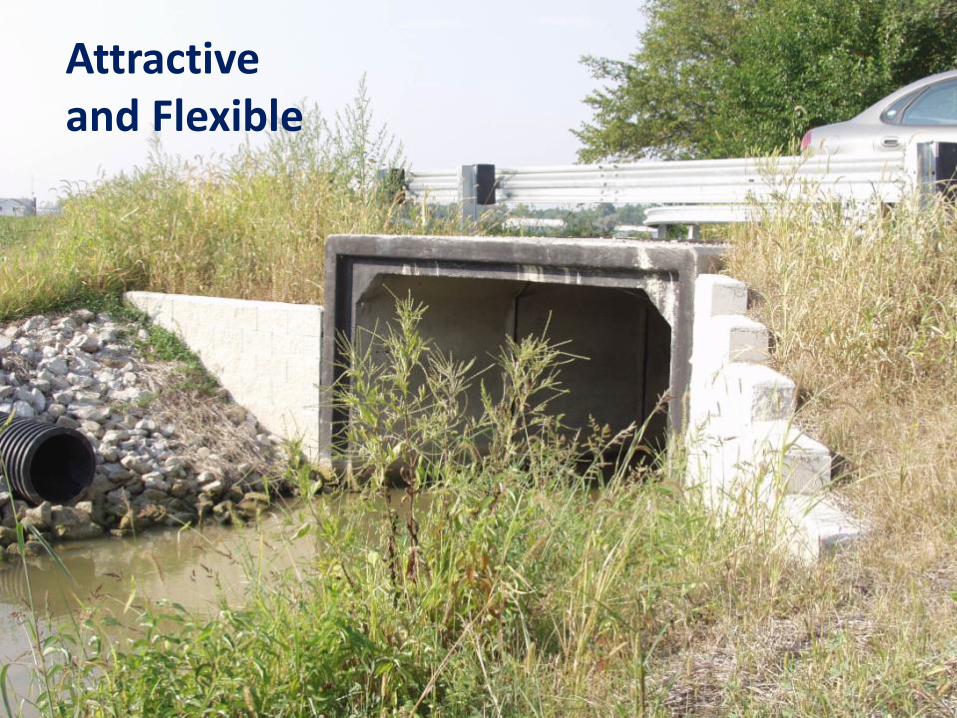
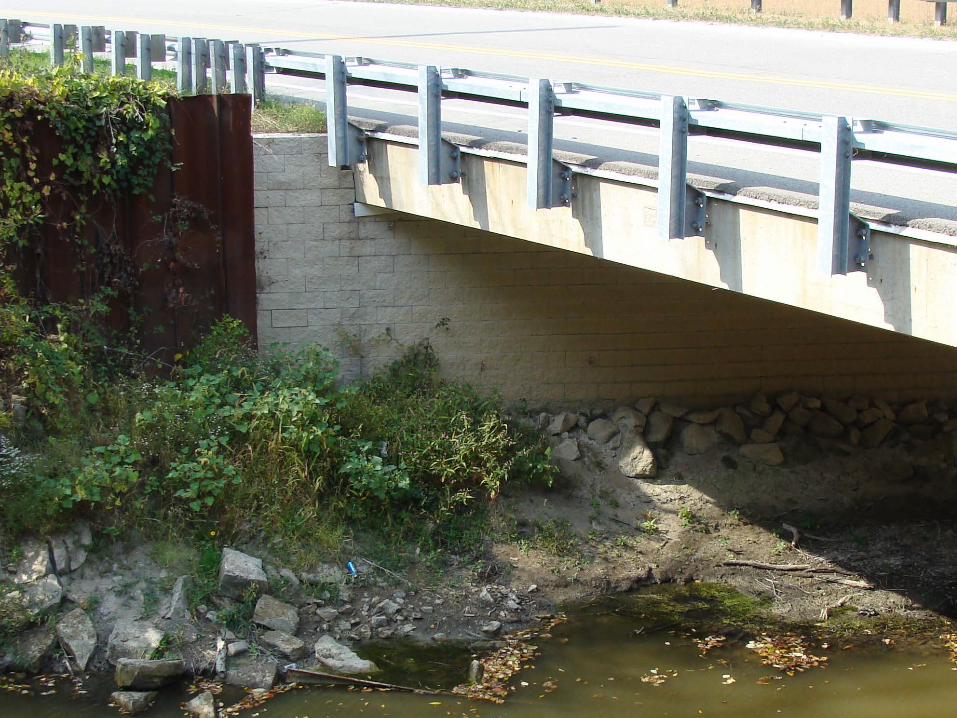
Attractive and Flexible
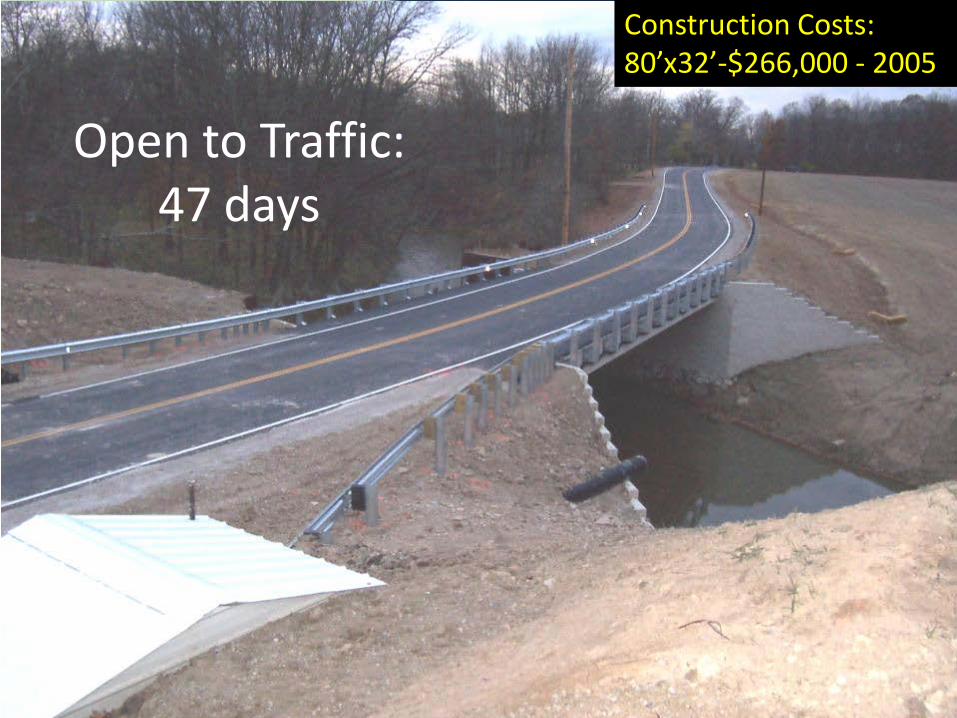
Open to Traffic: 47 days
Construction Costs: 80’x32’-$266,000 - 2005
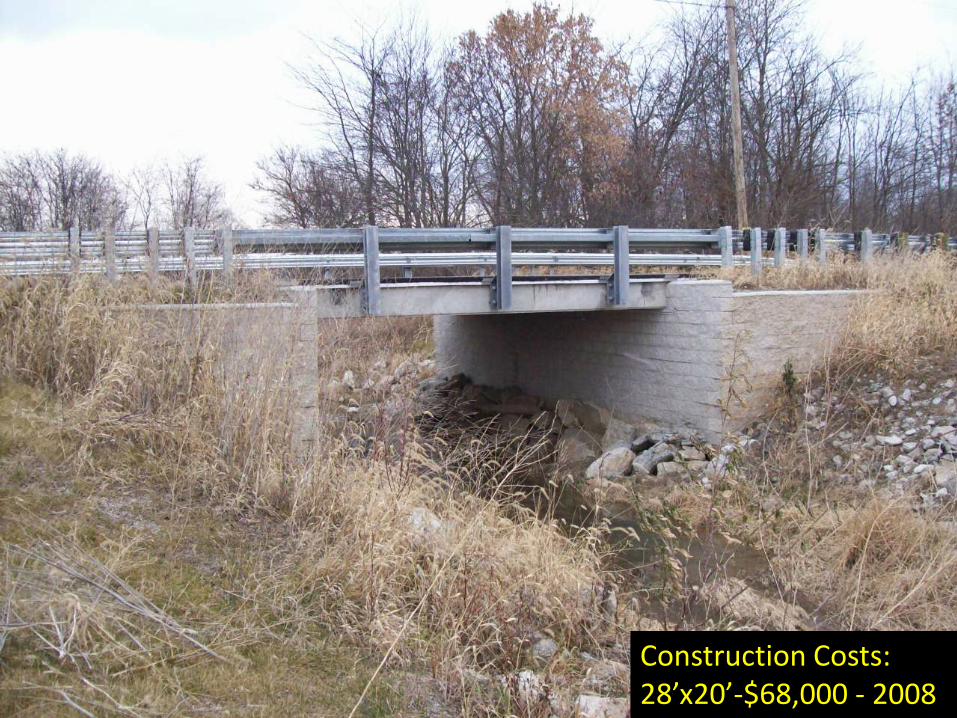
Construction Costs: 28’x20’-$68,000 - 2008
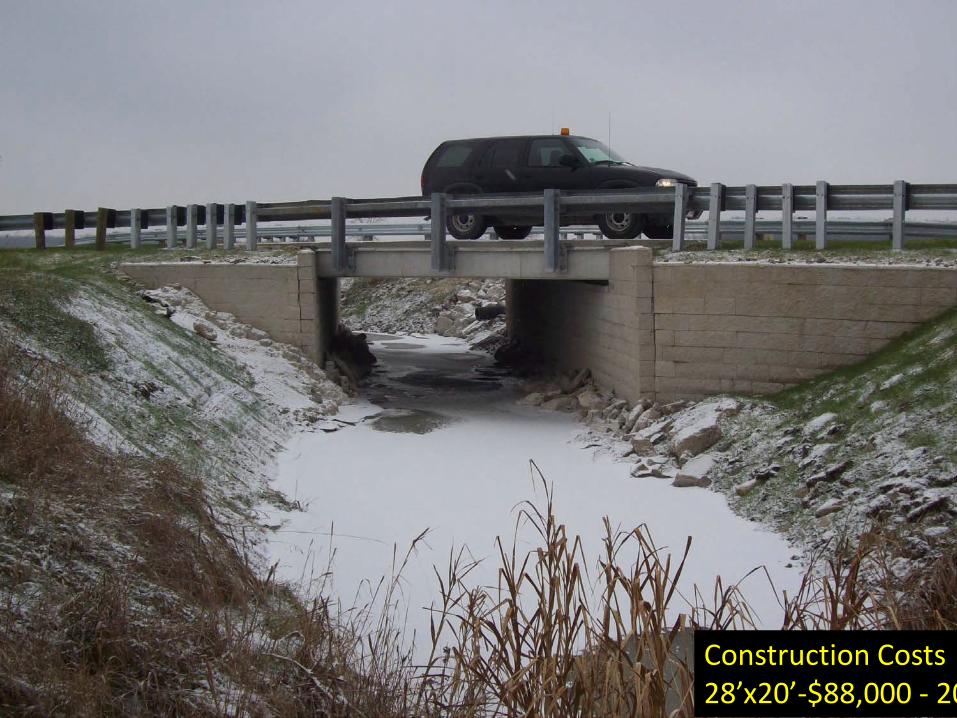
Construction Costs 28’x20’-$88,000 - 20
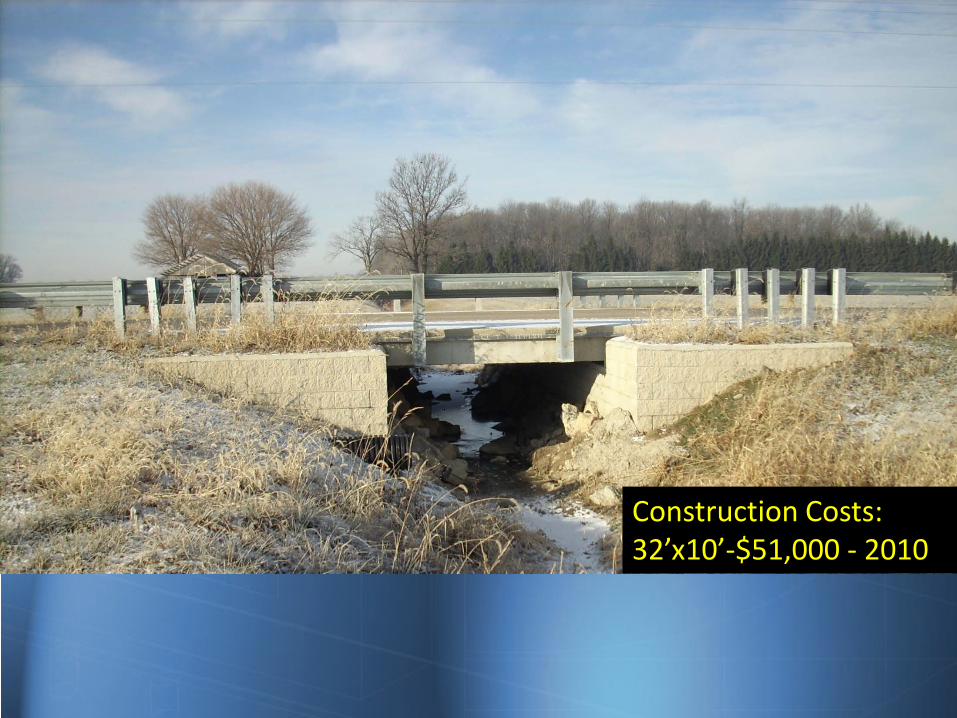
Construction Costs: 32’x10’-$51,000 - 2010
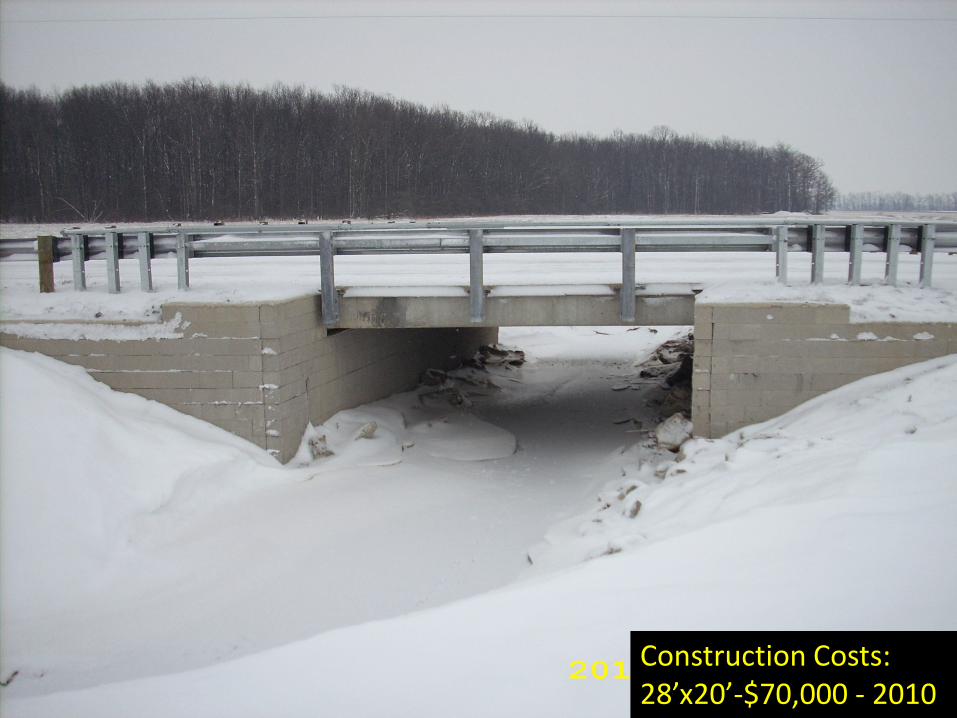
Construction Costs: 28’x20’-$70,000 - 2010
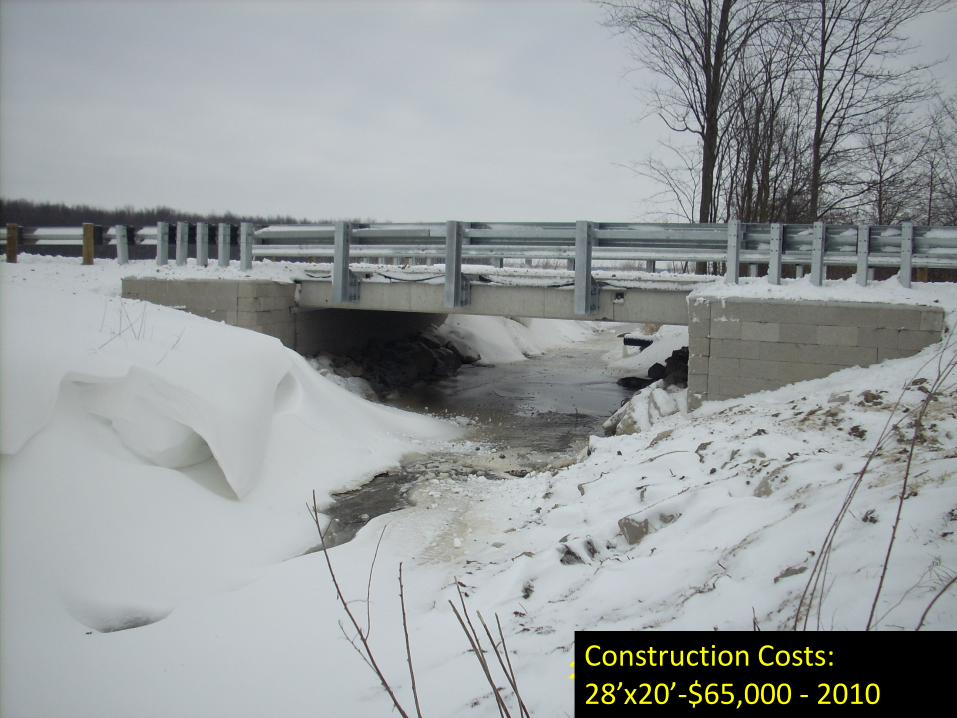
Construction Costs: 28’x20’-$65,000 - 2010
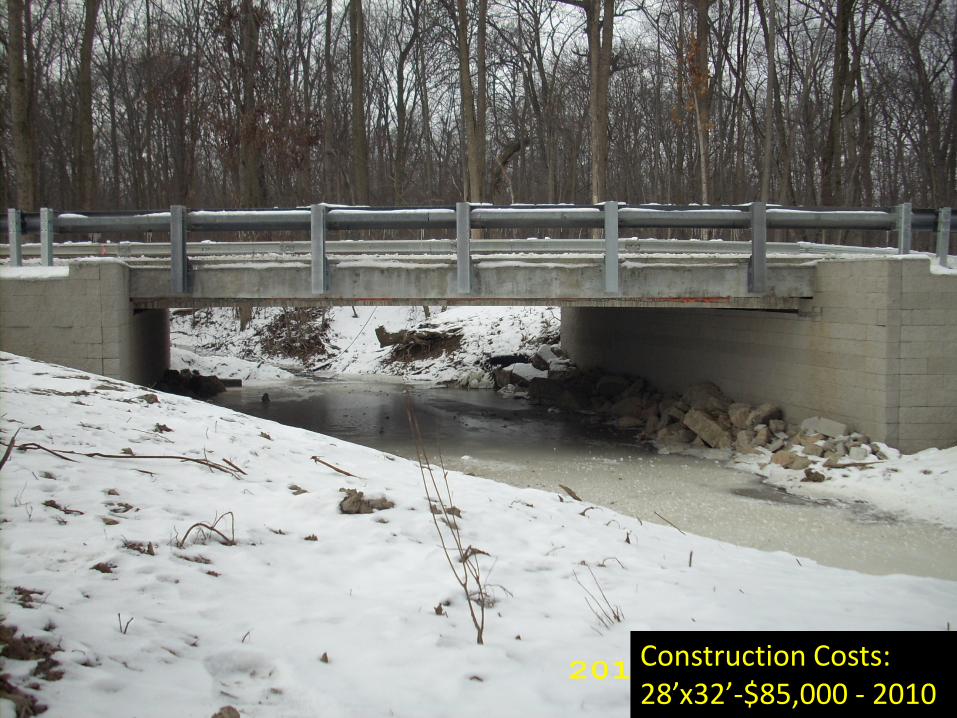
Construction Costs: 28’x32’-$85,000 - 2010
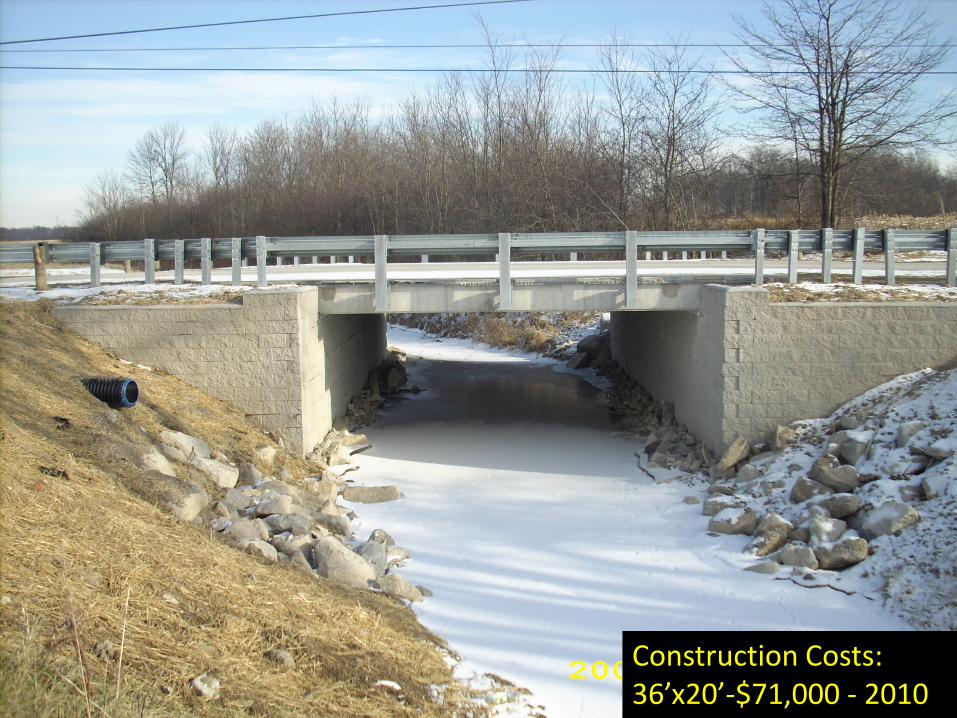
Construction Costs: 36’x20’-$71,000 - 2010
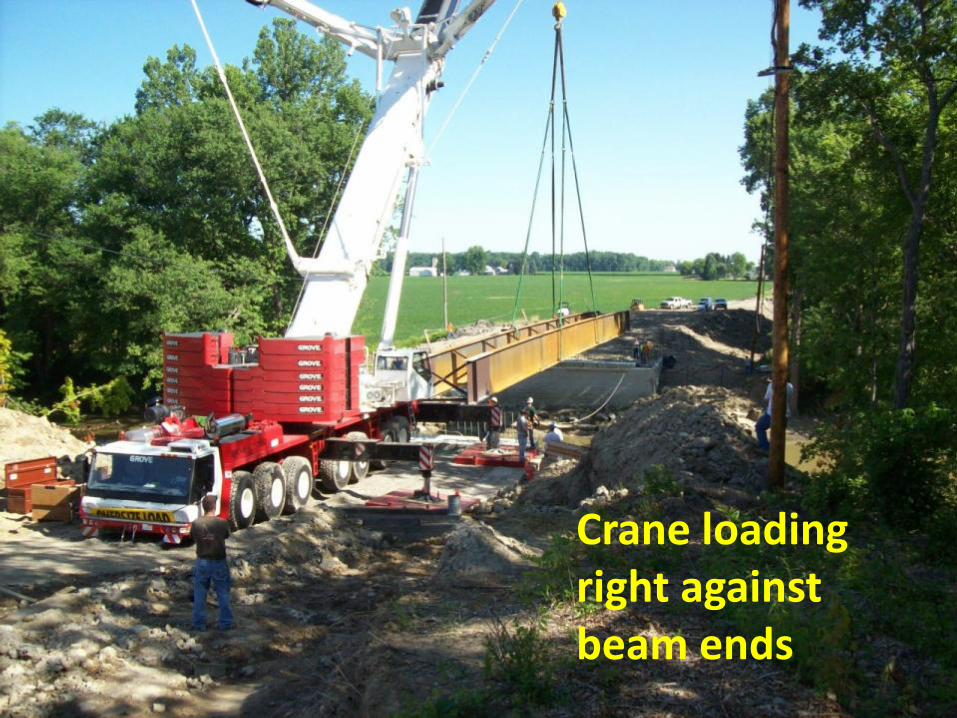
Crane loading right against beam ends
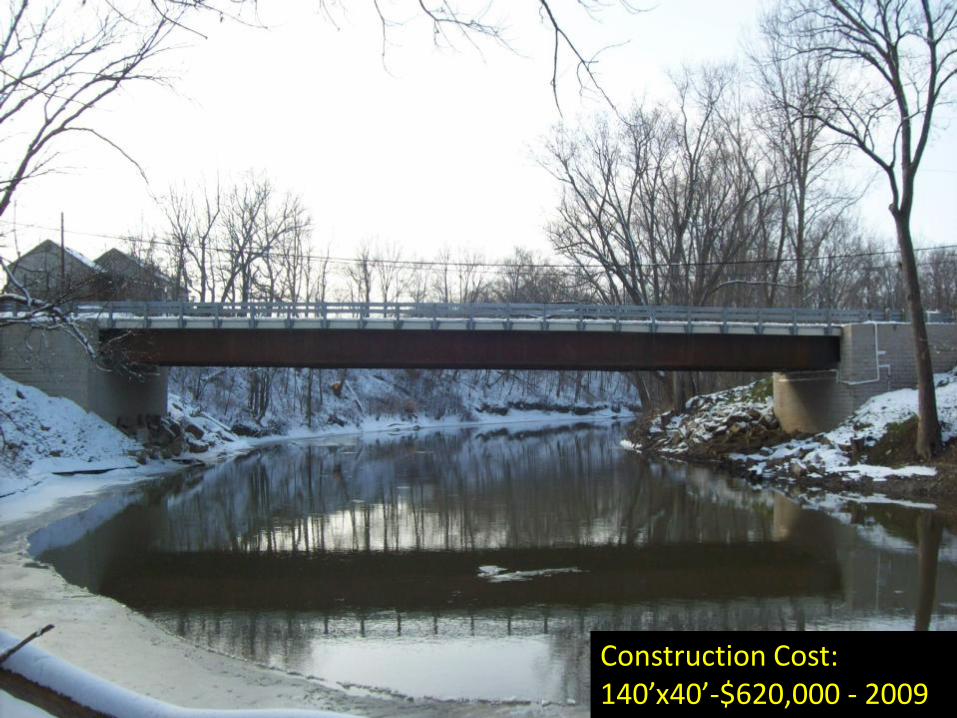
Construction Cost: 140’x40’-$620,000 - 2009

User Perspective St. Lawrence County, NY
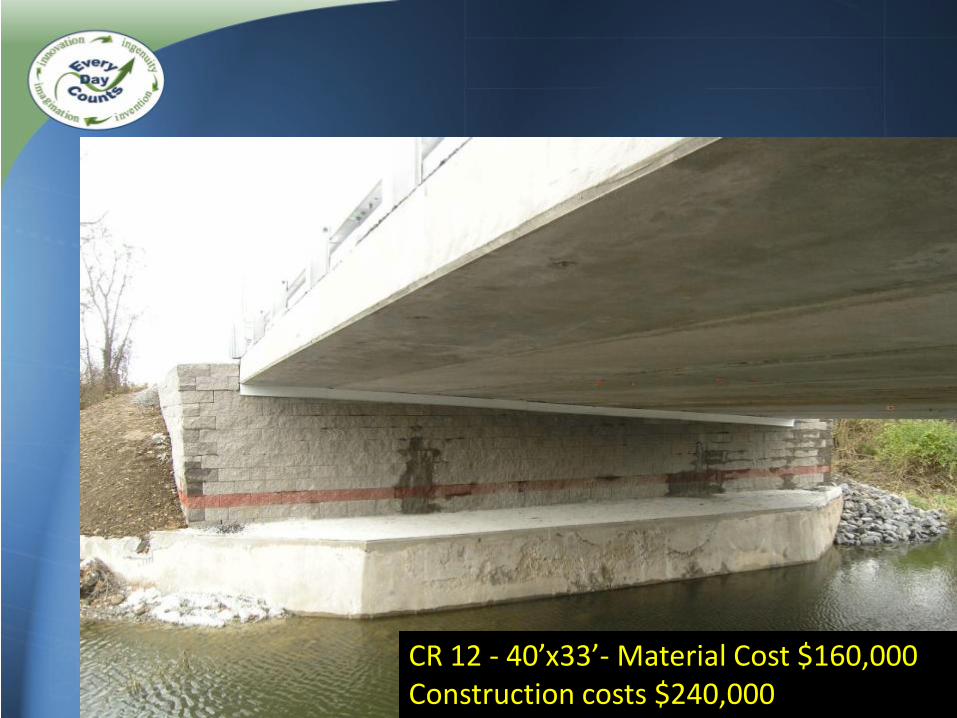
CR 12 - 40’x33’- Material Cost $160,000 Construction costs $240,000
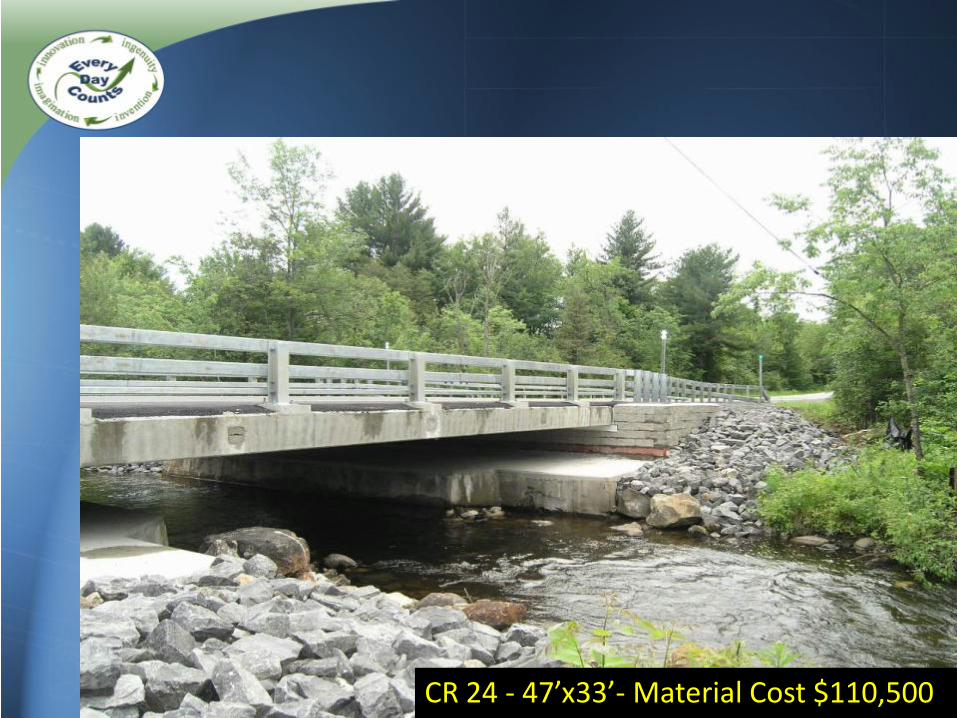
CR 24 - 47’x33’- Material Cost $110,500
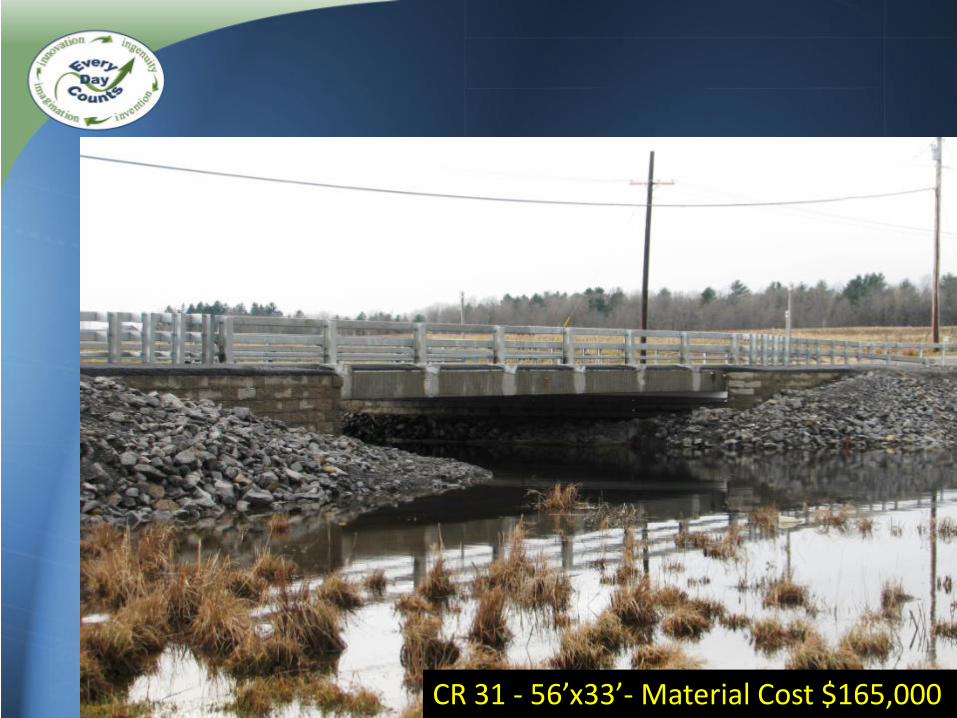
CR 31 - 56’x33’- Material Cost $165,000
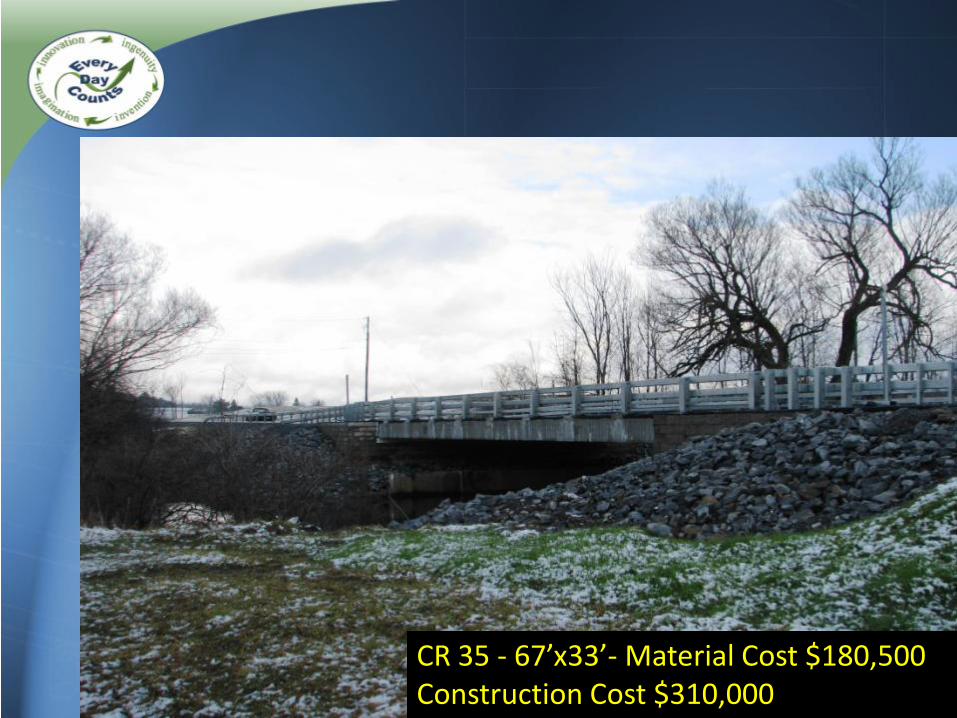
CR 35 - 67’x33’- Material Cost $180,500 Construction Cost $310,000
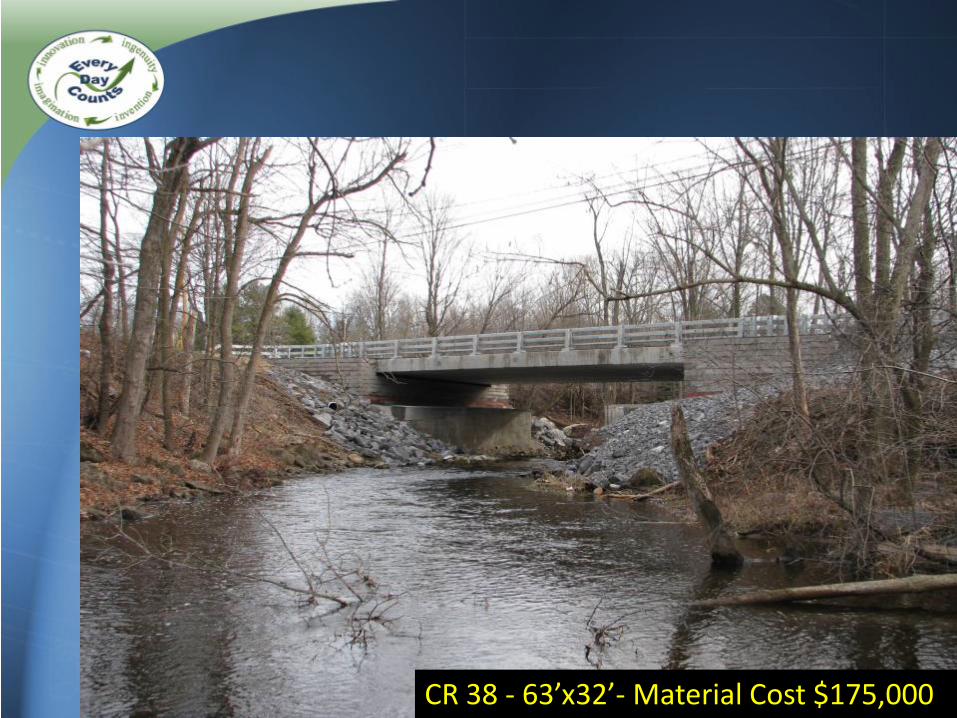
CR 38 - 63’x32’- Material Cost $175,000
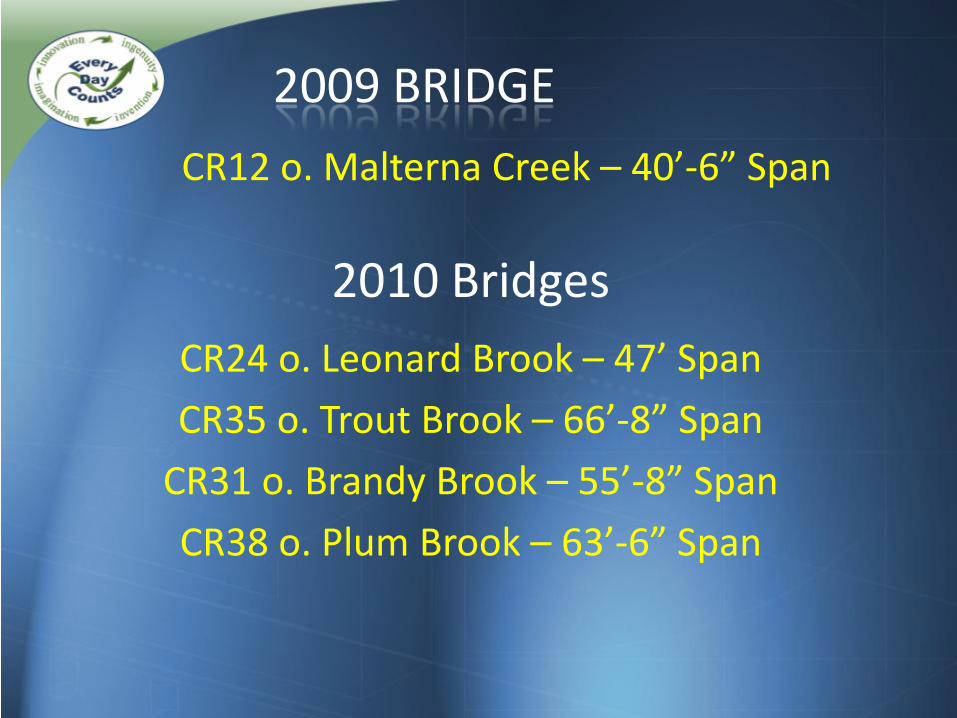
2010 Bridges
CR12 o. Malterna Creek – 40’-6” Span
CR24 o. Leonard Brook – 47’ Span CR35 o. Trout Brook – 66’-8” Span
CR31 o. Brandy Brook – 55’-8” Span CR38 o. Plum Brook – 63’-6” Span
2009 BRIDGE
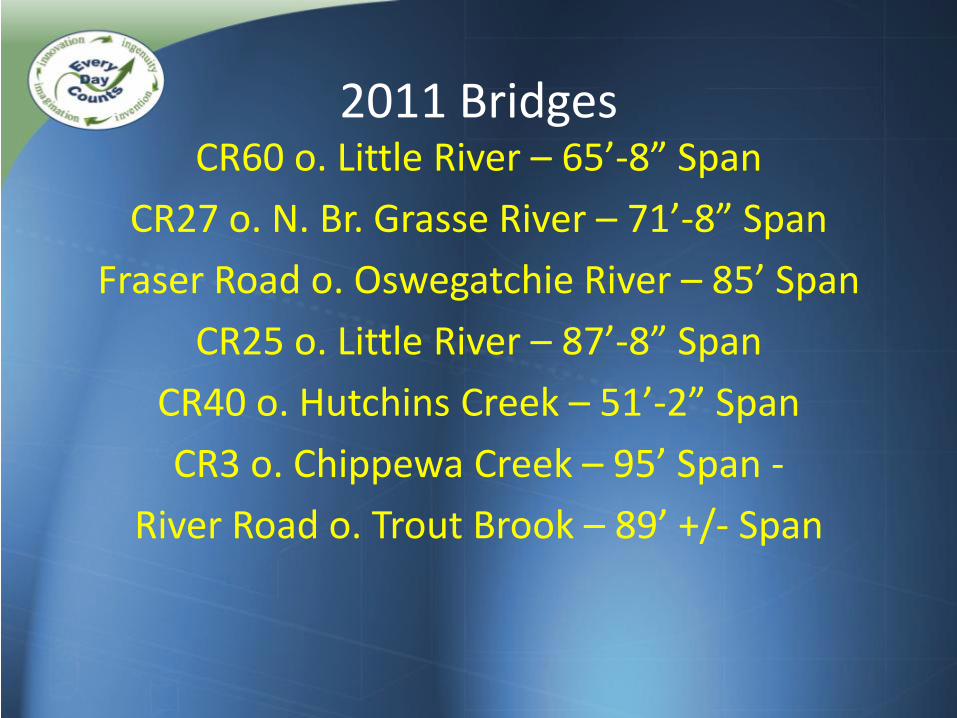
CR60 o. Little River – 65’-8” Span CR27 o. N. Br. Grasse River – 71’-8” Span
Fraser Road o. Oswegatchie River – 85’ Span CR25 o. Little River – 87’-8” Span
CR40 o. Hutchins Creek – 51’-2” Span CR3 o. Chippewa Creek – 95’ Span -
River Road o. Trout Brook – 89’ +/- Span
2011 Bridges
CR47 o. Trout Brook (IBRD) – 110’-0” Span CR20 o. Tanner Creek – 65’-0” Span Proposed
2012 Bridges
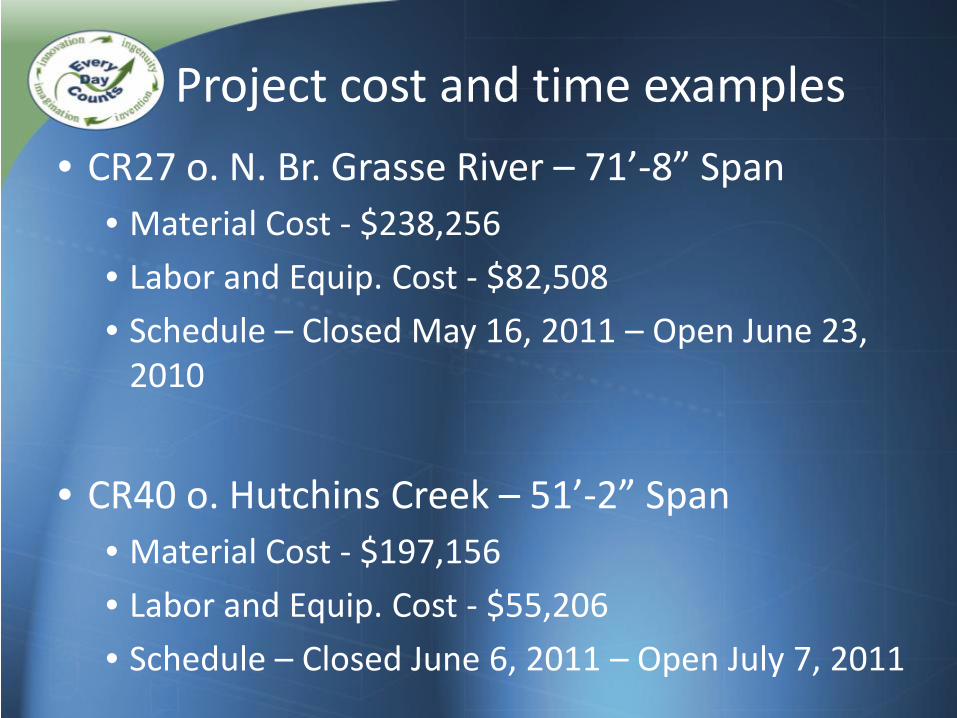
Project cost and time examples • CR27 o. N. Br. Grasse River – 71’-8” Span
• Material Cost - $238,256 • Labor and Equip. Cost - $82,508 • Schedule – Closed May 16, 2011 – Open June 23,
2010
• CR40 o. Hutchins Creek – 51’-2” Span
• Material Cost - $197,156 • Labor and Equip. Cost - $55,206 • Schedule – Closed June 6, 2011 – Open July 7, 2011
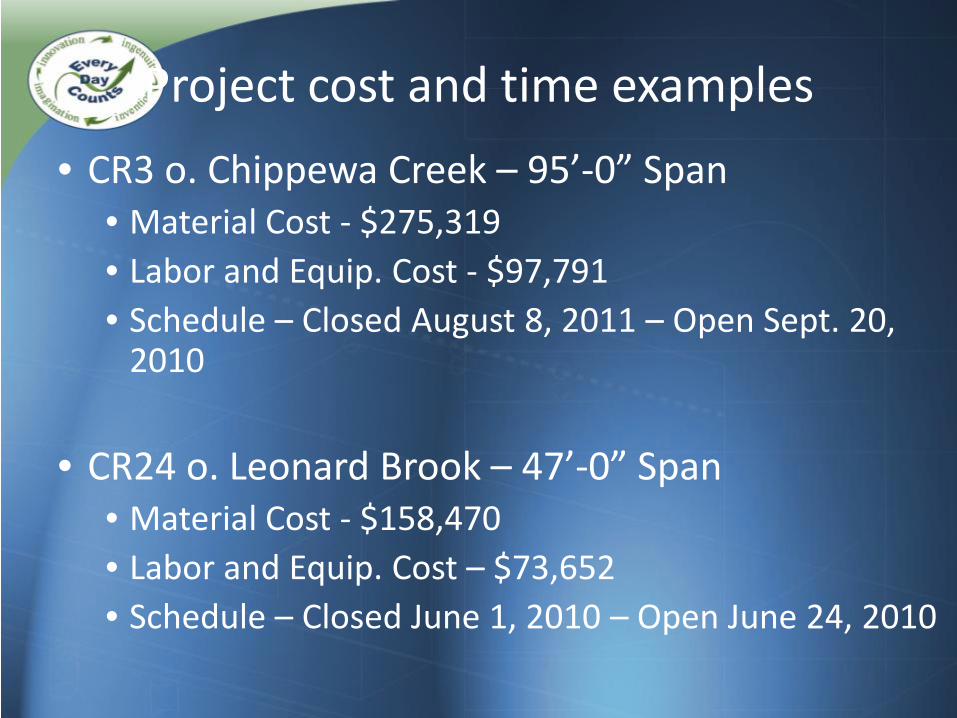
Project cost and time examples • CR3 o. Chippewa Creek – 95’-0” Span
• Material Cost - $275,319 • Labor and Equip. Cost - $97,791 • Schedule – Closed August 8, 2011 – Open Sept. 20,
2010
• CR24 o. Leonard Brook – 47’-0” Span • Material Cost - $158,470 • Labor and Equip. Cost – $73,652 • Schedule – Closed June 1, 2010 – Open June 24, 2010
User Perspective National Park Service
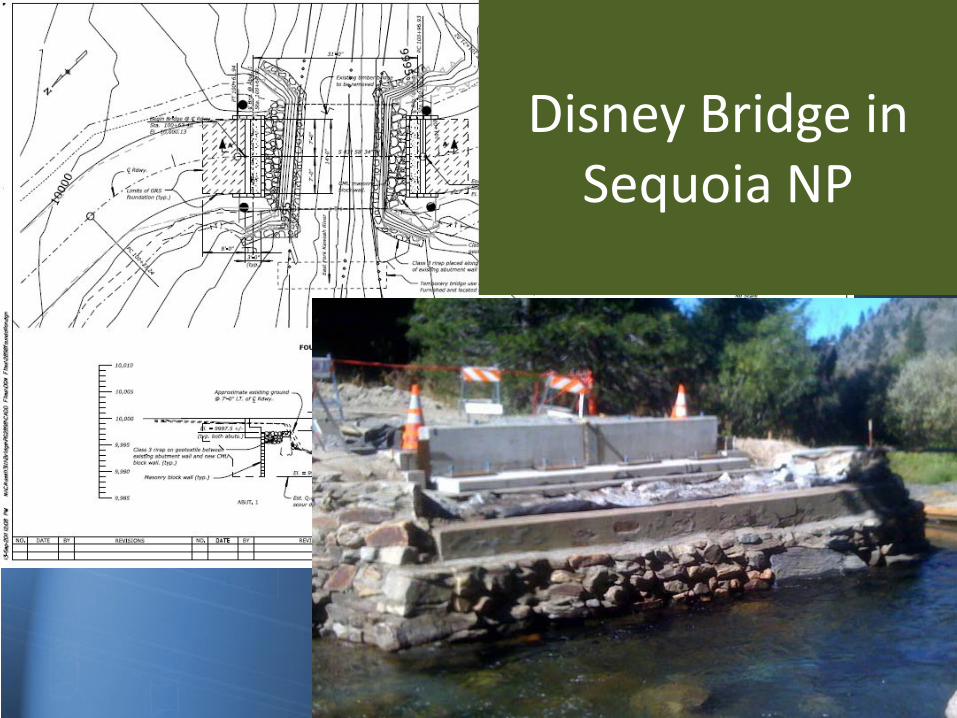
Disney Bridge in Sequoia NP
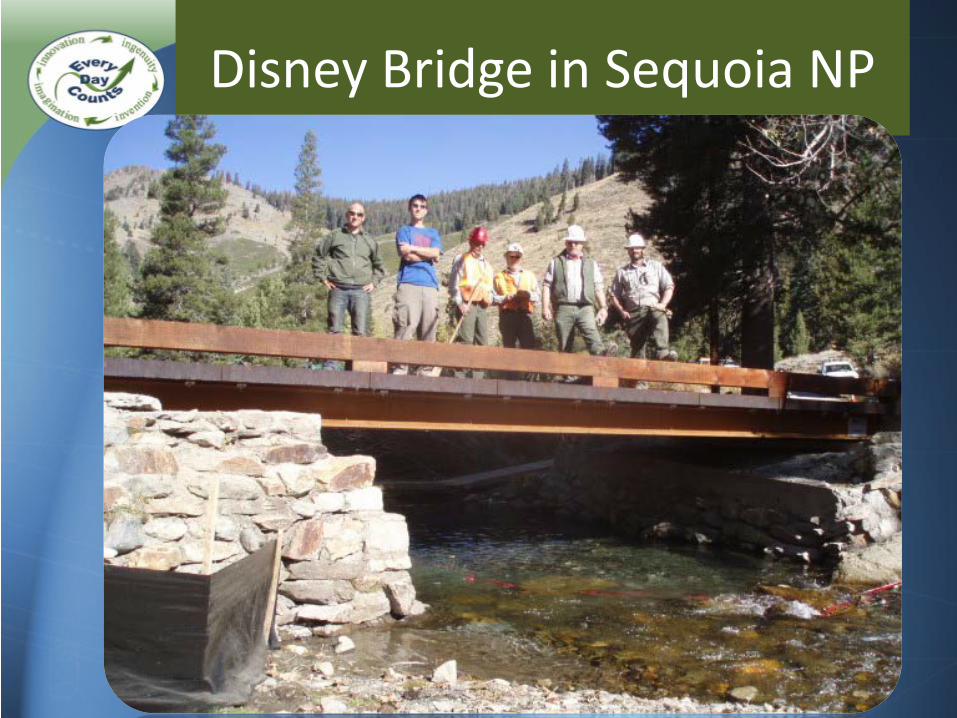
Disney Bridge in Sequoia NP
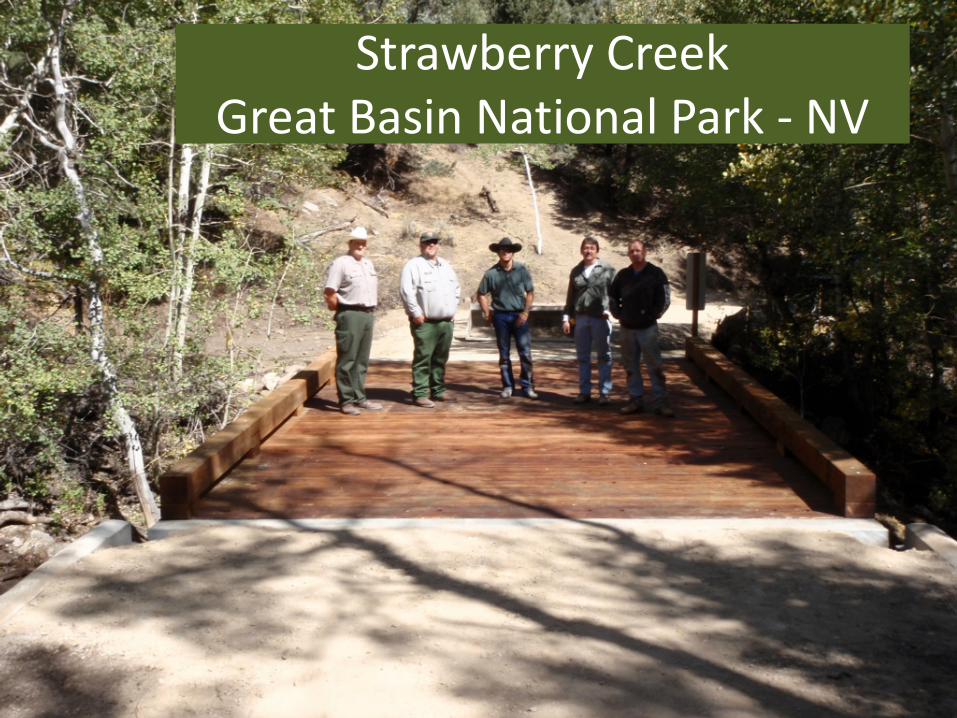
Strawberry Creek Great Basin National Park - NV
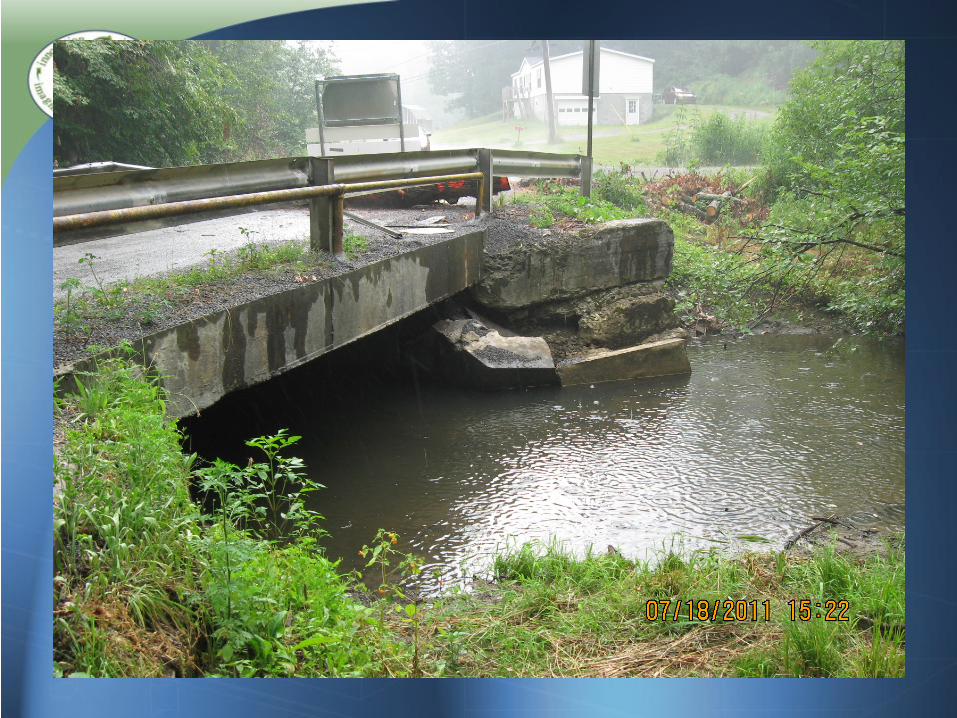
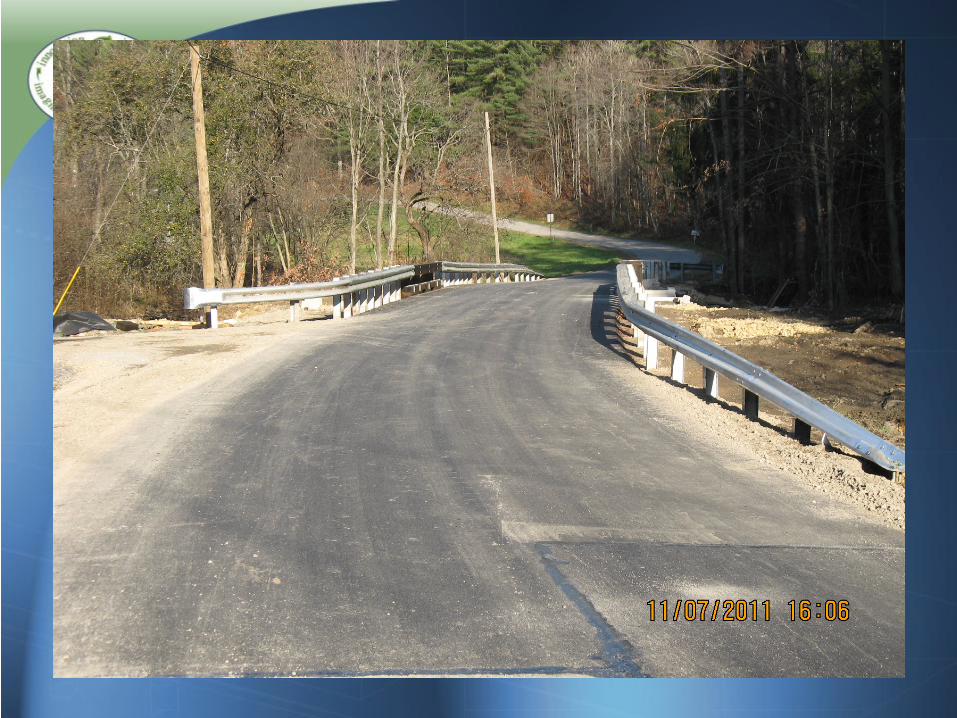
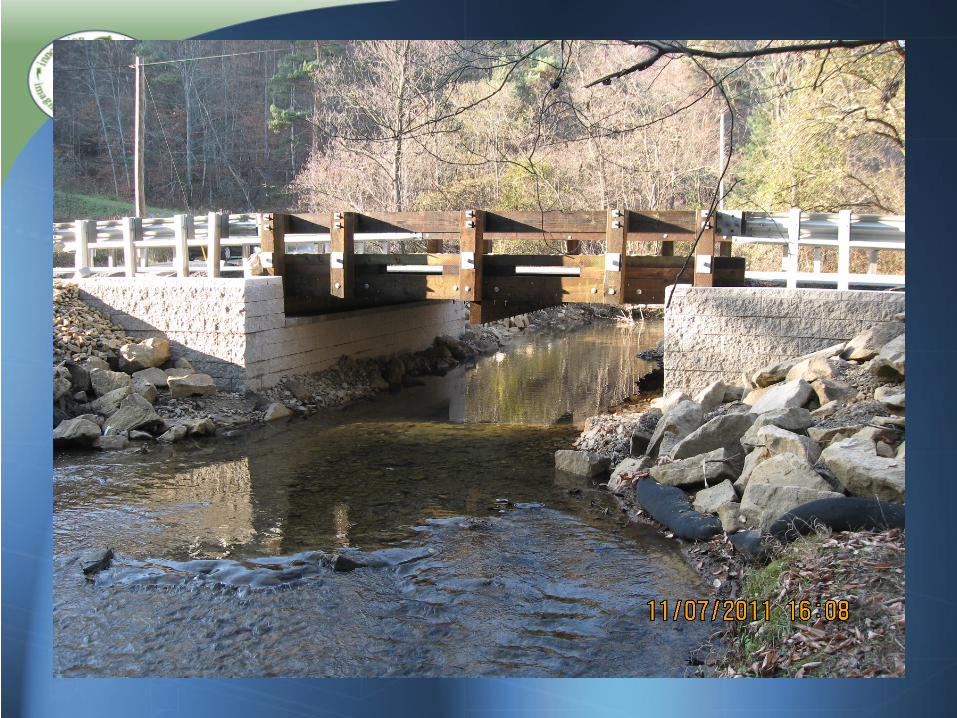
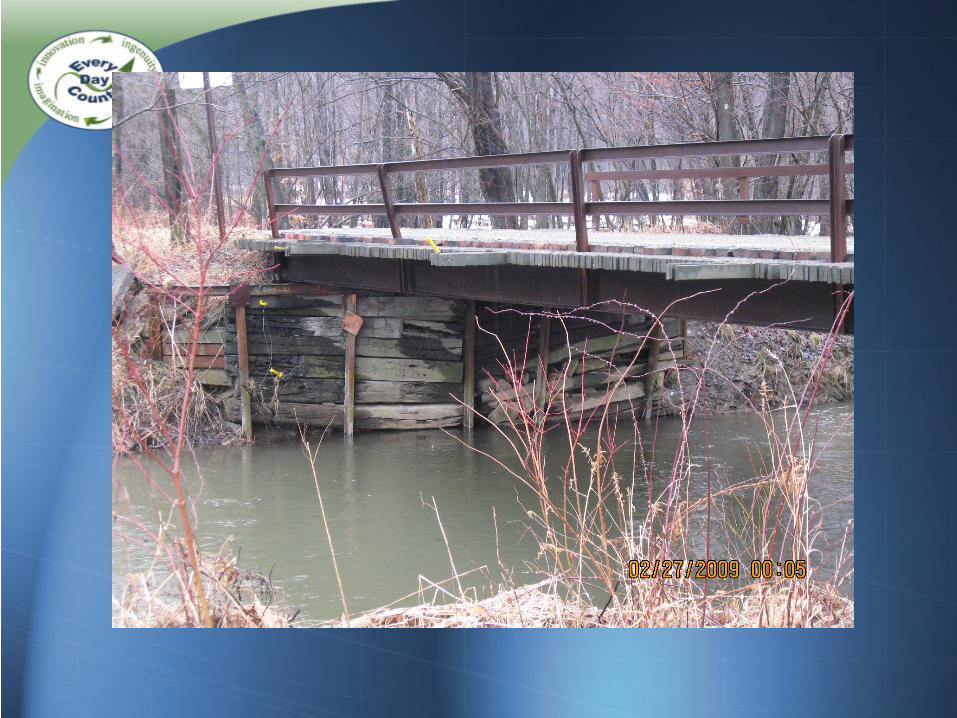
User Perspective Huston Township, Pennsylvania
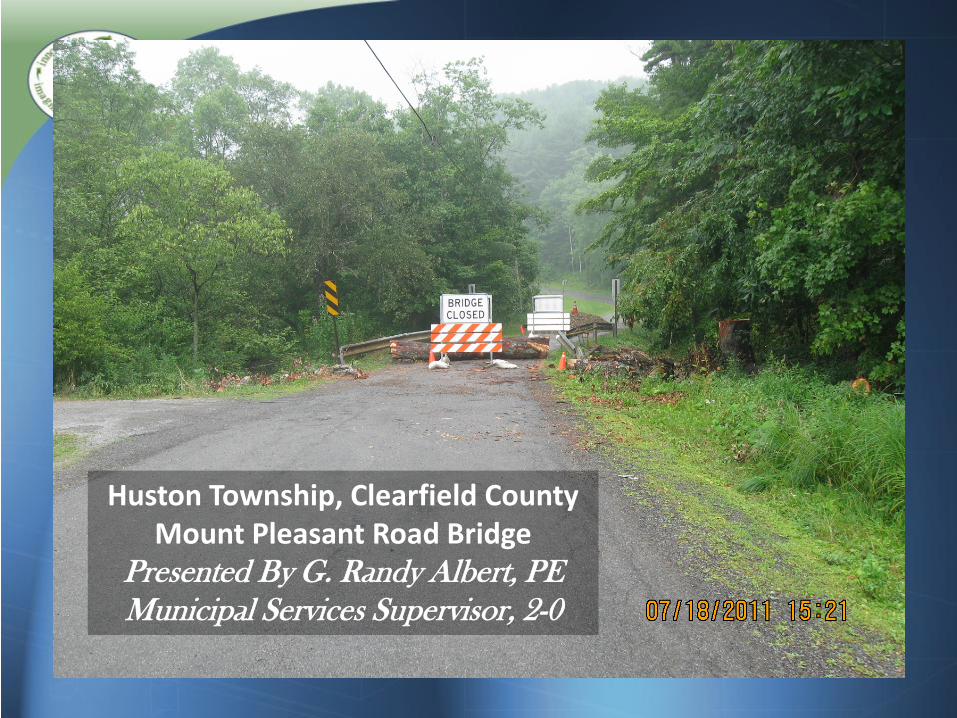
Huston Township, Clearfield County Mount Pleasant Road Bridge
Presented By G. Randy Albert, PE Municipal Services Supervisor, 2-0
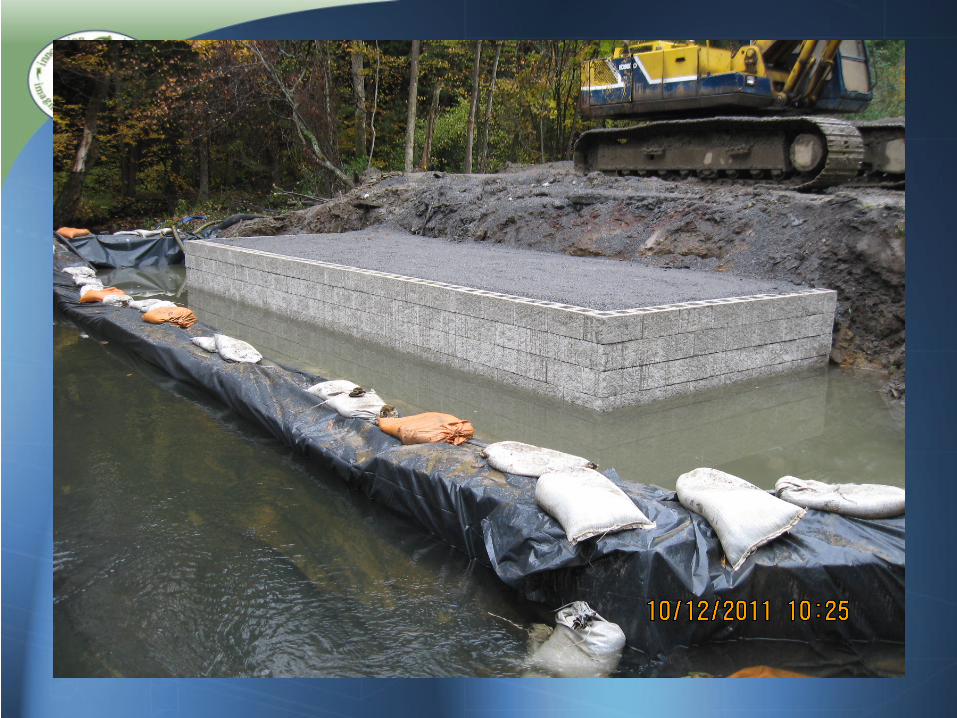
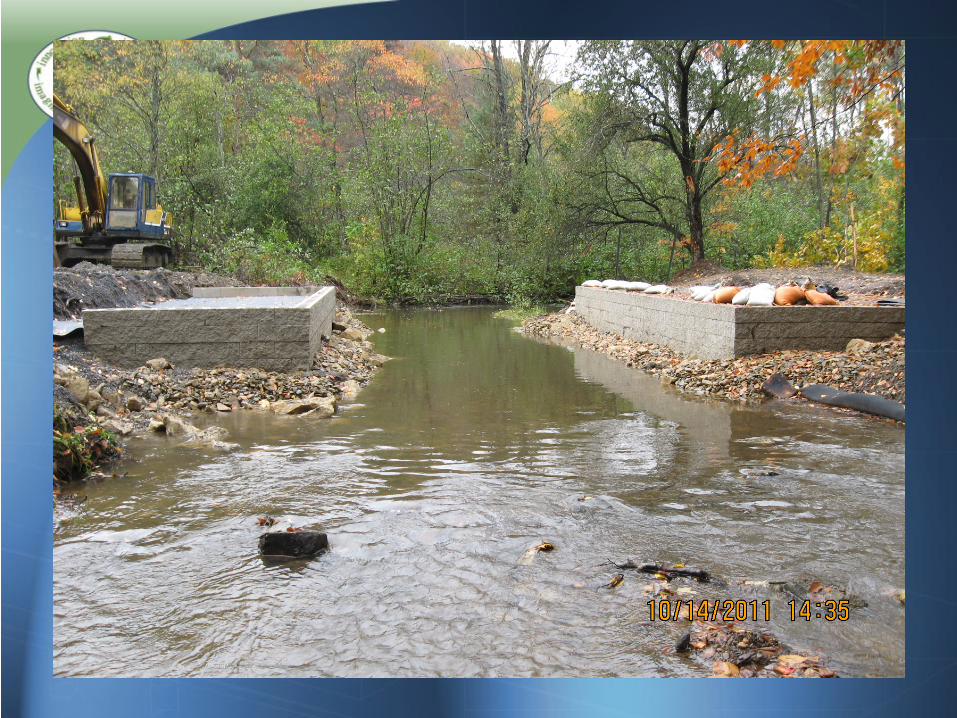
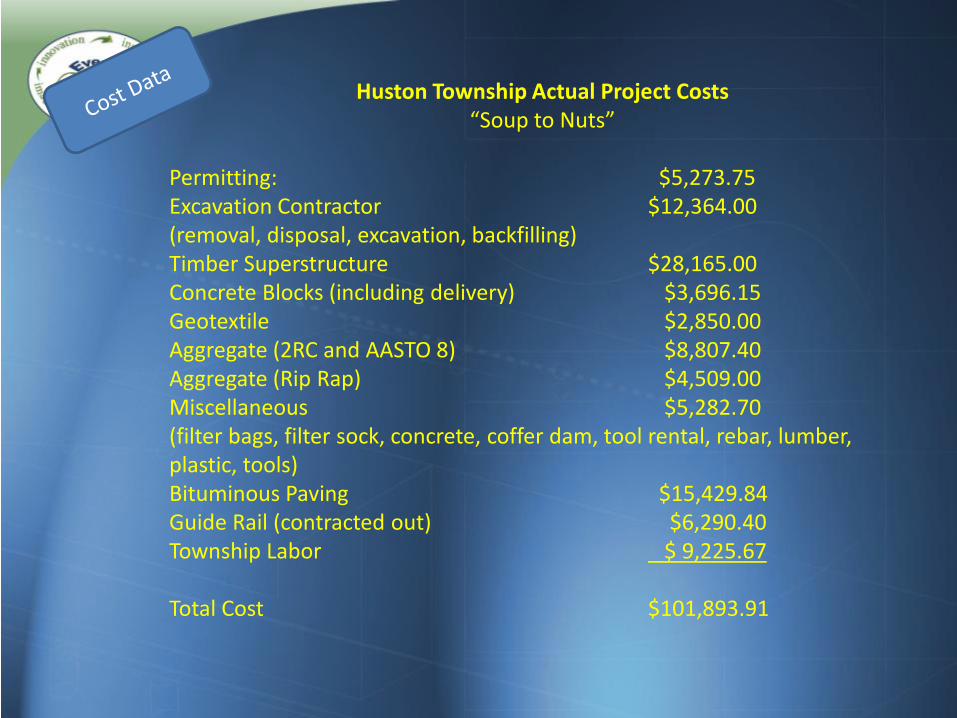
Huston Township Actual Project Costs “Soup to Nuts”
Permitting: $5,273.75 Excavation Contractor $12,364.00 (removal, disposal, excavation, backfilling) Timber Superstructure $28,165.00 Concrete Blocks (including delivery) $3,696.15 Geotextile $2,850.00 Aggregate (2RC and AASTO 8) $8,807.40 Aggregate (Rip Rap) $4,509.00 Miscellaneous $5,282.70 (filter bags, filter sock, concrete, coffer dam, tool rental, rebar, lumber, plastic, tools) Bituminous Paving $15,429.84 Guide Rail (contracted out) $6,290.40 Township Labor $ 9,225.67 Total Cost $101,893.91
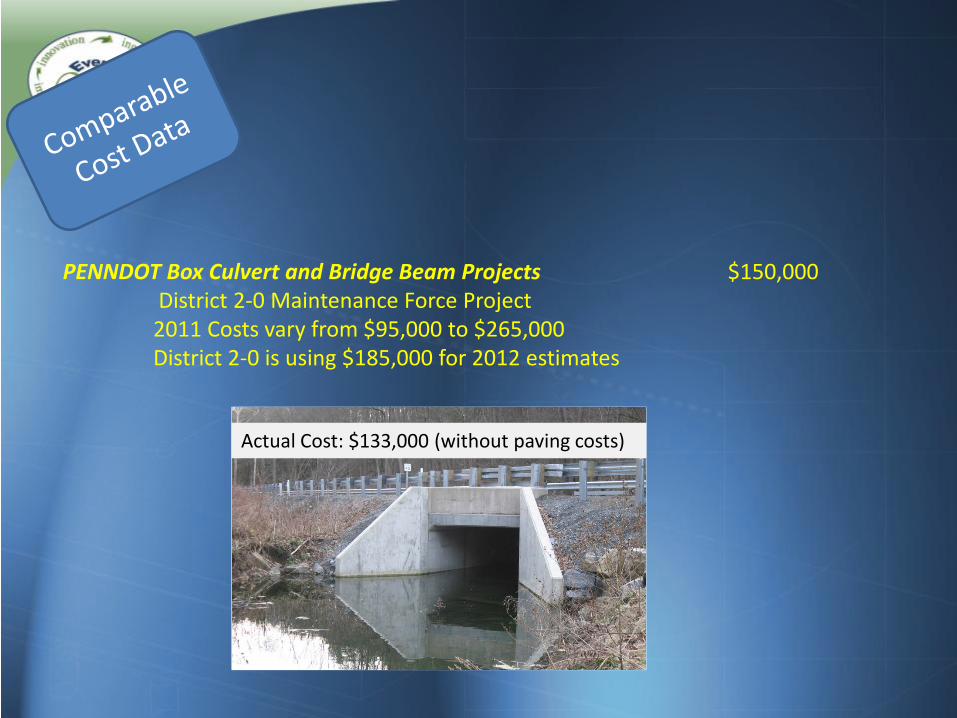
PENNDOT Box Culvert and Bridge Beam Projects $150,000 District 2-0 Maintenance Force Project 2011 Costs vary from $95,000 to $265,000 District 2-0 is using $185,000 for 2012 estimates
Actual Cost: $133,000 (without paving costs)
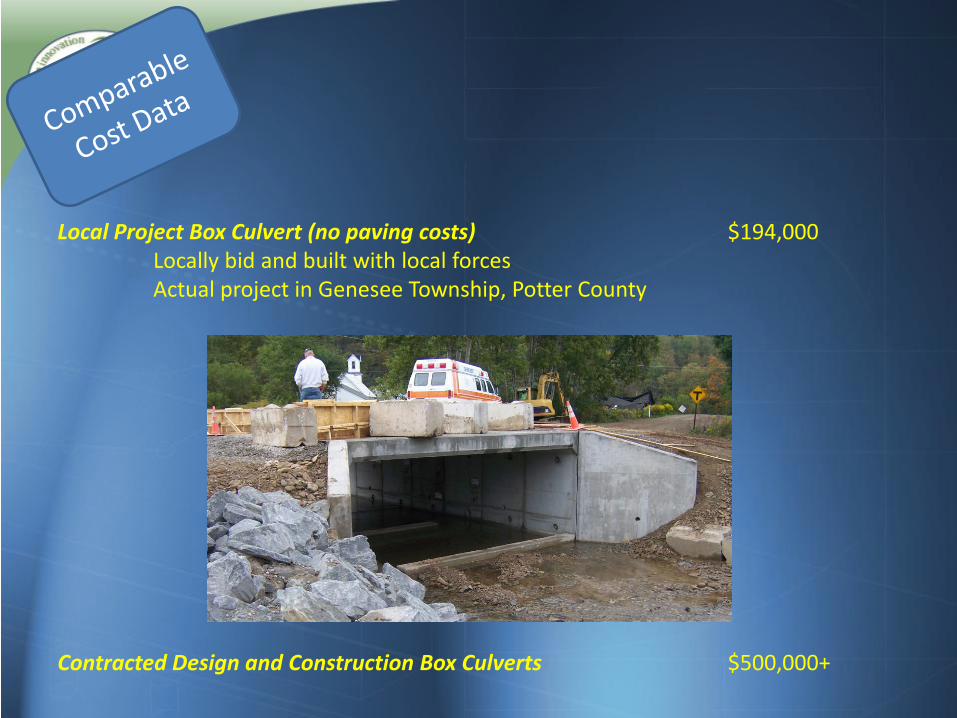
Local Project Box Culvert (no paving costs) $194,000 Locally bid and built with local forces Actual project in Genesee Township, Potter County Contracted Design and Construction Box Culverts $500,000+
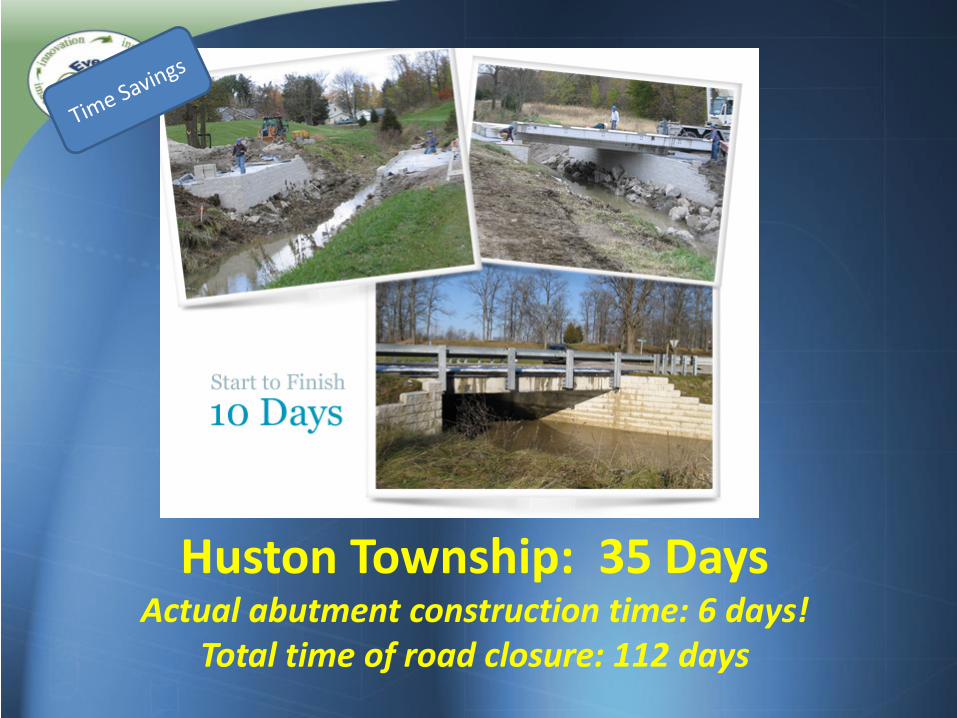
Huston Township: 35 Days Actual abutment construction time: 6 days!
Total time of road closure: 112 days
PROGRESS TOWARD 2012 EDC GRS IBD GOALS
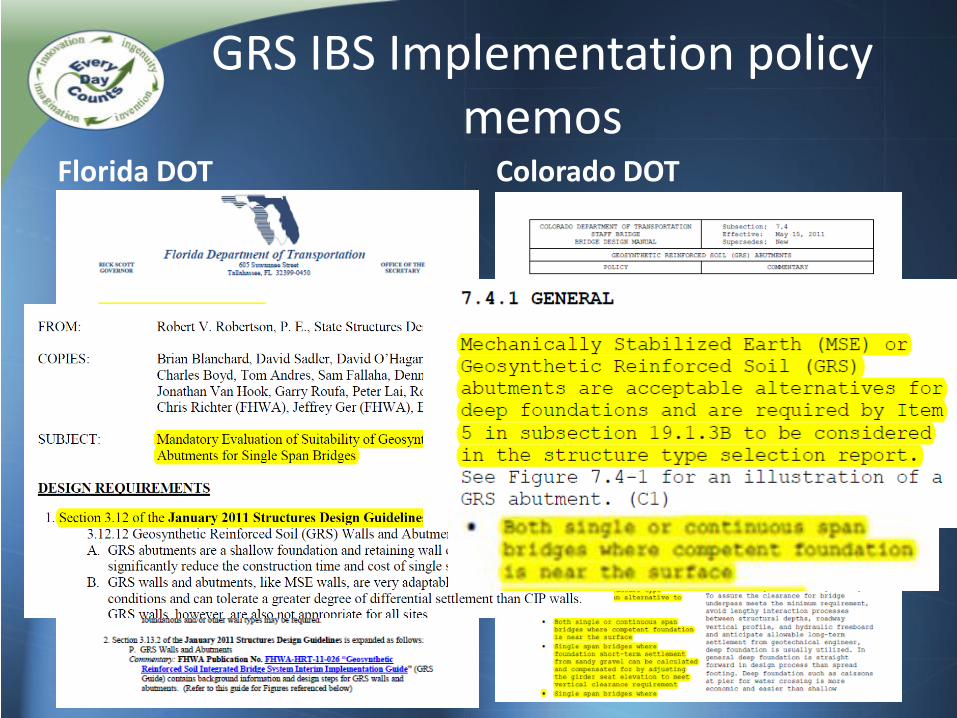
GRS IBS Implementation policy memos
Florida DOT Colorado DOT
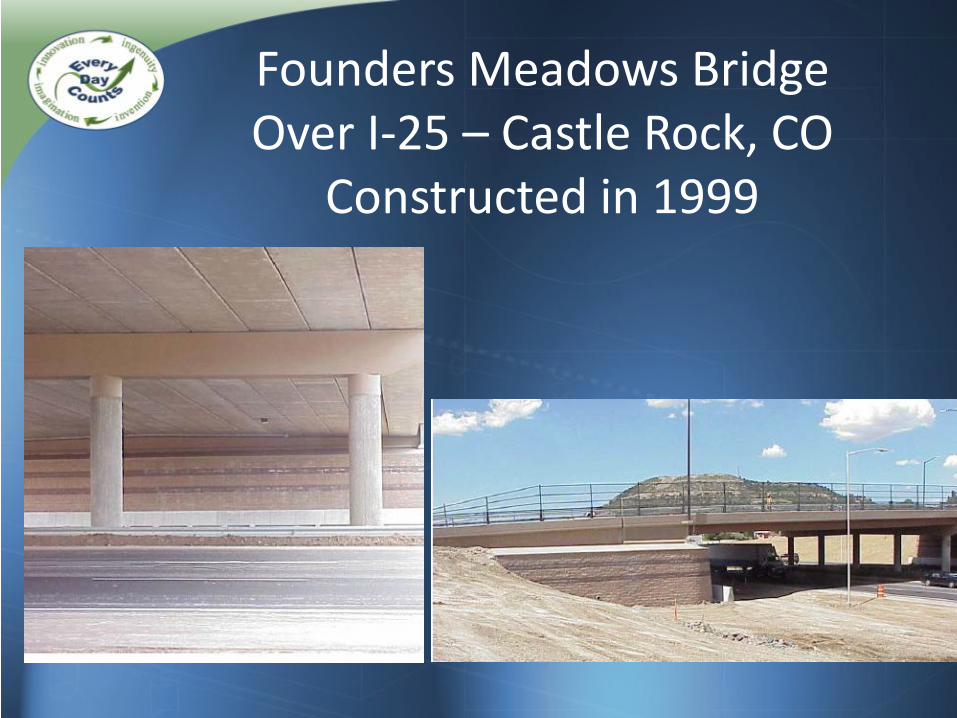
Founders Meadows Bridge Over I-25 – Castle Rock, CO
Constructed in 1999
CA
AZ
CO
NM
TX
OK AR
LA
MO KY
AL GA
FL
VA
OH
MI
VT AK
MT
NV
ME
WA
OR
UT KS
ID WY
ND
SD
MN
NE
WI
IA IL IN
MS
TN SC
NC
WV
PA
NY
CT NJ DE MD DC
MA NH
PR
HI
RI
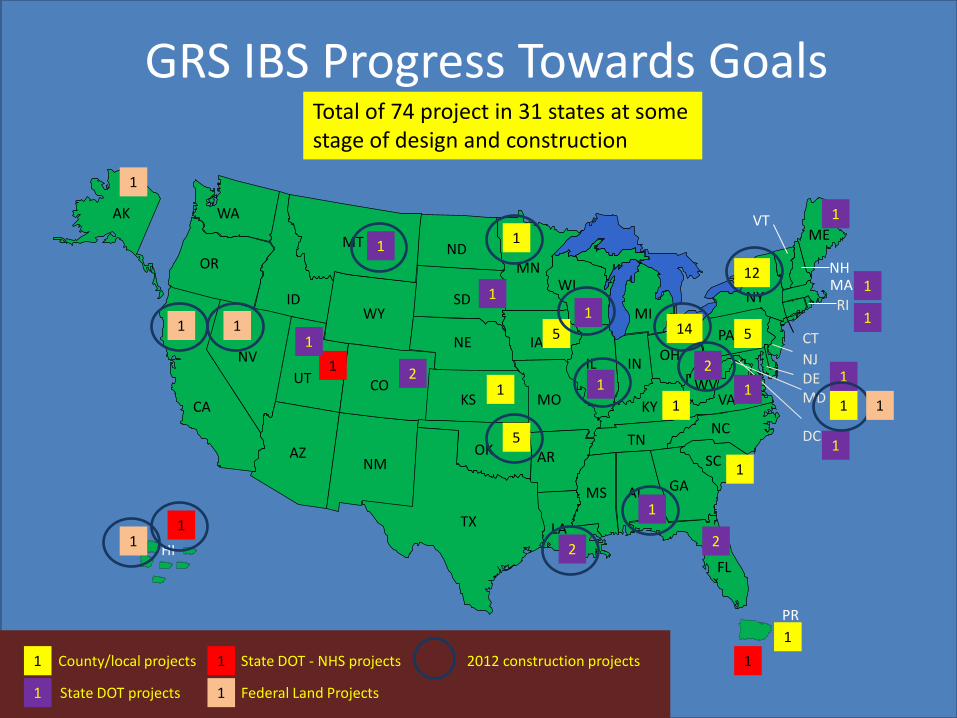
GRS IBS Progress Towards Goals
1
1
1 2
5
12
14
2
5
2
1
1
1
1 1
1
Total of 74 project in 31 states at some stage of design and construction
1 1
5
1
1 1
1
1
1
2
1
1
1
1 1
1
1
1
1
1 County/local projects
State DOT projects
State DOT - NHS projects
Federal Land Projects
1
1
2012 construction projects
1
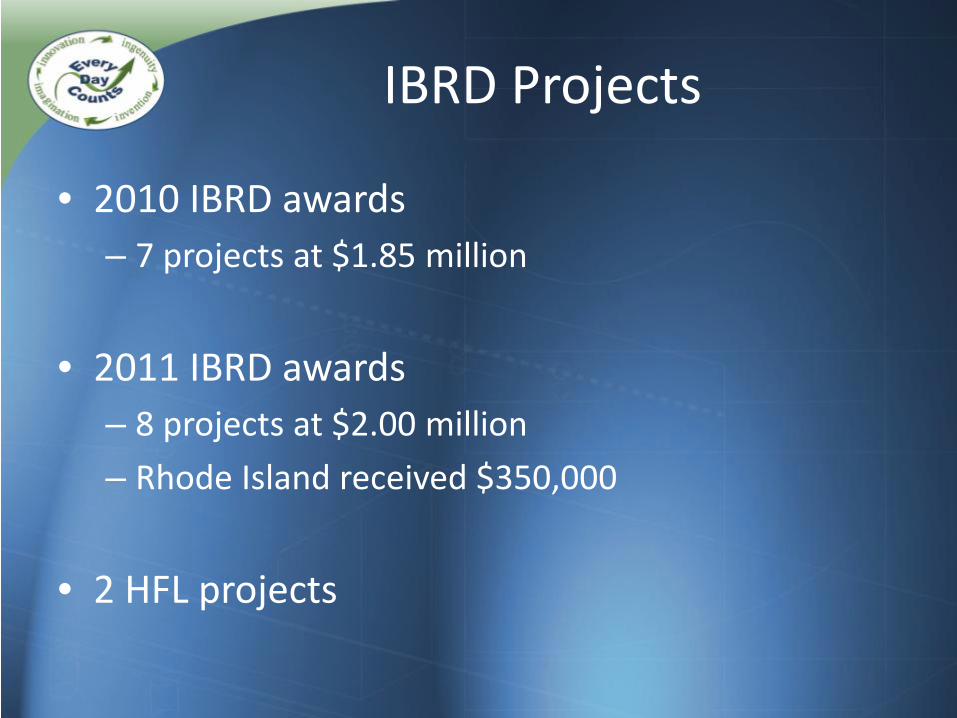
IBRD Projects
• 2010 IBRD awards – 7 projects at $1.85 million
• 2011 IBRD awards – 8 projects at $2.00 million – Rhode Island received $350,000
• 2 HFL projects
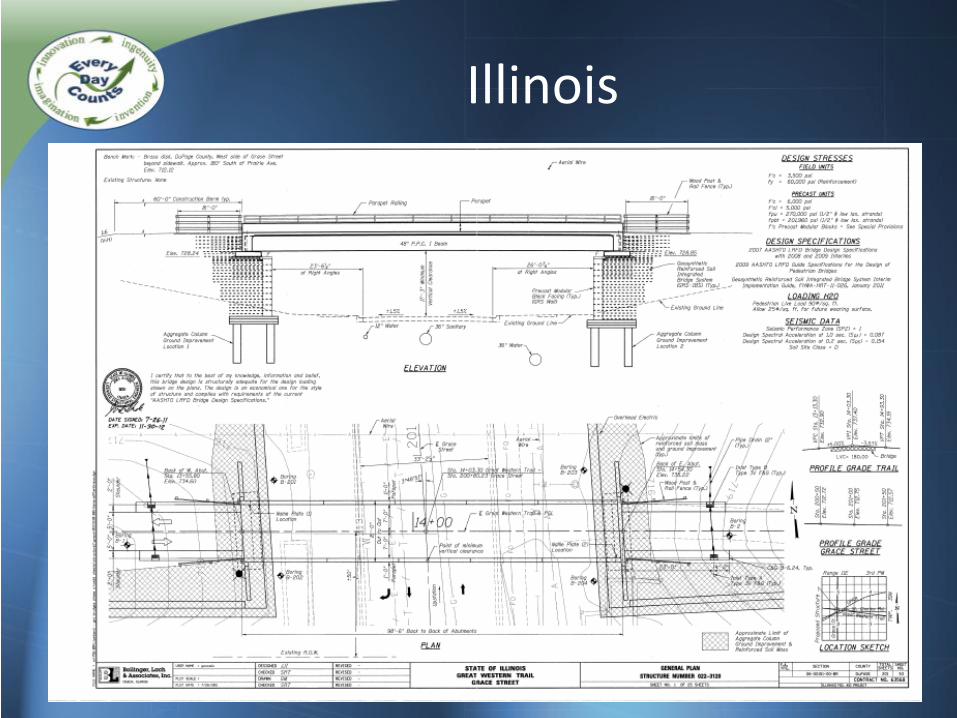
Illinois
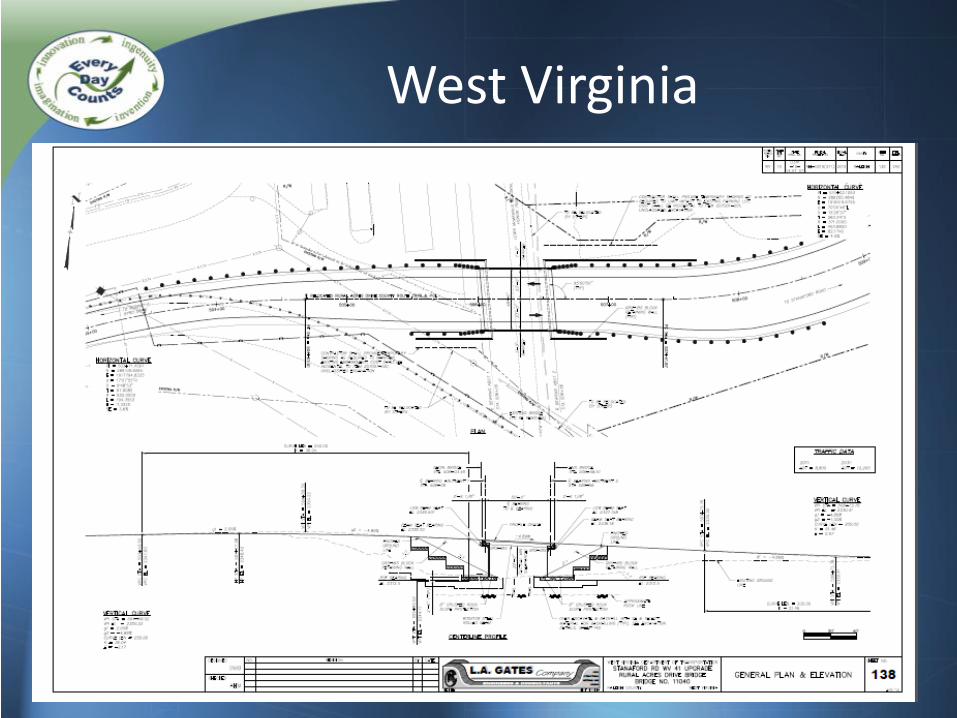
West Virginia
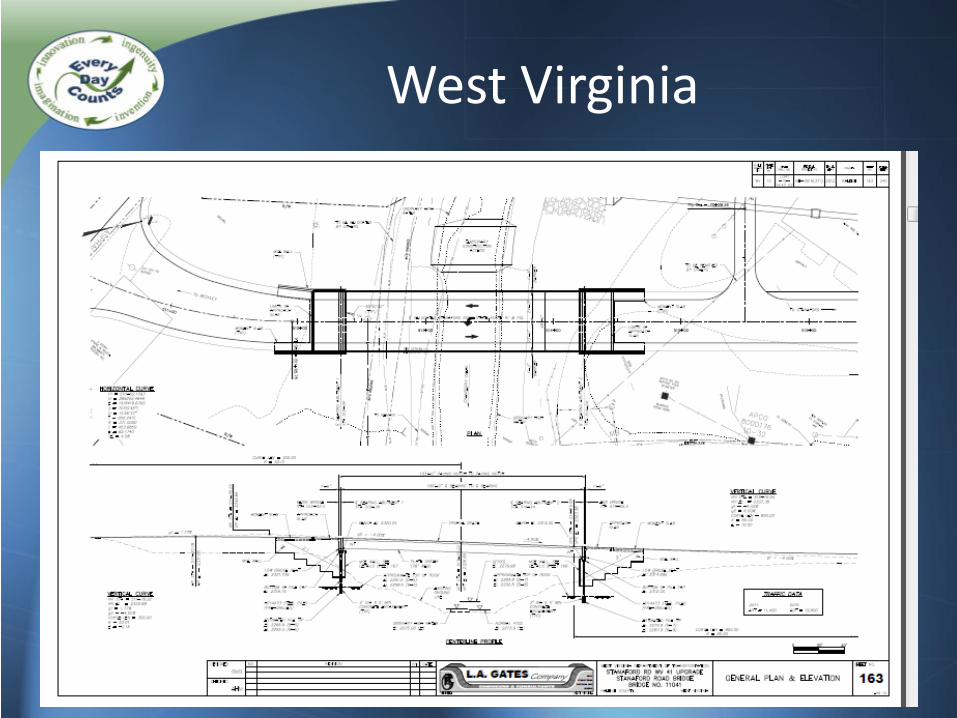
West Virginia
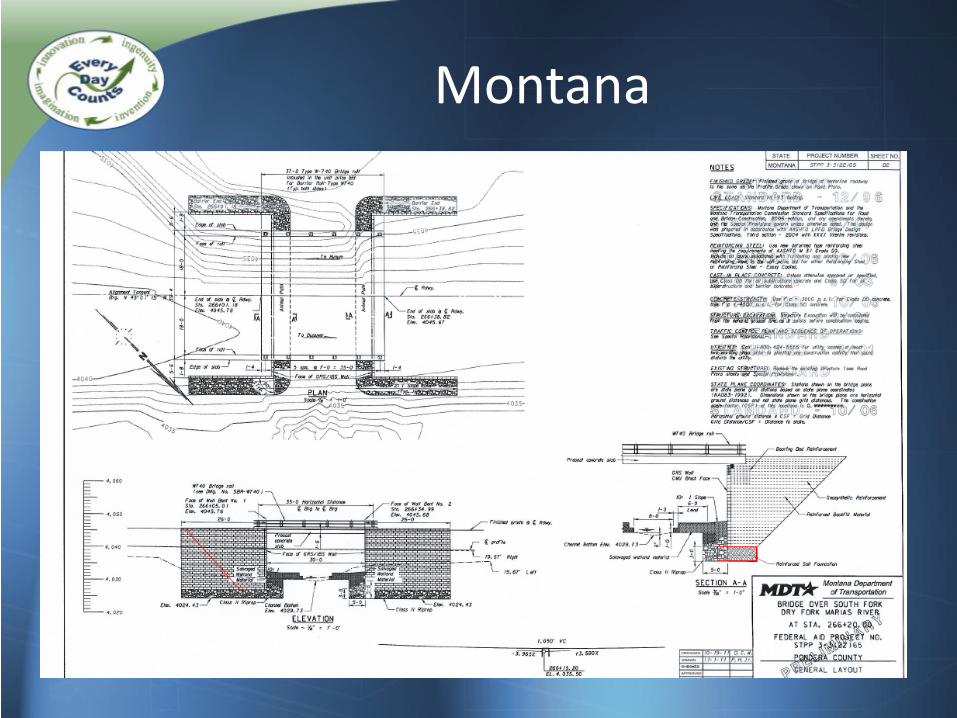
Montana
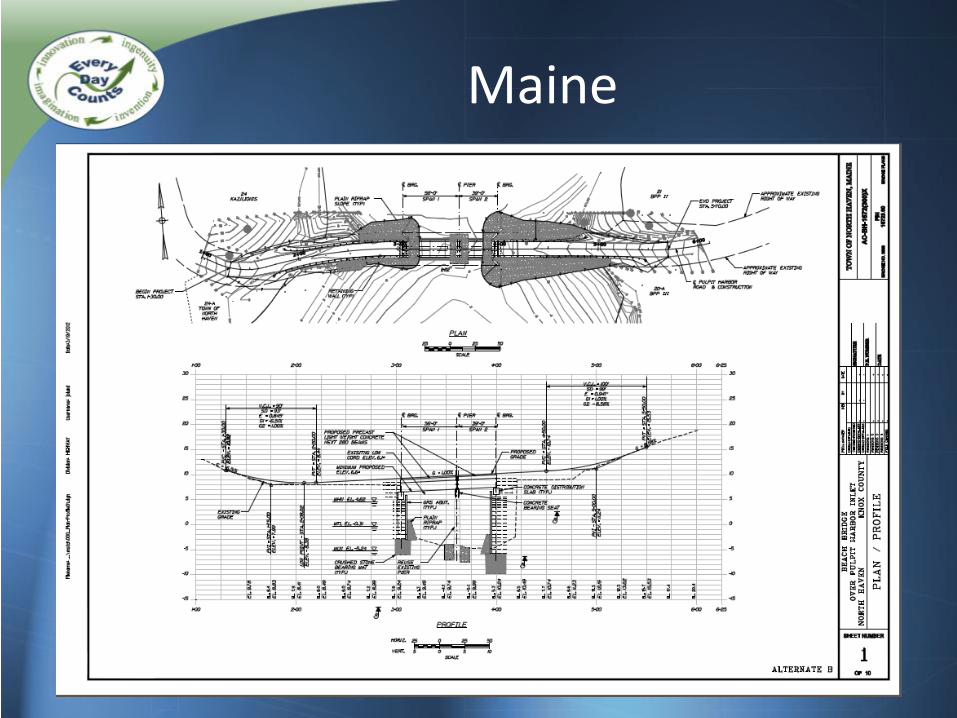
Maine
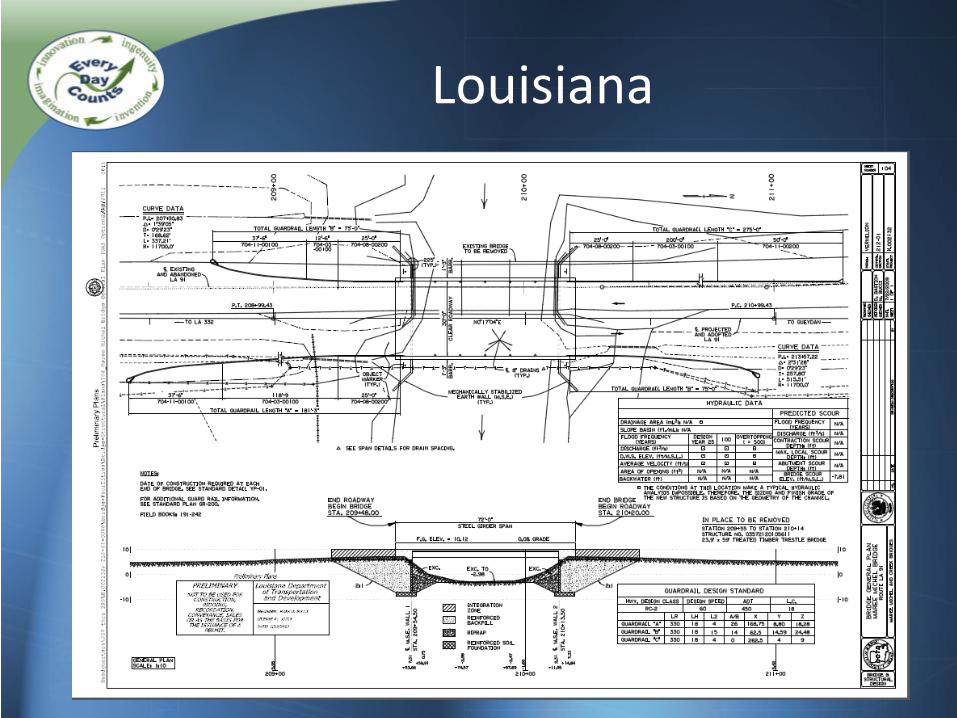
Louisiana
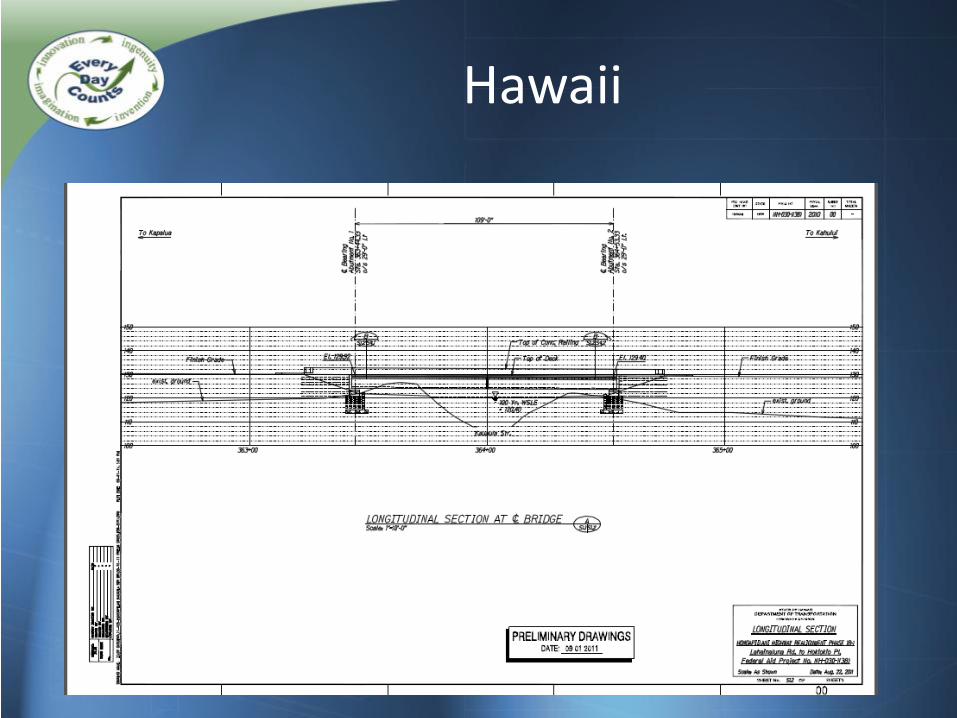
Hawaii
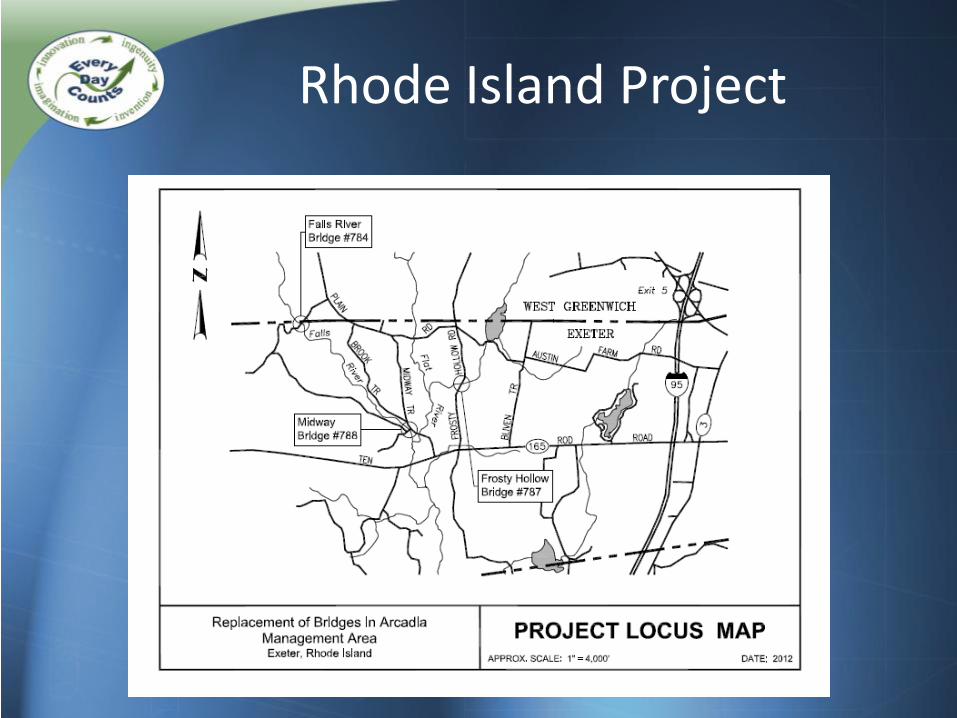
Rhode Island Project
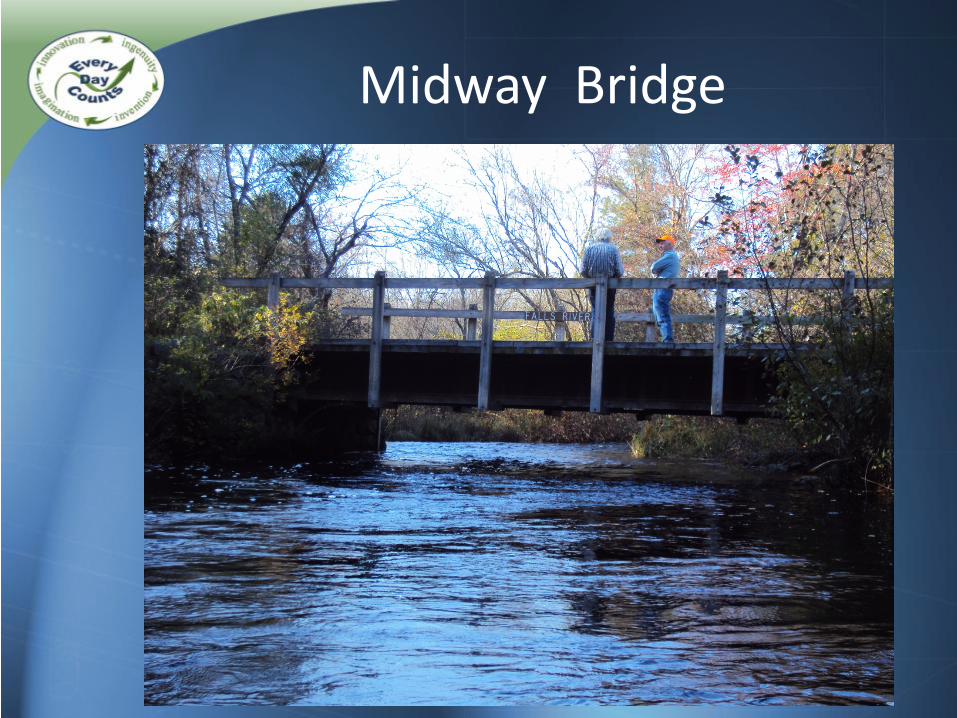
Midway Bridge
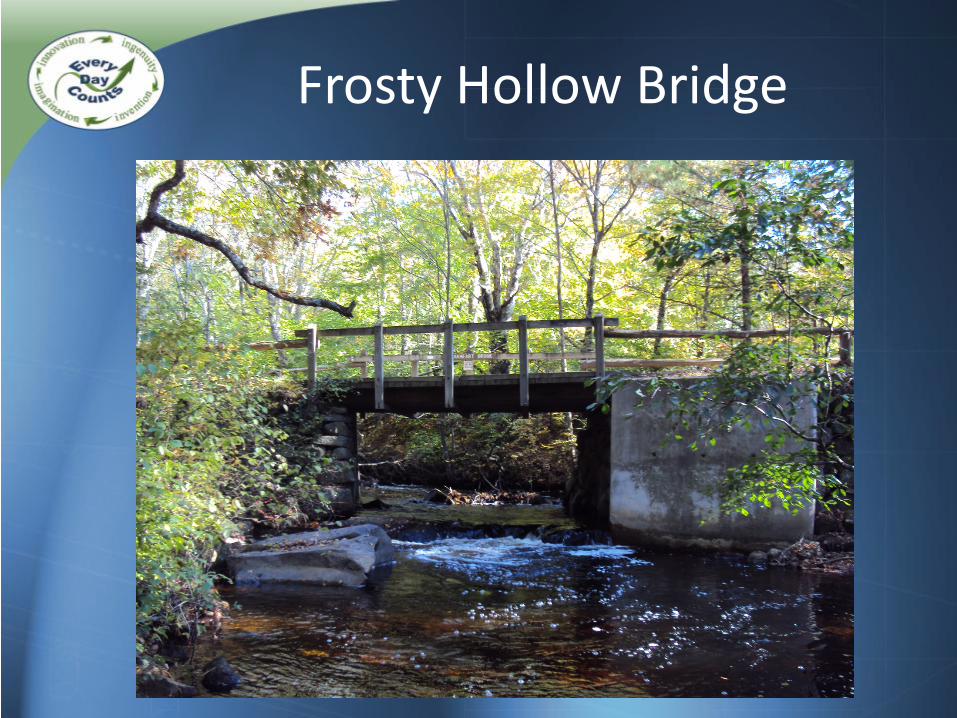
Frosty Hollow Bridge
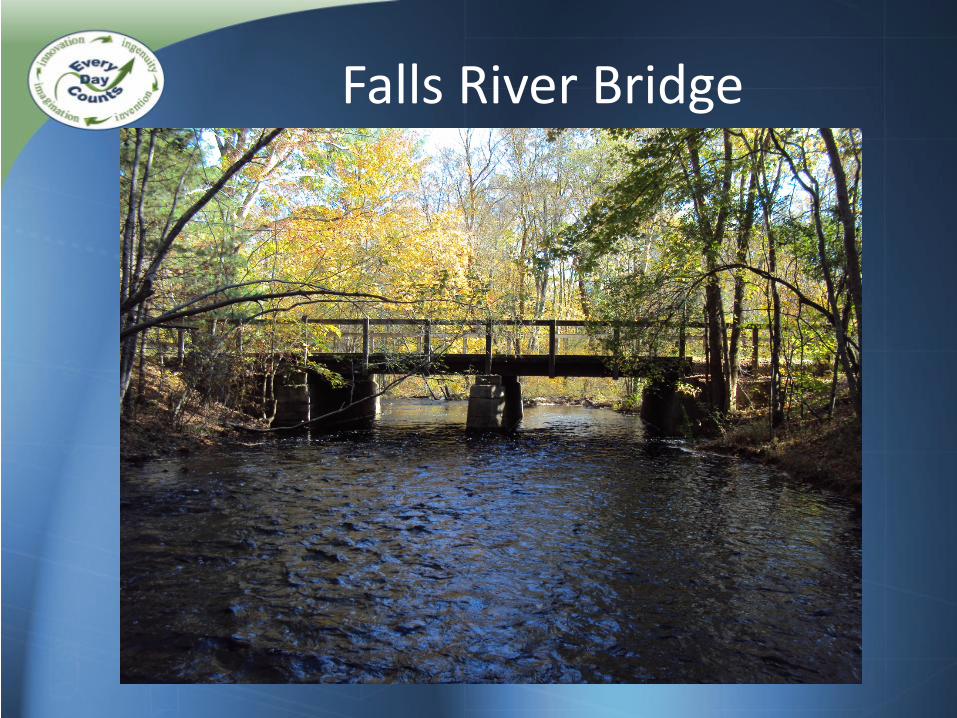
Falls River Bridge
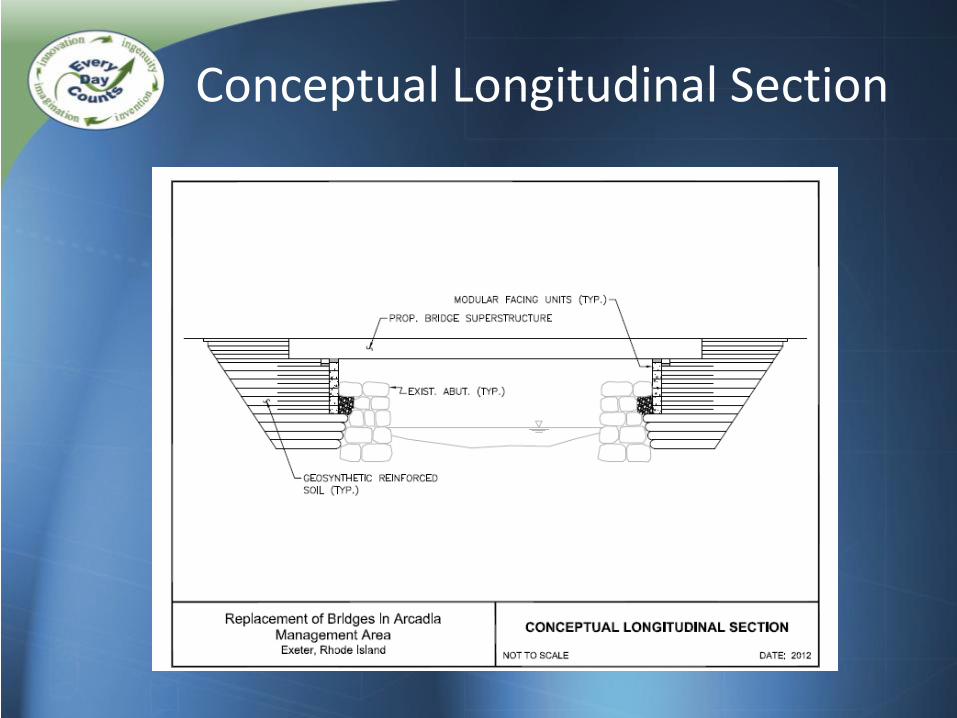
Conceptual Longitudinal Section