Embed Size (px)
DESCRIPTION
Saturn neutral particle modeling Overview of Enceladus/Titan research with possible application to Mercury. Johns Hopkins University Applied Physics Laboratory. H. Todd Smith. Introduction. - PowerPoint PPT Presentation
Citation preview
Saturn neutral particle modeling
Overview of Enceladus/Titan research with possible application to
Mercury
Johns Hopkins University Applied Physics LaboratoryJohns Hopkins University Applied Physics Laboratory
H. Todd SmithH. Todd Smith
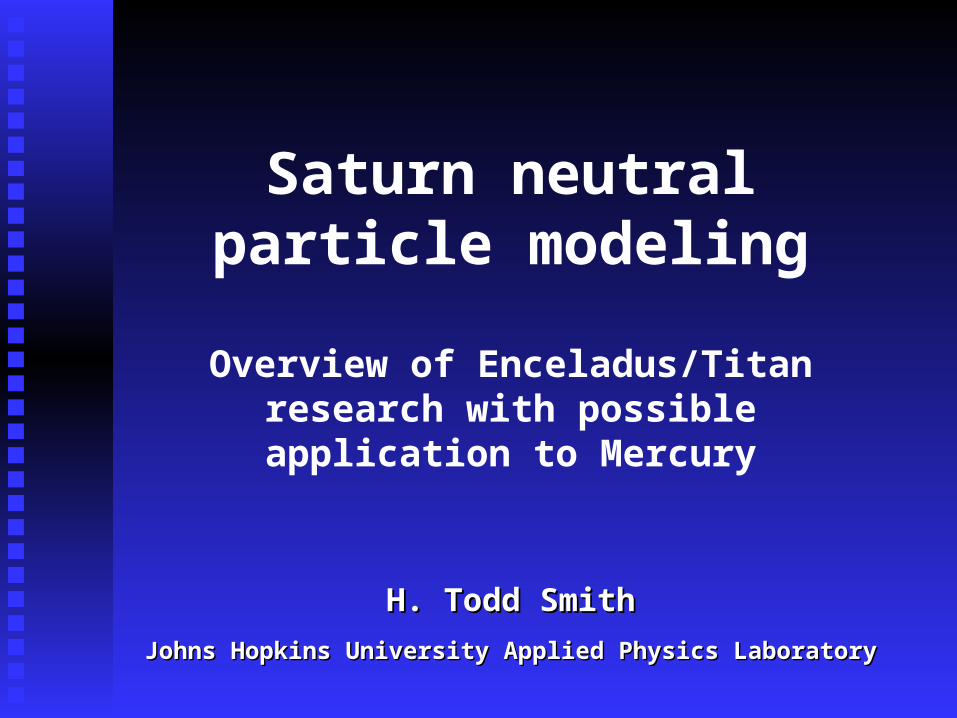
Show examples of how we used neutral Show examples of how we used neutral particle modeling with data analysis for particle modeling with data analysis for studying the Saturnian systemstudying the Saturnian system
Titan and Enceladus neutral particle Titan and Enceladus neutral particle source investigation source investigation
Initial ground work for possible Initial ground work for possible assistance with Mercury neutral assistance with Mercury neutral particle prediction and analysisparticle prediction and analysis
Introduction
Investigating neutral particle sources and processes in Investigating neutral particle sources and processes in Saturnian systemSaturnian system
Particle distributionParticle distribution Source & interaction characterization Source & interaction characterization Titan (nitrogen/methane)Titan (nitrogen/methane) Enceladus (water, nitrogen species)Enceladus (water, nitrogen species)
Pre-Cassini arrival predictions (data limited to 3 fly-bys Pre-Cassini arrival predictions (data limited to 3 fly-bys and Earth based observations)and Earth based observations)
Post-arrival interpretation using data analysis and Post-arrival interpretation using data analysis and modelingmodeling
Current Research
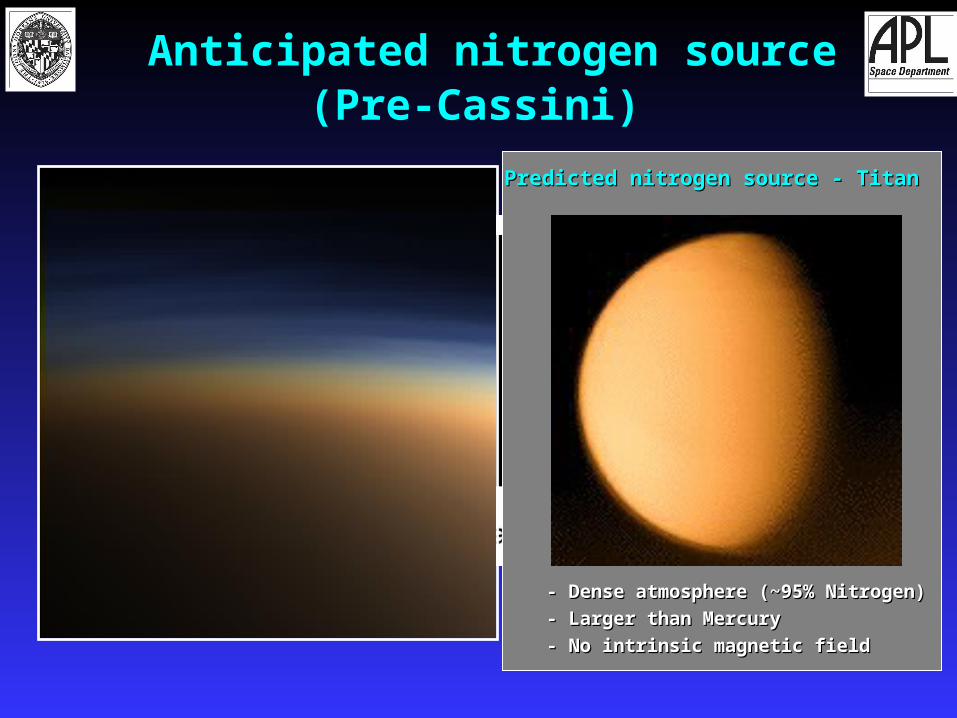
Predicted nitrogen source - TitanPredicted nitrogen source - Titan
- Dense atmosphere (~95% Nitrogen)- Dense atmosphere (~95% Nitrogen)
- Larger than Mercury- Larger than Mercury
- No intrinsic magnetic field- No intrinsic magnetic field
Anticipated nitrogen source(Pre-Cassini)
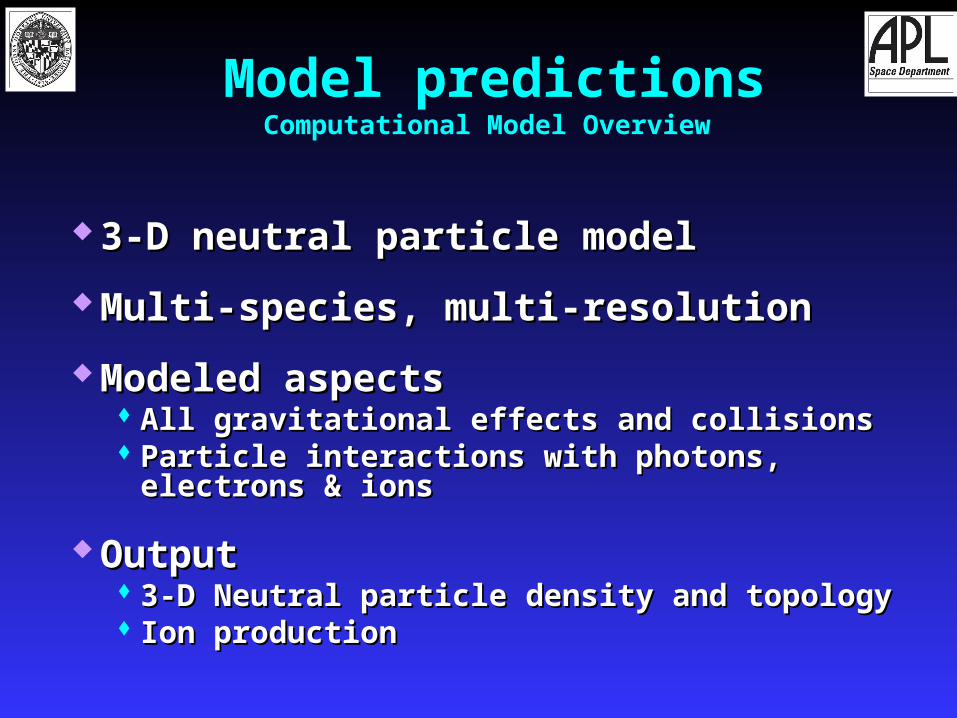
3-D neutral particle model3-D neutral particle model
Multi-species, multi-resolution Multi-species, multi-resolution
Modeled aspectsModeled aspects All gravitational effects and collisionsAll gravitational effects and collisions Particle interactions with photons, electrons & Particle interactions with photons, electrons &
ionsions
OutputOutput 3-D Neutral particle density and topology3-D Neutral particle density and topology Ion productionIon production
Model predictionsComputational Model Overview
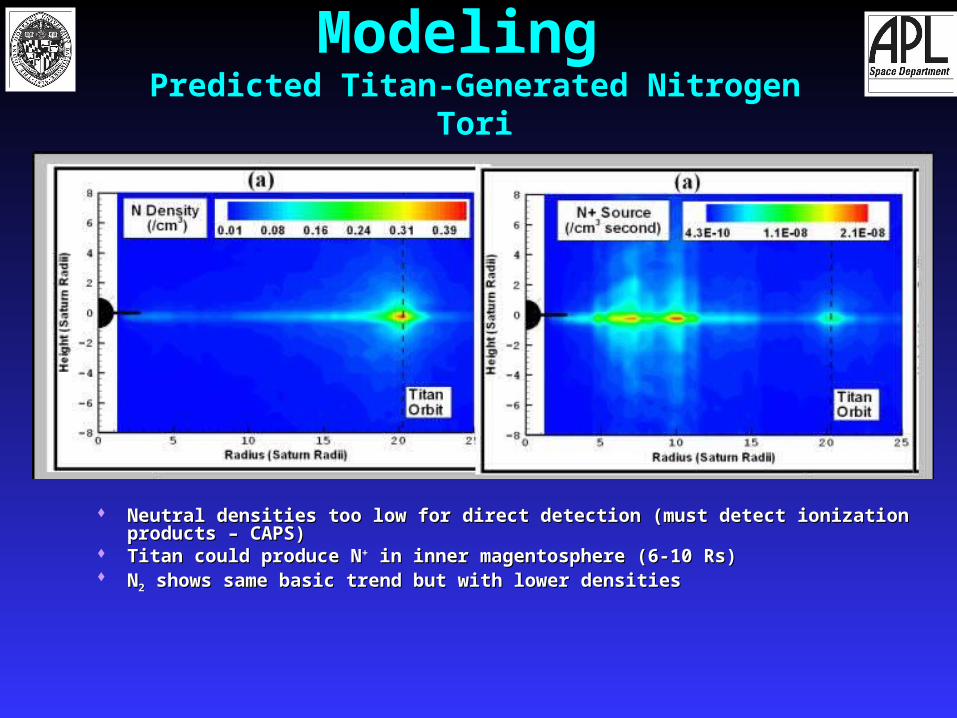
Neutral densities too low for direct detection (must detect ionization products – CAPS)Neutral densities too low for direct detection (must detect ionization products – CAPS) Titan could produce NTitan could produce N++ in inner magentosphere (6-10 Rs) in inner magentosphere (6-10 Rs) NN22 shows same basic trend but with lower densities shows same basic trend but with lower densities
Modeling Predicted Titan-Generated Nitrogen Tori
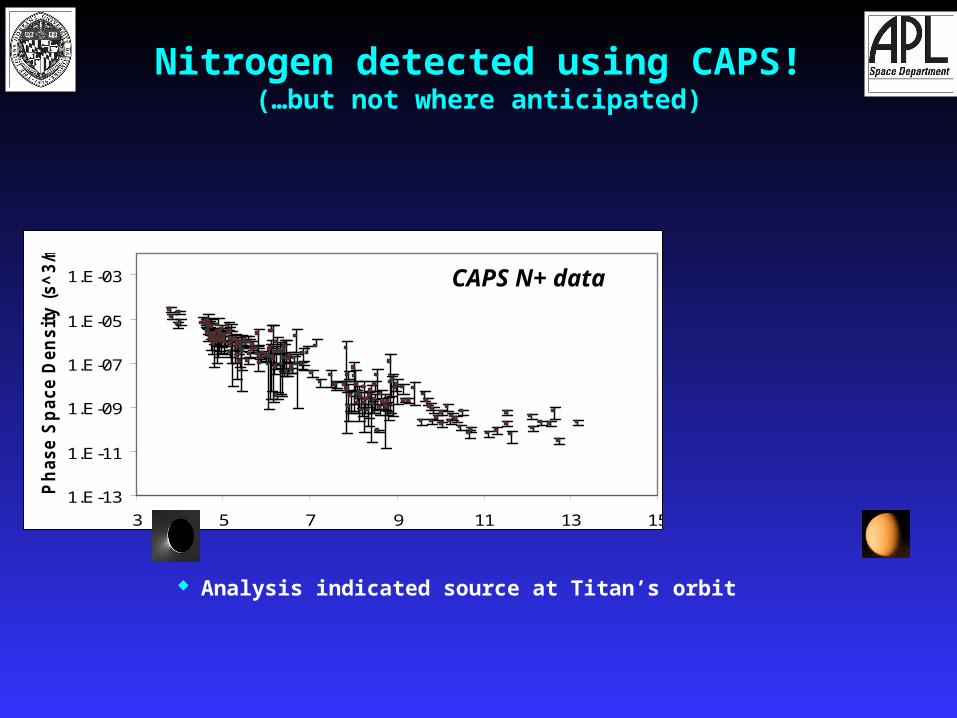
Nitrogen detected using CAPS! (…but not where anticipated)
Analysis indicated source at Titan’s orbit
1.E-13
1.E-11
1.E-09
1.E-07
1.E-05
1.E-03
3 5 7 9 11 13 15
Ph
ase S
pace D
en
sit
y (
s^
3/m
^6)
CAPS N+ data
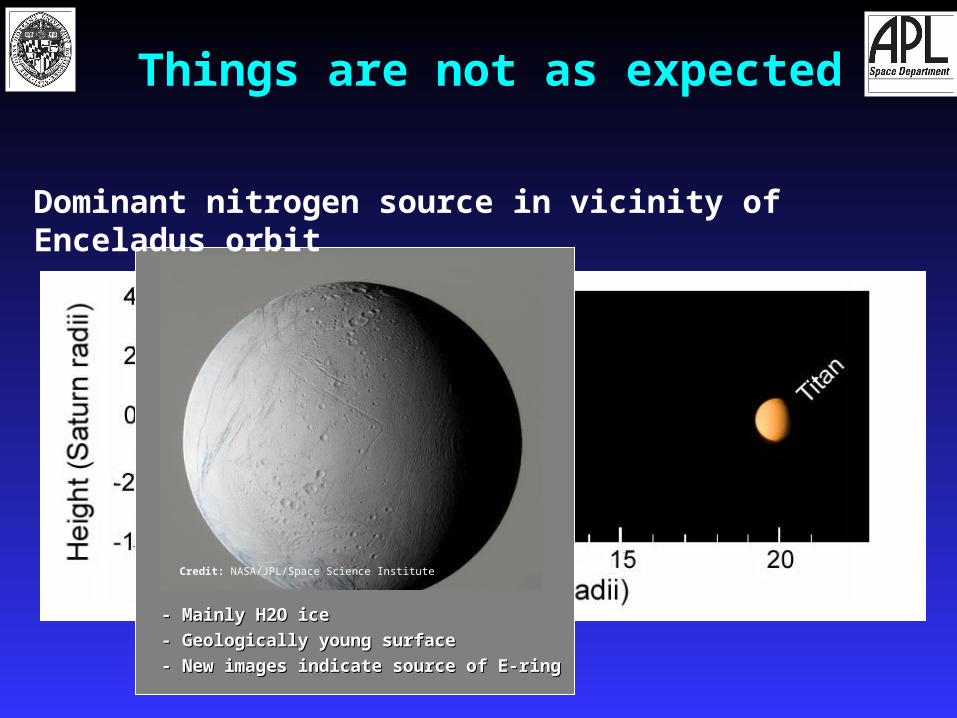
Things are not as expected
- Mainly H2O ice- Mainly H2O ice
- Geologically young surface- Geologically young surface
- New images indicate source of E-ring- New images indicate source of E-ring
Credit: NASA/JPL/Space Science Institute
Dominant nitrogen source in vicinity of Enceladus orbit
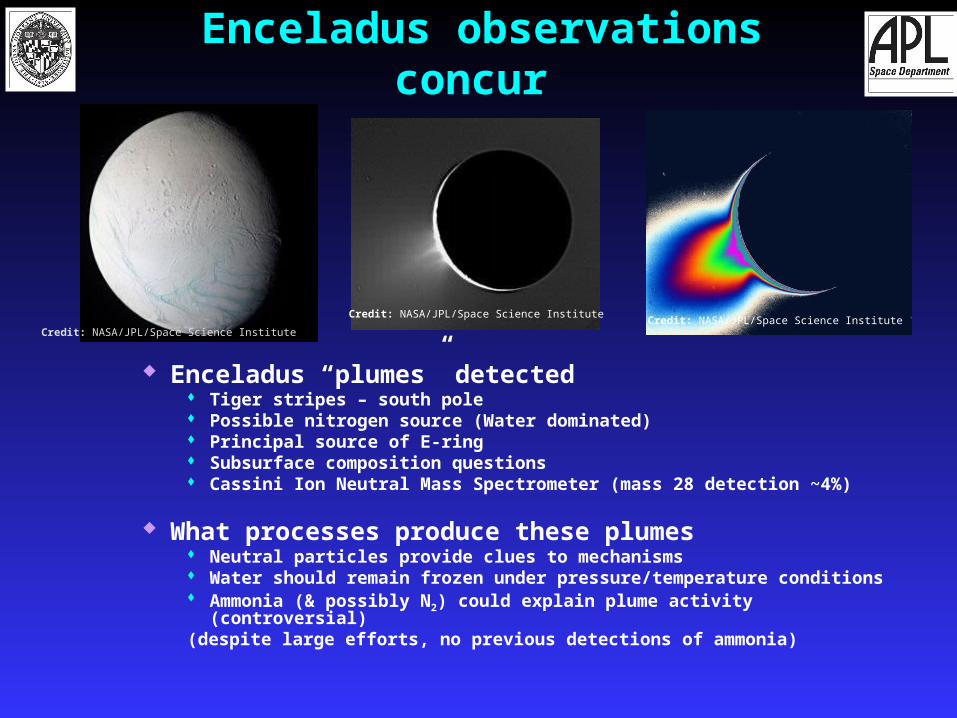
Enceladus observations concur
Enceladus “plumes” detected Tiger stripes – south pole Possible nitrogen source (Water dominated) Principal source of E-ring Subsurface composition questions Cassini Ion Neutral Mass Spectrometer (mass 28 detection ~4%)
What processes produce these plumes Neutral particles provide clues to mechanisms Water should remain frozen under pressure/temperature conditions Ammonia (& possibly N2) could explain plume activity (controversial)(despite large efforts, no previous detections of ammonia)
Credit: NASA/JPL/Space Science Institute
Credit: NASA/JPL/Space Science Institute Credit: NASA/JPL/Space Science Institute
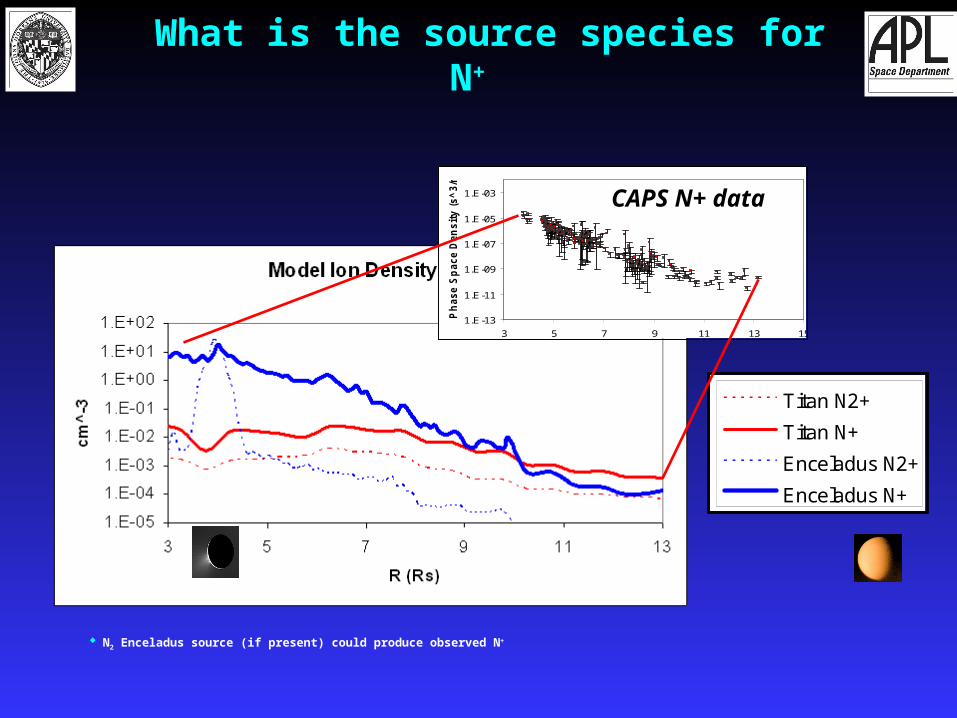
What is the source species for N+
N2 Enceladus source (if present) could produce observed N+
1.E-05
1.E-04
1.E-03
1.E-02
1.E-01
1.E+00
1.E+01
1.E+02
3 8 13 18
Titan N2+
Titan N+
Enceladus N2+
Enceladus N+
1.E-13
1.E-11
1.E-09
1.E-07
1.E-05
1.E-03
3 5 7 9 11 13 15
Ph
ase S
pace D
en
sit
y (
s^
3/m
^6)
CAPS N+ data
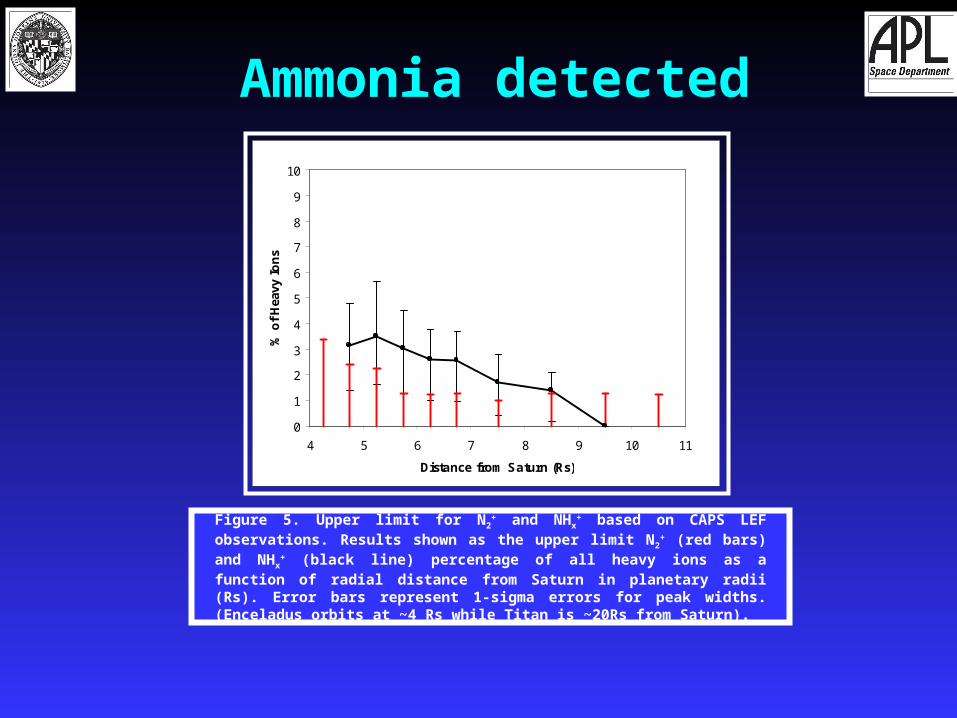
Ammonia detected
Figure 5. Upper limit for N2+ and NHx
+ based on CAPS LEF observations. Results shown as the upper limit N2
+ (red bars) and NHx+ (black line)
percentage of all heavy ions as a function of radial distance from Saturn in planetary radii (Rs). Error bars represent 1-sigma errors for peak widths. (Enceladus orbits at ~4 Rs while Titan is ~20Rs from Saturn).
0
1
2
3
4
5
6
7
8
9
10
4 5 6 7 8 9 10 11
Distance from Saturn (Rs)
% o
f H
eavy
Io
ns
Enceladus
Saturn
X (Saturn Radii)
Y(S
atu
rnR
ad
ii)
-4 -2 0 2 4
-4
-2
0
2
4
46942
37127
29364
23225
18369
14528
11490
9088
7188
5685
4496
3556
2813
2225
1759
H20/cc
Frame 001 03 Dec 2005 Converted Excel DataFrame 001 03 Dec 2005 Converted Excel Data
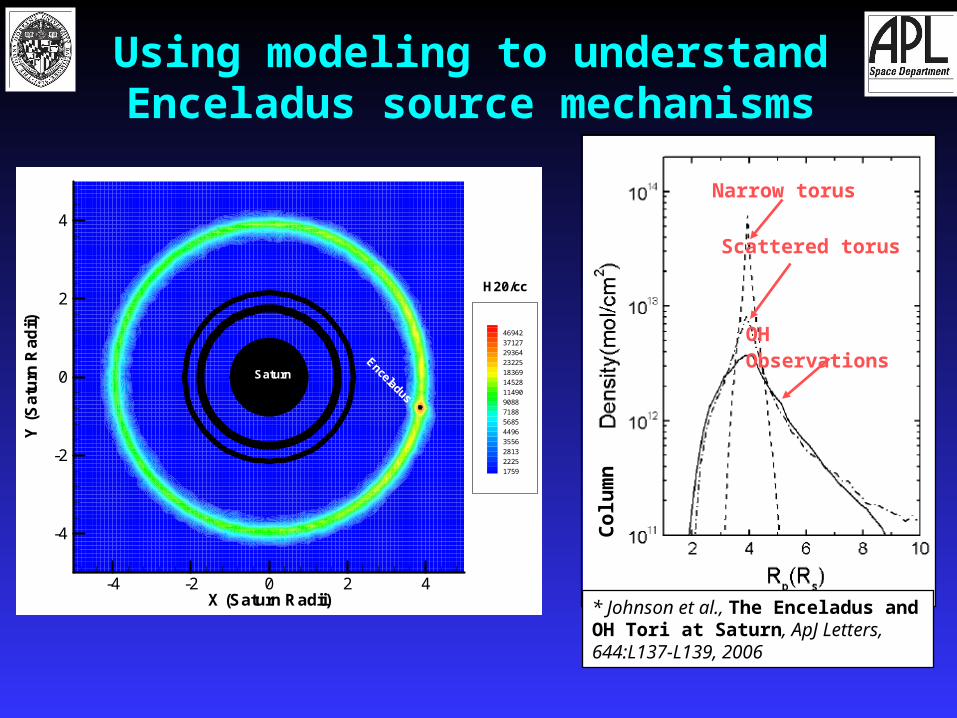
Using modeling to understand Enceladus source mechanisms
Co
lum
n
Narrow torus
Scattered torus
OH Observations
* Johnson et al., The Enceladus and OH Tori at Saturn, ApJ Letters, 644:L137-L139, 2006
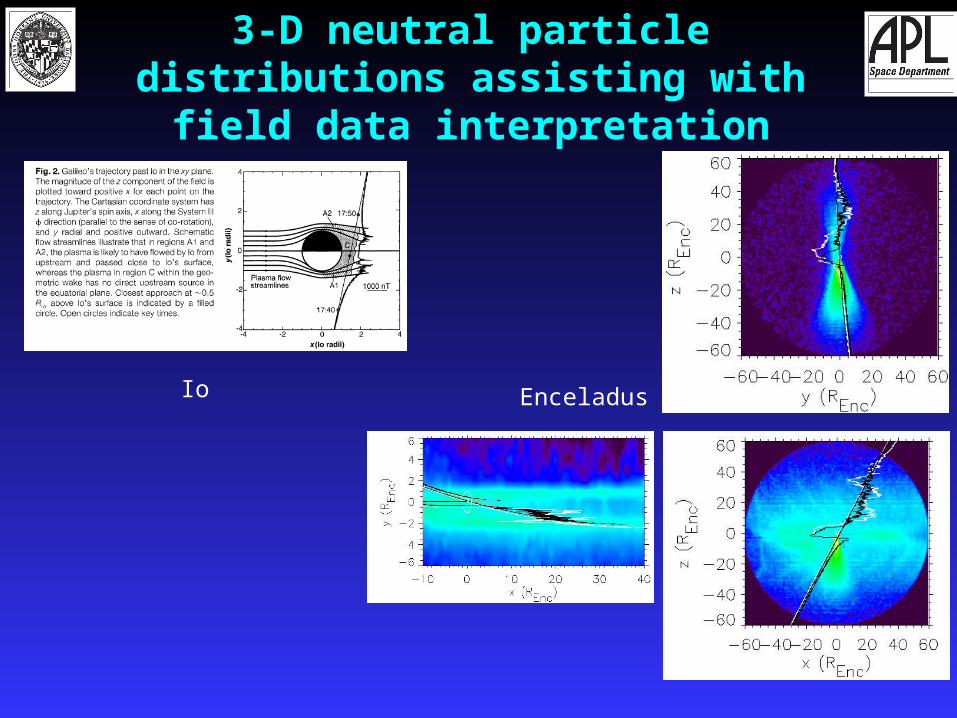
3-D neutral particle distributions assisting with field data interpretation
Io Enceladus
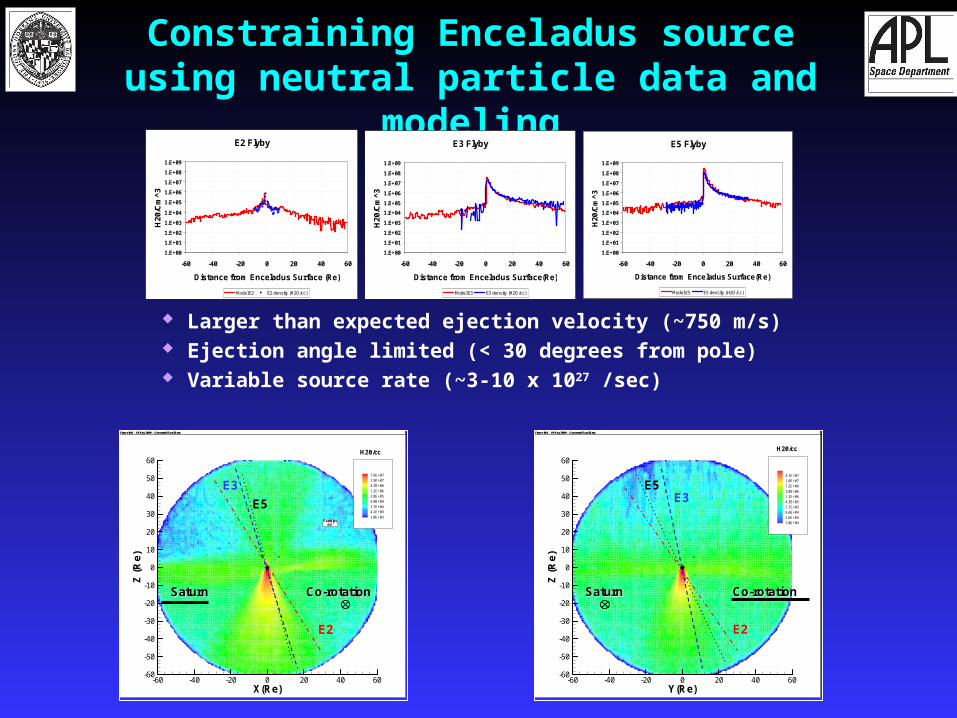
Constraining Enceladus source using neutral particle data and modeling
Rhe
a
Particles/cm3
Y(Re)
Z(R
e)
-60 -40 -20 0 20 40 60-60
-50
-40
-30
-20
-10
0
10
20
30
40
50
60
4.7E+07
1.8E+07
7.2E+06
2.8E+06
1.1E+06
4.3E+05
1.7E+05
6.6E+04
2.6E+04
1.0E+04
H20/cc
Frame 001 19 May 2009 Converted Excel DataFrame 001 19 May 2009 Converted Excel Data
CoCo--rotationrotationSaturnSaturn
E5E3
E2
Rhe
a
Particles/cm3
X(Re)
Z(R
e)
-60 -40 -20 0 20 40 60-60
-50
-40
-30
-20
-10
0
10
20
30
40
50
60
7.9E+07
1.9E+07
4.7E+06
1.2E+06
2.8E+05
6.9E+04
1.7E+04
4.1E+03
1.0E+03
H20/cc
Frame 001 19 May 2009 Converted Excel DataFrame 001 19 May 2009 Converted Excel Data
SaturnSaturn CoCo--rotationrotation
E5
E3
E2
E2 Flyby
1.E+00
1.E+01
1.E+02
1.E+03
1.E+04
1.E+05
1.E+06
1.E+07
1.E+08
1.E+09
-60 -40 -20 0 20 40 60
Distance from Enceladus Surface (Re)
H20
/Cm
^3
Model E2 E2 density (H2O/cc)
E3 Flyby
1.E+00
1.E+01
1.E+02
1.E+03
1.E+04
1.E+05
1.E+06
1.E+07
1.E+08
1.E+09
-60 -40 -20 0 20 40 60
Distance from Enceladus Surface(Re)
H20
/Cm
^3
Model E3 E3 density (H2O/cc)
E5 Flyby
1.E+00
1.E+01
1.E+02
1.E+03
1.E+04
1.E+05
1.E+06
1.E+07
1.E+08
1.E+09
-60 -40 -20 0 20 40 60
Distance from Enceladus Surface(Re)
H20
/Cm
^3
Model E5 E5 density (H2O/cc)
Larger than expected ejection velocity (~750 m/s) Ejection angle limited (< 30 degrees from pole) Variable source rate (~3-10 x 1027 /sec)
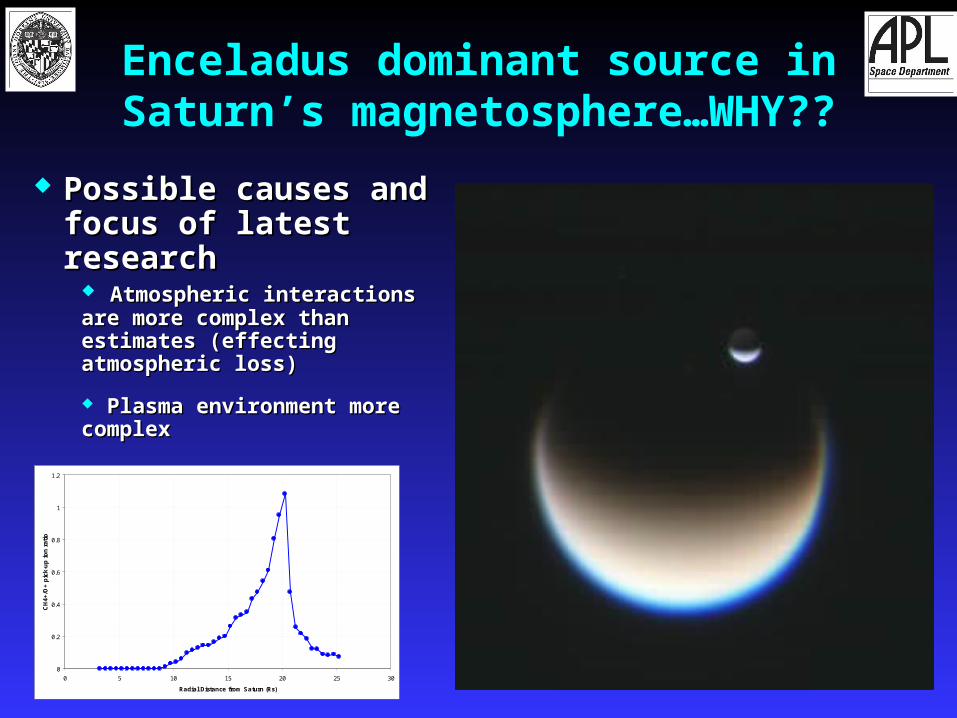
Enceladus dominant source in Saturn’s magnetosphere…WHY??
Possible causes and Possible causes and focus of latest researchfocus of latest research
Atmospheric interactions are Atmospheric interactions are more complex than estimates more complex than estimates (effecting atmospheric loss)(effecting atmospheric loss)
Plasma environment more Plasma environment more complexcomplex
Hydrodynamic methane escape?Hydrodynamic methane escape?
0
0.2
0.4
0.6
0.8
1
1.2
0 5 10 15 20 25 30
Radial Distance from Saturn (Rs)
CH
4+/O
+ p
ick-
up
io
n r
atio
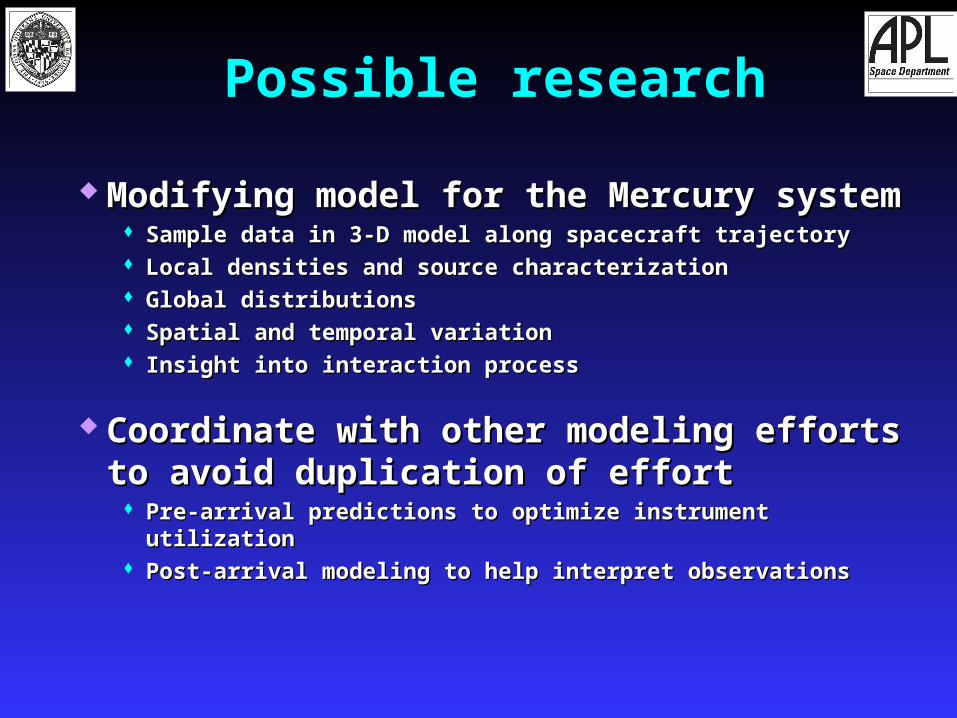
Modifying model for the Mercury systemModifying model for the Mercury system Sample data in 3-D model along spacecraft trajectorySample data in 3-D model along spacecraft trajectory Local densities and source characterizationLocal densities and source characterization Global distributionsGlobal distributions Spatial and temporal variationSpatial and temporal variation Insight into interaction processInsight into interaction process
Coordinate with other modeling efforts to Coordinate with other modeling efforts to avoid duplication of effortavoid duplication of effort
Pre-arrival predictions to optimize instrument utilizationPre-arrival predictions to optimize instrument utilization Post-arrival modeling to help interpret observationsPost-arrival modeling to help interpret observations
Possible research
![THE The JOHNS HOPKINS CLUB Events JOHNS HOPKINS … [4].pdf · Club Herald July / August 2015 Events THE The JOHNS HOPKINS CLUB JOHNS HOPKINS UNIVERSITY 3400 North Charles Street,](https://img.pdfslide.us/doc/110x75/5fae1ad08ad8816d2e1aaabe/the-the-johns-hopkins-club-events-johns-hopkins-4pdf-club-herald-july-august.jpg)