Embed Size (px)
Citation preview
Page 1 of 11
John Riding – Marico Marine
Determining Survey Scope and Priority by understanding Hydrographic Risk
Biography
John Riding is the Managing Director and founder of MARICO Marine. He initially spent 12 years at sea, leaving in 1986 to undertake a Master’s Degree at Liverpool University, UK. He was a UK prize winner. After a period in the marine casualty market, then in the nuclear industry, he worked for the UK Maritime and Coastguard Agency where he was a key player in the team developing IMO's Formal Safety Assessment system (FSA), which is still in use today. This system applies risk based methodologies to the development of International Shipping Regulations. In 1996 he commenced applying this new science to shipping at ports, harbours and terminals. It was the beginnings of Marico Marine, initially a Southampton based firm specialising in the practical management of marine risk. Since then, John has worked with national marine regulators, harbour authorities and port companies all over the world and now has some 21 years' experience in this field. He is currently based in the New Zealand office of Marico, where, in 2013, Marico developed a methodology to apply risk techniques to Charting and decision making for Charting Improvements. This was driven by the need to update the Charts of the South West Pacific.
Summary
Chart adequacy assurance and provision of hydrographic surveys on commercial sea lanes and harbors are the responsibilities of coastal states and Charting Authorities, who under IHO arrangements are sometimes separate entities. In many cases, the need to resurvey and update are easy decisions to make, when sea lanes are busy, funding the regular charting updates. However, there are very large tracts of coastal sea areas where the interests of safe shipping transit have presented impossible cost benefit options for responsible coastal states. A number of charts around the globe still reflect the survey charting technology and lead-line findings of the colonial period. Those coastal states reliant on IHO Capacity Building or Aid funding for charting development have often been unable to proceed as experts agreeing a realistic scope has proven elusive. Aid funding banks simply haven’t in the past entertained large offshore hydrographic projects with risk of uncertain and potentially extending scope.
Indigenous peoples’ values of coastal areas can be contradictory about charting adequacy need. The traditional concept of risk does not fit well with the hydrographic community, where evidence of casualties associated with charting problems are small in number but also seen as a liability trap.
A solution for this has been sought in the SW Pacific for some time, especially given the penetration of large cruise vessel operations into remote island nations.
Marico Marine were commissioned to use a combination of marine and risk expertise into the research, funded by Land Information New Zealand (LINZ). After spending some time researching and developing a methodology to resolve the problem of assessing risk associated with hydrography, it was first trialed in the waters of Vanuatu, refined and then
Page 2 of 11
deployed in other SW Pacific countries. It is recognized that the Canadian northern seaboards have also been the focus of similar research.
Advances in Geographic Information System (GIS) capability has enabled a data-rich solution to be developed, taking marine traffic and accident impact into account to determining survey priority and scope for upgrade in charting adequacy.
This paper provides an overview of Hydrographic Risk Assessment (now an endorsed IHO methodology) as a risk-based tool, to determine where hydrographic survey and charting updates should be undertaken. Also illustrated are applications in hydrography, decision-making, and the benefits it can provide for Hydrographic Authorities, Coastguard and coastal states with hydrographic responsibility. The paper draws upon a number of practical case studies in which innovative modelling of hydrographic risk and charting benefit has enabled targeted decision making to prevent pollution of the environment and loss of life while ensuring proprietary and economic prosperity.
Introduction – the Problem
Since 2002, the UN body the International Maritime Organization (IMO) has specified the role of hydrographic services delivered by Contracting Governments, under Safety of Life of Sea (SOLAS) Chapter V, Regulation 9. Regulation 20 of Chapter V requires all vessels to carry up-to-date charts.
The provision of hydrographic services and its standards are the remit of the sister UN body the International Hydrographic Organization (IHO). In many small states with large coastal zones there can be Charting Authority provided by another state, producing charts from data obtained by the coastal state in its required role as Hydrographic Authority. Small coastal states in some cases need to rely on external assistance to develop a viable Hydrographic Authority and the IHO have a Capacity Building1 program to assist with this (UKHO 1). However, undertaking the Hydrographic Surveys that facilitate chart adequacy improvements to large areas of coastal zones in, for example, the Pacific Island Nations, often require a robust case to be made for further external funding, including Aid. The problem with this is the vast scale of the work required and the considerable uncertainly in defining scope. For many years charting standards in some more remote sea areas have remained inadequate, by the standards required by modern shipping and particularly vessel fitted with electronic navigation systems (ECDIS).
In parallel with this, large areas of the SW Pacific are enjoying visits by an expanding cruise industry, with the largest vessels now routinely visiting remote islands. The positive passenger experience is providing the business case for ongoing expansion, but the question of charting adequacy to support such expansion has for many years remained unresolved. Chart Adequacy is also an abstract subject and shrouded in judgement. Improvements for example may mean new surveys, charting re-organization, or updating datum, or even republishing with improved bottom coverage data that is sometimes held unpublished, or even recording the sea floor composition. Equally it can mean improvements to coastal Aids to Navigation or even simpler improvements such as the distance between leads or clearer advice to a mariner about navigation in a particular area.
1 The International Hydrographic Organization (IHO) has developed a framework to promulgate the sustainability of hydrographic services, known as Capacity Building. In particular, IHO defines Capacity Building as “the process by which the organization assesses the status of current arrangements and assists States to achieve sustainable development and improvement in their ability to meet hydrographic, cartographic and maritime safety obligations with particular reference to recommendations in United Nations Convention on the Law of the Sea (UNCLOS), SOLAS and other international instruments”
Page 3 of 11
IMOs Formal Safety Assessment
Risk Assessment entered the IMOs regulatory system in the late 1990s, when its 5 step Formal Safety Assessment (FSA) methodology was released (IMO FSA Guidelines (2)). The identification and assessment of risks from maritime accidents had traditionally depended on judgement and experience – essentially fixing accidents that had happened, doing little for regulation of developing ship types. The traditional depiction of risk in the FSA system uses the casualty record to provide the frequency and consequence information to drive the process and identify cost-effective changes to international regulations. FSA drove a demand for a proactive safety approach to emerge in the maritime industry, through its international regulator. But the FSA approach proved elusive for use by the IHO membership to solve the hydrography need for risk-based analysis to prioritize response to a growing problem of inadequate charting standards across the SW Pacific region in general. Clearly, a hydrographic risk assessment methodology that the IHO could consider needed to take account of the processes used by its sister UN body, IMO.
The Hydrographic Risk Problem – Core Methodology Concepts
The SW Pacific comprises a number of adjacent island states, each with economies struggling to develop and in many cases, falling populations. The traditional approach of an independent hydrographic expert studying a sovereign area had resulted in competing but unclear cases for each region. Apart from some harbor waters, charting had also not been updated in years, with those charged with responsibility shying away because of the size of the problem.
It is true that large areas of the SW Pacific, as well as many other sea areas, are not “adequately surveyed”, but this does not mean that the available information is insufficient for all types of traffic. The assessment of hydrographic risk is not just a two-dimensional issue of comparing charting age, sounding accuracy and bottom coverage in different areas. It is a complex problem of considering in how many different ways the totality of the hydrographic, navigational and meteorological information available might be insufficiently accurate for the intended use to which that info is subject.
In developing a new approach to determine Hydrographic Risk as a measure of use to those needing to take expensive decisions of scope, a number of grounding casualties were reviewed to draw the important conclusion that there were very few examples of Marine Casualties that could be relied on to determine charting adequacy or conclusively; hydrographic risk, using traditional risk methodologies in any particular area. Some systems2 have attempted to assess offshore transit risk, but demonstrating results against the reality of shipping movements in any particular area is difficult. “Traditional” risk assessment being risk derived from “Frequency and Consequence” measurements, or traffic levels based on the waterways that just happen to be busy, provide an illusion, but based on something indeterminate. When it came to hydrographic risk based on casualty rate, the number that can be cited globally was so small as to make such risk assessments unreliable, simply because the probability of occurrence is unreliable using such data.
So, a different approach was necessary, but still recognizing that risk is a combination of frequency and consequence. The answer was really a case of understanding the causal factors that influence likelihood of any grounding casualty and the consequence factors that determine the consequence of outcome. An enhanced understanding of traffic evidence is now available, taken from Automatic Identification System (AIS) transmissions. Knowledge
2 E.g., IWRAP, a tool developed by a member of the International Association of Lighthouse Authorities (IALA).
Page 4 of 11
of the coastal domestic traffic can be had, but only if generated by work study in the area, aided by the local governmental links and advice. Then information about local tidal conditions, the coastal economy and consequential damage arising out of a marine casualty can be understood. In summary the ingredients that the hydrographic risk methodology was developed from are:
• Shipping traffic (volume, type, size) and the routes taken by track voting pattern (AIS). • The services provided by coastal trading vessels – frequency and size. • The proximity of coastal areas of ecological and environmental importance, such as
breeding grounds. • The proximity of culturally important sites along coastlines. • The known hazards in the area as reported by current charting and local knowledge. • The present status of charting (survey age and technology used, chart coverage,
bottom coverage and extents in relation to traffic use).
Geographic Information Systems and Maritime Risk
The applicability of GIS in the maritime arena has advanced, and its usage is effective in decision making (Rawson and Riding, (3)). GIS as a tool has come of age, probably nothing new to hydrographers and cartographers. Its role is now everywhere: design of port infrastructure; expansions; environmentally efficient stormwater systems; port asset and facility management; security planning and operations; berthing assignments; vessel tracking and routeing; cargo multimodal operations; disaster response planning; and delineating restricted areas and danger zone (Baylon and Santos,4).
GIS is also already used extensively to evaluate maritime traffic risk problems, with analysis helping with separation scheme and offshore development design. With modern processors, GIS has provided a powerful platform to undertake quantifiable risk analysis by bringing many large data sets together.
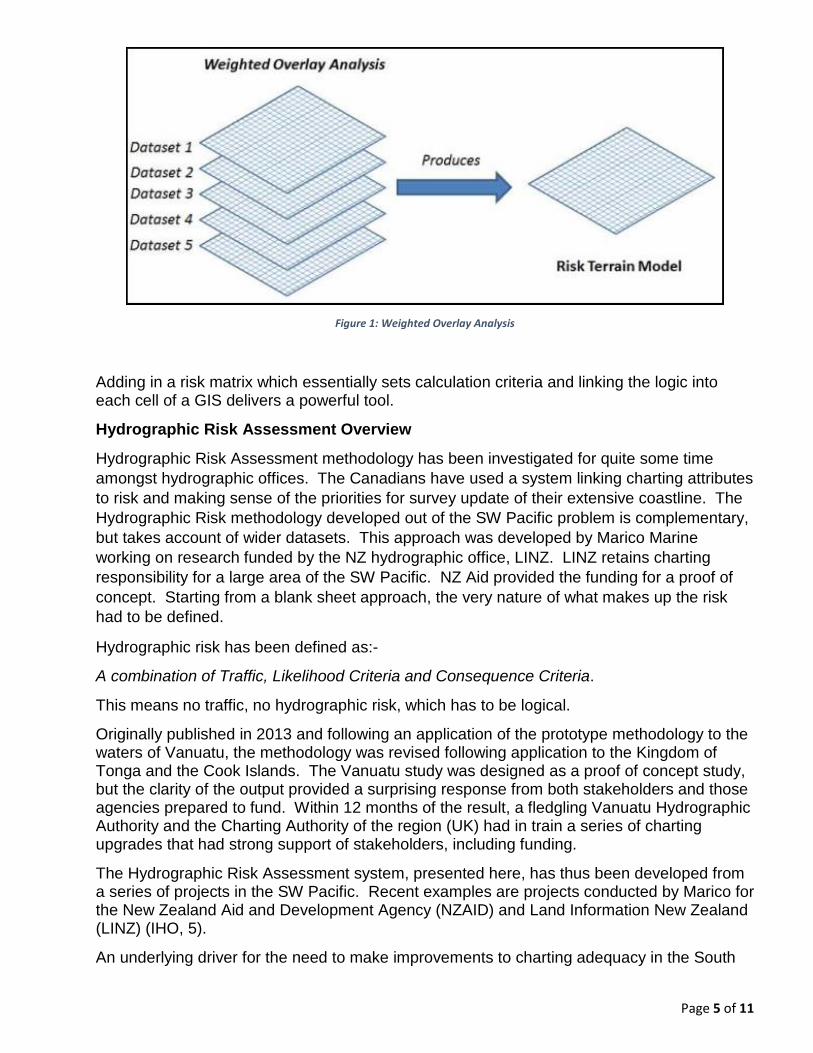
The increasing availability of global Automatic Identification System (AIS) data allows for a cost-effective and accurate analysis to undertake navigation risk assessments and investigate maritime accidents. AIS has limitations, especially by Satellite, but corrected by knowledge from data gathering, it is a core part of a GIS based Hydrographic Risk Assessment. Another example of maritime risk modelling with a GIS is weighted overlay analysis. This analysis combines multiple geographic datasets, weighs the relative importance of each, and produces a single map prioritizing some areas over others (Figure 1). Accordingly, diverse type of hazards or incidents have a multitude of causes and impacts. This particular tool is capable of combining each and identifying areas that are particularly at risk.
Page 5 of 11
Figure 1: Weighted Overlay Analysis
Adding in a risk matrix which essentially sets calculation criteria and linking the logic into each cell of a GIS delivers a powerful tool.
Hydrographic Risk Assessment Overview
Hydrographic Risk Assessment methodology has been investigated for quite some time amongst hydrographic offices. The Canadians have used a system linking charting attributes to risk and making sense of the priorities for survey update of their extensive coastline. The Hydrographic Risk methodology developed out of the SW Pacific problem is complementary, but takes account of wider datasets. This approach was developed by Marico Marine working on research funded by the NZ hydrographic office, LINZ. LINZ retains charting responsibility for a large area of the SW Pacific. NZ Aid provided the funding for a proof of concept. Starting from a blank sheet approach, the very nature of what makes up the risk had to be defined.
Hydrographic risk has been defined as:-
A combination of Traffic, Likelihood Criteria and Consequence Criteria.
This means no traffic, no hydrographic risk, which has to be logical.
Originally published in 2013 and following an application of the prototype methodology to the waters of Vanuatu, the methodology was revised following application to the Kingdom of Tonga and the Cook Islands. The Vanuatu study was designed as a proof of concept study, but the clarity of the output provided a surprising response from both stakeholders and those agencies prepared to fund. Within 12 months of the result, a fledgling Vanuatu Hydrographic Authority and the Charting Authority of the region (UK) had in train a series of charting upgrades that had strong support of stakeholders, including funding.
The Hydrographic Risk Assessment system, presented here, has thus been developed from a series of projects in the SW Pacific. Recent examples are projects conducted by Marico for the New Zealand Aid and Development Agency (NZAID) and Land Information New Zealand (LINZ) (IHO, 5).
An underlying driver for the need to make improvements to charting adequacy in the South
Page 6 of 11
West Pacific was a significant cruise market expansion with a rapid increase in size of vessels.
The developed methodology was formally recognized by the IHO at its 2014 meeting in Paris(6).
As the Conference presentation will show, this is a form of risk analysis that somewhat prioritizes consequence impacts, but realizes that transit frequency, vessel size and type have a significant influence on frequency. There are also foreseeable and realistic impacts from a shipping accident of each vessel type, which can be evaluated using event tree structures, which requires practical marine expertise. The concept of Most Likely and Worst Credible (not worst possible) in terms of accident outcome brings realism to this process as this bounds the range of possible accidents, given the ship types involved.
Charting Benefit
The Hydrographic Risk Assessment methodology had a Charting Benefit Module developed in 2015, prior to a whole of New Zealand EEZ hydrographic risk assessment. Although this added complexity to an already sophisticated approach, the output provides a clarity of locations where there is greater room for charting improvement. This reflects the reality of the ALARP principal where there can be heightened hydrographic risk in some areas, due to traffic type and volume and the presence of key economic locations, but if charting is already to an adequate standard for the type of navigation in the area, there may be greater benefit for committing limited budgets to other areas. In short, this module provides decision-makers with a balance of key information. This module was developed to provide better information about the cost effectiveness of charting improvements in areas where recent charting upgrades may have been undertaken. It addresses a problem within the existing methodology, where, because of high traffic volume, a significant risk result can be present in an area where charting standard is already high.
The Charting Benefit module takes the risk assessment output. It uses at its core the IHO system of Category of Zone of Confidence (CATZOC). CATZOC was developed to provide a standardized means of measuring and conveying hydrographic uncertainty to the mariner, via electronic navigational charts (ENC)3. It considers vertical and lateral uncertainties alongside completeness and survey currency, to assign a category from A to D in five levels, with A1 (5 stars) being the best and U being Un-assessed. The CATZOC system is not universally supported and the Hydrographic World in Authors opinion needs to come to consensus in this area. There have been instances in some project work where charts with an Unassessed rating needed charting expertise to regrade. There are also instances where datum is uncertain and in some cases converted from fathoms. These areas need more thought given to grading. Unassessed seems to be in some cases a “catch all”.
Risk Criteria
The presence of hydrographic risk is dependent on linking traffic geographically with areas of potential consequence. The risk criteria are set in a large “risk matrix”, affecting one or more layers of spatial data in a GIS system. We all understand what a risk matrix is, but one that combines GIS calculations to many data sets is taking the humble risk matrix into new territory.
It is the Risk Matrix and GIS Risk Terrain Modelling which links the data based evidence from ship track records and their proximity to coastal features possessing important consequence exposure, to a calculated result that outputs risk. The risk criteria provides a relative risk 3 In an ENC it is an MQUAL attribute.
Page 7 of 11
assessment output. For the SW Pacific work to date, the relative risk in each area was compared using constant criteria for different risk assessments. This was important for the large areas of the SW Pacific where traffic levels, economies and ecological importance are relatively comparable as far as geography is concerned. For New Zealand waters, criteria needed to be developed to reflect the traffic levels and the economic activity.
The development of appropriate risk criteria for the assessment is of great importance. Criteria can be developed further as the analysis is run. This refines the risk assessment and it is also possible to modify criteria for significance testing. This identifies areas or items that affect the risk result the most and is of use to the benefit assessment.
Alongside the risk matrix is the choice of cell size; each cell provides the boundary of a calculation. A country overview that can zoom into remote inlets with clarity means cell sizes are small in coastal areas and vary in size offshore. Even by today’s technology standards a high speed GIS computer can take hours to run the assessment.
Data Gathering
Accurate data gathering is critical to the process. Areas require visiting and the indigenous population need to be consulted with to understand coastal areas that have cultural importance. It requires national and regional datasets to support the identification of risk areas in the risk calculations. These data sets are readily available, but only local input can advise on practicality and accuracy. For example, the SW Pacific project used an up-to date data set of all known turtle breeding grounds, kindly but confidentially released by environmental and research interests, once they understood the benefit such a contribution would make. This approach can thus provide valuable output from processed data, but also protecting the utility of accurate but sensitive data sources.
A variety of maritime and port stakeholders, such as harbor masters, harbor regulatory and port company interests, riparian governmental representatives (regional/local). Local passenger and coastal vessel operators are also consulted. A series of commercial, environmental and spatial datasets are obtained, e.g. cargo volumes and vessel movements, geospatial shapefiles, to examine a coastal profile on a national level.
The risk assessment process uses AIS data as already tabled, but AIS data records need supplementing in order to provide, e.g. vessel size measured in gross tons (GT). Satellite data can also require extensive correction from port visit records. Satellite pass rates are improving, but in the Southern Hemisphere, it is possible for a vessel to be in and out of port waters without that being recorded in satellite data. Once sorted out, the traffic is essentially driven through the risk assessment matrix.
Thus, key information is used to support the risk and charting benefit output and is based as much as possible on factual evidence.
What Sets the Risk?
The key factor in the risk is the level of traffic in the area. But traffic volume alone is misleading, ship type and size are much more important. Risk potential is set by Likelihood Criteria, such as ocean conditions; navigational complexity, the distance of traffic from a coastline with high currents, status and disposition of Aids to Navigation and natural hazards to navigation. The level of risk is calculated by using consequence criteria, such as environmental impact, cultural importance, and economic importance. Risk Criteria are thus
Page 8 of 11
logically categorized in Traffic, Likelihood and Consequence. An example is provided in the accompanying presentation.
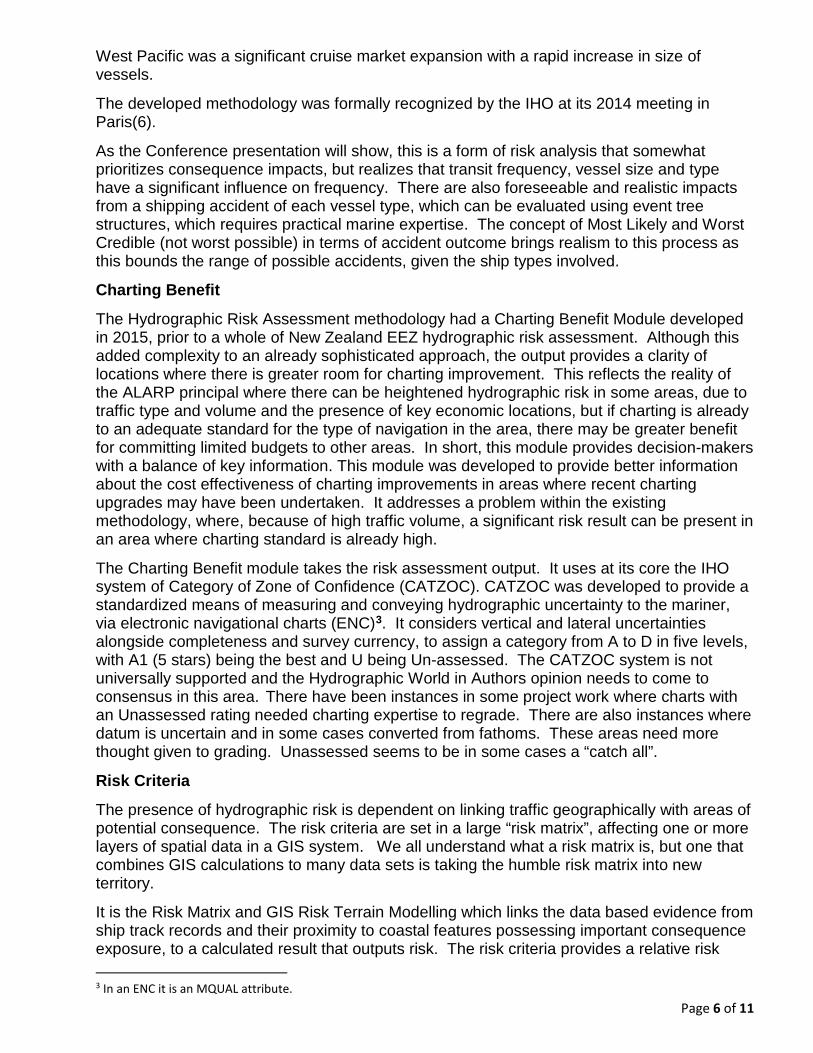
Figure 2 shows an overall hydrographic result, with the methodology applied for the whole of New Zealand waters.
Figure 2: Hydrographic Risk Output - New Zealand EEZ
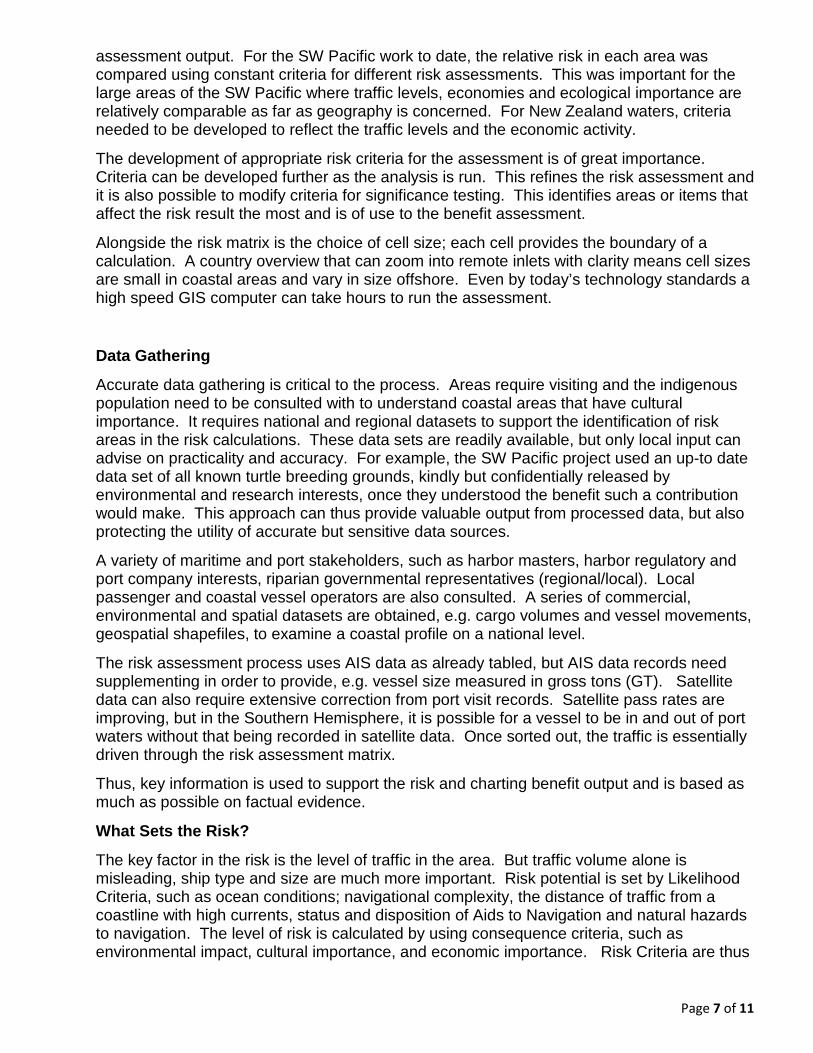
Charting Benefit Application
The assessment of charting benefit is a separate module, run after the risk assessment output has completed. The benefit module complements the hydrographic risk module in that it measures the ability of the hydrographic system to reduce risk by an upgrade of the charting system (either a charting reorganization, scales, extents or improved sea floor coverage through a survey update). The purpose of the charting benefit model is the identification of areas where there is the most positive benefit available from charting improvements (Figures 3 and 4). The benefit module does take the cost of survey into account, so can be used to help with selection of the most appropriate survey technology, or even to help with tender selection. The Charting benefit is not driven by cost alone, it is driven by the available scope of achievable charting upgrade in relation to the hydrographic risk present in any given area.
It is needed because of the reality that areas of heightened hydrographic risk exist in any coastline. However charting may already be appropriate for the needs of navigation, especially in deeper waters where many years of transit have been problem free. Incidents can thus have a greater role in charting benefit assessment than in the generation of hydrographic risk!
Page 9 of 11
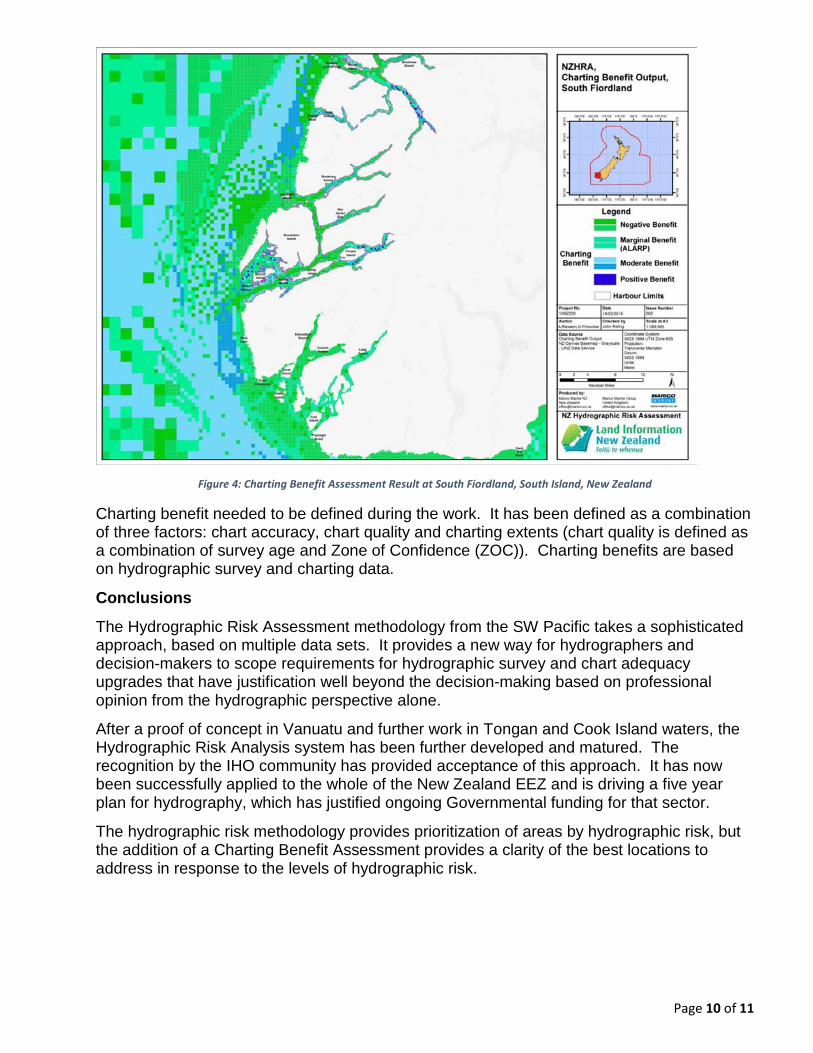
Examples of charting benefit, again using a New Zealand overview as an example are shown in Figures 3 and 4. Figure 4 shows the result in the Fiordland waters of the South Island and demonstrates that with careful design of cell size, the results remain clear when individual channels are needing to be assessed.
Figure 3: Charting benefit Result Overview for New Zealand Waters
Page 10 of 11
Figure 4: Charting Benefit Assessment Result at South Fiordland, South Island, New Zealand
Charting benefit needed to be defined during the work. It has been defined as a combination of three factors: chart accuracy, chart quality and charting extents (chart quality is defined as a combination of survey age and Zone of Confidence (ZOC)). Charting benefits are based on hydrographic survey and charting data.
Conclusions
The Hydrographic Risk Assessment methodology from the SW Pacific takes a sophisticated approach, based on multiple data sets. It provides a new way for hydrographers and decision-makers to scope requirements for hydrographic survey and chart adequacy upgrades that have justification well beyond the decision-making based on professional opinion from the hydrographic perspective alone.
After a proof of concept in Vanuatu and further work in Tongan and Cook Island waters, the Hydrographic Risk Analysis system has been further developed and matured. The recognition by the IHO community has provided acceptance of this approach. It has now been successfully applied to the whole of the New Zealand EEZ and is driving a five year plan for hydrography, which has justified ongoing Governmental funding for that sector.
The hydrographic risk methodology provides prioritization of areas by hydrographic risk, but the addition of a Charting Benefit Assessment provides a clarity of the best locations to address in response to the levels of hydrographic risk.
Page 11 of 11
Works Cited
1. UKHO. IHO Capacity Building Strategy - The three stages of development of hydrographic capacity: https://www.iho.int/mtg_docs/rhc/NIOHC/NIOHC11/NIOHC11-14_Capacity-Building.pdf. 2014.
2. IMO. Revised guidelines for formal safety assessment (FSA) for use in the IMO rule-making process. London: IMO, 2013.
3. Rawson, Andrew and Riding, John. Improving Port Safety using GIS. Global Port & Marine Operations, 2014. 9th International Harbour Masters Association Congress, 2014.
4. Baylon A.M., and E.M.R. Santos. Introducing GIS to TransNav and its Extensive Maritime Application: An Innovative Tool for Intelligent Decision Making? TRANSNAV, the International Journal on Marine Navigation and Safety of Sea Transportation, December 2013, pp 557-566.
5. IHO. SW Pacific Regional Hydrography Programme – Methodology and Vanuatu Risk Assessment Results: https://www.iho.int/mtg_docs/CB/CBA/Risk/SWPRHP-Hydrography-Risk-Assessment-Methodology.pdf. 2015.
6. Sixth meeting of the IHO inter-regional coordination committee, IHO IRCC6, Paris, France 19 - 20 May 2014. http://www.iho.int/mtg_docs/com_wg/IRCC/IRCC6/IRCC6_Docs.htm