Embed Size (px)
Citation preview
Chapter 17: Fire
John A Stanturf and Scott L Goodrick
Key Findings
• Climate forecasts indicate that the South's spring and fall wildfire seasons will be extended.
• Prescribed fires, currently conducted on roughly a 3 to 5 year rotation across much of the South, would need to become more frequent if conditions become drier.
• Major wildfire events, such as the 2007 Okefenokee wildfires, 2008 Evans Road Fire in eastern North Carolina, and recent west Texas fire seasons, are also likely to occur more often. Such events currently occur once every 50 years; however they could be more frequent in a warmer/drier climate.
• Land use change will have the most immediate effects on fuels and wildland fire management by constraining prescribed burning and increasing suppression complexity and cost.
• Air quality issues will likely increase restrictions on prescribed burning over large areas, not just in the wildland-urban interface.
• Potential health and safety concerns, in addition to air quality restrictions, will add to the regulatory constraints on use of prescribed burning.
• Alternatives to prescribed burning are generally not cost-effective and do not provide the ecological benefits of fire to adapted ecosystems; nor do they provide adequate protection for structures and human communities.
• Restrictions on use of prescribed burning to manage fuels will exacerbate potential climate change effects, particularly in the Coastal Plain and on the western Appalachian Mountains, where models predict an increase in wildfire potential.
• Fuels buildups combined with more intense wildfires under a warmer, drier climate could severely degrade fire-dependent communities that often support one or more threatened, endangered, or sensitive species.
• In addition to increasing the severity of wildfire events, the drier conditions and increased variability in precipitation that are associated with climate change could hamper successful forest regeneration and cause shifts in vegetation types over time.
Introduction Fire is an integral part of the southern landscape. The pervasive role of fire predates human
activity in the South (Lafon 2010, Stanturf and others 2002), and human society has magnified that role.
The South leads the nation in number of wildfires per year, averaging approximately 45,000 wildfires per
year from 1997 through 2003 (Gramley 2005). Continued population growth in this region increases the
potential threat that wildfires pose to life and property. In addition, forestry and forestry related
industry represent a significant portion of the region's economy, making each wildfire a potential loss to
a local economy.
Prescribed fire is an important tool used in the South to manage hazardous fuels and provide
other ecological and economic benefits (Wade and Lunsford 1989). Each year approximately 8 million
acres (3.2 million ha) of land are treated with prescribed fire in the South — more than in all other
regions combined (Wade and others 2000). Most of this acreage is burned for hazardous fuel reduction,
wildlife management, and range management; although an increasing number of acres is burned for
ecosystem restoration and maintenance. Most prescribed burning is carried out in the Coastal Plain and
Piedmont; however, its use is increasing in the Southern Appalachians and Ozark/ Ouachita Highlands as
historic fire regimes are reintroduced into these physiographic regions. Of increasing importance is the
use of prescribed burning in landscape restoration, in particular for longleaf pine (Pinus palustris; see
Brockway and others 2005). In March 2009, the Regional Working Group for America’s Longleaf
published a “Range-wide conservation plan for longleaf pine” that calls for increasing the extent of
longleaf forests from 3.4 million acres to 8 million acres over 15 years (online report available at
http://www.americaslongleaf.net/resources/the-conservationplan/Conservation%20Plan.pdf, last
accessed on 9 December 2010). Because periodic burning is essential to maintain the longleaf
ecosystem, successful restoration will require a significant increase in the area burned annually in the
South (Southern Regional Partnership for Planning and Sustainability 2010).
In the United States, the popular notion of wildfires often focuses on the large conflagrations
common in the western states. However, wildfires occur more frequently in the Southeast, where rapid
vegetation growth and fuel accumulation combine with frequent ignitions from lightning and humans.
Wildfires in the Southeast have the potential to develop into large, dangerous conflagrations, as
epitomized by the Volusia Fire (111,130 acres) and the Flagler/St. John Fire (94,656 acres) that occurred
in Florida in 1998 and more recently the Bugaboo Fire/Big Turn Around/Sweat Farm Road Fires
(Okefenokee) Fires of 2007 (over 600,000 acres), which occurred in Georgia and Florida and the 2008
Evans Road Fire in North Carolina (over 41,000 acres). Despite the annual wildfire acreage typically being
relatively small compared to the West, a disproportionate number of the structures destroyed nationally
by wildfires are located in the Southeast (Monroe 2002). For example, in 2008 the Highway 31 Fire in
South Carolina burned 19,000 acres, destroyed or damaged 176 homes and caused economic losses in
excess of $50 million.
Wildland fire is an integral component of southern ecosystems across a range of climatic
conditions, including recent warming associated with greenhouse gas emissions. Westerling and
Swetnam (2003) have linked annual areas burned in the Southwest to similar large-scale patterns
favoring unusually dry conditions. Their reconstructed paleo-fire records reveal that the drought-
producing, year-to-year variability in the atmospheric circulation patterns of the past are still a driving
force in the variability of wildfire season severity. Wildfires continue to exhibit significant variability from
one year to the next. For example, the burned area in the U.S. increased from 1.3 million acres (0.5
million ha) in 1998 to 5.6 million acres (2.3 million ha) the next year (National Interagency Fire Center
2010). This mainly results from the inter-annual variability of atmospheric condition, which is a
determinant for wildfires along with fuel properties and topography (Pyne and others 1996).
The close relationship between droughts and wildfires provides a basis for evaluating and
predicting wildfire potential. Several studies have linked long-term atmospheric anomalies and wildfire
activities in the South (Brenner 1991, Dixon and others 2008, Goodrick and Hanley 2009), using
atmospheric teleconnection patterns to predict wildfire season severity and help establish a strong tie
between wildfire activity and the global climate system. Using the Keetch-Byram Drought Index to
forecast changes in wildfire potential at a global scale, Liu and others (2009) found that wildfire
potential in the United States is likely to increase by the end of this century, although the magnitude of
this increase varied widely, depending on the climate model and emissions scenario selected for the
projection.
The remainder of this chapter examines how wildland fire conditions could evolve over the next
50 years, and how these changing conditions may impact prescribed fire in the South. Our examination
of changing wildland fire conditions builds upon the methodology of Liu and others (2009) by using a
simple water balance-based wildfire potential index to relate changes in temperature and precipitation
patterns across the South to changes in fire potential. We evaluate four possible futures (ch. 2) each of
which represent a different combination of general circulation model and greenhouse gas emission
scenario (Intergovernmental Panel on Climate Change 2007). For each of these Cornerstone Futures, we
examine potential changes in the duration and severity of future wildfire seasons and how these
changes may impact prescribed burning.
The issues affecting continued use under current conditions of prescribed burning will be
presented, along with a discussion of alternatives and their efficacy. Prescribed burning is used routinely
to reduce fuel loads and decrease the risk of catastrophic wildfires, improve forest health, and manage
habitat for threatened and endangered species. Increasingly, one of the most effective tools in the
manager’s kit, fuel reduction by frequent understory burning, is off-limits because of safety and liability
risks (Achtemeier and others 1998, Wade and Brenner 1995) or public dislike for the inconvenience of
smoke (Macie and Hermansen 2002). The concluding section will describe the effects of potential
climate change on prescribed fire practice.
Methods
To address questions regarding future wildfire potential, we examine the response of a drought
index to a set of simulated future conditions. A description of these methods follows. Questions
regarding the future of prescribed burning are addressed using a synthesis of the scientific literature
linked to these forecasts.
Climate Scenarios
Four climate scenarios are used in evaluating potential changes in wildfire potential over a 50
year period from 2010 and 2060. These four scenarios represent four of the six Cornerstone Futures
presented in chapter 2 and represent different combinations of general circulation model and IPCC
greenhouse gas emission scenario. Cornerstone A uses the MIROC model developed by the University of
Tokyo’s Center for Climate System Research (National Institute for Environmental Studies) and forced by
the IPCC's A1B emissions scenario. Also using the A1B emissions scenario, Cornerstone B uses the CSIRO
mk3.5 model developed by the Commonwealth Scientific and Industrial Research Organization of
Australia. Cornerstone C employs an older version of the CSIRO model (mk2) forced by the IPCC's B2
emissions scenario. Cornerstone D uses version 3 of the Hadley Centre Coupled Model forced by the
IPCC's B2 emissions scenario.
IPCC emissions scenarios combine two sets of divergent tendencies: one set varies between
strong economic values and strong environmental values, the other set between increasing globalization
and increasing regionalization (Nakicenovic and others 2000). The A1 scenario family describes a future
of very rapid economic growth, global population that peaks in mid-century and declines thereafter, and
the rapid introduction of new and more efficient technologies. Within that family, A1B represents a
balance between fossil fuels and alternative energy sources. The B2 scenario describes a world with

continuously increasing global population, moderate levels of economic development, and less rapid but
more diverse technological change than in the A1B scenario.
The climate and wildfire potential information presented in this chapter is based on decadal
averages, rather than on individual years. Therefore, data for 2010 represents the average of all the
years from 2001 to 2010. Monthly data is also expressed as a decadal average, for example, April
2060 would represent the average of the 10 Aprils from 2051 to 2060.
Measuring Wildfire Potential
Wildfire potential is a complex function of recent weather conditions, vegetation and
topography. Of these three components, weather exhibits the most variability at any given spot.
Wildfire potential is often determined using a system such as the National Fire Danger Rating System
(Burgan 1988) that utilizes afternoon weather observations of temperature, humidity, wind speed, and
precipitation amount/duration. In general, the output from general circulation models does not include
all the information that would be required by such a system to project future changes in wildfire
potential.
The Keetch-Byram Drought Index (KBDI) is a rather simple drought index designed specifically
for assessing wildfire potential in the South (Keetch and Byram 1968). The KBDI is a cumulative
measure of the balance between evapotranspiration and rainfall; and only requires three inputs: daily
high temperature, daily rainfall and annual average rainfall. The high temperature and annual rainfall
are used to estimate daily evapotranspiration (annual rainfall acts as a surrogate for the amount of
vegetation as higher annual rainfall supports more vegetation which leads to increased
evapotranspiration).
The KBDI has two potential limitations for climate change work. First, because the function
defining evapotranspiration was derived for historical rainfall and temperature regimes, the fit may
not be as good under climate change conditions. Secondly, the index scale is fixed to be from 0 (very
wet) to 800 (extremely dry) with a nonlinear, asymptotic approach to this maximum value. For a
changing climate where conditions could potentially get much drier than they are currently, use of the
KBDI could underestimate the potential drought conditions by compressing the changes into the
asymptotic portion of the curve.
As an alternative index, referred to as simply the potential drought index (PDI), we use the
balance between 0.75 times the potential evapotranspiration minus precipitation. The 0.75 scaling is
designed to reflect the fact that the potential evapotranspiration is an overestimate of the actual
evapotranspiration (Eagleman 1967). The exact value of this scaling coefficient is not critical; the
primary requirement is that it provides reasonable estimates of the current water balance conditions
to serve as a basis for evaluating future changes. The slight change in how evapotranspiration is
calculated compared to the KBDI will cause the PDI to accentuate drought conditions and thus
highlight areas of potential increases in wildfire potential. The PDI has an open ended scale with units
of millimeters. Positive values of the PDI indicate drought conditions.
Results
Future Wildfire Potential Changes
Annual fire potential — Wildfire reports compiled as part of the Southern Wildfire Risk
Assessment (SWRA, Buckley and others 2006) reveal three primary areas of wildfire activity from 1997
to 2002: the Coastal Plain, the western Appalachian Mountains (eastern parts of Kentucky and
Tennessee) and eastern Oklahoma/Arkansas (fig 17-1). Other areas may be important locally but are
of limited geographic extent, such as the Coastal Plain sandhills, where longleaf pine burns regularly.
Care must be taken when examining this figure as not all States provided wildfire records with
latitude/longitude for each fire; some States located all wildfires at the geographic center of counties.
This is especially noticeable in Texas, where counties are larger.
All four Cornerstone Futures provide a consistent view of the current annual fire potential as
expressed by the PDI (fig 17-2). On these maps brown areas define regions where evapotranspiration
exceeds precipitation (positive PDI) while in blue regions precipitation dominates (negative PDI). White
areas show a balanced moisture budget (PDI near zero). Areas farthest west are dominated by the
highest PDI values because of lower precipitation and higher summer temperatures; areas farther east
are dominated by higher precipitation, leading to negative PDI values. The primary differences among
the Cornerstone Futures are primarily focused in the Ohio River Valley where Cornerstone B is the
wettest, and along a band just inland of the coast where the PDI is near zero. This band is most evident
for Cornerstones C and D.
Comparing these PDI maps to the map of acres burned in figure 17-1 shows that areas with the
driest conditions (highest PDI) do not necessarily have the highest acres burned. The Coastal Plain,
whose annual PDI in Cornerstones B, C and D is near zero has some of the highest amounts of burned
area. The areas with highest positive PDI values are not productive enough to support sufficient build up
of fuels to support frequent wildfires. The eastern Oklahoma/Arkansas region is another area of
transition in the PDI reflecting near balance between rainfall and precipitation. The western
Appalachians shows significant areas burned despite having the lowest PDI values.
In 50 years, all Cornerstone Futures depict drier conditions (fig 17-3). Cornerstone A depicts the
most severe conditions with an eastward expansion of the western dry area and the development of a
similar area in southern Georgia and Florida; only the Appalachians maintain a negative PDI. The other
Cornerstone Futures are very consistent in their depiction of drier conditions, though the magnitude of
the drying is far less than in Cornerstone A. The central part of the region shifts from negative PDI values
to a more balanced condition and the band of near zero PDI in the Coastal Plain becomes better defined.
All three of the primary fire areas depicted in figure 17-1 experience an increase in wildfire potential,
with Cornerstone A showing the most dramatic increase and B, C and D showing more modest increases.
Seasonal variation of wildfire potential — These annual numbers provide a glimpse of future
wildland fire conditions, but examination of PDI changes at the seasonal scale provides more
information. Splitting the area burned information presented in figure 17-1 by season provides insight
into the current wildfire season. Figure 17-4 shows the number of acres burned during the winter
months (December, January and February). South Florida and the western Appalachians are the areas
showing highest wildfire activity; although wildfire activity is present at a low level across much of the
South. For southern Florida, the heart of the dry season is the winter months, when natural ignitions are
uncommon, but human ignitions are sufficient to support significant winter wildfire activity. In the
Appalachians, much of the winter wildfire season is tied to either the start or end of the season
reflecting either a prolonged fall wildfire season or an early start to a spring wildfire season.
Spring (March, April, May) brings more wildfire activity, particularly to the Coastal Plain and
Piedmont (fig 17-5). Along the Coastal Plain, sea-breeze induced thunderstorms provide a natural
ignition source along with the ever present human ignition component. By summer (June, July, August),
wildfire activity decreases throughout the Appalachians while a low level of wildfire activity persists in
the Coastal Plain, where continuing thunderstorms produce sufficient rainfall to reduce the probability
ignition by late June or early July (fig 17-6). Fall brings a return of wildfire activity to the Appalachians
and a great reduction in the Coastal Plain, particularly Florida (fig 17-7). For much of the Appalachians
the input of litter to the forest floor provides the fuel to support the spread of wildfires when coupled
with dry conditions.
Although wildfires are possible in any season, the two areas discussed above have distinct
wildfire seasons. For the Coastal Plain, wildfire activity is lowest in the fall and highest in the spring,
with some activity spilling over into summer and winter. For the Appalachians, activity is lowest in the
summer and highest in the fall, with spring providing a secondary peak in wildfire activity. Winter
wildfire activity in the Appalachians is considerably more than during summer, but is largely tied to
either an extended fall wildfire season or an early spring season. Although no other area shows a
seasonal peak in wildfire activity as pronounced as the Coastal Plain or Appalachians, the eastern
Oklahoma/Arkansas region experiences wildfire activity in all seasons.
For current conditions under Cornerstone A, winter is the primary rainy season, although the
areal extent of this wet area is restricted to the Appalachians as reflected by the PDI (fig 17-8). During
the summer, Cornerstone A is dominated by pronounced drying and fails to capture the summer rains
in Florida and along the Coastal Plain. Over the course of 50 years, this drying is further reinforced and
virtually eliminates all areas of negative PDI values (fig 17-9).
Cornerstone B offers a better representation of current conditions compared to Cornerstone A
(fig 17-10); especially in capturing the evolution of the spring/fall wildfire season of the Coastal Plain.
Key features of note are the improved flow of moisture from the Gulf of Mexico northward across the
Appalachians and dry conditions across Florida during winter. The area of moist conditions shifts
northward during spring as dry conditions expand across the Coastal Plain. Summer brings dry
conditions to much of the South, with the exception of the Coastal Plain where precipitation from
afternoon thunderstorms balances the dry conditions. During fall, dry conditions return to the Coastal
Plain.
Compared to Cornerstone A, the changes in wildfire potential in 50 years are much more subtle
under Cornerstone B (fig 17-11); which shows substantial drying along the Gulf of Mexico during winter
and areas of dryness in spring and summer that are similar but smaller than in Cornerstone A. Unlike the
domination by strong, widespread drying under Cornerstone A; Cornerstone B shows a much smaller
area of change that is strongest during winter rather than summer. Wintertime drying could adversely
affect prescribed burning by favoring conditions that promote escaped prescribed fires. Drier conditions
would also promote increased fuel consumption on prescribed burns, increasing the likelihood of air
quality problems. Cornerstones C and D resemble Cornerstone B in spatial patterns but their magnitudes
of changes after 50 years are smaller.
Monthly variation in wildfire potential — To get a better feel for the spatial extent of these
changes in wildfire potential as described by the PDI, we examine the changes in areal extent of wet and
dry conditions within each State by month. What constitutes wet versus dry conditions for each
Cornerstone is determined by taking all PDI estimates for 2010 and splitting this collection of values into
thirds. The third with the highest PDI values represents dry conditions and the lowest third wet
conditions. The breakpoints defining dry versus wet conditions are shown in table 17-1 along with
maximum/minimum values for each Cornerstone.
For current conditions, Cornerstones A, C and D have many of the States predominantly in the
wettest category for November through March, then transitioning to the driest category for June
through August (tables 17-2 to 17-5). Cornerstone B has a much more prolonged and gradual transition
in the spring for many of the States. These transition periods in spring and fall are typical of the southern
wildfire season, and they largely depend on the annual evolution of live fuel moisture conditions. In
spring, live fuel moisture values are low until the start of green up. Periods of drought during this time
create periods of high fire danger. When live fuel moisture peaks, the moisture content acts as a heat
sink, reducing the fire danger. In the fall, live fuel moistures begin to decline in many species which
along with drying from high summer temperatures brings about the fall wildfire season. The onset of
winter rains typically signals the end of the fall wildfire season.
Notable exceptions to this pattern are Florida, Texas and Oklahoma.
• Florida has a complex climate as the northern part of the state has both a summer and
winter rainy season while the southern part exhibits only a single summer rainy
season. In Florida the primary wildfire season is in the spring as this is the time of year
when most of the acres burn. For the southern part of Florida spring marks the peak of
dry conditions prior to the start of the summer rainy season. During May and June, the
summer rainy season begins with isolated thunderstorms. Lightning from these storms
provides a major ignition source until the rainy season progresses to a point where
most areas are receiving rain on a regular basis.
• Texas and Oklahoma represent the dry western portion of the region. During winter,
the storms that move eastward out of the Rocky Mountains are dry and must begin
rebuilding their moisture levels from southerly winds coming from the Gulf of Mexico.
This process is just getting started as the storms move across Texas and Oklahoma,
only reaching significant moisture levels in those States’ eastern parts (hence the very
low acreage in the wet category).
In 50 years, Cornerstone A has almost every acre of the South in the driest category during the
summer (table 17-6). This scenario completely erases Florida's summer rainy season. This reveals a
possible flaw in the downscaling used to generate the Cornerstone Futures. Florida's summer rains are
small scale local events, far below the resolution of the underlying general circulation models. These
storms are forced by the difference in temperature between the land and ocean which is not going to
disappear due to climate change. Cornerstones B, C and D show only subtle differences (tables 17-7 to
17-9). The gradual transition from winter rainy season to summer dry season in Cornerstone B is largely
erased which brings the 2060 conditions into much closer alignment with Cornerstones C and D.
Impacts of climate change — Results from the four Cornerstone Futures indicate that wildfire
potential is likely to increase over the next 50 years. The magnitude of that increase is likely to be fairly
slight, although one scenario (Cornerstone A) predicts a significant increase. Predicted results for
Cornerstone B are much more aligned with Cornerstones C and D despite being forced with the same
emissions scenario as Cornerstone A (A1B). This suggests that the simulated severe drying of
Cornerstone A may be more closely tied to the general circulation model used for the simulation than
any forcing from the emissions scenario.
From Cornerstone B we can expect both the spring and fall wildfire seasons to increase in
duration across the Coastal Plain. Drier conditions in winter spring and summer will likely both extend
and worsen the spring wildfire season. Although the results presented above reflect average conditions,
it is likely that we will see shifts in variability that will result in the bad wildfire seasons being worse than
they currently are. Winter and summer drying will likely extend the fall wildfire season, but the overall
fall magnitude is little changed from current conditions. Outside of the Coastal Plain, the western
Appalachians would see drier summers, resulting in a prolonged spring and earlier fall wildfire season.
These changes in wildfire potential in the South would lead to longer fire seasons, but for the
elevated fire potential to translate to increased acres burned requires ignitions. Because the vast
majority of southern wildfires are human caused, not natural; changes in ignitions will be more closely
tied to social issues than to climate. As the population in the South continues to increase and the
wildland-urban interface continues to expand, ignitions caused by human carelessness are likely to
increase, creating wildfire conditions that quickly exceed local suppression capabilities.
Future of Prescribed Fire
Prescribed fire is an important tool used in the South to manage hazardous fuels. The potential
for an extended wildfire season will magnify the importance of effective fuels management. However,
the same drying that is extending the wildfire season could also limit the ability to use prescribed fire as
the dry conditions will likely increase the potential for escaped fires and also increase the potential for
the fires to harm resources. Dry conditions will promote increased fuel consumption and consequently
increased emissions. With air quality standards continually being tightened, these added emissions
could result in further constraints on prescribed fire usage to help protect the health of the growing
population. Air quality issues could have the largest impact on prescribed fire as air quality restrictions
would restrict burning over large areas, not just within the wildland-urban interface.
The rapid expansion of the US population since World War II into formerly rural areas has
caused significant shifts in land use and land cover. Natural resource managers must cope with
constraints on traditional tools as well as a new class of resource and societal problems in the
interface zone where urban and wildland uses must co-exist. A history of extensive clearing,
farming, or grazing has left many legacies, including an extensive road system (fig 17-12).
Population growth since the middle of the last century has caused increasing urbanization and
fragmentation of the forested landscape (Wear 2002, Stanturf and Wimberly In Press), increasing
the size and importance of the wildland-urban interface. More people now live at the interface
and the transportation system is expanding, becoming denser and more pervasive (Riitters and
Wickham 2003).
Aside from the physical aspects of urbanization, changing demographic profiles and
cultural values (Cordell and others 2004) have altered attitudes towards natural resource
management in general (Bliss and others 1997, Hull and Stewart 2002, Jacobson and others 2001)
and prescribed burning in particular (Loomis and others 2001, Duryea and Hermansen 2002).
More than 50,000 U.S. communities on the wildland-urban interface have been designated as “at
risk” for fire, and most of them (70 percent) are in the Southern States (Blue Ribbon Panel 2008).
The values at risk are substantial: recent wildfire seasons have been expensive with suppression
costs in 2002 at $1.5 billion nationwide (National Interagency Fire Center 2001) and damage
estimates from the 1998 wildfires in Florida alone costing close to $800 million (Butry and others
2001).
The growing wildland-urban interface increases both the risk of wildfire occurring and the
cost of wildfire by placing higher values at risk than in wildland areas. Use of prescribed burning in
the wildland-urban interface is still practical but requires more planning and preparedness, safe
conduct, and communication with landowners and local officials (Miller and Wade 2003, Wade
and Mobley 2007). In addition to the increased complexity of fire management, State agencies are
faced with a dwindling workforce as the number of firefighters dropped by 24 percent between
2004 and 2010 (David Frederick, Fire Director, Southern Group of State Foresters, personal
communication, Feb. 2011). Declining budgets impact more than just staffing as agencies incur
increased costs for training their staff and cooperators to work in the interface (State of Georgia
2010). High rates of arson in some states add to the fire risk (U.S. Department of Agriculture
Forest Service 2011).
The South exemplifies the problems of mixing urbanized land uses with fire-adapted natural
vegetation. Urbanization constrains traditional forest management and use of prescribed burning even
at the wildland end of the urban-wildland gradient because of concerns for liability from escaped
prescribed fire, transportation safety, and regional air quality. Moving toward the urban end of the
gradient, these concerns greatly increase often resulting in abandonment of fuel management and
increased risk of occurrence and severity of inevitable wildfire. Because of an extensive road system, the
entire South may be regarded as a wildland-urban interface, at least in terms of managing smoke from
prescribed burning.
Even when continued forest management is feasible, there will likely be further constraints on
use of prescribed burning in the wildland-urban interface due to smoke. Smoke from prescribed burning
is a critical issue in the South due to a combination of physical (meteorology, climate, topography),
biological (fire-affected vegetation and hazardous fuels), and social (population density, road network)
factors. In fact, smoke is probably the key issue in suitability of prescribed burning as a way to manage
fuel loads in the interface. Concerns with smoke are several: local and regional air quality (Achtemeier
and others 2001, Achtemeier 2003, Monroe 2002), visibility on roads (Mobley 1989), and health impacts
especially on sensitive segments of the population with respiratory problems (Sorenson and others
1999).
Threat of Escapes—Potential liability from escaped prescribed fire is often cited as a constraint
on the use of prescribed burning (Haines and Cleaves 1999, Haines and Busby 2001, Brenner and Wade
2003). Even when the best available practices are applied, the possibility of an escape exists. Potential
damage to neighboring properties, endangerment of human lives, and smoke-caused transportation
accidents pose liability risk, along with litigation costs (Sun 2006).
Following the lead of Florida, all Southern States except Tennessee have revised their liability
laws to limit liability unless negligence is involved (Brenner and Wade 2003, Sun 2006); some
differentiate between simple and gross negligence. In the 10 States with simple negligence rules
(Alabama, Arkansas, Kentucky, Louisiana, Mississippi, North Carolina, Oklahoma, South Carolina, Texas,
and Virginia), a landowner who does not exercise the care that would be exercised by a “reasonable
prudent person” could be held liable for damage from an escaped prescribed fire. In Florida and
Georgia, where the gross negligence rule holds, the burden on the landowner or agent is even lower
(Sun 2006). Thus State legislatures in the South offer legal protection for managers who use prescribed
burning, provided they follow relevant laws and regulations, and exercise care in planning and
execution.
Smoke—Smoke is produced when wood and other organic material combusts (Urbanski and
others 2009) and produces a mixture of gases, solid particles, and droplets. Because wood fires are
generally inefficient, they produce a large number of chemicals. Emissions from wildland fire are usually
expressed as emission factors, defined as the mass of compound released per mass of dry fuel
consumed (Urbanski and others 2009). Emission factors are influenced by fuel moisture and whether
combustion is smoldering or flaming (Naeher and others 2007). In the South, the preferred time for
prescribed burning is when fuel moisture is high and meteorological conditions favor low-intensity fires
with lower fuel consumption as compared to wildfires that typically occur under drier conditions that
favor high-intensity fires with more complete fuel consumption. Prescribed burning generally results in
lower emissions than wildfire (Urbanski and others 2009). Typical emission factors from prescribed
burns in a variety of southern forest ecosystems are given in Table 17-10; the dominant compounds
emitted are carbon dioxide, carbon monoxide, and particulates (Urbanski and others 2009).
Smoke is a problem when it in some way negatively impacts human habitation or activity
(Achtemeier and others 2001). Smoke is a health problem when it invades the habitation of those with
respiratory problems and other smoke-sensitive illnesses (Naeher and others 2007). Smoke is a nuisance
when it irritates the eyes and mucus membranes of the nose and throat. Smoke is a nuisance when it
deposits soot on clothes hung out to dry. Smoke is a safety problem when it impedes local visibility to
create hazards to drivers of motor vehicles. The enormous wildland—urban interface and dense road
network located in a region where up to six million acres of forest land per year are subject to
prescribed fire combine to make problem smoke the foremost forestry-related air quality problem in the
South. During the daytime, smoke becomes a problem when it drifts into areas of human habitation. At
night, smoke can become entrapped near the ground and, in combination with fog, create visibility
reductions that cause roadway accidents. Public complaints about smoke-related problems usually begin
at levels well below national ambient air quality standards.
Air Quality—One of the key indicators of air quality is whether monitoring shows that an area
complies with the national air quality standards established by the Environmental Protection Agency
(EPA). Although EPA does not directly regulate the use of wildland fire, it is responsible for enforcing the
sections of the Clean Air Act that requires States and Tribes to attain and maintain the national ambient
air quality standards (NAAQS). The EPA also must develop “primary” and “secondary” standards for six
pollutants: ozone, particulate matter, sulfur dioxide, carbon monoxide, nitrogen dioxide and lead (table
17-11). Primary standards are for human health and secondary standards for public welfare, which
includes damage to vegetation and crops as well as effects on visibility. Of these six pollutants, only
two—sulfur dioxide and lead—are of little concern for prescribed burning. As a result of rapid dilution
and its instability, carbon monoxide emissions from prescribed burning are not a concern to the general
public (National Coalition of Prescribed Fire Councils 2007). However, carbon monoxide emissions may
be a concern to firefighters and prescribed burning crews.
Although nitrogen oxides from prescribed burning are not of concern on a local level (National
Coalition of Prescribed Fire Councils 2007), they combine with other emissions (volatile organic carbon,
particulates, and carbon monoxide) in a photochemical process (Urbanski and others 2009) and
contribute to ozone formation that may be a concern in some areas (National Coalition of Prescribed
Fire Councils 2007). Figure 17-13 shows the current status of non-attainment areas in the South for
ozone and highlights the relationship of urban areas to non-attainment status. Ozone and particulate
levels are generally at their lowest ambient levels during the prescribed burning season in the South,
winter and early spring (Southeast Regional Partnership for Planning and Sustainability 2010). But
occasionally summer burns are recommended for ecological reasons (Brockway and others 2005), a
practice that would be limited in an area designated as non-attainment for ozone and particulates.
After carbon dioxide and carbon monoxide, particulates account for the greatest share of
emissions from wildland burning (Urbanski and others 2009) and because particulates are a criteria
pollutant, currently they are the greatest concern from prescribed burning. Wood smoke particulates
are relatively small but their size distribution can vary greatly, depending on the rate of energy release.
Because of their size (generally, 70 percent are smaller than 2.5 microns in aerodynamic
diameter or PM2.5), wood smoke particulates scatter light and reduce visibility (National Coalition of
Prescribed Fire Councils 2007). Standards for particulate matter have been on a trend of increasing
stringency since 1971 (Southeast Regional Partnership for Planning and Sustainability 2010)—with
current thresholds of 35 μg m-3
averaged for any 24 hour-period and 15 μg m-3
averaged over a full
year—and there is little evidence to suggest that standards will loosen in future reviews. Recent annual
and 24-hour ambient PM2.5
EPA also monitors visibility in Federal Class I areas (Fox and others In Press), which consist of all
levels for the States east of the Mississippi River and south of Virginia (EPA
Region 4) are displayed in figures 17-14 and 17-15. Although current levels for most of the Coastal Plain
are below national standards (both the current standards and those being evaluated), the same cannot
be said for areas in the Piedmont and Southern Appalachian Mountains.
international parks, national wilderness areas larger than 5,000 acres, national memorial parks larger
than 5,000 acres, and national parks larger than 6,000 acres that were established before 1977. EPA’s
1999 Regional Haze Rule (64 FR 35714) provides specific guidance on wildland fire for many Western
States but takes a more general approach for the rest of the country (National Coalition of Prescribed
Fire Councils 2007), requiring that all States with Class I areas consider the impacts of prescribed
burning on visibility. Five Regional Planning Organizations were established to help States develop
visibility protection programs; the Central Regional Air Planning Association serves Oklahoma, Texas,
Arkansas, and Louisiana and the Visibility Improvement State and Tribal Association of the Southeast for
all other Southern States. Their goal for each Class I area is to improve the 20 percent haziest days and
ensure that no degradation occurs on the cleanest days.
The Regional Haze Rule requires all States and participating Tribes to develop State
Implementation Plans for reducing emissions of visibility degrading aerosols, relative to “natural
background conditions.” Natural background haze is a complex concept that reflects contemporary, not
pre-European settlement conditions (Fox and others In Press). One central issue is whether wildland fire
is natural or anthropogenic. The policy developed for the Western States is that any wildfire or any fire
being managed to the natural fire frequency is classified as natural; any fire ignited or managed to
restore the natural fire frequency is anthropogenic (National Coalition of Prescribed Fire Councils 2007).
This policy, which has not been applied beyond the West, would have serious implications for the South,
especially in the mountains where prescribed burning for restoration objectives is increasing.
Transportation safety—The extensive transportation system in the South presents a formidable
challenge to prescribed burners. Although most burns are carried out without incident, smoke and
smoke/fog visibility obstructions on southern highways cause numerous accidents with loss of life and
personal injuries. Mobley (1989) reported 28 fatalities, more than 60 serious injuries, numerous minor
injuries, and millions of dollars in lawsuits from 1979 to 1988. Comparing three years of accident reports
in Florida, Lavdas and Achtemeier (1995) found accidents are more closely associated with local ground
radiation fogs (cooling of land after sunset) than with widespread advection fogs (formed when moist air
passes over a cool surface) and that most serious accidents occur at night or near sunrise when smoke
from smoldering fires is entrapped near the ground and carried by local drainage winds into shallow
basins. Near sunset, under clear skies and near calm winds, temperatures in shallow stream basins can
drop up to 20 °F in an hour (Achtemeier 1993) and strong, shallow valley inversions can develop. Weak
nighttime drainage winds of approximately 1 mile per hour (0.5 m sec-1
Achtemeier (2006, 2008, 2009) demonstrated that under certain conditions, fog combined with
smoke from prescribed burning can produce a “superfog” that reduces visibility to less than 10 feet (3
m, the definition of zero visibility). Motorists have no defense when driving from unlimited visibility to
zero visibility in a manner of seconds. Because most prescribed burns take place in the winter when dry
surface fuels overlay wet fuels, they often provide considerable moisture release both from the
combustion and from heated soil and underlying wet fuels that do not ignite. At night, moisture from
residual smoke can increase ambient relative humidity to 100 percent and contribute to the formation
of superfog (Achtemeier, 2009). Because we are just beginning to recognize the conditions for superfog
formation, the full significance of this extremely hazardous phenomenon is yet to be realized or
mitigated by the public safety community.
) can carry smoke more than 10
miles, far enough to carry smoke/fog over a roadway in many areas. An example is the smoke from
wildfires in 2000 that drifted across Interstate 10 and caused at least 10 fatalities, five in Florida and five
in Mississippi.
Human health—The greatest health threat from wood smoke appears to come from fine
particles although a number of other constituents have health effects (Naeher and others 2007). Fine
particles in wood smoke (less than 100 μg m3
Other groups may be more susceptible due to higher exposures: outdoor workers, firefighters
and emergency response workers (“Guidelines on vegetation fire emergencies for public health
protection” also contains a review of studies linking health effects to biomass burning. Available online
at
) that penetrate far into lung tissue have toxic effects
(Naeher and others 2007). Because ultra-fine particles (PM2.5) can be transported long distances from
the combustion site and may form later through condensation and atmospheric chemical reactions, they
can pose a health hazard to vulnerable populations at considerable distance from a prescribed burn.
According to the World Health Organization, vulnerable groups are the very young, pregnant women,
the elderly and individuals with pre-existing respiratory (asthma, chronic obstructive pulmonary
diseases) and cardiac diseases.
http://www.who.int/docstore/peh/Vegetation_fires/Health_Guidelines_final_3.pdf ,
A number of other wood smoke constituents have health effects (Naeher and others 2007).
Although carbon monoxide’s instability and rapid dilution preclude any threats to the general public
(National Coalition of Prescribed Fire Councils 2007), carbon monoxide emissions may be a concern to
firefighters and persons on prescribed burning crews. At least five chemical groups with known
carcinogenic properties are present in wood smoke along with 26 chemicals considered hazardous air
pollutants by EPA (Naeher and others 2007). Currently EPA is focusing on acetaldehyde, acrolein, 1,3
butadiene, formaldehyde, and polycyclic organic matter (Southeast Regional Partnership for Planning
last accessed on
9 December 2010). Recent studies have shown that wildfires and prescribed burns expose fire personnel
to smoke levels high enough to present potential occupational health concerns (Yanosky 2001, Carlton
and others 2004, Naeher and others 2007). Naeher and others (2006) also found that current exposure
standards for dust inhalation, although not intended to apply to wildland fire personnel, would be
inadequate if applied to protect fire personnel from harmful particulate exposures.
and Sustainability 2010). Naeher and others (2007) found that even limited exposure to wood smoke
can reduce resistance against infections, that most effects are associated with the particle phase, and
that an associations exists between wildfires and increased emergency room visits for upper and lower
respiratory illnesses and decreased lung functioning (Naeher and others 2007).
Alternatives to Prescribed Burning
Various mechanical and chemical alternatives to prescribed burning are used or have been
proposed and recent reviews provide details (Guldin 2010, Marshall and others 2008, Mercer and
Prestemon 2008, O’Brien and others 2010, Outcalt 2009, Reilly and others 2009, Schwilk and others
2009). Equipment such as mowers, mulchers and choppers are used to cut, chop, or sever mostly
midstory and understory fuel layers (Outcalt 2009). This equipment is most effective where large stems
are widely spaced and is often used in areas with high fuel loads. Mechanical methods change fuel
configurations but do not remove fuels from the site and may not completely mitigate the wildfire
threat. Most often they are used as a pre-treatment prior to prescribed burning. Although slope
limitations have traditionally hindered usage of mechanical methods in the mountains, increasingly
smaller crawler units are now available for steep slopes (Reilly and others 2009). Harvesting with
mechanized equipment is a normal forestry operation and clear-cutting or thinning for fuels
management or restoration is increasingly utilized especially in pine types (Outcalt 2009, Guldin 2010).
Harvesting to remove unwanted species or to reduce stem density is often followed by prescribed
burning to maintain stand structure and composition.
Herbicides that target broadleaved trees have been a standard treatment in pine plantation
management for more than 30 years. Managers also use herbicides for fuel reduction (Outcalt 2009).
Similar to mechanical fuel reduction methods, herbicides are often the precursor to prescribed burning
in stands with dense shrub-layer vegetation. Herbicide application followed by burning can be more

effective than burning alone (Outcalt 2009).
Prescribed burning remains the most widely used fuel treatment in the South although
significant acres are treated with mechanical means, mostly on Federal lands in the wildland-urban
interface zone (Outcalt 2009). Each method has benefits and drawbacks (table 17-13) with prescribed
burning often costing the least and providing the most ecosystem benefits (Glitzenstein and others
2003, Kirkman and others 2004a, b).
Carbon and Climate
Wildfire can affect climate through emitting carbon dioxide and aerosol particles into the
atmosphere (National Academy of Sciences 2010). The greenhouse gas effect is one of the major
contributors for climate change at long-term (decade and century) scale. Greenhouse gases in the
atmosphere can absorb long-wave radiation emitted from the ground, which prevents heat energy from
radiating into space. As a result, the temperature of the earth-atmosphere system increases. A number
of atmospheric general circulation models have projected that greenhouse gases will increase global
temperature by 4 to 6 °C by the end of this century, accompanied by significant changes in precipitation.
It is estimated that average annual global fire carbon emissions were about 2 Pg (petagrams) in the
recent decade, about a third of all carbon emissions. This indicates that wildfire emission is one of the
major sources of atmospheric carbon dioxide and therefore an important contributor to future climate
change, even though they comprised only 4 to 6 percent of anthropogenic emissions in the United
States (Wiedinmyer and Neff 2007).
Charlson and others (1992) showed that smoke from wildfires can affect global climate by
scattering and absorbing short-wave (solar) radiation (direct radiative forcing) and modifying cloud
microphysics (indirect radiative forcing). These processes can further modify clouds and precipitation
and atmospheric circulation (Ackerman and others 2000, Liu 2005a). In contrast, smoke aerosols

(including black carbon or soot) have a shorter life span, but greater spatial variability and the potential
for long-range transport (Kopp and Mauzerall 2010). Thus, they mainly affect short-term (daily, monthly,
or seasonal) regional climate variability. For example, figure 17-16 shows the role of the smoke aerosols
from the Yellowstone National Park wildfires in the development of the 1988 drought in the northern
U.S. (Liu 2005b). The precipitation change in response to radiative forcing of smoke aerosols was mostly
negative in the Northwest, with the largest negative response of about -30 mm found in the
northeastern portion of the Midwest. This was accompanied by positive responses in the Southwest,
Northeast, and southeastern portion of the Midwest; and negative response in the South. This simulated
pattern was similar to the observed pattern of precipitation anomalies, suggesting that the smoke
particles from the wildfire might have exacerbated the drought.
Although much about the interaction between wildfire and climate has yet to be understood
and great uncertainty surrounds U.S. policy and regulatory approaches, smoke from prescribed burning
clearly will receive increased attention from the scientific and policy communities. Recent studies have
called for a more complete accounting of fire in carbon budgets (Hurteau and others 2008) and have
emphasized the need to consider black carbon in climate change projections (Kopp and Mauzerall 2010).
If climate change increases the potential for wildfire and alters fire regimes (Running 2006), the ability of
forests to sequester carbon as a mitigation strategy could be compromised; instead of a carbon sink,
forests could become a carbon source. Although it is generally agreed that fuel management through
prescribed burning emits less carbon into the atmosphere compared to more intense wildfires, only a
few studies have quantified this comparison (Wiedinmyer and Hurteau 2010) or demonstrated how
forest management techniques can significantly alter the emissions from prescribed burning (Tian and
others 2008).
Conclusions and Discussion
The potential for an extended wildfire season magnifies the importance of effective fuels
management. However, the same drying that is extending the wildfire season could also limit the ability
to use prescribed fire because the dry conditions will likely increase the potential for escaped fires and
harm to resources. Dry conditions promote increased fuel consumption and consequently increased
emissions. If air quality standards continue to tighten, these added emissions could result in further
constraints on use of prescribed fire to protect the health of the growing population. Air quality issues
could have the largest impact on prescribed fire by restricting burning over large areas, not just within
the wildland-urban interface.
Prescribed burning is an important forest management tool in the South, used to manage fuels
and promote wildlife habitat. Because natural wildfires have been limited both by effective fire
suppression to protect other resources and by forest fragmentation, prescribed burning plays a critical
ecological role in restoring and maintaining the integrity of fire-dependent forest and grassland
communities.
Nevertheless, the near-term future of prescribed burning in the South is problematic. Changing
land use and demographics have increased the numbers of people and value of structures in close
proximity to wildlands, the so-called wildland-urban interface. In this interface zone, prescribed burning
requires greater skill and more attention to communication with the public, both of which increase costs
(State of Georgia 2010). State legislatures have established limits on liability from responsibly conducted
burns that escape, but laws can be changed. The greatest threat to continued use of prescribed burning
comes from the effects of smoke on public health, transportation safety, and air quality; and from new
regulations on carbon and greenhouse gas emissions to mitigate climate change. Air quality issues,
including caps on carbon and greenhouse gas emissions, would have the greatest impact as they could
restrict prescribed burning over large areas, not just the wildland-urban interface. Alternatives to
prescribed burning are neither cost-effective nor do they provide the ecological benefits of fire in
adapted ecosystems, (Glitzenstein and others 2003, Kirkman and others 2004a,b) and do not achieve
the same level of health and safety benefits to human communities.
Over the longer-term and factoring in the effects of climate change, the need for prescribed
burning will likely grow at the same time that obstacles, complexity and cost will increase. Restrictions
on the use of prescribed burning to manage fuels would exacerbate potential climate change effects,
particularly in the Coastal Plain and western Appalachian Mountains where wildfire potential is expected
to increase. Fuels buildups combined with more intense wildfires under a changed climate potentially
would have drastic consequences for fire-dependent communities that often support one or more
threatened, endangered, or sensitive species. Drier conditions with more variability in precipitation
could cause vegetation ranges to begin shifting, which could be initially resisted by active management,
particularly in production conifer forests where reforestation through planting currently is the norm.
Over longer time than the projections used here, the combination of climate change, extreme weather
events, and severe wildfires could disrupt successful regeneration and result in new species
assemblages, so-called novel ecosystems, with possibly novel fire regimes (Williams and Jackson 2007).
Acknowledgements The Atmospheric Science and Fire Science Teams of the Center for Forest Disturbance Science (Gary
Achtemeier, Yongqiang Liu, Tom Waldrop, and Joe O’Brien) contributed to this chapter both by
contributing their knowledge and ideas. We would also like to thank three anonymous reviewers for
their helpful comments and recommendations.
Literature Cited Achtemeier, G.L. 1993. Measurements of drainage winds along a small ridge. In:
Proceedings of the 86th
annual meeting of the air and waste management association. 93–FA–
155.06. Pittsburgh, PA: 15p.
Achtemeier G.L. 2001. Simulating nocturnal smoke movement. Fire Management Today. 61: 28–33.
Achtemeier G.L. 2003. On the origins of “superfog”—a combination of smoke and water vapor that
produces zero visibility over roadways. In: Proceedings 2nd
international wildland fire ecology and fire
management congress and 5th
symposium on fire and forest meteorology. J8.9. Boston: American
Meteorological Society: 1—4.
Achtemeier, G.L. 2006. Measurements of moisture in smoldering smoke. International Journal of
Wildland Fire. 15: 517–525.
Achtemeier, G.L. 2008. Effects of moisture released during forest burning on fog formation and
implications for visibility. Journal of Applied Meteorology and Climatology. 47: 1287–1296.
Achtemeier, G.L. 2009. On the formation of superfog in woodland smoke. Meteorological
Applications. 16: 215–225.
Achtemeier, G.L.; Jackson, B.; Brenner, J.D. 2001. Problem and nuisance smoke. In: Hardy, C.;
Ottmar, R.D.; Peterson, J.L. [and others], eds. Smoke management guide for prescribed and wildland
fire. National Wildfire Coordination Group, PMS 420–2 and NFES 1279.
http://www.nwcg.gov/pms/pubs/SMG/SMG-72.pdf. [Date accessed: December 9, 2010].
Achtemeier, G.L.; Jackson, W.; Hawkins, B. [and others]. 1998. The smoke dilemma: a head-on
collision. In: Transactions of the sixty-third North American wildlife and natural resources conference.
Orlando, FL: Wildlife Management Institute: 415–421.
Ackerman, A.S.; Toon, O.B.; Stevens, D.E. [and others]. 2000. Reduction of tropical cloudiness by
soot. Science. 288: 1042–1047.
Bliss, J.C.; Nepal, S.K.; Brooks, R.T.; Larsen, M.D. 1997. In the mainstream: environmental attitudes
of mid-South landowners. Southern Journal of Applied Forestry. 21: 37–43.
Blue Ribbon Panel. 2008. National blue ribbon panel on wildland urban interface fire report.
Washington, DC: International Code Council. 42 p.
http://www.iccsafe.org/gr/WUIC/Documents/BlueRibbonReport-Hi.pdf. [Date accessed: December
8, 2010].
Brenner, J. 1991. Southern oscillation anomalies and their relationship to wildfire activity in Florida.
International Journal of Wildland Fire. 1: 73–78.
Brenner, J.; Wade, D. 2003. Florida’s revised prescribed fire law: protection for responsible burners.
In: Galley, K.E.M.; Klinger, R.C.; Sugihara, N.G., eds. Proceedings of fire conference 2000: the first
national congress on fire ecology, prevention, and management. Misc. Publ. 13. Tallahassee, FL: Tall
Timbers Research Station: 132–136.
Brockway, D.G.; Outcalt, K.W.; Tomczak, D.; Johnson, E.E. 2005. Restoring longleaf pine forest
ecosystems in the Southern U.S. In: Stanturf, J.A.; Madsen, P. Restoration of boreal and temperate
forests. Boca Raton, FL: CRC Press: 501–519. Chapter 32.
Buckley, D.; Berry, J.K.; Spencer, T.; Carlton, D. 2006. Quantifying wildland fire risk in the South. 10 p.
http://www.southernwildfirerisk.com/downloads_reports/Sanborn%20–
%20Quantifying_Wildland_Fire_Risk_in_South.pdf. [Date accessed: January 4, 2011].
Burgan, R.E. 1988. 1988 revisions to the 1978 national fire danger rating system. Res. Pap. SE–273.
Asheville, NC: U.S. Department of Agriculture Forest Service, Southeastern Forest Experiment Station. 39
p.
Butry, D.T.; Mercer, D.E.; Prestemon, J.P.; Pye, J.M. 2001. What is the price of catastrophic fire?
Journal of Forestry. 99: 9–17.
Carlton, C.S. 2004. Personal PM2.5 exposures for firefighters doing prescribed forest burns in the
Southeastern United States, 2004. Athens, GA: University of Georgia. 70 p. M.S. thesis.
Charlson, R.J.; Schwartz, S.E.; Hales, J.M. [and others]. 1992. Climate forcing by anthropogenic
sulfate aerosols. Science. 255: 423–430.
Christopher, S.A.; Gupta, P.; Nair, U. [and others]. 2009. Satellite remote sensing and mesoscale
modeling of the 2007 Georgia/Florida Fires. IEEE Journal of Selected Topics in Applied Earth
Observations and Remote Sensing. 2: 163–175.
Cleaves, D.; Martinez, J.; Haines, T. 2000. Influences on prescribed burning activity and costs in the
National Forest System. Gen. Tech. Rep. SRS–37. Asheville, NC: U.S. Department of Agriculture Forest
Service, Southern Research Station. 34 p.
Cordell, H.K.; Bergstrom, J.C.; Betz, C.J.; Green, G.T. 2004. Socioeconomic forces shaping the future
of the United States. In: Manfredo, M.J.; Vaske, J.J.; Bruyere, B.L. [and others], eds. Society and natural
resources: a summary of knowledge. Jefferson, MO: Modern Litho:349-361.
Dixon, P.G.; Goodrich, G.B.; Cooke, W.H. 2008. Using teleconnections to predict wildfires in
Mississippi. Monthly Weather Review. 136: 2804–2811.
Duryea, M.L.; Hermansen, L.A. 2002. Challenges to forest resource management. In: Macie, E.A.;
Hermansen, L.A., eds. Human influences on forest ecosystems—the Southern Wildland-Urban Interface
Assessment. Gen. Tech. Rep. SRS–55. Asheville, NC: U.S. Department of Agriculture Forest Service,
Southern Research Station: 67-68.
Eagleman, J.R. 1967. Pan evaporation, potential and actual evapotranspiration. Journal of Applied
Meteorology. 6: 482–488.
Fox, D.G.; Riebau, A.R.; Lahm, P. [In press]. A review of wildland fire and air quality management. In:
Qu, J.J.; Riebau, A.; Yang, R.; Sommers, W., eds. Remote sensing and modeling applications to wildland
fires. Dordrecht: Springer Publishing. Chapter 5.
Glitzenstein, J.S.; Streng, D.R.; Wade, D.D. 2003. Fire frequency effects on longleaf pine (Pinus
palustris P. Mill.) vegetation in South Carolina and northeast Florida, USA. Natural Areas Journal. 23: 22–
37.
Goodrick, S.L.; Hanley, D.E. 2009. Florida wildfire activity and atmospheric teleconnections.
International Journal of Wildland Fire. 18: 476–482.
Gramley, M. 2005. Fire in the South: a report by the Southern Group of State Foresters. Winder, GA:
Southern Group of State Foresters. http://216.226.177.78/PDFs/fire_in_the_south.pdf. [Date accessed:
September 12, 2010].
Guldin, J.M. 2010. Fuels management in the subtropical division—mountains. In: Audin, L.J., ed.
Draft cumulative watershed effects of fuels management in the Eastern United States.
http://www.na.fs.fed.us/fire/cwe.shtm. [Date accessed: December 9, 2010].

Haines, T.K.; Busby, R.L. 2001. Prescribed burning in the South: trends, purpose, and barriers.
Southern Journal Applied Forestry. 25: 149–153.
Haines, T.K.; Cleaves, D.A. 1999. The legal environment for forestry prescribed burning in the South:
regulatory programs and voluntary guidelines. Southern Journal Applied Forestry. 23: 170–174.
Hesseln, H. 2000. The economics of prescribed burning: a research review. Forest Science. 46: 332–
334.
Hu, Y.; Odman, M.T.; Chang, M.E. [and others]. 2008. Simulation of air quality impacts from
prescribed fires on an urban area. Environmental Science & Technology. 42: 3676–3682.
Hull, R.B.; Stewart, S.I. 2002. Social consequences of change. In: Macie, E.A.; Hermansen, L.A., eds.
Human influences on forest ecosystems—the Southern Wildland-Urban Interface Assessment. Gen.
Tech. Rep. SRS–55. Asheville, NC: U.S. Department of Agriculture Forest Service, Southern Research
Station: 115–129.
Hurteau, M.D.; Koch, G.W.; Hungate, B.A. 2008. Carbon protection and fire risk reduction: toward a
full accounting of forest carbon offsets. Frontiers in Ecology and the Environment. 6: 493–498.
Intergovernmental Panel on Climate Change. 2007. IPCC fourth assessment report: climate change
2007 (AR4). http://www.ipcc.ch/publications_and_data/publications_and_data_reports.htm. [Date
accessed: July 7, 2010].
Jacobson, S.K.; Monroe, M.C.; Marynowski, S. 2001. Fire at the wildland interface: the influence of
experience and mass media on public knowledge, attitudes, and behavioral intentions. Wildlife Society
Bulletin. 29: 929–937.
Keetch, J.J.; Byram, G.M. 1968. A drought index for forest fire control. Res. Pap. SE–38. Asheville, NC:
U.S. Department of Agriculture Forest Service, Southeastern Forest Experiment Station. 32 p.
Kirkman, L.K.; Coffey, K.L.; Mitchell, R.J.; Moser, E.B. 2004a. Ground cover recovery patterns and life
history traits: implications for restoration obstacles and opportunities in a species-rich savanna. Journal
of Ecology. 92: 409–421.
Kirkman, L.K.; Goebel, P.C.; Palik, B.J.; West, L.T. 2004b. Predicting plant species diversity in a
longleaf pine landscape. Ecoscience. 11: 80–93.
Kopp, R.E.; Mauzerall, D.L. 2010. Assessing the climatic benefits of black carbon mitigation.
Proceedings of the National Academy of Sciences. 107: 11,703–11,708.
Lafon, C.W. 2010. Fire in the American South: vegetation, impacts, history, and climatic relations.
Geography Compass. 4/8: 919–944.
Lavdas, L.; Achtemeier, G.L. 1995. A fog and smoke risk index for estimating roadway visibility
hazard. National Weather Digest. 20: 26–33.
Lee, S.; Baumann, K.; Schauer, J.J. [and others]. 2005. Gaseous and particulate emissions from
prescribed burning in Georgia. Environmental Science and Technology. 39: 9049–9056.
Liu, Y.-Q. 2005a. Atmospheric response and feedback to smoke radiative forcing from wildland fires
in tropical South America. Agricultural Forest Meteorology. 133: 40–53.
Liu, Y.-Q. 2005b. Enhancement of the 1988 Northern U.S. drought due to wildfires. Geophysical
Research Letters. 32: 4 p. [L10806, doi:10.1029/2005GL022411].
Liu, Y.–Q.; Stanturf, J.; Goodrick, S. 2009. Trends in global wildfire potential in a changing climate.
Forest Ecology and Management. 259: 685–697.
Loomis, J.B.; Bair, L.S.; González-Cabán, A. 2001. Prescribed fire and public support: knowledge
gained, attitudes changed in Florida. Journal of Forestry. 99: 18–22.
Macie, E.A.; Hermansen, L.A., eds. 2002. Human influences on forest ecosystems—the Southern
Wildland-Urban Interface Assessment. Gen. Tech. Rep. SRS–55. Asheville, NC: U.S. Department of
Agriculture Forest Service, Southern Research Station. 160 p.
Marshall, D.J.; Wimberly, M.; Bettinger, P.; Stanturf, J. 2008. Synthesis of knowledge of hazardous
fuels management in loblolly pine forests. Gen. Tech. Rep. SRS–110. Asheville, NC: U.S. Department of
Agriculture Forest Service, Southern Research Station. 43 p.
Mercer, D.E.; Prestemon, J.P. 2008. Economic analysis of fuel treatments. In: Audin, L.J., ed. Draft
cumulative watershed effects of fuels management in the Eastern United States.
http://www.na.fs.fed.us/fire/cwe.shtm. [Date accessed: December 9, 2010].
Mercer, D.E.; Prestemon, J.P.; Butry, D.T.; Pye, J.M. 2007. Evaluating alternative prescribed burning
policies to reduce net economic damages from wildfire. American Journal Agricultural Economics. 89:
63–77.
Miller, S.R.; Wade, D. 2003. Re-introducing fire at the urban/wild-land interface: planning for
success. Forestry. 76: 253–260.
Mobley, H.E. 1989. Summary of smoke-related accidents in the South from prescribed fire (1979-
1988). Tech. Release 90–R–11. Rockville, MD: American Pulpwood Association. 11 p.
Monroe, M. 2002. Fire. In: Human influences on forest ecosystems: the southern wildland-urban
interface assessment. Gen. Tech. Rep. SRS-55. Asheville, NC: U.S. Department of Agriculture, Forest
Service, Southern Research Station: 133-150. http://www.interfacesouth.org/swui-assessment/ch8.pdf.
[Date accessed: April 18, 2011].
Naeher, L.P.; Achtemeier, G.L.; Glitzenstein, J.G. [and others]. 2006. Real-time and time-integrated
PM2.5 and CO from prescribed burns in chipped and non-chipped plots: firefighter and community
exposure and health implications. Journal of Exposure Science and Environmental Epidemiology. 16:
351–361.
Naeher, L.P.; Brauer, M.; Lipsett, M. [and others]. 2007. Woodsmoke health effects: a review.
Inhalation Technology. 19: 67–106.
Nakicenovic, N.; Alcamo, J.; Davis, G. [and others]. 2000. Special report on emissions scenarios: a
special report of working group III of the Intergovernmental Panel on Climate Change. Cambridge, UK:
Cambridge University Press. 599 p. http://www.grida.no/climate/ipcc/emission/index.htm. [Date
accessed: December 9, 2010].
National Academy of Sciences. 2010. Advancing the science of climate change. Washington, DC:
National Academies Press. 528 p.
National Coalition of Prescribed Fire Councils. 2007. National coalition of prescribed fire councils
guide to smoke management.
http://www.garxfire.com/pdf%20files/The_National_Coalition_of_Prescribed_Fire_Councils_Guide_to_
Smoke _Management.pdf. [Date accessed: December 9, 2010].
National Interagency Fire Center. 2001. National fire news, wildland fire season 2000 at a glance.
Boise, ID. http://www.nifc.gov/fireinfo/2000/. [Date accessed: December 9, 2010].
National Interagency Fire Center. 2010. Fire information -wildland fire statistics.
http://www.nifc.gov/fire_info/fires_acres.htm. [Date accessed: December 9].
O’Brien, J.J.; Mordecai, K.A.; Wolcott, L. [and others]. 2010. Fire managers field guide: hazardous
fuels management in subtropical pine flatwoods and tropical pine rocklands. Gen. Tech. Rep. SRS–123.
Asheville, NC: U.S. Department of Agriculture Forest Service, Southern Research Station. 55 p.
Outcalt, K.W. 2009. Fuel management in the subtropical and savanna divisions. In: Audin, L.J., ed.
Draft cumulative watershed effects of fuels management in the Eastern United States.
http://www.na.fs.fed.us/fire/cwe.shtm. [Date accessed: December 9, 2010].
Pyne, S.; Andrews, P.L.; Laven, R.D. 1996. Introduction to wildland fire. New York: John Wiley. 769 p.
Reilly, M.J.; O’Brien, J.J.; Waldrop, T.A. 2009. Fuels management in the hot continental division,
Southern Appalachian Mountains. In: Audin, L.J., ed. Draft cumulative watershed effects of fuels
management in the Eastern United States. http://www.na.fs.fed.us/fire/cwe.shtm. [Date accessed:
December 9, 2010].
Riiters, K.H.; Wickham, J.D. 2003. How far to the nearest road? Frontiers in Ecology and
Environment. 1: 125–129.
Rummer, R.; Outcalt, K.; Brockway, D. 2002. Mechanical mid-story reduction treatments for forest
fuel management. In: Proceedings 55 annual weed science society meeting. Champaign, IL: Southern
Weed Science Society: 76.
Running, S. 2006. Is global warming causing more, larger wildfires? Science. 313: 927–928.
Schwilk, D.W.; Keeley, J.E.; Knapp, E.E. [and others]. 2009. The national fire and fire surrogate study:
effects of fuel reduction methods on forest vegetation structure and fuels. Ecological Applications. 19:
285–304.
Sorenson, B.; Fuss, M.; Mulla, Z. [and others]. 1999. Surveillance of morbidity during wildfires—
central Florida 1998. Morbidity and Mortality Weekly Report. 48(4): 78–79.
Southeast Regional Partnership for Planning and Sustainability. 2010. Smoke management
guidelines and prescribed fire tracking. SERPPAS smoke management and air quality subcommittee. 39p.
External review draft, October 13, 2010. On file with: Environmental Protection Agency Region 4, Air,
Pesticides & Toxics Management Division, Sam Nunn Atlanta Federal Center, 61 Forsyth Street SW,
Atlanta GA 30303.
Stanturf, J.A.; Wade, D.D.; Waldrop, T.A. [and others]. 2002. Background paper: fire in southern
landscapes. In: Wear, D.N.; Greis, J.G., eds. Southern Forest Resource Assessment. Gen. Tech. Rep. SRS–
53. Asheville, NC: U.S. Department of Agriculture Forest Service, Southern Research Station: 607–622.
Stanturf, J.A.; Wimberly, M.C. [In press]. Demographic trends in the Eastern US and the wildland
urban interface: implications for fire management. In: Qu, J.J.; Riebau, A.; Yang, R.; Sommers, W., eds.
Remote sensing and modeling applications to wildland fires. Dordrecht: Springer Publishing.
State of Georgia. 2010. Georgia statewide assessment of forest resources 2010. Macon, GA: Georgia
Forestry Commission.
http://www.gfc.state.ga.us/ForestManagement/documents/GAStateAssessment-6-17-10.pdf. [Date
accessed: May 11, 2011].

Sun, C. 2006. State statutory reforms and retention of prescribed fire liability laws on U.S. forest
land. Forest Policy and Economics. 9: 392–402.
Tian, D.; Wang, Y.; Bergin, M. [and others]. 2008. Air quality impacts from prescribed forest fires
under different management practices. Environmental Science and Technology. 42: 2767–2772.
Urbanski, S.P.; Hao, W.M.; Baker, S. 2009. Chemical composition of wildland fire emissions. In:
Bytnerowicz, A.; Arbaugh, M.; Riebau, A.; Andersen, C., eds. Wildland fires and air pollution.
Developments in environmental science. Elsevier. 8: 79—107. Chapter 4.
U.S. Department of Agriculture Forest Service. 2011. Planning for the future of southern forests. R8–
PR–61. Atlanta: U.S. Department of Agriculture Forest Service, Southern Region. 33 p.
Wade, D.; Mobley, H. 2007. Managing smoke at the wildland-urban interface. Gen. Tech. Rep. SRS–
103. Asheville, NC: U.S. Department of Agriculture Forest Service, Southern Research Station. 28 p.
Wade, D.D.; Brenner, J.D. 1995. Florida's solution to liability issues. In: Weise, D.R.; Martin, R.E.,
tech. coords. The Biswell symposium: fire issues and solutions in urban interface and wildland
ecosystems. Gen. Tech. Rep. PSW–GTR–158. Albany, CA: U.S. Department of Agriculture Forest Service,
Pacific Southwest Research Station: 131–138.
Wade, D.D.; Brock, B.L.; Brose, P.H. [and others]. 2000. Fire in eastern ecosystems. In: Brown, J.K.;
Smith, J.K., eds. Wildland fire in ecosystems: effects of fire on flora. Gen. Tech. Rep. RMRS–42. Ogden,
UT: U.S. Department of Agriculture Forest Service,, Rocky Mountain Research Station: 53–96.
Wade, D.D.; Lunsford, J.D. 1989. A guide for prescribed fire in the Southern United States. Tech.
Publ. R8–TP–11. Atlanta: U.S. Department of Agriculture Forest Service, Southern Region. 56 p.
Wear, D.N. 2002. Land use. In: Wear, D.N.; Greis, J.G., eds. Southern Forest Resource Assessment.
Gen. Tech. Rep. SRS–53. Asheville, NC: U.S. Department of Agriculture Forest Service, Southern Research
Station: 153–173.
Westerling, A.L.; Swetnam, T. 2003. Interannual to decadal drought and wildfire in the Western
United States. Eos. 84(49): 545, 554–555.
Wiedinmyer, C.; Hurteau, M.D. 2010. Prescribed fire as a means of reducing forest carbon emissions
in the Western United States. Environmental Science and Technology. 44: 1926–1932.
Wiedinmyer, C.; Neff, J.C. 2007. Estimates of CO2 from fires in the United States: implications for
carbon management. CARBON Balance and Management. 2: 10.
http://www.cbmjournal.com/content/2/1/10. [Date accessed: May 11, 2011].
Williams, J.W.; Jackson, S.T. 2007. Novel climates, no-analog communities, and ecological surprises.
Frontiers in Ecology and the Environment. 5: 475–482.
Wolcott, L.; O’Brien, J.J.; Mordecai, K. 2007. A survey of land managers on wildland hazardous fuels
issues in Florida: a technical note. Southern Journal Applied Forestry. 31: 148–150.
Yanosky J.D. 2001. Fine particle exposure of prescribed fire workers in the Southeastern United
States and a comparison of several particulate matter sampling methods, 2001. Athens, GA: University
of Georgia. 120 p. M.S. thesis.
Yin, Z. 1993. Fire regime of the Okefenokee Swamp and its relation to hydrological and climatic
conditions. International Journal of Wildland Fire. 3: 229.
Zipperer, W.C. 2002. Urban influences on forests. In: Macie, E.A.; Hermansen, L.A., eds. 2002.
Human influences on forest ecosystems—the Southern Wildland-Urban Interface Assessment. Gen.
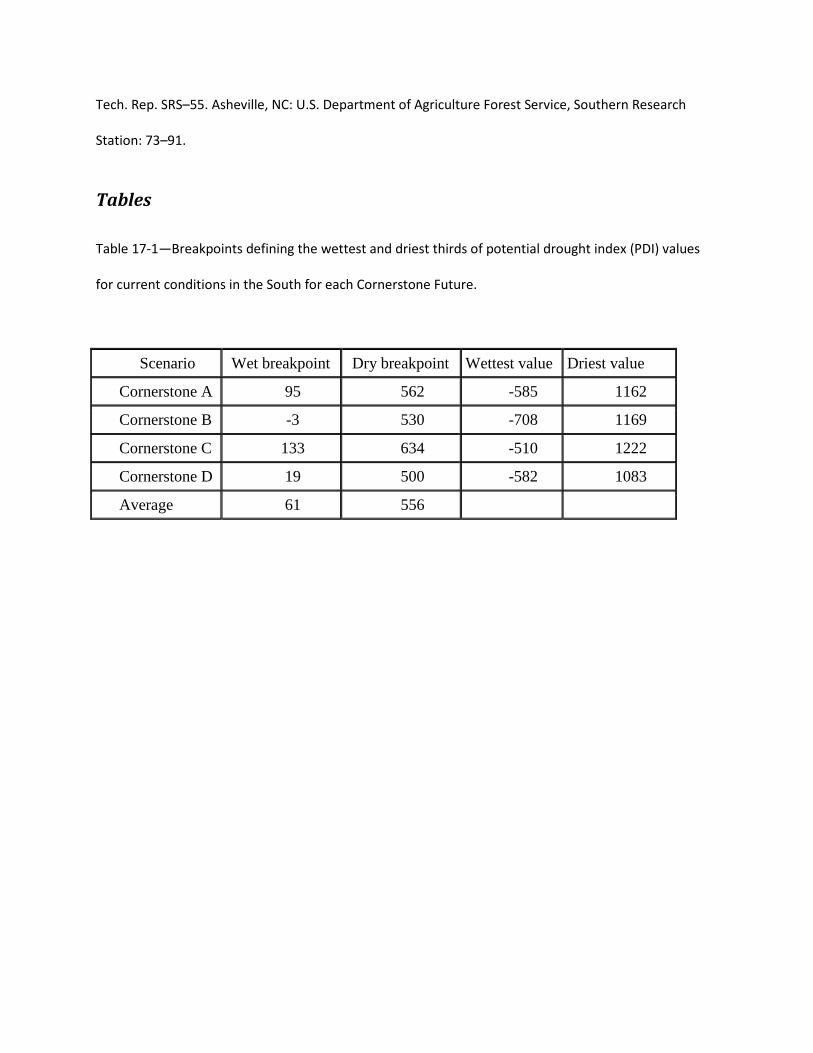
Tech. Rep. SRS–55. Asheville, NC: U.S. Department of Agriculture Forest Service, Southern Research
Station: 73–91.
Tables
Table 17-1—Breakpoints defining the wettest and driest thirds of potential drought index (PDI) values
for current conditions in the South for each Cornerstone Future.
Scenario Wet breakpoint Dry breakpoint Wettest value Driest value
Cornerstone A 95 562 -585 1162
Cornerstone B -3 530 -708 1169
Cornerstone C 133 634 -510 1222
Cornerstone D 19 500 -582 1083
Average 61 556
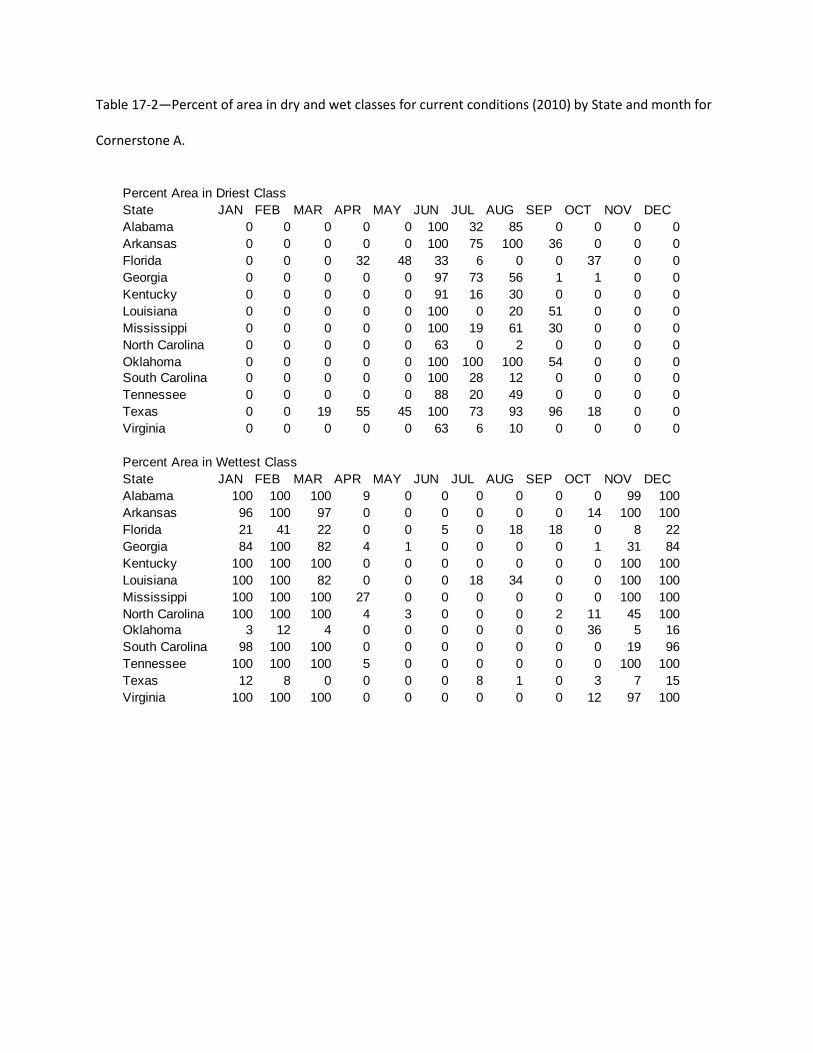
Table 17-2—Percent of area in dry and wet classes for current conditions (2010) by State and month for
Cornerstone A.
Percent Area in Driest ClassState JAN FEB MAR APR MAY JUN JUL AUG SEP OCT NOV DECAlabama 0 0 0 0 0 100 32 85 0 0 0 0Arkansas 0 0 0 0 0 100 75 100 36 0 0 0Florida 0 0 0 32 48 33 6 0 0 37 0 0Georgia 0 0 0 0 0 97 73 56 1 1 0 0Kentucky 0 0 0 0 0 91 16 30 0 0 0 0Louisiana 0 0 0 0 0 100 0 20 51 0 0 0Mississippi 0 0 0 0 0 100 19 61 30 0 0 0North Carolina 0 0 0 0 0 63 0 2 0 0 0 0Oklahoma 0 0 0 0 0 100 100 100 54 0 0 0South Carolina 0 0 0 0 0 100 28 12 0 0 0 0Tennessee 0 0 0 0 0 88 20 49 0 0 0 0Texas 0 0 19 55 45 100 73 93 96 18 0 0Virginia 0 0 0 0 0 63 6 10 0 0 0 0
Percent Area in Wettest ClassState JAN FEB MAR APR MAY JUN JUL AUG SEP OCT NOV DECAlabama 100 100 100 9 0 0 0 0 0 0 99 100Arkansas 96 100 97 0 0 0 0 0 0 14 100 100Florida 21 41 22 0 0 5 0 18 18 0 8 22Georgia 84 100 82 4 1 0 0 0 0 1 31 84Kentucky 100 100 100 0 0 0 0 0 0 0 100 100Louisiana 100 100 82 0 0 0 18 34 0 0 100 100Mississippi 100 100 100 27 0 0 0 0 0 0 100 100North Carolina 100 100 100 4 3 0 0 0 2 11 45 100Oklahoma 3 12 4 0 0 0 0 0 0 36 5 16South Carolina 98 100 100 0 0 0 0 0 0 0 19 96Tennessee 100 100 100 5 0 0 0 0 0 0 100 100Texas 12 8 0 0 0 0 8 1 0 3 7 15Virginia 100 100 100 0 0 0 0 0 0 12 97 100
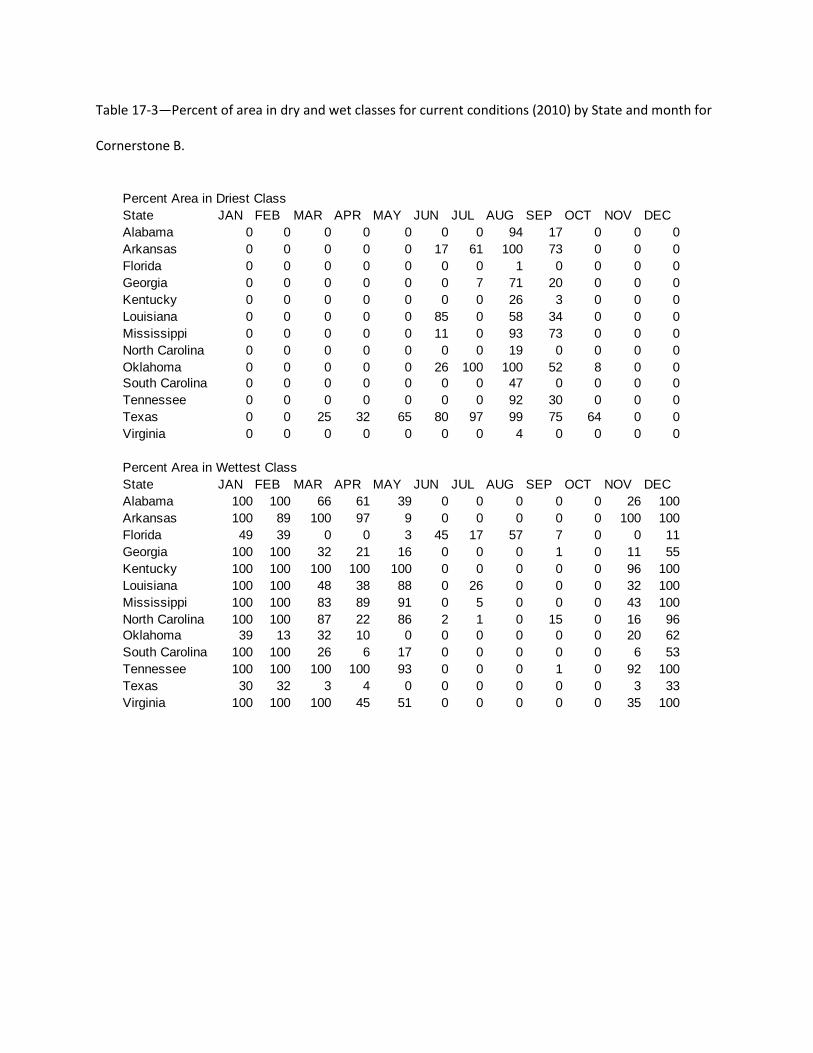
Table 17-3—Percent of area in dry and wet classes for current conditions (2010) by State and month for
Cornerstone B.
Percent Area in Driest ClassState JAN FEB MAR APR MAY JUN JUL AUG SEP OCT NOV DECAlabama 0 0 0 0 0 0 0 94 17 0 0 0Arkansas 0 0 0 0 0 17 61 100 73 0 0 0Florida 0 0 0 0 0 0 0 1 0 0 0 0Georgia 0 0 0 0 0 0 7 71 20 0 0 0Kentucky 0 0 0 0 0 0 0 26 3 0 0 0Louisiana 0 0 0 0 0 85 0 58 34 0 0 0Mississippi 0 0 0 0 0 11 0 93 73 0 0 0North Carolina 0 0 0 0 0 0 0 19 0 0 0 0Oklahoma 0 0 0 0 0 26 100 100 52 8 0 0South Carolina 0 0 0 0 0 0 0 47 0 0 0 0Tennessee 0 0 0 0 0 0 0 92 30 0 0 0Texas 0 0 25 32 65 80 97 99 75 64 0 0Virginia 0 0 0 0 0 0 0 4 0 0 0 0
Percent Area in Wettest ClassState JAN FEB MAR APR MAY JUN JUL AUG SEP OCT NOV DECAlabama 100 100 66 61 39 0 0 0 0 0 26 100Arkansas 100 89 100 97 9 0 0 0 0 0 100 100Florida 49 39 0 0 3 45 17 57 7 0 0 11Georgia 100 100 32 21 16 0 0 0 1 0 11 55Kentucky 100 100 100 100 100 0 0 0 0 0 96 100Louisiana 100 100 48 38 88 0 26 0 0 0 32 100Mississippi 100 100 83 89 91 0 5 0 0 0 43 100North Carolina 100 100 87 22 86 2 1 0 15 0 16 96Oklahoma 39 13 32 10 0 0 0 0 0 0 20 62South Carolina 100 100 26 6 17 0 0 0 0 0 6 53Tennessee 100 100 100 100 93 0 0 0 1 0 92 100Texas 30 32 3 4 0 0 0 0 0 0 3 33Virginia 100 100 100 45 51 0 0 0 0 0 35 100
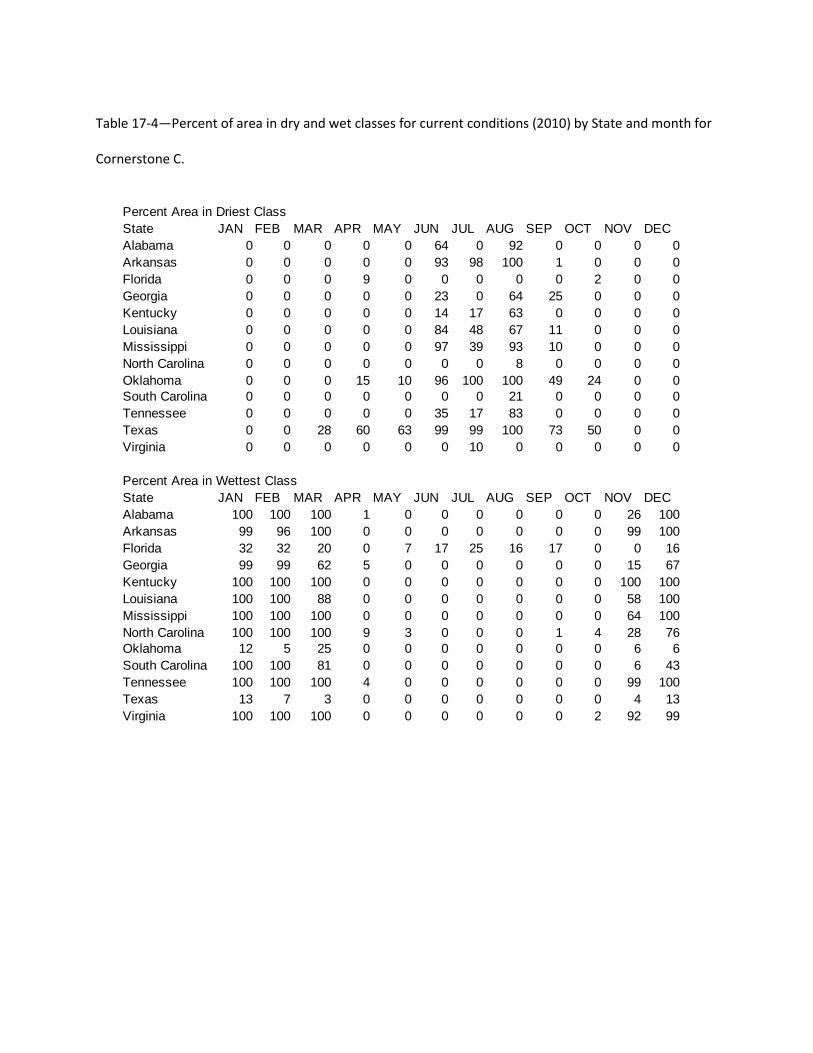
Table 17-4—Percent of area in dry and wet classes for current conditions (2010) by State and month for
Cornerstone C.
Percent Area in Driest ClassState JAN FEB MAR APR MAY JUN JUL AUG SEP OCT NOV DECAlabama 0 0 0 0 0 64 0 92 0 0 0 0Arkansas 0 0 0 0 0 93 98 100 1 0 0 0Florida 0 0 0 9 0 0 0 0 0 2 0 0Georgia 0 0 0 0 0 23 0 64 25 0 0 0Kentucky 0 0 0 0 0 14 17 63 0 0 0 0Louisiana 0 0 0 0 0 84 48 67 11 0 0 0Mississippi 0 0 0 0 0 97 39 93 10 0 0 0North Carolina 0 0 0 0 0 0 0 8 0 0 0 0Oklahoma 0 0 0 15 10 96 100 100 49 24 0 0South Carolina 0 0 0 0 0 0 0 21 0 0 0 0Tennessee 0 0 0 0 0 35 17 83 0 0 0 0Texas 0 0 28 60 63 99 99 100 73 50 0 0Virginia 0 0 0 0 0 0 10 0 0 0 0 0
Percent Area in Wettest ClassState JAN FEB MAR APR MAY JUN JUL AUG SEP OCT NOV DECAlabama 100 100 100 1 0 0 0 0 0 0 26 100Arkansas 99 96 100 0 0 0 0 0 0 0 99 100Florida 32 32 20 0 7 17 25 16 17 0 0 16Georgia 99 99 62 5 0 0 0 0 0 0 15 67Kentucky 100 100 100 0 0 0 0 0 0 0 100 100Louisiana 100 100 88 0 0 0 0 0 0 0 58 100Mississippi 100 100 100 0 0 0 0 0 0 0 64 100North Carolina 100 100 100 9 3 0 0 0 1 4 28 76Oklahoma 12 5 25 0 0 0 0 0 0 0 6 6South Carolina 100 100 81 0 0 0 0 0 0 0 6 43Tennessee 100 100 100 4 0 0 0 0 0 0 99 100Texas 13 7 3 0 0 0 0 0 0 0 4 13Virginia 100 100 100 0 0 0 0 0 0 2 92 99

Table 17-5—Percent of area in dry and wet classes for current conditions (2010) by State and month for
Cornerstone D.
Percent Area in Driest ClassState JAN FEB MAR APR MAY JUN JUL AUG SEP OCT NOV DECAlabama 0 0 0 0 0 96 0 79 7 0 0 0Arkansas 0 0 0 0 0 71 70 70 87 0 0 0Florida 0 0 0 0 1 8 0 0 0 24 0 0Georgia 0 0 0 0 5 72 0 47 19 0 0 0Kentucky 0 0 0 0 0 7 7 45 17 0 0 0Louisiana 0 0 0 0 0 83 7 36 44 0 0 0Mississippi 0 0 0 0 0 100 2 68 53 0 0 0North Carolina 0 0 0 0 0 0 0 2 0 0 0 0Oklahoma 0 0 0 0 0 76 100 94 71 26 0 0South Carolina 0 0 0 0 0 6 0 15 0 0 0 0Tennessee 0 0 0 0 0 39 8 72 16 0 0 0Texas 0 0 7 40 35 96 97 99 77 64 1 0Virginia 0 0 0 0 0 0 0 7 0 0 0 0
Percent Area in Wettest ClassState JAN FEB MAR APR MAY JUN JUL AUG SEP OCT NOV DECAlabama 100 100 95 0 0 0 0 0 0 0 56 100Arkansas 99 97 100 2 0 0 0 0 0 0 100 100Florida 32 35 5 0 4 22 15 15 35 0 0 22Georgia 100 100 36 1 0 0 0 0 0 0 21 74Kentucky 100 100 100 0 0 0 0 0 0 0 100 100Louisiana 100 100 100 0 0 0 0 0 0 0 82 100Mississippi 100 100 100 0 0 0 0 0 0 0 93 100North Carolina 100 100 97 5 3 0 11 0 0 0 21 100Oklahoma 6 5 16 0 0 0 0 0 0 0 29 32South Carolina 100 100 32 0 0 0 0 0 0 0 6 82Tennessee 100 100 100 2 0 0 0 0 0 0 100 100Texas 16 9 12 0 0 0 0 0 0 0 18 20Virginia 100 100 98 0 0 0 0 0 0 2 42 100
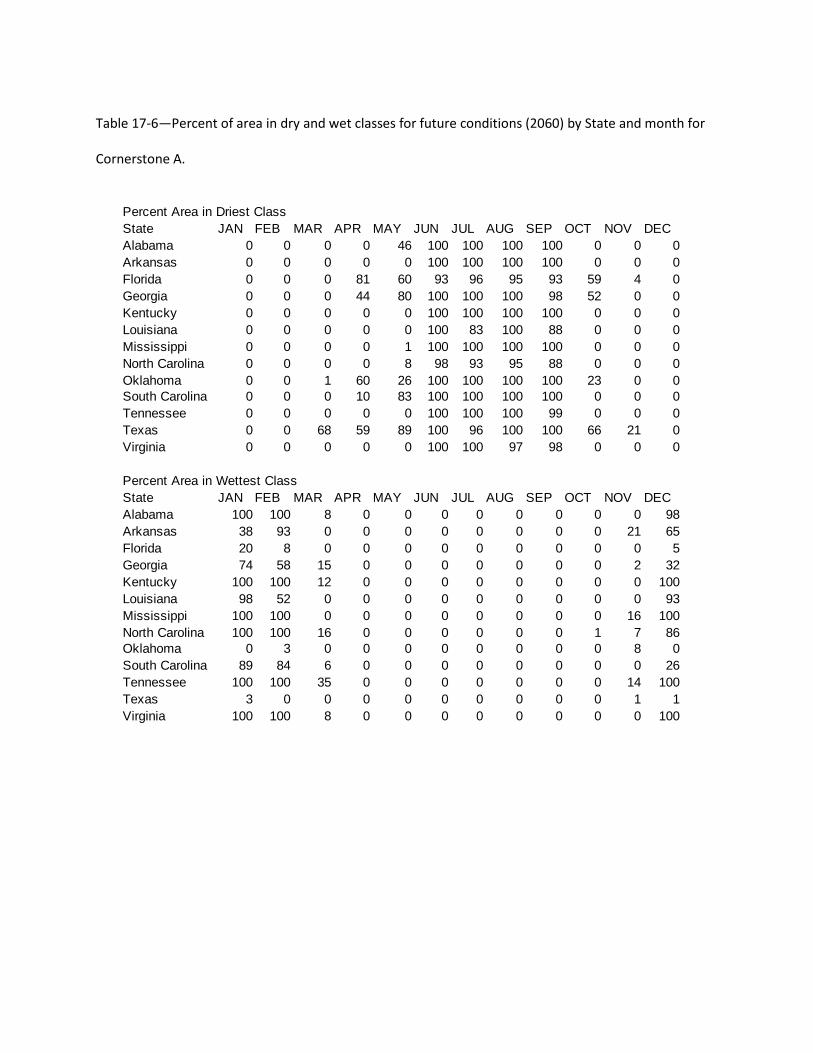
Table 17-6—Percent of area in dry and wet classes for future conditions (2060) by State and month for
Cornerstone A.
Percent Area in Driest ClassState JAN FEB MAR APR MAY JUN JUL AUG SEP OCT NOV DECAlabama 0 0 0 0 46 100 100 100 100 0 0 0Arkansas 0 0 0 0 0 100 100 100 100 0 0 0Florida 0 0 0 81 60 93 96 95 93 59 4 0Georgia 0 0 0 44 80 100 100 100 98 52 0 0Kentucky 0 0 0 0 0 100 100 100 100 0 0 0Louisiana 0 0 0 0 0 100 83 100 88 0 0 0Mississippi 0 0 0 0 1 100 100 100 100 0 0 0North Carolina 0 0 0 0 8 98 93 95 88 0 0 0Oklahoma 0 0 1 60 26 100 100 100 100 23 0 0South Carolina 0 0 0 10 83 100 100 100 100 0 0 0Tennessee 0 0 0 0 0 100 100 100 99 0 0 0Texas 0 0 68 59 89 100 96 100 100 66 21 0Virginia 0 0 0 0 0 100 100 97 98 0 0 0
Percent Area in Wettest ClassState JAN FEB MAR APR MAY JUN JUL AUG SEP OCT NOV DECAlabama 100 100 8 0 0 0 0 0 0 0 0 98Arkansas 38 93 0 0 0 0 0 0 0 0 21 65Florida 20 8 0 0 0 0 0 0 0 0 0 5Georgia 74 58 15 0 0 0 0 0 0 0 2 32Kentucky 100 100 12 0 0 0 0 0 0 0 0 100Louisiana 98 52 0 0 0 0 0 0 0 0 0 93Mississippi 100 100 0 0 0 0 0 0 0 0 16 100North Carolina 100 100 16 0 0 0 0 0 0 1 7 86Oklahoma 0 3 0 0 0 0 0 0 0 0 8 0South Carolina 89 84 6 0 0 0 0 0 0 0 0 26Tennessee 100 100 35 0 0 0 0 0 0 0 14 100Texas 3 0 0 0 0 0 0 0 0 0 1 1Virginia 100 100 8 0 0 0 0 0 0 0 0 100
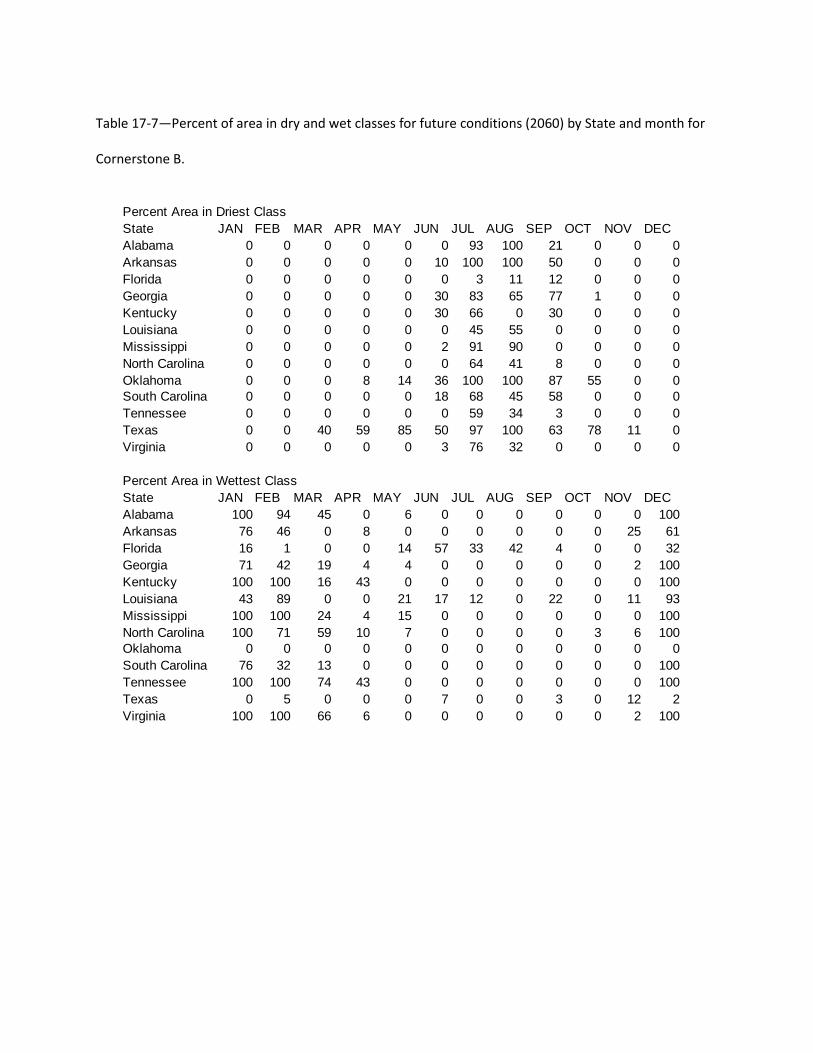
Table 17-7—Percent of area in dry and wet classes for future conditions (2060) by State and month for
Cornerstone B.
Percent Area in Driest ClassState JAN FEB MAR APR MAY JUN JUL AUG SEP OCT NOV DECAlabama 0 0 0 0 0 0 93 100 21 0 0 0Arkansas 0 0 0 0 0 10 100 100 50 0 0 0Florida 0 0 0 0 0 0 3 11 12 0 0 0Georgia 0 0 0 0 0 30 83 65 77 1 0 0Kentucky 0 0 0 0 0 30 66 0 30 0 0 0Louisiana 0 0 0 0 0 0 45 55 0 0 0 0Mississippi 0 0 0 0 0 2 91 90 0 0 0 0North Carolina 0 0 0 0 0 0 64 41 8 0 0 0Oklahoma 0 0 0 8 14 36 100 100 87 55 0 0South Carolina 0 0 0 0 0 18 68 45 58 0 0 0Tennessee 0 0 0 0 0 0 59 34 3 0 0 0Texas 0 0 40 59 85 50 97 100 63 78 11 0Virginia 0 0 0 0 0 3 76 32 0 0 0 0
Percent Area in Wettest ClassState JAN FEB MAR APR MAY JUN JUL AUG SEP OCT NOV DECAlabama 100 94 45 0 6 0 0 0 0 0 0 100Arkansas 76 46 0 8 0 0 0 0 0 0 25 61Florida 16 1 0 0 14 57 33 42 4 0 0 32Georgia 71 42 19 4 4 0 0 0 0 0 2 100Kentucky 100 100 16 43 0 0 0 0 0 0 0 100Louisiana 43 89 0 0 21 17 12 0 22 0 11 93Mississippi 100 100 24 4 15 0 0 0 0 0 0 100North Carolina 100 71 59 10 7 0 0 0 0 3 6 100Oklahoma 0 0 0 0 0 0 0 0 0 0 0 0South Carolina 76 32 13 0 0 0 0 0 0 0 0 100Tennessee 100 100 74 43 0 0 0 0 0 0 0 100Texas 0 5 0 0 0 7 0 0 3 0 12 2Virginia 100 100 66 6 0 0 0 0 0 0 2 100
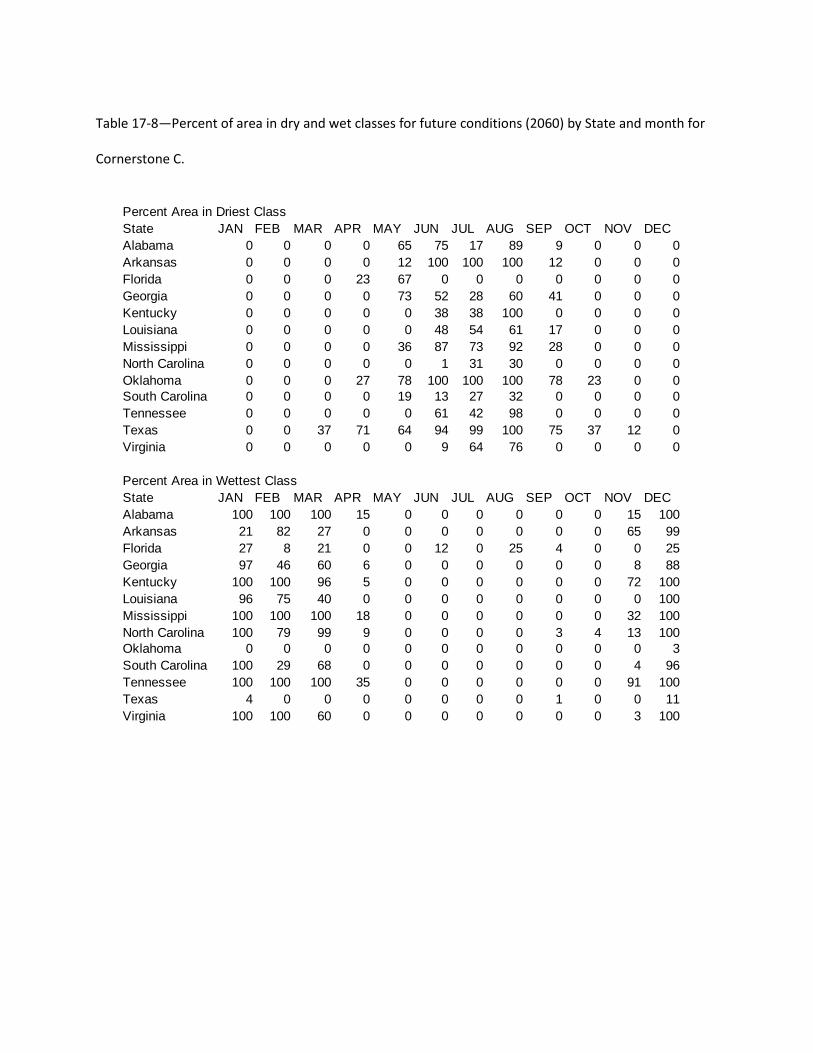
Table 17-8—Percent of area in dry and wet classes for future conditions (2060) by State and month for
Cornerstone C.
Percent Area in Driest ClassState JAN FEB MAR APR MAY JUN JUL AUG SEP OCT NOV DECAlabama 0 0 0 0 65 75 17 89 9 0 0 0Arkansas 0 0 0 0 12 100 100 100 12 0 0 0Florida 0 0 0 23 67 0 0 0 0 0 0 0Georgia 0 0 0 0 73 52 28 60 41 0 0 0Kentucky 0 0 0 0 0 38 38 100 0 0 0 0Louisiana 0 0 0 0 0 48 54 61 17 0 0 0Mississippi 0 0 0 0 36 87 73 92 28 0 0 0North Carolina 0 0 0 0 0 1 31 30 0 0 0 0Oklahoma 0 0 0 27 78 100 100 100 78 23 0 0South Carolina 0 0 0 0 19 13 27 32 0 0 0 0Tennessee 0 0 0 0 0 61 42 98 0 0 0 0Texas 0 0 37 71 64 94 99 100 75 37 12 0Virginia 0 0 0 0 0 9 64 76 0 0 0 0
Percent Area in Wettest ClassState JAN FEB MAR APR MAY JUN JUL AUG SEP OCT NOV DECAlabama 100 100 100 15 0 0 0 0 0 0 15 100Arkansas 21 82 27 0 0 0 0 0 0 0 65 99Florida 27 8 21 0 0 12 0 25 4 0 0 25Georgia 97 46 60 6 0 0 0 0 0 0 8 88Kentucky 100 100 96 5 0 0 0 0 0 0 72 100Louisiana 96 75 40 0 0 0 0 0 0 0 0 100Mississippi 100 100 100 18 0 0 0 0 0 0 32 100North Carolina 100 79 99 9 0 0 0 0 3 4 13 100Oklahoma 0 0 0 0 0 0 0 0 0 0 0 3South Carolina 100 29 68 0 0 0 0 0 0 0 4 96Tennessee 100 100 100 35 0 0 0 0 0 0 91 100Texas 4 0 0 0 0 0 0 0 1 0 0 11Virginia 100 100 60 0 0 0 0 0 0 0 3 100

Table 17-9—Percent of area in dry and wet classes for future conditions (2060) by State and month for
Cornerstone D.
Percent Area in Driest ClassState JAN FEB MAR APR MAY JUN JUL AUG SEP OCT NOV DECAlabama 0 0 0 0 0 91 83 94 3 0 0 0Arkansas 0 0 0 0 0 100 100 100 100 0 0 0Florida 0 0 0 0 0 0 0 0 0 0 0 0Georgia 0 0 0 0 6 63 56 61 2 0 0 0Kentucky 0 0 0 0 0 85 82 100 34 0 0 0Louisiana 0 0 0 0 0 91 78 88 54 0 0 0Mississippi 0 0 0 0 0 99 94 96 73 0 0 0North Carolina 0 0 0 0 0 53 15 14 0 0 0 0Oklahoma 0 0 0 36 11 100 100 100 100 44 0 0South Carolina 0 0 0 0 0 37 33 29 0 0 0 0Tennessee 0 0 0 0 0 83 81 98 42 0 0 0Texas 0 0 25 75 55 97 100 100 98 76 17 0Virginia 0 0 0 0 0 77 44 47 0 0 0 0
Percent Area in Wettest ClassState JAN FEB MAR APR MAY JUN JUL AUG SEP OCT NOV DECAlabama 100 100 100 0 0 0 0 0 0 0 22 100Arkansas 51 74 99 0 0 0 0 0 0 0 82 100Florida 23 39 25 0 4 20 1 39 6 0 0 22Georgia 91 100 89 1 1 0 0 0 0 0 11 74Kentucky 100 100 100 38 0 0 0 0 0 0 50 100Louisiana 100 100 85 0 0 0 0 0 0 0 49 100Mississippi 100 100 100 0 0 0 0 0 0 0 58 100North Carolina 100 100 100 8 3 0 0 0 0 1 13 100Oklahoma 0 3 8 0 0 0 0 0 0 0 8 6South Carolina 100 100 100 0 0 0 0 0 0 0 6 57Tennessee 100 100 100 2 0 0 0 0 0 0 91 100Texas 3 8 3 0 0 0 0 0 0 0 3 9Virginia 100 100 100 2 0 0 0 0 0 0 2 100
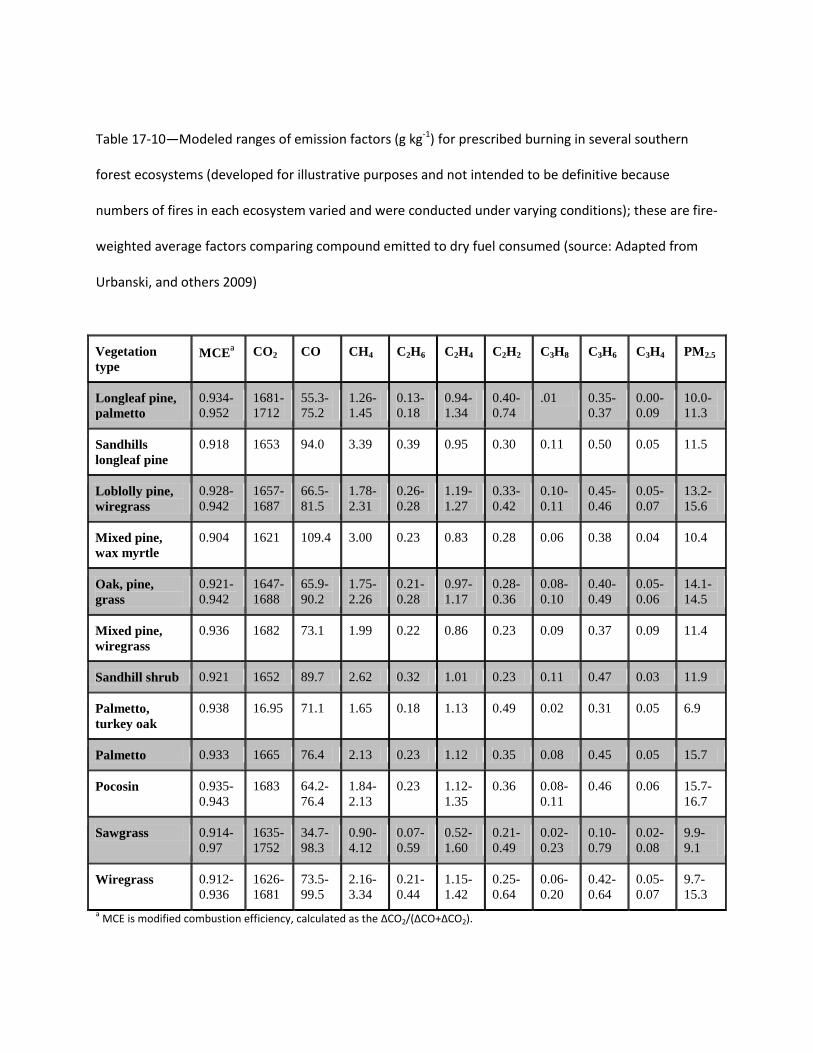
Table 17-10—Modeled ranges of emission factors (g kg-1) for prescribed burning in several southern
forest ecosystems (developed for illustrative purposes and not intended to be definitive because
numbers of fires in each ecosystem varied and were conducted under varying conditions); these are fire-
weighted average factors comparing compound emitted to dry fuel consumed (source: Adapted from
Urbanski, and others 2009)
a MCE is modified combustion efficiency, calculated as the ΔCO2/(ΔCO+ΔCO2).
Vegetation type
MCEa CO2 CO CH4 C2H6 C2H4 C2H2 C3H8 C3H6 C3H4 PM2.5
Longleaf pine, palmetto
0.934-0.952
1681-1712
55.3-75.2
1.26-1.45
0.13-0.18
0.94-1.34
0.40-0.74
.01 0.35-0.37
0.00-0.09
10.0-11.3
Sandhills longleaf pine
0.918 1653 94.0 3.39 0.39 0.95 0.30 0.11 0.50 0.05 11.5
Loblolly pine, wiregrass
0.928-0.942
1657-1687
66.5-81.5
1.78-2.31
0.26-0.28
1.19-1.27
0.33-0.42
0.10-0.11
0.45-0.46
0.05-0.07
13.2-15.6
Mixed pine, wax myrtle
0.904 1621 109.4 3.00 0.23 0.83 0.28 0.06 0.38 0.04 10.4
Oak, pine, grass
0.921-0.942
1647-1688
65.9-90.2
1.75-2.26
0.21-0.28
0.97-1.17
0.28-0.36
0.08-0.10
0.40-0.49
0.05-0.06
14.1-14.5
Mixed pine, wiregrass
0.936 1682 73.1 1.99 0.22 0.86 0.23 0.09 0.37 0.09 11.4
Sandhill shrub 0.921 1652 89.7 2.62 0.32 1.01 0.23 0.11 0.47 0.03 11.9
Palmetto, turkey oak
0.938 16.95 71.1 1.65 0.18 1.13 0.49 0.02 0.31 0.05 6.9
Palmetto 0.933 1665 76.4 2.13 0.23 1.12 0.35 0.08 0.45 0.05 15.7
Pocosin 0.935-0.943
1683 64.2-76.4
1.84-2.13
0.23 1.12-1.35
0.36 0.08-0.11
0.46 0.06 15.7-16.7
Sawgrass 0.914-0.97
1635-1752
34.7-98.3
0.90-4.12
0.07-0.59
0.52-1.60
0.21-0.49
0.02-0.23
0.10-0.79
0.02-0.08
9.9-9.1
Wiregrass 0.912-0.936
1626-1681
73.5-99.5
2.16-3.34
0.21-0.44
1.15-1.42
0.25-0.64
0.06-0.20
0.42-0.64
0.05-0.07
9.7-15.3
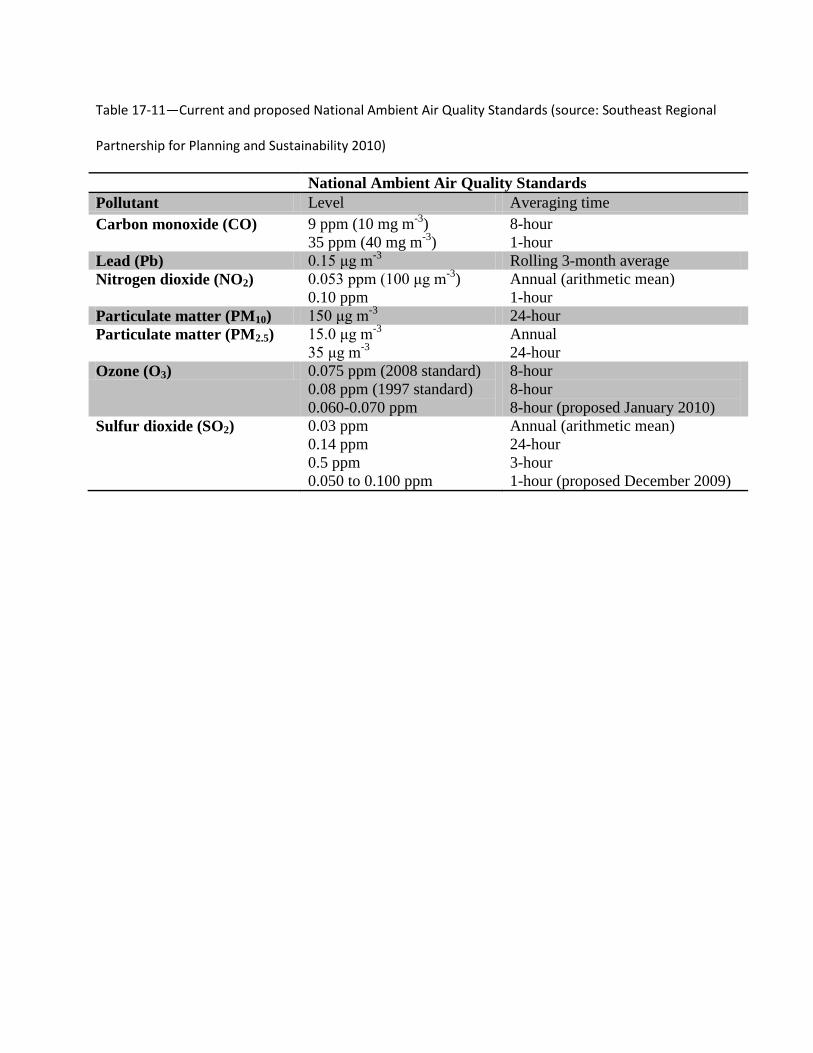
Table 17-11—Current and proposed National Ambient Air Quality Standards (source: Southeast Regional
Partnership for Planning and Sustainability 2010)
National Ambient Air Quality Standards Pollutant Level Averaging time Carbon monoxide (CO) 9 ppm (10 mg m-3)
35 ppm (40 mg m-3) 8-hour 1-hour
Lead (Pb) 0.15 μg m-3 Rolling 3-month average Nitrogen dioxide (NO2) 0.053 ppm (100 μg m-3)
0.10 ppm Annual (arithmetic mean) 1-hour
Particulate matter (PM10) 150 μg m-3 24-hour Particulate matter (PM2.5) 15.0 μg m-3
35 μg m-3 Annual 24-hour
Ozone (O3) 0.075 ppm (2008 standard) 0.08 ppm (1997 standard) 0.060-0.070 ppm
8-hour 8-hour 8-hour (proposed January 2010)
Sulfur dioxide (SO2) 0.03 ppm 0.14 ppm 0.5 ppm 0.050 to 0.100 ppm
Annual (arithmetic mean) 24-hour 3-hour 1-hour (proposed December 2009)

Table 17-12—Advantages, disadvantages, and costs of fuel treatment options being used in the South
(source: Outcalt 2009)
Attributes Treatment
Prescribed burn Mechanical Manual Harvesting
Pros Low cost
Ecological benefits
Minimal soil disturbance
Facilitates burning
Use in urban areas
Selective
Use in urban areas
Selective
Produces revenue
Cons Smoke
Potential escapes
Resource damage
Can be costly
Fuel created
Equipment breakage
Potential site damage
Can be costly
Fuel created
Fuel created
Potential site damage
Cost (dollars per acre)
23 to 121a 120 to 350b
35 to 1000c
a Cleaves and others 2000 b Rummer and others 2002 c Wolcott and others 2007
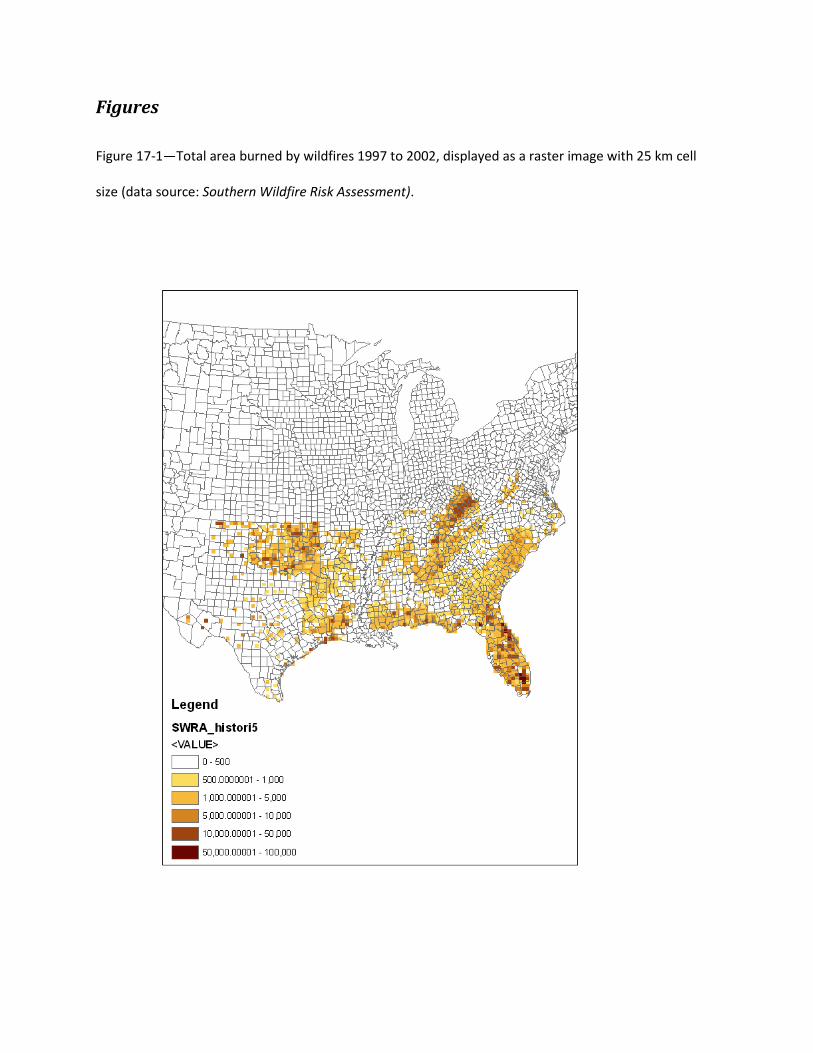
Figures Figure 17-1—Total area burned by wildfires 1997 to 2002, displayed as a raster image with 25 km cell
size (data source: Southern Wildfire Risk Assessment).
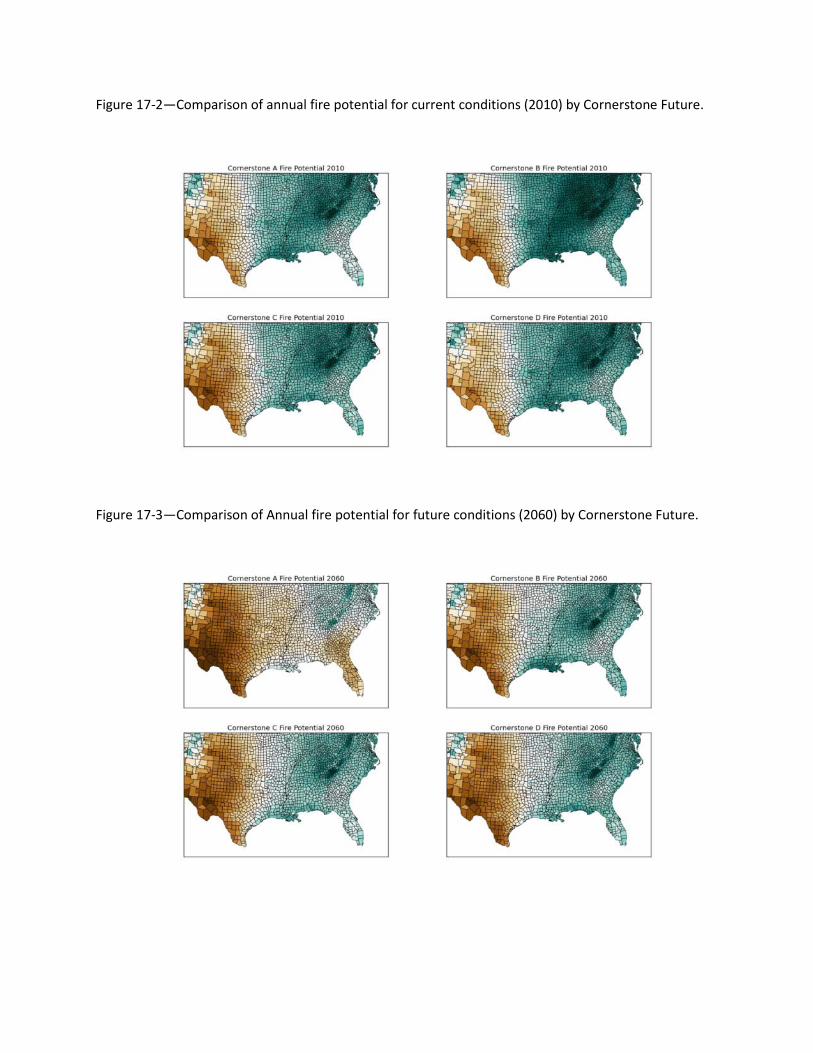
Figure 17-2—Comparison of annual fire potential for current conditions (2010) by Cornerstone Future.
Figure 17-3—Comparison of Annual fire potential for future conditions (2060) by Cornerstone Future.
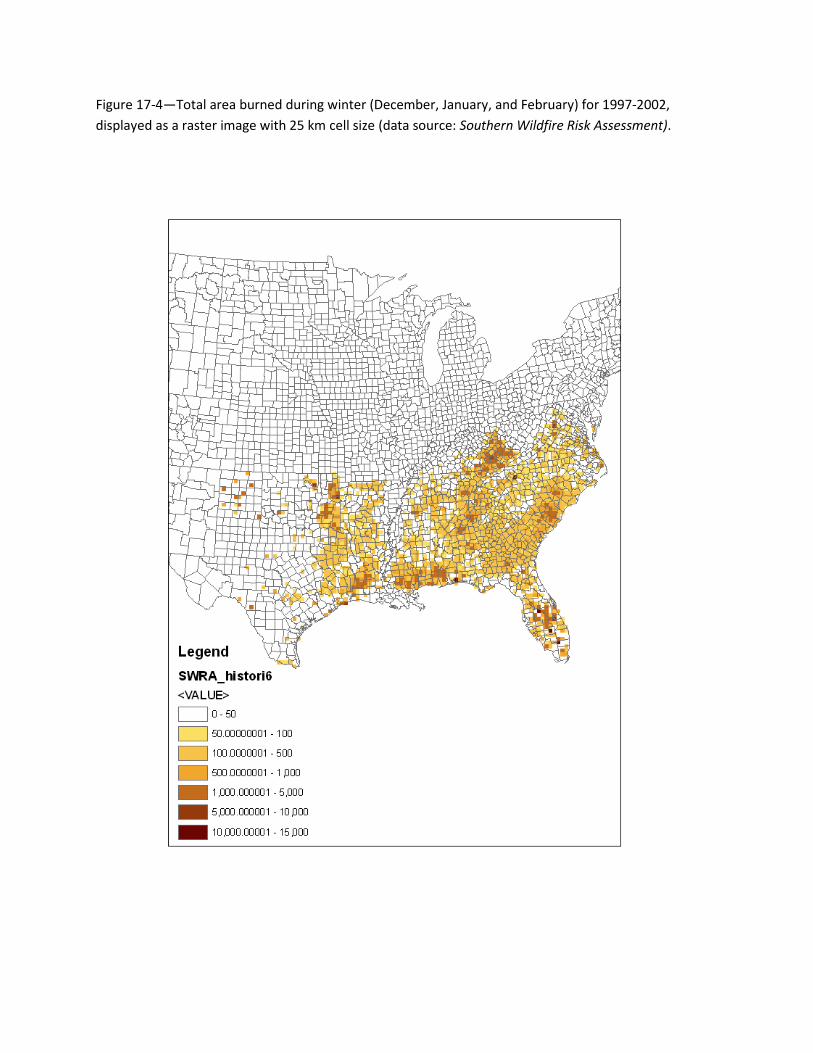
Figure 17-4—Total area burned during winter (December, January, and February) for 1997-2002, displayed as a raster image with 25 km cell size (data source: Southern Wildfire Risk Assessment).
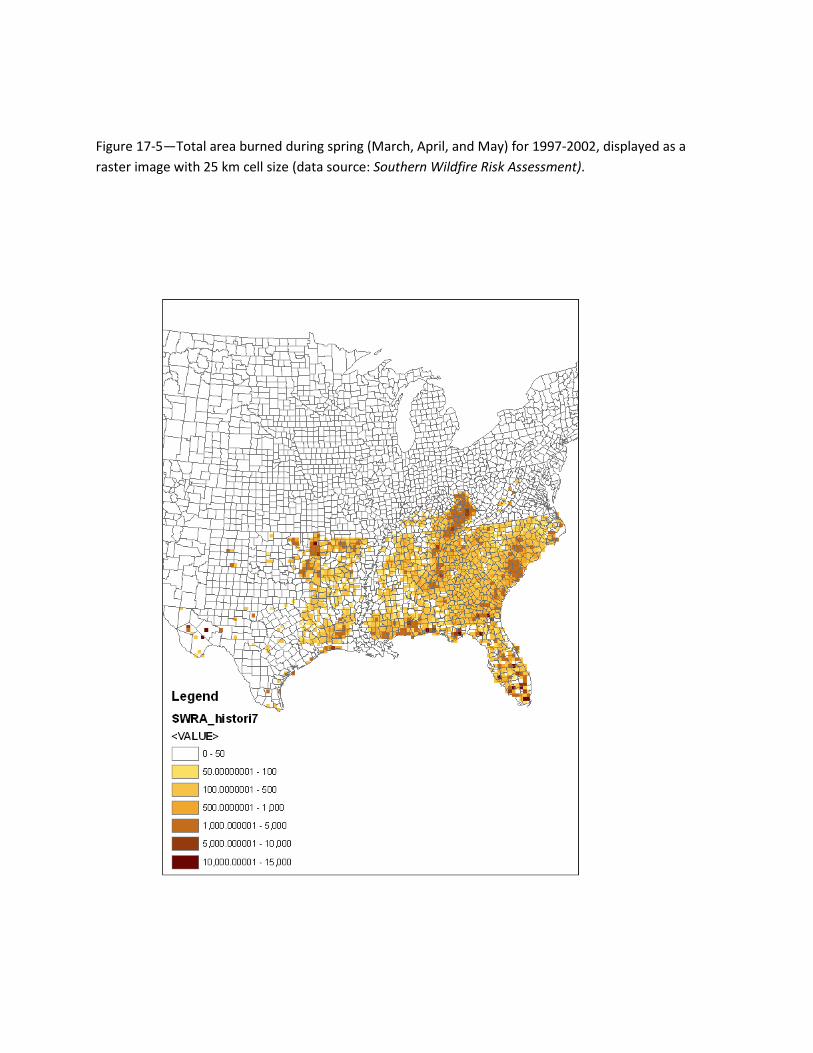
Figure 17-5—Total area burned during spring (March, April, and May) for 1997-2002, displayed as a raster image with 25 km cell size (data source: Southern Wildfire Risk Assessment).
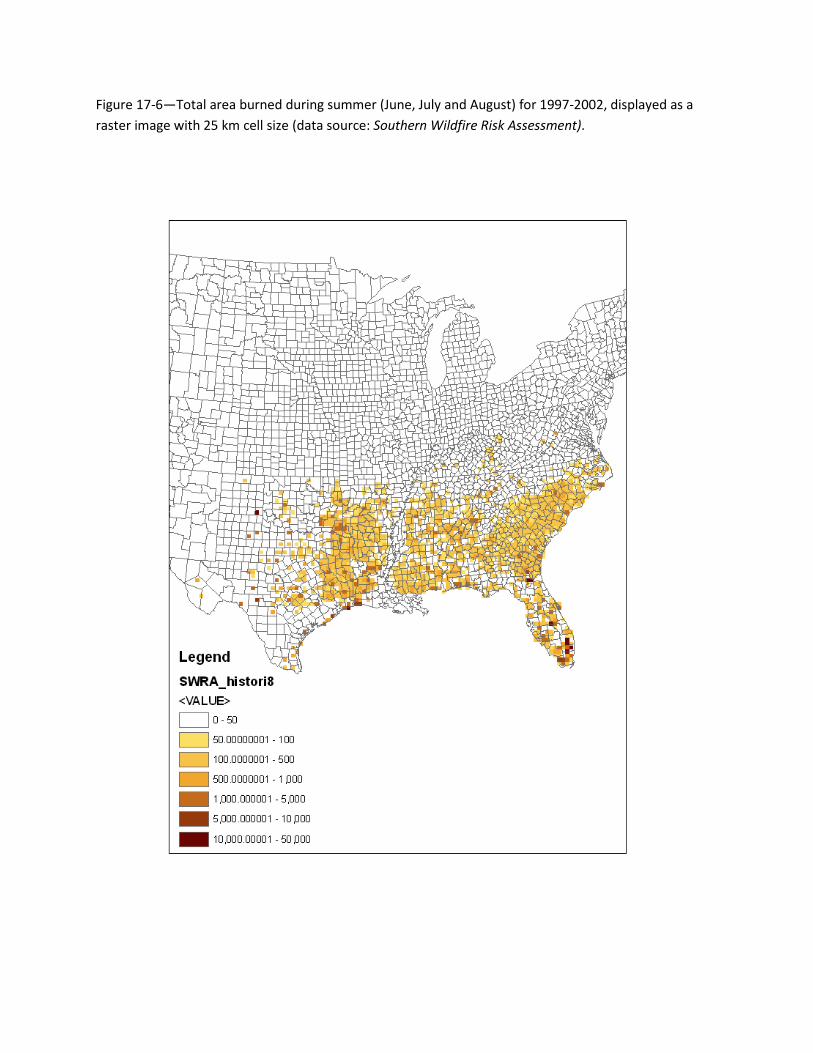
Figure 17-6—Total area burned during summer (June, July and August) for 1997-2002, displayed as a raster image with 25 km cell size (data source: Southern Wildfire Risk Assessment).
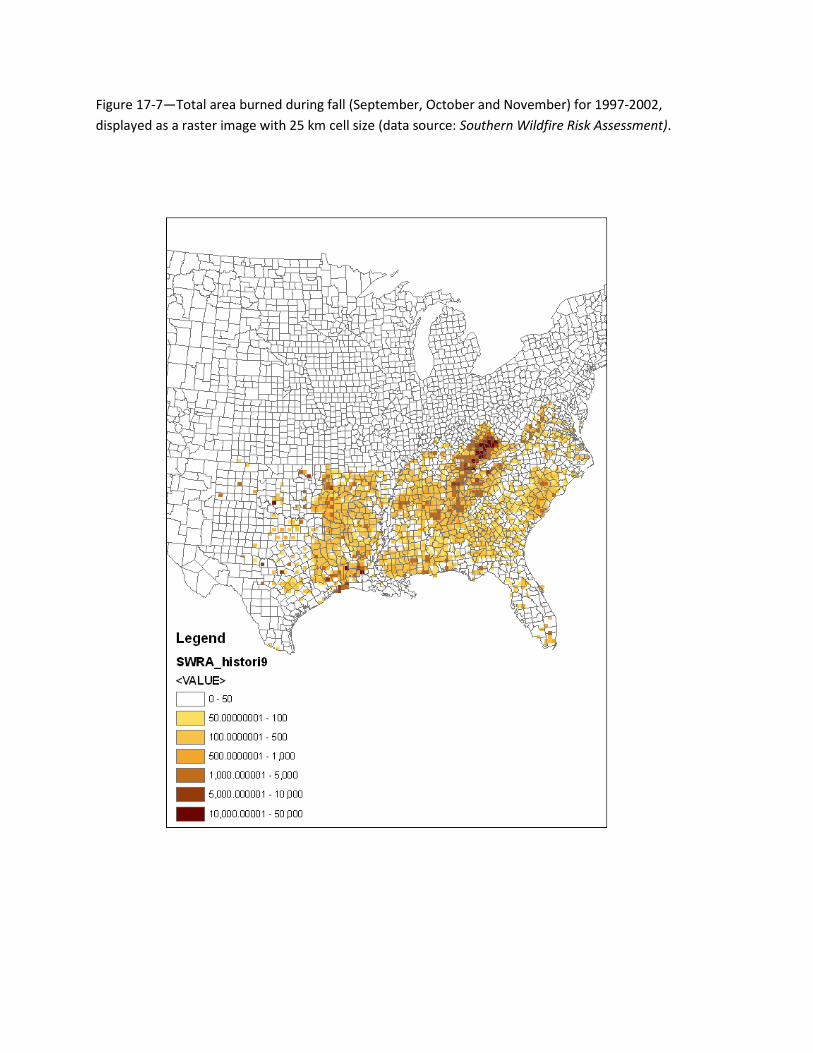
Figure 17-7—Total area burned during fall (September, October and November) for 1997-2002, displayed as a raster image with 25 km cell size (data source: Southern Wildfire Risk Assessment).
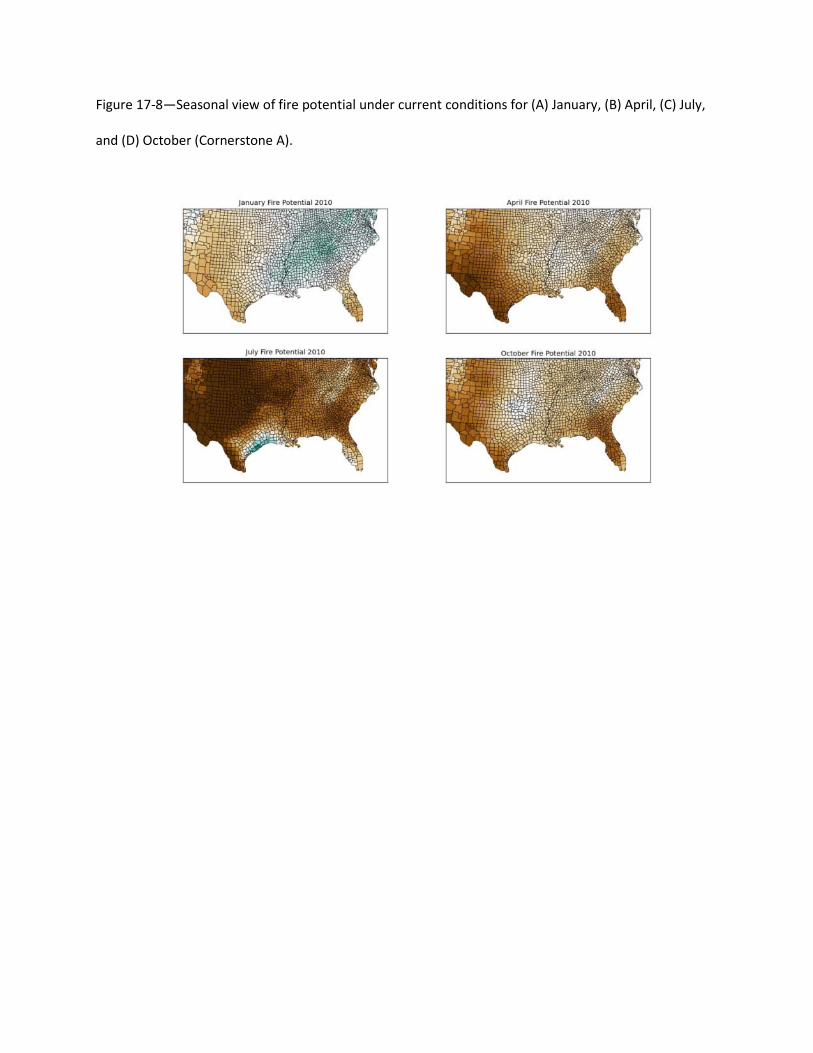
Figure 17-8—Seasonal view of fire potential under current conditions for (A) January, (B) April, (C) July,
and (D) October (Cornerstone A).
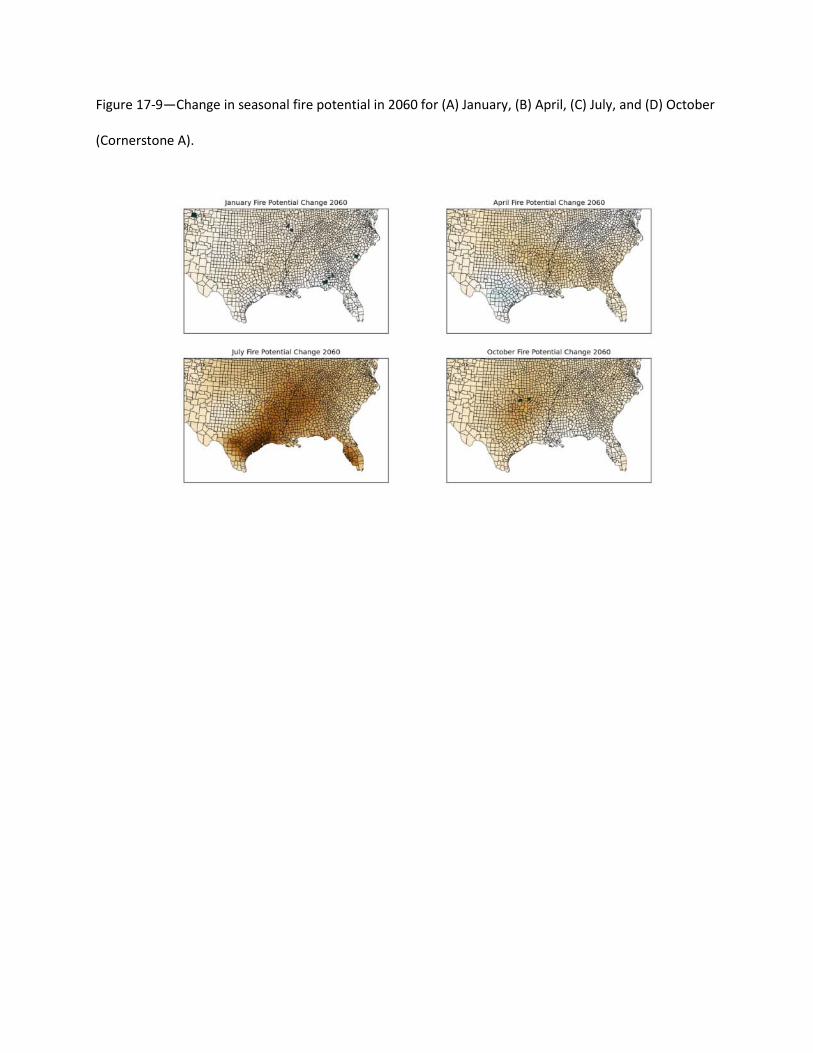
Figure 17-9—Change in seasonal fire potential in 2060 for (A) January, (B) April, (C) July, and (D) October
(Cornerstone A).
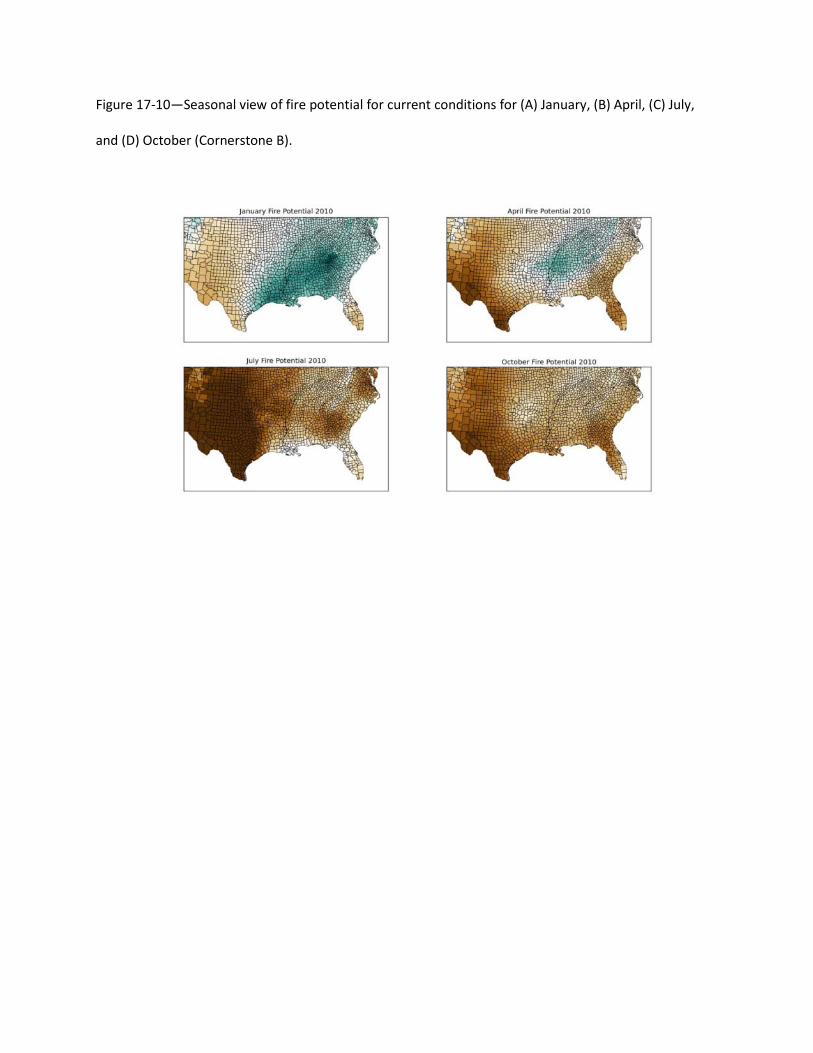
Figure 17-10—Seasonal view of fire potential for current conditions for (A) January, (B) April, (C) July,
and (D) October (Cornerstone B).
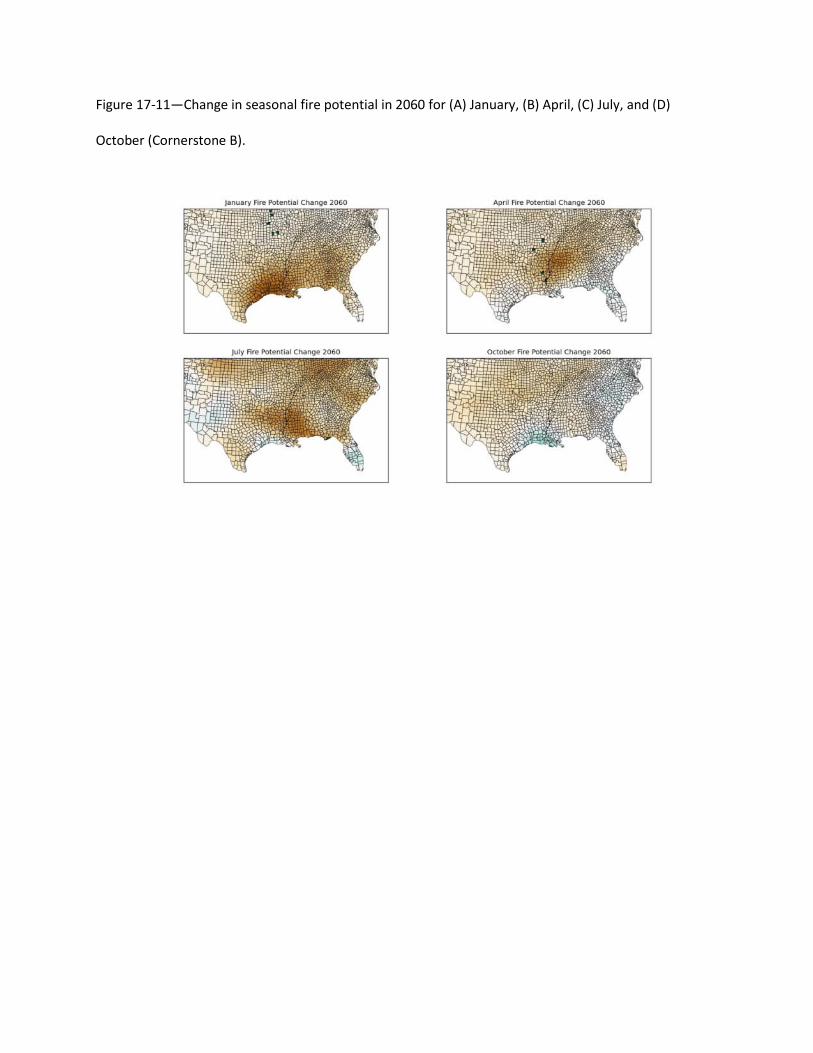
Figure 17-11—Change in seasonal fire potential in 2060 for (A) January, (B) April, (C) July, and (D)
October (Cornerstone B).
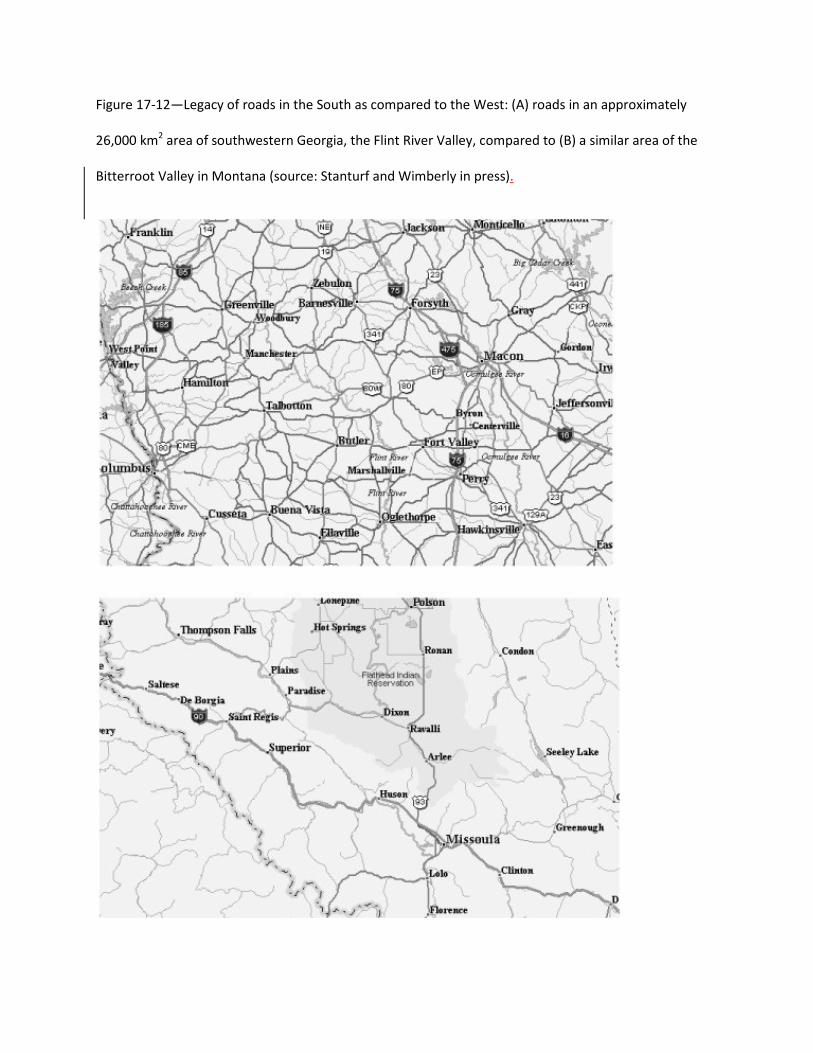
Figure 17-12—Legacy of roads in the South as compared to the West: (A) roads in an approximately
26,000 km2 area of southwestern Georgia, the Flint River Valley, compared to (B) a similar area of the
Bitterroot Valley in Montana (source: Stanturf and Wimberly in press).
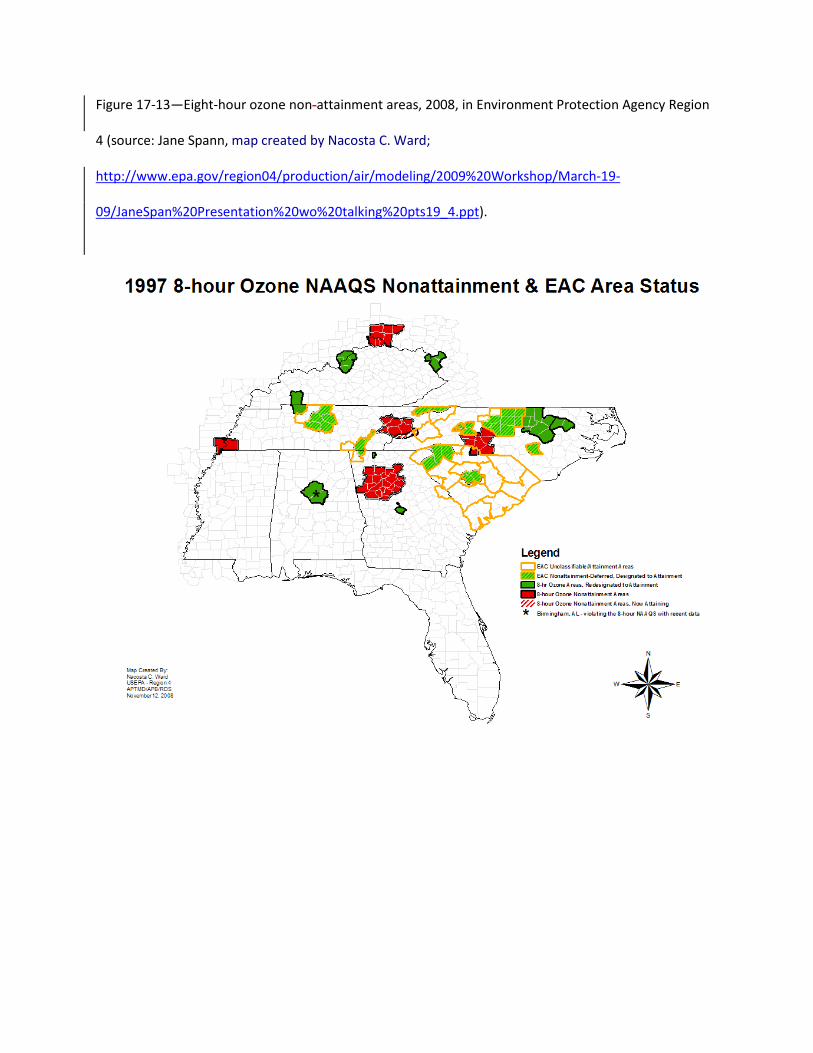
Figure 17-13—Eight-hour ozone non-attainment areas, 2008, in Environment Protection Agency Region
4 (source: Jane Spann, map created by Nacosta C. Ward;
http://www.epa.gov/region04/production/air/modeling/2009%20Workshop/March-19-
09/JaneSpan%20Presentation%20wo%20talking%20pts19_4.ppt).
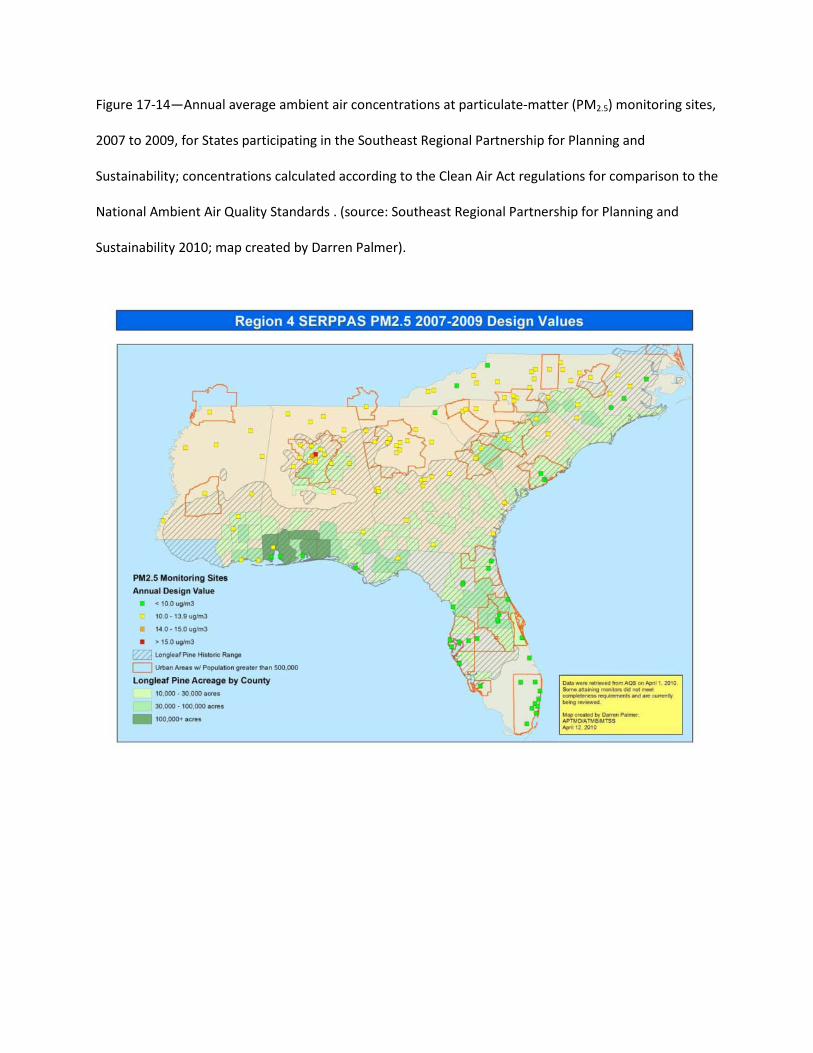
Figure 17-14—Annual average ambient air concentrations at particulate-matter (PM2.5) monitoring sites,
2007 to 2009, for States participating in the Southeast Regional Partnership for Planning and
Sustainability; concentrations calculated according to the Clean Air Act regulations for comparison to the
National Ambient Air Quality Standards . (source: Southeast Regional Partnership for Planning and
Sustainability 2010; map created by Darren Palmer).
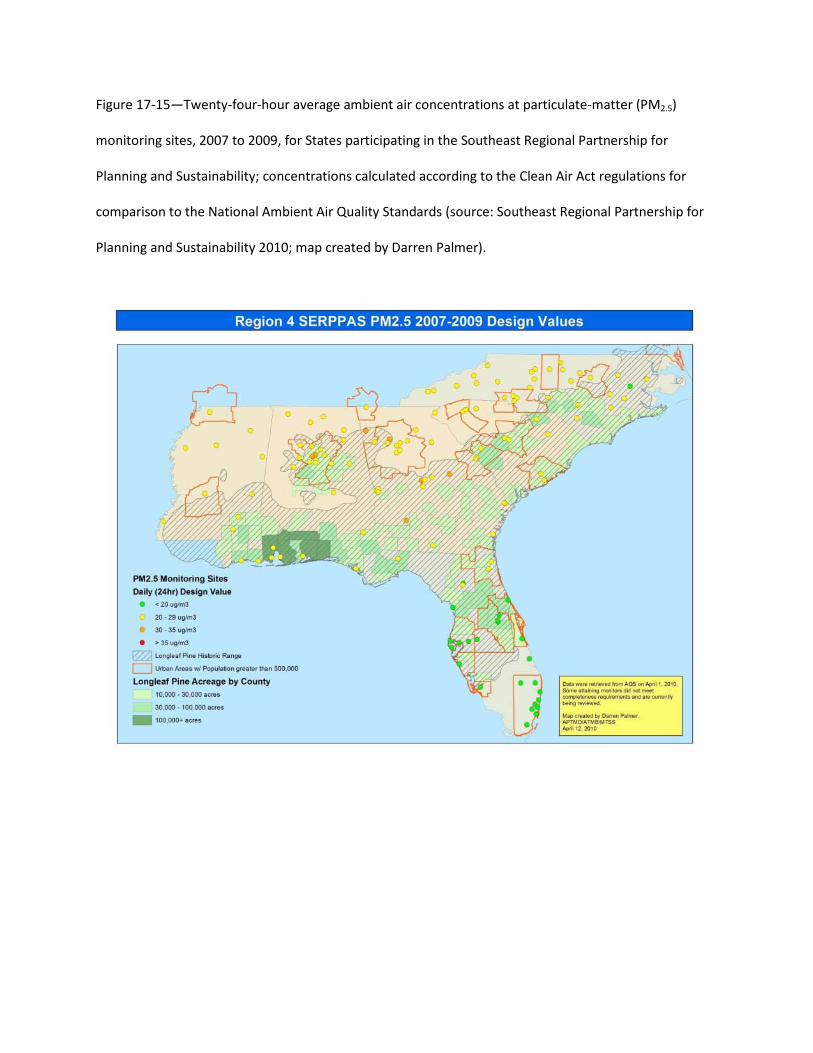
Figure 17-15—Twenty-four-hour average ambient air concentrations at particulate-matter (PM2.5)
monitoring sites, 2007 to 2009, for States participating in the Southeast Regional Partnership for
Planning and Sustainability; concentrations calculated according to the Clean Air Act regulations for
comparison to the National Ambient Air Quality Standards (source: Southeast Regional Partnership for
Planning and Sustainability 2010; map created by Darren Palmer).
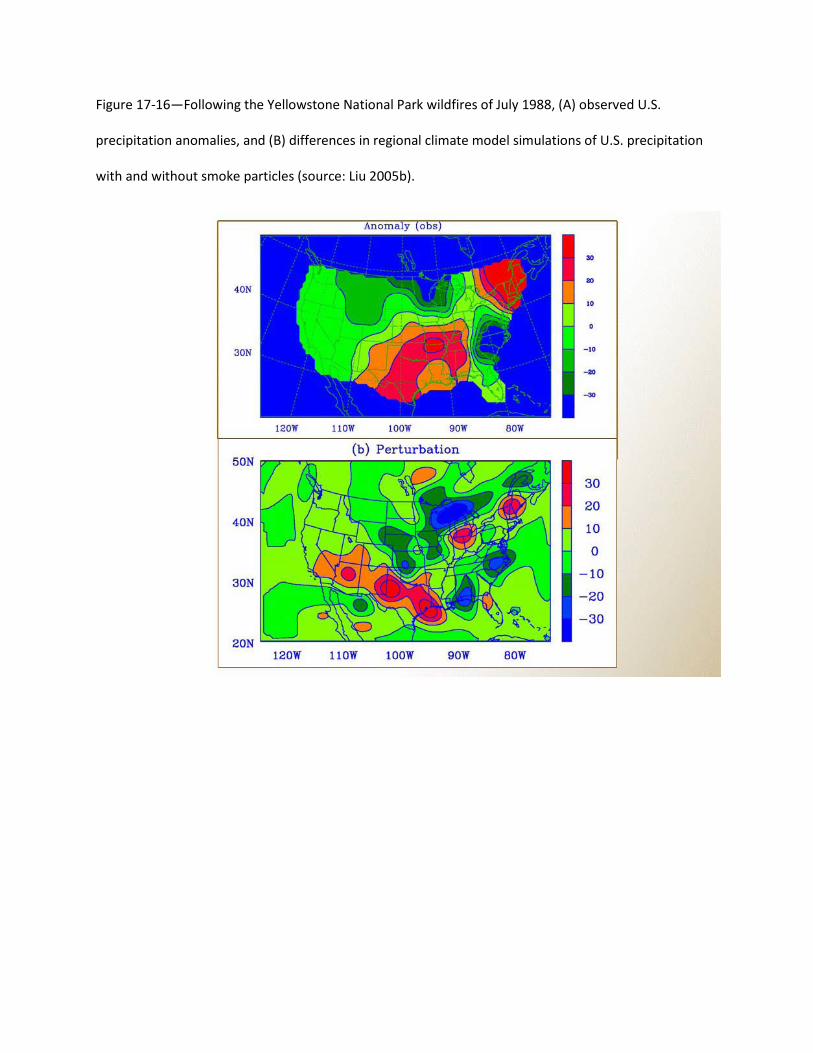
Figure 17-16—Following the Yellowstone National Park wildfires of July 1988, (A) observed U.S.
precipitation anomalies, and (B) differences in regional climate model simulations of U.S. precipitation
with and without smoke particles (source: Liu 2005b).