Embed Size (px)
Citation preview

Elimination of systematic faults and maintenance uncertainties on the City of
Johannesburg’s roads Intelligent Transport Systems
by
PHALANNDWA LAWRENCE MAKHWATHANA
submitted in accordance with the requirements
for the degree of
MAGISTER TECHNOLOGIAE
in the subject of
ELECTRICAL ENGINEERING
at the
UNIVERSITY OF SOUTH AFRICA
SUPERVISOR: PROF S. DU
FEBRUARY 2016

i
Declaration
Student number: 47309075
I declare that Elimination of systematic faults and maintenance uncertainties on the City of
Johannesburg’s roads Intelligent Transport Systems is my own work and that all the sources that I have
used or quoted have been indicated and acknowledged by means of complete references. This dissertation is
being submitted for the degree of Master of Technology at the University of South Africa, Pretoria. It
has not been submitted before for any degree or examination at any other university.
________________________ _____________________
SIGNATURE DATE
Mr Phalanndwa Lawrence Makhwathana

ii
Acknowledgement
I would like to acknowledge my supervisor, Professor S. Du, for understanding my passion in
Intelligent Transport Systems (ITS) and for guiding me to the final stage of this dissertation. I am
glad to have had you as my mentor.
I would like to thank my employer, Johannesburg Roads Agency (JRA) for supporting me with the
time and resources necessary to accomplish this research. I may not mention all the names of
Transport Engineers and Technologists, ITS project implementation and maintenance technical staff,
with whom I have always interacted throughout the research, but their inputs are highly appreciated.
To my beloved family, your belief in me and moral support kept me passionate.
God, glory be to thee.

iii
Publications derived from this dissertation
1. Phalanndwa L. Makhwathana and Shengzhi Du. “Analysis on Faults and Maintenance
Uncertainties at Traffic Signal Junctions in the City of Johannesburg”. 4th International
Conference in traffic and Transportation Engineering 2015 (ICTTE 2015)
2. Phalanndwa L. Makhwathana and Shengzhi Du. “Road ITS Backup Power Source Performance
Estimation”. 4th International Conference in traffic and Transportation Engineering 2015 (ICTTE
2015)

iv
Abstract
Road transport mobility continues to be a challenge to the City of Johannesburg (CoJ)’s economy in
general. Traffic signals, their remote monitoring and control systems are the current implemented
Intelligent Transport Systems (ITS), but daily systematic faults and maintenance uncertainties on
such systems decrease the effectiveness of traffic engineers’ intersections optimization techniques.
Inefficient electrical power supply to such ITS is a challenge, with conditional power cuts and
fluctuations, uncertainties on traffic control system faults. Another factor leading to the problem is
the communication channel which is using traditional modems which are not reliable. Reporting
through both customer complaints and such unreliable remote monitoring systems makes
maintenance to be ineffective.
In this dissertation, the factors leading to the faults and uncertainties are considered. The proposed
solution considers the important concerns of ITS, such as electrical power source performance
optimization technique, road traffic control systems compatibility and communications systems.
Energy consumption and battery bank state of charge (SOC) are modelled and used to determine the
running period prediction with reference to traffic signal control timing plan. Research results and
analysis on proposed model show that its implementation shall improve mobility in the CoJ.

v
Key terms
• Intelligent Transport Systems
• Uninterruptable Power Supply
• Battery Runtime
• Load Prediction
• Fuzzy Logic Systems
• Artificial Neural Networks
• Packet Switching

vi
Table of Contents
Declaration.................................................................................................................................. i
Acknowledgement ..................................................................................................................... ii
Publications derived from this dissertation ................................................................................ iii
Abstract .................................................................................................................................... iv
Key terms....................................................................................................................................v
Table of Contents ...................................................................................................................... vi
List of figures .......................................................................................................................... viii
List of tables ...............................................................................................................................x
List of abbreviations .................................................................................................................. xi
Delimitations........................................................................................................................... xiii
1. Introduction .........................................................................................................................1
1.1 Background ................................................................................................................... 1
1.2 Research problem.......................................................................................................... 3
1.3 Objectives of the research ............................................................................................. 3
1.4 Value of the research ..................................................................................................... 4
1.5 Research methodology .................................................................................................. 4
1.6 Structure of dissertation sections ................................................................................... 5
2. Review of related literature ..................................................................................................6
2.1 Introduction .................................................................................................................. 6
2.2 Artificial Intelligence Techniques ................................................................................. 6
2.3 Traffic Signal Control ................................................................................................... 9
2.4 Electrical Power Supply and Stability ......................................................................... 15
2.5 Power Supply Performance Prediction ........................................................................ 23
2.6 Communication Networks and Synchronization .......................................................... 25
2.7 Systems Reliability ..................................................................................................... 28
3. Analysis of the current situation on ITS faults and maintenance uncertainties in the City of
Johannesburg ............................................................................................................................ 30
3.1 Introduction ................................................................................................................ 30
3.2 Faults Analysis............................................................................................................ 35
3.3 Maintenance uncertainties ........................................................................................... 44
4. Proposed solution, modeling and configuration of energy efficient roads ITS ..................... 45

vii
4.1 Introduction of the proposed solution .......................................................................... 45
4.2 Energy storage efficiency optimization ....................................................................... 48
4.3 Road ITS Electrical Power Source Performance Estimation Technique ....................... 50
4.4 TCU and LED Lights Compatibility ............................................................................ 56
4.5 Remote Monitoring Network....................................................................................... 57
4.6 Conclusion .................................................................................................................. 59
5. Implementation and analysis of energy efficient roads ITS ................................................. 60
5.1 Introduction ................................................................................................................ 60
5.2 Information collection ................................................................................................. 60
5.3 Battery SOC and Runtime Estimation ......................................................................... 65
5.4 Communication network ............................................................................................. 68
5.5 Road network reliability assessment ............................................................................ 69
5.6 Results analysis ........................................................................................................... 79
6. Conclusions and Future research ........................................................................................ 81
6.1 Conclusion .................................................................................................................. 81
6.2 Future research............................................................................................................ 81
List of references....................................................................................................................... 83
Appendix A: Wi-Fi scanned frequencies ................................................................................... 90

viii
List of figures
Figure 1: Fuzzy Logic application on Matlab..................................................................................... 7
Figure 2: Matlab extracted neural networks structure. ........................................................................ 8
Figure 3: Example of ANFIS structure. ............................................................................................. 9
Figure 4: SARTSM example of signal interval. ............................................................................... 10
Figure 5: Time-space diagrams........................................................................................................ 12
Figure 6: Semi-actuated control in American layout. ....................................................................... 14
Figure 7: Fully-actuated control in South African layout. ................................................................ 14
Figure 8: Possible distortion in input voltage ................................................................................... 16
Figure 9: UPS types ........................................................................................................................ 17
Figure 10: Power supply system schematics. ................................................................................... 19
Figure 11: MPPT operation. ............................................................................................................ 21
Figure 12: Ring-feed electrical power distribution network schematic. ............................................ 22
Figure 13: Packet switching. ........................................................................................................... 26
Figure 14: SCADA block diagram................................................................................................... 28
Figure 15: Reliability function......................................................................................................... 28
Figure 16: CoJ metropolitan municipality map ................................................................................ 30
Figure 17: Junction with 2-way 4-lane street. .................................................................................. 31
Figure 18: Junction with 2-way 7-lane street. .................................................................................. 31
Figure 19: Junction with 2-way 5-lane streets and right-turn lane. ................................................... 32
Figure 20: Junction with 2-way 5-lane streets and right-turn lane. ................................................... 32
Figure 21: Consecutive junctions of different layouts. ..................................................................... 33
Figure 22: Current road ITS architecture. ........................................................................................ 33
Figure 23: Recorded traffic signal faults analysis............................................................................. 40
Figure 24: Daily average traffic signal faults occurrence analysis. ................................................... 40
Figure 25: Monthly faults analysis .................................................................................................. 41
Figure 26: UPSs discharge characteristics. ...................................................................................... 43
Figure 27: Standard conversion concepts. ........................................................................................ 46
Figure 28: Multiple-battery configuration. ....................................................................................... 49
Figure 29: Integrated road ITS connected properties. ....................................................................... 51
Figure 30: Battery performance or runtime estimation algorithm. .................................................... 52
Figure 31: Basic battery measurement setup .................................................................................... 54

ix
Figure 32: Basic biased switching circuitry. .................................................................................... 57
Figure 33: Communication network architectures. ........................................................................... 58
Figure 34: Sample junction layout. .................................................................................................. 61
Figure 35: Stage movements plan. ................................................................................................... 61
Figure 36: AM & PM fixed timing plan........................................................................................... 62
Figure 37: Off-peak fixed timing plan. ............................................................................................ 63
Figure 38: Remaining 64.82Ah runtime........................................................................................... 67
Figure 39: CoJ applicable Wi-Fi setup block diagram...................................................................... 68
Figure 40: A map showing Booysens road and its selected junctions ............................................... 70
Figure 41: Booysens road traffic flow ............................................................................................. 71
Figure 42: Wi-Fi with 1-3ms response time ..................................................................................... 73
Figure 43: Wi-Fi with 5-10ms response time ................................................................................... 74
Figure 44: Wi-Fi with 6-7ms response time ..................................................................................... 75
Figure 45: Wi-Fi with 12-40ms response time ................................................................................. 76
Figure 46: GPRS with 559-1449ms response time ........................................................................... 77
Figure 47: GPRS with 525 - 1673ms response time ......................................................................... 78

x
List of tables
Table I: Information on JRA's traffic signal backup and alternative power supply systems .............. 34
Table II: Traffic control and communication components ................................................................ 35
Table III: September 2013 traffic signal faults data ......................................................................... 38
Table IV: AM & PM peak cycle timetable ...................................................................................... 62
Table V: Off-peak cycle timetable ................................................................................................... 63
Table VI: Traffic control cycle weight data comparison .................................................................. 64
Table VII: 48V battery data ............................................................................................................. 65
Table VIII: Battery charge cycle data .............................................................................................. 65
Table IX: ITS component assessment on SCADA ........................................................................... 69
Table X: Booysens road network junctions data .............................................................................. 70
xi
List of abbreviations
3G = Third Generation
AC = Alternating Current
Ah = Amp-hour
ANFIS = Adaptive Neuro Fuzzy Inference System
ANN = Artificial Neural Networks
ATMS = Advanced Traffic Management Systems
BRT = Bus Rapid Transit
BTS = Base Transceiver Station
CBD = Central Business District
CCTV = Closed Circuit Television
CoJ = City of Johannesburg
DC = Direct Current
DUSC = Dial Up Strategic Control
EDGE = Enhanced Data rates for GSM Evolution
ESKOM = Electricity Supply Commission
EU = European Union
GPRS = General Packet Radio Service
GSM = Global System for Mobile
IP = Internet Protocol
ISP = Internet Service Provider
ITS = Intelligent Transport Systems
ITSSA = Intelligent Transport Systems South Africa
JRA = Johannesburg Roads Agency
JMPD = Johannesburg Metropolitan Police Department
LED = Light Emitting Diode
MCU = Mobile Control Unit
MPPT = Maximum Power Point Tracking
MTU = Master Terminal Unit
NTCIP = National Transportation Communications for ITS Protocol
OCV = Open Circuit Voltage
PV = Photovoltaic

xii
QoS = Quality of Service
RMS = Remote Monitoring System
RTU = Remote Terminal Unit
SANS = South African National Standards
SARTSM = South African Road Traffic Signs Manual
SCADA = Supervisory Control and Data Acquisition
SCOOT = Split Cycle Offset Optimisation Technique
SDA = Service Delivery Agreement
SMS = Short Message Service
SOC = State-of-Charge
SOD = State of Discharge
TCP = Transmission Control Protocol
TCU = Traffic Control Unit
TMC = Traffic Monitoring Centre
UPS = Uninterruptable Power Supply
UTC = Urban Traffic Control
VA = Vehicle Actuated
VICC = Voltage Inference Coulomb Counting
WAN = Wide Area Network
Wh = Watt-hour

xiii
Delimitations
• This dissertation may serve to guide in development of DC LED lights and traffic control unit
(TCU), but not the complete design.
• Implementation of external surge protection systems is not part of this dissertation.
• Software development is also not the purpose of this research, but guideline.

1
1. Introduction
1.1 Background
Road Traffic congestion is a serious problem to the economy. In the City of Johannesburg
(CoJ) municipality, one of Johannesburg Roads Agency (JRA)’s service areas is the traffic
regulatory infrastructure, with traffic signaling as a concern. JRA is responsible for over 2000
signalized intersections, while new other installations are taking place at other intersections
of concern. They are located along 10 000km total length of roads.
Due to economic development, it is very important that efficient Intelligent Transport
Systems (ITS) must be implemented in places like CoJ. According to City of Johannesburg,
through technology installed (Split Cycle Offset Optimization Technique (SCOOT) / Urban
Traffic Control (UTC)) at the company’s mobility centre, the section can monitor traffic
signals at various locations.
According to JRA’s ITS technical section, it is through Advanced Traffic Management
System (ATMS) / Supervisory Control and Data Acquisition (SCADA) as part from ITS /
UTC, that traffic signals are monitored for any defects including systematic faults that have
negative impact on traffic mobility. The company’s Traffic Management Centre (TMC) also
takes calls from the public, reporting any traffic signals defects, including such systematic
faults. When technicians and electricians in the traffic signals maintenance department are
given such faults information to fix, such maintenance attendance is expected to be done
according to the customer charter standard, set by the CoJ municipality.
According to Traffic management & Network Support section of Mobility & Freight unit,
one of the business units of JRA, working on ITS, in the year 2008, uninterruptable power
supply (UPS) and solar systems were installed at identified intersections. This was as a result
of high energy supply demand in the municipality and other parts of the country, leading to
load shedding strategy initiated by power utility companies to deal with demand and supply
challenges. JRA, the entity of CoJ, gets power supply for ITS, from Electricity Supply
Commission (ESKOM), South Africa’s main grid utility company or City Power, CoJ’s
entity for electricity, depending on area or region. However, according to Pieterse et al.

2
(2013), City Power is the largest electricity distribution company in the CoJ metropolitan
area.
Load shedding was causing a lot of traffic congestion on CoJ roads. Energy Systems
implemented are to store energy for such difficult time.
It was also decided that light emitting diode (LED) traffic signal lights had to be installed at
every intersection as a way of retrofitting, to save on the supplied energy.
Different RMS components and configurations are used for ITS, depending on traffic control
unit (TCU). Such ITS components are confirmed to be conforming to National
Transportation Communications for ITS Protocol (NTCIP) standards. Implemented SCADA
systems also use global system for mobile (GSM) for remote monitoring system (RMS),
mobile control unit (MCU) and dial-up strategic control (DUSC).
JRA is facing the challenges of systematic faults and uncertainties in maintaining such faults
reported by the public and current installed RMS. This also causes a serious delay against the
maintenance turnaround times, set in the customer charter of the municipality. The
occurrence of such faults and the delay to fix them, due to uncertainties within maintenance
department, leaves a bad reflection of traffic signals status, resulting in traffic congestion.
Implementation of Rea Vaya bus rapid transit (BRT) has also added pressure, with dedicated
lanes.
200 critical signalized intersections were identified by both JRA and Johannesburg
Metropolitan Police Department (JMPD) as the busiest and with the most complaints record.
According to Traffic Engineering section of Mobility & Freight unit, traffic impact studies
have also been used to identify the busiest intersections. JMPD’s selection is based on the
intersections at which traffic officers have often been operating to reduce congestion due to
systematic faults. JMPD gets callouts from JRA’s TMC, about faulty traffic signals and
traffic congested intersections. TMC gets calls from the public and some intersections with
RMS. Such 200 intersections were common in both JRA and JMPD identification processes.

3
1.2 Research problem
City of Johannesburg’s ITS systematic faults occurrence and maintenance uncertainties result
in long-lasting roads traffic congestions in the City of Johannesburg.
Improvement of the current ITS, should look into the following sub-problems:
• Eskom’s or City Power’s grid power instability has negative impact on traffic signal
control systems. The grid power supply flactuates all the time.
• Current backup systems are not reliable in terms of actual capacity against off-grid time
and variable loads. The charge level information cannot be used to predict autonomy.
This involves both standard UPS and those with solar as primary source of energy.
• During traffic signal phase transition, the TCU turns the signals into flashing mode.
• Current communication network connectivity and speed are not reliable to ITS, with
current SCADA systems’ operational principle making it worse to use RMS.
1.3 Objectives of the research
• Analysis on the causes of identified systematic faults and maintenance uncertainty on
installed ITS in the CoJ.
• Analysis on energy inefficiency of current road ITS in the CoJ. This should consider
types of UPS and ESKOM or City Power’s electric power distribution at traffic signal
junctions.
• To compare circuit switching and packet switching efficiencies and recommend suitable
communication model for ITS.
• To design energy efficient integrated ITS configuration model that aims to increase
systems reliability, while eliminating double energy conversion by making use of clean
regulated DC power distribution and operation, at an intersection.

4
• The research shall produce papers for publications.
1.4 Value of the research
• There will be more certainty on reactive maintenance of ITS faults.
• Occurrence of systematic faults will be reduced by ensuring continuous direct current
(DC) power supply and distribution for energy efficient ITS operations.
• Implementation of model of this research shall lead to the amendments of South African
Road Traffic Signs Manual (SARTSM), for compliance.
• The research outcomes can be used by ITSSA members, including JRA as a guide to
future energy efficient integrated ITS configuration model.
• Application of the model will intensify road transport mobility.
1.5 Research methodology
• Random systematic faults analysis on CoJ’s 200 critical and other intersections has been
done.
• Assessment of installed energy efficient ITS infrastructure has been done, using colleted
data on power flactuations and backup systems performance. Current ITS model and
specifications have been analysed and improved model is proposed. This involve
intersections with different backup power systems.
• Assessment of circuit-switched and packet-switched communication technology network.
Synchronisation performance on SCADA systems has been done. Fault identification
delay and operational principle of SCADA systems has been analysed in comparison with
same faults reported by the public including possible positions or addresses when
reporting such faults.

5
• Load estimation and performance prediction has been performed. Power backup capacity
measurement method, Traffic signals timing plans per selected intersection and Artificial
intelligent techniques have been used.
• Traffic engineering and Electrical/Electronic sections of traffic signals division, in JRA,
will be consulted.
1.6 Structure of dissertation sections
Section 2 gives a review of related literature. As the sub-problems are outlined, there are
probably different researches and methods with solutions, of related challenges. This
section focuses on Traffic signal control, power supply, communication networks and
artificial intelligence techniques.
Section 3 gives the analysis about the problem. It gives the analysis on the causes of the
systematic faults and maintenance uncertainties.
Section 4 focuses on the proposed solution, modeling and configuration of road energy
efficient traffic control systems. Different and suitable methods are implemented for
different parts of the proposed solution. An integrated model is then introduced.
Section 5 shows how the introduced model is implemented based on selected scenarios. It
also gives analysis of the implementation results in comparison with the existing road
ITS.
Section 6 gives the conclusion and recommendations with reference to all the sections of
this dissertation. It shows the level of satisfactions towards the objectives of the research.
Related future research work is also suggested.
As always stated, where applicable, some work has been done by other researchers and
documented for further activities. Section 7 gives the list of references from which some
applicable ideas have been noted.

6
2. Review of related literature
2.1 Introduction
According to Wikipedia, though Intelligent Transport Systems (ITS) may not contain very
high intelligence, they are advanced applications used in transport and traffic management of
different modes, for smart, safer and more coordinated transport networks with well-informed
users.
Although ITS may refer to all modes of transport, EU Directive 2010/40/40/EU of 07 July
2010 on the framework for ITS deployment in the field of road transport and for interfaces
with other transport modes, defines ITS as systems in which information and communication
technologies are applied in road transport field, including infrastructure, vehicles and users,
and in traffic and mobility management, as well as for interfaces with other transport modes.
EDGEICT states that Interest in ITS comes from the problem caused by traffic congestion
and a synergy of new information technology for simulation, real-time control and
communication networks. Traffic congestion has been increasing worldwide as a result of
increased motorization, urbanization, population growth and changes in population density.
Congestion reduces efficiency of transportation infrastructure and increases travel time, air
polution and fuel consumption.
Of course, the development of ITS is also based on artificial intelligence, with relevance to
principles of transportation engineering. To have such ITS operating, a source of stable
electrical energy is important.
This research focuses more on roads ITS in relation to what CoJ, through the JRA
implements. A review on related literature is presented.
2.2 Artificial Intelligence Techniques
Artificial intelligent techniques (AI) are relied on in different disciplines which contribute in
resolving complicated problems in ITS. Fuzzy Logic and Neural Network systems are used.

7
2.2.1 Fuzzy Logic Systems
Fuzzy logic systems are highly considered in resolving uncertainty problems. Researchers in
traffic engineering related problems also tend to implement such systems to improve road
traffic mobility through optimization of traffic signals. Others like Feng et al. (2013) still
continue in recent researches, to use fuzzy logic to estimate the state of charge of lead acid
batteries. Fuzzy logic is also applicable in short-term load forecasting.
Wang (2005:202) defines fuzzy logic as a logic that attempts to combine the imprecision
associated with natural events with the computational power of the computer to produce
highly intelligent, robust and flexible reasoning systems. In other words, uncertainties require
some intelligent power to bring about assurance in solving non-linear problems.
Negnevitsky (2011:87) describes fuzzy logic as the theory of fuzzy sets that calibrate
vagueness. He further defines fuzzy set as a set with boundaries. To support this definition
with relevance to identified problems in road ITS and specifications of current traffic control
systems, fuzzy inference system application can be suitable in the grid power voltage of
220Vac +/- 5% and battery voltage measurements in percentage, from 0 to 100. Therefore,
the basic control, protection and voltage stability systems can also be aligned to such
principles to avoid confusion. Figure 1 below shows the basic application structure of fuzzy
logic system, on Matlab.
Figure 1: Fuzzy Logic application on Matlab.
8
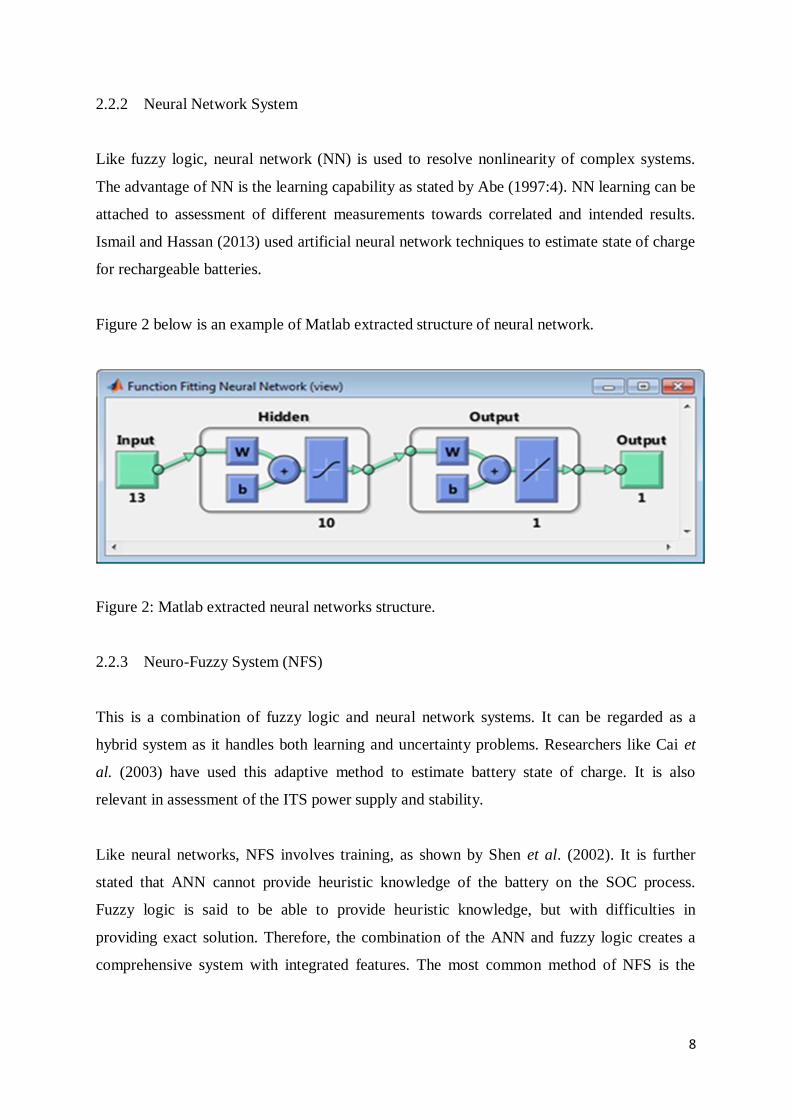
2.2.2 Neural Network System
Like fuzzy logic, neural network (NN) is used to resolve nonlinearity of complex systems.
The advantage of NN is the learning capability as stated by Abe (1997:4). NN learning can be
attached to assessment of different measurements towards correlated and intended results.
Ismail and Hassan (2013) used artificial neural network techniques to estimate state of charge
for rechargeable batteries.
Figure 2 below is an example of Matlab extracted structure of neural network.
Figure 2: Matlab extracted neural networks structure.
2.2.3 Neuro-Fuzzy System (NFS)
This is a combination of fuzzy logic and neural network systems. It can be regarded as a
hybrid system as it handles both learning and uncertainty problems. Researchers like Cai et
al. (2003) have used this adaptive method to estimate battery state of charge. It is also
relevant in assessment of the ITS power supply and stability.
Like neural networks, NFS involves training, as shown by Shen et al. (2002). It is further
stated that ANN cannot provide heuristic knowledge of the battery on the SOC process.
Fuzzy logic is said to be able to provide heuristic knowledge, but with difficulties in
providing exact solution. Therefore, the combination of the ANN and fuzzy logic creates a
comprehensive system with integrated features. The most common method of NFS is the

9
adaptive neuro fuzzy inference system (ANFIS). Figure 3 show an example of the ANFIS
structure.
Figure 3: Example of ANFIS structure.
2.3 Traffic Signal Control
Traffic signal control is one of the intersection optimisation techniques in road traffic
engineering. According to Davey and Thomas (2000), the first South African traffic signal
was installed in Johannesburg. Detailed signal network description and comprehensive traffic
flow data is required from the engineer, for traffic signal installation. Number of plans, best
cycle times, offset and green splits are decided from analysis. Some coordination of traffic
signals is needed to improve traffic flow. The following are the traffic signal control modes
as stated in South African Road Traffic Sign Manual (SARTSM):
• Fixed timing control
• Vehicle-actuated control
• Traffic-responsive control
Fixed timing and vehicle-actuated modes of control are the commonly implemented in the
CoJ. Such modes are determined by the timing plan, which also determines cycle time,

10
phases and stages sequence. The timing plans are morning (AM), midday (OFF) and evening
(PM) peak timing plans. Figure 4 is an example of signal intervals for three-stage traffic
signal with six signal groups, as shown in SARTSM (2001). The signal groups represent the
movement of vehicles and pedestrians at a traffic signal junction.
Figure 4: SARTSM example of signal interval.
2.3.1 Fixed timing control
As explained by Askerzade and Mahmood, (2010), fixed time control is calculated in
advance. SARTSM, (2001), also adds that the control sequence and duration of each phase is
the same in each cycle. In this mode, multiple timing plans are required to cope with the
variation in traffic demand throughout the day. The cycle lengths may also be different per
plan. Cycle length can be defined as the duration a full sequence of traffic signal lights in
their colours, in which all approaches are satisfied.
2.3.2 Traffic signal coordination
The coordination between relative traffic signals is very important for mobility in urban
areas. According to SARTSM (2001), coordinated systems are suitably applicable with fixed
time signal. Goliya and Jain (2012) stated that a major objective of traffic signal
synchronization at intersection is to clear maximum number of vehicles through the

11
intersection in a given length and time with least number of accidents, at maximum safe
speed with minimum delay.
According to the City of Irvine, traffic signal synchronization is a traffic engineering
technique of matching the green light times for a series of intersections to enable the
maximum number of vehicles to pass through, thereby reducing stops and delays experienced
by motorists. It should be noted, though, that this requires clocks of TCUs of such
intersections to be at the same time. Time-space diagram is used to illustrate the concept of
synchronization and expected system reliability in traffic engineering perspective, as shown
on Figure 5.

12
(a) Main street with unsynchronized traffic signals
(b) Main street with synchronized traffic signals
Figure 5: Time-space diagrams

13
The yellow colour in Figure 5(a), represents slow vehicle traffic flow that results in
congestion and causing vehicles to stop at every traffic signal junction. Green colour in
Figure 5(b), represent a smooth flow of vehicle traffic progressing through well-coordinated
and functional traffic signal junctions.
2.3.3 Vehicle-actuated (VA) control
This kind of control is also used in the CoJ, like in any other parts of the country and world in
general. This control type has the capability to respond to the presence of vehicles at a
junction. The presence of a vehicle is detected by electrical or electronic detectors. The most
common VA control modes are semi-actuated and fully-actuated.
2.3.3.1 Semi-actuated control
Semi-actuated control is used with detectors on minor street that intersects with the major
street. The operation is similar to the real-time strategy defined by Askerzade and Mahmood
(2010), as it combines preset cycle time with proximity sensors which can activate a change
in the cycle time. As stated by Mathew (2014), the green light is on the major street at all
times unless a call on the side street is noted. The active operation of detectors is in
accordance with the validated peak timing plan.
Traffic signal junctions with such type of control are often implemented along all types of
routes, as shown on Figure 6. Therefore, it is implemented on all categories of junctions, as
explained in section 2 of this dissertation. Other junctions may have the turning arrow leading
towards the side street.
Figure 6 shows an example of junction layout with semi-actuated control configuration, as
presented by Mathew (2014).

14
Figure 6: Semi-actuated control in American layout.
2.3.3.2 Fully-actuated control
This type of control mode needs detectors implemented on all approaches to a junction. It
allows for the extension of all green intervals provided at a signal, especially on isolated
junctions. Messer and Nageswara (1996) further explain that the junction at which such mode
is applicable often has relatively equal volumes with varying traffic distribution. Figure 7 is
an example of fully-actuated control junction layout, also presented by Mathew (2014).
Figure 7: Fully-actuated control in South African layout.

15
2.4 Electrical Power Supply and Stability
Intelligent transportation systems operations depend on the supply of electrical power. The
supply source can be standalone solar system or utility grid, which is the case in the City of
Johannesburg.
2.4.1 Grid Power Supply
South African utility power supply network supplies alternating current (AC) power. Current
traffic signals equipment is designed to operate on 220Vac at 50Hz +/- 5%. The grid network
does encounter some disturbances which eventually have an effect on the load. According to
Mohan et al. (2003:354-355), the following are the power-line disturbances:
• Overvoltage
• Under-voltage
• Outage
• Voltage spikes
• Chopped voltage waveform
• Harmonics
• Electromagnetic interference
Glover and Sarma (2002:589) further elaborate on lightning surges, switching surges and
power frequency overvoltage as the types of overvoltage encountered by the power systems
equipment. It is also the case in the city of Johannesburg, causing many traffic signals to be
on red light flashing mode. Figure 8 shows possible distortion in input voltage.

16
(a) Noise distortion
(b) Harmonic distortion
Figure 8: Possible distortion in input voltage
2.4.2 Uninterruptable Power Supply (UPS) system
Commonly used UPS types are double conversion, line-interactive and standby. Gunes et al.
(2009), state that, UPS systems are employed to supply the critical loads with continuous and
energy of high quality, in facilities. The three types of UPS differ in their ability to perform
critical functions and vary in the degree of security and level of power protection they
provide. A UPS is composed of the following major components:
• Rectifier/charger
• Battery bank
• Inverter

17
UPS can be grid-connected, PV panel-connected or hybrid-connected. A charger converts
either AC or DC to DC energy to be stored into the battery bank as well as supplying to the
inverter. Batteries play an important part in storing energy for backup supply. Lead-acid
batteries are the most used at traffic signal junctions in the CoJ.
Figure 9 shows the schematic designs of three types of commonly used UPSs, as
demonstrated by Arias et al. (2012).
(a) Passive standby
(b) Line-interactive
(c) Double-conversion
Figure 9: UPS types

18
As explained by Rathmann and Warner (1996), the inverter supplies the load with
continuous, precisely regulated AC power. Arias et al. (2008) add that the difference between
UPSs in Figure 9 is the way in which the elements are connected to the load and the grid. It
can be deduced that the conversion of energy in grid connected UPS to the load connection
point, is done twice, from AC to DC and CD to AC.
2.4.3 Solar Power Supply System
Solar system is used to harness natural energy from the sun. This is a renewable energy
supply system applicable for traffic signals and other parts of ITS. Kalingamudali et al.
(2006) also motivated that the use of solar cells with lead acid accumulators to provide
required power and use of light emitting diode (LED) displays to function as signal lamps to
reduce the stored power consumption will be a feasible solution.
Current implemented solar systems supply power to AC LED lights and traffic signal
controllers. The system consists of solar panels, battery charger, battery bank and DC/AC
inverter. Due to sizes of such systems, they cannot be implemented at every junction,
especially within the city. Qiao et al. (2011) also presented a hybrid power supply system for
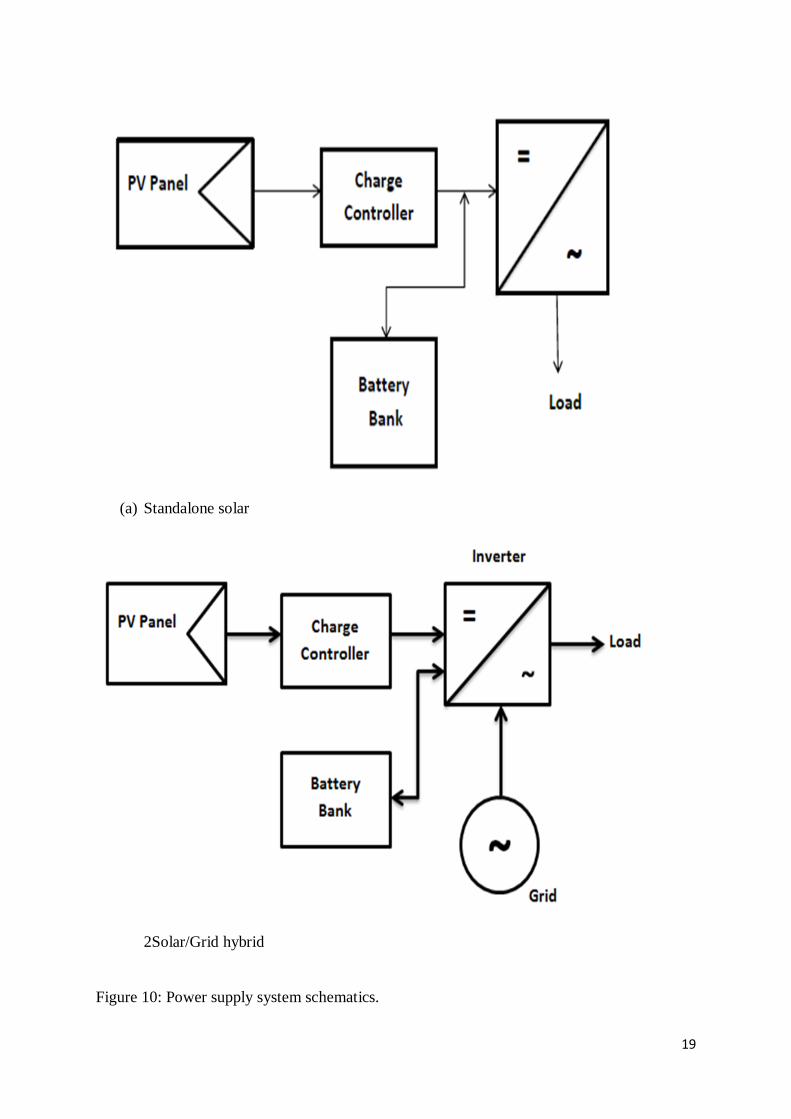
traffic signals. Figure 10 shows examples of standalone solar and grid/solar hybrid power
supply system schematics implemented in the CoJ.
19
(a) Standalone solar
2Solar/Grid hybrid
Figure 10: Power supply system schematics.

20
From Figure 10, PV panel is the primary source of energy. The battery bank starts to supply
energy when the PV panel does not supply sufficient energy. When both PV panel and
battery bank do not have sufficient energy, the load in Figure 10(a) will not function whereas
the grid in Figure 10(b) will supply energy to the load and battery bank.
2.4.4 Maximum Power Point Tracking
Advanced solar battery chargers use maximum power point tracking as a technique to get the
maximum possible power from photovoltaic solar panels. Therefore, a maximum power point
tracker (MPPT) is an electronic DC to DC converter that optimizes the match between PV
panels and the battery bank. The optimization becomes effective during cloudy, low battery
state of charge and cold conditions.
MPPT adjusts the voltage at which the solar panels are able to produce maximum power. The
difference between MPPT and conventional charger is that the conventional system connects
the module directly to the battery, thereby forcing the solar module to operate at battery
voltage. Figure 11 shows the MPPT operational principles demonstrated by Markvart
(1994:107).

21
(a) Schematic diagram
(b) I-V characteristics
Figure 11: MPPT operation.

22
Figure 11 shows that the DC/DC converter transforms the voltage at the load, to ensure
maximum power transfer. MPPT implementation is important to increase the supply
reliability, as recommended in section 1 of this dissertation.
2.4.5 Ring Feed Network
Ring feed distribution network is network of parallel connected load, with redundancy
feature. In other words, traffic signal heads per phase, at different poles of the same junction,
get power at one point of same voltage. When a fault is persistent at one pole, the cables of
the signal lights mounted on that pole can be disconnected, leaving other signal lights
operational. The basic principle and schematic design are related to Figure 12, obtained from
Wikipedia.
Figure 12: Ring-feed electrical power distribution network schematic.

23
2.5 Power Supply Performance Prediction
2.5.1 Load Prediction Modeling
Different models of electrical load prediction have been demonstrated by different
researchers. Many researches may have not particularly been in relation to ITS problems, but
they are also applicable. Application of AI techniques seems to be intriguing to many.
According to Weron (2006:78), additive models are by far more popular. Chen et al. (2001),
also concurs, by presenting an additive model assumed to be a combination of four separate
components, written as follows:
𝐿 = 𝐿𝑛 + 𝐿𝑤+ 𝐿𝑠 + 𝐿𝑟 (6)
where n, w, s and r respectively represent the normal, weather, special and noise parts of
system load.
Due to the nature of traffic signal control operation, the additive load predicting model has to
be developed.
2.5.2 Battery State of Charge
State of charge (SOC) estimation is very important in determining amount remaining battery
charge to supply the load. Different methods of determining state of charge of the battery
have been presented by different researchers with aim of battery charging and discharge
control and to determine battery runtime.
According to Coleman et al. (2007), Coulomb Counting, Voltage Indication and Impedance
Measurement are the methods of assessing the state of charge of batteries presented by
different researchers. Other researchers further implemented fuzzy logic, artificial neural
network and neuro-fuzzy networks as computational intelligence systems to account for other
conditional factors that affect the battery SOC. According to Moo et al. (2007), most of
techniques for estimating SOC of batteries need very accurate measurements of either the

24
battery chemical content or its operating conditions and thus are suitable for laboratory
experiments. The main methods presented are voltage and coulomb counting.
Voltage method is based on the terminal voltage of the battery. For an online battery,
discharge and charging processes will have an effect on the SOC estimation. Feng et
al.(2013) define the SOC as the ratio of actually available charge to maximum capacity
charge of battery as described by the formula below.
SOC =𝑄𝑐
𝐶𝑡∗ 100% 𝑜𝑟 SOC = (1 −
𝑄𝑏
𝐶𝑡) ∗ 100% (7)
𝑄𝑐, 𝑄𝑏 and 𝐶𝑡 denote the remaining charge quantity, discharge quantity and maximum
capacity, respectively.
Moo et al. (2007) also defined the battery state of discharge (SOD) as the percentage of the
discharge capacity of a battery which is fully charged before discharging. This definition is
illustrated by the formula below:
𝑆𝑂𝐷 = (𝑄𝑑
𝑄𝑟𝑎𝑡𝑒𝑑) ∗ 100% (8)
Qd and Qrated are the discharged capacity and the rated capacity, respectively, both in
Ampere hour (Ah). The conclusion in this regard by Moo et al. (2007) was that open-circuit-
voltage (OCV) test is inapplicable for applications with series connected battery banks. Feng
et al. (2013) put forward OCV extrapolation as the calibration and calculating basis of the
coulomb counting method.
Coulomb counting is the current integration method of counting the amount of charge in or
out of the battery over time. According to Leksono et al. (2013) Coulomb counting provides
high accuracy but still requires compensation from operational condition such as OCV
estimation method. Cai et al. (2003) define the battery SOC with the formula below:
𝑆𝑂𝐶 =𝐶𝑎− ∫ 𝑖𝑑𝑡
𝐶𝑎 (9)

25
𝐶𝑎 is the available discharging capacity of battery that is fully charged, while i and t are the
discharging current and time, respectively.
2.6 Communication Networks and Synchronization
There are two types of commonly used switched communication networks in ITS, namely,
circuit-switched and packet-switched networks. They support the operation of SCADA. Real-
time synchronization depends on suitable switched network, for good quality of service
(QoS).
2.6.1 Circuit-Switched Network
According to Cisco, circuit-switched networks offer users dedicated bandwidth that cannot be
infringed upon by other users. In modern networks, electronic signals pass through several
switches before a connection is established. Modarressi et al. (2009) concur with Cheung et
al. (1993), that the increase in such network type increases the contention among the circuits
due to the restrictions of the topology, leading to long latency. An example of its application
is DUSC RMS, from Siemens, whereby communication with Gemini outstations are based on
infrequent GSM communication connections, according to Gilham (2001:7). The same
applies to current traffic signal UPS monitoring systems in the CoJ. The basic phases of
circuit-switched network are:
• Establish
• Transfer
• Disconnect
It should also be noted that if the network is inactive in ITS application, to establish
connectivity or transfer data, the response time becomes prolonged or timed out, causing the
SCADA to be ineffective.
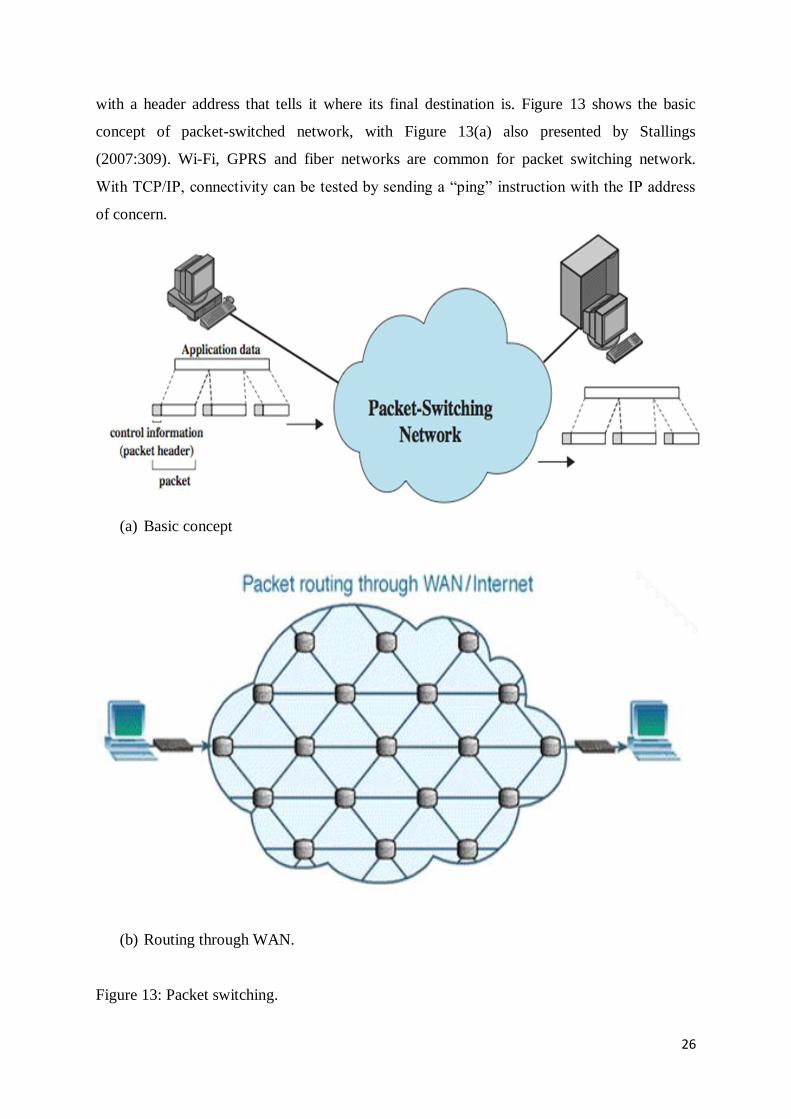
2.6.2 Packet-Switched Network
According to Teach-ict, this is a method of breaking data files into small packets or chunks in
order to send them across a network. Each packet may go a different route from the others,
26
with a header address that tells it where its final destination is. Figure 13 shows the basic
concept of packet-switched network, with Figure 13(a) also presented by Stallings
(2007:309). Wi-Fi, GPRS and fiber networks are common for packet switching network.
With TCP/IP, connectivity can be tested by sending a “ping” instruction with the IP address
of concern.
(a) Basic concept
(b) Routing through WAN.
Figure 13: Packet switching.

27
A packet also contains total amount of packets to arrive to the recipient computer, to know of
any failures. If any packet fails to arrive, the recipient sends a message back to sender,
requesting missing packet. This is very important as the bandwidth gets to be used efficiently.
2.6.3 SCADA
Nowadays ITS operations need advanced supervisory control and data acquisition (SCADA)
systems. Road transportation management operations also have power supply systems which
need to be monitored remotely from time to time, to avoid maintenance uncertainties. Like in
power supply operations, Miller and Malinowski (1994:137) also state that delays which
could result from the need to send an operator to such locations may lengthen an outage and
deteriorate customer service. It is also the case in the transportation engineering operations,
whereby the dependence on motorists to report on faulty traffic signals, makes it
uneconomically efficient for a city like Johannesburg. This led to the development of current
SCADA systems which consist of master station or terminal unit (MTU), remote terminal
units (RTUs) and some communication links between the master and remote units. From
Durrani et al. (2013), it can be added that RTU is connected main monitoring center via
GSM/Satellite/Ethernet connection, IP connectivity via EDGE/3D where applicable.
As supported by Babovic and Velagic (2009), SCADA systems provide industry with safe
and reliable tool for remote monitoring and control. Some of the expected benefits of using
such systems are as follows:
• Automatic report generating,
• Troubleshooting,
• System modifications,
• Real-time monitoring, etc.
It is furthermore stated that the network configuration also plays a crucial role in real-time
operations. Of course, there are different SCADA implementations in ITS. A standard
SCADA system block diagram is shown on Figure 14.

28
Figure 14: SCADA block diagram.
2.7 Systems Reliability
Reliability of ITS is very important, for it is the main concern to which the problem and its
sub-problems, in this dissertation are attributed to. Wang & Wets (2013:245) clarify
reliability as the ability of technical item to perform one or more required functions, under
given environmental and operational conditions and for a stated period of time. Middleton et
al. (2009) support the concept, with emphasis on consistent performance without a need for
human intervention. Figure 15 illustrates reliability function over time.
Figure 15: Reliability function
RTU
MTU
RTU RTU
Comms.

29
Reliability of systems per traffic signal junction can be broadened towards reliability of a
coordinated signals network. In this case, time-space diagram can be useful in assessing the
impact of systems reliability. In addition, reliability of communication systems can be
attributed to consistent link and transmission speed between in-station and outstation
components, thereby enhancing the overall system QoS.

30
3. Analysis of the current situation on ITS faults and maintenance
uncertainties in the City of Johannesburg
3.1 Introduction
Major intersections are situated along major and minor arterial routes, within the CoJ
municipality. Other intersections are along the collector or local routes, especially in central
business district (CBD). Figure 16 below, shows the CoJ map, with its arterial, collector and
local routes.
Figure 16: CoJ metropolitan municipality map

31
More than 60% of the selected intersections have four or more street lanes, regardless of the
direction of such lanes. Some of them have right-turning lanes, with special traffic signal
light heads installed to accommodate the signal timing plans. Considered junctions can be
categorized as 2-way, 4-way and T-junction. Their signal heads are also implemented
accordingly, to comply with SARTSM requirements. The length around such intersections is
between 70 and 100 meters in approximation. Figures 17-20 show the layout of traffic
signalized intersections with four or more street lanes, obtained from JRA’s traffic
engineering department.
Figure 17: Junction with 2-way 4-lane street.
Figure 18: Junction with 2-way 7-lane street.
N17 Of
f ramp
W414
R2
R2
SANRALimit of Contract
W406
W406
Controller
S1
S8
S1
S1
S1
S1
S1
S2
S2
S1S1
P
S1
P
P S10R
S1
P
P

32
Figure 19: Junction with 2-way 5-lane streets and right-turn lane.
Figure 20: Junction with 2-way 5-lane streets and right-turn lane.
3.8
3.3
3.6
1.5
3.1
3.6
26.0
26.2
30.0
R2
R2
R2
NetcareOl ivedale Hosp
GDL1 (Malanshof)
(Randburg)
GDL1 (Randburg)
Randburg
Advertising
R103

33
Over 85% of the major junctions are of fixed timing plans. Some corridors have consecutive
junctions laid out as shown in Figure 21, with vehicle movement directional arrows.
Figure 21: Consecutive junctions of different layouts.
Figure 22 shows, in block diagram, the current ITS architecture of concern to this research.
Figure 22: Current road ITS architecture.
PC / Server (SMS
/ Data)
TCU / UPS /
Solar Mobile Network
[GSM / Router (Dial-
up) and GPRS]

34
Table I shows the information collected on alternative energy supply, at major intersections.
The output power is of pure sine wave.
Table I: Information on JRA's traffic signal backup and alternative power supply systems
Type Power
Out
Config. Η Estimated autonomy Maximum
estimated
load
Battery
cutoff level
UPS 600VA Line-
interactive
67% 4 hours
2*54Ah 12V battery
500W @
220Vac
10~20%
UPS 700VA Line-
interactive
67% 4 hours
2*54Ah 12V battery
500W @
220Vac
10~20%
UPS 1500W Stand-by 85% 7 hours
4*102Ah 12V Battery
500W @
220Vac
10~20%
UPS 2000V
A
Line-
interactive
67% 4 hours
2*54Ah 12V battery
500W @
220Vac
10~20%
UPS 3000V
A
Line-
interactive
70% 4 hours
2*54Ah 12V battery
500W @
220Vac
10~20%
Solar 1500W Hybrid
(Solar &
Grid)
85% 3 days
Various batteries
500W @
220Vac
10~20%
Solar 2300V
A
Stand-
alone
90% 7 days
Various batteries
500W @
220Vac
10~20%
With reference to Table I, the assessed backup and renewable power supply systems are
installed along arterial routes which also intersect. 20% of UPS systems are of less than 70%
efficiency, with only two batteries per intersection. 75% of the systems are standby UPS
systems of different battery configurations. Solar systems constitute the remaining 5% of the
total.
The installation of some power supply systems is inconsistent with the estimated autonomy
and power supply synchronization. The inverter’s transfer function or efficiency and the true

35
output power are not considered in line with the load per traffic signal junction. The situation
becomes worse when traffic signals maintenance is not of good quality.
Table II shows information gathered about the traffic control and communication components
and the power supply.
Table II: Traffic control and communication components
System
Components
Power source
Power rating
Traffic Control Traffic signal controller AC +/- 70W
LED AC < 15W
SCADA Communications Modem DC 24Vdc
MCU DC 12Vdc
Router DC/AC 12~50Vdc
85~264Vac
3.2 Faults Analysis
Systematic faults of concern in this research, which are reported by the public and through
RMS, as part of ITS, are all-out and flashing red. Such faults result from systematic
interruptions on traffic signals. The interruptions may be caused by electrical power
instability or fluctuations. Sometimes the utility grid may just be off, but when it is on, the
TCU may detect an error and keep the signals on flashing mode. Mohan et al. (2003:354-
355) also give the relevant list of power line disturbances.
JRA, the entity of CoJ, gets power supply for ITS, from ESKOM, South Africa’s main grid
utility company or City Power, CoJ’s entity for electricity, depending on area or region.
According to ITS maintenance team, it has been discovered and confirmed by utility
companies’ technical teams that in industrial areas, supply voltages are increased at mini-
substations to cover up on the supply volt drops caused by heavy operations. Such
mitigations, however, negatively affect the traffic signals operation as the voltage may rise

36
above the maximum or decrease below minimum required input AC voltage during peak and
off-peak hours respectively, due to grid fluctuations.
At intersections with solar or uninterruptable power supply systems, there exist stored energy
losses during supplying time. The lost energy is due to DC/AC power conversion as the main
ITS is driven by AC power. Current ITS energy conversion UPS models decrease power
efficiency and reduce the actual and expected capacity. Installed UPSs use AC/DC to DC/AC
and solars use DC/AC electrical energy conversions, when supplying power to TCU.
It should be noted that about 10~ 20% of stored energy must be retained per full battery bank
discharge cycle, to maintain storage lifespan. So, the energy can be used when the grid
supply is off, is very limited.
With reference to table I, it is deduced that the following formula was used when planning for
existing alternative energy implementation:
𝑄𝑟𝑒𝑞 = 𝑄𝑏𝑏 − 𝑄𝑜𝑓𝑓 (1)
where, 𝑄𝑟𝑒𝑞 is the required charge
𝑄𝑏𝑏is the battery bank charge
𝑄𝑜𝑓𝑓 is cut-off charge
The stored energy 𝑄 is expressed in amp-hour (Ah)
where
𝑄 = 𝐼 ∗ 𝑡 (2)
for I is the charging current
t is charging time
From (1), it is further deduced that the load supplied power is derived as follows:
𝑃𝑙 = 𝑉𝑠(𝑄𝑏𝑏 − 𝑄𝑜𝑓𝑓) ∗ 𝜂 (3)
where, 𝑃𝑙 is load supply power
𝑉𝑠 is supply voltage in Vdc
η is inverter efficiency

37
Traffic signal intersection load can be obtained as follows:
𝐿𝑡 = 𝑛5𝐿5 + 𝑛3𝐿3 + 𝑛𝑝𝐿𝑝 + 𝐿𝑡𝑐𝑢 (4)
where 𝐿𝑡 is total load
𝐿5 is 5-light head load
𝐿3 is 3-light head load
𝐿𝑝 is pedestrian light head load
𝐿𝑡𝑐𝑢 is TCU load
n is quantity of specific light head.
Table III shows traffic signals faults data recorded during September 2013, at major
intersections. More than 95% of initial reports per junction were coming from members of
the public, instead of installed RMS.

38
Table III: September 2013 traffic signal faults data
Date (Sept 2013) Daily faults recorded All Out Flashing Red
2 36 32 4
3 39 31 1
4 62 47 4
5 63 58 1
6 57 47 4
9 73 51 8
10 56 41 4
11 44 33 5
12 52 37 5
13 62 40 10
16 61 42 5
17 72 48 7
18 89 59 11
19 58 36 6
20 41 35 2
23 34 27 1
24 No data No data No data
25 45 38 1
26 38 27 8
27 No data No data No data
Average daily faults Average A/O Average F/R
52 39 06
75% 11%
With reference to Table III, “all out (A/O)” and “flashing red (F/R)” are the two systematic
faults dominating the daily and monthly faults report. During faults maintenance activity
analysis, it has been discovered that A/O is caused by utility grid network problems. The
major causes are overvoltage, under-voltage and outages. Since many faults were reported by

39
motorists, most of them are reported after over half an hour from the time of occurrence, as
many reporters use their office phone numbers after getting to their workplaces.
Due to sensitivity of traffic signal controllers, F/R faults eventually take place as a result of
persistent grid network problems. UPS configuration, incompatibilities between TCU and
LED lights also play a role in systems reliability.
It has been discovered that the grid supply voltage can go below minimum threshold, backed
up by standby UPS, with battery charge close to cutoff level, while multiple fluctuations take
place at the same intersection. When the signal timing imposes the higher load, the TCU may
detect persistent system error that can take longer, even when the grid power is restored. Due
to such error, the TCU turns the signal heads to operate on F/R mode.
F/R can also take place where line-interactive UPS is installed, due to grid fluctuations. This
is due to the fact that battery charging takes longer whereas discharging is quicker. Other
batteries at other assessed junctions are older than others, with no replacement plan in the
maintenance department. It is even worse with old batteries, when charging cycles are
interrupted by grid instabilities.
It has been discovered that the grid network has different supply points, supplying junctions
along the same street. It becomes worse when such points belong to different utility
companies, which is found to be the case in CoJ. With many junctions operating on fixed
timing plans, the statistical traffic signal optimization does not become effective as the
junction synchronization becomes affected by grid instabilities. Mobility becomes affected
and worse where adjacent streets are closer whereby, road network nodes are created.
Figures 23 and 24 are graphical analysis to show and confirm that of all daily faults recorded,
an average of about 75% of all-out and 11% of flashing-red faults are reported, making a total
of about 86%.
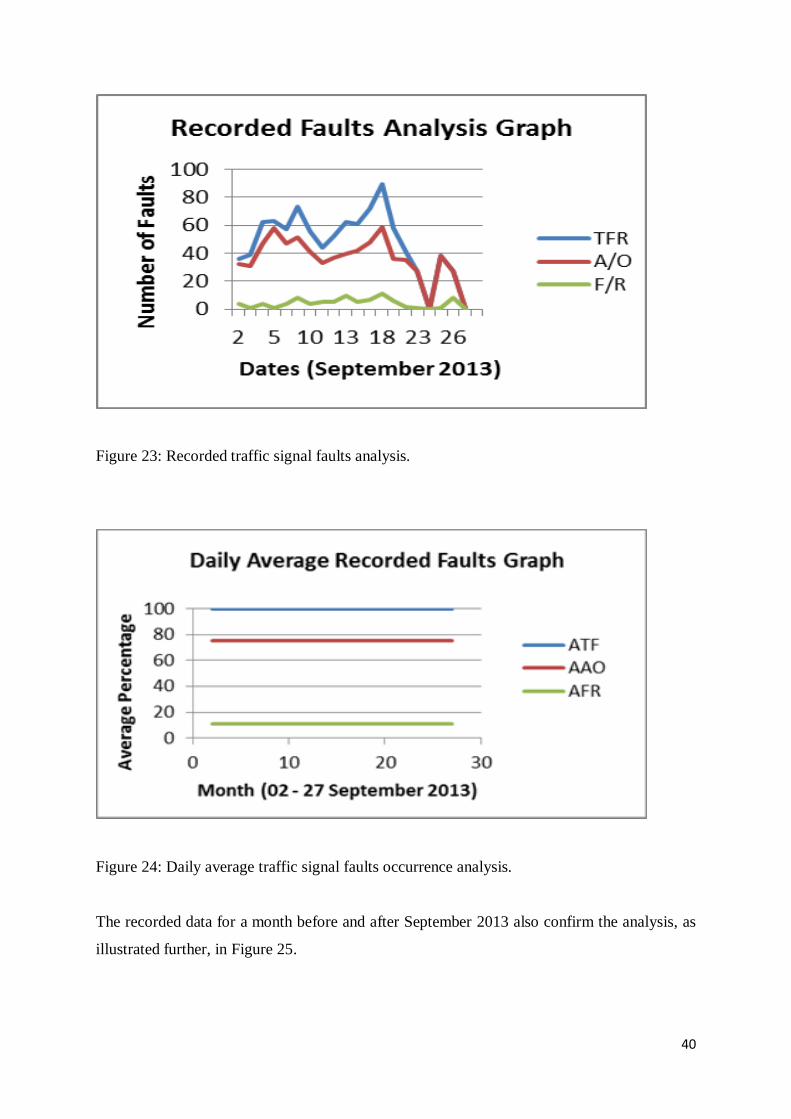
40
Figure 23: Recorded traffic signal faults analysis.
Figure 24: Daily average traffic signal faults occurrence analysis.
The recorded data for a month before and after September 2013 also confirm the analysis, as
illustrated further, in Figure 25.

41
(a)
(b)
Figure 25: Monthly faults analysis
It is also deduced that recorded systematic faults affected almost 25% of major intersections,
in average, during September 2013. This also negatively affects maintenance target of less
than 1% of malfunctioning traffic signals per day

42
In the existing ITS, three UPSs of equal lead-acid battery banks have been charged to the
maximum charge at intersections of different layouts and fixed timing plans, but when the
grid supply is switched off, their operating times were different due to efficiency and timing
plans related load per intersection. For instance, when many preview signal heads are used at
other junctions, like four-way junctions, and the turning arrows are implemented for specific
timing plans, such junctions require more electrical energy than others.
In traffic signals control systems, many controllers are very sensitive to the power supply.
Such high sensitivity causes the intersection signals to flash red, then result in traffic
congestion. The feedback from many LED lights has been found as one of causes of the
problem.
Steps taken, by technicians and electricians, to eliminate such a problem, have always
increased considerably high load against energy saving approach. Transformers, incandescent
and halogen lamps have been installed inside controllers which could not withstand the
feedbacks from LED lights. Such devices, however, have increased load with their high
energy consumption. Therefore, such maintenance procedure is not energy efficient.
The additive load model in (5) is casually supported for quick maintenance that turns out to
be permanent, for TCU stability:
𝐿𝑙𝑎𝑏 = 𝐿𝑡 + 𝐿𝑥 (5)
where, 𝐿𝑙𝑎𝑏 is the abnormal load
𝐿𝑥 is extra load
However, (5) ignores energy efficiency initiatives at traffic signal intersections as the
alternative energy or backup storage is subjected to abnormal load and against expected
autonomy.
Figure 26 shows the discharge curves of fully charged UPSs, at different intersections,
starting at the same time.

43
Figure 26: UPSs discharge characteristics.
From Figure 26, it can be concurred with Cultura II and Salameh (2003), that the lower the
discharge time, the lower the efficiency.
Krauter (2006:64) describes battery energy efficiency as a function of discharge current. With
the aid of discharge current characteristics of lead acid battery, he shows that low efficiencies
are caused by high discharge currents. It is also a similar case, as can be analyzed from
Figure 26, of this research. The higher the load, the higher the required current and shorter
the backup time becomes.
From Table I, elimination of electrical energy double conversion is expected to add
approximately 15~30% of backup operating time per respective junction. At assessed
junctions, extra load may constitute 15~30% of maximum estimated traffic signal junction
load.
Considering traffic signals junction layout is very important, for synchronization and
reliability support modeling. If the three examined UPSs were along the same main road, one
after another, traffic signal junctions’ synchronization would be completely out, allowing for
traffic congestion, especially during peak hours.

44
3.3 Maintenance uncertainties
Current ITS systems experience a variety of maintenance uncertainties. Some of them are
listed as follows.
1. Different SCADA systems have been implemented. Depending on the manufacturer
of the traffic control system, some dashboard information does not give the true
reflection of real-time technical information received from the intersections. An
example of that is when the dashboard shows that the intersection is online, while
showing the communication networks signal strength at zero. This leaves every
information not reliable, for the synchronization does not take place between
outstations and the in-station communication systems. Such a problem leaves the
TMC with no option, but to rely on calls from motorists. This has become evident
with reference to table III, as the faults reports came from members of the public,
most of whom were motorists.
2. Some devices are of dial-up operation, which makes it difficult to receive real-time
information. The worst is that a server connected to multiple in-station devices may
have been allocated for groups of out-station devices, which causes confusion and
inefficiency in ITS monitoring and energy saving respectively. Short Message Service
(SMS) communication is used but some messages take longer to be delivered to their
destination, and such a process renders the system not helpful.
3. When power fluctuations take place, some intersections get to be reported as off,
however, maintenance personnel may find the traffic signal system in good working
condition. Sometimes, the grid power may be below the required minimum supply
voltage. Irrespective of consideration on the energy efficiency and UPS type, very
often, the strength of road ITS does not incorporate the importance of power supply
performance or runtime estimation when the primary power supply source is off.
4. Available energy capacity per intersection, with backup power, is not measured per
downtime, for maintenance priority. It makes it difficult to prioritize faulty
intersections for maintenance against set standards.

45
4. Proposed solution, modeling and configuration of energy efficient
roads ITS
4.1 Introduction of the proposed solution
There is a need to eliminate systematic faults interference through integrated and energy
efficient ITS. According to the faults and uncertainties discussed in the research, the
following strategies are proposed.
Since the length around many assessed intersections is estimated between 70 and 100 meters,
it is proposed that power distribution from the traffic controller to traffic light heads should
be of DC, in ring feed. According to Thomasnet, to reduce the risk of power supply
distortion, UPS systems are often incorporated in electrical networks. Rasmussen also
outlines different types of UPS, however, it is proposed that UPS double conversion of
electrical energy supply to traffic control systems must be eliminated.
Maximum power point tracker (MPPT) is also recommended, for photovoltaic (PV) generator
special interface measures, to ensure that there is maximum energy transfer from the
generator to the battery. It is therefore, recommended that intersections with solar systems
need charging controllers with MPPT features. This will also increase the efficiency and
autonomy of energy storage. Negative effects of utility grid instability shall also be
eliminated. Figure 27 shows the standard AC/DC and DC/DC converters concepts.

46
Grid Load
(a) AC/DC
Solar Load
(b) DC/DC
Figure 27: Standard conversion concepts.
Shiranaga and Ogawa (2012) also developed a similar model related to Figure 27(b), for their
ultra-low consumption traffic signals.
From Table 1, elimination of DC/AC transfer function can increase 10~33 % of efficiency on
currently implemented backup and alternative power supply systems. It can also be noted
~
=
Battery bank
=
=
Battery Bank
Charge
Controller

47
from Intelight’s confirmation of approximately 15% increased power efficiency on its 357
ITS v2 cabinet model that operates on 48Vdc supply.
Electrical power supply strategy for traffic signals and their remote monitoring systems can
have a negative or positive impact on energy efficiency or saving. Power source stability
modeling is important, to ensure that ITS will not encounter frequent interruptions that have
negative impact on mobility. Therefore, it is important to consider regulating the source
output power and energy storage optimization.
It is important to extract information from the intersection’s backup power systems and signal
timing plans, for performance time estimation when prioritizing energy restoration at
intersections which are running on alternative or backup power. The complexity of
processing such information needs some forms of artificial intelligence methods, such as
Fuzzy Logic (FL) and Neural Networks (NN).
Lee et al. (1992), also state that an artificial neural network (ANN) as a computing system is
made of a number of simple and highly interconnected processing elements, which processes
information by its dynamic state response to external inputs.
Such information is also important for on-road motorists’ awareness, through Advanced
Traffic Management System (ATMS).
Effective reactive maintenance needs advanced information systems, in order to eliminate
uncertainties when disseminating the message to relevant stakeholders. Different incidences
require proper prioritizing method or system for smart maintenance. Power source
performance optimisation technique is therefore required for road ITS and it must focus
efficiency optimisation, load and performance prediction, as the major factors. Intelligent
techniques are applied in optimisation of power source performance for sustainable and
efficient autonomy on traffic control systems. Different traffic signal control modes are
considered, as applicable and common in traffic engineering, in accordance with SARTSM.
The TCU and LED lights interfacing needs to be redeveloped, to eliminate compatibility
related faults. Such design must bring about reliability against feedbacks from LEDs to a
sensitive TCU.

48
Remote monitoring communication systems should also be configured in energy efficient
manner. This includes having an in-station device that accommodates all out-station devices.
Automated real-time information system configuration is important, for simultaneous
multiple monitored and controlled traffic signal junctions. Aras et al. (1994), emphasize that
in real time computing, the distinguishing feature of real-time communication is the fact that
the value of the communication depends upon the times at which messages are successfully
delivered to the recipient.
It does not help to have well developed road traffic control systems and fault detectors,
without realtime information system. Good communication network, with high QoS, is
needed in ITS. Therefore, private packet switching and synchronization configurations are
important.
4.2 Energy storage efficiency optimization
This focuses on increasing the efficiency of the battery storage. Current batteries are of 12V
nominal, however, high amount of electrical current is required to supply power of around
240W, as estimated by Coetzee et al. (2008). The higher the current drawn from the battery,
the higher the temperature will become. 12V battery configuration is not ideal.
According to Ermon et al. (2012), battery energy is partially wasted due to internal
resistance, during charging and discharging process. This is in addition to the actual delivery
capacity which depends on the discharge rate.
It is therefore recommended that 48V battery configuration should be used with reference to
the estimated length around the traffic signal junction and ring-feed configuration, as
proposed in this section of this dissertation. In addition to selected batteries operational
specifications, the 12V batteries should be configured as shown on Figure 28(a), with further
configuration of such series connected segments, in parallel as shown on Figure 28(b), to
promote current division amongst current exit battery terminals. In general, the use of
multiple-battery configuration should be used.

49
- 48Vdc + (a) Batteries in series connection
48Vdc
(b) Batteries in parallel connection
Figure 28: Multiple-battery configuration.
The basic principle is that total supplied current from Figure 28(b) is the sum of series
connected segments, as shown by formula (10).

50
𝐼𝑐 = 𝐼𝑠𝑠1 + 𝐼𝑠𝑠2 + ⋯ + 𝐼𝑠𝑠𝑛 (10)
where, 𝐼𝑠𝑠 is series segment current
As useful as the battery monitoring system is, during charging process, it is also important to
monitor the battery when it takes over from the main source. This is to ensure that battery
bank is not negatively affected by unlimited discharge process. It is advisable to discharge 80
to 90 percent of the battery, leaving 10 to 20 percent remaining before the next charging
process, to sustain the lifespan of the battery bank.
As opposed to the implementation of any of the systems concepts shown on Figure 9 and 10,
of this dissertation, the basic concept shown on Figure 27 is the most relevant in increasing
the efficiency of the backup power supply system. The aim is to get the battery bank stored
energy supplied to the load, with minimal losses incurred. The confirmation in section 3, of
addition in efficiency shows that the total system efficiency can reach 99%. Therefore,
efficiency model should be worked out as follows:
ɳ =𝑃𝑜𝑢𝑡
𝑆𝑂𝐶 (11)
where 𝑃𝑜𝑢𝑡 is the battery bank output power
High energy losses should be minimal, when the battery bank discharges current to the load.
This can be attained by using DC energy saving devices. This should include the thickness of
power distribution cables. Electronic regulation should be of ultra-low power dissipation.
4.3 Road ITS Electrical Power Source Performance Estimation Technique
Operation of road traffic signals and their monitoring systems is obviously very dependent on
the availability of electrical energy. The use of backup power supply systems on road ITS
also needs supply time estimation technique, in order to prioritise traffic signal junctions, to
prevent possible traffic congestion.
In case of traffic signals reactive maintenance in a place like CoJ, related ITS must be able to
give highly reliable projected performance of backup power systems with reference to traffic

51
signal timing plan per junction. The following is the block diagram of connected properties of
integrated road ITS.
Output
Figure 29: Integrated road ITS connected properties.
From Figure 29, it can be deduced that assessment is done based on three data sources, being
signal timing plan, ITS power ratings and battery bank data. The grid supply status serves as
the backup performance prediction trigger.
It is assumed that the power consumption ratings of traffic signal LED lights and other parts
of ITS, are obtained from manufacturers. The prediction principle is based on the basic
algorithm, as shown in Figure 30:
Signal Timing
Plan
Battery Bank
Data
Load & Battery
Runtime
Estimation ITS Power
ratings

52
Figure 30: Battery performance or runtime estimation algorithm.
The battery temperature is indirectly considered as it nonlinearly affects the changes of SOC
of the battery, thereby causing nonlinearity of the process.
4.3.1 Battery State-of-Charge Estimation
This research concurs with Feng et al. (2013) that the charge build-up in the battery results in
the increase in terminal voltage or electrical force. It can also be stated that a loss of charge
from the battery results in the decrease in battery’s electrical force. In other words, when the
battery is discharged, the terminal voltage drops Sato et al. (2002). Terminal voltage does not
exactly determine the state of charge, without considering the amount of current stored.
Therefore, is it proposed that the available voltage should be considered as a factor of
AC/DC or DC/DC charger
Off/Low
Battery SOC
Signal Timing
Plan
ITS Load
Ratings
Load
Estimation
Performance
Estimation

53
determination of SOC, with reference to maximum stored current as counted. Voltage
inference coulomb counting (VICC) method is used as it takes into account, other effects, like
temperature without thorough temperature measurements.
SOC is therefore defined by (12) below.
𝑆𝑂𝐶 = 𝑄𝑟 (𝑉𝑟−𝑉𝑐𝑜
𝑉𝑓𝑟−𝑉𝑐𝑜 ) (12)
where,
𝑄𝑟 is the remaining charge
𝑉𝑟 is the remaining battery voltage
𝑉𝑐𝑜 is the cut-off voltage
𝑉𝑓𝑟 is the full reference battery voltage
and
𝑄 = 𝐼𝑡 (13)
for
Q is the charge
I is the charge current
t is time
From (12), it can be deduced that the remaining charge is coulomb counting based,
elaborated by (14):
𝑄𝑟 = 𝑄𝑓𝑟 + 𝑄𝑎𝑑𝑑 − 𝑄𝑑 (14)
where
𝑄𝑓𝑟 is full reference charge
𝑄𝑎𝑑𝑑 is added charge
𝑄𝑑 is the discharged capacity
SoC and other charges (Q) are expressed in Ampere hour (Ah). From (13), time should be
counted in seconds. It is proper to do so to accommodate frequent charge and discharge as
they probably take place over different periods of time. The remaining battery charge is
fundamentally considered for an hour of delivery.

54
When new fully charged battery is used for the first time, the assumption is that the available
charge is equal to the full reference charge, based on the rated capacity. Therefore, (12) gives
the correct estimating technique and assurance.
In addition, it can also be deduced that the true storage capacity or state of health (SOH) of
the battery can be expressed as the ratio between full reference charge and rated full charge
capacity. The formula below elaborates:
𝑆𝑂𝐻 = (𝑄𝑓𝑟
𝑄𝑟𝑎𝑡𝑒𝑑) ∗ 100% (15)
(15) is also related to the state-of-health (SOH) expression presented by Williard et al.
(2001). Therefore, it can be used to determine the quality of the battery. Figure 31 below is
the basic battery measurement setup.
Figure 31: Basic battery measurement setup
Another schematic measurement setup done by Leksono et al. (2013) can be used with focus
on 48V battery bank constructed for traffic signals.
4.3.2 Load Prediction
From Figure 30, it is deduced that load estimation is dependent on battery state of charge, as
point of reference. This gives a limitation in the data correlation, especially in fixed traffic
signal timing plan, which is the case with reference to CoJ. Therefore, the estimated load
consumption at nominal voltage should be equivalent to the battery state of charge.
Battery
Load
I ,V, t
measuring
system
DC regulator/
Charger

55
The additive model is then used to sum up the equivalent load, linked to the signal timing
plan and with reference to the nominal battery voltage. In this research, 48Vdc is considered
as nominal battery voltage. Of course, there are phases to be considered for fixed timing plan,
which is an important aspect of this research as applicable as it is in the CoJ.
It should be noted though, that the stored battery energy can be finished before a phase or
cycle gets completed. Therefore, the stage load must be taken into consideration for the
additive calculations to yield well estimated load. The formula to be used is as follows:
𝐿𝑡 = 𝐶𝑙 ∗ 𝐶𝑐 (16)
where,
𝐶𝑙 = 𝐿𝑡𝑐𝑢 ∗ 𝐶𝑡 + 𝑛𝑝𝑡𝑝𝐿𝑝 + 𝑛𝑆𝐿𝑆𝐿𝑛 (17)
and
𝑆𝐿 = 𝑛3𝑡3𝐿3 + 𝑛𝑡𝑢𝑟𝑛𝑡𝑡𝑢𝑟𝑛𝐿𝑡𝑢𝑟𝑛 (18)
where,
SL is signal light load
Lt is total load
Ltcu is TCU load
Lp is pedestrian head load
Ct is cycle time in seconds
Cl is cycle load in Ah
𝐶 𝑐 is cycle count
𝐿3 is 3-light head load
Lturn is turning light load
n is quantity of the specific light head
t is time for specific light head
It should be noted that SL can be an L3 or L5, depending on the combination.

56
4.3.3 Battery Runtime Prediction
This is the method of estimating battery runtime against the estimated or projected load at
battery nominal voltage. Obviously, the dependence between the two aspects is the main
factor to be considered. The linearity and non-linearity of inputs as products and sums of
other inputs definitely require some intelligence techniques to compute the battery runtime,
with reference to (12, 13, 14, 16, 17, and 18). It can be deduced in this case that a
multiplicative model has to be applied to predict the battery runtime. Therefore, the following
formula should be used for computation:
𝑇𝑡 = 𝐾𝑡 ∗ 𝑆𝑂𝐶 ∗ 𝐶𝑡 ∗ 𝐶𝑙−1 ℎ𝑟 (19)
where, time constant, 𝐾𝑡 = 2.7778 ∗ 10−4ℎ𝑠−1
and 𝑇𝑡 is the runtime
4.4 TCU and LED Lights Compatibility
It is important for the TCU to operate effectively without feedback from LED lights. It still
cannot be assumed that the use of battery solves compatibility problems. DC power
distribution takes place through lamp drive cards embedded or flexibly mounted in the TCU.
Therefore, some biasing is required to ensure robustness in traffic signal control.
DC lamp drive cards will need additional biased switching in control of current to and from
the TCU and LED light, respectively. The basic circuitry may look like Figure 32.
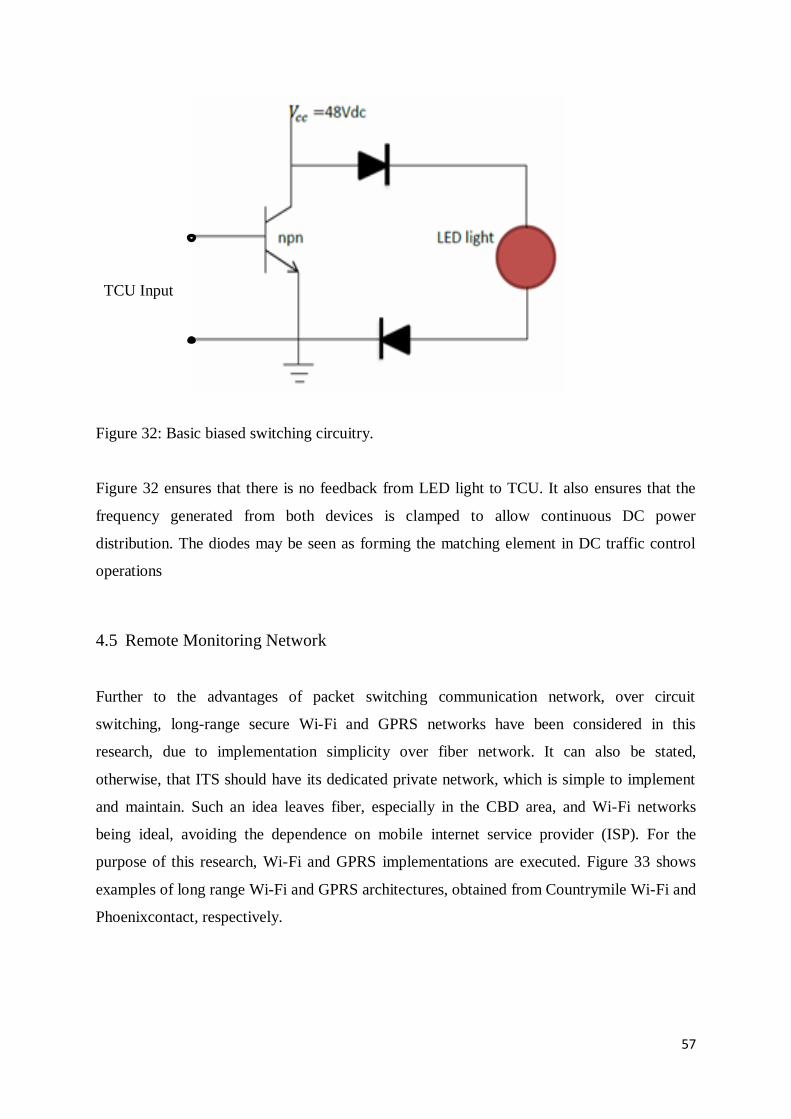
57
Figure 32: Basic biased switching circuitry.
Figure 32 ensures that there is no feedback from LED light to TCU. It also ensures that the
frequency generated from both devices is clamped to allow continuous DC power
distribution. The diodes may be seen as forming the matching element in DC traffic control
operations
4.5 Remote Monitoring Network
Further to the advantages of packet switching communication network, over circuit
switching, long-range secure Wi-Fi and GPRS networks have been considered in this
research, due to implementation simplicity over fiber network. It can also be stated,
otherwise, that ITS should have its dedicated private network, which is simple to implement
and maintain. Such an idea leaves fiber, especially in the CBD area, and Wi-Fi networks
being ideal, avoiding the dependence on mobile internet service provider (ISP). For the
purpose of this research, Wi-Fi and GPRS implementations are executed. Figure 33 shows
examples of long range Wi-Fi and GPRS architectures, obtained from Countrymile Wi-Fi and
Phoenixcontact, respectively.
TCU Input

58
(a) Wi-Fi
(b) GPRS
Figure 33: Communication network architectures.
59
From Figure 33(a), the Wi-Fi network is boosted for long range connectivity, with point-to-
point antennae. In addition, the internet line can be used when automated SMSs are to be sent
to the dedicated mobile phones. On the other hand, from Figure 33(b), virtual static internet
protocol (VSIP) is set up for GPRS network.
4.6 Conclusion
Road ITS challenges continue to show that there is a need for further improvement than just
traffic signal and traditional maintenance culture. Nowadays drivers have high expectations
about traffic signals operations, as opposed to Mannering et al. (2009:228), who stated that
from a driver’s perspective, a traffic signal is just a collection of light emitting devices
[usually incandescent bulbs or light-emitting diodes (LEDs)] and lenses that are housed in
cases of various configurations (referred to as heads) whose purpose is to display red, yellow
and green full circles and/or arrows.
The following are also key, in this research:
1. Energy efficiency modeling is proposed to increase system reliability for road traffic
mobility. Intersection optimization technique by using traffic signals should consider
such models important, for sustainability and elimination of maintenance
uncertainties. Double energy conversion and addition of abnormal loads decrease the
expected autonomy of backup power storage, and this research discourages such
methods.
2. Junction layout should be considered during load planning and estimation.
3. The complexity of extracting and disseminating advanced road transport related
information calls for application of artificial intelligence methods.
4. The need for automated simultaneous multiple traffic junction real-time monitoring
and control calls for real-time data communication for effective reactive maintenance.

60
5. Implementation and analysis of energy efficient roads ITS
5.1 Introduction
Data collection was done on selected battery bank, and traffic signal timing plan.
MATLAB/Simulink has been used to get the estimated battery SOC, traffic signal equivalent
load and battery runtime, for DC operated traffic signal. The stage movement plan is used for
clarity based on the sample intersection layout, designed according to SARTSM. The stage
movement represents the traffic signal operational sequence that controls vehicle movements
at a junction.
Tru-Traffic software has been used in assessing the reliability of roads network, in terms of
traffic flow efficiency.
Different sites have been selected for communication network pilot project. Wi-Fi and GPRS
networks have been tested to compare the operation of circuit and packet switching networks.
5.2 Information collection
Figures 35, 36 and 37 together with table IV and V show how the signals system at Figure 34
will operate. It can be seen from Figure 34, where traffic signal heads are identified as S1 and
S8, where
S1 is 3-light head, and
S8 is 5-light head (of right turning)
Figure 35 shows cycle stages as P1 and P2 representing pedestrian lights on their specific
roadsides. V1A is vehicle one-way. V2A, V2B represent vehicles in opposite directions.

61
Figure 34: Sample junction layout.
Figure 35: Stage movements plan.

62
Table IV: AM & PM peak cycle timetable
Sta
ge
Sta
rt
Gr
Fre
d
FlG
r
Ext
Yel
AR
Tota
l
V1A 0 45 3 2 50
V2A 50 35 3 2 40
V2ART 50 8 3 2 13
V2B 63 22 3 2 27
P1 0 7 10 17
P2 63 7 15 22
Cycle 90
AM period Week days: 06:00-09:00 Weeked: 06:00-09:00
PM time Week days: 15:00-19:00 Weekend: 15:00-19:00
Figure 36: AM & PM fixed timing plan.

63
Table V: Off-peak cycle timetable
Sta
ge
Sta
rt
Gr
Fre
d
FlG
r
Ext
Yel
AR
Tota
l
V1A 0 30 3 2 35
V2A 35 30 3 2 35
V2ART 35 6 3 2 11
V2B 46 19 3 2 24
P1 0 7 10 17
P2 46 4 15 19
Cycle 70
Off peak
time
Weekday: 09:00 - 15:00, 19:00 - 24:00, 00:00 - 06:00
Saturdays & Sundays: 00:00-24:00
Figure 37: Off-peak fixed timing plan.

64
From the cycle timetables and timing plans, signal times are explained as follows:
Gr is green time
FRed is flashing red time
FlGr is flashing green time
Yel is yellow time
AR is all red time
Table VI below shows weight data per cycle, for system training, to estimate the equivalent
load in Watt-hour (Wh), against battery state-of-charge. The variables’ times converted to
hours and their quantities are used to derive the weight data, with reference to (17) and (18).
Table VI: Traffic control cycle weight data comparison
I
np
ut
Cycle
70 seconds
90 seconds
Ltcu 0.019 0.025
L3 0.233 0.300
Lp 0.156 0.200
Lturn 0.009 0.011
Therefore, the cycle loads training expression for the selected junction can be written as
follows:
For the case of 70sec cycle:
𝐶𝑙 = 0.0019𝐿𝑡𝑐𝑢 + 0.233𝐿3 + 0.156𝐿𝑝+ 0.009𝐿𝑡𝑢𝑟𝑛
For the case of 90sec cycle:
𝐶𝑙 = 0.025𝐿𝑡𝑐𝑢 + 0.3𝐿3 + 0.2𝐿𝑝+ 0.011𝐿𝑡𝑢𝑟𝑛

65
5.3 Battery SOC and Runtime Estimation
Tables VII and VIII show the data collected on used and randomly selected battery bank. The
expected charge is based on the percentage of the charge capacity rating. A Discharge-
Charge-Discharge (D-C-D) process has been conducted on the used 48V battery bank, to
get 𝑄𝑓𝑟 on Table V. 𝑄𝑓𝑟 and 𝑄𝑎𝑑𝑑 are respective cumulative values before the next full
charge cycle.
Table VII: 48V battery data
Percentage (%) Voltage (V) Expected Charge (Ah)
100 51.13 102 (rated)
90 50.06 91.8
80 50.11 81.6
70 49.60 71.4
60 49.09 61.2
50 48.59 51
40 48.08 40.8
30 47.57 30.6
20 47.06 20.4
10 46.55 10.2
0 46.04 0
Table VIII: Battery charge cycle data
Measurement Result
Floating Voltage 54.5V
𝑄𝑓𝑟 95Ah
𝑄𝑑@ 5.6A 57.6Ah
𝑄𝑎𝑑𝑑@ 10A 54Ah
𝑉𝑟 49.65V
𝑉𝑓𝑟 51.13
𝑉𝑐𝑜 46.04

66
From (14),
𝑄𝑟 = 95 + 54 − 57.6 = 91.4𝐴ℎ
However, from (12),
𝑆𝑂𝐶 =91.4(49.65 − 46.04)
51.13 − 46.04= 64.82𝐴ℎ
Figure 38 shows the estimated and actual runtime and curves from MATLAB/Simulink, at
off-peak and peak periods, from 10:00 and 15:00 respectively. TCU and LED light module
consumptions ratings used are 65W and 10W respectively, as the variable input values. A
decrease in input variable power ratings, depending on the manufacturer’s product power
rating, will increase the battery runtime, thereby increasing the efficiency of the battery bank.
It should also be noted that the estimated runtime determines the reliability factor about the
battery bank charge, when the primary energy source is off.

67
(a) Without reserved capacity
(b) With 10% capacity reserved
Figure 38: Remaining 64.82Ah runtime.
0 2 4 6 8 10 12 140
10
20
30
40
50
60
70
Time (hours)
Rem
ain
ing C
harg
e (
Ah)
Peak and Offpeak Runtimes
EstimatedOFFPEAK
ActualOFFPEAK
EstimatedPEAK
ActualPEAK
0 2 4 6 8 10 12 146.5
10
20
30
40
50
60
70
Time (hours)
Rem
ain
ing C
harg
e (
Ah)
Peak and Offpeak Runtimes (10% reserved charge)
EstimatedOFFPEAK
ActualOFFPEAK
EstimatedPEAK
ActualPEAK

68
From Figure 38, it can be noticed that the traffic control system consumes more energy in
peak than off-peak periods. The timing plans dictate the consumption variables and the
training data thereof.
The estimated runtime is projected on the basis of the consumption variables of the period of
estimation, against the available battery charge of 64.82Ah. The actual runtime is based on
the true consumption, during both periods and the times of experiment.
5.4 Communication network
In a city like CoJ, it is important to have high sites for Wi-Fi implementation, which should
accommodate base transceiver station (BTS). This is to avoid signal obstruction of multiple
connected sites. One can also refer to the city of Boulder, Colorado, like Kotwal et al. (2013),
on replacing its T1 phone lines with private wireless technology that allows coordination of
traffic signals from a central location, for the benefits of this new technology are remote
signal monitoring, increased coverage areas and reduced cost of operations and maintenance.
Apart from reliability of communication between system components, the weaknesses of
wireless control include limited transmission distance and bandwidth. Therefore, in addition
to Figure 33(a) as it is, the setup should resemble the block diagram in Figure 39, with one in-
station device connected to multiple junction outstations.
Figure 39: CoJ applicable Wi-Fi setup block diagram.

69
The general idea of real time information transmission in ITS revolves around continuous
connectivity with good network response time, with sufficient bandwidth. Appendix A shows
some results of scanned Wi-Fi frequencies, with 5755MHz and 5845MHz as the frequency of
operation for the tested communication networks.
5.5 Road network reliability assessment
The assessment involves scenarios around impact of ITS components and traffic signal
coordination. The components considered are: electrical power and communication network.
Traffic signal coordination gives assurance to both TMC and the public, in terms of road
mobility.
The assurance on ITS to the TMC is given through SCADA system. From all system tests
conducted, the information obtained on SCADA system, from the traffic signal junction, can
be considered when both power and communication systems are functioning effectively.
When one system becomes unreliable, the whole ITS cannot be reliable to the TMC. Table
VI has been developed in the process of component assessment at the traffic signal junction
Table IX: ITS component assessment on SCADA
Fundamental components
Output group Power Communication
system
Reliability
0 OFF OFF Not reliable
1 OFF ON Not reliable
2 ON OFF Not reliable
3 ON ON Reliable
Consecutive intersections have been selected from Booysens road, as one of the arterial
routes in the CoJ, for signals coordination simulation. The peak signal plan data in Table X
has been used when dealing with synchronization. The Tru-Traffic software has been used for

70
simulation. The aim is to show the impact of well synchronized and interrupted road network.
Figure 40 and 41 show the road network on the map and simulation results respectively.
Table X below shows the collected data about each junction. The green time data has been
extracted from the latest versions of signal timing plans.
Table X: Booysens road network junctions data
Street name (from
reference)
Distance from
previous street
(meters)
Speed limit
(km/h)
Arterial Green time (Seconds),
At 90secods cycle time
No. of lanes (per
direction)
North South
Klip river str. 0 60 54 44 3
Heronmere str. 350 60 40 31 3
Hilliard str. 550 60 40 40 3
Mewett str. 270 60 47 58 3
John str. 600 60 57 41 3
Webber str. 450 60 54 54 3
Trump str. 200 60 43 52 3
M1 north 130 60 45 55 3
Figure 40: A map showing Booysens road and its selected junctions

71
(a) Booysens road traffic flow with junctions’ traffic signals not working at Hilliard and
John streets
(b) Booysens road fine-tuned synchronized road network functioning well with effective
dc power systems
Klipriver dr
Heronmere rd
Hilliard Street
Mewett Street
John Street
Webber
Trump
M1 North
90 sec ®Thu. 10/1/2015 11:33 AM NorthBooysens Rd
54 sec
54 sec
11 sec
44 sec
24.1 mph®
44 sec
51s®
27s¬ 40 sec
27s¬ 40 sec
51s®
31 sec
49 sec
51s®
31 sec
51s®
5 sec
40 sec37s¬
40 sec37s¬
47 sec
55s¬
40 sec37s®
47 sec
55s¬
40 sec37s®
24.9 mph® 58 sec
57 sec
44s® 58 sec
20 sec
38s¬
57 sec
38s¬
57 sec
41 sec
54s®
41 sec
54s®
54 sec
57 sec
24.9 mph¬
54 sec
52s¬
54 sec50s® 43 sec
52s¬
63 sec
54 sec50s®
43 sec
52s¬
45 sec
24.1 mph¬ 40s®
52 sec
58 sec
45 sec
52s¬40s® 52 sec
55 sec
55 sec
Klipriver dr
Heronmere rd
Hilliard Street
Mewett Street
John Street
Webber
Trump
M1 North
90 sec ®Thu. 10/1/2015 11:37 AM NorthBooysens Rd
54 sec
54 sec
11 sec
44 sec
24.1 mph®
44 sec
51s®
40 sec
52s¬
40 sec
52s¬
51s®
31 sec
49 sec
51s®
31 sec
51s®
52s¬5 sec
40 sec
52s¬
40 sec
52s¬
47 sec
52s¬51s®
40 sec
47 sec
52s¬51s®
40 sec
24.9 mph®
58 sec
57 sec
51s®
58 sec
51s®
52s¬20 sec
57 sec
52s¬
57 sec
52s¬
51s®
41 sec
51s®
41 sec
54 sec
57 sec
24.9 mph¬
54 sec
52s¬
51s®
54 sec 43 sec
52s¬
63 sec
51s®
54 sec 43 sec
52s¬
51s®
45 sec51s®
24.1 mph¬
52 sec
58 sec
45 sec51s®
52s¬ 52 sec
55 sec
55 sec
Figure 41: Booysens road traffic flow

72
From Figure 41(a), Booysens junctions at Hilliard and John streets traffic signals are not
working, due to systematic faults. Such interruption is causing road network inefficiencies in
terms of mobility, with reference to Klip river as the point of departure, by causing delays at
other junctions too.
Depending on the vehicle queue length and occupancy per lane per direction, some vehicles
may also end up stopping at functional junctions, due to delays, thereby moving from
synchronization. The same Figure 41(a) shows the same traffic flow being affected at the
junction of Mewett street and other subsequent junctions in north and south directions,
respectively. In addition, systematic faults along different routes can contribute towards
mobility inefficiencies, even where systems are working
.
Figure 41(b) shows simulation results of the seamless and well synchronized road network
that operates according to traffic signal plan and synchronization settings. The results are
dependent on the effective and efficient power supply systems modeling and configuration,
as shown in section 4 of this dissertation.
Reliability of communication network is based on the connectivity and response speed. Wi-Fi
network test results are shown in Figure 42 to 45. GPRS results are shown in Figure 46 and
47.

73
Figure 42: Wi-Fi with 1-3ms response time

74
Figure 43: Wi-Fi with 5-10ms response time

75
Figure 44: Wi-Fi with 6-7ms response time

76
Figure 45: Wi-Fi with 12-40ms response time

77
Figure 46: GPRS with 559-1449ms response time

78
Figure 47: GPRS with 525 - 1673ms response time

79
5.6 Results analysis
DC power distribution fulfills the elimination the effects of grid power instability, towards
road ITS. In addition, only AC/DC power conversion takes place, where the main source is
from the utility grid. When the main source is off, the battery bank automatically becomes the
source of energy, without instabilities. This ensures optimum usage of stored energy, as no
further DC/AC conversion has to take place, for it could lead to high current drawn, resulting
in increase in temperature. The high temperature would be a sign that some stored energy is
getting lost than used, in the process.
With reference to Table I and the experiments conducted, when using AC power distribution,
with battery cutoff level at 10%, 60% of stored energy would be available on ideal line-
interactive UPS of 67~70% efficiency. Therefore, 20% cutoff level would reduce to 54%,
meaning that almost 50% goes to reserved and wasted energy collectively. It is noticed that
DC implementation improves on systems compatibility as feedbacks are eliminated, which
also eliminates the use of abnormal loads. This eventually reduces the cost of electrical
energy supply and systems maintenance thereof.
Elimination of double conversion, therefore, leads to the elimination of DC/AC inverters.
This subsequently relates to the reduction of systems costs per junction. With reference to
Table I, pure sine wave inverters are highly expensive, compared to other parts of the backup
systems. An estimated minimum cost of 40% of UPS, for example, goes to the inverter.
Therefore, the implementation of the proposed power supply solution will save 40% of
capital cost and the subsequent cost of maintenance or replacement, while improving the ITS
reliability.
From SOC derived from Table V, in comparison with Table IV data, about 7% of battery
rated storage quality or capacity is lost. The losses incurred during adaptive cumulative
charge and discharge processes before the next full charge cycle, also have an effect on the
battery SOC, resulting in 10.4% missing against the expected battery charge level. This may
be caused by battery age or previous severe usage. Therefore, Voltage inference coulomb
counting ensures accuracy by indirectly incorporating dynamic effects. Of course the battery

80
configuration also helps in eliminating other factors like high temperature as it helps in
maintaining operational conditions.
As part of the SCADA system development, the integration with SOC assessment
functionality will improve in extracting real-time information. It will improve in ITS
maintenance decisions, with more assurance on information reliability. Figure 38 shows the
close relationship between the estimated and actual battery runtimes, with the difference
caused by changes in traffic signal time plan cycles. Surely, this is also dependent on the
packet switching network implementation, as recommended in this research.
In addition to primary power source off-trigger, timing plan cycles also trigger and give
training data for estimations. Therefore, AM-, PM- and OFF-Peak timing plans functionality
triggers continuous SOC assessment, which further considers dynamic effects on accurate
performance estimation. This can improve the accuracy of battery bank reliability
assessment, periodically and daily.
From the communication network test results in figure 42 to 47, it can be deduced that packet
switching brings simplicity in monitoring network connectivity. Wi-Fi shows good response
time over GPRS, which is good for real-time information systems. This is probably because
GPRS connectivity goes through internet Service Provider (ISP) link, whereas secure Wi-Fi
connectivity belongs to JRA, with limited traffic as compared to ISP infrastructure.
.
The assessment of Wi-Fi network implementation has shown cost effectiveness, in the sense
that there is no continuous rental cost associated with it, as ownership is with JRA.
Ownership is better, for the network does not get shared with other parties, as it happens with
ISPs. This helps in reducing the risk of not getting ITS functionality information, which can
also put the lives of motorists and pedestrians in danger.

81
6. Conclusions and Future research
6.1 Conclusion
DC power distribution is the way to go in the CoJ, to eliminate systematic faults and
maintenance uncertainties at traffic signal junctions. The effects of utility grid and backup
systems inefficiencies can also be eliminated, with almost 100% of stored energy available.
With reference to experiential analysis, it can be concluded that 86% of persistent faults can
be eliminated. It can further be concluded that the related maintenance cost thereof, will be
eliminated.
Voltage inference coulomb counting perfectly determines the true battery SOC. It indirectly
incorporates all dynamic factors that affect charge level accuracy. The models applied in this
research can serve well in traffic signal load and operational runtime estimations. Traffic
signal control software should include the integration of backup power supply performance
application. This will contribute towards increasing certainty level to the TMC and in
maintenance decisions.
Private packet switched network should be used to monitor and control all parts of road ITS.
This ensures continuous ownership and maintenance independence from ISPs and cost
reduction thereof. The assurance in real-time information also depends in such a
complementary element of ITS. This can support reactive and preventative maintenance
planning, effectively.
The implementation of DC systems should see the amendment of SARTSM section 25, to
make sure that qualified Electronic Engineering Technicians take maintenance
responsibilities of advanced ITS.
6.2 Future research
Future work can be done to improve the quality of traffic signal load prediction training data.
The data should be dependent on the true and adaptive power consumption data collected per
connected LED light module.

82
Since there has always been an interest in reducing power consumption, it will also be
important to determine the true consumed energy, for the purpose of avoiding unstructured
cost estimation. A hint can be given on the fact that some LED signal heads may be burnt,
though others are working. Some LEDs of a module may be burnt too, while the module is
deemed working. It can therefore be argued that the cost of consumed electrical energy
cannot be the same, every month, but should be below the maximum expected cost.
Therefore, it is important to have accurate power consumption measuring method or
technique.
The same improvements can also help in fault detection per individual module, while
bringing more assurance to the maintenance team. From this research, it can be deduced that
ITS functionality improvement, attached to maintenance cost reduction, is possible at very
low cost, as part of systems maintenance.

83
List of references
1. City of Johannesburg. 29 September 2011. Joburg chooses solar power.
http://www.joburg.org.za/index.php?option=com_content&view=artice&id=7238:joburg-
chooses-solar power&catid=131:transport&Itemid=213
2. Louis Pieterse, Alexander Ebert and Paul Ryan. ´Asset Management at City Power
Johannesburg Enabled by ICT”. 22nd International Conference on Electricity Distribution.
June 2013. pp. 1-4.
3. South African Road Traffic Sign Manual. April 2001. 3rd Edition. Traffic Signal
Design. Volume 3.
4. Ned Mohan, Tore M. Undeland & William P. Robbins. 2003. Power Electronics.
Converters, Applications and Design. John Wiley & Sons, Inc.
5. A.B. Cultura II and Z.M. Salameh. 2008. “Performance Evaluation of a Supercapacitor
Module for Energy Storage Applications”. IEEE Power and Energy Society Meeting. pp.
1-7.
6. Stefan Krauter. 2006. “Solar Electric Power Generation. Photovoltaic Energy Systems”.
The Netherlands: Springer.
7. Types of Uninterruptable Power Supply (UPS) Systems. [Online]. Available at:
http://www.thomasnet.com/articles/electrical-power-generation/ups-system-types
8. Neil Rasmussen. The Different Types of UPS Systems. White peper 1, Revision 6. 2010.
[Online]. Pp. 1-10. Available at: http://m.softchoice.com/files/pdf/brands/apc/SADE-
5TNM3Y_R6_EN.pdf
9. Hideaki Shiranaga and Shouhei Ogawa. “Development of ultra-low power consumption
traffic signals with magnetic inversion method”. 2012 ITSAP. pp. 1-8

84
10. Intelight. Intelight Cabinet Model 357 ITS v2.
http://intelight-its.com/product/cabinets/item/98-intelight-cabinet-model-357-its-v2.html
11. K.Y Lee, Y.T. Cha and J.H. Park. February 1992. “Short-term load forecasting using
an artificial neural network”. Transaction on Power Systems. Vol. 7, No. 1, pp. 124 –
132
12. Caglan M. Aras, James J. Kurose, Douglas S. Reeves and Henning Schulzrinne. January
1994. “Real-time communication in packet-switched networks. Proceedings of IEEE”.
Vol. 82, No. 1, pp. 122 – 139
13. Fred L. Mannering, Scott S. Washburn & Walter P. Kilareski. 2009. “Principle of
Highway Engineering and Traffic Analysis”. Fourth edition. USA: John Wiley & Sons,
Inc.
14. Intelligent transportation systems. [Online]. Available at:
http://en.wikipedia.org/wiki/Intelligent_transportation_system
15. Intelligent Traffic Management Systems. [Online]. Available at:
http://edgeict.com/Intelligent%20Traffic%20Management%20Systems.html
16. Renjian Feng, Shuai Zhao & Xiaodong Lu. 2013. “On-Line Estimation of Dynamic State-
of-Charge for Lead Acid Battery Based on Fuzzy Logic”. 2nd International Conference of
Measurement, Information and Control. pp. 447-451.
17. Kesheng Wang. 2005. ‘Applied computational intelligence in intelligent manufacturing
systems’. Adelaide, S.A.
18. Michael Negnevitsky. 3rd Edition. 2011. ‘Artificial intelligence: a guide to intelligent
systems’. Harlow, England. Addison Wesley / Pearson.
19. Abe Shigeo. 1997. “Neural networks and fuzzy systems : theory and applications”
Boston : Kluwer Academic.

85
20. Mohamed Mohamoud Ismail & M.A. Moustafa Hassan. 2013. “The state of Charge
Estimation for Rechargeable Batteries Based on Artificial neural network techniques”.
IEEE Control, decision and Information technologies (CoDIT). pp. 733-739.
21. C.H. Cai, D. Du & Z.Y. Liu. 2003. “Battery State-of-Charge Estimation Using Adaptive
Neuro-Fuzzy Inference System (ANFIS)”. The IEEE International Conference on Fuzzy
Systems. Vol. 2. pp. 1068-1073.
22. W.X. Shen, C.C. Chan, E.W.C. Lo & K.T. Chau. June 2002. “Adaptive Neuro-Fuzzy
Modeling of Battery Residual Capacity for Electric Vehicles”. IEEE Transactions on
Industrial Electronics. Vol. 49. No. 3. pp. 677-684.
23. Douglas Davey & Darryll Thomas. July 2000. “A Review of Selected South African
Urban traffic Control Systems”. South African Transport Conference.
24. I.N. Askerzade & Mustafa Mahmood. April 2010. “Control the Extension Time of Traffic
Light in Single Junction by Using Fuzzy Logic”. International Journal of Electrical &
computer Sciences. Vol. 10. No. 2. pp. 48-55.
25. H.S. Goliya & Nitin Kimar Jain. 2012. “Synchronization of Traffic Signals. “A Case
Study – Eastern Ring Road, Indore””. International Journal of Advanced Technology in
Civil Engineering. Vol, 1. Issue 2. pp. 47-52.
26. City of Irvine. Traffic Signal Synchronization. [online]. Available at:
http://www.cityofirvine.org/signal-operations-maintenance/traffic-signal-synchronization
27. Dr. Tom V. Mathew. August 2014. Transportation Systems Engineering: Vehicle
Actuated Signals. Indian Institute of Technology Bombay. pp. 39.1-39.19. Available at:
http://www.civil.iitb.ac.in/tvm/1111_nptel/576_VAS/fancy.pdf
28. Carroll J. Messer & Ramanan V. Mageswara. August 1996. “Improved Traffic Signal
Coordination Strategies for Actuated Control”. Southwest Region University

86
Transportation Center. Available at:
http://library.ctr.utexas.edu/digitized/SWUTC/465110-1.pdf
29. J. Duncan Glover & S. Mulukutla Sarma. 2002. 3rd Edition. “Power system analysis and
design”. Pacific Grove, California.
30. Tomas Markvart. 1994. “Solar Electricity”. England: John Wiley & Sons Ltd.
31. Wikipedia. Ring Circuit. Available at: http://en.wikipedia.org/wiki/Ring_circuit
32. Rafal Weron. 2006. “Modeling and forecasting electricity load and prices”. A Statistical
Approach. England: John Wiley & Sons Ltd.
33. Hong Chen, Claudio A. Canizares and Ajit Singh. 2001. “ANN-based Short-Term Load
Forecasting in Electricity Markets”. IEEE Power Engineering Society Winter Meeting.
[Online]. Vol. 2. pp. 411-415.
34. Martin Coleman, Chi Kwan Lee, Chunbo Zhu, William Gerard Hurley. October 2007.
“State-of-charge Determination From EMF Voltage Estimation: Using Impedance,
Terminal Voltage and Current for Lead-Acid and lithium-Ion Batteries”. IEEE
transactions on Industrial Electronics, vol 54, no. 5, pp. 2550-2557.
35. Shinya Sato & Atsuo Kawamura. 2002. “A New Estimation Method of State of Charge
using Terminal Voltage and Internal Resistance for Lead Acid Battery”. Power
Conversion Conference. pp. 565-570.
36. Nick Williard, Wei He, Michael Osterman & Michael Pecht. “Improved SOH Estimation
through Coulomb Counting”. Center for Advanced Life Cycle Engineering. University of
Maryland. 2001. pp. 1-11.
37. Edi Leksono, Irsyad Nashirul Haq, Muhammad Iqbal, FX Nugroho Soelami & IGN
Merthayasa. 2013. “State of Charge (SoC) Estimation on LiFePO4 Battery Module Using
Coulomb Counting Methods with Modified Peukert”. Joint International Conference on

87
Rural Information & Communication Technology and Electric-Vehicle Technology (rICT
& ICeV-T). pp. 1-4.
38. Cisco Press Publications. “Cisco CCIE Fundamentals: Network Design and Case
Studies”. Available at: http://www.cisco.com/cpress/cc/td/cpress/ccie/ndcs/index.htm
39. Mehdi Modarressi, Hamid Sarbazi-Azad & Mohammad Arjomand. 2009. “A Hybrid
Packet-Circuit Switched On-Chip Network Based on SDM”. Design, Automation & Test
in Europe Conference & Exhibition. pp. 566-569.
40. R.W.l. Cheung, P.C.K. Liu & M.S. Demokan. 1993. “The Advanctages of Packet
Switching Communication Network in Power Supply Industry”. IEEE 2nd International
Conference on Advances in Power System Control, Operations and Management. Vol. 1.
pp. 257-261.
41. Martin Gilham. September 2001. “Handbook For The Dial Up Strategic Control Facility”.
Issue 1.
42. William Stallings. 2007. 8th Edition. “Data and Computer Communications“. Pearson
Prentice Hall. USA.
43. Teach-ict. “What is Packet Switching?” Available at: http://www.teach-
ict.com/technology_explained/packet_switching/packet_switching.html
44. Robert H. Miller & James H. Malinowski. 1994. 3rd Edition. “Power System Operation”.
Mcgraw-Hill. USA.
45. Shakeel Durrani, Imran Jattala, Junaid Farooqi, Naila Shakeel & Mohsin Murad. 2013.
“Design and Development of Wireless RTU and Cybersecurity Framework for SCADA
System”. IEEE 5th International Conference on Information & Communication
Technologies. pp. 1-6.

88
46. Elimir Babovic & Jasmin Velagic. 2009. “Lowering SCADA development and
implementation costs using PtP concept”. XXII International Symposium on Information,
Communication and Automation Technologies. pp. 1-7.
47. Wuhong Wang & Geert Wets. 2013. “Computational Intelligence for Traffic and
Mobility”. Atlantis Press. France.
48. Dan Middleton, Hassa Charara & Ryan Longmire. 2009. “Alternative Vehicle Detection
Technologies for Traffic Signal Systems”: Technical Report. Texas Transportation
Institute.
49. Jan Coetzee, Willem Low & Peter Bullock. “Solar powered Traffic Signals: Myth or
Marvel?”. Proceedings of 27th Southern African Transport Conference. June 2008. pp.
629 – 644.
50. Stefano Ermon, Yexiang Xue, Carla Gomes & Bart Selman. “Learning Policies For
Battery Usage Optimization in Electric Vehicles”. Proceedings of European Conference
on Machine Learning and Principles and Practice of knowledge Discovery in Databases.
September 2012. pp. 1-16.
51. Phoenix Contact. “What you don’t know about industrial GSM/GPRS modem
communication”. A White Paper. [Online]. Available at:
http://web.arrownac.com/sites/default/files/pdfs/What_you_dont_know_about_industrial_
GSMGPRS_modem_communications.pdf
52. Countrymile Wi-Fi. “How to Setup a long distance Wi-Fi bridge”. [Online]. Available at:
http://www.countrymilewifi.com/Images/bridge_wifi.jpg
53. Ashley Russell Kotwal, Soon Jae Lee & Yoo Jae Kim. 2013. Traffic Signal Systems: “A
Revew of Current Technology in the United States”. Science and Technology 2013, 3(1).
[Online]. pp. 33-41. Available at: http://article.sapub.org/10.5923.j.scit.20130301.04.html
54. P. Makhwathana & S. Du. “Analysis on Faults and Maintenance Uncertainties at Traffic
Signal Junctions in the City of Johannesburg”. 4th International Conference on Traffic

89
and Transportation Engineering (ICTTE 2015). Madrid, Spain. Journal for Traffic and
Logistics Engineering, Vol.3, No. 2, December 2015. pp. 162-167
55. P. Makhwathana & S. Du. “Road ITS Backup Power Source Performance Estimation”.
4th International Conference on Traffic and Transportation Engineering (ICTTE 2015).
Madrid, Spain. Journal for Traffic and Logistics Engineering, Vol.3, No. 2, December
2015. pp. 143-148

90
Appendix A: Wi-Fi scanned frequencies
A.1: 5455 – 5835 (MHz)

91
A.2: 5730 – 5845 (MHz)