Embed Size (px)
Citation preview
Jobs, Economic Growth, and Capacity Development for Youth in Africa
By Haroon Bhorat and Morné Oosthuizen
DPRU Working Paper 202005May 2020

JOBS, ECONOMIC GROWTH, AND
CAPACITY DEVELOPMENT FOR YOUTH IN AFRICA
DEVELOPMENT POLICY RESEARCH UNIT
HAROON BHORAT [email protected]
MORNÉ OOSTHUIZEN [email protected]
Working Paper 202005
ISBN 978-1-920633-76-9
May 2020
© DPRU, University of Cape Town 2020
This work is licenced under the Creative Commons Attribution-Non-Commercial-Share Alike 2.5 South Africa License. To view a copy of this licence, visit http://creativecommons.org/licenses/by-nc-sa/2.5/za or send a letter to Creative Commons, 171 Second Street, Suite 300, San Francisco, California 94105, USA.
Abstract
The rapid growth of its population presents both opportunities and challenges to the African continent. In order for the demographic dividend to be harnessed, African countries’ youthful populations need to find productive work. Unfortunately, labour market outcomes on the continent tend to be relatively poor, and while there has been a shift towards the services sector as a potential engine for future economic growth, development and— critically—jobs, it is debatable as to whether the services sector can generate jobs of the quantity or quality required to raise incomes. In this paper, we argue that the economic complexity framework, with its associated mapping of products within the product space, provides a useful lens through which to view industrial policymaking. By focusing more narrowly on specific products identified through the economic complexity methodology, it is argued that policymakers can be presented with a more targeted menu of policy recommendations aimed at resolving very specific problems within economies. By successfully addressing capability constraints, policy can have a potentially greater impact on the accumulation of capabilities and economic diversification, unlocking the potential of manufacturing as a source of economic dynamism and job creation.
JEL codes:
J08; J11; J18; J60; N3; N17; O55
Keywords:
Africa; Economic Growth; Jobs; Employment; Youth; Demographic Dividend; Population; Labour Markets; Structural Transformation; Economic Complexity; Product Space.
Working Papers can be downloaded in PDF (Adobe Acrobat) format from www.dpru.uct.ac.za. A limited number of printed copies are available from the Communications Manager: DPRU, University of Cape Town, Private Bag X3, Rondebosch, Cape Town, 7700, South Africa. Tel: +27 (0)21 650 5701, email: [email protected]
Corresponding author
Prof. Haroon Bhorat (DPRU Director) email: [email protected]
Recommended citation
Bhorat, H. and Oosthuizen, M. (2020). Jobs, Economic Growth, and Capacity Development for Youth in Africa. Development Policy Research Unit Working Paper 202005. DPRU, University of Cape Town.
Disclaimer
The Working Paper series is intended to catalyse policy debate. They express the views of their respective authors and not necessarily those of the Development Policy Research Unit (DPRU).
i
Table of Contents
1. INTRODUCTION ..................................................................................................................... 1
2. AFRICA’S YOUTH POPULATION BOOM ................................................................................... 1
2.1. POPULATION GROWTH TO 2100 ................................................................................................ 1 2.2. SUMMARY ............................................................................................................................ 5
3. LABOUR MARKET PROSPECTS FOR AFRICA’S YOUTH ............................................................... 5
3.1. REGIONAL LABOUR MARKET OUTCOMES ...................................................................................... 5 3.2. YOUTH LABOUR MARKET OUTCOMES ........................................................................................ 12 3.3. GOVERNMENT AS AN EMPLOYER IN AFRICA ................................................................................. 14
4. STRUCTURAL TRANSFORMATION IN AFRICA ........................................................................ 17
4.1. STRUCTURAL TRANSFORMATION AND THE ADVENT OF DE-INDUSTRIALISATION .................................... 17 4.2. SERVICES AS AN ALTERNATIVE GROWTH MODEL IN AFRICA ............................................................. 20
5. ECONOMIC COMPLEXITY AS A POLICY INSTRUMENT ............................................................ 26
5.1. ECONOMIC COMPLEXITY ......................................................................................................... 26 5.2. ECONOMIC COMPLEXITY AND ECONOMIC DEVELOPMENT ............................................................... 28 5.3. INTEGRATING ECONOMIC COMPLEXITY INTO POLICY ...................................................................... 34
6. CONCLUSION ....................................................................................................................... 38
7. REFERENCES ........................................................................................................................ 40
APPENDIX ONE .......................................................................................................................... 42
ii
List of Figures
Figure 1. Youth Share of the Population across Africa, 2020-2100............................................................................. 3 Figure 2. Country Shares of African Youth Population Growth, 2020-2100 ............................................................... 4 Figure 3. Africa’s Labour Market, 2020 ......................................................................................................................... 7 Figure 4. Share of Wage Employment in Total Employment by Region, 2020 ........................................................... 8 Figure 5. Prevalence of Working Poverty by Region, 2020 .......................................................................................... 8 Figure 6. Median Hourly Wages (USD, PPP-Adjusted, Base 2010) .............................................................................. 9 Figure 7. Median Hourly Wages and GDP per capita ................................................................................................. 10 Figure 8. Skills Composition of Employment, 2020 .................................................................................................... 11 Figure 9. Youth Unemployment Rate by Region, 2020 .............................................................................................. 12 Figure 10. Youth Labour Markets by Region, 2020 .................................................................................................... 13 Figure 11. Share of Public Sector Employment in Wage Employment by Region .................................................... 14 Figure 12. Median Public-to-Private Wage Gap by Region ........................................................................................ 15 Figure 13. Public-to-Private Wage Gaps in Africa ....................................................................................................... 16 Figure 14. Relative Sectoral Productivity and Employment Changes in Asia and Africa, 1975-2010 ...................... 18 Figure 15. Manufacturing as a Share of Gross Value Added, 1970-2010 ................................................................. 19 Figure 16. Manufacturing as a Share of GDP relative to GDP per capita .................................................................. 20 Figure 17. Distribution of Employment by Broad Sector, 1991-2020 ....................................................................... 21 Figure 18. Ratio of Services Employment Growth to Total Employment Growth in Selected Low and Middle Income
Countries, 1990-2010 ......................................................................................................................................... 25 Figure 19. Economic Complexity Index and GDP per capita, 2013 ........................................................................... 28 Figure 20. The Product Space ...................................................................................................................................... 30 Figure 21. The Product Space for Ghana .................................................................................................................... 31 Figure 22. The Product Space for Kenya ..................................................................................................................... 32 Figure 23. The Product Space for Senegal .................................................................................................................. 33 Figure 24. The Product Space for South Africa ........................................................................................................... 34 Figure 25. An Example of Criteria for Identifying Frontier Products ......................................................................... 35 Figure 26. An Example of a List of the Top 20 Frontier Products for South Africa ................................................... 37
List of Tables
Table 1. Projected Population Growth, 2020-2100 ..................................................................................................... 2 Table 2. Projected Change in the Youth and Working-Age Populations, 2020-2100 ................................................. 2 Table 3. Projected Average Annual Growth Rates of the Youth Population, 2020-2100 .......................................... 4 Table 4. The Labour Market Globally, 2020 .................................................................................................................. 6 Table 5. Composition of Gross Value Added (percent), 1994 and 2018 ................................................................... 21 Table 6. Sectoral Contributions to Employment Change, 1990-2010 ....................................................................... 23 Table 7. List of Top 20 Frontier Products for South Africa ......................................................................................... 42
DPRU WP202005
1
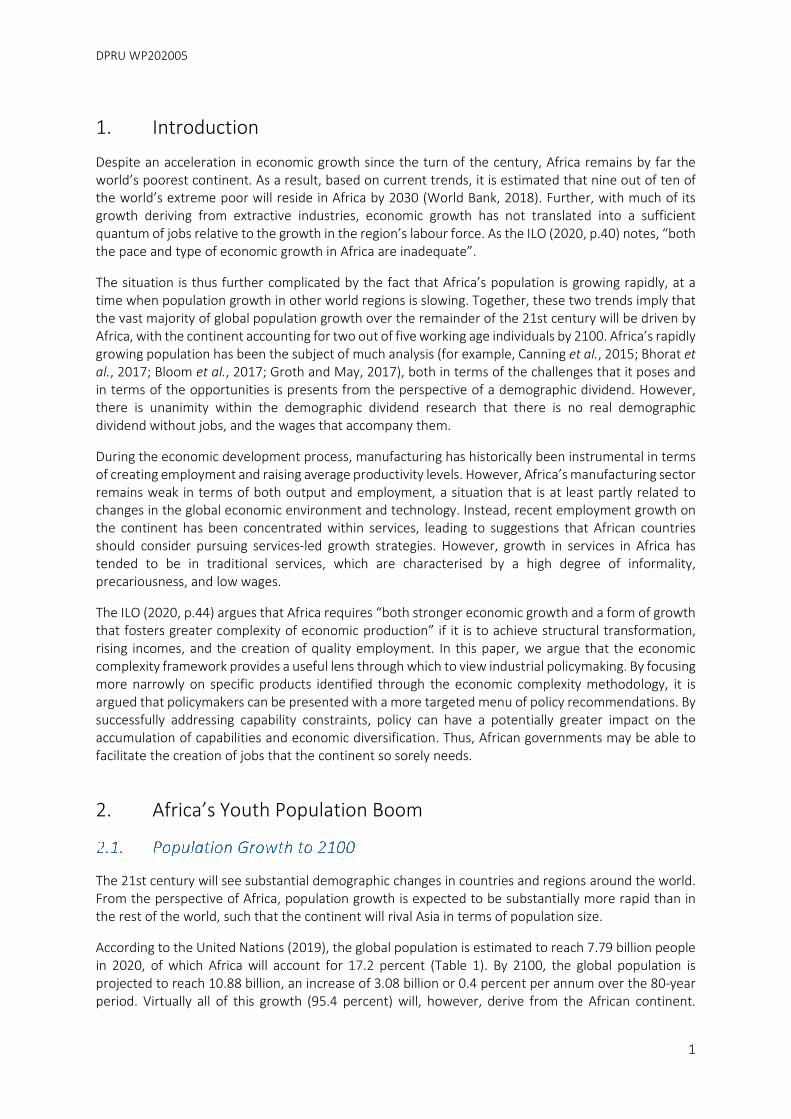
1. Introduction
Despite an acceleration in economic growth since the turn of the century, Africa remains by far the world’s poorest continent. As a result, based on current trends, it is estimated that nine out of ten of the world’s extreme poor will reside in Africa by 2030 (World Bank, 2018). Further, with much of its growth deriving from extractive industries, economic growth has not translated into a sufficient quantum of jobs relative to the growth in the region’s labour force. As the ILO (2020, p.40) notes, “both the pace and type of economic growth in Africa are inadequate”.
The situation is thus further complicated by the fact that Africa’s population is growing rapidly, at a time when population growth in other world regions is slowing. Together, these two trends imply that the vast majority of global population growth over the remainder of the 21st century will be driven by Africa, with the continent accounting for two out of five working age individuals by 2100. Africa’s rapidly growing population has been the subject of much analysis (for example, Canning et al., 2015; Bhorat et al., 2017; Bloom et al., 2017; Groth and May, 2017), both in terms of the challenges that it poses and in terms of the opportunities is presents from the perspective of a demographic dividend. However, there is unanimity within the demographic dividend research that there is no real demographic dividend without jobs, and the wages that accompany them.
During the economic development process, manufacturing has historically been instrumental in terms of creating employment and raising average productivity levels. However, Africa’s manufacturing sector remains weak in terms of both output and employment, a situation that is at least partly related to changes in the global economic environment and technology. Instead, recent employment growth on the continent has been concentrated within services, leading to suggestions that African countries should consider pursuing services-led growth strategies. However, growth in services in Africa has tended to be in traditional services, which are characterised by a high degree of informality, precariousness, and low wages.
The ILO (2020, p.44) argues that Africa requires “both stronger economic growth and a form of growth that fosters greater complexity of economic production” if it is to achieve structural transformation, rising incomes, and the creation of quality employment. In this paper, we argue that the economic complexity framework provides a useful lens through which to view industrial policymaking. By focusing more narrowly on specific products identified through the economic complexity methodology, it is argued that policymakers can be presented with a more targeted menu of policy recommendations. By successfully addressing capability constraints, policy can have a potentially greater impact on the accumulation of capabilities and economic diversification. Thus, African governments may be able to facilitate the creation of jobs that the continent so sorely needs.
2. Africa’s Youth Population Boom
The 21st century will see substantial demographic changes in countries and regions around the world. From the perspective of Africa, population growth is expected to be substantially more rapid than in the rest of the world, such that the continent will rival Asia in terms of population size.
According to the United Nations (2019), the global population is estimated to reach 7.79 billion people in 2020, of which Africa will account for 17.2 percent (Table 1). By 2100, the global population is projected to reach 10.88 billion, an increase of 3.08 billion or 0.4 percent per annum over the 80-year period. Virtually all of this growth (95.4 percent) will, however, derive from the African continent.
Jobs, Economic Growth, and Capacity Development for Youth in Africa
2
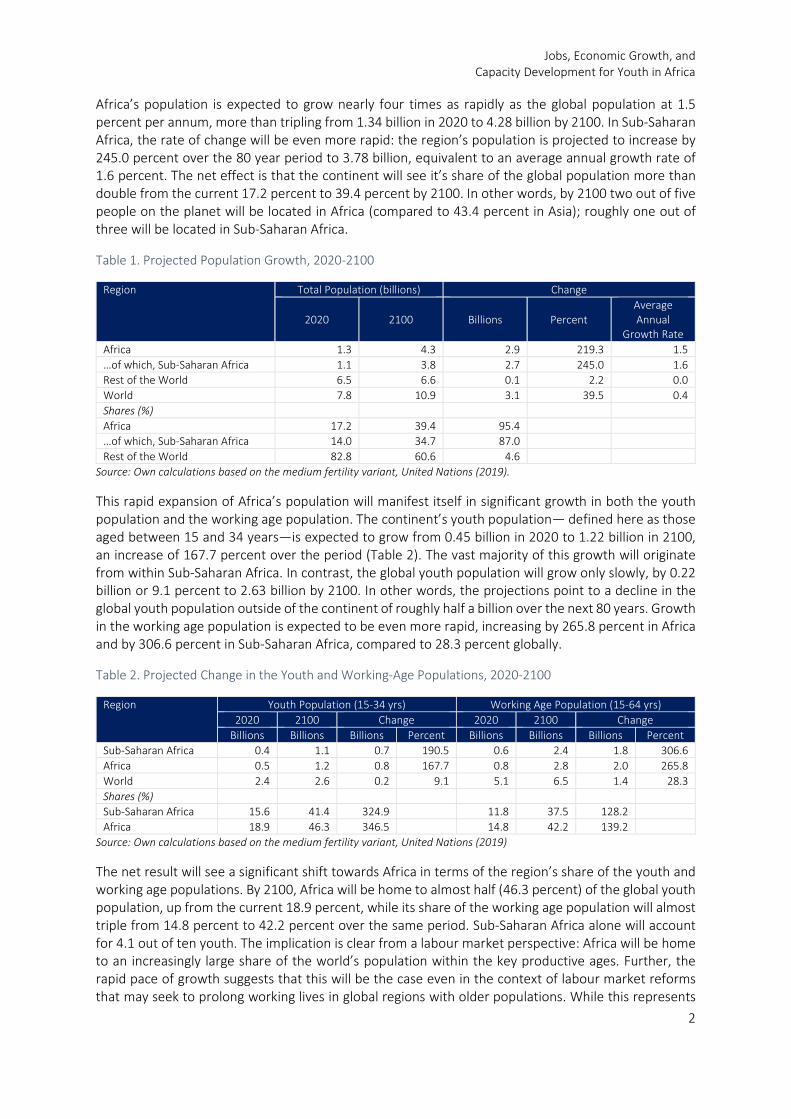
Africa’s population is expected to grow nearly four times as rapidly as the global population at 1.5 percent per annum, more than tripling from 1.34 billion in 2020 to 4.28 billion by 2100. In Sub-Saharan Africa, the rate of change will be even more rapid: the region’s population is projected to increase by 245.0 percent over the 80 year period to 3.78 billion, equivalent to an average annual growth rate of 1.6 percent. The net effect is that the continent will see it’s share of the global population more than double from the current 17.2 percent to 39.4 percent by 2100. In other words, by 2100 two out of five people on the planet will be located in Africa (compared to 43.4 percent in Asia); roughly one out of three will be located in Sub-Saharan Africa.
Table 1. Projected Population Growth, 2020-2100
Region Total Population (billions) Change
2020 2100 Billions Percent Average Annual
Growth Rate Africa 1.3 4.3 2.9 219.3 1.5 …of which, Sub-Saharan Africa 1.1 3.8 2.7 245.0 1.6 Rest of the World 6.5 6.6 0.1 2.2 0.0 World 7.8 10.9 3.1 39.5 0.4 Shares (%) Africa 17.2 39.4 95.4 …of which, Sub-Saharan Africa 14.0 34.7 87.0 Rest of the World 82.8 60.6 4.6
Source: Own calculations based on the medium fertility variant, United Nations (2019).
This rapid expansion of Africa’s population will manifest itself in significant growth in both the youth population and the working age population. The continent’s youth population— defined here as those aged between 15 and 34 years—is expected to grow from 0.45 billion in 2020 to 1.22 billion in 2100, an increase of 167.7 percent over the period (Table 2). The vast majority of this growth will originate from within Sub-Saharan Africa. In contrast, the global youth population will grow only slowly, by 0.22 billion or 9.1 percent to 2.63 billion by 2100. In other words, the projections point to a decline in the global youth population outside of the continent of roughly half a billion over the next 80 years. Growth in the working age population is expected to be even more rapid, increasing by 265.8 percent in Africa and by 306.6 percent in Sub-Saharan Africa, compared to 28.3 percent globally.
Table 2. Projected Change in the Youth and Working-Age Populations, 2020-2100
Region Youth Population (15-34 yrs) Working Age Population (15-64 yrs) 2020 2100 Change 2020 2100 Change
Billions Billions Billions Percent Billions Billions Billions Percent Sub-Saharan Africa 0.4 1.1 0.7 190.5 0.6 2.4 1.8 306.6 Africa 0.5 1.2 0.8 167.7 0.8 2.8 2.0 265.8 World 2.4 2.6 0.2 9.1 5.1 6.5 1.4 28.3 Shares (%) Sub-Saharan Africa 15.6 41.4 324.9 11.8 37.5 128.2 Africa 18.9 46.3 346.5 14.8 42.2 139.2
Source: Own calculations based on the medium fertility variant, United Nations (2019)
The net result will see a significant shift towards Africa in terms of the region’s share of the youth and working age populations. By 2100, Africa will be home to almost half (46.3 percent) of the global youth population, up from the current 18.9 percent, while its share of the working age population will almost triple from 14.8 percent to 42.2 percent over the same period. Sub-Saharan Africa alone will account for 4.1 out of ten youth. The implication is clear from a labour market perspective: Africa will be home to an increasingly large share of the world’s population within the key productive ages. Further, the rapid pace of growth suggests that this will be the case even in the context of labour market reforms that may seek to prolong working lives in global regions with older populations. While this represents
DPRU WP202005
3
a potential demographic dividend for the continent, it is implicitly a representation of the scale of future job creation that will be required.
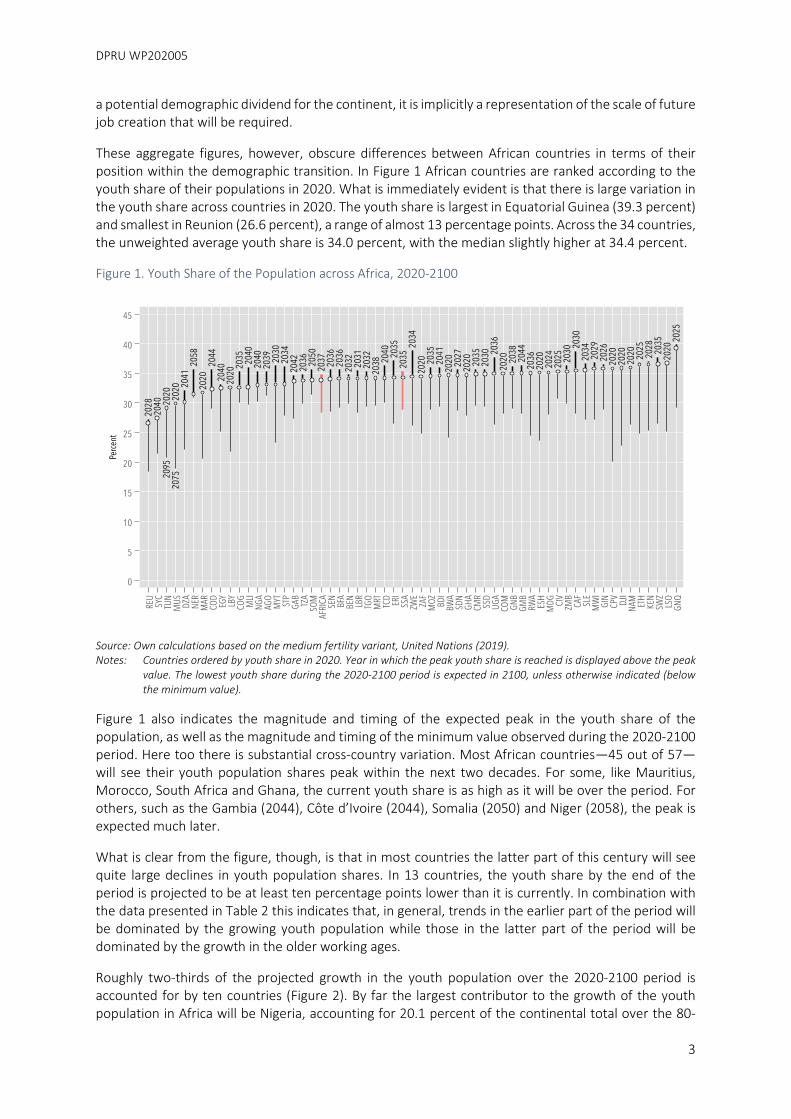
These aggregate figures, however, obscure differences between African countries in terms of their position within the demographic transition. In Figure 1 African countries are ranked according to the youth share of their populations in 2020. What is immediately evident is that there is large variation in the youth share across countries in 2020. The youth share is largest in Equatorial Guinea (39.3 percent) and smallest in Reunion (26.6 percent), a range of almost 13 percentage points. Across the 34 countries, the unweighted average youth share is 34.0 percent, with the median slightly higher at 34.4 percent.
Figure 1. Youth Share of the Population across Africa, 2020-2100
Source: Own calculations based on the medium fertility variant, United Nations (2019). Notes: Countries ordered by youth share in 2020. Year in which the peak youth share is reached is displayed above the peak
value. The lowest youth share during the 2020-2100 period is expected in 2100, unless otherwise indicated (below the minimum value).
Figure 1 also indicates the magnitude and timing of the expected peak in the youth share of the population, as well as the magnitude and timing of the minimum value observed during the 2020-2100 period. Here too there is substantial cross-country variation. Most African countries—45 out of 57—will see their youth population shares peak within the next two decades. For some, like Mauritius, Morocco, South Africa and Ghana, the current youth share is as high as it will be over the period. For others, such as the Gambia (2044), Côte d’Ivoire (2044), Somalia (2050) and Niger (2058), the peak is expected much later.
What is clear from the figure, though, is that in most countries the latter part of this century will see quite large declines in youth population shares. In 13 countries, the youth share by the end of the period is projected to be at least ten percentage points lower than it is currently. In combination with the data presented in Table 2 this indicates that, in general, trends in the earlier part of the period will be dominated by the growing youth population while those in the latter part of the period will be dominated by the growth in the older working ages.
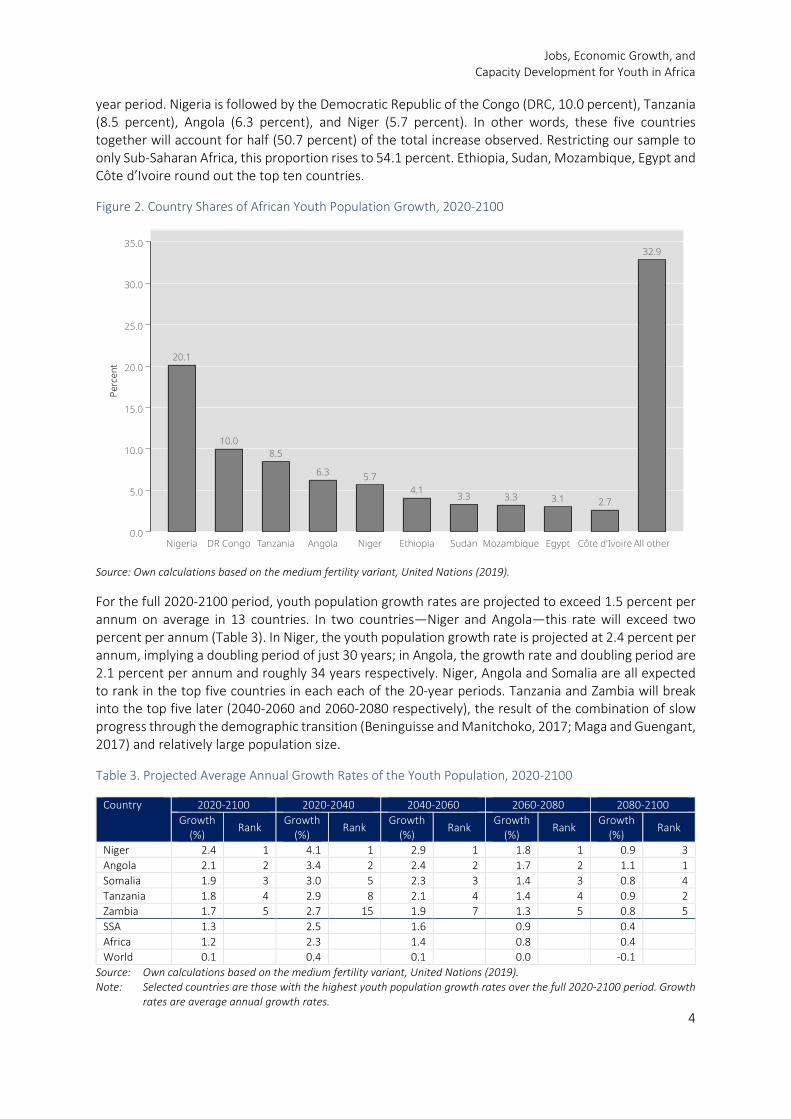
Roughly two-thirds of the projected growth in the youth population over the 2020-2100 period is accounted for by ten countries (Figure 2). By far the largest contributor to the growth of the youth population in Africa will be Nigeria, accounting for 20.1 percent of the continental total over the 80-
Jobs, Economic Growth, and Capacity Development for Youth in Africa
4
year period. Nigeria is followed by the Democratic Republic of the Congo (DRC, 10.0 percent), Tanzania (8.5 percent), Angola (6.3 percent), and Niger (5.7 percent). In other words, these five countries together will account for half (50.7 percent) of the total increase observed. Restricting our sample to only Sub-Saharan Africa, this proportion rises to 54.1 percent. Ethiopia, Sudan, Mozambique, Egypt and Côte d’Ivoire round out the top ten countries.
Figure 2. Country Shares of African Youth Population Growth, 2020-2100
Source: Own calculations based on the medium fertility variant, United Nations (2019).
For the full 2020-2100 period, youth population growth rates are projected to exceed 1.5 percent per annum on average in 13 countries. In two countries—Niger and Angola—this rate will exceed two percent per annum (Table 3). In Niger, the youth population growth rate is projected at 2.4 percent per annum, implying a doubling period of just 30 years; in Angola, the growth rate and doubling period are 2.1 percent per annum and roughly 34 years respectively. Niger, Angola and Somalia are all expected to rank in the top five countries in each each of the 20-year periods. Tanzania and Zambia will break into the top five later (2040-2060 and 2060-2080 respectively), the result of the combination of slow progress through the demographic transition (Beninguisse and Manitchoko, 2017; Maga and Guengant, 2017) and relatively large population size.
Table 3. Projected Average Annual Growth Rates of the Youth Population, 2020-2100
Country 2020-2100 2020-2040 2040-2060 2060-2080 2080-2100 Growth
(%) Rank
Growth (%)
Rank Growth
(%) Rank
Growth (%)
Rank Growth
(%) Rank
Niger 2.4 1 4.1 1 2.9 1 1.8 1 0.9 3 Angola 2.1 2 3.4 2 2.4 2 1.7 2 1.1 1 Somalia 1.9 3 3.0 5 2.3 3 1.4 3 0.8 4 Tanzania 1.8 4 2.9 8 2.1 4 1.4 4 0.9 2 Zambia 1.7 5 2.7 15 1.9 7 1.3 5 0.8 5 SSA 1.3 2.5 1.6 0.9 0.4 Africa 1.2 2.3 1.4 0.8 0.4 World 0.1 0.4 0.1 0.0 -0.1
Source: Own calculations based on the medium fertility variant, United Nations (2019). Note: Selected countries are those with the highest youth population growth rates over the full 2020-2100 period. Growth
rates are average annual growth rates.
DPRU WP202005
5
Current population projections point to the rapid growth of the African population over the rest of the 21st century, to the extent that the continent will account for virtually all of the net increase in the global population over the period. By 2100, Africa will be home to four-tenths of humanity, more than double its current share and only slightly behind Asia. This growth has initially been driven by an expansion of the youth population, but as these cohorts age the momentum will shift to the older working age population. While the continent’s youth population will almost triple, its working age population will almost quadruple over the course of the next 80 years. By 2100, almost half of the global youth population will call Africa home, while this will be true for more than two-fifths of the working age population.
Despite this growth, national-level experiences will vary widely. Over the course of the 2020-2100 period, some countries will see significant increases in their youth population shares, rapid growth of the youth population in absolute terms over extended periods of time, or both. In these countries, the pressure to ensure that new and increasingly large cohorts entering the labour market have sufficient opportunities to be gainfully employed. This is likely to be even more challenging in an era where technological change is expected to be particularly disruptive to existing modes of production and employment. In other countries—specifically in North Africa, Southern Africa, and various island states—youth population shares are already as high as they will be, with ten countries expected to have youth populations smaller (in absolute terms) by the end of the century than they are currently. In these countries, the challenges are quite different and not the subject of this paper.
The key question that emerges then is from where will the jobs for the continent’s burgeoning youth population originate?
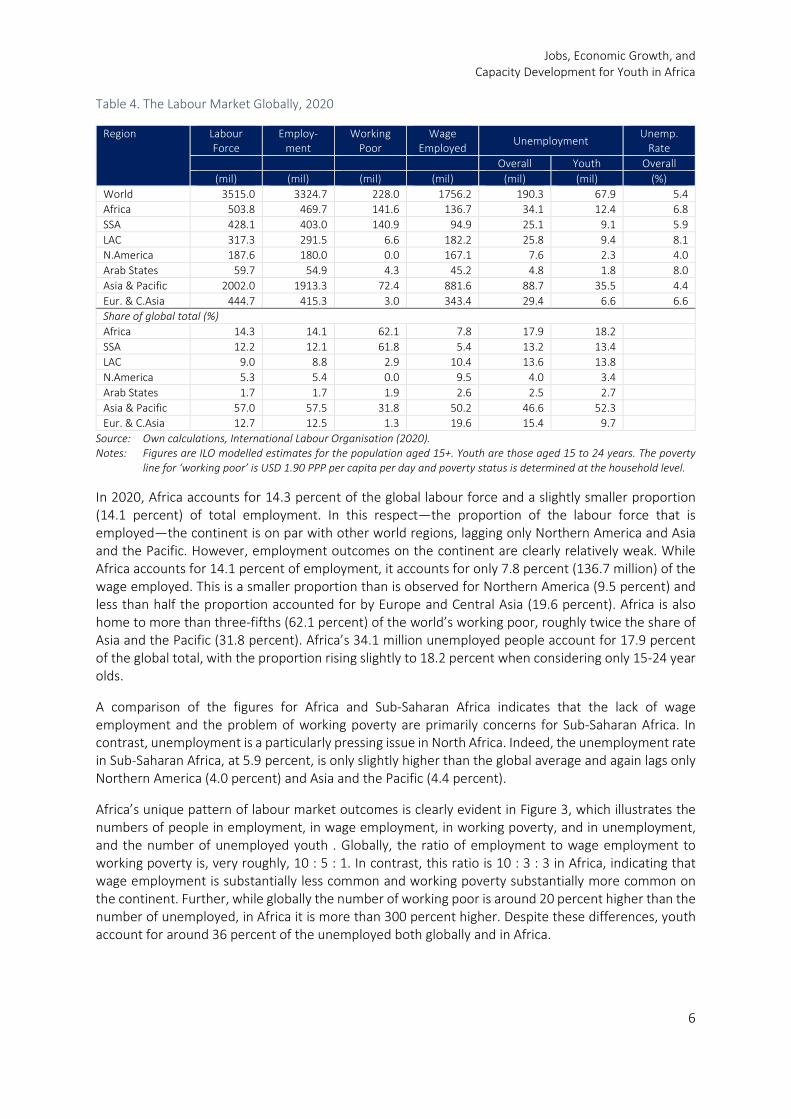
To answer the question about the provenance of the jobs required for Africa’s burgeoning youth population, we begin with the current state of labour market outcomes on the continent in comparison to those in other regions. Table 4 provides an overview of labour market outcomes across world regions in 2020. Globally, 3.3 billion people aged 15 years and older are employed, out of 3.5 billion in the labour force. Wage employment—defined as employees as opposed to employers, own-account workers and contributing family workers—in the global labour market is estimated at just under 1.8 billion, or 52.8 percent of the employed. Despite working, a significant number of the employed are classified as working poor: 228 million workers (6.9 percent of the employed) reside in households that survive on less than USD 1.90 PPP per capita per day.
Jobs, Economic Growth, and Capacity Development for Youth in Africa
6
Table 4. The Labour Market Globally, 2020
Region Labour Force
Employ-ment
Working Poor
Wage Employed Unemployment
Unemp. Rate
Overall Youth Overall (mil) (mil) (mil) (mil) (mil) (mil) (%)
World 3515.0 3324.7 228.0 1756.2 190.3 67.9 5.4 Africa 503.8 469.7 141.6 136.7 34.1 12.4 6.8 SSA 428.1 403.0 140.9 94.9 25.1 9.1 5.9 LAC 317.3 291.5 6.6 182.2 25.8 9.4 8.1 N.America 187.6 180.0 0.0 167.1 7.6 2.3 4.0 Arab States 59.7 54.9 4.3 45.2 4.8 1.8 8.0 Asia & Pacific 2002.0 1913.3 72.4 881.6 88.7 35.5 4.4 Eur. & C.Asia 444.7 415.3 3.0 343.4 29.4 6.6 6.6 Share of global total (%) Africa 14.3 14.1 62.1 7.8 17.9 18.2 SSA 12.2 12.1 61.8 5.4 13.2 13.4 LAC 9.0 8.8 2.9 10.4 13.6 13.8 N.America 5.3 5.4 0.0 9.5 4.0 3.4 Arab States 1.7 1.7 1.9 2.6 2.5 2.7 Asia & Pacific 57.0 57.5 31.8 50.2 46.6 52.3 Eur. & C.Asia 12.7 12.5 1.3 19.6 15.4 9.7
Source: Own calculations, International Labour Organisation (2020). Notes: Figures are ILO modelled estimates for the population aged 15+. Youth are those aged 15 to 24 years. The poverty
line for ‘working poor’ is USD 1.90 PPP per capita per day and poverty status is determined at the household level.
In 2020, Africa accounts for 14.3 percent of the global labour force and a slightly smaller proportion (14.1 percent) of total employment. In this respect—the proportion of the labour force that is employed—the continent is on par with other world regions, lagging only Northern America and Asia and the Pacific. However, employment outcomes on the continent are clearly relatively weak. While Africa accounts for 14.1 percent of employment, it accounts for only 7.8 percent (136.7 million) of the wage employed. This is a smaller proportion than is observed for Northern America (9.5 percent) and less than half the proportion accounted for by Europe and Central Asia (19.6 percent). Africa is also home to more than three-fifths (62.1 percent) of the world’s working poor, roughly twice the share of Asia and the Pacific (31.8 percent). Africa’s 34.1 million unemployed people account for 17.9 percent of the global total, with the proportion rising slightly to 18.2 percent when considering only 15-24 year olds.
A comparison of the figures for Africa and Sub-Saharan Africa indicates that the lack of wage employment and the problem of working poverty are primarily concerns for Sub-Saharan Africa. In contrast, unemployment is a particularly pressing issue in North Africa. Indeed, the unemployment rate in Sub-Saharan Africa, at 5.9 percent, is only slightly higher than the global average and again lags only Northern America (4.0 percent) and Asia and the Pacific (4.4 percent).
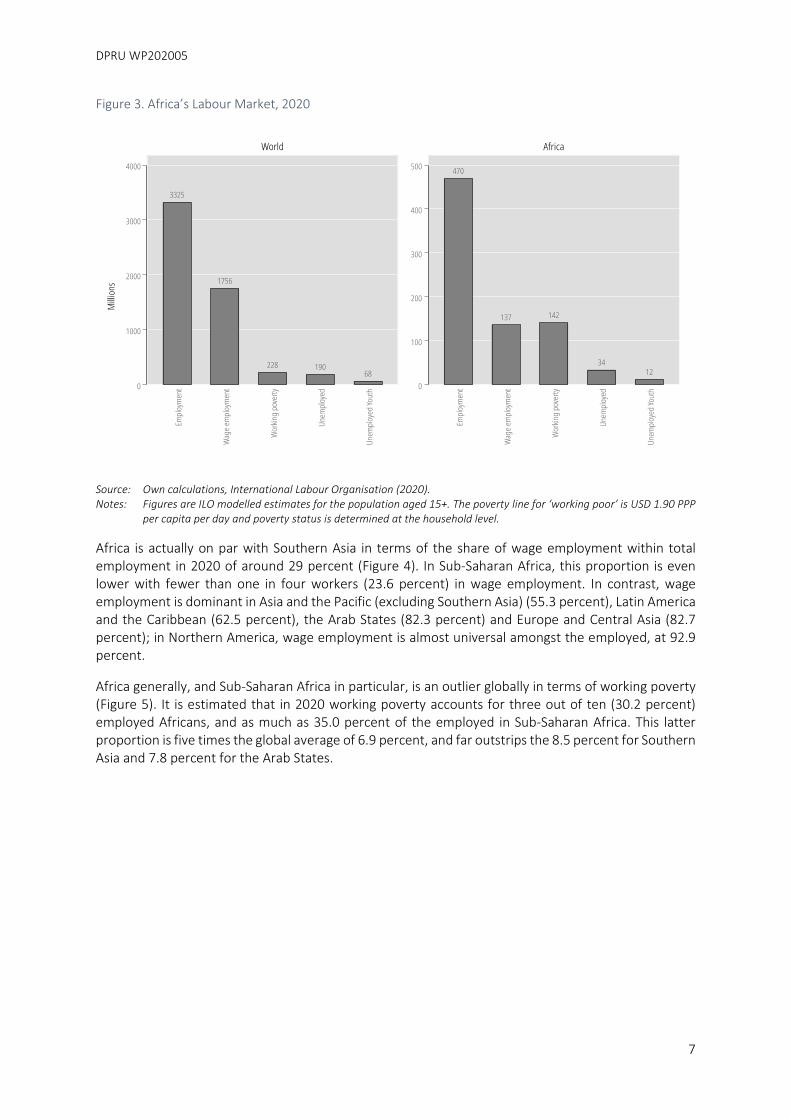
Africa’s unique pattern of labour market outcomes is clearly evident in Figure 3, which illustrates the numbers of people in employment, in wage employment, in working poverty, and in unemployment, and the number of unemployed youth . Globally, the ratio of employment to wage employment to working poverty is, very roughly, 10 : 5 : 1. In contrast, this ratio is 10 : 3 : 3 in Africa, indicating that wage employment is substantially less common and working poverty substantially more common on the continent. Further, while globally the number of working poor is around 20 percent higher than the number of unemployed, in Africa it is more than 300 percent higher. Despite these differences, youth account for around 36 percent of the unemployed both globally and in Africa.
DPRU WP202005
7
Figure 3. Africa’s Labour Market, 2020
Source: Own calculations, International Labour Organisation (2020). Notes: Figures are ILO modelled estimates for the population aged 15+. The poverty line for ‘working poor’ is USD 1.90 PPP
per capita per day and poverty status is determined at the household level.
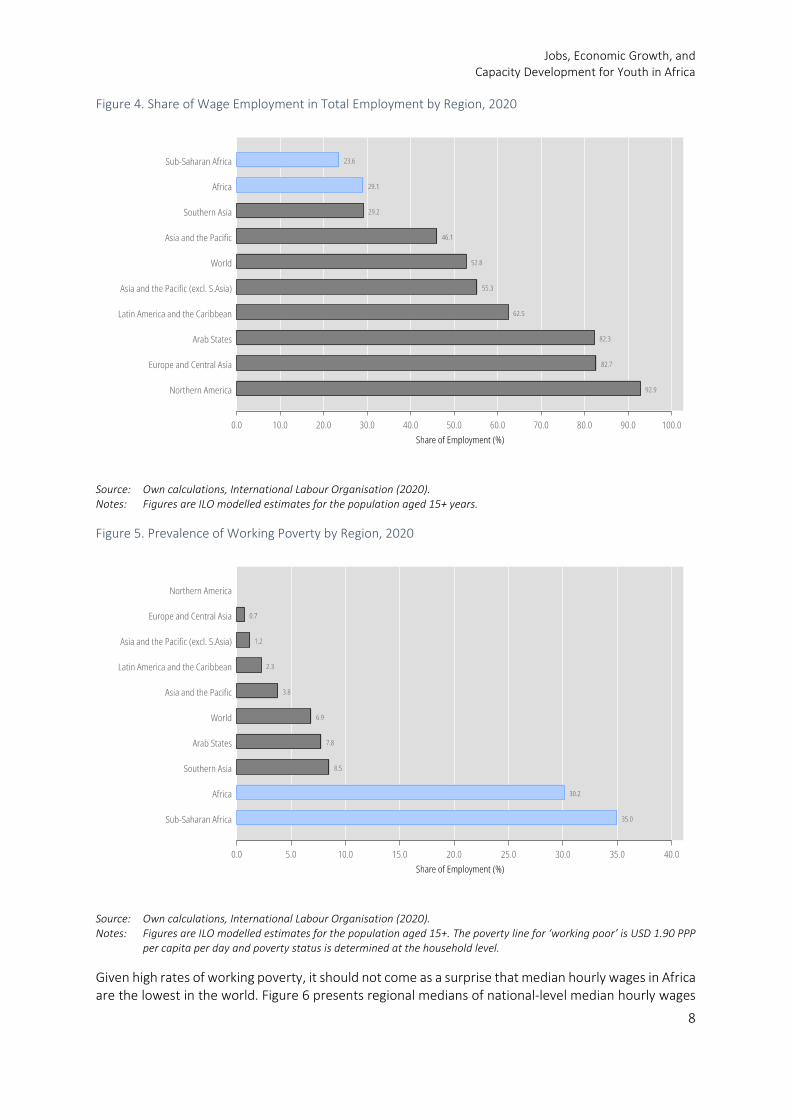
Africa is actually on par with Southern Asia in terms of the share of wage employment within total employment in 2020 of around 29 percent (Figure 4). In Sub-Saharan Africa, this proportion is even lower with fewer than one in four workers (23.6 percent) in wage employment. In contrast, wage employment is dominant in Asia and the Pacific (excluding Southern Asia) (55.3 percent), Latin America and the Caribbean (62.5 percent), the Arab States (82.3 percent) and Europe and Central Asia (82.7 percent); in Northern America, wage employment is almost universal amongst the employed, at 92.9 percent.
Africa generally, and Sub-Saharan Africa in particular, is an outlier globally in terms of working poverty (Figure 5). It is estimated that in 2020 working poverty accounts for three out of ten (30.2 percent) employed Africans, and as much as 35.0 percent of the employed in Sub-Saharan Africa. This latter proportion is five times the global average of 6.9 percent, and far outstrips the 8.5 percent for Southern Asia and 7.8 percent for the Arab States.
Jobs, Economic Growth, and Capacity Development for Youth in Africa
8
Figure 4. Share of Wage Employment in Total Employment by Region, 2020
Source: Own calculations, International Labour Organisation (2020). Notes: Figures are ILO modelled estimates for the population aged 15+ years.
Figure 5. Prevalence of Working Poverty by Region, 2020
Source: Own calculations, International Labour Organisation (2020). Notes: Figures are ILO modelled estimates for the population aged 15+. The poverty line for ‘working poor’ is USD 1.90 PPP
per capita per day and poverty status is determined at the household level.
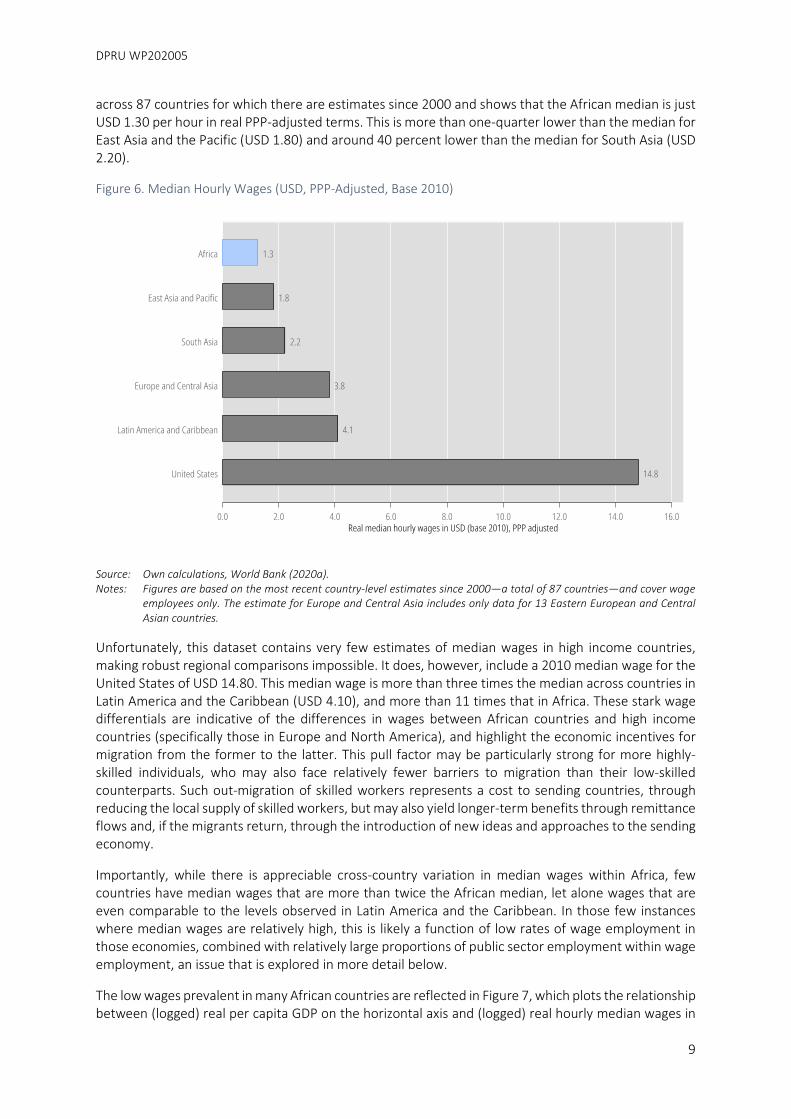
Given high rates of working poverty, it should not come as a surprise that median hourly wages in Africa are the lowest in the world. Figure 6 presents regional medians of national-level median hourly wages
DPRU WP202005
9
across 87 countries for which there are estimates since 2000 and shows that the African median is just USD 1.30 per hour in real PPP-adjusted terms. This is more than one-quarter lower than the median for East Asia and the Pacific (USD 1.80) and around 40 percent lower than the median for South Asia (USD 2.20).
Figure 6. Median Hourly Wages (USD, PPP-Adjusted, Base 2010)
Source: Own calculations, World Bank (2020a). Notes: Figures are based on the most recent country-level estimates since 2000—a total of 87 countries—and cover wage
employees only. The estimate for Europe and Central Asia includes only data for 13 Eastern European and Central Asian countries.
Unfortunately, this dataset contains very few estimates of median wages in high income countries, making robust regional comparisons impossible. It does, however, include a 2010 median wage for the United States of USD 14.80. This median wage is more than three times the median across countries in Latin America and the Caribbean (USD 4.10), and more than 11 times that in Africa. These stark wage differentials are indicative of the differences in wages between African countries and high income countries (specifically those in Europe and North America), and highlight the economic incentives for migration from the former to the latter. This pull factor may be particularly strong for more highly-skilled individuals, who may also face relatively fewer barriers to migration than their low-skilled counterparts. Such out-migration of skilled workers represents a cost to sending countries, through reducing the local supply of skilled workers, but may also yield longer-term benefits through remittance flows and, if the migrants return, through the introduction of new ideas and approaches to the sending economy.
Importantly, while there is appreciable cross-country variation in median wages within Africa, few countries have median wages that are more than twice the African median, let alone wages that are even comparable to the levels observed in Latin America and the Caribbean. In those few instances where median wages are relatively high, this is likely a function of low rates of wage employment in those economies, combined with relatively large proportions of public sector employment within wage employment, an issue that is explored in more detail below.
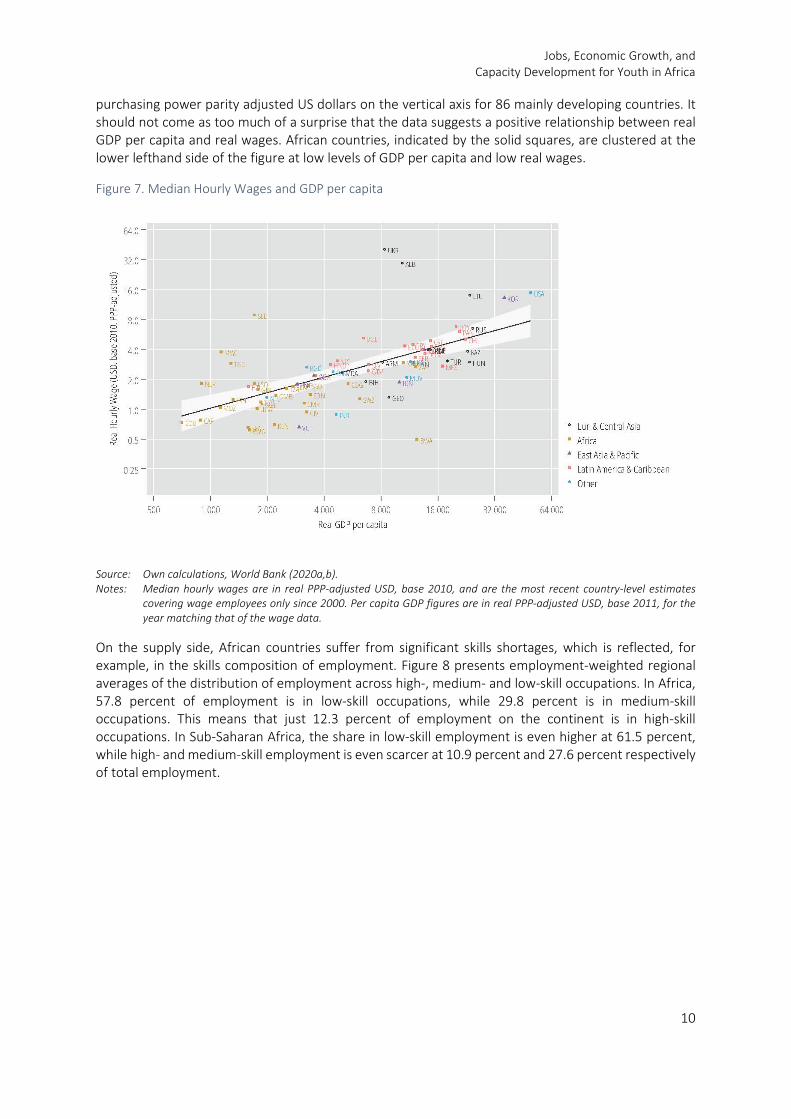
The low wages prevalent in many African countries are reflected in Figure 7, which plots the relationship between (logged) real per capita GDP on the horizontal axis and (logged) real hourly median wages in
Jobs, Economic Growth, and Capacity Development for Youth in Africa
10
purchasing power parity adjusted US dollars on the vertical axis for 86 mainly developing countries. It should not come as too much of a surprise that the data suggests a positive relationship between real GDP per capita and real wages. African countries, indicated by the solid squares, are clustered at the lower lefthand side of the figure at low levels of GDP per capita and low real wages.
Figure 7. Median Hourly Wages and GDP per capita
Source: Own calculations, World Bank (2020a,b). Notes: Median hourly wages are in real PPP-adjusted USD, base 2010, and are the most recent country-level estimates
covering wage employees only since 2000. Per capita GDP figures are in real PPP-adjusted USD, base 2011, for the year matching that of the wage data.
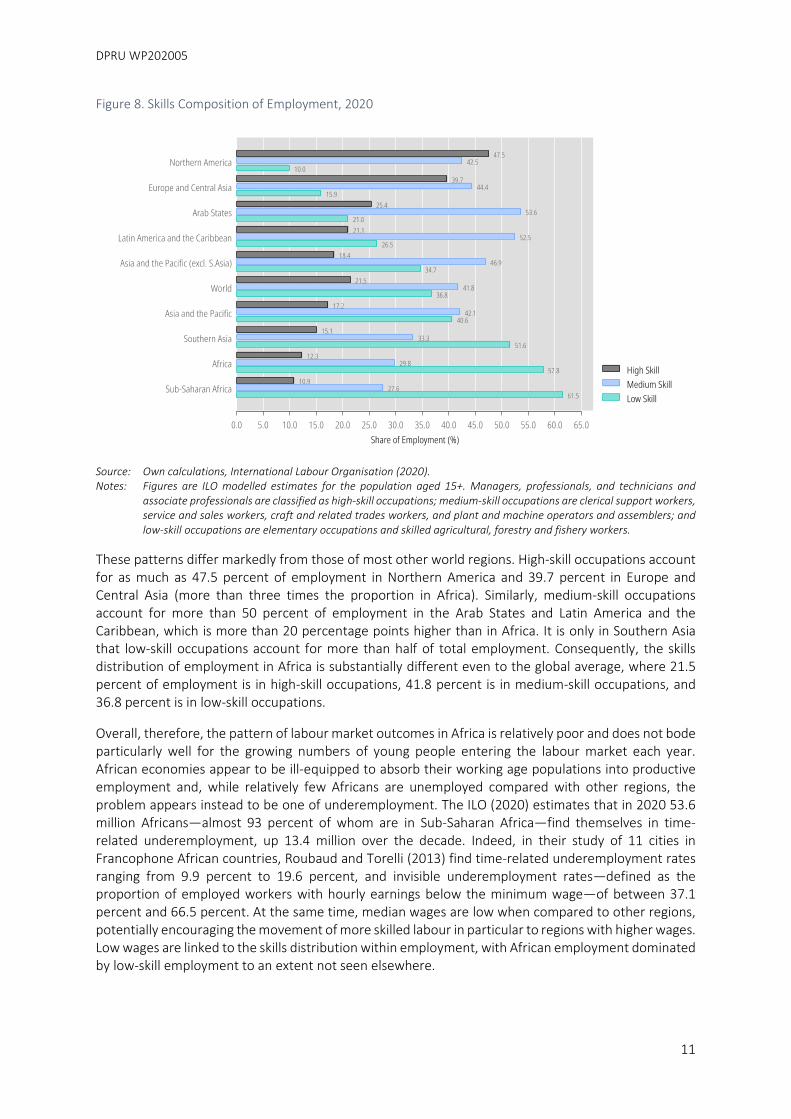
On the supply side, African countries suffer from significant skills shortages, which is reflected, for example, in the skills composition of employment. Figure 8 presents employment-weighted regional averages of the distribution of employment across high-, medium- and low-skill occupations. In Africa, 57.8 percent of employment is in low-skill occupations, while 29.8 percent is in medium-skill occupations. This means that just 12.3 percent of employment on the continent is in high-skill occupations. In Sub-Saharan Africa, the share in low-skill employment is even higher at 61.5 percent, while high- and medium-skill employment is even scarcer at 10.9 percent and 27.6 percent respectively of total employment.
DPRU WP202005
11
Figure 8. Skills Composition of Employment, 2020
Source: Own calculations, International Labour Organisation (2020). Notes: Figures are ILO modelled estimates for the population aged 15+. Managers, professionals, and technicians and
associate professionals are classified as high-skill occupations; medium-skill occupations are clerical support workers, service and sales workers, craft and related trades workers, and plant and machine operators and assemblers; and low-skill occupations are elementary occupations and skilled agricultural, forestry and fishery workers.
These patterns differ markedly from those of most other world regions. High-skill occupations account for as much as 47.5 percent of employment in Northern America and 39.7 percent in Europe and Central Asia (more than three times the proportion in Africa). Similarly, medium-skill occupations account for more than 50 percent of employment in the Arab States and Latin America and the Caribbean, which is more than 20 percentage points higher than in Africa. It is only in Southern Asia that low-skill occupations account for more than half of total employment. Consequently, the skills distribution of employment in Africa is substantially different even to the global average, where 21.5 percent of employment is in high-skill occupations, 41.8 percent is in medium-skill occupations, and 36.8 percent is in low-skill occupations.
Overall, therefore, the pattern of labour market outcomes in Africa is relatively poor and does not bode particularly well for the growing numbers of young people entering the labour market each year. African economies appear to be ill-equipped to absorb their working age populations into productive employment and, while relatively few Africans are unemployed compared with other regions, the problem appears instead to be one of underemployment. The ILO (2020) estimates that in 2020 53.6 million Africans—almost 93 percent of whom are in Sub-Saharan Africa—find themselves in time-related underemployment, up 13.4 million over the decade. Indeed, in their study of 11 cities in Francophone African countries, Roubaud and Torelli (2013) find time-related underemployment rates ranging from 9.9 percent to 19.6 percent, and invisible underemployment rates—defined as the proportion of employed workers with hourly earnings below the minimum wage—of between 37.1 percent and 66.5 percent. At the same time, median wages are low when compared to other regions, potentially encouraging the movement of more skilled labour in particular to regions with higher wages. Low wages are linked to the skills distribution within employment, with African employment dominated by low-skill employment to an extent not seen elsewhere.
Jobs, Economic Growth, and Capacity Development for Youth in Africa
12
At the aggregate level, labour market outcomes in Africa tend not to be as favourable as in other world regions. An important question, particularly within the context of rapidly growing youth populations, is how do youth labour market outcomes on the continent compare with those in the rest of the world?
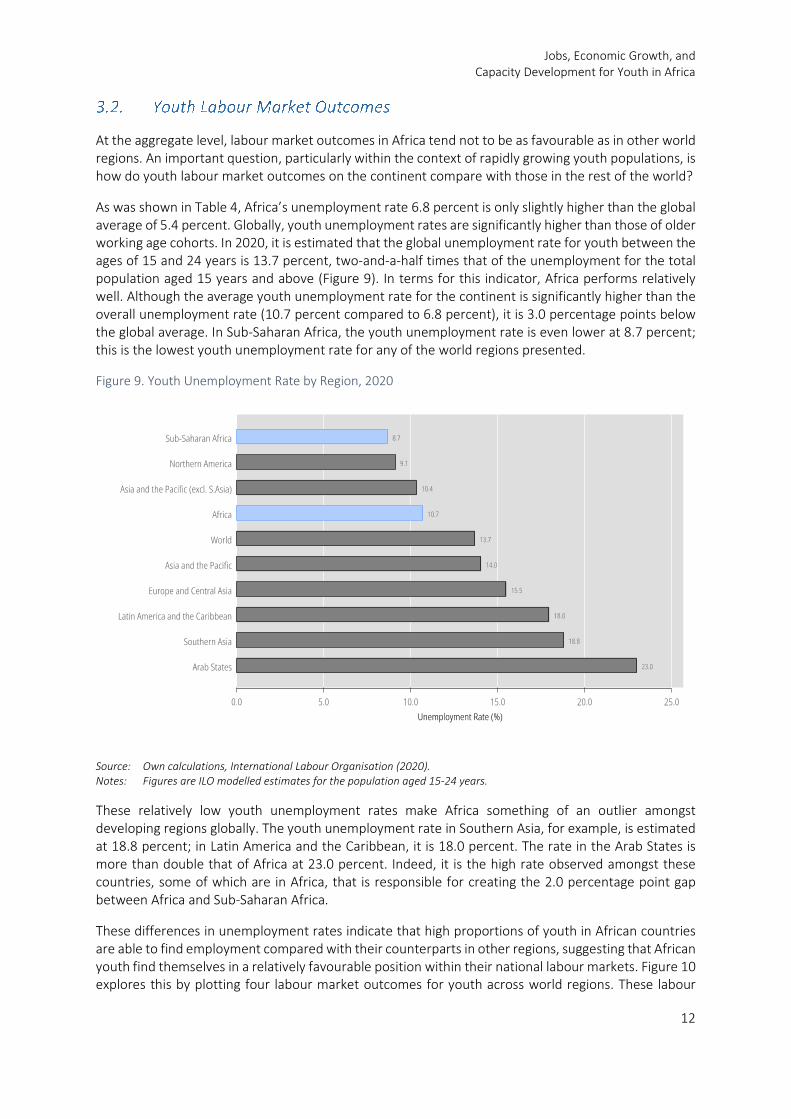
As was shown in Table 4, Africa’s unemployment rate 6.8 percent is only slightly higher than the global average of 5.4 percent. Globally, youth unemployment rates are significantly higher than those of older working age cohorts. In 2020, it is estimated that the global unemployment rate for youth between the ages of 15 and 24 years is 13.7 percent, two-and-a-half times that of the unemployment for the total population aged 15 years and above (Figure 9). In terms for this indicator, Africa performs relatively well. Although the average youth unemployment rate for the continent is significantly higher than the overall unemployment rate (10.7 percent compared to 6.8 percent), it is 3.0 percentage points below the global average. In Sub-Saharan Africa, the youth unemployment rate is even lower at 8.7 percent; this is the lowest youth unemployment rate for any of the world regions presented.
Figure 9. Youth Unemployment Rate by Region, 2020
Source: Own calculations, International Labour Organisation (2020). Notes: Figures are ILO modelled estimates for the population aged 15-24 years.
These relatively low youth unemployment rates make Africa something of an outlier amongst developing regions globally. The youth unemployment rate in Southern Asia, for example, is estimated at 18.8 percent; in Latin America and the Caribbean, it is 18.0 percent. The rate in the Arab States is more than double that of Africa at 23.0 percent. Indeed, it is the high rate observed amongst these countries, some of which are in Africa, that is responsible for creating the 2.0 percentage point gap between Africa and Sub-Saharan Africa.
These differences in unemployment rates indicate that high proportions of youth in African countries are able to find employment compared with their counterparts in other regions, suggesting that African youth find themselves in a relatively favourable position within their national labour markets. Figure 10 explores this by plotting four labour market outcomes for youth across world regions. These labour
DPRU WP202005
13
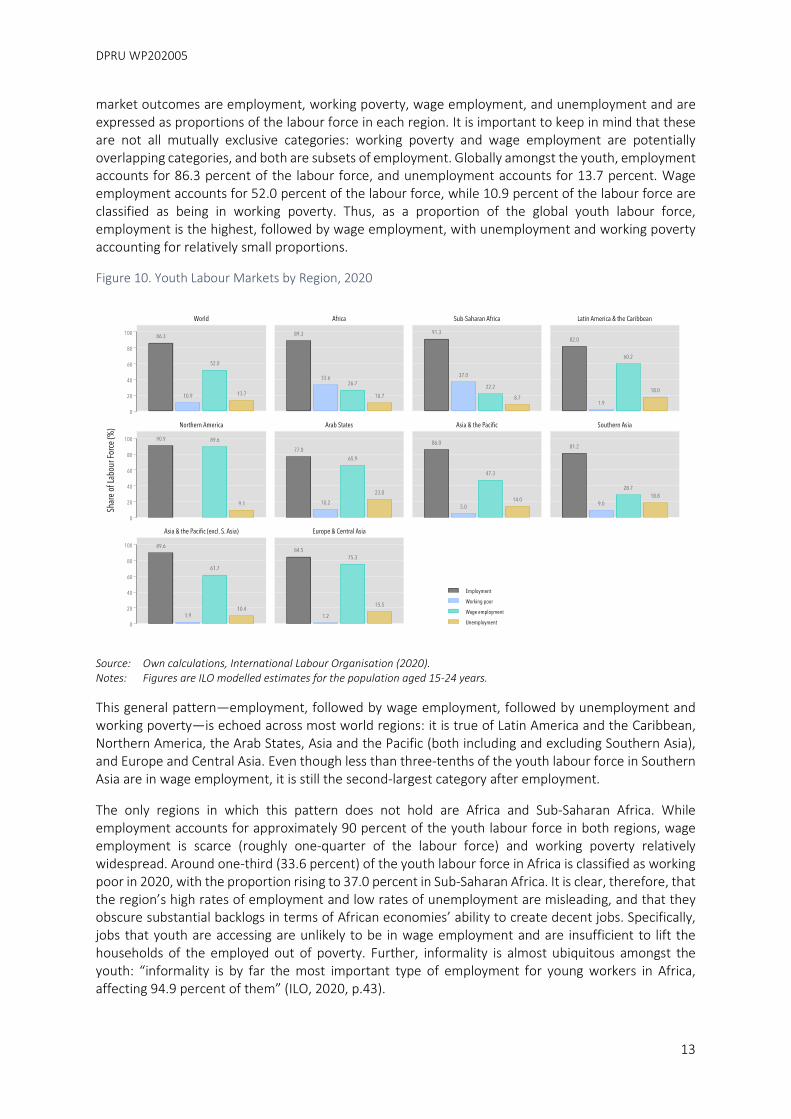
market outcomes are employment, working poverty, wage employment, and unemployment and are expressed as proportions of the labour force in each region. It is important to keep in mind that these are not all mutually exclusive categories: working poverty and wage employment are potentially overlapping categories, and both are subsets of employment. Globally amongst the youth, employment accounts for 86.3 percent of the labour force, and unemployment accounts for 13.7 percent. Wage employment accounts for 52.0 percent of the labour force, while 10.9 percent of the labour force are classified as being in working poverty. Thus, as a proportion of the global youth labour force, employment is the highest, followed by wage employment, with unemployment and working poverty accounting for relatively small proportions.
Figure 10. Youth Labour Markets by Region, 2020
Source: Own calculations, International Labour Organisation (2020). Notes: Figures are ILO modelled estimates for the population aged 15-24 years.
This general pattern—employment, followed by wage employment, followed by unemployment and working poverty—is echoed across most world regions: it is true of Latin America and the Caribbean, Northern America, the Arab States, Asia and the Pacific (both including and excluding Southern Asia), and Europe and Central Asia. Even though less than three-tenths of the youth labour force in Southern Asia are in wage employment, it is still the second-largest category after employment.
The only regions in which this pattern does not hold are Africa and Sub-Saharan Africa. While employment accounts for approximately 90 percent of the youth labour force in both regions, wage employment is scarce (roughly one-quarter of the labour force) and working poverty relatively widespread. Around one-third (33.6 percent) of the youth labour force in Africa is classified as working poor in 2020, with the proportion rising to 37.0 percent in Sub-Saharan Africa. It is clear, therefore, that the region’s high rates of employment and low rates of unemployment are misleading, and that they obscure substantial backlogs in terms of African economies’ ability to create decent jobs. Specifically, jobs that youth are accessing are unlikely to be in wage employment and are insufficient to lift the households of the employed out of poverty. Further, informality is almost ubiquitous amongst the youth: “informality is by far the most important type of employment for young workers in Africa, affecting 94.9 percent of them” (ILO, 2020, p.43).
Jobs, Economic Growth, and Capacity Development for Youth in Africa
14
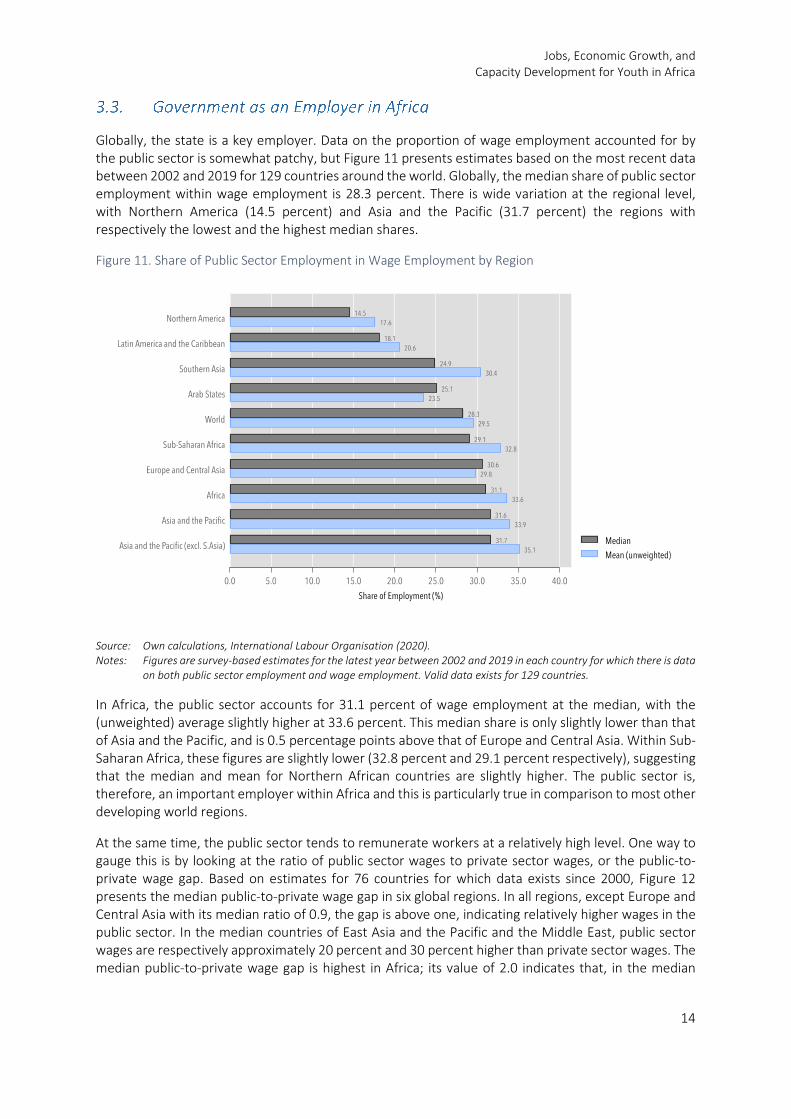
Globally, the state is a key employer. Data on the proportion of wage employment accounted for by the public sector is somewhat patchy, but Figure 11 presents estimates based on the most recent data between 2002 and 2019 for 129 countries around the world. Globally, the median share of public sector employment within wage employment is 28.3 percent. There is wide variation at the regional level, with Northern America (14.5 percent) and Asia and the Pacific (31.7 percent) the regions with respectively the lowest and the highest median shares.
Figure 11. Share of Public Sector Employment in Wage Employment by Region
Source: Own calculations, International Labour Organisation (2020). Notes: Figures are survey-based estimates for the latest year between 2002 and 2019 in each country for which there is data
on both public sector employment and wage employment. Valid data exists for 129 countries.
In Africa, the public sector accounts for 31.1 percent of wage employment at the median, with the (unweighted) average slightly higher at 33.6 percent. This median share is only slightly lower than that of Asia and the Pacific, and is 0.5 percentage points above that of Europe and Central Asia. Within Sub-Saharan Africa, these figures are slightly lower (32.8 percent and 29.1 percent respectively), suggesting that the median and mean for Northern African countries are slightly higher. The public sector is, therefore, an important employer within Africa and this is particularly true in comparison to most other developing world regions.
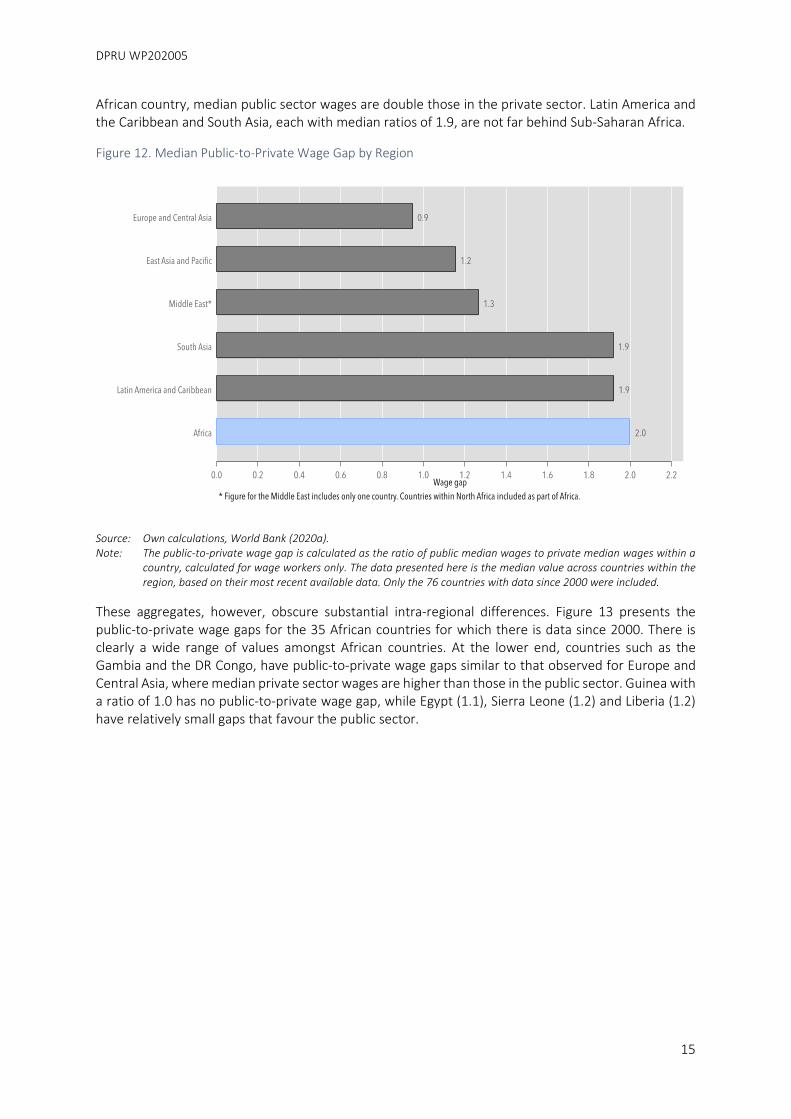
At the same time, the public sector tends to remunerate workers at a relatively high level. One way to gauge this is by looking at the ratio of public sector wages to private sector wages, or the public-to-private wage gap. Based on estimates for 76 countries for which data exists since 2000, Figure 12 presents the median public-to-private wage gap in six global regions. In all regions, except Europe and Central Asia with its median ratio of 0.9, the gap is above one, indicating relatively higher wages in the public sector. In the median countries of East Asia and the Pacific and the Middle East, public sector wages are respectively approximately 20 percent and 30 percent higher than private sector wages. The median public-to-private wage gap is highest in Africa; its value of 2.0 indicates that, in the median
DPRU WP202005
15
African country, median public sector wages are double those in the private sector. Latin America and the Caribbean and South Asia, each with median ratios of 1.9, are not far behind Sub-Saharan Africa.
Figure 12. Median Public-to-Private Wage Gap by Region
Source: Own calculations, World Bank (2020a). Note: The public-to-private wage gap is calculated as the ratio of public median wages to private median wages within a
country, calculated for wage workers only. The data presented here is the median value across countries within the region, based on their most recent available data. Only the 76 countries with data since 2000 were included.
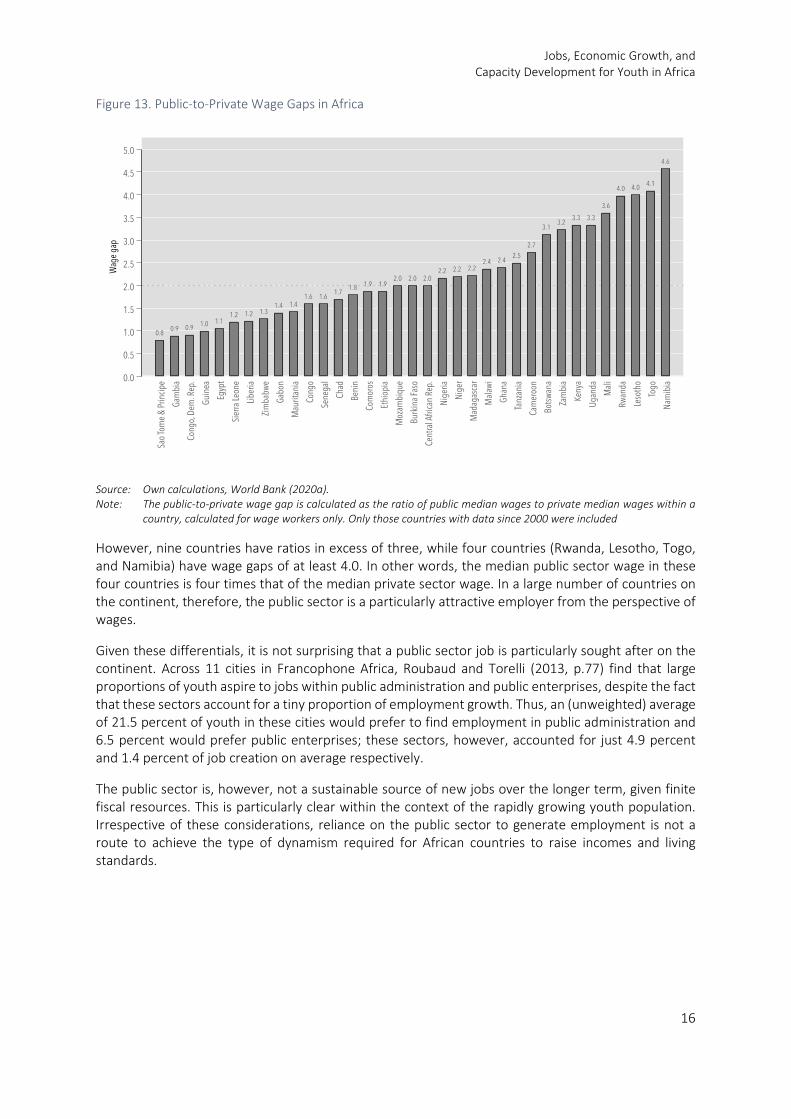
These aggregates, however, obscure substantial intra-regional differences. Figure 13 presents the public-to-private wage gaps for the 35 African countries for which there is data since 2000. There is clearly a wide range of values amongst African countries. At the lower end, countries such as the Gambia and the DR Congo, have public-to-private wage gaps similar to that observed for Europe and Central Asia, where median private sector wages are higher than those in the public sector. Guinea with a ratio of 1.0 has no public-to-private wage gap, while Egypt (1.1), Sierra Leone (1.2) and Liberia (1.2) have relatively small gaps that favour the public sector.
Jobs, Economic Growth, and Capacity Development for Youth in Africa
16
Figure 13. Public-to-Private Wage Gaps in Africa
Source: Own calculations, World Bank (2020a). Note: The public-to-private wage gap is calculated as the ratio of public median wages to private median wages within a
country, calculated for wage workers only. Only those countries with data since 2000 were included
However, nine countries have ratios in excess of three, while four countries (Rwanda, Lesotho, Togo, and Namibia) have wage gaps of at least 4.0. In other words, the median public sector wage in these four countries is four times that of the median private sector wage. In a large number of countries on the continent, therefore, the public sector is a particularly attractive employer from the perspective of wages.
Given these differentials, it is not surprising that a public sector job is particularly sought after on the continent. Across 11 cities in Francophone Africa, Roubaud and Torelli (2013, p.77) find that large proportions of youth aspire to jobs within public administration and public enterprises, despite the fact that these sectors account for a tiny proportion of employment growth. Thus, an (unweighted) average of 21.5 percent of youth in these cities would prefer to find employment in public administration and 6.5 percent would prefer public enterprises; these sectors, however, accounted for just 4.9 percent and 1.4 percent of job creation on average respectively.
The public sector is, however, not a sustainable source of new jobs over the longer term, given finite fiscal resources. This is particularly clear within the context of the rapidly growing youth population. Irrespective of these considerations, reliance on the public sector to generate employment is not a route to achieve the type of dynamism required for African countries to raise incomes and living standards.
DPRU WP202005
17
Conventional models of economic development present a sequential process of development that sees economies transition from agriculture to manufacturing, from rural- to urban-based activity (Lewis, 1954, for example). Over time, economies then transition from manufacturing into services. This type of process has been observed in various countries around the world, including both frontrunners in the process of economic development as well as countries still going through this process.
These models of development hinge on productivity differentials, with agriculture and manufacturing the typical examples of a relatively low productivity traditional sector and a relatively high productivity modern sector respectively. By shifting factors of production out of lower productivity activities and into higher productivity sectors, average productivity rises and economies grow; this is the case even without productivity growth in any individual sector. McMillan et al. (2014, p.11) point out that the evidence shows that these productivity differentials exist at more detailed levels of disaggregation—within sectors and between firms and plants—suggesting broader scope for such improvements in allocative efficiency. Thus, in the same way, redistribution of production factors between manufacturing subsectors, between the formal and informal sectors, or between firms may either promote or constrain growth.
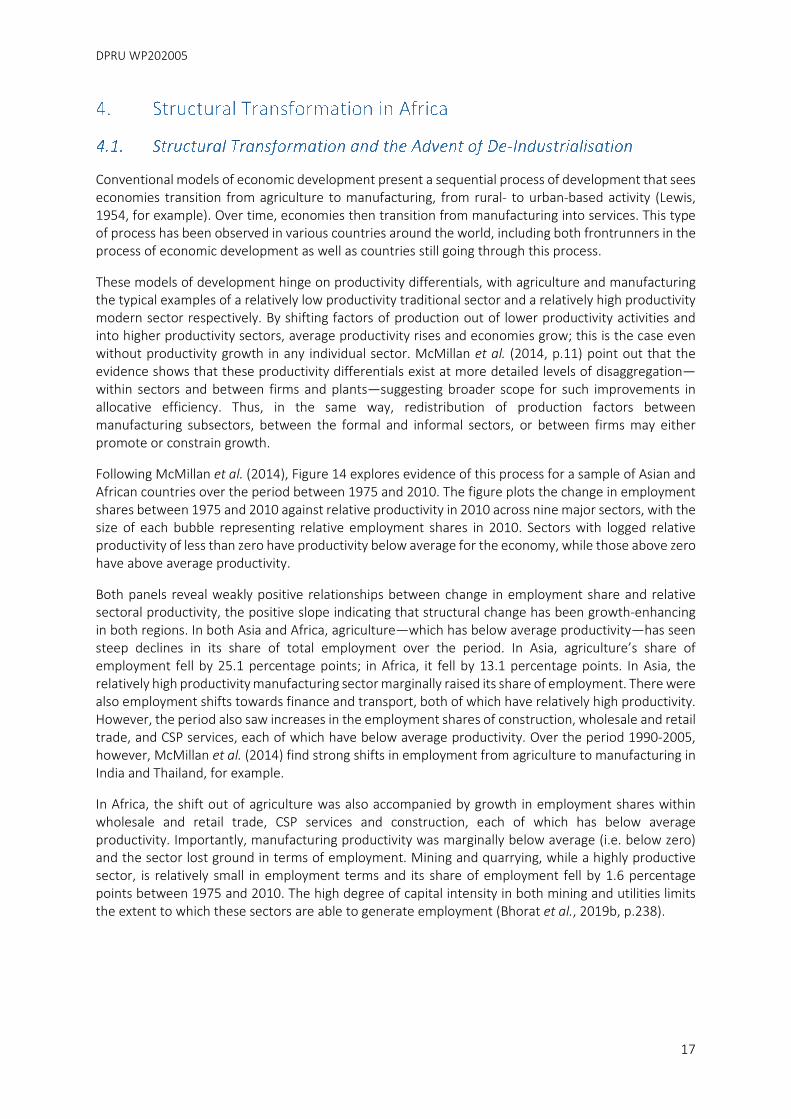
Following McMillan et al. (2014), Figure 14 explores evidence of this process for a sample of Asian and African countries over the period between 1975 and 2010. The figure plots the change in employment shares between 1975 and 2010 against relative productivity in 2010 across nine major sectors, with the size of each bubble representing relative employment shares in 2010. Sectors with logged relative productivity of less than zero have productivity below average for the economy, while those above zero have above average productivity.
Both panels reveal weakly positive relationships between change in employment share and relative sectoral productivity, the positive slope indicating that structural change has been growth-enhancing in both regions. In both Asia and Africa, agriculture—which has below average productivity—has seen steep declines in its share of total employment over the period. In Asia, agriculture’s share of employment fell by 25.1 percentage points; in Africa, it fell by 13.1 percentage points. In Asia, the relatively high productivity manufacturing sector marginally raised its share of employment. There were also employment shifts towards finance and transport, both of which have relatively high productivity. However, the period also saw increases in the employment shares of construction, wholesale and retail trade, and CSP services, each of which have below average productivity. Over the period 1990-2005, however, McMillan et al. (2014) find strong shifts in employment from agriculture to manufacturing in India and Thailand, for example.
In Africa, the shift out of agriculture was also accompanied by growth in employment shares within wholesale and retail trade, CSP services and construction, each of which has below average productivity. Importantly, manufacturing productivity was marginally below average (i.e. below zero) and the sector lost ground in terms of employment. Mining and quarrying, while a highly productive sector, is relatively small in employment terms and its share of employment fell by 1.6 percentage points between 1975 and 2010. The high degree of capital intensity in both mining and utilities limits the extent to which these sectors are able to generate employment (Bhorat et al., 2019b, p.238).
Jobs, Economic Growth, and Capacity Development for Youth in Africa
18
Figure 14. Relative Sectoral Productivity and Employment Changes in Asia and Africa, 1975-2010
Source: Own calculations, Timmer et al. (2015); World Bank (2020a). Note: Figure is based on based on McMillan et al. (2014). Sizes of bubbles reflect employment share within each region in
2010, and are not comparable between regions. Change in employment share and the log of relative sectoral productivity for each region are calculated as weighted averages of the country-level estimates, the weight being GDP in 2010 in USD. The black dashed line represents the fitted values, while β refers to the coefficient in the regression: ln(p/P ) = α+β∆(Employment Share), estimated separately for each region. Sectors are agriculture (Agric); mining; manufacturing (Mfg); electricity, gas and water supply (Util); construction (Constr); wholesale and retail trade, hotels and restaurants (W&R Trade); transport, storage, and communication (Transp); finance, insurance, real estate and business services (Fin); and community, social and personal services and government services (CSP Serv). The sample of Asian countries covers China, Hong Kong, Indonesia, India, Japan, South Korea, Malaysia, the Philippines, Singapore, and Thailand; the sample of African countries comprises Botswana, Egypt, Ethiopia, Ghana, Kenya, Mauritius, Malawi, Morocco, Nigeria, Senegal, Tanzania, South Africa, and Zambia.
In their analysis of the 1990-2005 period, McMillan et al. (2014) find important differences over time. For the full period, the authors find that, “[in] both Latin America and Africa, structural change has made a sizeable negative contribution to overall growth”, with the opposite true of Asia (McMillan et al., 2014, p.20). In Africa, reallocation of labour towards low productivity sectors lowered growth by an average of 1.3 percent per year. However, this negative relationship does not exist in the 2000-2005 period: the contribution of structural change to labour productivity growth on the continent during this period is estimated at 1.4 percentage points (using employment-weighted averages, or 0.4 percentage points using unweighted averages) (McMillan et al., 2014, p.24).
The importance of the manufacturing sector within the development process relates, in part, to the interlinkages with other sectors that are integral to success in manufacturing. Indeed, a thriving manufacturing sector requires a wide variety of direct and indirect linkages to other activities, from upstream linkages to the production and processing of raw materials, and the supply of other inputs, including power supply, to an array of downstream services required in the process of selling, including transportation and storage, marketing, and financing. However, in the case of Africa, these interlinkages are relatively weak, which constrains the ability of the manufacturing sector to grow as it might have in other regions.
DPRU WP202005
19
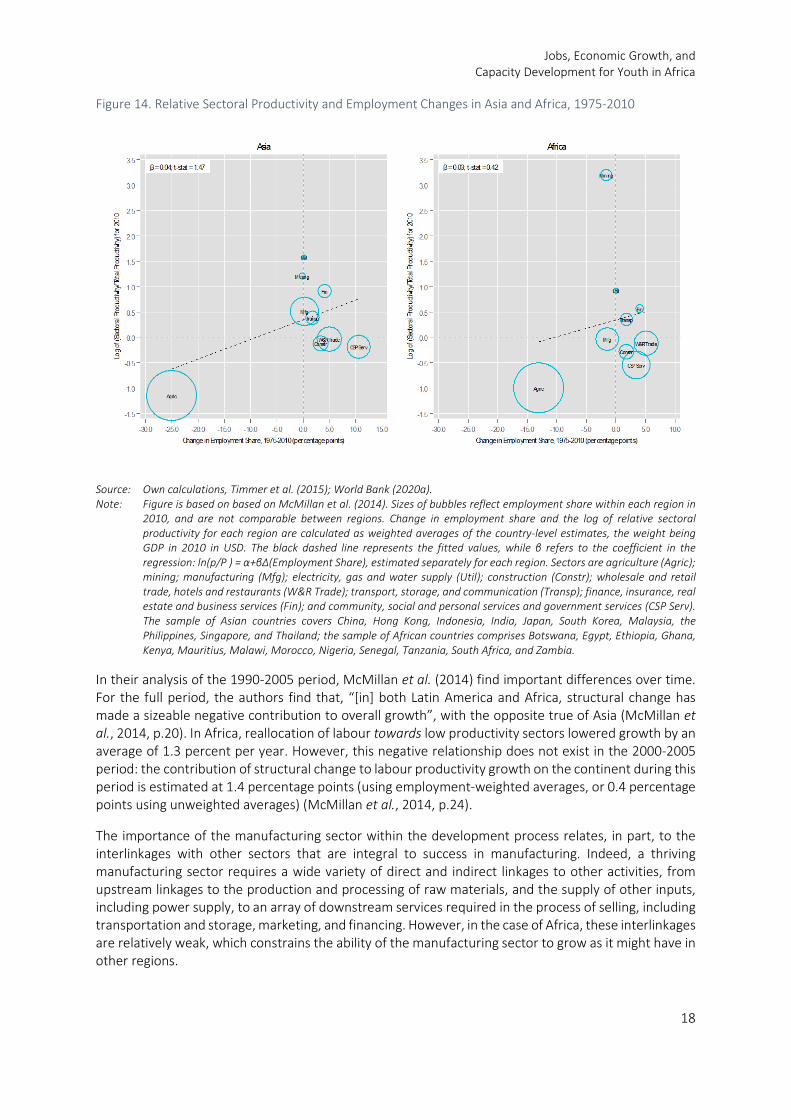
The result is the relatively weak performance of manufacturing in countries across Africa over the past several decades. Manufacturing’s share of gross value added is found to have been at best stagnant between 1970 and 2010 across the nine African countries in the GGDC 10-Sector Database (Figure 15). The best performance amongst these countries was that of Zambia, where manufacturing increased its share by 5.4 percentage points over four decades. Mauritius (+4.3 percentage points), Ethiopia (+1.4 percentage points) and Botswana (0.5 percentage points were the only other countries to see even marginal increases. However, in each of these countries, except Mauritius, manufacturing’s share of GVA in 2010 remained in the single digits.
Figure 15. Manufacturing as a Share of Gross Value Added, 1970-2010
Source: Own calculations using Groningen Growth and Development Centre 10-Sector Database, Timmer et al. (2015). Note: Shares are calculated using gross value added at current national prices.
In contrast, manufacturing’s share of GVA contracted by 14.1 percentage points in Nigeria, 11.7 percentage points in Tanzania, 9.6 percentage points in South Africa and 8.0 percentage points in Ghana. These declines, alongside relatively weak improvements in the other countries in the sample, suggest the early advent of deindustrialisation on the continent.
The relationship between countries’ income levels and the importance of manufacturing within the economy has historically exhibited an inverted U-shape. At lower levels of development, per capita incomes are lower and manufacturing accounts for a relatively small share of total output. Rising incomes are associated with large increases in the manufacturing share of GDP. At higher income levels, economies start diversifying and the service sectors grow relative to total output; as a result, the manufacturing share of GDP begins to fall. This relationship is illustrated in Figure 16, which is taken from Newfarmer et al. (2018).

Jobs, Economic Growth, and Capacity Development for Youth in Africa
20
Figure 16. Manufacturing as a Share of GDP relative to GDP per capita
Source: Reproduced from Newfarmer et al. (2018, p.8).
The figure also illustrates that this inverted U-shape relationship has changed over the past four decades: in each successive decade, manufacturing value added as a percentage of GDP declines at a given level of GDP per capita. As Newfarmer et al. (2018, p.8) note, “[where] in the 1980s, average shares of manufacturing in GDP peaked at nearly 20 per cent of GDP, in today’s world the average peak is about 14 per cent”. These declines are at least partly explained by the shifting boundaries between the manufacturing and services sectors, with services firms providing key inputs into the production processes of manufacturing firms (Hallward-Driemeier and Nayyar, 2018; Hoekman, 2018). As a result, part of the relative decline of manufacturing and relative growth of services may simply be due to the reclassification of services that have been increasingly outsourced by manufacturing firms. Relatedly, Rodrik (2016) shows that manufacturing employment is peaking in developing countries sooner than was the case for early industrialisers, and that the peaks themselves are also lower, while Hallward-Driemeier and Nayyar (2018, p.52) find that three-quarters of countries globally are experiencing declines in their manufacturing shares of GDP.
The weakness in job creation in Africa over the past few decades is the result of a growth path that has been heavily reliant on extractive and other capital intensive industries. As Bhorat et al. (2019b, p.238) note, “the African growth experience over the past thirty-five years, in general, can be characterized as having manifested in the growth of capital-intensive resource- and energy-based industries, which in turn have not generated a sufficient number of jobs”.
The previous section presented evidence on the relative weakness of manufacturing in Africa. While there has been a reallocation of resources and labour away from agriculture, manufacturing has not seen any growth in its share of employment in a sample of African countries. Indeed, over the four decades since 1970, manufacturing in these countries declined or, at best, stagnated as a share of GVA. Finally, the period has also seen declines in the cross-country average share of manufacturing value added within GDP at all income levels. Within this context, the question arises as to whether services represents a viable alternative to manufacturing for developing countries as a pathway to higher incomes.
DPRU WP202005
21
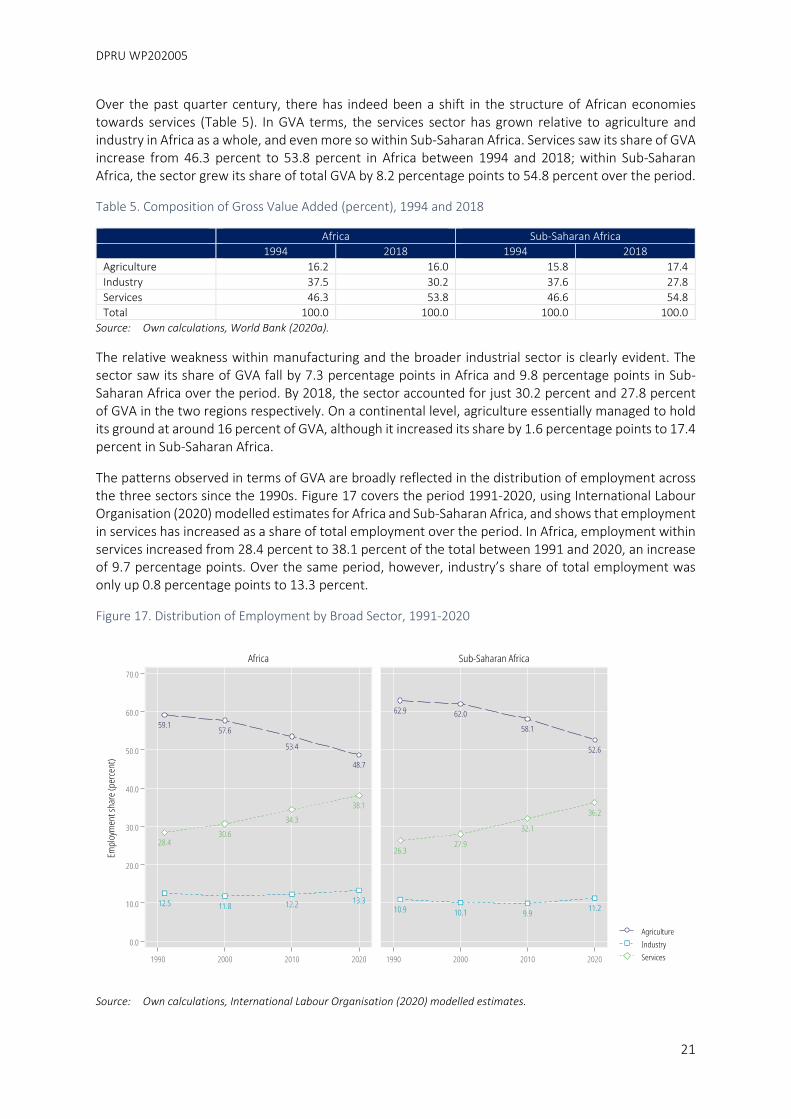
Over the past quarter century, there has indeed been a shift in the structure of African economies towards services (Table 5). In GVA terms, the services sector has grown relative to agriculture and industry in Africa as a whole, and even more so within Sub-Saharan Africa. Services saw its share of GVA increase from 46.3 percent to 53.8 percent in Africa between 1994 and 2018; within Sub-Saharan Africa, the sector grew its share of total GVA by 8.2 percentage points to 54.8 percent over the period.
Table 5. Composition of Gross Value Added (percent), 1994 and 2018
Africa Sub-Saharan Africa 1994 2018 1994 2018 Agriculture 16.2 16.0 15.8 17.4 Industry 37.5 30.2 37.6 27.8 Services 46.3 53.8 46.6 54.8 Total 100.0 100.0 100.0 100.0
Source: Own calculations, World Bank (2020a).
The relative weakness within manufacturing and the broader industrial sector is clearly evident. The sector saw its share of GVA fall by 7.3 percentage points in Africa and 9.8 percentage points in Sub-Saharan Africa over the period. By 2018, the sector accounted for just 30.2 percent and 27.8 percent of GVA in the two regions respectively. On a continental level, agriculture essentially managed to hold its ground at around 16 percent of GVA, although it increased its share by 1.6 percentage points to 17.4 percent in Sub-Saharan Africa.
The patterns observed in terms of GVA are broadly reflected in the distribution of employment across the three sectors since the 1990s. Figure 17 covers the period 1991-2020, using International Labour Organisation (2020) modelled estimates for Africa and Sub-Saharan Africa, and shows that employment in services has increased as a share of total employment over the period. In Africa, employment within services increased from 28.4 percent to 38.1 percent of the total between 1991 and 2020, an increase of 9.7 percentage points. Over the same period, however, industry’s share of total employment was only up 0.8 percentage points to 13.3 percent.
Figure 17. Distribution of Employment by Broad Sector, 1991-2020
Source: Own calculations, International Labour Organisation (2020) modelled estimates.
Jobs, Economic Growth, and Capacity Development for Youth in Africa
22
With industry flat and services rising as a proportion of total African employment, agriculture’s share declined by more than ten percentage points between 1991 and 2020. Nevertheless, the sector remained the dominant employment sector, accounting for 48.7 percent of total employment in 2020. These figures, in combination with the GVA shares presented in Table 5, highlight the very low productivity of the agricultural sector on the continent: agriculture’s employment share at the end of the period is roughly three times its share of GVA. The patterns observed at the continental level are very similar to those for Sub-Saharan Africa.
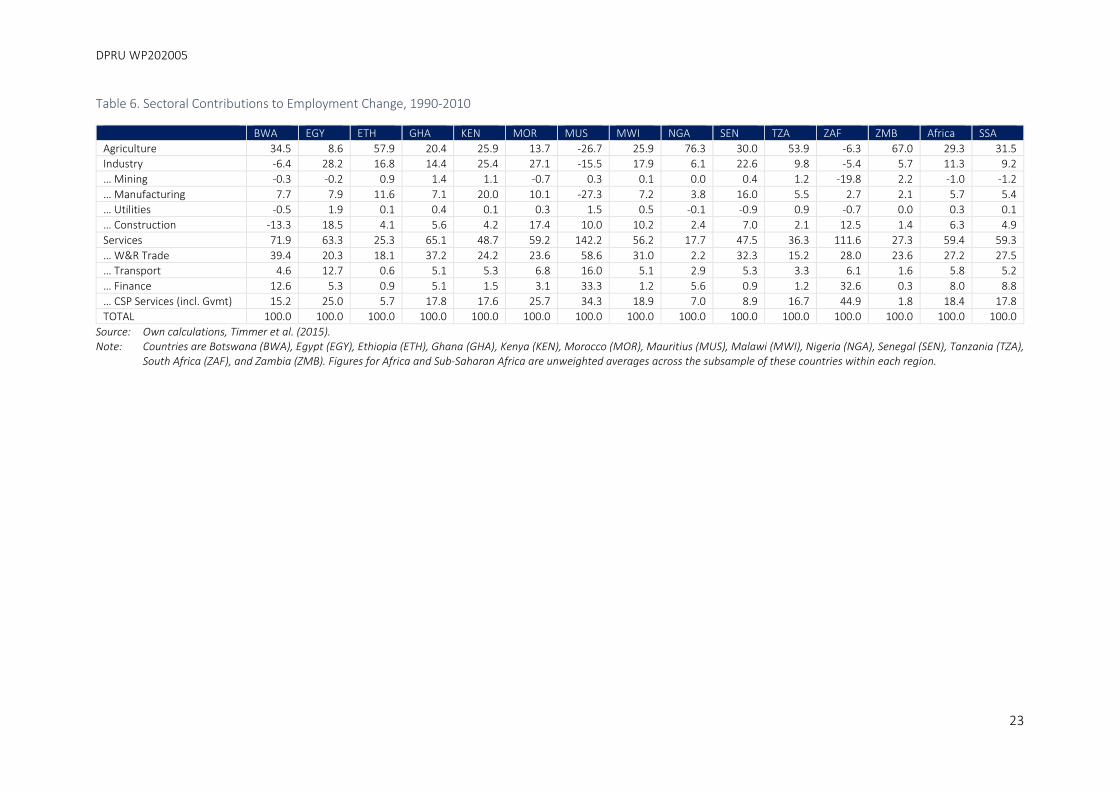
Services have, therefore, accounted for substantial proportions of employment growth in Africa over the past few decades. However, what is of particular importance is the type of service sectors that have been growing, since this impacts on, amongst other things, the type of jobs being created. Table 6presents the contributions to total employment change over the 1990-2010 period by individual sectors for a sample of 13 African countries in the Timmer et al. (2015) data. The table further provides (unweighted) average figures for Africa and Sub-Saharan Africa.
For the sample of African countries, almost three-fifths (59.4 percent) of employment growth over the two decades was accounted for by the services sector. Over the same period, agriculture accounted for 29.3 percent of employment growth, while industry accounted for just 11.3 percent. The figures for Sub-Saharan Africa were very similar, with agriculture accounting for a slightly higher and industry for a slightly lower proportion of employment growth at 31.5 percent and 9.2 percent respectively. These proportions are consistent with the patterns observed earlier in Figure 17, which uses different data.
DPRU WP202005
23
Table 6. Sectoral Contributions to Employment Change, 1990-2010
BWA EGY ETH GHA KEN MOR MUS MWI NGA SEN TZA ZAF ZMB Africa SSA Agriculture 34.5 8.6 57.9 20.4 25.9 13.7 -26.7 25.9 76.3 30.0 53.9 -6.3 67.0 29.3 31.5 Industry -6.4 28.2 16.8 14.4 25.4 27.1 -15.5 17.9 6.1 22.6 9.8 -5.4 5.7 11.3 9.2 … Mining -0.3 -0.2 0.9 1.4 1.1 -0.7 0.3 0.1 0.0 0.4 1.2 -19.8 2.2 -1.0 -1.2 … Manufacturing 7.7 7.9 11.6 7.1 20.0 10.1 -27.3 7.2 3.8 16.0 5.5 2.7 2.1 5.7 5.4 … Utilities -0.5 1.9 0.1 0.4 0.1 0.3 1.5 0.5 -0.1 -0.9 0.9 -0.7 0.0 0.3 0.1 … Construction -13.3 18.5 4.1 5.6 4.2 17.4 10.0 10.2 2.4 7.0 2.1 12.5 1.4 6.3 4.9 Services 71.9 63.3 25.3 65.1 48.7 59.2 142.2 56.2 17.7 47.5 36.3 111.6 27.3 59.4 59.3 … W&R Trade 39.4 20.3 18.1 37.2 24.2 23.6 58.6 31.0 2.2 32.3 15.2 28.0 23.6 27.2 27.5 … Transport 4.6 12.7 0.6 5.1 5.3 6.8 16.0 5.1 2.9 5.3 3.3 6.1 1.6 5.8 5.2 … Finance 12.6 5.3 0.9 5.1 1.5 3.1 33.3 1.2 5.6 0.9 1.2 32.6 0.3 8.0 8.8 … CSP Services (incl. Gvmt) 15.2 25.0 5.7 17.8 17.6 25.7 34.3 18.9 7.0 8.9 16.7 44.9 1.8 18.4 17.8 TOTAL 100.0 100.0 100.0 100.0 100.0 100.0 100.0 100.0 100.0 100.0 100.0 100.0 100.0 100.0 100.0
Source: Own calculations, Timmer et al. (2015). Note: Countries are Botswana (BWA), Egypt (EGY), Ethiopia (ETH), Ghana (GHA), Kenya (KEN), Morocco (MOR), Mauritius (MUS), Malawi (MWI), Nigeria (NGA), Senegal (SEN), Tanzania (TZA),
South Africa (ZAF), and Zambia (ZMB). Figures for Africa and Sub-Saharan Africa are unweighted averages across the subsample of these countries within each region.
Jobs, Economic Growth, and Capacity Development for Youth in Africa
24
Within services, the primary drivers of employment growth were wholesale and retail trade, and CSP services. Wholesale and retail trade accounted for 27.2 percent of total employment growth on average amongst African countries (27.5 percent for Sub-Saharan Africa), while CSP services accounted for 18.4 percent on average (17.8 percent for Sub-Saharan Africa). Transport and finance together accounted for under 14 percent of total employment growth in Africa, less than half the share of agriculture. In other words, while the services sector dominated employment creation on the continent, the majority of this growth derived from more traditional services sectors, while growth in the modern services sectors—transport, storage and communication, and finance, insurance, real estate and business services—was far less important to overall employment growth.
Employment trends over the 20-year period therefore do not suggest a qualitative shift amongst African countries in employment growth towards the more dynamic modern services sectors. Wholesale and retail trade is typically associated with a high degree of informality, while a large proportion of CSP services employment falls within the public sector. In the case of the former sector, employment growth is likely to be associated with a rise in the prevalence of low-paid and precarious work, while responsibility for employment creation in the latter falls disproportionately on already-constrained governments.
The dominance of wholesale and retail trade within employment growth on the continent is reflected in the fact that the sector was one of the three largest contributors to employment growth over the period in each of the 13 countries in the sample, except for Nigeria. Similarly, CSP services was amongst the top three sectors in nine of the 13 countries. In contrast, it was only in Mauritius (33.3 percent of employment growth) and South Africa (32.6 percent) that finance contributed substantially to total employment growth, while the only countries where transport contributed more than 10 percentage points were Mauritius (16.0 percent) and Egypt (12.7 percent).
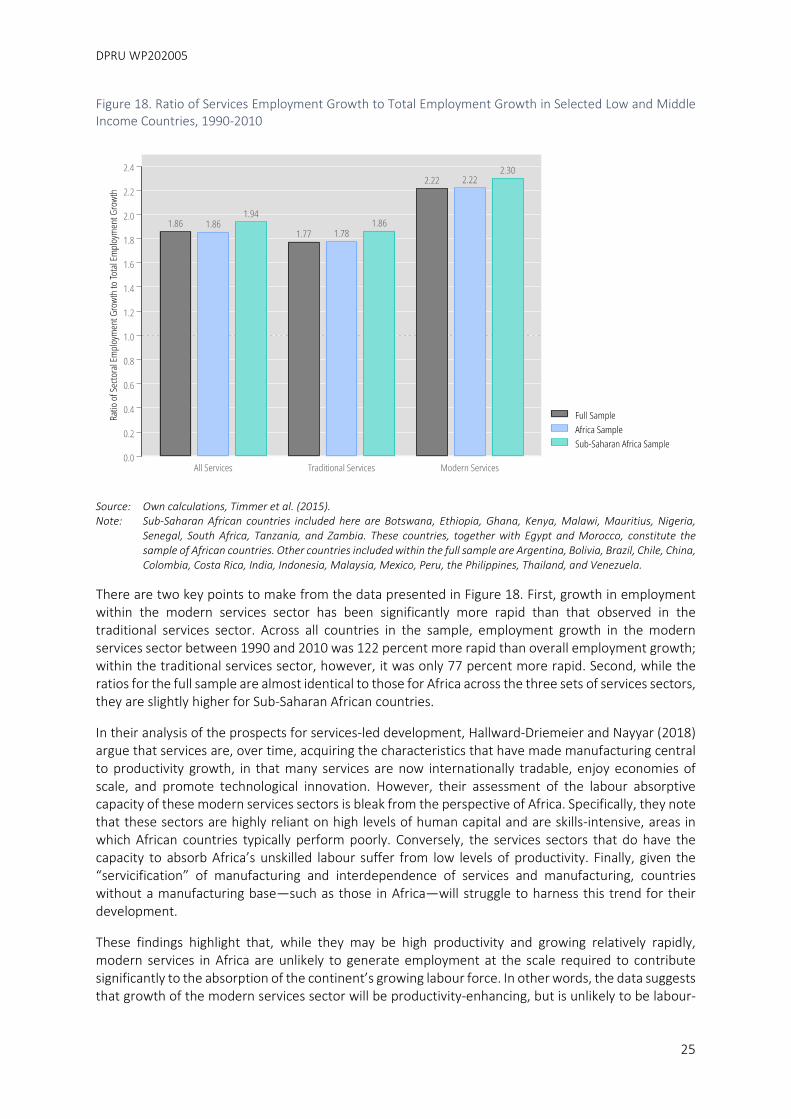
Despite the relatively small contributions to employment growth by the modern services sectors over the 1990-2010 period, Figure 18 illustrates the potential of these sectors and their ability to drive employment growth. The figure presents the ratio of employment growth rate in the services sector to the employment growth rate in the overall economy, presenting estimates for the overall services sector, the traditional services sector, and the modern services sector. For the full sample of countries in the dataset, the ratio of services employment growth to total employment growth is 1.86, indicating that employment growth in the services sector is 86 percent higher than the total employment growth rate.
DPRU WP202005
25
Figure 18. Ratio of Services Employment Growth to Total Employment Growth in Selected Low and Middle Income Countries, 1990-2010
Source: Own calculations, Timmer et al. (2015). Note: Sub-Saharan African countries included here are Botswana, Ethiopia, Ghana, Kenya, Malawi, Mauritius, Nigeria,
Senegal, South Africa, Tanzania, and Zambia. These countries, together with Egypt and Morocco, constitute the sample of African countries. Other countries included within the full sample are Argentina, Bolivia, Brazil, Chile, China, Colombia, Costa Rica, India, Indonesia, Malaysia, Mexico, Peru, the Philippines, Thailand, and Venezuela.
There are two key points to make from the data presented in Figure 18. First, growth in employment within the modern services sector has been significantly more rapid than that observed in the traditional services sector. Across all countries in the sample, employment growth in the modern services sector between 1990 and 2010 was 122 percent more rapid than overall employment growth; within the traditional services sector, however, it was only 77 percent more rapid. Second, while the ratios for the full sample are almost identical to those for Africa across the three sets of services sectors, they are slightly higher for Sub-Saharan African countries.
In their analysis of the prospects for services-led development, Hallward-Driemeier and Nayyar (2018) argue that services are, over time, acquiring the characteristics that have made manufacturing central to productivity growth, in that many services are now internationally tradable, enjoy economies of scale, and promote technological innovation. However, their assessment of the labour absorptive capacity of these modern services sectors is bleak from the perspective of Africa. Specifically, they note that these sectors are highly reliant on high levels of human capital and are skills-intensive, areas in which African countries typically perform poorly. Conversely, the services sectors that do have the capacity to absorb Africa’s unskilled labour suffer from low levels of productivity. Finally, given the “servicification” of manufacturing and interdependence of services and manufacturing, countries without a manufacturing base—such as those in Africa—will struggle to harness this trend for their development.
These findings highlight that, while they may be high productivity and growing relatively rapidly, modern services in Africa are unlikely to generate employment at the scale required to contribute significantly to the absorption of the continent’s growing labour force. In other words, the data suggests that growth of the modern services sector will be productivity-enhancing, but is unlikely to be labour-
Jobs, Economic Growth, and Capacity Development for Youth in Africa
26
absorbing. If this is the case, the key question that emerges is whether this implies that growth paths dependent on manufacturing and agro-processing remain central to job creation in Africa.
The debate around manufacturing and industrialisation as a pathway to higher incomes tends to gloss over heterogeneity within the manufacturing sector. By treating manufacturing as a single aggregate rather than a collection of varied activities, the discussion often misses the fact that each of these activities may have very different requirements—in terms of inputs of raw materials, intermediate goods, labour, capital, and support services—and that these differences strongly influence the ability of firms to engage in these activities.
The concept of economic complexity, as introduced by Hidalgo et al. (2007); Hidalgo and Hausmann (2009); Hausmann et al. (2013), begins with the recognition that a product is the embodiment of an array of knowledge. While some knowledge—“explicit knowledge”—is relatively easily transferred between individuals, so-called tacit knowledge requires a process of transfer that is “costly and time-consuming” (Hausmann et al., 2013, p.16). By specialising in a particular area, individuals can accumulate the knowledge required to perform a particular function. Hausmann et al. (2013, p.16) refer to these “modularized chunks of embedded knowledge” as capabilities, and note that modularisation may occur at the level of the individual, the organisation, or the set of organisations.
In this context, producing a given product requires a particular set of capabilities: without the full set of capabilities, the product cannot be produced. More complex products require a wider array of productive knowledge, necessitating the bringing together of ever larger numbers of individuals and organisations with the requisite capabilities directly or indirectly through the use of intermediate goods. According to Hausmann et al. (2013, p.18), “[economic] complexity is a measure of how intricate this network of interactions is and hence of how much productive knowledge a society mobilizes”.
Since it is not possible to directly ascertain the amount of productive knowledge embedded within a country, the economic complexity approach is to infer this from looking at how many different kinds of products a country is able to produce. The first key piece of information for the analysis of economic complexity is diversity, or the range of different products the country produces. The second piece of information is referred to as ubiquity, which refers to the number of countries that produce a given product. A country with a wide range of capabilities is likely to produce a wide range of products; in other words, the country is characterised by a high level of diversity. At the same time, a product that requires a wide range of capabilities is likely to be produced by only those few countries with a sufficiently wide range of capabilities; in other words, the product is characterised by low ubiquity.
In more practical terms, a country’s economic complexity is inferred from the diversity of the products it produces. Assessing the ubiquity of the products it produces provides more nuanced information about the country’s economic complexity. By looking at the diversity of the other countries that produce these products, the assessment of the first country’s economic complexity is further refined. By repeating this process, measures of the complexity of countries (the Economic Complexity Index or ECI) and of products (the Product Complexity Index or PCI) are calculated.
DPRU WP202005
27
Box 1. Calculating Economic Complexity Measures
As a starting point, we consider the framework outlined by Hidalgo et al. (2014): consider the matrix 𝑀𝑀, with elements 𝑀𝑀𝑐𝑐,𝑝𝑝 which are equal to 1 if country 𝑐𝑐 exports product 𝑝𝑝 with relative comparative advantage (i.e. RCA≥1) and 0 otherwise. Diversity and ubiquity can be calculated by summing along the rows and columns of the matrix, respectively. Formally, we can define these concepts as:
𝐷𝐷𝐷𝐷𝐷𝐷𝐷𝐷𝐷𝐷𝐷𝐷𝐷𝐷𝐷𝐷𝐷𝐷 = 𝑑𝑑𝑐𝑐,0 = ∑ 𝑀𝑀𝑐𝑐,𝑝𝑝𝑝𝑝 (1)
𝑈𝑈𝑈𝑈𝐷𝐷𝑈𝑈𝑈𝑈𝐷𝐷𝐷𝐷𝐷𝐷 = 𝑈𝑈𝑝𝑝,0 = ∑ 𝑀𝑀𝑐𝑐,𝑝𝑝𝑐𝑐 (2)
However, diversity and ubiquity by themselves are not sufficient to provide a nuanced measure of economic complexity. Rather, one has to refine the notion of diversity of a country by considering the ubiquity of the products it exports, and vice versa. For example, two countries with the same diversity can be ranked according to the average ubiquity of the products they produce in order to refine our ranking of complexity. Analogously, if two products have the same ubiquity, then one refines the notion of product complexity by considering the average diversity of the countries which export those products. This refinement is mathematically defined according to the following recursion
𝑑𝑑𝑐𝑐,𝑁𝑁 = 1𝑑𝑑𝑐𝑐,0
∑ 𝑀𝑀𝑐𝑐,𝑝𝑝 ∙ 𝑈𝑈𝑝𝑝,𝑁𝑁−1𝑝𝑝 (3)
𝑈𝑈𝑝𝑝,𝑁𝑁 = 1𝑢𝑢𝑝𝑝,0
∑ 𝑀𝑀𝑐𝑐,𝑝𝑝 ∙ 𝑑𝑑𝑐𝑐,𝑁𝑁−1𝑐𝑐 (4)
At this point, it should be noted that simply applying the recursion iteratively until a steady state is reached would correspond to the method of reflections approach to calculating the ECI of country X. However, this method is not the preferred one for computing the ECI due to, among other things: its lack of practical interpretability after a number of iterations, and the fact that the natural fixed point of the system would result in the ECI for all countries being equal, which is uninformative (Calderelli et al., 2012; Cristelli et al., 2013).
Calderelli, et al. (2012) present an alternative method of solving for the ECI through the use of the spectral properties of a linear system. They prove that solving for each country’s ECI through the method of reflections is equivalent to the method of solving for the ECI through eigenvectors, however, without the same drawbacks that are present in the method of reflections (Calderelli et al., 2012).
The coefficient matrix of the linear system to be analysed is given by 𝑀𝑀� , whose rows and columns represent countries, and whose elements 𝑀𝑀�𝑖𝑖,𝑗𝑗 are defined as follows:
𝑀𝑀�𝑋𝑋,𝑐𝑐 = ∑ 𝑀𝑀𝑋𝑋,𝑝𝑝𝑀𝑀𝑐𝑐,𝑝𝑝
𝑑𝑑𝑐𝑐,0𝑢𝑢𝑝𝑝,0𝑝𝑝 (5)
Equivalently, the matrix 𝑀𝑀� can be written in matrix notation as
𝑀𝑀� = 𝐷𝐷−1𝑀𝑀𝑈𝑈−1𝑀𝑀′ (6)
Where 𝐷𝐷 is a diagonal matrix with entries along the main diagonal being the diversity measures for each country as defined in equation (1), and 𝑈𝑈 is the diagonal matrix with diagonal entries equal to product ubiquities, as per equation (2).
The vector of ECI values for all countries is then defined by the eigenvector corresponding to the second-largest right-eigenvalue of the matrix 𝑀𝑀� . It is common practice to standardize this ECI vector by subtracting the mean and dividing by the standard deviation of the vector’s entries, and it is this standardized version of the ECI which is presented throughout this paper.
As a result, one can define the ECI mathematically as:
𝐸𝐸𝐶𝐶𝐶𝐶 = 𝐷𝐷��⃗ −<𝐷𝐷��⃗ >𝑠𝑠𝑑𝑑(𝐷𝐷��⃗ )
(7)
where 𝐷𝐷��⃗ is the eigenvector associated with the second-largest right eigenvalue of 𝑀𝑀� , <∙> represents the mean of the vector, and 𝐷𝐷𝑑𝑑(∙) represents the standard deviation.
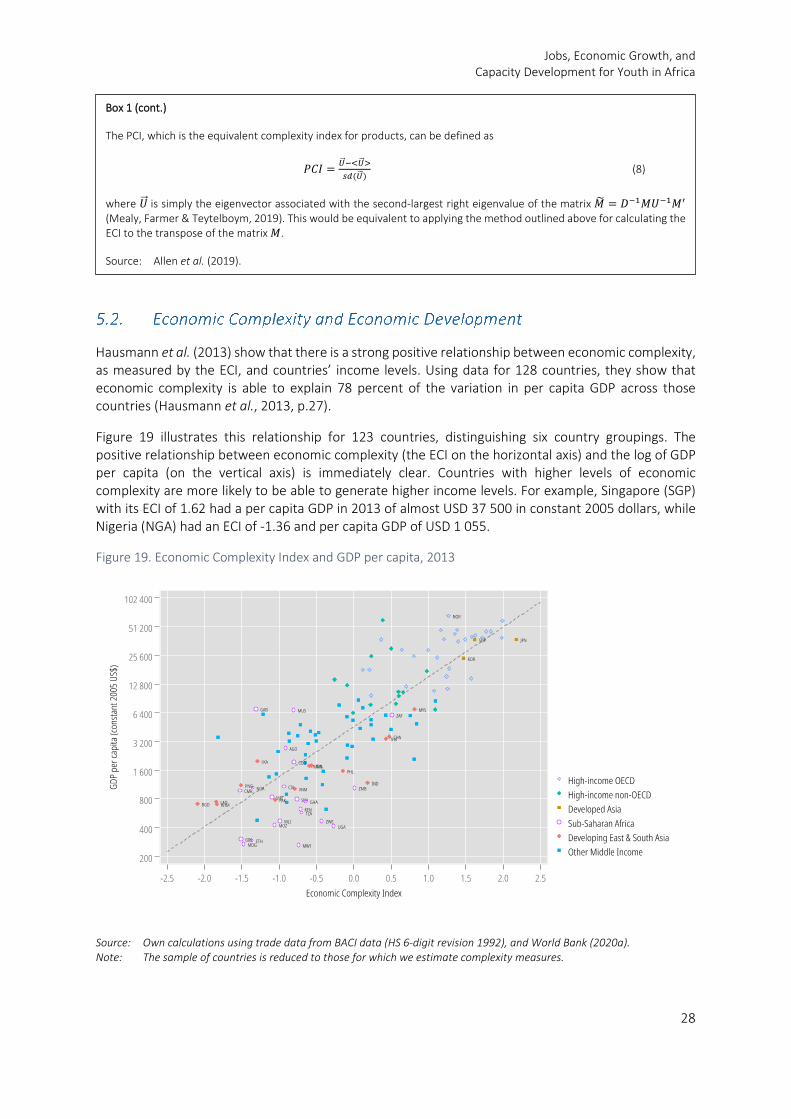
Jobs, Economic Growth, and Capacity Development for Youth in Africa
28
Hausmann et al. (2013) show that there is a strong positive relationship between economic complexity, as measured by the ECI, and countries’ income levels. Using data for 128 countries, they show that economic complexity is able to explain 78 percent of the variation in per capita GDP across those countries (Hausmann et al., 2013, p.27).
Figure 19 illustrates this relationship for 123 countries, distinguishing six country groupings. The positive relationship between economic complexity (the ECI on the horizontal axis) and the log of GDP per capita (on the vertical axis) is immediately clear. Countries with higher levels of economic complexity are more likely to be able to generate higher income levels. For example, Singapore (SGP) with its ECI of 1.62 had a per capita GDP in 2013 of almost USD 37 500 in constant 2005 dollars, while Nigeria (NGA) had an ECI of -1.36 and per capita GDP of USD 1 055.
Figure 19. Economic Complexity Index and GDP per capita, 2013
Source: Own calculations using trade data from BACI data (HS 6-digit revision 1992), and World Bank (2020a). Note: The sample of countries is reduced to those for which we estimate complexity measures.
Box 1 (cont.)
The PCI, which is the equivalent complexity index for products, can be defined as
𝑃𝑃𝐶𝐶𝐶𝐶 = 𝑈𝑈��⃗ −<𝑈𝑈��⃗ >𝑠𝑠𝑑𝑑(𝑈𝑈��⃗ )
(8)
where 𝑈𝑈��⃗ is simply the eigenvector associated with the second-largest right eigenvalue of the matrix 𝑀𝑀� = 𝐷𝐷−1𝑀𝑀𝑈𝑈−1𝑀𝑀′ (Mealy, Farmer & Teytelboym, 2019). This would be equivalent to applying the method outlined above for calculating the ECI to the transpose of the matrix 𝑀𝑀.
Source: Allen et al. (2019).
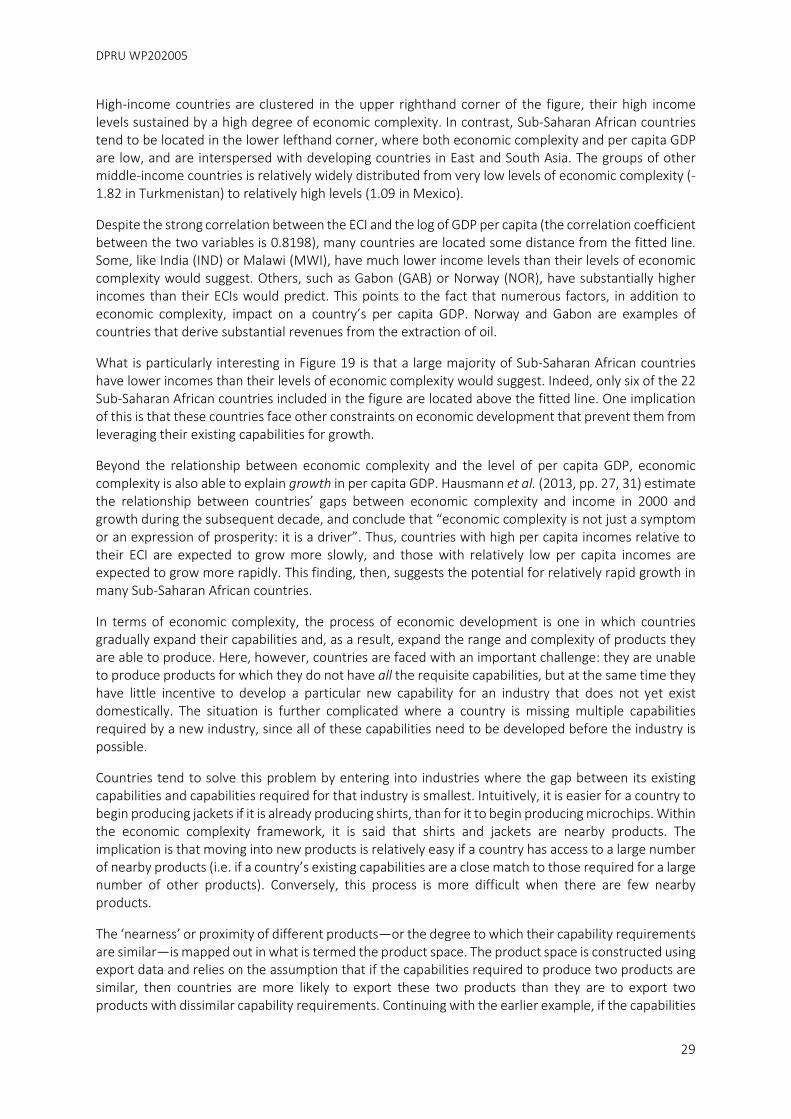
DPRU WP202005
29
High-income countries are clustered in the upper righthand corner of the figure, their high income levels sustained by a high degree of economic complexity. In contrast, Sub-Saharan African countries tend to be located in the lower lefthand corner, where both economic complexity and per capita GDP are low, and are interspersed with developing countries in East and South Asia. The groups of other middle-income countries is relatively widely distributed from very low levels of economic complexity (-1.82 in Turkmenistan) to relatively high levels (1.09 in Mexico).
Despite the strong correlation between the ECI and the log of GDP per capita (the correlation coefficient between the two variables is 0.8198), many countries are located some distance from the fitted line. Some, like India (IND) or Malawi (MWI), have much lower income levels than their levels of economic complexity would suggest. Others, such as Gabon (GAB) or Norway (NOR), have substantially higher incomes than their ECIs would predict. This points to the fact that numerous factors, in addition to economic complexity, impact on a country’s per capita GDP. Norway and Gabon are examples of countries that derive substantial revenues from the extraction of oil.
What is particularly interesting in Figure 19 is that a large majority of Sub-Saharan African countries have lower incomes than their levels of economic complexity would suggest. Indeed, only six of the 22 Sub-Saharan African countries included in the figure are located above the fitted line. One implication of this is that these countries face other constraints on economic development that prevent them from leveraging their existing capabilities for growth.
Beyond the relationship between economic complexity and the level of per capita GDP, economic complexity is also able to explain growth in per capita GDP. Hausmann et al. (2013, pp. 27, 31) estimate the relationship between countries’ gaps between economic complexity and income in 2000 and growth during the subsequent decade, and conclude that “economic complexity is not just a symptom or an expression of prosperity: it is a driver”. Thus, countries with high per capita incomes relative to their ECI are expected to grow more slowly, and those with relatively low per capita incomes are expected to grow more rapidly. This finding, then, suggests the potential for relatively rapid growth in many Sub-Saharan African countries.
In terms of economic complexity, the process of economic development is one in which countries gradually expand their capabilities and, as a result, expand the range and complexity of products they are able to produce. Here, however, countries are faced with an important challenge: they are unable to produce products for which they do not have all the requisite capabilities, but at the same time they have little incentive to develop a particular new capability for an industry that does not yet exist domestically. The situation is further complicated where a country is missing multiple capabilities required by a new industry, since all of these capabilities need to be developed before the industry is possible.
Countries tend to solve this problem by entering into industries where the gap between its existing capabilities and capabilities required for that industry is smallest. Intuitively, it is easier for a country to begin producing jackets if it is already producing shirts, than for it to begin producing microchips. Within the economic complexity framework, it is said that shirts and jackets are nearby products. The implication is that moving into new products is relatively easy if a country has access to a large number of nearby products (i.e. if a country’s existing capabilities are a close match to those required for a large number of other products). Conversely, this process is more difficult when there are few nearby products.
The ‘nearness’ or proximity of different products—or the degree to which their capability requirements are similar—is mapped out in what is termed the product space. The product space is constructed using export data and relies on the assumption that if the capabilities required to produce two products are similar, then countries are more likely to export these two products than they are to export two products with dissimilar capability requirements. Continuing with the earlier example, if the capabilities
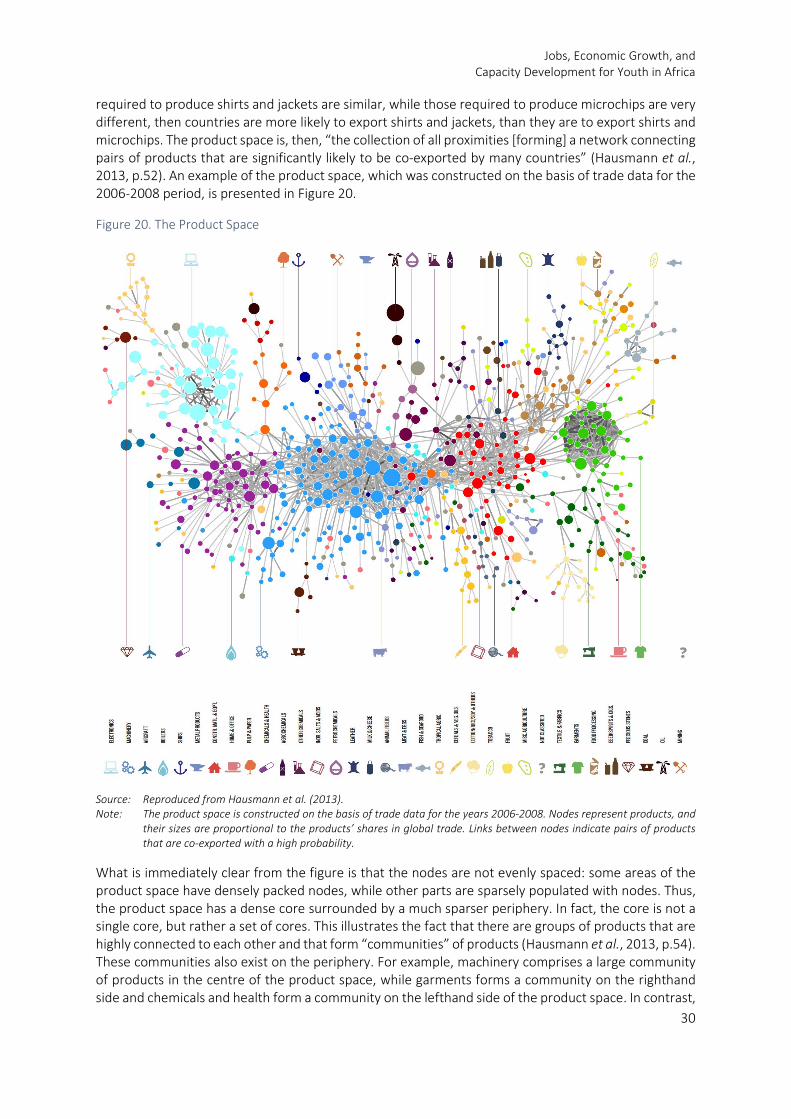
Jobs, Economic Growth, and Capacity Development for Youth in Africa
30
required to produce shirts and jackets are similar, while those required to produce microchips are very different, then countries are more likely to export shirts and jackets, than they are to export shirts and microchips. The product space is, then, “the collection of all proximities [forming] a network connecting pairs of products that are significantly likely to be co-exported by many countries” (Hausmann et al., 2013, p.52). An example of the product space, which was constructed on the basis of trade data for the 2006-2008 period, is presented in Figure 20.
Figure 20. The Product Space
Source: Reproduced from Hausmann et al. (2013). Note: The product space is constructed on the basis of trade data for the years 2006-2008. Nodes represent products, and
their sizes are proportional to the products’ shares in global trade. Links between nodes indicate pairs of products that are co-exported with a high probability.
What is immediately clear from the figure is that the nodes are not evenly spaced: some areas of the product space have densely packed nodes, while other parts are sparsely populated with nodes. Thus, the product space has a dense core surrounded by a much sparser periphery. In fact, the core is not a single core, but rather a set of cores. This illustrates the fact that there are groups of products that are highly connected to each other and that form “communities” of products (Hausmann et al., 2013, p.54). These communities also exist on the periphery. For example, machinery comprises a large community of products in the centre of the product space, while garments forms a community on the righthand side and chemicals and health form a community on the lefthand side of the product space. In contrast,
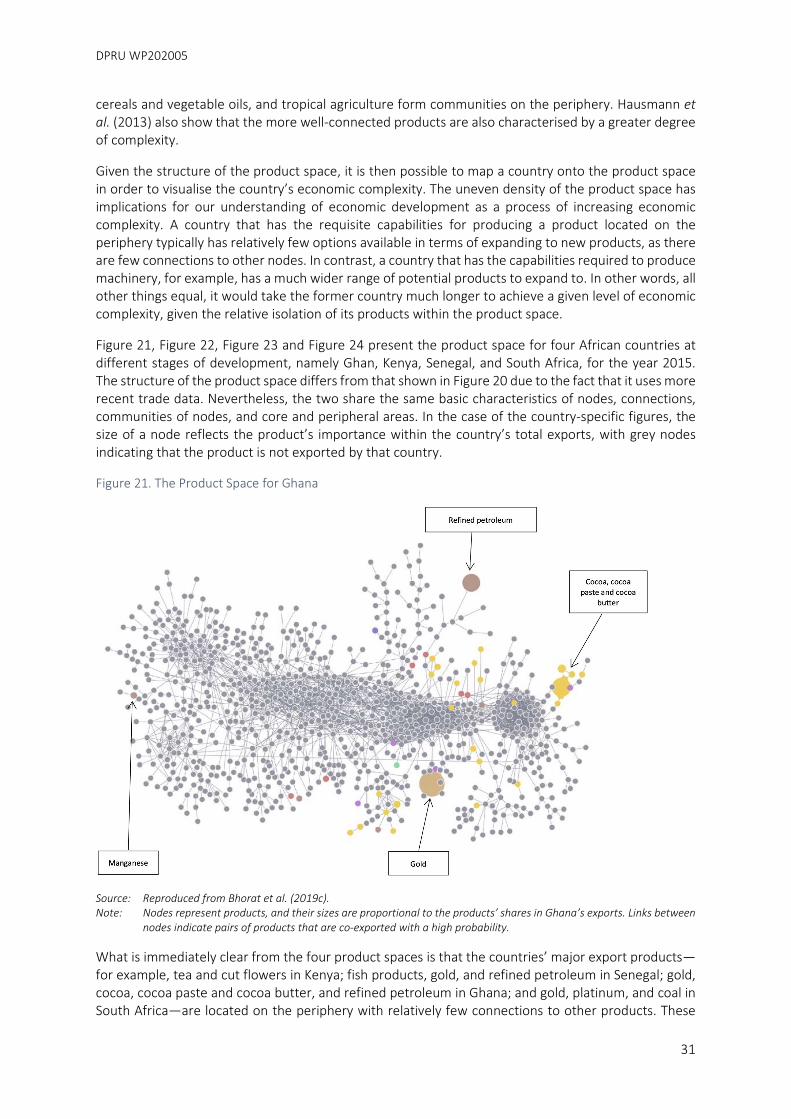
DPRU WP202005
31
cereals and vegetable oils, and tropical agriculture form communities on the periphery. Hausmann et al. (2013) also show that the more well-connected products are also characterised by a greater degree of complexity.
Given the structure of the product space, it is then possible to map a country onto the product space in order to visualise the country’s economic complexity. The uneven density of the product space has implications for our understanding of economic development as a process of increasing economic complexity. A country that has the requisite capabilities for producing a product located on the periphery typically has relatively few options available in terms of expanding to new products, as there are few connections to other nodes. In contrast, a country that has the capabilities required to produce machinery, for example, has a much wider range of potential products to expand to. In other words, all other things equal, it would take the former country much longer to achieve a given level of economic complexity, given the relative isolation of its products within the product space.
Figure 21, Figure 22, Figure 23 and Figure 24 present the product space for four African countries at different stages of development, namely Ghan, Kenya, Senegal, and South Africa, for the year 2015. The structure of the product space differs from that shown in Figure 20 due to the fact that it uses more recent trade data. Nevertheless, the two share the same basic characteristics of nodes, connections, communities of nodes, and core and peripheral areas. In the case of the country-specific figures, the size of a node reflects the product’s importance within the country’s total exports, with grey nodes indicating that the product is not exported by that country.
Figure 21. The Product Space for Ghana
Source: Reproduced from Bhorat et al. (2019c). Note: Nodes represent products, and their sizes are proportional to the products’ shares in Ghana’s exports. Links between
nodes indicate pairs of products that are co-exported with a high probability.
What is immediately clear from the four product spaces is that the countries’ major export products—for example, tea and cut flowers in Kenya; fish products, gold, and refined petroleum in Senegal; gold, cocoa, cocoa paste and cocoa butter, and refined petroleum in Ghana; and gold, platinum, and coal in South Africa—are located on the periphery with relatively few connections to other products. These
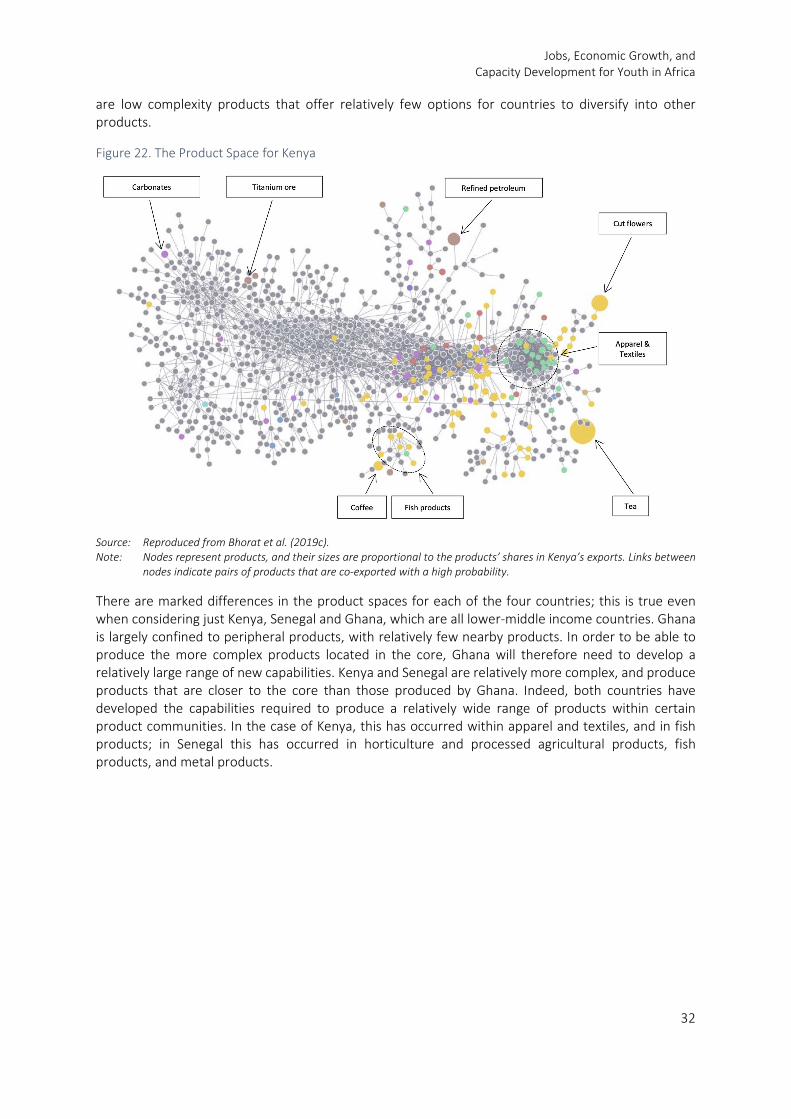
Jobs, Economic Growth, and Capacity Development for Youth in Africa
32
are low complexity products that offer relatively few options for countries to diversify into other products.
Figure 22. The Product Space for Kenya
Source: Reproduced from Bhorat et al. (2019c). Note: Nodes represent products, and their sizes are proportional to the products’ shares in Kenya’s exports. Links between
nodes indicate pairs of products that are co-exported with a high probability.
There are marked differences in the product spaces for each of the four countries; this is true even when considering just Kenya, Senegal and Ghana, which are all lower-middle income countries. Ghana is largely confined to peripheral products, with relatively few nearby products. In order to be able to produce the more complex products located in the core, Ghana will therefore need to develop a relatively large range of new capabilities. Kenya and Senegal are relatively more complex, and produce products that are closer to the core than those produced by Ghana. Indeed, both countries have developed the capabilities required to produce a relatively wide range of products within certain product communities. In the case of Kenya, this has occurred within apparel and textiles, and in fish products; in Senegal this has occurred in horticulture and processed agricultural products, fish products, and metal products.
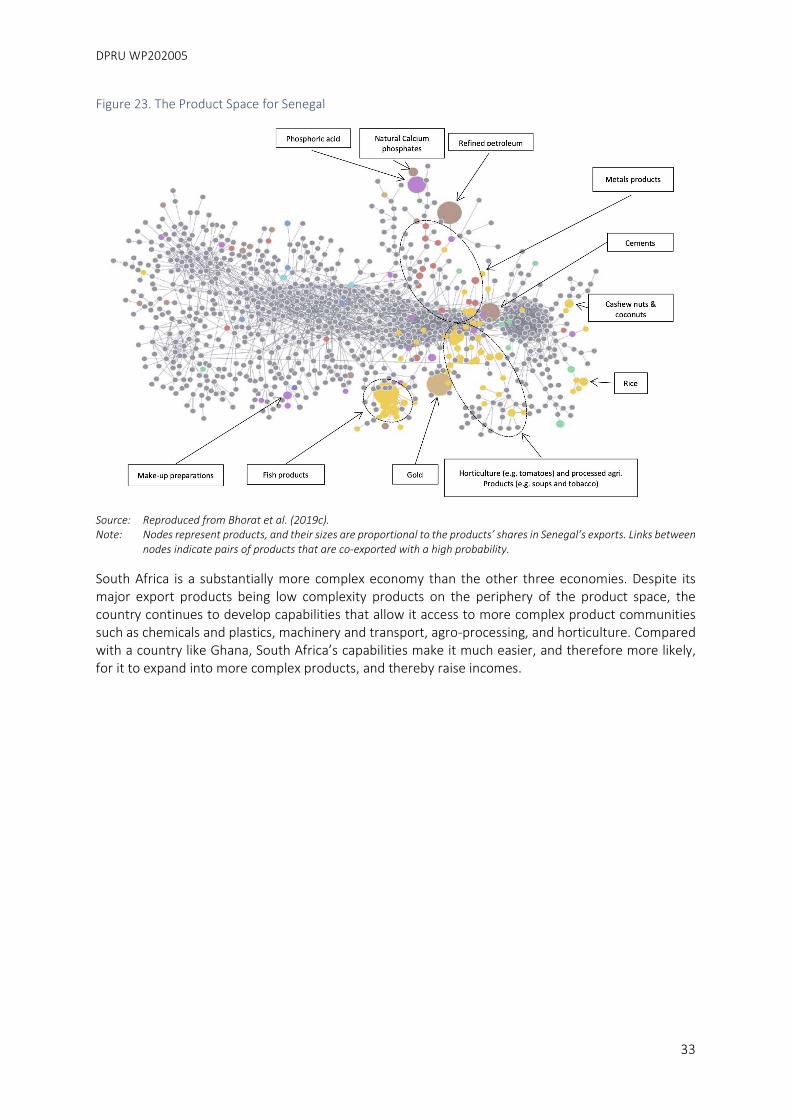
DPRU WP202005
33
Figure 23. The Product Space for Senegal
Source: Reproduced from Bhorat et al. (2019c). Note: Nodes represent products, and their sizes are proportional to the products’ shares in Senegal’s exports. Links between
nodes indicate pairs of products that are co-exported with a high probability.
South Africa is a substantially more complex economy than the other three economies. Despite its major export products being low complexity products on the periphery of the product space, the country continues to develop capabilities that allow it access to more complex product communities such as chemicals and plastics, machinery and transport, agro-processing, and horticulture. Compared with a country like Ghana, South Africa’s capabilities make it much easier, and therefore more likely, for it to expand into more complex products, and thereby raise incomes.
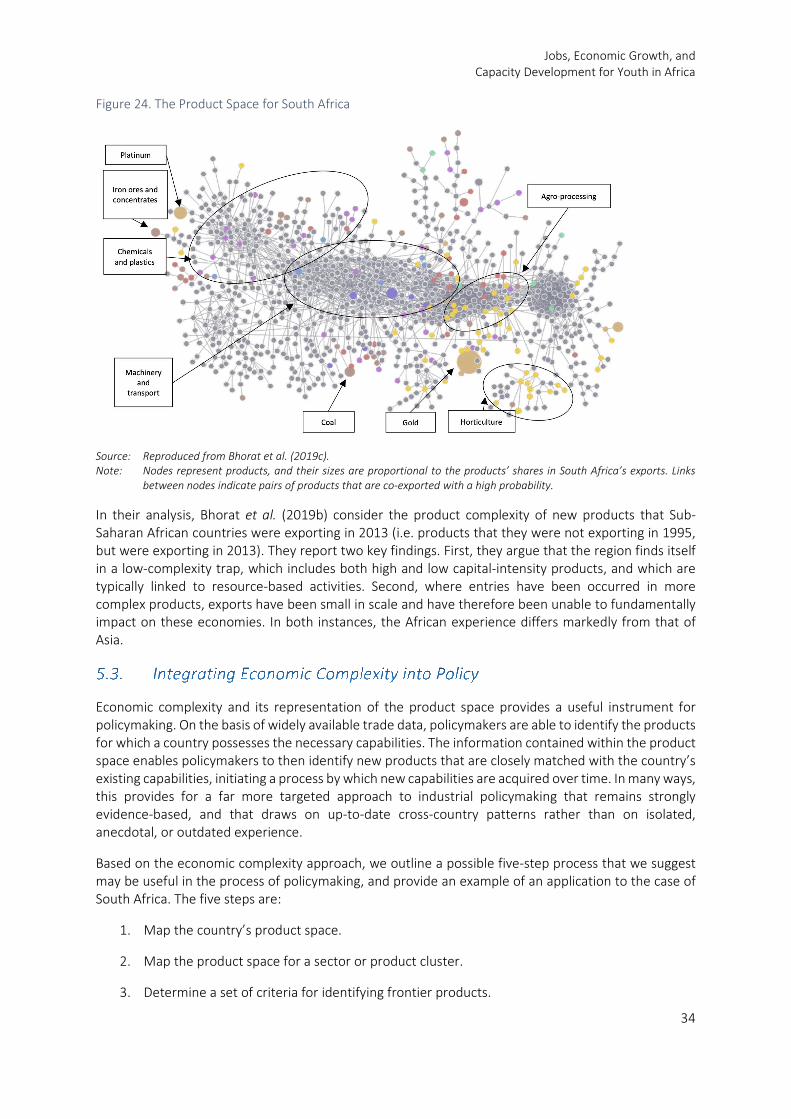
Jobs, Economic Growth, and Capacity Development for Youth in Africa
34
Figure 24. The Product Space for South Africa
Source: Reproduced from Bhorat et al. (2019c). Note: Nodes represent products, and their sizes are proportional to the products’ shares in South Africa’s exports. Links
between nodes indicate pairs of products that are co-exported with a high probability.
In their analysis, Bhorat et al. (2019b) consider the product complexity of new products that Sub-Saharan African countries were exporting in 2013 (i.e. products that they were not exporting in 1995, but were exporting in 2013). They report two key findings. First, they argue that the region finds itself in a low-complexity trap, which includes both high and low capital-intensity products, and which are typically linked to resource-based activities. Second, where entries have been occurred in more complex products, exports have been small in scale and have therefore been unable to fundamentally impact on these economies. In both instances, the African experience differs markedly from that of Asia.
Economic complexity and its representation of the product space provides a useful instrument for policymaking. On the basis of widely available trade data, policymakers are able to identify the products for which a country possesses the necessary capabilities. The information contained within the product space enables policymakers to then identify new products that are closely matched with the country’s existing capabilities, initiating a process by which new capabilities are acquired over time. In many ways, this provides for a far more targeted approach to industrial policymaking that remains strongly evidence-based, and that draws on up-to-date cross-country patterns rather than on isolated, anecdotal, or outdated experience.
Based on the economic complexity approach, we outline a possible five-step process that we suggest may be useful in the process of policymaking, and provide an example of an application to the case of South Africa. The five steps are:
1. Map the country’s product space.
2. Map the product space for a sector or product cluster.
3. Determine a set of criteria for identifying frontier products.
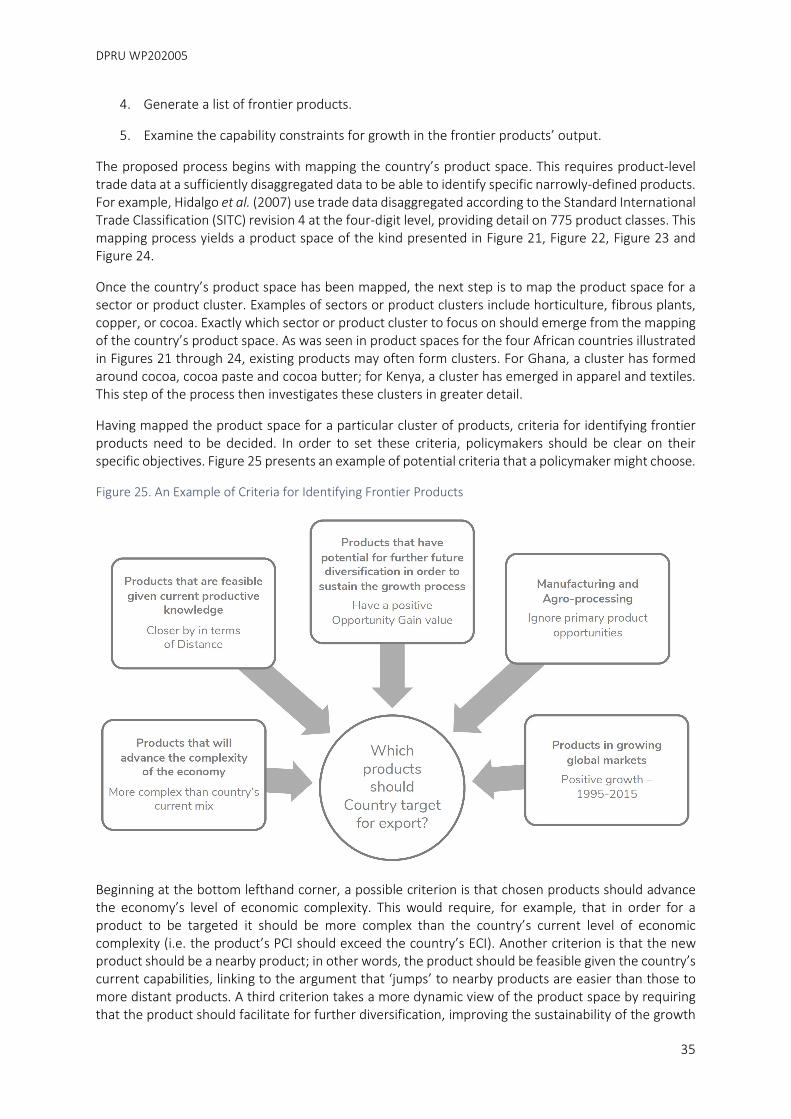
DPRU WP202005
35
4. Generate a list of frontier products.
5. Examine the capability constraints for growth in the frontier products’ output.
The proposed process begins with mapping the country’s product space. This requires product-level trade data at a sufficiently disaggregated data to be able to identify specific narrowly-defined products. For example, Hidalgo et al. (2007) use trade data disaggregated according to the Standard International Trade Classification (SITC) revision 4 at the four-digit level, providing detail on 775 product classes. This mapping process yields a product space of the kind presented in Figure 21, Figure 22, Figure 23 and Figure 24.
Once the country’s product space has been mapped, the next step is to map the product space for a sector or product cluster. Examples of sectors or product clusters include horticulture, fibrous plants, copper, or cocoa. Exactly which sector or product cluster to focus on should emerge from the mapping of the country’s product space. As was seen in product spaces for the four African countries illustrated in Figures 21 through 24, existing products may often form clusters. For Ghana, a cluster has formed around cocoa, cocoa paste and cocoa butter; for Kenya, a cluster has emerged in apparel and textiles. This step of the process then investigates these clusters in greater detail.
Having mapped the product space for a particular cluster of products, criteria for identifying frontier products need to be decided. In order to set these criteria, policymakers should be clear on their specific objectives. Figure 25 presents an example of potential criteria that a policymaker might choose.
Figure 25. An Example of Criteria for Identifying Frontier Products
Beginning at the bottom lefthand corner, a possible criterion is that chosen products should advance the economy’s level of economic complexity. This would require, for example, that in order for a product to be targeted it should be more complex than the country’s current level of economic complexity (i.e. the product’s PCI should exceed the country’s ECI). Another criterion is that the new product should be a nearby product; in other words, the product should be feasible given the country’s current capabilities, linking to the argument that ‘jumps’ to nearby products are easier than those to more distant products. A third criterion takes a more dynamic view of the product space by requiring that the product should facilitate for further diversification, improving the sustainability of the growth
Jobs, Economic Growth, and Capacity Development for Youth in Africa
36
process. In terms of the product space, the idea would be to prefer a new product that has more links to more complex products that the country does not produce, than a new product with fewer links or with links to less complex products. Within the economic complexity framework, this means that the product should have a positive opportunity gain value. These three criteria are complexity-based criteria that select products on the extent to which they promote increasing economic complexity.
A fourth criterion that is particularly relevant to African countries given their historical growth trajectories is to focus only on product opportunities within manufacturing and agro-processing, and to therefore ignore primary product opportunities. Many of these products may in any event fall short of the first criterion, which requires greater than average complexity for new products, and of the third criterion, which essentially prioritises access to the more complex products in the core. A fifth criterion is that new products should be situated in growing global markets, which would be more accessible for new producers than declining markets.
These criteria are certainly not exhaustive and there is plenty of scope to tailor the criteria to address local concerns. This is in line with, for example, the consideration by Hallward-Driemeier and Nayyar (2018) of “pro-development characteristics” implicit in particular manufacturing activities. A key consideration, particularly from the perspective of this paper, relates to jobs: all things equal, new product opportunities that are likely to create more and better jobs would, in many African countries, be preferable to capital-intensive products that are likely to have little direct or indirect employment effects. This is not to say that it will always be easy to decide on a straightforward set of criteria that do not conflict with each other, and the policymaking process will therefore need to work to resolve these conflicts whether it be through weighting specific criteria or through creating first- and second-round criteria, for example.
In the fourth step of the policymaking process, the criteria are applied to the prospective products in order to generate a list of frontier products. These frontier products are those new products that the country does not yet produce, but which best comply with the set of criteria decided upon during the previous step. Figure 26 illustrates an example of the top 20 products for South Africa, having been chosen according to a specific set of criteria.1 Again, coloured nodes represent existing products, while the sizes of the nodes represent their relative size in South Africa’s exports. Black nodes are the frontier products; their sizes do not have any meaning in this figure. Details on these frontier products are provided in Table 7 in the appendix.
1 These criteria were: (1) products in which South Africa does not have revealed comparative advantage, and which have a PCI greater than the average PCI for South Africa’s existing exports; (2) products that do not lie beyond the median distance of the sample of products in which South Africa does not have revealed comparative advantage; (3) products that have a positive opportunity gain index; (4) products that experienced positive growth in global trade between 1995 and 2015; and (5) products that are classified within manufacturing or agro-processing (Bhorat et al., 2019a).
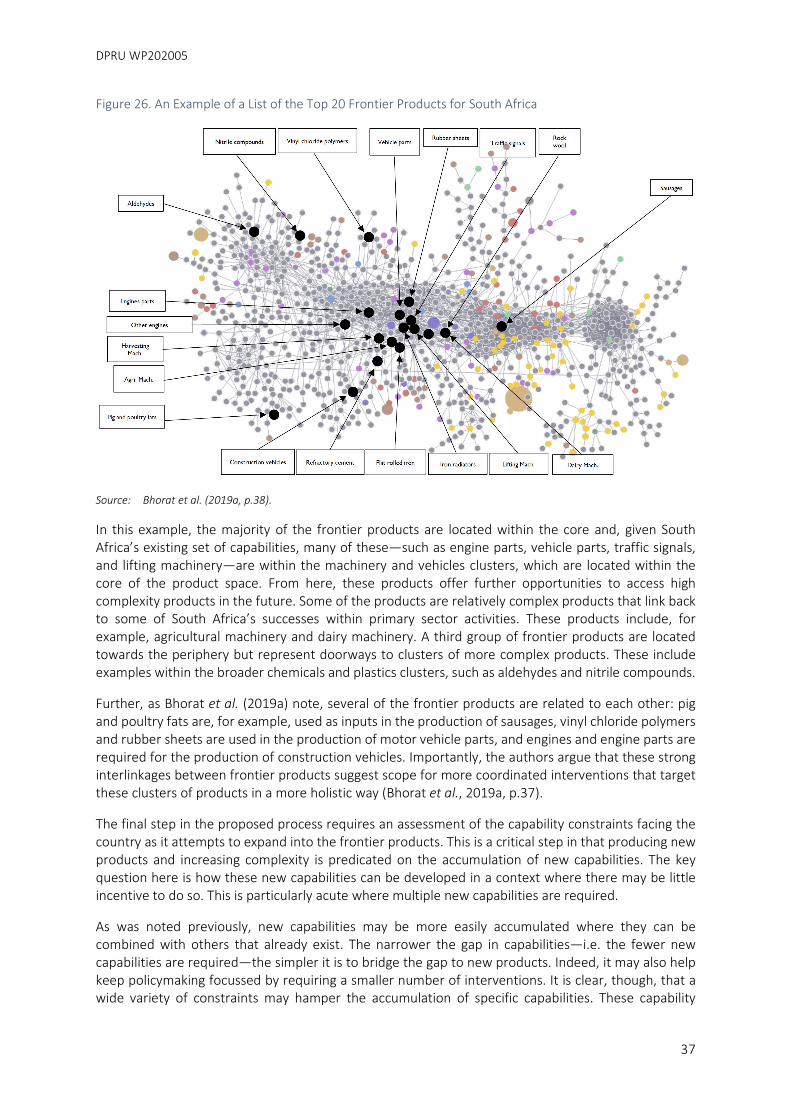
DPRU WP202005
37
Figure 26. An Example of a List of the Top 20 Frontier Products for South Africa
Source: Bhorat et al. (2019a, p.38).
In this example, the majority of the frontier products are located within the core and, given South Africa’s existing set of capabilities, many of these—such as engine parts, vehicle parts, traffic signals, and lifting machinery—are within the machinery and vehicles clusters, which are located within the core of the product space. From here, these products offer further opportunities to access high complexity products in the future. Some of the products are relatively complex products that link back to some of South Africa’s successes within primary sector activities. These products include, for example, agricultural machinery and dairy machinery. A third group of frontier products are located towards the periphery but represent doorways to clusters of more complex products. These include examples within the broader chemicals and plastics clusters, such as aldehydes and nitrile compounds.
Further, as Bhorat et al. (2019a) note, several of the frontier products are related to each other: pig and poultry fats are, for example, used as inputs in the production of sausages, vinyl chloride polymers and rubber sheets are used in the production of motor vehicle parts, and engines and engine parts are required for the production of construction vehicles. Importantly, the authors argue that these strong interlinkages between frontier products suggest scope for more coordinated interventions that target these clusters of products in a more holistic way (Bhorat et al., 2019a, p.37).
The final step in the proposed process requires an assessment of the capability constraints facing the country as it attempts to expand into the frontier products. This is a critical step in that producing new products and increasing complexity is predicated on the accumulation of new capabilities. The key question here is how these new capabilities can be developed in a context where there may be little incentive to do so. This is particularly acute where multiple new capabilities are required.
As was noted previously, new capabilities may be more easily accumulated where they can be combined with others that already exist. The narrower the gap in capabilities—i.e. the fewer new capabilities are required—the simpler it is to bridge the gap to new products. Indeed, it may also help keep policymaking focussed by requiring a smaller number of interventions. It is clear, though, that a wide variety of constraints may hamper the accumulation of specific capabilities. These capability
Jobs, Economic Growth, and Capacity Development for Youth in Africa
38
constraints vary in terms of their extent and the ease with which they can be addressed. For example, capability constraints may include issues such as stalled negotiations on trade protocols; a lack of export-accredited abattoirs; a backlog in terms of state veterinary services; a lack of biosecurity; or missing infrastructure.
While some of these capability constraints may appear daunting, they are rarely insurmountable. What is clear, though, is that this approach has important strengths that may improve the ability of policymakers to foster diversification, greater economic complexity, and economic growth and development. Instead of generating broad general policies, this approach is intended to identify the key constraints that prevent the emergence of the requisite capabilities within an economy. As a consequence, policy recommendations should be more specific and targeted, helping to focus policy attention on resolving very specific problems within the economy and unlocking its potential.
While the global population is expected to expand by 3.08 billion between 2020 and 2100, more than 95 percent of this growth will occur within Africa. The continent’s population is projected to grow nearly four times the rate of the world population, which will see its population more than triple over the period to almost 4.3 billion by the end of the century. Much of this growth will be concentrated within the working ages and, as a result, two out of five people of working age globally will reside in Africa by 2100, up from less than 15 percent in 2020.
The rapid growth of its population presents both opportunities and challenges to the African continent. The continent’s youthful population represent the hopes of a demographic dividend, which governments hope to harness in pursuit of more rapid and sustainable economic growth and development. Through appropriate investments in education and health and alongside good governance and sound economic policy, this dividend may be harnessed to raise living standards. However, the sheer pace of demographic change presents particular challenges that have rarely, if ever, been faced by other countries. Thus, for example, it has been estimated that, assuming no change in the labour force participation rate or the unemployment rate, African countries will together need to create an average of 1.7 million jobs per month between 2016 and 2063 (Ewinyu et al., 2018). At the same time, though, there is substantial variation across countries in terms of their progress through the demographic transition and both the extent and pace of growth of the working age population.
In order for the demographic dividend to be harnessed, however, African countries’ youthful populations need to find productive work. Unfortunately, labour market outcomes on the continent tend to be relatively poor. While a high proportion of the working age population are in employment in Africa, they are less likely than their counterparts globally to be in wage employment and more likely to be in working poverty. Fewer than 30 percent of the employed in Africa are in wage employment compared to 52.8 percent globally, wage employment is relatively scarce, and employment is dominated by low skilled occupations. As a result, wages are low for those who earn them, and the rate of working poverty on the continent is 30.2 percent compared to 6.9 percent globally. Indeed, Africa is an extreme outlier in terms of working poverty, with a working poverty rate more than 3.5 times that of Southern Asia. The picture for youth specifically is similarly bleak: one-third of the labour force are classified as working poor, while just over one-quarter are in wage employment.
Recent economic growth on the continent has seen a shift of employment in relative terms out of agriculture, as has been the case in Asia. However, where Asian growth has typically been accompanied by a shift in employment towards manufacturing, in Africa it has typically been towards services, with wholesale and retail trade growing most rapidly as a share of total employment. This difference is explained by the poor performance of manufacturing in Africa over the past several decades: data for
DPRU WP202005
39
nine African countries presented above indicate that manufacturing’s share of gross value added has been at best stagnant over the 1970-2010 period.
The lack of dynamism in Africa’s manufacturing sector, combined with evidence that African countries are attempting to industrialise in an international economic context that is very different to that faced by earlier industrialisers, has prompted attention to shift towards the services sector as a potential engine for future economic growth, development and— critically—jobs. The services sector has indeed grown rapidly over the past quarter-century, and now accounts for more than half of the continent’s gross value added. This pattern is echoed in employment trends and, although agriculture remains the dominant employment sector on the continent, services accounts for 38.1 percent of African employment in 2020 (up almost ten percentage points over a 30-year period). However, much of this employment growth has been concentrated in the traditional services sectors (wholesale and retail trade, and CSP services, which includes the public sector) and, even though growth in employment in modern services has been particularly rapid, it is from a small base with limited impact in terms of the absolute numbers of jobs required. It is, therefore, debatable as to whether the services sector can generate jobs of the quantity or quality required to raise incomes.
Instead, we argue that economic complexity provides an extremely useful framework for industrial policymaking. Measures of economic complexity have been shown to be strongly correlated with GDP per capita: more complex economies have higher GDP per capita. Further, deviations of actual income levels from those predicted on the basis of a country’s economic complexity are predictive of future growth rates. In comparison to wealthier and more developed economies, African economies are typically less complex. The products African countries produce are more likely to be located on the periphery of the product space, are typically linked to resource-based activities, and have relatively few connections to other more complex products.
Using the concept of economic complexity and its associated mapping of products within the product space, we argue that policymakers are able to more easily identify products that represent opportunities for diversification of their economies. The relatively large number of potential products can be narrowed down using a set of criteria that is both focussed on promoting complexity and supporting a sustainable process of development, and responsive to local economic considerations such as labour absorptive capacity. The policymaking process is then able to focus in on this much smaller number of potential products with a view to understanding and addressing the particular capability constraints that prevent the country from entering into these products. Instead of generating very broad and general policy prescriptions, this approach should be able to yield more specific and targeted recommendations aimed at resolving very specific problems within the economy, and unlocking the potential of manufacturing as a source of economic dynamism and job creation.
Jobs, Economic Growth, and Capacity Development for Youth in Africa
40
ALLEN, C., BHORAT, H., HILL, R., ROONEY, C., and STEENKAMP, F., 2019. ‘Building Economic Complexity in the South African Fibrous Plant Economy.’ DPRU DSI-NRF CoP/WP201904. Retrieved from http://www.dpru.uct.ac.za/.
BENINGUISSE, G. and MANITCHOKO, L., 2017, ‘Countries with Slow and Irregular Fertility Transitions.’ In: H. Groth and J.F. May (eds.), Africa’s Population: In Search of a Demographic Dividend, pp. 131–146, Springer, Switzerland.
BHORAT, H., EWINYU, A., LILENSTEIN, K., ROONEY, C., STEENKAMP, F., and THORNTON, A., 2019a, ‘Economic Complexity and Employment Expansion: The Case of South Africa.’ Report commissioned for the “Building economic complexity in Africa: Laying the foundation for expanding economic opportunities for women and youth in Africa”, Retrieved from http://www.dpru.uct.ac.za/.
BHORAT, H., KANBUR, R., ROONEY, C., and STEENKAMP, F., 2019b, ‘Sub-Saharan Africa’s Manufacturing Sector: Building Complexity.’ In: R. Kanbur, A. Noman, and J.E. Stiglitz (eds.), The Quality of Growth in Africa, chap. 8, pp. 234–263, Columbia University Press, Retrieved from https://www.jstor.org/stable/10.7312/kanb19476.12.
BHORAT, H., NAIDOO, K., and EWINYU, A., 2017, ‘The Tipping Point: The Youth Bulge and the Sub-Saharan African Labor Market.’ In: Foresight Africa: Top Priorities for the Continent in 2017, chap. 2, Africa Growth Initiative at Brookings, Washington, DC.
BHORAT, H., ROONEY, C., and STEENKAMP, F., 2019c, ‘Building Economic Complexity in Africa.’ Synthesis Report commissioned for the project “Building economic complexity in Africa: Laying the foundation for expanding economic opportunities for women and youth in Africa”, Retrieved from http://www.dpru.uct.ac.za/.
BLOOM, D.E., KUHN, M., and PRETTNER, K., 2017, ‘Africa’s Prospects for Enjoying a Demographic Dividend.’ Journal of Demographic Economics, 83(01): 63–76, ISSN 2054-0906, doi: 10.1017/dem.2016.19, Retrieved from http://dx.doi.org/10.1017/dem.2016.19.
CANNING, D., RAJA, S., and YAZBECK, A.S., 2015, Africa’s Demographic Transition: Dividend or Disaster? World Bank and Agence Francaise de Développement, Washington, DC, Retrieved from https://openknowledge.worldbank.org/handle/10986/22036.
EWINYU, A., KIMANI, M., OOSTHUIZEN, M., ROONEY, C., STEENKAMP, F., and YU, D., 2018, ‘Jobs in Africa: Demographic change, the labour market and youth in Africa.’, unpublished paper prepared for the African Development Bank.
GROTH, H. and MAY, J.F. (eds.), 2017, Africa’s Population: In Search of a Demographic Dividend. Springer, Switzerland.
HALLWARD-DRIEMEIER, M. and NAYYAR, G., 2018, Trouble in the Making? The Future of Manufacturing-Led Development. World Bank, Washington, DC, doi:10.1596/ 978-1-4648-1174-6.
HAUSMANN, R., HIDALGO, C., BUSTOS, S., COSCIA, M., SIMOES, A., and YILDIRIM, M., 2013, The Atlas of Economic Complexity: Mapping Paths to Prosperity. MIT Press, Cambridge, MA, second ed.
HIDALGO, C., KLINGER, B., BARABÁSI, A.L., and HAUSMANN, R., 2007, ‘The Product Space Conditions the Development of Nations.’ Science, New Series, Vol. 317(8537): 482–487.
DPRU WP202005
41
HIDALGO, C.A. and HAUSMANN, R., 2009, ‘The building blocks of economic complexity.’ Proceedings of the National Academy of Sciences, 106(26): 10570–10575, ISSN 1091-6490, doi:10. 1073/pnas.0900943106, Retrieved from http://dx.doi.org/10.1073/pnas.0900943106.
HOEKMAN, B., 2018, ‘Trade in Services: Opening Markets to Create Opportunities.’ In: R.S. Newfarmer, J. Page, and F. Tarp (eds.), Industries without Smokestacks: Industrialization in Africa Reconsidered, pp. 151–169, Oxford University Press, New York, USA.
ILO, 2020, World Employment and Social Outlook: Trends 2020. International Labour Organization, Geneva.
INTERNATIONAL LABOUR ORGANISATION, 2020, ‘ILO Estimates and Projections.’ ILO Data Explorer. ILOSTAT Online database, November 2019, Retrieved from https://ilostat.ilo.org/.
LEWIS, W.A., 1954, ‘Economic Development with Unlimited Supplies of Labour.’ The Manchester School, 22(2): 139–191.
MAGA, H.I. and GUENGANT, J.P., 2017, ‘Countries with Very Slow or Incipient Fertility Transition.’ In: H. Groth and J.F. May (eds.), Africa’s Population: In Search of a Demographic Dividend, pp. 147–164, Springer, Switzerland.
MCMILLAN, M., RODRIK, D., and VERDUZCO-GALLO, I., 2014, ‘Globalization, Structural Change, and Productivity Growth, with an Update on Africa.’ World Development, 63: 11–32, doi: http://dx.doi.org/10.1016/j.worlddev.2013.10.012.
NEWFARMER, R.S., PAGE, J., and TARP, F., 2018, ‘Industries without Smokestacks and Structural Transformation in Africa: Overview.’ In: R.S. Newfarmer, J. Page, and F. Tarp (eds.), Industries without Smokestacks: Industrialization in Africa Reconsidered, pp. 1–26, Oxford University Press, New York, USA.
RODRIK, D., 2016, ‘Premature Deindustrialization.’ Journal of Economic Growth, 21(1): 1–33.
ROUBAUD, F. and TORELLI, C., 2013, ‘Employment, Unemployment, and Working Conditions in the Urban Labor Markets of Sub-Saharan Africa: Main Stylized Facts.’ In: P. De Vreyer and F. Roubaud (eds.), Urban Labor Markets in Sub-Saharan Africa, chap. 1, pp. 35–80, Afirca Development Forum Series, World Bank, Washington, DC, doi:10.1596/978-0-8213-9781-7.
SIMOES, A.J.G. and HIDALGO, C.A., 2011, ‘The Economic Complexity Observatory: An Analytical Tool for Understanding the Dynamics of Economic Development.’ Workshops at the Twenty-Fifth AAAI Conference on Artificial Intelligence, Retrieved from https://oec.world.
TIMMER, M., DE VRIES, G., and DE VRIES, K., 2015, ‘Patterns of Structural Change in Developing Countries.’ In: J. Weiss and M. Tribe (eds.), Routledge Handbook of Industry and Development, pp. 66–83, Routledge.
UNITED NATIONS, 2019, ‘World Population Prospects: The 2019 Revision.’ Department of Economic and Social Affairs, Population Division, Retrieved from http://esa.un.org/unpd/wpp/.
WORLD BANK, 2018, Poverty and Shared Prosperity 2018: Piecing Together the Poverty Puzzle. World Bank, Washington, DC.
———, 2020a, ‘Global Jobs Indicators Database.’ Online database., Retrieved from https://datacatalog.worldbank.org/dataset/global-jobs-indicators-database.
———, 2020b, ‘World DataBank.’ Retrieved from http://databank.worldbank.org/.
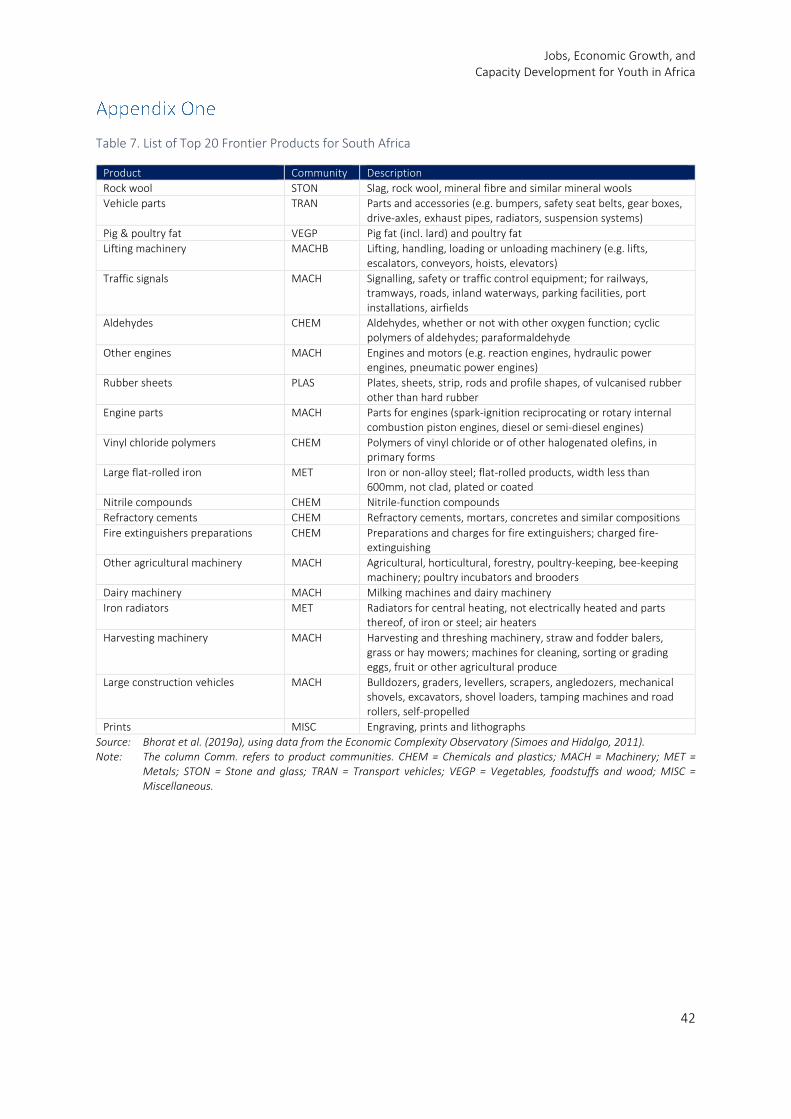
Jobs, Economic Growth, and Capacity Development for Youth in Africa
42
Table 7. List of Top 20 Frontier Products for South Africa
Product Community Description Rock wool STON Slag, rock wool, mineral fibre and similar mineral wools Vehicle parts TRAN Parts and accessories (e.g. bumpers, safety seat belts, gear boxes,
drive-axles, exhaust pipes, radiators, suspension systems) Pig & poultry fat VEGP Pig fat (incl. lard) and poultry fat Lifting machinery MACHB Lifting, handling, loading or unloading machinery (e.g. lifts,
escalators, conveyors, hoists, elevators) Traffic signals MACH Signalling, safety or traffic control equipment; for railways,
tramways, roads, inland waterways, parking facilities, port installations, airfields
Aldehydes CHEM Aldehydes, whether or not with other oxygen function; cyclic polymers of aldehydes; paraformaldehyde
Other engines MACH Engines and motors (e.g. reaction engines, hydraulic power engines, pneumatic power engines)
Rubber sheets PLAS Plates, sheets, strip, rods and profile shapes, of vulcanised rubber other than hard rubber
Engine parts MACH Parts for engines (spark-ignition reciprocating or rotary internal combustion piston engines, diesel or semi-diesel engines)
Vinyl chloride polymers CHEM Polymers of vinyl chloride or of other halogenated olefins, in primary forms
Large flat-rolled iron MET Iron or non-alloy steel; flat-rolled products, width less than 600mm, not clad, plated or coated
Nitrile compounds CHEM Nitrile-function compounds Refractory cements CHEM Refractory cements, mortars, concretes and similar compositions Fire extinguishers preparations CHEM Preparations and charges for fire extinguishers; charged fire-
extinguishing Other agricultural machinery MACH Agricultural, horticultural, forestry, poultry-keeping, bee-keeping
machinery; poultry incubators and brooders Dairy machinery MACH Milking machines and dairy machinery Iron radiators MET Radiators for central heating, not electrically heated and parts
thereof, of iron or steel; air heaters Harvesting machinery MACH Harvesting and threshing machinery, straw and fodder balers,
grass or hay mowers; machines for cleaning, sorting or grading eggs, fruit or other agricultural produce
Large construction vehicles MACH Bulldozers, graders, levellers, scrapers, angledozers, mechanical shovels, excavators, shovel loaders, tamping machines and road rollers, self-propelled
Prints MISC Engraving, prints and lithographs Source: Bhorat et al. (2019a), using data from the Economic Complexity Observatory (Simoes and Hidalgo, 2011). Note: The column Comm. refers to product communities. CHEM = Chemicals and plastics; MACH = Machinery; MET =
Metals; STON = Stone and glass; TRAN = Transport vehicles; VEGP = Vegetables, foodstuffs and wood; MISC = Miscellaneous.

Development Policy Research UnitUniversity of Cape TownPrivate Bag, Rondebosch 7701Cape Town, South AfricaTel: +27 21 650 5701www.dpru.uct.ac.za