Embed Size (px)
Citation preview
7/23/2019 job satisfaction research
http://slidepdf.com/reader/full/job-satisfaction-research 1/31
See discussions, stats, and author profiles for this publication at: http://www.researchgate.net/publication/280723649
JOB SATISFACTION OF ACADEMIC AND ADMINISTRATIVESTAFF MEMBERS IN JIMMA UNIVERSITY:
RESEARCH · AUGUST 2015
DOI: 10.13140/RG.2.1.3778.5449
READS
37
1 AUTHOR:
Yasin Negash Jabir
Jimma University
1 PUBLICATION 0 CITATIONS
SEE PROFILE
Available from: Yasin Negash Jabir
Retrieved on: 08 December 2015
7/23/2019 job satisfaction research
http://slidepdf.com/reader/full/job-satisfaction-research 2/31
COLLAGE OF NATURAL SCIENCE
DEPARTMENT OF STATISTICS
JOB SATISFACTION OF ACADEMIC AND ADMINISTRATIVE STAFF MEMBERS IN JIMMA UNIVERSITY: - (A
CASE STUDY AT MAIN CAMPUS).
PREPARED BY: YASIN NEGASH
ADVISOR: ZENEBE TEKA (MSC)
A RESEARCH PAPER SUBMITTED TO THE DEPARTMENT OF STATISTICS, COLLEGE OF NATURALSCIENCE, JIMMA UNIVERSITY AS A PARTIAL FULFILLMENT FOR THE REQUIREMENTS OF BACHELOR
OF SCIENCE (BSC.) DEGREE IN STATISTICS
JUNE, 2001 E.C.
JIMMA, ETHIOPIA

7/23/2019 job satisfaction research
http://slidepdf.com/reader/full/job-satisfaction-research 3/31
Acknowledgement
First, I would like to express my deepest and warmest gratitude to the ‘ALLAH’ who help me from the beginning to the
end of this study. Secondly, I am also greatly interested to express my hearted thanks to my advisor ZENEBE TEKA.
(MSC), for his ultimate assistance to do this study.
I would like to thanks the academic and administration of staff members of Jimma University Main Campus, for their
responsiveness of filling the questionnaire during data collection.
Lastly, I would like to express my deepest gratitude to my parents and all my partners who were help me from the
beginning to the end of this study.
7/23/2019 job satisfaction research
http://slidepdf.com/reader/full/job-satisfaction-research 4/31
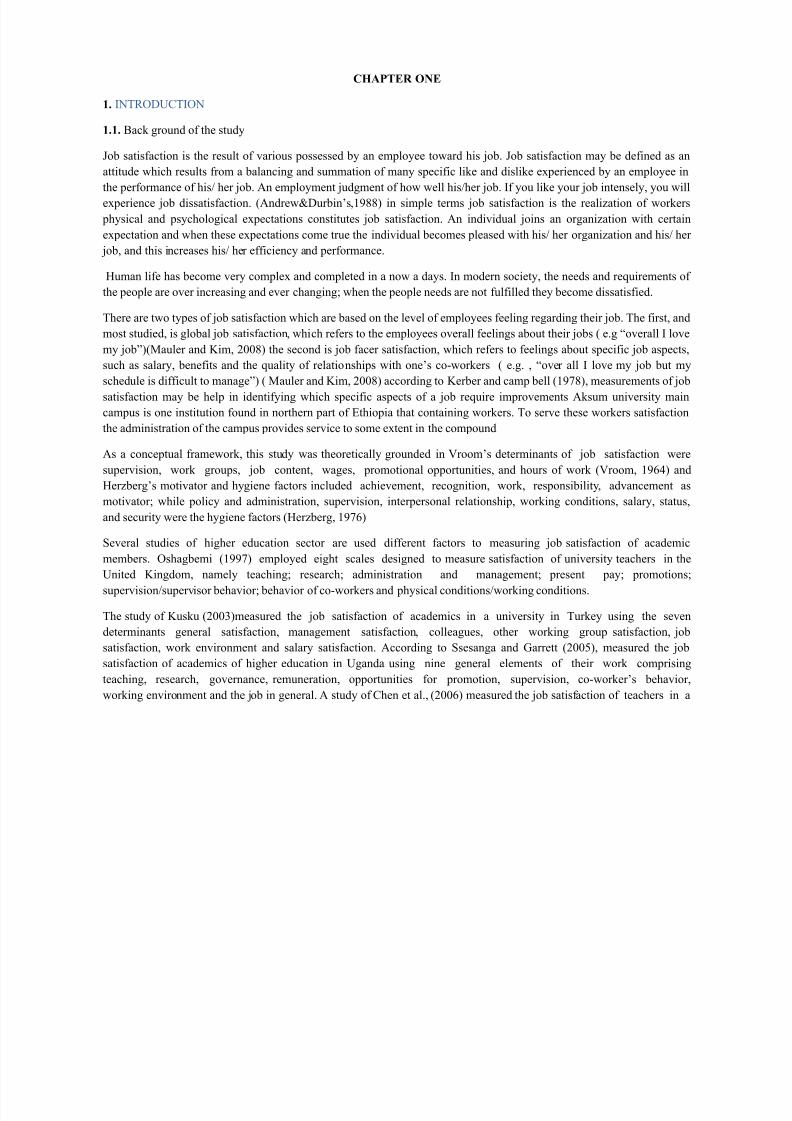
Abstract
Background: Job satisfaction may be defined as an attitude which results from a balancing and summation of many
specific like and dislike experienced by an employee in the performance of his/ her job.
Objectives: This study was conducted to identify and assess the level of job satisfaction of Jimma University Main
Campus academic and administration staff member’s .The subject who was involved in the study was a sample of
academic and administrative staff members found in main campus.
Methodology: Out of about 1504 staff members in main campus 716 are administrative and 788 are academic. The sample
was selected by using stratification over simple random sampling .so that 43 of administrative and 47 academic staffmember are selected from 716 and 788 respectively and total 90 from 1504. In order to get an appropriate finding, it uses
stratification over simple random sampling and self-administered questionnaire for sampled staff member. The study uses
both descriptive and inferential statistics method of data analysis, which means from descriptive frequency table, cross tab
and from inferential statistics chi-square test of associations and binary logistic regression.
Results: Most of the staff members are satisfied with their job, which was 69.6the total staff member, are satisfied.
Conclusion: Some variables like age, relationship with workers, work environment, experience and etc show an
association with job satisfaction.
7/23/2019 job satisfaction research
http://slidepdf.com/reader/full/job-satisfaction-research 5/31
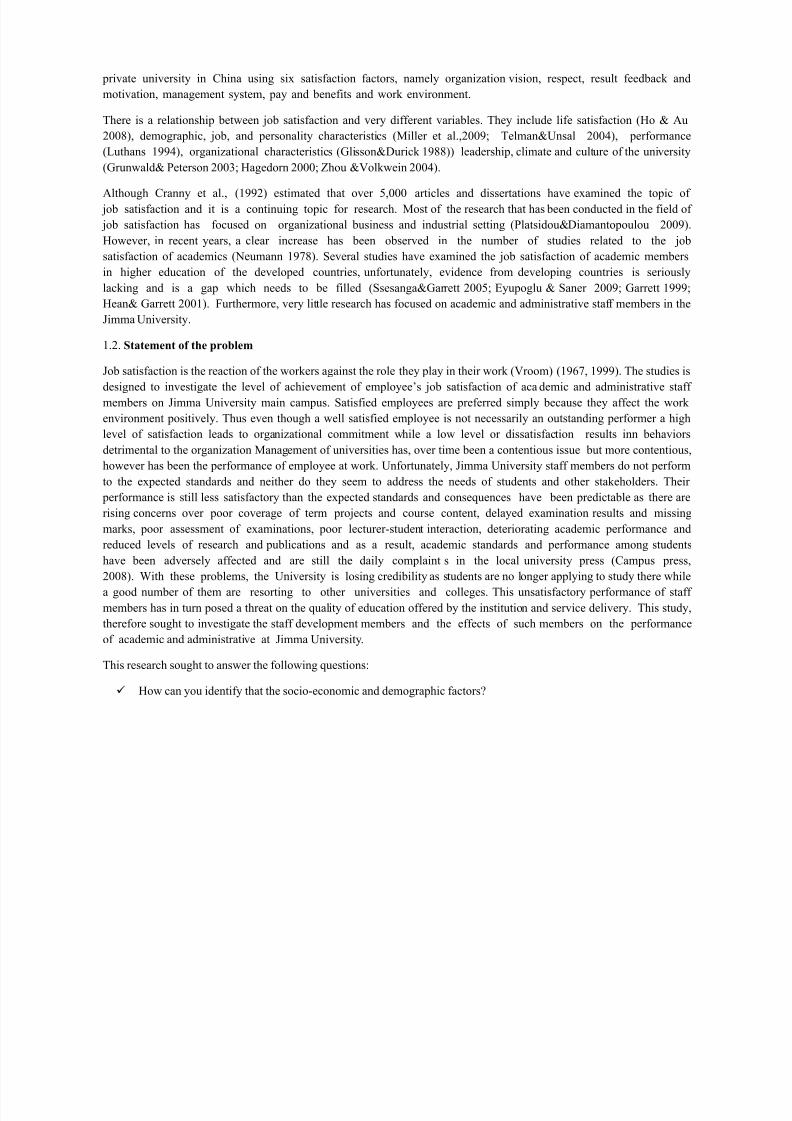
CHAPTER ONE
1. INTRODUCTION
1.1. Back ground of the study
Job satisfaction is the result of various possessed by an employee toward his job. Job satisfaction may be defined as an
attitude which results from a balancing and summation of many specific like and dislike experienced by an employee in
the performance of his/ her job. An employment judgment of how well his/her job. If you like your job intensely, you will
experience job dissatisfaction. (Andrew&Durbin’s,1988) in simple terms job satisfaction is the realization of workers
physical and psychological expectations constitutes job satisfaction. An individual joins an organization with certain
expectation and when these expectations come true the individual becomes pleased with his/ her organization and his/ her
job, and this increases his/ her efficiency and performance.
Human life has become very complex and completed in a now a days. In modern society, the needs and requirements of
the people are over increasing and ever changing; when the people needs are not fulfilled they become dissatisfied.
There are two types of job satisfaction which are based on the level of employees feeling regarding their job. The first, and
most studied, is global job satisfaction, which refers to the employees overall feelings about their jobs ( e.g “overall I love
my job”)(Mauler and Kim, 2008) the second is job facer satisfaction, which refers to feelings about specific job aspects,
such as salary, benefits and the quality of relationships with one’s co-workers ( e.g. , “over all I love my job but my
schedule is difficult to manage”) ( Mauler and Kim, 2008) according to Kerber and camp bell (1978), measurements of jobsatisfaction may be help in identifying which specific aspects of a job require improvements Aksum university main
campus is one institution found in northern part of Ethiopia that containing workers. To serve these workers satisfaction
the administration of the campus provides service to some extent in the compound
As a conceptual framework, this study was theoretically grounded in Vroom’s determinants of job satisfaction were
supervision, work groups, job content, wages, promotional opportunities, and hours of work (Vroom, 1964) and
Herzberg’s motivator and hygiene factors included achievement, recognition, work, responsibility, advancement as
motivator; while policy and administration, supervision, interpersonal relationship, working conditions, salary, status,
and security were the hygiene factors (Herzberg, 1976)
Several studies of higher education sector are used different factors to measuring job satisfaction of academic
members. Oshagbemi (1997) employed eight scales designed to measure satisfaction of university teachers in the
United Kingdom, namely teaching; research; administration and management; present pay; promotions;
supervision/supervisor behavior; behavior of co-workers and physical conditions/working conditions.
The study of Kusku (2003)measured the job satisfaction of academics in a university in Turkey using the seven
determinants general satisfaction, management satisfaction, colleagues, other working group satisfaction, job
satisfaction, work environment and salary satisfaction. According to Ssesanga and Garrett (2005), measured the job
satisfaction of academics of higher education in Uganda using nine general elements of their work comprising
teaching, research, governance, remuneration, opportunities for promotion, supervision, co-worker’s behavior,
working environment and the job in general. A study of Chen et al., (2006) measured the job satisfaction of teachers in a
7/23/2019 job satisfaction research
http://slidepdf.com/reader/full/job-satisfaction-research 6/31
private university in China using six satisfaction factors, namely organization vision, respect, result feedback and
motivation, management system, pay and benefits and work environment.
There is a relationship between job satisfaction and very different variables. They include life satisfaction (Ho & Au
2008), demographic, job, and personality characteristics (Miller et al.,2009; Telman&Unsal 2004), performance
(Luthans 1994), organizational characteristics (Glisson&Durick 1988)) leadership, climate and culture of the university
(Grunwald& Peterson 2003; Hagedorn 2000; Zhou &Volkwein 2004).
Although Cranny et al., (1992) estimated that over 5,000 articles and dissertations have examined the topic of
job satisfaction and it is a continuing topic for research. Most of the research that has been conducted in the field of
job satisfaction has focused on organizational business and industrial setting (Platsidou&Diamantopoulou 2009).
However, in recent years, a clear increase has been observed in the number of studies related to the job
satisfaction of academics (Neumann 1978). Several studies have examined the job satisfaction of academic membersin higher education of the developed countries, unfortunately, evidence from developing countries is seriously
lacking and is a gap which needs to be filled (Ssesanga&Garrett 2005; Eyupoglu & Saner 2009; Garrett 1999;
Hean& Garrett 2001). Furthermore, very little research has focused on academic and administrative staff members in the
Jimma University.
1.2. Statement of the problem
Job satisfaction is the reaction of the workers against the role they play in their work (Vroom) (1967, 1999). The studies is
designed to investigate the level of achievement of employee’s job satisfaction of aca demic and administrative staffmembers on Jimma University main campus. Satisfied employees are preferred simply because they affect the work
environment positively. Thus even though a well satisfied employee is not necessarily an outstanding performer a high
level of satisfaction leads to organizational commitment while a low level or dissatisfaction results inn behaviors
detrimental to the organization Management of universities has, over time been a contentious issue but more contentious,
however has been the performance of employee at work. Unfortunately, Jimma University staff members do not perform
to the expected standards and neither do they seem to address the needs of students and other stakeholders. Their
performance is still less satisfactory than the expected standards and consequences have been predictable as there are
rising concerns over poor coverage of term projects and course content, delayed examination results and missingmarks, poor assessment of examinations, poor lecturer-student interaction, deteriorating academic performance and
reduced levels of research and publications and as a result, academic standards and performance among students
have been adversely affected and are still the daily complaint s in the local university press (Campus press,
2008). With these problems, the University is losing credibility as students are no longer applying to study there while
a good number of them are resorting to other universities and colleges. This unsatisfactory performance of staff
members has in turn posed a threat on the quality of education offered by the institution and service delivery. This study,
therefore sought to investigate the staff development members and the effects of such members on the performance
of academic and administrative at Jimma University.
This research sought to answer the following questions:
How can you identify that the socio-economic and demographic factors?
7/23/2019 job satisfaction research
http://slidepdf.com/reader/full/job-satisfaction-research 7/31
What relationship does experience have with job satisfaction of academic and administrative staff in Jimma
University?
What relationship does working environment have with job satisfaction of staff members of Jimma University?
1.3 objective of the study
1.3.1 General objectives
The general objective of this study will be to asses, examine and distinguish job satisfaction of academic and
administrative staff members in Jimma University.
1.3.2 Specific objectives
To explore whether there is a relationship between socio-economic and demographic factors. To estimate the relationship between experience and job satisfaction.
To exam the relationship between the working environment and job satisfaction.
1.4 significance of the study
The study deals about statistical analysis of job satisfaction of administrative and academic staff members of Jimma
university main campus. The study could help those University identify staff members that may be positively or
negatively affecting job performance among academic and administrative in the University and hence be in position to
adjust those programs that are in their power to adjust to positively enhance job performance in the University. Theresearch findings can also be an invaluable information base for the heads of department, deans, principals of
Jimma University to revise and improve policies on training and promotion opportunities for the improvement of
employee job performance. Theoretically, the study will also prompt more researches in the area having
contributed to literature related to staff members and serves as a reference for private and public universities
interested in the dynamics of job performance.
This study emphasis in the following scope:
To identify the employees level of satisfaction upon that job. This study is helpful to that organization for conducting further research.
It is helpful to identify the employer’s level of satisfaction towards welfare measure.
This study is helpful to the organization for identifying the area of dissatisfaction of job of
the employees.
7/23/2019 job satisfaction research
http://slidepdf.com/reader/full/job-satisfaction-research 8/31
CHAPTER TWO
2. LITERATURE REVIEW
Job satisfaction is the most widely investigated as well as one of the most extensively proposed subjects in
industrial/organizational psychology.
Many work motivation theories have represented the implied role of job satisfaction. In addition many work satisfaction
theories have tried to explain job satisfaction and i8)it influence, such as, Maslow’s (1943) hierarchy of needs,
Hertzberg’s (1968) Two-factor (motivation hygiene) theory, Adams (1965) equity theory , porter and Lawler’s (1968)
modified version of vrooms (1964)
As a result of this expensive proposal, job satisfaction has been linked to productivity, motivation, absenteeism/tardiness,
accidents, mental/physical health and general life satisfaction.(Landv, 1978). A common idea of the proposal has been to
some extent, the motivational state of a n individual is affected by interactions with their work environment people
identify themselves by their profession, such as doctor, lawyer or teacher. A person’s individual well-being at work
therefore, is a very significant aspect of proposal (judge and Klinger, 2007).
The most widely accepted explanation of job satisfaction was presented by locke (1976), who defined job satisfaction as
“pleasurable or positive emotional state resulting from the appraisal of one’s job or job experience(p.1304) additionally,
job satisfaction has emotional, cognitive and behavioral components (Bernstein and Nash,2008)
The emotional component refers to feeling regarding the job, such as boredom, anxiety, or excitement. The cognitive
component of job satisfaction refers to beliefs regarding one’s job. For example, feeling that one job is mentallydemanding and challenging. Finally the behavioral component includes people’s action in relation to their work. These
action may include being tardy, staying late, or pretending to be ill in order to avoid work.
2.1 cause of job satisfaction/ dissatisfaction
Since people tend to be evaluating, they look at their work experiences in terms of liking or disliking and develop feelings
of satisfaction or dissatisfaction regarding their job, as well as the organization in which they work (Jex, 2002). There are
many probable influences that effect how favorably an individual appraises his or her job: specifically, an individual’s
attitude towards his or her job. To explain the development of job satisfaction, proposal have taken three commonapproaches: job characteristics, social information processing (organizational characteristics), and dispositional (worker
characteristics)(Glisson&Durick, 1988,2002 ).
7/23/2019 job satisfaction research
http://slidepdf.com/reader/full/job-satisfaction-research 9/31
2.1.1. Job characteristics
In relation to the job characteristics approach, research has revealed that the nature of an individual’s job or the
characteristics of the organization that the individual works for predominantly determines job satisfaction (Jex, 2002).
According to Hackman and Oldham (1980) a job characteristics is an aspect of a job that generates ideal conditions for
high levels motivation, satisfaction and performance
Furthermore, Hackman and Oldham (1980) proposed five core job characteristics that all jobs should contain: skill variety,
task identity, task significance, autonomy, and feedback. These characteristics have been added to the more popular
dimensions of job satisfaction assessment: the work itself, pay, promotional opportunities, supervision, and co-worker
relations (Smith, Kendall, & Hulin, 1969).
2.1.2. Social information processing (organizational characteristics)
Social information processing (organizational characteristics) based mainly on Festinger’s (1954) social comparison
theory, Sex (2002), explain that during social information processing employees look to coworkers to make sense of and
development attitudes about their work environment dispositional ( worker characteristics).
2.1.3. Dispositional (worker characteristics)
Internal disposition is the basis of the latest method to explaining job satisfaction and hints that some people are inclined
to be satisfied or dissatisfied with their work no matter the nature of the job or the organizations environmental (Jex, 2002)
2.2. Measure of job satisfaction
The following are measures of job satisfaction as outlined by fields (2002)
Overall job satisfaction:- in these measure three items are used to describe an employee’s subjective response to
working in the specific job and organization(fields,2002,p.20)
Global job satisfaction:- two subscale are hide for extrinsic and intrinsic aspects of the job
Job in general sale:- this was developed “to assess global satisfaction independent from satisfaction withfacts”(fields 2002,p.9)
Job satisfaction related to expectations:- it accesses the degree of agreement the perceived quality of broad aspect
of a job and employee expectations(fields2002,p.6)
Job satisfaction survey:- the job facts include pay, promotion, supervision, benefits , contingent rewards, operating
procedures, co-workers, nature of work and communication job diagnostic survey:- the facts which are measured
on the survey include security, compensation co-workers and supervision(fields 2002,p.20)
Career satisfaction:- it assesses general satisfaction with career outcome, but also with career progress (fields,
2002,p.20)
7/23/2019 job satisfaction research
http://slidepdf.com/reader/full/job-satisfaction-research 10/31
CHAPTER THREE
3. METHODOLOGY
3.1. Study design
This study can be conducted by using primary data that can be collected from academic and administrative staff in Aksum
university. The questionnaire were distributed to the academic and administrative staff members who will be selected as a
sample for this study (research)
3.2. Study area and population.
Axum University is one of the newly established public higher education institutionsin Ethiopia. It is located in
Axum town, about 1024Km north of Addis Ababa.This study is conducted in Aksum university main campus the
study population are all administrative and academic staff members which are found in main campus.
3.3 Sampling Techniques
This study was conducted using simple stratification over simple random sampling of staff members academic and
administrative because the target population force to use stratification and it increase precession, separate estimate and
administratively convenient. The stratification consists of, stratum, academic staff and stratum to administrative staff.
3.4. Sample size determination
Normally the sample size determination requires three factors which are
level of precision
margin of error
level of significance
After the study of total population size is known the sample size was calculated as follow
Zα/2=1.96
α= the significance
d= margin of error=10%
p= the proportion of satisfaction=0.5
q= 1-p=1-0.5=0.5
no =p(q)( Zα/2)²
7/23/2019 job satisfaction research
http://slidepdf.com/reader/full/job-satisfaction-research 11/31
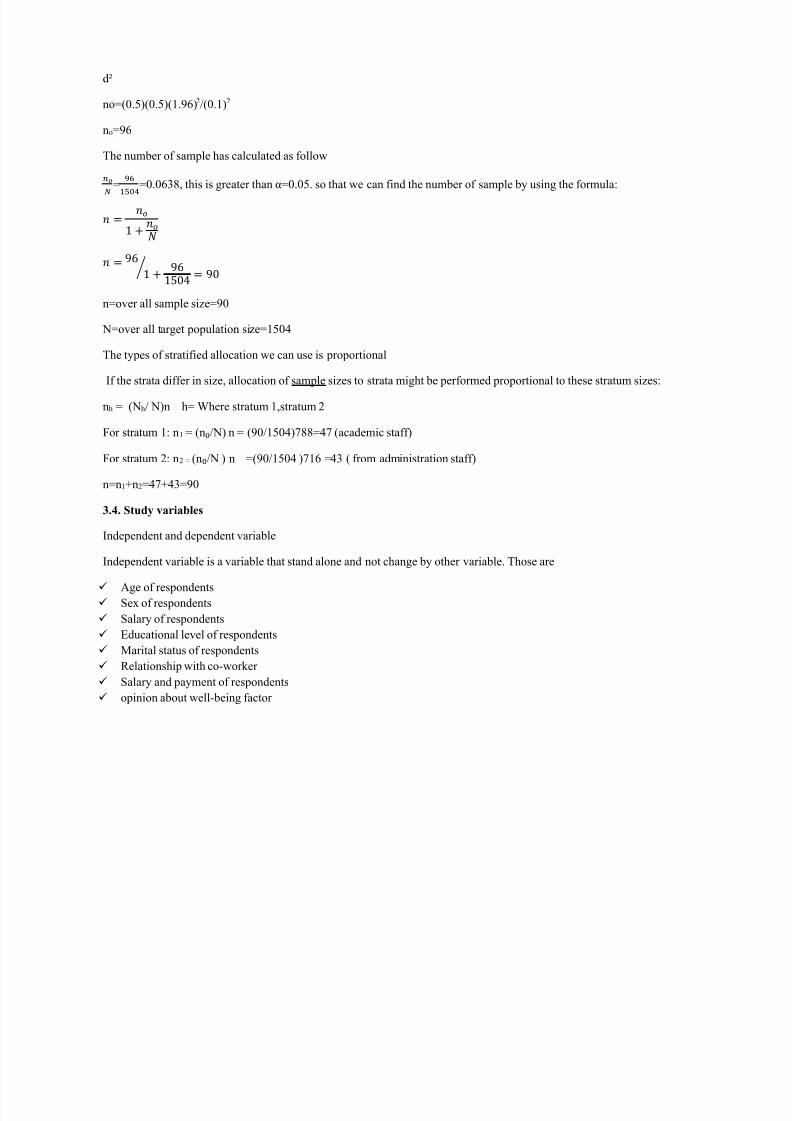
d²
no=(0.5)(0.5)(1.96)2/(0.1)2
no=96
The number of sample has calculated as follow
=
=0.0638, this is greater than α=0.05. so that we can find the number of sample by using the formula:
1 +
96 1 + 961504 90⁄
n=over all sample size=90
N=over all target population size=1504
The types of stratified allocation we can use is proportional
If the strata differ in size, allocation of sample sizes to strata might be performed proportional to these stratum sizes:
nh = (Nh/ N)n h= Where stratum 1,stratum 2
For stratum 1: n1 = (n₀/N) n = (90/1504)788=47 (academic staff)
For stratum 2: n2 = (n₀/N ) n =(90/1504 )716 =43 ( from administration staff)
n=n1+n2=47+43=90
3.4. Study variables
Independent and dependent variable
Independent variable is a variable that stand alone and not change by other variable. Those are
Age of respondents
Sex of respondents
Salary of respondents
Educational level of respondents
Marital status of respondents
Relationship with co-worker
Salary and payment of respondents
opinion about well-being factor
7/23/2019 job satisfaction research
http://slidepdf.com/reader/full/job-satisfaction-research 12/31
working environment
experience of respondents
work condition and enough time to spend with family
Dependent variable is a variable that depend on others that is job satisfaction.
3.5. Methods of data analysis
Methods data analysis depending used for any study was depending on – the nature of variable incorporated in the study,
objective of the research, the data type of basic variables included in the study.
3.5.1. Descriptive statistics
The descriptive statistics is a method in which the data collected are organized, and summarized in the form of cross tab,frequency table and bar chart.
3.5.2. Inferential statistics
As its name indicates that the inferential statistics infer about the population depending on the sample data, analysis and
test hypothesis which are test of independency and logistic regression.
3.5.2.1 Chi-square test of independency
Chi-square test is a method of analysis for data obtained from categorical variables. The data was the forms of count chi-square test for association (independence in a two way classification use this procedure to test it the probability of item or
subject being classified for one variable depend up on the classification of the other variables. The objective of chi-square
test independencies to test whether there is a relationship between two categories variables.
Assumptions of chi-square independence
The chi-squared test, when used with the standard approximation that a chi-squared distribution is applicable, has the
following assumptions
The observation must be independence of each other. The sample must be randomly selected from the independent population.
The population must be normally distributed.
A test that relies on different assumptions is Fisher's exact test; if its assumption of fixed marginal distributions is met it is
substantially more accurate in obtaining a significance level, especially with few observations. In the vast majority ofapplications this assumption will not be met, and Fisher's exact test will be over conservative and not have correct
coverage.
The chi-square test of independency approach consists of four steps
State the hypothesis
Formulate an analysis
7/23/2019 job satisfaction research
http://slidepdf.com/reader/full/job-satisfaction-research 13/31
Analyze sample data Interpret
1. State hypothesis
Ho: the two attributes are independent
H1: the two attributes are dependent
These attributes
There is no association between working conditions and job satisfaction.
There is no association between working environments and job satisfaction
There is no association between welfare measures and job satisfaction
There is no association between monthly salary and job satisfaction. There is no association between educational level and job satisfaction and the like.
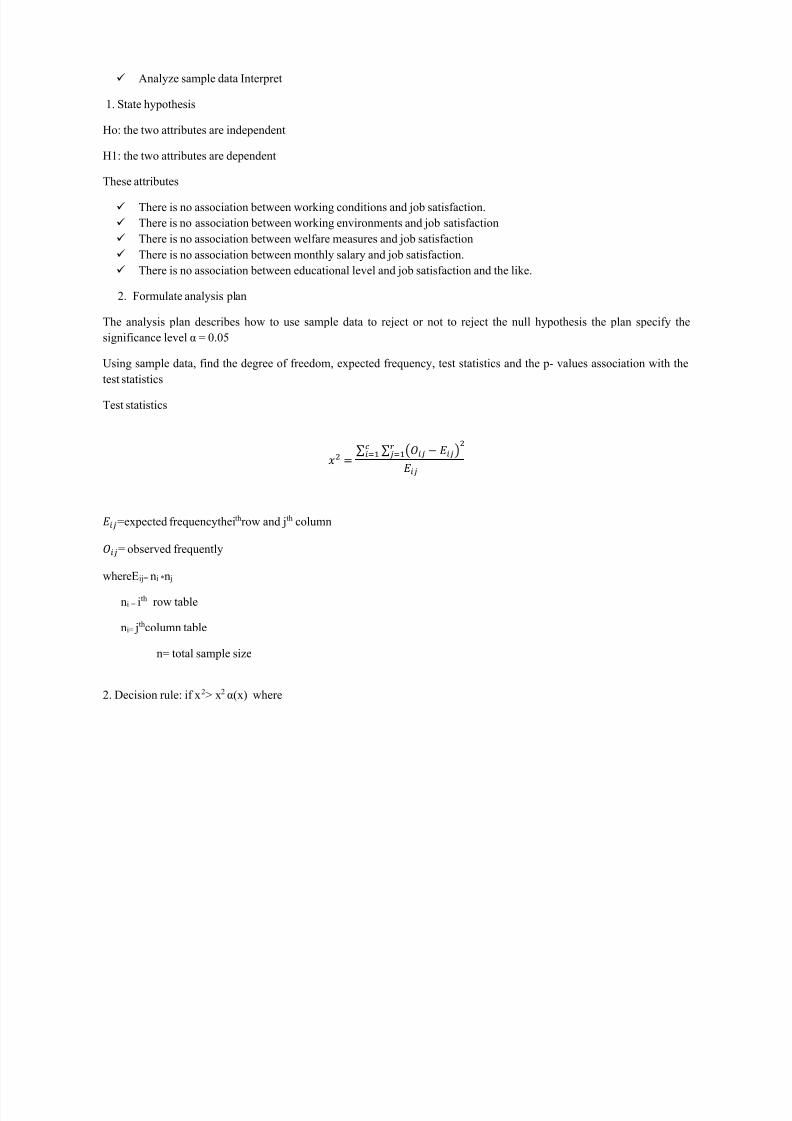
2. Formulate analysis plan
The analysis plan describes how to use sample data to reject or not to reject the null hypothesis the plan specify the
significance level α = 0.05
Using sample data, find the degree of freedom, expected frequency, test statistics and the p- values association with the
test statistics
Test statistics
∑ ∑ ( )==
=expected frequencytheithrow and jth column
= observed frequently
whereEij= ni *n j
ni = ith row table
ni= jthcolumn table
n= total sample size
2. Decision rule: if x2> x2 α(x) where
7/23/2019 job satisfaction research
http://slidepdf.com/reader/full/job-satisfaction-research 14/31
X= (r-1)(c-1) the hypothesis is rejected at α=0.05
It implies that reject Ho. hence there is significant association between supervision and job satisfaction of the respondent.
Otherwise accept Ho
Where the square of the differences between the observed and expected values in each cell, divided by the expected value,
are added across all of the cells in the table.
The distribution of the statistic X 2 is chi-square with (r -1)(c-1) degrees of freedom, where r represents the number of rows
in the two-way table and c represents the number of columns. The distribution is denoted (df), where df is the numberof degrees of freedom.
The chi-square distribution is defined for all positive values. The P-value for the chi-square test is P ( >X²), the probability of observing a value at least as extreme as the test statistic for a chi-square distribution with (r -1)(c-1) degrees
of freedom. It implies that reject Ho. hence there is significant association between supervision and job satisfaction of therespondent, otherwise accept HO
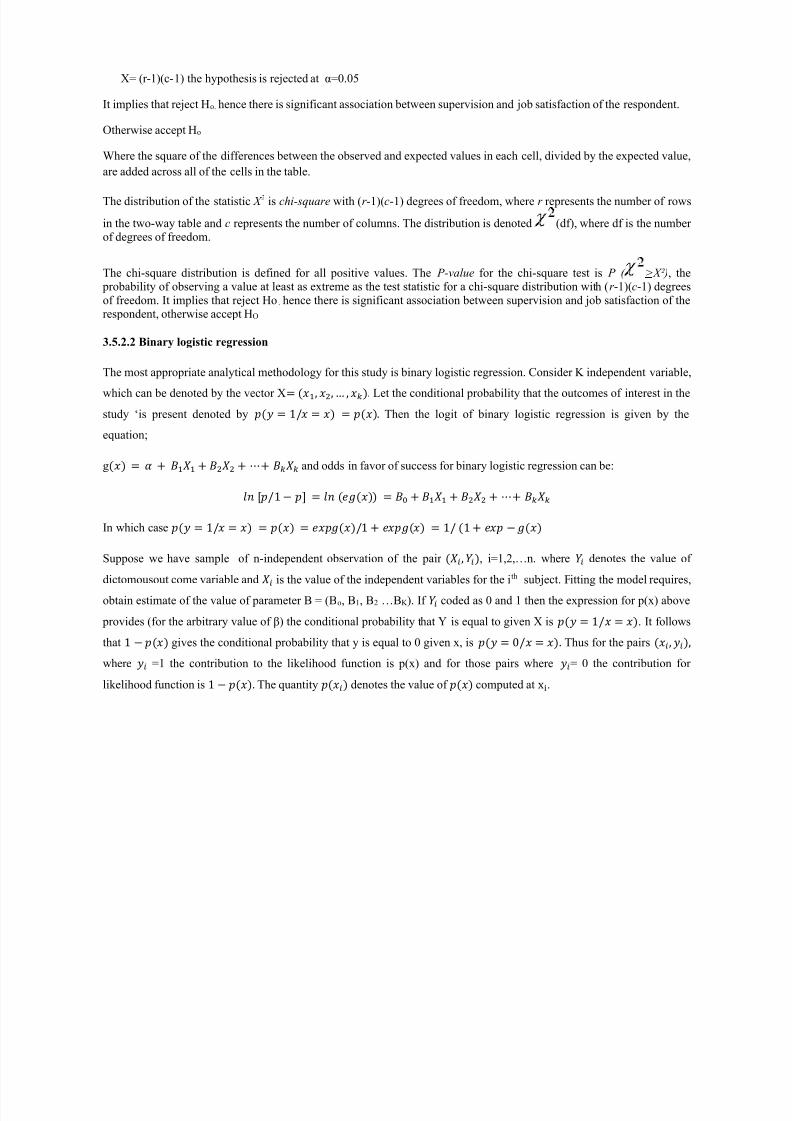
3.5.2.2 Binary logistic regression
The most appropriate analytical methodology for this study is binary logistic regression. Consider K independent variable,
which can be denoted by the vector X , , … , . Let the conditional probability that the outcomes of interest in the
study ‘is present denoted by 1/ . Then the logit of binary logistic regression is given by the
equation;
g + + + ⋯+ and odds in favor of success for binary logistic regression can be:
[/1 ] + + + ⋯+
In which case 1/ /1 + 1/ 1 +
Suppose we have sample of n-independent observation of the pair , , i=1,2,…n. where denotes the value of
dictomousout come variable and is the value of the independent variables for the ith subject. Fitting the model requires,
obtain estimate of the value of parameter B = (Bo, B1, B2 …BK ). If coded as 0 and 1 then the expression for p(x) above
provides (for the arbitrary value of β) the conditional probability that Y is equal to given X is 1/ . It follows
that 1 gives the conditional probability that y is equal to 0 given x, is 0/ . Thus for the pairs , , where =1 the contribution to the likelihood function is p(x) and for those pairs where = 0 the contribution for
likelihood function is 1 . The quantity denotes the value of computed at xi.
7/23/2019 job satisfaction research
http://slidepdf.com/reader/full/job-satisfaction-research 15/31
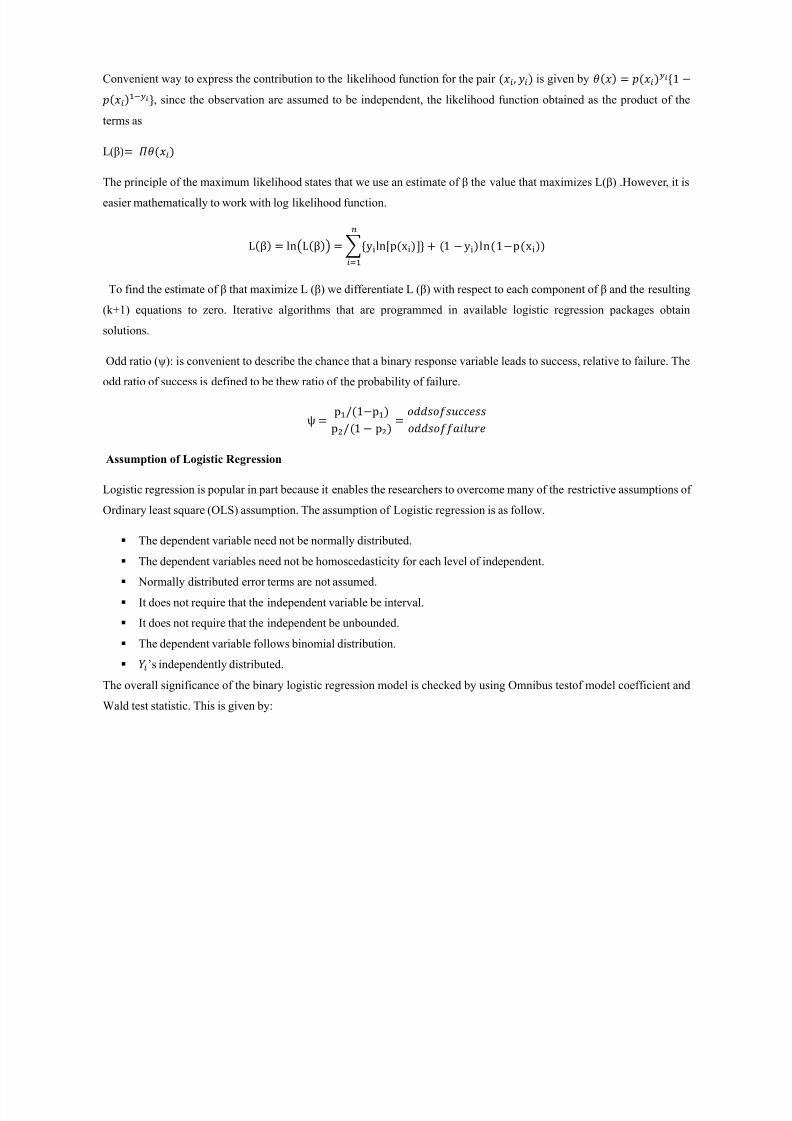
Convenient way to express the contribution to the likelihood function for the pair , is given by {1 −}, since the observation are assumed to be independent, the likelihood function obtained as the product of the
terms as
L(β)
The principle of the maximum likelihood states that we use an estimate of β the value that maximizes L(β) .However, it is
easier mathematically to work with log likelihood function.
Lβ ln(Lβ) {yiln[pxi]} + 1 yiln1pxi
=
To find the estimate of β that maximize L (β) we differentiate L (β) with respect to each component of β and the resulting
(k+1) equations to zero. Iterative algorithms that are programmed in available logistic regression packages obtain
solutions.
Odd ratio (ψ): is convenient to describe the chance that a binary response variable leads to success, relative to failure. The
odd ratio of success is defined to be thew ratio of the probability of failure.
ψ p/1pp/1 p
Assumption of Logistic Regression
Logistic regression is popular in part because it enables the researchers to overcome many of the restrictive assumptions of
Ordinary least square (OLS) assumption. The assumption of Logistic regression is as follow.
The dependent variable need not be normally distributed.
The dependent variables need not be homoscedasticity for each level of independent.
Normally distributed error terms are not assumed.
It does not require that the independent variable be interval.
It does not require that the independent be unbounded.
The dependent variable follows binomial distribution. ’s independently distributed.
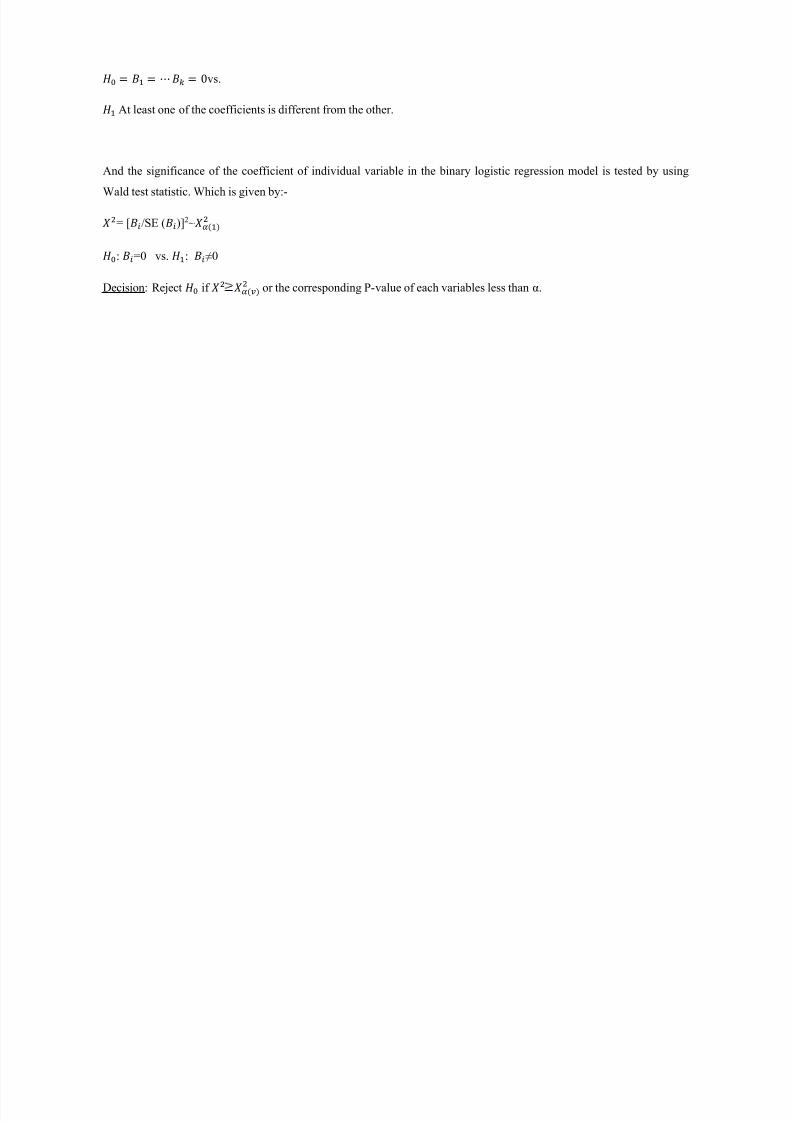
The overall significance of the binary logistic regression model is checked by using Omnibus testof model coefficient and
Wald test statistic. This is given by:
7/23/2019 job satisfaction research
http://slidepdf.com/reader/full/job-satisfaction-research 16/31
⋯ 0vs.
At least one of the coefficients is different from the other.
And the significance of the coefficient of individual variable in the binary logistic regression model is tested by using
Wald test statistic. Which is given by:-
= [/SE ()]2~
: =0 vs. : ≠0
Decision: Reject if or the corresponding P-value of each variables less than α.
7/23/2019 job satisfaction research
http://slidepdf.com/reader/full/job-satisfaction-research 17/31
CHAPTER FOUR
4. Result and discussion
This chapter contains the result of descriptive statistics, bivariate analysis and binary logistic regression from 1504,
Sample of 90. The statistical analysis is used to see job satisfaction of academic and administrative staff members
in Jimma University. The data were analyzed using SPSS version 20.
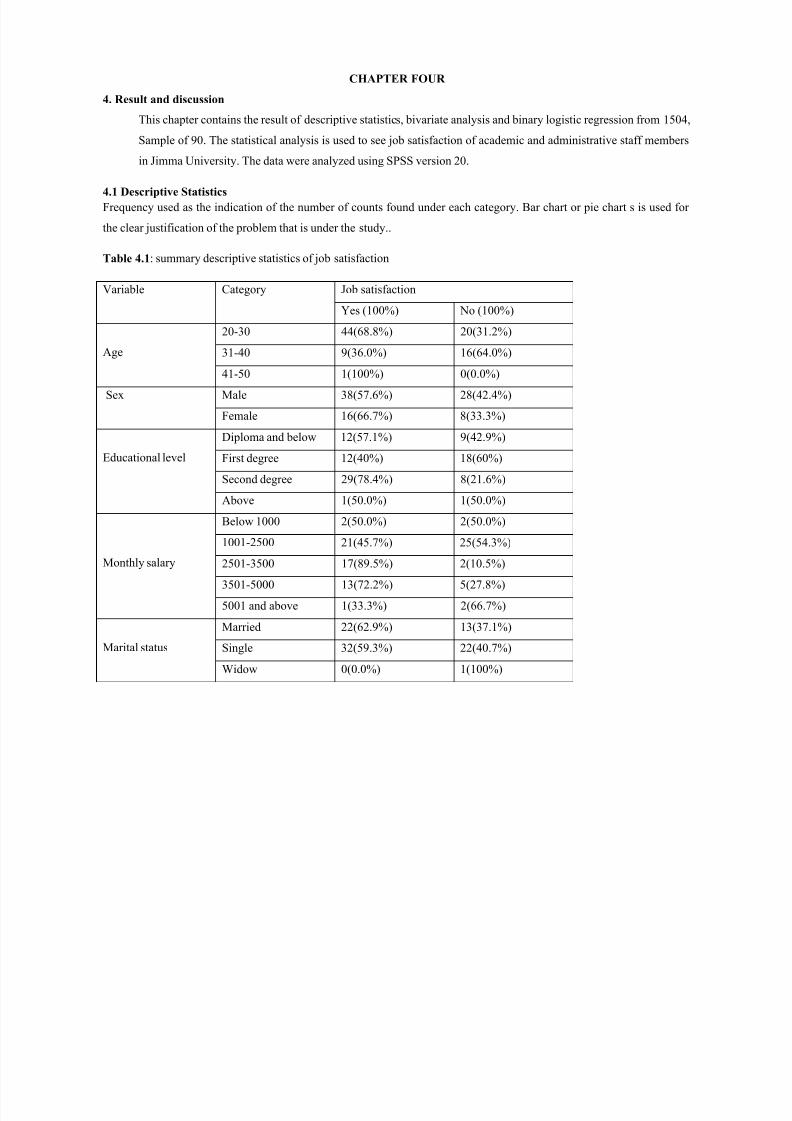
4.1 Descriptive Statistics
Frequency used as the indication of the number of counts found under each category. Bar chart or pie chart s is used for
the clear justification of the problem that is under the study..
Table 4.1: summary descriptive statistics of job satisfaction
Variable Category Job satisfaction
Yes (100%) No (100%)
Age
20-30 44(68.8%) 20(31.2%)
31-40 9(36.0%) 16(64.0%)
41-50 1(100%) 0(0.0%)
Sex Male 38(57.6%) 28(42.4%)
Female 16(66.7%) 8(33.3%)
Educational level
Diploma and below 12(57.1%) 9(42.9%)
First degree 12(40%) 18(60%)
Second degree 29(78.4%) 8(21.6%)
Above 1(50.0%) 1(50.0%)
Monthly salary
Below 1000 2(50.0%) 2(50.0%)
1001-2500 21(45.7%) 25(54.3%)
2501-3500 17(89.5%) 2(10.5%)
3501-5000 13(72.2%) 5(27.8%)
5001 and above 1(33.3%) 2(66.7%)
Marital status
Married 22(62.9%) 13(37.1%)
Single 32(59.3%) 22(40.7%)
Widow 0(0.0%) 1(100%)
7/23/2019 job satisfaction research
http://slidepdf.com/reader/full/job-satisfaction-research 18/31
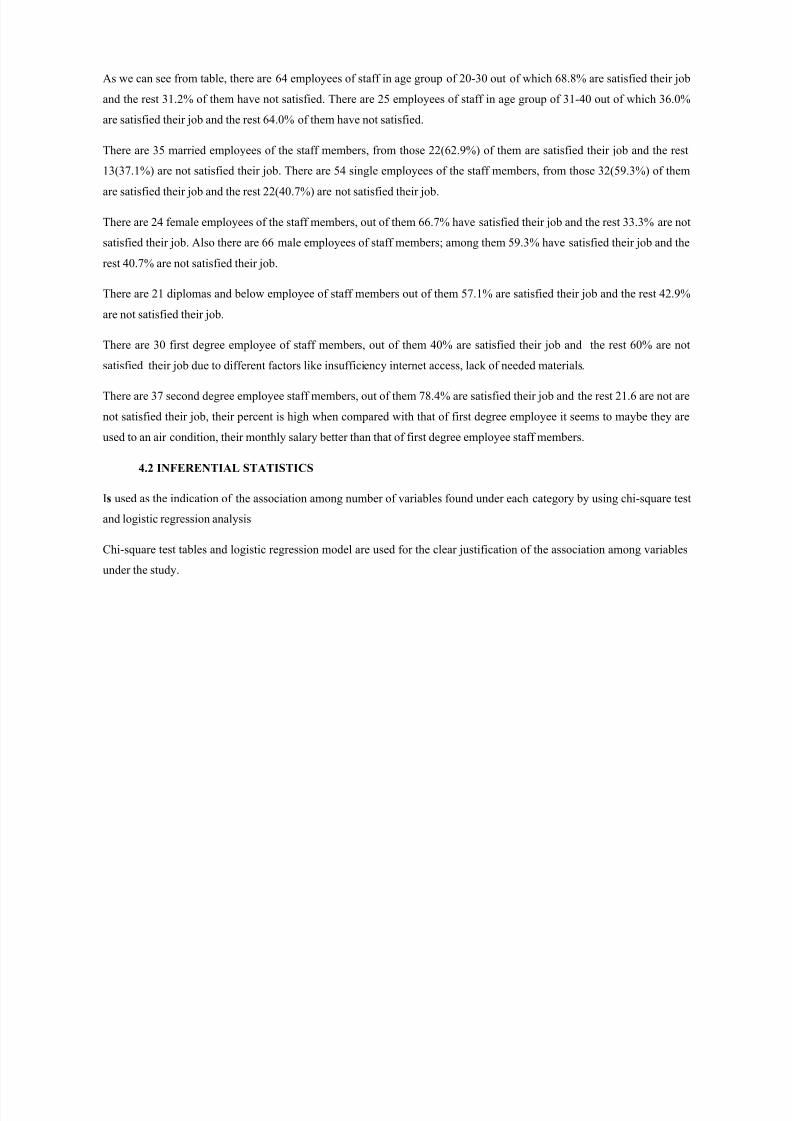
As we can see from table, there are 64 employees of staff in age group of 20-30 out of which 68.8% are satisfied their job
and the rest 31.2% of them have not satisfied. There are 25 employees of staff in age group of 31-40 out of which 36.0%
are satisfied their job and the rest 64.0% of them have not satisfied.
There are 35 married employees of the staff members, from those 22(62.9%) of them are satisfied their job and the rest
13(37.1%) are not satisfied their job. There are 54 single employees of the staff members, from those 32(59.3%) of them
are satisfied their job and the rest 22(40.7%) are not satisfied their job.
There are 24 female employees of the staff members, out of them 66.7% have satisfied their job and the rest 33.3% are not
satisfied their job. Also there are 66 male employees of staff members; among them 59.3% have satisfied their job and the
rest 40.7% are not satisfied their job.
There are 21 diplomas and below employee of staff members out of them 57.1% are satisfied their job and the rest 42.9%
are not satisfied their job.
There are 30 first degree employee of staff members, out of them 40% are satisfied their job and the rest 60% are not
satisfied their job due to different factors like insufficiency internet access, lack of needed materials.
There are 37 second degree employee staff members, out of them 78.4% are satisfied their job and the rest 21.6 are not are
not satisfied their job, their percent is high when compared with that of first degree employee it seems to maybe they are
used to an air condition, their monthly salary better than that of first degree employee staff members.
4.2 INFERENTIAL STATISTICS
Is used as the indication of the association among number of variables found under each category by using chi-square test
and logistic regression analysis
Chi-square test tables and logistic regression model are used for the clear justification of the association among variables
under the study.
7/23/2019 job satisfaction research
http://slidepdf.com/reader/full/job-satisfaction-research 19/31
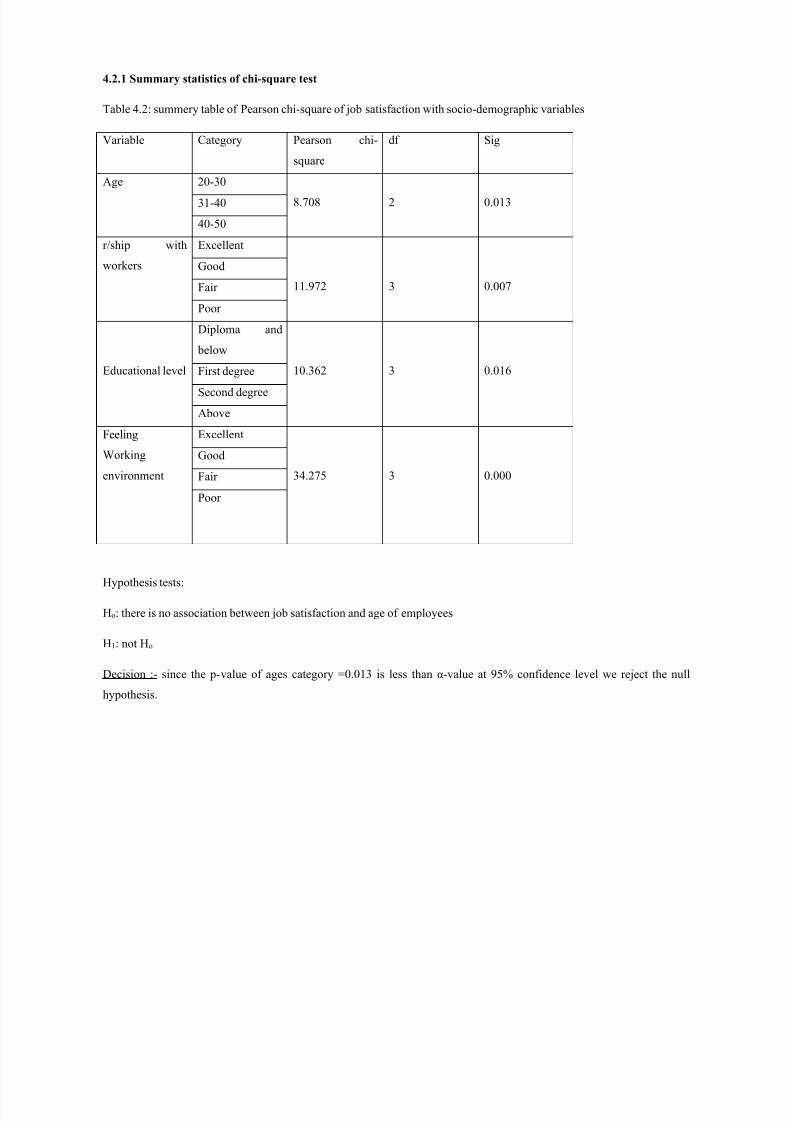
4.2.1 Summary statistics of chi-square test
Table 4.2: summery table of Pearson chi-square of job satisfaction with socio-demographic variables
Variable Category Pearson chi-
square
df Sig
Age 20-30
8.708 2 0.01331-40
40-50
r/ship with
workers
Excellent
11.972 3 0.007
Good
Fair
Poor
Educational level
Diploma and
below
10.362 3 0.016First degree
Second degree
Above
Feeling
Working
environment
Excellent
34.275 3 0.000
Good
Fair
Poor
Hypothesis tests:
Ho: there is no association between job satisfaction and age of employees
H1: not Ho
Decision :- since the p-value of ages category =0.013 is less than α-value at 95% confidence level we reject the null
hypothesis.
7/23/2019 job satisfaction research
http://slidepdf.com/reader/full/job-satisfaction-research 20/31
Conclusion:- there is enough evidence against the null hypothesis at α=5% level of significance then there are relationship
between the job satisfaction and age of employees, that mean the job satisfaction of the employees are depends on the
ages of the employee staff members.
H0: there is no association between job satisfaction and relationship with workers.
H1: not H0.
Decision:- since p-value of the category=0.007 is less than α-value at 95% confidence level we reject the null hypothesis.
Conclusion:- :- there is enough evidence against the null hypothesis at α=5% level of significance then there are
association between the job satisfaction and relationship of employees that works in Aksum university, that mean the job
satisfaction of the employees are depends on the relationships of academic and administrative staff members.
Hypothesis tests:
Ho: there is no association between job satisfaction and feeling working environment of employees.
H1: not Ho
Decision: - since the p-value of feeling working environment category =0.000 is less than α-value at 95% confidence level
we reject the null hypothesis.
Conclusion:- there is enough evidence against the null hypothesis at α=5% level of significance then there are
association between the job satisfaction and feeling of working environment of employees that works in Aksum
university, that mean the job satisfaction of the employees are depends on the feeling of the working environment of staff
members.
From the categorical variables listed in the table above age of employees, relationship of workers, educational level of
employees, feeling working environment and well- being or welfare factors are statistically significant at α=5% confidence
level it implies that there is strong enough evidence against null hypothesis, there is association between the job
satisfaction of academic and administrative staff members with the above variables.
7/23/2019 job satisfaction research
http://slidepdf.com/reader/full/job-satisfaction-research 21/31
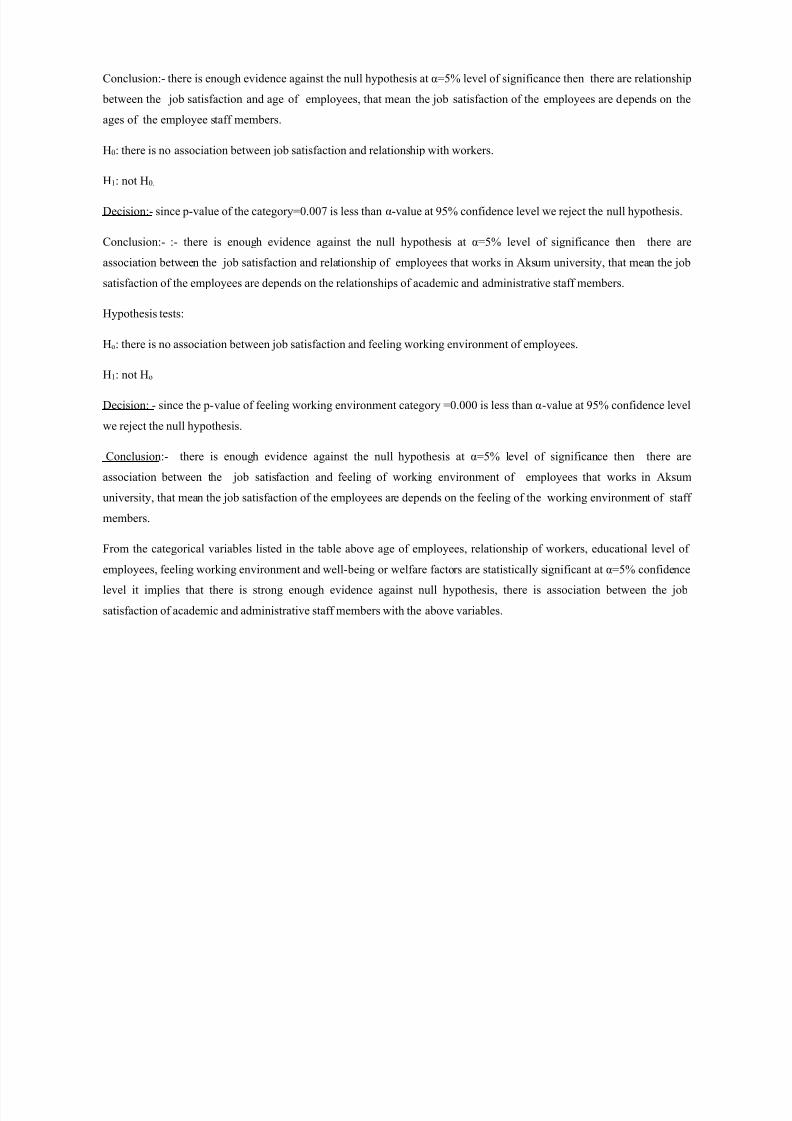
4.3. LOGISTIC REGRESSION ANALYSIS
Table 4.3: Categorical Variables Coding
Frequency
Parameter coding
(1) (2) (3)
Relationship with
workers
excellent 31 1.000 .000 .000
good 14 .000 1.000 .000
Fair 26 .000 .000 1.000
poor 19 .000 .000 .000
salary and payment for
the staff are:
high
satisfaction31 1.000 .000 .000
moderately 20 .000 1.000 .000
satisfactory 5 .000 .000 1.000
unsatisfaction 34 .000 .000 .000
Feeling about workingenvironments are
excellent 25 1.000 .000 .000
good 11 .000 1.000 .000Fair 30 .000 .000 1.000
poor 24 .000 .000 .000
Opinion about welfare
factors are:
excellent 11 1.000 .000 .000
good 20 .000 1.000 .000
Fair 32 .000 .000 1.000
poor 27 .000 .000 .000
Enough time spending
with family or friends
Yes 47 1.000
No 43 .000
7/23/2019 job satisfaction research
http://slidepdf.com/reader/full/job-satisfaction-research 22/31
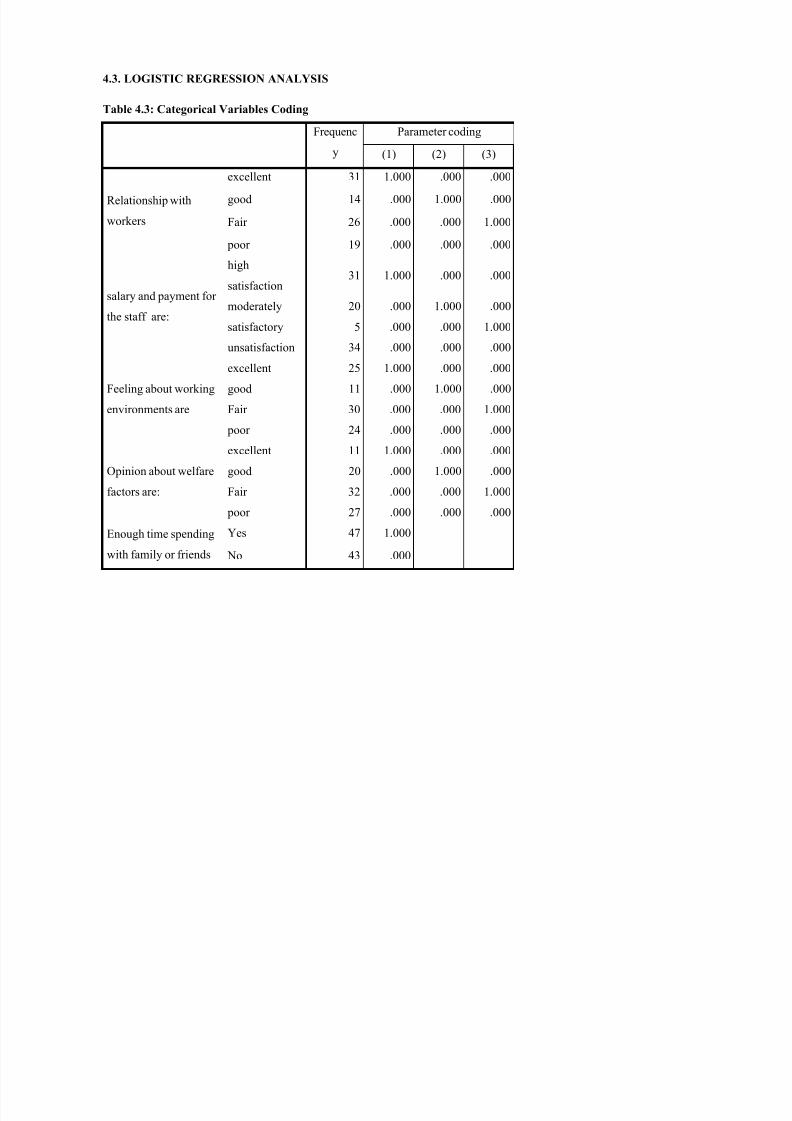
4.3.1 Assessing the goodness of fit of the model
Based on likelihood ratio test
Table 4.4: Omnibus Tests of Model Coefficients
Chi-square Df Sig.
Step 1
Step 80.935 14 .000
Block 80.935 14 .000
Model 80.935 14 .000
Table 4.5: Model Summary
Step -2 Log
likelihood
Cox & Snell
R Square
Nagelkerke
R Square
1 400.207a .593 .802
a. Estimation terminated at iteration number 7
because parameter estimates changed by less than
.001.
The model is good fit based on likelihood ratio test if G2=-2(LO-L1) =
10
1
02
loglog2log2 l l l
l
G
G2=-2(80.935-400.207) =638.544
This results of large number and positive is indicated that the model is good fit based on the likelihood ratio test.
Based on Hosmer and Lemeshow test.
Table4.6: summary of Hosmer and Lemeshow
Test
Step Chi-square df Sig.
1 15.797 8 .45
The model is good fit according to the Hosmer and Lemeshow test if and only if p-value of the test is greater than α-value
at level of significance accordingly from the summary table 4.6 above p-value=0.45>
-value=0.05 level of significance,
therefore the model is good fit based on Hosmer-Lemeshow test.
7/23/2019 job satisfaction research
http://slidepdf.com/reader/full/job-satisfaction-research 23/31
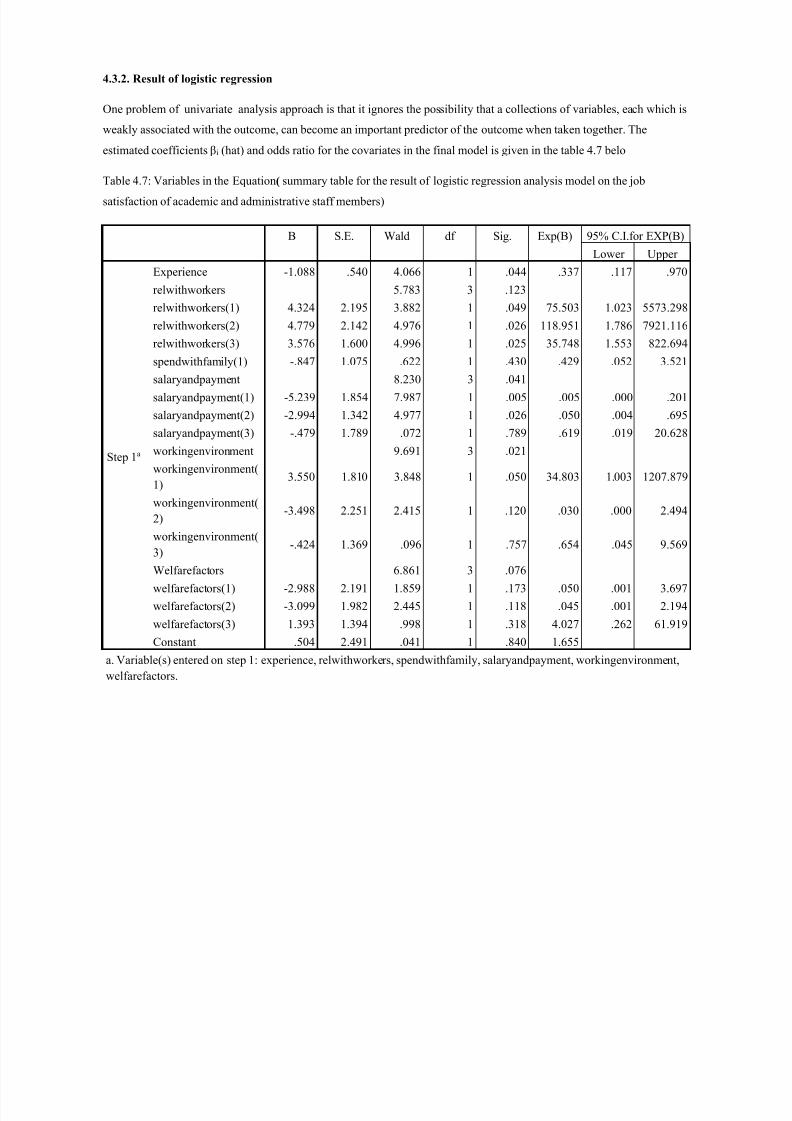
4.3.2. Result of logistic regression
One problem of univariate analysis approach is that it ignores the possibility that a collections of variables, each which is
weakly associated with the outcome, can become an important predictor of the outcome when taken together. Theestimated coefficients βi (hat) and odds ratio for the covariates in the final model is given in the table 4.7 belo
Table 4.7: Variables in the Equation( summary table for the result of logistic regression analysis model on the job
satisfaction of academic and administrative staff members)
B S.E. Wald df Sig. Exp(B) 95% C.I.for EXP(B)
Lower Upper
Step 1a
Experience -1.088 .540 4.066 1 .044 .337 .117 .970
relwithworkers 5.783 3 .123
relwithworkers(1) 4.324 2.195 3.882 1 .049 75.503 1.023 5573.298
relwithworkers(2) 4.779 2.142 4.976 1 .026 118.951 1.786 7921.116
relwithworkers(3) 3.576 1.600 4.996 1 .025 35.748 1.553 822.694
spendwithfamily(1) -.847 1.075 .622 1 .430 .429 .052 3.521
salaryandpayment 8.230 3 .041
salaryandpayment(1) -5.239 1.854 7.987 1 .005 .005 .000 .201
salaryandpayment(2) -2.994 1.342 4.977 1 .026 .050 .004 .695
salaryandpayment(3) -.479 1.789 .072 1 .789 .619 .019 20.628
workingenvironment 9.691 3 .021
workingenvironment(
1)3.550 1.810 3.848 1 .050 34.803 1.003 1207.879
workingenvironment(
2)
-3.498 2.251 2.415 1 .120 .030 .000 2.494
workingenvironment(
3)-.424 1.369 .096 1 .757 .654 .045 9.569
Welfarefactors 6.861 3 .076
welfarefactors(1) -2.988 2.191 1.859 1 .173 .050 .001 3.697
welfarefactors(2) -3.099 1.982 2.445 1 .118 .045 .001 2.194
welfarefactors(3) 1.393 1.394 .998 1 .318 4.027 .262 61.919
Constant .504 2.491 .041 1 .840 1.655
a. Variable(s) entered on step 1: experience, relwithworkers, spendwithfamily, salaryandpayment, workingenvironment,
welfarefactors.
7/23/2019 job satisfaction research
http://slidepdf.com/reader/full/job-satisfaction-research 24/31
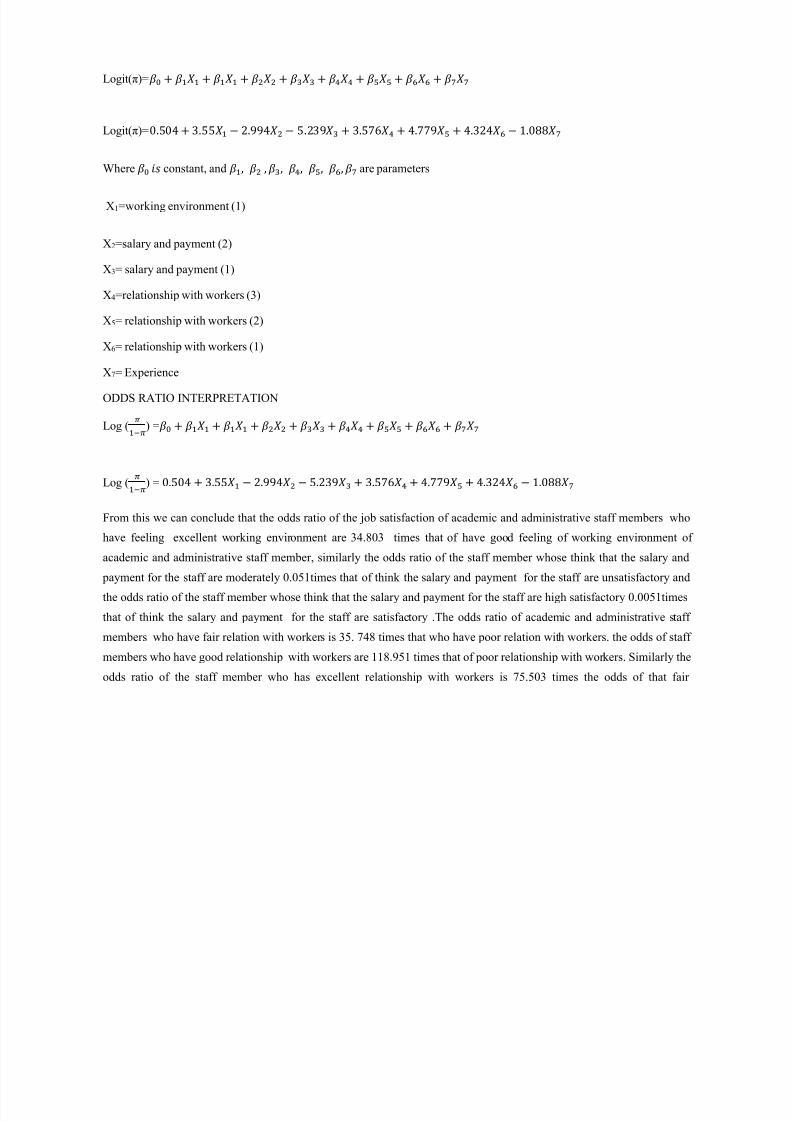
Logit(π)= + + + + + + + +
Logit(π)=0.504 + 3.55 2.994 5.239 + 3.576 + 4.779 + 4.324 1.088
Where constant, and , , , , , , are parameters
X1=working environment (1)
X2=salary and payment (2)
X3= salary and payment (1)
X4=relationship with workers (3)
X5= relationship with workers (2)
X6= relationship with workers (1)
X7= Experience
ODDS RATIO INTERPRETATION
Log ( −) = + + + + + + + +
Log ( −) = 0.504 + 3.55 2.994 5.239 + 3.576 + 4.779 + 4.324 1.088
From this we can conclude that the odds ratio of the job satisfaction of academic and administrative staff members whohave feeling excellent working environment are 34.803 times that of have good feeling of working environment of
academic and administrative staff member, similarly the odds ratio of the staff member whose think that the salary and
payment for the staff are moderately 0.051times that of think the salary and payment for the staff are unsatisfactory and
the odds ratio of the staff member whose think that the salary and payment for the staff are high satisfactory 0.0051times
that of think the salary and payment for the staff are satisfactory .The odds ratio of academic and administrative staff
members who have fair relation with workers is 35. 748 times that who have poor relation with workers. the odds of staff
members who have good relationship with workers are 118.951 times that of poor relationship with workers. Similarly the
odds ratio of the staff member who has excellent relationship with workers is 75.503 times the odds of that fair

7/23/2019 job satisfaction research
http://slidepdf.com/reader/full/job-satisfaction-research 25/31
relationship with workers. The odds of staff members who have 4-6years experience is 0.337times those have 2-4years
experience.
7/23/2019 job satisfaction research
http://slidepdf.com/reader/full/job-satisfaction-research 26/31
CHAPTER FIVE
5. Conclusions and recommendation
5.1. Conclusions
Based on the above result and discussion the following conclusions are concluded.
There is association between the job satisfaction academic and administration of staff member and their age,
relationship with workers and feeling of working environments educational level, salary and payment for the staff.
From the logistic regression, there is sufficient evidence that relationship between workers and supervision,
relationship with co-workers have an effect on job satisfaction.
Generally of the academic and administration staff, members are satisfied with their job due to their age
relationship with coworkers and work environment. And the respondent those are satisfied due to student approach,
if the students have active participation, if they score good result and if they attend class perfectly.
Of staff members are not satisfied with their job due to monthly salary employment , scarcity of time and
educational level.
5.2 Recommendations
Based on the result the paper would recommend the following:-
From the result of the research it can be seen that staff having higher salary have been seen to be satisfied with
their job. So, it will be good if they are played better for what they do.
The administration of the university should work to maximize the relationship between the staff members.
Any researcher who wants to conduct the research on job satisfaction of academic and administrative staff
members should include training opportunity, facility and service, family size and promotional opportunity as hisvariable in addition.
7/23/2019 job satisfaction research
http://slidepdf.com/reader/full/job-satisfaction-research 27/31
REFERENCE
Agresti, A., (1996). An introduction to categorical data analysis, New York Wiley.
An introduction to statistical method and data analysis, R.Lyman 5th Edition.
Andrew J Durbin’s The practice of supervision New Delhi
Demander.N Gujarati 3rd Edition, Basic Econometrics
Hawley, (1886).foundation of statistics 2nd edition
Hosmer,D., and Lemarshow, S., (1989), Applied Logistic regression, john and sons, Inc
John wily and sons Cochran sampling Technique, 3rdedition NetworkGupta.
S.E Fienberg (1987). The analysis of cross-classification categorical data

7/23/2019 job satisfaction research
http://slidepdf.com/reader/full/job-satisfaction-research 28/31
APPENDIX
SOFTWARE/ PACKAGES
1.
SPSS.
2. Microsoft Word 2003
7/23/2019 job satisfaction research
http://slidepdf.com/reader/full/job-satisfaction-research 29/31
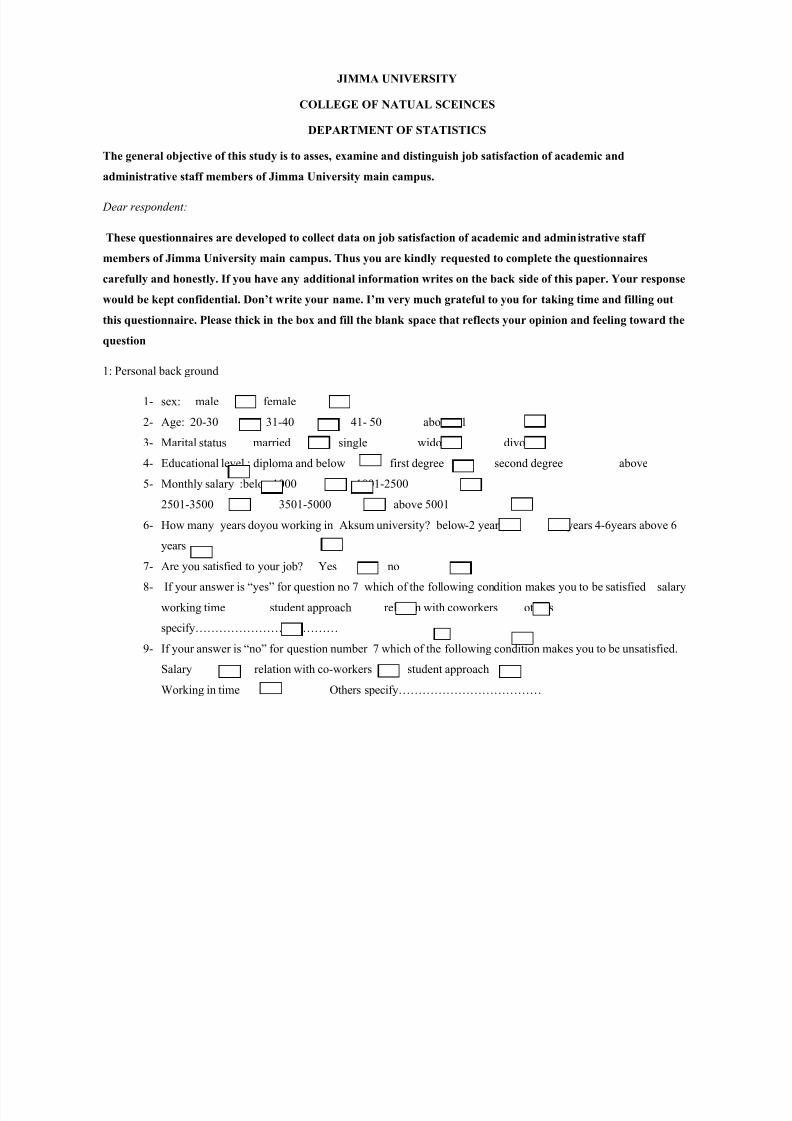
JIMMA UNIVERSITY
COLLEGE OF NATUAL SCEINCES
DEPARTMENT OF STATISTICS
The general objective of this study is to asses, examine and distinguish job satisfaction of academic and
administrative staff members of Jimma University main campus.
Dear respondent:
These questionnaires are developed to collect data on job satisfaction of academic and administrative staff
members of Jimma University main campus. Thus you are kindly requested to complete the questionnaires
carefully and honestly. If you have any additional information writes on the back side of this paper. Your response
would be kept confidential. Don’t write your name. I’m very much grateful to you for taking time and filling out
this questionnaire. Please thick in the box and fill the blank space that reflects your opinion and feeling toward the
question
1: Personal back ground
1-
sex: male female
2- Age: 20-30 31-40 41- 50 above 51
3- Marital status married single widow divorced
4- Educational level : diploma and below first degree second degree above
5- Monthly salary :below1000 1001-2500
2501-3500 3501-5000 above 5001
6-
How many years doyou working in Aksum university? below-2 years 2-4 years 4-6years above 6
years
7- Are you satisfied to your job? Yes no
8- If your answer is “yes” for question no 7 which of the following condition makes you to be satisfied salary
working time student approach relation with coworkers others
specify………………………………
9-
If your answer is “no” for question number 7 which of the following condition makes you to be unsatisfied.
Salary relation with co-workers student approach
Working in time Others specify………………………………
7/23/2019 job satisfaction research
http://slidepdf.com/reader/full/job-satisfaction-research 30/31
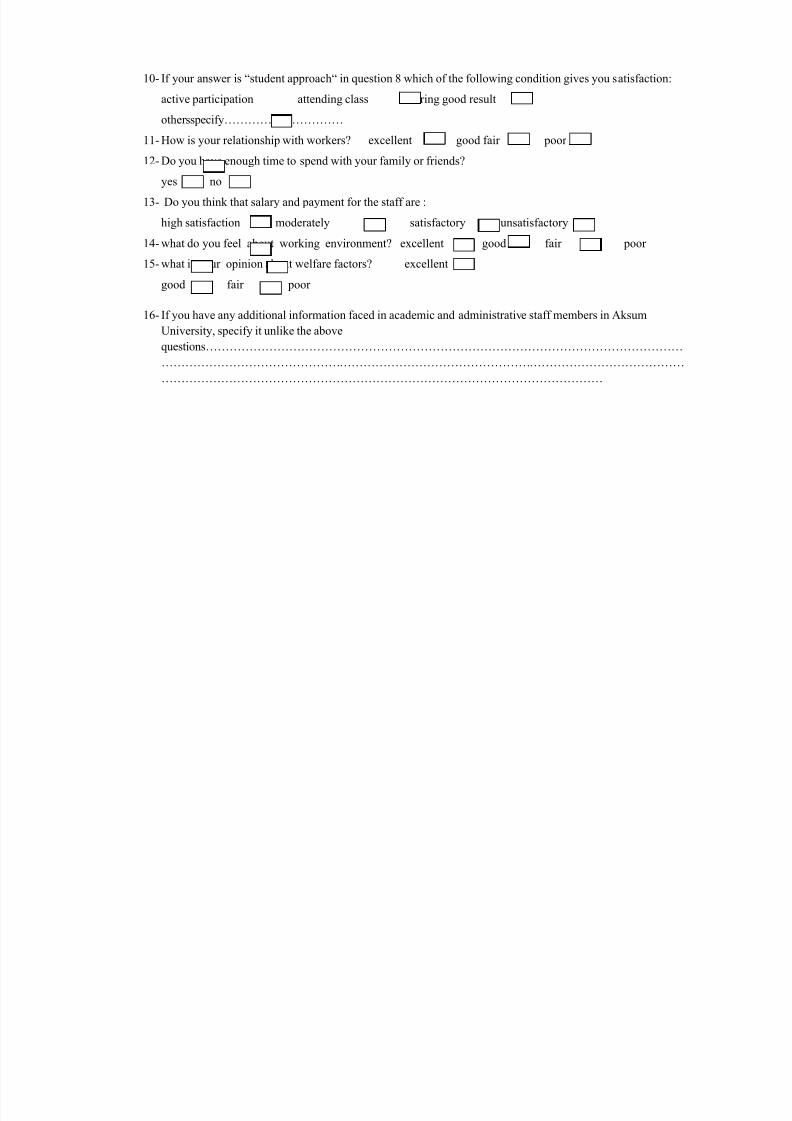
10- If your answer is “student approach“ in question 8 which of the following condition gives you satisfaction:
active participation attending class scoring good result
other sspecify…………………………
11-
How is your relationship with workers? excellent good fair poor
12- Do you have enough time to spend with your family or friends?
yes no
13- Do you think that salary and payment for the staff are :
high satisfaction moderately satisfactory unsatisfactory
14- what do you feel about working environment? excellent good fair poor
15-
what is your opinion about welfare factors? excellent
good fair poor
16- If you have any additional information faced in academic and administrative staff members in Aksum
University, specify it unlike the above
questions…………………………………………………………………………………………………………
……………………………………………………………………………………………………………………
…………………………………………………………………………………………………
7/23/2019 job satisfaction research
http://slidepdf.com/reader/full/job-satisfaction-research 31/31
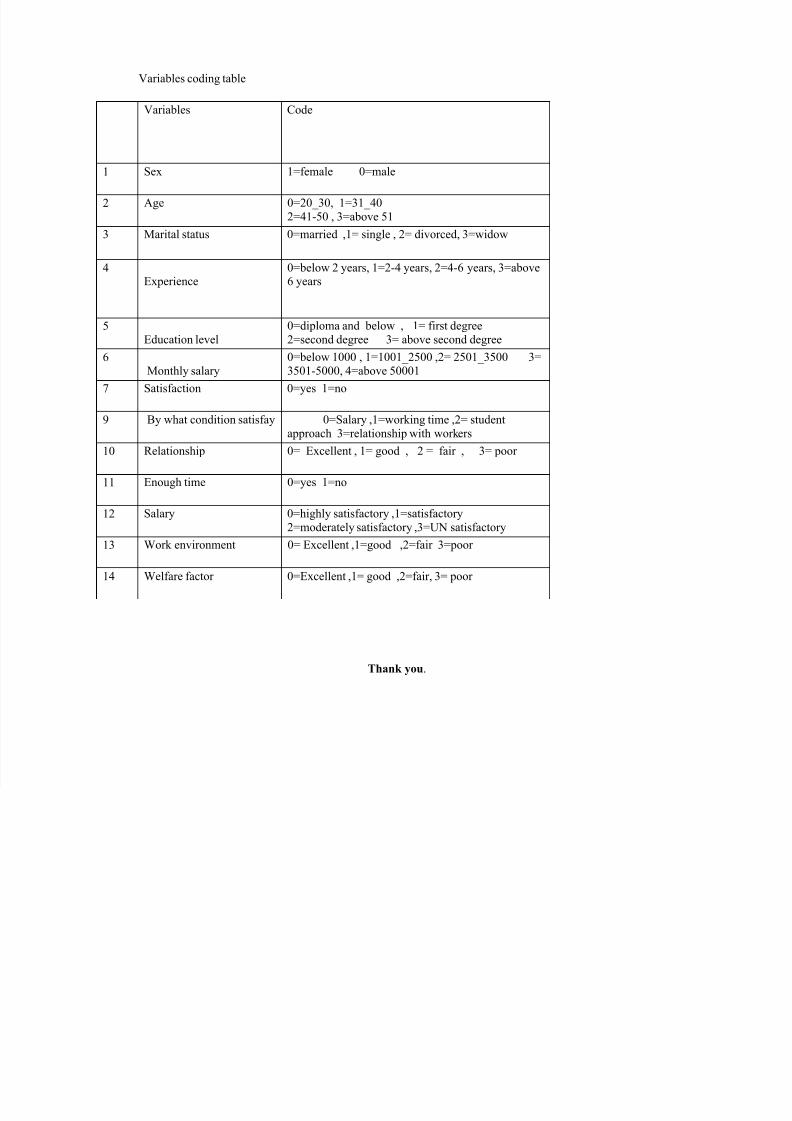
Variables coding table
Thank you.
Variables Code
1 Sex 1=female 0=male
2 Age 0=20_30, 1=31_40
2=41-50 , 3=above 51
3 Marital status 0=married ,1= single , 2= divorced, 3=widow
4Experience
0=below 2 years, 1=2-4 years, 2=4-6 years, 3=above6 years
5Education level
0=diploma and below , 1= first degree
2=second degree 3= above second degree
6Monthly salary
0=below 1000 , 1=1001_2500 ,2= 2501_3500 3=
3501-5000, 4=above 50001
7 Satisfaction 0=yes 1=no
9 By what condition satisfay 0=Salary ,1=working time ,2= student
approach 3=relationship with workers
10 Relationship 0= Excellent , 1= good , 2 = fair , 3= poor
11 Enough time 0=yes 1=no
12 Salary 0=highly satisfactory ,1=satisfactory
2=moderately satisfactory ,3=UN satisfactory
13 Work environment 0= Excellent ,1=good ,2=fair 3=poor
14 Welfare factor 0=Excellent ,1= good ,2=fair, 3= poor