Embed Size (px)
Citation preview

Industrial Fluid PowerJoao Ramon Capital Markets Day 2004
2
• Business overview• Business overview
Agenda
• Our position
• South America
• Summary
• Markets
3
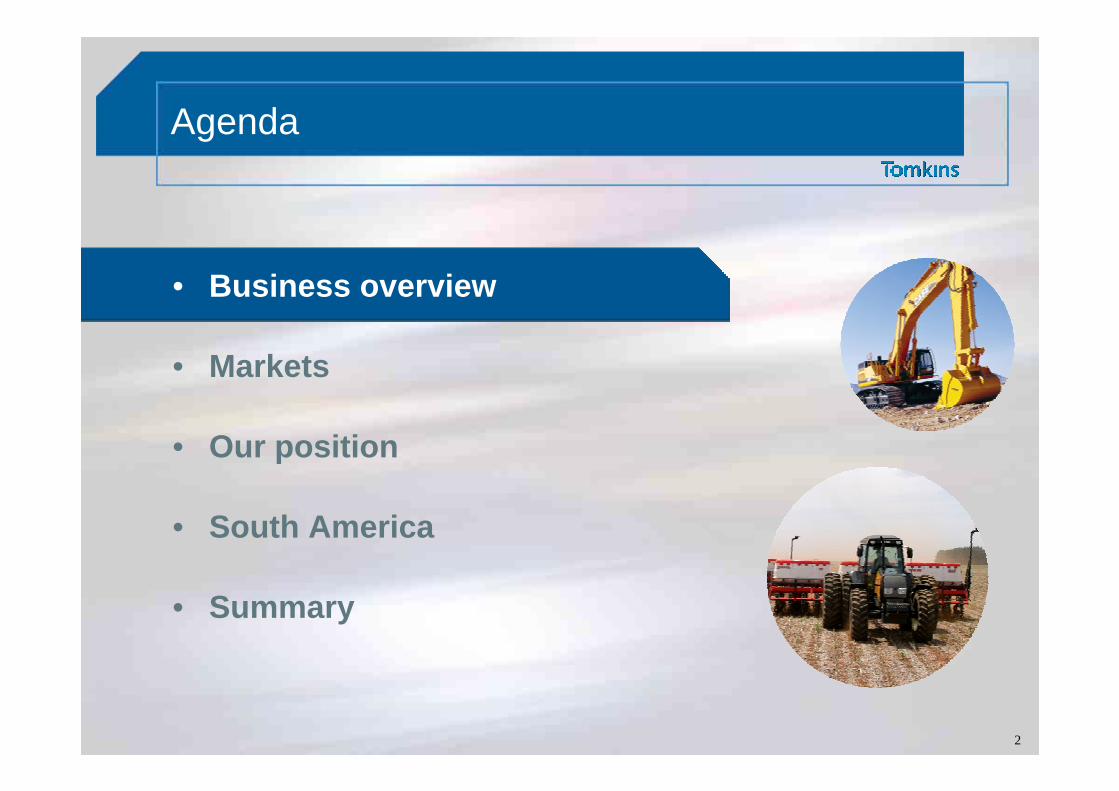
Fluid Power Products
Fluid Power global market worth $7.3bn – Hose & Connectors $1.8bn

4
Business Overview
• Part of Tomkins Industrial& Automotive division
• Accounts for 10% of Group revenue
• Balanced OE and aftermarket revenues
Hose & Connector Sales(Index: April 2002 = 100)
Operates globally in a market worth $1.8bn
123109
100
Apr 02 Dec 03 Dec 04
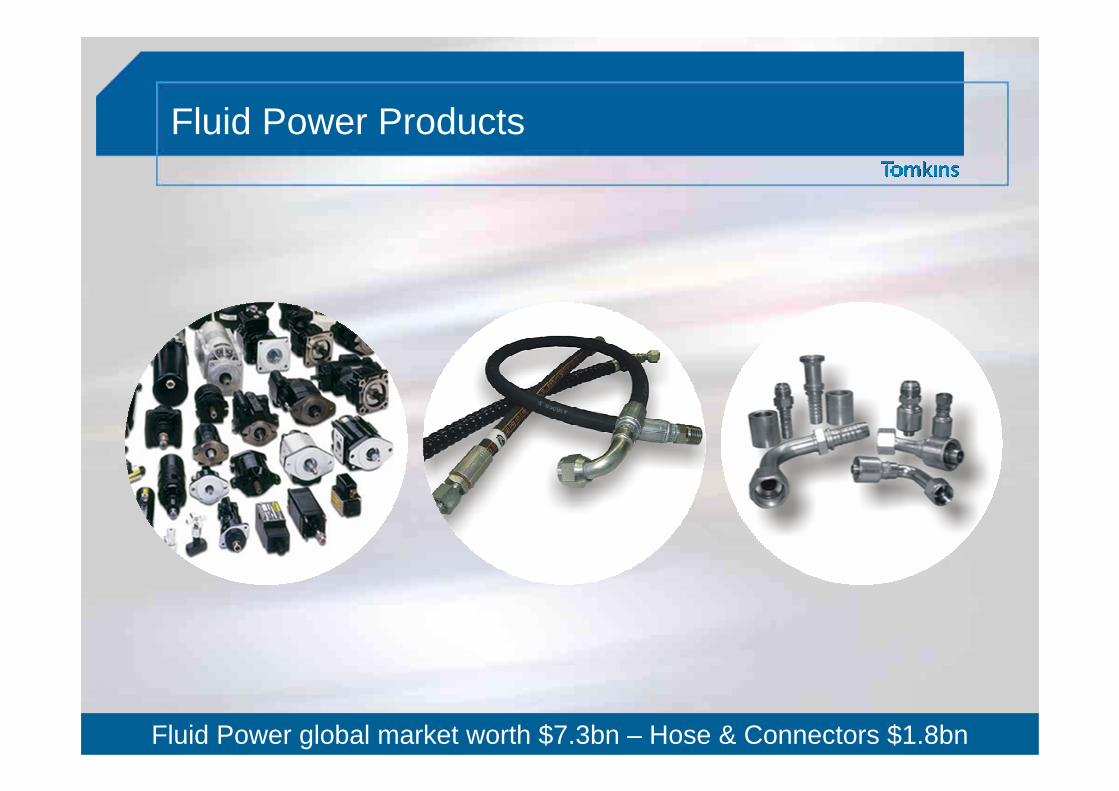
5New Tech Centre in Denver, Colorado
Global Position
Facilities
17 Production % of Total Sales 4,600 Employees
12 79% 3,000North America
3 15% 1,000Europe
1 3% 200Asia
1 3% 400Rest of World
6
• Business overview• Business overview
Agenda
• Our position
• South America
• Summary
• Markets
7
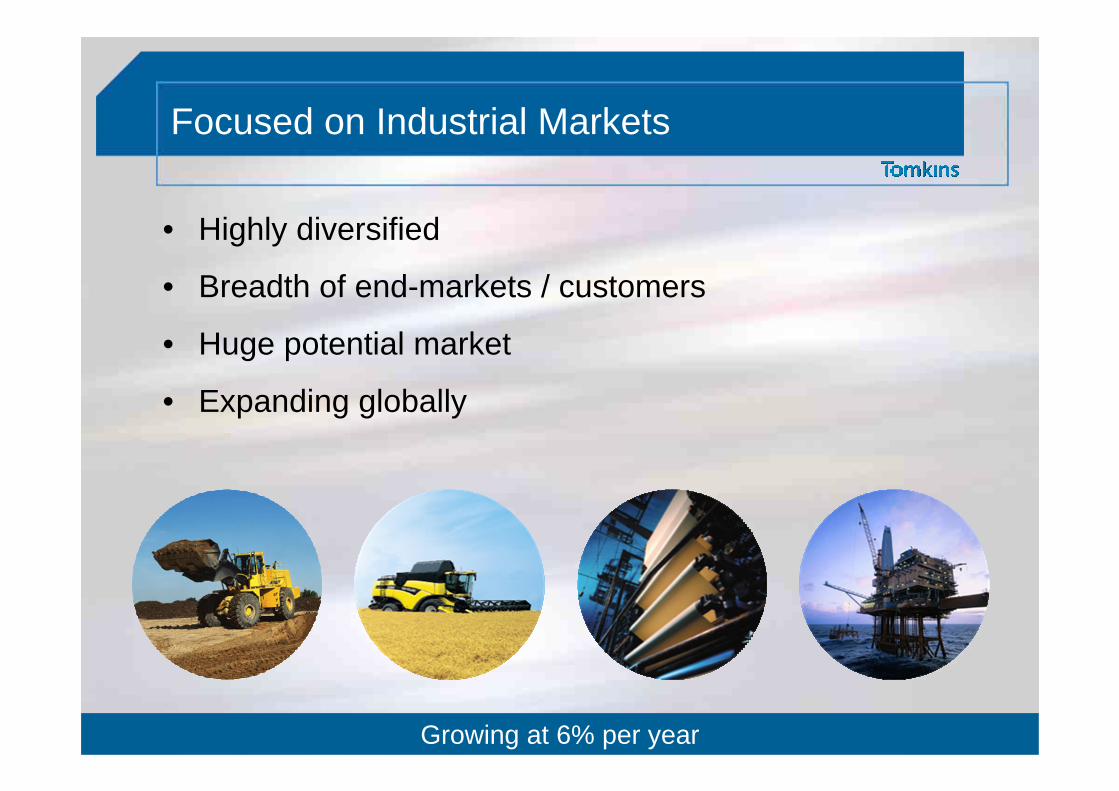
Focused on Industrial Markets
• Highly diversified
• Breadth of end-markets / customers
• Huge potential market
• Expanding globally
Growing at 6% per year
8
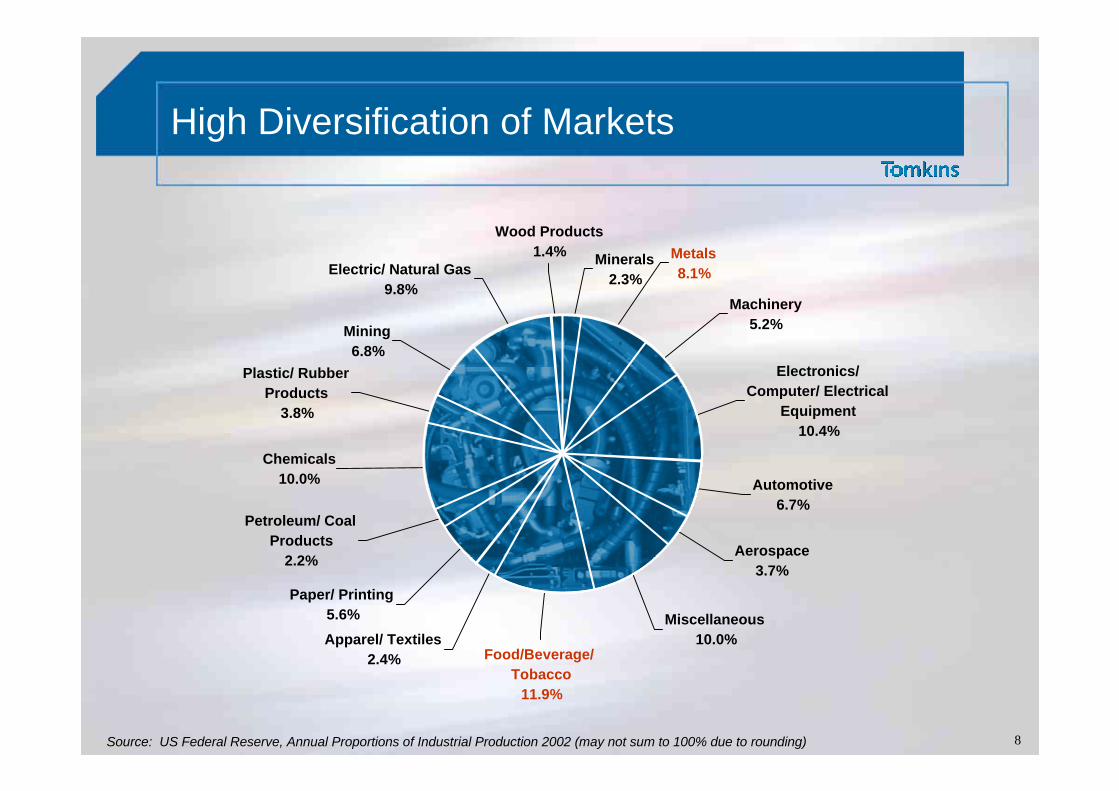
High Diversification of Markets
Source: US Federal Reserve, Annual Proportions of Industrial Production 2002 (may not sum to 100% due to rounding)
Wood Products1.4%
Electric/ Natural Gas9.8%
Plastic/ Rubber Products
3.8%
Mining6.8%
Chemicals10.0%
Food/Beverage/Tobacco
11.9%
Apparel/ Textiles2.4%
Paper/ Printing5.6%
Petroleum/ Coal Products
2.2%
Miscellaneous10.0%
Aerospace3.7%
Automotive6.7%
Electronics/ Computer/ Electrical
Equipment10.4%
Machinery5.2%
Metals8.1%
Minerals2.3%

9
Steel Market – Growing 6% Annually
• 1,040m tons / $ 1,200bn
• Replacement H&C - $ 98m
• Our strategy:– Focused equipment mfg– Develop specialized
distributors
Worldwide Steel Production
Source: IISI / ILAFA / IBS
Global Annual Production
Others34%
USA10%Ukraine
4%
Germany5%
South Korea
5%
Russia7%
Japan12%
Brazil3%
China20%
10
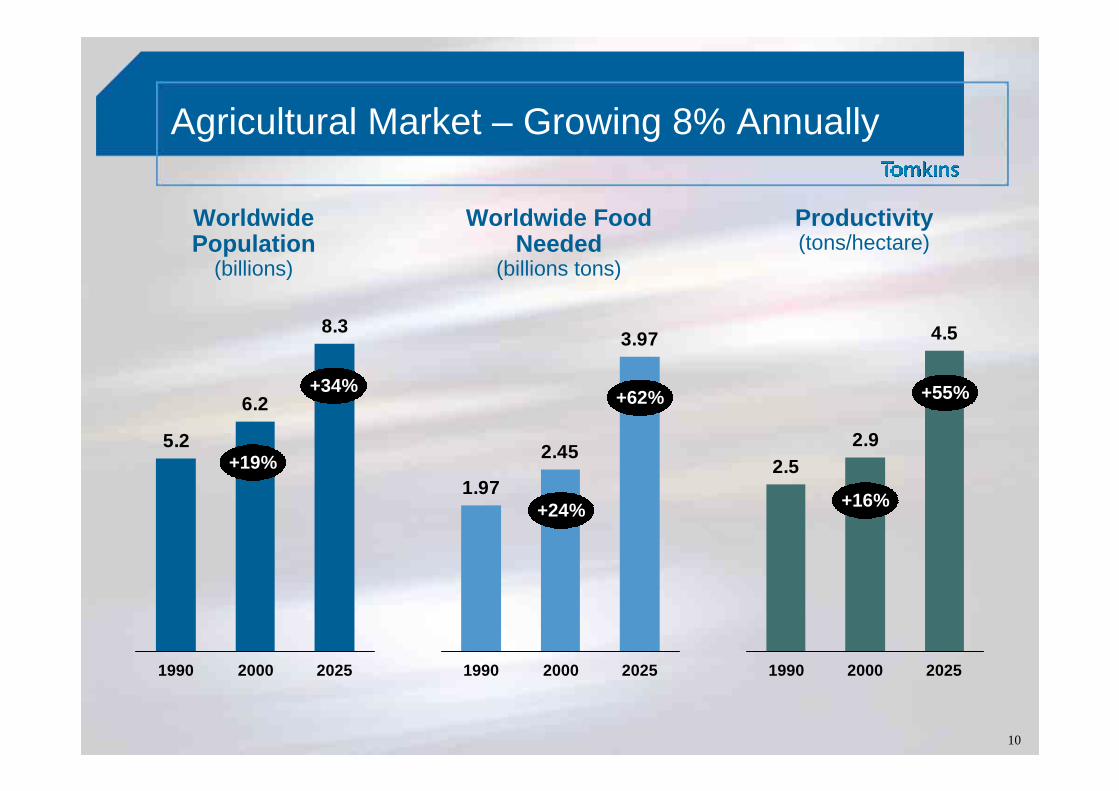
Agricultural Market – Growing 8% Annually
WorldwidePopulation
(billions)
Worldwide FoodNeeded
(billions tons)
Productivity(tons/hectare)
5.2
6.2
8.3
1990 2000 2025
+19%
+34%
1.97
2.45
3.97
1990 2000 2025
+24%
+62%
2.52.9
4.5
1990 2000 2025
+16%
+55%
11
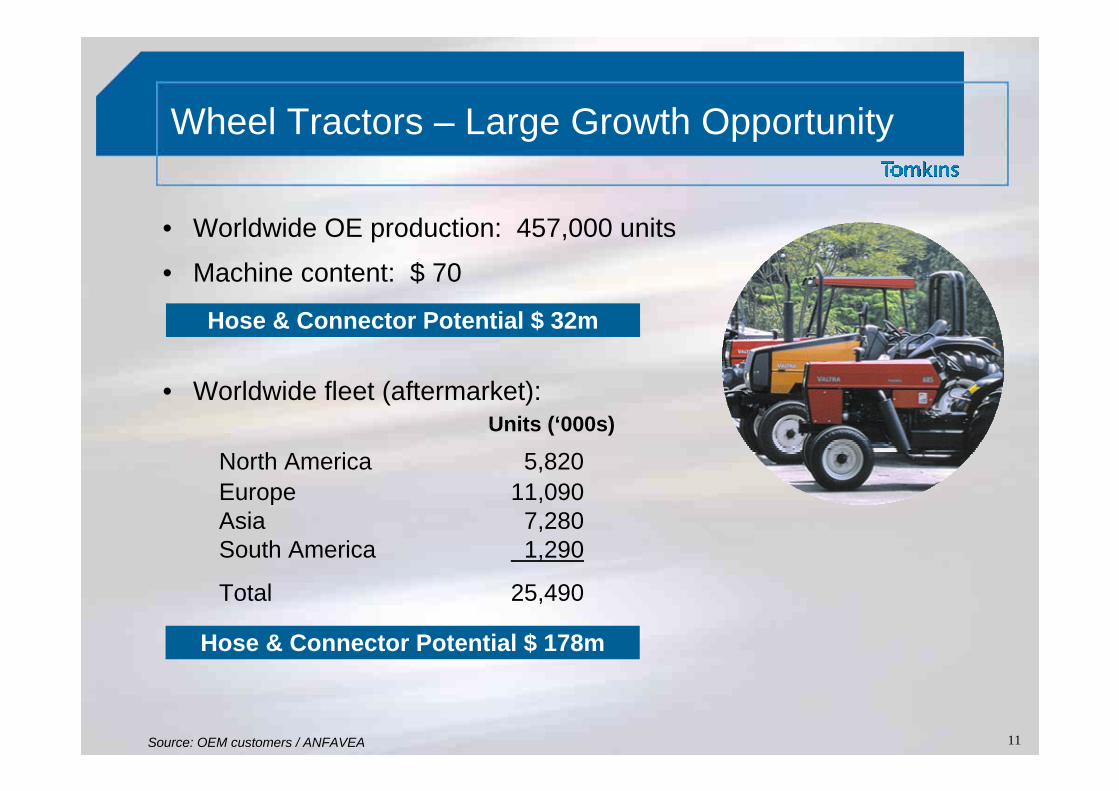
Wheel Tractors – Large Growth Opportunity
• Worldwide OE production: 457,000 units
• Machine content: $ 70
Source: OEM customers / ANFAVEA
• Worldwide fleet (aftermarket):
Hose & Connector Potential $ 32m
Hose & Connector Potential $ 178m
Units (‘000s)
North America 5,820 Europe 11,090Asia 7,280South America 1,290
Total 25,490
12
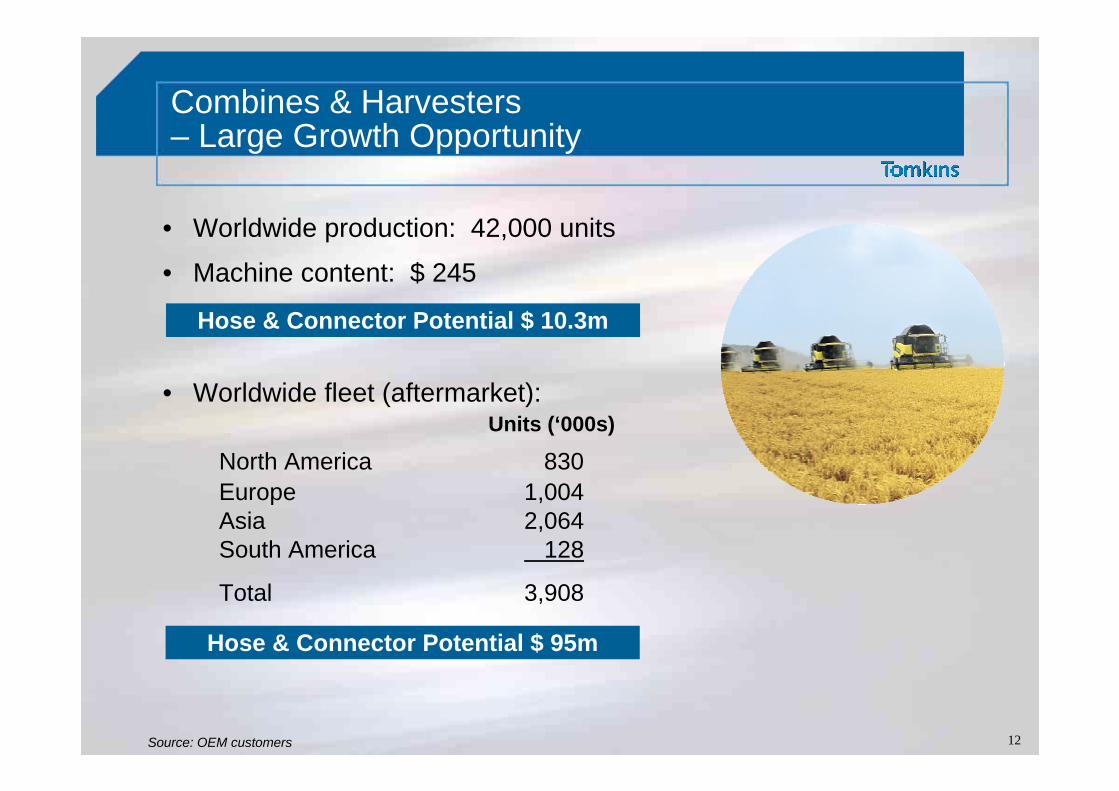
Combines & Harvesters– Large Growth Opportunity
• Worldwide production: 42,000 units
• Machine content: $ 245
Source: OEM customers
• Worldwide fleet (aftermarket):
Hose & Connector Potential $ 10.3m
Hose & Connector Potential $ 95m
Units (‘000s)
North America 830 Europe 1,004Asia 2,064South America 128
Total 3,908
13
• Business overview• Business overview
Agenda
• Our position
• South America
• Summary
• Markets
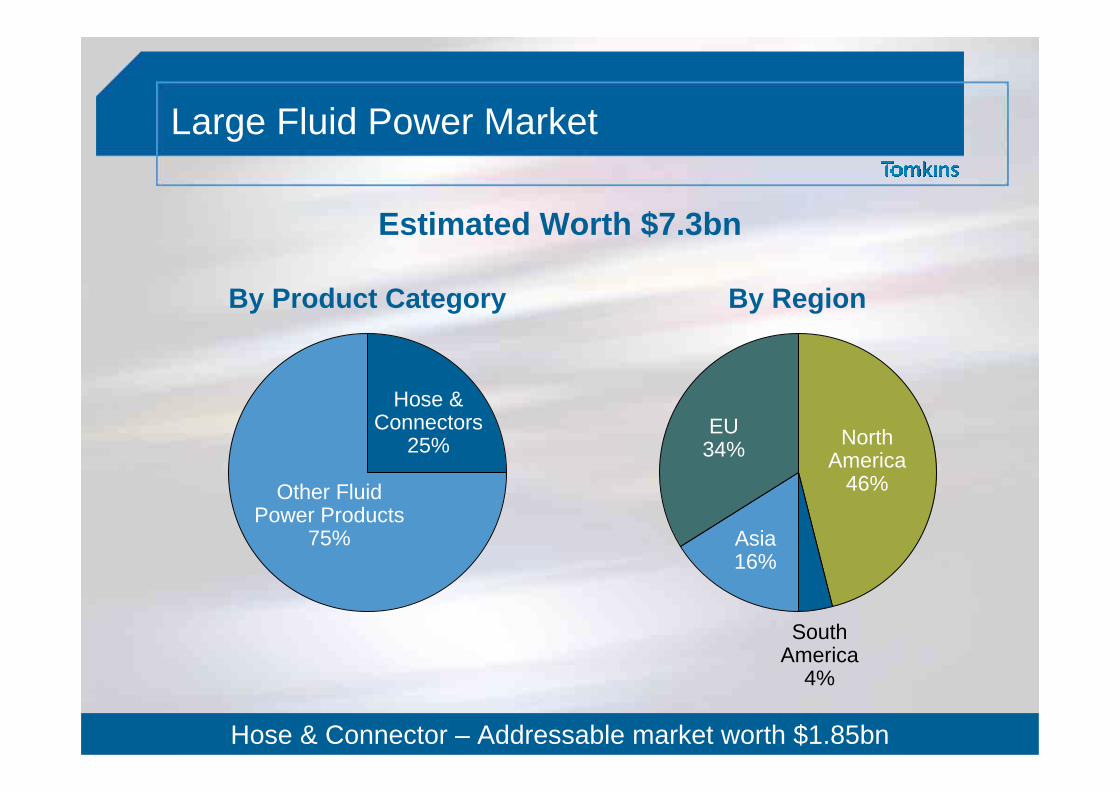
14Hose & Connector – Addressable market worth $1.85bn
Large Fluid Power Market
Estimated Worth $7.3bn
Other FluidPower Products
75%
Hose & Connectors
25%
By Product Category By Region
Asia16%
NorthAmerica
46%
EU 34%
South America
4%
15
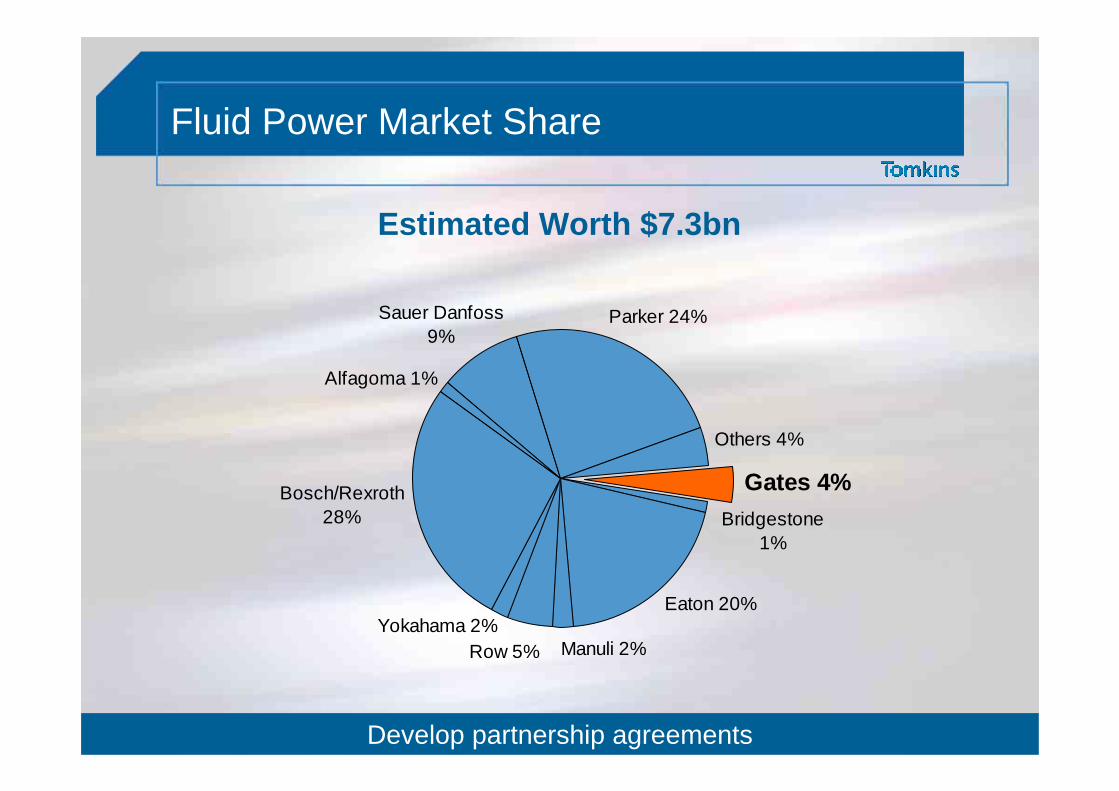
Eaton 20%
Manuli 2%
Gates 4%Bridgestone
1%
Others 4%
Parker 24%Sauer Danfoss 9%
Alfagoma 1%
Row 5%Yokahama 2%
Bosch/Rexroth28%
Fluid Power Market Share
Develop partnership agreements
Estimated Worth $7.3bn

16
Eaton 20%Manuli 6%
Gates 17%
Bridgestone4%
Others 18%
Parker 29%
Alfagomma 6%
Hose & Connector Market Share
Third largest player – acting in all regions
Estimated Worth $1.85bn
17
• Business overview• Business overview
Agenda
• Our position
• South America
• Summary
• Markets
18
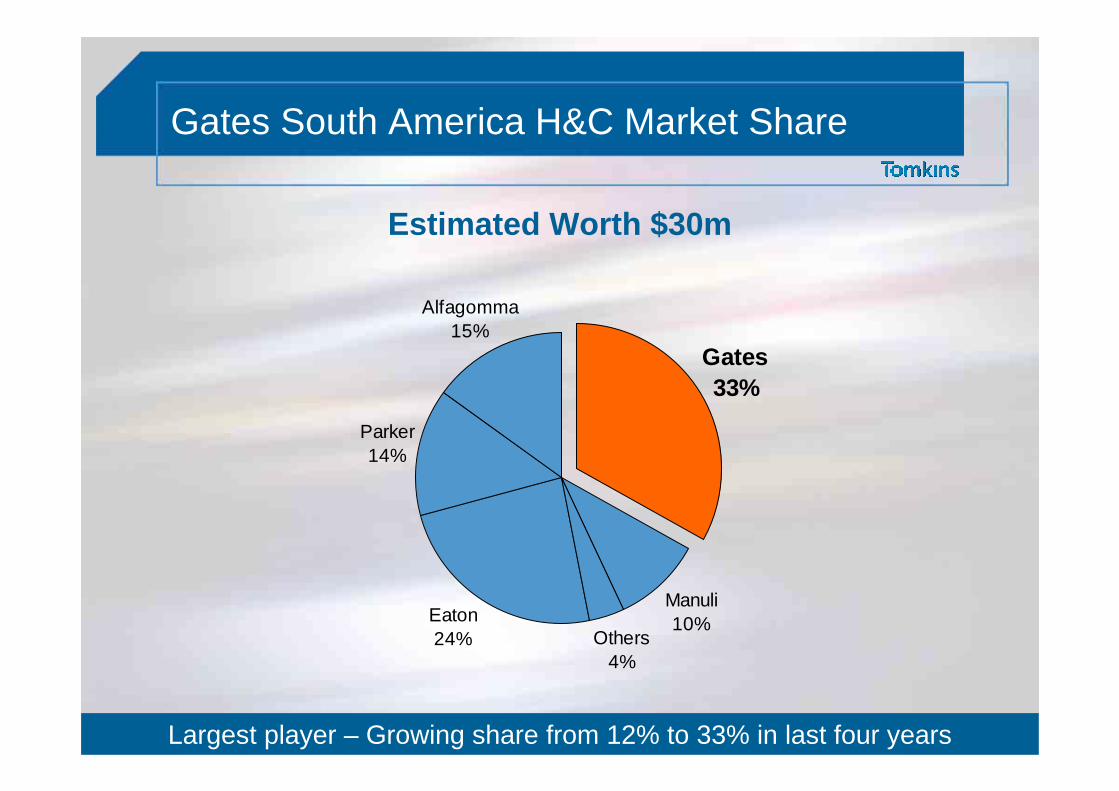
Others4%
Gates33%
Manuli10%
Alfagomma15%
Parker14%
Eaton24%
Gates South America H&C Market Share
Largest player – Growing share from 12% to 33% in last four years
Estimated Worth $30m
19
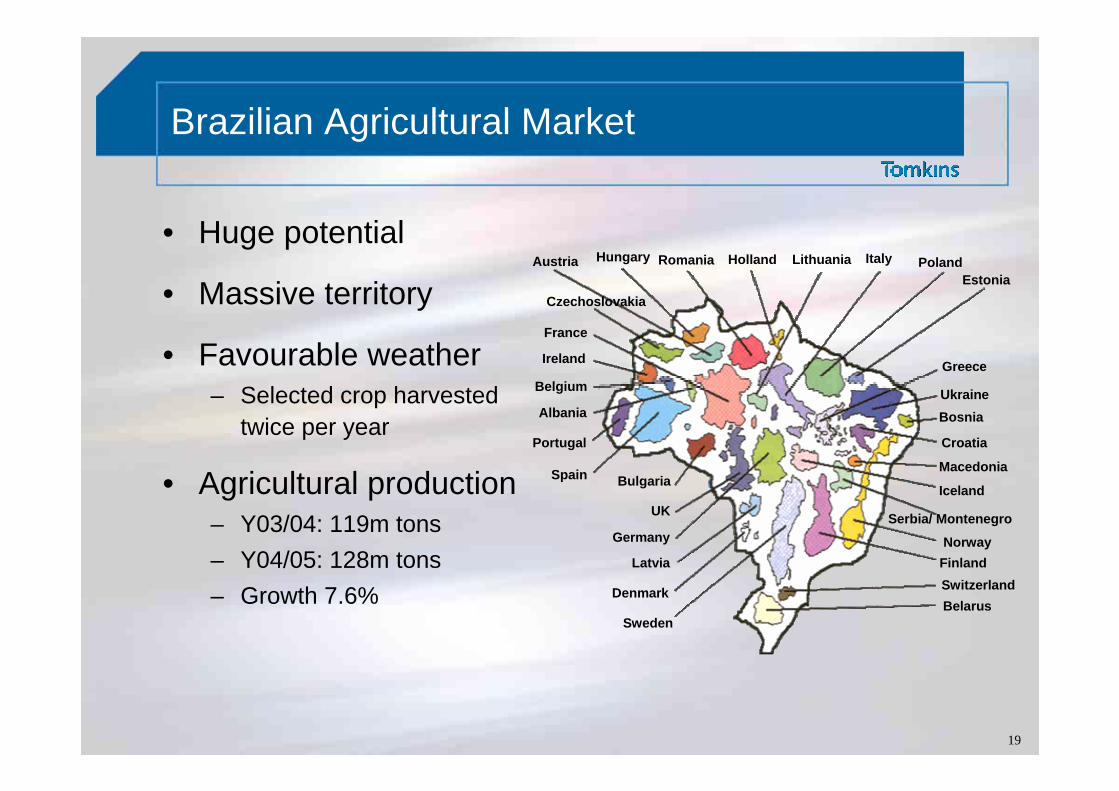
Brazilian Agricultural Market
• Huge potential
• Massive territory
• Favourable weather– Selected crop harvested
twice per year
• Agricultural production– Y03/04: 119m tons– Y04/05: 128m tons– Growth 7.6%
Austria Romania Holland Lithuania Italy PolandEstonia
Greece
UkraineBosnia
Croatia
Macedonia
Iceland
Serbia/ Montenegro
NorwayFinlandSwitzerlandBelarus
Czechoslovakia
Hungary
France
Ireland
Belgium
Albania
Portugal
Spain Bulgaria
UK
Germany
Denmark
Sweden
Latvia
20
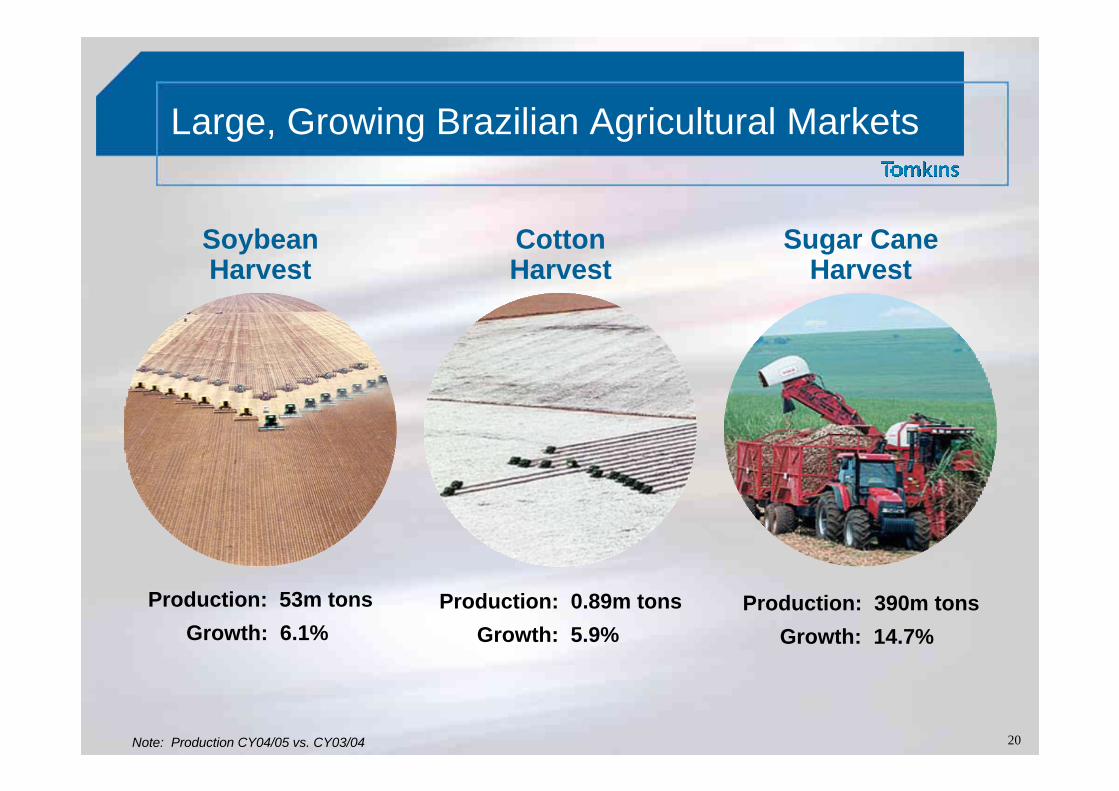
Large, Growing Brazilian Agricultural Markets
SoybeanHarvest
CottonHarvest
Sugar CaneHarvest
Production: 53m tonsGrowth: 6.1%
Note: Production CY04/05 vs. CY03/04
Production: 0.89m tonsGrowth: 5.9%
Production: 390m tonsGrowth: 14.7%

21
Agricultural OEMs – Gates Customers
22
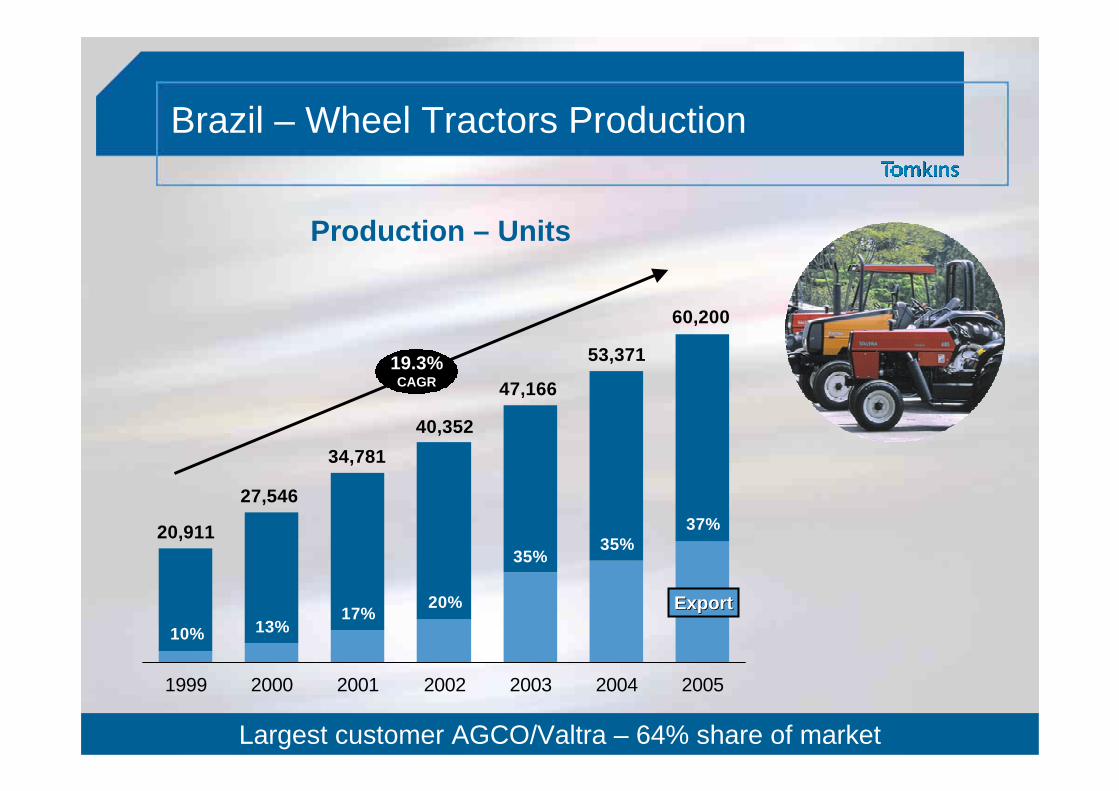
Brazil – Wheel Tractors Production
37%35%
35%
20%17%13%10%
60,200
53,371
47,166
40,35234,781
27,546
20,911
1999 2000 2001 2002 2003 2004 2005
ExportExport
Production – Units
19.3%CAGR
Largest customer AGCO/Valtra – 64% share of market

23
Brazil – Combines Production
42%35%
35%
18%23%16%18%
10,97710,515
9,195
6,851
5,1964,296
3,760
1999 2000 2001 2002 2003 2004 2005
ExportExport
Production – Units
19.5%CAGR
Largest customer John Deere – 40% share of market

24
John Deere
• 2003 sales of $13.3bn worldwide and $0.7bn in Brazil
• Investing $250m in new Brazilian wheel tractor plant
93%$2.0mBelts78%$2.6mHose & Connector
ShareSales
25
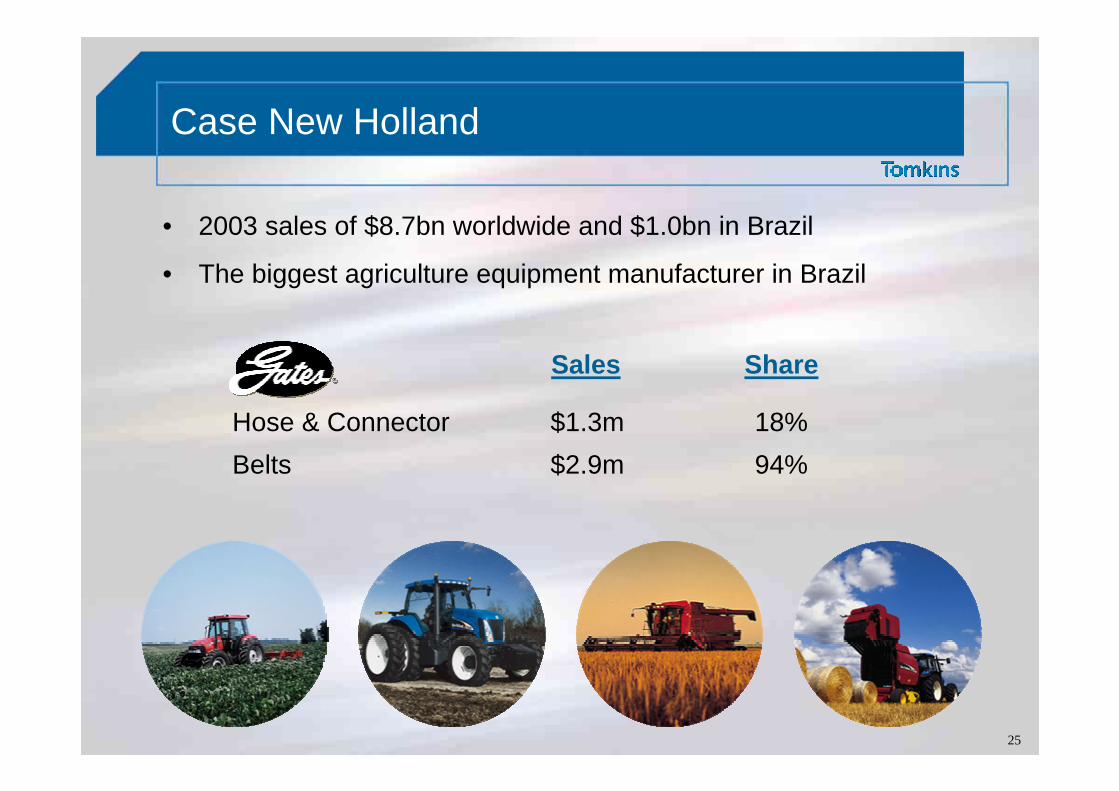
Case New Holland
• 2003 sales of $8.7bn worldwide and $1.0bn in Brazil
• The biggest agriculture equipment manufacturer in Brazil
94%$2.9mBelts18%$1.3mHose & Connector
ShareSales
26
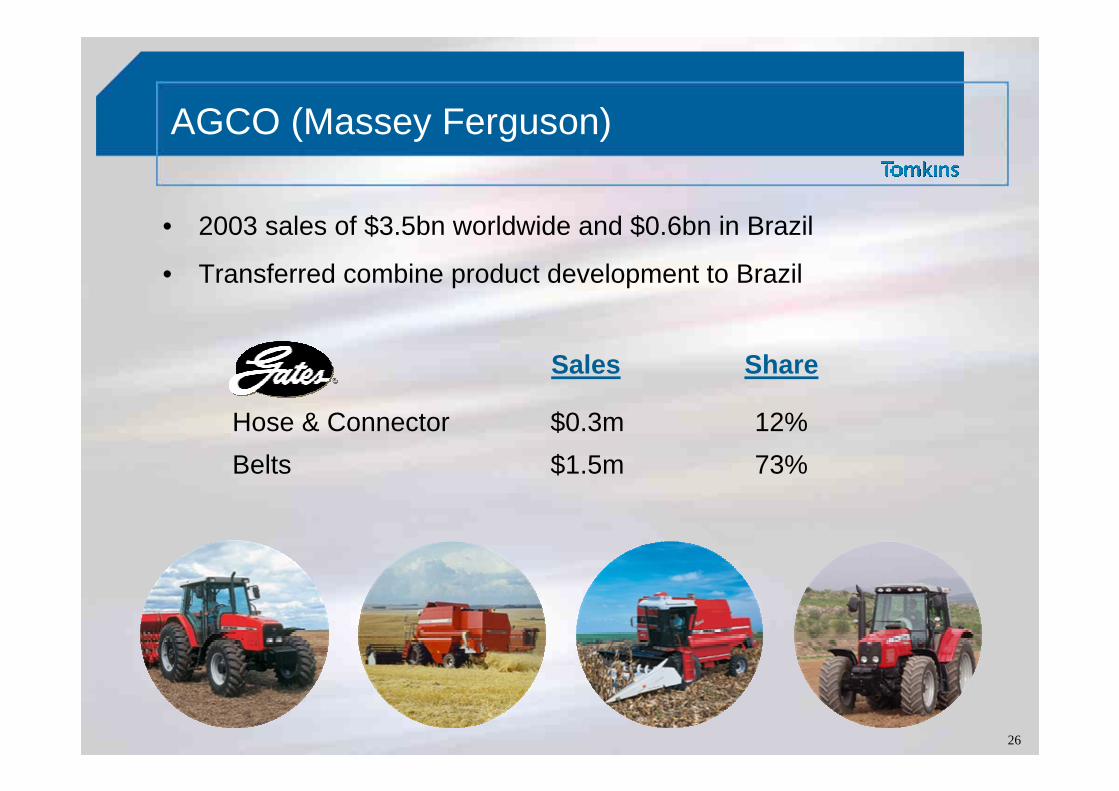
AGCO (Massey Ferguson)
• 2003 sales of $3.5bn worldwide and $0.6bn in Brazil
• Transferred combine product development to Brazil
73%$1.5mBelts12%$0.3mHose & Connector
ShareSales
27
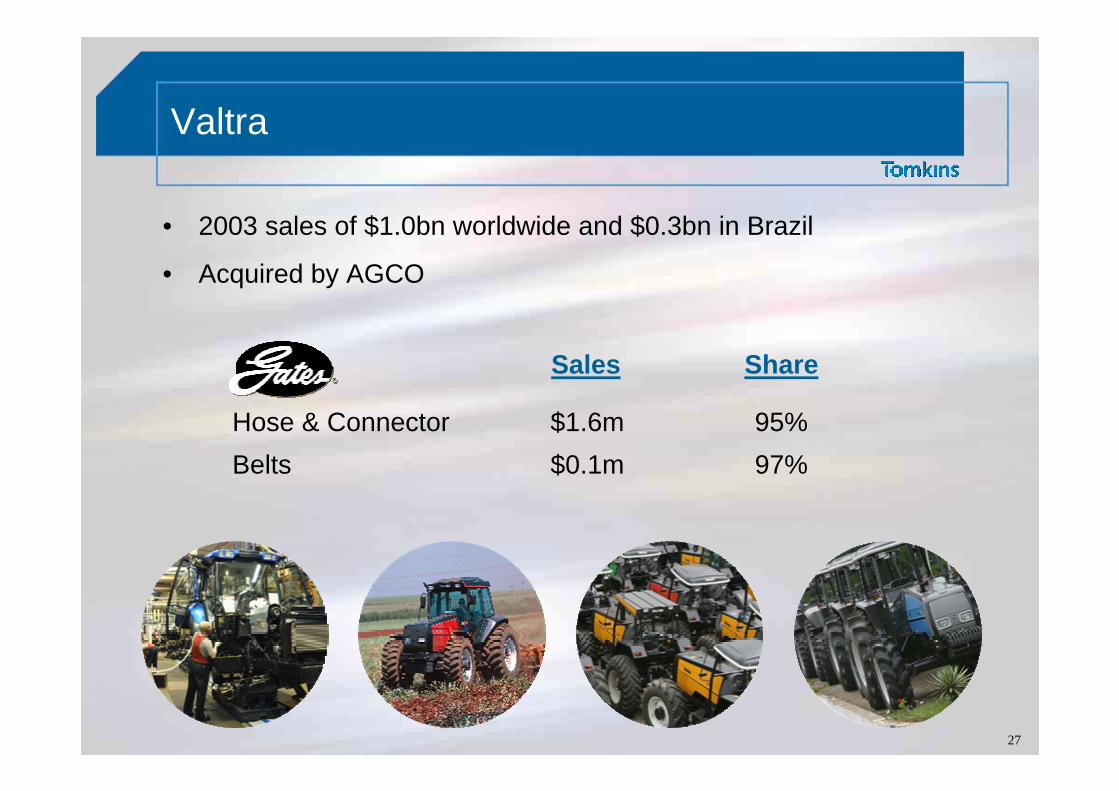
Valtra
• 2003 sales of $1.0bn worldwide and $0.3bn in Brazil
• Acquired by AGCO
97%$0.1mBelts95%$1.6mHose & Connector
ShareSales
28
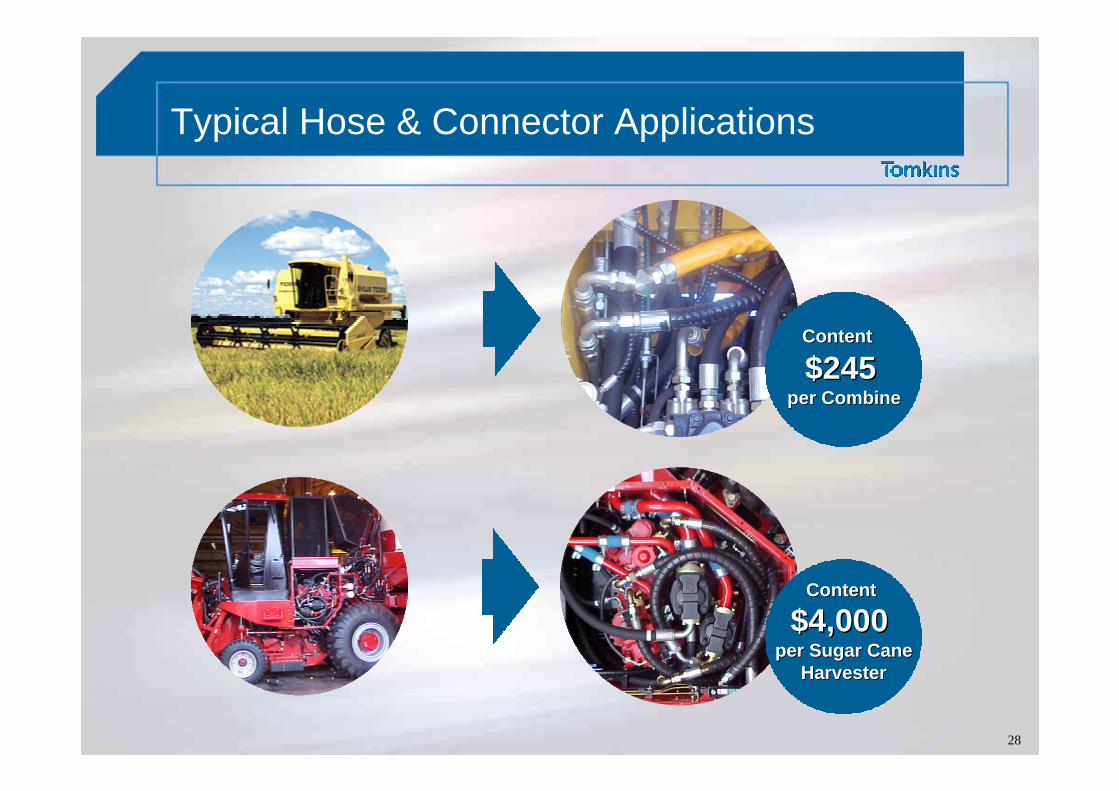
Typical Hose & Connector Applications
ContentContent
$245$245per Combineper Combine
Content Content
$4,000 $4,000 per Sugar Caneper Sugar Cane
HarvesterHarvester

29
Hydraulic Assemblies – Market Trends
TraditionalAssemblies
Gates InnovationKit Assemblies
Gates CreativitySub-Systems
$42 $47 $238
Five times value increase

30
Sub-Systems: Expand Content Five-Fold
John DeereWheel Tractor MR TOP
Creativity increasing machine content & business potential
BUSINESS POTENTIALTractors over 100hp
Actual Future
Machine content $47 $238
Brazil $1.3m $6.4m
Global $11m $56m
31
TOTAL
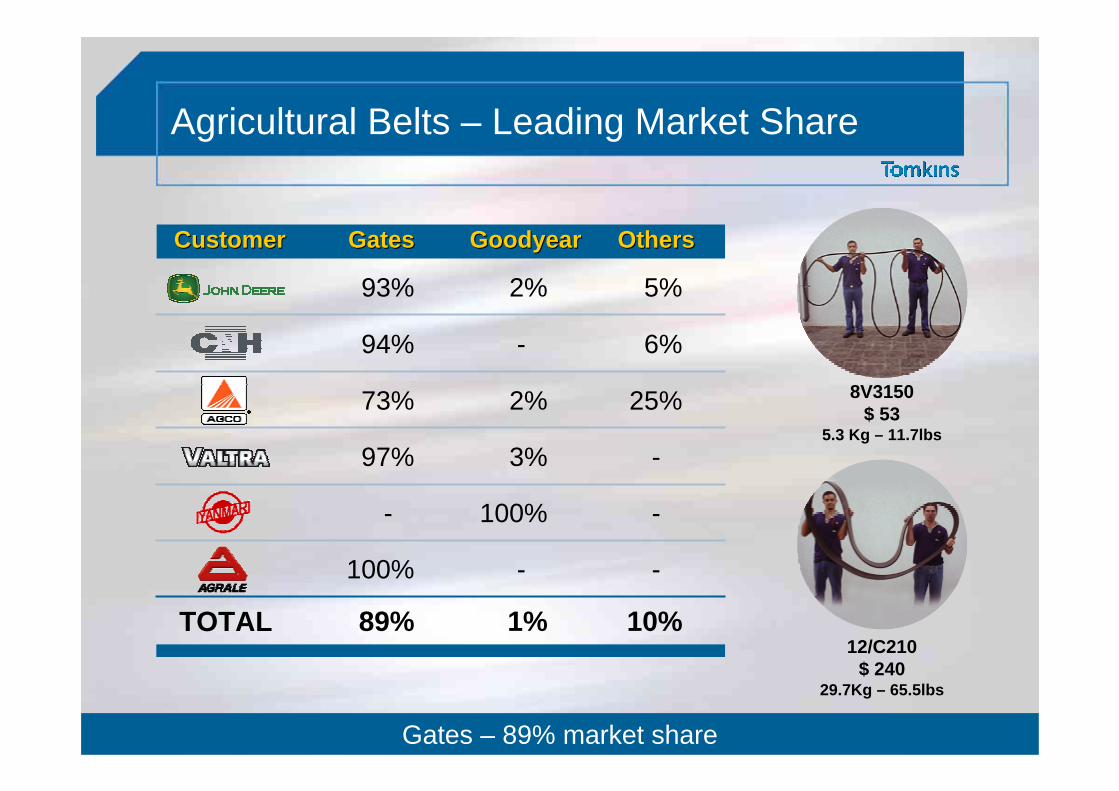
OthersOthersGoodyearGoodyearGates Gates CustomerCustomer
Agricultural Belts – Leading Market Share
10%
-
-
-
25%
6%
5%
1%
-
100%
3%
2%
-
2%
89%
100%
-
97%
73%
94%
93%
Gates – 89% market share
12/C210$ 240
29.7Kg – 65.5lbs
8V3150$ 53
5.3 Kg – 11.7lbs
32
• Business overview• Business overview
Agenda
• Our position
• South America
• Summary
• Markets
33
Gates: South America Strategy
Focus, execution, speed and people to drive growth and profit
Value Creation
Business Intelligence
Product Innovation
Market Leader
ManufacturingExcellence
Admired CompanyReputation
34
Strong Performance
• Financial performance since 1999– Sales growing 13% per annum– Profits growing 50% per annum
• Strategic direction 2005-2008– Sales growing 12% per annum– Profits growing 15% per annum
• “10 – 10 – 10”– Delivering on the Goal
In Summary
10 – 10 – 10

Industrial Fluid PowerJoao Ramon Capital Markets Day 2004