Embed Size (px)
Citation preview
Plymouth & South West Devon Joint Local Plan Reformatted Housing Trajectories 2016 Monitoring Point The following housing trajectories relate to the 31 March 2016 monitoring point. The trajectories were published in March 2017 when the Councils consulted on the Joint Local Plan: Pre-submission plan. They were submitted to the Examination as appendices to the Housing Topic Paper (Provision and Supply) document TP3. Trajectories Examination Library
Reference No. Housing Trajectory 1a Joint Local Plan Area TP3A Housing Trajectory 3a Plymouth Policy Area TP3B Housing Trajectory 4a Thriving Towns and Villages Policy Area
TP3C As well as trajectories of housing delivery, those documents also included other tables and the Plan, Monitor Manage graphs and the Rolling 5 year housing land supply graphs. The graphs were also reproduced in the main Housing Topic Paper TP3. In response to the JLP Inspectors’ request, the Councils have prepared three new documents at A3 using the 2016 monitoring point data.
The three trajectories have been reformatted so that they can be printed as A3 documents.
The other tables and graphs have also been reformatted so that they can be printed at A3.
Each new document contains the reformatted trajectory and the relevant tables and graphs.
The A3 documents have a publication date of 6 October 2017. 6 October 2017
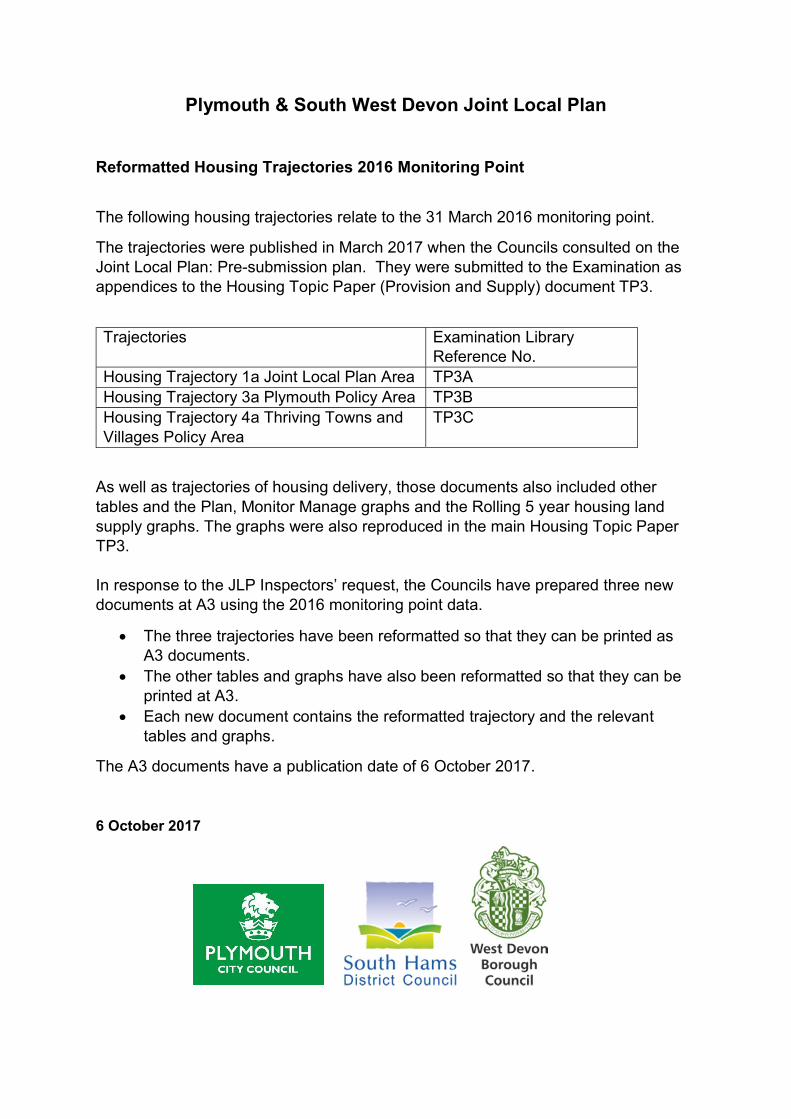
GRAPH JLP1 JLP Plan Area - Supply - Delivery in Plan period TABLE JLP1 SUMMARY OF SUPPLY SOURCES(Delivery of dwellings in the plan period 2014 to 2034)
DWS2,572
13,15511,842
225720
1,29429,808
Source: TABLE JLP2
TABLE JLP2 - SUPPLY CATEGORIES AND PLANNING STATUS(Delivery of dwellings in the plan period 2014 to 2034)
Source : Summation of TABLES PPA4 AND TTV4
0
29,808SUPPLY TOTAL - all sources 2,572 13,155 225 13,856
JLP PLAN AREA TOTALnot yet committed*
Student Accommodation
Releasepp(not built)Built
225small sites (non-allocations) 312 684 0 0 996Student Accommodation release 0 0 225 0
11,842 22,255Neighbourhood Plan Allowance 0 0 0 720 720Allocations 291 10,122 0
4,318Small site (non garden land) Windfalls 0 0 0 1,294 1,294large sites (non-allocations) 1,969 2,349
Supply sourcesCompletions 2014-2016Commitments at 31/3/2016Pre Submission JLP allocations (excluding commitments and completions)Student Accommodation releaseNeighbourhood Plan AllowanceWindfalls (small, non-garden land)JLP Plan Area
SUPPLY CATEGORIES
0
HOUSING TRAJECTORY 1a : PSWD JLP Plan area TOTAL (target Annualised over whole plan period)TARGET 26,700 = Annualised rate 1335 pa (2014-2034) 31 March 2016 Monitoring Point
Plymouth and South West Devon Joint Local PlanPlymouth City, South Hams District and West Devon Borough Councils
2,572
13,15511,842
225720 1,294
JLP Plan Area housing delivery in plan period by supply sources
completions 2014-2016
commitments at 31/3/2016
Pre Submission JLP allocations(excluding commitments andcompletions)Student Accommodation release
Neighbourhood Plan Allowance
windfalls
JOINT LOCAL PLAN AREA HOUSING TRAJECTORY - 31 MARCH 2016 MONITORING POINT Publication Date 06 October 2017
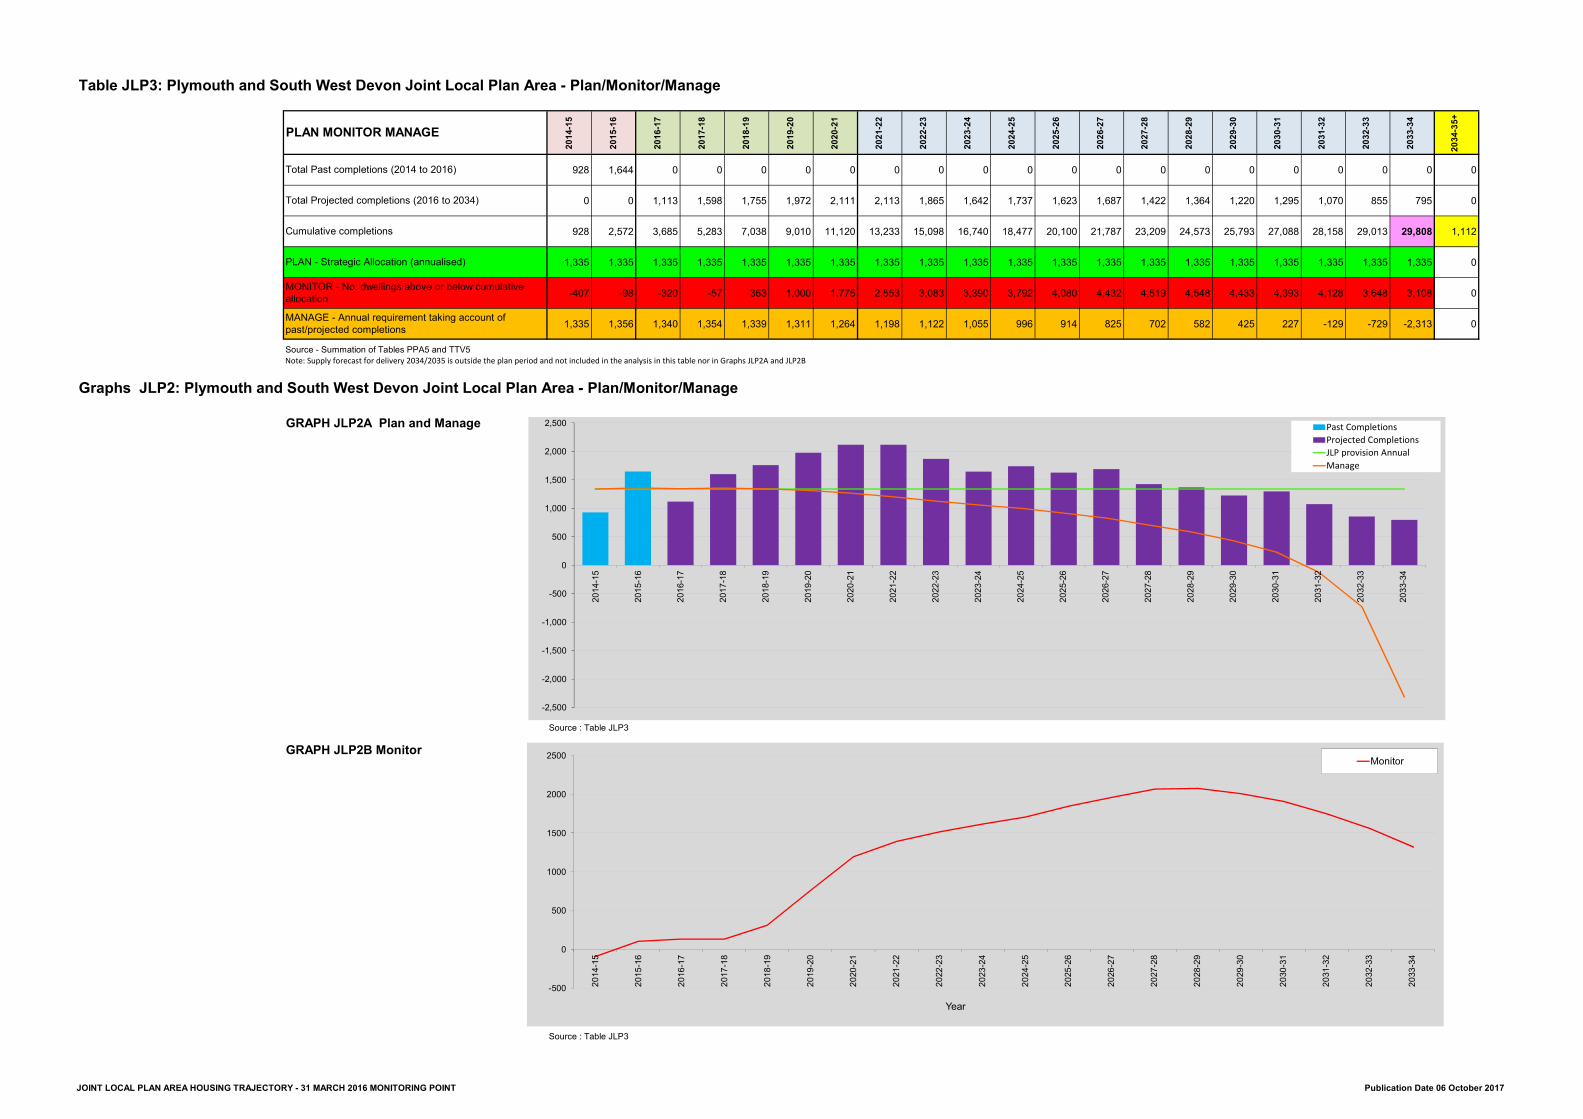
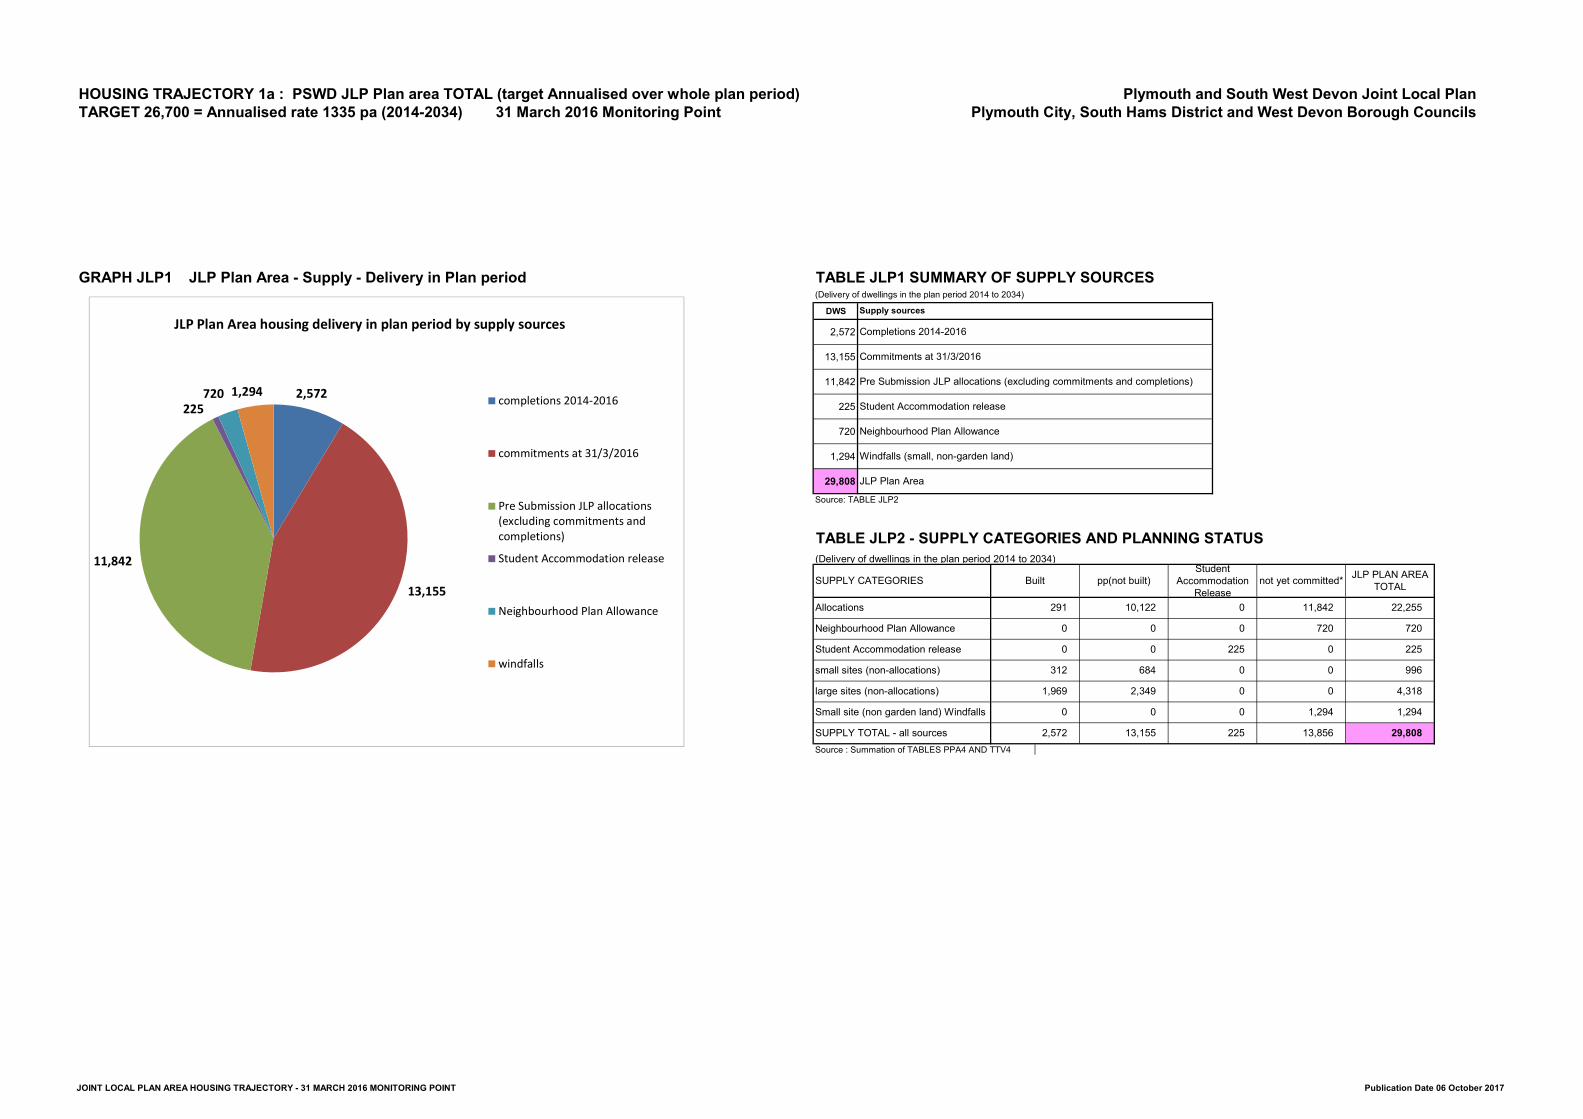
Table JLP3: Plymouth and South West Devon Joint Local Plan Area - Plan/Monitor/Manage
2014-1
5
2015-1
6
2016-1
7
2017-1
8
2018-1
9
2019-2
0
2020-2
1
2021-2
2
2022-2
3
2023-2
4
2024-2
5
2025-2
6
2026-2
7
2027-2
8
2028-2
9
2029-3
0
2030-3
1
2031-3
2
2032-3
3
2033-3
4
2034-3
5+
928 1,644 0 0 0 0 0 0 0 0 0 0 0 0 0 0 0 0 0 0 0
0 0 1,113 1,598 1,755 1,972 2,111 2,113 1,865 1,642 1,737 1,623 1,687 1,422 1,364 1,220 1,295 1,070 855 795 0
928 2,572 3,685 5,283 7,038 9,010 11,120 13,233 15,098 16,740 18,477 20,100 21,787 23,209 24,573 25,793 27,088 28,158 29,013 29,808 1,112
1,335 1,335 1,335 1,335 1,335 1,335 1,335 1,335 1,335 1,335 1,335 1,335 1,335 1,335 1,335 1,335 1,335 1,335 1,335 1,335 0
-407 -98 -320 -57 363 1,000 1,775 2,553 3,083 3,390 3,792 4,080 4,432 4,519 4,548 4,433 4,393 4,128 3,648 3,108 0
1,335 1,356 1,340 1,354 1,339 1,311 1,264 1,198 1,122 1,055 996 914 825 702 582 425 227 -129 -729 -2,313 0Source - Summation of Tables PPA5 and TTV5Note: Supply forecast for delivery 2034/2035 is outside the plan period and not included in the analysis in this table nor in Graphs JLP2A and JLP2B
Graphs JLP2: Plymouth and South West Devon Joint Local Plan Area - Plan/Monitor/Manage GRAPH JLP2A Plan and Manage
Source : Table JLP3GRAPH JLP2B Monitor
Source : Table JLP3
MANAGE - Annual requirement taking account of past/projected completions
PLAN MONITOR MANAGE
PLAN - Strategic Allocation (annualised)MONITOR - No. dwellings above or below cumulative allocation
Total Past completions (2014 to 2016)
Total Projected completions (2016 to 2034)
Cumulative completions
-2,500
-2,000
-1,500
-1,000
-500
0
500
1,000
1,500
2,000
2,500
2014-1
5
2015-1
6
2016-1
7
2017-1
8
2018-1
9
2019-2
0
2020-2
1
2021-2
2
2022-2
3
2023-2
4
2024-2
5
2025-2
6
2026-2
7
2027-2
8
2028-2
9
2029-3
0
2030-3
1
2031-3
2
2032-3
3
2033-3
4
Past CompletionsProjected CompletionsJLP provision AnnualManage
-500
0
500
1000
1500
2000
2500
2014-1
5
2015-1
6
2016-1
7
2017-1
8
2018-1
9
2019-2
0
2020-2
1
2021-2
2
2022-2
3
2023-2
4
2024-2
5
2025-2
6
2026-2
7
2027-2
8
2028-2
9
2029-3
0
2030-3
1
2031-3
2
2032-3
3
2033-3
4
Year
Monitor
JOINT LOCAL PLAN AREA HOUSING TRAJECTORY - 31 MARCH 2016 MONITORING POINT Publication Date 06 October 2017
TABLE JLP4 Plymouth and South West Devon Joint Local Plan Area Rolling 5 year housing land supply
2014-1
5
2015-1
6
2016-1
7
2017-1
8
2018-1
9
2019-2
0
2020-2
1
2021-2
2
2022-2
3
2023-2
4
2024-2
5
2025-2
6
2026-2
7
2027-2
8
2028-2
9
2029-3
0
2030-3
1
2031-3
2
2032-3
3
2033-3
4
928 1,644 1,113 1,598 1,755 1,972 2,111 2,113 1,865 1,642 1,737 1,623 1,687 1,422 1,364 1,220 1,295 1,070 855 795928 2,572 3,685 5,283 7,038 9,010 11,120 13,233 15,098 16,740 18,477 20,100 21,787 23,209 24,573 25,793 27,088 28,158 29,013 29,808
8,082 8,548 9,548 9,815 9,702 9,467 8,980 8,554 8,110 7,833 7,316 6,988 6,371 5,804 5,235 4,015 2,720 1,650 0 026,700 26,700 26,700 26,700 26,700 26,700 26,700 26,700 26,700 26,700 26,700 26,700 26,700 26,700 26,700 26,700 26,700 26,700 26,700 26,700
1,335 1,335 1,335 1,335 1,335 1,335 1,335 1,335 1,335 1,335 1,335 1,335 1,335 1,335 1,335 1,335 1,335 1,335 1,335 1,3350 0 0 0 -121 -357 -683 -1,064 -1,402 -1,695 -2,107 -2,550 -3,166 -3,766 -4,548 -4,433 -4,393 -4,128 0 0
407 98 320 57 0 0 0 0 0 0 0 0 0 0 0 0 0 0 0 0
7,082 6,773 6,995 6,732 6,554 6,318 5,992 5,611 5,274 4,980 4,568 4,125 3,510 2,909 2,127 907 -388 -1,458 0 0
7,436 7,112 7,344 7,069 6,882 6,634 6,292 5,892 5,537 5,229 4,797 4,331 3,685 3,055 2,234 953 -407 -1,531 0 08,498 8,128 8,394 8,078 7,865 7,581 7,191 6,734 6,328 5,976 5,482 4,950 4,211 3,491 2,553 1,089 -465 -1,749 0 0
1,487 1,422 1,469 1,414 1,376 1,327 1,258 1,178 1,107 1,046 959 866 737 611 447 191 -81 -306 0 01,700 1,626 1,679 1,616 1,573 1,516 1,438 1,347 1,266 1,195 1,096 990 842 698 511 218 -93 -350 0 0
5.43 6.01 6.50 6.94 7.05 7.14 7.14 7.26 7.32 7.49 7.63 8.07 8.64 9.50 11.72 21.07 -33.41 -5.39 0.00 0.004.75 5.26 5.69 6.08 6.17 6.24 6.24 6.35 6.41 6.55 6.67 7.06 7.56 8.31 10.25 18.44 -29.23 -4.72 0.00 0.00
Minimum target reached* See Residuals and Sedgefield Calculations TABLE JLP5Note: 5 year supply position (at end this year) = Forecast completions for next 5 years divided by the Annualised (ie (5 year target + x% buffer)
GRAPH JLP3 Plymouth and South West Devon Joint Local Plan Area Rolling 5 year housing land supply YEARS
Source: TABLE JLP5
Annualised (5 year target + 20% buffer)
FIVE YEAR SUPPLY POSITION (at end this year):Years of supply (with 5% buffer)Years of supply (with 5% buffer)Source - Summation of Tables PPA6 and TTV6
Target 2014 to 2034Annualised target (7700/20)Annualised Residual Surplus of completions to date x 5 years * Past shortfall (from 1/4/2014 to end this year) (Sedgefield) * 5 year target as at end this year ie SUM annualised targets for next 5 years; and then DEDUCT this year's residual surplus and ADD past shortfall5 year target+5% buffer5 year target+20% buffer
Annualised (5 year target + 5% buffer)
No of dwellings built in this yearCumulative no of dwellings built 1/4/2014 to end this yearForecast completions for next 5 years (from end this year)
ROLLING 5 YEAR HOUSING LAND SUPPLY
0.0
5.0
10.0
2014-1
5
2015-1
6
2016-1
7
2017-1
8
2018-1
9
2019-2
0
2020-2
1
2021-2
2
2022-2
3
2023-2
4
2024-2
5
2025-2
6
2026-2
7
2027-2
8
2028-2
9
2029-3
0
2030-3
1
2031-3
2
2032-3
3
2033-3
4
5% buffer20% buffer
JOINT LOCAL PLAN AREA HOUSING TRAJECTORY - 31 MARCH 2016 MONITORING POINT Publication Date 06 October 2017
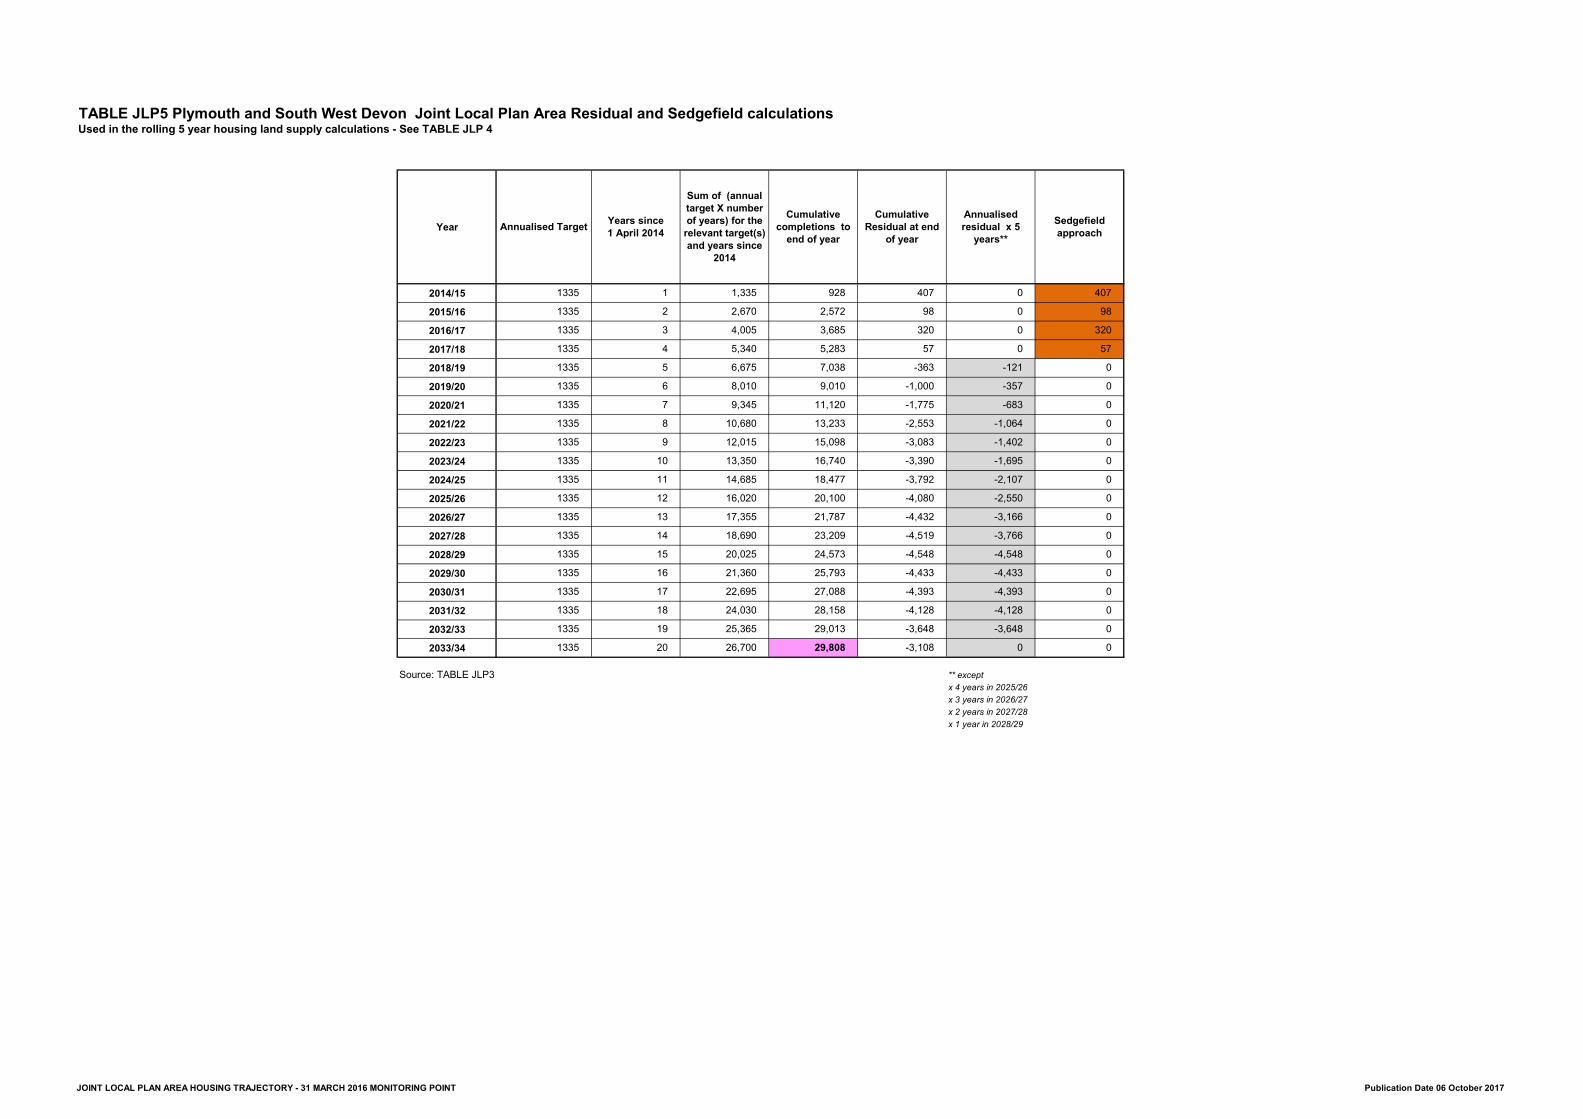
TABLE JLP5 Plymouth and South West Devon Joint Local Plan Area Residual and Sedgefield calculationsUsed in the rolling 5 year housing land supply calculations - See TABLE JLP 4
Year
2014/152015/162016/172017/182018/192019/202020/212021/222022/232023/242024/252025/262026/272027/282028/292029/302030/312031/322032/332033/34
Source: TABLE JLP3 ** except x 4 years in 2025/26x 3 years in 2026/27x 2 years in 2027/28x 1 year in 2028/29
0 01335 20 26,700 29,808 -3,108
-4,128 01335 19 25,365 29,013 -3,648 -3,648 01335 18 24,030 28,158 -4,128
-4,433 01335 17 22,695 27,088 -4,393 -4,393 01335 16 21,360 25,793 -4,433
-3,766 01335 15 20,025 24,573 -4,548 -4,548 01335 14 18,690 23,209 -4,519
-2,550 01335 13 17,355 21,787 -4,432 -3,166 01335 12 16,020 20,100 -4,080
-1,695 01335 11 14,685 18,477 -3,792 -2,107 01335 10 13,350 16,740 -3,390
-1,064 01335 9 12,015 15,098 -3,083 -1,402 01335 8 10,680 13,233 -2,553
-357 01335 7 9,345 11,120 -1,775 -683 01335 6 8,010 9,010 -1,000
0 571335 5 6,675 7,038 -363 -121 01335 4 5,340 5,283 57
0 981335 3 4,005 3,685 320 0 3201335 2 2,670 2,572 98
Annualised residual x 5
years** Sedgefield approach
1335 1 1,335 928 407 0 407
Annualised Target Years since 1 April 2014
Sum of (annual target X number of years) for the
relevant target(s) and years since
2014
Cumulative completions to
end of yearCumulative
Residual at end of year
JOINT LOCAL PLAN AREA HOUSING TRAJECTORY - 31 MARCH 2016 MONITORING POINT Publication Date 06 October 2017
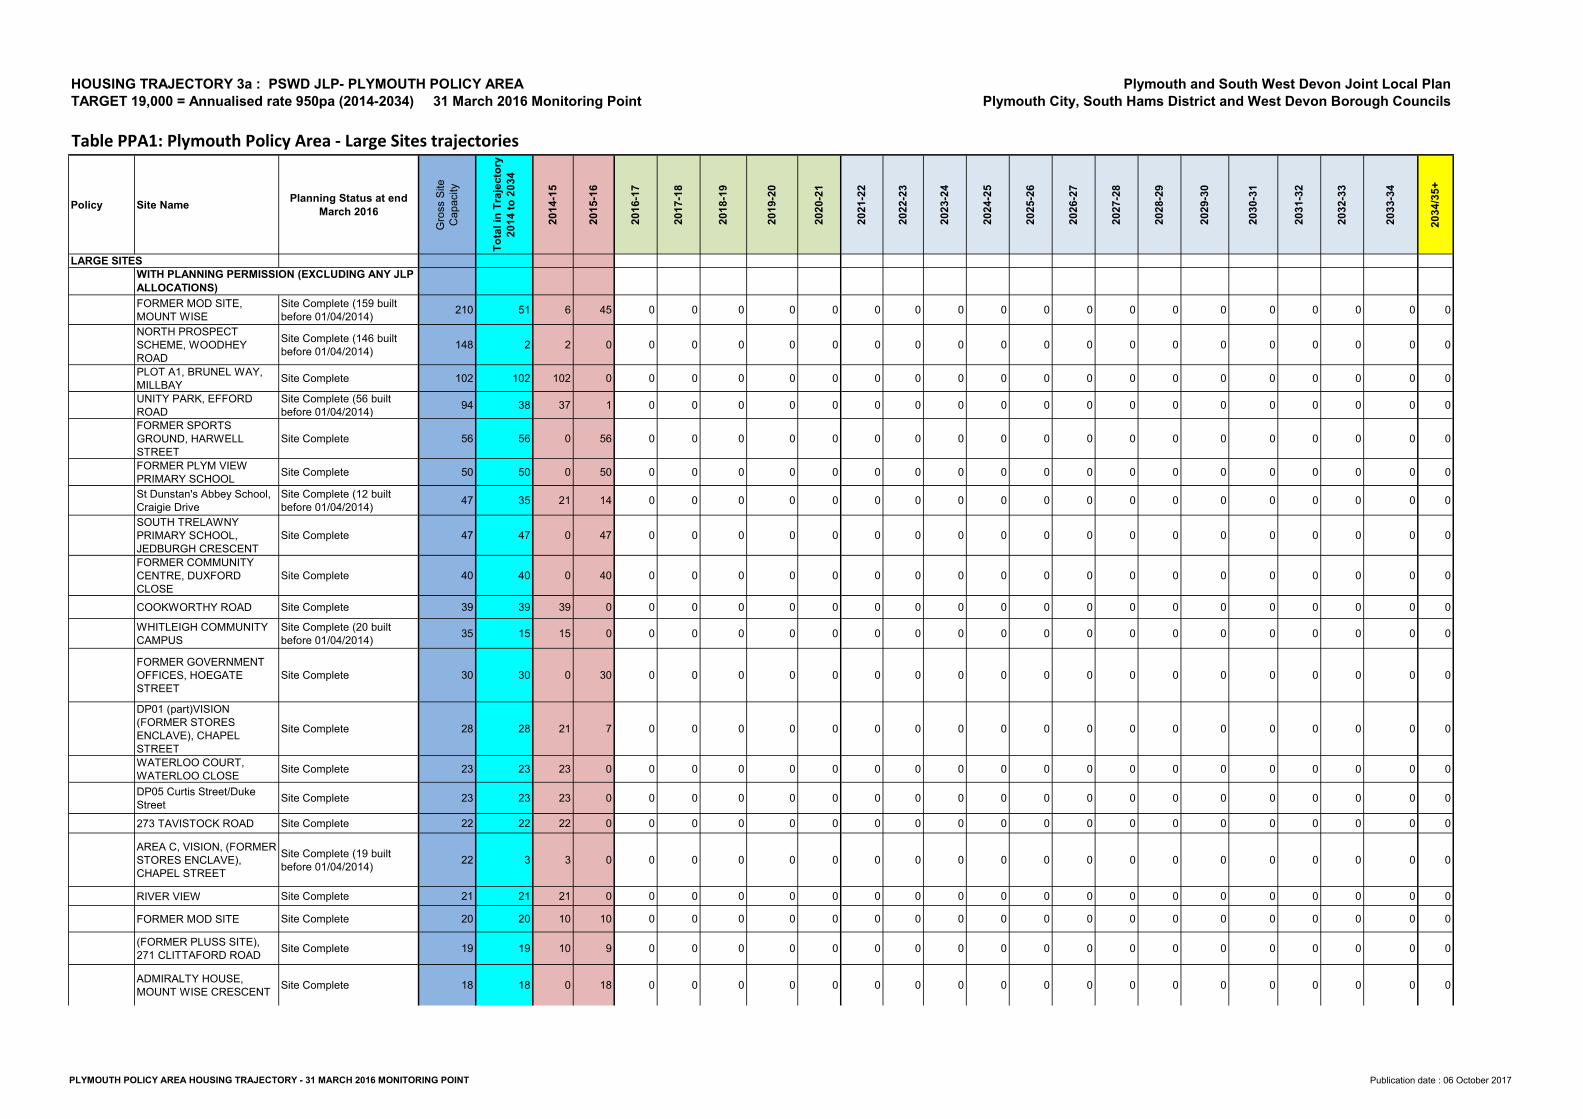
Table PPA1: Plymouth Policy Area - Large Sites trajectories
Policy Site Name Planning Status at end March 2016
Gross
Site
Capac
ity
Total
in Tr
ajecto
ry
2014 t
o 2034
2014-1
5
2015-1
6
2016-1
7
2017-1
8
2018-1
9
2019-2
0
2020-2
1
2021-2
2
2022-2
3
2023-2
4
2024-2
5
2025-2
6
2026-2
7
2027-2
8
2028-2
9
2029-3
0
2030-3
1
2031-3
2
2032-3
3
2033-3
4
2034/3
5+
LARGE SITES
FORMER MOD SITE, MOUNT WISE
Site Complete (159 built before 01/04/2014) 210 51 6 45 0 0 0 0 0 0 0 0 0 0 0 0 0 0 0 0 0 0 0
NORTH PROSPECT SCHEME, WOODHEY ROAD
Site Complete (146 built before 01/04/2014) 148 2 2 0 0 0 0 0 0 0 0 0 0 0 0 0 0 0 0 0 0 0 0
PLOT A1, BRUNEL WAY, MILLBAY Site Complete 102 102 102 0 0 0 0 0 0 0 0 0 0 0 0 0 0 0 0 0 0 0 0UNITY PARK, EFFORD ROAD
Site Complete (56 built before 01/04/2014) 94 38 37 1 0 0 0 0 0 0 0 0 0 0 0 0 0 0 0 0 0 0 0
FORMER SPORTS GROUND, HARWELL STREET
Site Complete 56 56 0 56 0 0 0 0 0 0 0 0 0 0 0 0 0 0 0 0 0 0 0FORMER PLYM VIEW PRIMARY SCHOOL Site Complete 50 50 0 50 0 0 0 0 0 0 0 0 0 0 0 0 0 0 0 0 0 0 0St Dunstan's Abbey School, Craigie Drive
Site Complete (12 built before 01/04/2014) 47 35 21 14 0 0 0 0 0 0 0 0 0 0 0 0 0 0 0 0 0 0 0
SOUTH TRELAWNY PRIMARY SCHOOL, JEDBURGH CRESCENT
Site Complete 47 47 0 47 0 0 0 0 0 0 0 0 0 0 0 0 0 0 0 0 0 0 0FORMER COMMUNITY CENTRE, DUXFORD CLOSE
Site Complete 40 40 0 40 0 0 0 0 0 0 0 0 0 0 0 0 0 0 0 0 0 0 0
COOKWORTHY ROAD Site Complete 39 39 39 0 0 0 0 0 0 0 0 0 0 0 0 0 0 0 0 0 0 0 0WHITLEIGH COMMUNITY CAMPUS
Site Complete (20 built before 01/04/2014) 35 15 15 0 0 0 0 0 0 0 0 0 0 0 0 0 0 0 0 0 0 0 0
FORMER GOVERNMENT OFFICES, HOEGATE STREET
Site Complete 30 30 0 30 0 0 0 0 0 0 0 0 0 0 0 0 0 0 0 0 0 0 0
DP01 (part)VISION (FORMER STORES ENCLAVE), CHAPEL STREET
Site Complete 28 28 21 7 0 0 0 0 0 0 0 0 0 0 0 0 0 0 0 0 0 0 0
WATERLOO COURT, WATERLOO CLOSE Site Complete 23 23 23 0 0 0 0 0 0 0 0 0 0 0 0 0 0 0 0 0 0 0 0DP05 Curtis Street/Duke Street Site Complete 23 23 23 0 0 0 0 0 0 0 0 0 0 0 0 0 0 0 0 0 0 0 0273 TAVISTOCK ROAD Site Complete 22 22 22 0 0 0 0 0 0 0 0 0 0 0 0 0 0 0 0 0 0 0 0AREA C, VISION, (FORMER STORES ENCLAVE), CHAPEL STREET
Site Complete (19 built before 01/04/2014) 22 3 3 0 0 0 0 0 0 0 0 0 0 0 0 0 0 0 0 0 0 0 0
RIVER VIEW Site Complete 21 21 21 0 0 0 0 0 0 0 0 0 0 0 0 0 0 0 0 0 0 0 0FORMER MOD SITE Site Complete 20 20 10 10 0 0 0 0 0 0 0 0 0 0 0 0 0 0 0 0 0 0 0(FORMER PLUSS SITE), 271 CLITTAFORD ROAD Site Complete 19 19 10 9 0 0 0 0 0 0 0 0 0 0 0 0 0 0 0 0 0 0 0ADMIRALTY HOUSE, MOUNT WISE CRESCENT Site Complete 18 18 0 18 0 0 0 0 0 0 0 0 0 0 0 0 0 0 0 0 0 0 0
WITH PLANNING PERMISSION (EXCLUDING ANY JLP ALLOCATIONS)
HOUSING TRAJECTORY 3a : PSWD JLP- PLYMOUTH POLICY AREATARGET 19,000 = Annualised rate 950pa (2014-2034) 31 March 2016 Monitoring Point
Plymouth and South West Devon Joint Local PlanPlymouth City, South Hams District and West Devon Borough Councils
PLYMOUTH POLICY AREA HOUSING TRAJECTORY - 31 MARCH 2016 MONITORING POINT Publication date : 06 October 2017
Policy Site Name Planning Status at end March 2016
Gross
Site
Capac
ity
Total
in Tr
ajecto
ry
2014 t
o 2034
2014-1
5
2015-1
6
2016-1
7
2017-1
8
2018-1
9
2019-2
0
2020-2
1
2021-2
2
2022-2
3
2023-2
4
2024-2
5
2025-2
6
2026-2
7
2027-2
8
2028-2
9
2029-3
0
2030-3
1
2031-3
2
2032-3
3
2033-3
4
2034/3
5+
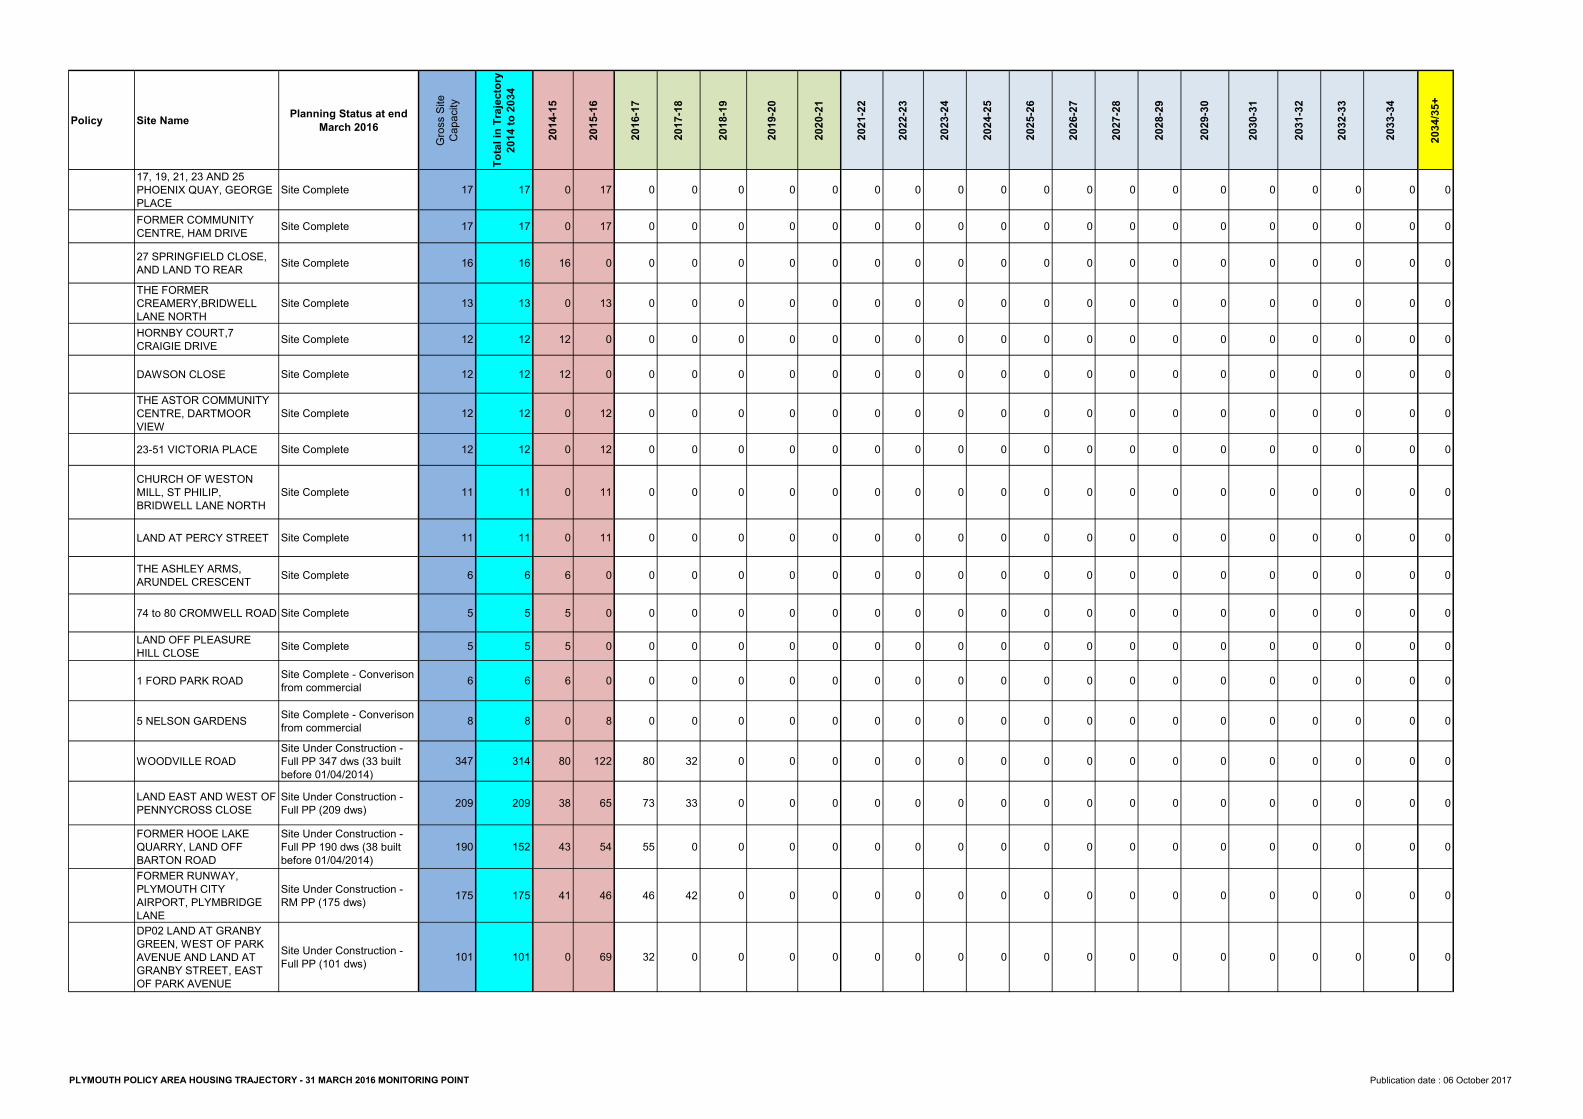
17, 19, 21, 23 AND 25 PHOENIX QUAY, GEORGE PLACE
Site Complete 17 17 0 17 0 0 0 0 0 0 0 0 0 0 0 0 0 0 0 0 0 0 0FORMER COMMUNITY CENTRE, HAM DRIVE Site Complete 17 17 0 17 0 0 0 0 0 0 0 0 0 0 0 0 0 0 0 0 0 0 027 SPRINGFIELD CLOSE, AND LAND TO REAR Site Complete 16 16 16 0 0 0 0 0 0 0 0 0 0 0 0 0 0 0 0 0 0 0 0THE FORMER CREAMERY,BRIDWELL LANE NORTH
Site Complete 13 13 0 13 0 0 0 0 0 0 0 0 0 0 0 0 0 0 0 0 0 0 0HORNBY COURT,7 CRAIGIE DRIVE Site Complete 12 12 12 0 0 0 0 0 0 0 0 0 0 0 0 0 0 0 0 0 0 0 0
DAWSON CLOSE Site Complete 12 12 12 0 0 0 0 0 0 0 0 0 0 0 0 0 0 0 0 0 0 0 0THE ASTOR COMMUNITY CENTRE, DARTMOOR VIEW
Site Complete 12 12 0 12 0 0 0 0 0 0 0 0 0 0 0 0 0 0 0 0 0 0 0
23-51 VICTORIA PLACE Site Complete 12 12 0 12 0 0 0 0 0 0 0 0 0 0 0 0 0 0 0 0 0 0 0CHURCH OF WESTON MILL, ST PHILIP, BRIDWELL LANE NORTH
Site Complete 11 11 0 11 0 0 0 0 0 0 0 0 0 0 0 0 0 0 0 0 0 0 0
LAND AT PERCY STREET Site Complete 11 11 0 11 0 0 0 0 0 0 0 0 0 0 0 0 0 0 0 0 0 0 0
THE ASHLEY ARMS, ARUNDEL CRESCENT Site Complete 6 6 6 0 0 0 0 0 0 0 0 0 0 0 0 0 0 0 0 0 0 0 0
74 to 80 CROMWELL ROAD Site Complete 5 5 5 0 0 0 0 0 0 0 0 0 0 0 0 0 0 0 0 0 0 0 0LAND OFF PLEASURE HILL CLOSE Site Complete 5 5 5 0 0 0 0 0 0 0 0 0 0 0 0 0 0 0 0 0 0 0 0
1 FORD PARK ROAD Site Complete - Converison from commercial 6 6 6 0 0 0 0 0 0 0 0 0 0 0 0 0 0 0 0 0 0 0 0
5 NELSON GARDENS Site Complete - Converison from commercial 8 8 0 8 0 0 0 0 0 0 0 0 0 0 0 0 0 0 0 0 0 0 0
WOODVILLE ROADSite Under Construction - Full PP 347 dws (33 built before 01/04/2014)
347 314 80 122 80 32 0 0 0 0 0 0 0 0 0 0 0 0 0 0 0 0 0
LAND EAST AND WEST OF PENNYCROSS CLOSE
Site Under Construction - Full PP (209 dws) 209 209 38 65 73 33 0 0 0 0 0 0 0 0 0 0 0 0 0 0 0 0 0
FORMER HOOE LAKE QUARRY, LAND OFF BARTON ROAD
Site Under Construction - Full PP 190 dws (38 built before 01/04/2014)
190 152 43 54 55 0 0 0 0 0 0 0 0 0 0 0 0 0 0 0 0 0 0FORMER RUNWAY, PLYMOUTH CITY AIRPORT, PLYMBRIDGE LANE
Site Under Construction - RM PP (175 dws) 175 175 41 46 46 42 0 0 0 0 0 0 0 0 0 0 0 0 0 0 0 0 0
DP02 LAND AT GRANBY GREEN, WEST OF PARK AVENUE AND LAND AT GRANBY STREET, EAST OF PARK AVENUE
Site Under Construction - Full PP (101 dws) 101 101 0 69 32 0 0 0 0 0 0 0 0 0 0 0 0 0 0 0 0 0 0
PLYMOUTH POLICY AREA HOUSING TRAJECTORY - 31 MARCH 2016 MONITORING POINT Publication date : 06 October 2017
Policy Site Name Planning Status at end March 2016
Gross
Site
Capac
ity
Total
in Tr
ajecto
ry
2014 t
o 2034
2014-1
5
2015-1
6
2016-1
7
2017-1
8
2018-1
9
2019-2
0
2020-2
1
2021-2
2
2022-2
3
2023-2
4
2024-2
5
2025-2
6
2026-2
7
2027-2
8
2028-2
9
2029-3
0
2030-3
1
2031-3
2
2032-3
3
2033-3
4
2034/3
5+
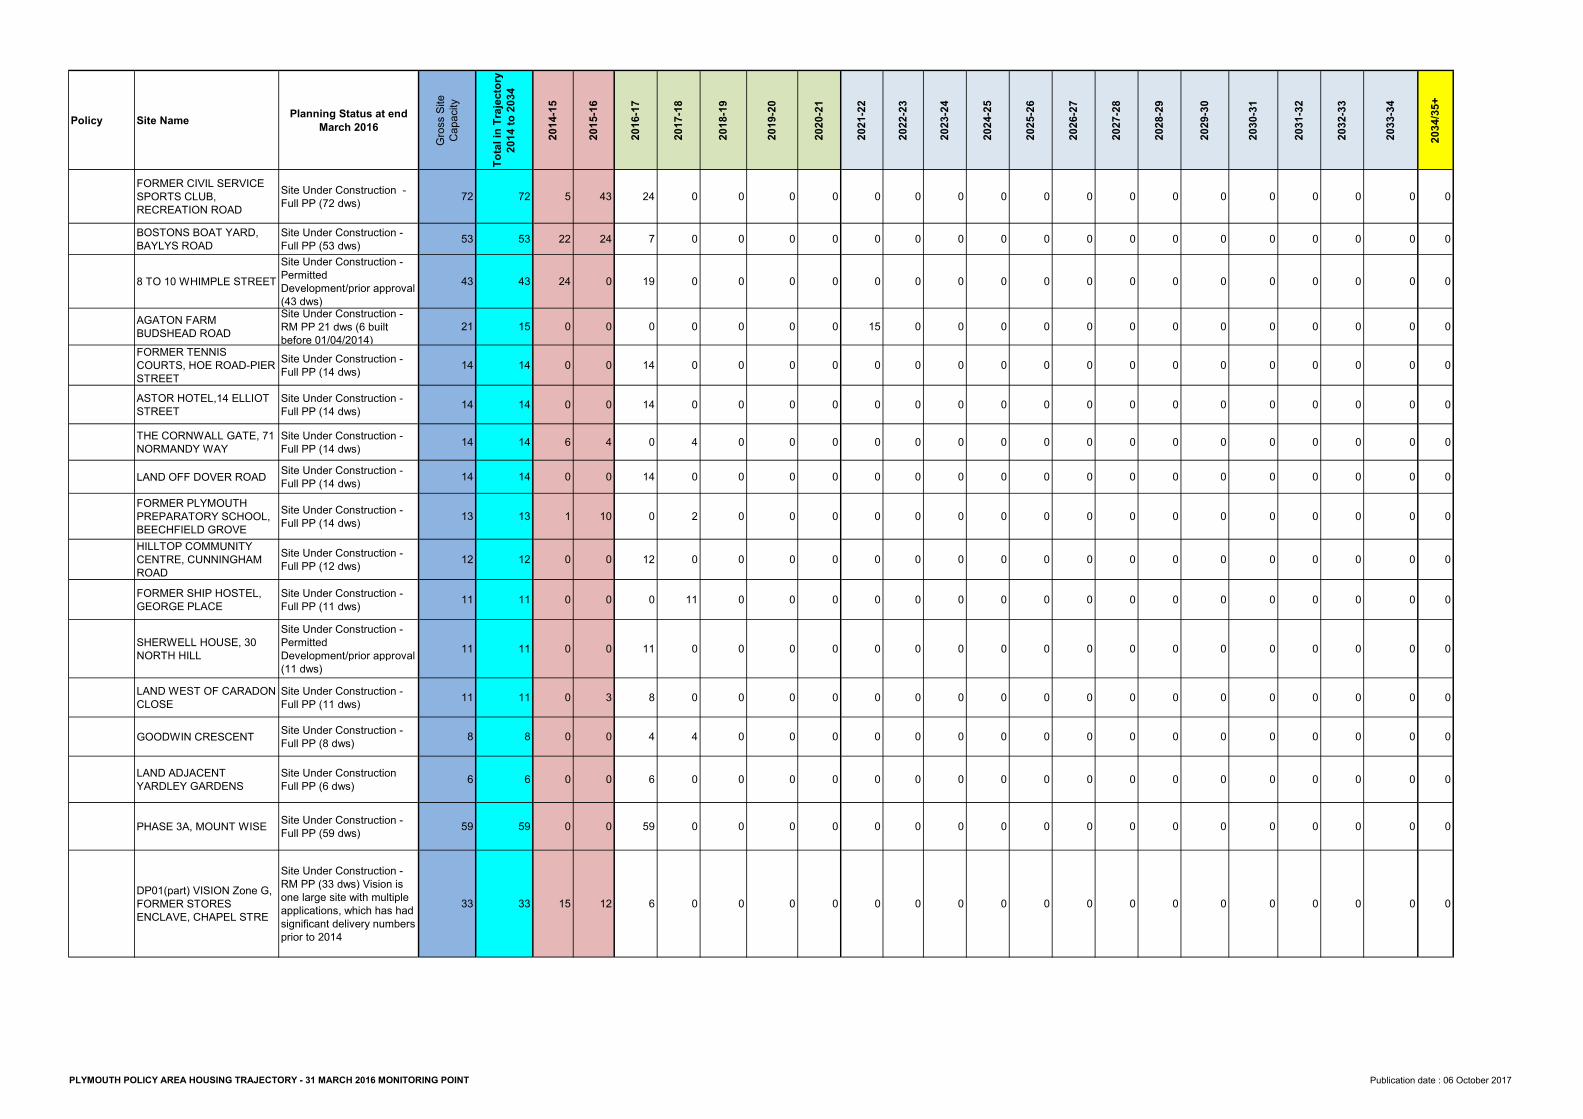
FORMER CIVIL SERVICE SPORTS CLUB, RECREATION ROAD
Site Under Construction - Full PP (72 dws) 72 72 5 43 24 0 0 0 0 0 0 0 0 0 0 0 0 0 0 0 0 0 0
BOSTONS BOAT YARD, BAYLYS ROAD
Site Under Construction - Full PP (53 dws) 53 53 22 24 7 0 0 0 0 0 0 0 0 0 0 0 0 0 0 0 0 0 0
8 TO 10 WHIMPLE STREETSite Under Construction - Permitted Development/prior approval (43 dws)
43 43 24 0 19 0 0 0 0 0 0 0 0 0 0 0 0 0 0 0 0 0 0
AGATON FARM BUDSHEAD ROAD
Site Under Construction - RM PP 21 dws (6 built before 01/04/2014)
21 15 0 0 0 0 0 0 0 15 0 0 0 0 0 0 0 0 0 0 0 0 0FORMER TENNIS COURTS, HOE ROAD-PIER STREET
Site Under Construction - Full PP (14 dws) 14 14 0 0 14 0 0 0 0 0 0 0 0 0 0 0 0 0 0 0 0 0 0
ASTOR HOTEL,14 ELLIOT STREET
Site Under Construction - Full PP (14 dws) 14 14 0 0 14 0 0 0 0 0 0 0 0 0 0 0 0 0 0 0 0 0 0
THE CORNWALL GATE, 71 NORMANDY WAY
Site Under Construction - Full PP (14 dws) 14 14 6 4 0 4 0 0 0 0 0 0 0 0 0 0 0 0 0 0 0 0 0
LAND OFF DOVER ROAD Site Under Construction - Full PP (14 dws) 14 14 0 0 14 0 0 0 0 0 0 0 0 0 0 0 0 0 0 0 0 0 0
FORMER PLYMOUTH PREPARATORY SCHOOL, BEECHFIELD GROVE
Site Under Construction - Full PP (14 dws) 13 13 1 10 0 2 0 0 0 0 0 0 0 0 0 0 0 0 0 0 0 0 0
HILLTOP COMMUNITY CENTRE, CUNNINGHAM ROAD
Site Under Construction - Full PP (12 dws) 12 12 0 0 12 0 0 0 0 0 0 0 0 0 0 0 0 0 0 0 0 0 0
FORMER SHIP HOSTEL, GEORGE PLACE
Site Under Construction - Full PP (11 dws) 11 11 0 0 0 11 0 0 0 0 0 0 0 0 0 0 0 0 0 0 0 0 0
SHERWELL HOUSE, 30 NORTH HILL
Site Under Construction - Permitted Development/prior approval (11 dws)
11 11 0 0 11 0 0 0 0 0 0 0 0 0 0 0 0 0 0 0 0 0 0
LAND WEST OF CARADON CLOSE
Site Under Construction - Full PP (11 dws) 11 11 0 3 8 0 0 0 0 0 0 0 0 0 0 0 0 0 0 0 0 0 0
GOODWIN CRESCENT Site Under Construction - Full PP (8 dws) 8 8 0 0 4 4 0 0 0 0 0 0 0 0 0 0 0 0 0 0 0 0 0
LAND ADJACENT YARDLEY GARDENS
Site Under Construction Full PP (6 dws) 6 6 0 0 6 0 0 0 0 0 0 0 0 0 0 0 0 0 0 0 0 0 0
PHASE 3A, MOUNT WISE Site Under Construction - Full PP (59 dws) 59 59 0 0 59 0 0 0 0 0 0 0 0 0 0 0 0 0 0 0 0 0 0
DP01(part) VISION Zone G, FORMER STORES ENCLAVE, CHAPEL STRE
Site Under Construction - RM PP (33 dws) Vision is one large site with multiple applications, which has had significant delivery numbers prior to 2014
33 33 15 12 6 0 0 0 0 0 0 0 0 0 0 0 0 0 0 0 0 0 0
PLYMOUTH POLICY AREA HOUSING TRAJECTORY - 31 MARCH 2016 MONITORING POINT Publication date : 06 October 2017
Policy Site Name Planning Status at end March 2016
Gross
Site
Capac
ity
Total
in Tr
ajecto
ry
2014 t
o 2034
2014-1
5
2015-1
6
2016-1
7
2017-1
8
2018-1
9
2019-2
0
2020-2
1
2021-2
2
2022-2
3
2023-2
4
2024-2
5
2025-2
6
2026-2
7
2027-2
8
2028-2
9
2029-3
0
2030-3
1
2031-3
2
2032-3
3
2033-3
4
2034/3
5+
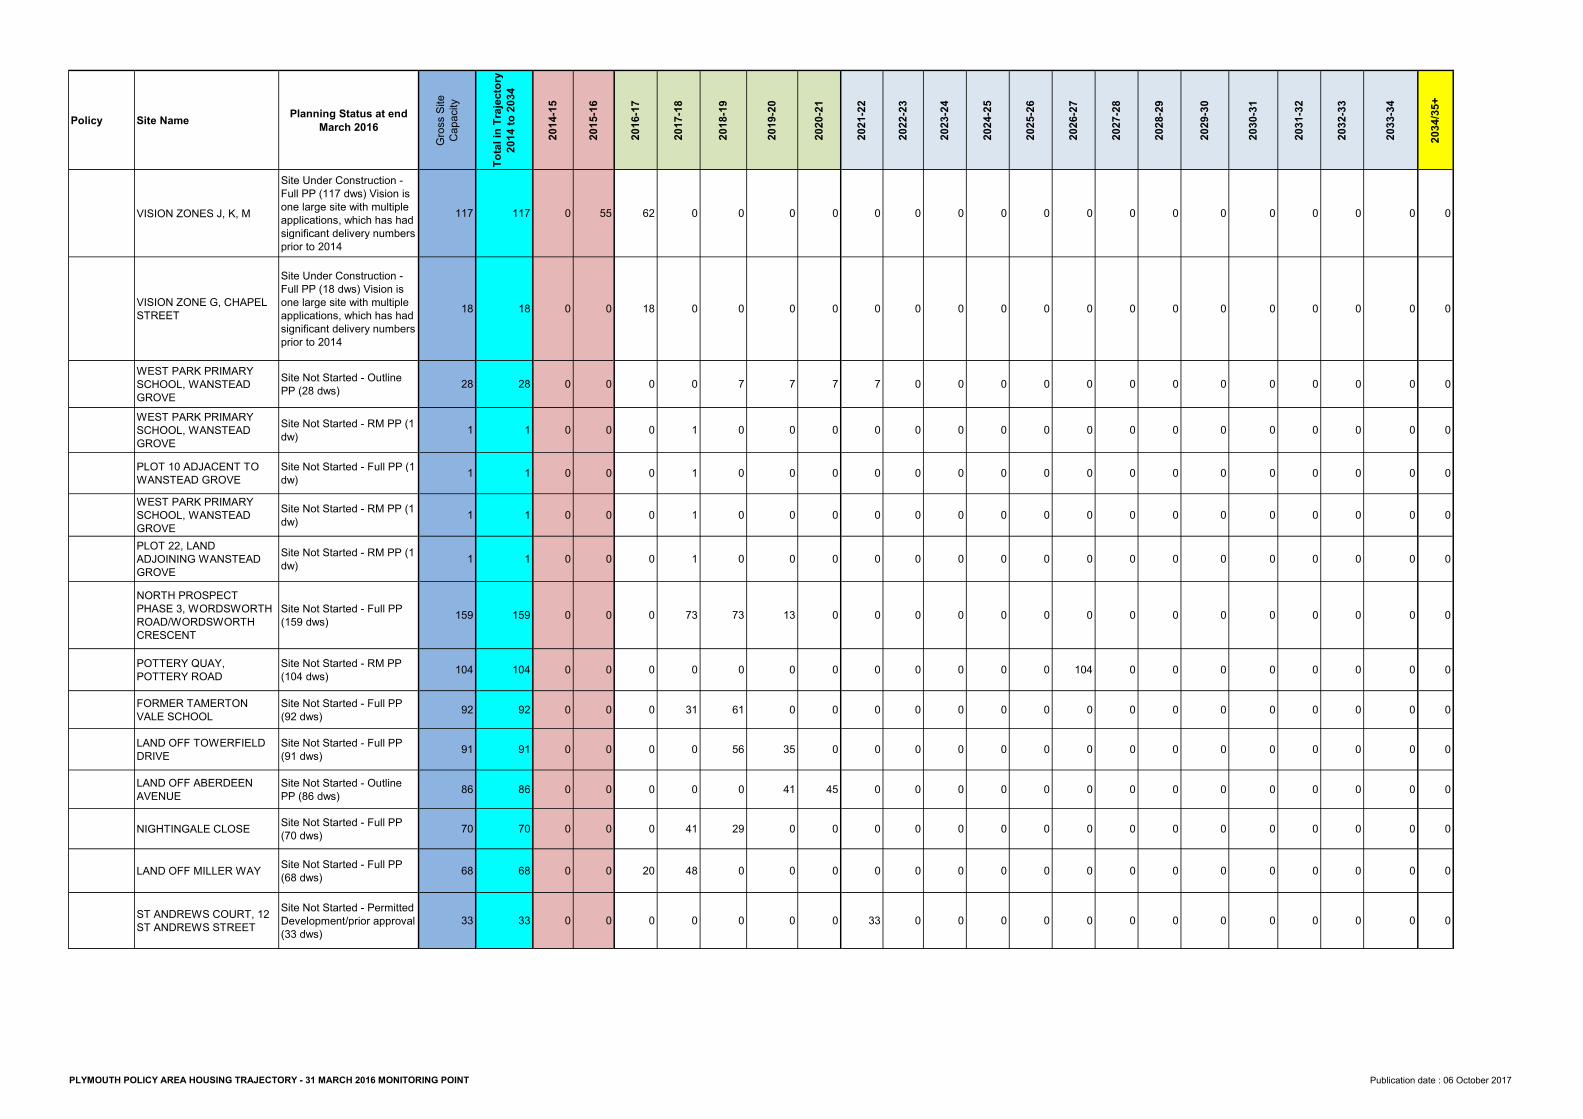
VISION ZONES J, K, M
Site Under Construction - Full PP (117 dws) Vision is one large site with multiple applications, which has had significant delivery numbers prior to 2014
117 117 0 55 62 0 0 0 0 0 0 0 0 0 0 0 0 0 0 0 0 0 0
VISION ZONE G, CHAPEL STREET
Site Under Construction - Full PP (18 dws) Vision is one large site with multiple applications, which has had significant delivery numbers prior to 2014
18 18 0 0 18 0 0 0 0 0 0 0 0 0 0 0 0 0 0 0 0 0 0
WEST PARK PRIMARY SCHOOL, WANSTEAD GROVE
Site Not Started - Outline PP (28 dws) 28 28 0 0 0 0 7 7 7 7 0 0 0 0 0 0 0 0 0 0 0 0 0
WEST PARK PRIMARY SCHOOL, WANSTEAD GROVE
Site Not Started - RM PP (1 dw) 1 1 0 0 0 1 0 0 0 0 0 0 0 0 0 0 0 0 0 0 0 0 0
PLOT 10 ADJACENT TO WANSTEAD GROVE
Site Not Started - Full PP (1 dw) 1 1 0 0 0 1 0 0 0 0 0 0 0 0 0 0 0 0 0 0 0 0 0
WEST PARK PRIMARY SCHOOL, WANSTEAD GROVE
Site Not Started - RM PP (1 dw) 1 1 0 0 0 1 0 0 0 0 0 0 0 0 0 0 0 0 0 0 0 0 0
PLOT 22, LAND ADJOINING WANSTEAD GROVE
Site Not Started - RM PP (1 dw) 1 1 0 0 0 1 0 0 0 0 0 0 0 0 0 0 0 0 0 0 0 0 0
NORTH PROSPECT PHASE 3, WORDSWORTH ROAD/WORDSWORTH CRESCENT
Site Not Started - Full PP (159 dws) 159 159 0 0 0 73 73 13 0 0 0 0 0 0 0 0 0 0 0 0 0 0 0
POTTERY QUAY, POTTERY ROAD
Site Not Started - RM PP (104 dws) 104 104 0 0 0 0 0 0 0 0 0 0 0 0 104 0 0 0 0 0 0 0 0
FORMER TAMERTON VALE SCHOOL
Site Not Started - Full PP (92 dws) 92 92 0 0 0 31 61 0 0 0 0 0 0 0 0 0 0 0 0 0 0 0 0
LAND OFF TOWERFIELD DRIVE
Site Not Started - Full PP (91 dws) 91 91 0 0 0 0 56 35 0 0 0 0 0 0 0 0 0 0 0 0 0 0 0
LAND OFF ABERDEEN AVENUE
Site Not Started - Outline PP (86 dws) 86 86 0 0 0 0 0 41 45 0 0 0 0 0 0 0 0 0 0 0 0 0 0
NIGHTINGALE CLOSE Site Not Started - Full PP (70 dws) 70 70 0 0 0 41 29 0 0 0 0 0 0 0 0 0 0 0 0 0 0 0 0
LAND OFF MILLER WAY Site Not Started - Full PP (68 dws) 68 68 0 0 20 48 0 0 0 0 0 0 0 0 0 0 0 0 0 0 0 0 0
ST ANDREWS COURT, 12 ST ANDREWS STREET
Site Not Started - Permitted Development/prior approval (33 dws)
33 33 0 0 0 0 0 0 0 33 0 0 0 0 0 0 0 0 0 0 0 0 0
PLYMOUTH POLICY AREA HOUSING TRAJECTORY - 31 MARCH 2016 MONITORING POINT Publication date : 06 October 2017
Policy Site Name Planning Status at end March 2016
Gross
Site
Capac
ity
Total
in Tr
ajecto
ry
2014 t
o 2034
2014-1
5
2015-1
6
2016-1
7
2017-1
8
2018-1
9
2019-2
0
2020-2
1
2021-2
2
2022-2
3
2023-2
4
2024-2
5
2025-2
6
2026-2
7
2027-2
8
2028-2
9
2029-3
0
2030-3
1
2031-3
2
2032-3
3
2033-3
4
2034/3
5+
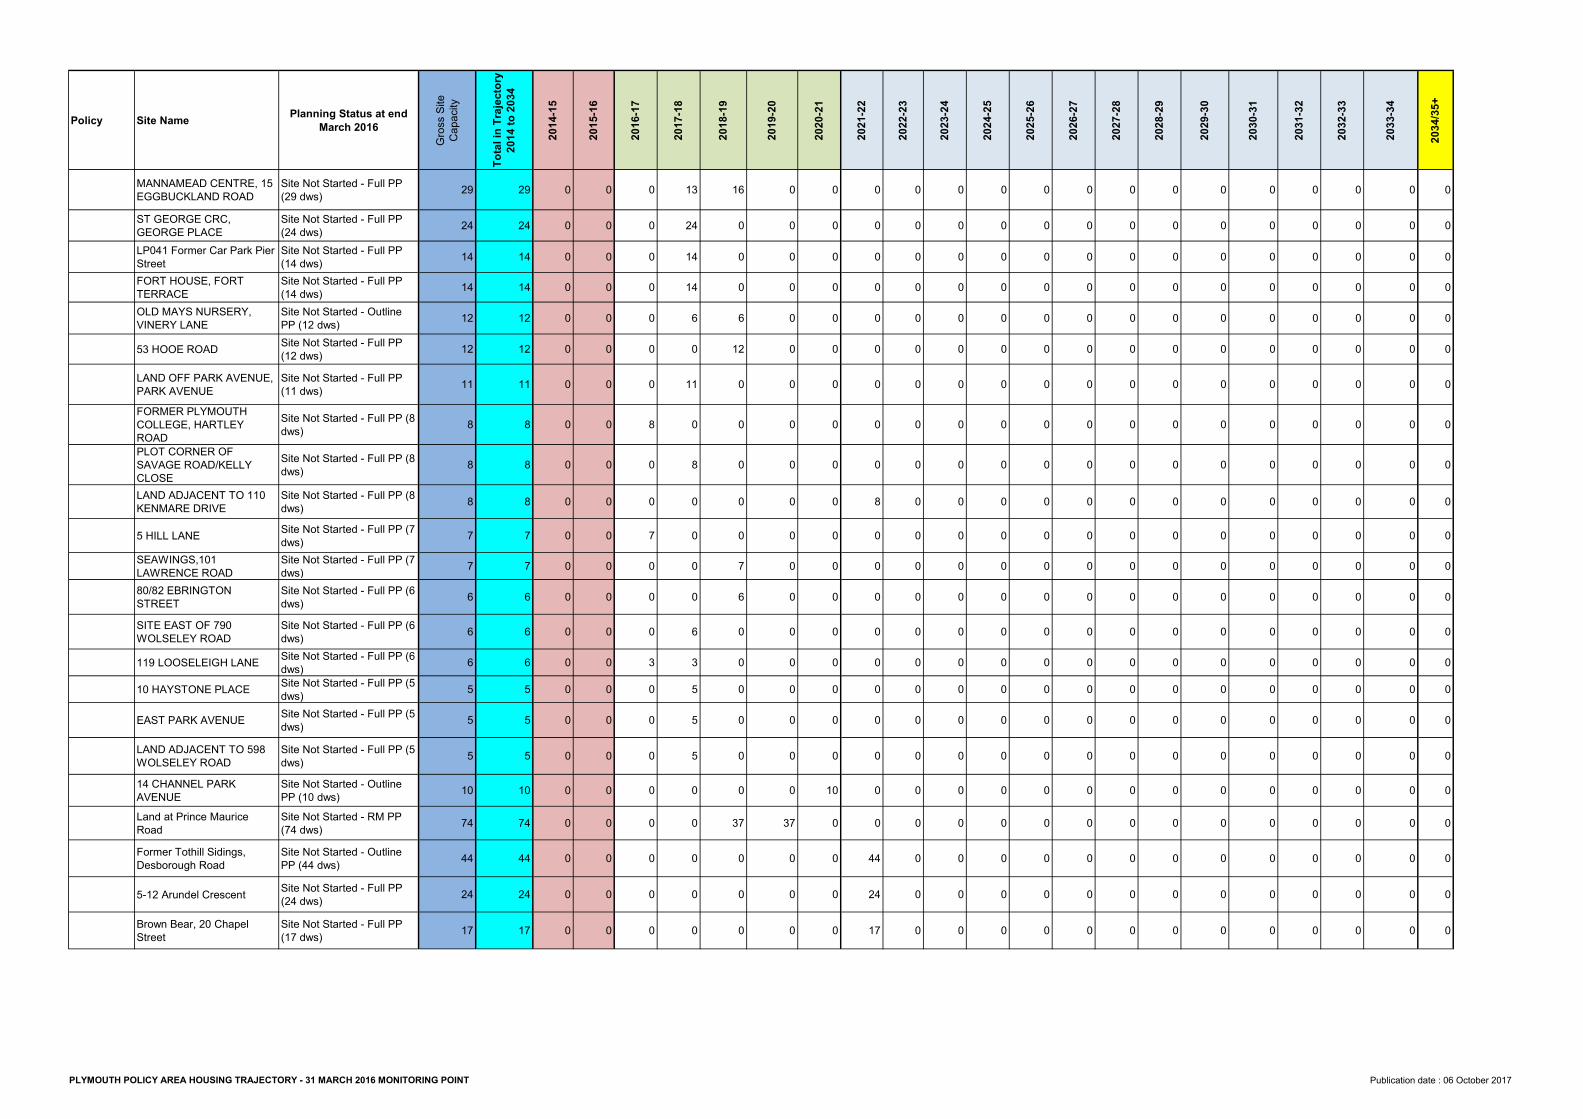
MANNAMEAD CENTRE, 15 EGGBUCKLAND ROAD
Site Not Started - Full PP (29 dws) 29 29 0 0 0 13 16 0 0 0 0 0 0 0 0 0 0 0 0 0 0 0 0
ST GEORGE CRC, GEORGE PLACE
Site Not Started - Full PP (24 dws) 24 24 0 0 0 24 0 0 0 0 0 0 0 0 0 0 0 0 0 0 0 0 0
LP041 Former Car Park Pier Street
Site Not Started - Full PP (14 dws) 14 14 0 0 0 14 0 0 0 0 0 0 0 0 0 0 0 0 0 0 0 0 0
FORT HOUSE, FORT TERRACE
Site Not Started - Full PP (14 dws) 14 14 0 0 0 14 0 0 0 0 0 0 0 0 0 0 0 0 0 0 0 0 0
OLD MAYS NURSERY, VINERY LANE
Site Not Started - Outline PP (12 dws) 12 12 0 0 0 6 6 0 0 0 0 0 0 0 0 0 0 0 0 0 0 0 0
53 HOOE ROAD Site Not Started - Full PP (12 dws) 12 12 0 0 0 0 12 0 0 0 0 0 0 0 0 0 0 0 0 0 0 0 0
LAND OFF PARK AVENUE, PARK AVENUE
Site Not Started - Full PP (11 dws) 11 11 0 0 0 11 0 0 0 0 0 0 0 0 0 0 0 0 0 0 0 0 0
FORMER PLYMOUTH COLLEGE, HARTLEY ROAD
Site Not Started - Full PP (8 dws) 8 8 0 0 8 0 0 0 0 0 0 0 0 0 0 0 0 0 0 0 0 0 0
PLOT CORNER OF SAVAGE ROAD/KELLY CLOSE
Site Not Started - Full PP (8 dws) 8 8 0 0 0 8 0 0 0 0 0 0 0 0 0 0 0 0 0 0 0 0 0
LAND ADJACENT TO 110 KENMARE DRIVE
Site Not Started - Full PP (8 dws) 8 8 0 0 0 0 0 0 0 8 0 0 0 0 0 0 0 0 0 0 0 0 0
5 HILL LANE Site Not Started - Full PP (7 dws) 7 7 0 0 7 0 0 0 0 0 0 0 0 0 0 0 0 0 0 0 0 0 0
SEAWINGS,101 LAWRENCE ROAD
Site Not Started - Full PP (7 dws) 7 7 0 0 0 0 7 0 0 0 0 0 0 0 0 0 0 0 0 0 0 0 0
80/82 EBRINGTON STREET
Site Not Started - Full PP (6 dws) 6 6 0 0 0 0 6 0 0 0 0 0 0 0 0 0 0 0 0 0 0 0 0
SITE EAST OF 790 WOLSELEY ROAD
Site Not Started - Full PP (6 dws) 6 6 0 0 0 6 0 0 0 0 0 0 0 0 0 0 0 0 0 0 0 0 0
119 LOOSELEIGH LANE Site Not Started - Full PP (6 dws) 6 6 0 0 3 3 0 0 0 0 0 0 0 0 0 0 0 0 0 0 0 0 0
10 HAYSTONE PLACE Site Not Started - Full PP (5 dws) 5 5 0 0 0 5 0 0 0 0 0 0 0 0 0 0 0 0 0 0 0 0 0
EAST PARK AVENUE Site Not Started - Full PP (5 dws) 5 5 0 0 0 5 0 0 0 0 0 0 0 0 0 0 0 0 0 0 0 0 0
LAND ADJACENT TO 598 WOLSELEY ROAD
Site Not Started - Full PP (5 dws) 5 5 0 0 0 5 0 0 0 0 0 0 0 0 0 0 0 0 0 0 0 0 0
14 CHANNEL PARK AVENUE
Site Not Started - Outline PP (10 dws) 10 10 0 0 0 0 0 0 10 0 0 0 0 0 0 0 0 0 0 0 0 0 0
Land at Prince Maurice Road
Site Not Started - RM PP (74 dws) 74 74 0 0 0 0 37 37 0 0 0 0 0 0 0 0 0 0 0 0 0 0 0
Former Tothill Sidings, Desborough Road
Site Not Started - Outline PP (44 dws) 44 44 0 0 0 0 0 0 0 44 0 0 0 0 0 0 0 0 0 0 0 0 0
5-12 Arundel Crescent Site Not Started - Full PP (24 dws) 24 24 0 0 0 0 0 0 0 24 0 0 0 0 0 0 0 0 0 0 0 0 0
Brown Bear, 20 Chapel Street
Site Not Started - Full PP (17 dws) 17 17 0 0 0 0 0 0 0 17 0 0 0 0 0 0 0 0 0 0 0 0 0
PLYMOUTH POLICY AREA HOUSING TRAJECTORY - 31 MARCH 2016 MONITORING POINT Publication date : 06 October 2017
Policy Site Name Planning Status at end March 2016
Gross
Site
Capac
ity
Total
in Tr
ajecto
ry
2014 t
o 2034
2014-1
5
2015-1
6
2016-1
7
2017-1
8
2018-1
9
2019-2
0
2020-2
1
2021-2
2
2022-2
3
2023-2
4
2024-2
5
2025-2
6
2026-2
7
2027-2
8
2028-2
9
2029-3
0
2030-3
1
2031-3
2
2032-3
3
2033-3
4
2034/3
5+
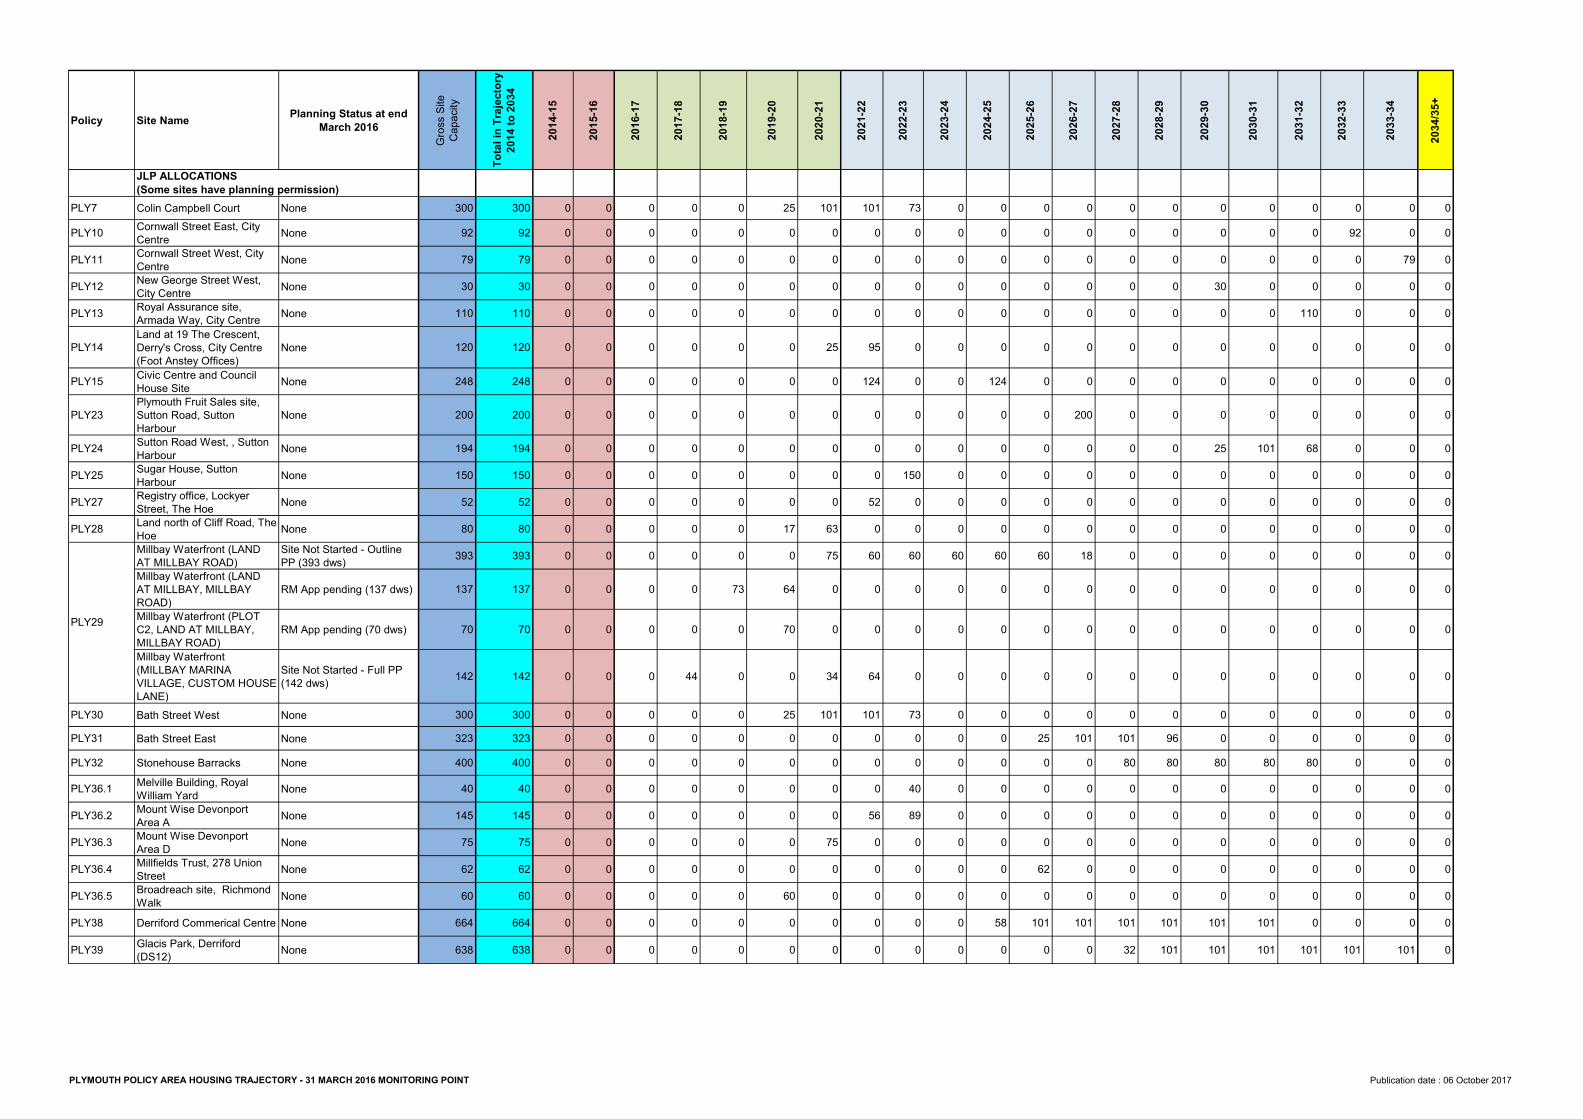
PLY7 Colin Campbell Court None 300 300 0 0 0 0 0 25 101 101 73 0 0 0 0 0 0 0 0 0 0 0 0PLY10 Cornwall Street East, City
Centre None 92 92 0 0 0 0 0 0 0 0 0 0 0 0 0 0 0 0 0 0 92 0 0PLY11 Cornwall Street West, City
Centre None 79 79 0 0 0 0 0 0 0 0 0 0 0 0 0 0 0 0 0 0 0 79 0PLY12 New George Street West,
City Centre None 30 30 0 0 0 0 0 0 0 0 0 0 0 0 0 0 0 30 0 0 0 0 0PLY13 Royal Assurance site,
Armada Way, City Centre None 110 110 0 0 0 0 0 0 0 0 0 0 0 0 0 0 0 0 0 110 0 0 0
PLY14Land at 19 The Crescent, Derry's Cross, City Centre (Foot Anstey Offices)
None 120 120 0 0 0 0 0 0 25 95 0 0 0 0 0 0 0 0 0 0 0 0 0
PLY15 Civic Centre and Council House Site None 248 248 0 0 0 0 0 0 0 124 0 0 124 0 0 0 0 0 0 0 0 0 0
PLY23Plymouth Fruit Sales site, Sutton Road, Sutton Harbour
None 200 200 0 0 0 0 0 0 0 0 0 0 0 0 200 0 0 0 0 0 0 0 0
PLY24 Sutton Road West, , Sutton Harbour None 194 194 0 0 0 0 0 0 0 0 0 0 0 0 0 0 0 25 101 68 0 0 0
PLY25 Sugar House, Sutton Harbour None 150 150 0 0 0 0 0 0 0 0 150 0 0 0 0 0 0 0 0 0 0 0 0
PLY27 Registry office, Lockyer Street, The Hoe None 52 52 0 0 0 0 0 0 0 52 0 0 0 0 0 0 0 0 0 0 0 0 0
PLY28 Land north of Cliff Road, The Hoe None 80 80 0 0 0 0 0 17 63 0 0 0 0 0 0 0 0 0 0 0 0 0 0Millbay Waterfront (LAND AT MILLBAY ROAD)
Site Not Started - Outline PP (393 dws) 393 393 0 0 0 0 0 0 75 60 60 60 60 60 18 0 0 0 0 0 0 0 0
Millbay Waterfront (LAND AT MILLBAY, MILLBAY ROAD)
RM App pending (137 dws) 137 137 0 0 0 0 73 64 0 0 0 0 0 0 0 0 0 0 0 0 0 0 0Millbay Waterfront (PLOT C2, LAND AT MILLBAY, MILLBAY ROAD)
RM App pending (70 dws) 70 70 0 0 0 0 0 70 0 0 0 0 0 0 0 0 0 0 0 0 0 0 0Millbay Waterfront (MILLBAY MARINA VILLAGE, CUSTOM HOUSE LANE)
Site Not Started - Full PP (142 dws) 142 142 0 0 0 44 0 0 34 64 0 0 0 0 0 0 0 0 0 0 0 0 0
PLY30 Bath Street West None 300 300 0 0 0 0 0 25 101 101 73 0 0 0 0 0 0 0 0 0 0 0 0PLY31 Bath Street East None 323 323 0 0 0 0 0 0 0 0 0 0 0 25 101 101 96 0 0 0 0 0 0PLY32 Stonehouse Barracks None 400 400 0 0 0 0 0 0 0 0 0 0 0 0 0 80 80 80 80 80 0 0 0PLY36.1 Melville Building, Royal
William Yard None 40 40 0 0 0 0 0 0 0 0 40 0 0 0 0 0 0 0 0 0 0 0 0PLY36.2 Mount Wise Devonport
Area A None 145 145 0 0 0 0 0 0 0 56 89 0 0 0 0 0 0 0 0 0 0 0 0PLY36.3 Mount Wise Devonport
Area D None 75 75 0 0 0 0 0 0 75 0 0 0 0 0 0 0 0 0 0 0 0 0 0PLY36.4 Millfields Trust, 278 Union
Street None 62 62 0 0 0 0 0 0 0 0 0 0 0 62 0 0 0 0 0 0 0 0 0PLY36.5 Broadreach site, Richmond
Walk None 60 60 0 0 0 0 0 60 0 0 0 0 0 0 0 0 0 0 0 0 0 0 0PLY38 Derriford Commerical Centre None 664 664 0 0 0 0 0 0 0 0 0 0 58 101 101 101 101 101 101 0 0 0 0PLY39 Glacis Park, Derriford
(DS12) None 638 638 0 0 0 0 0 0 0 0 0 0 0 0 0 32 101 101 101 101 101 101 0
JLP ALLOCATIONS (Some sites have planning permission)
PLY29
PLYMOUTH POLICY AREA HOUSING TRAJECTORY - 31 MARCH 2016 MONITORING POINT Publication date : 06 October 2017
Policy Site Name Planning Status at end March 2016
Gross
Site
Capac
ity
Total
in Tr
ajecto
ry
2014 t
o 2034
2014-1
5
2015-1
6
2016-1
7
2017-1
8
2018-1
9
2019-2
0
2020-2
1
2021-2
2
2022-2
3
2023-2
4
2024-2
5
2025-2
6
2026-2
7
2027-2
8
2028-2
9
2029-3
0
2030-3
1
2031-3
2
2032-3
3
2033-3
4
2034/3
5+
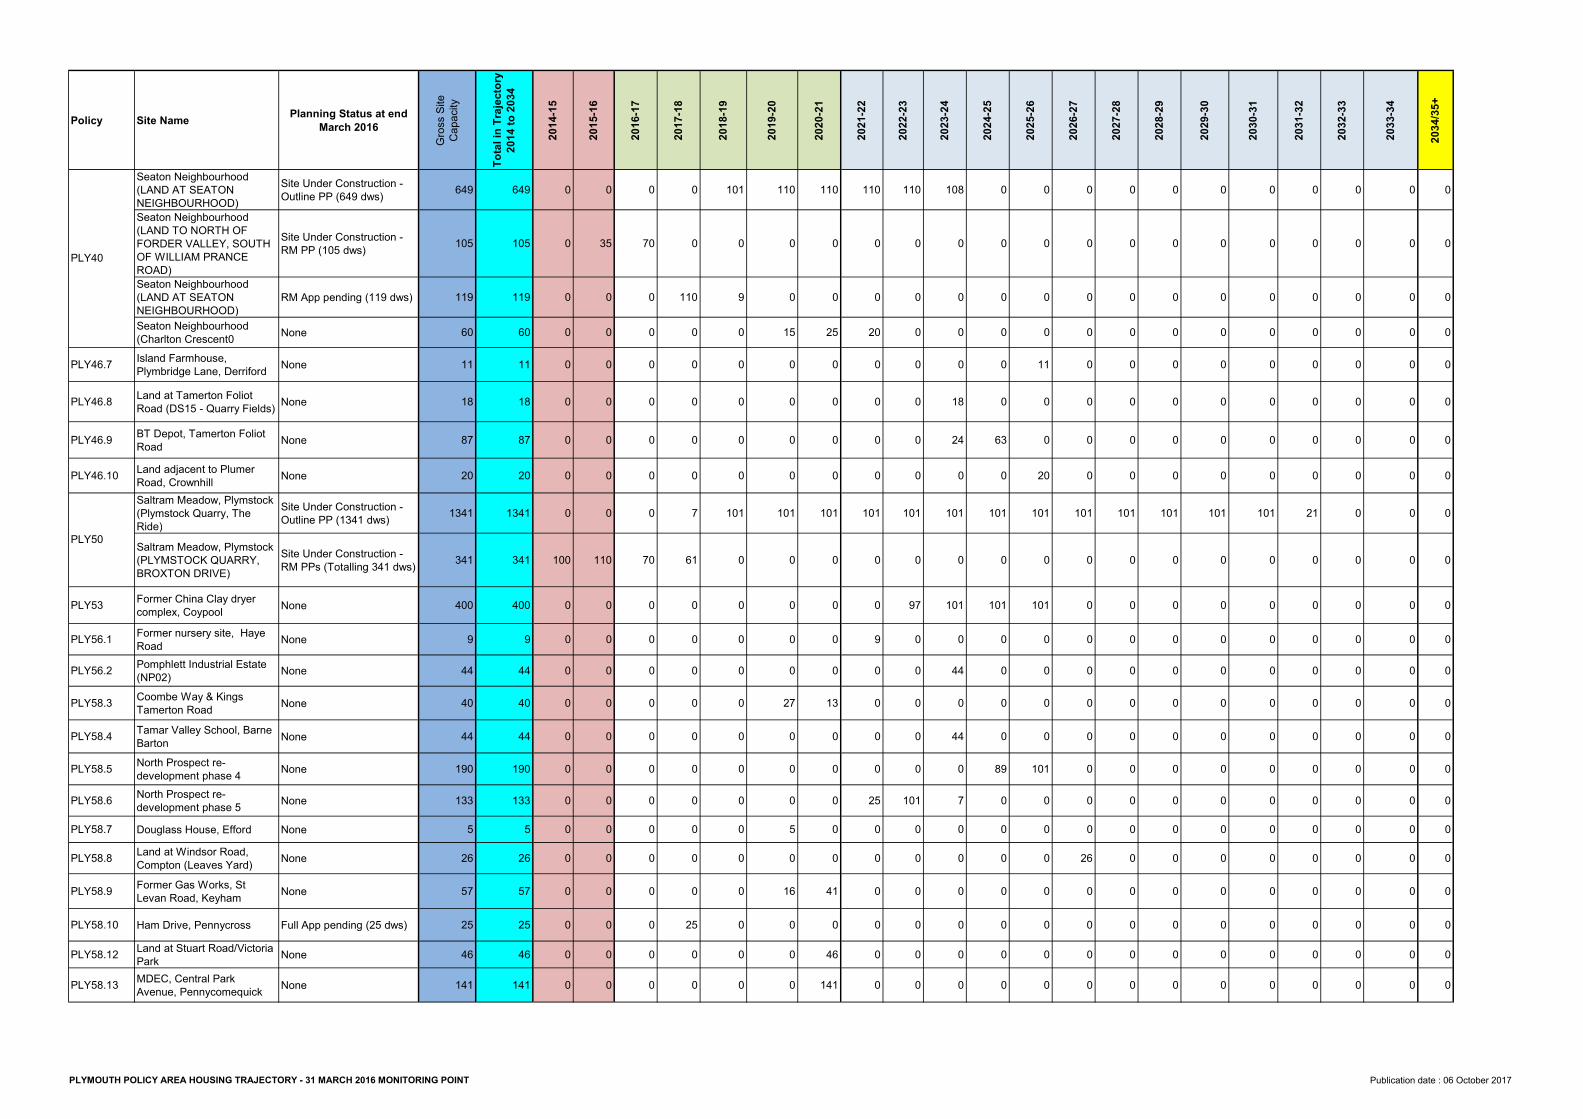
Seaton Neighbourhood (LAND AT SEATON NEIGHBOURHOOD)
Site Under Construction - Outline PP (649 dws) 649 649 0 0 0 0 101 110 110 110 110 108 0 0 0 0 0 0 0 0 0 0 0
Seaton Neighbourhood (LAND TO NORTH OF FORDER VALLEY, SOUTH OF WILLIAM PRANCE ROAD)
Site Under Construction - RM PP (105 dws) 105 105 0 35 70 0 0 0 0 0 0 0 0 0 0 0 0 0 0 0 0 0 0
Seaton Neighbourhood (LAND AT SEATON NEIGHBOURHOOD)
RM App pending (119 dws) 119 119 0 0 0 110 9 0 0 0 0 0 0 0 0 0 0 0 0 0 0 0 0Seaton Neighbourhood (Charlton Crescent0 None 60 60 0 0 0 0 0 15 25 20 0 0 0 0 0 0 0 0 0 0 0 0 0
PLY46.7 Island Farmhouse, Plymbridge Lane, Derriford None 11 11 0 0 0 0 0 0 0 0 0 0 0 11 0 0 0 0 0 0 0 0 0
PLY46.8 Land at Tamerton Foliot Road (DS15 - Quarry Fields) None 18 18 0 0 0 0 0 0 0 0 0 18 0 0 0 0 0 0 0 0 0 0 0
PLY46.9 BT Depot, Tamerton Foliot Road None 87 87 0 0 0 0 0 0 0 0 0 24 63 0 0 0 0 0 0 0 0 0 0
PLY46.10 Land adjacent to Plumer Road, Crownhill None 20 20 0 0 0 0 0 0 0 0 0 0 0 20 0 0 0 0 0 0 0 0 0Saltram Meadow, Plymstock (Plymstock Quarry, The Ride)
Site Under Construction - Outline PP (1341 dws) 1341 1341 0 0 0 7 101 101 101 101 101 101 101 101 101 101 101 101 101 21 0 0 0
Saltram Meadow, Plymstock (PLYMSTOCK QUARRY, BROXTON DRIVE)
Site Under Construction - RM PPs (Totalling 341 dws) 341 341 100 110 70 61 0 0 0 0 0 0 0 0 0 0 0 0 0 0 0 0 0
PLY53 Former China Clay dryer complex, Coypool None 400 400 0 0 0 0 0 0 0 0 97 101 101 101 0 0 0 0 0 0 0 0 0
PLY56.1 Former nursery site, Haye Road None 9 9 0 0 0 0 0 0 0 9 0 0 0 0 0 0 0 0 0 0 0 0 0
PLY56.2 Pomphlett Industrial Estate (NP02) None 44 44 0 0 0 0 0 0 0 0 0 44 0 0 0 0 0 0 0 0 0 0 0
PLY58.3 Coombe Way & Kings Tamerton Road None 40 40 0 0 0 0 0 27 13 0 0 0 0 0 0 0 0 0 0 0 0 0 0
PLY58.4 Tamar Valley School, Barne Barton None 44 44 0 0 0 0 0 0 0 0 0 44 0 0 0 0 0 0 0 0 0 0 0
PLY58.5 North Prospect re-development phase 4 None 190 190 0 0 0 0 0 0 0 0 0 0 89 101 0 0 0 0 0 0 0 0 0
PLY58.6 North Prospect re-development phase 5 None 133 133 0 0 0 0 0 0 0 25 101 7 0 0 0 0 0 0 0 0 0 0 0
PLY58.7 Douglass House, Efford None 5 5 0 0 0 0 0 5 0 0 0 0 0 0 0 0 0 0 0 0 0 0 0PLY58.8 Land at Windsor Road,
Compton (Leaves Yard) None 26 26 0 0 0 0 0 0 0 0 0 0 0 0 26 0 0 0 0 0 0 0 0
PLY58.9 Former Gas Works, St Levan Road, Keyham None 57 57 0 0 0 0 0 16 41 0 0 0 0 0 0 0 0 0 0 0 0 0 0
PLY58.10 Ham Drive, Pennycross Full App pending (25 dws) 25 25 0 0 0 25 0 0 0 0 0 0 0 0 0 0 0 0 0 0 0 0 0PLY58.12 Land at Stuart Road/Victoria
Park None 46 46 0 0 0 0 0 0 46 0 0 0 0 0 0 0 0 0 0 0 0 0 0PLY58.13 MDEC, Central Park
Avenue, Pennycomequick None 141 141 0 0 0 0 0 0 141 0 0 0 0 0 0 0 0 0 0 0 0 0 0
PLY40
PLY50
PLYMOUTH POLICY AREA HOUSING TRAJECTORY - 31 MARCH 2016 MONITORING POINT Publication date : 06 October 2017
Policy Site Name Planning Status at end March 2016
Gross
Site
Capac
ity
Total
in Tr
ajecto
ry
2014 t
o 2034
2014-1
5
2015-1
6
2016-1
7
2017-1
8
2018-1
9
2019-2
0
2020-2
1
2021-2
2
2022-2
3
2023-2
4
2024-2
5
2025-2
6
2026-2
7
2027-2
8
2028-2
9
2029-3
0
2030-3
1
2031-3
2
2032-3
3
2033-3
4
2034/3
5+
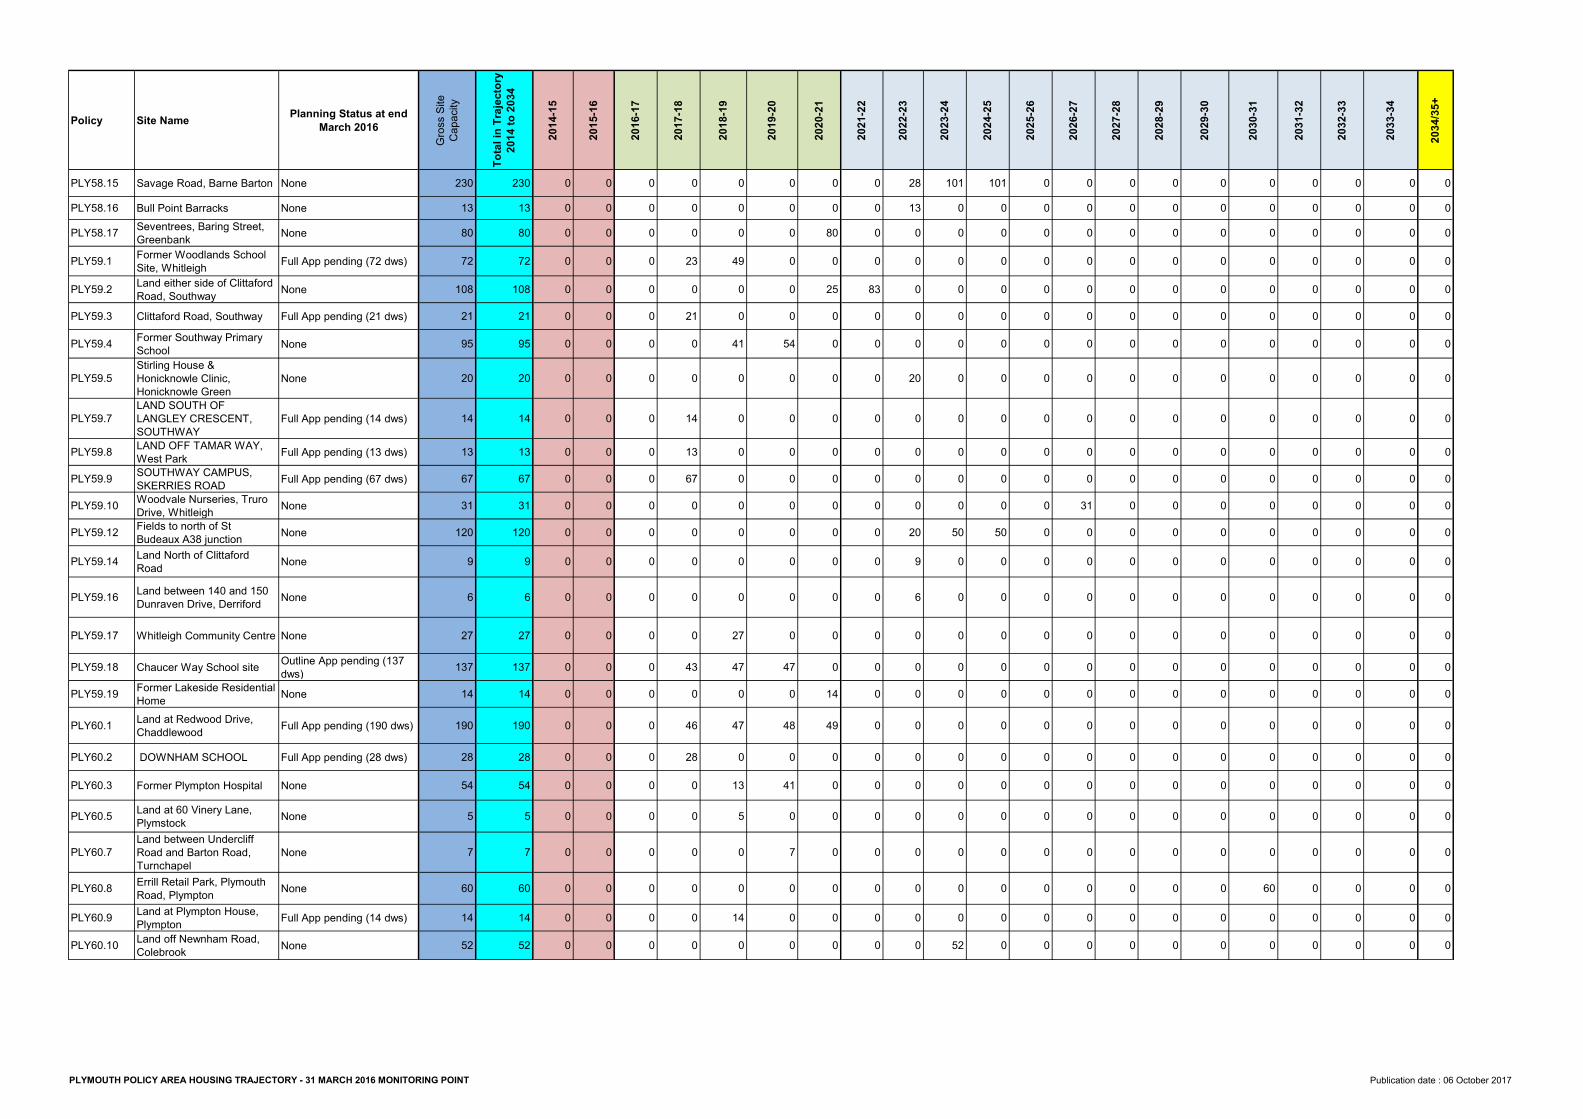
PLY58.15 Savage Road, Barne Barton None 230 230 0 0 0 0 0 0 0 0 28 101 101 0 0 0 0 0 0 0 0 0 0PLY58.16 Bull Point Barracks None 13 13 0 0 0 0 0 0 0 0 13 0 0 0 0 0 0 0 0 0 0 0 0PLY58.17 Seventrees, Baring Street,
Greenbank None 80 80 0 0 0 0 0 0 80 0 0 0 0 0 0 0 0 0 0 0 0 0 0PLY59.1 Former Woodlands School
Site, Whitleigh Full App pending (72 dws) 72 72 0 0 0 23 49 0 0 0 0 0 0 0 0 0 0 0 0 0 0 0 0PLY59.2 Land either side of Clittaford
Road, Southway None 108 108 0 0 0 0 0 0 25 83 0 0 0 0 0 0 0 0 0 0 0 0 0PLY59.3 Clittaford Road, Southway Full App pending (21 dws) 21 21 0 0 0 21 0 0 0 0 0 0 0 0 0 0 0 0 0 0 0 0 0PLY59.4 Former Southway Primary
School None 95 95 0 0 0 0 41 54 0 0 0 0 0 0 0 0 0 0 0 0 0 0 0
PLY59.5Stirling House & Honicknowle Clinic, Honicknowle Green
None 20 20 0 0 0 0 0 0 0 0 20 0 0 0 0 0 0 0 0 0 0 0 0
PLY59.7LAND SOUTH OF LANGLEY CRESCENT, SOUTHWAY
Full App pending (14 dws) 14 14 0 0 0 14 0 0 0 0 0 0 0 0 0 0 0 0 0 0 0 0 0
PLY59.8 LAND OFF TAMAR WAY, West Park Full App pending (13 dws) 13 13 0 0 0 13 0 0 0 0 0 0 0 0 0 0 0 0 0 0 0 0 0
PLY59.9 SOUTHWAY CAMPUS, SKERRIES ROAD Full App pending (67 dws) 67 67 0 0 0 67 0 0 0 0 0 0 0 0 0 0 0 0 0 0 0 0 0
PLY59.10 Woodvale Nurseries, Truro Drive, Whitleigh None 31 31 0 0 0 0 0 0 0 0 0 0 0 0 31 0 0 0 0 0 0 0 0
PLY59.12 Fields to north of St Budeaux A38 junction None 120 120 0 0 0 0 0 0 0 0 20 50 50 0 0 0 0 0 0 0 0 0 0
PLY59.14 Land North of Clittaford Road None 9 9 0 0 0 0 0 0 0 0 9 0 0 0 0 0 0 0 0 0 0 0 0
PLY59.16 Land between 140 and 150 Dunraven Drive, Derriford None 6 6 0 0 0 0 0 0 0 0 6 0 0 0 0 0 0 0 0 0 0 0 0
PLY59.17 Whitleigh Community Centre None 27 27 0 0 0 0 27 0 0 0 0 0 0 0 0 0 0 0 0 0 0 0 0
PLY59.18 Chaucer Way School site Outline App pending (137 dws) 137 137 0 0 0 43 47 47 0 0 0 0 0 0 0 0 0 0 0 0 0 0 0
PLY59.19 Former Lakeside Residential Home None 14 14 0 0 0 0 0 0 14 0 0 0 0 0 0 0 0 0 0 0 0 0 0
PLY60.1 Land at Redwood Drive, Chaddlewood Full App pending (190 dws) 190 190 0 0 0 46 47 48 49 0 0 0 0 0 0 0 0 0 0 0 0 0 0
PLY60.2 DOWNHAM SCHOOL Full App pending (28 dws) 28 28 0 0 0 28 0 0 0 0 0 0 0 0 0 0 0 0 0 0 0 0 0PLY60.3 Former Plympton Hospital None 54 54 0 0 0 0 13 41 0 0 0 0 0 0 0 0 0 0 0 0 0 0 0PLY60.5 Land at 60 Vinery Lane,
Plymstock None 5 5 0 0 0 0 5 0 0 0 0 0 0 0 0 0 0 0 0 0 0 0 0
PLY60.7Land between Undercliff Road and Barton Road, Turnchapel
None 7 7 0 0 0 0 0 7 0 0 0 0 0 0 0 0 0 0 0 0 0 0 0
PLY60.8 Errill Retail Park, Plymouth Road, Plympton None 60 60 0 0 0 0 0 0 0 0 0 0 0 0 0 0 0 0 60 0 0 0 0
PLY60.9 Land at Plympton House, Plympton Full App pending (14 dws) 14 14 0 0 0 0 14 0 0 0 0 0 0 0 0 0 0 0 0 0 0 0 0
PLY60.10 Land off Newnham Road, Colebrook None 52 52 0 0 0 0 0 0 0 0 0 52 0 0 0 0 0 0 0 0 0 0 0
PLYMOUTH POLICY AREA HOUSING TRAJECTORY - 31 MARCH 2016 MONITORING POINT Publication date : 06 October 2017
Policy Site Name Planning Status at end March 2016
Gross
Site
Capac
ity
Total
in Tr
ajecto
ry
2014 t
o 2034
2014-1
5
2015-1
6
2016-1
7
2017-1
8
2018-1
9
2019-2
0
2020-2
1
2021-2
2
2022-2
3
2023-2
4
2024-2
5
2025-2
6
2026-2
7
2027-2
8
2028-2
9
2029-3
0
2030-3
1
2031-3
2
2032-3
3
2033-3
4
2034/3
5+
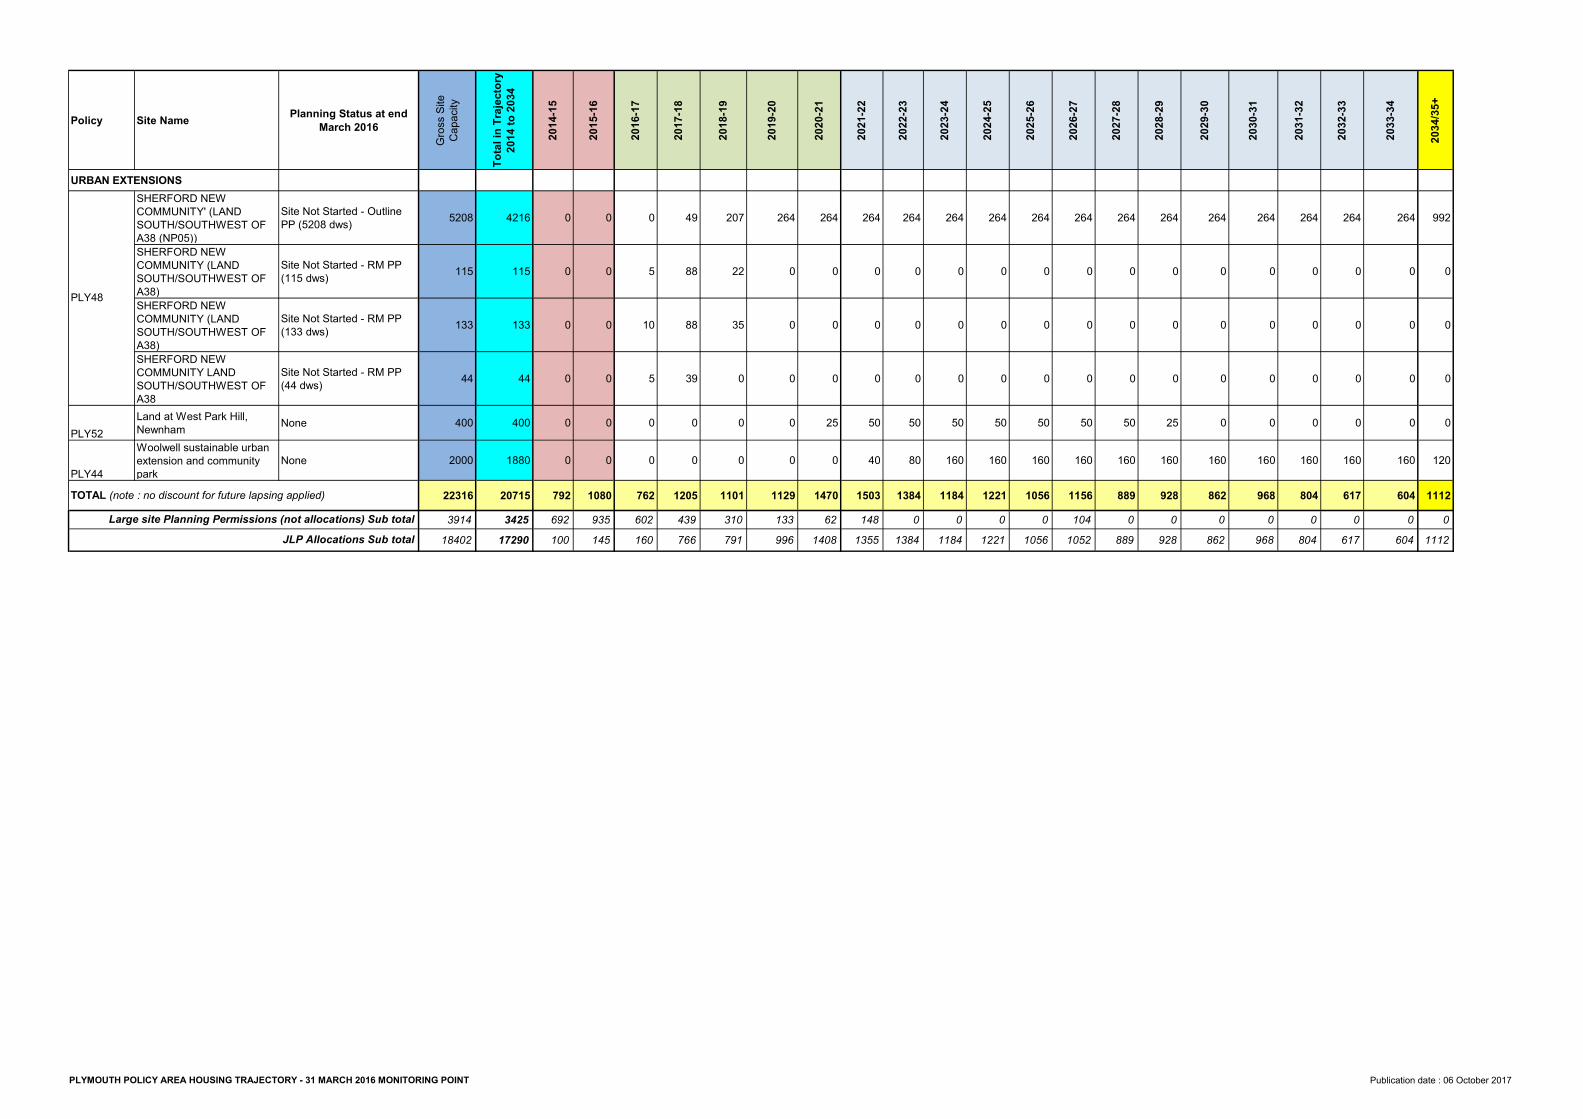
URBAN EXTENSIONSSHERFORD NEW COMMUNITY' (LAND SOUTH/SOUTHWEST OF A38 (NP05))
Site Not Started - Outline PP (5208 dws) 5208 4216 0 0 0 49 207 264 264 264 264 264 264 264 264 264 264 264 264 264 264 264 992
SHERFORD NEW COMMUNITY (LAND SOUTH/SOUTHWEST OF A38)
Site Not Started - RM PP (115 dws) 115 115 0 0 5 88 22 0 0 0 0 0 0 0 0 0 0 0 0 0 0 0 0
SHERFORD NEW COMMUNITY (LAND SOUTH/SOUTHWEST OF A38)
Site Not Started - RM PP (133 dws) 133 133 0 0 10 88 35 0 0 0 0 0 0 0 0 0 0 0 0 0 0 0 0
SHERFORD NEW COMMUNITY LAND SOUTH/SOUTHWEST OF A38
Site Not Started - RM PP (44 dws) 44 44 0 0 5 39 0 0 0 0 0 0 0 0 0 0 0 0 0 0 0 0 0
PLY52Land at West Park Hill, Newnham None 400 400 0 0 0 0 0 0 25 50 50 50 50 50 50 50 25 0 0 0 0 0 0
PLY44Woolwell sustainable urban extension and community park
None 2000 1880 0 0 0 0 0 0 0 40 80 160 160 160 160 160 160 160 160 160 160 160 120
22316 20715 792 1080 762 1205 1101 1129 1470 1503 1384 1184 1221 1056 1156 889 928 862 968 804 617 604 11123914 3425 692 935 602 439 310 133 62 148 0 0 0 0 104 0 0 0 0 0 0 0 0
18402 17290 100 145 160 766 791 996 1408 1355 1384 1184 1221 1056 1052 889 928 862 968 804 617 604 1112
TOTAL (note : no discount for future lapsing applied)
PLY48
Large site Planning Permissions (not allocations) Sub totalJLP Allocations Sub total
PLYMOUTH POLICY AREA HOUSING TRAJECTORY - 31 MARCH 2016 MONITORING POINT Publication date : 06 October 2017
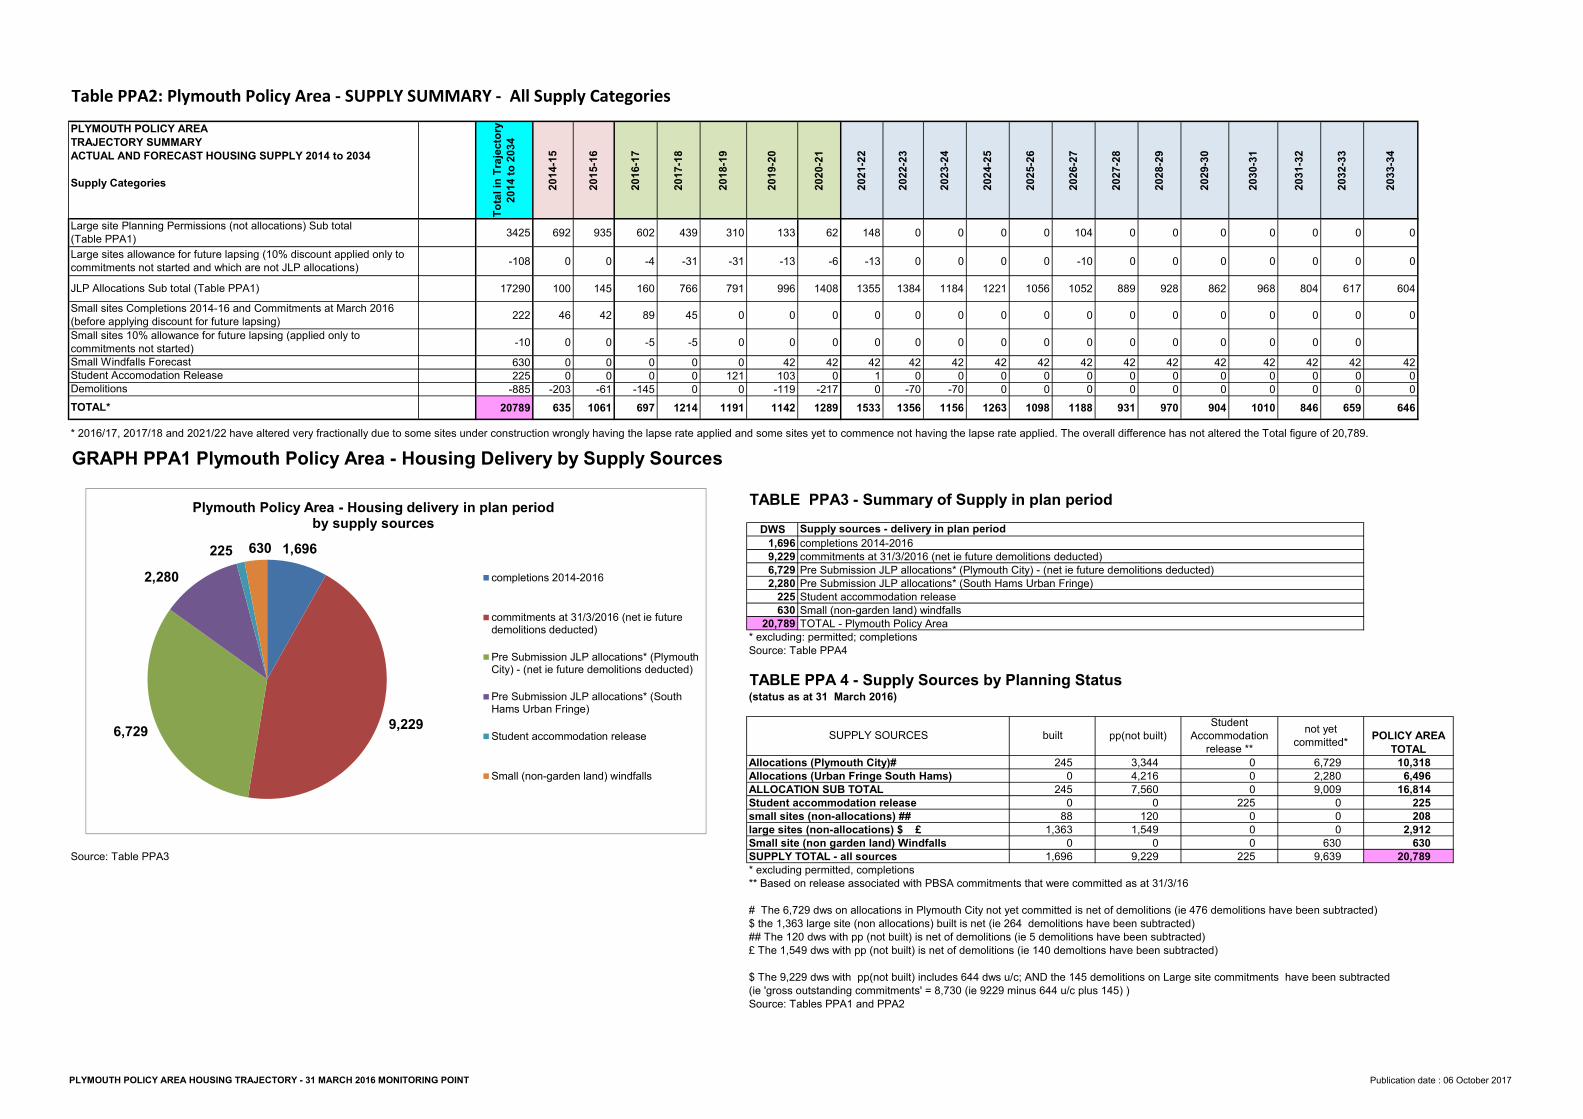
Table PPA2: Plymouth Policy Area - SUPPLY SUMMARY - All Supply Categories
Total
in Tr
ajecto
ry
2014 t
o 2034
2014-1
5
2015-1
6
2016-1
7
2017-1
8
2018-1
9
2019-2
0
2020-2
1
2021-2
2
2022-2
3
2023-2
4
2024-2
5
2025-2
6
2026-2
7
2027-2
8
2028-2
9
2029-3
0
2030-3
1
2031-3
2
2032-3
3
2033-3
4
3425 692 935 602 439 310 133 62 148 0 0 0 0 104 0 0 0 0 0 0 0-108 0 0 -4 -31 -31 -13 -6 -13 0 0 0 0 -10 0 0 0 0 0 0 0
17290 100 145 160 766 791 996 1408 1355 1384 1184 1221 1056 1052 889 928 862 968 804 617 604222 46 42 89 45 0 0 0 0 0 0 0 0 0 0 0 0 0 0 0 0
-10 0 0 -5 -5 0 0 0 0 0 0 0 0 0 0 0 0 0 0 0630 0 0 0 0 0 42 42 42 42 42 42 42 42 42 42 42 42 42 42 42225 0 0 0 0 121 103 0 1 0 0 0 0 0 0 0 0 0 0 0 0
-885 -203 -61 -145 0 0 -119 -217 0 -70 -70 0 0 0 0 0 0 0 0 0 020789 635 1061 697 1214 1191 1142 1289 1533 1356 1156 1263 1098 1188 931 970 904 1010 846 659 646
GRAPH PPA1 Plymouth Policy Area - Housing Delivery by Supply SourcesTABLE PPA3 - Summary of Supply in plan period
DWS1,6969,2296,7292,280
225630
20,789Source: Table PPA4
TABLE PPA 4 - Supply Sources by Planning Status (status as at 31 March 2016)
Source: Table PPA3* excluding permitted, completions** Based on release associated with PBSA commitments that were committed as at 31/3/16
$ the 1,363 large site (non allocations) built is net (ie 264 demolitions have been subtracted)## The 120 dws with pp (not built) is net of demolitions (ie 5 demolitions have been subtracted)£ The 1,549 dws with pp (not built) is net of demolitions (ie 140 demoltions have been subtracted)
(ie 'gross outstanding commitments' = 8,730 (ie 9229 minus 644 u/c plus 145) )Source: Tables PPA1 and PPA2
00
2250
Small site (non garden land) Windfalls
Allocations (Plymouth City)#Allocations (Urban Fringe South Hams)
Student Accommodation
release **
PLYMOUTH POLICY AREATRAJECTORY SUMMARYACTUAL AND FORECAST HOUSING SUPPLY 2014 to 2034 Supply Categories
Large sites allowance for future lapsing (10% discount applied only to commitments not started and which are not JLP allocations)
Small sites Completions 2014-16 and Commitments at March 2016 (before applying discount for future lapsing)Small sites 10% allowance for future lapsing (applied only to commitments not started)Small Windfalls Forecast
TOTAL*
Student Accomodation ReleaseDemolitions
POLICY AREA TOTAL
2450
245
SUPPLY TOTAL - all sources
088
Pre Submission JLP allocations* (South Hams Urban Fringe)Student accommodation releaseSmall (non-garden land) windfallsTOTAL - Plymouth Policy Area
* excluding: permitted; completions
ALLOCATION SUB TOTALStudent accommodation releasesmall sites (non-allocations) ##large sites (non-allocations) $ £
* 2016/17, 2017/18 and 2021/22 have altered very fractionally due to some sites under construction wrongly having the lapse rate applied and some sites yet to commence not having the lapse rate applied. The overall difference has not altered the Total figure of 20,789.
2,912630
20,789
SUPPLY SOURCES10,318
6,496
Large site Planning Permissions (not allocations) Sub total (Table PPA1)
Pre Submission JLP allocations* (Plymouth City) - (net ie future demolitions deducted)
Supply sources - delivery in plan periodcompletions 2014-2016commitments at 31/3/2016 (net ie future demolitions deducted)
$ The 9,229 dws with pp(not built) includes 644 dws u/c; AND the 145 demolitions on Large site commitments have been subtracted
# The 6,729 dws on allocations in Plymouth City not yet committed is net of demolitions (ie 476 demolitions have been subtracted)
16,814225208
00
225
6,7299,009
000
6309,639
0
not yet committed*
1,3630
1,696
7,5603,3444,216
0120
1,5490
9,229
2,280
built pp(not built)
JLP Allocations Sub total (Table PPA1)
1,696
9,2296,729
2,280225 630
Plymouth Policy Area - Housing delivery in plan period by supply sources
completions 2014-2016
commitments at 31/3/2016 (net ie futuredemolitions deducted)Pre Submission JLP allocations* (PlymouthCity) - (net ie future demolitions deducted)Pre Submission JLP allocations* (SouthHams Urban Fringe)Student accommodation release
Small (non-garden land) windfalls
PLYMOUTH POLICY AREA HOUSING TRAJECTORY - 31 MARCH 2016 MONITORING POINT Publication date : 06 October 2017
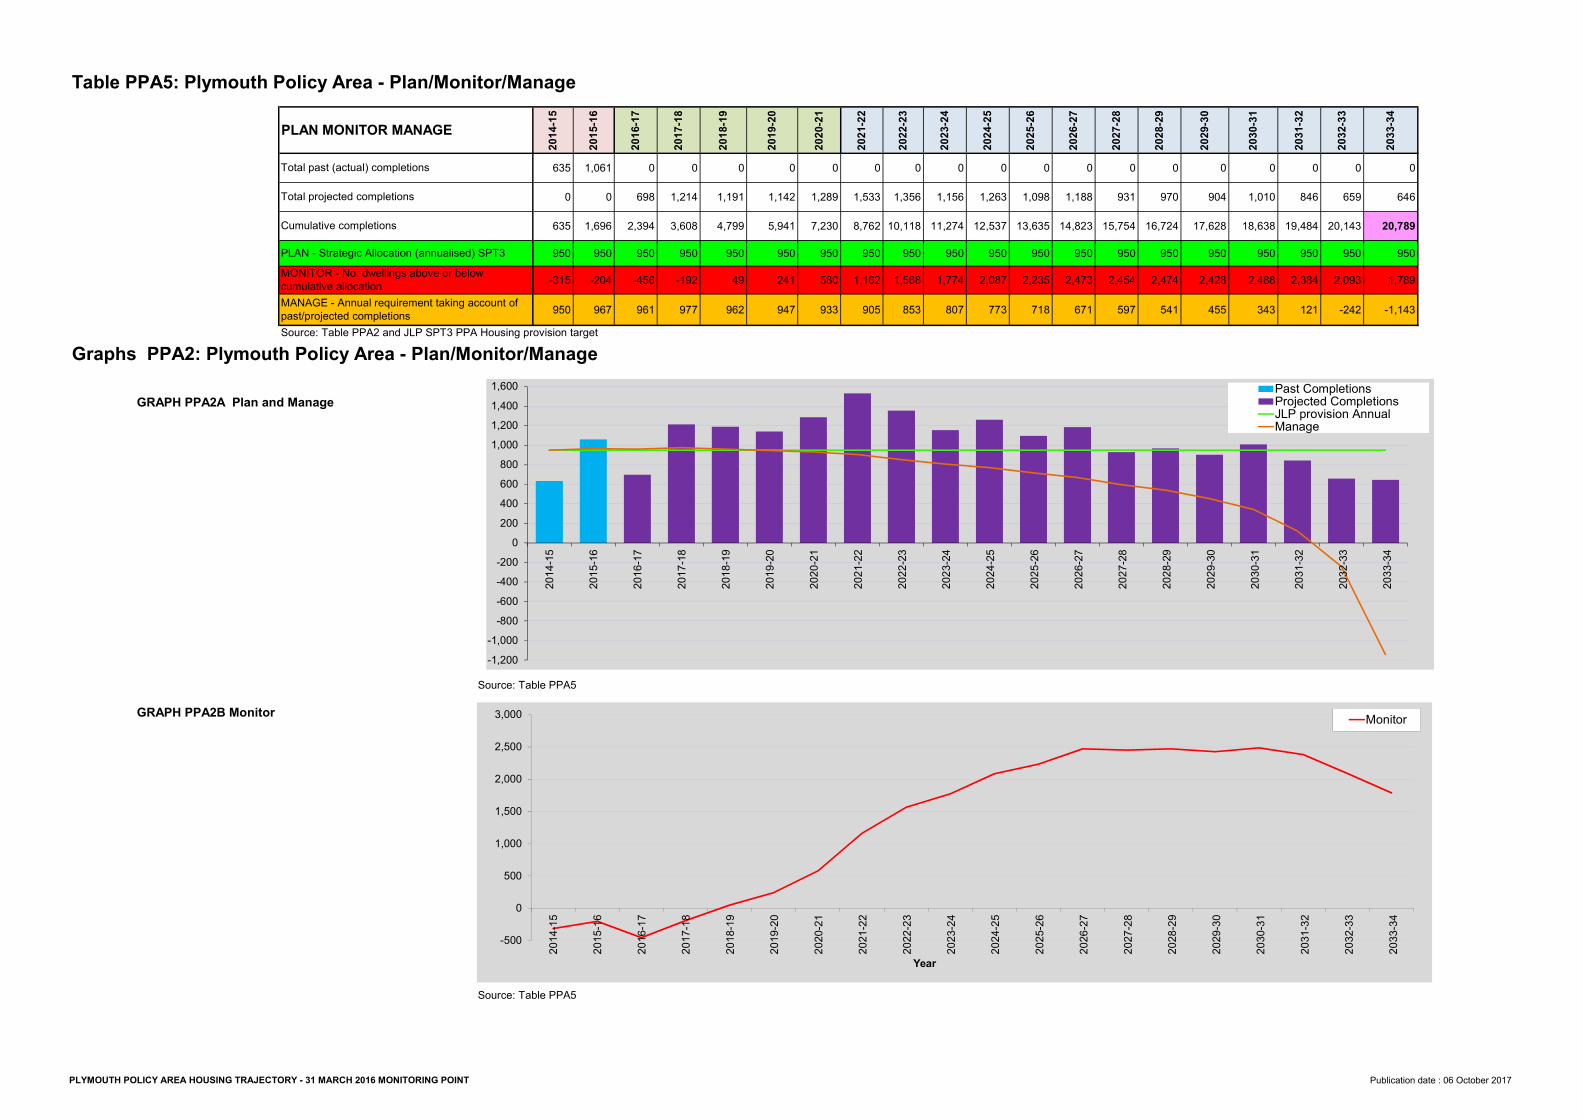
Table PPA5: Plymouth Policy Area - Plan/Monitor/Manage
2014-1
5
2015-1
6
2016-1
7
2017-1
8
2018-1
9
2019-2
0
2020-2
1
2021-2
2
2022-2
3
2023-2
4
2024-2
5
2025-2
6
2026-2
7
2027-2
8
2028-2
9
2029-3
0
2030-3
1
2031-3
2
2032-3
3
2033-3
4
635 1,061 0 0 0 0 0 0 0 0 0 0 0 0 0 0 0 0 0 00 0 698 1,214 1,191 1,142 1,289 1,533 1,356 1,156 1,263 1,098 1,188 931 970 904 1,010 846 659 646
635 1,696 2,394 3,608 4,799 5,941 7,230 8,762 10,118 11,274 12,537 13,635 14,823 15,754 16,724 17,628 18,638 19,484 20,143 20,789950 950 950 950 950 950 950 950 950 950 950 950 950 950 950 950 950 950 950 950
-315 -204 -456 -192 49 241 580 1,162 1,568 1,774 2,087 2,235 2,473 2,454 2,474 2,428 2,488 2,384 2,093 1,789950 967 961 977 962 947 933 905 853 807 773 718 671 597 541 455 343 121 -242 -1,143
Source: Table PPA2 and JLP SPT3 PPA Housing provision targetGraphs PPA2: Plymouth Policy Area - Plan/Monitor/Manage
GRAPH PPA2A Plan and Manage
Source: Table PPA5GRAPH PPA2B Monitor
Source: Table PPA5
Total projected completionsCumulative completionsPLAN - Strategic Allocation (annualised) SPT3MONITOR - No. dwellings above or below cumulative allocationMANAGE - Annual requirement taking account of past/projected completions
PLAN MONITOR MANAGETotal past (actual) completions
-1,200-1,000
-800-600-400-200
0200400600800
1,0001,2001,4001,600
2014-1
5
2015-1
6
2016-1
7
2017-1
8
2018-1
9
2019-2
0
2020-2
1
2021-2
2
2022-2
3
2023-2
4
2024-2
5
2025-2
6
2026-2
7
2027-2
8
2028-2
9
2029-3
0
2030-3
1
2031-3
2
2032-3
3
2033-3
4
Past CompletionsProjected CompletionsJLP provision AnnualManage
-500
0
500
1,000
1,500
2,000
2,500
3,000
2014-1
5
2015-1
6
2016-1
7
2017-1
8
2018-1
9
2019-2
0
2020-2
1
2021-2
2
2022-2
3
2023-2
4
2024-2
5
2025-2
6
2026-2
7
2027-2
8
2028-2
9
2029-3
0
2030-3
1
2031-3
2
2032-3
3
2033-3
4
Year
Monitor
PLYMOUTH POLICY AREA HOUSING TRAJECTORY - 31 MARCH 2016 MONITORING POINT Publication date : 06 October 2017
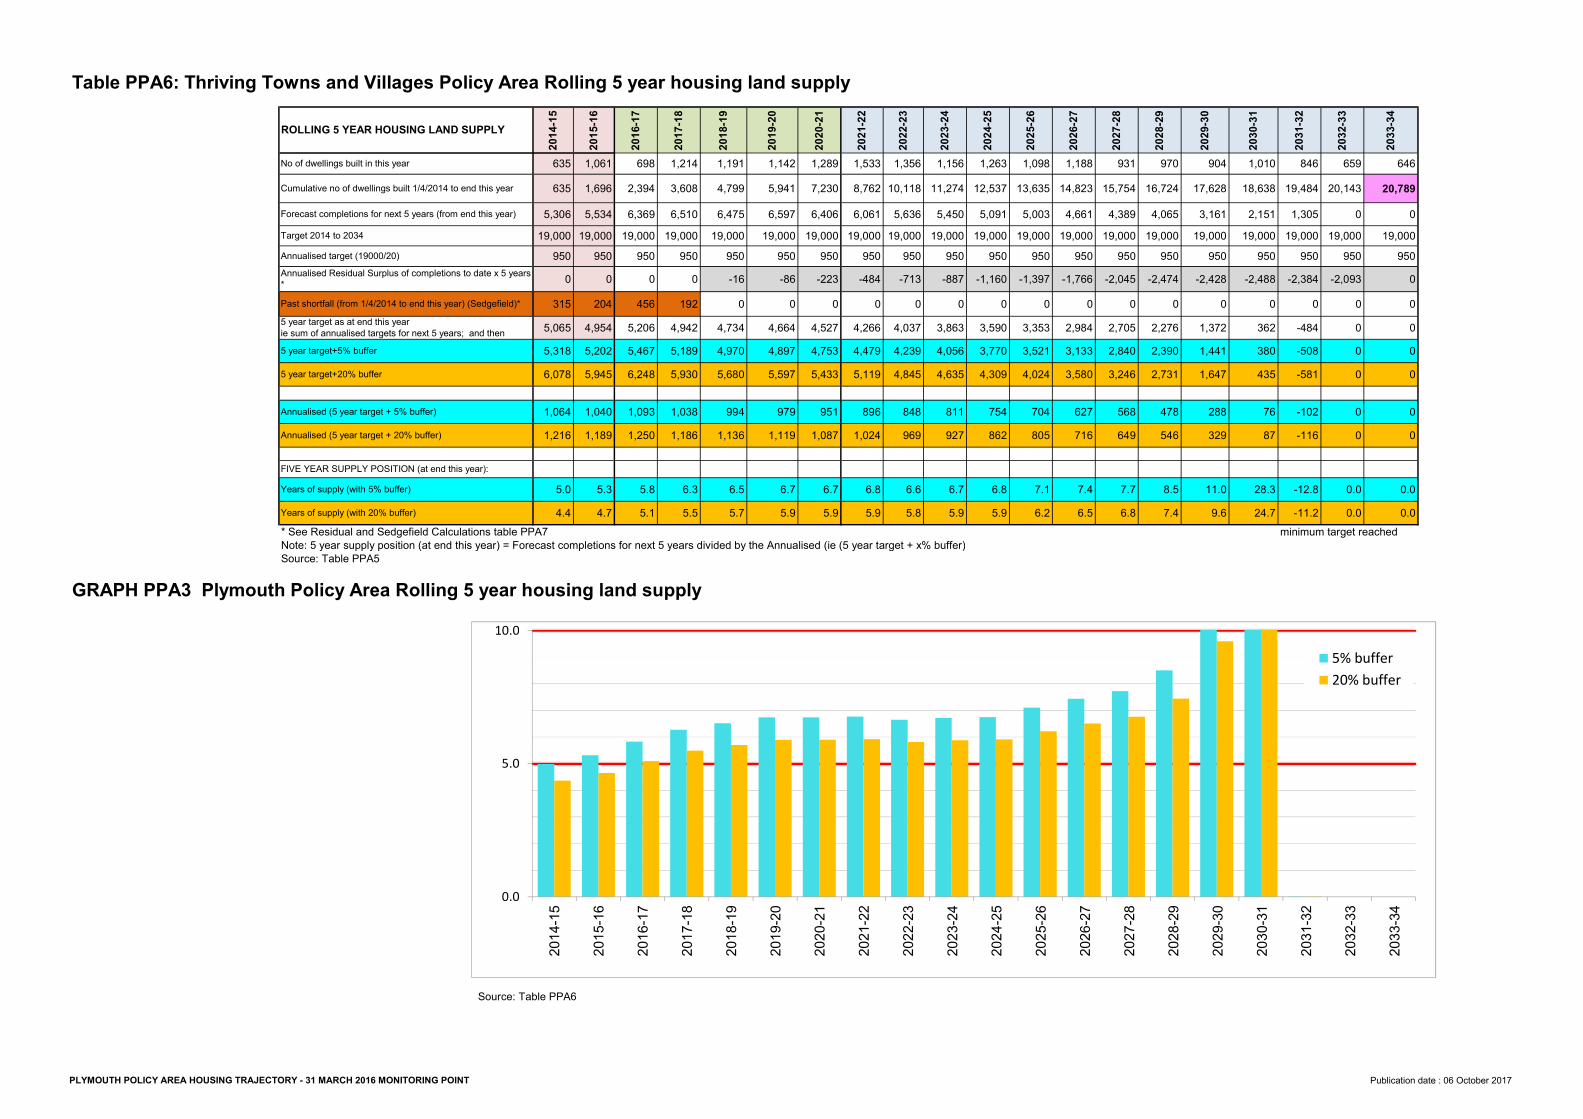
Table PPA6: Thriving Towns and Villages Policy Area Rolling 5 year housing land supply
2014-1
5
2015-1
6
2016-1
7
2017-1
8
2018-1
9
2019-2
0
2020-2
1
2021-2
2
2022-2
3
2023-2
4
2024-2
5
2025-2
6
2026-2
7
2027-2
8
2028-2
9
2029-3
0
2030-3
1
2031-3
2
2032-3
3
2033-3
4
635 1,061 698 1,214 1,191 1,142 1,289 1,533 1,356 1,156 1,263 1,098 1,188 931 970 904 1,010 846 659 646635 1,696 2,394 3,608 4,799 5,941 7,230 8,762 10,118 11,274 12,537 13,635 14,823 15,754 16,724 17,628 18,638 19,484 20,143 20,789
5,306 5,534 6,369 6,510 6,475 6,597 6,406 6,061 5,636 5,450 5,091 5,003 4,661 4,389 4,065 3,161 2,151 1,305 0 019,000 19,000 19,000 19,000 19,000 19,000 19,000 19,000 19,000 19,000 19,000 19,000 19,000 19,000 19,000 19,000 19,000 19,000 19,000 19,000
950 950 950 950 950 950 950 950 950 950 950 950 950 950 950 950 950 950 950 9500 0 0 0 -16 -86 -223 -484 -713 -887 -1,160 -1,397 -1,766 -2,045 -2,474 -2,428 -2,488 -2,384 -2,093 0
315 204 456 192 0 0 0 0 0 0 0 0 0 0 0 0 0 0 0 05,065 4,954 5,206 4,942 4,734 4,664 4,527 4,266 4,037 3,863 3,590 3,353 2,984 2,705 2,276 1,372 362 -484 0 05,318 5,202 5,467 5,189 4,970 4,897 4,753 4,479 4,239 4,056 3,770 3,521 3,133 2,840 2,390 1,441 380 -508 0 06,078 5,945 6,248 5,930 5,680 5,597 5,433 5,119 4,845 4,635 4,309 4,024 3,580 3,246 2,731 1,647 435 -581 0 0
1,064 1,040 1,093 1,038 994 979 951 896 848 811 754 704 627 568 478 288 76 -102 0 01,216 1,189 1,250 1,186 1,136 1,119 1,087 1,024 969 927 862 805 716 649 546 329 87 -116 0 0
5.0 5.3 5.8 6.3 6.5 6.7 6.7 6.8 6.6 6.7 6.8 7.1 7.4 7.7 8.5 11.0 28.3 -12.8 0.0 0.04.4 4.7 5.1 5.5 5.7 5.9 5.9 5.9 5.8 5.9 5.9 6.2 6.5 6.8 7.4 9.6 24.7 -11.2 0.0 0.0
* See Residual and Sedgefield Calculations table PPA7 minimum target reachedNote: 5 year supply position (at end this year) = Forecast completions for next 5 years divided by the Annualised (ie (5 year target + x% buffer)Source: Table PPA5
GRAPH PPA3 Plymouth Policy Area Rolling 5 year housing land supply
Source: Table PPA6
Years of supply (with 5% buffer)Years of supply (with 20% buffer)
No of dwellings built in this yearCumulative no of dwellings built 1/4/2014 to end this yearForecast completions for next 5 years (from end this year)Target 2014 to 2034Annualised target (19000/20)Annualised Residual Surplus of completions to date x 5 years *Past shortfall (from 1/4/2014 to end this year) (Sedgefield)*5 year target as at end this year ie sum of annualised targets for next 5 years; and then 5 year target+5% buffer5 year target+20% buffer
Annualised (5 year target + 5% buffer)Annualised (5 year target + 20% buffer)
FIVE YEAR SUPPLY POSITION (at end this year):
ROLLING 5 YEAR HOUSING LAND SUPPLY
0.0
5.0
10.0
2014-1
5
2015-1
6
2016-1
7
2017-1
8
2018-1
9
2019-2
0
2020-2
1
2021-2
2
2022-2
3
2023-2
4
2024-2
5
2025-2
6
2026-2
7
2027-2
8
2028-2
9
2029-3
0
2030-3
1
2031-3
2
2032-3
3
2033-3
4
5% buffer20% buffer
PLYMOUTH POLICY AREA HOUSING TRAJECTORY - 31 MARCH 2016 MONITORING POINT Publication date : 06 October 2017
2014/152015/162016/172017/182018/192019/202020/21 O2021/22
2022/232023/242024/252025/262026/272027/282028/292029/302030/312031/322032/332033/34
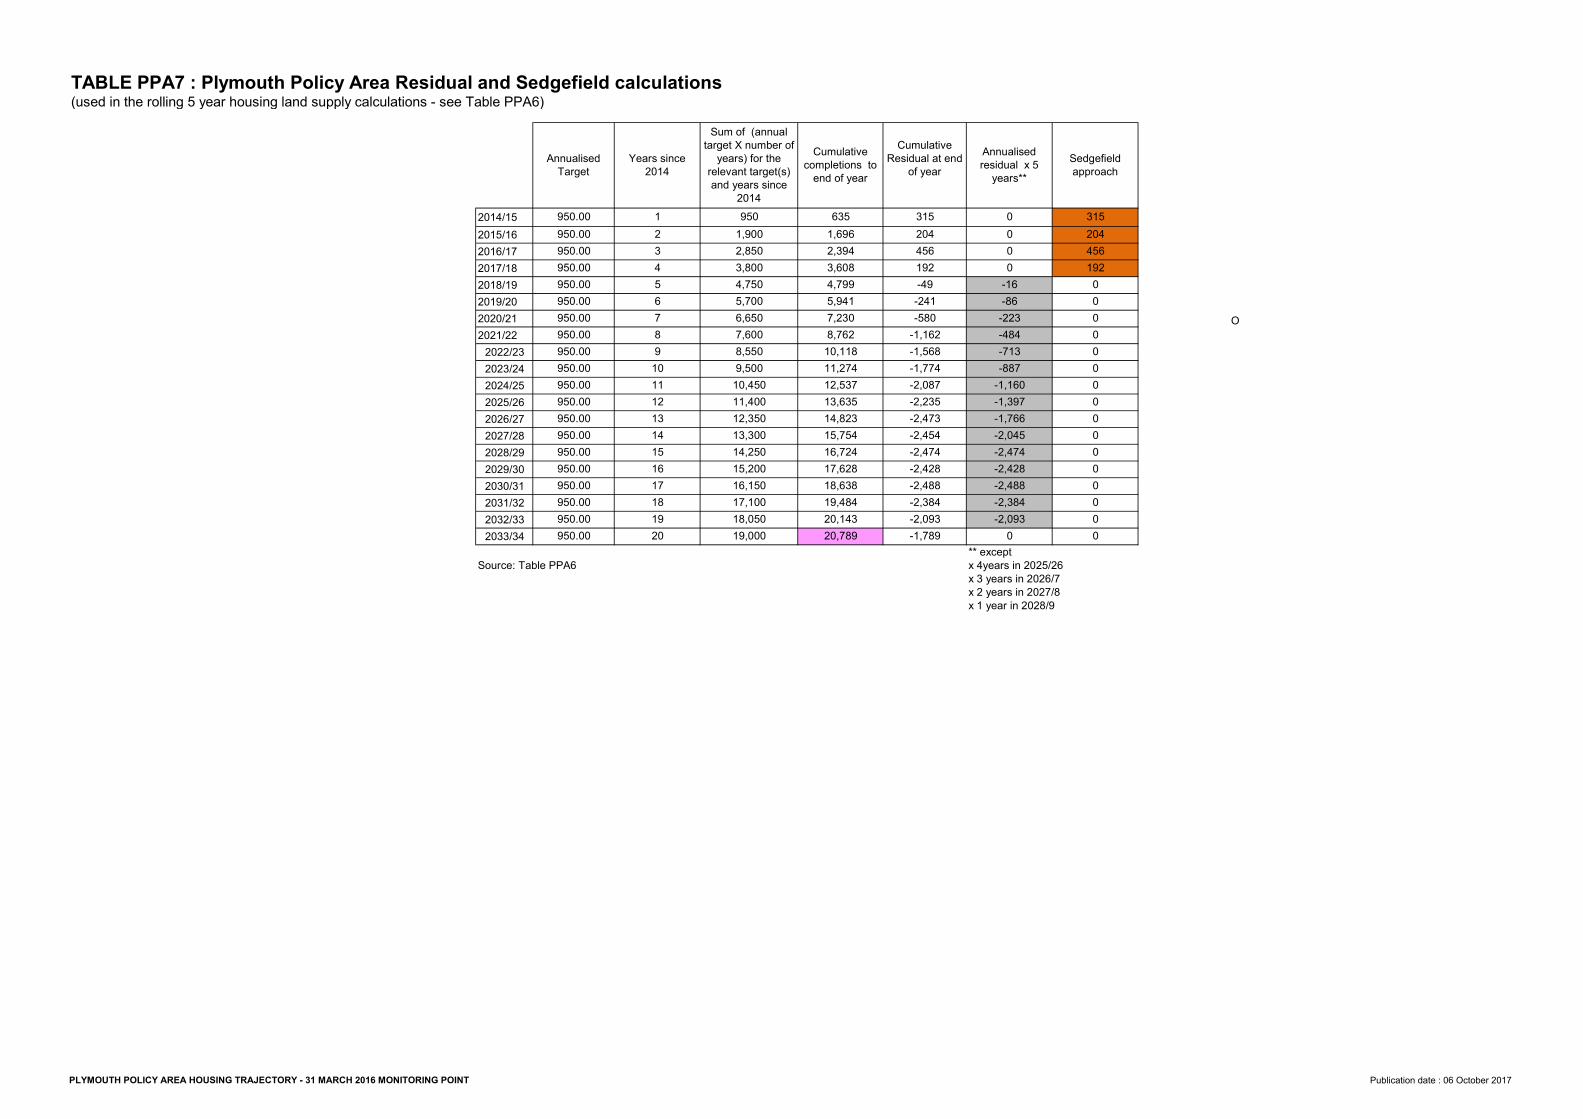
** except Source: Table PPA6 x 4years in 2025/26
x 3 years in 2026/7x 2 years in 2027/8x 1 year in 2028/9
TABLE PPA7 : Plymouth Policy Area Residual and Sedgefield calculations (used in the rolling 5 year housing land supply calculations - see Table PPA6)
Annualised Target
Years since 2014
Sum of (annual target X number of
years) for the relevant target(s) and years since
2014
Cumulative completions to
end of year
Cumulative Residual at end
of yearAnnualised residual x 5
years** Sedgefield approach
950.00 315 0
950.00950.00950.00950.00
987
2,3941,696635
0 204315
456
950.00
12
6543
2019181716151413121110
950.00950.00950.00950.00950.00950.00950.00950.00950.00
950.00950.00950.00950.00950.00
16,15015,20014,25013,30012,35011,400
19,00018,05017,100
4,7503,8002,8501,900950
10,4509,5008,5507,6006,6505,700
456204
-2,473-2,235-2,087-1,774-1,568-1,162
-1,789-2,093-2,384-2,488-2,428-2,474-2,454
5,9414,7993,608
18,63817,62816,72415,75414,82313,63512,53711,27410,1188,7627,230
-2,045-1,766-1,397
20,78920,14319,484
-580-241-49192
-1,160-887-713-484-223-86-1600
0-2,093
0000000000000000
192
-2,384-2,488-2,428-2,474
PLYMOUTH POLICY AREA HOUSING TRAJECTORY - 31 MARCH 2016 MONITORING POINT Publication date : 06 October 2017
FORMER MOD SITE, MOUNT WISE
FORMER COMMUNITY CENTRE, DUXFORD CLOSESOUTH TRELAWNY PRIMARY SCHOOL, JEDBURGH CRESCENTSt Dunstan's Abbey School, Craigie DriveFORMER PLYM VIEW PRIMARY SCHOOLFORMER SPORTS GROUND, HARWELL STREETUNITY PARK, EFFORD ROADPLOT A1, BRUNEL WAY, MILLBAYNORTH PROSPECT SCHEME, WOODHEY ROAD
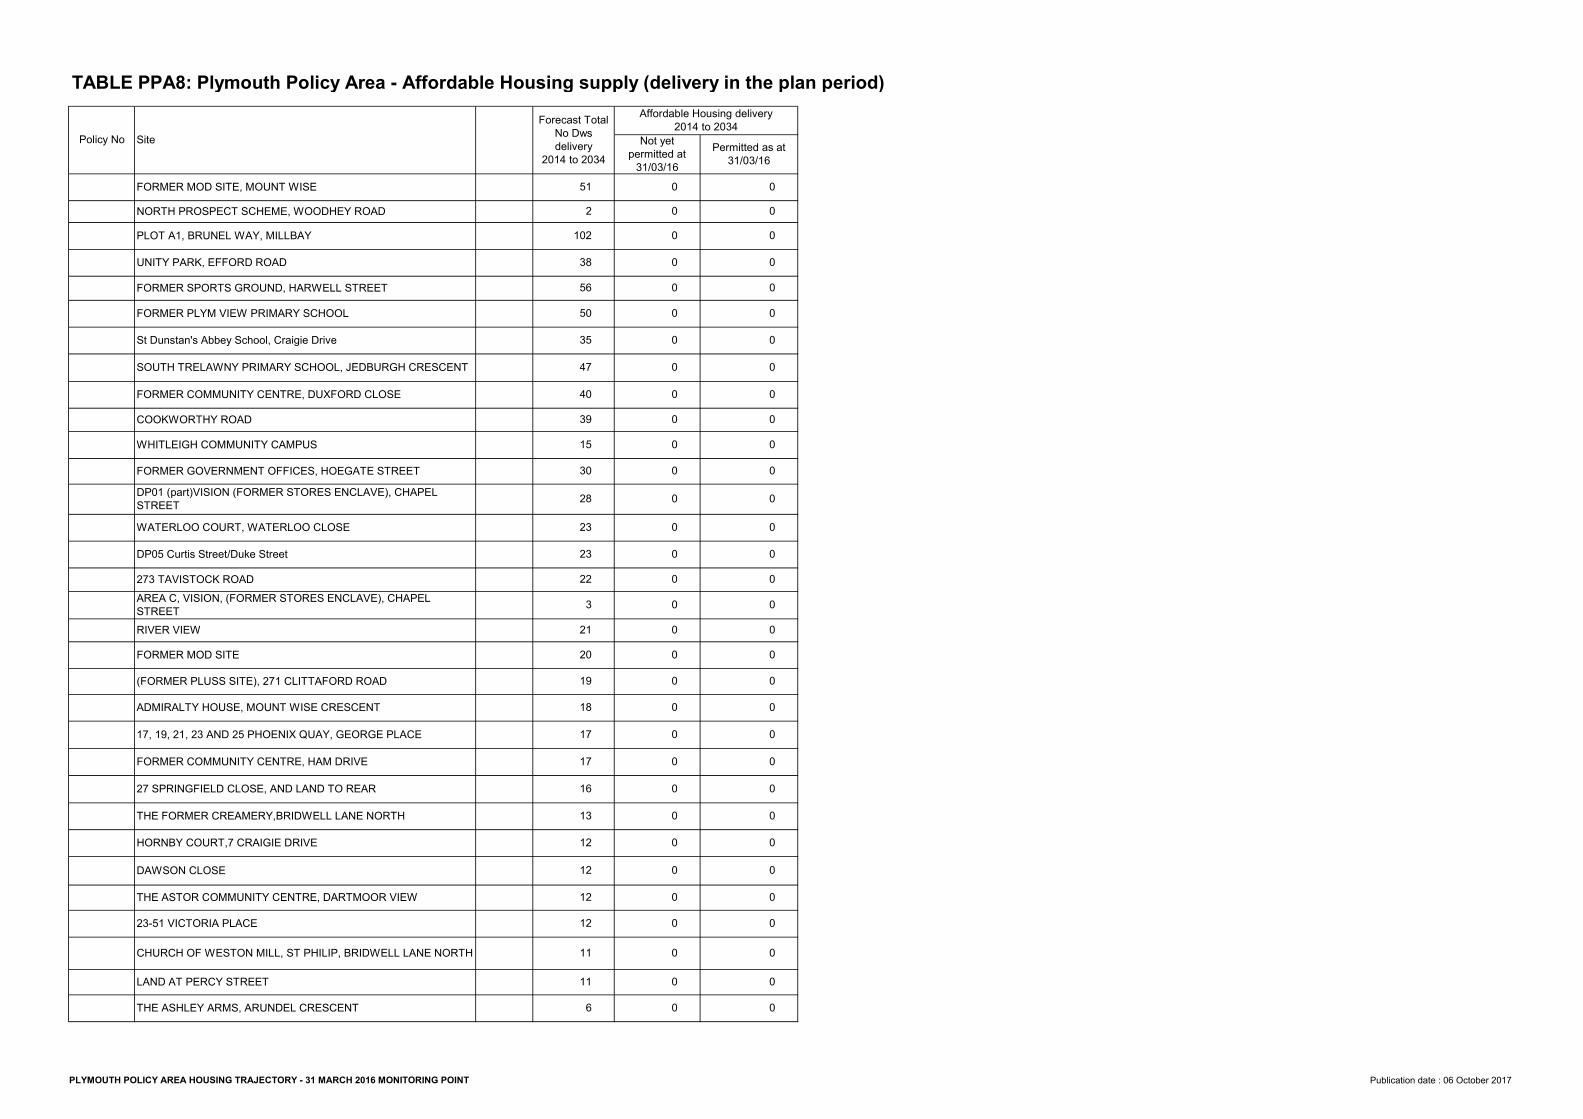
TABLE PPA8: Plymouth Policy Area - Affordable Housing supply (delivery in the plan period)
Policy No Site Forecast Total
No Dws delivery
2014 to 2034
Affordable Housing delivery 2014 to 2034
Not yet permitted at
31/03/16Permitted as at
31/03/16
DAWSON CLOSE
THE ASHLEY ARMS, ARUNDEL CRESCENTLAND AT PERCY STREETCHURCH OF WESTON MILL, ST PHILIP, BRIDWELL LANE NORTH23-51 VICTORIA PLACETHE ASTOR COMMUNITY CENTRE, DARTMOOR VIEW
WHITLEIGH COMMUNITY CAMPUSCOOKWORTHY ROAD
HORNBY COURT,7 CRAIGIE DRIVETHE FORMER CREAMERY,BRIDWELL LANE NORTH27 SPRINGFIELD CLOSE, AND LAND TO REARFORMER COMMUNITY CENTRE, HAM DRIVE17, 19, 21, 23 AND 25 PHOENIX QUAY, GEORGE PLACEADMIRALTY HOUSE, MOUNT WISE CRESCENT(FORMER PLUSS SITE), 271 CLITTAFORD ROADFORMER MOD SITERIVER VIEW
AREA C, VISION, (FORMER STORES ENCLAVE), CHAPEL STREET
273 TAVISTOCK ROADDP05 Curtis Street/Duke StreetWATERLOO COURT, WATERLOO CLOSE
DP01 (part)VISION (FORMER STORES ENCLAVE), CHAPEL STREET
FORMER GOVERNMENT OFFICES, HOEGATE STREET
4047355056
1718192021
1212131617
611111212
38102
251
39
3222323283015
000000000
0
000
0000000000000000000
0000000
00000000
0000
0000000000000
PLYMOUTH POLICY AREA HOUSING TRAJECTORY - 31 MARCH 2016 MONITORING POINT Publication date : 06 October 2017
LAND EAST AND WEST OF PENNYCROSS CLOSEWOODVILLE ROAD5 NELSON GARDENS1 FORD PARK ROADLAND OFF PLEASURE HILL CLOSE74 to 80 CROMWELL ROAD
BOSTONS BOAT YARD, BAYLYS ROADFORMER CIVIL SERVICE SPORTS CLUB, RECREATION ROAD
DP02 LAND AT GRANBY GREEN, WEST OF PARK AVENUE AND LAND AT GRANBY STREET, EAST OF PARK AVENUE
FORMER RUNWAY, PLYMOUTH CITY AIRPORT, PLYMBRIDGE LANE
FORMER HOOE LAKE QUARRY, LAND OFF BARTON ROAD
PHASE 3A, MOUNT WISELAND ADJACENT YARDLEY GARDENSGOODWIN CRESCENTLAND WEST OF CARADON CLOSESHERWELL HOUSE, 30 NORTH HILLFORMER SHIP HOSTEL, GEORGE PLACE
HILLTOP COMMUNITY CENTRE, CUNNINGHAM ROAD
FORMER PLYMOUTH PREPARATORY SCHOOL, BEECHFIELD GROVE
LAND OFF DOVER ROADTHE CORNWALL GATE, 71 NORMANDY WAYASTOR HOTEL,14 ELLIOT STREETFORMER TENNIS COURTS, HOE ROAD-PIER STREETAGATON FARM BUDSHEAD ROAD8 TO 10 WHIMPLE STREET
WEST PARK PRIMARY SCHOOL, WANSTEAD GROVEWEST PARK PRIMARY SCHOOL, WANSTEAD GROVEVISION ZONE G, CHAPEL STREETVISION ZONES J, K, M
DP01(part) VISION Zone G, FORMER STORES ENCLAVE, CHAPEL STRE
PLOT 10 ADJACENT TO WANSTEAD GROVE
3148655
72101175152209
4353
11
2818
68
111111
12
131414141415
1173359
0
000000000
0
00
000000000
000000000
000
936
029
00030
32174
0
0
014
000005
0
00
0
680
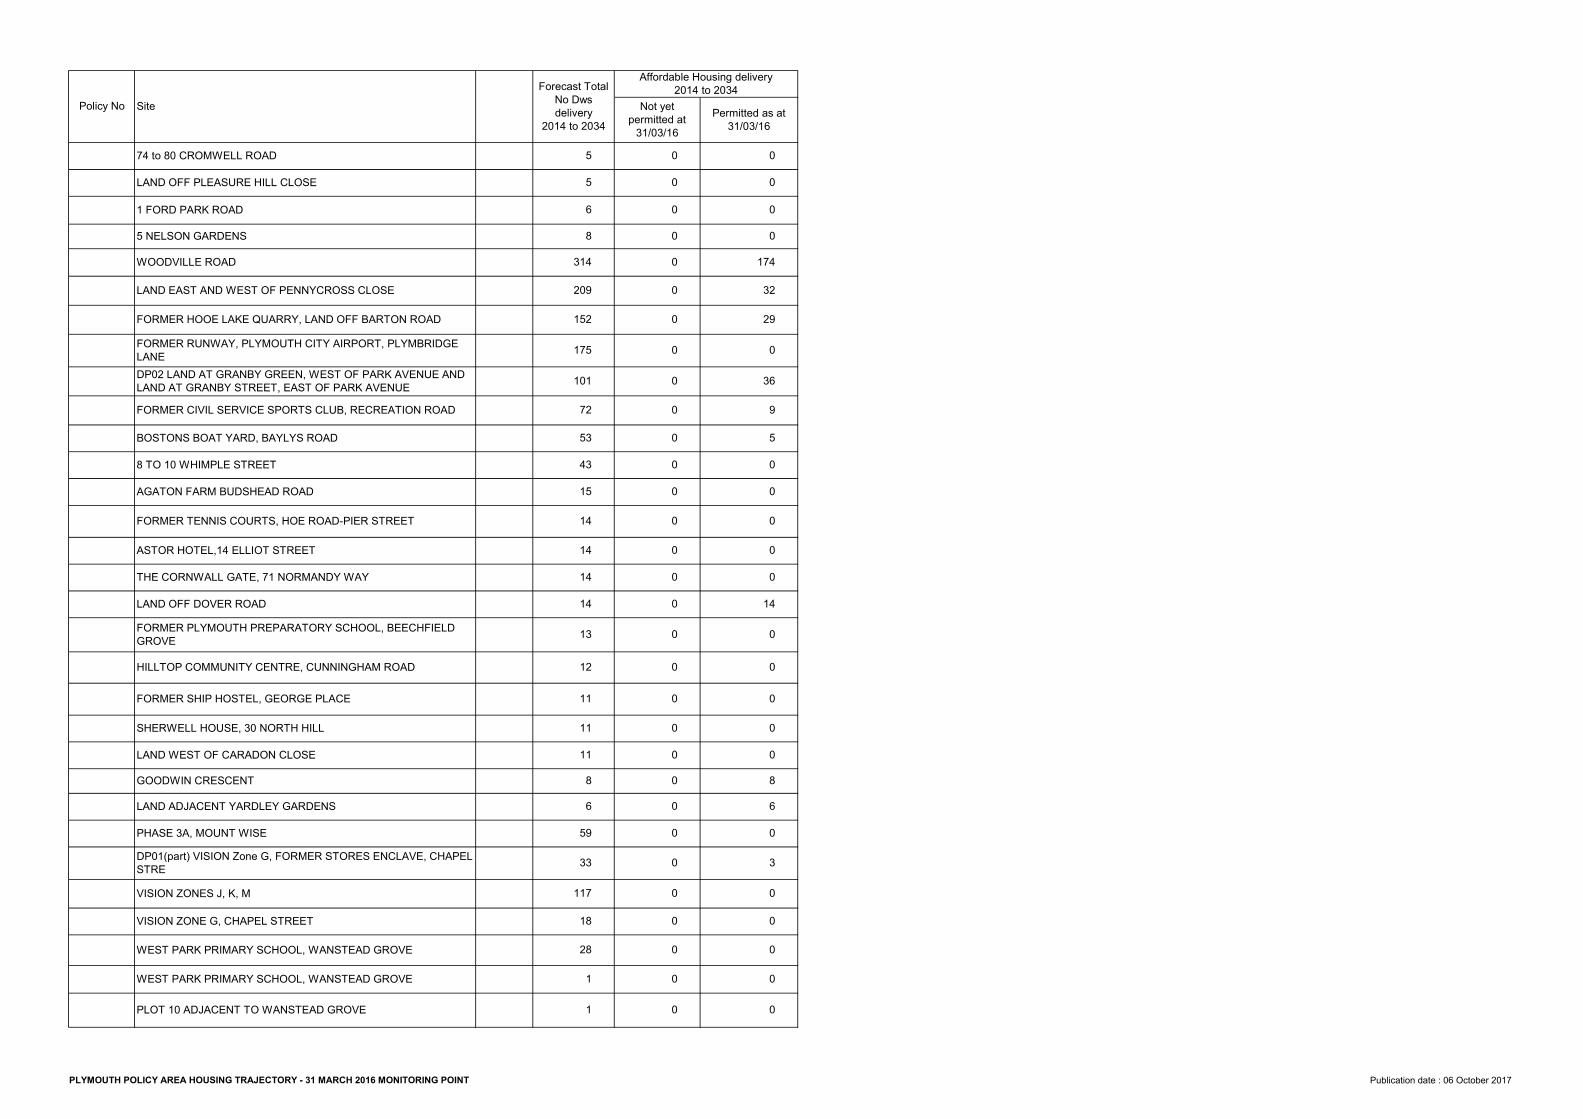
Policy No Site Forecast Total
No Dws delivery
2014 to 2034
Affordable Housing delivery 2014 to 2034
Not yet permitted at
31/03/16Permitted as at
31/03/16
PLYMOUTH POLICY AREA HOUSING TRAJECTORY - 31 MARCH 2016 MONITORING POINT Publication date : 06 October 2017
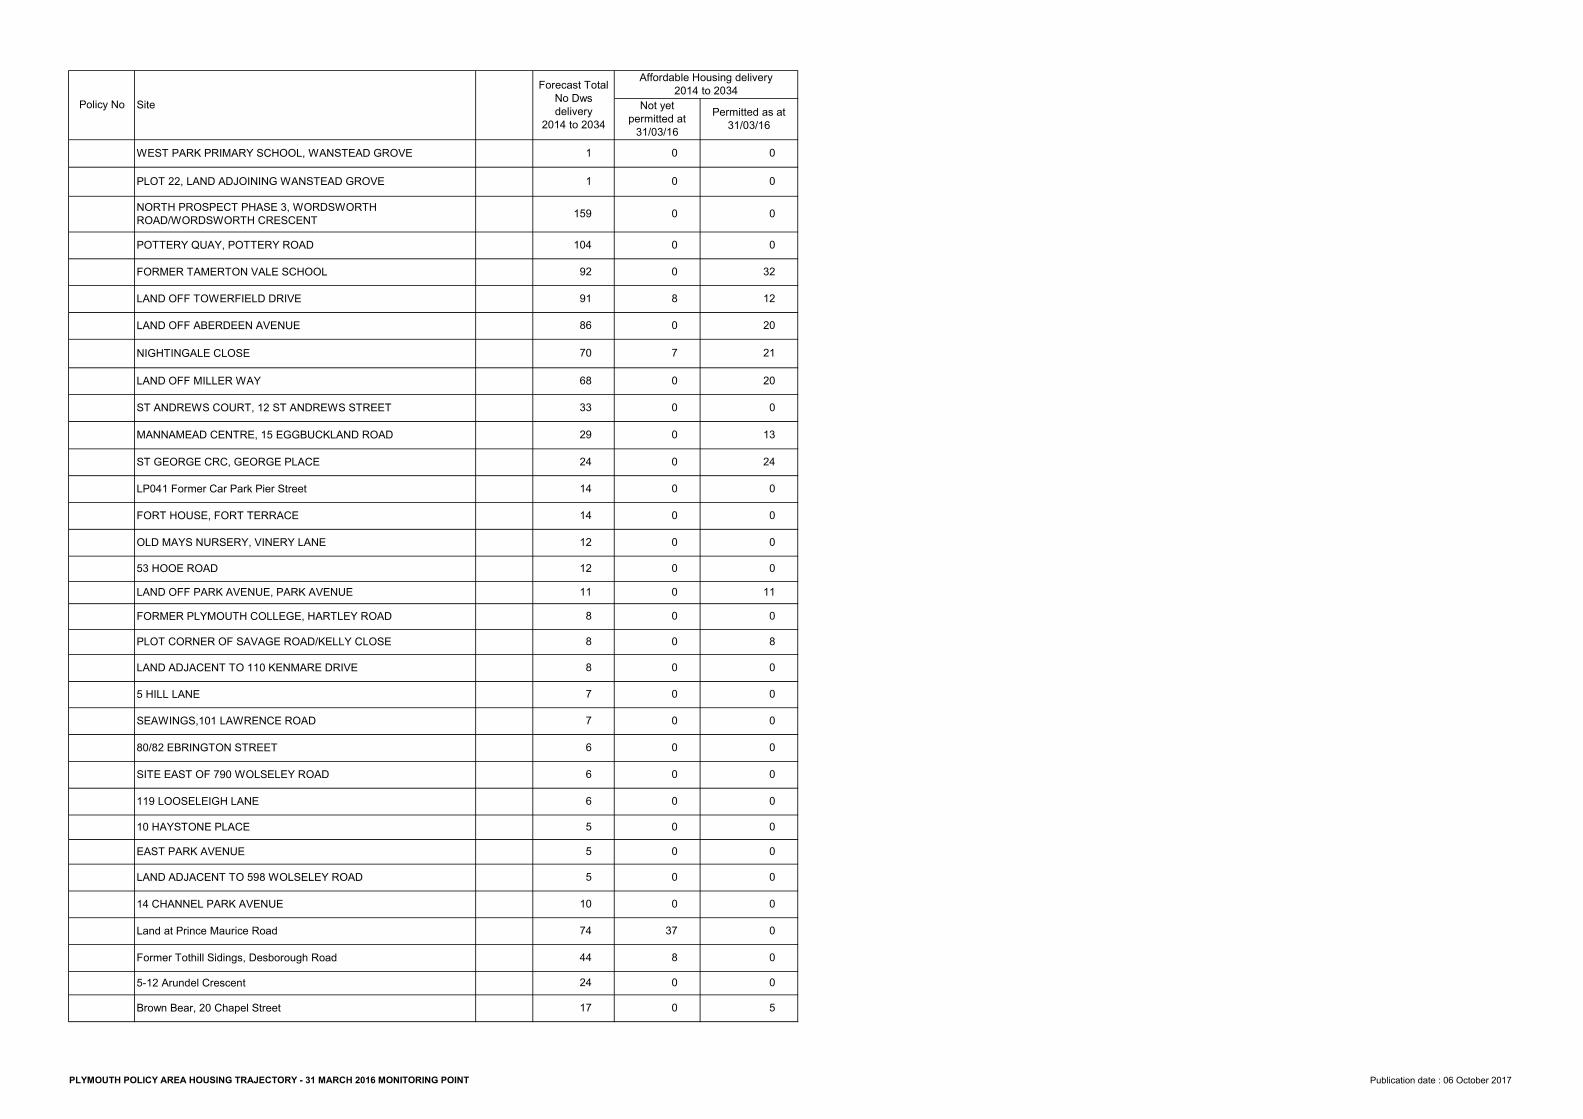
MANNAMEAD CENTRE, 15 EGGBUCKLAND ROADST ANDREWS COURT, 12 ST ANDREWS STREETLAND OFF MILLER WAYNIGHTINGALE CLOSELAND OFF ABERDEEN AVENUELAND OFF TOWERFIELD DRIVEFORMER TAMERTON VALE SCHOOLPOTTERY QUAY, POTTERY ROAD
OLD MAYS NURSERY, VINERY LANEFORT HOUSE, FORT TERRACELP041 Former Car Park Pier StreetST GEORGE CRC, GEORGE PLACE
NORTH PROSPECT PHASE 3, WORDSWORTH ROAD/WORDSWORTH CRESCENT
PLOT 22, LAND ADJOINING WANSTEAD GROVEWEST PARK PRIMARY SCHOOL, WANSTEAD GROVE
14 CHANNEL PARK AVENUELAND ADJACENT TO 598 WOLSELEY ROADEAST PARK AVENUE10 HAYSTONE PLACE
SEAWINGS,101 LAWRENCE ROAD5 HILL LANELAND ADJACENT TO 110 KENMARE DRIVEPLOT CORNER OF SAVAGE ROAD/KELLY CLOSEFORMER PLYMOUTH COLLEGE, HARTLEY ROADLAND OFF PARK AVENUE, PARK AVENUE53 HOOE ROAD
119 LOOSELEIGH LANESITE EAST OF 790 WOLSELEY ROAD80/82 EBRINGTON STREET
Brown Bear, 20 Chapel Street5-12 Arundel CrescentFormer Tothill Sidings, Desborough RoadLand at Prince Maurice Road
11
70869192
104
159
8111212141424293368
17244474
667788
105556
00
0
00
00708
00000000
00000000000
008
37
212012
00080
11
0000000
320
0
00
0000
2413
020
5000
Policy No Site Forecast Total
No Dws delivery
2014 to 2034
Affordable Housing delivery 2014 to 2034
Not yet permitted at
31/03/16Permitted as at
31/03/16
PLYMOUTH POLICY AREA HOUSING TRAJECTORY - 31 MARCH 2016 MONITORING POINT Publication date : 06 October 2017
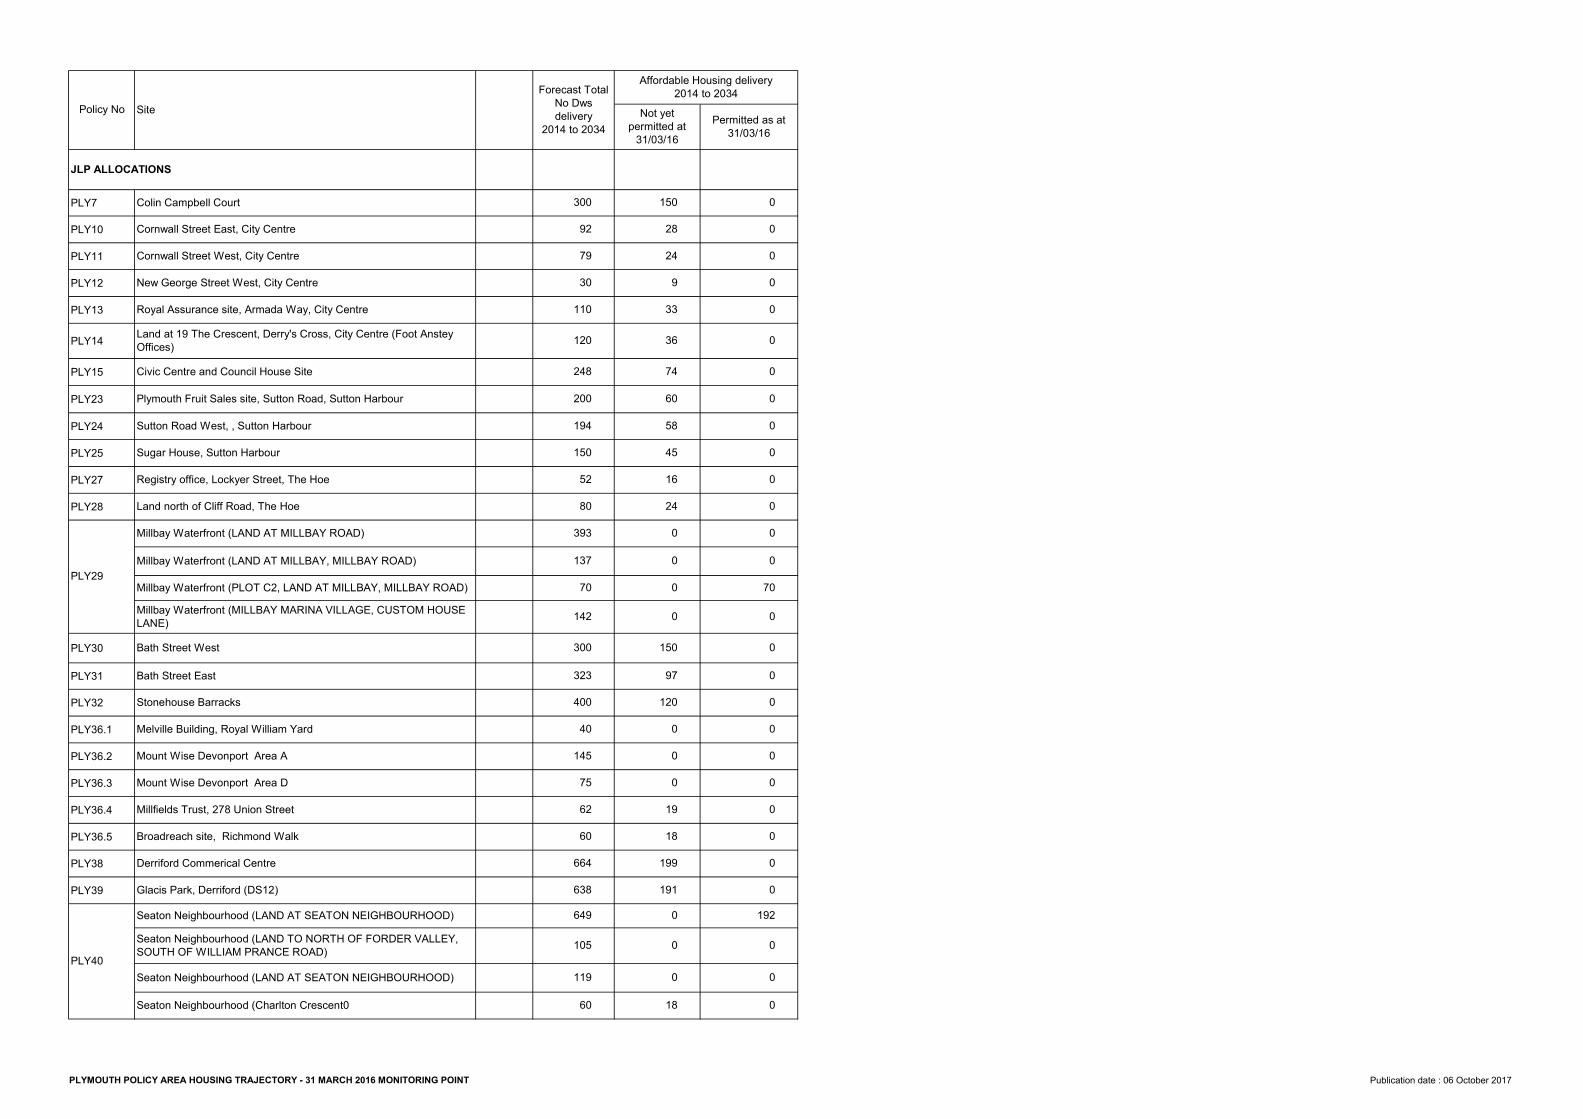
PLY7PLY10PLY11PLY12PLY13PLY14
PLY15PLY23PLY24PLY25PLY27PLY28
PLY30PLY31PLY32PLY36.1PLY36.2PLY36.3PLY36.4PLY36.5PLY38PLY39
PLY40
Millbay Waterfront (MILLBAY MARINA VILLAGE, CUSTOM HOUSE LANE)
Millbay Waterfront (PLOT C2, LAND AT MILLBAY, MILLBAY ROAD)Millbay Waterfront (LAND AT MILLBAY, MILLBAY ROAD)Millbay Waterfront (LAND AT MILLBAY ROAD)Land north of Cliff Road, The Hoe
Melville Building, Royal William YardStonehouse BarracksBath Street EastBath Street West
Registry office, Lockyer Street, The HoeSugar House, Sutton HarbourSutton Road West, , Sutton HarbourPlymouth Fruit Sales site, Sutton Road, Sutton HarbourCivic Centre and Council House Site
Land at 19 The Crescent, Derry's Cross, City Centre (Foot Anstey Offices)
Royal Assurance site, Armada Way, City CentreNew George Street West, City CentreCornwall Street West, City CentreCornwall Street East, City CentreColin Campbell Court
JLP ALLOCATIONS
PLY29
Seaton Neighbourhood (LAND AT SEATON NEIGHBOURHOOD)Glacis Park, Derriford (DS12)Derriford Commerical Centre Broadreach site, Richmond WalkMillfields Trust, 278 Union StreetMount Wise Devonport Area DMount Wise Devonport Area A
Seaton Neighbourhood (Charlton Crescent0Seaton Neighbourhood (LAND AT SEATON NEIGHBOURHOOD)
Seaton Neighbourhood (LAND TO NORTH OF FORDER VALLEY, SOUTH OF WILLIAM PRANCE ROAD)
92300
150194200248
120110
3079
40400323300
14270
137393
8052
606275
145
60119
105649638664
28150
6074
3633
924
180
00
191199
18
00
24164558
19000
12097
150
00
00
0192
00000
00
00
Permitted as at 31/03/16
00
Policy No Site
00000
070
000
0
0000
Forecast Total No Dws delivery
2014 to 2034
Affordable Housing delivery 2014 to 2034
Not yet permitted at
31/03/16
PLYMOUTH POLICY AREA HOUSING TRAJECTORY - 31 MARCH 2016 MONITORING POINT Publication date : 06 October 2017
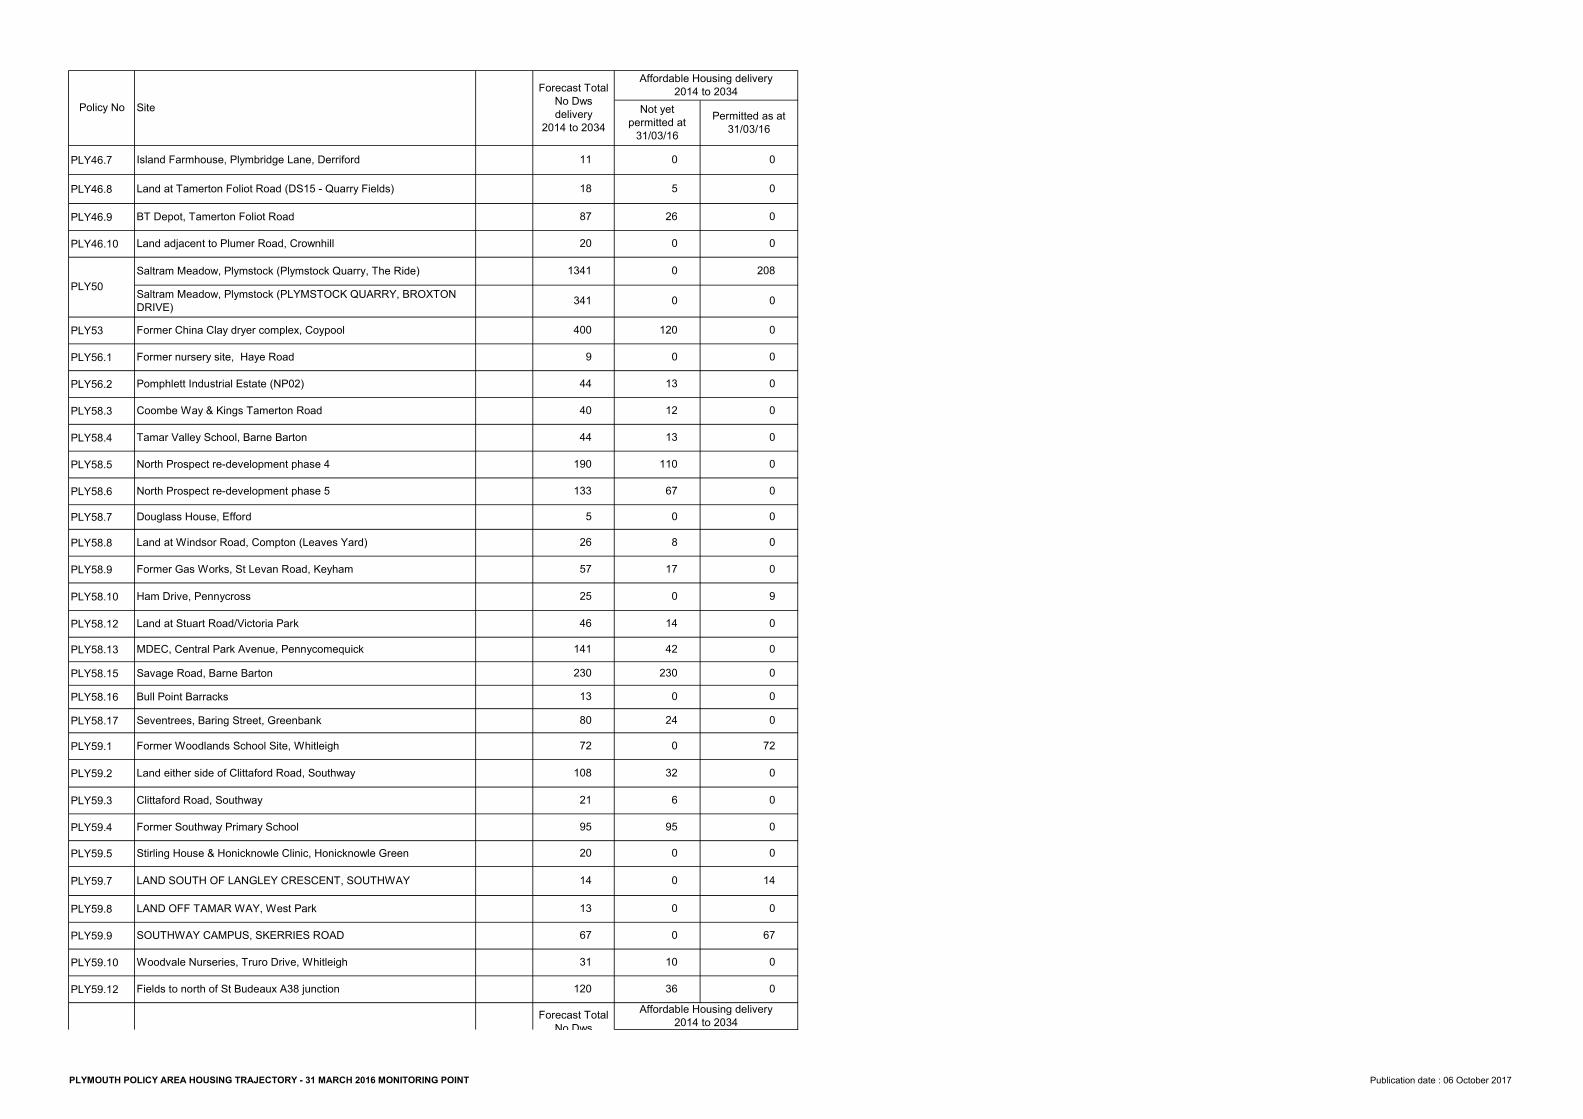
PLY46.7PLY46.8PLY46.9PLY46.10
PLY53PLY56.1PLY56.2PLY58.3PLY58.4PLY58.5PLY58.6PLY58.7PLY58.8PLY58.9PLY58.10PLY58.12PLY58.13PLY58.15PLY58.16PLY58.17PLY59.1PLY59.2PLY59.3PLY59.4PLY59.5PLY59.7PLY59.8PLY59.9PLY59.10PLY59.12
PLY50
Seventrees, Baring Street, Greenbank
Former Gas Works, St Levan Road, KeyhamLand at Windsor Road, Compton (Leaves Yard)Douglass House, EffordNorth Prospect re-development phase 5North Prospect re-development phase 4Tamar Valley School, Barne BartonCoombe Way & Kings Tamerton RoadPomphlett Industrial Estate (NP02)Former nursery site, Haye RoadFormer China Clay dryer complex, Coypool
Saltram Meadow, Plymstock (PLYMSTOCK QUARRY, BROXTON DRIVE)
Saltram Meadow, Plymstock (Plymstock Quarry, The Ride)Land adjacent to Plumer Road, CrownhillBT Depot, Tamerton Foliot RoadLand at Tamerton Foliot Road (DS15 - Quarry Fields)Island Farmhouse, Plymbridge Lane, Derriford
Bull Point BarracksSavage Road, Barne BartonMDEC, Central Park Avenue, PennycomequickLand at Stuart Road/Victoria ParkHam Drive, Pennycross
Policy No Site
Fields to north of St Budeaux A38 junctionWoodvale Nurseries, Truro Drive, WhitleighSOUTHWAY CAMPUS, SKERRIES ROADLAND OFF TAMAR WAY, West ParkLAND SOUTH OF LANGLEY CRESCENT, SOUTHWAYStirling House & Honicknowle Clinic, Honicknowle GreenFormer Southway Primary SchoolClittaford Road, SouthwayLand either side of Clittaford Road, SouthwayFormer Woodlands School Site, Whitleigh
190444044
9400341
134120871811
5726
5133
21108
728013
230141
4625
120316713142095
0
026
0230
4214
017
80
67110
131213
0
5
00
956
320
24
3610
00
12000 208
000
72000
0000
0000
Permitted as at 31/03/16
Forecast Total No Dws
Affordable Housing delivery 2014 to 2034
0090000000
Policy No Site Forecast Total
No Dws delivery
2014 to 2034
Affordable Housing delivery 2014 to 2034
Not yet permitted at
31/03/16
00
670
140
PLYMOUTH POLICY AREA HOUSING TRAJECTORY - 31 MARCH 2016 MONITORING POINT Publication date : 06 October 2017
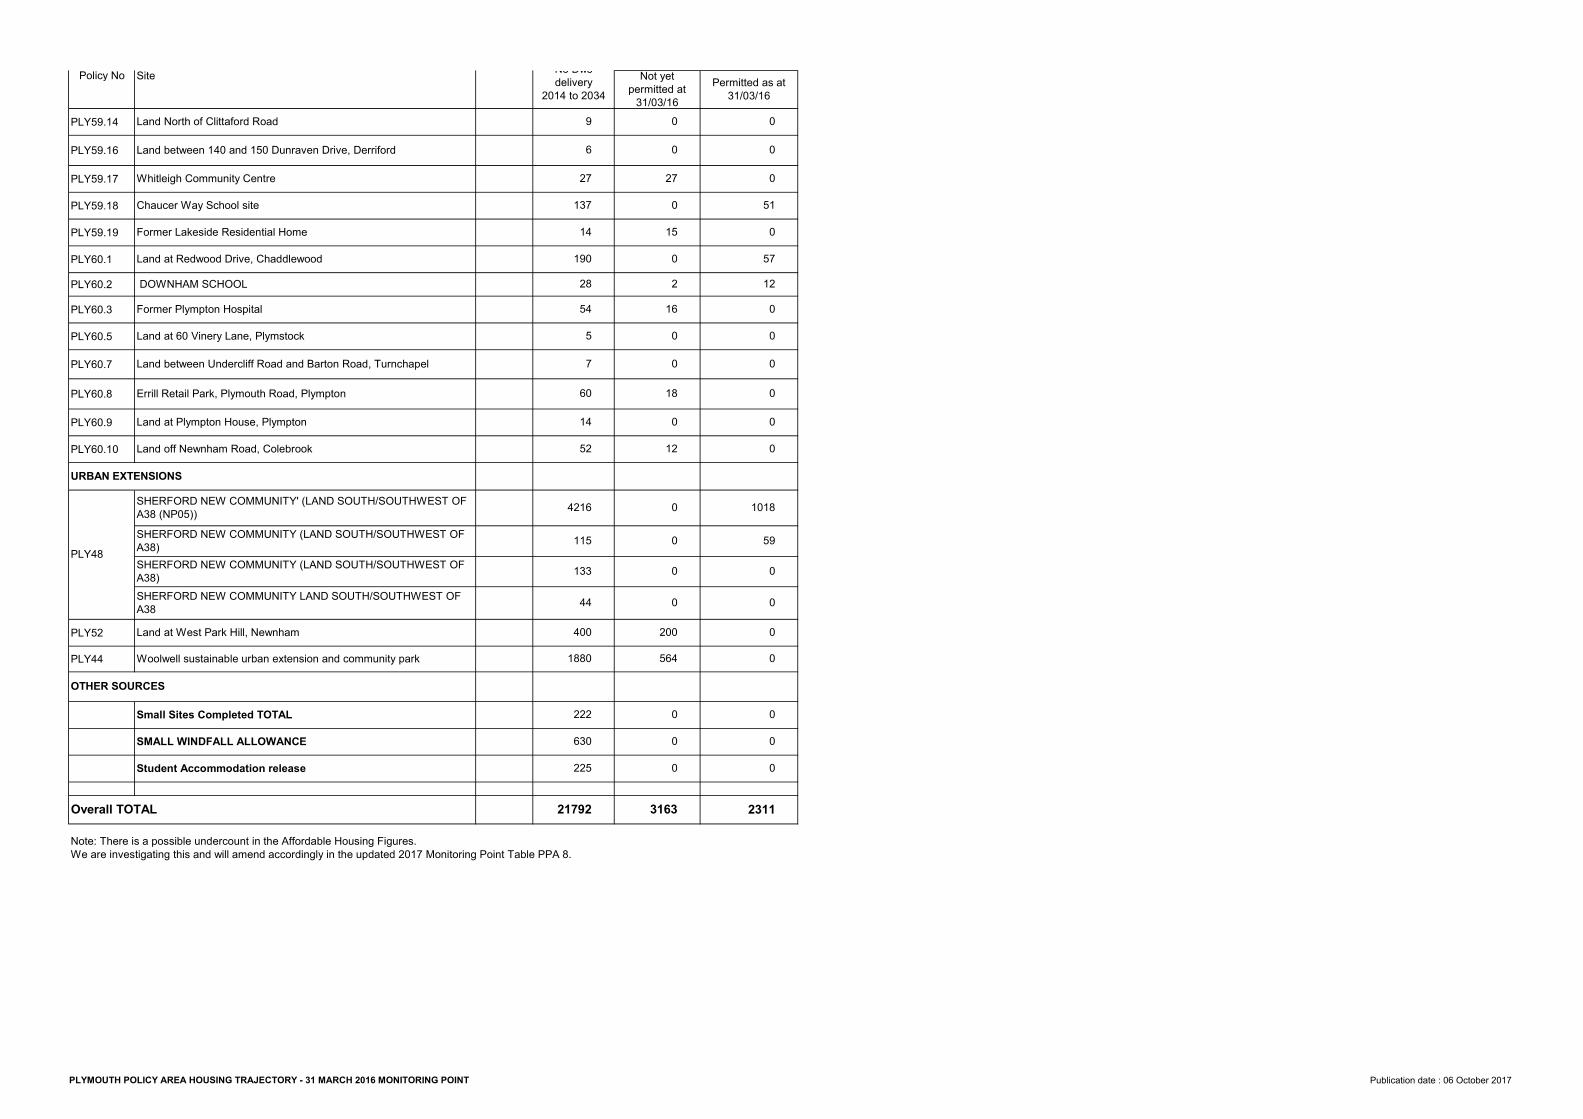
PLY59.14PLY59.16PLY59.17PLY59.18PLY59.19PLY60.1PLY60.2PLY60.3PLY60.5PLY60.7PLY60.8PLY60.9PLY60.10
PLY52PLY44
Note: There is a possible undercount in the Affordable Housing Figures. We are investigating this and will amend accordingly in the updated 2017 Monitoring Point Table PPA 8.
PLY48
OTHER SOURCES
Overall TOTAL
SHERFORD NEW COMMUNITY LAND SOUTH/SOUTHWEST OF A38
Policy No Site
DOWNHAM SCHOOL Land at Redwood Drive, ChaddlewoodFormer Lakeside Residential HomeChaucer Way School siteWhitleigh Community CentreLand between 140 and 150 Dunraven Drive, DerrifordLand North of Clittaford Road
Land off Newnham Road, ColebrookLand at Plympton House, PlymptonErrill Retail Park, Plymouth Road, PlymptonLand between Undercliff Road and Barton Road, TurnchapelLand at 60 Vinery Lane, PlymstockFormer Plympton Hospital
URBAN EXTENSIONS
SHERFORD NEW COMMUNITY (LAND SOUTH/SOUTHWEST OF A38)
SHERFORD NEW COMMUNITY (LAND SOUTH/SOUTHWEST OF A38)
SHERFORD NEW COMMUNITY' (LAND SOUTH/SOUTHWEST OF A38 (NP05))
Student Accommodation releaseSMALL WINDFALL ALLOWANCESmall Sites Completed TOTAL
Woolwell sustainable urban extension and community parkLand at West Park Hill, Newnham
55428
19014
13727
6
630222
1880400
44
133
9
7
2700
000
564
3163
00
1620
150
2000
00
0
120
18
21792
115
4216
521460
225
2311
0
00
No Dws delivery
2014 to 2034Not yet
permitted at 31/03/16
Permitted as at 31/03/16
0
0
059
1018
0
000
000000
1257
051
PLYMOUTH POLICY AREA HOUSING TRAJECTORY - 31 MARCH 2016 MONITORING POINT Publication date : 06 October 2017
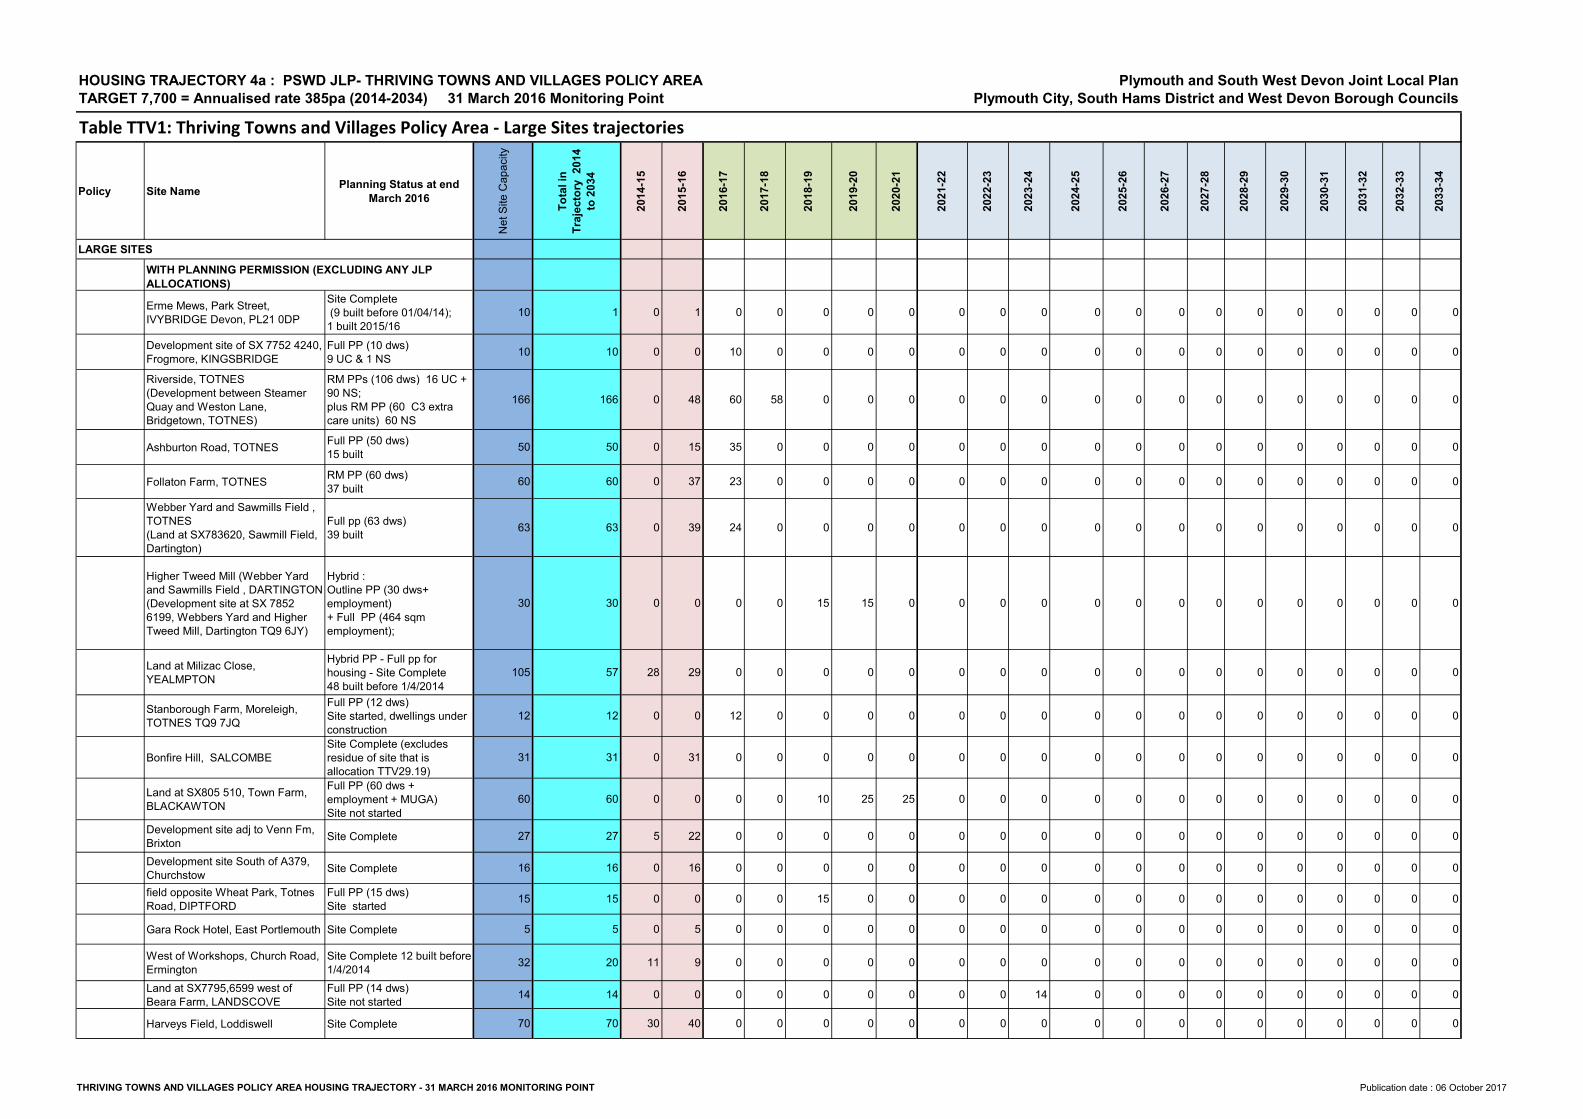
Table TTV1: Thriving Towns and Villages Policy Area - Large Sites trajectories
Policy Site Name Planning Status at end March 2016
Net S
ite Ca
pacity
Total
in
Trajec
tory 2
014
to 203
4
2014-1
5
2015-1
6
2016-1
7
2017-1
8
2018-1
9
2019-2
0
2020-2
1
2021-2
2
2022-2
3
2023-2
4
2024-2
5
2025-2
6
2026-2
7
2027-2
8
2028-2
9
2029-3
0
2030-3
1
2031-3
2
2032-3
3
2033-3
4
LARGE SITES
Erme Mews, Park Street, IVYBRIDGE Devon, PL21 0DP
Site Complete (9 built before 01/04/14);1 built 2015/16
10 1 0 1 0 0 0 0 0 0 0 0 0 0 0 0 0 0 0 0 0 0
Development site of SX 7752 4240, Frogmore, KINGSBRIDGE
Full PP (10 dws) 9 UC & 1 NS 10 10 0 0 10 0 0 0 0 0 0 0 0 0 0 0 0 0 0 0 0 0
Riverside, TOTNES(Development between Steamer Quay and Weston Lane, Bridgetown, TOTNES)
RM PPs (106 dws) 16 UC + 90 NS;plus RM PP (60 C3 extra care units) 60 NS
166 166 0 48 60 58 0 0 0 0 0 0 0 0 0 0 0 0 0 0 0 0
Ashburton Road, TOTNES Full PP (50 dws) 15 built 50 50 0 15 35 0 0 0 0 0 0 0 0 0 0 0 0 0 0 0 0 0
Follaton Farm, TOTNES RM PP (60 dws) 37 built 60 60 0 37 23 0 0 0 0 0 0 0 0 0 0 0 0 0 0 0 0 0
Webber Yard and Sawmills Field , TOTNES(Land at SX783620, Sawmill Field, Dartington)
Full pp (63 dws)39 built 63 63 0 39 24 0 0 0 0 0 0 0 0 0 0 0 0 0 0 0 0 0
Higher Tweed Mill (Webber Yard and Sawmills Field , DARTINGTON(Development site at SX 7852 6199, Webbers Yard and Higher Tweed Mill, Dartington TQ9 6JY)
Hybrid :Outline PP (30 dws+ employment) + Full PP (464 sqm employment);
30 30 0 0 0 0 15 15 0 0 0 0 0 0 0 0 0 0 0 0 0 0
Land at Milizac Close, YEALMPTON
Hybrid PP - Full pp forhousing - Site Complete48 built before 1/4/2014
105 57 28 29 0 0 0 0 0 0 0 0 0 0 0 0 0 0 0 0 0 0
Stanborough Farm, Moreleigh, TOTNES TQ9 7JQ
Full PP (12 dws) Site started, dwellings under construction
12 12 0 0 12 0 0 0 0 0 0 0 0 0 0 0 0 0 0 0 0 0
Bonfire Hill, SALCOMBESite Complete (excludes residue of site that is allocation TTV29.19)
31 31 0 31 0 0 0 0 0 0 0 0 0 0 0 0 0 0 0 0 0 0
Land at SX805 510, Town Farm, BLACKAWTON
Full PP (60 dws + employment + MUGA) Site not started
60 60 0 0 0 0 10 25 25 0 0 0 0 0 0 0 0 0 0 0 0 0Development site adj to Venn Fm, Brixton Site Complete 27 27 5 22 0 0 0 0 0 0 0 0 0 0 0 0 0 0 0 0 0 0Development site South of A379, Churchstow Site Complete 16 16 0 16 0 0 0 0 0 0 0 0 0 0 0 0 0 0 0 0 0 0field opposite Wheat Park, Totnes Road, DIPTFORD
Full PP (15 dws) Site started 15 15 0 0 0 0 15 0 0 0 0 0 0 0 0 0 0 0 0 0 0 0
Gara Rock Hotel, East Portlemouth Site Complete 5 5 0 5 0 0 0 0 0 0 0 0 0 0 0 0 0 0 0 0 0 0West of Workshops, Church Road, Ermington
Site Complete 12 built before 1/4/2014 32 20 11 9 0 0 0 0 0 0 0 0 0 0 0 0 0 0 0 0 0 0
Land at SX7795,6599 west of Beara Farm, LANDSCOVE
Full PP (14 dws) Site not started 14 14 0 0 0 0 0 0 0 0 0 14 0 0 0 0 0 0 0 0 0 0
Harveys Field, Loddiswell Site Complete 70 70 30 40 0 0 0 0 0 0 0 0 0 0 0 0 0 0 0 0 0 0
WITH PLANNING PERMISSION (EXCLUDING ANY JLP ALLOCATIONS)
HOUSING TRAJECTORY 4a : PSWD JLP- THRIVING TOWNS AND VILLAGES POLICY AREATARGET 7,700 = Annualised rate 385pa (2014-2034) 31 March 2016 Monitoring Point
Plymouth and South West Devon Joint Local PlanPlymouth City, South Hams District and West Devon Borough Councils
THRIVING TOWNS AND VILLAGES POLICY AREA HOUSING TRAJECTORY - 31 MARCH 2016 MONITORING POINT Publication date : 06 October 2017
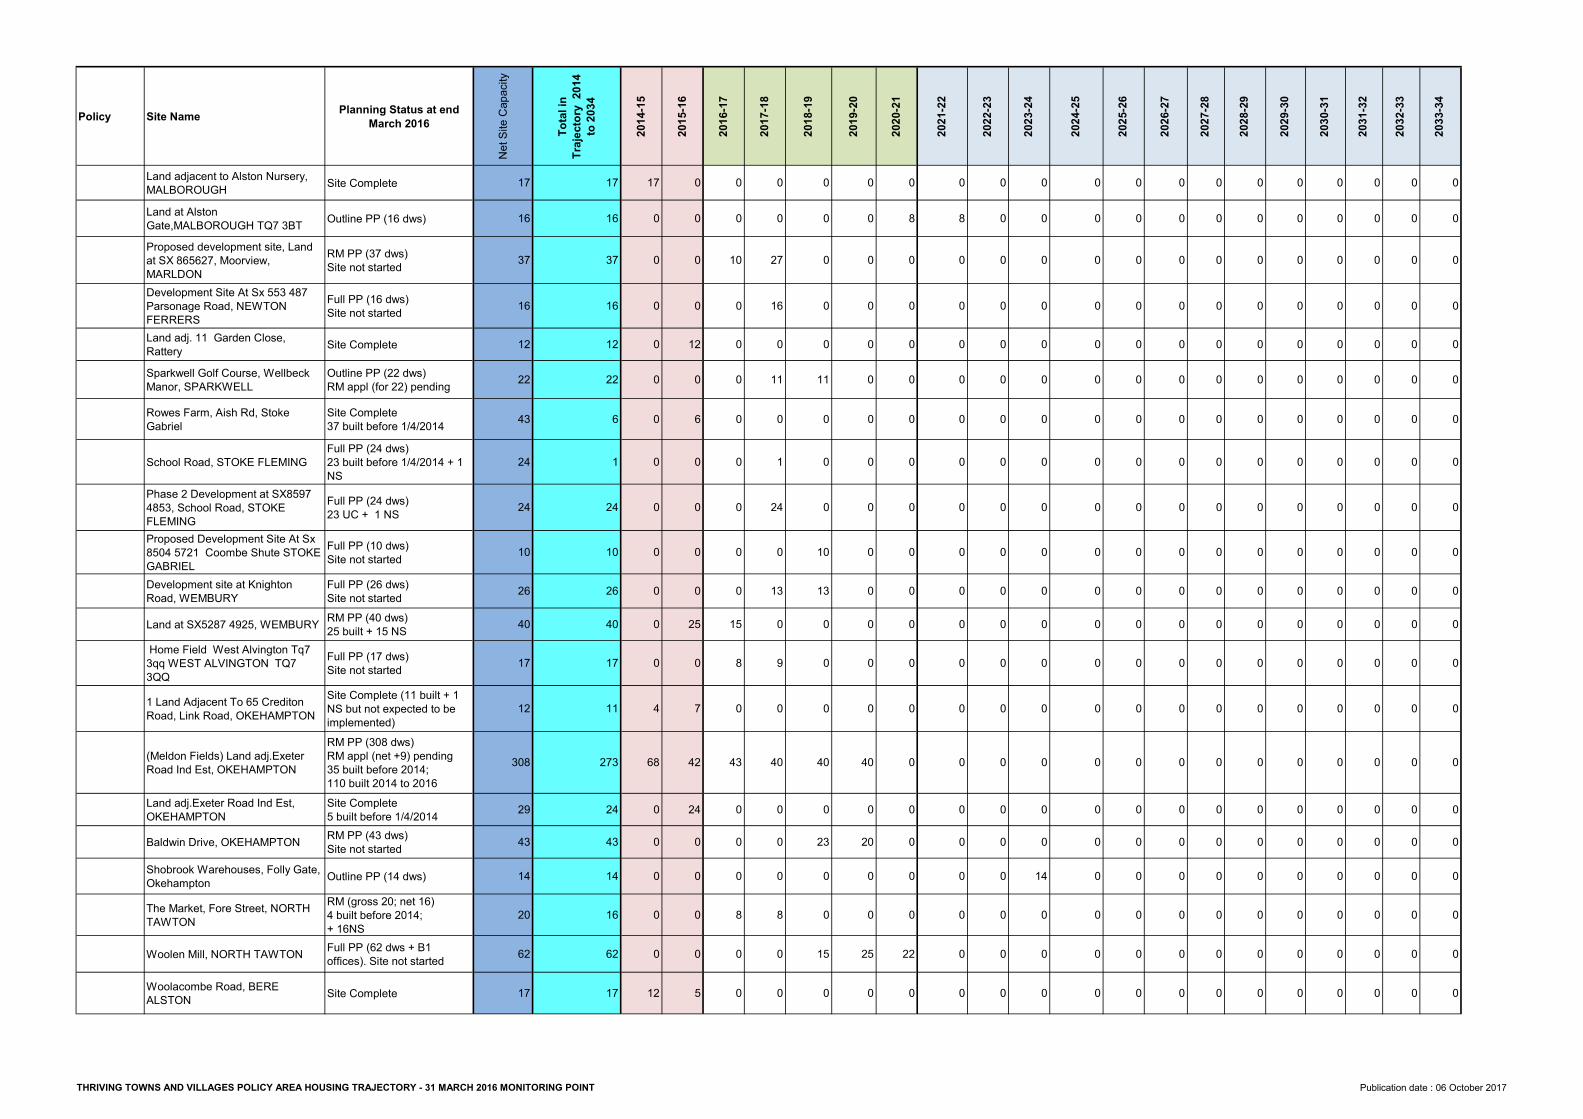
Policy Site Name Planning Status at end March 2016
Net S
ite Ca
pacity
Total
in
Trajec
tory 2
014
to 203
4
2014-1
5
2015-1
6
2016-1
7
2017-1
8
2018-1
9
2019-2
0
2020-2
1
2021-2
2
2022-2
3
2023-2
4
2024-2
5
2025-2
6
2026-2
7
2027-2
8
2028-2
9
2029-3
0
2030-3
1
2031-3
2
2032-3
3
2033-3
4
Land adjacent to Alston Nursery, MALBOROUGH Site Complete 17 17 17 0 0 0 0 0 0 0 0 0 0 0 0 0 0 0 0 0 0 0Land at Alston Gate,MALBOROUGH TQ7 3BT Outline PP (16 dws) 16 16 0 0 0 0 0 0 8 8 0 0 0 0 0 0 0 0 0 0 0 0Proposed development site, Land at SX 865627, Moorview, MARLDON
RM PP (37 dws) Site not started 37 37 0 0 10 27 0 0 0 0 0 0 0 0 0 0 0 0 0 0 0 0
Development Site At Sx 553 487 Parsonage Road, NEWTON FERRERS
Full PP (16 dws)Site not started 16 16 0 0 0 16 0 0 0 0 0 0 0 0 0 0 0 0 0 0 0 0
Land adj. 11 Garden Close, Rattery Site Complete 12 12 0 12 0 0 0 0 0 0 0 0 0 0 0 0 0 0 0 0 0 0Sparkwell Golf Course, Wellbeck Manor, SPARKWELL
Outline PP (22 dws)RM appl (for 22) pending 22 22 0 0 0 11 11 0 0 0 0 0 0 0 0 0 0 0 0 0 0 0
Rowes Farm, Aish Rd, Stoke Gabriel
Site Complete 37 built before 1/4/2014 43 6 0 6 0 0 0 0 0 0 0 0 0 0 0 0 0 0 0 0 0 0
School Road, STOKE FLEMINGFull PP (24 dws) 23 built before 1/4/2014 + 1 NS
24 1 0 0 0 1 0 0 0 0 0 0 0 0 0 0 0 0 0 0 0 0
Phase 2 Development at SX8597 4853, School Road, STOKE FLEMING
Full PP (24 dws) 23 UC + 1 NS 24 24 0 0 0 24 0 0 0 0 0 0 0 0 0 0 0 0 0 0 0 0
Proposed Development Site At Sx 8504 5721 Coombe Shute STOKE GABRIEL
Full PP (10 dws) Site not started 10 10 0 0 0 0 10 0 0 0 0 0 0 0 0 0 0 0 0 0 0 0
Development site at Knighton Road, WEMBURY
Full PP (26 dws) Site not started 26 26 0 0 0 13 13 0 0 0 0 0 0 0 0 0 0 0 0 0 0 0
Land at SX5287 4925, WEMBURY RM PP (40 dws)25 built + 15 NS 40 40 0 25 15 0 0 0 0 0 0 0 0 0 0 0 0 0 0 0 0 0
Home Field West Alvington Tq7 3qq WEST ALVINGTON TQ7 3QQ
Full PP (17 dws)Site not started 17 17 0 0 8 9 0 0 0 0 0 0 0 0 0 0 0 0 0 0 0 0
1 Land Adjacent To 65 Crediton Road, Link Road, OKEHAMPTON
Site Complete (11 built + 1 NS but not expected to be implemented)
12 11 4 7 0 0 0 0 0 0 0 0 0 0 0 0 0 0 0 0 0 0
(Meldon Fields) Land adj.Exeter Road Ind Est, OKEHAMPTON
RM PP (308 dws)RM appl (net +9) pending35 built before 2014; 110 built 2014 to 2016
308 273 68 42 43 40 40 40 0 0 0 0 0 0 0 0 0 0 0 0 0 0
Land adj.Exeter Road Ind Est, OKEHAMPTON
Site Complete 5 built before 1/4/2014 29 24 0 24 0 0 0 0 0 0 0 0 0 0 0 0 0 0 0 0 0 0
Baldwin Drive, OKEHAMPTON RM PP (43 dws) Site not started 43 43 0 0 0 0 23 20 0 0 0 0 0 0 0 0 0 0 0 0 0 0
Shobrook Warehouses, Folly Gate, Okehampton Outline PP (14 dws) 14 14 0 0 0 0 0 0 0 0 0 14 0 0 0 0 0 0 0 0 0 0
The Market, Fore Street, NORTH TAWTON
RM (gross 20; net 16)4 built before 2014; + 16NS
20 16 0 0 8 8 0 0 0 0 0 0 0 0 0 0 0 0 0 0 0 0
Woolen Mill, NORTH TAWTON Full PP (62 dws + B1 offices). Site not started 62 62 0 0 0 0 15 25 22 0 0 0 0 0 0 0 0 0 0 0 0 0
Woolacombe Road, BERE ALSTON Site Complete 17 17 12 5 0 0 0 0 0 0 0 0 0 0 0 0 0 0 0 0 0 0
THRIVING TOWNS AND VILLAGES POLICY AREA HOUSING TRAJECTORY - 31 MARCH 2016 MONITORING POINT Publication date : 06 October 2017
Policy Site Name Planning Status at end March 2016
Net S
ite Ca
pacity
Total
in Tr
ajecto
ry
2014 t
o 2034
2014-1
5
2015-1
6
2016-1
7
2017-1
8
2018-1
9
2019-2
0
2020-2
1
2021-2
2
2022-2
3
2023-2
4
2024-2
5
2025-2
6
2026-2
7
2027-2
8
2028-2
9
2029-3
0
2030-3
1
2031-3
2
2032-3
3
2033-3
4
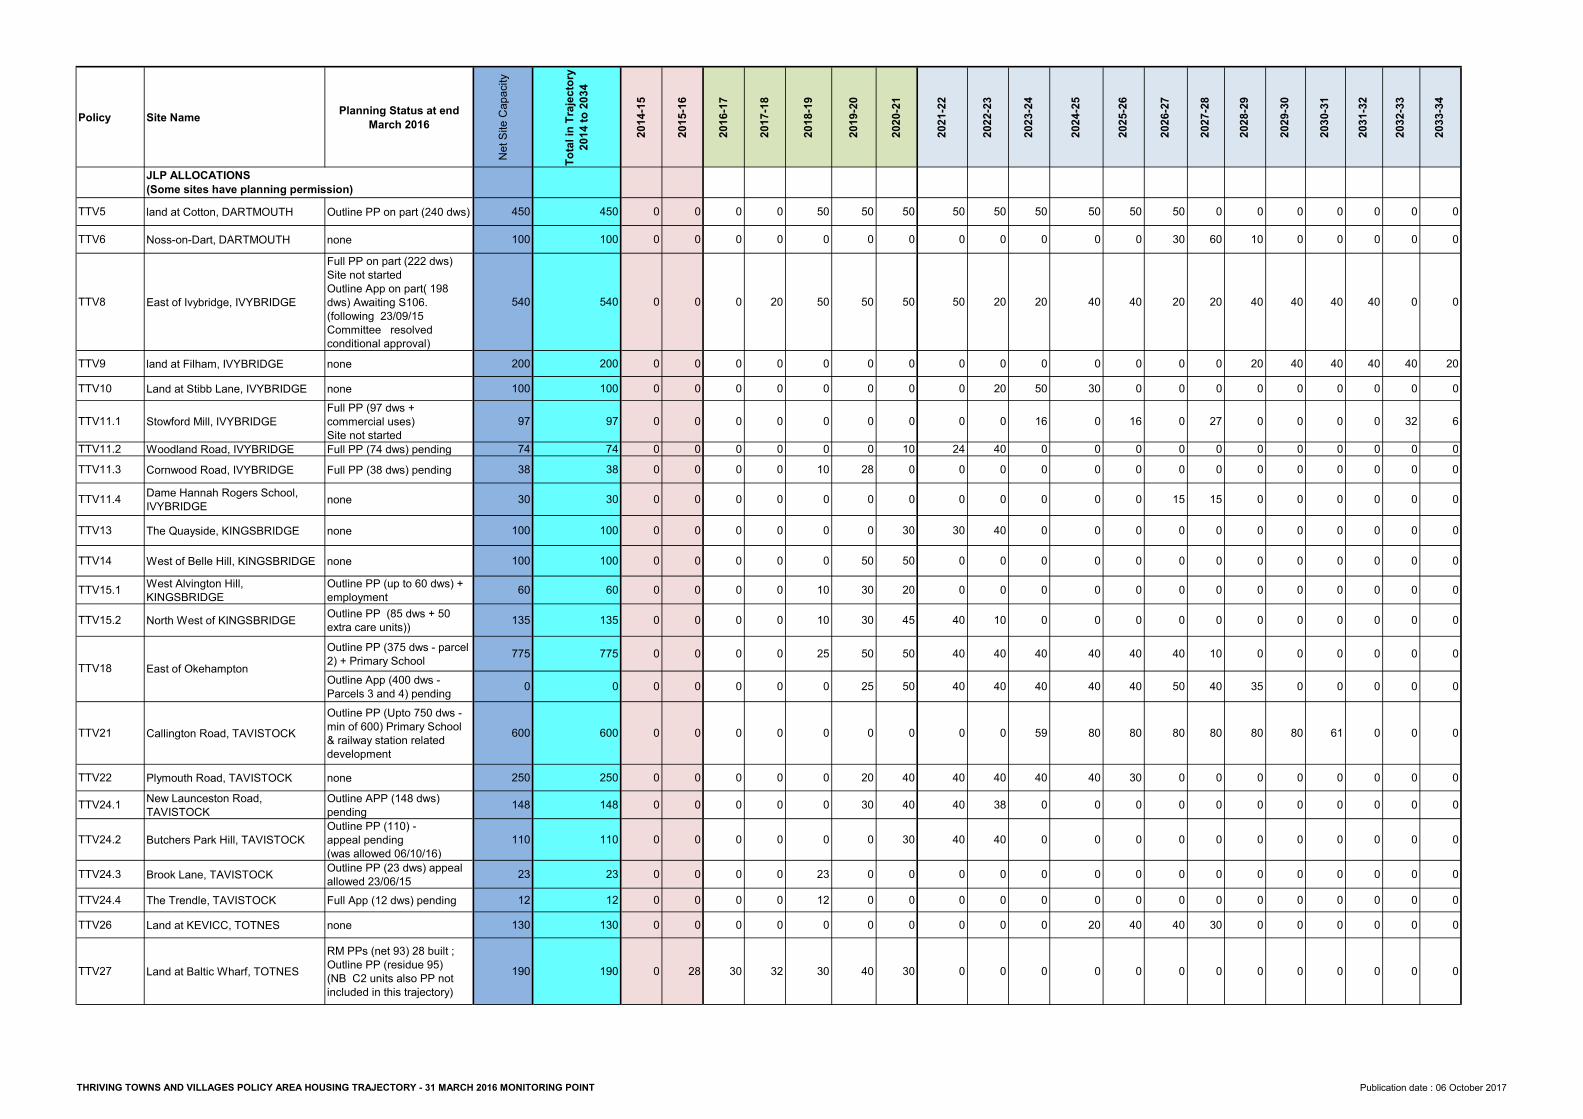
TTV5 land at Cotton, DARTMOUTH Outline PP on part (240 dws) 450 450 0 0 0 0 50 50 50 50 50 50 50 50 50 0 0 0 0 0 0 0TTV6 Noss-on-Dart, DARTMOUTH none 100 100 0 0 0 0 0 0 0 0 0 0 0 0 30 60 10 0 0 0 0 0
TTV8 East of Ivybridge, IVYBRIDGE
Full PP on part (222 dws) Site not startedOutline App on part( 198 dws) Awaiting S106. (following 23/09/15 Committee resolved conditional approval)
540 540 0 0 0 20 50 50 50 50 20 20 40 40 20 20 40 40 40 40 0 0
TTV9 land at Filham, IVYBRIDGE none 200 200 0 0 0 0 0 0 0 0 0 0 0 0 0 0 20 40 40 40 40 20TTV10 Land at Stibb Lane, IVYBRIDGE none 100 100 0 0 0 0 0 0 0 0 20 50 30 0 0 0 0 0 0 0 0 0
TTV11.1 Stowford Mill, IVYBRIDGEFull PP (97 dws + commercial uses) Site not started
97 97 0 0 0 0 0 0 0 0 0 16 0 16 0 27 0 0 0 0 32 6TTV11.2 Woodland Road, IVYBRIDGE Full PP (74 dws) pending 74 74 0 0 0 0 0 0 10 24 40 0 0 0 0 0 0 0 0 0 0 0TTV11.3 Cornwood Road, IVYBRIDGE Full PP (38 dws) pending 38 38 0 0 0 0 10 28 0 0 0 0 0 0 0 0 0 0 0 0 0 0TTV11.4 Dame Hannah Rogers School,
IVYBRIDGE none 30 30 0 0 0 0 0 0 0 0 0 0 0 0 15 15 0 0 0 0 0 0TTV13 The Quayside, KINGSBRIDGE none 100 100 0 0 0 0 0 0 30 30 40 0 0 0 0 0 0 0 0 0 0 0TTV14 West of Belle Hill, KINGSBRIDGE none 100 100 0 0 0 0 0 50 50 0 0 0 0 0 0 0 0 0 0 0 0 0TTV15.1 West Alvington Hill,
KINGSBRIDGEOutline PP (up to 60 dws) + employment 60 60 0 0 0 0 10 30 20 0 0 0 0 0 0 0 0 0 0 0 0 0
TTV15.2 North West of KINGSBRIDGE Outline PP (85 dws + 50 extra care units)) 135 135 0 0 0 0 10 30 45 40 10 0 0 0 0 0 0 0 0 0 0 0Outline PP (375 dws - parcel 2) + Primary School 775 775 0 0 0 0 25 50 50 40 40 40 40 40 40 10 0 0 0 0 0 0Outline App (400 dws - Parcels 3 and 4) pending 0 0 0 0 0 0 0 25 50 40 40 40 40 40 50 40 35 0 0 0 0 0
TTV21 Callington Road, TAVISTOCKOutline PP (Upto 750 dws - min of 600) Primary School & railway station related development
600 600 0 0 0 0 0 0 0 0 0 59 80 80 80 80 80 80 61 0 0 0
TTV22 Plymouth Road, TAVISTOCK none 250 250 0 0 0 0 0 20 40 40 40 40 40 30 0 0 0 0 0 0 0 0TTV24.1 New Launceston Road,
TAVISTOCKOutline APP (148 dws) pending 148 148 0 0 0 0 0 30 40 40 38 0 0 0 0 0 0 0 0 0 0 0
TTV24.2 Butchers Park Hill, TAVISTOCKOutline PP (110) - appeal pending (was allowed 06/10/16)
110 110 0 0 0 0 0 0 30 40 40 0 0 0 0 0 0 0 0 0 0 0
TTV24.3 Brook Lane, TAVISTOCK Outline PP (23 dws) appeal allowed 23/06/15 23 23 0 0 0 0 23 0 0 0 0 0 0 0 0 0 0 0 0 0 0 0
TTV24.4 The Trendle, TAVISTOCK Full App (12 dws) pending 12 12 0 0 0 0 12 0 0 0 0 0 0 0 0 0 0 0 0 0 0 0TTV26 Land at KEVICC, TOTNES none 130 130 0 0 0 0 0 0 0 0 0 0 20 40 40 30 0 0 0 0 0 0
TTV27 Land at Baltic Wharf, TOTNESRM PPs (net 93) 28 built ; Outline PP (residue 95) (NB C2 units also PP not included in this trajectory)
190 190 0 28 30 32 30 40 30 0 0 0 0 0 0 0 0 0 0 0 0 0
East of OkehamptonTTV18
JLP ALLOCATIONS (Some sites have planning permission)
THRIVING TOWNS AND VILLAGES POLICY AREA HOUSING TRAJECTORY - 31 MARCH 2016 MONITORING POINT Publication date : 06 October 2017
Policy Site Name Planning Status at end March 2016
Net S
ite Ca
pacity
Total
in Tr
ajecto
ry
2014 t
o 2034
2014-1
5
2015-1
6
2016-1
7
2017-1
8
2018-1
9
2019-2
0
2020-2
1
2021-2
2
2022-2
3
2023-2
4
2024-2
5
2025-2
6
2026-2
7
2027-2
8
2028-2
9
2029-3
0
2030-3
1
2031-3
2
2032-3
3
2033-3
4
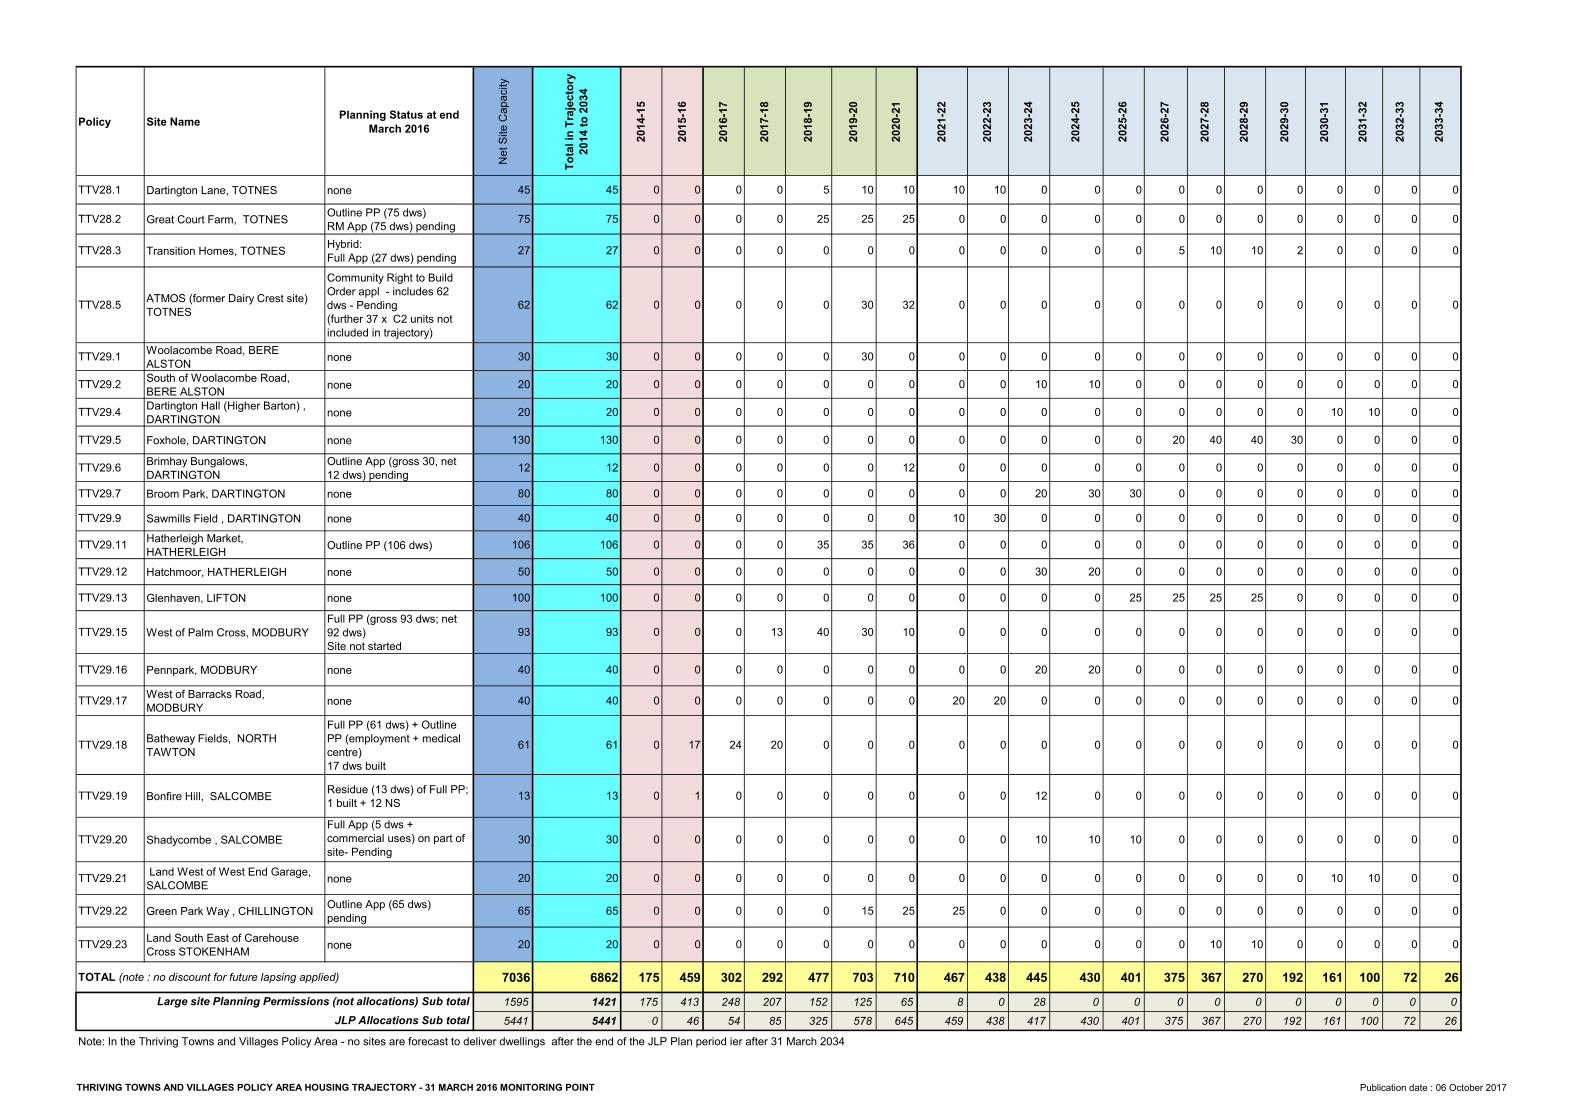
TTV28.1 Dartington Lane, TOTNES none 45 45 0 0 0 0 5 10 10 10 10 0 0 0 0 0 0 0 0 0 0 0TTV28.2 Great Court Farm, TOTNES Outline PP (75 dws)
RM App (75 dws) pending 75 75 0 0 0 0 25 25 25 0 0 0 0 0 0 0 0 0 0 0 0 0TTV28.3 Transition Homes, TOTNES Hybrid:
Full App (27 dws) pending 27 27 0 0 0 0 0 0 0 0 0 0 0 0 5 10 10 2 0 0 0 0
TTV28.5 ATMOS (former Dairy Crest site) TOTNES
Community Right to Build Order appl - includes 62 dws - Pending(further 37 x C2 units not included in trajectory)
62 62 0 0 0 0 0 30 32 0 0 0 0 0 0 0 0 0 0 0 0 0
TTV29.1 Woolacombe Road, BERE ALSTON none 30 30 0 0 0 0 0 30 0 0 0 0 0 0 0 0 0 0 0 0 0 0
TTV29.2 South of Woolacombe Road, BERE ALSTON none 20 20 0 0 0 0 0 0 0 0 0 10 10 0 0 0 0 0 0 0 0 0
TTV29.4 Dartington Hall (Higher Barton) , DARTINGTON none 20 20 0 0 0 0 0 0 0 0 0 0 0 0 0 0 0 0 10 10 0 0
TTV29.5 Foxhole, DARTINGTON none 130 130 0 0 0 0 0 0 0 0 0 0 0 0 20 40 40 30 0 0 0 0TTV29.6 Brimhay Bungalows,
DARTINGTONOutline App (gross 30, net 12 dws) pending 12 12 0 0 0 0 0 0 12 0 0 0 0 0 0 0 0 0 0 0 0 0
TTV29.7 Broom Park, DARTINGTON none 80 80 0 0 0 0 0 0 0 0 0 20 30 30 0 0 0 0 0 0 0 0TTV29.9 Sawmills Field , DARTINGTON none 40 40 0 0 0 0 0 0 0 10 30 0 0 0 0 0 0 0 0 0 0 0TTV29.11 Hatherleigh Market,
HATHERLEIGH Outline PP (106 dws) 106 106 0 0 0 0 35 35 36 0 0 0 0 0 0 0 0 0 0 0 0 0TTV29.12 Hatchmoor, HATHERLEIGH none 50 50 0 0 0 0 0 0 0 0 0 30 20 0 0 0 0 0 0 0 0 0TTV29.13 Glenhaven, LIFTON none 100 100 0 0 0 0 0 0 0 0 0 0 0 25 25 25 25 0 0 0 0 0
TTV29.15 West of Palm Cross, MODBURYFull PP (gross 93 dws; net 92 dws)Site not started
93 93 0 0 0 13 40 30 10 0 0 0 0 0 0 0 0 0 0 0 0 0
TTV29.16 Pennpark, MODBURY none 40 40 0 0 0 0 0 0 0 0 0 20 20 0 0 0 0 0 0 0 0 0TTV29.17 West of Barracks Road,
MODBURY none 40 40 0 0 0 0 0 0 0 20 20 0 0 0 0 0 0 0 0 0 0 0
TTV29.18 Batheway Fields, NORTH TAWTON
Full PP (61 dws) + Outline PP (employment + medical centre)17 dws built
61 61 0 17 24 20 0 0 0 0 0 0 0 0 0 0 0 0 0 0 0 0
TTV29.19 Bonfire Hill, SALCOMBE Residue (13 dws) of Full PP; 1 built + 12 NS 13 13 0 1 0 0 0 0 0 0 0 12 0 0 0 0 0 0 0 0 0 0
TTV29.20 Shadycombe , SALCOMBEFull App (5 dws + commercial uses) on part of site- Pending 30 30 0 0 0 0 0 0 0 0 0 10 10 10 0 0 0 0 0 0 0 0
TTV29.21 Land West of West End Garage, SALCOMBE none 20 20 0 0 0 0 0 0 0 0 0 0 0 0 0 0 0 0 10 10 0 0
TTV29.22 Green Park Way , CHILLINGTON Outline App (65 dws) pending 65 65 0 0 0 0 0 15 25 25 0 0 0 0 0 0 0 0 0 0 0 0
TTV29.23 Land South East of Carehouse Cross STOKENHAM none 20 20 0 0 0 0 0 0 0 0 0 0 0 0 0 10 10 0 0 0 0 0
7036 6862 175 459 302 292 477 703 710 467 438 445 430 401 375 367 270 192 161 100 72 261595 1421 175 413 248 207 152 125 65 8 0 28 0 0 0 0 0 0 0 0 0 05441 5441 0 46 54 85 325 578 645 459 438 417 430 401 375 367 270 192 161 100 72 26
Note: In the Thriving Towns and Villages Policy Area - no sites are forecast to deliver dwellings after the end of the JLP Plan period ier after 31 March 2034
TOTAL (note : no discount for future lapsing applied)Large site Planning Permissions (not allocations) Sub total
JLP Allocations Sub total
THRIVING TOWNS AND VILLAGES POLICY AREA HOUSING TRAJECTORY - 31 MARCH 2016 MONITORING POINT Publication date : 06 October 2017
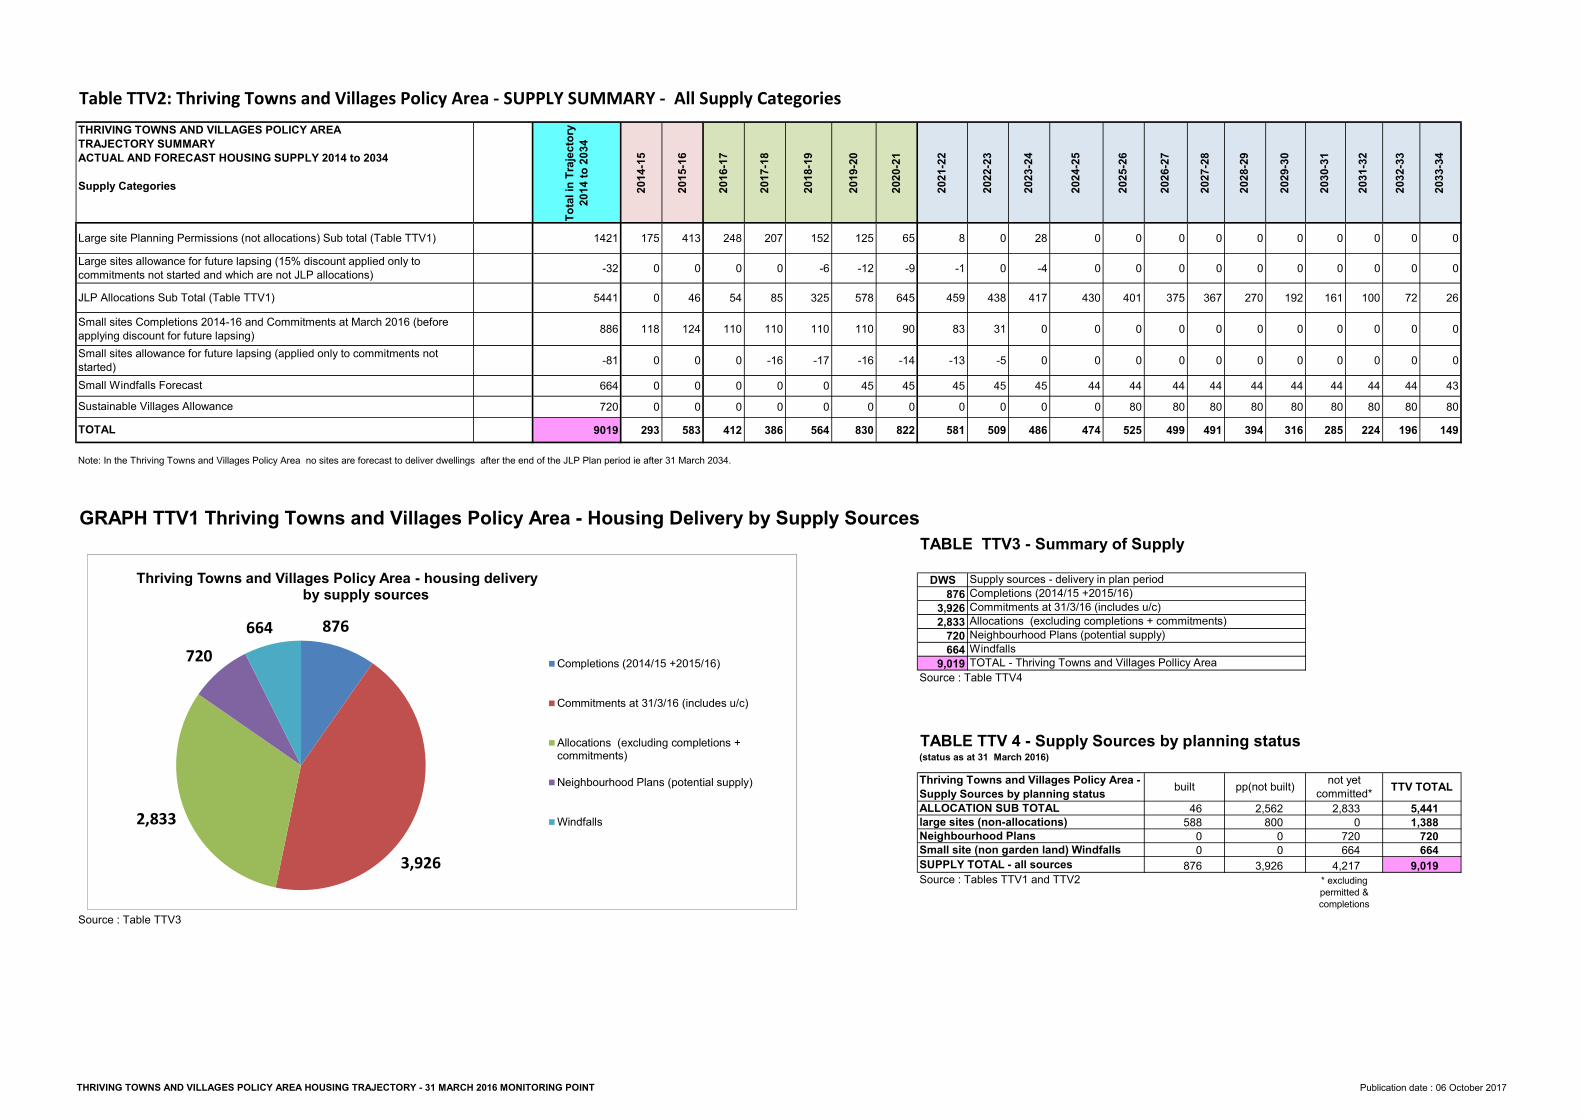
Table TTV2: Thriving Towns and Villages Policy Area - SUPPLY SUMMARY - All Supply Categories
Total
in Tr
ajecto
ry
2014 t
o 2034
2014-1
5
2015-1
6
2016-1
7
2017-1
8
2018-1
9
2019-2
0
2020-2
1
2021-2
2
2022-2
3
2023-2
4
2024-2
5
2025-2
6
2026-2
7
2027-2
8
2028-2
9
2029-3
0
2030-3
1
2031-3
2
2032-3
3
2033-3
4
1421 175 413 248 207 152 125 65 8 0 28 0 0 0 0 0 0 0 0 0 0-32 0 0 0 0 -6 -12 -9 -1 0 -4 0 0 0 0 0 0 0 0 0 0
5441 0 46 54 85 325 578 645 459 438 417 430 401 375 367 270 192 161 100 72 26886 118 124 110 110 110 110 90 83 31 0 0 0 0 0 0 0 0 0 0 0
-81 0 0 0 -16 -17 -16 -14 -13 -5 0 0 0 0 0 0 0 0 0 0 0664 0 0 0 0 0 45 45 45 45 45 44 44 44 44 44 44 44 44 44 43720 0 0 0 0 0 0 0 0 0 0 0 80 80 80 80 80 80 80 80 80
9019 293 583 412 386 564 830 822 581 509 486 474 525 499 491 394 316 285 224 196 149Note: In the Thriving Towns and Villages Policy Area no sites are forecast to deliver dwellings after the end of the JLP Plan period ie after 31 March 2034.
GRAPH TTV1 Thriving Towns and Villages Policy Area - Housing Delivery by Supply SourcesTABLE TTV3 - Summary of Supply
DWS876
3,9262,833
720664
9,019Source : Table TTV4
TABLE TTV 4 - Supply Sources by planning status (status as at 31 March 2016)
Source : Tables TTV1 and TTV2
THRIVING TOWNS AND VILLAGES POLICY AREATRAJECTORY SUMMARYACTUAL AND FORECAST HOUSING SUPPLY 2014 to 2034 Supply Categories
JLP Allocations Sub Total (Table TTV1)
* excluding permitted & completions
6649,019
built
Supply sources - delivery in plan periodCompletions (2014/15 +2015/16)Commitments at 31/3/16 (includes u/c)Allocations (excluding completions + commitments)Neighbourhood Plans (potential supply)WindfallsTOTAL - Thriving Towns and Villages Pollicy Area
46588
00
TTV TOTAL5,4411,388
7204,217
not yet committed*
2,8330
720664
pp(not built)2,562
80000
3,926876
ALLOCATION SUB TOTALlarge sites (non-allocations)Neighbourhood PlansSmall site (non garden land) WindfallsSUPPLY TOTAL - all sources
Thriving Towns and Villages Policy Area - Supply Sources by planning status
Source : Table TTV3
Sustainable Villages AllowanceTOTAL
Large site Planning Permissions (not allocations) Sub total (Table TTV1)
Small sites Completions 2014-16 and Commitments at March 2016 (before applying discount for future lapsing)
Large sites allowance for future lapsing (15% discount applied only to commitments not started and which are not JLP allocations)
Small sites allowance for future lapsing (applied only to commitments not started)Small Windfalls Forecast
876
3,9262,833
720664
Thriving Towns and Villages Policy Area - housing delivery by supply sources
Completions (2014/15 +2015/16)
Commitments at 31/3/16 (includes u/c)
Allocations (excluding completions +commitments)Neighbourhood Plans (potential supply)
Windfalls
THRIVING TOWNS AND VILLAGES POLICY AREA HOUSING TRAJECTORY - 31 MARCH 2016 MONITORING POINT Publication date : 06 October 2017
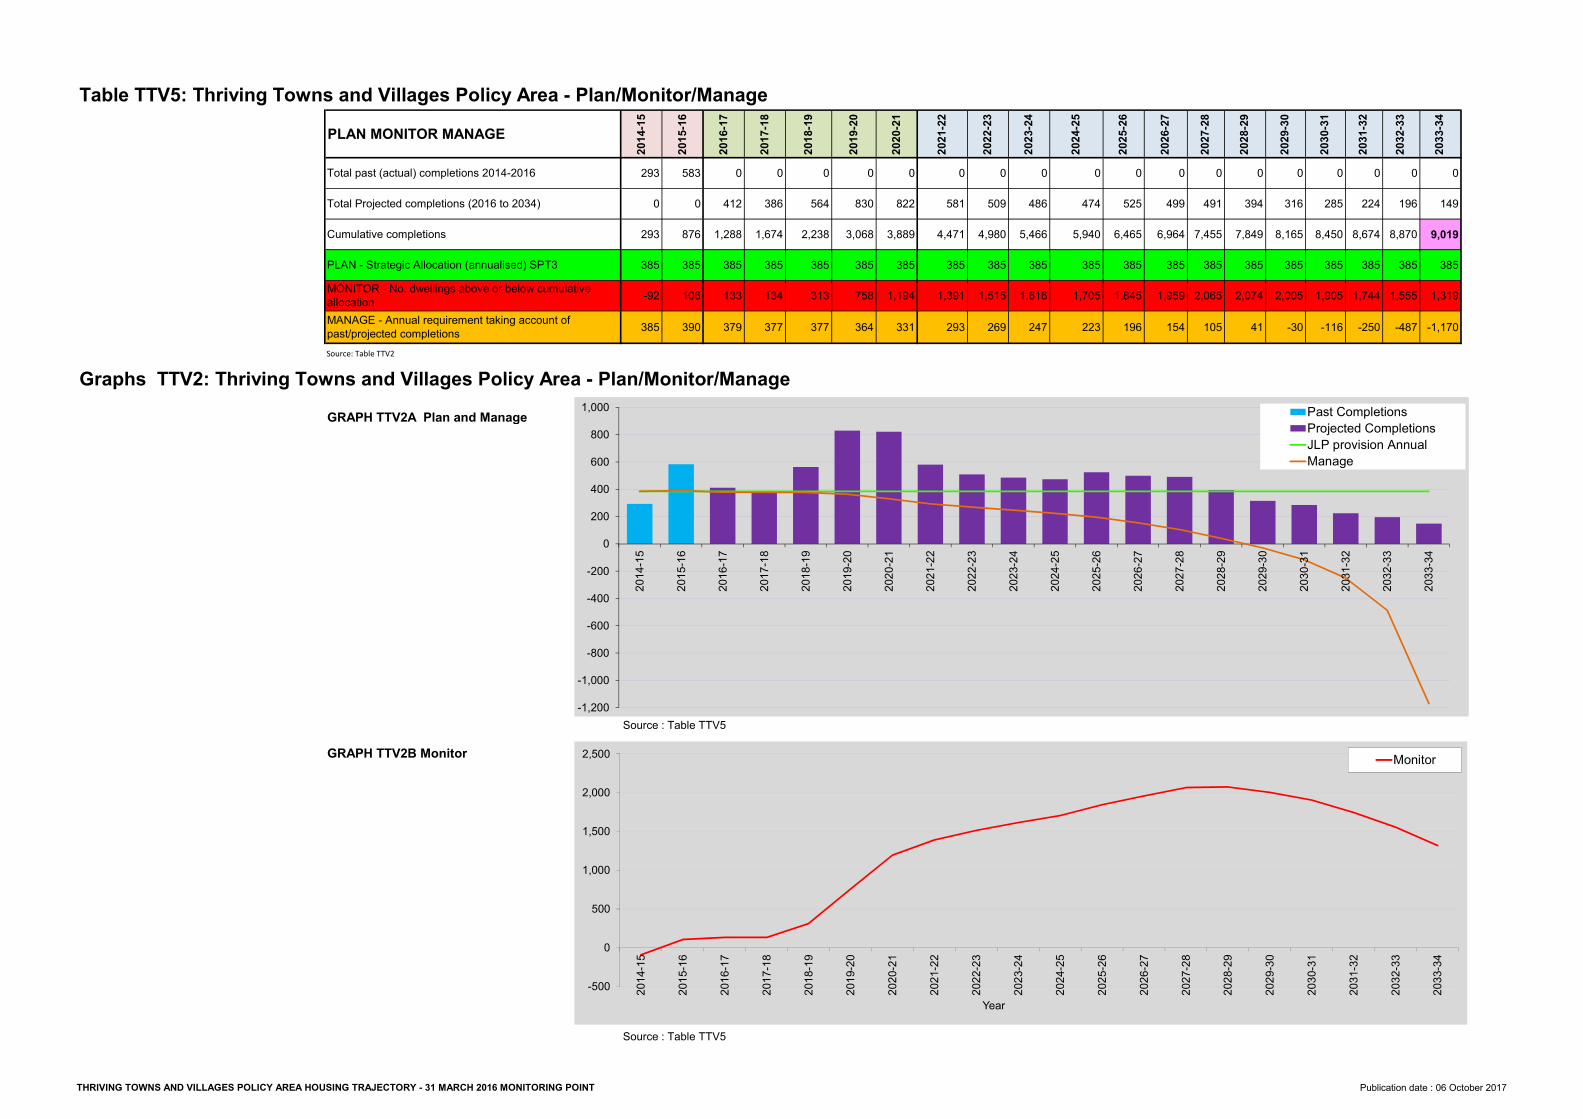
Table TTV5: Thriving Towns and Villages Policy Area - Plan/Monitor/Manage
2014-1
5
2015-1
6
2016-1
7
2017-1
8
2018-1
9
2019-2
0
2020-2
1
2021-2
2
2022-2
3
2023-2
4
2024-2
5
2025-2
6
2026-2
7
2027-2
8
2028-2
9
2029-3
0
2030-3
1
2031-3
2
2032-3
3
2033-3
4
293 583 0 0 0 0 0 0 0 0 0 0 0 0 0 0 0 0 0 00 0 412 386 564 830 822 581 509 486 474 525 499 491 394 316 285 224 196 149
293 876 1,288 1,674 2,238 3,068 3,889 4,471 4,980 5,466 5,940 6,465 6,964 7,455 7,849 8,165 8,450 8,674 8,870 9,019385 385 385 385 385 385 385 385 385 385 385 385 385 385 385 385 385 385 385 385-92 106 133 134 313 758 1,194 1,391 1,515 1,616 1,705 1,845 1,959 2,065 2,074 2,005 1,905 1,744 1,555 1,319385 390 379 377 377 364 331 293 269 247 223 196 154 105 41 -30 -116 -250 -487 -1,170
Source: Table TTV2
Graphs TTV2: Thriving Towns and Villages Policy Area - Plan/Monitor/Manage GRAPH TTV2A Plan and Manage
Source : Table TTV5GRAPH TTV2B Monitor
Source : Table TTV5
Total past (actual) completions 2014-2016Total Projected completions (2016 to 2034)Cumulative completionsPLAN - Strategic Allocation (annualised) SPT3MONITOR - No. dwellings above or below cumulative allocationMANAGE - Annual requirement taking account of past/projected completions
PLAN MONITOR MANAGE
-1,200-1,000
-800-600-400-200
0200400600800
1,000
2014-1
5
2015-1
6
2016-1
7
2017-1
8
2018-1
9
2019-2
0
2020-2
1
2021-2
2
2022-2
3
2023-2
4
2024-2
5
2025-2
6
2026-2
7
2027-2
8
2028-2
9
2029-3
0
2030-3
1
2031-3
2
2032-3
3
2033-3
4
Past CompletionsProjected CompletionsJLP provision AnnualManage
-500
0
500
1,000
1,500
2,000
2,500
2014-1
5
2015-1
6
2016-1
7
2017-1
8
2018-1
9
2019-2
0
2020-2
1
2021-2
2
2022-2
3
2023-2
4
2024-2
5
2025-2
6
2026-2
7
2027-2
8
2028-2
9
2029-3
0
2030-3
1
2031-3
2
2032-3
3
2033-3
4
Year
Monitor
THRIVING TOWNS AND VILLAGES POLICY AREA HOUSING TRAJECTORY - 31 MARCH 2016 MONITORING POINT Publication date : 06 October 2017
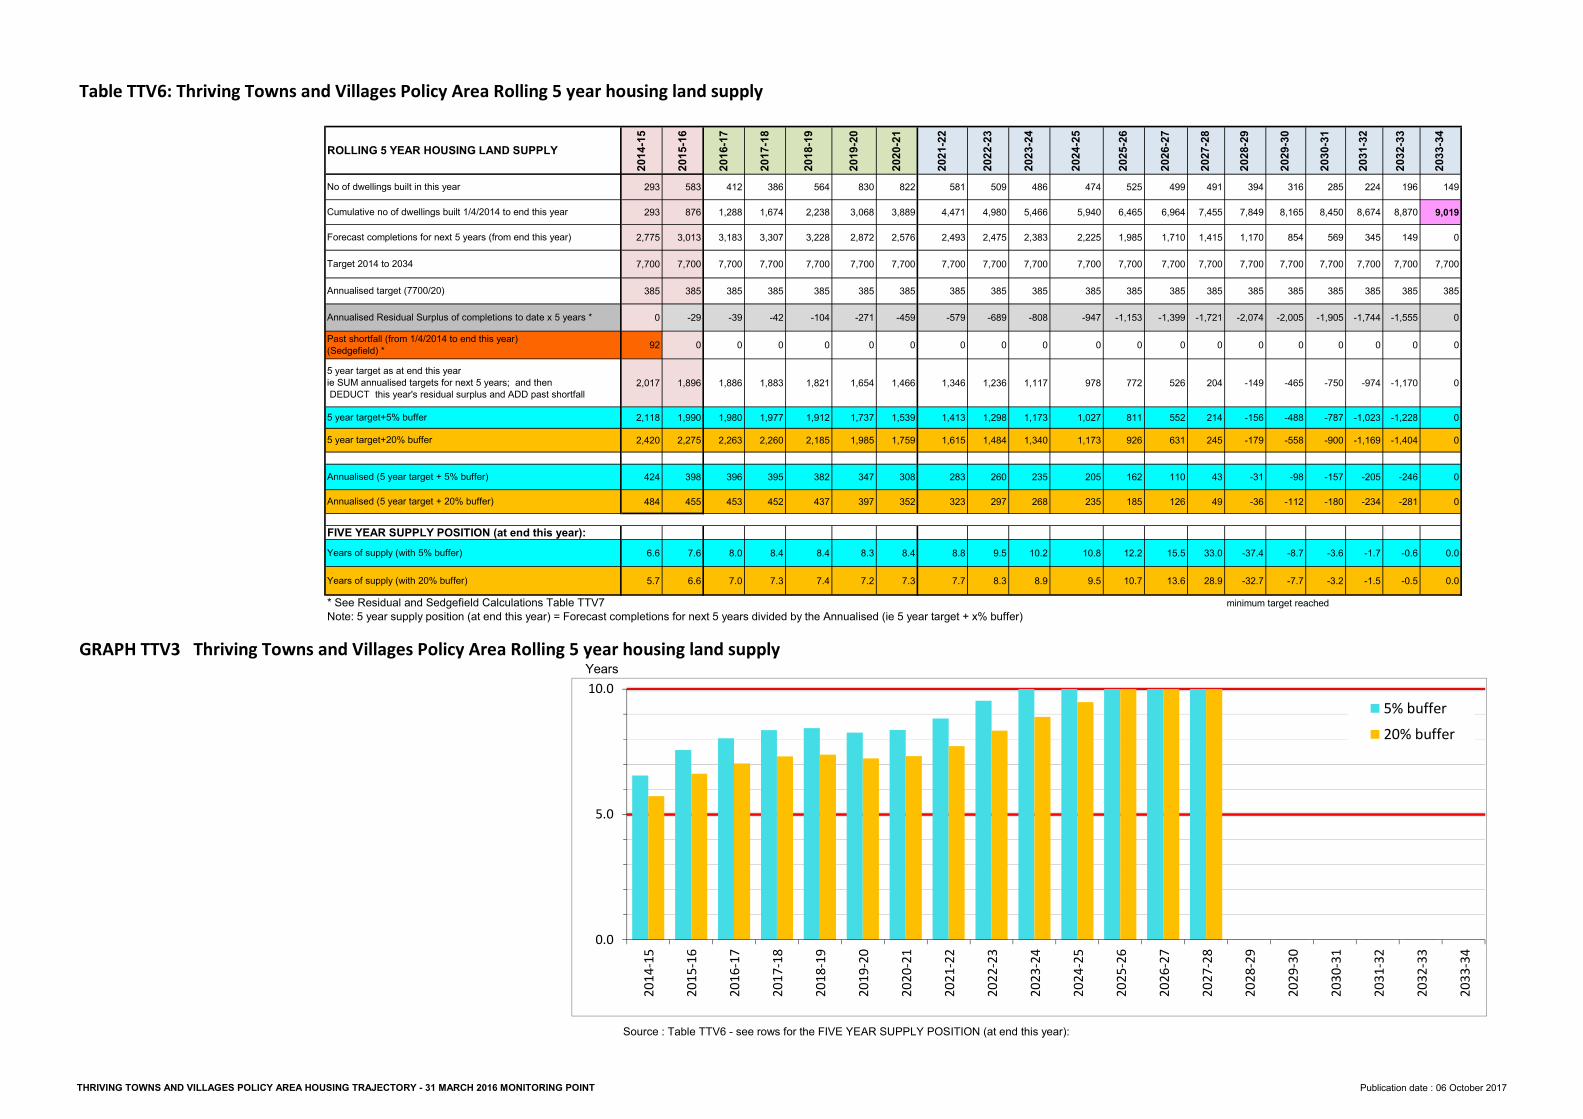
Table TTV6: Thriving Towns and Villages Policy Area Rolling 5 year housing land supply
2014-1
5
2015-1
6
2016-1
7
2017-1
8
2018-1
9
2019-2
0
2020-2
1
2021-2
2
2022-2
3
2023-2
4
2024-2
5
2025-2
6
2026-2
7
2027-2
8
2028-2
9
2029-3
0
2030-3
1
2031-3
2
2032-3
3
2033-3
4
293 583 412 386 564 830 822 581 509 486 474 525 499 491 394 316 285 224 196 149293 876 1,288 1,674 2,238 3,068 3,889 4,471 4,980 5,466 5,940 6,465 6,964 7,455 7,849 8,165 8,450 8,674 8,870 9,019
2,775 3,013 3,183 3,307 3,228 2,872 2,576 2,493 2,475 2,383 2,225 1,985 1,710 1,415 1,170 854 569 345 149 07,700 7,700 7,700 7,700 7,700 7,700 7,700 7,700 7,700 7,700 7,700 7,700 7,700 7,700 7,700 7,700 7,700 7,700 7,700 7,700
385 385 385 385 385 385 385 385 385 385 385 385 385 385 385 385 385 385 385 3850 -29 -39 -42 -104 -271 -459 -579 -689 -808 -947 -1,153 -1,399 -1,721 -2,074 -2,005 -1,905 -1,744 -1,555 0
92 0 0 0 0 0 0 0 0 0 0 0 0 0 0 0 0 0 0 0
2,017 1,896 1,886 1,883 1,821 1,654 1,466 1,346 1,236 1,117 978 772 526 204 -149 -465 -750 -974 -1,170 0
2,118 1,990 1,980 1,977 1,912 1,737 1,539 1,413 1,298 1,173 1,027 811 552 214 -156 -488 -787 -1,023 -1,228 02,420 2,275 2,263 2,260 2,185 1,985 1,759 1,615 1,484 1,340 1,173 926 631 245 -179 -558 -900 -1,169 -1,404 0
424 398 396 395 382 347 308 283 260 235 205 162 110 43 -31 -98 -157 -205 -246 0484 455 453 452 437 397 352 323 297 268 235 185 126 49 -36 -112 -180 -234 -281 0
6.6 7.6 8.0 8.4 8.4 8.3 8.4 8.8 9.5 10.2 10.8 12.2 15.5 33.0 -37.4 -8.7 -3.6 -1.7 -0.6 0.0
5.7 6.6 7.0 7.3 7.4 7.2 7.3 7.7 8.3 8.9 9.5 10.7 13.6 28.9 -32.7 -7.7 -3.2 -1.5 -0.5 0.0* See Residual and Sedgefield Calculations Table TTV7 minimum target reachedNote: 5 year supply position (at end this year) = Forecast completions for next 5 years divided by the Annualised (ie 5 year target + x% buffer)
GRAPH TTV3 Thriving Towns and Villages Policy Area Rolling 5 year housing land supply Years
Source : Table TTV6 - see rows for the FIVE YEAR SUPPLY POSITION (at end this year):
FIVE YEAR SUPPLY POSITION (at end this year):
Cumulative no of dwellings built 1/4/2014 to end this yearForecast completions for next 5 years (from end this year)Target 2014 to 2034Annualised target (7700/20)Annualised Residual Surplus of completions to date x 5 years * Past shortfall (from 1/4/2014 to end this year) (Sedgefield) * 5 year target as at end this year ie SUM annualised targets for next 5 years; and then DEDUCT this year's residual surplus and ADD past shortfall5 year target+5% buffer5 year target+20% buffer
ROLLING 5 YEAR HOUSING LAND SUPPLY
No of dwellings built in this year
Years of supply (with 5% buffer)
Years of supply (with 20% buffer)
Annualised (5 year target + 5% buffer)Annualised (5 year target + 20% buffer)
0.0
5.0
10.0201
4-15
2015-1
6201
6-17
2017-1
8201
8-19
2019-2
0202
0-21
2021-2
2202
2-23
2023-2
4202
4-25
2025-2
6202
6-27
2027-2
8202
8-29
2029-3
0203
0-31
2031-3
2203
2-33
2033-3
4
5% buffer20% buffer
THRIVING TOWNS AND VILLAGES POLICY AREA HOUSING TRAJECTORY - 31 MARCH 2016 MONITORING POINT Publication date : 06 October 2017
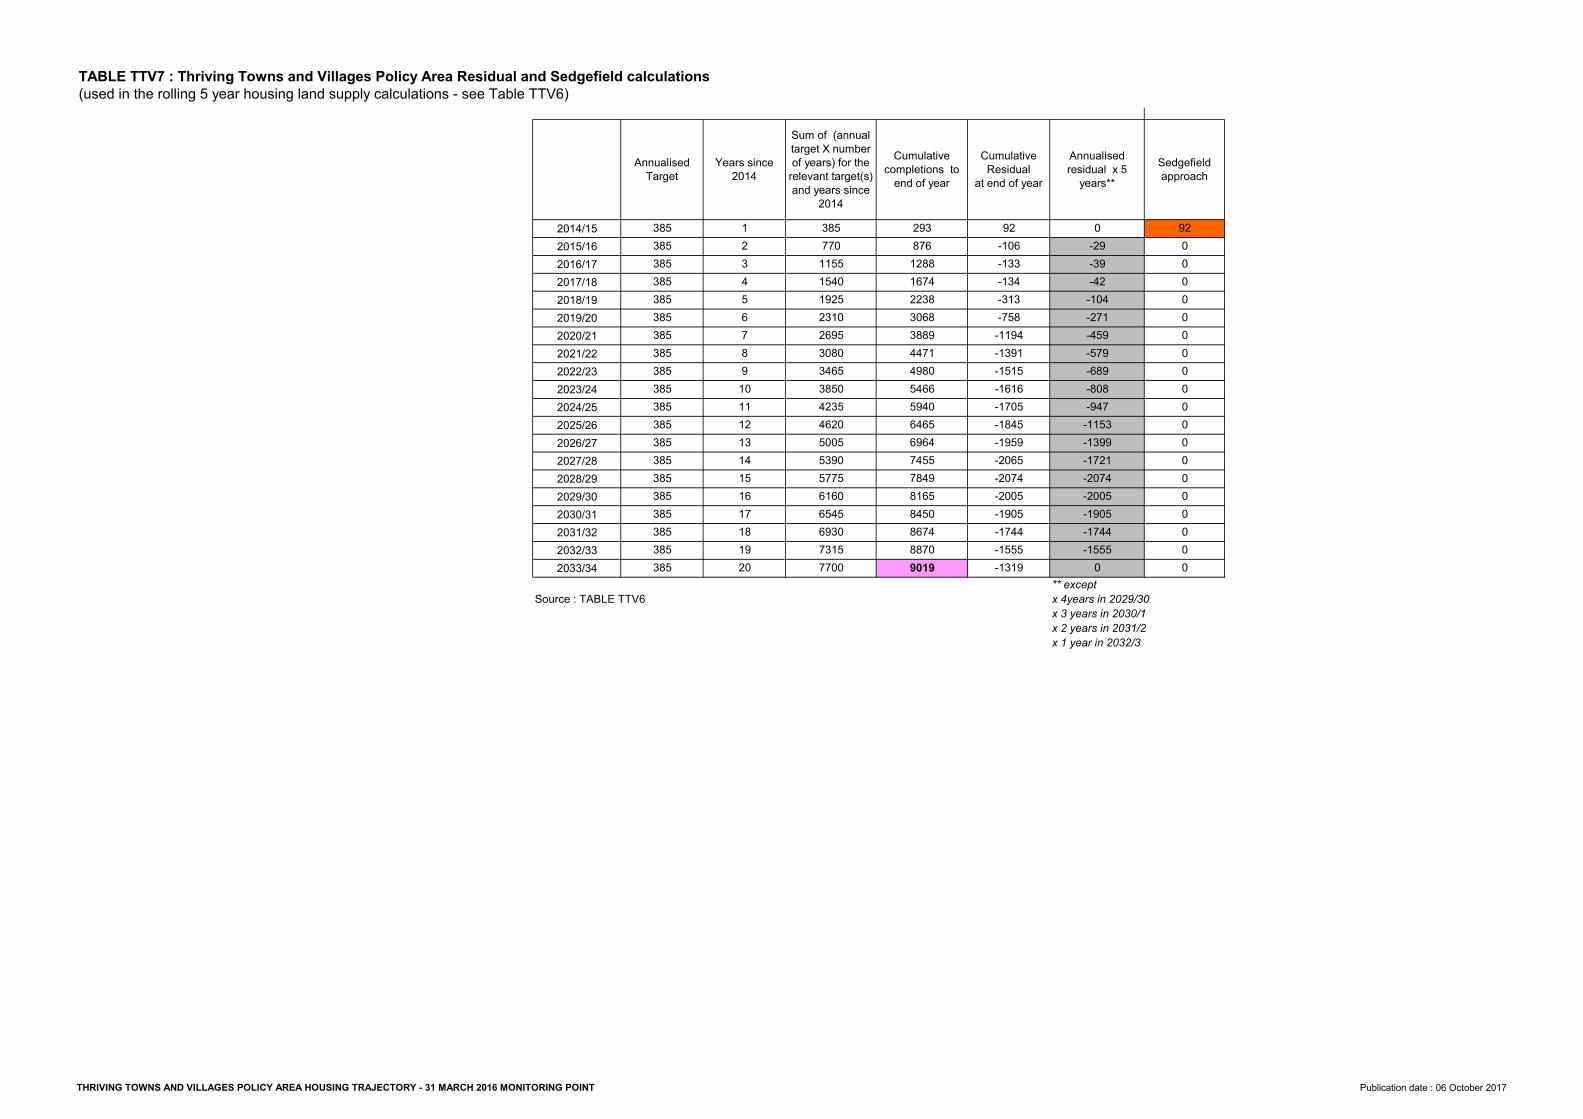
2014/152015/162016/172017/182018/192019/202020/212021/222022/232023/242024/252025/262026/272027/282028/292029/302030/312031/322032/332033/34
Source : TABLE TTV6
x 1 year in 2032/3
x 4years in 2029/30x 3 years in 2030/1x 2 years in 2031/2
** except
Annualised residual x 5
years**
TABLE TTV7 : Thriving Towns and Villages Policy Area Residual and Sedgefield calculations (used in the rolling 5 year housing land supply calculations - see Table TTV6)
0
Sedgefield approach
9200000000000
00
00000
0
0-29-39-42-104-271-459-579-689-808-947
-1153-1399
-1555
-1721-2074-2005-1905-1744
-1319
Cumulative Residual
at end of year
92-106-133-134-313-758
-1194-1391-1515-1616-1705-1845
-1744-1555
-1959-2065-2074-2005-1905
9019
Cumulative completions to
end of year
29387612881674223830683889447149805466594064656964
8870
74557849816584508674
385770115515401925
16171819
42354620500553905775
23102695308034653850
385
7700
6160654569307315
1112131415
385385385385385385385
385
385
385385385385385
Annualised Target
Sum of (annual target X number of years) for the
relevant target(s) and years since
2014
38520
Years since 2014
12345678910
385
385385385
THRIVING TOWNS AND VILLAGES POLICY AREA HOUSING TRAJECTORY - 31 MARCH 2016 MONITORING POINT Publication date : 06 October 2017
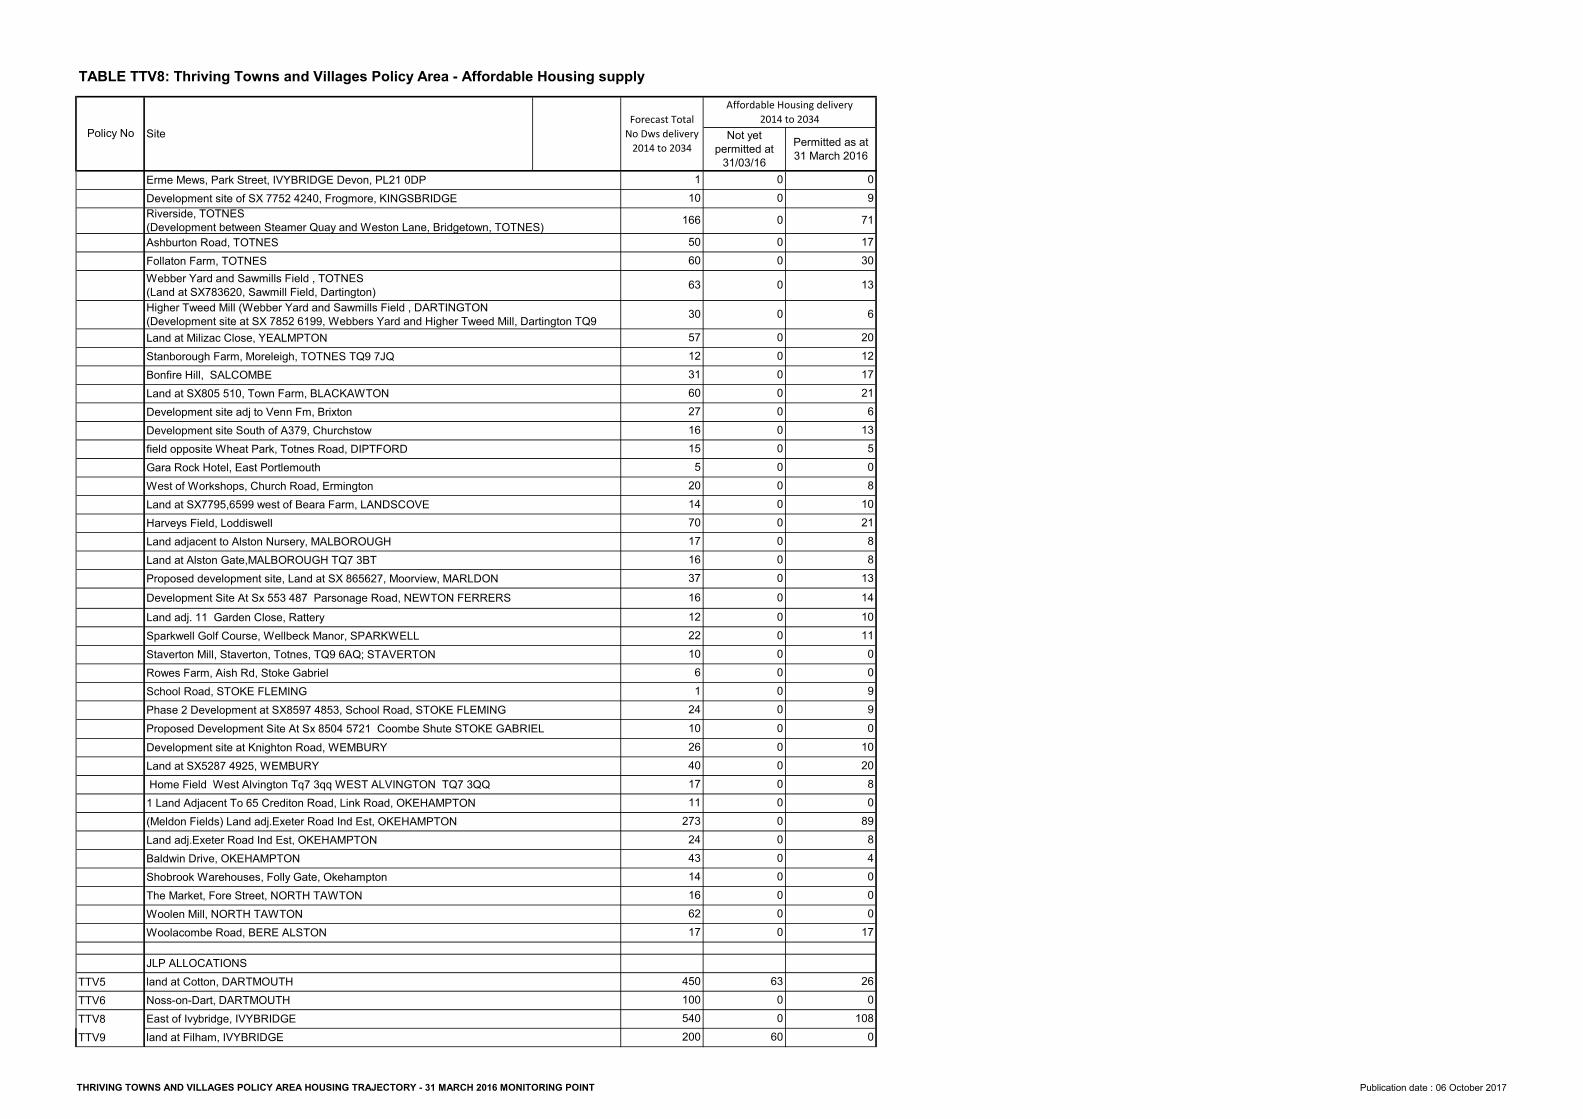
TTV5TTV6TTV8TTV9
Harveys Field, LoddiswellLand adjacent to Alston Nursery, MALBOROUGH
Proposed Development Site At Sx 8504 5721 Coombe Shute STOKE GABRIELDevelopment site at Knighton Road, WEMBURYLand at SX5287 4925, WEMBURY Home Field West Alvington Tq7 3qq WEST ALVINGTON TQ7 3QQ1 Land Adjacent To 65 Crediton Road, Link Road, OKEHAMPTON(Meldon Fields) Land adj.Exeter Road Ind Est, OKEHAMPTONLand adj.Exeter Road Ind Est, OKEHAMPTONBaldwin Drive, OKEHAMPTON
Land at Alston Gate,MALBOROUGH TQ7 3BTProposed development site, Land at SX 865627, Moorview, MARLDONDevelopment Site At Sx 553 487 Parsonage Road, NEWTON FERRERS Land adj. 11 Garden Close, RatterySparkwell Golf Course, Wellbeck Manor, SPARKWELLStaverton Mill, Staverton, Totnes, TQ9 6AQ; STAVERTONRowes Farm, Aish Rd, Stoke GabrielSchool Road, STOKE FLEMINGPhase 2 Development at SX8597 4853, School Road, STOKE FLEMING
Woolacombe Road, BERE ALSTONJLP ALLOCATIONSland at Cotton, DARTMOUTHNoss-on-Dart, DARTMOUTHEast of Ivybridge, IVYBRIDGE land at Filham, IVYBRIDGE
110
1665060633057123160271615
520147017163716
1711
27324
122210
61
24102640
540200
4314166217
450100
00000000000000000000000000
0000000
000000
0
6300
60
09
71173013
620121721
613
508
1021
88
13
2080
89
141011
00990
10
84000
17
260
1080
Policy No
TABLE TTV8: Thriving Towns and Villages Policy Area - Affordable Housing supply
Not yet permitted at
31/03/16Permitted as at 31 March 2016
Forecast Total No Dws delivery
2014 to 2034
Affordable Housing delivery 2014 to 2034
Site
Erme Mews, Park Street, IVYBRIDGE Devon, PL21 0DPDevelopment site of SX 7752 4240, Frogmore, KINGSBRIDGERiverside, TOTNES(Development between Steamer Quay and Weston Lane, Bridgetown, TOTNES)Ashburton Road, TOTNESFollaton Farm, TOTNESWebber Yard and Sawmills Field , TOTNES(Land at SX783620, Sawmill Field, Dartington)Higher Tweed Mill (Webber Yard and Sawmills Field , DARTINGTON(Development site at SX 7852 6199, Webbers Yard and Higher Tweed Mill, Dartington TQ9 Land at Milizac Close, YEALMPTONStanborough Farm, Moreleigh, TOTNES TQ9 7JQBonfire Hill, SALCOMBELand at SX805 510, Town Farm, BLACKAWTONDevelopment site adj to Venn Fm, BrixtonDevelopment site South of A379, Churchstow field opposite Wheat Park, Totnes Road, DIPTFORDGara Rock Hotel, East PortlemouthWest of Workshops, Church Road, ErmingtonLand at SX7795,6599 west of Beara Farm, LANDSCOVE
Shobrook Warehouses, Folly Gate, Okehampton The Market, Fore Street, NORTH TAWTONWoolen Mill, NORTH TAWTON
THRIVING TOWNS AND VILLAGES POLICY AREA HOUSING TRAJECTORY - 31 MARCH 2016 MONITORING POINT Publication date : 06 October 2017
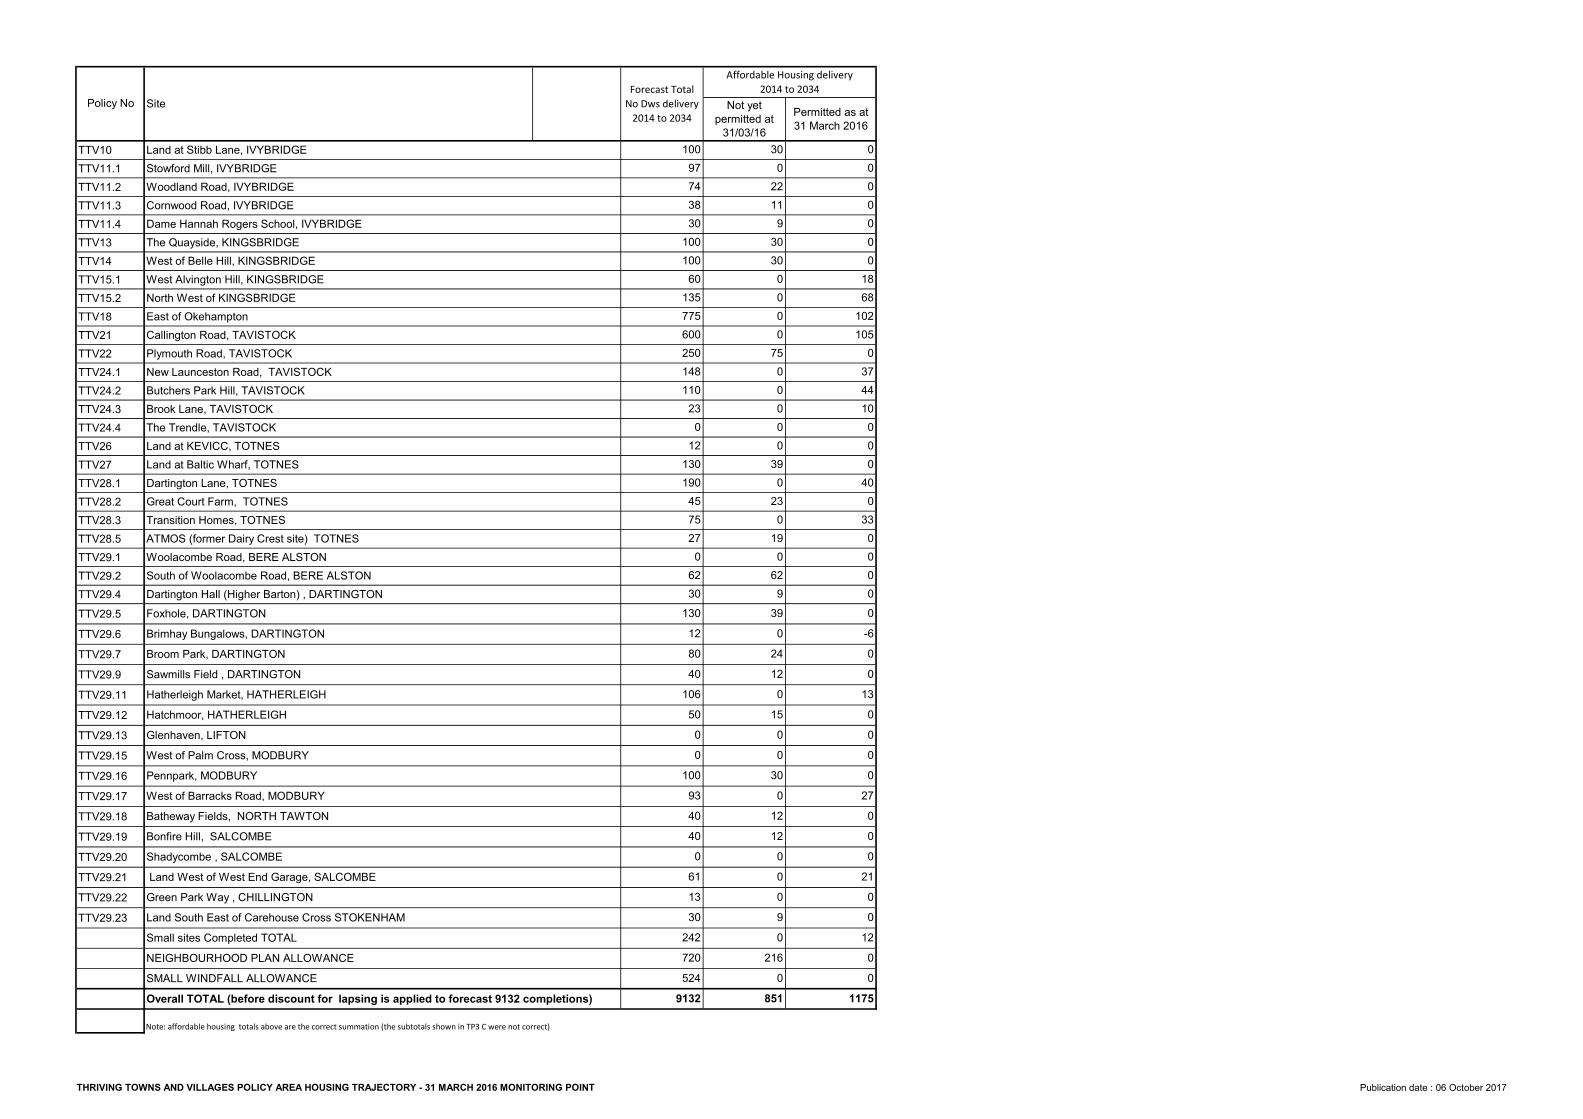
TTV10TTV11.1TTV11.2TTV11.3TTV11.4TTV13TTV14TTV15.1TTV15.2TTV18TTV21TTV22TTV24.1TTV24.2TTV24.3TTV24.4TTV26TTV27TTV28.1TTV28.2TTV28.3TTV28.5TTV29.1TTV29.2TTV29.4TTV29.5TTV29.6TTV29.7TTV29.9TTV29.11TTV29.12TTV29.13TTV29.15TTV29.16TTV29.17TTV29.18TTV29.19TTV29.20TTV29.21TTV29.22TTV29.23
Note: affordable housing totals above are the correct summation (the subtotals shown in TP3 C were not correct)
New Launceston Road, TAVISTOCKButchers Park Hill, TAVISTOCKBrook Lane, TAVISTOCKThe Trendle, TAVISTOCKLand at KEVICC, TOTNESLand at Baltic Wharf, TOTNES
Bonfire Hill, SALCOMBEShadycombe , SALCOMBE Land West of West End Garage, SALCOMBEGreen Park Way , CHILLINGTONLand South East of Carehouse Cross STOKENHAMSmall sites Completed TOTALNEIGHBOURHOOD PLAN ALLOWANCESMALL WINDFALL ALLOWANCEOverall TOTAL (before discount for lapsing is applied to forecast 9132 completions) 9132
10097743830
11023
012
130190
4575
100100
60135775600250148
10650
00
10093
270
6230
130128040
851
2211
93030
00
300
039
023
019
062
00
750000
00
300
1212
00
939
02412
015
1175
01868
102105
0
00000
013
0000
27
0-60
242 0 12
0
000
2100
0
09
2160524
4040
0611330
720
330000
0
374410
000
400
Policy No Site Forecast Total
No Dws delivery2014 to 2034
Affordable Housing delivery 2014 to 2034
Not yet permitted at
31/03/16Permitted as at 31 March 2016
Land at Stibb Lane, IVYBRIDGEStowford Mill, IVYBRIDGEWoodland Road, IVYBRIDGECornwood Road, IVYBRIDGEDame Hannah Rogers School, IVYBRIDGEThe Quayside, KINGSBRIDGE
Pennpark, MODBURYWest of Barracks Road, MODBURYBatheway Fields, NORTH TAWTON
West of Belle Hill, KINGSBRIDGEWest Alvington Hill, KINGSBRIDGENorth West of KINGSBRIDGE
Broom Park, DARTINGTONSawmills Field , DARTINGTONHatherleigh Market, HATHERLEIGHHatchmoor, HATHERLEIGHGlenhaven, LIFTONWest of Palm Cross, MODBURY
Dartington Lane, TOTNESGreat Court Farm, TOTNESTransition Homes, TOTNESATMOS (former Dairy Crest site) TOTNESWoolacombe Road, BERE ALSTONSouth of Woolacombe Road, BERE ALSTONDartington Hall (Higher Barton) , DARTINGTONFoxhole, DARTINGTONBrimhay Bungalows, DARTINGTON
East of OkehamptonCallington Road, TAVISTOCKPlymouth Road, TAVISTOCK
THRIVING TOWNS AND VILLAGES POLICY AREA HOUSING TRAJECTORY - 31 MARCH 2016 MONITORING POINT Publication date : 06 October 2017


![Market Declines and Volatility - Unbranded (7) [Read-Only] Management... · 2020-07-01 · 7kh 0dunhw¶v 5hvsrqvh wr &ulvlv ,q 86 grooduv 5hsuhvhqwv fxpxodwlyh wrwdo uhwxuqv ri d](https://img.pdfslide.us/doc/110x75/5f465ca83d97ff2ec730aade/market-declines-and-volatility-unbranded-7-read-only-management-2020-07-01.jpg)


![Presentation1 - Built Environment UNSW present… · 3DVW 'HILQLWLRQV d } v v ] U ^ ] u u o U t ] Z U W l Y ] À ] } u u µ v ] Ç v } ] Ç } u u µ v ] Ç A Ç ] o o Ç µ o U o](https://img.pdfslide.us/doc/110x75/5ecdb7cf8182b53df94d6d77/presentation1-built-environment-unsw-present-3dvw-hilqlwlrqv-d-v-v-u-.jpg)

![una grammatica semplificata by Lewis Baker - Home - Esercizi supplementari … · 2019. 11. 30. · (vhufl]l ± 3uhvhqw shuihfw vlpsoh ru 3dvw vlpsoh 6hl pdl vwdwd lq 6fr]ld" +r vwxgldwr](https://img.pdfslide.us/doc/110x75/60cb631ae072980ad370df36/una-grammatica-semplificata-by-lewis-baker-home-esercizi-supplementari-2019.jpg)


![Esercizi supplementari pdf full - lewisdispensa.com · (vhufl]l ± 3uhvhqw shuihfw vlpsoh ru 3dvw vlpsoh 6hl pdl vwdwd lq 6fr]ld" +r vwxgldwr lo iudqfhvh do olfhr pd qrq ulfrugr qlhqwh](https://img.pdfslide.us/doc/110x75/5fa2967ad3422d49407dcc91/esercizi-supplementari-pdf-full-vhufll-3uhvhqw-shuihfw-vlpsoh-ru-3dvw-vlpsoh.jpg)


![v P î ì í õ ^ î í ò W W } P u u ] v P ] } v · 5hylhz 2i 0hpru\ /d\rxw 0hpru\ doorfdwlrq vwudwhjlhv ± 6wdwlf frpsloh wlph &rgh *oredov 2zqyduldeohv ([solflw frqvwdqwv lqfoxglqj](https://img.pdfslide.us/doc/110x75/5cf9efcc88c993146c8b6b78/v-p-i-i-i-o-i-i-o-w-w-p-u-u-v-p-v-5hylhz-2i-0hpru-drxw-0hpru.jpg)

![Satish NZ Credit and finance institute April 2019 delinked€¦ · o ] ( ] ] } v w wzkd d 3dvw ilyh \hduv 3rsxodwlrq jurzwk 5htxluhv durxqg dgglwlrqdo krphv :h exlow durxqg dgglwlrq](https://img.pdfslide.us/doc/110x75/5f41bcb194899e0e0779c8f6/satish-nz-credit-and-finance-institute-april-2019-delinked-o-v-w-wzkd.jpg)