Embed Size (px)
Citation preview
Jupiter European Absolute Return Fund
Stephen PearsonCédric de Fonclare
October 2009
1
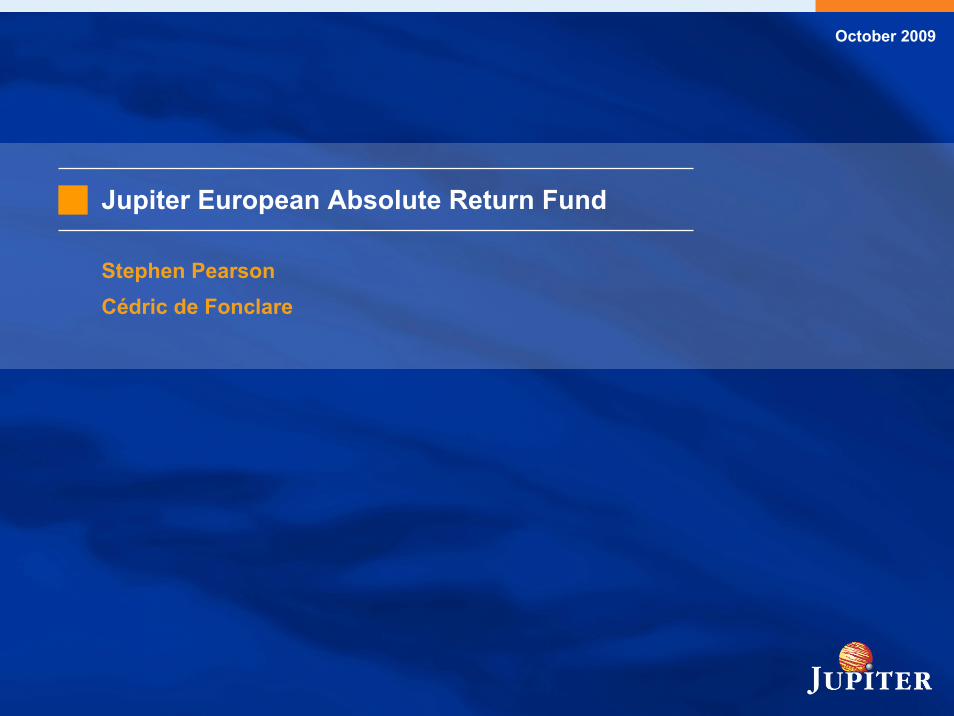
Agenda
Pan European Equity long/short absolute return fund: Objective: attractive long-term returns with limited volatility
Diversified portfolio of long and short equity positions in Pan-European stock markets
Strong alignment of investors and fund managers’ interests: performance fee payable above cash hurdle rate
Regulated framework under the UCITS III directiveDaily liquidity
Increased transparency
Broad investment policies
A combination of experienced managers 15 years of track record in long/short and long only European equities
Proven track record
Investment process & risk managementFundamental ‘bottom up’ stock picking, based on direct company contact
Strict diversification and strong risk controls applied
Investment return above cash with limited volatility
Current targets:
Return: Approx. 8 – 10% net
Volatility: 5 – 8% annualised
2
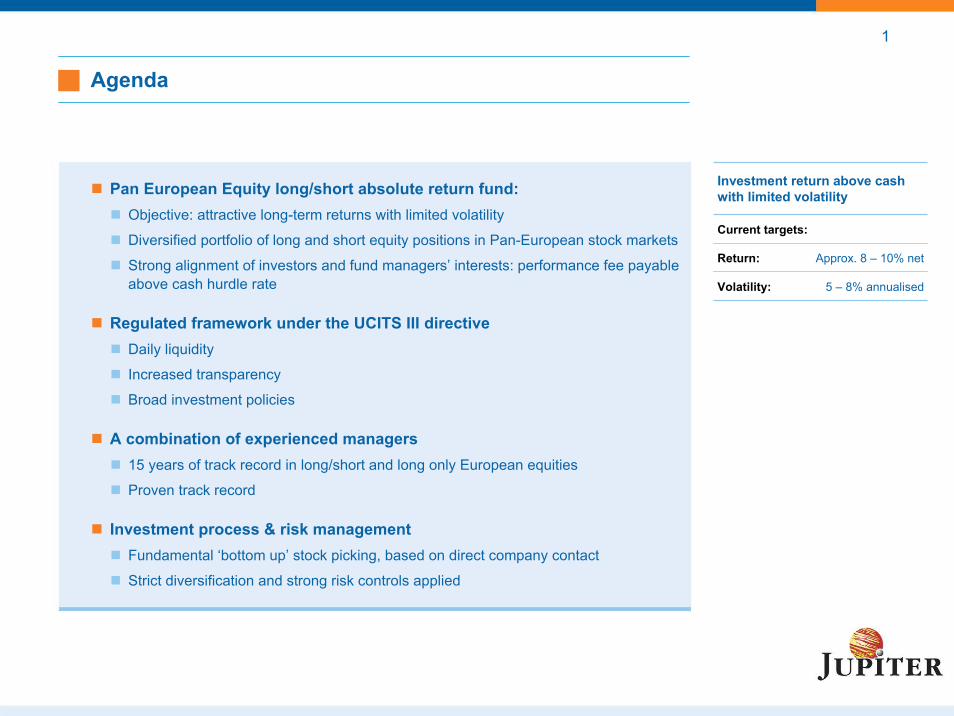
Jupiter Asset Management
Company profileJupiter is a leading equity investment house
Majority owned by employees with a minority stake held by T.A. Associates
$34 billion AUM1 across product and investor segments with $3992 million in hedge funds
Comprehensive asset management infrastructure for hedge and long only products
Competitive advantagesBroad access to senior company management
Unconstrained approach which has led to sustained alpha generation
Stable, focused and award winning investment team3
1. As of October 31, 2009. 2. As of October 31, 2009. 3. Source: EDHEC, Europerformance , Awarded to Jupiter Unit Trust Managers for the management of Unit Trust funds.

3
Investment team
Fund Managers’ biographies
Stephen Pearson
2001 - Current Jupiter Asset ManagementFund Manager: European equity long/shortJupiter Europa Hedge Fund Ltd
1994 - 2001 Sloane Robinson Investment Management
1986 - 1994 GT Management
Education Classics (Oxford University)
Cédric de Fonclare
1999 - Current Jupiter Asset ManagementFund Manager: European equities Pan European &European ex-UK strategies
Education International Business Administration (Sorbonne University)
Mathematics (Imperial College), CFAEducation
Credit Suisse – Analyst2000 - 2003
Mike Buhl-Nielsen
2006 - Current Jupiter Asset ManagementFund Manager: European equity long/short
2003 - 2006 Centaurus Capital – Analyst
Greg Herbert
2005 - Current Jupiter Asset ManagementAnalyst: European Equities
Education Modern Languages (Bristol University)MSC International Relations (LSE)MSC Investment Management (Cass Business School)
Supported by
4
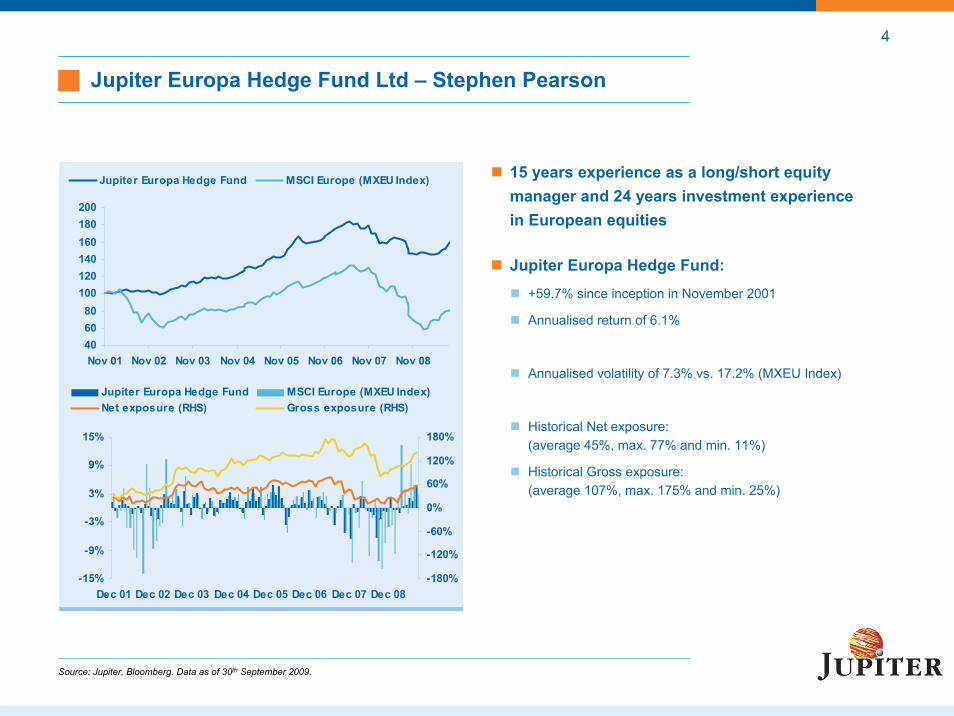
Jupiter Europa Hedge Fund Ltd – Stephen Pearson
15 years experience as a long/short equity manager and 24 years investment experiencein European equities
Jupiter Europa Hedge Fund: +59.7% since inception in November 2001
Annualised return of 6.1%
Annualised volatility of 7.3% vs. 17.2% (MXEU Index)
Historical Net exposure: (average 45%, max. 77% and min. 11%)
Historical Gross exposure:(average 107%, max. 175% and min. 25%)
Source: Jupiter, Bloomberg. Data as of 30th September 2009.
406080
100120140160180200
Nov 01 Nov 02 Nov 03 Nov 04 Nov 05 Nov 06 Nov 07 Nov 08
Jupiter Europa Hedge Fund MSCI Europe (MXEU Index)
-15%
-9%
-3%
3%
9%
15%
Dec 01 Dec 02 Dec 03 Dec 04 Dec 05 Dec 06 Dec 07 Dec 08-180%
-120%
-60%
0%
60%
120%
180%
Jupiter Europa Hedge Fund MSCI Europe (MXEU Index)Net exposure (RHS) Gross exposure (RHS)
5
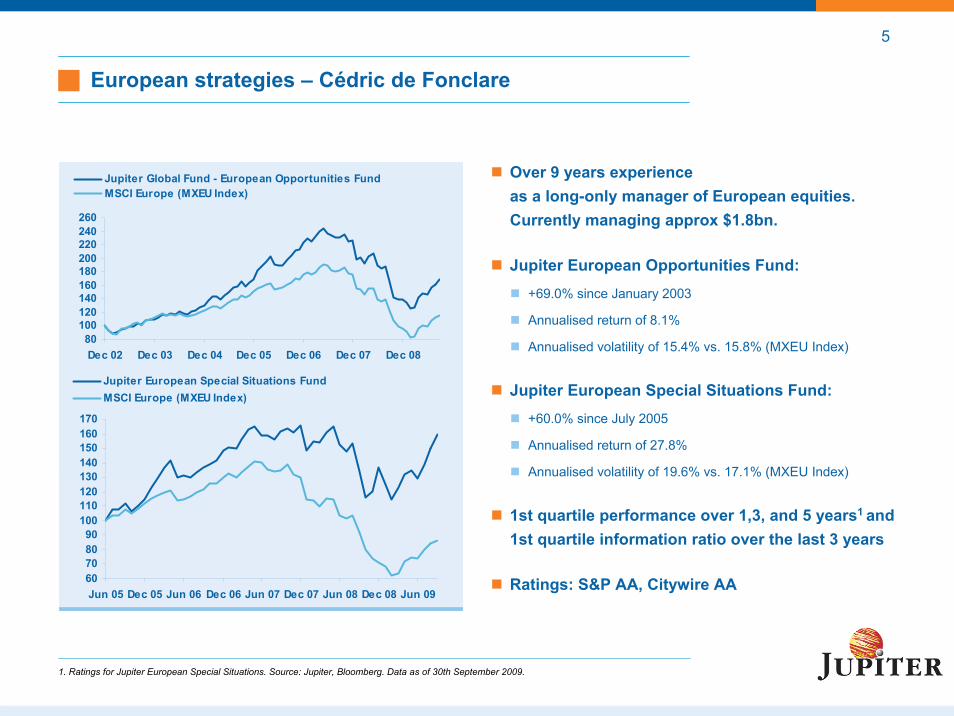
European strategies – Cédric de Fonclare
Over 9 years experience as a long-only manager of European equities. Currently managing approx $1.8bn.
Jupiter European Opportunities Fund:+69.0% since January 2003
Annualised return of 8.1%
Annualised volatility of 15.4% vs. 15.8% (MXEU Index)
Jupiter European Special Situations Fund:+60.0% since July 2005
Annualised return of 27.8%
Annualised volatility of 19.6% vs. 17.1% (MXEU Index)
1st quartile performance over 1,3, and 5 years1 and 1st quartile information ratio over the last 3 years
Ratings: S&P AA, Citywire AA
1. Ratings for Jupiter European Special Situations. Source: Jupiter, Bloomberg. Data as of 30th September 2009.
80100120140160180200220240260
Dec 02 Dec 03 Dec 04 Dec 05 Dec 06 Dec 07 Dec 08
Jupiter Global Fund - European Opportunities FundMSCI Europe (MXEU Index)
60708090
100110120130140150160170
Jun 05 Dec 05 Jun 06 Dec 06 Jun 07 Dec 07 Jun 08 Dec 08 Jun 09
Jupiter European Special Situations FundMSCI Europe (MXEU Index)
66
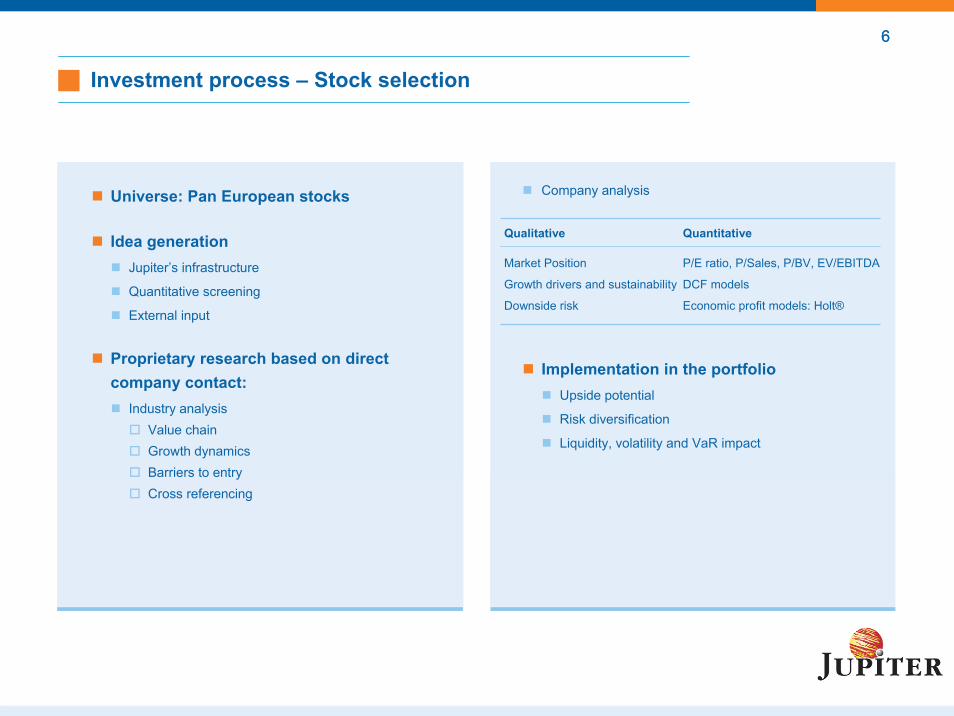
Investment process – Stock selection
Universe: Pan European stocks
Idea generationJupiter’s infrastructure
Quantitative screening
External input
Proprietary research based on direct company contact:
Industry analysis Value chainGrowth dynamicsBarriers to entryCross referencing
Qualitative Quantitative
Market Position
Growth drivers and sustainability
Downside risk
P/E ratio, P/Sales, P/BV, EV/EBITDA
DCF models
Economic profit models: Holt®
Company analysis
Implementation in the portfolioUpside potential
Risk diversification
Liquidity, volatility and VaR impact
7
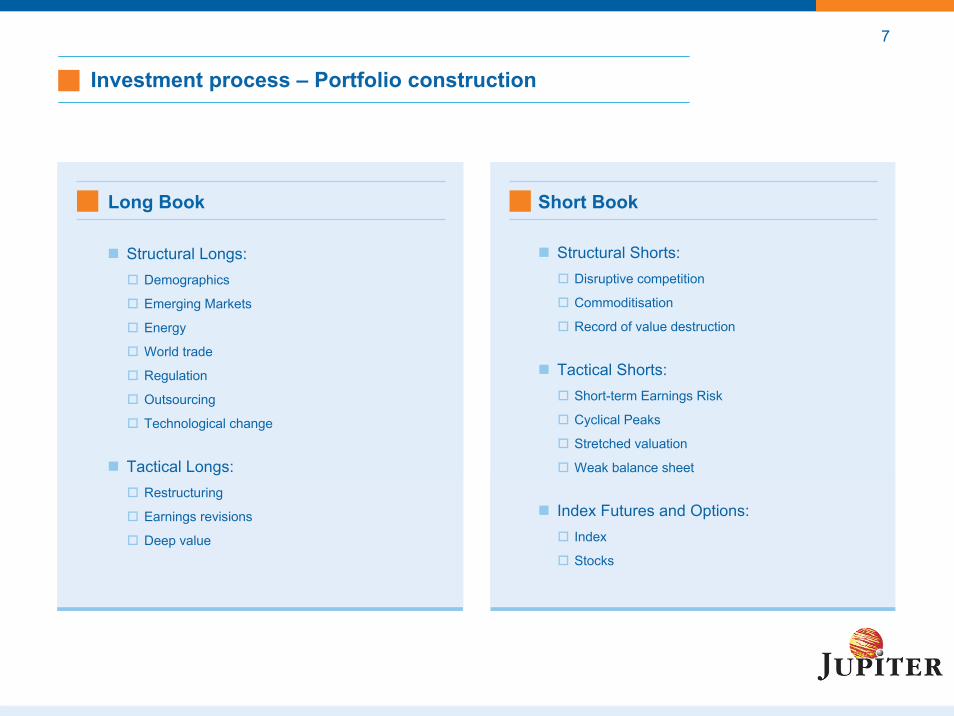
Structural Longs: Demographics
Emerging Markets
Energy
World trade
Regulation
Outsourcing
Technological change
Tactical Longs: Restructuring
Earnings revisions
Deep value
Long Book
Structural Shorts: Disruptive competition
Commoditisation
Record of value destruction
Tactical Shorts: Short-term Earnings Risk
Cyclical Peaks
Stretched valuation
Weak balance sheet
Short Book
Index Futures and Options: Index
Stocks
Investment process – Portfolio construction
88
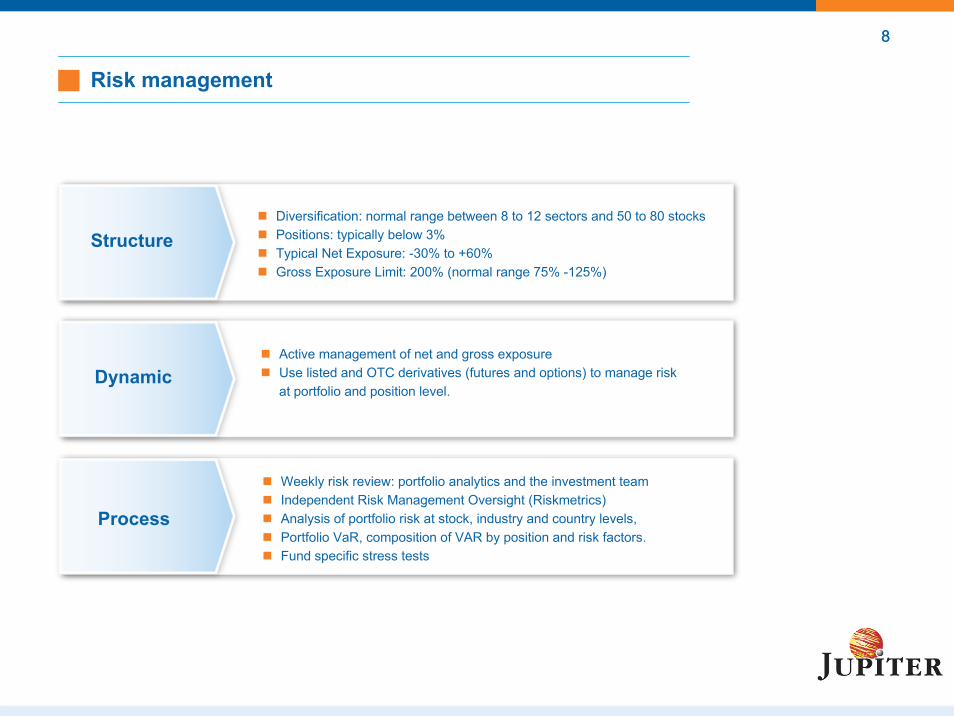
Risk management
Structure
Process
Dynamic
Diversification: normal range between 8 to 12 sectors and 50 to 80 stocksPositions: typically below 3% Typical Net Exposure: -30% to +60% Gross Exposure Limit: 200% (normal range 75% -125%)
Weekly risk review: portfolio analytics and the investment teamIndependent Risk Management Oversight (Riskmetrics)Analysis of portfolio risk at stock, industry and country levels, Portfolio VaR, composition of VAR by position and risk factors.Fund specific stress tests
Active management of net and gross exposure Use listed and OTC derivatives (futures and options) to manage risk at portfolio and position level.
9
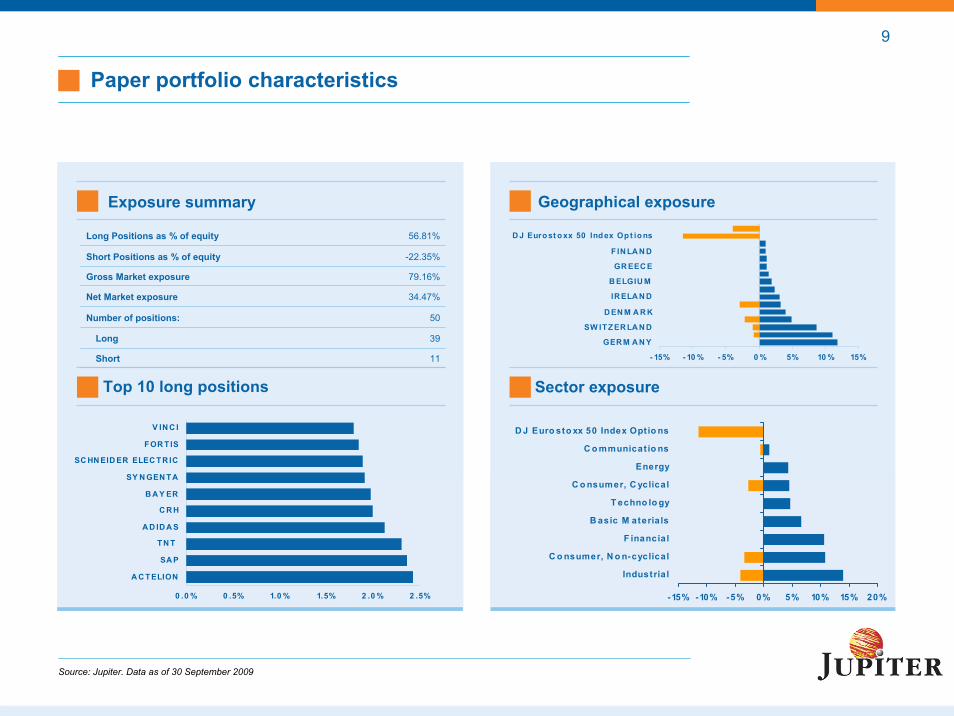
Paper portfolio characteristics
Exposure summary Geographical exposure
Sector exposureTop 10 long positions
Long Positions as % of equity 56.81%
Short Positions as % of equity -22.35%
Gross Market exposure 79.16%
Net Market exposure 34.47%
Number of positions: 50
Long 39
Short 11
Source: Jupiter. Data as of 30 September 2009
-15% -10% -5% 0% 5% 10% 15% 20%
Industria l
C o nsumer, N o n-cyclical
F inancial
B asic M ateria ls
T echno lo gy
C o nsumer, C yclical
Energy
C o mmunicat io ns
D J Euro sto xx 50 Index Optio ns
- 15% - 10 % - 5% 0 % 5% 10 % 15%
GER M A N Y
SW ITZER LA N D
D EN M A R K
IR ELA N D
B ELGIU M
GR EEC E
FIN LA N D
D J Eurost oxx 50 Index Opt ions
0 .0 % 0 .5% 1.0 % 1.5% 2 .0 % 2 .5%
A C TELION
SA P
T N T
A D ID A S
C R H
B A Y ER
SY N GEN T A
SC HN EID ER ELEC T R IC
F OR T IS
V IN C I
10
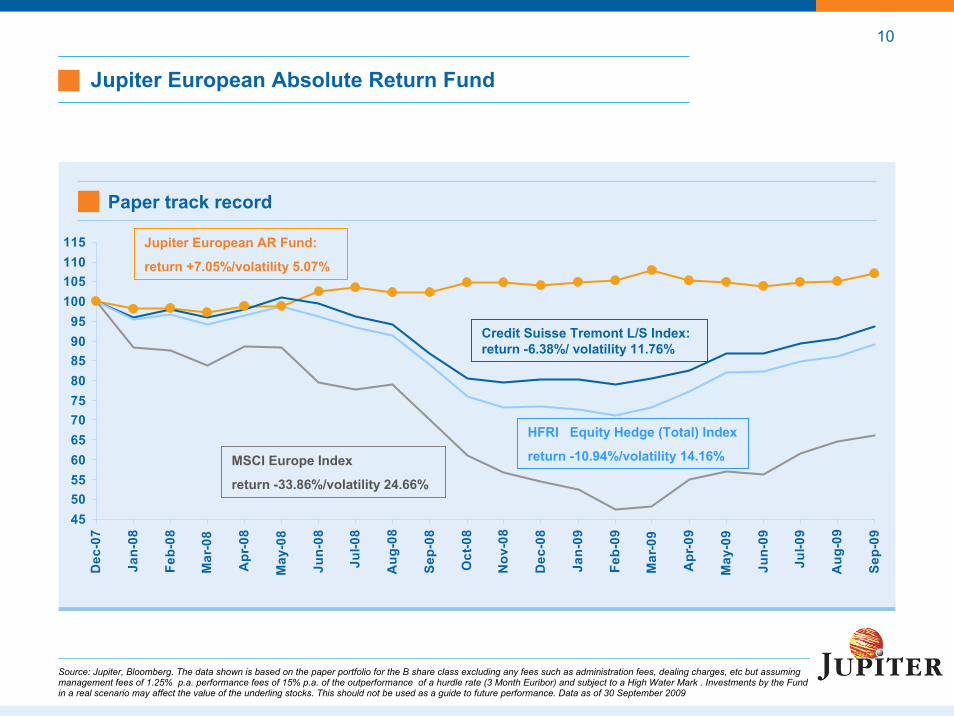
Jupiter European Absolute Return Fund
Paper track record
4550556065707580859095
100105110115
Dec
-07
Jan-
08
Feb-
08
Mar
-08
Apr
-08
May
-08
Jun-
08
Jul-0
8
Aug
-08
Sep-
08
Oct
-08
Nov
-08
Dec
-08
Jan-
09
Feb-
09
Mar
-09
Apr
-09
May
-09
Jun-
09
Jul-0
9
Aug
-09
Sep-
09
Jupiter European AR Fund:
return +7.05%/volatility 5.07%
Credit Suisse Tremont L/S Index: return -6.38%/ volatility 11.76%
MSCI Europe Index
return -33.86%/volatility 24.66%
HFRI Equity Hedge (Total) Index
return -10.94%/volatility 14.16%
Source: Jupiter, Bloomberg. The data shown is based on the paper portfolio for the B share class excluding any fees such as administration fees, dealing charges, etc but assuming management fees of 1.25% p.a. performance fees of 15% p.a. of the outperformance of a hurdle rate (3 Month Euribor) and subject to a High Water Mark . Investments by the Fund in a real scenario may affect the value of the underling stocks. This should not be used as a guide to future performance. Data as of 30 September 2009
11
Why invest in Jupiter European Absolute Return Fund?
Aim to deliver attractive risk adjusted returns across market cycles
Stable and experienced investment team with proven track record on the long only and long/short equity
Jupiter’s expertise and technical support on operations and management of offshore and UCITS investment vehicles
12
Market outlook
Liquidity trends
Earnings momentum
Valuation
Dispersion
13
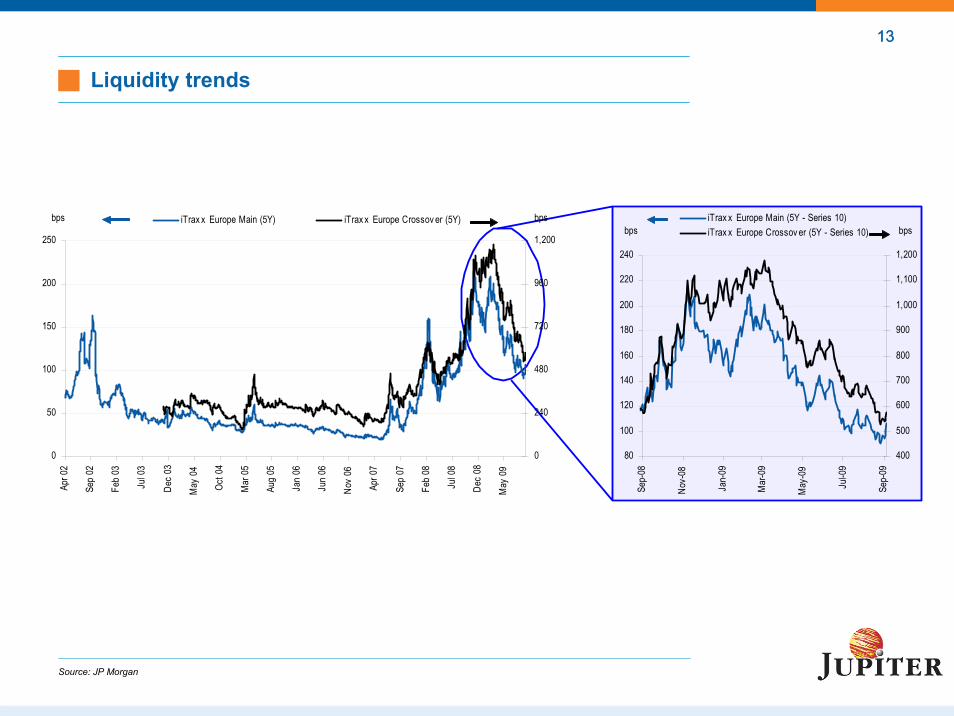
Liquidity trends
0
50
100
150
200
250
Apr 0
2
Sep
02
Feb
03
Jul 0
3
Dec
03
May
04
Oct 0
4
Mar
05
Aug
05
Jan
06
Jun
06
Nov
06
Apr 0
7
Sep
07
Feb
08
Jul 0
8
Dec
08
May
09
0
240
480
720
960
1,200
iTrax x Europe Main (5Y) iTrax x Europe Crossov er (5Y)bps bps
80
100
120
140
160
180
200
220
240
Sep-
08
Nov-
08
Jan-
09
Mar
-09
May
-09
Jul-0
9
Sep-
09
400
500
600
700
800
900
1,000
1,100
1,200
iTrax x Europe Main (5Y - Series 10)iTrax x Europe Crossov er (5Y - Series 10)bps bps
13
Source: JP Morgan
14
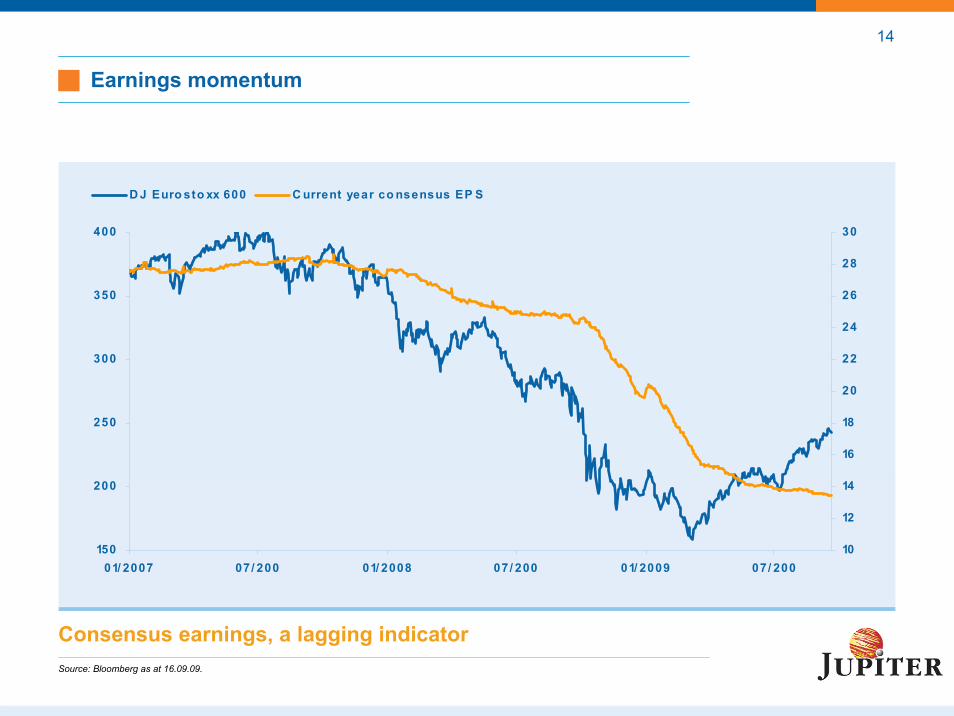
Earnings momentum
Consensus earnings, a lagging indicatorSource: Bloomberg as at 16.09.09.
150
200
250
300
350
400
01/ 2007 07/ 200 01/ 2008 07/ 200 01/ 2009 07/ 20010
12
14
16
18
20
22
24
26
28
30
D J Euro sto xx 600 C urrent year co nsensus EP S
15
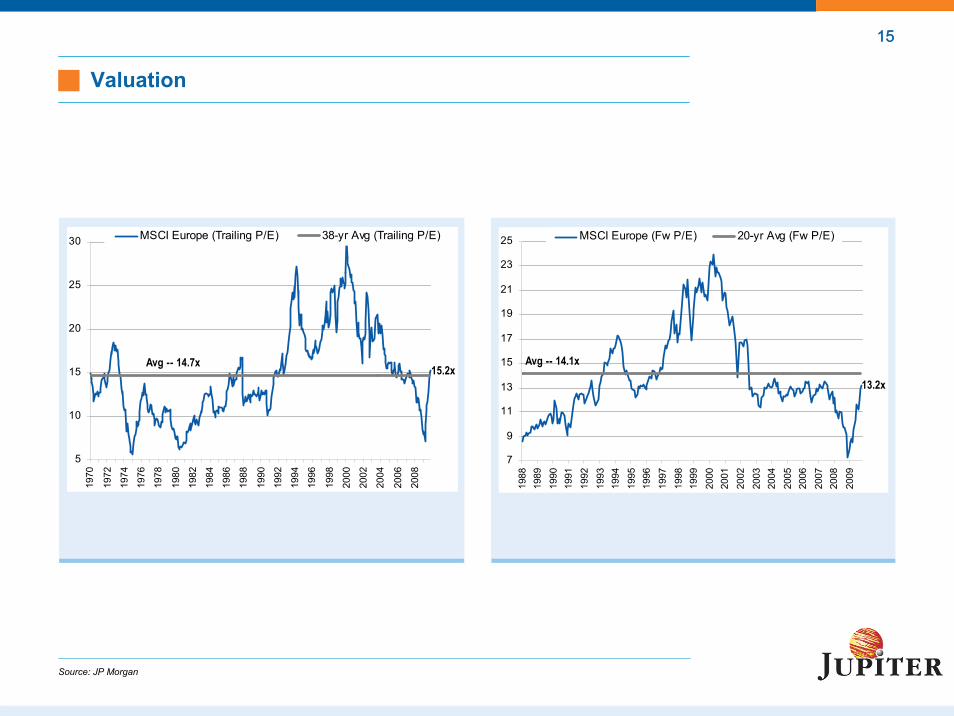
Valuation
15
Source: JP Morgan
15.2xAvg -- 14.7x
5
10
15
20
25
30
1970
1972
1974
1976
1978
1980
1982
1984
1986
1988
1990
1992
1994
1996
1998
2000
2002
2004
2006
2008
MSCI Europe (Trailing P/E) 38-yr Avg (Trailing P/E)
13.2x
Avg -- 14.1x
7
9
11
13
15
17
19
21
23
25
1988
1989
1990
1991
1992
1993
1994
1995
1996
1997
1998
1999
2000
2001
2002
2003
2004
2005
2006
2007
2008
2009
MSCI Europe (Fw P/E) 20-yr Avg (Fw P/E)
16
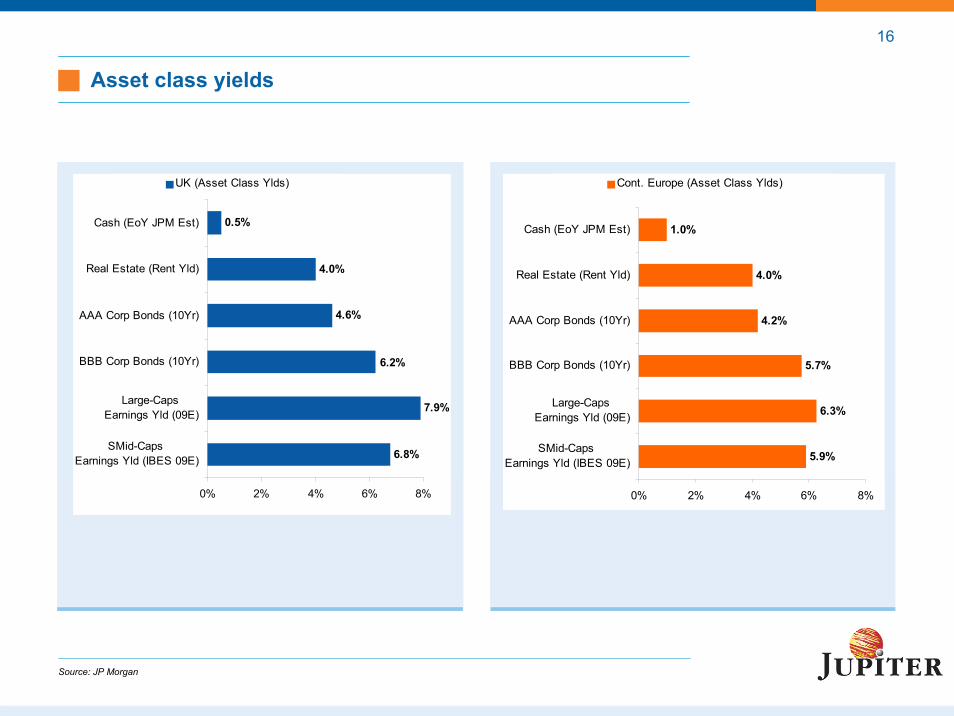
Asset class yields
Source: JP Morgan
0.5%
4.0%
4.6%
7.9%
6.8%
6.2%
0% 2% 4% 6% 8%
Cash (EoY JPM Est)
Real Estate (Rent Yld)
AAA Corp Bonds (10Yr)
BBB Corp Bonds (10Yr)
Large-Caps Earnings Yld (09E)
SMid-Caps Earnings Yld (IBES 09E)
UK (Asset Class Ylds)
1.0%
4.0%
4.2%
5.7%
6.3%
5.9%
0% 2% 4% 6% 8%
Cash (EoY JPM Est)
Real Estate (Rent Yld)
AAA Corp Bonds (10Yr)
BBB Corp Bonds (10Yr)
Large-Caps Earnings Yld (09E)
SMid-Caps Earnings Yld (IBES 09E)
Cont. Europe (Asset Class Ylds)
17
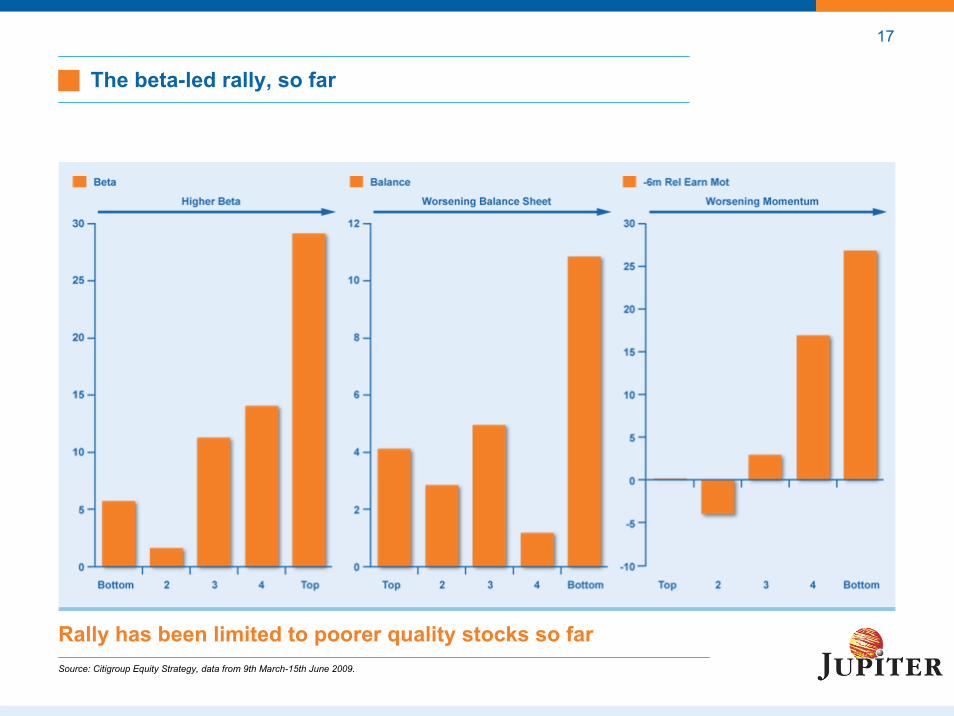
The beta-led rally, so far
Rally has been limited to poorer quality stocks so farSource: Citigroup Equity Strategy, data from 9th March-15th June 2009.
18
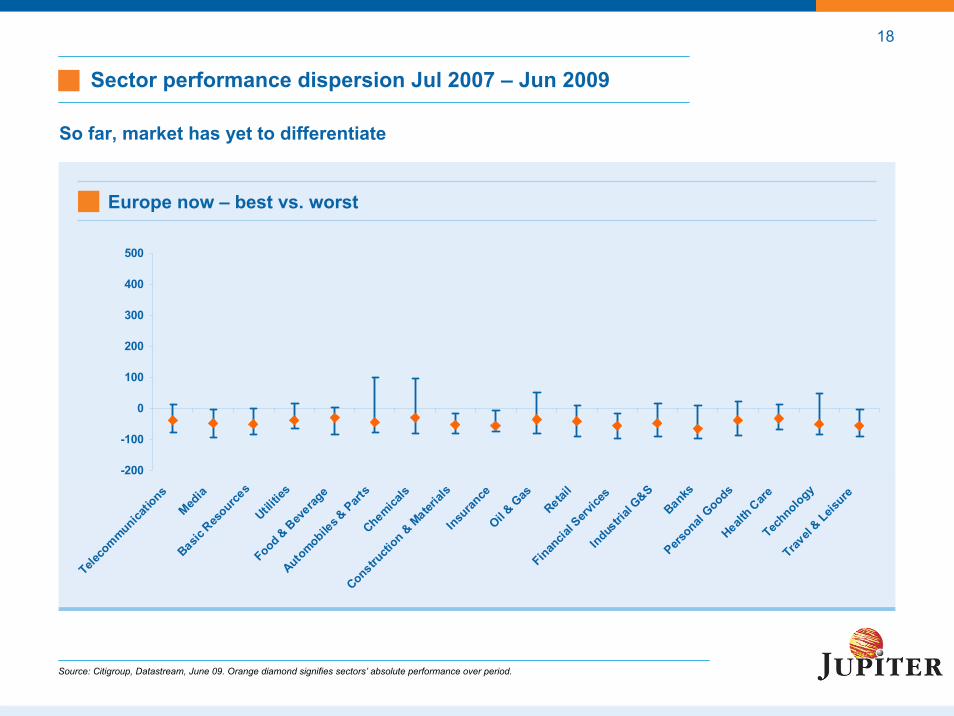
Sector performance dispersion Jul 2007 – Jun 2009
Europe now – best vs. worst
So far, market has yet to differentiate
Source: Citigroup, Datastream, June 09. Orange diamond signifies sectors’ absolute performance over period.
-200
-100
0
100
200
300
400
500
Teleco
mmunicatio
ns
Media
Basic R
esource
sUtili
ties
Food & B
everag
e
Automobile
s & Part
sChemica
ls
Constructi
on & M
aterial
sInsu
rance
Oil & G
as
Retail
Financia
l Serv
ices
Industri
al G&S
Banks
Personal
GoodsHealt
h Care
Technology
Travel
& Leisure
19
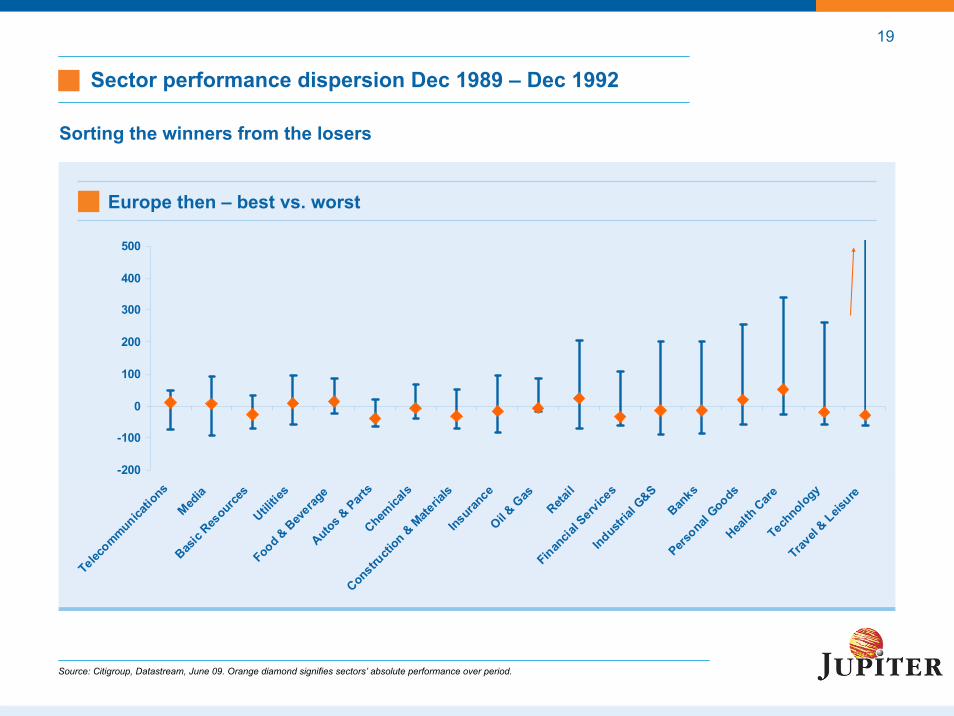
Sector performance dispersion Dec 1989 – Dec 1992
Europe then – best vs. worst
Sorting the winners from the losers
Source: Citigroup, Datastream, June 09. Orange diamond signifies sectors’ absolute performance over period.
-200
-100
0
100
200
300
400
500
Telecommunica
tions
Media
Basic
Resource
sUtili
ties
Food & B
everag
eAutos &
Parts
Chemica
ls
Constructi
on & M
ateria
lsInsuran
ceOil &
Gas
Retail
Financia
l Service
sIndustr
ial G
&S
Banks
Personal
GoodsHea
lth C
areTech
nology
Travel
& Leisure
20
Appendices
Paper track record vs. MSCI Europe Index
Paper portfolio monthly returns
Monthly returns vs. equity and hedge fund indices
Volatility and distribution of returns
Terms/Contacts
21
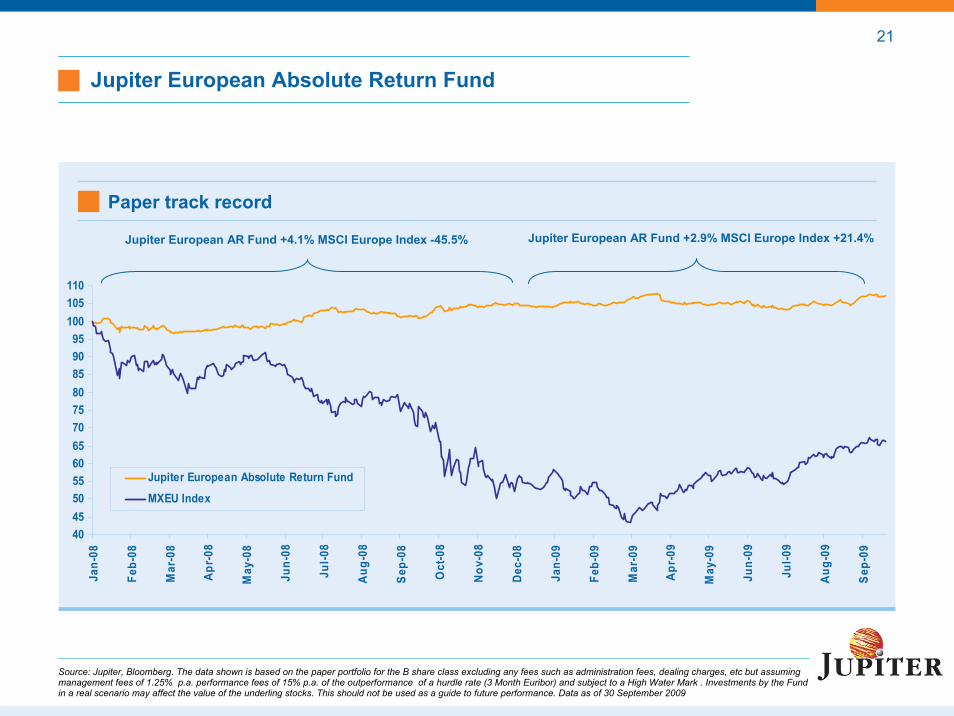
Jupiter European Absolute Return Fund
Paper track record
Jupiter European AR Fund +4.1% MSCI Europe Index -45.5% Jupiter European AR Fund +2.9% MSCI Europe Index +21.4%
404550556065707580859095
100105110
Jan-
08
Feb-
08
Mar
-08
Apr-0
8
May
-08
Jun-
08
Jul-0
8
Aug-
08
Sep-
08
Oct
-08
Nov-
08
Dec-
08
Jan-
09
Feb-
09
Mar
-09
Apr-0
9
May
-09
Jun-
09
Jul-0
9
Aug-
09
Sep-
09
Jupiter European Absolute Return Fund
MXEU Index
Source: Jupiter, Bloomberg. The data shown is based on the paper portfolio for the B share class excluding any fees such as administration fees, dealing charges, etc but assuming management fees of 1.25% p.a. performance fees of 15% p.a. of the outperformance of a hurdle rate (3 Month Euribor) and subject to a High Water Mark . Investments by the Fund in a real scenario may affect the value of the underling stocks. This should not be used as a guide to future performance. Data as of 30 September 2009
22
Paper portfolio monthly returns
-1.9
% -0.4
%
-0.6
%
1.6%
0.1%
3.6%
1.0%
-1.1
%
0.1%
2.3%
0.1%
-0.7
%
0.8%
0.3%
2.5%
-2.3
% -0.4
%
-0.9
%
1.0%
0.2%
1.8%
-15.0%
-12.5%
-10.0%
-7.5%
-5.0%
-2.5%
0.0%
2.5%
5.0%
7.5%
10.0%
12.5%
15.0%
Jan-
08
Feb-
08
Mar
-08
Apr
-08
May
-08
Jun-
08
Jul-0
8
Aug
-08
Sep-
08
Oct
-08
Nov
-08
Dec
-08
Jan-
09
Feb-
09
Mar
-09
Apr
-09
May
-09
Jun-
09
Jul-0
9
Aug
-09
Sep-
09
MSCI Europe (MXEU Index) Jupiter European AR Fund
Source: Jupiter, Bloomberg. The data shown is based on the paper portfolio for the B share class excluding any fees such as administration fees, dealing charges, etc but assuming management fees of 1.25% p.a. performance fees of 15% p.a. of the outperformance of a hurdle rate (3 Month Euribor) and subject to a High Water Mark . Investments by the Fund in a real scenario may affect the value of the underling stocks. This should not be used as a guide to future performance. Data as of 30 September 2009
23
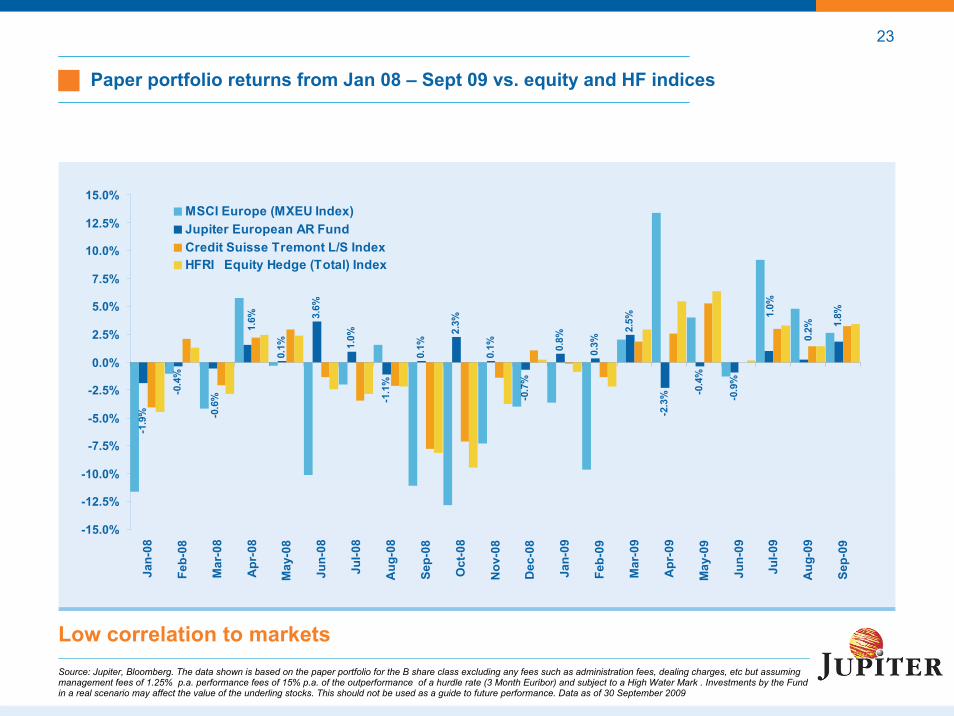
Paper portfolio returns from Jan 08 – Sept 09 vs. equity and HF indices
Low correlation to markets
-0.4
%
0.1%
3.6%
1.0%
-1.1
%
0.1%
2.3%
0.1% 0.
8%
0.3%
2.5%
-2.3
% -0.4
%
-0.9
%
1.8%
0.2%
1.0%
-0.7
%
1.6%
-0.6
%
-1.9
%
-15.0%
-12.5%
-10.0%
-7.5%
-5.0%
-2.5%
0.0%
2.5%
5.0%
7.5%
10.0%
12.5%
15.0%
Jan-
08
Feb-
08
Mar
-08
Apr
-08
May
-08
Jun-
08
Jul-0
8
Aug
-08
Sep-
08
Oct
-08
Nov
-08
Dec
-08
Jan-
09
Feb-
09
Mar
-09
Apr
-09
May
-09
Jun-
09
Jul-0
9
Aug
-09
Sep-
09
MSCI Europe (MXEU Index)Jupiter European AR FundCredit Suisse Tremont L/S IndexHFRI Equity Hedge (Total) Index
Source: Jupiter, Bloomberg. The data shown is based on the paper portfolio for the B share class excluding any fees such as administration fees, dealing charges, etc but assuming management fees of 1.25% p.a. performance fees of 15% p.a. of the outperformance of a hurdle rate (3 Month Euribor) and subject to a High Water Mark . Investments by the Fund in a real scenario may affect the value of the underling stocks. This should not be used as a guide to future performance. Data as of 30 September 2009
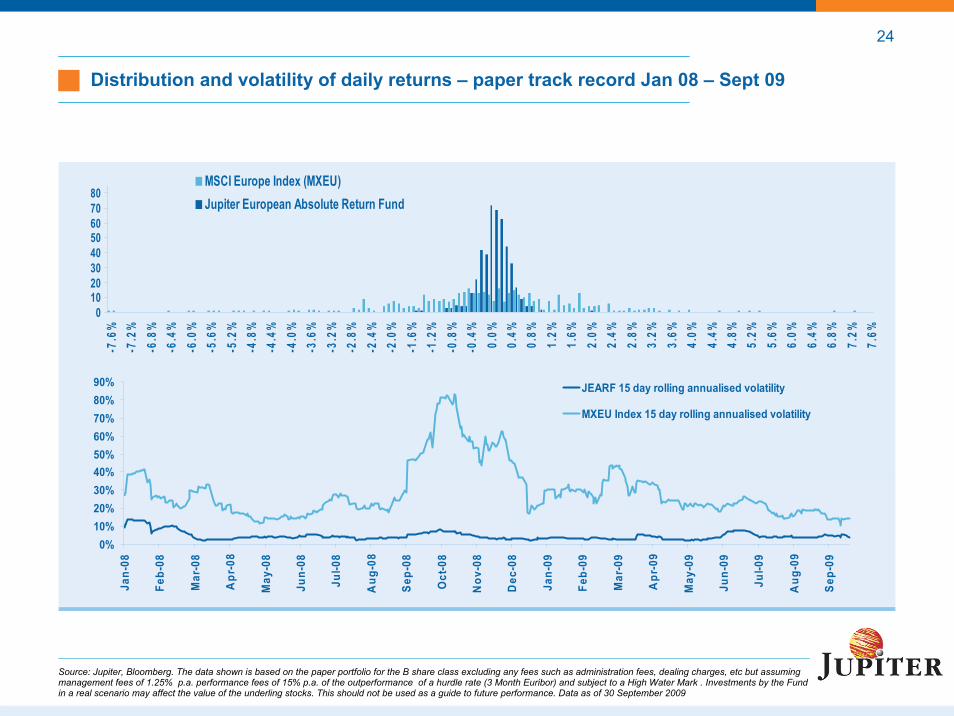
24
Distribution and volatility of daily returns – paper track record Jan 08 – Sept 09
01020304050607080
-7.6
%-7
.2%
-6.8
%-6
.4%
-6.0
%-5
.6%
-5.2
%-4
.8%
-4.4
%-4
.0%
-3.6
%-3
.2%
-2.8
%-2
.4%
-2.0
%-1
.6%
-1.2
%-0
.8%
-0.4
%0.
0%0.
4%0.
8%1.
2%1.
6%2.
0%2.
4%2.
8%3.
2%3.
6%4.
0%4.
4%4.
8%5.
2%5.
6%6.
0%6.
4%6.
8%7.
2%7.
6 %
MSCI Europe Index (MXEU)Jupiter European Absolute Return Fund
0%10%20%30%40%50%60%70%80%90%
Jan-
08
Feb-
08
Mar
-08
Apr
-08
May
-08
Jun-
08
Jul-0
8
Aug
-08
Sep-
08
Oct
-08
Nov
-08
Dec
-08
Jan-
09
Feb-
09
Mar
-09
Apr
-09
May
-09
Jun-
09
Jul-0
9
Aug
-09
Sep-
09
JEARF 15 day rolling annualised volatility
MXEU Index 15 day rolling annualised volatility
Source: Jupiter, Bloomberg. The data shown is based on the paper portfolio for the B share class excluding any fees such as administration fees, dealing charges, etc but assuming management fees of 1.25% p.a. performance fees of 15% p.a. of the outperformance of a hurdle rate (3 Month Euribor) and subject to a High Water Mark . Investments by the Fund in a real scenario may affect the value of the underling stocks. This should not be used as a guide to future performance. Data as of 30 September 2009
25
Share classes Euro A & B ( to be activated at launch)Sterling A & BUSD A & B
Minimum investment €1,000, £1,000 or $1,000
Management fee L Class A 1.75%L Class B 1.25%
Performance fee L Class Euro A: N/AL Class Euro B: 15% of the outperformance of the NAV per share over EURIBOR 3 months subject to a high water mark
Dealing frequency
Initial fee Up to 5% for all share classes
Daily dealing (subject to Luxembourg Business Day)
25
Investment Advisor and DistributorJupiter Asset Management Limited1 Grosvenor PlaceLondon SW1X 7JJTelephone number: +44 (0) 207 314 4801Fax number: +44 (0) 207 314 5546Email: [email protected]
Authorized and regulated by the Financial ServicesAuthority for business in UK
Investment ManagerJupiter Asset Management (Bermuda) LimitedCumberland House, 1 Victoria Street, 3rd FloorHamilton, Bermuda HM11Telephone number: +1 (441) 292 2760Fax number: +1 (441) 295 8690 Email: [email protected]
Licensed to conduct Investment Business by the Bermuda Monetary Authority
Contacts
26
Disclosure
This document is intended solely for publication and distribution to the recipient and may not be passed on or disclosed to any other person. This document is for information only and is not an offer to sell or an invitation to buy shares in the Jupiter European Absolute Return fund. In particular, it does not constitute an offer or solicitation in any jurisdiction where it is unlawful or where the person making the offer or solicitation is not qualified to do so or the recipient may not lawfully receive any such offer or solicitation. It is the responsibility of any person in possession of this document to inform themselves, and to observe, all applicable laws and regulations of relevant jurisdictions.
The information and any opinions contained herein have been obtained from or are based on sources which are believed to be reliable, but the accuracy cannot be guaranteed. No responsibility can be accepted for any consequential loss from this information.
There is currently no registration or authorisation for this fund to be marketed to retail investors outside of Luxembourg.
Prospective investors should review the prospectus and the simplified prospectus for the Jupiter European Absolute Return fund before making an investment decision and should rely only on the information contained in the prospectus. Prospective investors should also inform themselves, and should take appropriate advice, on the legal requirements and as to the possible tax consequences, foreign exchange restrictions or exchange control requirements that they may encounter under the laws of the countries of their citizenship, residence or domicile and that may be relevant to the subscription, purchase, holding, exchange, redemption, or disposal of any investments.
Should any of the information herein contradict the information presented in the prospectus, only the information contained in the prospectus should be relied upon.
The value of investments can decrease as well as increase (this is partly due to exchange rate fluctuations in investments that have an exposure to currencies other than the base currency of the Fund). Performance numbers shown are records of past performance and as such do not guarantee future performance. The fund will enter into derivative transaction which may cause large falls or rises in the fund value over short periods of time. Due to the nature of these transactions it is unlikely the funds value will fall and rise in line with the markets it invests in to.
This document has been issued by Jupiter Asset Management Limited, investment adviser and named distributor of the fund, whose registered office is at: 1 Grosvenor Place, London, SW1X 7JJ. Jupiter Asset Management Limited is authorised and regulated by the Financial Services Authority for business conducted un the UK.