Embed Size (px)
Citation preview
EXAMINING THE KEY DETERMINANT FACTOR FOR TRANSPORT
DEMAND BY MSMEs IN DIFFERENT BUSINESS SECTORS
IN ZAMBIA
Bachelor of Commerce (Economics) Thesis
A Dissertation by
JIMMY SIKACHELELA
Submitted to the School of Social sciences Studies
In partial fulfillment of the requirements for the degree of Bachelor of Commerce
(Economies)
MULUNGUSHI UNIVERSITY
6th MAY, 2014
CHAPTER ONE
INTRODUCTION
Mobility is an essential part of human life especially in cities. Transport demand, mainly
results from rapid urbanization, population growth, modern life styles, economic conditions
and is one of the most commonly used transport modes that provide the mobility required in
our time according to Cihat (2012:1211).In the last 20 years and/or more, transport demand
has risen rapidly in local, nationwide, and worldwide agenda and it’s not only influenced by
the measure of elasticity but also on the quality of people’s lives. This increase is credited to
the dominant function that transport plays in everyday life due to the escalating amounts of
energy used and to the economical impacts of transport on local, national and the global
economy.
When a business or an entity engages in economic activities that may contribute to the
economy regardless of it being a sole proprietorship, corporation, partnership or any legal
business, it may be referred to as medium-sized enterprise or micro, small, medium
enterprises (MSMEs).
The terms “small” and “medium” in reference to a size of business or entity may vary within
the sectors. A broad general definition can be taken for MSMEs, some countries have a very
precise definition on how the types of enterprises can be called as “MSME”. MSMEs Country
Indicator (2010) defined MSMEs as follows: micro enterprises: 1 to 9 employees; small: 10 to
49 employees; and medium: 50 to 249 employees. On the other hand, the Small Enterprises
Development (SED) Act of 1996 defines MSMEs as follows: An enterprise is defined as an
undertaking engaged in the manufacture or provisions of services or any undertaking carrying
out business in the field of manufacturing, construction, trading, and services but does not
include mining or recovery of minerals. Micro: - an enterprise whose total investment
excluding land and buildings does not exceed 50 thousand Zambian Kwacha; annual turnover
that does not exceed 20 thousand Zambian Kwacha and employing up to 10 persons. Small-
an enterprise whose total investment excluding land and buildings does not exceed 50
thousand Zambian Kwacha, in case of manufacturing and processing enterprise and 10
thousand Zambian Kwacha in case of a trading and service enterprise; an annual turnover that
does not exceed 80 thousand Zambian Kwacha and employing up to 30 people. Transport is a
service rarely in demand for its own characteristics. Demand for transport, especially road
freight facilities is usually derived from some other function. An MSME producing food
(bread or buns) or sale merchandize sees transport as a means of moving its products from
factory or warehouse to the retail store. As demand for products, raw material and
merchandize increases so the demand for transport facilities will increase. MSMEs in different
business sectors intend to have different types of preference (characteristics of goods involved
or standard of services) when it comes to demand for transport because of the nature of
trading or business they are involved in.
1.1 BACKGROUND
The Zambian government had no policy on the private sector development in particular the
MSMEs as they followed a central planned economic system after attaining independence in
1964. The UNIP government had no special legal framework promoting the MSMEs since the
economy was receiving more revenue from the high copper prices hence ignoring MSME
sector. The country depended much on mining industry and only the public sector was visible
by the government. Sadly, the copper prices dropped in 1970s. With decreasing revenues in
the copper industry, the Zambian government had to find alternative ways of sustaining its
economy therefore, after 1981, it begun to initiate policies targeted at promoting MSMEs and
hence came up with the Small Industries Development Act of 1981 succeeded by the Small
Enterprises Development (SED) Act of 1996. Both policies had a negligible impact on the
development of SMEs as they were just merely public pronouncements with little effort to
implement them.
In the past, Zambians were not very enterprising due to the public sector led economic growth
model which excluded citizenry from participating in business activities with the threat of
nationalization of their business. Zambian citizenry depended entirely on formal service as a
way of earning income and living.
However, after the 1990s, when Zambia adopted the free market economy system that was
perpetuated by the World Bank (IBRD) and the International Monetary Fund (IMF) and
during this period, the Zambian economy experienced the most severe economic recession. As
a result, this lead to the privatization of the Zambia economy which left inefficient among
local producers thus becoming uncompetitive, hence it became essential that they restructure
in order to remain in business and retrenchment of employees was one of the methods used
while other firms had to shut-down operations completely. The opening up of domestic
markets was attached with privatization of the state owned mines and companies (and firms).
The Gross Domestic Product declined and poverty levels increased drastically (70%) placing
Zambia among the poorest countries in the world. The MSMEs formation was unavoidable
since most Zambians were now out of formal employment and they had to find other ways of
surviving.
1.2 SIGNIFICANCE OF TRANSPORT IN ZAMBIA
Being a landlocked country with the main economic centers lying at least 1400km from the
nearest seaport, Zambia is highly dependent on the efficiency and costs of cross-border
transport services. Transport costs can contribute as much as 17% to import costs (Mackellar
et al. 2000), which is more than three times the amount in most developed countries but
comparable with most landlocked countries.
Zambia’s main trading partner is South Africa, accounting for 1.8 million tonnes per year
(44% of the estimated total freight traffic in 2005). The DRC and Zimbabwe account for
about 9% and 8% respectively of total trade. Zambia’s international trade outside the SADC
region accounts for about 36% of total trade (www.sarpn.org,30th April, 2014).
The main products transported by road within Zambia are: mining products (ores,
concentrates, metals, sulphur, sulphuric acid, coal), agricultural products (sugar, tobacco,
cotton), fuels (diesel and petrol), and food (bulk grain).
According to data from the Zambian Revenue Authority, the total volume of Zambian
regional and international trade is 3.9 million tonnes in 2005, made up of 2.3 million of
imports and 1.6 million of exports.
Road transport is the dominant mode in Zambia and is expected to remain so. Current modal
share of about 71% of Zambia’s trade (in volume) is carried by road, 24% by rail and about
5% accounts for oil imports by pipeline from Dares-Salaam (TAZAMA pipeline).High value
mining and agricultural goods (cobalt and fresh / frozen products) are generally transported by
air freight except for copper cathodes (about USD 250,000 per load), which are exported by
road to Gauteng, where they are containerized in order to be exported through
Durban(Raballand etal 2008:4).
Poverty is said to be highest in most of the Zambian rural areas because of the lack of access
to market for agricultural produce as well as productive inputs. This has been worsened by the
poor transport systems that exist in rural areas. Therefore, if the poverty situation in rural
areas is to be addressed, the issue of transport has to be of paramount importance. In order to
improve rural travel and transport, the following measures have been proposed
(www.sarpn.org,30th April, 2014):
• Establish an institutional framework for the development and management of rural
transport and travel in the country.
• Improve the planning, management, and financing of rural road transport as well as
upgrading the road infrastructure such as community roads, paths, tracks, trails, and
footbridges through community participation.
• Facilitate the rural communities with the establishment of sustainable approaches to
the construction and maintenance of rural transport infrastructure.
• Facilitate the introduction and promotion of appropriate motorized and non-motorized
means of transport aimed at improved mobility in rural areas.
• Encourage the development of industries for the design, manufacture, repair, and
maintenance of intermediate motorized and non-motorized means of transport for rural
areas. And ensure that gender issues and the interests of the differently able persons
are considered in rural travel and transport.
1.3 NATURE OF TRANSPORT IN ZAMBIA
The road network is the backbone of the Zambian transport system reaching to remote areas
where other modes cannot. Zambia has a gazette road network of approximately 37,000 km of
which 6,476 km are bituminous and surfaced to Class 1 standard. The gravel and earth roads
account for 8,478 km and 21,967 km respectively. In addition there are about 30,000 km of
ungazetted community road network comprising tracks, trails and footpaths. A large part of
the main road network was constructed between 1965 and 1975. Over the years the country’s
road infrastructure has been eroded through lack of maintenance. The main problems have
been institutional and financial which relate to (WB 2002):
• Inadequate and erratic flow of funding.
• The inadequacy of the institutional framework within which roads were managed
• Poor terms and conditions of employment.
• Lack of clearly defined responsibilities among road management actors.
• Lack of managerial accountability.
According to ZDA (2013), the Zambian economy is forecast to grow between 7.5 and 8
percent annually over the next five years. To sustain this growth, Zambia needs to upgrade its
transportation infrastructure. Zambia, being a landlocked country lies in the center of the
Southern African Region and to this effect heavily relies on her neighbors for vital routes to
various import and export destinations. Transport infrastructure covers: roads and bridges,
railways, airports and aerodromes and maritime and inland waterways. The state of transport
infrastructure, however, remains inadequate to sustain and match the desired levels of growth
due to weak structural and management capacity resulting in over commitments, high cost of
construction and low investment.
Airports
There are four international airports; five secondary airfields and five airstrips serving the
international and domestic flights. Airports with paved runways are 8, of which 1 airport over
3,047m is, 3 are between 2,438m to 3,047m and between 914m to 1,523m respectively.
Airports with unpaved runways are 80,of which 1 is between 2,438m to 3,047m,5 are between
1,524m to 2,437m,53 are between 914m to 1,523m and 21 are under 914m (ZDA 2013:5).
The Kenneth Kaunda International Airport is Zambia’s main airport connecting the country
with the rest of the world. This is complimented by three airports at Ndola (Simon Mwansa
Kampwepwe, Livingstone (Harry Mwanga Nkumbula) and Mfuwe, as well as secondary
airfields at Chipata, Kitwe, Kasama, Mongu, Solwezi and Mansa.
RDA (2013:5) states that, Zambia has no national airline but is served by a number of airlines
that connect to international routes via Johannesburg, Cape Town, Addis Ababa, Nairobi,
London, Amsterdam, Dubai and Dar-Es-Salaam. Proflight Zambia is a privately run airline
with proposed regional flights to Johannesburg and Congo DRC and local flights to various
destinations within the country. The country recently adapted an “open sky policy” and is
currently promoting the establishment of an air cargo hub for the Southern African region.
Roads
According to RDA (2013), the Government of Zambia has recently embarked on the Link
Zambia 8,000 project (Accelerated National Roads Construction Programme) aimed at
rehabilitating and constructing the road network. The aim is to construct an efficient road
network and international highways linking Zambia to South Africa, Zimbabwe,
Mozambique, Malawi, Tanzania, the Democratic Republic of Congo and Namibia. This
project also aims at contributing to the reduction of road user costs and transit times across
Zambia. In 2001, the Zambian roadways had a total of 91,440 km, of which 20,117 km were
paved and 71,323 km were unpaved.
Railways
The Government intends to expand its railway network in the country to develop the surface
transport sector. The development of rail routes linking important exit points is not only vital
for facilitating smooth access to the outside world but also for the overall boosting of trade in
the sub-region and making Zambia a competitive country for doing business with a total of
2,157 km of railways.
The Zambian railways generally operate well below their original design capacity, yet they
cannot increase their volumes because of poor track condition, lack of locomotive and wagon
availability and low operating capital.
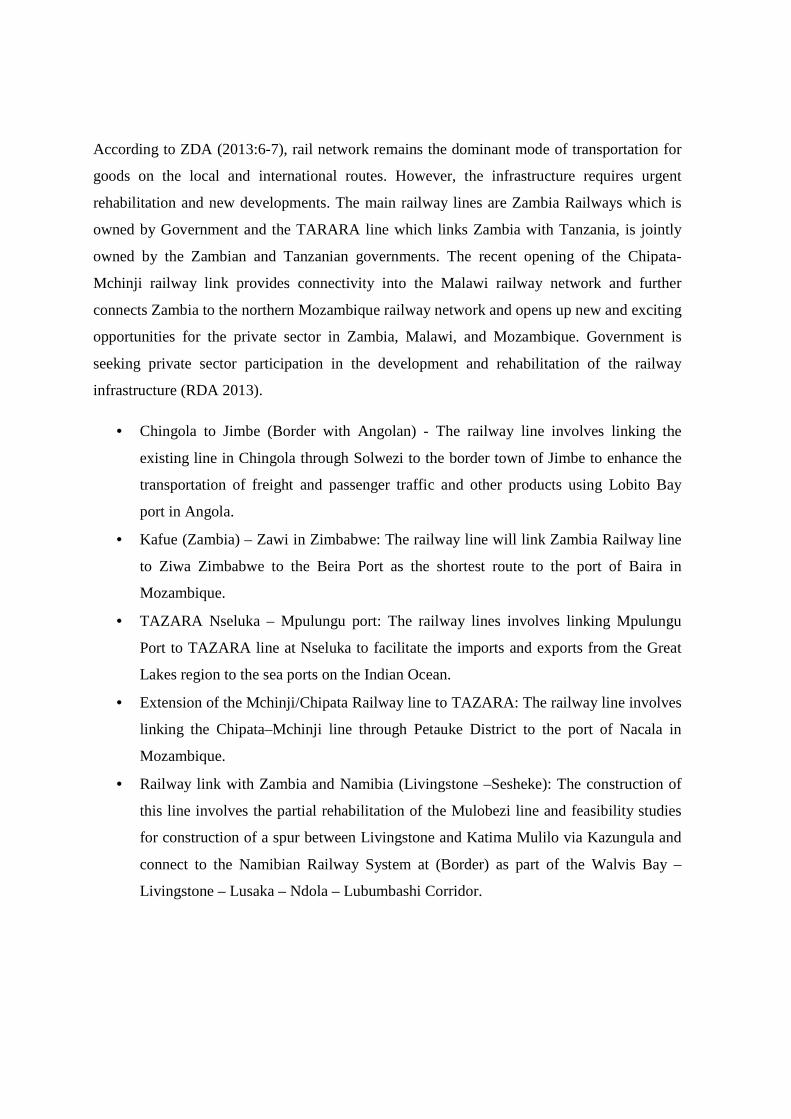
According to ZDA (2013:6-7), rail network remains the dominant mode of transportation for
goods on the local and international routes. However, the infrastructure requires urgent
rehabilitation and new developments. The main railway lines are Zambia Railways which is
owned by Government and the TARARA line which links Zambia with Tanzania, is jointly
owned by the Zambian and Tanzanian governments. The recent opening of the Chipata-
Mchinji railway link provides connectivity into the Malawi railway network and further
connects Zambia to the northern Mozambique railway network and opens up new and exciting
opportunities for the private sector in Zambia, Malawi, and Mozambique. Government is
seeking private sector participation in the development and rehabilitation of the railway
infrastructure (RDA 2013).
• Chingola to Jimbe (Border with Angolan) - The railway line involves linking the
existing line in Chingola through Solwezi to the border town of Jimbe to enhance the
transportation of freight and passenger traffic and other products using Lobito Bay
port in Angola.
• Kafue (Zambia) – Zawi in Zimbabwe: The railway line will link Zambia Railway line
to Ziwa Zimbabwe to the Beira Port as the shortest route to the port of Baira in
Mozambique.
• TAZARA Nseluka – Mpulungu port: The railway lines involves linking Mpulungu
Port to TAZARA line at Nseluka to facilitate the imports and exports from the Great
Lakes region to the sea ports on the Indian Ocean.
• Extension of the Mchinji/Chipata Railway line to TAZARA: The railway line involves
linking the Chipata–Mchinji line through Petauke District to the port of Nacala in
Mozambique.
• Railway link with Zambia and Namibia (Livingstone –Sesheke): The construction of
this line involves the partial rehabilitation of the Mulobezi line and feasibility studies
for construction of a spur between Livingstone and Katima Mulilo via Kazungula and
connect to the Namibian Railway System at (Border) as part of the Walvis Bay –
Livingstone – Lusaka – Ndola – Lubumbashi Corridor.
Waterways, Ports, and Pipelines
Zambia has 2,250km of waterways which includes; Lake Tanganyika, Kafue river, Zambezi
river, and Luapula river to mention but a few. There are 771 km of pipelines in Zambia (e.g.
Tazama Pipeline) and Mpulungu been the only port of Zambia (RDA 2013).
1.4 THE STATEMENT OF THE PROBLEM Over the last two decades, Zambia has experienced rapid changes and socio-economic
transformations. These socio-economic changes are affecting and causing worry mainly to
isolated, minor and rural areas of Zambia. However, the changes in economic and social
culture structure of Zambia have brought about an increase in the demand for transport. With
an increase in demand for transport in Zambia, MSMEs keep searching for the best alternative
mode of transport to move their goods from one place to another. This is however, dependent
on the attributes or characteristic of particular mode involved .It is therefore essential to find
out the key determinant factor from a wide range of factors that determine the demand for
transport of MSMEs, and a particular mode of transport being used.
1.5 GENERAL RESEARCH OBJECTIVES • To identify the key determinant factors for transport demand by MSMEs in their
different business sectors (Agricultural and Livestock, Trading, Service, Food
Processing and Non-Food Processing).
SPECIFIC OBJECTIVES
• To examine and identify which MSMEs by sector (agriculture & livestock, trading,
service, food processing and non-food manufacturing) demands more of transport.
• To determine what kind of transport mode is demanded mostly and what determinant
factors are attributed to.
• To determine the impact of transport on MSMEs growth with respect to effective
demand.
• Find out the period of existence of MSMEs by business sector.
1.6 FORMULATION OF HYPOTHESIS • It was hypothesized that, there is positive relationship between the number of trips
travelled and the determinant factors (speed of transport, characteristics of goods
involved and standard of services) for transport.
1.7 SIGNIFICANCE OF THE STUDY The significance of this study is to identify and evaluate the determinant of transport and the
impact it has on the MSMEs growth. This study is also aimed to be of benefit to MSMEs,
Government, policy makers and the community at large in finding remedies to develop the
Zambian economy. The research done was a partial fulfillment for the award of a Degree in
Bachelor of Commerce degree at Mulungushi University. The study was also intended to
contribute to the already existing body of knowledge which might be of help for future
researchers.
1.8 SCOPE AND LIMITATION OF THE STUDY
1.8.1 Scope of the study The study focused on MSMEs (agriculture & livestock, trading, service, food processing and
non-food manufacturing) that had been existence for the past period of 10 years from 2004 to
2014.
1.8.2 Limitation of the study The following were the challenges faced by the researcher during data collection and these
were; Firstly resistance on the part of the MSMEs Managers/owner to give clear information,
secondly the period of the study was too short as a result, alot of information was compressed
within a limited time. Lastly secondary information was not readily available and limited time
and resources could not allow further findings.
CHAPTER TWO
LITERATURE REVIEW
2.1 INTRODUCTION The following chapter reviews what other scholars have written on determinant factors for
transport demand by MSMEs. This will help to broaden the scope knowledge of what others
have written about this topic.
2.2 THEORETICAL LITERATURE REVIEW Travel demand modeling: definitions and purpose
Mohammad and etal (2011:3) states that people travel in order to participate in some land-
based activity, making the demand for travel a derived demand. Travel demand forecasting
predicts the number, type, origin and destination, and distribution of “trips” on a
transportation network as a function of land use patterns. A “trip” is defined as travel between
two points for one purpose, for instance, between home and work, or home and school, or
work and shopping. Therefore, more than one mode can be used for the same trip (e.g., walk
or dropped off at a bus stop). Usually, travel demand is expressed in terms of vehicles
(vehicle-trips); however, it can also be defined in terms of individuals (person-trips) or goods
(truck-trips). According to Wee and Kees (2003:201), travel demand has been defined as the
sum total of realized needs of travel, expressed as the actual number of trips or trip kilometers.
The theoretical foundation for the relation between travel and spatial structure can be found in
the theory of utilitarian travel demand. This theory postulates that the demand for travel does
not derive its utility from the trip itself. Rather, it comes from the need to reach the locations
where activities take place, such as the dwelling, the work place, and services and facilities.
Travel demand forecasting tools allow practitioners to measure and evaluate the impact of
changes to the transportation network and surrounding land uses on the traffic volumes, travel
paths, and travel modes. Using travel demand modeling tools, planners, engineers, and
economists make informed transportation infrastructure planning decisions.
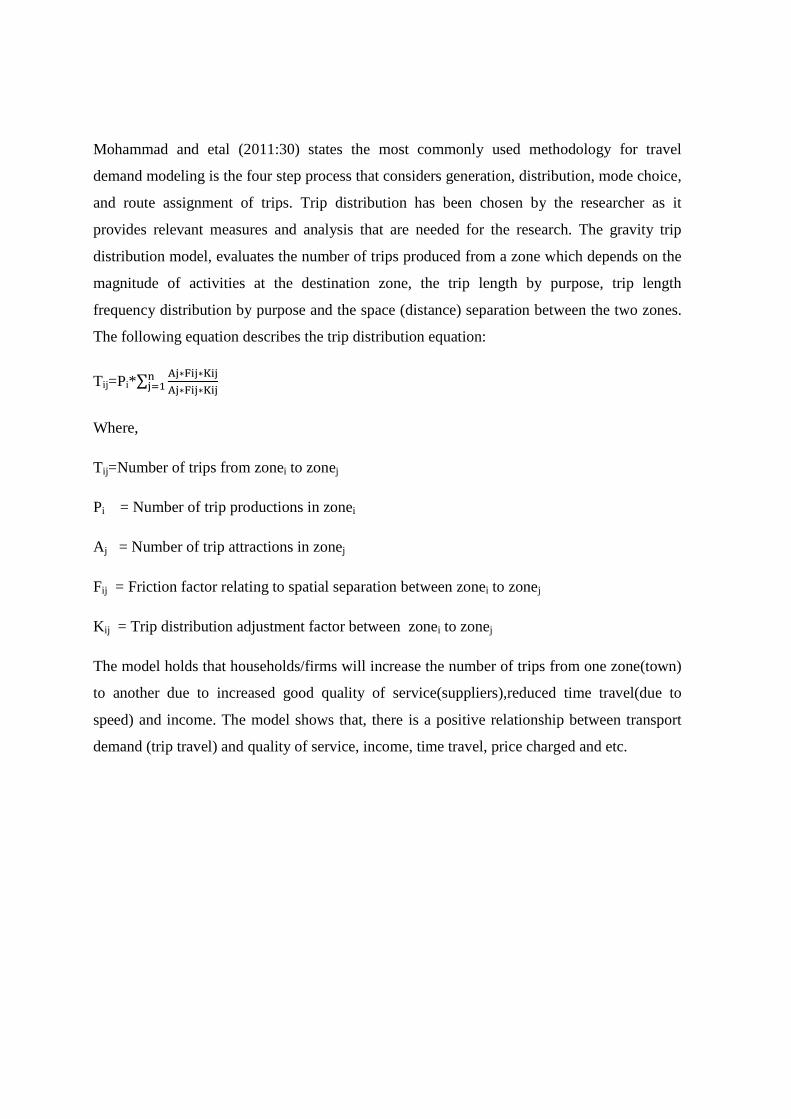
Mohammad and etal (2011:30) states the most commonly used methodology for travel
demand modeling is the four step process that considers generation, distribution, mode choice,
and route assignment of trips. Trip distribution has been chosen by the researcher as it
provides relevant measures and analysis that are needed for the research. The gravity trip
distribution model, evaluates the number of trips produced from a zone which depends on the
magnitude of activities at the destination zone, the trip length by purpose, trip length
frequency distribution by purpose and the space (distance) separation between the two zones.
The following equation describes the trip distribution equation:
Tij=Pi*∑��∗���∗���
��∗���∗���
��
Where,
Tij=Number of trips from zonei to zonej
Pi = Number of trip productions in zonei
A j = Number of trip attractions in zonej
Fij = Friction factor relating to spatial separation between zonei to zonej
K ij = Trip distribution adjustment factor between zonei to zonej
The model holds that households/firms will increase the number of trips from one zone(town)
to another due to increased good quality of service(suppliers),reduced time travel(due to
speed) and income. The model shows that, there is a positive relationship between transport
demand (trip travel) and quality of service, income, time travel, price charged and etc.
2.3 EMPIRICAL LITERATURE REVIEW Several studies have been carried out on matatus (Kenya) as a mode of transport. The studies
have mainly concentrated in the city of Nairobi. For instance, Alila and Pedersen (2001:70)
cited in (Situma 1977, Barwell 1979, Nairobi City Council 1980, Kapila 1994) states that they
all focused on Nairobi city. Situma (1977) looked at the origin of matatus and their
destinations: types of vehicles used, their carrying capacity, roadworthiness, average number
of trips, ridership and fare structure. The analysis based on Nairobi City Council surveys of
1971 indicate that the Matatu mode of transport played an important role in the public sector
in Nairobi. This finding is still quite valid in the 199Os. For example although matatus make
an important contribution to public transport in Kenya, a number of passengers are dissatisfied
with the services provided. For instance, Matatu drivers are often accused of over speeding,
carrying passengers beyond capacity, playing very loud music and generally of being reckless
drivers. The other workers associated with 'matatus like conductors, 'manambas' are often
accused of being rude to the passengers. The author's personal experience as a passenger in
the matatus to some extent agrees with the accusations. Despite the accusations, very few
studies have been carried out to establish the quality of services provided by matatus to
passengers.
Aduwa (1990) looked at the Matatu system's general role, its efficiency and quality of service
offered by matatus in Nairobi. A very strong functional relationship was established between
the distribution of Matatu services and population distribution. The other factors that
accounted for distribution was distance covered per trip, profitability levels and income levels
of the population. In ranking commuter (public) transport model choice, the matatus were
preferred because of their availability (frequency), comfort and speed. Little concern was
shown for reliability, cost and safety while travelling. This study is quite pertinent to the
present study. While road traffic accidents are threatening the safety of every traveler, it is
interesting to note that the travelers themselves do not give safety priority while travelling.
Bresson et al (2004) explored the economic and structural determinants of the demand for
public transport based on a panel data analysis of annual time series from 1975 to 1995 for 62
urban areas in France. Three economic determinants were considered – vehicle-kilometers,
income and price. Public transport was found to be an ‘inferior good’ as the estimated income
elasticity was negative. By synthesizing the structural determinants (including population
ageing, urban sprawl and growing car ownership) in a single indicator, there was an
interesting discovery that the ‘income effect’ was in fact mainly a ‘motorization effect’. It was
concluded that the downward trend in public transport patronage was mainly due to increasing
car ownership. It was also observed that the use of public transport was quite sensitive to the
service level and its price.
Hensher (2008) analyzed the direct elasticities associated with public transport demand with
respect to changes in three factors: fares, in-vehicle time and headway, based on information
from 319 studies. The major influences identified were: time of day (peak, all day versus off-
peak), data paradigm (especially combined stated preference/revealed preference versus
revealed preference), whether an average fare or class of tickets was included, the unit of
analysis (trips versus vehicle-kilometers), specific trip purposes, country and specific-mode
(i.e. bus and train).
Greer (2008) carried out a spatial analysis of cross-sectional data on bus ridership by
commuters to work and other related statistics for the Auckland region collected during the
2006 Census. The results from a regression analysis indicated that the following four factors
had a positive effect on commuter bus ridership:
• The total number of commuters from the area unit
• The distance from the centre of the area unit to the nearest rail or ferry terminal
• The population density of the area unit
• The combined morning and evening peak-hour bus service frequency within the area
unit.
On the other hand, the following three factors were found to have a negative influence on
commuter bus ridership:
• The average number of cars available to a household within the area unit
• The distance from the centre of the area unit to the city centre
• Median household income within the area unit.
Bureau of Industry Economics (1992b) reviewed international performance indicators for
road, which included customer orientated determinants, stating that these typically cover areas
like price, timeliness and other aspects of service quality. In a survey of Australian road
freight transport providers and users, the determinants stated in order of priority were:
• Price (road freight priced in a number of ways/km adopted to allow comparison).
• On-time delivery (as a percentage).
• Care of goods (loss and damage rates and claims paid as percentages).
• Availability of equipment to meet user needs.
• Timely and acceptable response to queries.
• Invoice accuracy.
• Shipment tracing.
Liability coverage and claims procedures were judged to be less important, which was
attributed as being possibly due to low loss and damage rates in the industry. It was noted that
suitability of electronic data interchange capability had not yet become a key factor of
concern.
CHAPTER THREE
METHODOLOGY The main purpose of this chapter was to demonstrate the methodology used to select
participants, the tools and approaches used to collect the data, the sample size and how it was
selected.This study was on determinant factors for transport demand by MSMEs.
3.1 RESEARCH DESIGN The research uses both qualitative and quantitative approaches. Qualitative data was be
collected by reviewing literature, asking question and conducting consultations with MSMEs
of Kabwe town while quantitative data was be collected by computation of cross-section data
using Regression, MS-EXCEL and SPSS.
3.2 DESCRIPTION OF RESEARCH AREA (KABWE) Kabwe, formally known as Broken Hill is the provincial headquarter of central province
which is one among 10 other provinces in Zambia. Kabwe is a one largest town in Zambia
located about 140 Km north of the Capital City Lusaka and 26km along great north road from
Mulungushi University. Kabwe is geographically located in the central part of Zambia and its
holds the headquarters of Zambia Railways and Prison Service. At 2010 census population,
Kabwe has a population of 202, 914, with a 16% share of the central province population
(1,267,803). The major economic activity of Kabwe town was mining and Manufacturing
before the closure of the major industries such as the Zambia-China Mulungushi Textile,
Kabwe Tannery and Kabwe Mine. At present, Kabwe’s increasing economic activity has been
agriculture, tertiary service and though some mining and manufacturing are still in operations
such as Zalco, Kifco, and San Hae.
3.3 MODEL SPECIFICATION
In order to produce an observed study we need to establish a functional relationship for total
trips traveled as a proxy for transport demand. As a result of this research, the functional
model measurement will be represented mathematically as follows:
TP= f (SS, GP, CGI, ST, µ)………………………….….. (a)
Where;
TP = Trips Traveled
SS - Standard of Service
GP – Good Price
CGI- Characteristics of Goods Involved
ST- Speed of Transport
µ- error term
In order to understand the relationship and significance of the variables above in the
objectives of this research and also applying to the testing of the hypothesis through the
transport economics theory of trip distribution and the econometric model can be expressed as
followed from (a) above:
TP =β0 + β1SS + β2GP + β3CGI + β4ST + µ……………………… (b)
Where;
TP = Trip Traveled
SS = Standard of Service
GP = Good Price
CGI = Characteristics of Goods Involved
ST = Speed of Transport
µ= error term
β0= Constant term and
β1= the coefficient of the independent variable (SS) which β1 > 0
β2= the coefficient of the independent variable (GP) which β2 > 0
β3= the coefficient of the independent variable (CGI) which β3 > 0
β4 = the coefficient of the independent variable (ST) which β4 > 0
3.4 IDENTIFICATION OF VARIABLES
• The independent variables are Standard of Service, Good Price, Speed of Transport,
and Characteristics of Goods.
• The dependent variable is the trips travelled in a month.
3.5 POPULATION The target population was five different types of MSMEs business sectors namely agriculture
and livestock, food processing, manufacturing, trading and service sectors.
3.6 SAMPLE SIZE The sample size was 40 but only managed to 36 respondents which consisted of the following.
- Agriculture and Livestock 8
- Food processing 5
- Non-Food processing 6
- Servicing 7
- Trading 10
3.7 SAMPLING PROCEDURES
The sample procedure which was used to select the respondents was on random sampling.
3.8 RESEARCH INSTRUMENTS
Data was collected using self-administered questionnaires which were designed with most
questions closed ended and few questions open ended.
3.9 DATA COLLECTION The study was confined to the period ranging from February 2014 to first week of May 2014
of data collection, analysis and evaluation (three months).
Date was collected using both the primary and secondary data. Primary data was collected
using questionnaires on management representatives/owners of MSMEs and the Secondary
data was collected using the reports on MSMEs, internet and the commercial banks reports.
3.4.0 DATA PROCESSING The data collected using questionnaires was subjected to verification for consistency, standard
editing, uniformity and accuracy before been coded. Data processing was done through the
use of simple and cross tabulations which was analyzed by using statistical package SPSS
version 16.0 and there-after was exported to and analyzed using a MS-EXCEL.
3.4.1 DATA ANALYSIS The data was analysed using both qualitative and quantitative approaches. The qualitative
approach gives an explanatory measure of research whilst the quantitative approach provides a
mathematical evaluation for the research. A proxy for transport demand was used to analyze
the findings.
3.4.2 ETHICAL ISSUES Issues of confidentiality and privacy were dealt with(personal and business details of
respondents were not published). Information was provided to the respondents prior to the
start of the interviews to the effect that the information provided is for academic purposes.
CHAPTER FOUR
DATA ANALYSIS AND DISCUSSION
4.1 INTRODUCTION This section contains the data collected. This chapter will include the respondents’ mode of
transport used, business sectors, speed of transport, characteristics, employment creation,
price/other forms of transport, and quality or quantity of the product and etc. The data will be
presented in form of tables, charts and where tables or charts cannot be easily applied,
interpretation, description, analysis and a short explanation will follow for each and every
table or chart.
4.1.1 THE DESCRIPTION OF THE POPULATION
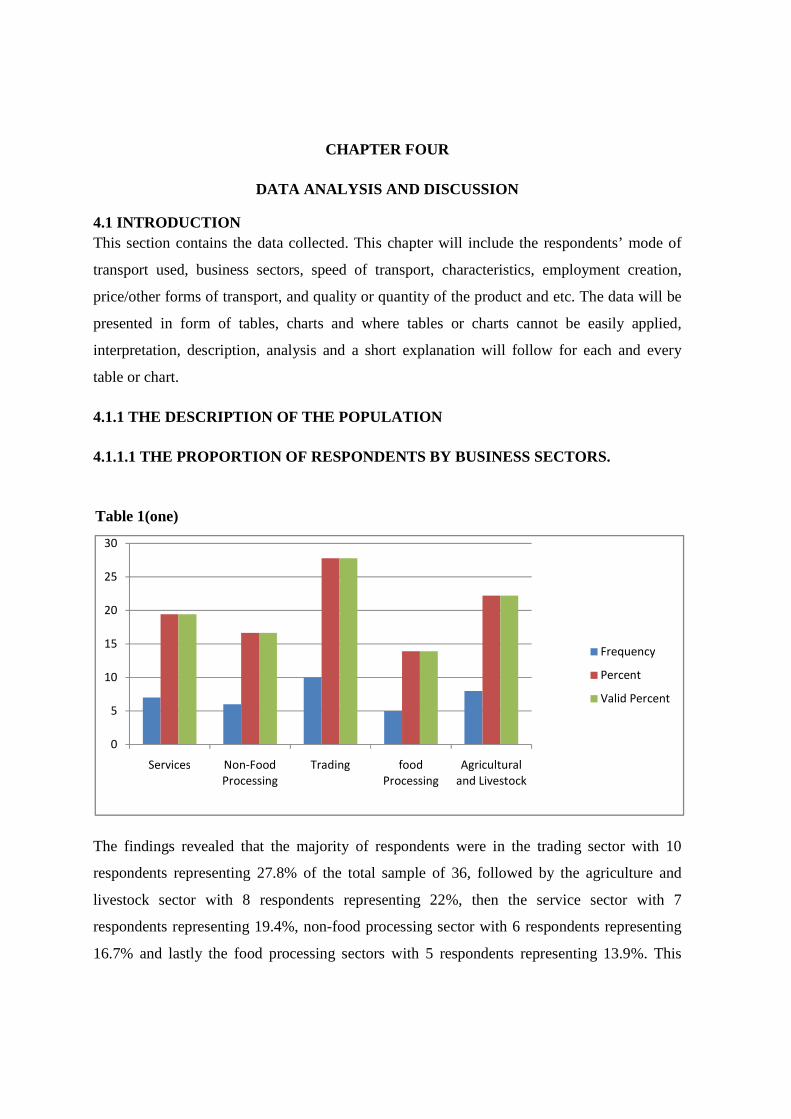
4.1.1.1 THE PROPORTION OF RESPONDENTS BY BUSINESS SECTORS.
Table 1(one)
The findings revealed that the majority of respondents were in the trading sector with 10
respondents representing 27.8% of the total sample of 36, followed by the agriculture and
livestock sector with 8 respondents representing 22%, then the service sector with 7
respondents representing 19.4%, non-food processing sector with 6 respondents representing
16.7% and lastly the food processing sectors with 5 respondents representing 13.9%. This
0
5
10
15
20
25
30
Services Non-Food
Processing
Trading food
Processing
Agricultural
and Livestock
Frequency
Percent
Valid Percent
revealed to the researcher that more MSMEs are involved in tr
agriculture sector, followed by service sector,
processing sectors in Kabwe.
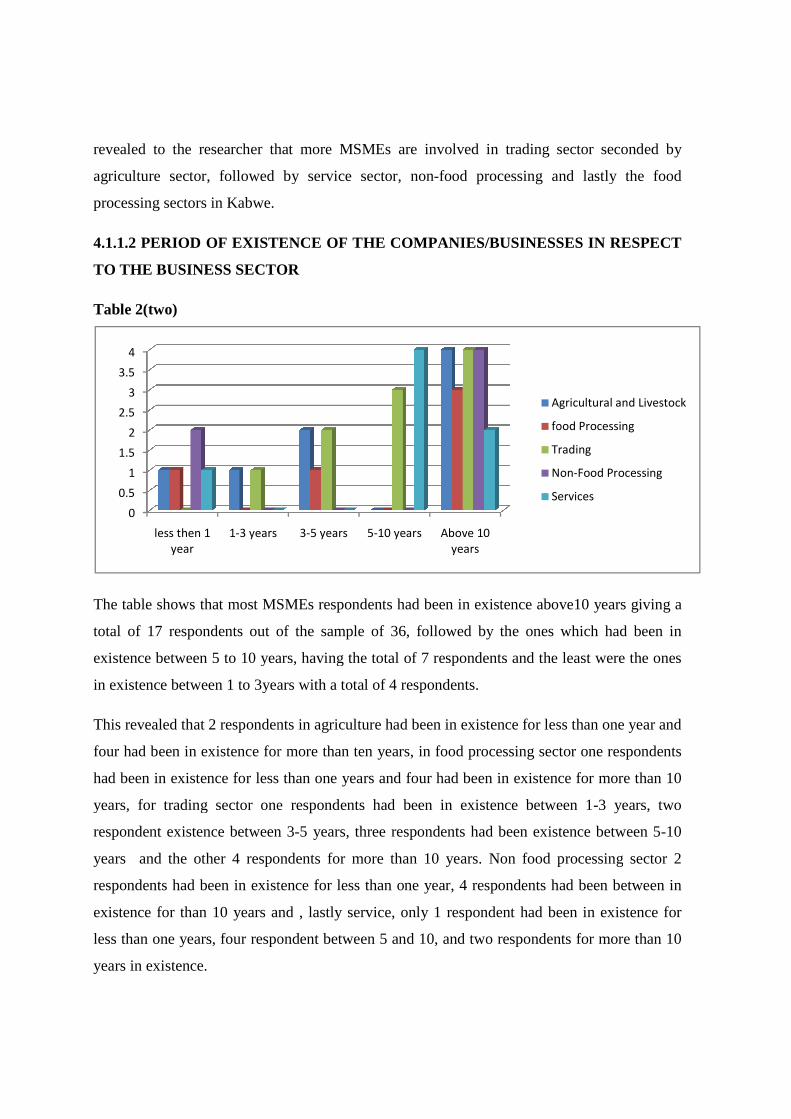
4.1.1.2 PERIOD OF EXISTENCE OF THE COMPANIES/BU
TO THE BUSINESS SECTOR
Table 2(two)
The table shows that most MSMEs
total of 17 respondents out of the sample of 36
existence between 5 to 10 years, having the total of 7
in existence between 1 to 3years with a total of 4
This revealed that 2 respondents in agriculture had be
four had been in existence for more than ten years, in food processing sector one
had been in existence for less than one years and four
years, for trading sector one
respondent existence between 3
years and the other 4 respondents
respondents had been in existen
existence for than 10 years and
less than one years, four respondent between 5 and 10, and two
years in existence.
0
0.5
1
1.5
2
2.5
3
3.5
4
less then 1
year
1-3 years
revealed to the researcher that more MSMEs are involved in trading sector seconded by
sector, followed by service sector, non-food processing and lastly th
4.1.1.2 PERIOD OF EXISTENCE OF THE COMPANIES/BUSINESSES IN RESPECT
SECTOR
The table shows that most MSMEs respondents had been in existence above
pondents out of the sample of 36, followed by the ones which had
existence between 5 to 10 years, having the total of 7 respondents and the least were the
ween 1 to 3years with a total of 4 respondents.
respondents in agriculture had been in existence for less than one year and
in existence for more than ten years, in food processing sector one
ce for less than one years and four had been in existence for more t
years, for trading sector one respondents had been in existence between 1
respondent existence between 3-5 years, three respondents had been existence between 5
respondents for more than 10 years. Non food processing
respondents had been in existence for less than one year, 4 respondents had been between
for than 10 years and , lastly service, only 1 respondent had been in existence for
pondent between 5 and 10, and two respondents for more than 10
3-5 years 5-10 years Above 10
years
Agricultural and Livestock
food Processing
Trading
Non
Services
ading sector seconded by
and lastly the food
SINESSES IN RESPECT
respondents had been in existence above10 years giving a
, followed by the ones which had been in
respondents and the least were the ones
en in existence for less than one year and
in existence for more than ten years, in food processing sector one respondents
had been in existence for more than 10
had been in existence between 1-3 years, two
respondents had been existence between 5-10
for more than 10 years. Non food processing sector 2
had been between in
, only 1 respondent had been in existence for
respondents for more than 10
Agricultural and Livestock
food Processing
Trading
Non-Food Processing
Services
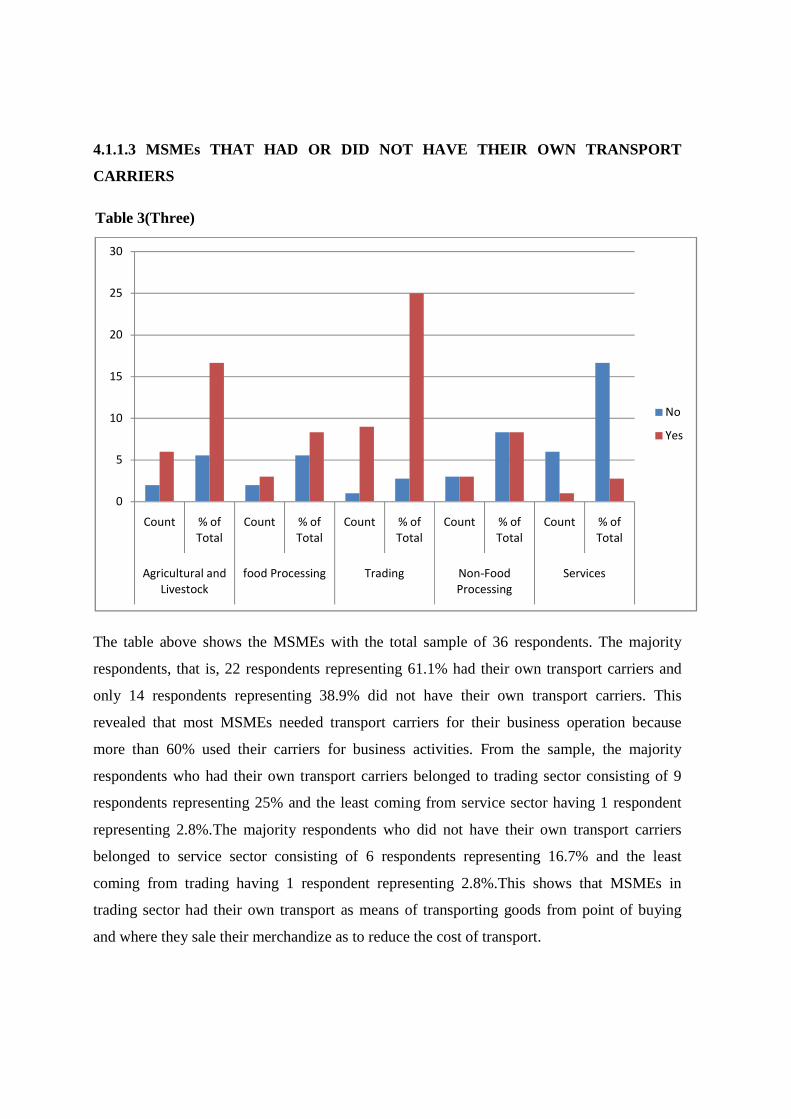
4.1.1.3 MSMEs THAT HAD OR DID NOT HAVE THEIR OWN TRANSPORT
CARRIERS
Table 3(Three)
The table above shows the MSMEs with the total sample of 36 respondents. The majority
respondents, that is, 22 respondents representing 61.1% had their own transport carriers and
only 14 respondents representing 38.9% did not have their own transport carriers. This
revealed that most MSMEs needed transport carriers for their business operation because
more than 60% used their carriers for business activities. From the sample, the majority
respondents who had their own transport carriers belonged to trading sector consisting of 9
respondents representing 25% and the least coming from service sector having 1 respondent
representing 2.8%.The majority respondents who did not have their own transport carriers
belonged to service sector consisting of 6 respondents representing 16.7% and the least
coming from trading having 1 respondent representing 2.8%.This shows that MSMEs in
trading sector had their own transport as means of transporting goods from point of buying
and where they sale their merchandize as to reduce the cost of transport.
0
5
10
15
20
25
30
Count % of
Total
Count % of
Total
Count % of
Total
Count % of
Total
Count % of
Total
Agricultural and
Livestock
food Processing Trading Non-Food
Processing
Services
No
Yes
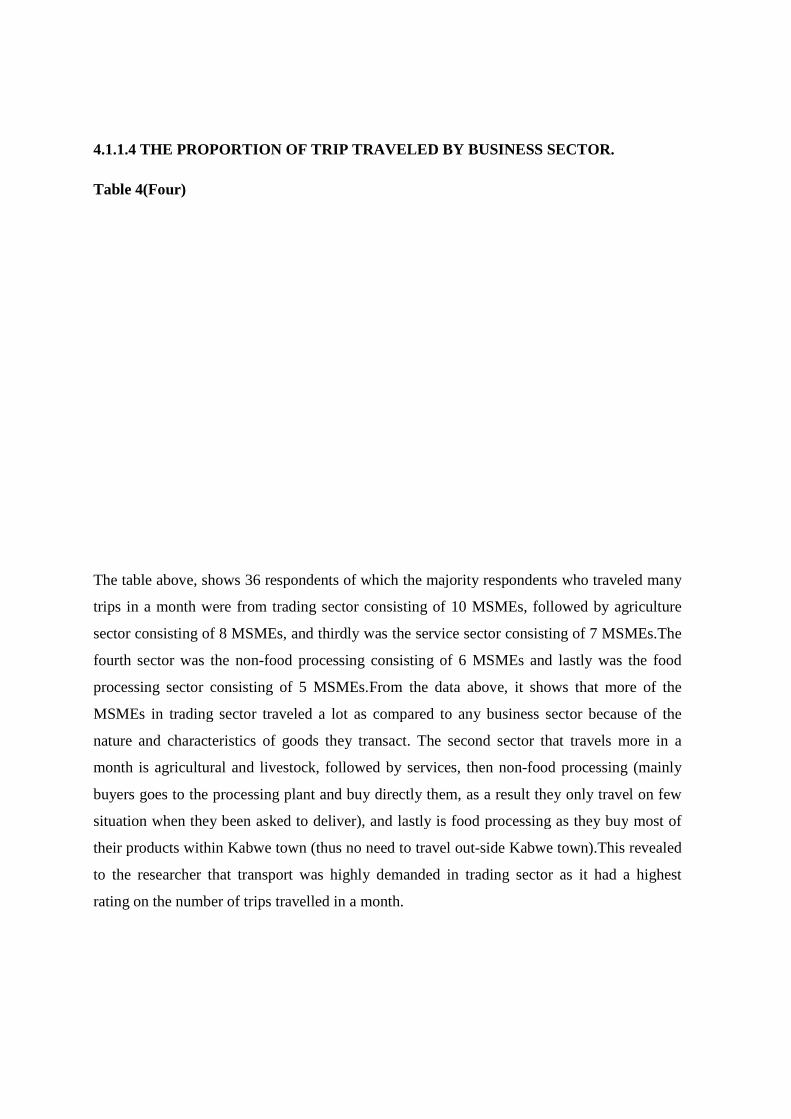
4.1.1.4 THE PROPORTION
Table 4(Four)
The table above, shows 36 respondents of which the majority respondents
trips in a month were from trading
sector consisting of 8 MSMEs, and thirdly was the service sector consisting of 7 MSMEs.The
fourth sector was the non-food processing consisting of 6 MSMEs and lastly was the
processing sector consisting
MSMEs in trading sector traveled a lot as compared to any business sector because of the
nature and characteristics of goods they transact. The second sector that travels more in a
month is agricultural and livestock, followed by services, then non
buyers goes to the processing plant and buy directly them, as a result they only travel on few
situation when they been asked to deliver)
their products within Kabwe town (thus no need to travel out
to the researcher that transport was highly demanded in trading sector as it had a highest
rating on the number of trips travelled in a month.
ON OF TRIP TRAVELED BY BUSINESS SECTOR
he table above, shows 36 respondents of which the majority respondents
ere from trading sector consisting of 10 MSMEs, followed by agriculture
sector consisting of 8 MSMEs, and thirdly was the service sector consisting of 7 MSMEs.The
food processing consisting of 6 MSMEs and lastly was the
of 5 MSMEs.From the data above, it shows that more of the
MSMEs in trading sector traveled a lot as compared to any business sector because of the
nature and characteristics of goods they transact. The second sector that travels more in a
tural and livestock, followed by services, then non-food processing (mainly
buyers goes to the processing plant and buy directly them, as a result they only travel on few
situation when they been asked to deliver), and lastly is food processing as they buy
Kabwe town (thus no need to travel out-side Kabwe town).
to the researcher that transport was highly demanded in trading sector as it had a highest
rating on the number of trips travelled in a month.
BY BUSINESS SECTOR.
he table above, shows 36 respondents of which the majority respondents who traveled many
consisting of 10 MSMEs, followed by agriculture
sector consisting of 8 MSMEs, and thirdly was the service sector consisting of 7 MSMEs.The
food processing consisting of 6 MSMEs and lastly was the food
From the data above, it shows that more of the
MSMEs in trading sector traveled a lot as compared to any business sector because of the
nature and characteristics of goods they transact. The second sector that travels more in a
food processing (mainly
buyers goes to the processing plant and buy directly them, as a result they only travel on few
, and lastly is food processing as they buy most of
side Kabwe town).This revealed
to the researcher that transport was highly demanded in trading sector as it had a highest
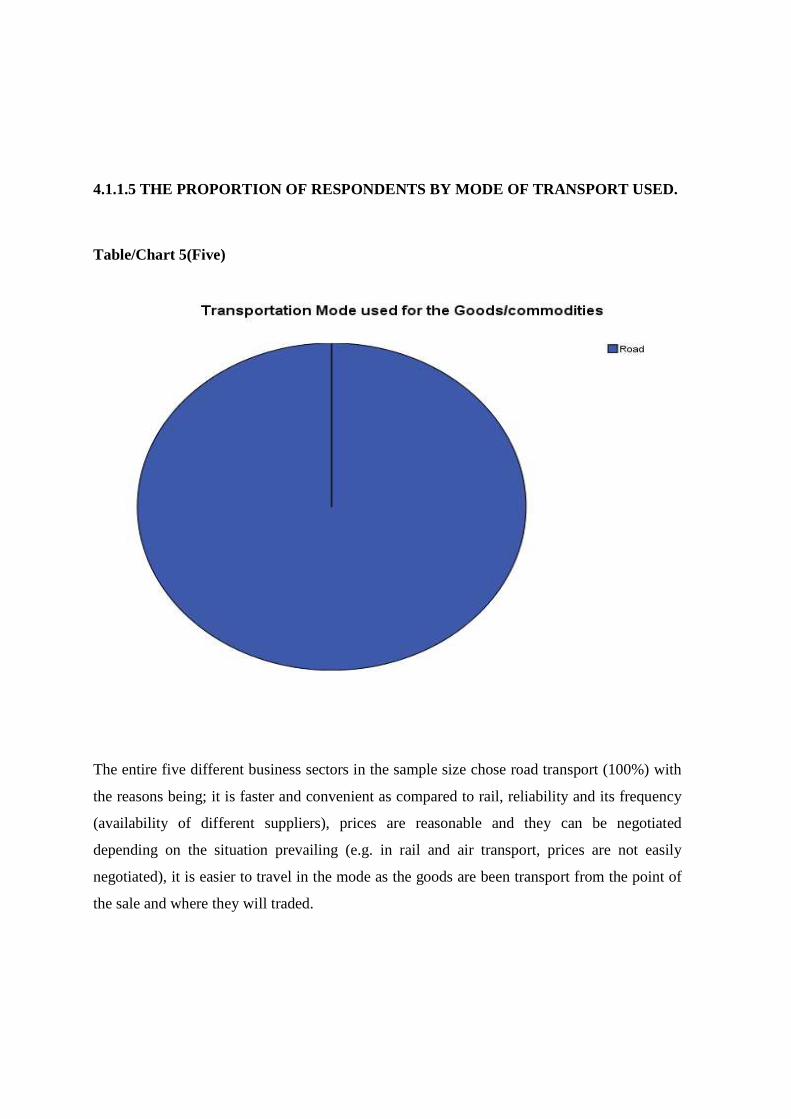
4.1.1.5 THE PROPORTION OF RESPONDENTS BY MODE OF TRANSPORT USED.
Table/Chart 5(Five)
The entire five different business sectors in the sample size chose road transport (100%) with
the reasons being; it is faster and convenient as compared to rail, reliability and its frequency
(availability of different suppliers), prices are reasonable and they can be negotiated
depending on the situation prevailing (e.g. in rail and air transport, prices are not easily
negotiated), it is easier to travel in the mode as the goods are been transport from the point of
the sale and where they will traded.
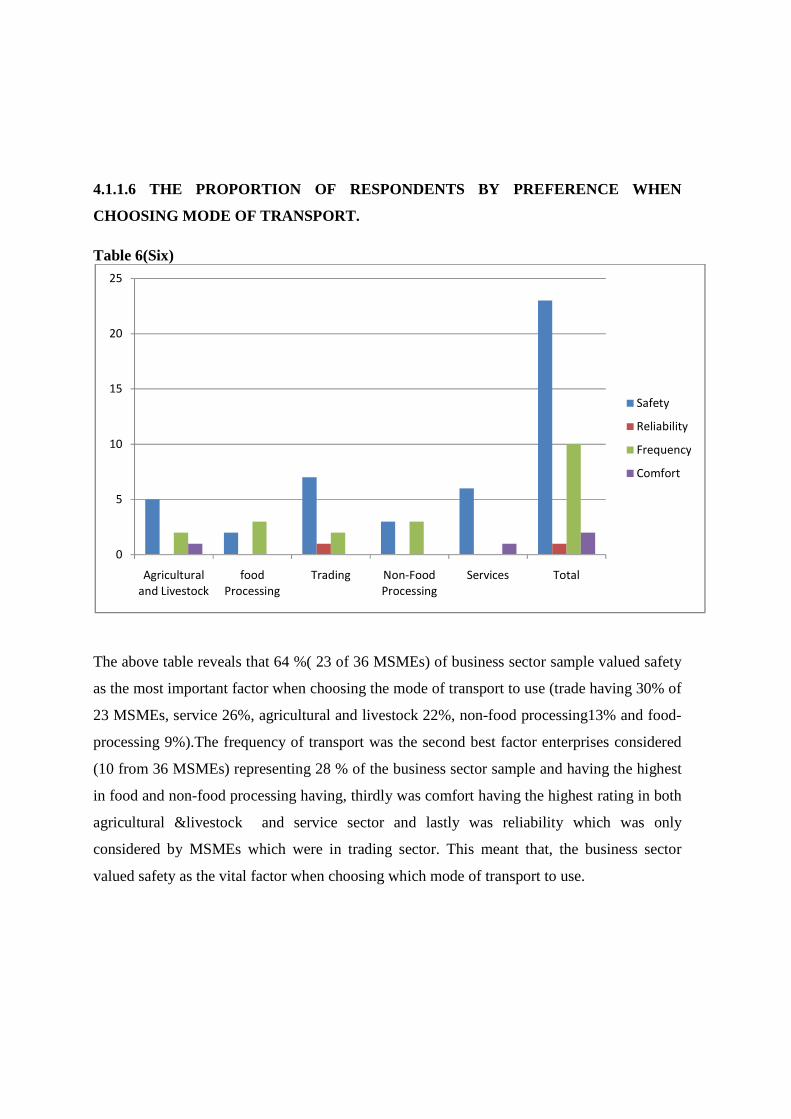
4.1.1.6 THE PROPORTION OF RESPONDENTS BY PREFERENCE WHEN
CHOOSING MODE OF TRANSPORT.
Table 6(Six)
The above table reveals that 64 %( 23 of 36 MSMEs) of business sector sample valued safety
as the most important factor when choosing the mode of transport to use (trade having 30% of
23 MSMEs, service 26%, agricultural and livestock 22%, non-food processing13% and food-
processing 9%).The frequency of transport was the second best factor enterprises considered
(10 from 36 MSMEs) representing 28 % of the business sector sample and having the highest
in food and non-food processing having, thirdly was comfort having the highest rating in both
agricultural &livestock and service sector and lastly was reliability which was only
considered by MSMEs which were in trading sector. This meant that, the business sector
valued safety as the vital factor when choosing which mode of transport to use.
0
5
10
15
20
25
Agricultural
and Livestock
food
Processing
Trading Non-Food
Processing
Services Total
Safety
Reliability
Frequency
Comfort

4.1.1.7 THE PROPORTION OF RESPONDENTS BY PREFERENCE WHEN
MAKING A JOURNEY.
Table 7(Seven)
The data above shows that, 33.33 %( highest)
quantity of the product as the most important factor when business/enterprise is making a trip
representing a majority from trading
services both representing 22.22% of the sample
high quality of services than any other sector because of the nature of goods and commodities
they usually buy and income is mostly in considered in non
deals with high cost goods that nee
business travel (incurred expenses are paid
transport is highly considered in the service sector with a percentage of 13.89% and it shows
that MSMEs that are involved in service sector are only interest in time taken to travel to their
respective destinations and come
business sector selected showing only 8.33% of the total sample
MSMEs considers among the business sector viewed it as one of the most influencing factor
PORTION OF RESPONDENTS BY PREFERENCE WHEN
The data above shows that, 33.33 %( highest) from 36 respondents considers
quantity of the product as the most important factor when business/enterprise is making a trip
representing a majority from trading sector. The second factors are income and quality of
services both representing 22.22% of the sample size. The agricultural and livestock considers
services than any other sector because of the nature of goods and commodities
they usually buy and income is mostly in considered in non-food manufacturing sector as it
deals with high cost goods that need to be properly apportioned before making an order or
expenses are paid the end of the month).Price of other forms of
transport is highly considered in the service sector with a percentage of 13.89% and it shows
re involved in service sector are only interest in time taken to travel to their
respective destinations and come back. Speed of transport is considered to be the least in the
showing only 8.33% of the total sample size; this means
MSMEs considers among the business sector viewed it as one of the most influencing factor
PORTION OF RESPONDENTS BY PREFERENCE WHEN
considers quality or
quantity of the product as the most important factor when business/enterprise is making a trip
second factors are income and quality of
gricultural and livestock considers
services than any other sector because of the nature of goods and commodities
food manufacturing sector as it
d to be properly apportioned before making an order or
Price of other forms of
transport is highly considered in the service sector with a percentage of 13.89% and it shows
re involved in service sector are only interest in time taken to travel to their
d to be the least in the
this means neither of
MSMEs considers among the business sector viewed it as one of the most influencing factor.
4.1.1.8 THE PROPORTION OF RESPONDENTS
RELLATIONSHIP BETWEEN
EMPLOYMENT CREATION
Table 8(Eight)
The growth of MSMEs leads to jobs creation in the economy and less unemployment leads to
economic growth. From the sample size of 36 MSMEs ,28% (trading sector),22%(agricultural
and livestock),19%(services),17%(non
that effective demand of transport can lead to employment
highest percentage of job creation
sector. The following reasons gi
employment creation. When more trips are made, more vehicles are needed and hence more
drivers, co-drivers and conductors will be employed and effective demand for road transport
leads to road damages(number of trips increa
construction and maintenance and thus creating employment. When there is high effective
demand for transport, more mechanics will be needed for the maintenance of automobile
because wear and tear will be high
create employment.
HE PROPORTION OF RESPONDENTS ON HOW THEY VIEW THE
RELLATIONSHIP BETWEEN EFFECTIVE TRANSPORT DE
EMPLOYMENT CREATION.
The growth of MSMEs leads to jobs creation in the economy and less unemployment leads to
economic growth. From the sample size of 36 MSMEs ,28% (trading sector),22%(agricultural
and livestock),19%(services),17%(non-food processing),and 14%(food processing)
that effective demand of transport can lead to employment creation. Trading sector shows the
of job creation as it demands more of transport than any other business
s given by are how effective demand for transport can lead to
. When more trips are made, more vehicles are needed and hence more
drivers and conductors will be employed and effective demand for road transport
leads to road damages(number of trips increases) which in turn lead to road rehabilitation,
construction and maintenance and thus creating employment. When there is high effective
demand for transport, more mechanics will be needed for the maintenance of automobile
will be high due to number trips taken, distance covered and thus it
ON HOW THEY VIEW THE
TRANSPORT DEMAND AND
The growth of MSMEs leads to jobs creation in the economy and less unemployment leads to
economic growth. From the sample size of 36 MSMEs ,28% (trading sector),22%(agricultural
food processing),and 14%(food processing),all agreed
creation. Trading sector shows the
than any other business
demand for transport can lead to
. When more trips are made, more vehicles are needed and hence more
drivers and conductors will be employed and effective demand for road transport
ses) which in turn lead to road rehabilitation,
construction and maintenance and thus creating employment. When there is high effective
demand for transport, more mechanics will be needed for the maintenance of automobile
due to number trips taken, distance covered and thus it
4.2 Challenges Faced by MSMEs
The following are some of the challenges faced by the MSMEs in Kabwe town according to
the study and these are as following;
Cost of wages and salaries have increased on MSMEs that have their own freight or transport
carriers. This showed that most MSMEs had difficulties to meet the minimum wage
demanded by the government and hence they had difficulties to employ many drivers to meet
their workforce.
Road traffic congestion between Kabwe and Lusaka road had brought concern on Kabwe
MSMEs due to its increased road accidents and delays made because of congestion as it is a
major trade route used by Kabwe MSMEs.The cost of energy had increased especially
electricity which had made an increment on expenses in incurred and MSMEs in food
processing and production sector felt the impact, thus reduced its profit which would have
been used for expansion.
Lack of high technology automobile center for the servicing of vehicles especially the
automatic vehicles, light and heavy trucks. There are few or no automobile center for spare
part and skilled workforce for vehicles such as trucks, automatic and heavy duty trucks. This
had made MSMEs either to hire expert from other towns (Lusaka or Copperbelt) or toll the
vehicles (trucks) to Lusaka to be work on by experts. This had brought inconveniences and
increased operation cost on MSMEs. The other factor was poor road network within and
which increased the cost of operation (depreciation) on vehicles.
4.3.1 Regression Analysis In order to produce a proxy, we need to establish a functional relationship for total trips
traveled. As a result of this research, the functional model measurement will be represented
mathematically as follows:
TP= f (SS, GP, CGI, ST, µ)………………………….….. (a)
Where;
TP = Trips Traveled
SS - Standard of Service
GP – Good Price
CGI- Characteristics of Goods Involved
ST- Speed of Transport
µ- error term
In order to understand the relationship and significance of the variables above in the
objectives of this research and also applying to the testing of the hypothesis through the
transport economics theory of trip distribution and the econometric model can be expressed as
followed from (a) above:
TP =β0 + β1SS + β2GP + β3CGI + β4ST + µ……………………… (b)
µ= error term
β0= Constant term and
β1= the coefficient of the independent variable (SS) which β1 > 0
β2= the coefficient of the independent variable (GP) which β2 > 0
β3= the coefficient of the independent variable (CGI) which β3 > 0
β4 = the coefficient of the independent variable (ST) which β4 > 0
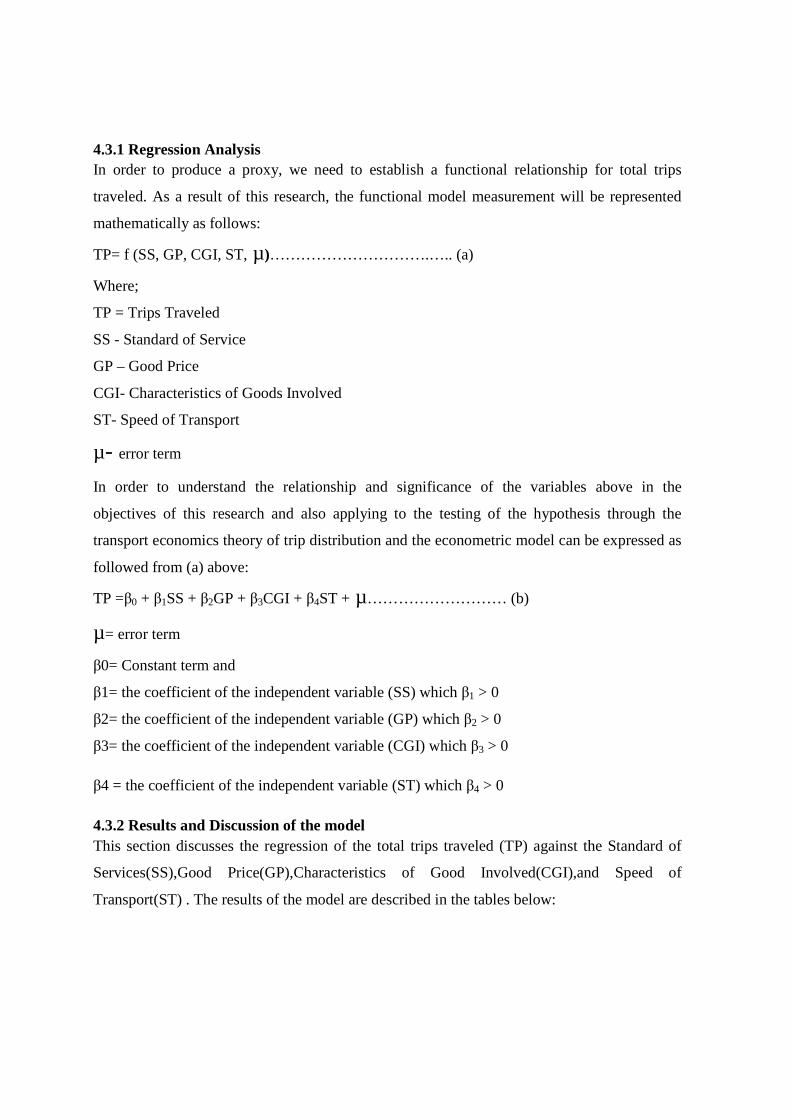
4.3.2 Results and Discussion of the model This section discusses the regression of the total trips traveled (TP) against the Standard of
Services(SS),Good Price(GP),Characteristics of Good Involved(CGI),and Speed of
Transport(ST) . The results of the model are described in the tables below:
4.3.3 One to Two Trips in Month
ANOVA Column1 Column2 Column3 Column4 Column5
Df SS MS F
Significance
F
Regression 4 0.86594203 0.216485507 1.363766049 0.269102377
Residual 32 6.77294686 0.211654589
Total 36 7.63888889
Column1 Coefficients
Standard
Error t Stat P-value
Lower
95%
Upper
95%
Intercept 1 0.46006 2.173633 0.03724228 0.063 1.9
Standard of service -0.65217 0.46995 -1.38774 0.17480461 -1.61 0.3
Good price 0 0 65535 #NUM! 0 0
Characteristics of goods
involved -0.77778 0.48495 -1.60385 0.11857369 -1.77 0.2
Speed of transport -1 0.53123 -1.88242 0.06889897 -2.08 0.1
The coefficient of determination, R 2, tells us that only 11.33 percent of the variation in data
values was explained by the regression line and 87 percent of the variables in the model are
not explained. The R2 is less than 0.2 as a result the fitted regression line is not of good fit and
it means that a very few MSMEs were affected by standard of services,price,characteristics of
goods involved and the speed of transport when making one to two trips in a month. They
were affected by other factors other than these mentioned above.
Regression Statistics Column1
Multiple R 0.336689299
R Square 0.113359684
Adjusted R Square -0.001012846
Standard Error 0.460059332
Observations 36
4.3.4 Three to Four Trips in Month
Regression Statistics Column1
Multiple R 0.414122668
R Square 0.171497585
Adjusted R Square 0.062575483
Standard Error 0.45511054
Observations 36
ANOVA Column1 Column2 Column3 Column4 Column5
Df SS MS F Significance F
Regression 4 1.371980676 0.342995169 2.207968902 0.091116931
Residual 32 6.628019324 0.207125604
Total 36 8
Column1 Coefficients
Standard
Error t Stat P-value Lower 95% Upper 95%
Intercept 1.443E-15 0.45511054 3.17031E-15 1 -0.92702983 0.92702983
Standard of
service 0.4782609 0.464898984 1.028741483 0.311314708
-
0.468707367 1.425229106
Good price 0 0 65535 #NUM! 0 0
Characteristics
of goods
involved 0.1111111 0.479728631 0.231612424 0.818313765 -0.86606413 1.088286352
Speed of
transport -1.41E-15 0.525516386 -2.6834E-15 1
-
1.070441844 1.070441844
4.3.5 Coefficient of Variation R-Squared (R2)
The coefficient of variation for this econometric model was found to be 0.1714975. This
implies that 17 percent of the disparity on total trips traveled was attributed to the variation on
standard of service, good price, characteristics of goods involved and speed of transport and
the remaining 83 percent of the variables in the model are not explained. The R2 is less than
0.2 as a result the fitted regression line is not of good fit. This shows that only a few of
MSMEs who traveled between three to four trips in a month were affected by standard of
services,price,characteristics of goods involved and the speed of transport and 83 percent of
the MSMEs were not affected.
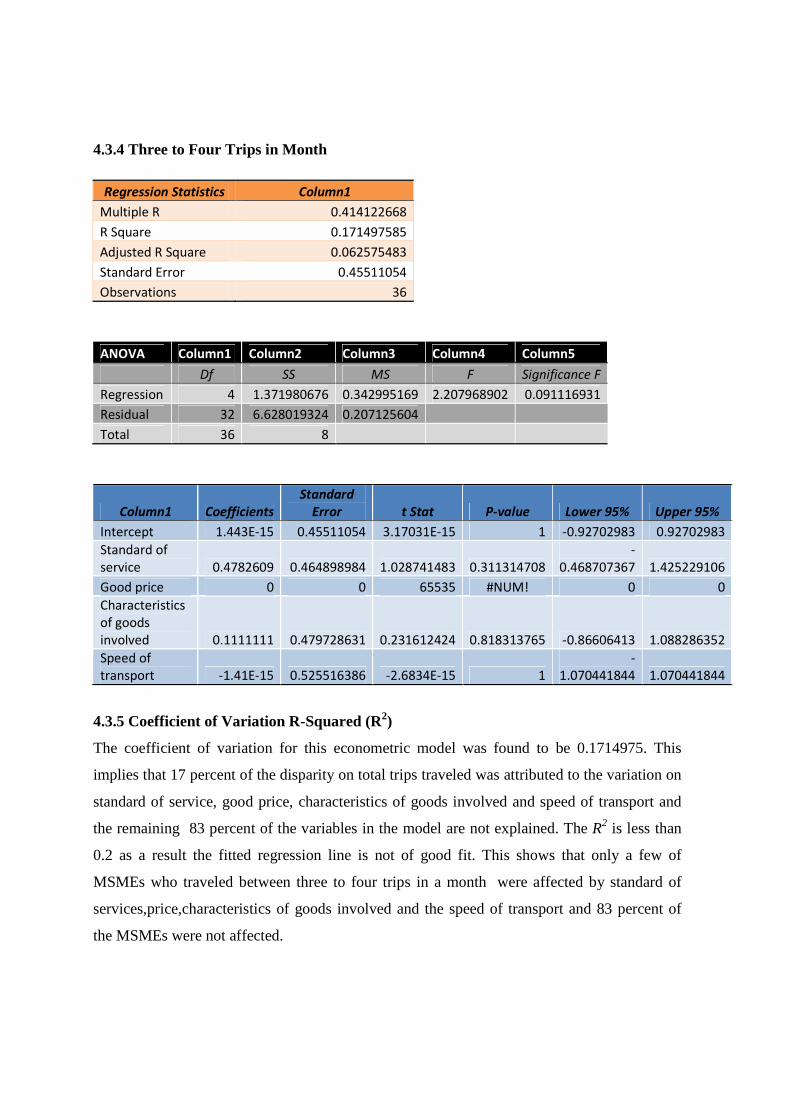
4.1.3.5 Five trip and above in month
Regression Statistics Column1
Multiple R 0.60112347
R Square 0.361349426
Adjusted R Square 0.270225934
Standard Error 0.407137409
Observations 36
ANOVA Column1 Column2 Column3 Column4 Column5
df SS MS F
Significance
F
Regression 4 3.001207729 0.750301932 6.035215543 0.001034137
Residual 32 5.304347826 0.16576087
Total 36 8.305555556
Column1 Coefficients
Standard
Error t Stat P-value Lower 95% Upper 95%
Intercept 5.55E-16 0.40713741 1.363E-15 1
-
0.829311759 0.829312
Standard of service(SS) 0.173913 0.41589405 0.4181667 0.67862
-
0.673235418 1.021062
Good price(GP) 0 0 65535 #NUM! 0 0
Characteristics of goods
involved(CGI) 0.666667 0.42916051 1.5534203 0.13016
-
0.207504683 1.540838
Speed of transport(ST) 1 0.47012179 2.1271084 0.04122 0.042393265 1.957607
4.3.7 INTERPRETATION OF RESULTS 4.3.7.1 CONSTANT INTERPRETATION
The intercept value of 5.55112 was found, mechanically interpreted, means that if the values
of SS,GP,CGI, and ST rate were fixed at zero, the mean trip travel in a month would increase
by 6 trips in a month. This implies that, the number of trips will still increase by 6 when
standard of service, speed of transport and characteristics of good involved are held constant.
4.3.7.2 COEFFICIENTS INTERPRETATION:
4.3.7.2a Standard of service
0.173913 is the partial regression coefficient of SS and tells us that with the influence of GP,
CGI, and ST held constant, as SS increases, number of trips traveled in a month will increase
by 0.173913. The coefficient was positive and statistically significantly with t-test value of
0.4181667 at 0.05 level of significance. This means that, if standard of service increases by 1
percent, the number of trips increases by 17 percent
4.3.7.2b Characteristics of Good Involved
In the model, the partial regression coefficient of CGI was found to be 0.66667 which implies
that for every increase in characteristics of goods involved, the total trip travels rate increases
by 0.66667. The coefficient was positive and statistically significantly with t-test value of
1.5534203 at 0.05 level of significance. This economically means that, if there are new
transport vessels that can accommodate different characteristics of goods involved then the
number of trips will increase by 67 percent.
4.3.7.2c Good Price
The partial coefficient of GP was found to be 0(zero) and tells us that holding the influence of
SS, CGI, and ST coefficient, constant, the number of trips to be traveled in a month was still
be 0(zero) at 0.05 level of significance.Economically, it implies that the number of trips will
still increase even if price increases at any percentage rate as demand for transport is elastic.
4.3.7.2d Speed of Transport
The partial regression coefficient was found to as 1. This implies that as the total number of
trips in a month increase by 100%. This implies that there is a positive relationship between
trips in a month and speed of transport. The coefficient was found to be positive and
statistically significantly with t-value of 2.1271084 at 0.05 level of significance. This implies
that, the number of trips will increase by 100 percent when there is a 1 percent increase in
speed of transport vessels.
4.3.7.3a Coefficient of Variation R-Squared (R2)
The coefficient of variation for this econometric model was found to be 0.361349426. This
implies that 36 percent of the disparity on total trips traveled was attributed to the variation on
standard of service, good price, characteristics of goods involved and speed of transport and
the remaining 64 percent of the variables in the model are not explained. The R2 is greater
than 0.2 as a result the fitted regression line is of good fit.
4.3.7.3b F-test and its significance:
The F-test shows that the relation of the disparity in the regression to the ratio of the variation
of the residual or errors was found as 6.03521. This value found was greater than the tabulated
F-value of 0.0010 at 0.05 level of significance. This implies that the econometric model was
significant correct.
4.3.7.3c Proving the hypothesis
The findings of this study accept the null hypothesis and rejected the alternative hypothesis
which stated that determinant factors of transport with reference to the standard of services,
speed of transport and characteristics of goods involved have a positive impact on MSMEs
number of trips to be traveled. From the regression model, it showed that speed of transport
was a major determinant factor of transport demand by MSMEs as it was more elastic than
any other determinant factors (good price, standard of services and characteristics of goods
involved).It was found that MSMEs who had more trips in a month had R2 greater than 20%
as compared to those who had less trip. Thus determinant factors had a positive influence on
transport demanded by MSMEs.
4.3.7.3d Justification of Model
In literature, transport demand is influenced to a certain degree by the determinant factors.
The model shows that, there is a positive relationship between transport demand (trip travel)
and quality of service, income, time travel, price charged and etc. In this context, regression
model was being used as proxy of MSMEs travel demand model. The researcher found that,
the results obtained had a correlation with the previous studies carried by other authors in
literature review.
CONCLUSION AND RECOMMENDATION
5.1 Conclusion
From this research, most MSMEs who considered speed of transport as a main determining
factor could travel five trips and above in a month because of the reduced time taken.
Therefore a price charged on transport had no effect on the number of trips to be traveled in a
month as MSMEs were influenced by other factor such as their income, the importance of the
business trip and the distance to be covered because MSMEs still travelled even if price
charge on transport was increasing. If the speed of transport increase across the board, then
trips made in a month increases, causing an increase in demand for transport. Using the
number of trip traveled, shows that transport was highly demanded in trading sector with the
highest percentage rating as shown in tables 4.1.1.4 and least demanded in food processing.
Determinant factors (standard of service, characteristics of good involved, good price and
speed of transport) of transport encourage the number of trips to make in an economy. The
number of trips can change rapidly in response to changes in standard of service, price,
characteristics of goods involved and the speed of transport. The majority of enterprise in the
private sector especially the Kabwe MSMEs needs high speed of transport vessels, followed
by well manufactured transport vessel to accommodate the different characteristics of goods
to be involved and lastly high standard of service increased from transport operators to run
their businesses.
The research study identified three factors that determine the number of trips to be made and
these factors include; standard of service, characteristics of goods involved and the speed of
transport and encouraged MSMEs to demand more of transport modes in order to expand.
Furthermore the growth of MSMEs leads to jobs creation in the economy and less
unemployment lead to economic growth. In addition road transport in general despite the
determinant factors was used by the MSMEs in their transportation. Not only that road
transport had been found to have a positive impact on the MSMEs growth but also led the
MSMEs to demand more of transport
5.2 RECOMMENDATIONS There is need for other researchers to examine the transport providers on the standard of
services they provide, conditions, the price they charge and how it comes to effect on
MSMEs, and other related issues but time and resources could not allow.
The researcher makes recommendation for future research to be done on MSMEs and even to
other business sectors and different industries. The future researcher should also include other
determinant factor and also do a research on transport supply as to examine what determinant
factors makes transport providers to supply more of transport vessels (different transport
mode).
Government should set up business incubators that will incubate individual or groups of
individuals to operate enterprises. For it had showed that MSMEs demands more of transport
which in return would lead to more of employment creation (table 8). This would thus lead to
reduction in unemployment rate as a result it will bring promotion and development of
MSMEs. These bodies may also provide, managerial skills, accounting skills and transport
and logistics support for start up.
REFERENCE
Albalate, D. & G. Bel (2010)"What shapes Local Public Transportation in Europe?
Economics, Mobility, Institutions and Geography", Transportation Research Part E 46, 775-
790.
Albalate, D. & G. Bel (2010) "Tourism and urban public transport: Holding demand pressure
under supply constraints", Tourism Management 31, 425-433.
Bert van Wee and Kees Maat (2003). Land-Use and Transport: a Review and Discussion of
Dutch Research. The Netherlands, EJTIR, 3, no.2 (2003) pp.199-218.
Bowen, J. T., and Chen, S. (2002). Information Quality Benchmarks: Product and Service.
New York: McGraw-Hill.
Bureau of Industry Economics (1992b), Research Report 46: Road Freight International
Performance Indicators, Canberra: Australian Government Publishing Service.
Cihat Polat (2012) The Demand Determinants for Urban Public Transport Services: A Review
of the Literature. Journal of Applied Sciences, 12: 1211-1231.
Edward A. Beimborn (June 2006) Center for Urban Transportation Studies University of
Wisconsin-Milwaukee.
Frankena MW (1978) The demand for urban bus transit in Canada.
Gaël Raballand, Charles Kunaka, Bo Giersing (2008) the Impact of Regional Liberalization
and Harmonization in Road Transport Services: A Focus on Zambia and Lessons for
Landlocked Countries. WPS4482
Holmgren J (2005) Demand and supply of public transport—the problem of cause and effect.
In: International Conference on Competition and Ownership in Land Passenger Transport
(2005).
Kremers H, Nijkamp P, Rietveld P (2002) A meta-analysis of price elasticities of transport
demand in a general equilibrium frame-work. Econ Model 19:463–485
Mackellar, L., Wörgötter, A. and Wörz, J. (2000), “Economic Development Problems of
Landlocked Countries”, Institut für Höhere Studien (IHS), Wien, working paper 14.
Ministry of Commerce, Trade and Industry (MCTI) (2003) Manufacturing Sector Survey,
Lusaka: MCTI
Mohring H (1972) Optimization and scale economies in urban bus transportation. Am Econ
Rev 62:591–604
Mohammad .S.Ullah, Udit Molakatalla ,Rita Morocoima-Black ,Ahmed Z. Mohideen(2011)
Obudho, R.A.1992 Urban transport system: A case of the Matatu mode of transport in the city
of Nairobi, Kenya. In: African Urban Quarterly, Vo.7 (1) and (2)
Obudho.R.A and G.O.Aduwo(1990)Small Urban Centers and Spatial Planning in Kenya and
in Jonathan Baker Small Town in Africa: Studies in Rural-Spatial Interaction Uppsala,
Scandinavian institute of Africa Studies
Travel Demand Modeling For the Small and Medium Sized Mpos in Illinois
The Link Zambia 8000 Project- Road Development Agency
Stuart Cole (2005) Applied Transport Economics, Third Edition, Great Britain, Published by
Kogan Page Limited, 1987
www.sarpn.org/CountryPovertyPapers/Zambia/FirstDraft/Chapter11.pdf
www.SpringerLink.com
World Bank (1984). Zambia: Industrial Policy and Performance. Washington, DC.
World Bank (2002) Report No: 4035-2A
EXAMINING THE KEY DETERMINANT FACTORS FOR TRANSPORT DEMAND
BY MSMEs IN DIFFERENT BUSINESS SECTORS (AGRICULTURAL AND
LIVESTOCK, TRANDING, SERVICES, FOOD PROCESSING AND NON-FOOD
MANUFACTURING)
APPENDIX
1. Name.............................................................................................................
2. Sex Male [ ] Female [ ]
3. Age Range:
16-25 26-35 36-45 46-55 56-65 Above 65
4. Highest formal education:
None primary Basic High
School
Certificate/Dip Degree Master & Above
SECTION 2: BUSINESS CHARACTERISTICS
1. Name of the
business....................................................................................................................
2. Contacts: Telephone..................................,Email................................................
3. In which sector does the business falls in? (Multiple answers is possible)
Agriculture
& livestock
Food
processing
Trading Non-food
manufacturing
Services Other Specify
4. Where does the business along the value chain?
Primary
producer
Primary
Supplier
Processor/Manufacturer Wholesale Retailer None
5. For how long have you been doing this business?
Less than a year 1-3 years ago 3-5 years ago 5-10 years ago Above 10 years
SECTION 3: QUESTION FROM SUBJECT AREAS OF RESEARCH
1. (a) Does the business have its own freight or transportation carriers? No [ ]
Yes [ ] and if yes
specify...........................................................................................................................................
(b) What is the main reasons for a business to have its transportation carrier?(if (a) was "yes")
.......................................................................................................................................................
.......................................................................................................................................................
3. Is the business registered with any association?
No [ ] Yes [ ] and if yes please
specify...........................................................................................................................................
4. How many times have you been on a business journey or a trip for the business in one
month?
One Twice Three times Four Five Above five times
5. How long does the journey takes?
Overnight 2-5days 6-10 days Above 10 day
Specify the distance if possible...................................................................................Kilometers
6. (a) How do you travel to your respective destination?
Private car Hired vehicles Public transport Coaches Other
(b) When coming from respective destinations, do you usually travel in the same mode of
transport where the goods/commodities are? Yes [ ] No[ ] And if so, why?
Ans.................................................................................................................................................
7. How affordable are the travelling fares/freight charges? Ans......................................
8. (a) Do you experience any problem during the travelling to the same destination?
Yes
(Specify)...............................................................................................................................
No [ ]
(b) What solution do you suggest to these problems?
.......................................................................................................................................................
9. Rearrange in chronological order of preference when choosing a specific mode of
transport? Ans...............................................................................................................................
[Standard of services-1] [Quality-6] [Speed-4] [Good price-4] [Characteristics of goods
involved-3]
10. Rearrange following in chronological order of preference when you are about to make a
journey (starting with the top priority things).e.g. 12345
[Quality or quantity of the product-1] [Price/other forms of transport-2] [Income-3] [Speed
of transport-4] [Quality of service-
5].Ans...........................................................................................................................................
11. How are the goods/commodities transported from the point of origin to their destination?
Road [ ] Railway [ ] Air [ ] other [ ]
12. What is the major reason for choosing the mode of transport in question 11?
.......................................................................................................................................................
.......................................................................................................................................................
13. What factors are needed to improve the transportation services in order to enhance the
MSMEs growth and stability?
a)..................................................................................................................................................
b)....................................................................................................................................................
c)....................................................................................................................................................
14. Does effective demand for transport lead to employment creation?
Yes [ ]
Specify…………………………………………………………………………………………
…………………………………………………………………………………………………
No[ ]
Specify………………….………………………………………………………………………
….………………………………………………………………………………………………
15. For long did it take in the past year for your business to acquire specific mode of transport
when it has been demanded for?
Ans………………………………………………………………………………………………
16. How long does it take now for the same transport to be provided when it has been
demanded for?
Ans……………………………………………………………………………………………
17. What are the key factor that has lead into this disparity (question 19 and 20)?
A)…………………………………………………………………………………………...
B)……………………………………………………………………………………………
C)……………………………………………………………………………………………