Embed Size (px)
Citation preview
Jim Farmer
As presented at theOnline Teaching Conference
11 June 2007 | Fremont, California USA
E-Learning: On the Right Trackto a Successful Future?
Context: the public viewof higher education
Georg
eto
wn
U
niv
ers
ity
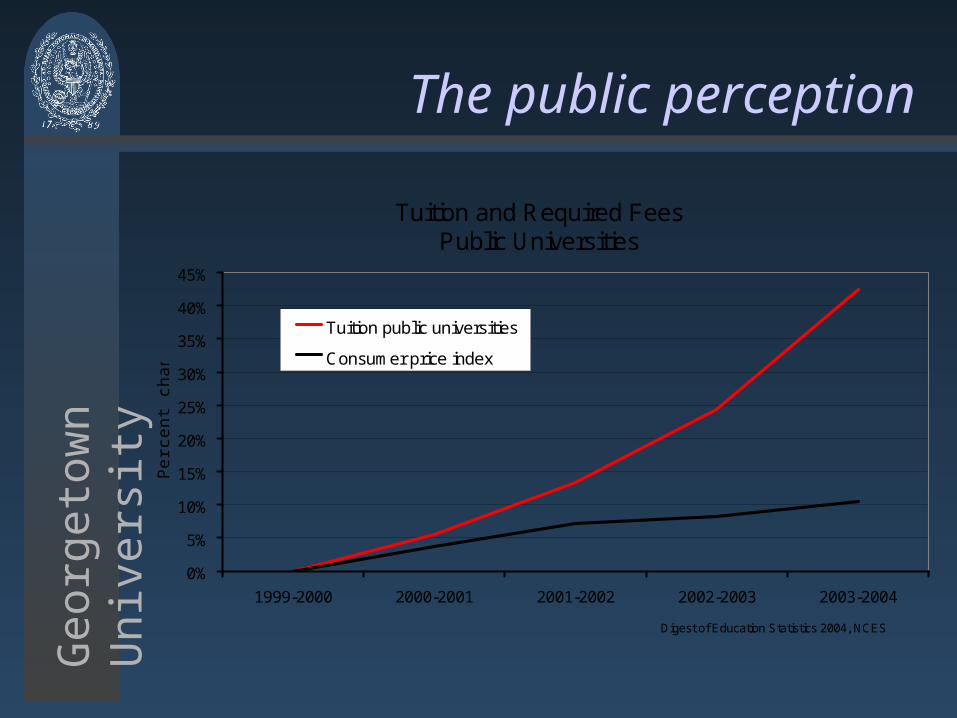
The public perception
Tuition and Required Fees Public Universities
0%
5%
10%
15%
20%
25%
30%
35%
40%
45%
1999-2000 2000-2001 2001-2002 2002-2003 2003-2004
Pe
rce
nt
cha
ng
e
Tuition public universities
Consumer price index
Digest of Education Statistics 2004, NCES
Georg
eto
wn
U
niv
ers
ity
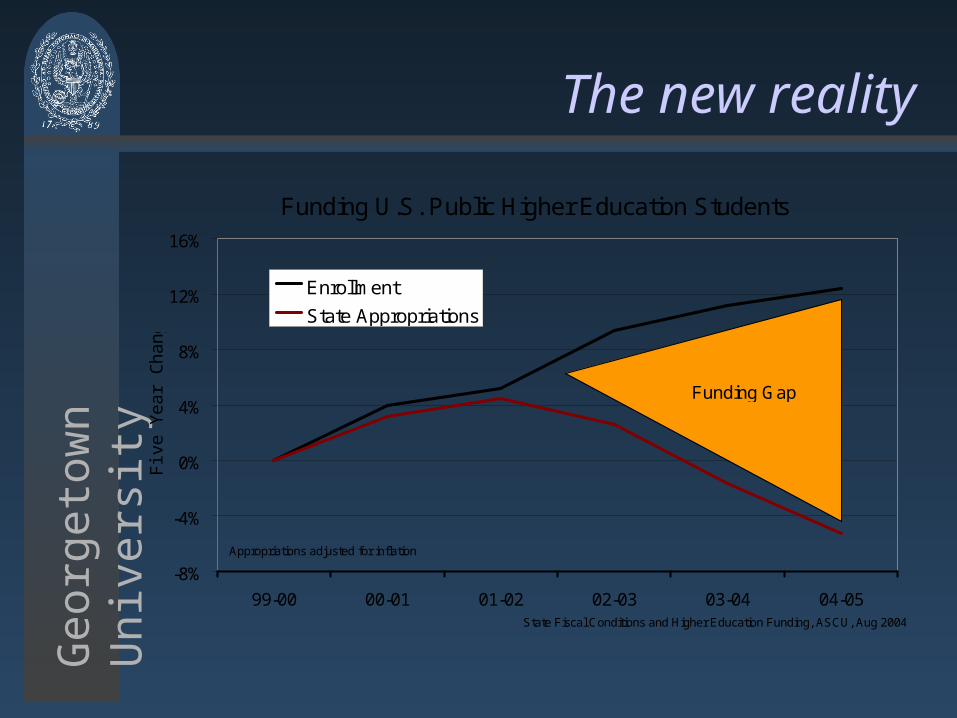
The new reality
Funding U.S. Public Higher Education Students
-8%
-4%
0%
4%
8%
12%
16%
99-00 00-01 01-02 02-03 03-04 04-05
Fiv
e Y
ea
r C
ha
ng
e
Enrollment
State Appropriations
FundingGap
State Fiscal Conditions and Higher Education Funding, ASCU, Aug 2004
Appropriations adjusted for inflation
Funding Gap
Georg
eto
wn
U
niv
ers
ity
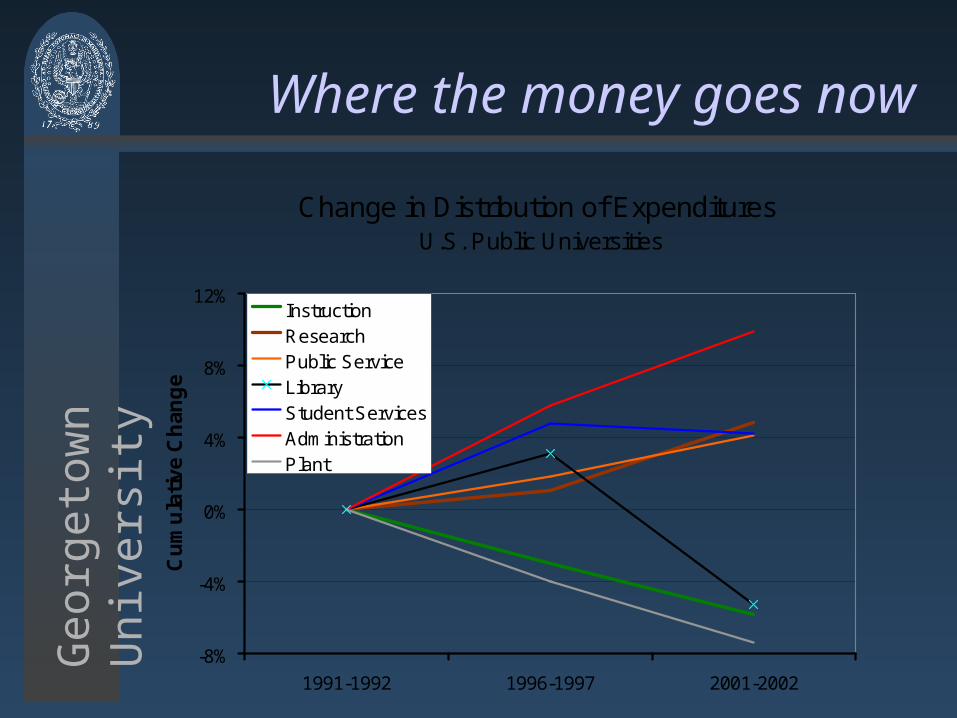
Where the money goes now
Change in Distribution of Expenditures U.S. Public Universities
-8%
-4%
0%
4%
8%
12%
1991-1992 1996-1997 2001-2002
Cu
mu
lati
ve C
han
ge
InstructionResearchPublic ServiceLibraryStudent ServicesAdministrationPlant
Georg
eto
wn
U
niv
ers
ity
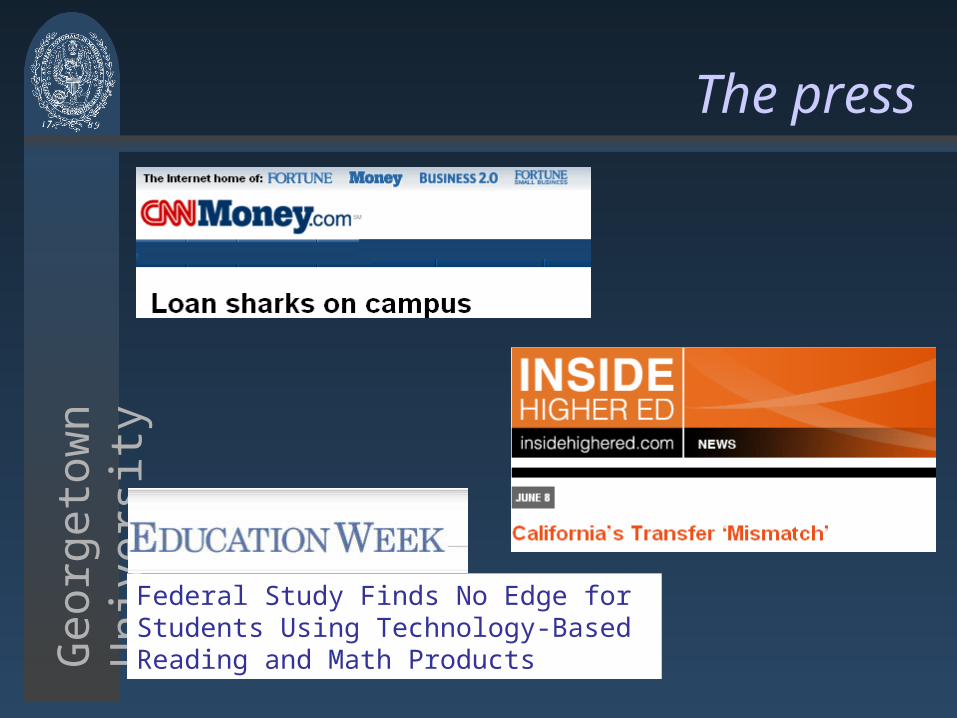
The press
Federal Study Finds No Edge for Students Using Technology-Based Reading and Math Products
Georg
eto
wn
U
niv
ers
ity
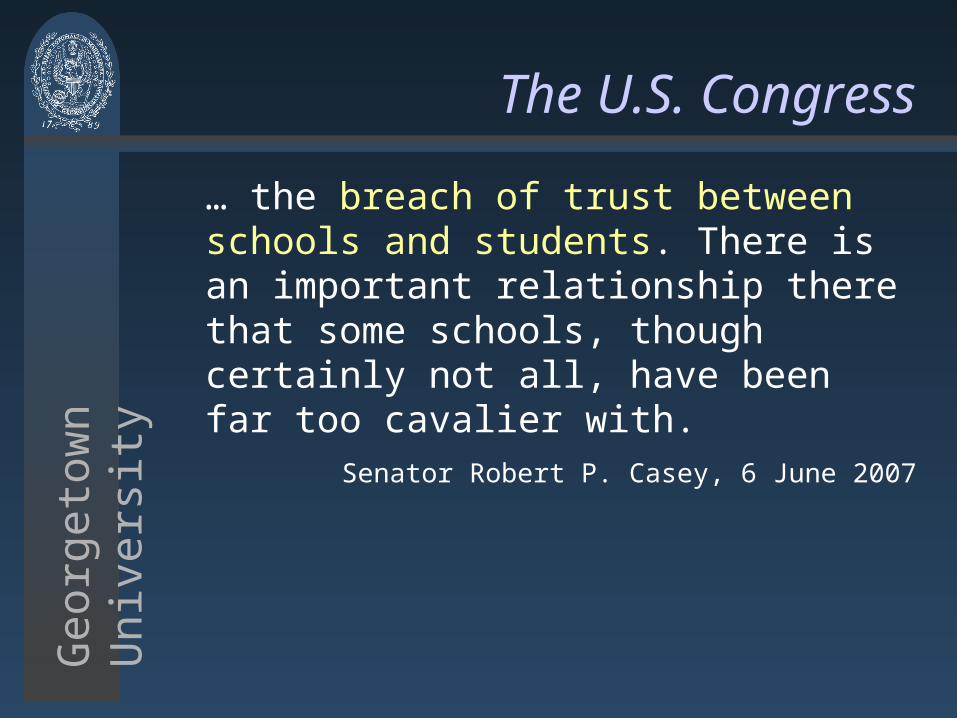
The U.S. Congress
… the breach of trust between schools and students. There is an important relationship there that some schools, though certainly not all, have been far too cavalier with.
Senator Robert P. Casey, 6 June 2007
Georg
eto
wn
U
niv
ers
ity
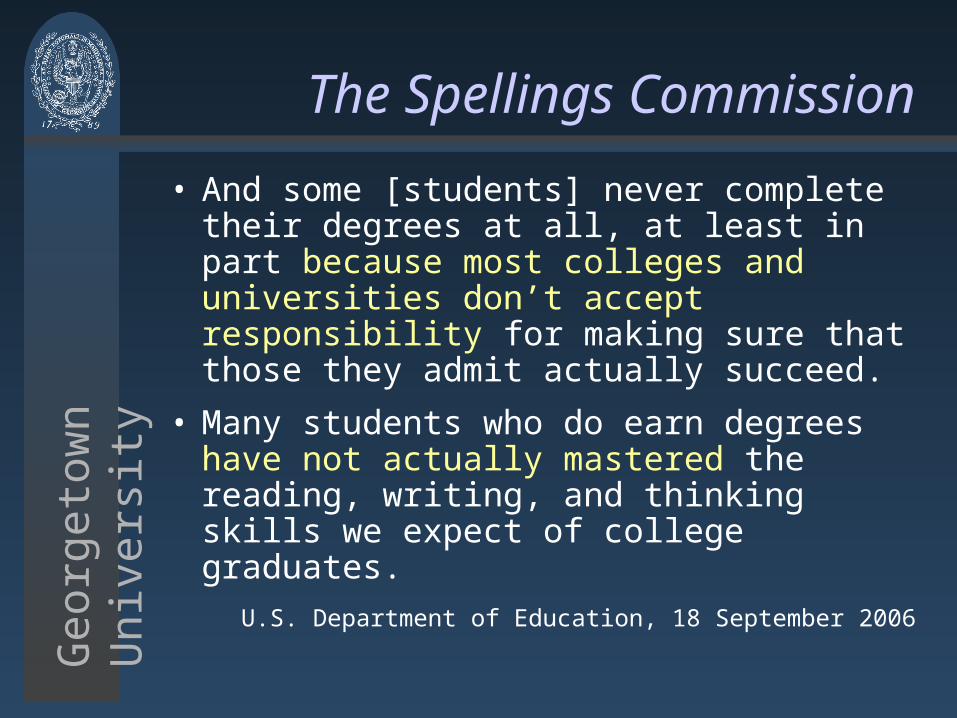
The Spellings Commission
• And some [students] never complete their degrees at all, at least in part because most colleges and universities don’t accept responsibility for making sure that those they admit actually succeed.
• Many students who do earn degrees have not actually mastered the reading, writing, and thinking skills we expect of college graduates.
U.S. Department of Education, 18 September 2006
Georg
eto
wn
U
niv
ers
ity
But the Commission wrote
• “We recommend that America’s colleges and universities embrace a culture of continuous innovation and quality improvement. We urge these institutions to develop new pedagogies, curricula and technologies to improve learning, particularly in the areas of science and mathematics.”
And eLearning
Georg
eto
wn
U
niv
ers
ity
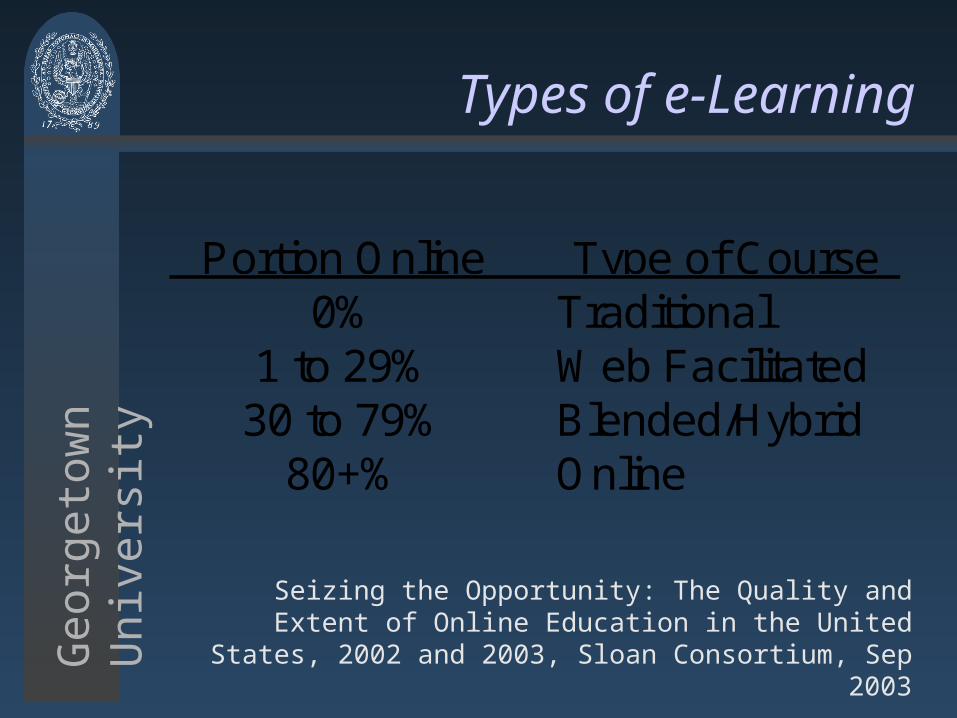
Types of e-Learning
Seizing the Opportunity: The Quality and Extent of Online Education in the United States, 2002 and 2003,
Sloan Consortium, Sep 2003
Portion Online Type of Course0% Traditional
1 to 29% Web Facilitated30 to 79% Blended/Hybrid
80+% Online
Georg
eto
wn
U
niv
ers
ity
Presidents on e-Learning
“Based on his work with the University of South Australia and his conversations with presidents and financial officers, [Bill Becker] said there is a general belief that eLearning increases the cost of education. He said the cost of the distance learning courses at the University of South Australia exceed those offered in the classroom because of the amount of time that faculty spend responding to students.”
“Access and Persistence Symposium,” September 8, 2005, Washington, DC
Georg
eto
wn
U
niv
ers
ityeLearning in California?
• “We did not hear that colleges looked to distance learning as a common strategy to help accommodate students and minimize loss of access. We do want to point out that one college that serves a large portion of its students through distance learning did find it economical to increase this portion. … with the infrastructures already in place, they could accommodate additional students in these programs more easily than in classrooms.”
Ensuring Access with Quality to California’s Community Colleges, May 2004
Georg
eto
wn
U
niv
ers
ity
Two perspectives of eLearning
• Graduate programs and undergraduate tutorials and independent study tend to: • Focus on collaboration among students and
faculty
• Use resources typical of a cross-institutional research effort
• Undergraduate programs, especially first and second year tend to:• Focus on online tutorials, “drill and practice,” and
assessments for learning
• Use faculty-recommended resources and Internet services
Georg
eto
wn
U
niv
ers
ity
U.S. Department of Education study of
educational software• “Congress posed questions about the
effectiveness of educational technology and how effectiveness is related to conditions and practices. ... On average, after one year, products did not increase or decrease test scores by amounts that were statistically different from zero.”
• As reported in the press: education technology doesn’t work.
Georg
eto
wn
U
niv
ers
ity
Evaluation of Education Technology: High School Algebra
“Effectiveness of Reading and Mathematics Software Products: Findings from the First
Student Cohort
Report to Congress,” Institute of Education Sciences, U.S. Department of Education, March
2007.
Georg
eto
wn
U
niv
ers
ity
Effectiveness of Reading andMathematics Software
Products• U.S. Congressionally mandated report
by the Institute of Education Sciences, U.S. Department of Education.
• Issued March 2007
• First and fourth grade reading, sixth grade mathematics and high school algebra.
• Context: The administration again did not seek funding for educational technology.
Georg
eto
wn
U
niv
ers
ity
Study findings
• “Nearly all teachers received training and believed the training prepared them to use the products.”
• “Technical difficulties using products mostly were minor.”
• “When products were being used, students were more likely to engage in individual practice and teachers were more likely to facilitate student learning rather than lecture.”
Georg
eto
wn
U
niv
ers
ity
Warning
These data are based on teaching high school algebra and would not be representative of other subjects, levels of instruction, or students with different characteristics.
Georg
eto
wn
U
niv
ers
ity
Training
• Algebra teachers received about 12 hours of training, including practice using the software.
• At the end 81% were “confident they were prepared to use the product”
• By the time of the first classroom observation, only 66% considered themselves prepared to use the software.
Georg
eto
wn
U
niv
ers
ity
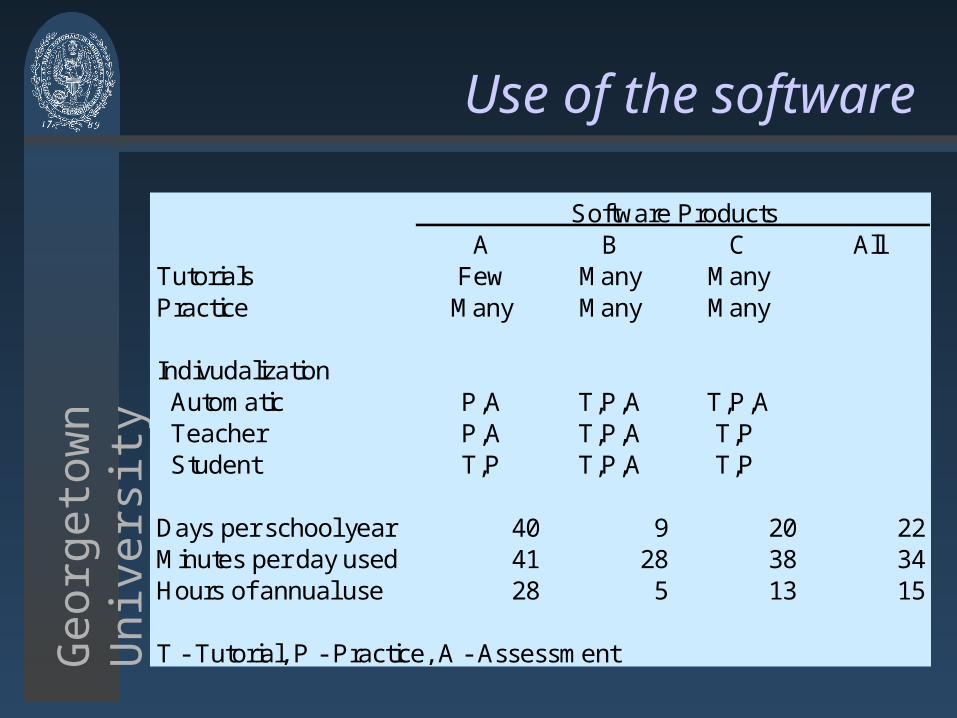
Use of the software
A B C AllTutorials Few Many ManyPractice Many Many Many
Indivudalization Automatic P,A T,P,A T,P,A Teacher P,A T,P,A T,P Student T,P T,P,A T,P
Days per school year 40 9 20 22Minutes per day used 41 28 38 34Hours of annual use 28 5 13 15
Software Products
T - Tutorial, P - Practice, A - Assessment
Georg
eto
wn
U
niv
ers
ity
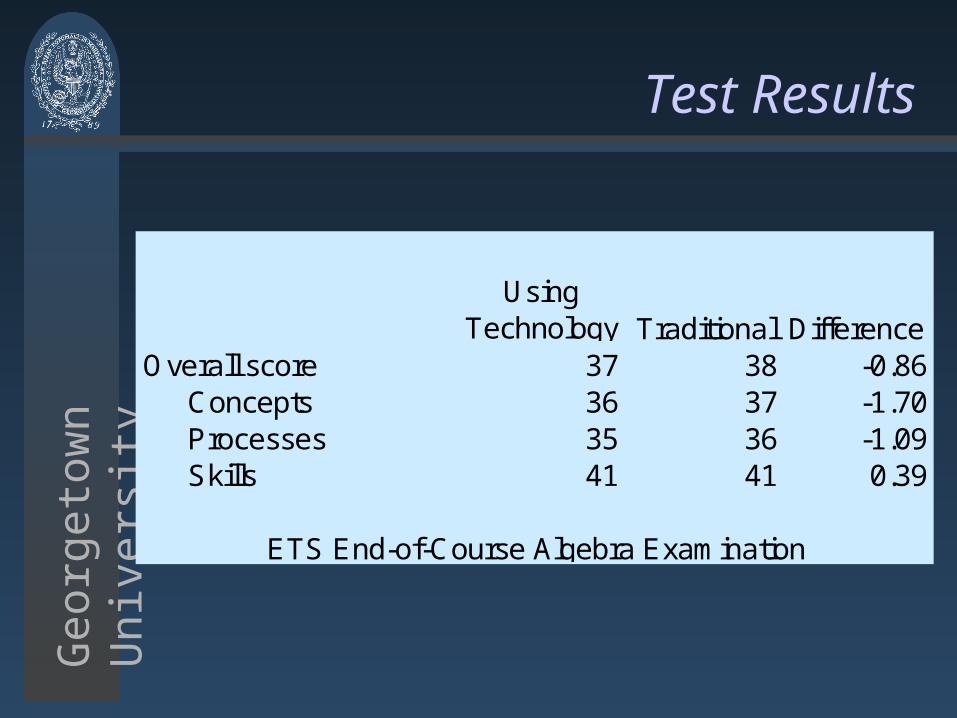
Test Results
Using Technology Traditional Difference
Overall score 37 38 -0.86Concepts 36 37 -1.70Processes 35 36 -1.09Skills 41 41 0.39
ETS End-of-Course Algebra Examination
Georg
eto
wn
U
niv
ers
ity
Cost of software
• Software provides tutorial, practice, and assessment opportunities.
• Average licensing fees about $15 per student for the school year; a range of $7 to $30.
• [Teachers reported] students used the software and average of 118 minutes per week for 23 weeks or 46 hours (of 180 hours).
Georg
eto
wn
U
niv
ers
ity
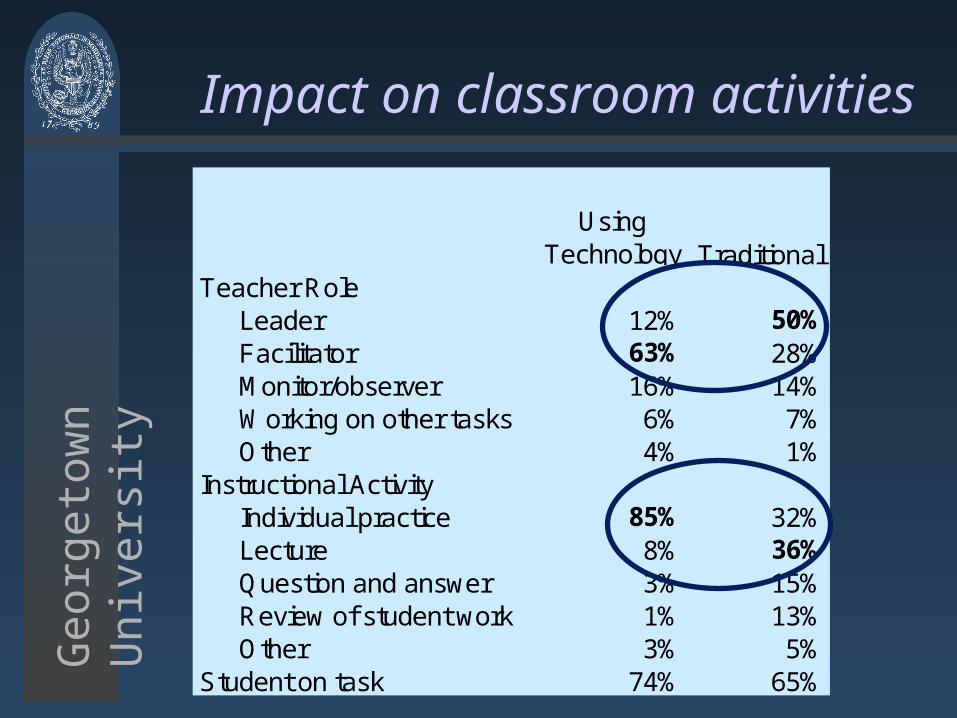
Impact on classroom activities
Using Technology Traditional
Teacher RoleLeader 12% 50%Facilitator 63% 28%Monitor/observer 16% 14%Working on other tasks 6% 7%Other 4% 1%
Instructional ActivityIndividual practice 85% 32%Lecture 8% 36%Question and answer 3% 15%Review of student work 1% 13%Other 3% 5%
Student on task 74% 65%
Georg
eto
wn
U
niv
ers
ity
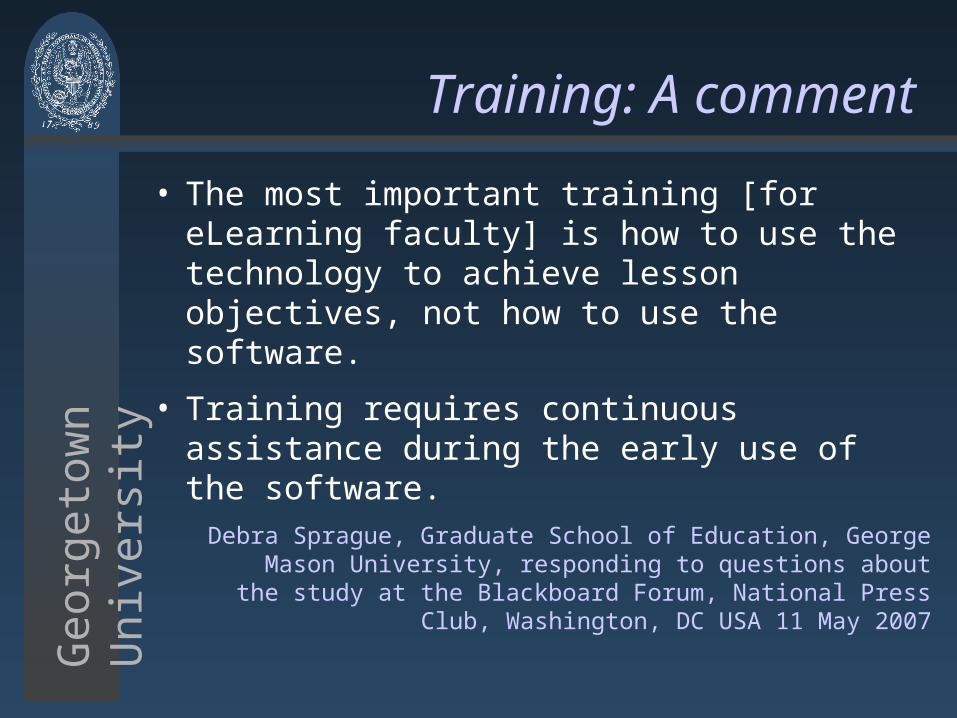
Training: A comment
• The most important training [for eLearning faculty] is how to use the technology to achieve lesson objectives, not how to use the software.
• Training requires continuous assistance during the early use of the software.Debra Sprague, Graduate School of Education, George
Mason University, responding to questions about the study at the Blackboard Forum, National Press
Club, Washington, DC USA 11 May 2007
Publishers have taken the lead on reporting
effectiveness of eLearning
Georg
eto
wn
U
niv
ers
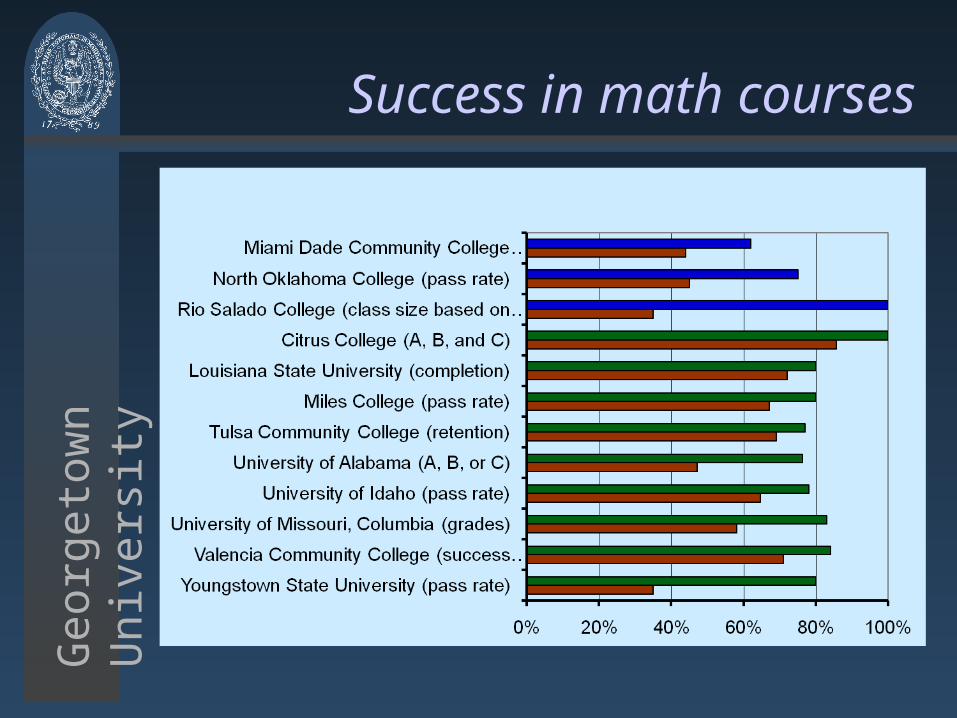
itySuccess in math courses
Georg
eto
wn
U
niv
ers
ity
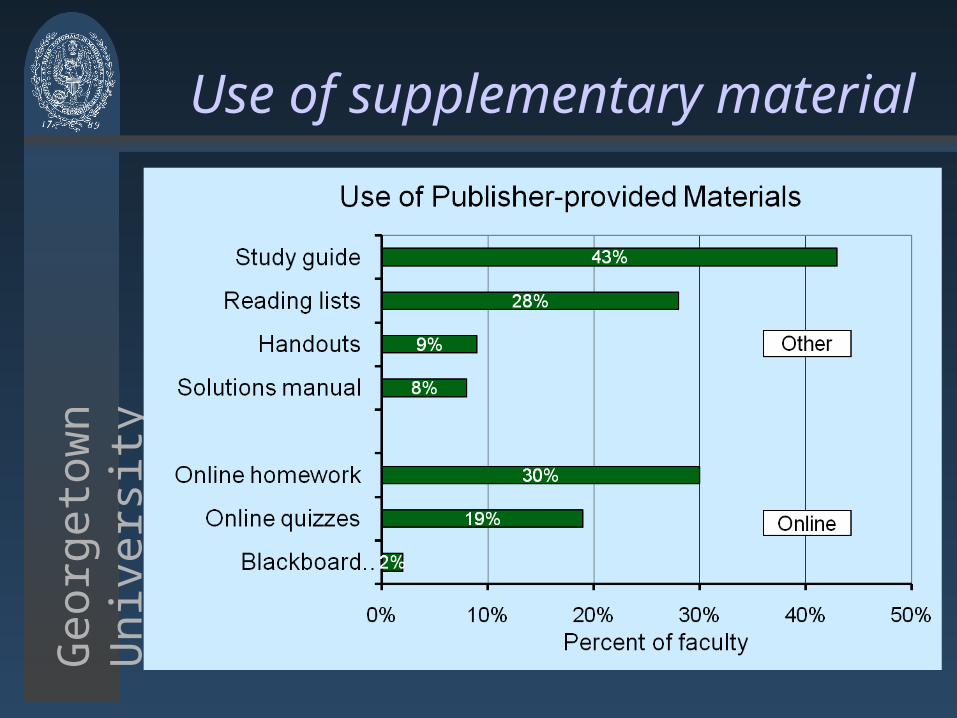
Use of supplementary material
Georg
eto
wn
U
niv
ers
ity
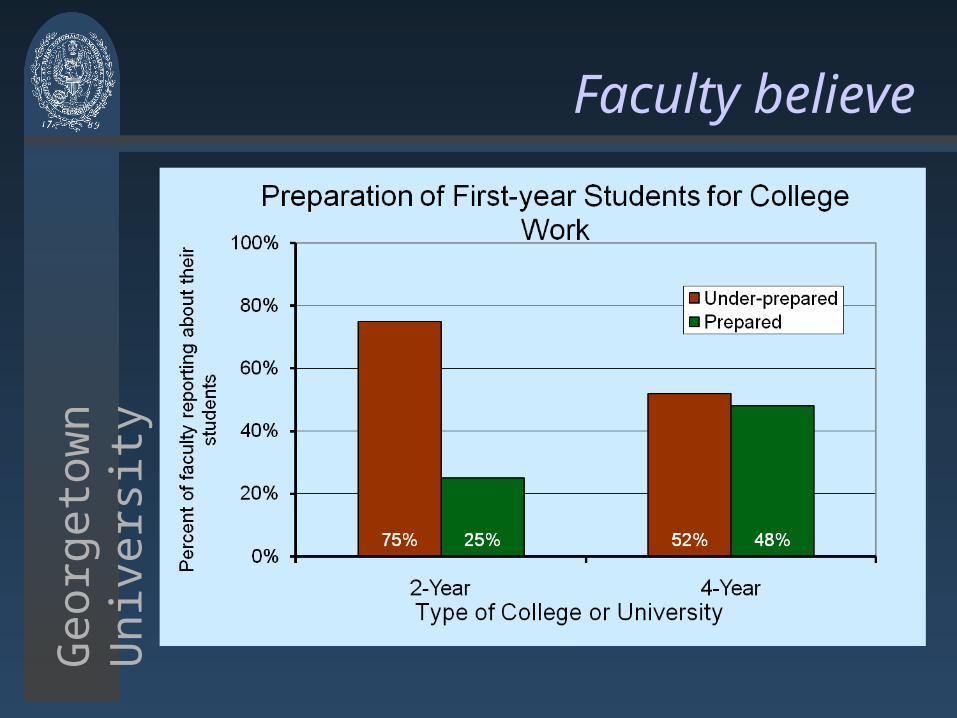
Faculty believe
Georg
eto
wn
U
niv
ers
ity
Unprepared defined
Georg
eto
wn
U
niv
ers
ity
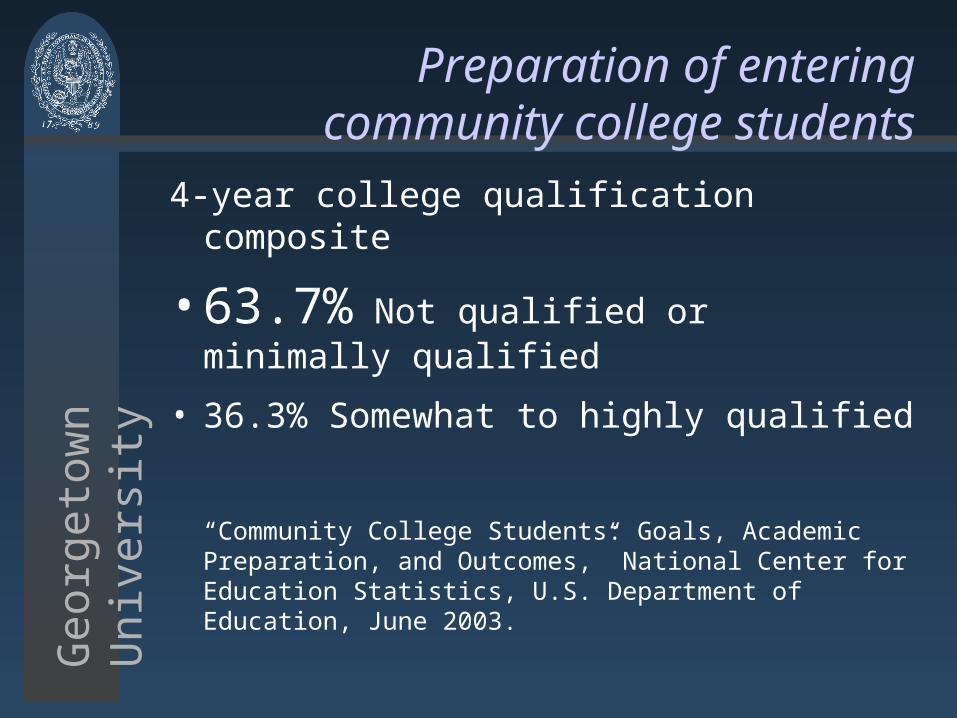
Preparation of entering community college students
4-year college qualification composite
•63.7% Not qualified or minimally qualified
• 36.3% Somewhat to highly qualified
“Community College Students: Goals, Academic Preparation, and Outcomes,” National Center for Education Statistics, U.S. Department of Education, June 2003.
Georg
eto
wn
U
niv
ers
ity
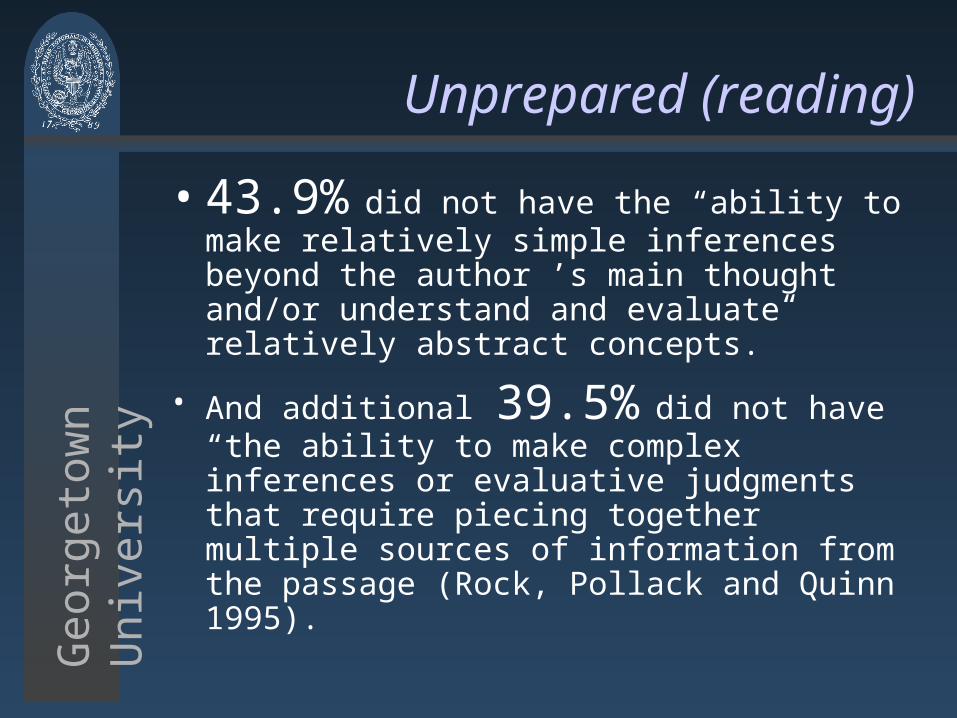
Unprepared (reading)
• 43.9% did not have the “ability to make relatively simple inferences beyond the author ’s main thought and/or understand and evaluate relatively abstract concepts.”
• And additional 39.5% did not have “the ability to make complex inferences or evaluative judgments that require piecing together multiple sources of information from the passage (Rock, Pollack and Quinn 1995).
Georg
eto
wn
U
niv
ers
ity
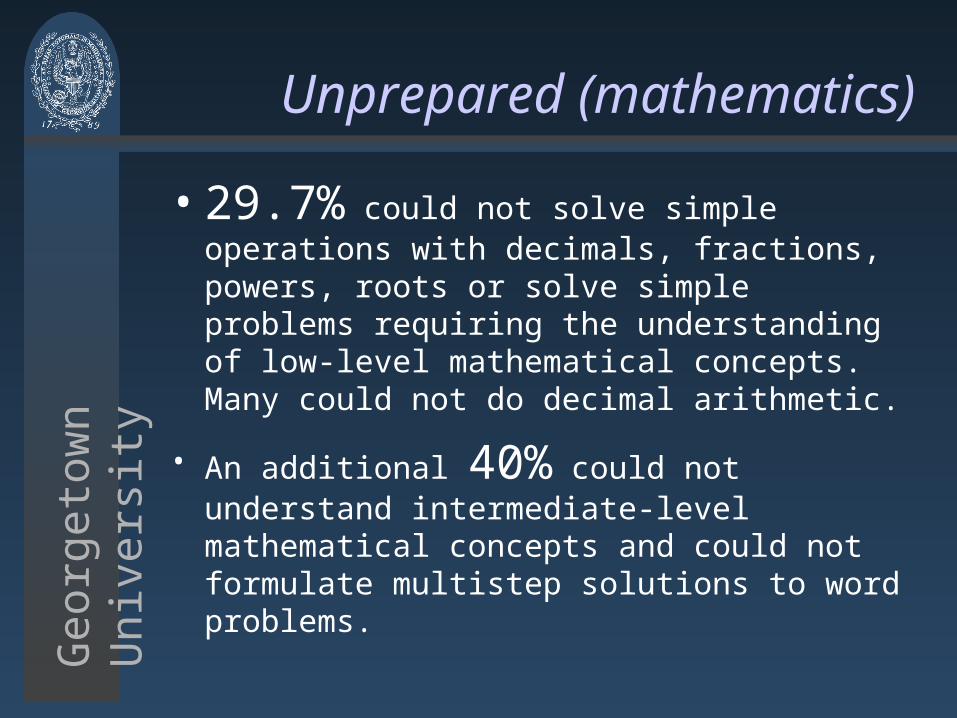
Unprepared (mathematics)
• 29.7% could not solve simple operations with decimals, fractions, powers, roots or solve simple problems requiring the understanding of low-level mathematical concepts. Many could not do decimal arithmetic.
• An additional 40% could not understand intermediate-level mathematical concepts and could not formulate multistep solutions to word problems.
The way students learn
Georg
eto
wn
U
niv
ers
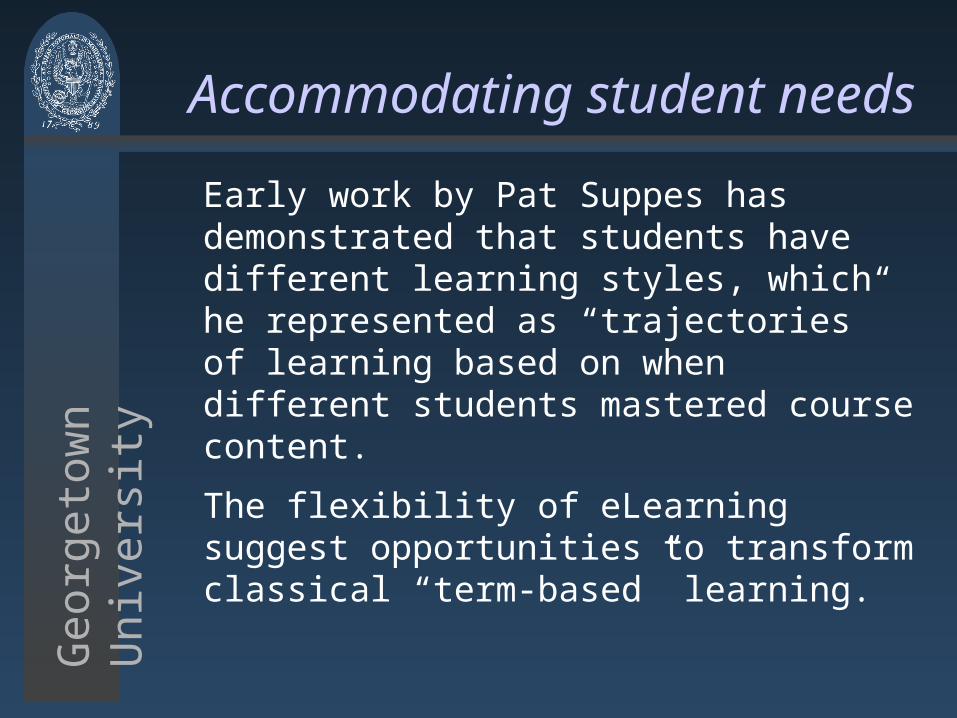
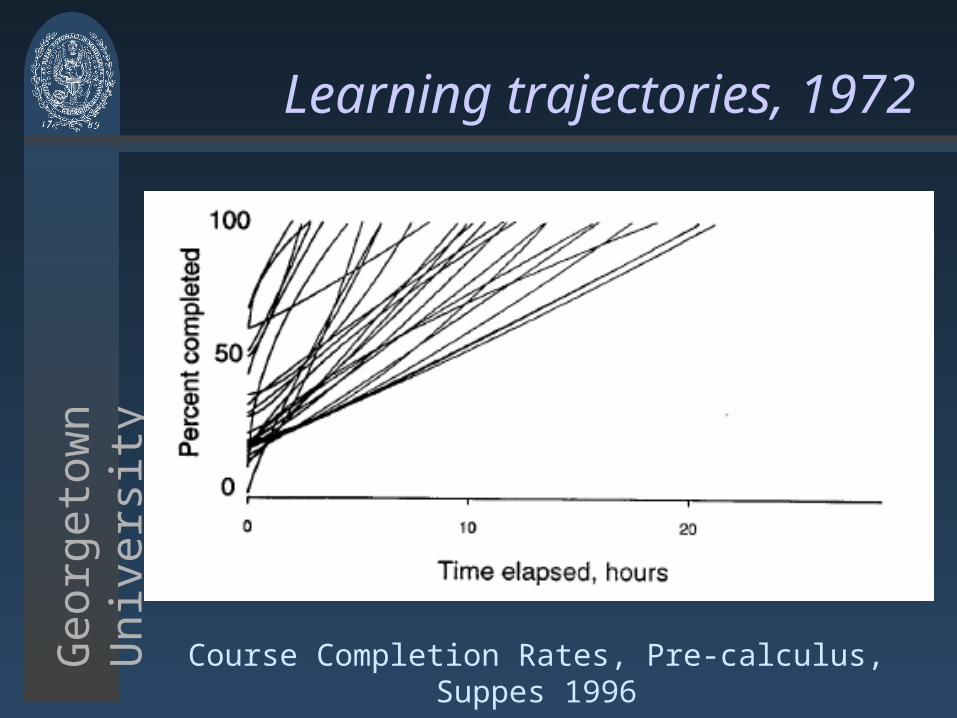
ityAccommodating student
needsEarly work by Pat Suppes has demonstrated that students have different learning styles, which he represented as “trajectories” of learning based on when different students mastered course content.
The flexibility of eLearning suggest opportunities to transform classical “term-based” learning.
Georg
eto
wn
U
niv
ers
ity
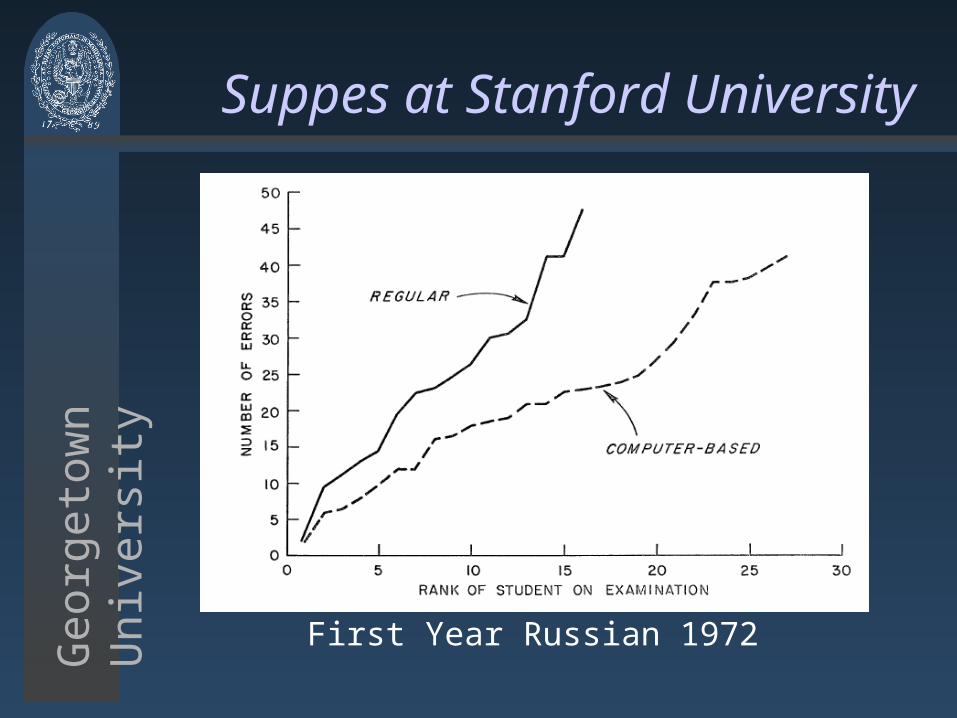
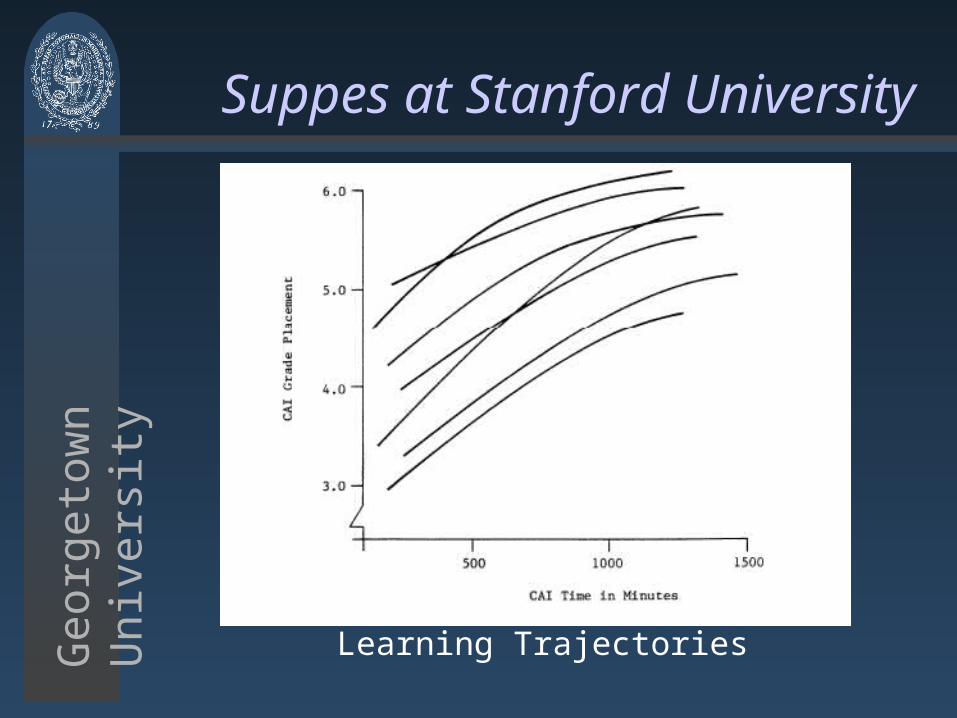
Suppes at Stanford University
First Year Russian 1972
Georg
eto
wn
U
niv
ers
ity
Learning trajectories, 1972
Course Completion Rates, Pre-calculus, Suppes 1996
Georg
eto
wn
U
niv
ers
ity
Suppes at Stanford University
Learning Trajectories
Georg
eto
wn
U
niv
ers
ity
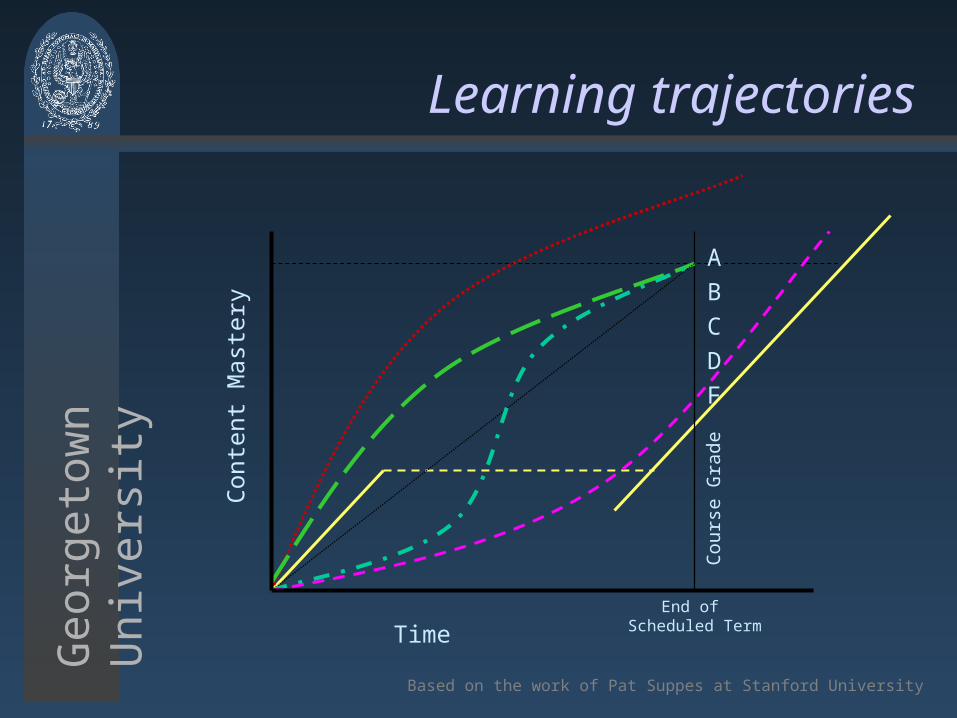
Learning trajectories
Based on the work of Pat Suppes at Stanford University
Conte
nt
Mast
ery
Cours
e G
rad
e
TimeEnd of
Scheduled Term
ABCDF
Georg
eto
wn
U
niv
ers
ity
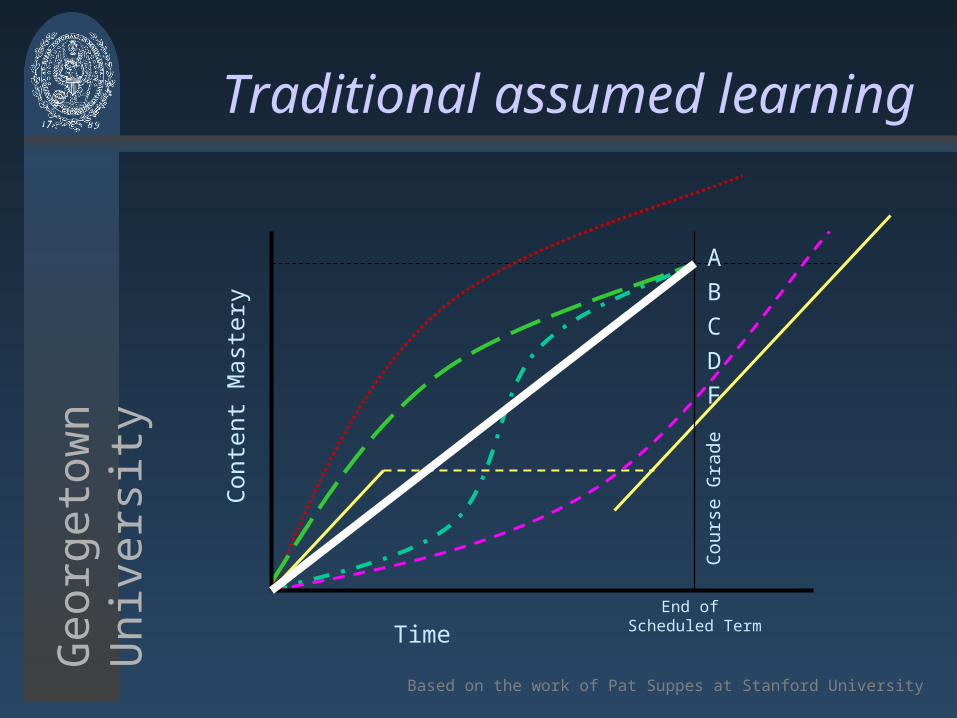
Traditional assumed learning
Based on the work of Pat Suppes at Stanford University
Conte
nt
Mast
ery
Cours
e G
rad
e
TimeEnd of
Scheduled Term
ABCDF
Georg
eto
wn
U
niv
ers
ity
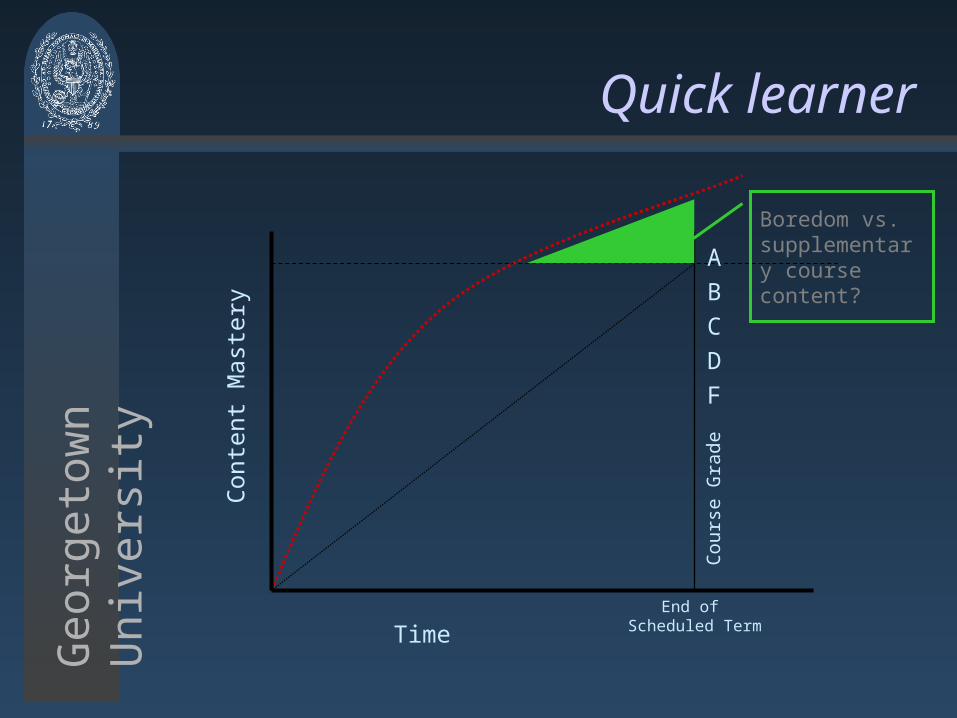
Quick learner
Conte
nt
Mast
ery
Cours
e G
rad
e
TimeEnd of
Scheduled Term
ABCDF
Boredom vs. supplementary course content?
Georg
eto
wn
U
niv
ers
ity
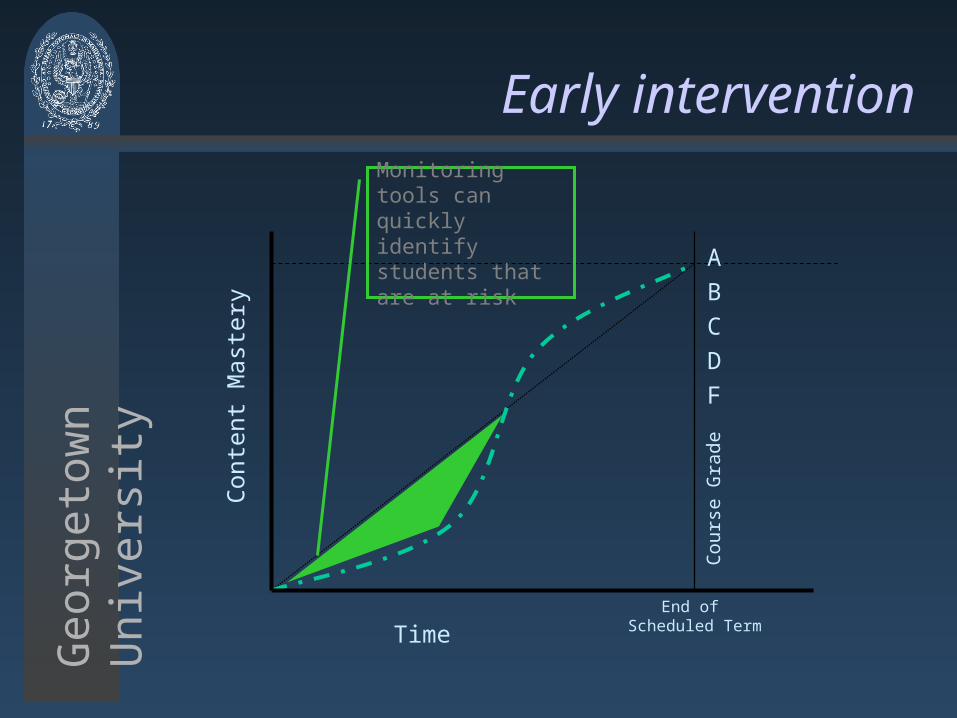
Early intervention
Conte
nt
Mast
ery
Cours
e G
rad
e
TimeEnd of
Scheduled Term
ABCDF
Monitoring tools can quickly identify students that are at risk
Georg
eto
wn
U
niv
ers
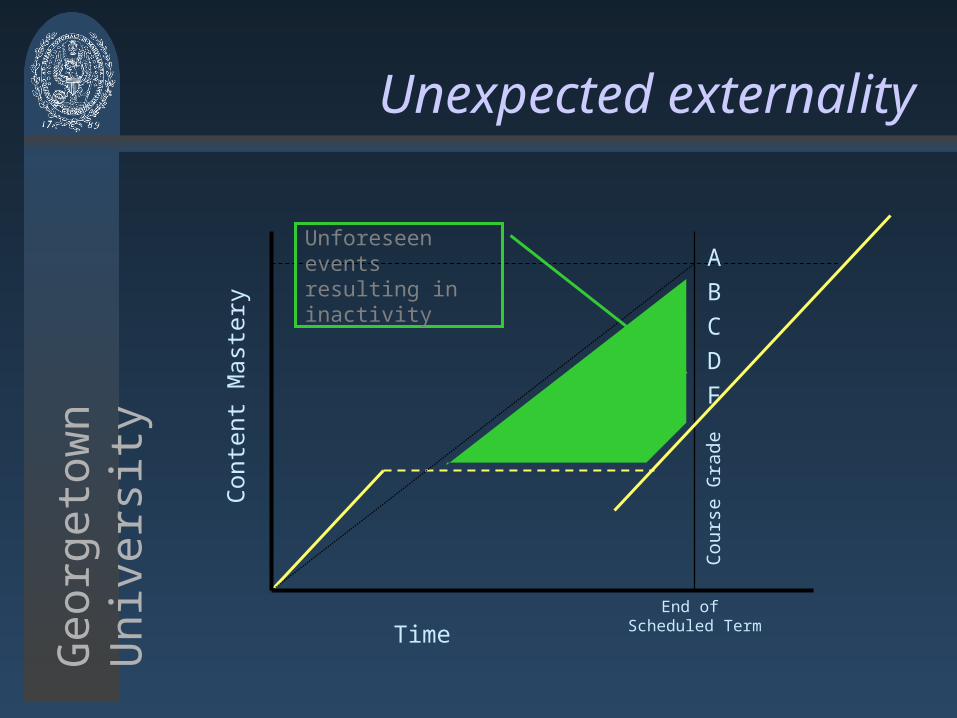
ityUnexpected externality
Conte
nt
Mast
ery
Cours
e G
rad
e
TimeEnd of
Scheduled Term
ABCDF
Unforeseen events resulting in inactivity
Georg
eto
wn
U
niv
ers
ity
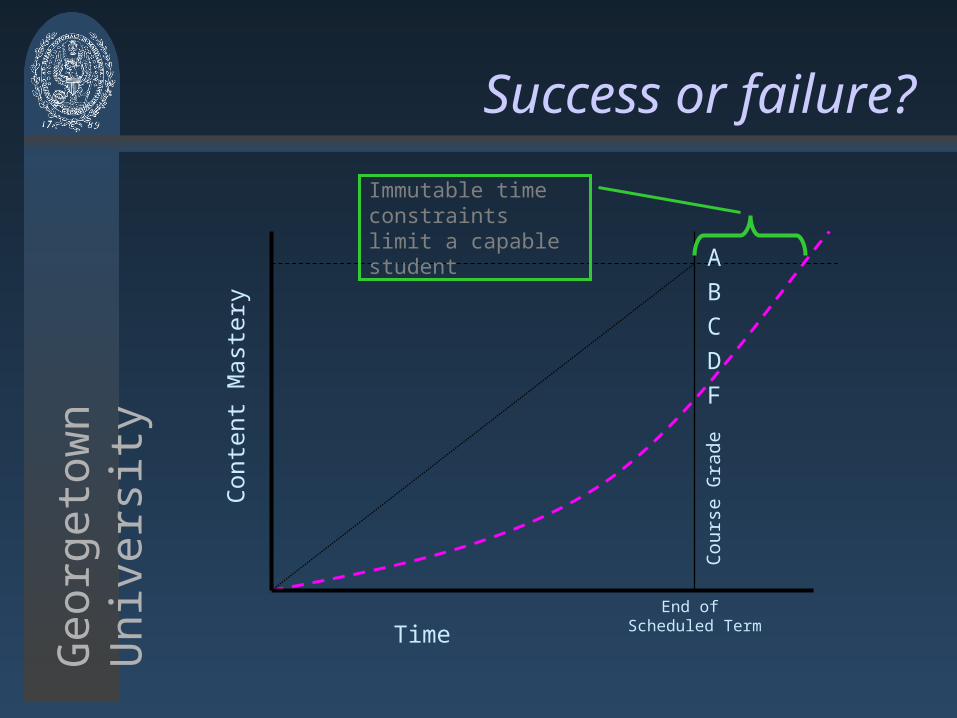
Success or failure?
Conte
nt
Mast
ery
Cours
e G
rad
e
TimeEnd of
Scheduled Term
ABCDF
Immutable time constraints limit a capable student
Georg
eto
wn
U
niv
ers
ity
Observation
Based on observations by Bryan Williams, remote-learning.net, in supporting Moodle services.
• Students will continue learning beyond the term if the eLearning resources are available.• Quick learners will go beyond the scope
of a course if materials are available.
• Those slow to learn or interruptions to their learning will succeed if given additional time.

An idea from Open University Netherlands
Georg
eto
wn
U
niv
ers
ity
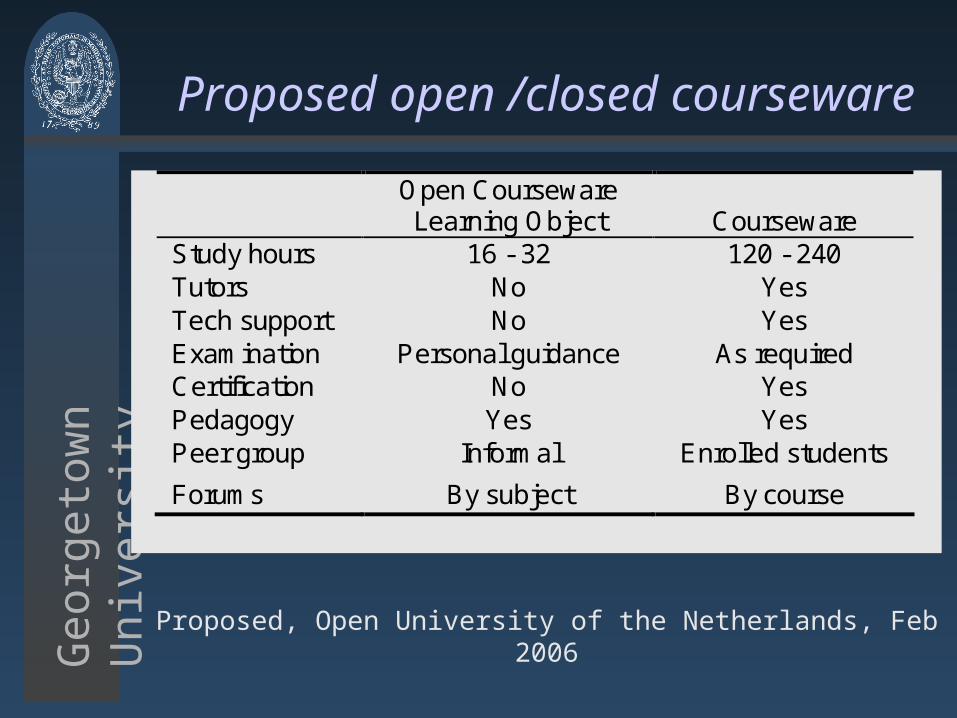
Proposed open /closed courseware
Open Courseware Learning Object
Courseware
Study hours 16 - 32 120 - 240 Tutors No Yes Tech support No Yes Examination Personal guidance As required Certification No Yes Pedagogy Yes Yes Peer group Informal Enrolled students
Forums By subject By course
Proposed, Open University of the Netherlands, Feb 2006
Georg
eto
wn
U
niv
ers
ity
Expected results
• “Learning on demand” in chunks (at no cost to the student)
• Incentive to either• Subscribe to tutorial support
• Participate as a student
• Seek “certification” by examination
paying current tuition
• Increase value of “brand” and gain course enrollments
Georg
eto
wn
U
niv
ers
ity
The barrier:Capital investment in
courseware
Georg
eto
wn
U
niv
ers
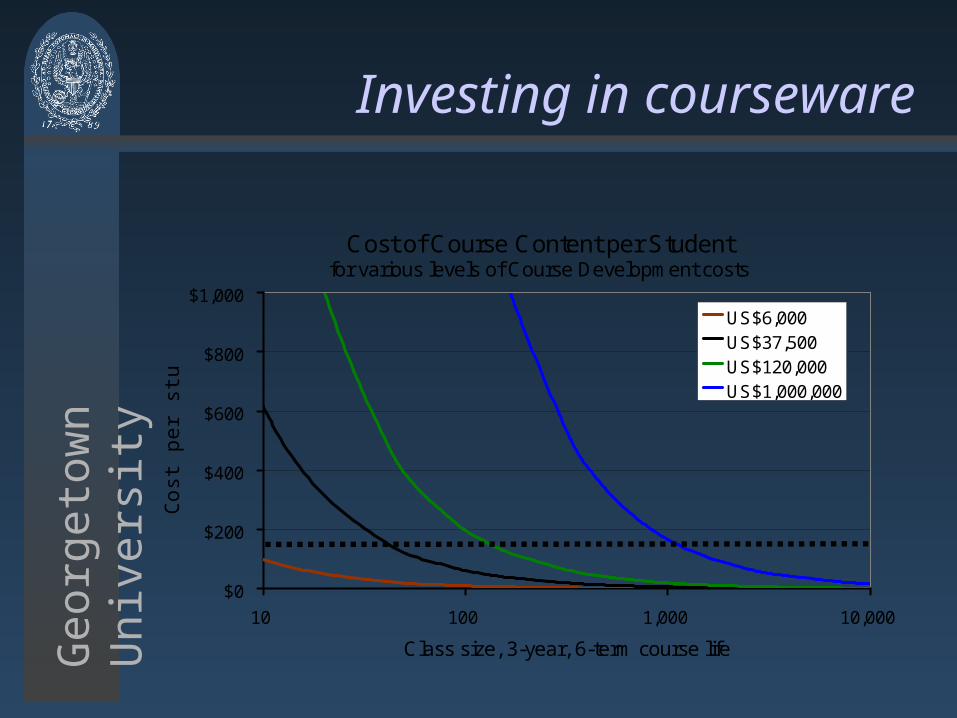
ityInvesting in courseware
Cost of Course Content per Studentfor various levels of Course Development costs
$0
$200
$400
$600
$800
$1,000
10 100 1,000 10,000
Class size, 3-year, 6-term course life
Cos
t per
stu
dent
US$6,000US$37,500US$120,000US$1,000,000
Georg
eto
wn
U
niv
ers
ity
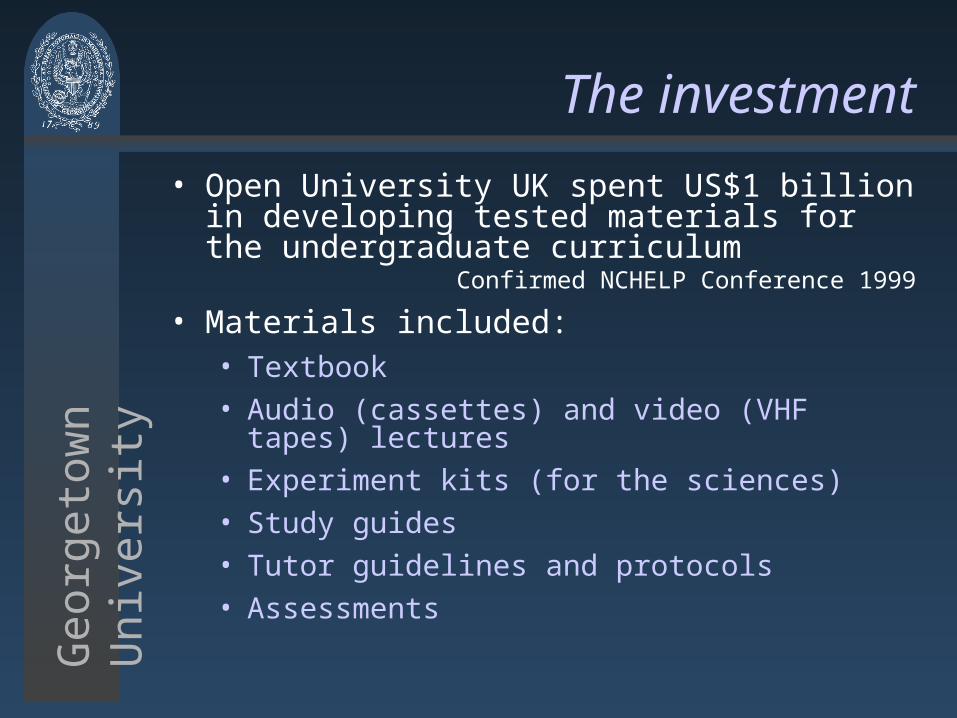
The investment
• Open University UK spent US$1 billion in developing tested materials for the undergraduate curriculum
Confirmed NCHELP Conference 1999
• Materials included:• Textbook• Audio (cassettes) and video (VHF tapes)
lectures• Experiment kits (for the sciences)• Study guides• Tutor guidelines and protocols• Assessments
Georg
eto
wn
U
niv
ers
ity
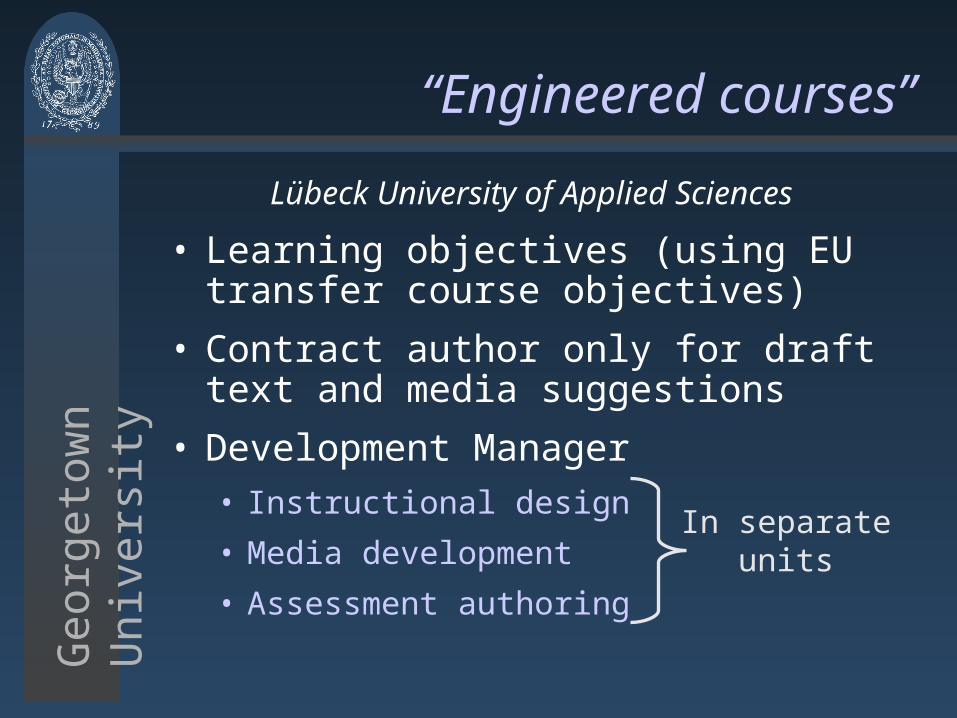
“Engineered courses”
Lübeck University of Applied Sciences
• Learning objectives (using EU transfer course objectives)
• Contract author only for draft text and media suggestions
• Development Manager• Instructional design
• Media development
• Assessment authoring
In separate units
Georg
eto
wn
U
niv
ers
ity
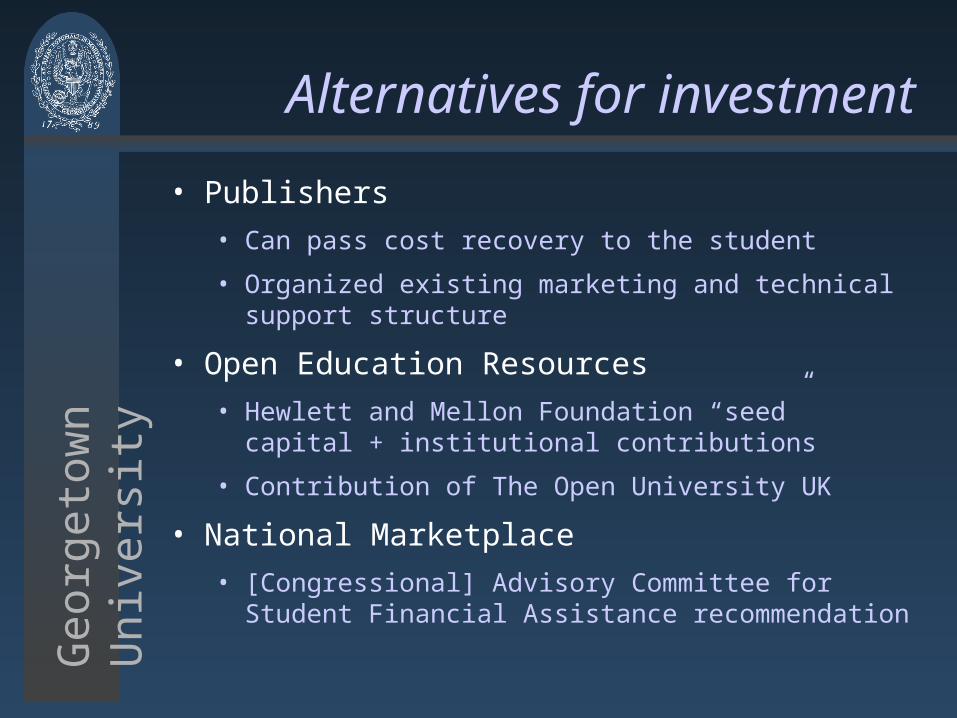
Alternatives for investment
• Publishers• Can pass cost recovery to the student
• Organized existing marketing and technical support structure
• Open Education Resources• Hewlett and Mellon Foundation “seed” capital +
institutional contributions
• Contribution of The Open University UK
• National Marketplace• [Congressional] Advisory Committee for Student
Financial Assistance recommendation
Georg
eto
wn
U
niv
ers
ityBarriers to sustainability
• Requires broad adoption by colleges and universities
• Requires adaptation for diverse student body
• Lack of education technologists
• Use of eLearning is not a priority for Schools of Education
The end
Jim Farmerjxf [at] immagic.com
jxf [at] Georgetown.edu