Embed Size (px)
Citation preview
ii
These materials are to be used only for the purpose of individual, private study and may not be reproduced in any form or medium, copied, stored in a retrieval system, lent, hired, rented, transmitted, or adapted in whole or in part without the prior written consent of Jeppesen.
Copyright in all materials bound within these covers or attached hereto, excluding that material which is used with the permission of third parties and acknowledged as such, belongs exclusively to Jeppesen. Certain copyright material is reproduced with the permission of the International Civil Aviation Organisation, the United Kingdom Civil Aviation Authority, and the Joint Aviation Authorities (JAA).
This book has been written and published to assist students enrolled in an approved JAA Air Transport Pilot Licence (ATPL) course in preparation for the JAA ATPL theoretical knowledge examinations. Nothing in the content of this book is to be interpreted as constituting instruction or advice relating to practical flying.
Whilst every effort has been made to ensure the accuracy of the information contained within this book, neither Jeppesen nor Atlantic Flight Training gives any warranty as to its accuracy or otherwise. Students preparing for the JAA ATPL theoretical knowledge examinations should not regard this book as a substitute for the JAA ATPL theoretical knowledge training syllabus published in the current edition of “JAR-FCL 1 Flight Crew Licensing (Aeroplanes)” (the Syllabus). The Syllabus constitutes the sole authoritative definition of the subject matter to be studied in a JAA ATPL theoretical knowledge training programme. No student should prepare for, or is entitled to enter himself/herself for, the JAA ATPL theoretical knowledge examinations without first being enrolled in a training school which has been granted approval by a JAA-authorised national aviation authority to deliver JAA ATPL training.
Contact Details: Sales and Service Department Jeppesen GmbH Frankfurter Strasse 233 63263 Neu-Isenburg Germany Tel: ++49 (0)6102 5070 E-mail: [email protected] For further information on products and services from Jeppesen, visit our web site at: www.jeppesen.com
© Jeppesen Sanderson Inc., 2004 All Rights Reserved
JA310108-000 ISBN 0-88487-358-7 Printed in Germany
iii
PREFACE_______________________ As the world moves toward a single standard for international pilot licensing, many nations have adopted the syllabi and regulations of the “Joint Aviation Requirements-Flight Crew Licensing" (JAR-FCL), the licensing agency of the Joint Aviation Authorities (JAA). Though training and licensing requirements of individual national aviation authorities are similar in content and scope to the JAA curriculum, individuals who wish to train for JAA licences need access to study materials which have been specifically designed to meet the requirements of the JAA licensing system. The volumes in this series aim to cover the subject matter tested in the JAA ATPL ground examinations as set forth in the ATPL training syllabus, contained in the JAA publication, “JAR-FCL 1 (Aeroplanes)”. The JAA regulations specify that all those who wish to obtain a JAA ATPL must study with a flying training organisation (FTO) which has been granted approval by a JAA-authorised national aviation authority to deliver JAA ATPL training. While the formal responsibility to prepare you for both the skill tests and the ground examinations lies with the FTO, these Jeppesen manuals will provide a comprehensive and necessary background for your formal training. Jeppesen is acknowledged as the world's leading supplier of flight information services, and provides a full range of print and electronic flight information services, including navigation data, computerised flight planning, aviation software products, aviation weather services, maintenance information, and pilot training systems and supplies. Jeppesen counts among its customer base all US airlines and the majority of international airlines worldwide. It also serves the large general and business aviation markets. These manuals enable you to draw on Jeppesen’s vast experience as an acknowledged expert in the development and publication of pilot training materials. We at Jeppesen wish you success in your flying and training, and we are confident that your study of these manuals will be of great value in preparing for the JAA ATPL ground examinations. The next three pages contain a list and content description of all the volumes in the ATPL series.

iv
ATPL Series
Meteorology (JAR Ref 050)
• The Atmosphere • Air Masses and Fronts • Wind • Pressure System • Thermodynamics • Climatology • Clouds and Fog • Flight Hazards • Precipitation • Meteorological Information
General Navigation (JAR Ref 061)
• Basics of Navigation • Dead Reckoning Navigation • Magnetism • In-Flight Navigation • Compasses • Inertial Navigation Systems • Charts
Radio Navigation (JAR Ref 062)
• Radio Aids • Basic Radar Principles • Self-contained and • Area Navigation Systems External-Referenced • Basic Radio Propagation Theory
Navigation Systems
Airframes and Systems (JAR Ref 021 01)
• Fuselage • Hydraulics • Windows • Pneumatic Systems • Wings • Air Conditioning System • Stabilising Surfaces • Pressurisation • Landing Gear • De-Ice / Anti-Ice Systems • Flight Controls • Fuel Systems
Powerplant (JAR Ref 021 03) • Piston Engine • Engine Systems • Turbine Engine • Auxiliary Power Unit (APU) • Engine Construction
Electrics (JAR Ref 021 02)
• Direct Current • Generator / Alternator • Alternating Current • Semiconductors • Batteries • Circuits • Magnetism
v
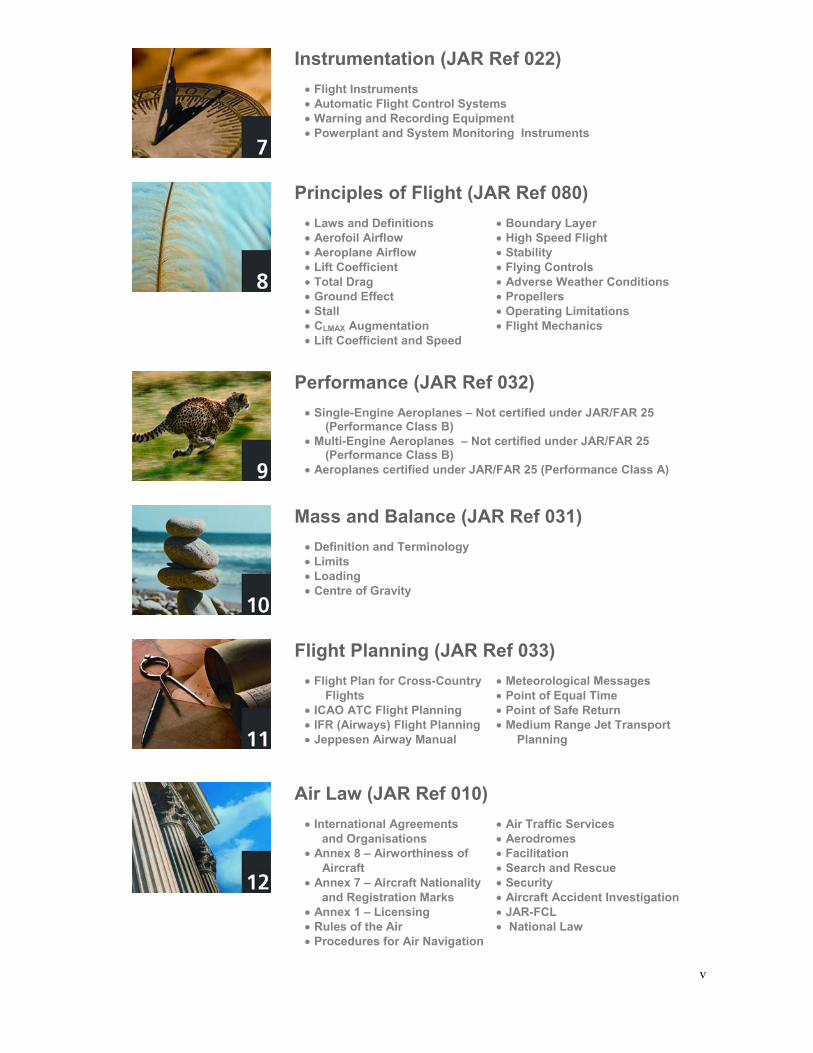
Instrumentation (JAR Ref 022)
• Flight Instruments • Automatic Flight Control Systems • Warning and Recording Equipment • Powerplant and System Monitoring Instruments
Principles of Flight (JAR Ref 080)
• Laws and Definitions • Boundary Layer • Aerofoil Airflow • High Speed Flight • Aeroplane Airflow • Stability • Lift Coefficient • Flying Controls • Total Drag • Adverse Weather Conditions • Ground Effect • Propellers • Stall • Operating Limitations • CLMAX Augmentation • Flight Mechanics • Lift Coefficient and Speed
Performance (JAR Ref 032)
• Single-Engine Aeroplanes – Not certified under JAR/FAR 25 (Performance Class B) • Multi-Engine Aeroplanes – Not certified under JAR/FAR 25 (Performance Class B) • Aeroplanes certified under JAR/FAR 25 (Performance Class A)
Mass and Balance (JAR Ref 031)
• Definition and Terminology • Limits • Loading • Centre of Gravity
Flight Planning (JAR Ref 033)
• Flight Plan for Cross-Country • Meteorological Messages Flights • Point of Equal Time • ICAO ATC Flight Planning • Point of Safe Return • IFR (Airways) Flight Planning • Medium Range Jet Transport • Jeppesen Airway Manual Planning
Air Law (JAR Ref 010)
• International Agreements • Air Traffic Services and Organisations • Aerodromes • Annex 8 – Airworthiness of • Facilitation Aircraft • Search and Rescue • Annex 7 – Aircraft Nationality • Security and Registration Marks • Aircraft Accident Investigation • Annex 1 – Licensing • JAR-FCL • Rules of the Air • National Law • Procedures for Air Navigation
vi
Human Performance and Limitations (JAR Ref 040)
• Human Factors • Aviation Physiology and Health Maintenance • Aviation Psychology
Operational Procedures (JAR Ref 070)
• Operator • Low Visibility Operations • Air Operations Certificate • Special Operational Procedures • Flight Operations and Hazards • Aerodrome Operating Minima • Transoceanic and Polar Flight
Communications (JAR Ref 090)
• Definitions • Distress and Urgency • General Operation Procedures Procedures • Relevant Weather Information • Aerodrome Control • Communication Failure • Approach Control • VHF Propagation • Area Control • Allocation of Frequencies
Table of Contents
Principles Of Flight vii
CHAPTER 1
Laws and Definitions
Introduction ...................................................................................................................................................1-1 SI Units .........................................................................................................................................................1-1 Derived Units ................................................................................................................................................1-1 Airspeeds......................................................................................................................................................1-5 Newton’s Laws of Motion ..............................................................................................................................1-5
CHAPTER 2
The Flight Environment
Introduction ...................................................................................................................................................2-1 The Atmosphere ...........................................................................................................................................2-1 The Universal Gas Law.................................................................................................................................2-1 The Effect of Pressure on Density ................................................................................................................2-1 The Effect of Temperature on Density ..........................................................................................................2-2 The Effect of Altitude on Density...................................................................................................................2-2 The Effect of Humidity on Density.................................................................................................................2-2 The International Standard Atmosphere .......................................................................................................2-2
CHAPTER 3
Aircraft Components and Terminology
Wing Position Terminology ...........................................................................................................................3-1 Wing Planform Terminology..........................................................................................................................3-2 Wing Section Terminology ............................................................................................................................3-6 Aerofoil Cross-sectional Shapes ...................................................................................................................3-7
CHAPTER 4
Lift
Introduction ...................................................................................................................................................4-1 Airflow ...........................................................................................................................................................4-1 Equation of Continuity...................................................................................................................................4-3 Bernoulli's Theorem ......................................................................................................................................4-4 Angle of Attack..............................................................................................................................................4-6 Two-Dimensional Airflow about an Aerofoil...................................................................................................4-8 Effect of Angle of Attack on the Airflow about an Aerofoil Section ................................................................4-9 Chordwise Pressure Distributions about an Aerofoil Section ......................................................................4-11 The Centre of Pressure...............................................................................................................................4-14 Aerodynamic Centre ...................................................................................................................................4-16 Lift Formula .................................................................................................................................................4-17 Variation of Coefficient of Lift with Angle of Attack......................................................................................4-17 Three-Dimensional Airflow About an Aerofoil..............................................................................................4-18 Wing Shape and its Effect on Lift ................................................................................................................4-21
Table of Contents
viii Principles Of Flight
CHAPTER 5
Drag
Introduction .................................................................................................................................................. 5-1 Form Drag.................................................................................................................................................... 5-2 Boundary Layer............................................................................................................................................ 5-4 Skin Friction Drag......................................................................................................................................... 5-7 Factors Affecting Skin Friction Drag............................................................................................................. 5-7 Interference Drag ......................................................................................................................................... 5-8 Induced Drag ............................................................................................................................................... 5-9 Factors Affecting Induced Drag.................................................................................................................. 5-10 Methods to Reduce Induced Drag.............................................................................................................. 5-14 Drag Formula ............................................................................................................................................. 5-15 Drag Curves............................................................................................................................................... 5-16 Lift/Drag Ratio ............................................................................................................................................ 5-18
CHAPTER 6
Flying Controls
Introduction .................................................................................................................................................. 6-1 Elevators ...................................................................................................................................................... 6-2 The Stabilator............................................................................................................................................... 6-2 The Rudder .................................................................................................................................................. 6-3 Ailerons ........................................................................................................................................................ 6-4 Adverse Aileron Yaw.................................................................................................................................... 6-5 Combined Primary Control Surfaces............................................................................................................ 6-6 Aerodynamic Balance .................................................................................................................................. 6-9 Tabs ........................................................................................................................................................... 6-12 Mass Balance............................................................................................................................................. 6-14 Powered Flying Controls ............................................................................................................................ 6-14 Powered Flying Control System................................................................................................................. 6-16 Layout and Requirements .......................................................................................................................... 6-16 Control Input Systems................................................................................................................................ 6-16 The Power Control Unit (PCU)................................................................................................................... 6-17 Artificial Feel Systems................................................................................................................................ 6-19 Trimming Control Systems......................................................................................................................... 6-22 Principle of a Trim Tab ............................................................................................................................... 6-22 Trimming of Powered Flying Controls ........................................................................................................ 6-25 Spoilers ...................................................................................................................................................... 6-30
CHAPTER 7
Lift Augmentation
Basic Lift Augmentation System................................................................................................................... 7-1 Trailing Edge Flaps ...................................................................................................................................... 7-2 Types of Trailing Edge Flaps ....................................................................................................................... 7-3 Comparison of Different Types of Trailing Edge Flap................................................................................... 7-5 The Effect of Trailing Edge Flaps on the Stalling Angle ............................................................................... 7-6 The Effect of Trailing Edge Flaps on the Stall Speed................................................................................... 7-6 Operation of Trailing Edge Flaps.................................................................................................................. 7-7 Use of Trailing Edge Flaps for Take-off........................................................................................................ 7-8 The Effects of Raising the Flaps in Flight..................................................................................................... 7-9 The Use of Trailing Edge Flaps During the Approach and Landing ............................................................. 7-9 High Lift Devices on Transport Category Aircraft ....................................................................................... 7-10 Leading Edge High Lift Devices ................................................................................................................. 7-11 The Effect of Leading Edge Flaps on the Stalling Angle ............................................................................ 7-16 The Operation of High Lift Devices on Transport Category Aircraft ........................................................... 7-17 Protection of High Lift Devices on Transport Category Aircraft .................................................................. 7-19
Table of Contents
Principles Of Flight ix
CHAPTER 8
Stalling
Introduction ...................................................................................................................................................8-1 Separated Airflow..........................................................................................................................................8-1 The Stalling Angle of Attack ..........................................................................................................................8-4 Definition of the JAR/FAR Stalling Speed (VS) .............................................................................................8-5 The Relationship between Stalling Speed and Lift........................................................................................8-5 Recognition of the Stall at Low Airspeeds.....................................................................................................8-8 Stall Warning in Light Aircraft........................................................................................................................8-8 Recovery from a Normal Stall .......................................................................................................................8-9 The Effect of Wing Section on the Stall.........................................................................................................8-9 The Effect of Wing Planform on the Stall ....................................................................................................8-10 The Cause of Pitch-up on Sweptback Wings at the Stall ............................................................................8-13 Devices to Alleviate Wing Tip Stalling.........................................................................................................8-14 Stall Sensing in Transport Category Aircraft ...............................................................................................8-16 The Stall Warning System on Transport Category Aircraft..........................................................................8-17 The Stall Prevention System on Transport Category Aircraft......................................................................8-17 Super Stall (Deep Stall) ..............................................................................................................................8-18 Accelerated or ‘G’-Stall ...............................................................................................................................8-19 Spinning......................................................................................................................................................8-19 Recovery from a Spin .................................................................................................................................8-24
CHAPTER 9
Forces Acting On An Aeroplane
Forces in Steady Level Flight........................................................................................................................9-1 Lift/Weight and Thrust/Drag Couples ............................................................................................................9-2 The Contribution of the Tailplane ..................................................................................................................9-5 Straight Steady Climb ...................................................................................................................................9-6 Forces in a Straight Steady Climb.................................................................................................................9-7 Straight Steady Descent (Dive).....................................................................................................................9-8 Steady Straight Glide ....................................................................................................................................9-9 Forces in a Steady Straight Glide ...............................................................................................................9-10 The Effect of the Lift/Drag Ratio on Glide Performance ..............................................................................9-11 The Effect of a Steady Wind on Glide Performance....................................................................................9-12 The Effect of Weight on Glide Performance................................................................................................9-13 Steady Co-ordinated Turn...........................................................................................................................9-13 Forces Acting on an Aircraft During a Steady Co-ordinated Turn ...............................................................9-14 Calculation of the Centripetal Force............................................................................................................9-14 Turning an Aircraft ......................................................................................................................................9-14 Factors Affecting an Aircraft's Radius of Turn.............................................................................................9-16 Balancing the Turn......................................................................................................................................9-19 Rate of Turn ................................................................................................................................................9-21 Load Factor.................................................................................................................................................9-21 The Effect of Turning on Stalling Speed .....................................................................................................9-22 Aircraft Response During a Level Banked Turn ..........................................................................................9-24 Aircraft Response During Climbing and Descending Turns ........................................................................9-25
Table of Contents
x Principles Of Flight
CHAPTER 10
Stability
Introduction to Stability............................................................................................................................... 10-1 Controllability.............................................................................................................................................. 10-1 Static Stability............................................................................................................................................. 10-2 The Degree of Stability............................................................................................................................... 10-2 Dynamic Stability........................................................................................................................................ 10-3 Static Longitudinal Stability ........................................................................................................................ 10-3 Mathematical Representation of Static Longitudinal Stability..................................................................... 10-4 Factors Affecting Static Longitudinal Stability ............................................................................................ 10-6 Graphical Representation of Static Longitudinal Stability........................................................................... 10-9 The Effect of Elevator Deflection on Pitching Moments ........................................................................... 10-11 Control Force Stability.............................................................................................................................. 10-12 Manoeuvring Stability............................................................................................................................... 10-14 Tailoring The Control Forces.................................................................................................................... 10-15 Dynamic Longitudinal Stability ................................................................................................................. 10-16 Pilot Induced Oscillations ......................................................................................................................... 10-17 Directional Static Stability......................................................................................................................... 10-17 Graphical Representation of Static Directional Stability ........................................................................... 10-18 The Factors Affecting Static Directional Stability...................................................................................... 10-18 Lateral Static Stability............................................................................................................................... 10-21 Graphical Representation of Static Lateral Stability ................................................................................. 10-25 Factors Affecting Static Lateral Stability................................................................................................... 10-26 Interaction Between Lateral and Directional Static Stability ..................................................................... 10-26 Dutch Roll ................................................................................................................................................ 10-27 Yaw Damper Systems.............................................................................................................................. 10-28 Speed Stability ......................................................................................................................................... 10-30
CHAPTER 11
Ground Effect
Introduction ................................................................................................................................................ 11-1 The Characteristics of Ground Effect ......................................................................................................... 11-1 The Influence of Ground Effect on Landing................................................................................................ 11-4 The Influence of Ground Effect on Take-Off .............................................................................................. 11-4 The Influence of Ground Effect on Trailing Edge Flaps.............................................................................. 11-4
CHAPTER 12
Propellers
Introduction ................................................................................................................................................ 12-1 Propeller Terminology ................................................................................................................................ 12-1 Factors Affecting the Blade Angle of Attack ............................................................................................... 12-3 Factors Affecting the Blade Thrust Distribution .......................................................................................... 12-6 Forces Acting on a Blade Section .............................................................................................................. 12-6 Centrifugal Turning Moment (CTM)............................................................................................................ 12-7 Aerodynamic Turning Moment (ATM) ........................................................................................................ 12-8 Centrifugal Forces...................................................................................................................................... 12-8 Thrust Bending Forces............................................................................................................................... 12-9 Torque Bending Forces.............................................................................................................................. 12-9 Propeller Efficiency .................................................................................................................................... 12-9 Forces Acting on a Windmilling Blade Section......................................................................................... 12-11 Propeller Pitch.......................................................................................................................................... 12-12 Disadvantages of Fixed Pitch Propellers.................................................................................................. 12-14 The Variable and Constant Speed Propeller............................................................................................ 12-15 Power Absorption..................................................................................................................................... 12-16 Propeller Solidity ...................................................................................................................................... 12-16 Propeller Effects on Take-off.................................................................................................................... 12-16 Propeller Icing .......................................................................................................................................... 12-20
Table of Contents
Principles Of Flight xi
CHAPTER 13
Asymmetric Flight
Introduction .................................................................................................................................................13-1 Single Engine Performance ........................................................................................................................13-1 Yawing Moments ........................................................................................................................................13-3 Asymmetric Blade Effect .............................................................................................................................13-6 The Effect of Bank ......................................................................................................................................13-9 The Effect of Weight .................................................................................................................................13-10 Rolling Moments .......................................................................................................................................13-10 Minimum Airspeeds During Asymmetric Flight..........................................................................................13-11 Turning Flight ............................................................................................................................................13-12 Recognition of a Failed Engine .................................................................................................................13-12
CHAPTER 14
High Speed Flight
Introduction .................................................................................................................................................14-1 The Speed of Sound ...................................................................................................................................14-1 Pressure Waves from a Moving Source......................................................................................................14-2 Nature of Compressibility ............................................................................................................................14-4 Mach Number .............................................................................................................................................14-4 Flight Speed Classifications ........................................................................................................................14-5 Comparison of Subsonic and Supersonic Flow Patterns ............................................................................14-6 The Development of Shock Waves.............................................................................................................14-7 Shock Stall ................................................................................................................................................14-10 The Effect of Altitude on the Shock Stall ...................................................................................................14-13 Buffet Onset Boundary Chart ....................................................................................................................14-14 Methods of Reducing or Delaying the Transonic Drag Rise......................................................................14-16 Transonic Area Rule .................................................................................................................................14-17 Supercritical Wings ...................................................................................................................................14-18 Control Problems in Transonic Flight ........................................................................................................14-18 Vortex Generators.....................................................................................................................................14-20 The Effect of Transonic Flight on Aircraft Trim and Stability .....................................................................14-21 Mach Trim.................................................................................................................................................14-22 Supersonic Flight ......................................................................................................................................14-22 Oblique Shock Wave ................................................................................................................................14-23 Mach Cone................................................................................................................................................14-23 Expansion Wave .......................................................................................................................................14-24 Summary of Supersonic Wave Characteristics .........................................................................................14-24
Table of Contents
xii Principles Of Flight
CHAPTER 15
Flight in Adverse Weather Conditions
Introduction ................................................................................................................................................ 15-1 Ice and Frost .............................................................................................................................................. 15-1 The Effect of Ice, Frost, and Snow on the Aircraft’s Performance.............................................................. 15-1 The Effects of Contamination on Maximum Wing Lift Capability ................................................................ 15-2 The Effects of Contamination on Flaps and Slats ...................................................................................... 15-4 The Effect of Contamination on Take-off Performance .............................................................................. 15-6 The Effect of Contamination on Aircraft Landing Performance .................................................................. 15-8 Tail Icing................................................................................................................................................... 15-10 Windshear................................................................................................................................................ 15-11 Vertical Gusts........................................................................................................................................... 15-11 Horizontal Gusts....................................................................................................................................... 15-12 Downdraughts and Updraughts................................................................................................................ 15-13 Indications of a Windshear Encounter...................................................................................................... 15-13 General Recovery from a Windshear Encounter...................................................................................... 15-14 Recovery from a Windshear Encounter During the Take-off, Approach, and Landing............................. 15-14 Microbursts .............................................................................................................................................. 15-15 The Effect of a Microburst Encounter During the Approach ..................................................................... 15-15 The Effect of a Microburst on Take-off ..................................................................................................... 15-16 Airborne Windshear Detection Systems................................................................................................... 15-17 The Effect of Heavy Rain on Aircraft Performance................................................................................... 15-17
CHAPTER 16
Operating Limitations
Introduction ................................................................................................................................................ 16-1 The Flight Operating Envelope................................................................................................................... 16-2 Manoeuvre and Gust Loads....................................................................................................................... 16-4 Aeroelastic Distortion (Aileron Reversal).................................................................................................... 16-5 Emergency Descents ................................................................................................................................. 16-7
Principles Of Flight 1-1
INTRODUCTION Before studying aerodynamics, it is essential to have a thorough grounding in basic mechanics and any related units of measurement. In aeronautics all measurements world-wide are based on the International System (SI) of units, but in practice some anomalies exist. For example, altitude is quoted in terms of feet (ft), and airspeed is quoted in nautical miles per hour (kt).
SI UNITS The fundamental SI units are those of: Mass
Length Time
The amount of matter in a body; measured in kilograms (kg). The distance between two points; measured in metres (m). The duration of an event; measured in seconds (s).
From these, other standard units are derived.
DERIVED UNITS The following quantities and their related units of measurement are extensively used in aerodynamics: Area
Volume Velocity Acceleration Momentum
A measure of a surface; measured in square metres (m2) A measure of the bulk or space occupied by a body; measured in cubic metres (m3). A measure of motion in a specified direction; measured in metres per second (m/s) A measure of the change of velocity of a body; measured in metres per second per second (m/s2) The product of the mass and the velocity of a body; measured in kilogram metres per second (kgm/s)
Chapter 1 Laws and Definitions
Principles Of Flight 1-2
Force Weight Work Power Energy
An external influence capable of altering the state of rest or motion of a body, proportional to the rate of change of momentum of a body
Force = Mass x Acceleration The unit of force is the Newton (N). One Newton is the force required to give a mass of one kilogram an acceleration of one metre per second per second. The gravitational force of attraction that the Earth exerts on a body of given mass; measured in kilograms (kg)
Weight = Mass x Acceleration due to Gravity Unlike the mass of a body, which remains constant irrespective of its location, the weight of a body varies with distance between the body and the centre of the Earth. This is because acceleration due to gravity varies with geographical location and altitude, but under standard conditions, this term is assumed to be 9.81 m/s2. The effort needed when a force is applied to a body causing it to be lifted or moved a given distance in the same direction as the force.
Work = Force x Distance The unit of work is the Joule (J). One Joule is the work done when a force of one Newton moves a body through a distance of one metre in the direction of the force. Work is also stated in terms of Newton metres (Nm), where1 Joule = 1 Nm. The rate of doing work; measured in units of work per unit time;measured in Watts (W), where 1 watt = 1 J/s or 1 Nm/s.
Power = Force x Velocity The capacity for doing work. In mechanics, energy exists in two basic forms: Potential energy - due to position. Kinetic energy - due to motion. The unit of energy is the Joule (J), where 1 Joule = 1 Nm.
Laws and Definitions Chapter 1
Principles Of Flight 1-3
Pressure
The force per unit area acting on a surface; This is measured in Newtons per square metre (N/m2) and is called the Pascal (Pa). In aviation, the bar is more commonly used to measure pressure. 1 bar = 105 Pa, or 1 mb = 1 hPa. In aerodynamics three types of pressure exist: Static Pressure (PS) When air is stationary it exerts pressure equally in all directions. For example, a mass of stationary air in a container exerts a certain amount of static pressure on the surrounding walls (Fig. 1.1).
STATICPRESSURE
FIG. 1.1
Dynamic Pressure (PD) This occurs when moving air is brought to rest on the surface of a body (i.e. when relative movement exists between the surface and the airflow) (Fig.1.2).
DYNAMIC
PRESSURE(q)
FIG. 1.2
Dynamic Pressure is expressed as:
Q = ½RhoV2 Rho (ρ) is the air density, which decreases with altitude, and V is the speed of the body relative to the airflow.
Chapter 1 Laws and Definitions
Principles Of Flight 1-4
Total Pressure (PT) The sum of both the static and dynamic pressures; This is a very important term in aerodynamic formulae, as it is used in the calculation of lift, drag, and indicated airspeeds. (These terms are explained later.)
Total Pressure = Static Pressure + Dynamic Pressure In aerodynamics, this is also referred to as Pitot Pressure.
Density The mass of material per unit volume; measured in kilograms per cubic metre (kg/m3). The density of air is an important property in the study of aerodynamics and varies with changes in pressure, temperature, and humidity. Such changes have a significant effect on aircraft performance.
Temperature (T)
A measure of the heat of a body; expressed in Degrees Celsius (°C). The unit of thermodynamic temperature is the Kelvin (K), which is the unit normally used in scientific calculations. To convert from Celsius to Kelvin, add 273 to the temperature in °C, e.g.:
15°C = 15+273 = 288K
Viscosity Wing Loading
A measure of the resistance to motion. In aerodynamics,viscosity refers to the resistance to movement of one layer of air over another. In the case of fluids, it relates to how liquidsflow over a surface. For example, cold engine oil has high viscosity and hot engine oil has low viscosity. The total aircraft weight supported per unit area of the wing;measured in Newtons per square metre (N/m2).
Wing Loading = AUW/wing area
Laws and Definitions Chapter 1
Principles Of Flight 1-5
AIRSPEEDS Indicated
Airspeed (IAS) Calibrated Airspeed (CAS) Equivalent Airspeed (EAS) True Airspeed (TAS) Mach No.
The indicated airspeed of an aircraft as shown on its pitot-static airspeed indicator (ASI). This provides vital airspeed information, e.g. stalling and structural limitation airspeeds, to the flight-crew. It is calibrated to reflect standard atmospheric adiabatic compressible flow at sea level and is uncorrected for airspeed system errors. The indicated airspeed of an aircraft corrected for position and instrument errors. CAS is equal to True Airspeed (TAS) in standard atmosphere at sea level only. The calibrated airspeed of an aircraft corrected for compressibility error at a particular altitude. EAS is equal to CAS at airspeeds less than 300 kt and is equal to TAS in standard atmosphere at sea level only. The actual speed of an aircraft through the air relative to the air that is uninfluenced by the aircraft. TAS is important for navigation purposes only. The relationship between EAS and TAS is as follows:
TAS = EAS ( ρo / ρ )1/2 where ρo = density at sea level ρ = density at altitude The ratio of the TAS of an aircraft to the speed of sound in the surrounding atmosphere (i.e. the local speed of sound (LSS).
Mach No = TAS/LSS
NEWTON’S LAWS OF MOTION Newton’s 1st Law.
Newton’s 2nd Law. Newton’s 3rd Law.
States that a body will continue in a state of rest, or in uniform motion in a straight line, unless acted on by an external force(i.e. it has inertia). States that a body at rest or in uniform motion will, when acted on by an external force, accelerate in the direction of the force. The magnitude of the acceleration for any given mass is directly proportional to the size of the force applied(i.e. when a force of 1 N is applied to a mass of 1 kg, it will accelerate at 1 m/s2).
Force = Mass x Acceleration States that for every action there is an equal and opposite reaction.
Chapter 1 Laws and Definitions
Principles Of Flight 1-6
Principles Of Flight 2-1
INTRODUCTION In order to study the principles of flight it is first necessary to understand the medium in which flight takes place.
THE ATMOSPHERE The atmosphere is a region of air surrounding the Earth up to a height of approximately 500 miles (900 km). Air is a mixture of gases, primarily oxygen (21% by volume) and nitrogen (78% by volume). Up to a height of 6 miles (11 km), water vapour also occurs in varying quantities. The actual amount of water vapour in a given mass of air depends on the temperature and whether the air has recently passed over a large area of water. Generally, the higher the temperature, the greater the amount of water vapour a given mass of air can hold. Air has weight and is also compressible. Its pressure, density, and temperature all decrease with increasing altitude. An aircraft performs work on the air to sustain flight, and any change in pressure, density, and temperature will affect the amount of energy that the aircraft can extract from the air.
THE UNIVERSAL GAS LAW The relationship between pressure, density, and temperature is:
Where; P = Pressure (N/m²) T = Absolute Temperature (K) ρ = Density or Mass per unit volume (kg/m3) This equation only applies to a perfect gas when a given mass occupies a given volume, but from this equation it is possible to establish the effect of pressure and temperature on density.
THE EFFECT OF PRESSURE ON DENSITY Air is a gas and can be easily compressed or expanded. When air is compressed, the number of molecules, or mass, in a given volume increases and the density rises. Conversely, as air expands, the original volume contains fewer molecules and the density decreases. Density is therefore directly proportional to pressure (i.e. if the pressure doubles, the density also doubles). This statement is only true if the temperature remains constant.
Density α Pressure
constantTP =ρ
Chapter 2 The Flight Environment
2-2 Principles Of Flight
THE EFFECT OF TEMPERATURE ON DENSITY As air is heated, the molecules tend to speed up and the spacing increases between them. Thus, a given volume contains fewer molecules and the air density decreases. Conversely, as air cools, the degree of molecular movement decreases and a given volume contains a greater number of molecules, so the density increases. Air density is inversely proportional to temperature (i.e. if the temperature doubles the density halves). This statement is only true if the pressure remains constant.
Density α 1/Temperature
THE EFFECT OF ALTITUDE ON DENSITY With increasing altitude, pressure and temperature both decrease. As stated previously, the drop in temperature causes an increase in density whilst the drop in pressure causes a decrease in density. These factors act in opposition to each other, but pressure has a dominating influence over density. Consequently, pressure, temperature, and density all decrease with increasing altitude.
THE EFFECT OF HUMIDITY ON DENSITY The preceding paragraphs assume that air is perfectly dry. In fact, there is always a certain amount of water vapour in the atmosphere, which varies from place to place and day to day. When air contains water vapour, the density of the air is reduced because water vapour is less dense than dry air. The density of water vapour under standard sea level conditions is 0.760 kg/m3, whereas the density of dry air is 1.225 kg/m3. Water vapour therefore weighs 5/8 as much as dry air. This means that, for a given volume, air is least dense when it contains a maximum amount of water vapour and most dense when it is perfectly dry. Humidity will therefore affect aircraft performance.
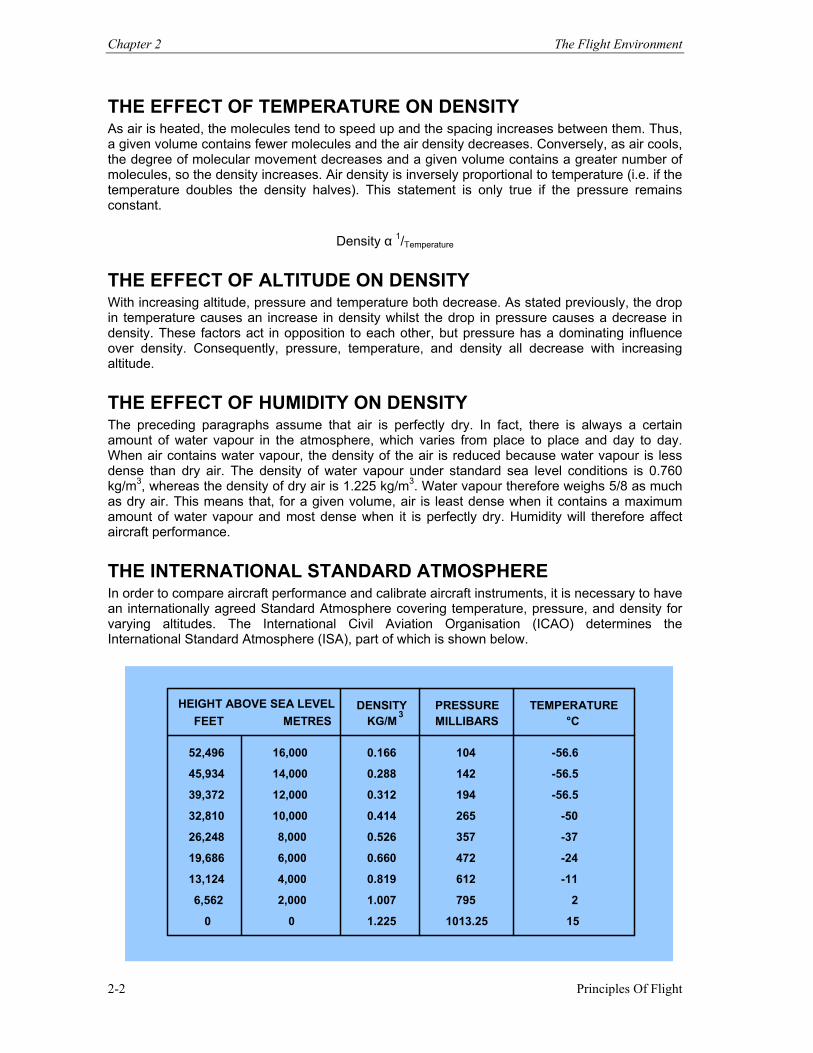
THE INTERNATIONAL STANDARD ATMOSPHERE In order to compare aircraft performance and calibrate aircraft instruments, it is necessary to have an internationally agreed Standard Atmosphere covering temperature, pressure, and density for varying altitudes. The International Civil Aviation Organisation (ICAO) determines the International Standard Atmosphere (ISA), part of which is shown below.
HEIGHT ABOVE SEA LEVELFEET METRES
52,496
45,934
39,372
32,810
26,248
19,686
13,124
6,562
0
16,000
14,000
12,000
10,000
8,000
6,000
4,000
2,000
0
DENSITYKG/M 3
PRESSUREMILLIBARS
TEMPERATURE°C
0.166
0.288
0.312
0.414
0.526
0.660
0.819
1.007
1.225
104
142
194
265
357
472
612
795
1013.25
-56.6
-56.5
-56.5
-50
-37
-24
-11
2
15
Principles Of Flight 3-1
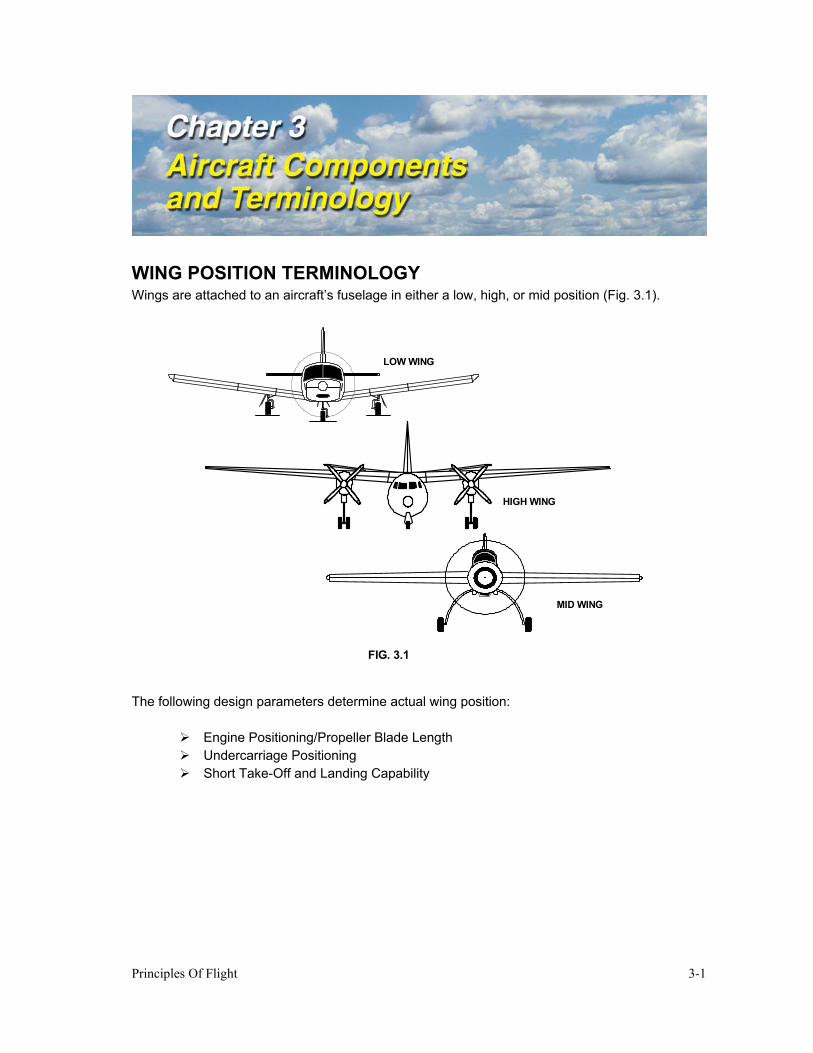
WING POSITION TERMINOLOGY Wings are attached to an aircraft’s fuselage in either a low, high, or mid position (Fig. 3.1).
LOW WING
HIGH WING
MID WING
FIG. 3.1
The following design parameters determine actual wing position:
Engine Positioning/Propeller Blade Length Undercarriage Positioning Short Take-Off and Landing Capability
Chapter 3 Aircraft Components and Terminology
Principles Of Flight 3-2
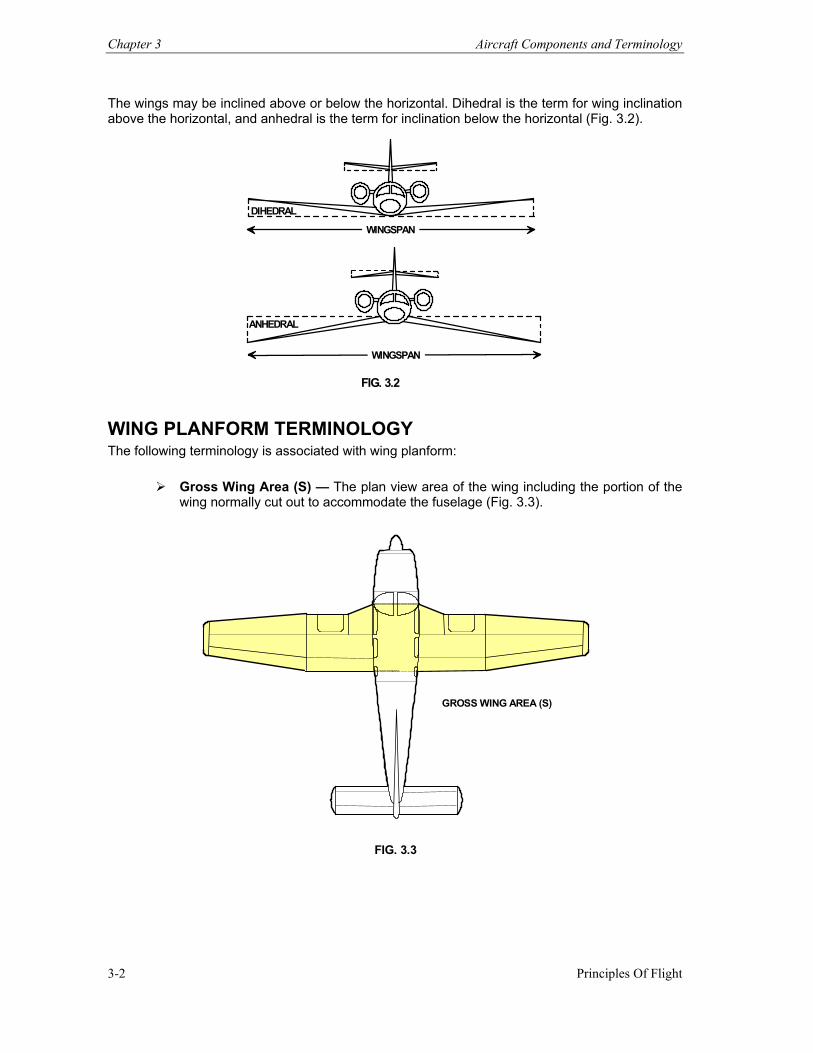
The wings may be inclined above or below the horizontal. Dihedral is the term for wing inclination above the horizontal, and anhedral is the term for inclination below the horizontal (Fig. 3.2).
DIHEDRAL
WINGSPAN
ANHEDRAL
WINGSPAN
FIG. 3.2
WING PLANFORM TERMINOLOGY The following terminology is associated with wing planform:
Gross Wing Area (S) — The plan view area of the wing including the portion of the wing normally cut out to accommodate the fuselage (Fig. 3.3).
GROSS WING AREA (S)
FIG. 3.3
Aircraft Components and Terminology Chapter 3
Principles Of Flight 3-3
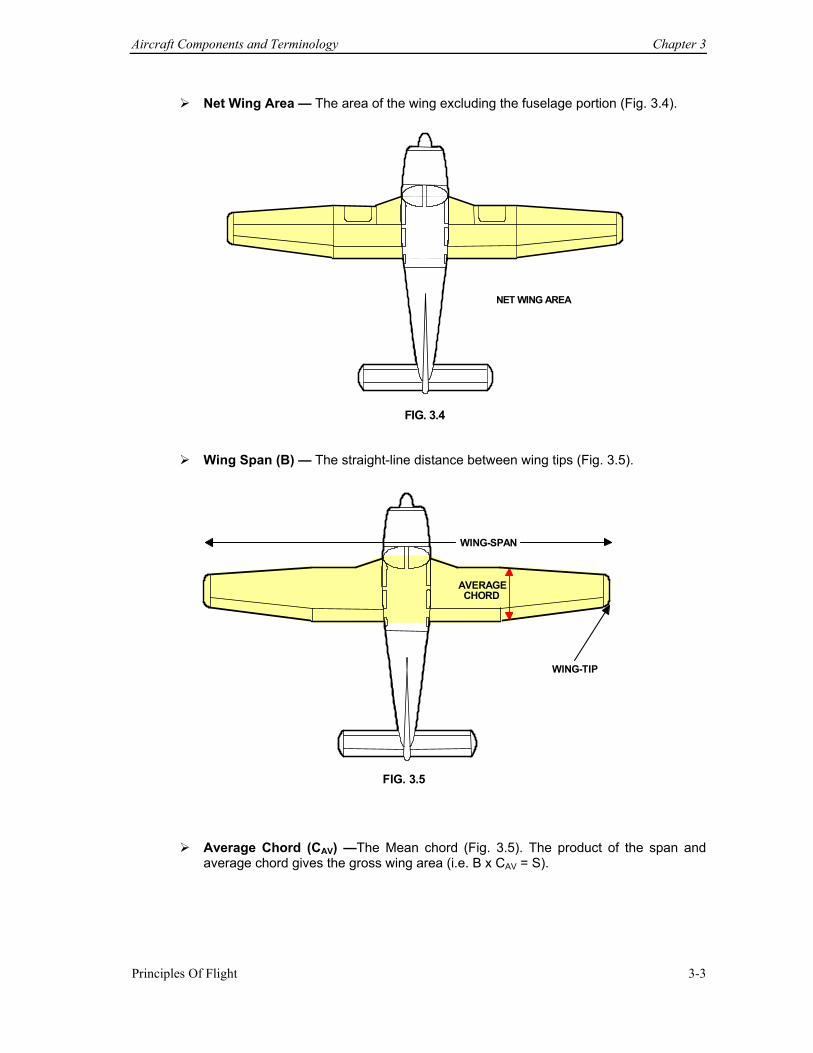
Net Wing Area — The area of the wing excluding the fuselage portion (Fig. 3.4).
NET WING AREA
FIG. 3.4
Wing Span (B) — The straight-line distance between wing tips (Fig. 3.5).
AVERAGECHORD
WING-TIP
WING-SPAN
FIG. 3.5
Average Chord (CAV) —The Mean chord (Fig. 3.5). The product of the span and average chord gives the gross wing area (i.e. B x CAV = S).
Chapter 3 Aircraft Components and Terminology
Principles Of Flight 3-4
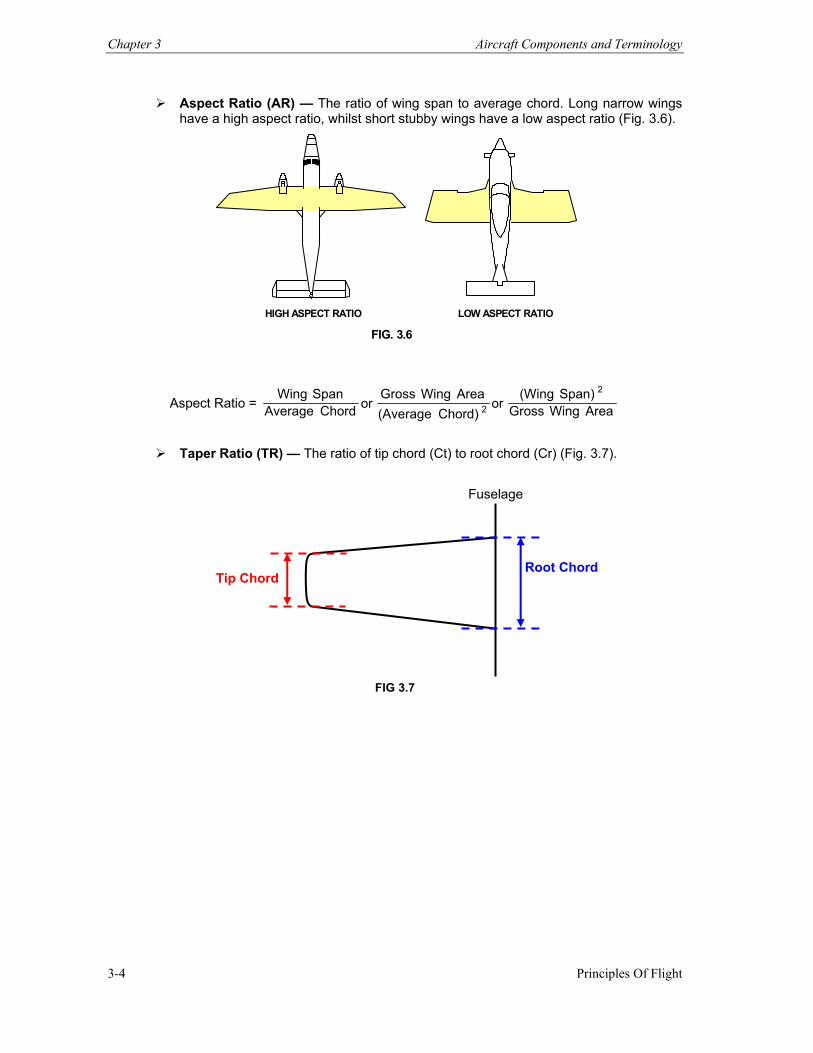
Aspect Ratio (AR) — The ratio of wing span to average chord. Long narrow wings have a high aspect ratio, whilst short stubby wings have a low aspect ratio (Fig. 3.6).
HIGH ASPECT RATIO LOW ASPECT RATIO
FIG. 3.6
Aspect Ratio = Area WingGrossSpan) (Wing
orChord) (Average
Area WingGross orChord Average
Span Wing 2
2
Taper Ratio (TR) — The ratio of tip chord (Ct) to root chord (Cr) (Fig. 3.7).
FIG 3.7
Root Chord Tip Chord
Fuselage
Aircraft Components and Terminology Chapter 3
Principles Of Flight 3-5
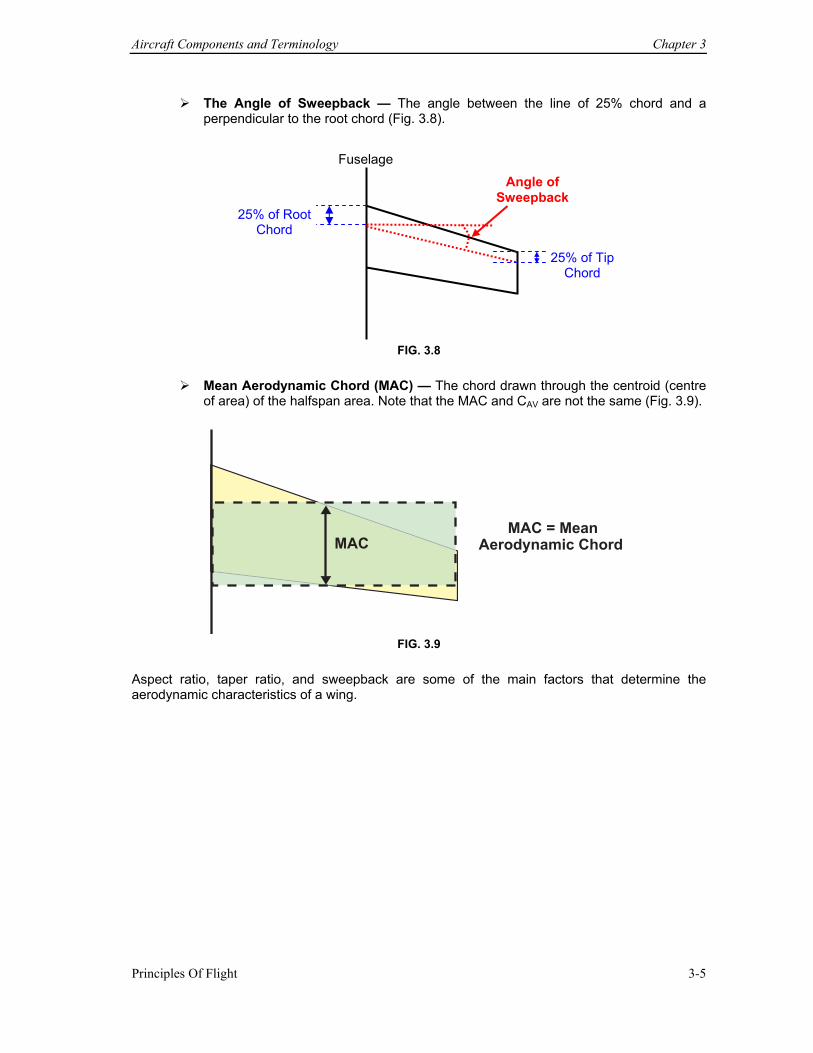
The Angle of Sweepback — The angle between the line of 25% chord and a perpendicular to the root chord (Fig. 3.8).
FIG. 3.8
Mean Aerodynamic Chord (MAC) — The chord drawn through the centroid (centre
of area) of the halfspan area. Note that the MAC and CAV are not the same (Fig. 3.9).
MACMAC = Mean
Aerodynamic Chord
FIG. 3.9
Aspect ratio, taper ratio, and sweepback are some of the main factors that determine the aerodynamic characteristics of a wing.
Fuselage
Angle of Sweepback
25% of Root Chord
25% of Tip Chord
Chapter 3 Aircraft Components and Terminology
Principles Of Flight 3-6
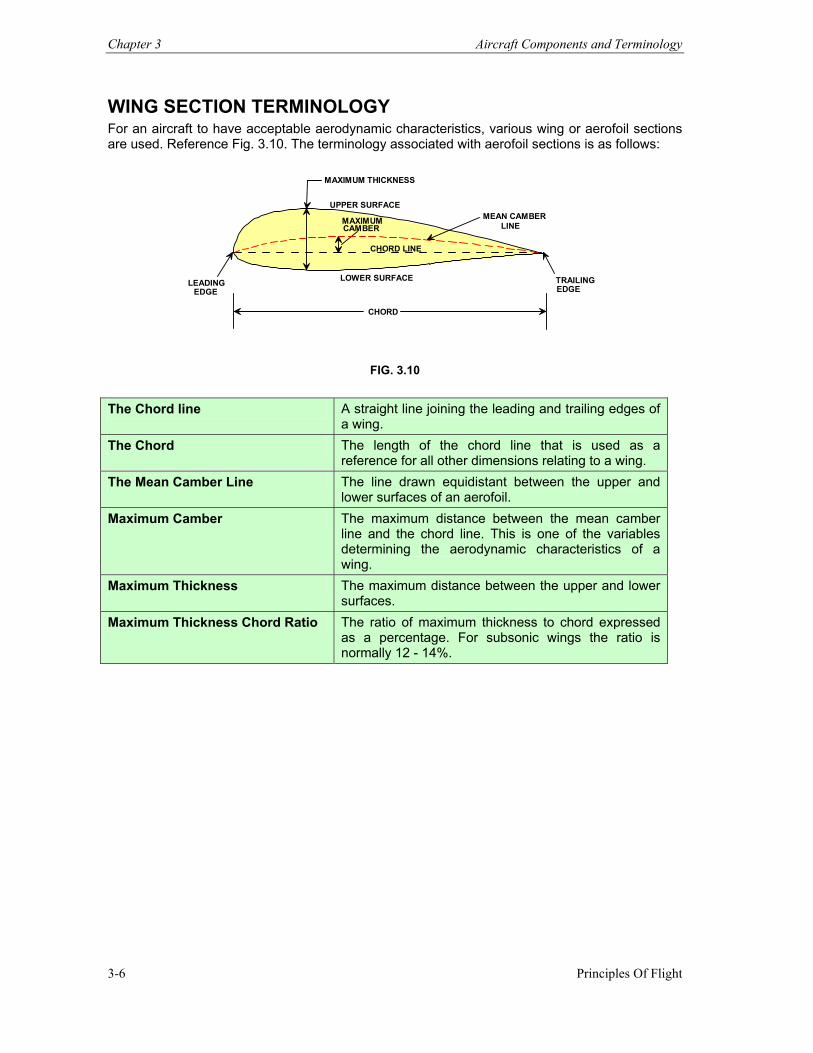
WING SECTION TERMINOLOGY For an aircraft to have acceptable aerodynamic characteristics, various wing or aerofoil sections are used. Reference Fig. 3.10. The terminology associated with aerofoil sections is as follows:
MAXIMUM THICKNESS
UPPER SURFACEMEAN CAMBER
LINEMAXIMUMCAMBER
CHORD LINE
LOWER SURFACE TRAILING EDGE
CHORD
LEADING EDGE
FIG. 3.10
The Chord line A straight line joining the leading and trailing edges of
a wing. The Chord The length of the chord line that is used as a
reference for all other dimensions relating to a wing. The Mean Camber Line The line drawn equidistant between the upper and
lower surfaces of an aerofoil. Maximum Camber The maximum distance between the mean camber
line and the chord line. This is one of the variables determining the aerodynamic characteristics of a wing.
Maximum Thickness The maximum distance between the upper and lower surfaces.
Maximum Thickness Chord Ratio The ratio of maximum thickness to chord expressed as a percentage. For subsonic wings the ratio is normally 12 - 14%.
Aircraft Components and Terminology Chapter 3
Principles Of Flight 3-7
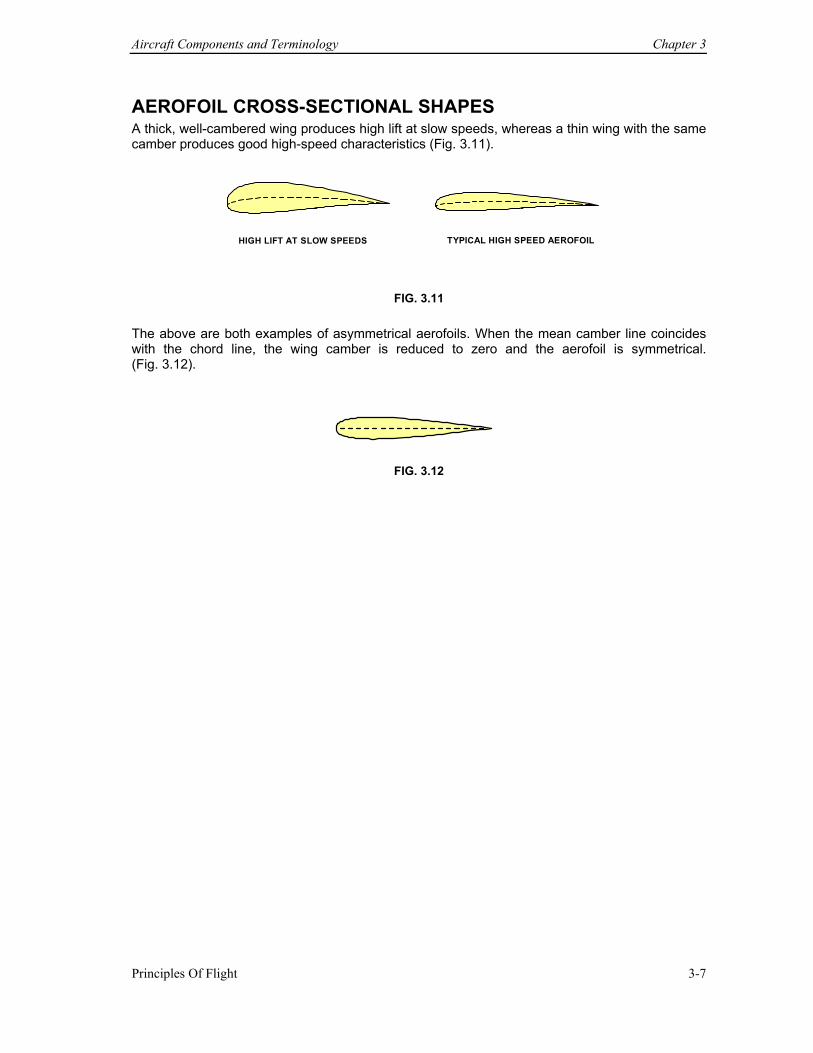
AEROFOIL CROSS-SECTIONAL SHAPES A thick, well-cambered wing produces high lift at slow speeds, whereas a thin wing with the same camber produces good high-speed characteristics (Fig. 3.11).
HIGH LIFT AT SLOW SPEEDS TYPICAL HIGH SPEED AEROFOIL
FIG. 3.11 The above are both examples of asymmetrical aerofoils. When the mean camber line coincides with the chord line, the wing camber is reduced to zero and the aerofoil is symmetrical. (Fig. 3.12).
FIG. 3.12
Chapter 3 Aircraft Components and Terminology
Principles Of Flight 3-8
Principles Of Flight 4-1
INTRODUCTION As air flows around an aerofoil the pressure differential set up over the upper and lower surfaces produces a force. This force acts perpendicular to the relative airflow and is known as lift. In steady level flight, lift exactly balances the aircraft's weight. For a given airspeed, a lower weight requires less lift.
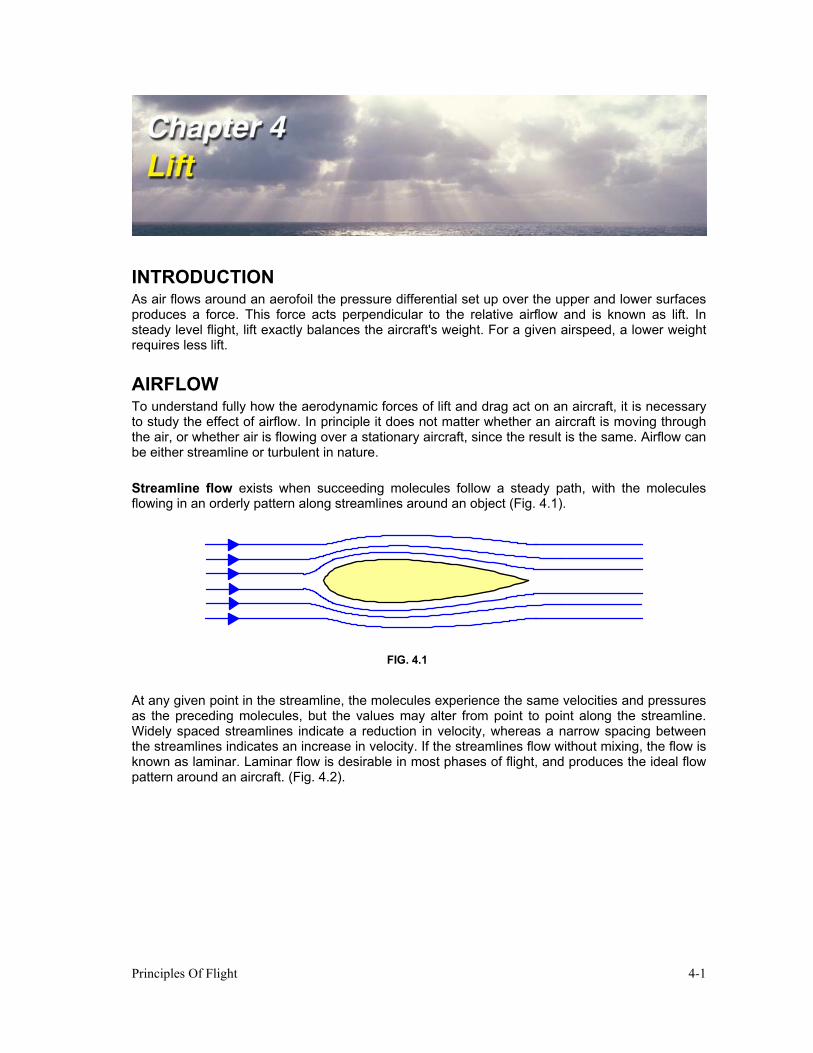
AIRFLOW To understand fully how the aerodynamic forces of lift and drag act on an aircraft, it is necessary to study the effect of airflow. In principle it does not matter whether an aircraft is moving through the air, or whether air is flowing over a stationary aircraft, since the result is the same. Airflow can be either streamline or turbulent in nature. Streamline flow exists when succeeding molecules follow a steady path, with the molecules flowing in an orderly pattern along streamlines around an object (Fig. 4.1).
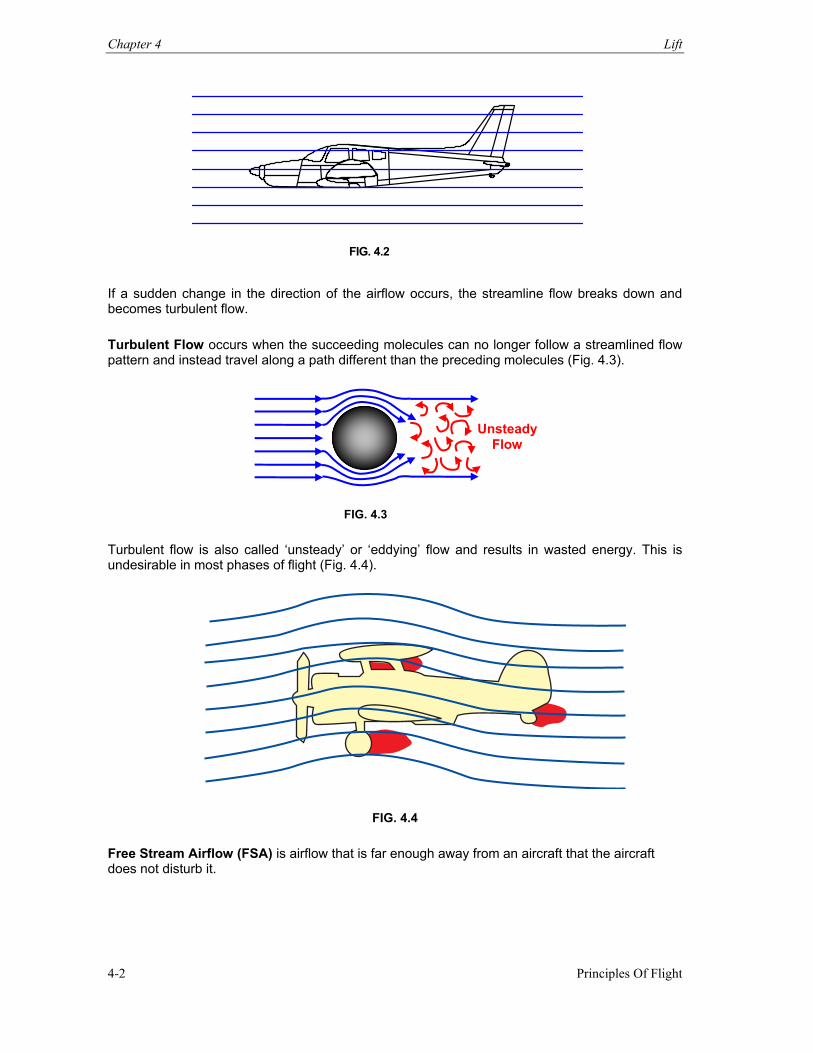
FIG. 4.1 At any given point in the streamline, the molecules experience the same velocities and pressures as the preceding molecules, but the values may alter from point to point along the streamline. Widely spaced streamlines indicate a reduction in velocity, whereas a narrow spacing between the streamlines indicates an increase in velocity. If the streamlines flow without mixing, the flow is known as laminar. Laminar flow is desirable in most phases of flight, and produces the ideal flow pattern around an aircraft. (Fig. 4.2).
Chapter 4 Lift
Principles Of Flight 4-2
FIG. 4.2
If a sudden change in the direction of the airflow occurs, the streamline flow breaks down and becomes turbulent flow.
Turbulent Flow occurs when the succeeding molecules can no longer follow a streamlined flow pattern and instead travel along a path different than the preceding molecules (Fig. 4.3).
FIG. 4.3 Turbulent flow is also called ‘unsteady’ or ‘eddying’ flow and results in wasted energy. This is undesirable in most phases of flight (Fig. 4.4).
FIG. 4.4 Free Stream Airflow (FSA) is airflow that is far enough away from an aircraft that the aircraft does not disturb it.
Unsteady Flow
Lift Chapter 4
Principles Of Flight 4-3
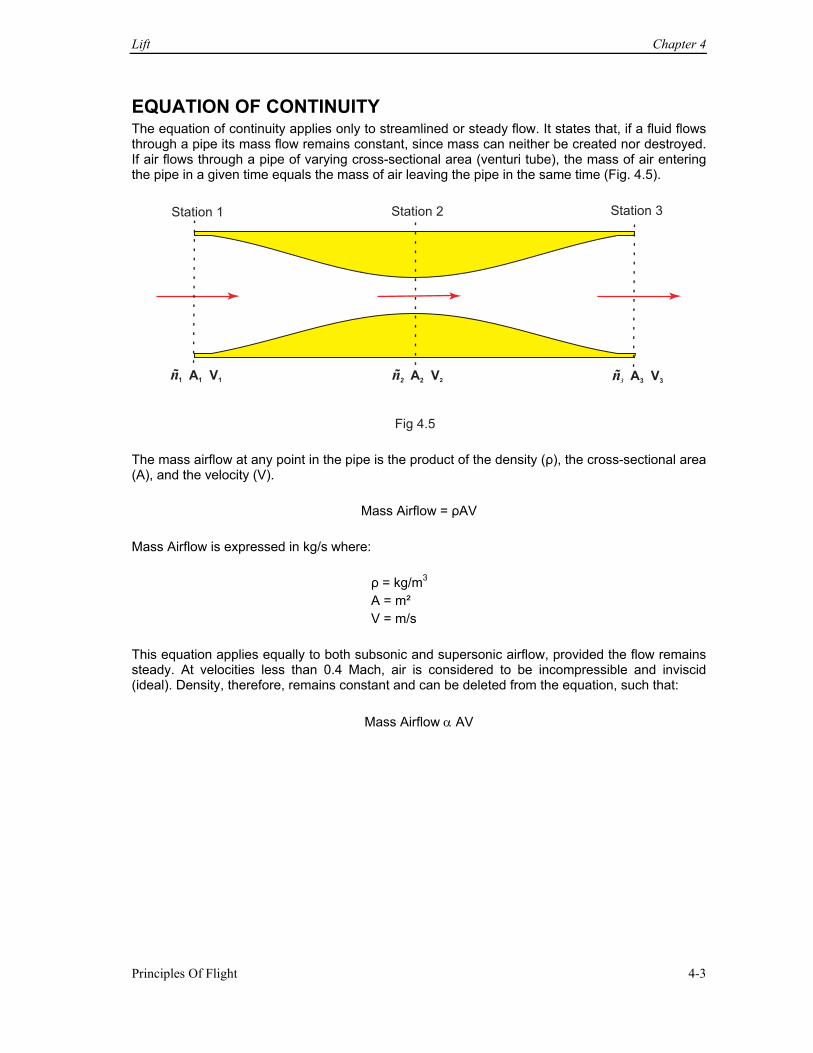
EQUATION OF CONTINUITY The equation of continuity applies only to streamlined or steady flow. It states that, if a fluid flows through a pipe its mass flow remains constant, since mass can neither be created nor destroyed. If air flows through a pipe of varying cross-sectional area (venturi tube), the mass of air entering the pipe in a given time equals the mass of air leaving the pipe in the same time (Fig. 4.5).
Station 1 Station 2 Station 3
ñ3 A V 3 3ñ1 1 1 A V ñ
2 A V 2 2
Fig 4.5 The mass airflow at any point in the pipe is the product of the density (ρ), the cross-sectional area (A), and the velocity (V).
Mass Airflow = ρAV
Mass Airflow is expressed in kg/s where: ρ = kg/m3 A = m² V = m/s This equation applies equally to both subsonic and supersonic airflow, provided the flow remains steady. At velocities less than 0.4 Mach, air is considered to be incompressible and inviscid (ideal). Density, therefore, remains constant and can be deleted from the equation, such that:
Mass Airflow α AV
Chapter 4 Lift
Principles Of Flight 4-4
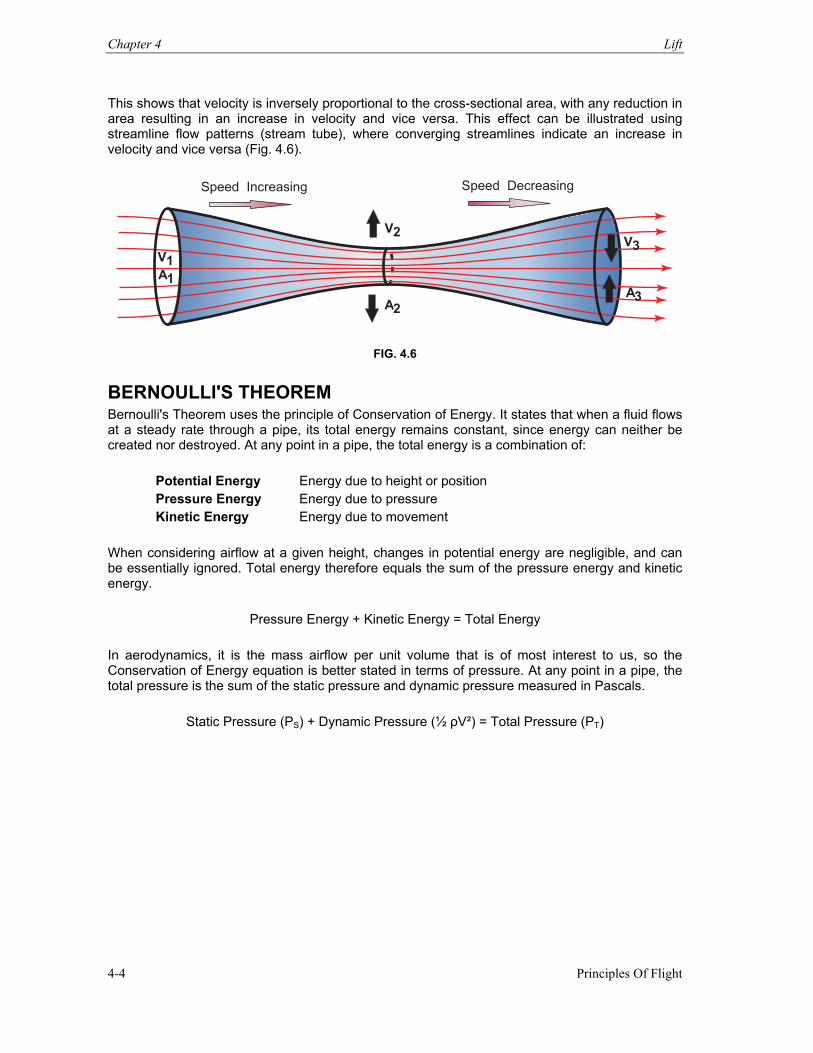
This shows that velocity is inversely proportional to the cross-sectional area, with any reduction in area resulting in an increase in velocity and vice versa. This effect can be illustrated using streamline flow patterns (stream tube), where converging streamlines indicate an increase in velocity and vice versa (Fig. 4.6).
Speed Increasing Speed Decreasing
V
AA
V2
32
3V1A1
FIG. 4.6
BERNOULLI'S THEOREM Bernoulli's Theorem uses the principle of Conservation of Energy. It states that when a fluid flows at a steady rate through a pipe, its total energy remains constant, since energy can neither be created nor destroyed. At any point in a pipe, the total energy is a combination of:
Potential Energy Energy due to height or position Pressure Energy Energy due to pressure Kinetic Energy Energy due to movement
When considering airflow at a given height, changes in potential energy are negligible, and can be essentially ignored. Total energy therefore equals the sum of the pressure energy and kinetic energy.
Pressure Energy + Kinetic Energy = Total Energy In aerodynamics, it is the mass airflow per unit volume that is of most interest to us, so the Conservation of Energy equation is better stated in terms of pressure. At any point in a pipe, the total pressure is the sum of the static pressure and dynamic pressure measured in Pascals.
Static Pressure (PS) + Dynamic Pressure (½ ρV²) = Total Pressure (PT)
Lift Chapter 4
Principles Of Flight 4-5
To satisfy Bernoulli's theorem, this value must remain constant at all points along the pipe, such that any rise in dynamic pressure is accompanied by a reduction in static pressure and vice versa.
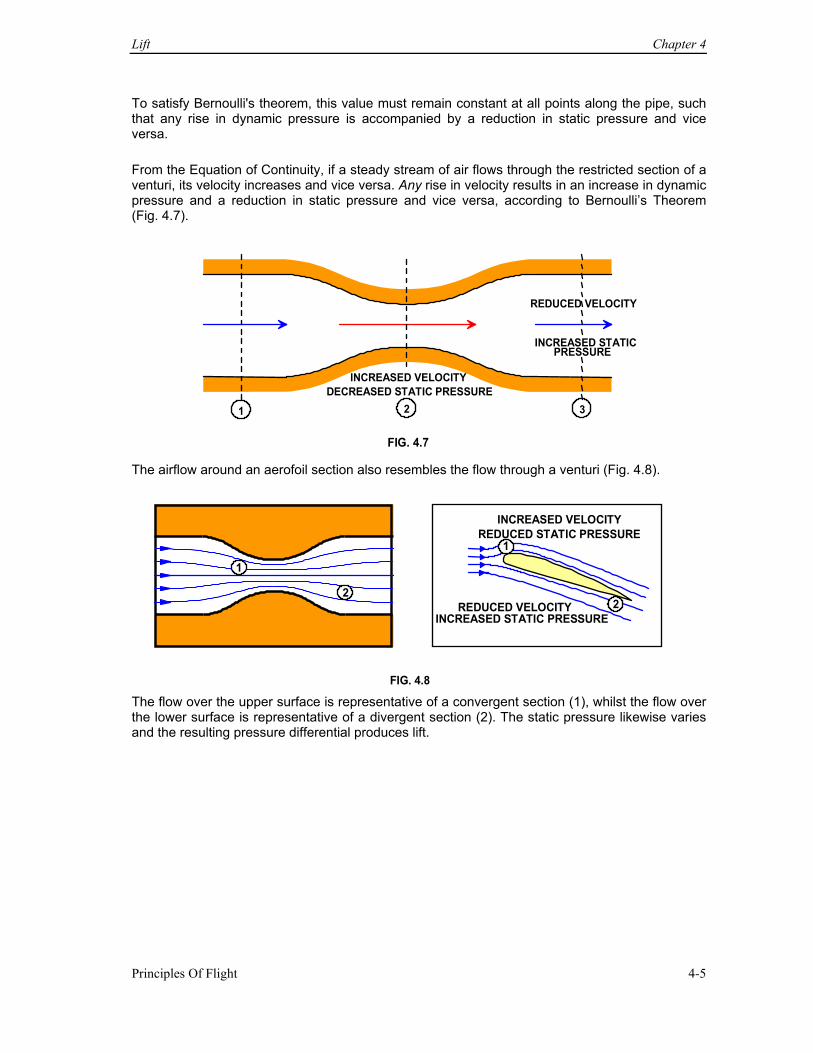
From the Equation of Continuity, if a steady stream of air flows through the restricted section of a venturi, its velocity increases and vice versa. Any rise in velocity results in an increase in dynamic pressure and a reduction in static pressure and vice versa, according to Bernoulli’s Theorem (Fig. 4.7).
INCREASED STATIC PRESSURE
INCREASED VELOCITYDECREASED STATIC PRESSURE
1 2 3
REDUCED VELOCITY
FIG. 4.7
The airflow around an aerofoil section also resembles the flow through a venturi (Fig. 4.8).
1 2
1
2
INCREASED VELOCITY REDUCED STATIC PRESSURE
REDUCED VELOCITY INCREASED STATIC PRESSURE
FIG. 4.8 The flow over the upper surface is representative of a convergent section (1), whilst the flow over the lower surface is representative of a divergent section (2). The static pressure likewise varies and the resulting pressure differential produces lift.
Chapter 4 Lift
Principles Of Flight 4-6
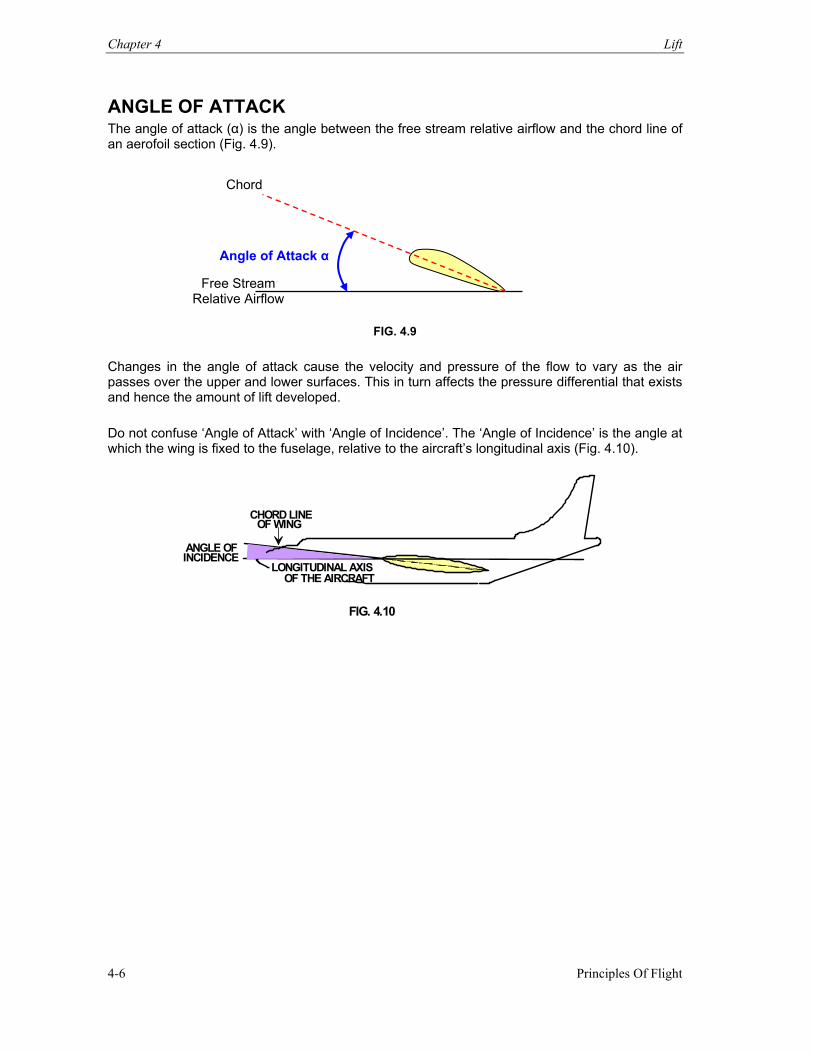
ANGLE OF ATTACK The angle of attack (α) is the angle between the free stream relative airflow and the chord line of an aerofoil section (Fig. 4.9).
FIG. 4.9
Changes in the angle of attack cause the velocity and pressure of the flow to vary as the air passes over the upper and lower surfaces. This in turn affects the pressure differential that exists and hence the amount of lift developed. Do not confuse ‘Angle of Attack’ with ‘Angle of Incidence’. The ‘Angle of Incidence’ is the angle at which the wing is fixed to the fuselage, relative to the aircraft’s longitudinal axis (Fig. 4.10).
CHORD LINE
OF WING ANGLE OF INCIDENCE
LONGITUDINAL AXISOF THE AIRCRAFT
FIG. 4.10
Free Stream Relative Airflow
Chord
Angle of Attack α
Lift Chapter 4
Principles Of Flight 4-7
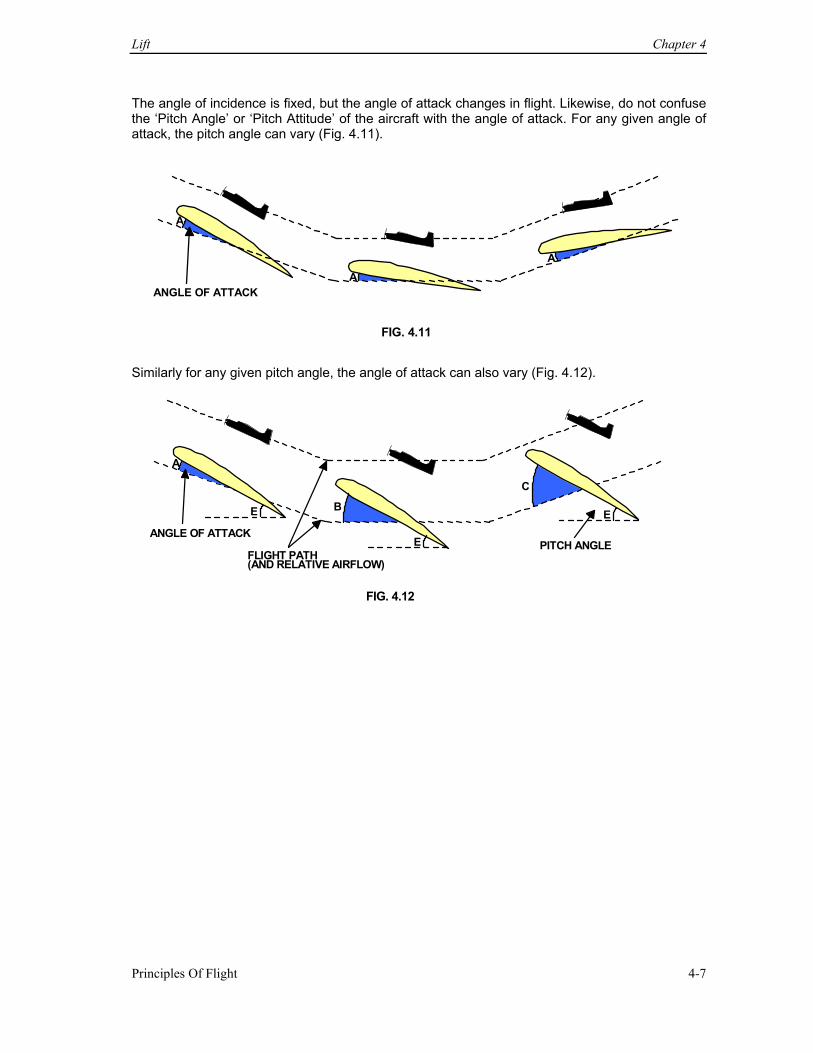
The angle of incidence is fixed, but the angle of attack changes in flight. Likewise, do not confuse the ‘Pitch Angle’ or ‘Pitch Attitude’ of the aircraft with the angle of attack. For any given angle of attack, the pitch angle can vary (Fig. 4.11).
A
AA
ANGLE OF ATTACK FIG. 4.11
Similarly for any given pitch angle, the angle of attack can also vary (Fig. 4.12).
A
ANGLE OF ATTACK E
E
E B
C
FLIGHT PATH (AND RELATIVE AIRFLOW)
PITCH ANGLE
FIG. 4.12
Chapter 4 Lift
Principles Of Flight 4-8
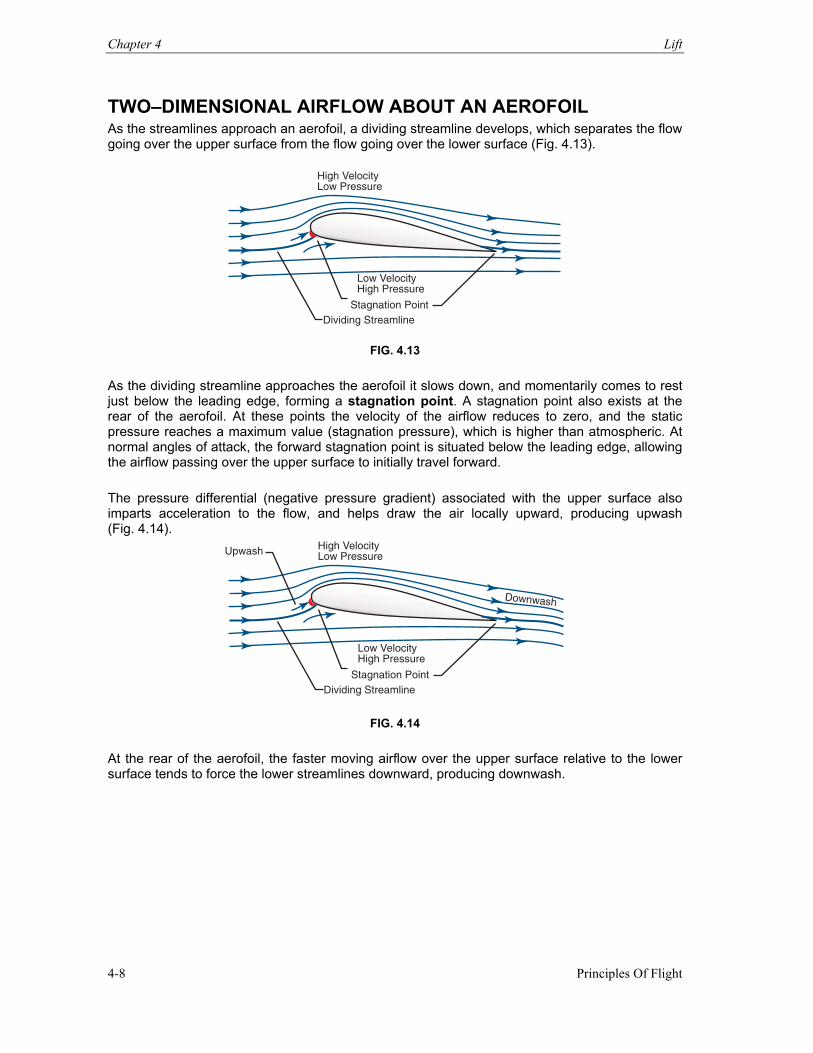
TWO–DIMENSIONAL AIRFLOW ABOUT AN AEROFOIL As the streamlines approach an aerofoil, a dividing streamline develops, which separates the flow going over the upper surface from the flow going over the lower surface (Fig. 4.13).
High VelocityLow Pressure
Stagnation PointDividing Streamline
Low VelocityHigh Pressure
FIG. 4.13 As the dividing streamline approaches the aerofoil it slows down, and momentarily comes to rest just below the leading edge, forming a stagnation point. A stagnation point also exists at the rear of the aerofoil. At these points the velocity of the airflow reduces to zero, and the static pressure reaches a maximum value (stagnation pressure), which is higher than atmospheric. At normal angles of attack, the forward stagnation point is situated below the leading edge, allowing the airflow passing over the upper surface to initially travel forward. The pressure differential (negative pressure gradient) associated with the upper surface also imparts acceleration to the flow, and helps draw the air locally upward, producing upwash (Fig. 4.14).
High VelocityLow Pressure
Stagnation PointDividing Streamline
Low VelocityHigh Pressure
Upwash
Downwash
FIG. 4.14
At the rear of the aerofoil, the faster moving airflow over the upper surface relative to the lower surface tends to force the lower streamlines downward, producing downwash.
Lift Chapter 4
Principles Of Flight 4-9
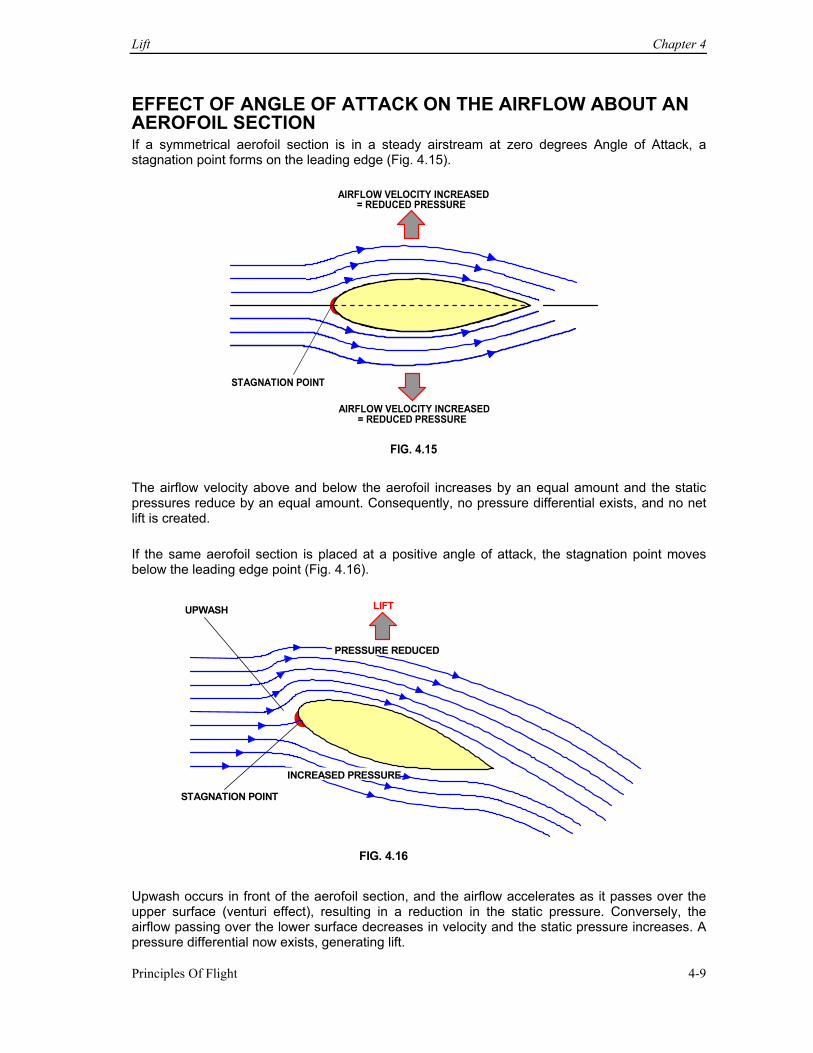
EFFECT OF ANGLE OF ATTACK ON THE AIRFLOW ABOUT AN AEROFOIL SECTION If a symmetrical aerofoil section is in a steady airstream at zero degrees Angle of Attack, a stagnation point forms on the leading edge (Fig. 4.15).
AIRFLOW VELOCITY INCREASED= REDUCED PRESSURE
AIRFLOW VELOCITY INCREASED= REDUCED PRESSURE
STAGNATION POINT
FIG. 4.15
The airflow velocity above and below the aerofoil increases by an equal amount and the static pressures reduce by an equal amount. Consequently, no pressure differential exists, and no net lift is created. If the same aerofoil section is placed at a positive angle of attack, the stagnation point moves below the leading edge point (Fig. 4.16).
LIFT
PRESSURE REDUCED
INCREASED PRESSURE
UPWASH
STAGNATION POINT
FIG. 4.16
Upwash occurs in front of the aerofoil section, and the airflow accelerates as it passes over the upper surface (venturi effect), resulting in a reduction in the static pressure. Conversely, the airflow passing over the lower surface decreases in velocity and the static pressure increases. A pressure differential now exists, generating lift.
Chapter 4 Lift
Principles Of Flight 4-10
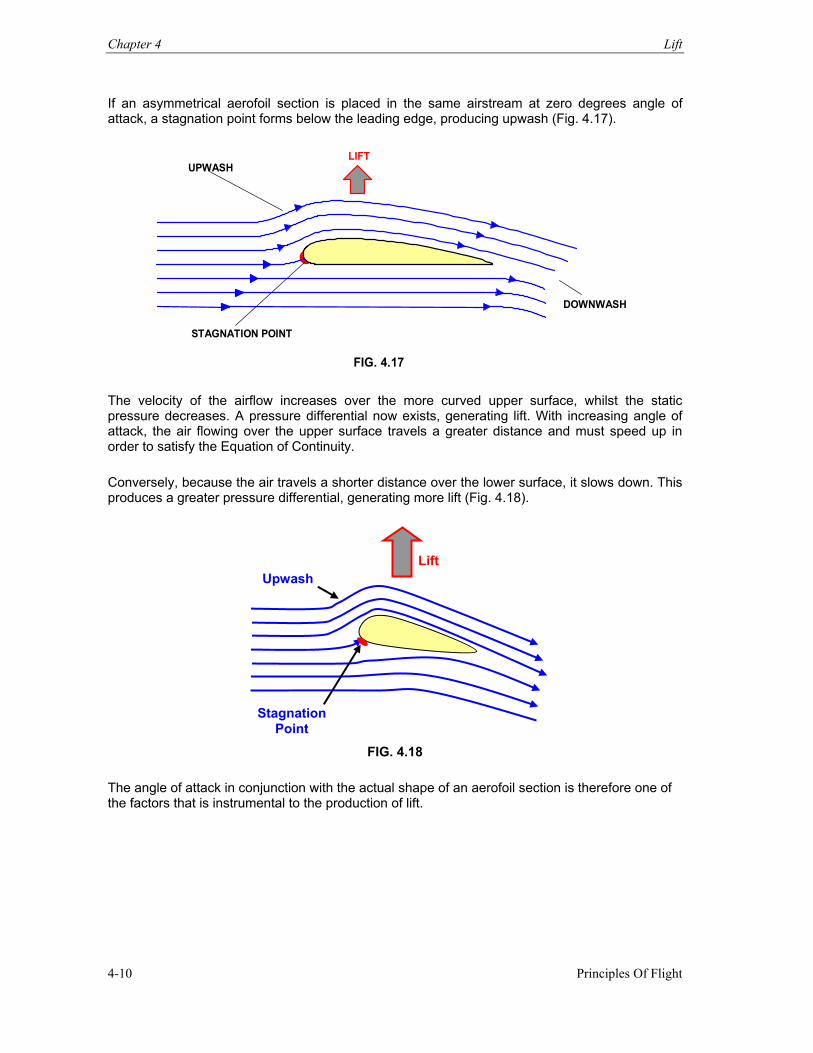
If an asymmetrical aerofoil section is placed in the same airstream at zero degrees angle of attack, a stagnation point forms below the leading edge, producing upwash (Fig. 4.17).
LIFTUPWASH
STAGNATION POINT DOWNWASH
FIG. 4.17
The velocity of the airflow increases over the more curved upper surface, whilst the static pressure decreases. A pressure differential now exists, generating lift. With increasing angle of attack, the air flowing over the upper surface travels a greater distance and must speed up in order to satisfy the Equation of Continuity. Conversely, because the air travels a shorter distance over the lower surface, it slows down. This produces a greater pressure differential, generating more lift (Fig. 4.18).
FIG. 4.18
The angle of attack in conjunction with the actual shape of an aerofoil section is therefore one of the factors that is instrumental to the production of lift.
Stagnation Point
Upwash Lift
Lift Chapter 4
Principles Of Flight 4-11
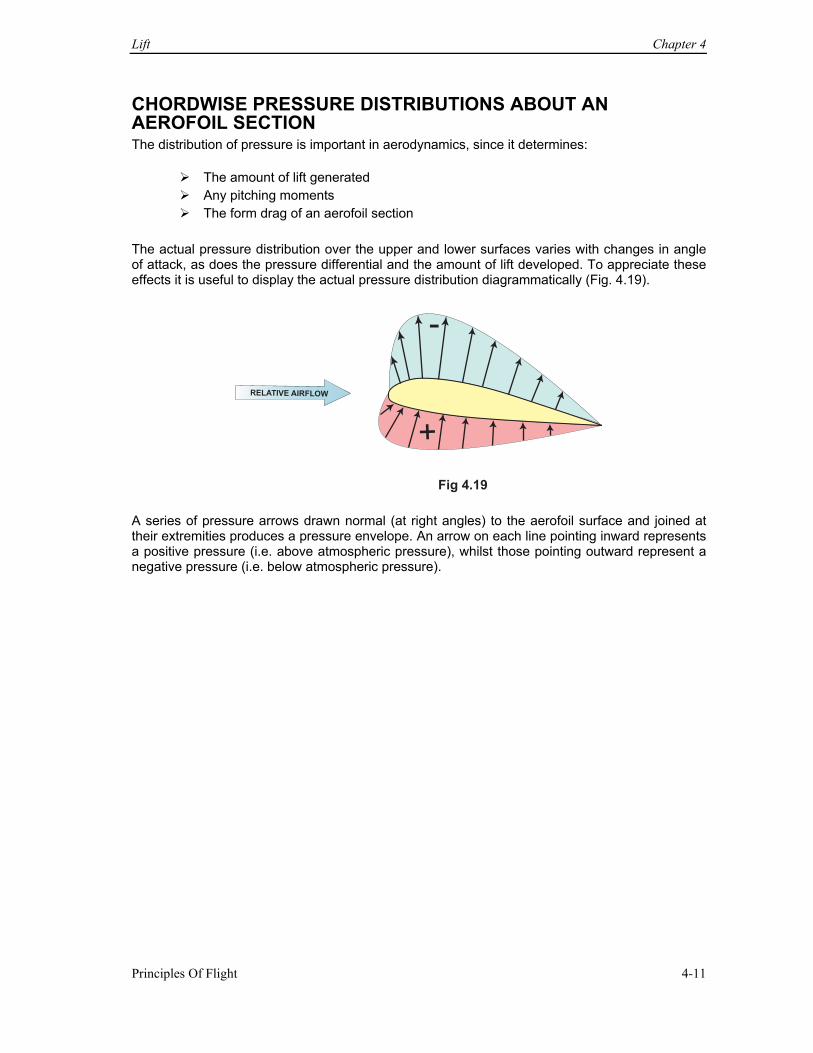
CHORDWISE PRESSURE DISTRIBUTIONS ABOUT AN AEROFOIL SECTION The distribution of pressure is important in aerodynamics, since it determines:
The amount of lift generated Any pitching moments The form drag of an aerofoil section
The actual pressure distribution over the upper and lower surfaces varies with changes in angle of attack, as does the pressure differential and the amount of lift developed. To appreciate these effects it is useful to display the actual pressure distribution diagrammatically (Fig. 4.19).
Fig 4.19
+
-
RELATIVE AIRFLOW
A series of pressure arrows drawn normal (at right angles) to the aerofoil surface and joined at their extremities produces a pressure envelope. An arrow on each line pointing inward represents a positive pressure (i.e. above atmospheric pressure), whilst those pointing outward represent a negative pressure (i.e. below atmospheric pressure).
Chapter 4 Lift
Principles Of Flight 4-12
-2°
-
-+
B
-5°
-
+
A
+2°
-
+C
+8°
+
-
D
0
+
+15°
-
E F
+20°
-
+
FIG. 4.20
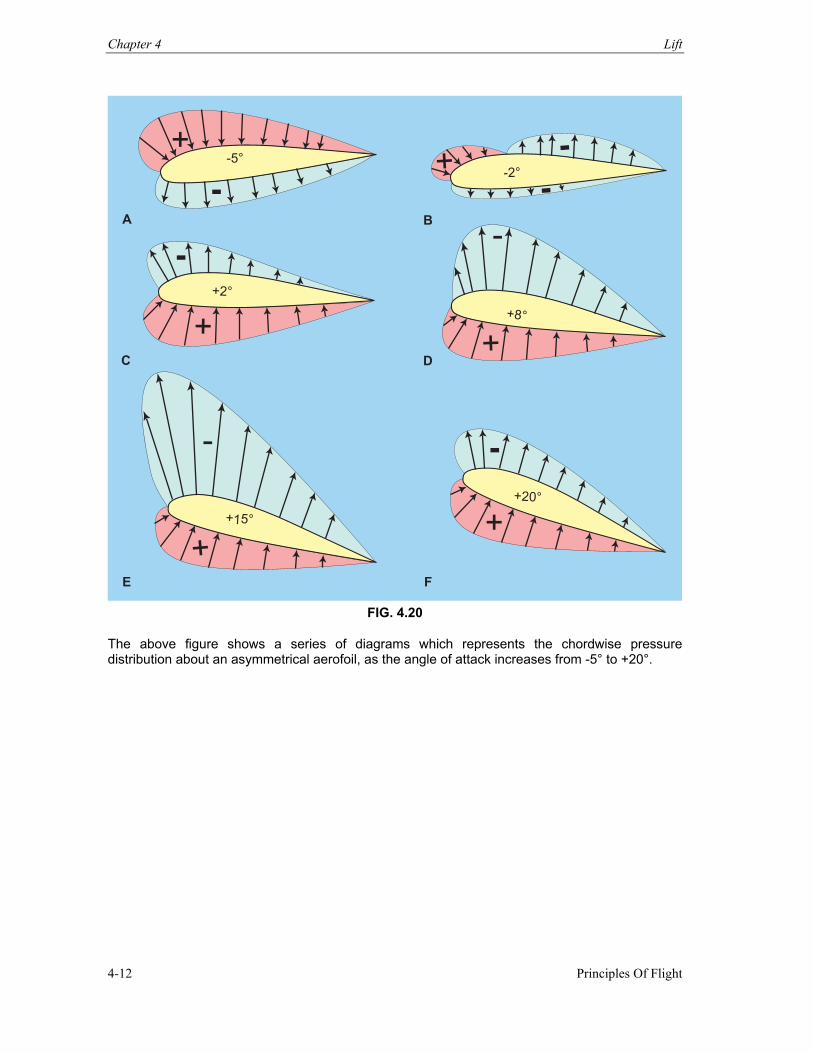
The above figure shows a series of diagrams which represents the chordwise pressure distribution about an asymmetrical aerofoil, as the angle of attack increases from -5° to +20°.
Lift Chapter 4
Principles Of Flight 4-13
Figure 4.20A shows the aerofoil at -5° angle of attack. The pressure above the aerofoil is greater than ambient atmospheric pressure and acceleration of the airflow beneath the aerofoil results in a drop in static pressure to less than ambient. The lift is therefore negative or downward due to both the higher pressure above the aerofoil and the lower pressure below the aerofoil. Figure 4.20B shows a typical small negative angle of attack at which no net lift is produced, which is known as the zero-lift angle of attack. The upper surface of the aerofoil has an area of higher pressure at the front, behind which there is an area of lower pressure. Below the aerofoil the pressure is slightly lower than ambient. Figures 4.20C to 4.20E show that as the angle of attack increases, the low pressure above the aerofoil deepens and the suction peak moves forward. This results in the lift increasing and more of the lift being generated further forward. Also note that the higher than ambient pressure beneath the aerofoil remains relatively constant in shape and magnitude as the angle of attack increases. This means that the increase in lift, as angle of attack increases, is mainly due to the suction above the aerofoil and not due to the high pressure below the aerofoil. If the angle of attack increases further, lift increases until the stalling angle of attack is exceeded. Figure 4.20F shows a stalled aerofoil at an angle of attack of +20°. In the stalled condition, the higher than ambient pressure below the aerofoil is the same as the unstalled aerofoil in Figure 4.20E, but the suction peak above the aerofoil has flattened and spread, causing lift to decrease and the centre of pressure to move aft. For conventional low speed aerofoils the angle of attack at which an aerofoil stalls is usually about 15° to 16°. Beyond this angle the streamline flow over the upper surface separates from the majority of the upper surface. The relationship between velocity and static pressure is no longer applicable beyond this point, since Bernoulli's Theorem only applies to streamline flow.
Chapter 4 Lift
Principles Of Flight 4-14
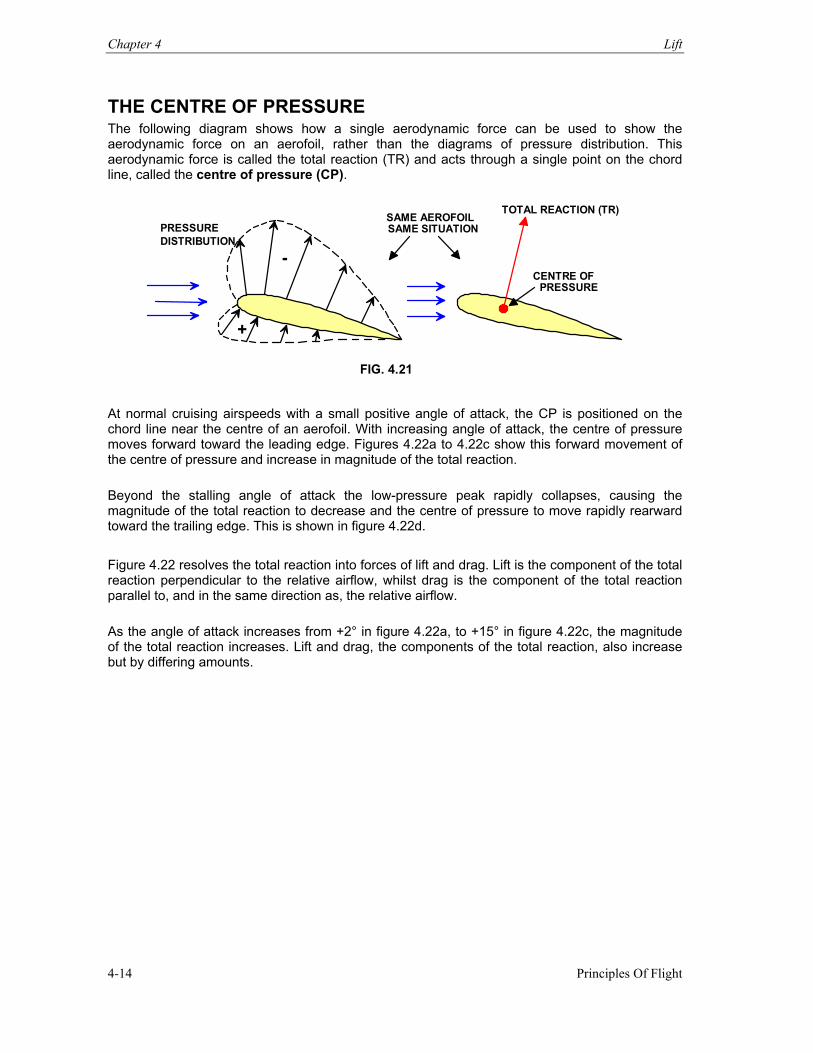
THE CENTRE OF PRESSURE The following diagram shows how a single aerodynamic force can be used to show the aerodynamic force on an aerofoil, rather than the diagrams of pressure distribution. This aerodynamic force is called the total reaction (TR) and acts through a single point on the chord line, called the centre of pressure (CP).
TOTAL REACTION (TR)
CENTRE OF PRESSURE
SAME AEROFOILSAME SITUATION
+
- PRESSURE DISTRIBUTION
FIG. 4.21
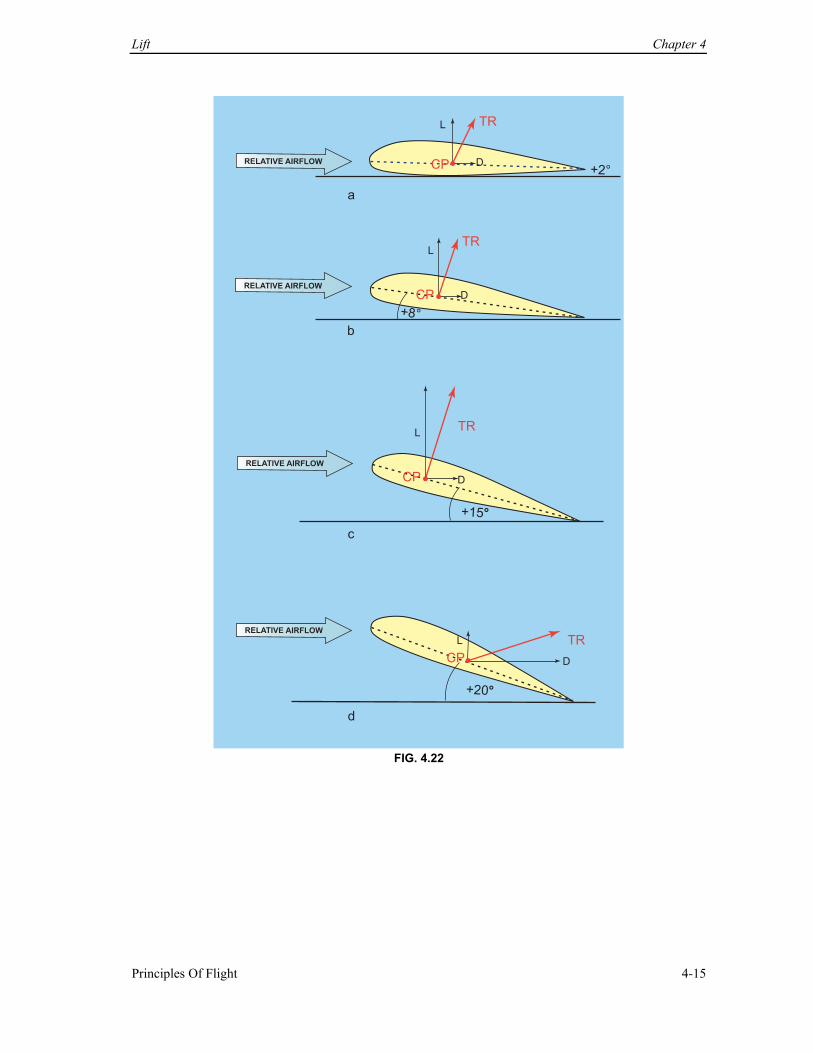
At normal cruising airspeeds with a small positive angle of attack, the CP is positioned on the chord line near the centre of an aerofoil. With increasing angle of attack, the centre of pressure moves forward toward the leading edge. Figures 4.22a to 4.22c show this forward movement of the centre of pressure and increase in magnitude of the total reaction. Beyond the stalling angle of attack the low-pressure peak rapidly collapses, causing the magnitude of the total reaction to decrease and the centre of pressure to move rapidly rearward toward the trailing edge. This is shown in figure 4.22d. Figure 4.22 resolves the total reaction into forces of lift and drag. Lift is the component of the total reaction perpendicular to the relative airflow, whilst drag is the component of the total reaction parallel to, and in the same direction as, the relative airflow. As the angle of attack increases from +2° in figure 4.22a, to +15° in figure 4.22c, the magnitude of the total reaction increases. Lift and drag, the components of the total reaction, also increase but by differing amounts.
Lift Chapter 4
Principles Of Flight 4-15
+20°
RELATIVE AIRFLOW
+2°CP
TRL
a
b
c
d
DRELATIVE AIRFLOW
+8°
RELATIVE AIRFLOW
TRL
CP D
+15°
RELATIVE AIRFLOW
TRL
CP D
TRL
CP D
FIG. 4.22
Chapter 4 Lift
Principles Of Flight 4-16
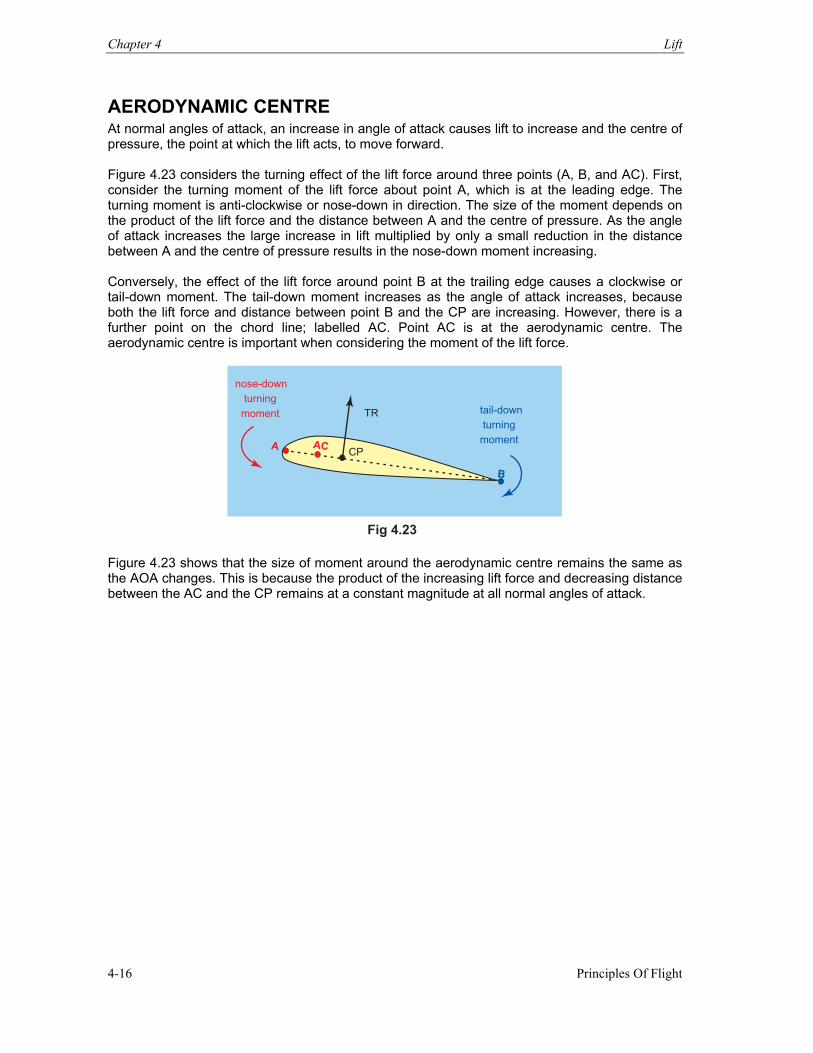
AERODYNAMIC CENTRE At normal angles of attack, an increase in angle of attack causes lift to increase and the centre of pressure, the point at which the lift acts, to move forward. Figure 4.23 considers the turning effect of the lift force around three points (A, B, and AC). First, consider the turning moment of the lift force about point A, which is at the leading edge. The turning moment is anti-clockwise or nose-down in direction. The size of the moment depends on the product of the lift force and the distance between A and the centre of pressure. As the angle of attack increases the large increase in lift multiplied by only a small reduction in the distance between A and the centre of pressure results in the nose-down moment increasing. Conversely, the effect of the lift force around point B at the trailing edge causes a clockwise or tail-down moment. The tail-down moment increases as the angle of attack increases, because both the lift force and distance between point B and the CP are increasing. However, there is a further point on the chord line; labelled AC. Point AC is at the aerodynamic centre. The aerodynamic centre is important when considering the moment of the lift force.
A AC
B
CP
TR
nose-down
turning
moment tail-down
turning
moment
Fig 4.23 Figure 4.23 shows that the size of moment around the aerodynamic centre remains the same as the AOA changes. This is because the product of the increasing lift force and decreasing distance between the AC and the CP remains at a constant magnitude at all normal angles of attack.
Lift Chapter 4
Principles Of Flight 4-17
LIFT FORMULA The amount of lift generated by a wing depends on the following:
Wing Shape Angle of Attack Air Density (ρ) Free Stream Air Velocity Squared (V²) Wing Planform Surface Area (S)
The dynamic pressure possessed by a moving fluid equals half the density times the velocity squared. (Dynamic Pressure = ½ ρ V²). The combination of this pressure and a wing’s planform surface area (S) produces a force, which is proportional to the area on which it acts. This force is known as Lift. Lift = Pressure x Area = ½ ρ V² x S Lift does not directly equal the product of the two terms and therefore the lifting efficiency of the wing also needs to be taken into account. This involves the wing's shape and angle of attack. Lift is expressed in Newtons (N) and the general lift formula is: Lift = CL ½ ρ V² S VARIATION OF COEFFICIENT OF LIFT WITH ANGLE OF ATTACK A graph of the coefficient of lift versus angle of attack shows the effect of angle of attack on the lifting ability of a wing. This is known as a lift curve, and highlights a number of important aerofoil features. The red curve in the following diagram is for an asymmetrical aerofoil section. This is evident because there is a positive CL at zero degrees angle of attack, which is due to the camber. Between 0° and 12° angle of attack the graph is a straight line. This shows that the coefficient of lift, and hence lift, is directly proportional to angle of attack in this region. Above 12° angle of attack, the rate of increase in lift reduces and the curve eventually peaks. This peak represents the maximum coefficient of lift (CL max), which for this particular aerofoil occurs at about 15° to 16° angle of attack. This angle varies with different aerofoil sections, but is a typical value for most light aircraft. At angles of attack beyond this point, the coefficient of lift curve drops rapidly downward, indicating a significant drop in the lift produced by the aerofoil. The aerofoil now stalls, and can no longer produce sufficient lift to maintain steady straight and level flight. The aerofoil stalls when the angle of attack passes CL max, so this angle is called the critical angle or stall angle. The normal flight range is between 0° angle of attack and the stalling angle of attack.
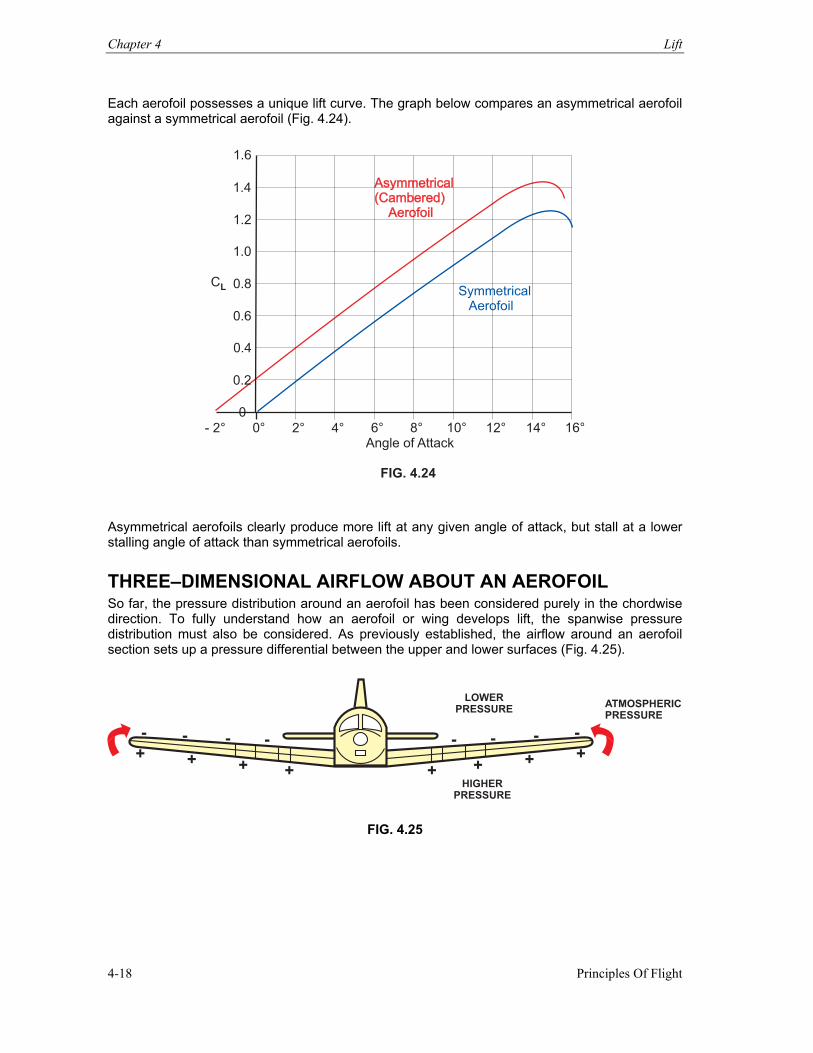
Chapter 4 Lift
Principles Of Flight 4-18
Each aerofoil possesses a unique lift curve. The graph below compares an asymmetrical aerofoil against a symmetrical aerofoil (Fig. 4.24).
Symmetrical Aerofoil
CL
1.6
1.4
1.2
1.0
0.8
0.6
0.4
0.2
0
- 2° 0° 6° 8° 10° 12° 14° 16°4°2°
Angle of Attack
Asymmetrical(Cambered) Aerofoil
Asymmetrical(Cambered) Aerofoil
FIG. 4.24
Asymmetrical aerofoils clearly produce more lift at any given angle of attack, but stall at a lower stalling angle of attack than symmetrical aerofoils.
THREE–DIMENSIONAL AIRFLOW ABOUT AN AEROFOIL So far, the pressure distribution around an aerofoil has been considered purely in the chordwise direction. To fully understand how an aerofoil or wing develops lift, the spanwise pressure distribution must also be considered. As previously established, the airflow around an aerofoil section sets up a pressure differential between the upper and lower surfaces (Fig. 4.25).
+ + + +- - - -
++++----
LOWERPRESSURE
HIGHERPRESSURE
ATMOSPHERICPRESSURE
FIG. 4.25
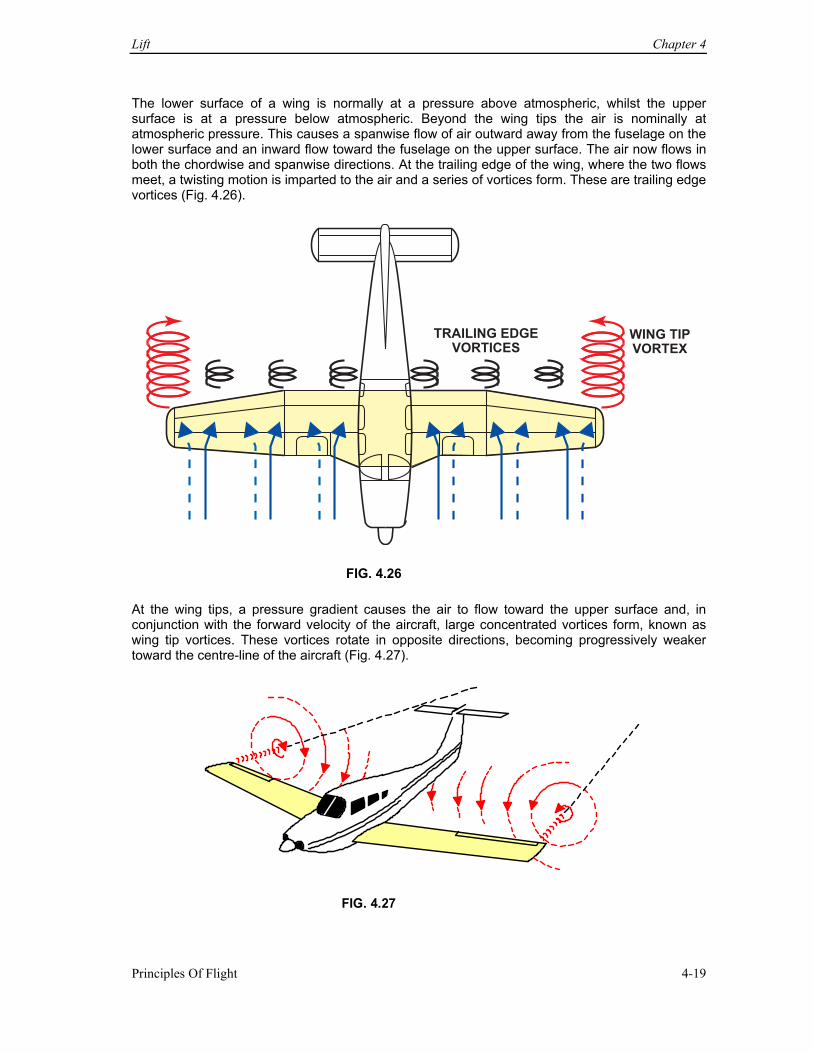
Lift Chapter 4
Principles Of Flight 4-19
The lower surface of a wing is normally at a pressure above atmospheric, whilst the upper surface is at a pressure below atmospheric. Beyond the wing tips the air is nominally at atmospheric pressure. This causes a spanwise flow of air outward away from the fuselage on the lower surface and an inward flow toward the fuselage on the upper surface. The air now flows in both the chordwise and spanwise directions. At the trailing edge of the wing, where the two flows meet, a twisting motion is imparted to the air and a series of vortices form. These are trailing edge vortices (Fig. 4.26).
TRAILING EDGEVORTICES
WING TIPVORTEX
FIG. 4.26 At the wing tips, a pressure gradient causes the air to flow toward the upper surface and, in conjunction with the forward velocity of the aircraft, large concentrated vortices form, known as wing tip vortices. These vortices rotate in opposite directions, becoming progressively weaker toward the centre-line of the aircraft (Fig. 4.27).
FIG. 4.27
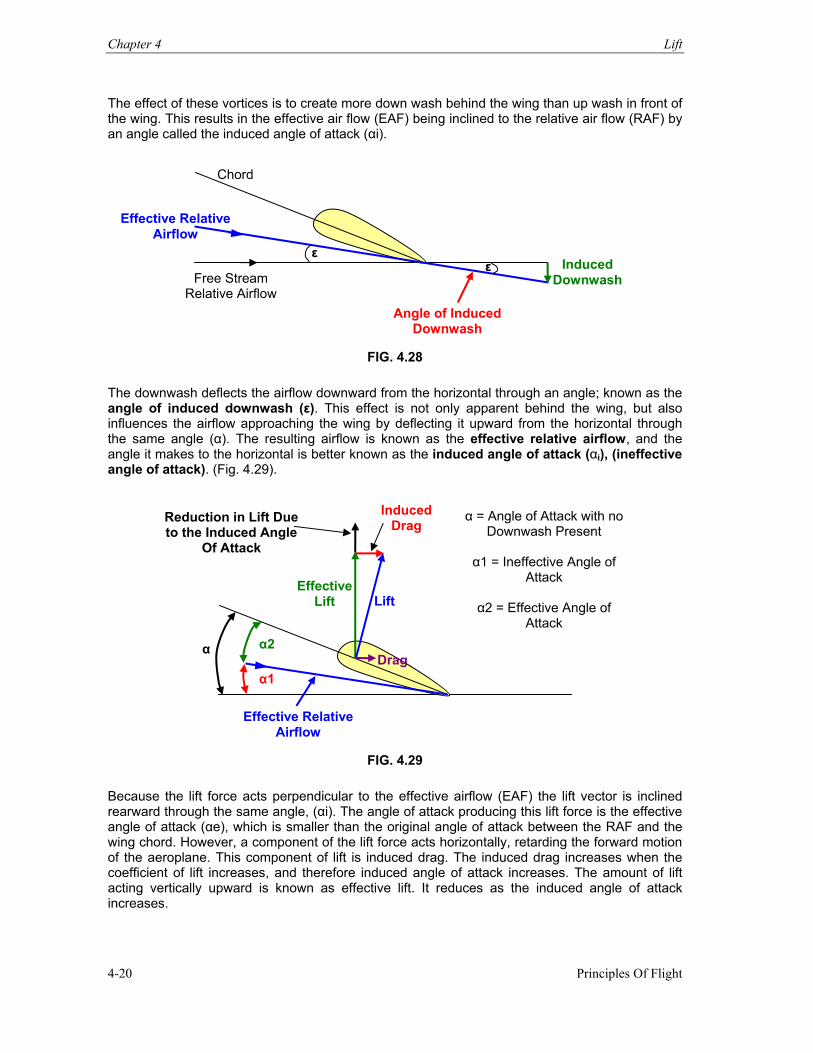
Chapter 4 Lift
Principles Of Flight 4-20
The effect of these vortices is to create more down wash behind the wing than up wash in front of the wing. This results in the effective air flow (EAF) being inclined to the relative air flow (RAF) by an angle called the induced angle of attack (αi).
FIG. 4.28
The downwash deflects the airflow downward from the horizontal through an angle; known as the angle of induced downwash (ε). This effect is not only apparent behind the wing, but also influences the airflow approaching the wing by deflecting it upward from the horizontal through the same angle (α). The resulting airflow is known as the effective relative airflow, and the angle it makes to the horizontal is better known as the induced angle of attack (αi), (ineffective angle of attack). (Fig. 4.29).
FIG. 4.29
Because the lift force acts perpendicular to the effective airflow (EAF) the lift vector is inclined rearward through the same angle, (αi). The angle of attack producing this lift force is the effective angle of attack (αe), which is smaller than the original angle of attack between the RAF and the wing chord. However, a component of the lift force acts horizontally, retarding the forward motion of the aeroplane. This component of lift is induced drag. The induced drag increases when the coefficient of lift increases, and therefore induced angle of attack increases. The amount of lift acting vertically upward is known as effective lift. It reduces as the induced angle of attack increases.
α1
Effective Relative Airflow
α2 α
Induced Drag
Drag
Lift Effective
Lift
Reduction in Lift Due to the Induced Angle
Of Attack
α = Angle of Attack with no Downwash Present
α1 = Ineffective Angle of
Attack
α2 = Effective Angle of Attack
Induced Downwash
Chord
Free Stream Relative Airflow
Effective Relative Airflow
Angle of Induced Downwash
ε ε
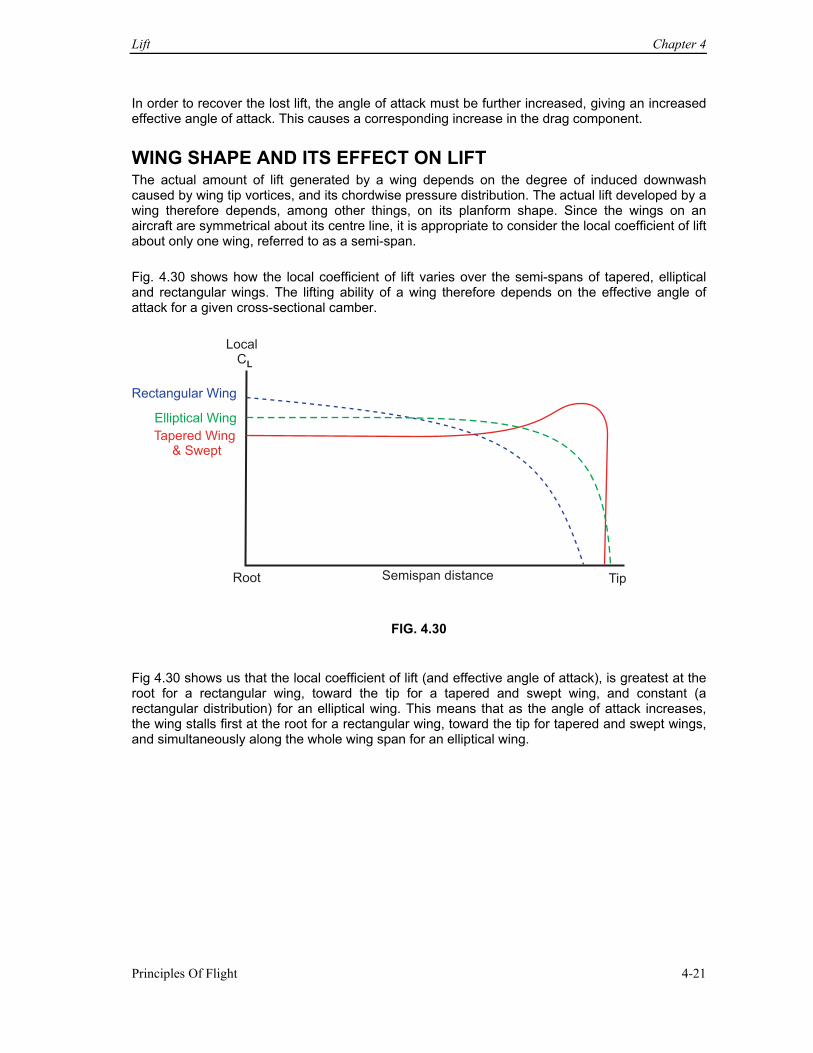
Lift Chapter 4
Principles Of Flight 4-21
In order to recover the lost lift, the angle of attack must be further increased, giving an increased effective angle of attack. This causes a corresponding increase in the drag component.
WING SHAPE AND ITS EFFECT ON LIFT The actual amount of lift generated by a wing depends on the degree of induced downwash caused by wing tip vortices, and its chordwise pressure distribution. The actual lift developed by a wing therefore depends, among other things, on its planform shape. Since the wings on an aircraft are symmetrical about its centre line, it is appropriate to consider the local coefficient of lift about only one wing, referred to as a semi-span. Fig. 4.30 shows how the local coefficient of lift varies over the semi-spans of tapered, elliptical and rectangular wings. The lifting ability of a wing therefore depends on the effective angle of attack for a given cross-sectional camber.
Local CL
Root TipSemispan distance
Rectangular Wing
Tapered Wing & Swept
Elliptical Wing
FIG. 4.30
Fig 4.30 shows us that the local coefficient of lift (and effective angle of attack), is greatest at the root for a rectangular wing, toward the tip for a tapered and swept wing, and constant (a rectangular distribution) for an elliptical wing. This means that as the angle of attack increases, the wing stalls first at the root for a rectangular wing, toward the tip for tapered and swept wings, and simultaneously along the whole wing span for an elliptical wing.
Chapter 4 Lift
Principles Of Flight 4-22
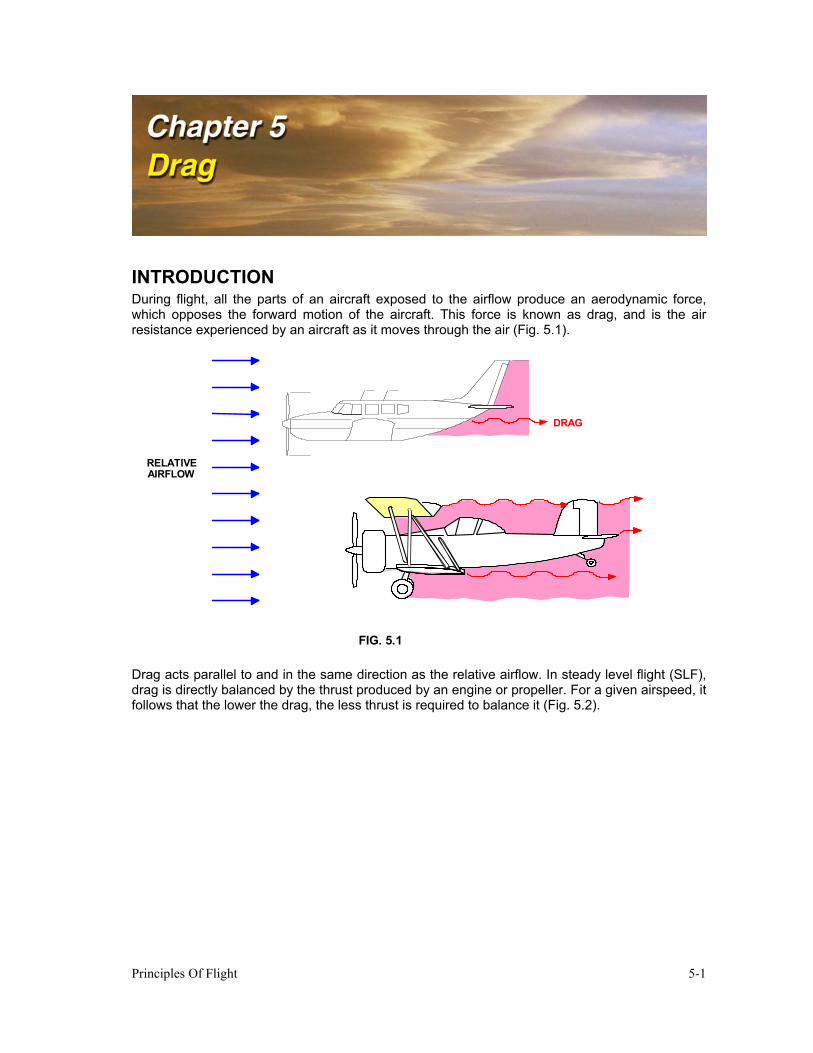
Principles Of Flight 5-1
INTRODUCTION During flight, all the parts of an aircraft exposed to the airflow produce an aerodynamic force, which opposes the forward motion of the aircraft. This force is known as drag, and is the air resistance experienced by an aircraft as it moves through the air (Fig. 5.1).
RELATIVE AIRFLOW
DRAG
FIG. 5.1
Drag acts parallel to and in the same direction as the relative airflow. In steady level flight (SLF), drag is directly balanced by the thrust produced by an engine or propeller. For a given airspeed, it follows that the lower the drag, the less thrust is required to balance it (Fig. 5.2).
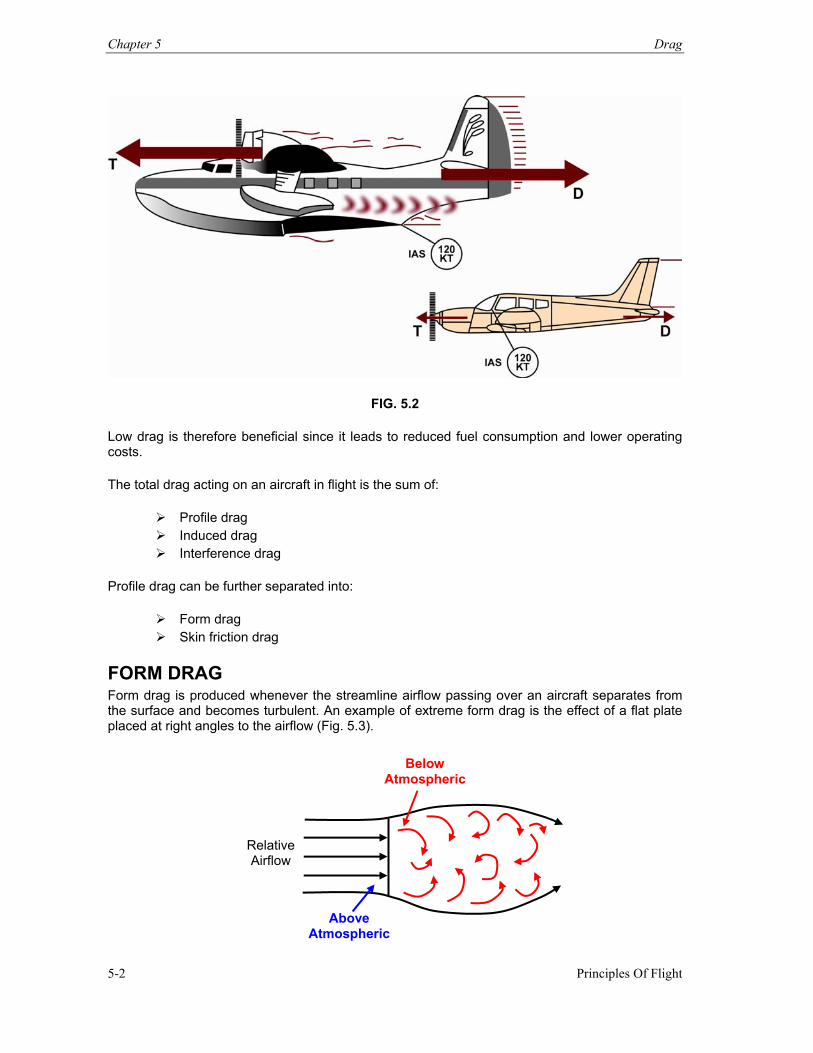
Chapter 5 Drag
Principles Of Flight 5-2
FIG. 5.2 Low drag is therefore beneficial since it leads to reduced fuel consumption and lower operating costs. The total drag acting on an aircraft in flight is the sum of:
Profile drag Induced drag Interference drag
Profile drag can be further separated into:
Form drag Skin friction drag
FORM DRAG Form drag is produced whenever the streamline airflow passing over an aircraft separates from the surface and becomes turbulent. An example of extreme form drag is the effect of a flat plate placed at right angles to the airflow (Fig. 5.3).
Relative Airflow
Above Atmospheric
Below Atmospheric
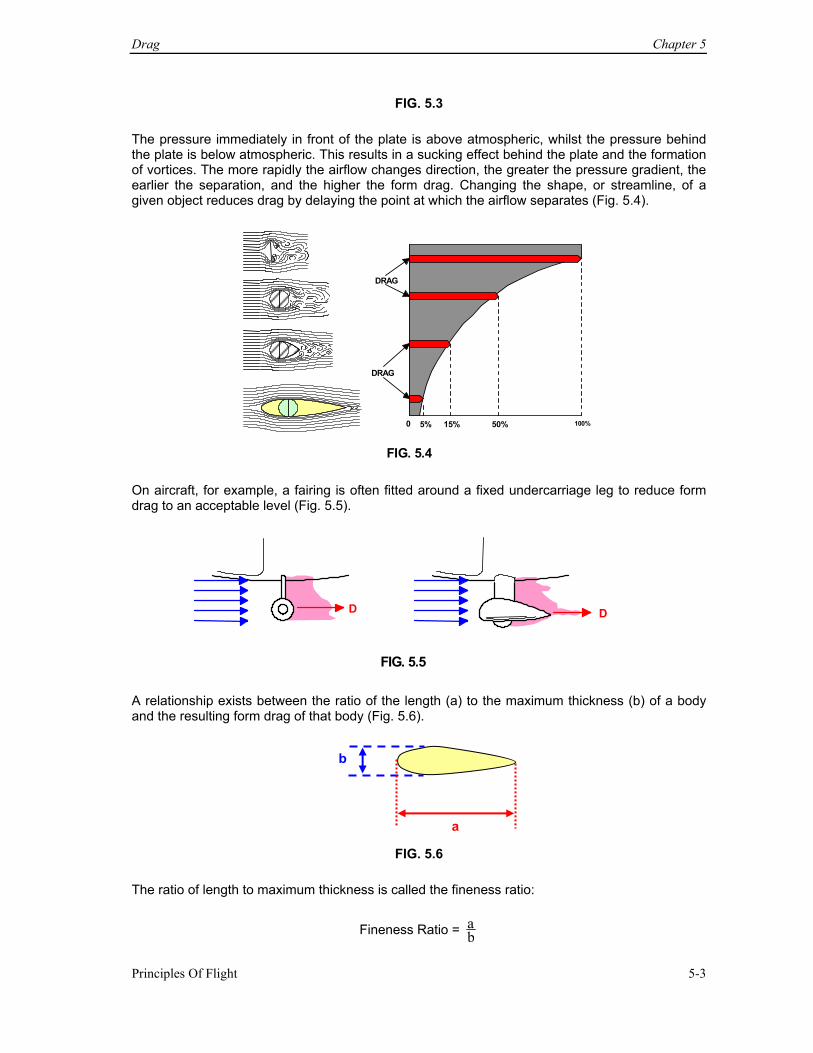
Drag Chapter 5
Principles Of Flight 5-3
FIG. 5.3 The pressure immediately in front of the plate is above atmospheric, whilst the pressure behind the plate is below atmospheric. This results in a sucking effect behind the plate and the formation of vortices. The more rapidly the airflow changes direction, the greater the pressure gradient, the earlier the separation, and the higher the form drag. Changing the shape, or streamline, of a given object reduces drag by delaying the point at which the airflow separates (Fig. 5.4).
5% 15% 50% 100% 0
DRAG
DRAG
FIG. 5.4 On aircraft, for example, a fairing is often fitted around a fixed undercarriage leg to reduce form drag to an acceptable level (Fig. 5.5).
D D
FIG. 5.5 A relationship exists between the ratio of the length (a) to the maximum thickness (b) of a body and the resulting form drag of that body (Fig. 5.6).
FIG. 5.6
The ratio of length to maximum thickness is called the fineness ratio:
Fineness Ratio = ba
b
a
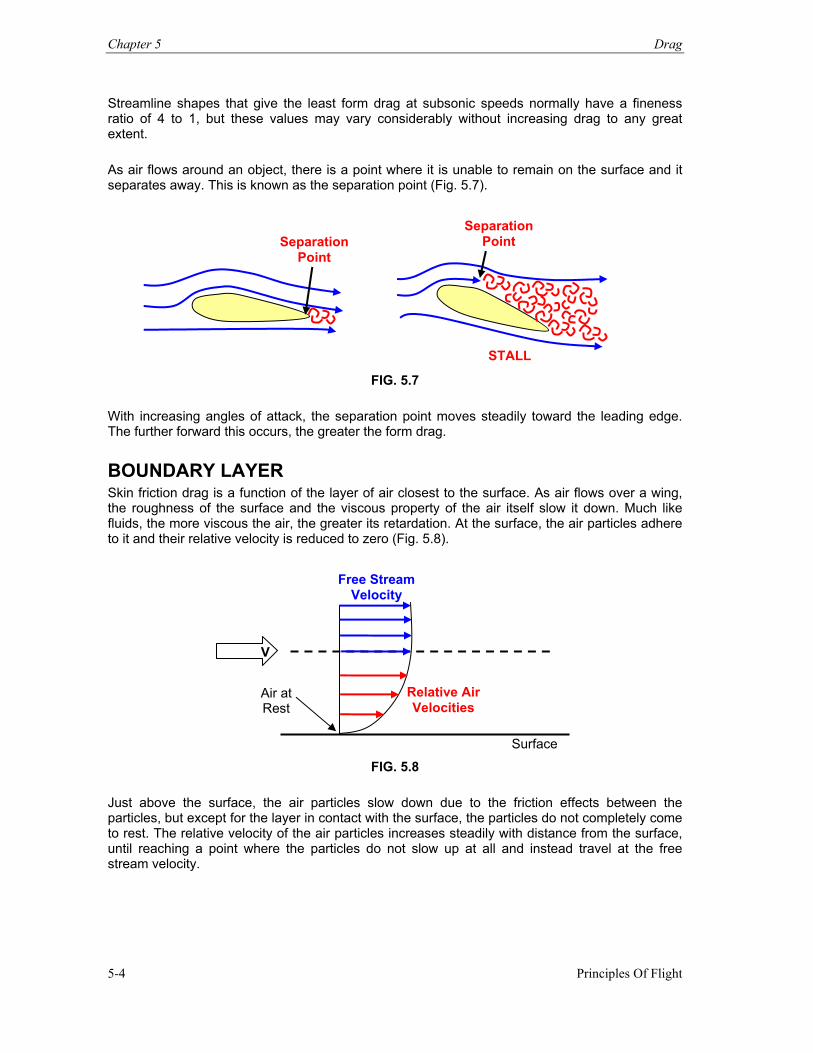
Chapter 5 Drag
Principles Of Flight 5-4
Streamline shapes that give the least form drag at subsonic speeds normally have a fineness ratio of 4 to 1, but these values may vary considerably without increasing drag to any great extent. As air flows around an object, there is a point where it is unable to remain on the surface and it separates away. This is known as the separation point (Fig. 5.7).
FIG. 5.7
With increasing angles of attack, the separation point moves steadily toward the leading edge. The further forward this occurs, the greater the form drag.
BOUNDARY LAYER Skin friction drag is a function of the layer of air closest to the surface. As air flows over a wing, the roughness of the surface and the viscous property of the air itself slow it down. Much like fluids, the more viscous the air, the greater its retardation. At the surface, the air particles adhere to it and their relative velocity is reduced to zero (Fig. 5.8).
FIG. 5.8
Just above the surface, the air particles slow down due to the friction effects between the particles, but except for the layer in contact with the surface, the particles do not completely come to rest. The relative velocity of the air particles increases steadily with distance from the surface, until reaching a point where the particles do not slow up at all and instead travel at the free stream velocity.
Separation Point
Separation Point
STALL
V
Air at Rest
Surface
Free Stream Velocity
Relative Air Velocities
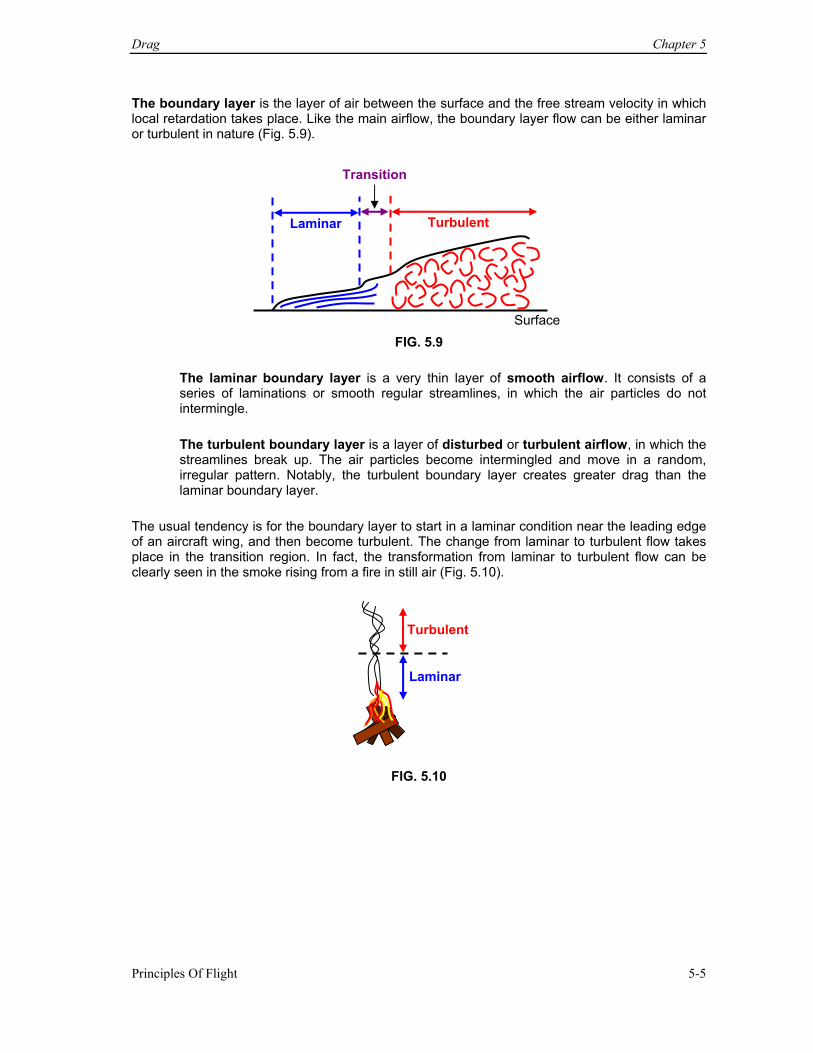
Drag Chapter 5
Principles Of Flight 5-5
The boundary layer is the layer of air between the surface and the free stream velocity in which local retardation takes place. Like the main airflow, the boundary layer flow can be either laminar or turbulent in nature (Fig. 5.9).
FIG. 5.9
The laminar boundary layer is a very thin layer of smooth airflow. It consists of a series of laminations or smooth regular streamlines, in which the air particles do not intermingle. The turbulent boundary layer is a layer of disturbed or turbulent airflow, in which the streamlines break up. The air particles become intermingled and move in a random, irregular pattern. Notably, the turbulent boundary layer creates greater drag than the laminar boundary layer.
The usual tendency is for the boundary layer to start in a laminar condition near the leading edge of an aircraft wing, and then become turbulent. The change from laminar to turbulent flow takes place in the transition region. In fact, the transformation from laminar to turbulent flow can be clearly seen in the smoke rising from a fire in still air (Fig. 5.10).
FIG. 5.10
Laminar Turbulent
Transition
Surface
Turbulent
Laminar
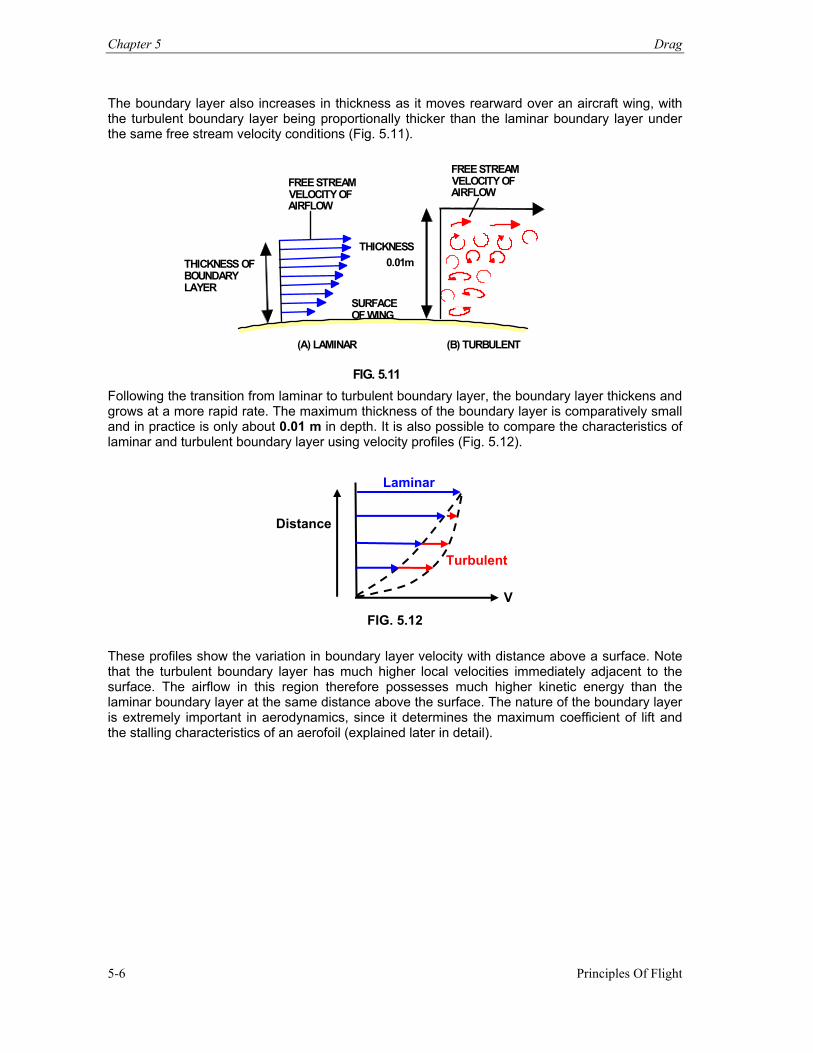
Chapter 5 Drag
Principles Of Flight 5-6
The boundary layer also increases in thickness as it moves rearward over an aircraft wing, with the turbulent boundary layer being proportionally thicker than the laminar boundary layer under the same free stream velocity conditions (Fig. 5.11).
FREE STREAMVELOCITY OFAIRFLOW
THICKNESS OF BOUNDARY LAYER
THICKNESS
(A) LAMINAR (B) TURBULENT
FREE STREAMVELOCITY OFAIRFLOW
0.01m
SURFACEOF WING
FIG. 5.11 Following the transition from laminar to turbulent boundary layer, the boundary layer thickens and grows at a more rapid rate. The maximum thickness of the boundary layer is comparatively small and in practice is only about 0.01 m in depth. It is also possible to compare the characteristics of laminar and turbulent boundary layer using velocity profiles (Fig. 5.12).
FIG. 5.12
These profiles show the variation in boundary layer velocity with distance above a surface. Note that the turbulent boundary layer has much higher local velocities immediately adjacent to the surface. The airflow in this region therefore possesses much higher kinetic energy than the laminar boundary layer at the same distance above the surface. The nature of the boundary layer is extremely important in aerodynamics, since it determines the maximum coefficient of lift and the stalling characteristics of an aerofoil (explained later in detail).
V
Distance
Turbulent
Laminar
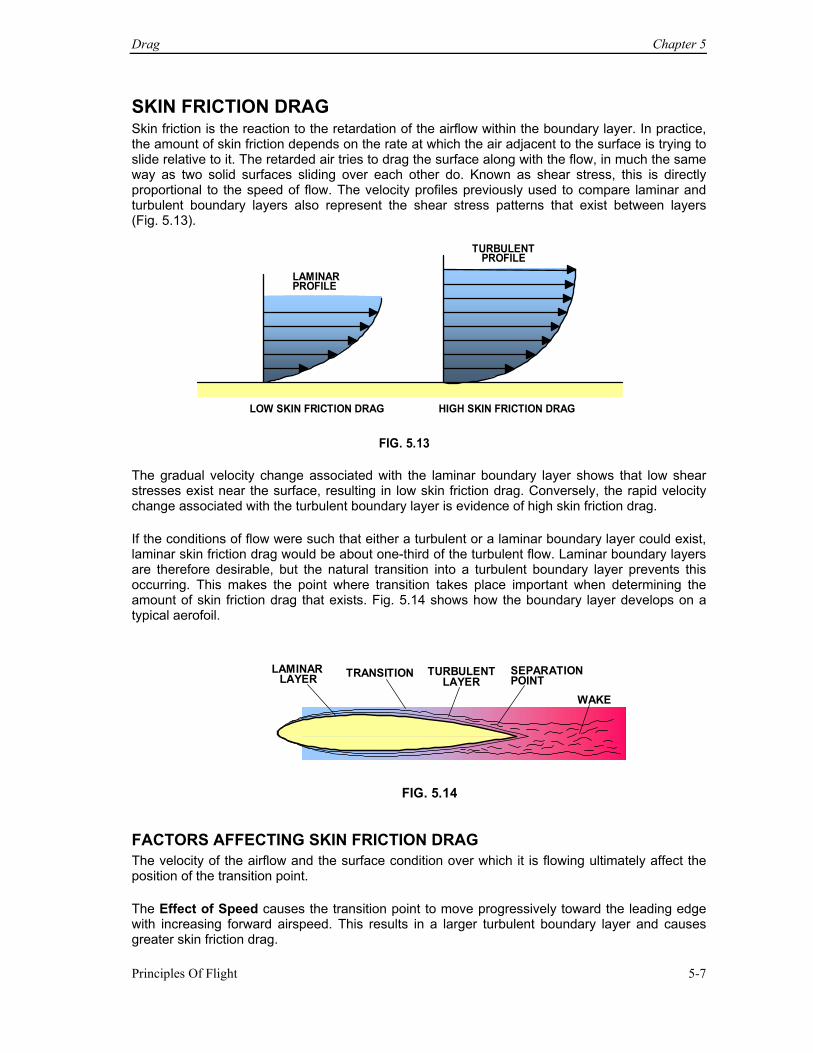
Drag Chapter 5
Principles Of Flight 5-7
SKIN FRICTION DRAG Skin friction is the reaction to the retardation of the airflow within the boundary layer. In practice, the amount of skin friction depends on the rate at which the air adjacent to the surface is trying to slide relative to it. The retarded air tries to drag the surface along with the flow, in much the same way as two solid surfaces sliding over each other do. Known as shear stress, this is directly proportional to the speed of flow. The velocity profiles previously used to compare laminar and turbulent boundary layers also represent the shear stress patterns that exist between layers (Fig. 5.13).
LAMINARPROFILE
TURBULENTPROFILE
LOW SKIN FRICTION DRAG HIGH SKIN FRICTION DRAG FIG. 5.13
The gradual velocity change associated with the laminar boundary layer shows that low shear stresses exist near the surface, resulting in low skin friction drag. Conversely, the rapid velocity change associated with the turbulent boundary layer is evidence of high skin friction drag. If the conditions of flow were such that either a turbulent or a laminar boundary layer could exist, laminar skin friction drag would be about one-third of the turbulent flow. Laminar boundary layers are therefore desirable, but the natural transition into a turbulent boundary layer prevents this occurring. This makes the point where transition takes place important when determining the amount of skin friction drag that exists. Fig. 5.14 shows how the boundary layer develops on a typical aerofoil.
WAKE SEPARATION POINT
TURBULENTLAYER
TRANSITIONLAMINAR LAYER
FIG. 5.14
FACTORS AFFECTING SKIN FRICTION DRAG The velocity of the airflow and the surface condition over which it is flowing ultimately affect the position of the transition point. The Effect of Speed causes the transition point to move progressively toward the leading edge with increasing forward airspeed. This results in a larger turbulent boundary layer and causes greater skin friction drag.
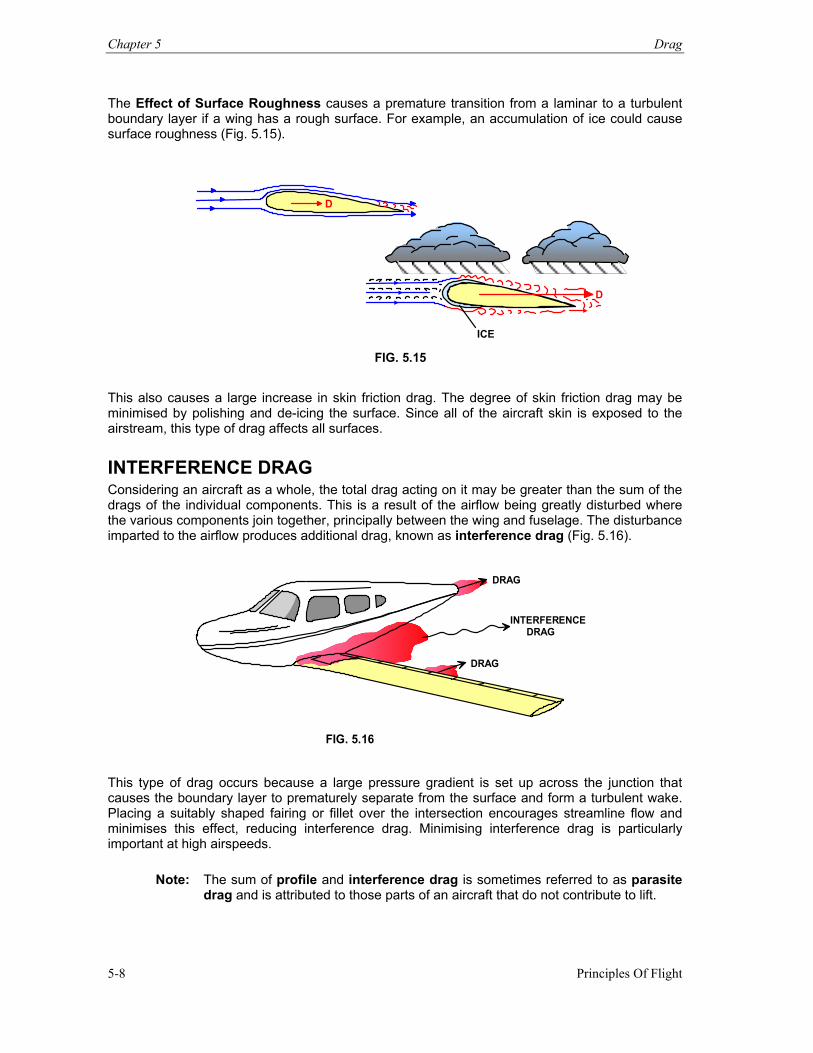
Chapter 5 Drag
Principles Of Flight 5-8
The Effect of Surface Roughness causes a premature transition from a laminar to a turbulent boundary layer if a wing has a rough surface. For example, an accumulation of ice could cause surface roughness (Fig. 5.15).
D
D ICE
FIG. 5.15
This also causes a large increase in skin friction drag. The degree of skin friction drag may be minimised by polishing and de-icing the surface. Since all of the aircraft skin is exposed to the airstream, this type of drag affects all surfaces.
INTERFERENCE DRAG Considering an aircraft as a whole, the total drag acting on it may be greater than the sum of the drags of the individual components. This is a result of the airflow being greatly disturbed where the various components join together, principally between the wing and fuselage. The disturbance imparted to the airflow produces additional drag, known as interference drag (Fig. 5.16).
INTERFERENCE
DRAG
DRAG
DRAG
FIG. 5.16
This type of drag occurs because a large pressure gradient is set up across the junction that causes the boundary layer to prematurely separate from the surface and form a turbulent wake. Placing a suitably shaped fairing or fillet over the intersection encourages streamline flow and minimises this effect, reducing interference drag. Minimising interference drag is particularly important at high airspeeds.
Note: The sum of profile and interference drag is sometimes referred to as parasite drag and is attributed to those parts of an aircraft that do not contribute to lift.
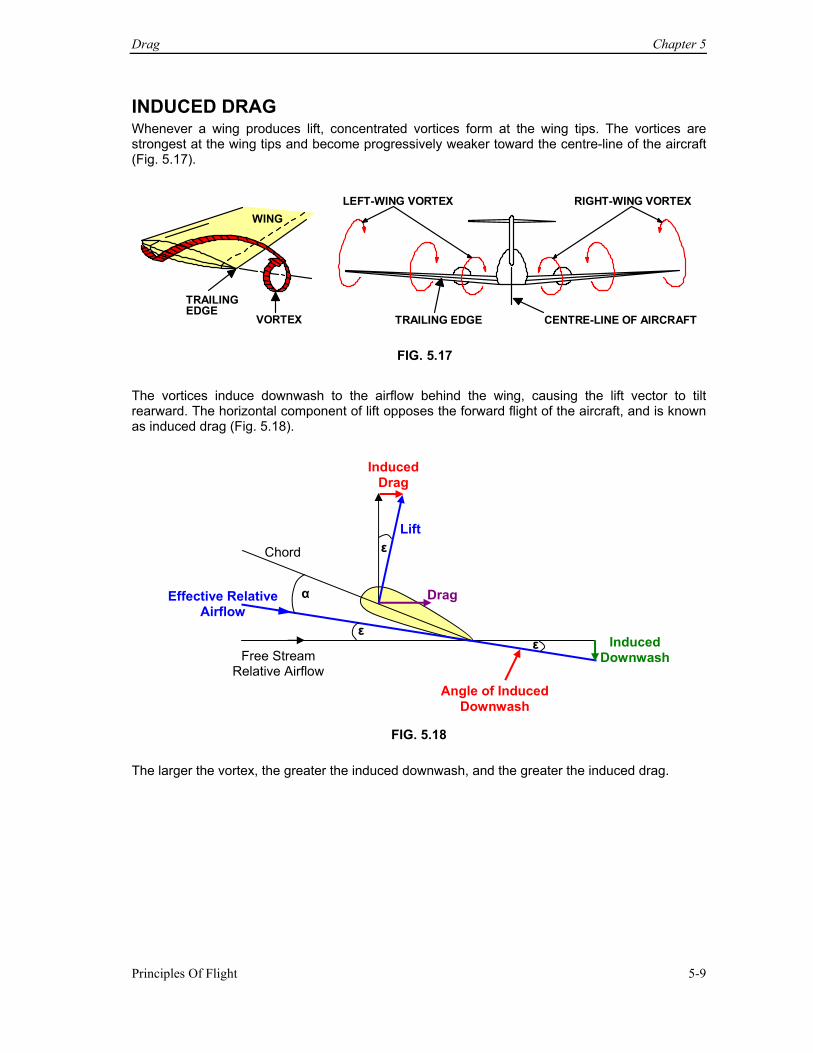
Drag Chapter 5
Principles Of Flight 5-9
INDUCED DRAG Whenever a wing produces lift, concentrated vortices form at the wing tips. The vortices are strongest at the wing tips and become progressively weaker toward the centre-line of the aircraft (Fig. 5.17).
WING
TRAILING EDGE
VORTEX
LEFT-WING VORTEX RIGHT-WING VORTEX
TRAILING EDGE CENTRE-LINE OF AIRCRAFT
FIG. 5.17 The vortices induce downwash to the airflow behind the wing, causing the lift vector to tilt rearward. The horizontal component of lift opposes the forward flight of the aircraft, and is known as induced drag (Fig. 5.18).
FIG. 5.18
The larger the vortex, the greater the induced downwash, and the greater the induced drag.
Induced Downwash
Chord
Free Stream Relative Airflow
Effective Relative Airflow
Angle of Induced Downwash
ε ε
α
ε Lift
Induced Drag
Drag
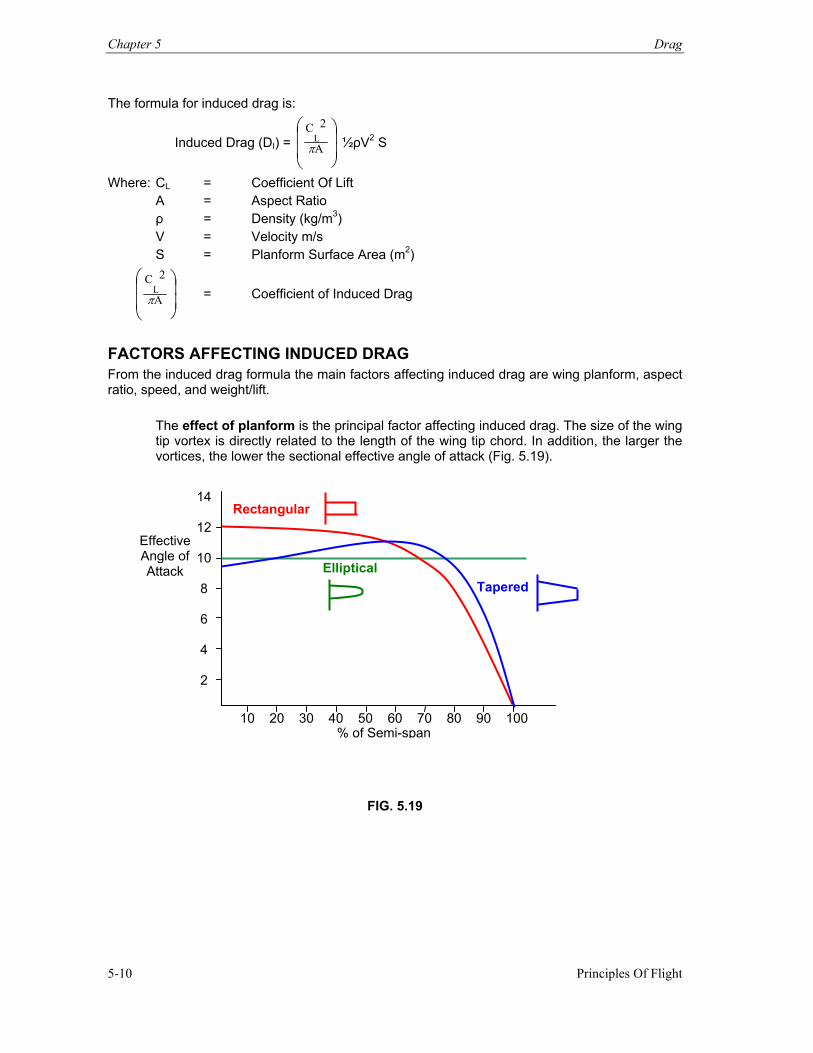
Chapter 5 Drag
Principles Of Flight 5-10
The formula for induced drag is:
Induced Drag (DI) =
A
2CLπ ½ρV2 S
Where: CL = Coefficient Of Lift A = Aspect Ratio ρ = Density (kg/m3) V = Velocity m/s S = Planform Surface Area (m2)
A
2CLπ = Coefficient of Induced Drag
FACTORS AFFECTING INDUCED DRAG From the induced drag formula the main factors affecting induced drag are wing planform, aspect ratio, speed, and weight/lift.
The effect of planform is the principal factor affecting induced drag. The size of the wing tip vortex is directly related to the length of the wing tip chord. In addition, the larger the vortices, the lower the sectional effective angle of attack (Fig. 5.19).
FIG. 5.19
14
12
10 8 6 4 2
10 20 30 40 50 60 70 80 90 100
Rectangular
Elliptical Tapered
Effective Angle of Attack
% of Semi-span
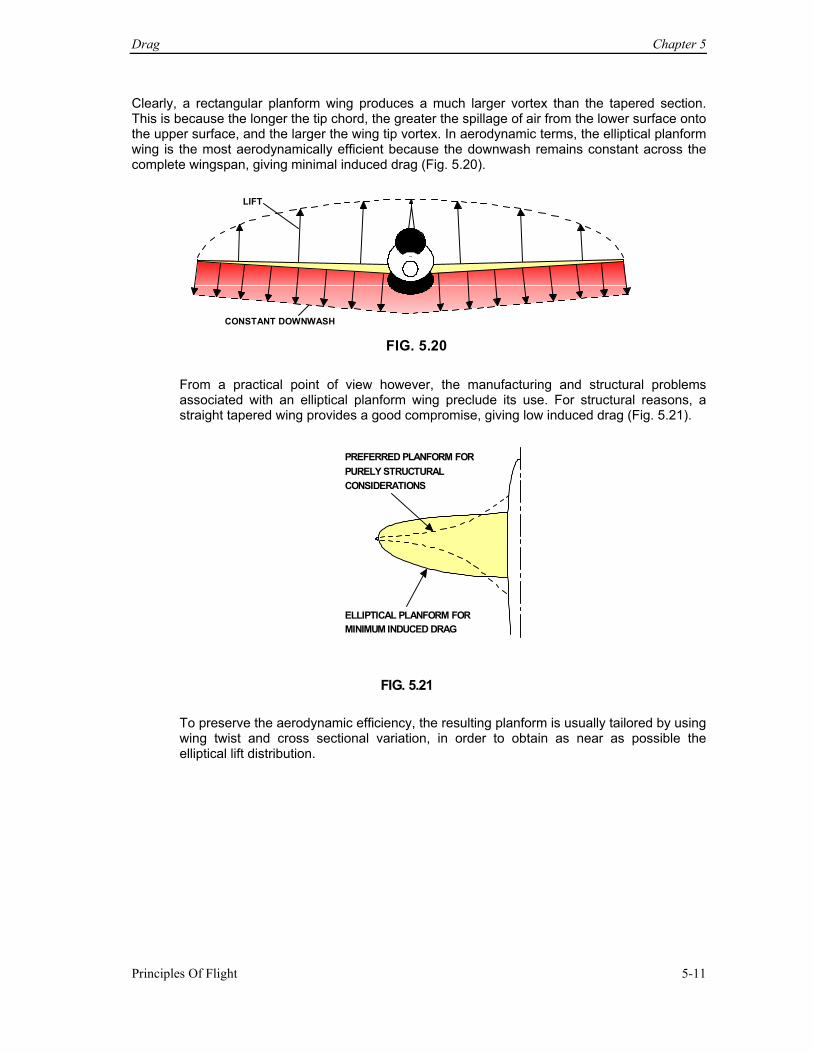
Drag Chapter 5
Principles Of Flight 5-11
Clearly, a rectangular planform wing produces a much larger vortex than the tapered section. This is because the longer the tip chord, the greater the spillage of air from the lower surface onto the upper surface, and the larger the wing tip vortex. In aerodynamic terms, the elliptical planform wing is the most aerodynamically efficient because the downwash remains constant across the complete wingspan, giving minimal induced drag (Fig. 5.20).
LIFT
CONSTANT DOWNWASH
FIG. 5.20 From a practical point of view however, the manufacturing and structural problems associated with an elliptical planform wing preclude its use. For structural reasons, a straight tapered wing provides a good compromise, giving low induced drag (Fig. 5.21).
PREFERRED PLANFORM FORPURELY STRUCTURALCONSIDERATIONS
ELLIPTICAL PLANFORM FORMINIMUM INDUCED DRAG
FIG. 5.21
To preserve the aerodynamic efficiency, the resulting planform is usually tailored by using wing twist and cross sectional variation, in order to obtain as near as possible the elliptical lift distribution.
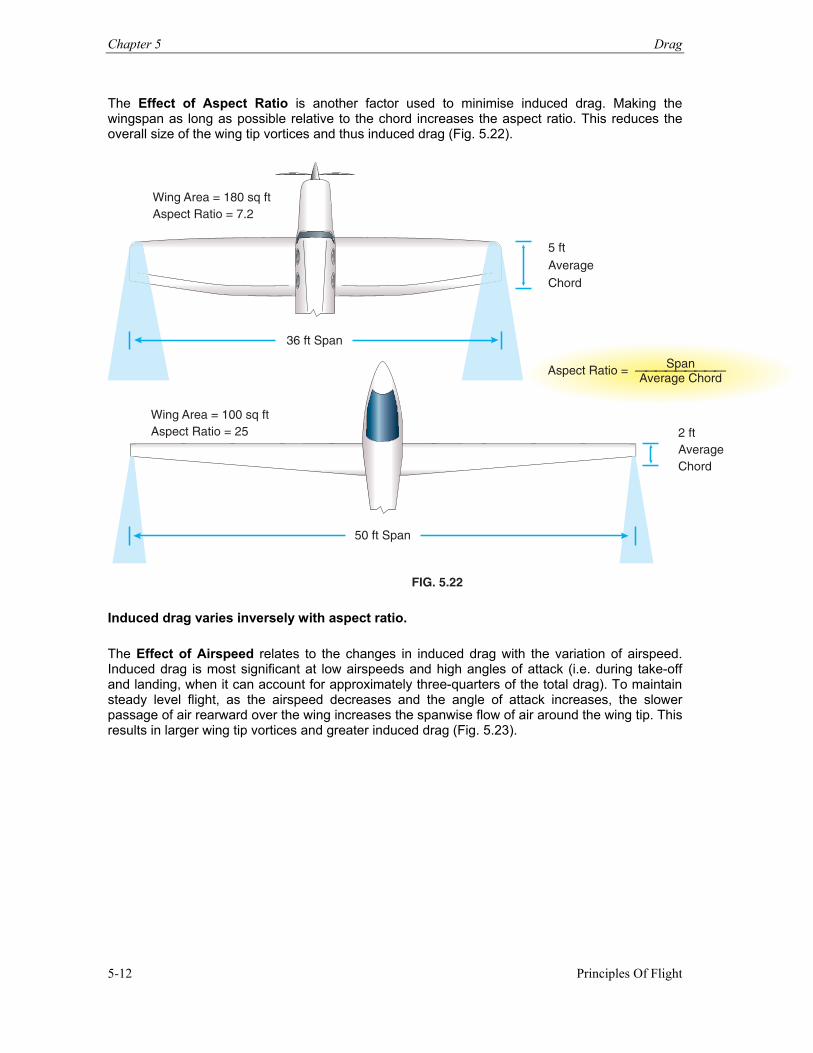
Chapter 5 Drag
Principles Of Flight 5-12
The Effect of Aspect Ratio is another factor used to minimise induced drag. Making the wingspan as long as possible relative to the chord increases the aspect ratio. This reduces the overall size of the wing tip vortices and thus induced drag (Fig. 5.22).
36 ft Span
5 ftAverageChord
2 ftAverageChord
50 ft Span
SpanAverage Chord
Aspect Ratio = —————————
Wing Area = 180 sq ftAspect Ratio = 7.2
Wing Area = 100 sq ftAspect Ratio = 25
FIG. 5.22 Induced drag varies inversely with aspect ratio. The Effect of Airspeed relates to the changes in induced drag with the variation of airspeed. Induced drag is most significant at low airspeeds and high angles of attack (i.e. during take-off and landing, when it can account for approximately three-quarters of the total drag). To maintain steady level flight, as the airspeed decreases and the angle of attack increases, the slower passage of air rearward over the wing increases the spanwise flow of air around the wing tip. This results in larger wing tip vortices and greater induced drag (Fig. 5.23).
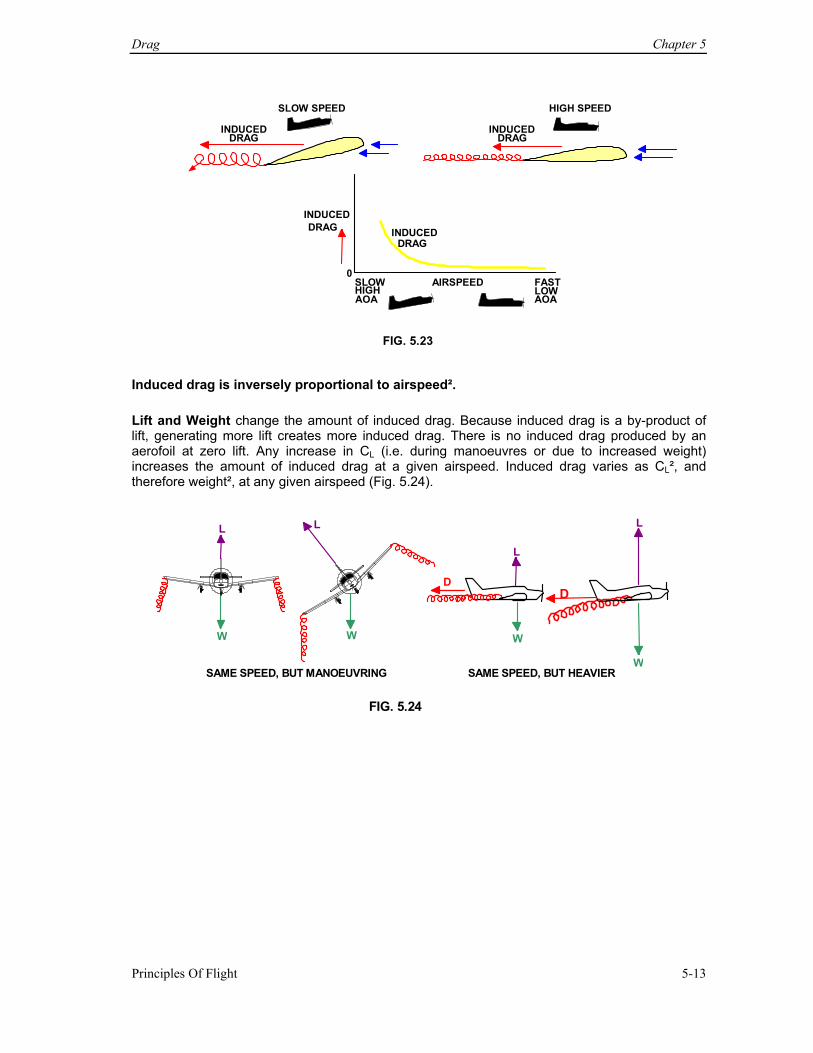
Drag Chapter 5
Principles Of Flight 5-13
INDUCED
DRAG SLOW SPEED
INDUCEDDRAG
HIGH SPEED
INDUCEDDRAG INDUCED
DRAG
AIRSPEEDSLOWHIGHAOA
FASTLOWAOA
0
FIG. 5.23
Induced drag is inversely proportional to airspeed². Lift and Weight change the amount of induced drag. Because induced drag is a by-product of lift, generating more lift creates more induced drag. There is no induced drag produced by an aerofoil at zero lift. Any increase in CL (i.e. during manoeuvres or due to increased weight) increases the amount of induced drag at a given airspeed. Induced drag varies as CL², and therefore weight², at any given airspeed (Fig. 5.24).
L
W
L
W SAME SPEED, BUT MANOEUVRING
L
W
DD
W SAME SPEED, BUT HEAVIER
L
FIG. 5.24
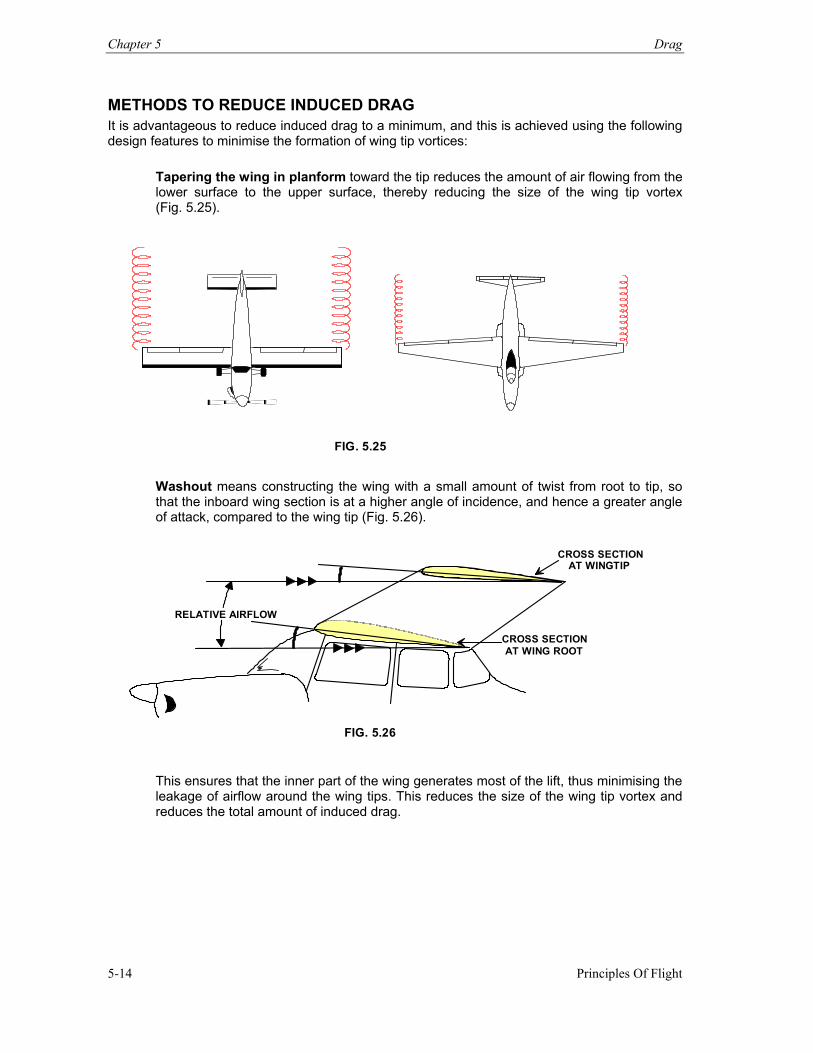
Chapter 5 Drag
Principles Of Flight 5-14
METHODS TO REDUCE INDUCED DRAG It is advantageous to reduce induced drag to a minimum, and this is achieved using the following design features to minimise the formation of wing tip vortices:
Tapering the wing in planform toward the tip reduces the amount of air flowing from the lower surface to the upper surface, thereby reducing the size of the wing tip vortex (Fig. 5.25).
FIG. 5.25
Washout means constructing the wing with a small amount of twist from root to tip, so that the inboard wing section is at a higher angle of incidence, and hence a greater angle of attack, compared to the wing tip (Fig. 5.26).
RELATIVE AIRFLOW CROSS SECTION AT WING ROOT
CROSS SECTION AT WINGTIP
FIG. 5.26
This ensures that the inner part of the wing generates most of the lift, thus minimising the leakage of airflow around the wing tips. This reduces the size of the wing tip vortex and reduces the total amount of induced drag.
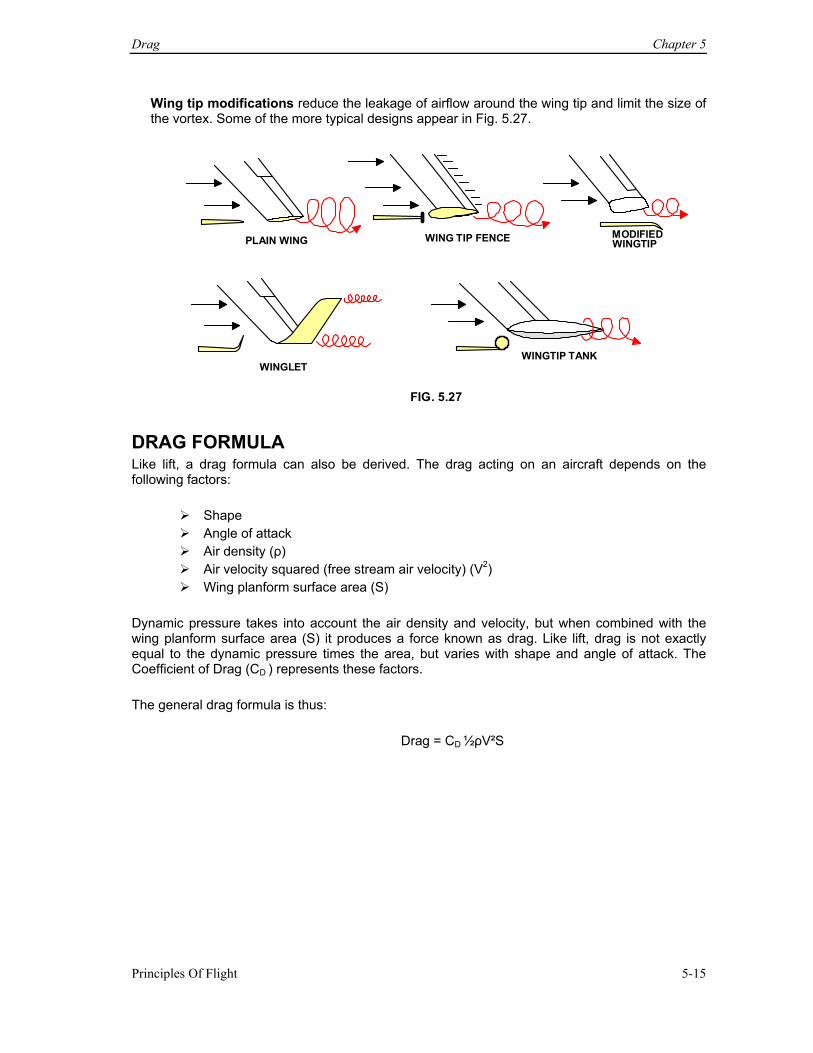
Drag Chapter 5
Principles Of Flight 5-15
Wing tip modifications reduce the leakage of airflow around the wing tip and limit the size of the vortex. Some of the more typical designs appear in Fig. 5.27.
WINGLET
PLAIN WING WING TIP FENCE MODIFIEDWINGTIP
WINGTIP TANK
FIG. 5.27
DRAG FORMULA Like lift, a drag formula can also be derived. The drag acting on an aircraft depends on the following factors:
Shape Angle of attack Air density (ρ) Air velocity squared (free stream air velocity) (V2) Wing planform surface area (S)
Dynamic pressure takes into account the air density and velocity, but when combined with the wing planform surface area (S) it produces a force known as drag. Like lift, drag is not exactly equal to the dynamic pressure times the area, but varies with shape and angle of attack. The Coefficient of Drag (CD ) represents these factors. The general drag formula is thus:
Drag = CD ½ρV²S
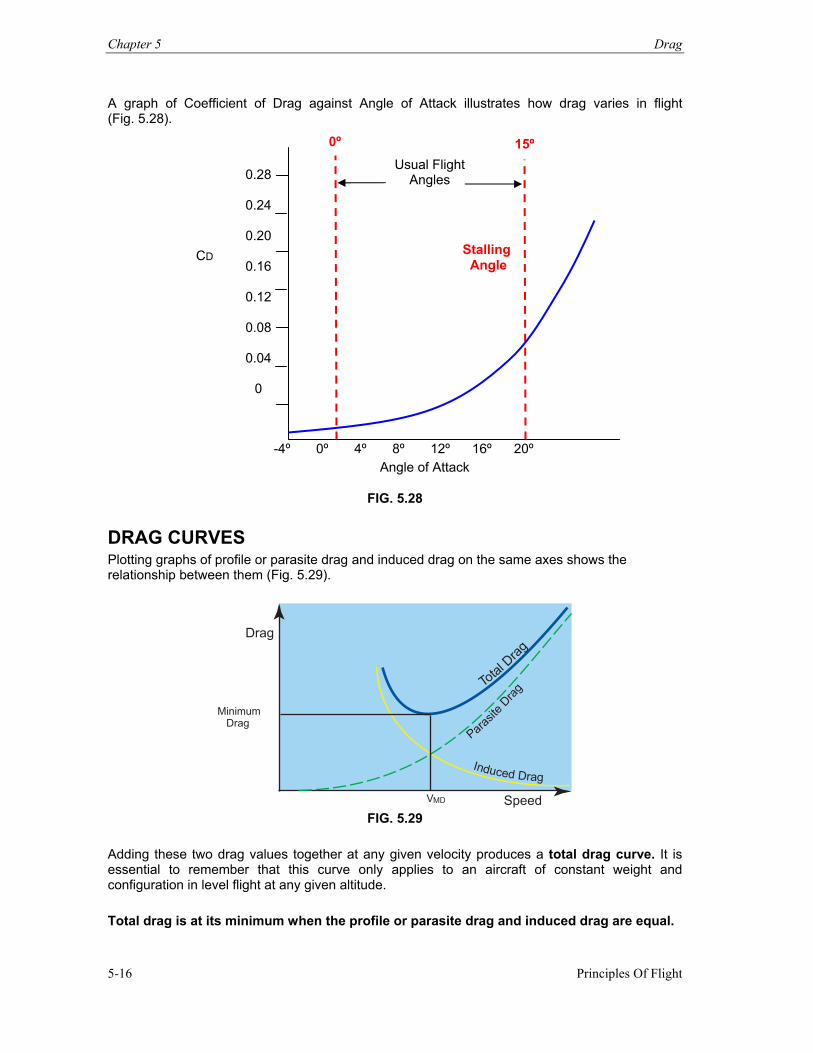
Chapter 5 Drag
Principles Of Flight 5-16
A graph of Coefficient of Drag against Angle of Attack illustrates how drag varies in flight (Fig. 5.28).
FIG. 5.28
DRAG CURVES Plotting graphs of profile or parasite drag and induced drag on the same axes shows the relationship between them (Fig. 5.29).
Tota
l Dra
g
Paras
ite D
rag
Induced Drag
Minimum Drag
VMD Speed
Drag
FIG. 5.29
Adding these two drag values together at any given velocity produces a total drag curve. It is essential to remember that this curve only applies to an aircraft of constant weight and configuration in level flight at any given altitude. Total drag is at its minimum when the profile or parasite drag and induced drag are equal.
Angle of Attack
CD Stalling Angle
0º Usual Flight
Angles 0.28
0.24
0.20
0.16
0.12
0.08
0.04 0
-4º 0º 4º 8º 12º 16º 20º
15º
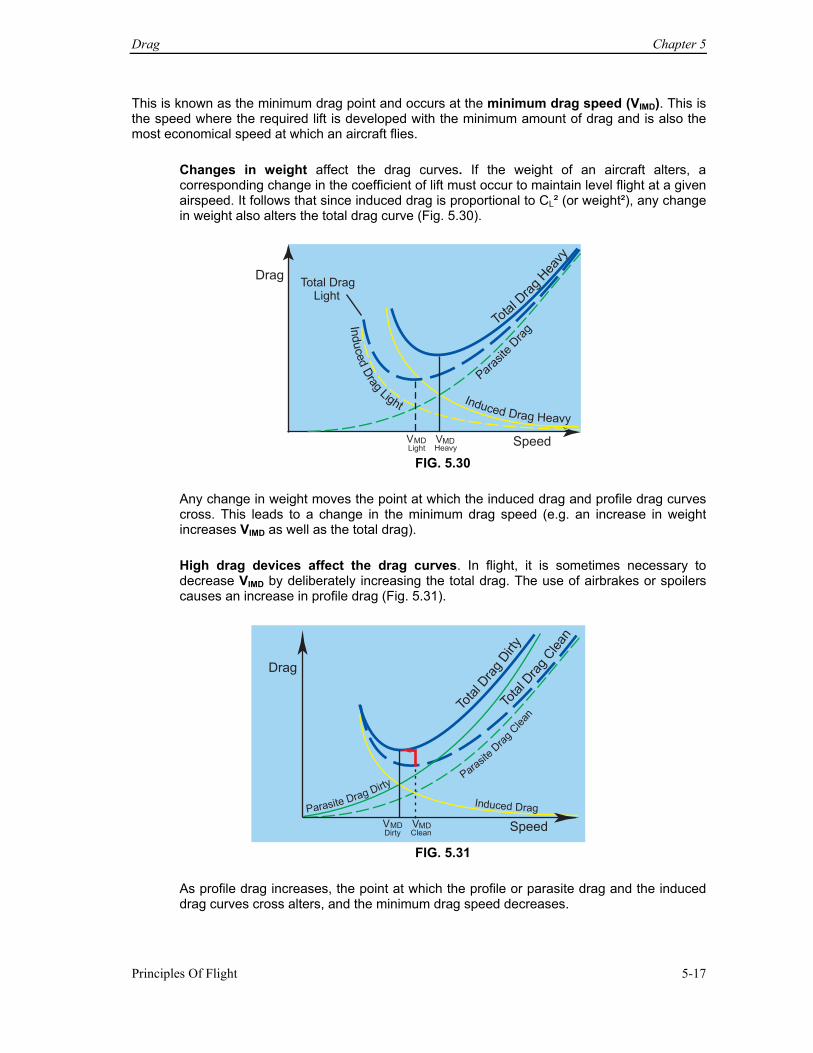
Drag Chapter 5
Principles Of Flight 5-17
This is known as the minimum drag point and occurs at the minimum drag speed (VIMD). This is the speed where the required lift is developed with the minimum amount of drag and is also the most economical speed at which an aircraft flies.
Changes in weight affect the drag curves. If the weight of an aircraft alters, a corresponding change in the coefficient of lift must occur to maintain level flight at a given airspeed. It follows that since induced drag is proportional to CL² (or weight²), any change in weight also alters the total drag curve (Fig. 5.30).
Tota
l Dra
g Hea
vy
Paras
ite D
rag
Induced Drag Heavy
Induced D
rag Light
Total Drag Light
Drag
VMD VMDHeavyLight
Speed FIG. 5.30
Any change in weight moves the point at which the induced drag and profile drag curves cross. This leads to a change in the minimum drag speed (e.g. an increase in weight increases VIMD as well as the total drag).
High drag devices affect the drag curves. In flight, it is sometimes necessary to decrease VIMD by deliberately increasing the total drag. The use of airbrakes or spoilers causes an increase in profile drag (Fig. 5.31).
Tota
l Dra
g Dirt
y
Induced DragParasite Drag DirtyPara
site
Dra
g C
lean
To
tal D
rag
Cle
an
VMD VMDCleanDirty
Speed
Drag
FIG. 5.31
As profile drag increases, the point at which the profile or parasite drag and the induced drag curves cross alters, and the minimum drag speed decreases.
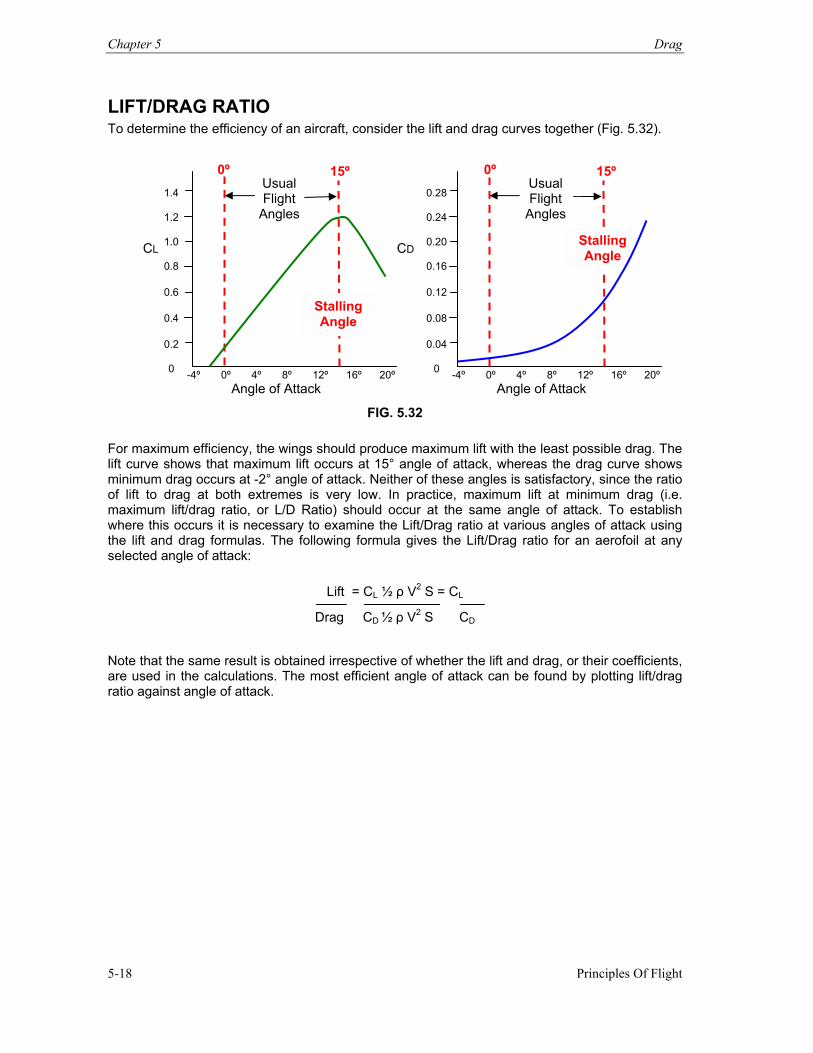
Chapter 5 Drag
Principles Of Flight 5-18
LIFT/DRAG RATIO To determine the efficiency of an aircraft, consider the lift and drag curves together (Fig. 5.32).
FIG. 5.32
For maximum efficiency, the wings should produce maximum lift with the least possible drag. The lift curve shows that maximum lift occurs at 15° angle of attack, whereas the drag curve shows minimum drag occurs at -2° angle of attack. Neither of these angles is satisfactory, since the ratio of lift to drag at both extremes is very low. In practice, maximum lift at minimum drag (i.e. maximum lift/drag ratio, or L/D Ratio) should occur at the same angle of attack. To establish where this occurs it is necessary to examine the Lift/Drag ratio at various angles of attack using the lift and drag formulas. The following formula gives the Lift/Drag ratio for an aerofoil at any selected angle of attack:
Lift = CL ½ ρ V2 S = CL
Drag CD ½ ρ V2 S CD
Note that the same result is obtained irrespective of whether the lift and drag, or their coefficients, are used in the calculations. The most efficient angle of attack can be found by plotting lift/drag ratio against angle of attack.
Angle of Attack
CD
0º Usual Flight
Angles 0.28
0.24
0.20
0.16
0.12
0.08
0.04
0 -4º 0º 4º 8º 12º 16º 20º
15º
-4º 0º 4º 8º 12º 16º 20º
Usual Flight
Angles 1.4
1.2
1.0
0.8
0.6
0.4
0.2
0
Angle of Attack
CL
0º 15º
Stalling Angle
Stalling Angle
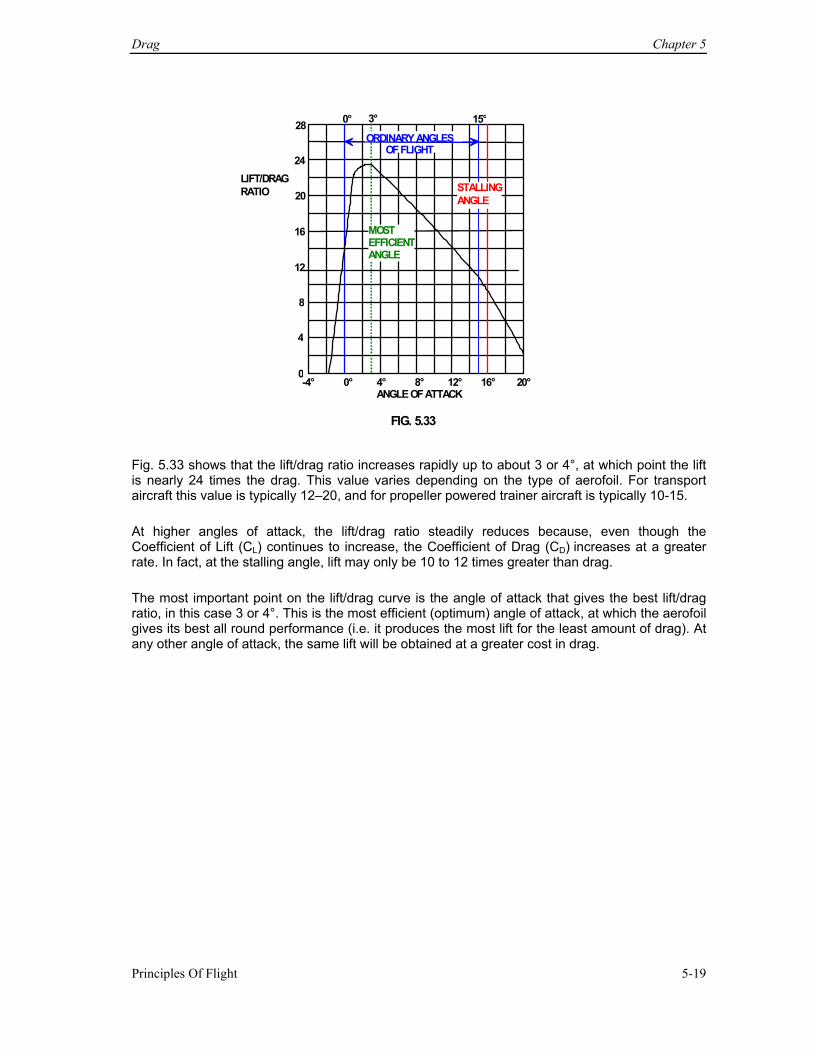
Drag Chapter 5
Principles Of Flight 5-19
28 24 20 16 12 8 4 0 -4° 0° 4° 8° 12° 16° 20°
ANGLE OF ATTACK
0° 3° 15°
LIFT/DRAG RATIO
ORDINARY ANGLESOF FLIGHT
MOST EFFICIENT ANGLE
FIG. 5.33
STALLING ANGLE
Fig. 5.33 shows that the lift/drag ratio increases rapidly up to about 3 or 4°, at which point the lift is nearly 24 times the drag. This value varies depending on the type of aerofoil. For transport aircraft this value is typically 12–20, and for propeller powered trainer aircraft is typically 10-15. At higher angles of attack, the lift/drag ratio steadily reduces because, even though the Coefficient of Lift (CL) continues to increase, the Coefficient of Drag (CD) increases at a greater rate. In fact, at the stalling angle, lift may only be 10 to 12 times greater than drag. The most important point on the lift/drag curve is the angle of attack that gives the best lift/drag ratio, in this case 3 or 4°. This is the most efficient (optimum) angle of attack, at which the aerofoil gives its best all round performance (i.e. it produces the most lift for the least amount of drag). At any other angle of attack, the same lift will be obtained at a greater cost in drag.
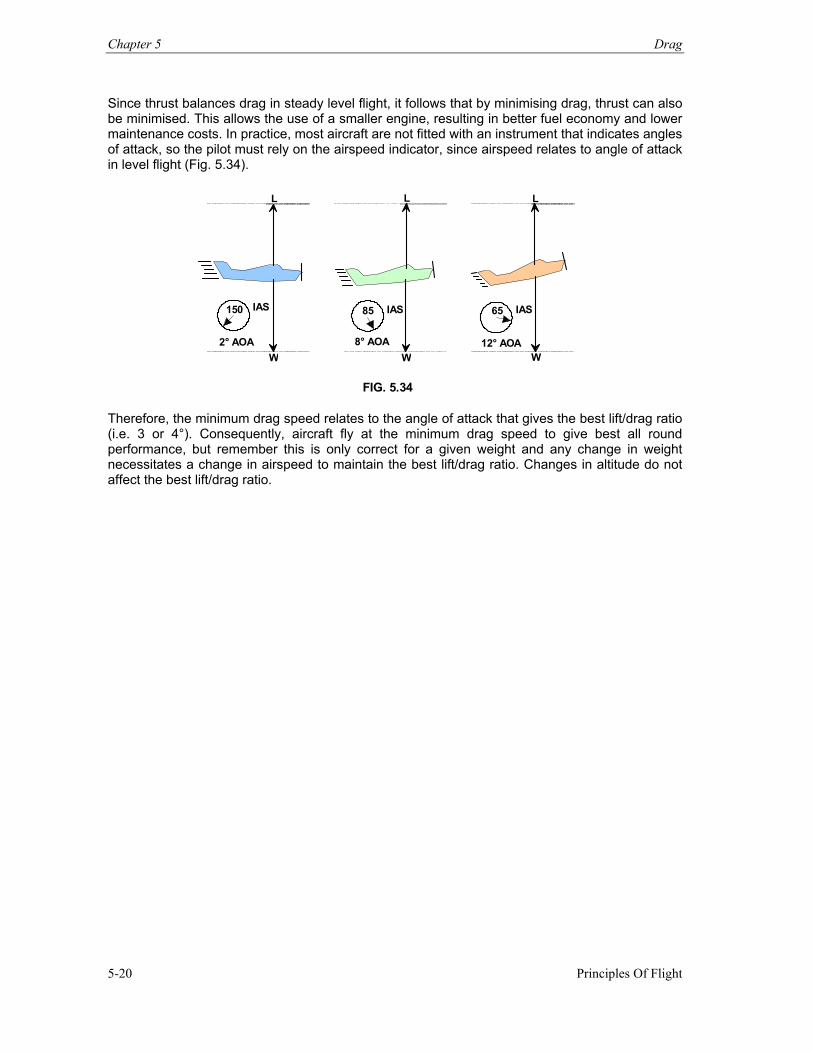
Chapter 5 Drag
Principles Of Flight 5-20
Since thrust balances drag in steady level flight, it follows that by minimising drag, thrust can also be minimised. This allows the use of a smaller engine, resulting in better fuel economy and lower maintenance costs. In practice, most aircraft are not fitted with an instrument that indicates angles of attack, so the pilot must rely on the airspeed indicator, since airspeed relates to angle of attack in level flight (Fig. 5.34).
IAS 2° AOA
150 85 IAS
8° AOA
IAS
12° AOA
65
L
W
L
W
L
W
FIG. 5.34
Therefore, the minimum drag speed relates to the angle of attack that gives the best lift/drag ratio (i.e. 3 or 4°). Consequently, aircraft fly at the minimum drag speed to give best all round performance, but remember this is only correct for a given weight and any change in weight necessitates a change in airspeed to maintain the best lift/drag ratio. Changes in altitude do not affect the best lift/drag ratio.
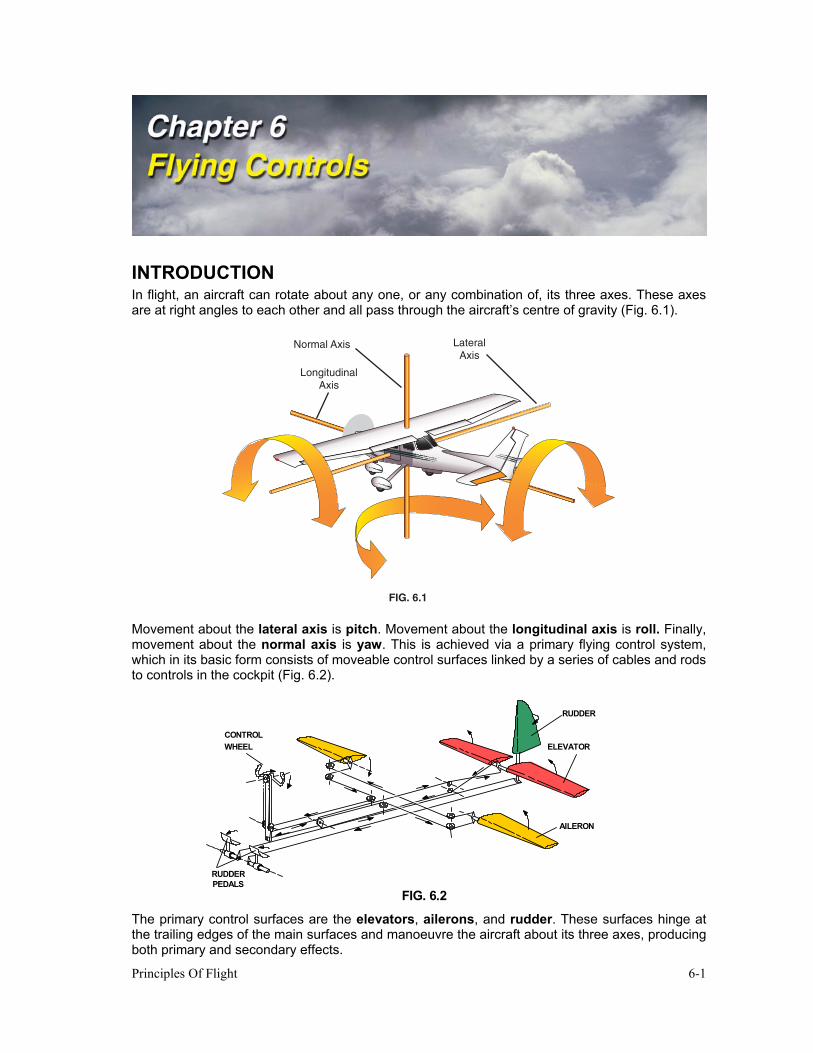
Principles Of Flight 6-1
INTRODUCTION In flight, an aircraft can rotate about any one, or any combination of, its three axes. These axes are at right angles to each other and all pass through the aircraft’s centre of gravity (Fig. 6.1).
LongitudinalAxis
LateralAxis
Normal Axis
FIG. 6.1 Movement about the lateral axis is pitch. Movement about the longitudinal axis is roll. Finally, movement about the normal axis is yaw. This is achieved via a primary flying control system, which in its basic form consists of moveable control surfaces linked by a series of cables and rods to controls in the cockpit (Fig. 6.2).
CONTROL WHEEL
RUDDERPEDALS
AILERON
ELEVATOR
RUDDER
FIG. 6.2 The primary control surfaces are the elevators, ailerons, and rudder. These surfaces hinge at the trailing edges of the main surfaces and manoeuvre the aircraft about its three axes, producing both primary and secondary effects.
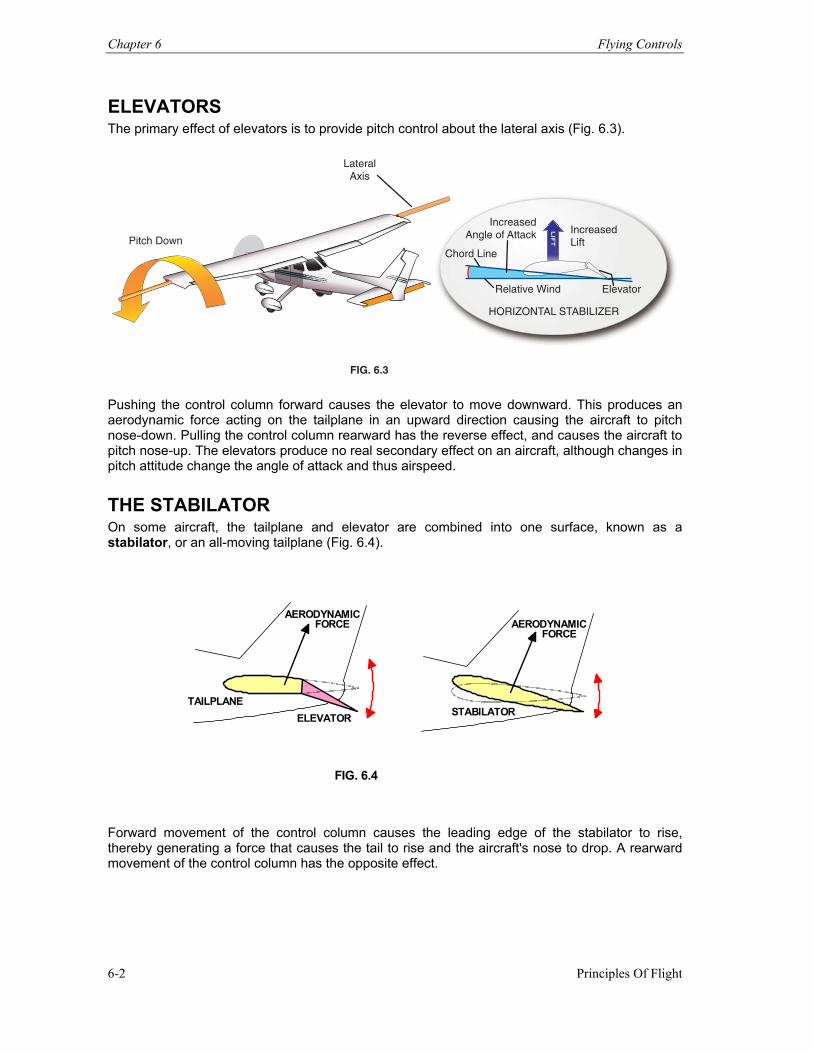
Chapter 6 Flying Controls
Principles Of Flight 6-2
ELEVATORS The primary effect of elevators is to provide pitch control about the lateral axis (Fig. 6.3).
FIG. 6.3
IncreasedAngle of Attack
ElevatorRelative Wind
Chord Line
IncreasedLift
HORIZONTAL STABILIZER
LateralAxis
Pitch Down
Pushing the control column forward causes the elevator to move downward. This produces an aerodynamic force acting on the tailplane in an upward direction causing the aircraft to pitch nose-down. Pulling the control column rearward has the reverse effect, and causes the aircraft to pitch nose-up. The elevators produce no real secondary effect on an aircraft, although changes in pitch attitude change the angle of attack and thus airspeed.
THE STABILATOR On some aircraft, the tailplane and elevator are combined into one surface, known as a stabilator, or an all-moving tailplane (Fig. 6.4).
AERODYNAMIC
AERODYNAMIC FORCEFORCE
TAILPLANE ELEVATOR STABILATOR
FIG. 6.4
Forward movement of the control column causes the leading edge of the stabilator to rise, thereby generating a force that causes the tail to rise and the aircraft's nose to drop. A rearward movement of the control column has the opposite effect.
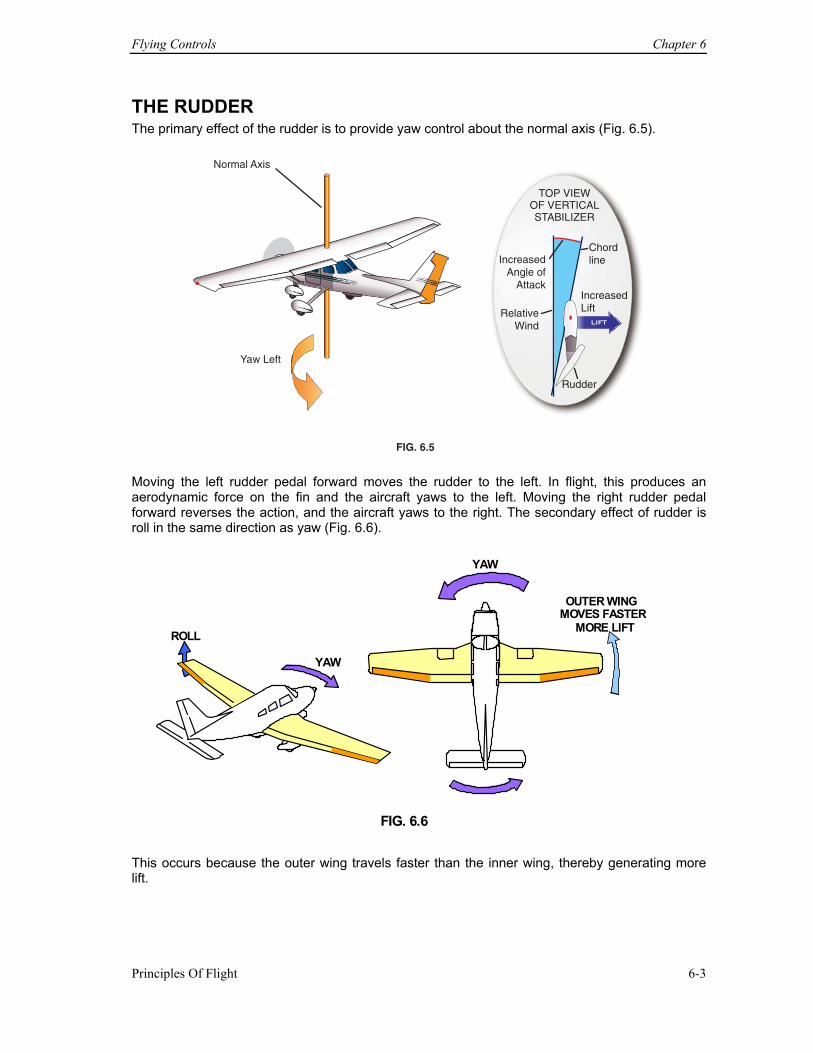
Flying Controls Chapter 6
Principles Of Flight 6-3
THE RUDDER The primary effect of the rudder is to provide yaw control about the normal axis (Fig. 6.5).
FIG. 6.5
TOP VIEWOF VERTICALSTABILIZER
IncreasedAngle of
Attack
Chordline
IncreasedLiftRelative
Wind
Rudder
Normal Axis
Yaw Left
Moving the left rudder pedal forward moves the rudder to the left. In flight, this produces an aerodynamic force on the fin and the aircraft yaws to the left. Moving the right rudder pedal forward reverses the action, and the aircraft yaws to the right. The secondary effect of rudder is roll in the same direction as yaw (Fig. 6.6).
YAW
OUTER WING MOVES FASTER
MORE LIFT YAW
ROLL
FIG. 6.6 This occurs because the outer wing travels faster than the inner wing, thereby generating more lift.
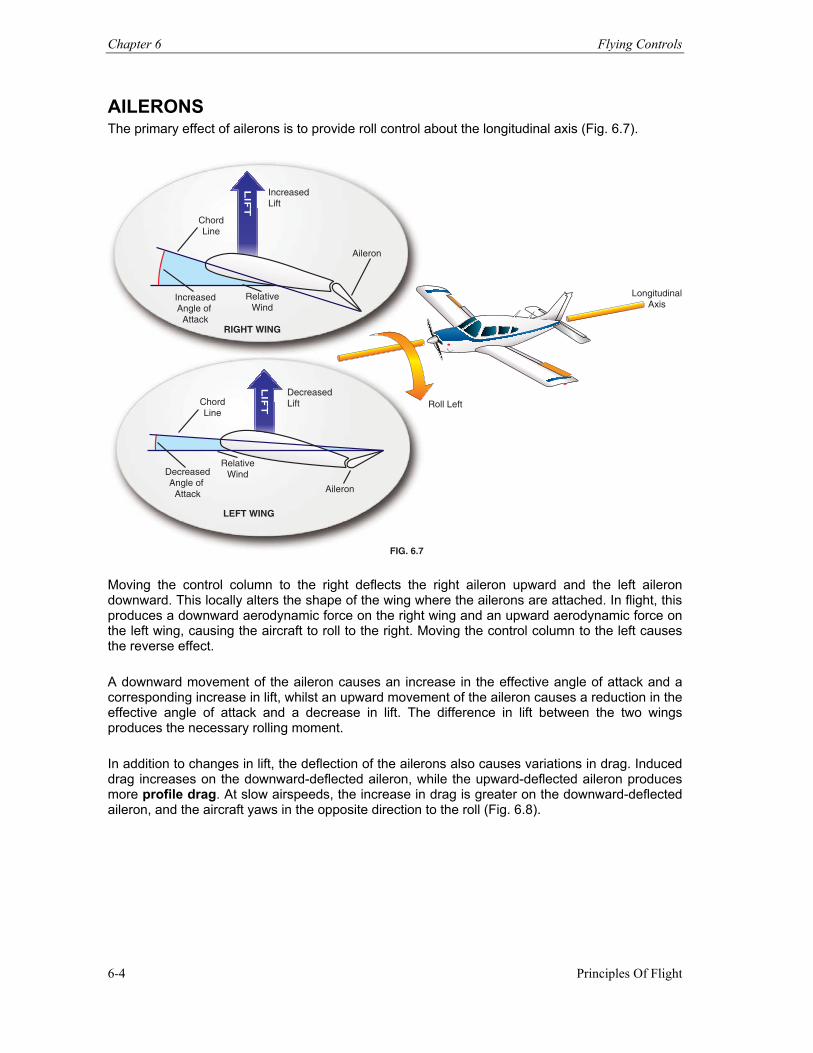
Chapter 6 Flying Controls
Principles Of Flight 6-4
AILERONS The primary effect of ailerons is to provide roll control about the longitudinal axis (Fig. 6.7).
ChordLine
DecreasedLift
Aileron
LEFT WING
DecreasedAngle of
Attack
IncreasedLift
IncreasedAngle of
Attack
Aileron
RIGHT WING
Roll Left
LongitudinalAxis
ChordLine
RelativeWind
RelativeWind
FIG. 6.7 Moving the control column to the right deflects the right aileron upward and the left aileron downward. This locally alters the shape of the wing where the ailerons are attached. In flight, this produces a downward aerodynamic force on the right wing and an upward aerodynamic force on the left wing, causing the aircraft to roll to the right. Moving the control column to the left causes the reverse effect. A downward movement of the aileron causes an increase in the effective angle of attack and a corresponding increase in lift, whilst an upward movement of the aileron causes a reduction in the effective angle of attack and a decrease in lift. The difference in lift between the two wings produces the necessary rolling moment. In addition to changes in lift, the deflection of the ailerons also causes variations in drag. Induced drag increases on the downward-deflected aileron, while the upward-deflected aileron produces more profile drag. At slow airspeeds, the increase in drag is greater on the downward-deflected aileron, and the aircraft yaws in the opposite direction to the roll (Fig. 6.8).
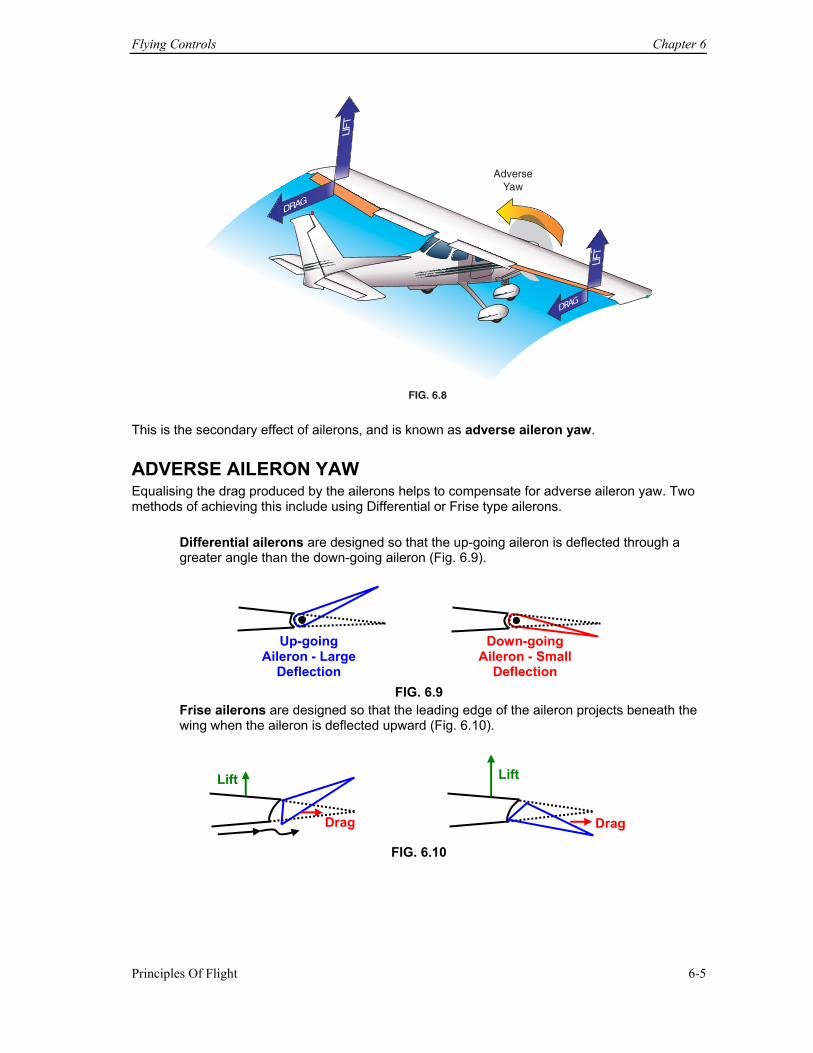
Flying Controls Chapter 6
Principles Of Flight 6-5
AdverseYaw
LIFT
LIFT
DRAG
DRAG
FIG. 6.8
This is the secondary effect of ailerons, and is known as adverse aileron yaw.
ADVERSE AILERON YAW Equalising the drag produced by the ailerons helps to compensate for adverse aileron yaw. Two methods of achieving this include using Differential or Frise type ailerons.
Differential ailerons are designed so that the up-going aileron is deflected through a greater angle than the down-going aileron (Fig. 6.9).
FIG. 6.9
Frise ailerons are designed so that the leading edge of the aileron projects beneath the wing when the aileron is deflected upward (Fig. 6.10).
FIG. 6.10
Up-going Aileron - Large
Deflection
Down-going Aileron - Small
Deflection
Drag Drag
Lift Lift
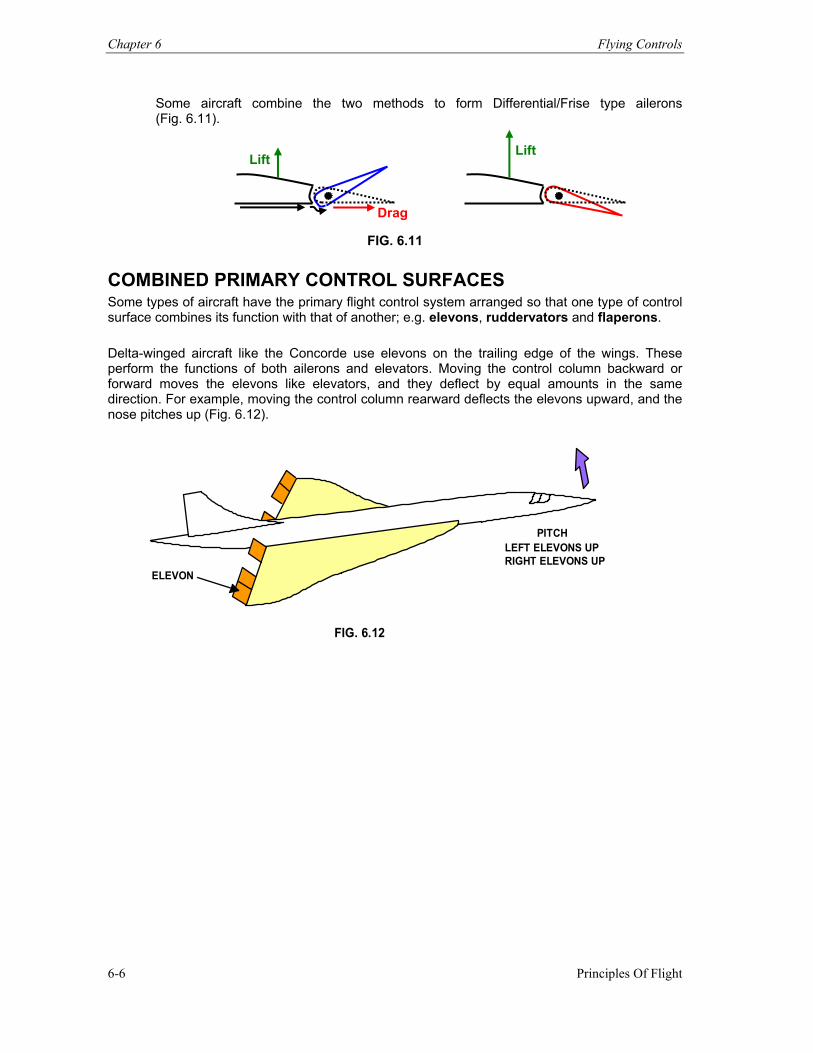
Chapter 6 Flying Controls
Principles Of Flight 6-6
Some aircraft combine the two methods to form Differential/Frise type ailerons (Fig. 6.11).
FIG. 6.11
COMBINED PRIMARY CONTROL SURFACES Some types of aircraft have the primary flight control system arranged so that one type of control surface combines its function with that of another; e.g. elevons, ruddervators and flaperons.
Delta-winged aircraft like the Concorde use elevons on the trailing edge of the wings. These perform the functions of both ailerons and elevators. Moving the control column backward or forward moves the elevons like elevators, and they deflect by equal amounts in the same direction. For example, moving the control column rearward deflects the elevons upward, and the nose pitches up (Fig. 6.12).
ELEVON PITCH
LEFT ELEVONS UP RIGHT ELEVONS UP
FIG. 6.12
Lift Lift
Drag
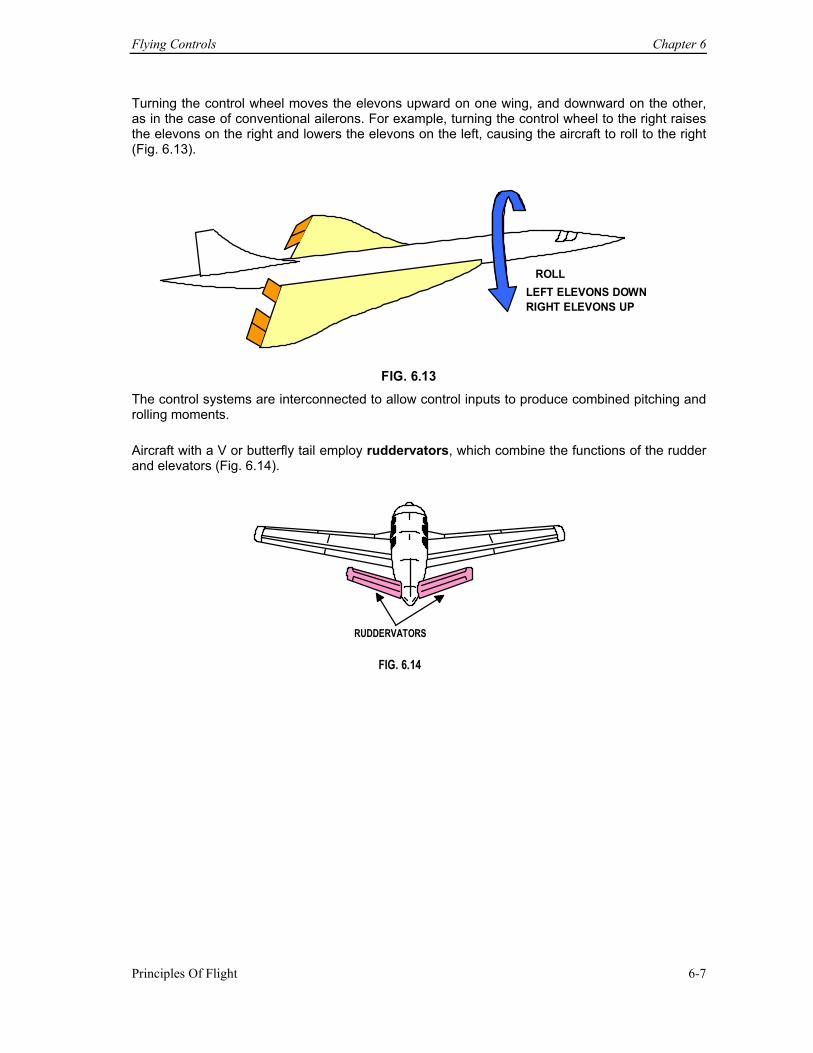
Flying Controls Chapter 6
Principles Of Flight 6-7
Turning the control wheel moves the elevons upward on one wing, and downward on the other, as in the case of conventional ailerons. For example, turning the control wheel to the right raises the elevons on the right and lowers the elevons on the left, causing the aircraft to roll to the right (Fig. 6.13).
ROLLLEFT ELEVONS DOWN RIGHT ELEVONS UP
FIG. 6.13 The control systems are interconnected to allow control inputs to produce combined pitching and rolling moments. Aircraft with a V or butterfly tail employ ruddervators, which combine the functions of the rudder and elevators (Fig. 6.14).
FIG. 6.14
RUDDERVATORS
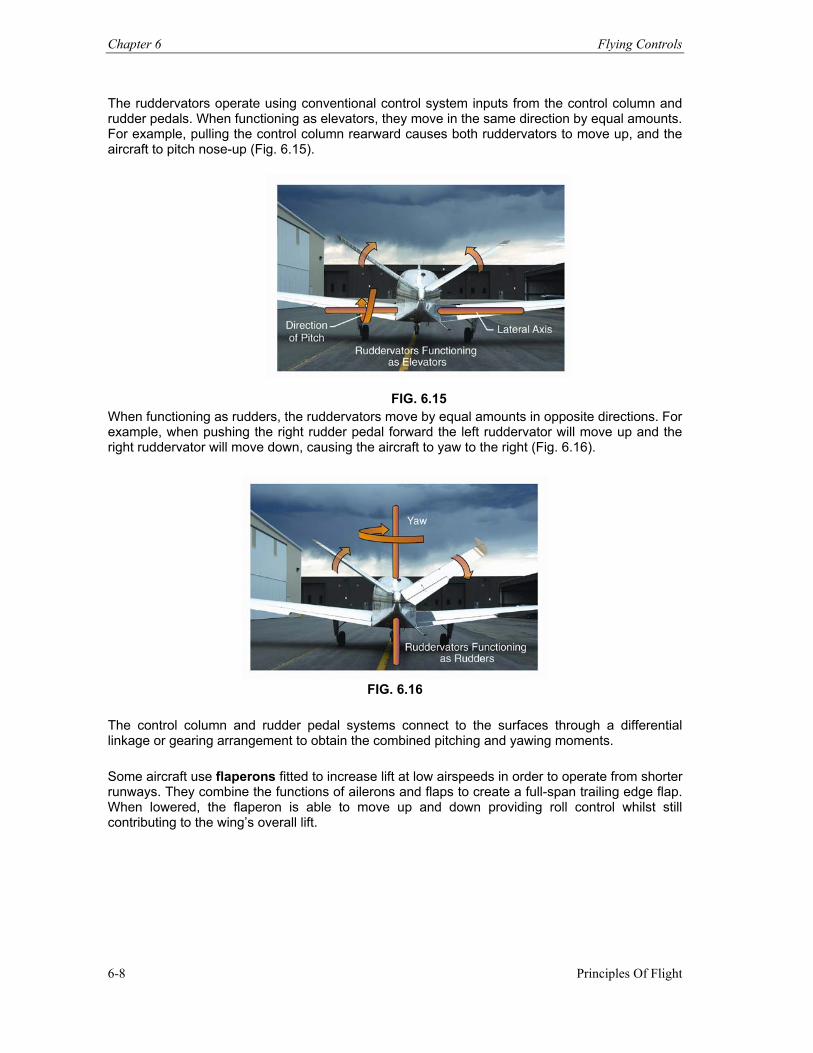
Chapter 6 Flying Controls
Principles Of Flight 6-8
The ruddervators operate using conventional control system inputs from the control column and rudder pedals. When functioning as elevators, they move in the same direction by equal amounts. For example, pulling the control column rearward causes both ruddervators to move up, and the aircraft to pitch nose-up (Fig. 6.15).
FIG. 6.15 When functioning as rudders, the ruddervators move by equal amounts in opposite directions. For example, when pushing the right rudder pedal forward the left ruddervator will move up and the right ruddervator will move down, causing the aircraft to yaw to the right (Fig. 6.16).
FIG. 6.16
The control column and rudder pedal systems connect to the surfaces through a differential linkage or gearing arrangement to obtain the combined pitching and yawing moments.
Some aircraft use flaperons fitted to increase lift at low airspeeds in order to operate from shorter runways. They combine the functions of ailerons and flaps to create a full-span trailing edge flap. When lowered, the flaperon is able to move up and down providing roll control whilst still contributing to the wing’s overall lift.
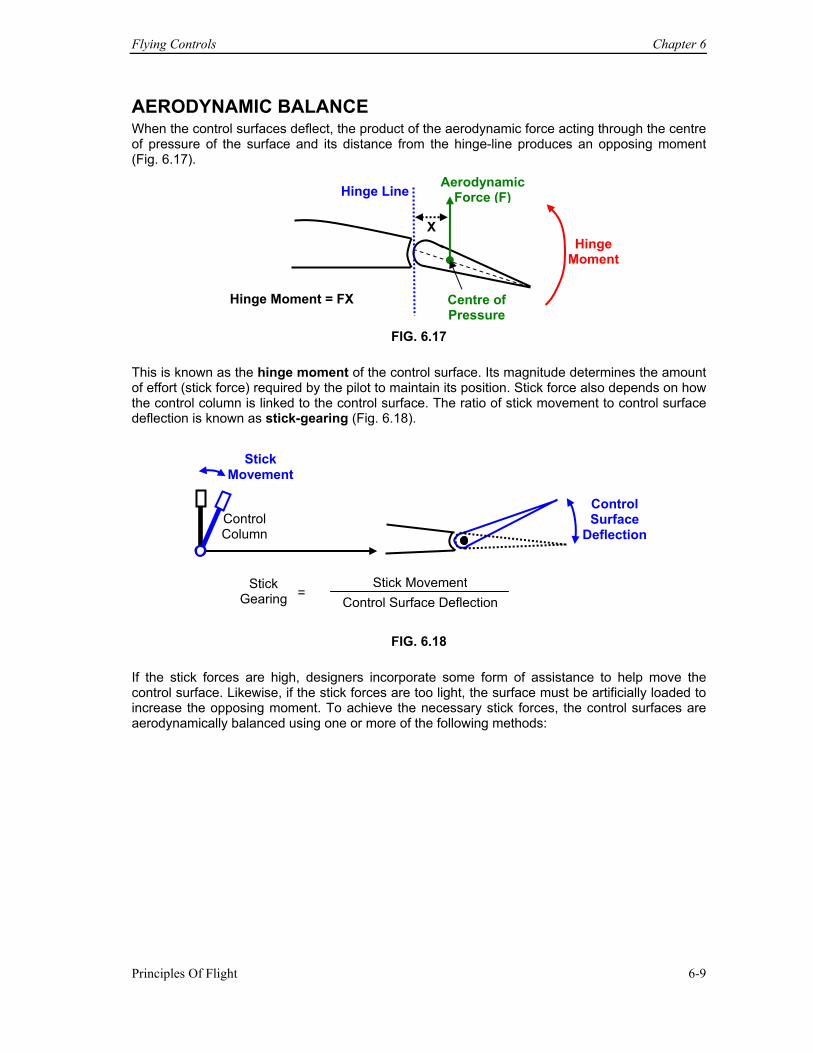
Flying Controls Chapter 6
Principles Of Flight 6-9
AERODYNAMIC BALANCE When the control surfaces deflect, the product of the aerodynamic force acting through the centre of pressure of the surface and its distance from the hinge-line produces an opposing moment (Fig. 6.17).
FIG. 6.17
This is known as the hinge moment of the control surface. Its magnitude determines the amount of effort (stick force) required by the pilot to maintain its position. Stick force also depends on how the control column is linked to the control surface. The ratio of stick movement to control surface deflection is known as stick-gearing (Fig. 6.18).
FIG. 6.18 If the stick forces are high, designers incorporate some form of assistance to help move the control surface. Likewise, if the stick forces are too light, the surface must be artificially loaded to increase the opposing moment. To achieve the necessary stick forces, the control surfaces are aerodynamically balanced using one or more of the following methods:
Aerodynamic Force (F)
Centre of Pressure
X
Hinge Line
Hinge Moment
Hinge Moment = FX
Control Column
Stick Movement
Control Surface
Deflection
Stick Gearing =
Stick MovementControl Surface Deflection
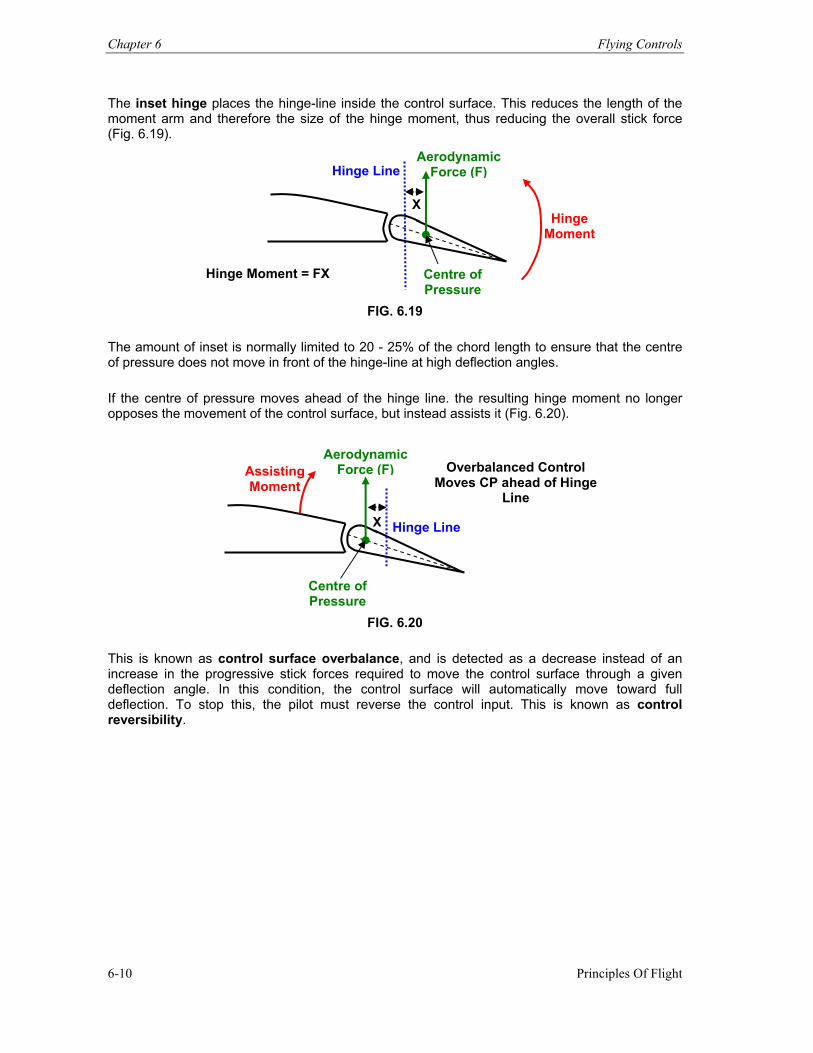
Chapter 6 Flying Controls
Principles Of Flight 6-10
The inset hinge places the hinge-line inside the control surface. This reduces the length of the moment arm and therefore the size of the hinge moment, thus reducing the overall stick force (Fig. 6.19).
FIG. 6.19
The amount of inset is normally limited to 20 - 25% of the chord length to ensure that the centre of pressure does not move in front of the hinge-line at high deflection angles. If the centre of pressure moves ahead of the hinge line. the resulting hinge moment no longer opposes the movement of the control surface, but instead assists it (Fig. 6.20).
FIG. 6.20
This is known as control surface overbalance, and is detected as a decrease instead of an increase in the progressive stick forces required to move the control surface through a given deflection angle. In this condition, the control surface will automatically move toward full deflection. To stop this, the pilot must reverse the control input. This is known as control reversibility.
Aerodynamic Force (F)
Centre of Pressure
X
Hinge Line
Hinge Moment
Hinge Moment = FX
Aerodynamic Force (F)
Centre of Pressure
X Hinge Line
Assisting Moment
Overbalanced Control Moves CP ahead of Hinge
Line
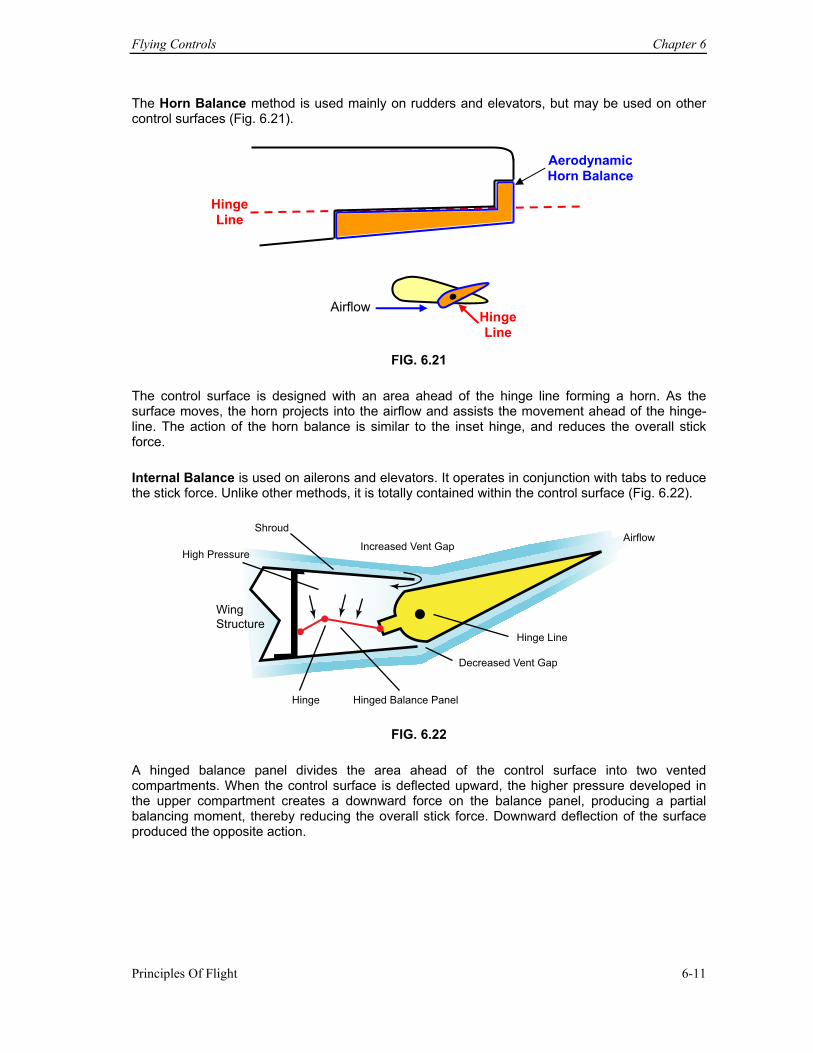
Flying Controls Chapter 6
Principles Of Flight 6-11
The Horn Balance method is used mainly on rudders and elevators, but may be used on other control surfaces (Fig. 6.21).
FIG. 6.21
The control surface is designed with an area ahead of the hinge line forming a horn. As the surface moves, the horn projects into the airflow and assists the movement ahead of the hinge-line. The action of the horn balance is similar to the inset hinge, and reduces the overall stick force. Internal Balance is used on ailerons and elevators. It operates in conjunction with tabs to reduce the stick force. Unlike other methods, it is totally contained within the control surface (Fig. 6.22).
Airflow
High Pressure
Shroud
Increased Vent Gap
Hinge Line
Decreased Vent Gap
Hinged Balance PanelHinge
Wing
Structure
FIG. 6.22 A hinged balance panel divides the area ahead of the control surface into two vented compartments. When the control surface is deflected upward, the higher pressure developed in the upper compartment creates a downward force on the balance panel, producing a partial balancing moment, thereby reducing the overall stick force. Downward deflection of the surface produced the opposite action.
Hinge Line
Aerodynamic Horn Balance
Hinge Line
Airflow
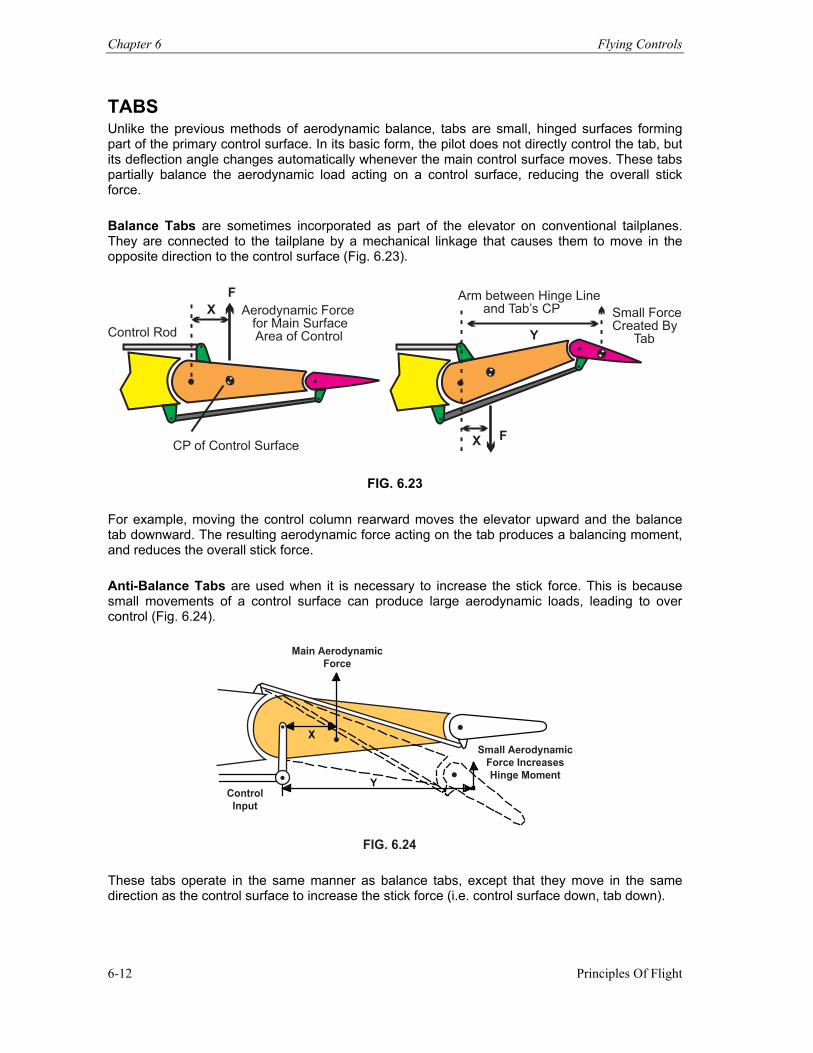
Chapter 6 Flying Controls
Principles Of Flight 6-12
TABS Unlike the previous methods of aerodynamic balance, tabs are small, hinged surfaces forming part of the primary control surface. In its basic form, the pilot does not directly control the tab, but its deflection angle changes automatically whenever the main control surface moves. These tabs partially balance the aerodynamic load acting on a control surface, reducing the overall stick force. Balance Tabs are sometimes incorporated as part of the elevator on conventional tailplanes. They are connected to the tailplane by a mechanical linkage that causes them to move in the opposite direction to the control surface (Fig. 6.23).
X F
Y
Arm between Hinge Line and Tab’s CP Small Force
Created By Tab
X
CP of Control Surface
Control Rod
F
Aerodynamic Force for Main Surface Area of Control
FIG. 6.23 For example, moving the control column rearward moves the elevator upward and the balance tab downward. The resulting aerodynamic force acting on the tab produces a balancing moment, and reduces the overall stick force. Anti-Balance Tabs are used when it is necessary to increase the stick force. This is because small movements of a control surface can produce large aerodynamic loads, leading to over control (Fig. 6.24).
X
Y
Main Aerodynamic
Force
Control
Input
Small Aerodynamic
Force Increases
Hinge Moment
FIG. 6.24 These tabs operate in the same manner as balance tabs, except that they move in the same direction as the control surface to increase the stick force (i.e. control surface down, tab down).
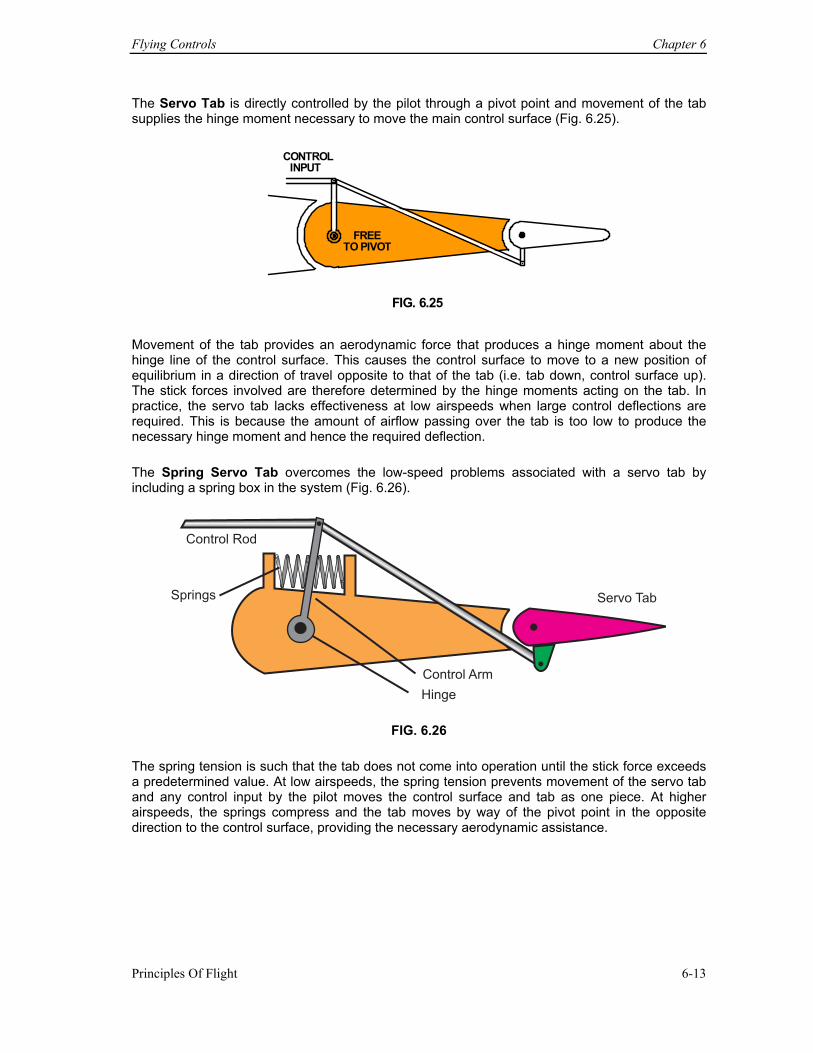
Flying Controls Chapter 6
Principles Of Flight 6-13
The Servo Tab is directly controlled by the pilot through a pivot point and movement of the tab supplies the hinge moment necessary to move the main control surface (Fig. 6.25).
FREETO PIVOT
CONTROLINPUT
FIG. 6.25
Movement of the tab provides an aerodynamic force that produces a hinge moment about the hinge line of the control surface. This causes the control surface to move to a new position of equilibrium in a direction of travel opposite to that of the tab (i.e. tab down, control surface up). The stick forces involved are therefore determined by the hinge moments acting on the tab. In practice, the servo tab lacks effectiveness at low airspeeds when large control deflections are required. This is because the amount of airflow passing over the tab is too low to produce the necessary hinge moment and hence the required deflection. The Spring Servo Tab overcomes the low-speed problems associated with a servo tab by including a spring box in the system (Fig. 6.26).
Hinge
Control Arm
Springs Servo Tab
Control Rod
FIG. 6.26 The spring tension is such that the tab does not come into operation until the stick force exceeds a predetermined value. At low airspeeds, the spring tension prevents movement of the servo tab and any control input by the pilot moves the control surface and tab as one piece. At higher airspeeds, the springs compress and the tab moves by way of the pivot point in the opposite direction to the control surface, providing the necessary aerodynamic assistance.
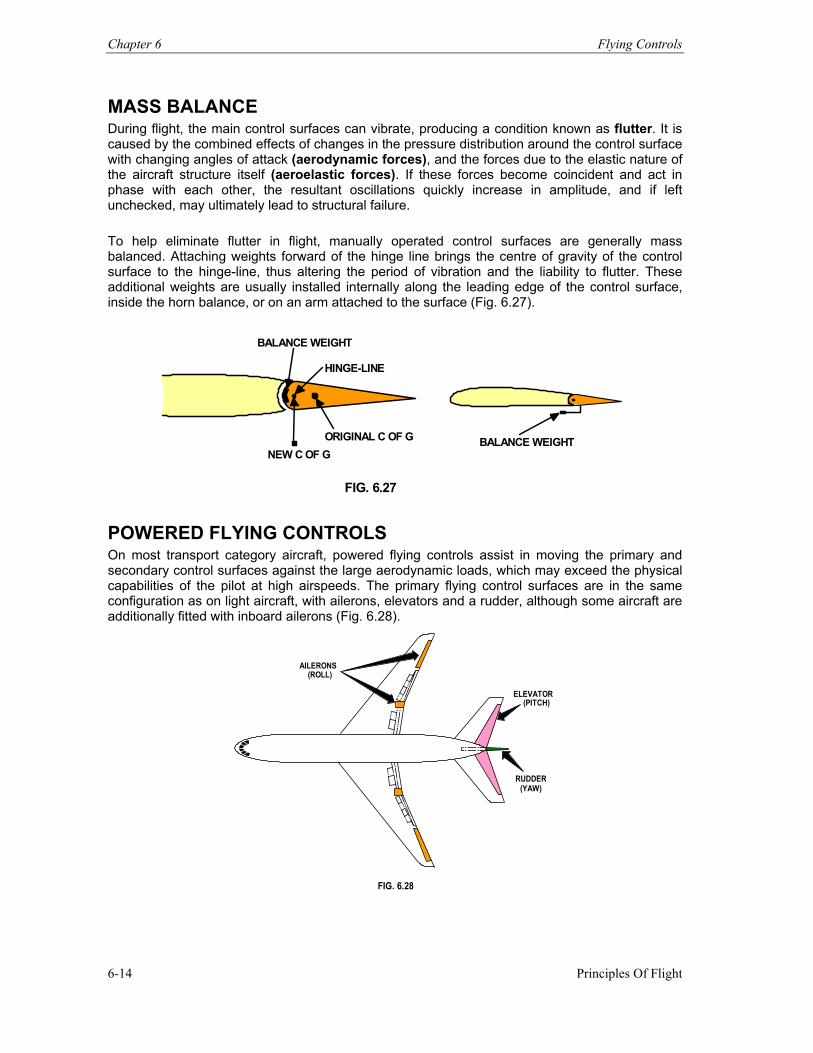
Chapter 6 Flying Controls
Principles Of Flight 6-14
MASS BALANCE During flight, the main control surfaces can vibrate, producing a condition known as flutter. It is caused by the combined effects of changes in the pressure distribution around the control surface with changing angles of attack (aerodynamic forces), and the forces due to the elastic nature of the aircraft structure itself (aeroelastic forces). If these forces become coincident and act in phase with each other, the resultant oscillations quickly increase in amplitude, and if left unchecked, may ultimately lead to structural failure. To help eliminate flutter in flight, manually operated control surfaces are generally mass balanced. Attaching weights forward of the hinge line brings the centre of gravity of the control surface to the hinge-line, thus altering the period of vibration and the liability to flutter. These additional weights are usually installed internally along the leading edge of the control surface, inside the horn balance, or on an arm attached to the surface (Fig. 6.27).
BALANCE WEIGHT
HINGE-LINE
ORIGINAL C OF GNEW C OF G
BALANCE WEIGHT
FIG. 6.27
POWERED FLYING CONTROLS On most transport category aircraft, powered flying controls assist in moving the primary and secondary control surfaces against the large aerodynamic loads, which may exceed the physical capabilities of the pilot at high airspeeds. The primary flying control surfaces are in the same configuration as on light aircraft, with ailerons, elevators and a rudder, although some aircraft are additionally fitted with inboard ailerons (Fig. 6.28).
AILERONS
(ROLL)
ELEVATOR(PITCH)
RUDDER(YAW)
FIG. 6.28
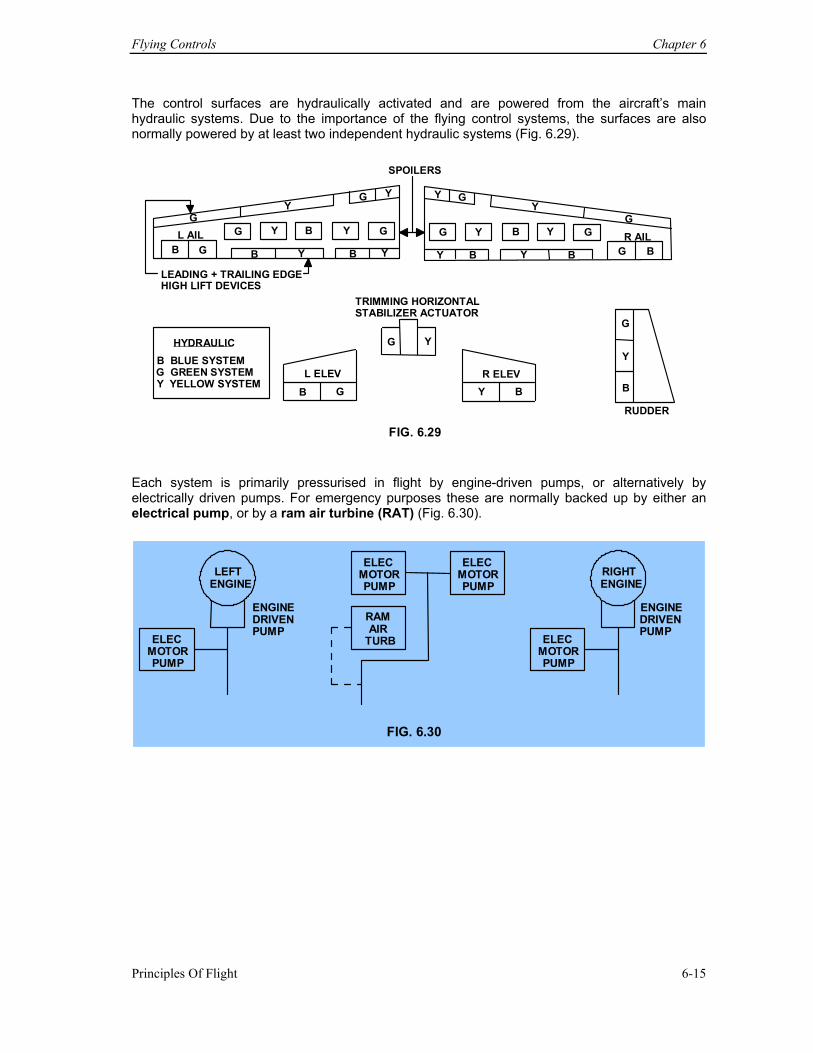
Flying Controls Chapter 6
Principles Of Flight 6-15
The control surfaces are hydraulically activated and are powered from the aircraft’s main hydraulic systems. Due to the importance of the flying control systems, the surfaces are also normally powered by at least two independent hydraulic systems (Fig. 6.29).
G
GG G
G Y
YY Y Y
Y
B
B B B
L AIL G G G
G G
YY
Y Y
Y Y
B
B B BR AIL
SPOILERS
G Y
TRIMMING HORIZONTALSTABILIZER ACTUATOR
HYDRAULIC B BLUE SYSTEMG GREEN SYSTEM Y YELLOW SYSTEM
LEADING + TRAILING EDGE HIGH LIFT DEVICES
L ELEV
B GR ELEV
Y B
G Y B RUDDER
FIG. 6.29
Each system is primarily pressurised in flight by engine-driven pumps, or alternatively by electrically driven pumps. For emergency purposes these are normally backed up by either an electrical pump, or by a ram air turbine (RAT) (Fig. 6.30).
LEFT
ENGINE
ELEC MOTOR PUMP
ENGINE DRIVEN PUMP
RIGHT ENGINE
ELEC MOTOR PUMP
ENGINEDRIVENPUMP
ELECMOTORPUMP
ELECMOTORPUMP
RAMAIR
TURB
FIG. 6.30
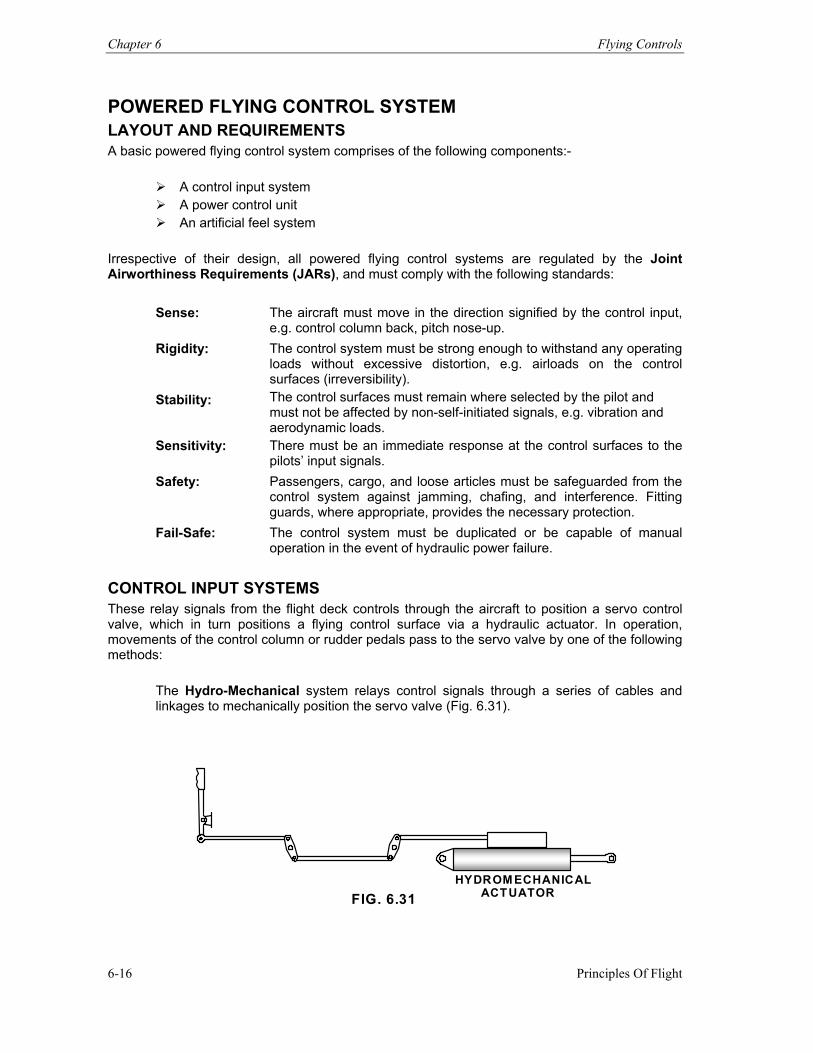
Chapter 6 Flying Controls
Principles Of Flight 6-16
POWERED FLYING CONTROL SYSTEM LAYOUT AND REQUIREMENTS A basic powered flying control system comprises of the following components:-
A control input system A power control unit An artificial feel system
Irrespective of their design, all powered flying control systems are regulated by the Joint Airworthiness Requirements (JARs), and must comply with the following standards:
Sense: The aircraft must move in the direction signified by the control input, e.g. control column back, pitch nose-up.
Rigidity: The control system must be strong enough to withstand any operating loads without excessive distortion, e.g. airloads on the control surfaces (irreversibility).
Stability: The control surfaces must remain where selected by the pilot and must not be affected by non-self-initiated signals, e.g. vibration and aerodynamic loads.
Sensitivity: There must be an immediate response at the control surfaces to the pilots’ input signals.
Safety: Passengers, cargo, and loose articles must be safeguarded from the control system against jamming, chafing, and interference. Fitting guards, where appropriate, provides the necessary protection.
Fail-Safe: The control system must be duplicated or be capable of manual operation in the event of hydraulic power failure.
CONTROL INPUT SYSTEMS These relay signals from the flight deck controls through the aircraft to position a servo control valve, which in turn positions a flying control surface via a hydraulic actuator. In operation, movements of the control column or rudder pedals pass to the servo valve by one of the following methods:
The Hydro-Mechanical system relays control signals through a series of cables and linkages to mechanically position the servo valve (Fig. 6.31).
HYDROM ECHANICAL ACTUATORFIG. 6.31
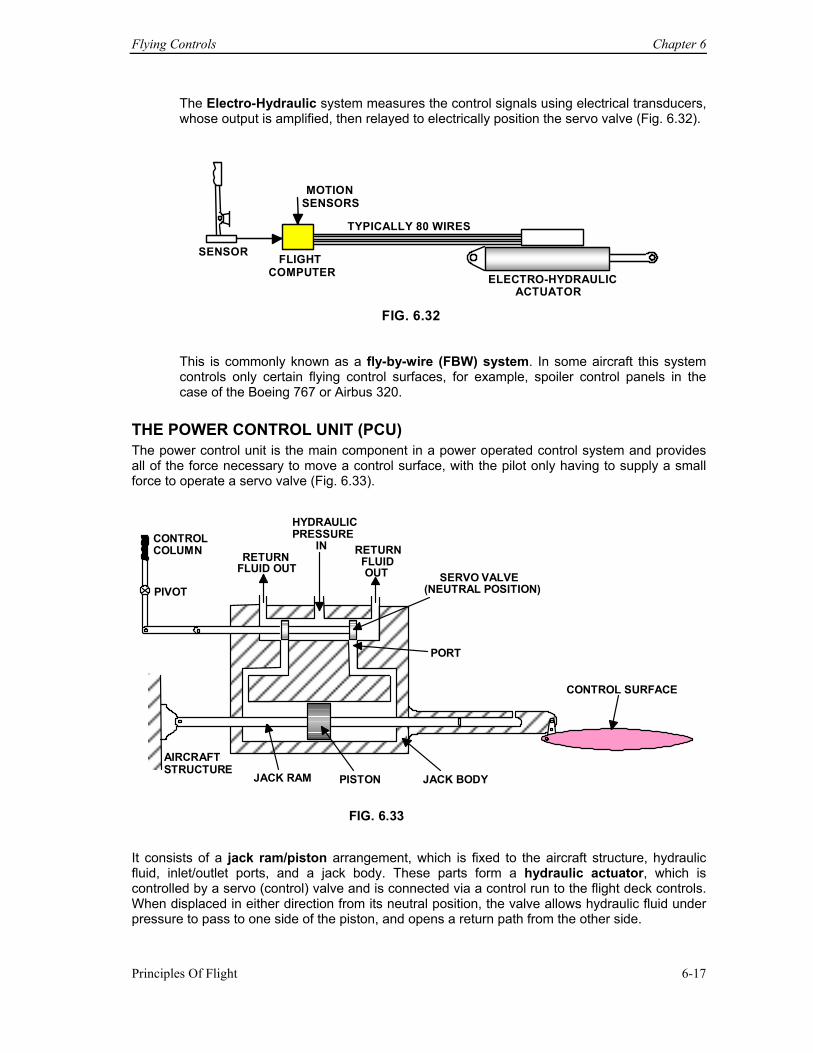
Flying Controls Chapter 6
Principles Of Flight 6-17
The Electro-Hydraulic system measures the control signals using electrical transducers, whose output is amplified, then relayed to electrically position the servo valve (Fig. 6.32).
ELECTRO-HYDRAULIC ACTUATOR
MOTIONSENSORS
SENSOR FLIGHT COMPUTER
TYPICALLY 80 WIRES
FIG. 6.32
This is commonly known as a fly-by-wire (FBW) system. In some aircraft this system controls only certain flying control surfaces, for example, spoiler control panels in the case of the Boeing 767 or Airbus 320.
THE POWER CONTROL UNIT (PCU) The power control unit is the main component in a power operated control system and provides all of the force necessary to move a control surface, with the pilot only having to supply a small force to operate a servo valve (Fig. 6.33).
CONTROL COLUMN RETURN
FLUID OUT
HYDRAULICPRESSURE
IN RETURNFLUIDOUT SERVO VALVE
(NEUTRAL POSITION)
PORT
AIRCRAFT STRUCTURE
JACK RAM PISTON JACK BODY
CONTROL SURFACE
PIVOT
FIG. 6.33
It consists of a jack ram/piston arrangement, which is fixed to the aircraft structure, hydraulic fluid, inlet/outlet ports, and a jack body. These parts form a hydraulic actuator, which is controlled by a servo (control) valve and is connected via a control run to the flight deck controls. When displaced in either direction from its neutral position, the valve allows hydraulic fluid under pressure to pass to one side of the piston, and opens a return path from the other side.
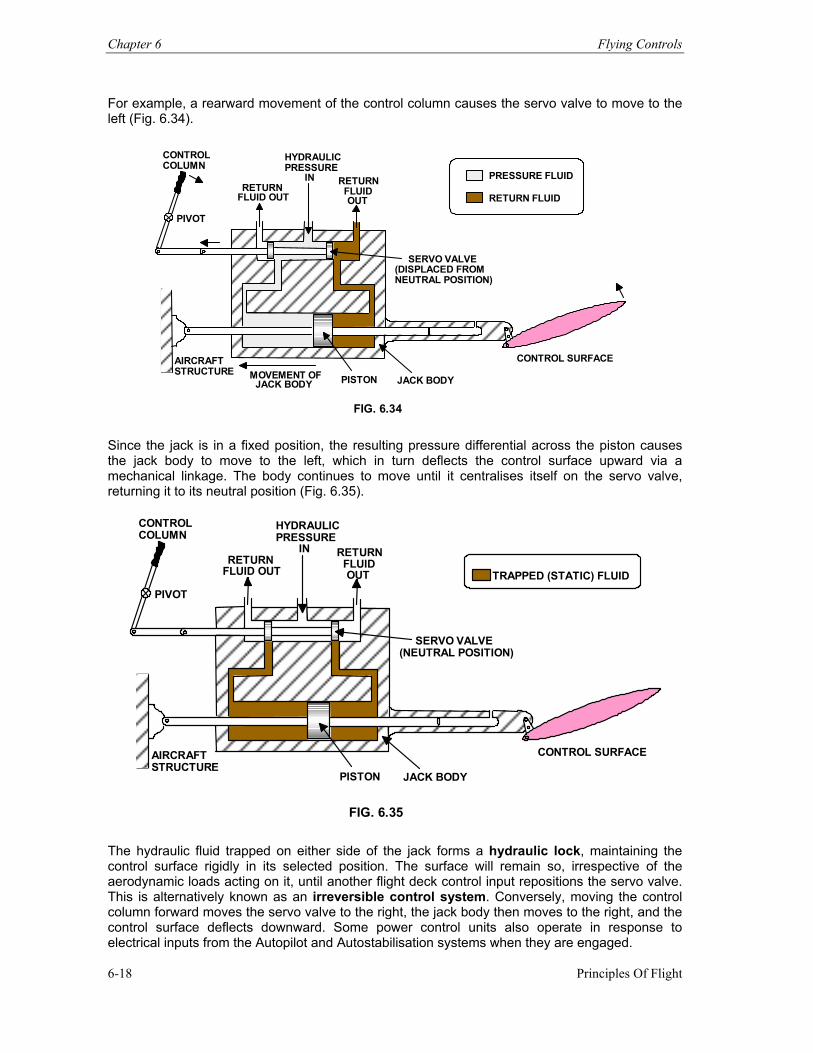
Chapter 6 Flying Controls
Principles Of Flight 6-18
For example, a rearward movement of the control column causes the servo valve to move to the left (Fig. 6.34).
CONTROL COLUMN
RETURN FLUID OUT
HYDRAULICPRESSURE
IN RETURNFLUIDOUT
SERVO VALVE(DISPLACED FROM
AIRCRAFT STRUCTURE
PISTON JACK BODY
CONTROL SURFACE MOVEMENT OF
JACK BODY
NEUTRAL POSITION)
PRESSURE FLUID RETURN FLUID
PIVOT
FIG. 6.34 Since the jack is in a fixed position, the resulting pressure differential across the piston causes the jack body to move to the left, which in turn deflects the control surface upward via a mechanical linkage. The body continues to move until it centralises itself on the servo valve, returning it to its neutral position (Fig. 6.35).
CONTROL COLUMN
RETURN FLUID OUT
HYDRAULICPRESSURE
IN RETURNFLUIDOUT
SERVO VALVE
AIRCRAFT STRUCTURE
PISTON JACK BODY
CONTROL SURFACE
(NEUTRAL POSITION)
TRAPPED (STATIC) FLUID PIVOT
FIG. 6.35 The hydraulic fluid trapped on either side of the jack forms a hydraulic lock, maintaining the control surface rigidly in its selected position. The surface will remain so, irrespective of the aerodynamic loads acting on it, until another flight deck control input repositions the servo valve. This is alternatively known as an irreversible control system. Conversely, moving the control column forward moves the servo valve to the right, the jack body then moves to the right, and the control surface deflects downward. Some power control units also operate in response to electrical inputs from the Autopilot and Autostabilisation systems when they are engaged.
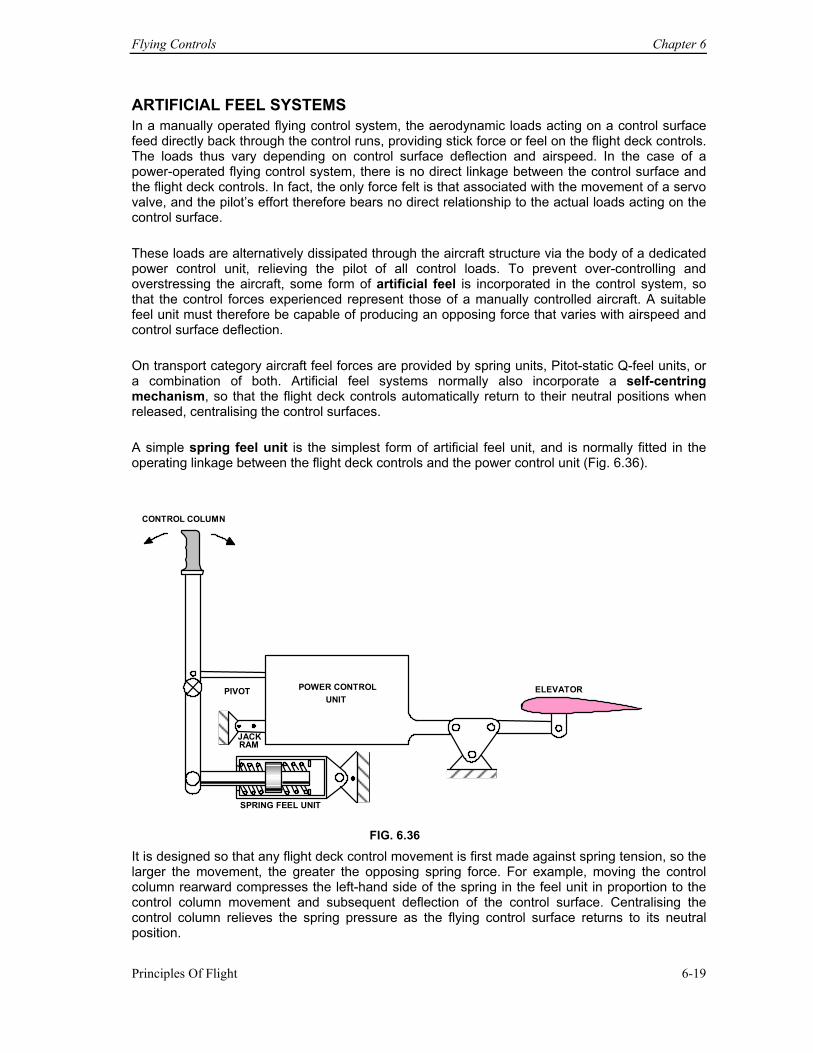
Flying Controls Chapter 6
Principles Of Flight 6-19
ARTIFICIAL FEEL SYSTEMS In a manually operated flying control system, the aerodynamic loads acting on a control surface feed directly back through the control runs, providing stick force or feel on the flight deck controls. The loads thus vary depending on control surface deflection and airspeed. In the case of a power-operated flying control system, there is no direct linkage between the control surface and the flight deck controls. In fact, the only force felt is that associated with the movement of a servo valve, and the pilot’s effort therefore bears no direct relationship to the actual loads acting on the control surface. These loads are alternatively dissipated through the aircraft structure via the body of a dedicated power control unit, relieving the pilot of all control loads. To prevent over-controlling and overstressing the aircraft, some form of artificial feel is incorporated in the control system, so that the control forces experienced represent those of a manually controlled aircraft. A suitable feel unit must therefore be capable of producing an opposing force that varies with airspeed and control surface deflection. On transport category aircraft feel forces are provided by spring units, Pitot-static Q-feel units, or a combination of both. Artificial feel systems normally also incorporate a self-centring mechanism, so that the flight deck controls automatically return to their neutral positions when released, centralising the control surfaces. A simple spring feel unit is the simplest form of artificial feel unit, and is normally fitted in the operating linkage between the flight deck controls and the power control unit (Fig. 6.36).
CONTROL COLUMN
PIVOT POWER CONTROLUNIT
JACK RAM
SPRING FEEL UNIT
ELEVATOR
FIG. 6.36 It is designed so that any flight deck control movement is first made against spring tension, so the larger the movement, the greater the opposing spring force. For example, moving the control column rearward compresses the left-hand side of the spring in the feel unit in proportion to the control column movement and subsequent deflection of the control surface. Centralising the control column relieves the spring pressure as the flying control surface returns to its neutral position.
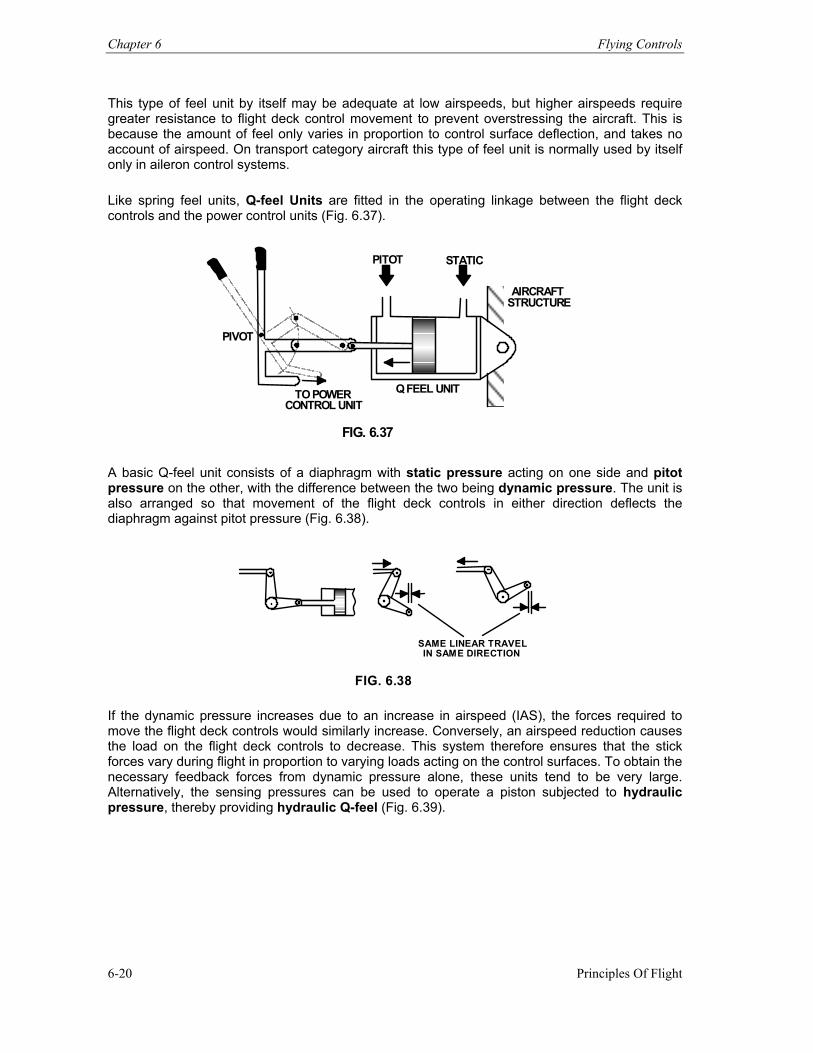
Chapter 6 Flying Controls
Principles Of Flight 6-20
This type of feel unit by itself may be adequate at low airspeeds, but higher airspeeds require greater resistance to flight deck control movement to prevent overstressing the aircraft. This is because the amount of feel only varies in proportion to control surface deflection, and takes no account of airspeed. On transport category aircraft this type of feel unit is normally used by itself only in aileron control systems.
Like spring feel units, Q-feel Units are fitted in the operating linkage between the flight deck controls and the power control units (Fig. 6.37).
PITOT STATIC
TO POWERCONTROL UNIT
Q FEEL UNIT
AIRCRAFTSTRUCTURE
PIVOT
FIG. 6.37
A basic Q-feel unit consists of a diaphragm with static pressure acting on one side and pitot pressure on the other, with the difference between the two being dynamic pressure. The unit is also arranged so that movement of the flight deck controls in either direction deflects the diaphragm against pitot pressure (Fig. 6.38).
SAME LINEAR TRAVELIN SAME DIRECTION
FIG. 6.38
If the dynamic pressure increases due to an increase in airspeed (IAS), the forces required to move the flight deck controls would similarly increase. Conversely, an airspeed reduction causes the load on the flight deck controls to decrease. This system therefore ensures that the stick forces vary during flight in proportion to varying loads acting on the control surfaces. To obtain the necessary feedback forces from dynamic pressure alone, these units tend to be very large. Alternatively, the sensing pressures can be used to operate a piston subjected to hydraulic pressure, thereby providing hydraulic Q-feel (Fig. 6.39).
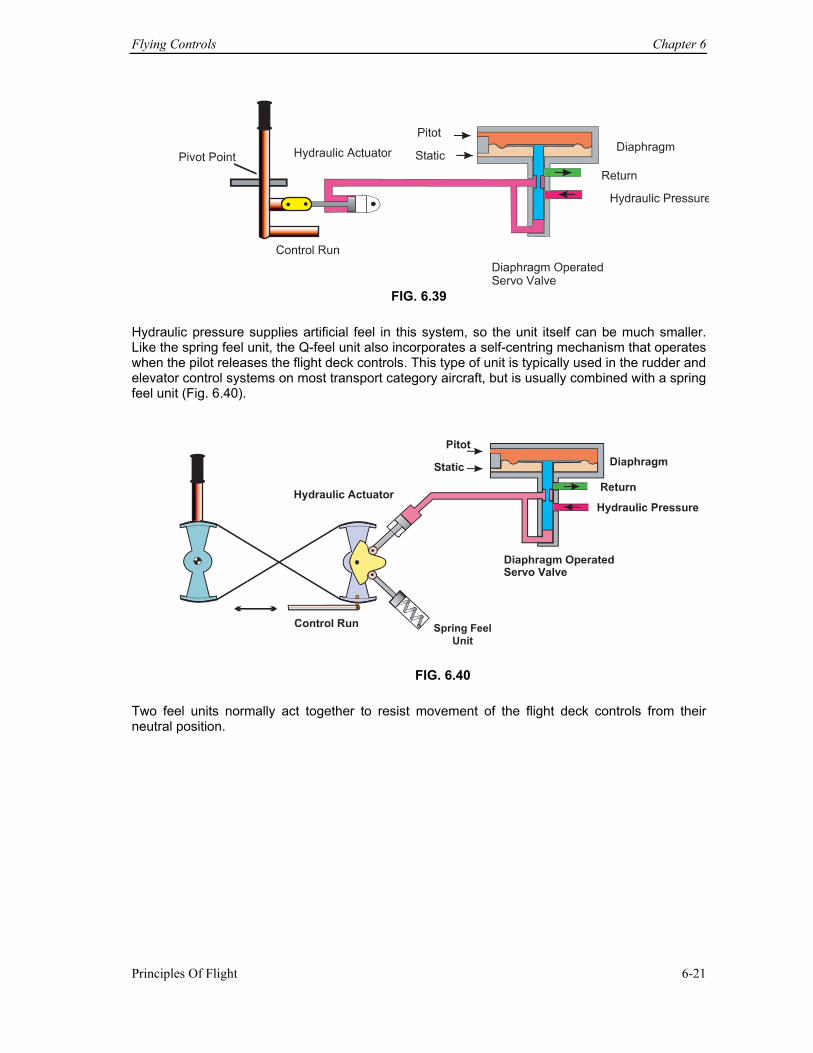
Flying Controls Chapter 6
Principles Of Flight 6-21
FIG. 6.39
Hydraulic pressure supplies artificial feel in this system, so the unit itself can be much smaller. Like the spring feel unit, the Q-feel unit also incorporates a self-centring mechanism that operates when the pilot releases the flight deck controls. This type of unit is typically used in the rudder and elevator control systems on most transport category aircraft, but is usually combined with a spring feel unit (Fig. 6.40).
Spring Feel
Unit
FIG. 6.40
Two feel units normally act together to resist movement of the flight deck controls from their neutral position.
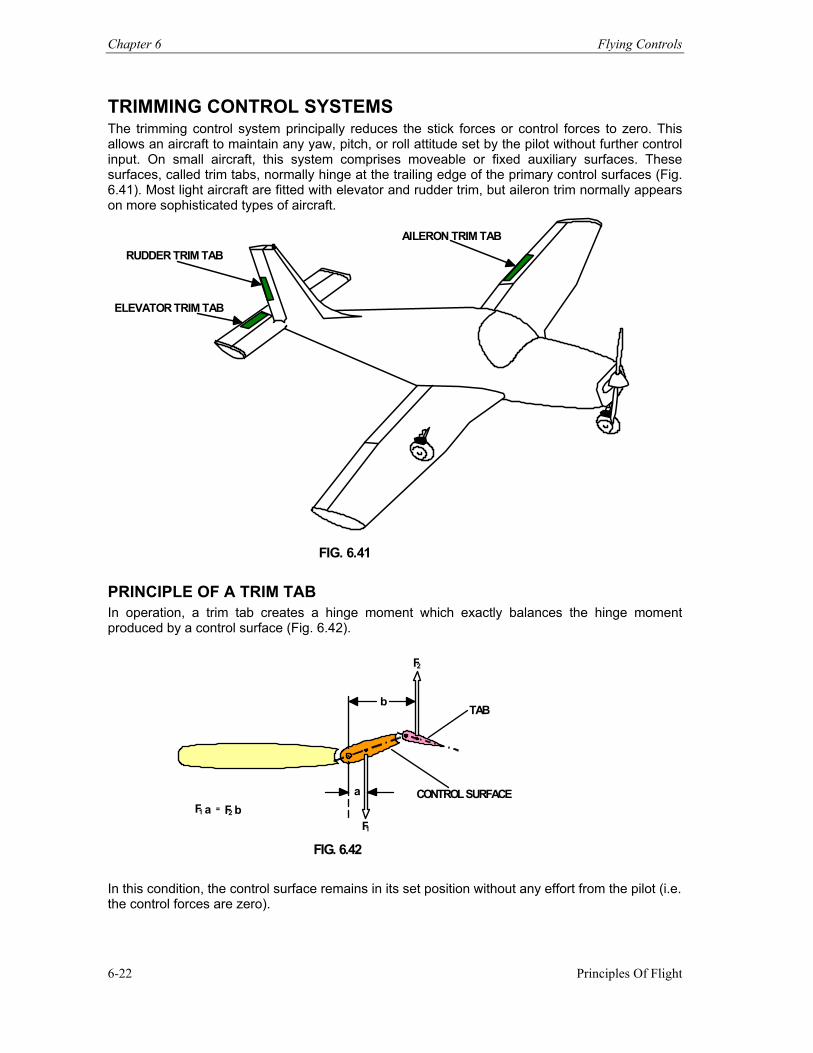
Chapter 6 Flying Controls
Principles Of Flight 6-22
TRIMMING CONTROL SYSTEMS The trimming control system principally reduces the stick forces or control forces to zero. This allows an aircraft to maintain any yaw, pitch, or roll attitude set by the pilot without further control input. On small aircraft, this system comprises moveable or fixed auxiliary surfaces. These surfaces, called trim tabs, normally hinge at the trailing edge of the primary control surfaces (Fig. 6.41). Most light aircraft are fitted with elevator and rudder trim, but aileron trim normally appears on more sophisticated types of aircraft.
RUDDER TRIM TAB
ELEVATOR TRIM TAB
AILERON TRIM TAB
FIG. 6.41
PRINCIPLE OF A TRIM TAB In operation, a trim tab creates a hinge moment which exactly balances the hinge moment produced by a control surface (Fig. 6.42).
b
a
F1
F2
TAB
CONTROL SURFACEF 1 a F 2 = b
FIG. 6.42 In this condition, the control surface remains in its set position without any effort from the pilot (i.e. the control forces are zero).
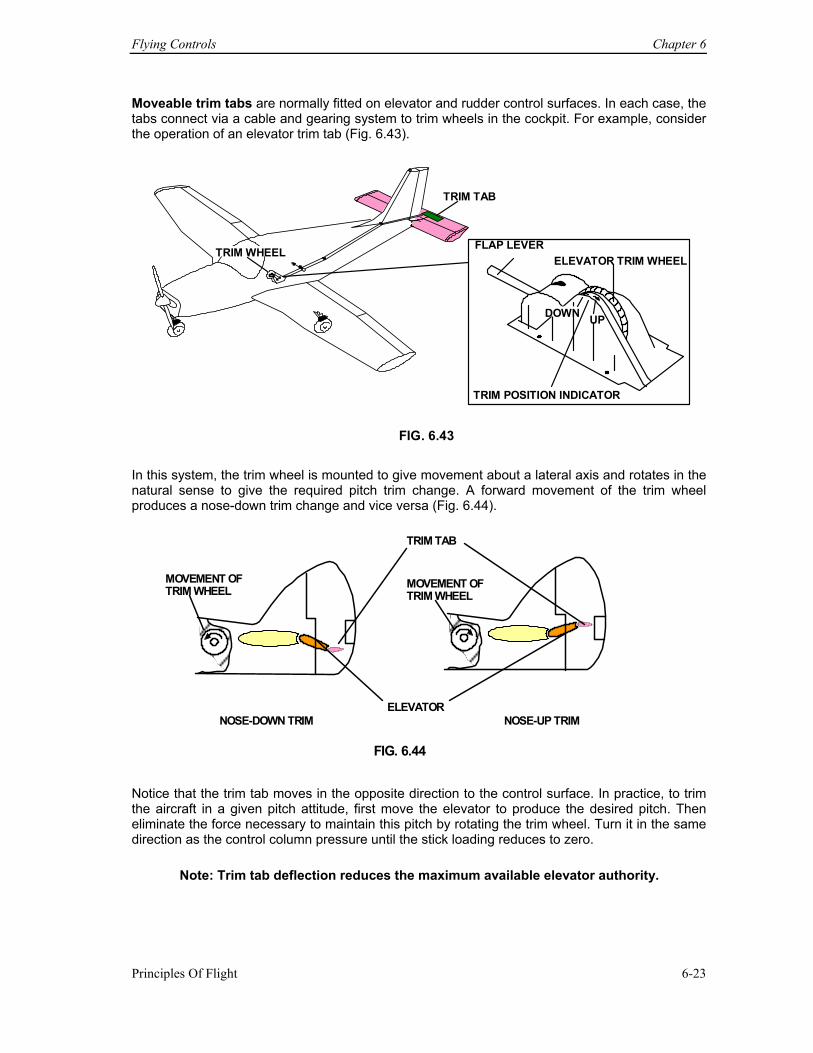
Flying Controls Chapter 6
Principles Of Flight 6-23
Moveable trim tabs are normally fitted on elevator and rudder control surfaces. In each case, the tabs connect via a cable and gearing system to trim wheels in the cockpit. For example, consider the operation of an elevator trim tab (Fig. 6.43).
TRIM WHEEL
TRIM TAB
FLAP LEVERELEVATOR TRIM WHEEL
TRIM POSITION INDICATOR
DOWN UP
FIG. 6.43 In this system, the trim wheel is mounted to give movement about a lateral axis and rotates in the natural sense to give the required pitch trim change. A forward movement of the trim wheel produces a nose-down trim change and vice versa (Fig. 6.44).
TRIM TAB
ELEVATOR
MOVEMENT OF TRIM WHEEL MOVEMENT OF
TRIM WHEEL
NOSE-DOWN TRIM NOSE-UP TRIM FIG. 6.44
Notice that the trim tab moves in the opposite direction to the control surface. In practice, to trim the aircraft in a given pitch attitude, first move the elevator to produce the desired pitch. Then eliminate the force necessary to maintain this pitch by rotating the trim wheel. Turn it in the same direction as the control column pressure until the stick loading reduces to zero.
Note: Trim tab deflection reduces the maximum available elevator authority.
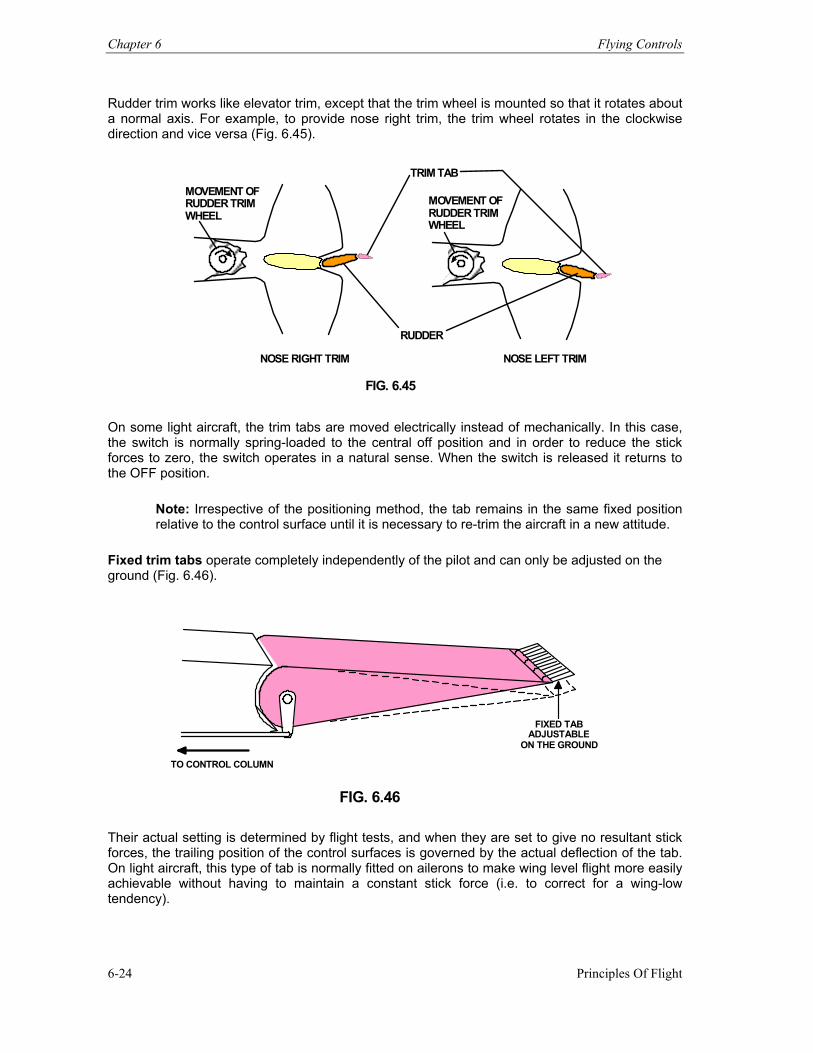
Chapter 6 Flying Controls
Principles Of Flight 6-24
Rudder trim works like elevator trim, except that the trim wheel is mounted so that it rotates about a normal axis. For example, to provide nose right trim, the trim wheel rotates in the clockwise direction and vice versa (Fig. 6.45).
TRIM TAB
RUDDER
NOSE RIGHT TRIM NOSE LEFT TRIM
MOVEMENT OF RUDDER TRIM WHEEL MOVEMENT OF
RUDDER TRIMWHEEL
FIG. 6.45
On some light aircraft, the trim tabs are moved electrically instead of mechanically. In this case, the switch is normally spring-loaded to the central off position and in order to reduce the stick forces to zero, the switch operates in a natural sense. When the switch is released it returns to the OFF position.
Note: Irrespective of the positioning method, the tab remains in the same fixed position relative to the control surface until it is necessary to re-trim the aircraft in a new attitude.
Fixed trim tabs operate completely independently of the pilot and can only be adjusted on the ground (Fig. 6.46).
TO CONTROL COLUMN
FIXED TAB ADJUSTABLE
ON THE GROUND
FIG. 6.46 Their actual setting is determined by flight tests, and when they are set to give no resultant stick forces, the trailing position of the control surfaces is governed by the actual deflection of the tab. On light aircraft, this type of tab is normally fitted on ailerons to make wing level flight more easily achievable without having to maintain a constant stick force (i.e. to correct for a wing-low tendency).
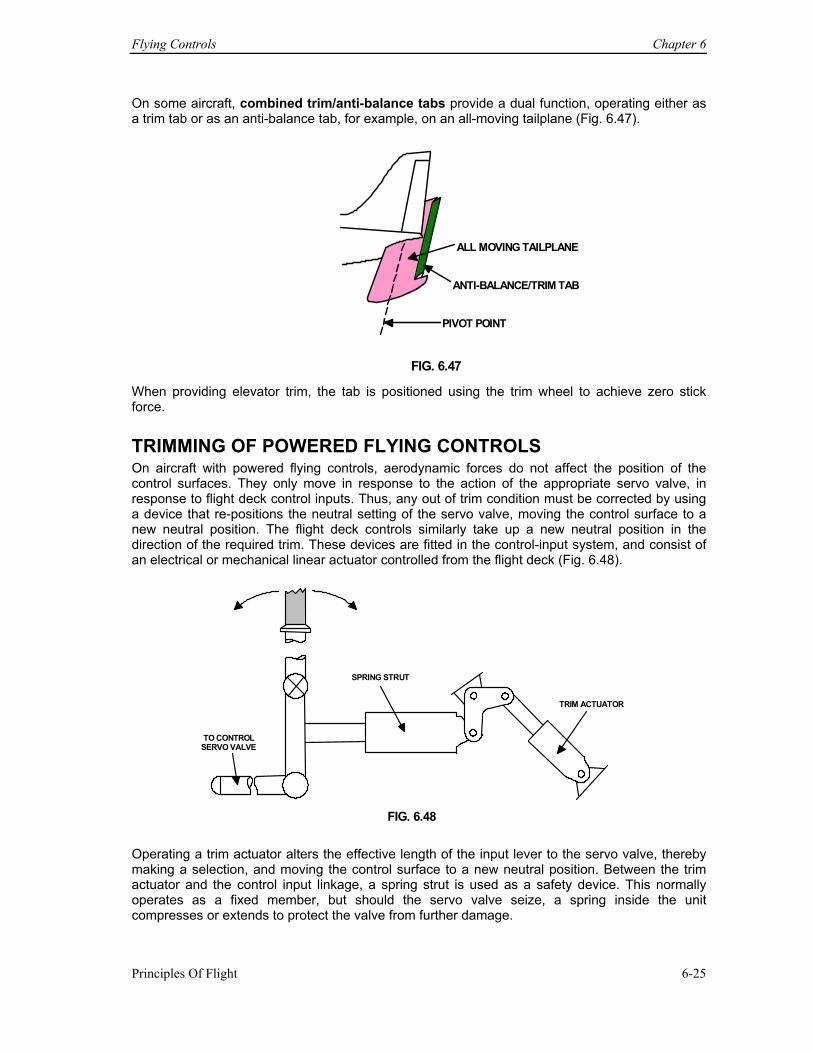
Flying Controls Chapter 6
Principles Of Flight 6-25
On some aircraft, combined trim/anti-balance tabs provide a dual function, operating either as a trim tab or as an anti-balance tab, for example, on an all-moving tailplane (Fig. 6.47).
ALL MOVING TAILPLANE ANTI-BALANCE/TRIM TAB
PIVOT POINT
FIG. 6.47
When providing elevator trim, the tab is positioned using the trim wheel to achieve zero stick force.
TRIMMING OF POWERED FLYING CONTROLS On aircraft with powered flying controls, aerodynamic forces do not affect the position of the control surfaces. They only move in response to the action of the appropriate servo valve, in response to flight deck control inputs. Thus, any out of trim condition must be corrected by using a device that re-positions the neutral setting of the servo valve, moving the control surface to a new neutral position. The flight deck controls similarly take up a new neutral position in the direction of the required trim. These devices are fitted in the control-input system, and consist of an electrical or mechanical linear actuator controlled from the flight deck (Fig. 6.48).
SPRING STRUT
TRIM ACTUATOR
TO CONTROLSERVO VALVE
FIG. 6.48 Operating a trim actuator alters the effective length of the input lever to the servo valve, thereby making a selection, and moving the control surface to a new neutral position. Between the trim actuator and the control input linkage, a spring strut is used as a safety device. This normally operates as a fixed member, but should the servo valve seize, a spring inside the unit compresses or extends to protect the valve from further damage.
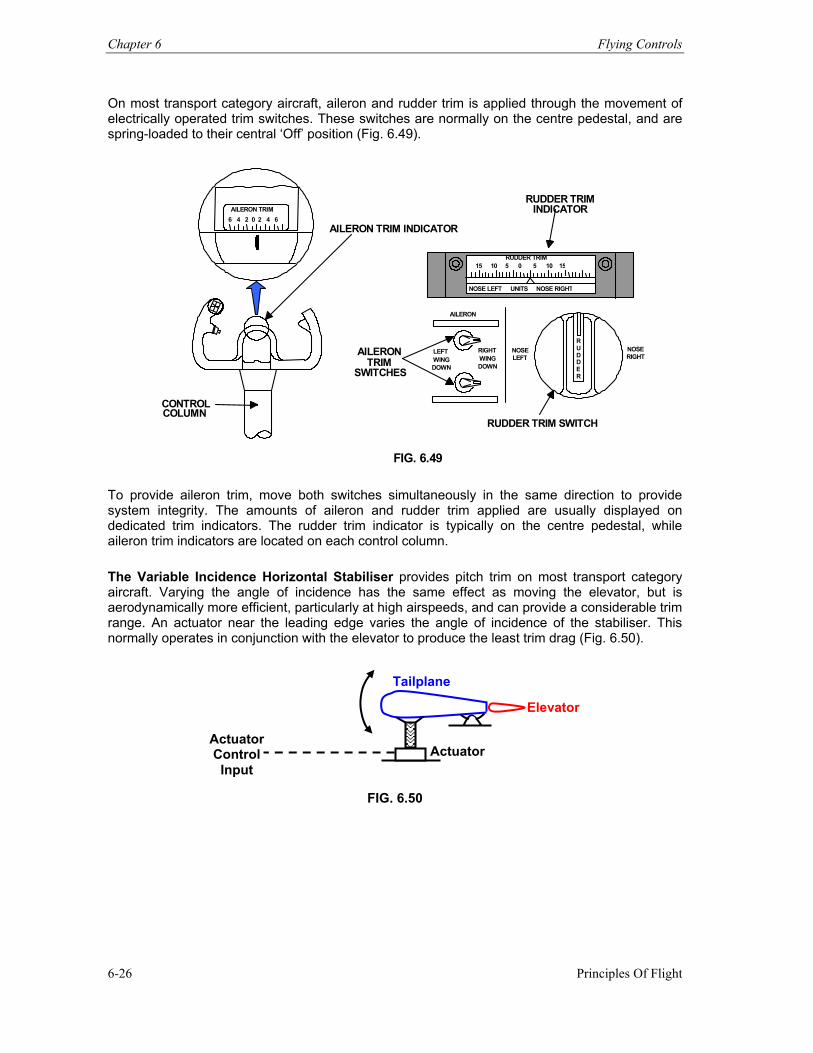
Chapter 6 Flying Controls
Principles Of Flight 6-26
On most transport category aircraft, aileron and rudder trim is applied through the movement of electrically operated trim switches. These switches are normally on the centre pedestal, and are spring-loaded to their central ‘Off’ position (Fig. 6.49).
AILERON TRIM 6 4 2 0 2 4 6
AILERON TRIM INDICATOR
CONTROL COLUMN
AILERONTRIM
SWITCHES
RUDDER TRIM INDICATOR
RUDDER TRIM SWITCH
LEFT RIGHTWING WINGDOWN DOWN
AILERON
RUDDER TRIM15 10 5 0 5 10 15
NOSE LEFT UNITS NOSE RIGHT
NOSELEFT
NOSE RIGHT R
U D D E R
FIG. 6.49
To provide aileron trim, move both switches simultaneously in the same direction to provide system integrity. The amounts of aileron and rudder trim applied are usually displayed on dedicated trim indicators. The rudder trim indicator is typically on the centre pedestal, while aileron trim indicators are located on each control column. The Variable Incidence Horizontal Stabiliser provides pitch trim on most transport category aircraft. Varying the angle of incidence has the same effect as moving the elevator, but is aerodynamically more efficient, particularly at high airspeeds, and can provide a considerable trim range. An actuator near the leading edge varies the angle of incidence of the stabiliser. This normally operates in conjunction with the elevator to produce the least trim drag (Fig. 6.50).
FIG. 6.50
Tailplane
Elevator
Actuator Actuator Control
Input
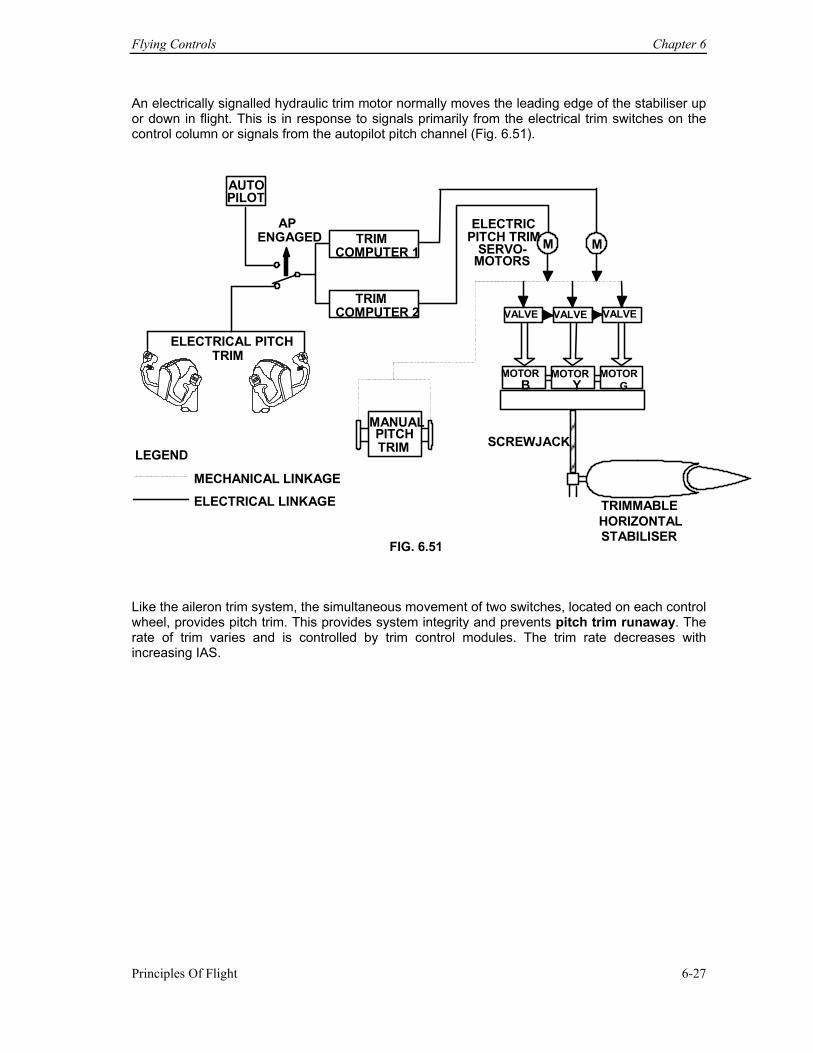
Flying Controls Chapter 6
Principles Of Flight 6-27
An electrically signalled hydraulic trim motor normally moves the leading edge of the stabiliser up or down in flight. This is in response to signals primarily from the electrical trim switches on the control column or signals from the autopilot pitch channel (Fig. 6.51).
AUTO PILOT
AP TRIM
COMPUTER 1
TRIMCOMPUTER 2
MANUALPITCHTRIM
ENGAGED M M
VALVE VALVE VALVE
MOTOR MOTOR MOTOR B Y G
SCREWJACK
TRIMMABLEHORIZONTALSTABILISER
ELECTRICPITCH TRIM
SERVO-MOTORS
ELECTRICAL PITCH TRIM
LEGEND MECHANICAL LINKAGE
ELECTRICAL LINKAGE
FIG. 6.51
Like the aileron trim system, the simultaneous movement of two switches, located on each control wheel, provides pitch trim. This provides system integrity and prevents pitch trim runaway. The rate of trim varies and is controlled by trim control modules. The trim rate decreases with increasing IAS.
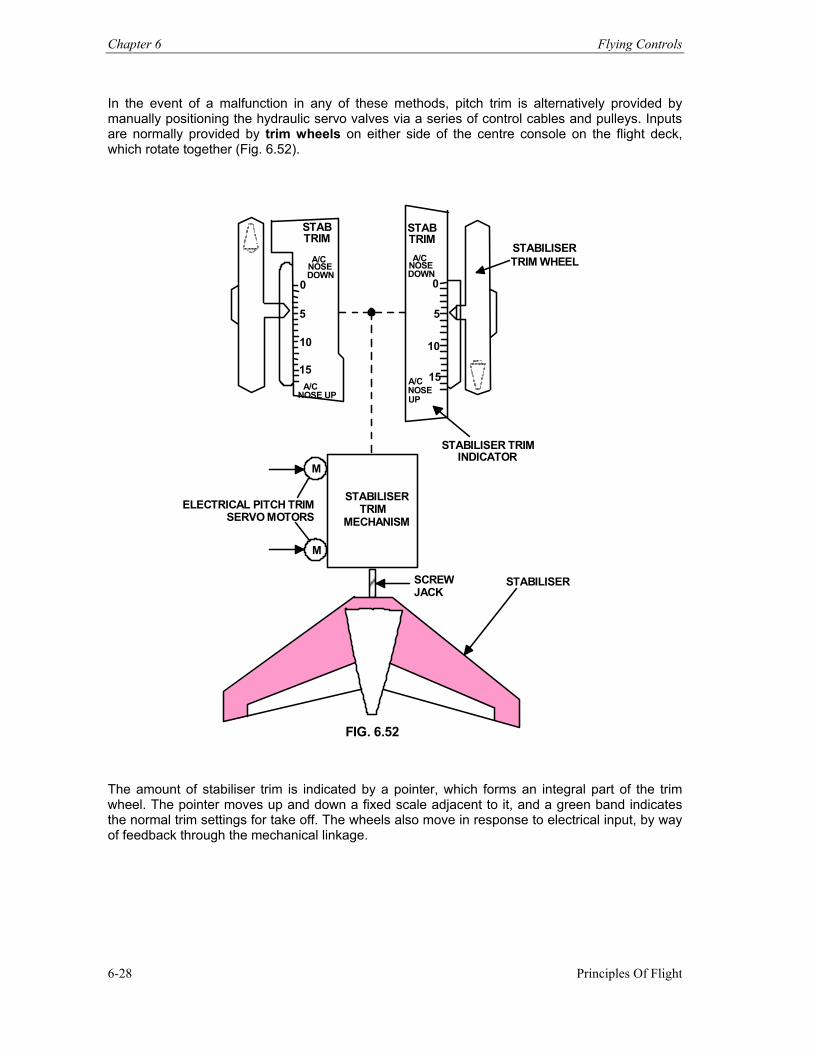
Chapter 6 Flying Controls
Principles Of Flight 6-28
In the event of a malfunction in any of these methods, pitch trim is alternatively provided by manually positioning the hydraulic servo valves via a series of control cables and pulleys. Inputs are normally provided by trim wheels on either side of the centre console on the flight deck, which rotate together (Fig. 6.52).
M
M STABILISER
TRIMMECHANISM
STABILISER
STABTRIM
A/C A/CNOSE NOSEDOWN DOWN
0 0
5 5
10 10
15 15A/C
NOSE UP
STABTRIM
A/CNOSEUP
STABILISER TRIMINDICATOR
STABILISER TRIM WHEEL
ELECTRICAL PITCH TRIM SERVO MOTORS
SCREWJACK
FIG. 6.52
The amount of stabiliser trim is indicated by a pointer, which forms an integral part of the trim wheel. The pointer moves up and down a fixed scale adjacent to it, and a green band indicates the normal trim settings for take off. The wheels also move in response to electrical input, by way of feedback through the mechanical linkage.
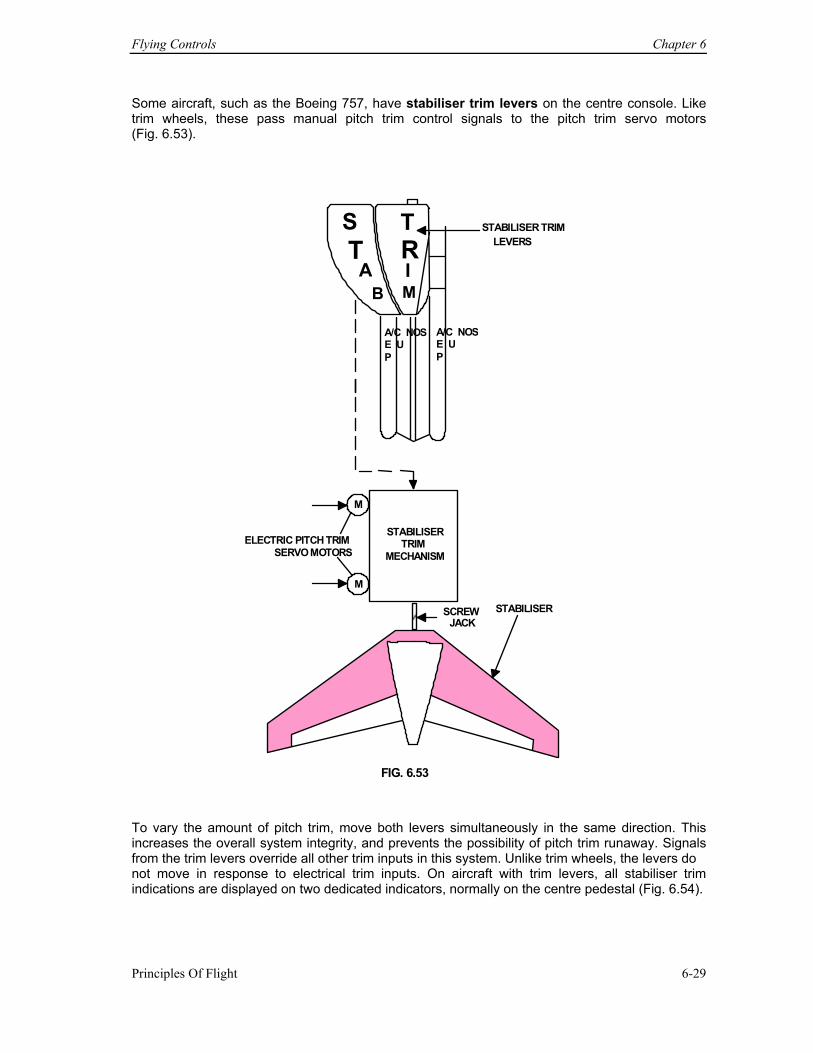
Flying Controls Chapter 6
Principles Of Flight 6-29
Some aircraft, such as the Boeing 757, have stabiliser trim levers on the centre console. Like trim wheels, these pass manual pitch trim control signals to the pitch trim servo motors (Fig. 6.53).
M
M
STABILISERTRIM
MECHANISM
STABILISER
A/C NOSE U P
A/C NOSE U P
STABILISER TRIMLEVERS
ST
AB
TRIM
ELECTRIC PITCH TRIMSERVO MOTORS
SCREW JACK
FIG. 6.53
To vary the amount of pitch trim, move both levers simultaneously in the same direction. This increases the overall system integrity, and prevents the possibility of pitch trim runaway. Signals from the trim levers override all other trim inputs in this system. Unlike trim wheels, the levers do not move in response to electrical trim inputs. On aircraft with trim levers, all stabiliser trim indications are displayed on two dedicated indicators, normally on the centre pedestal (Fig. 6.54).
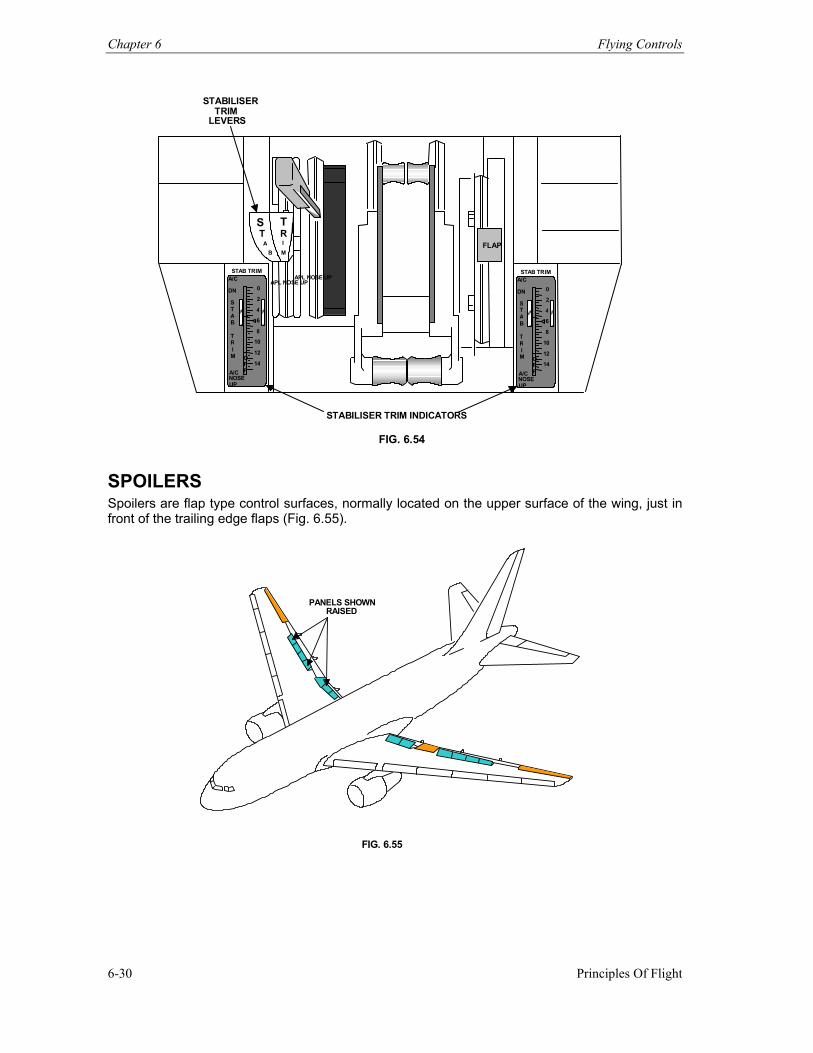
Chapter 6 Flying Controls
Principles Of Flight 6-30
NOSENOSE
FLAP
0 2 4 6 8
10 12 14 O
F F A/C
NOSEUP
A/C DN S T A B T R I M
STAB TRIM 0
2
4
6
8
10
12
14OFFA/C
NOSEUP
A/C
DN
STAB
TRIM
STAB TRIM
APL NOSE UP APL NOSE UP
S T
A B
T R I M
STABILISER TRIM
LEVERS
STABILISER TRIM INDICATORS
FIG. 6.54
SPOILERS Spoilers are flap type control surfaces, normally located on the upper surface of the wing, just in front of the trailing edge flaps (Fig. 6.55).
PANELS SHOWNRAISED
FIG. 6.55
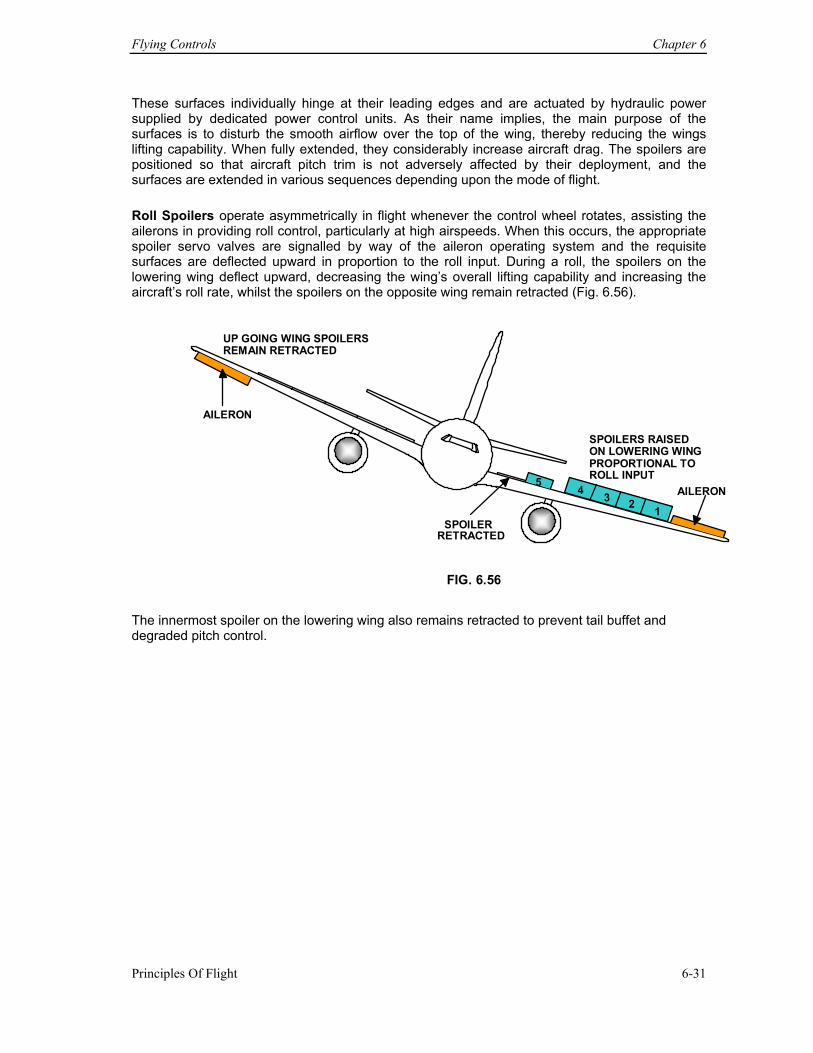
Flying Controls Chapter 6
Principles Of Flight 6-31
These surfaces individually hinge at their leading edges and are actuated by hydraulic power supplied by dedicated power control units. As their name implies, the main purpose of the surfaces is to disturb the smooth airflow over the top of the wing, thereby reducing the wings lifting capability. When fully extended, they considerably increase aircraft drag. The spoilers are positioned so that aircraft pitch trim is not adversely affected by their deployment, and the surfaces are extended in various sequences depending upon the mode of flight. Roll Spoilers operate asymmetrically in flight whenever the control wheel rotates, assisting the ailerons in providing roll control, particularly at high airspeeds. When this occurs, the appropriate spoiler servo valves are signalled by way of the aileron operating system and the requisite surfaces are deflected upward in proportion to the roll input. During a roll, the spoilers on the lowering wing deflect upward, decreasing the wing’s overall lifting capability and increasing the aircraft’s roll rate, whilst the spoilers on the opposite wing remain retracted (Fig. 6.56).
FIG. 6.56
54 3 2 1
UP GOING WING SPOILERSREMAIN RETRACTED
AILERON SPOILERS RAISEDON LOWERING WINGPROPORTIONAL TOROLL INPUT
AILERON
SPOILERRETRACTED
The innermost spoiler on the lowering wing also remains retracted to prevent tail buffet and degraded pitch control.
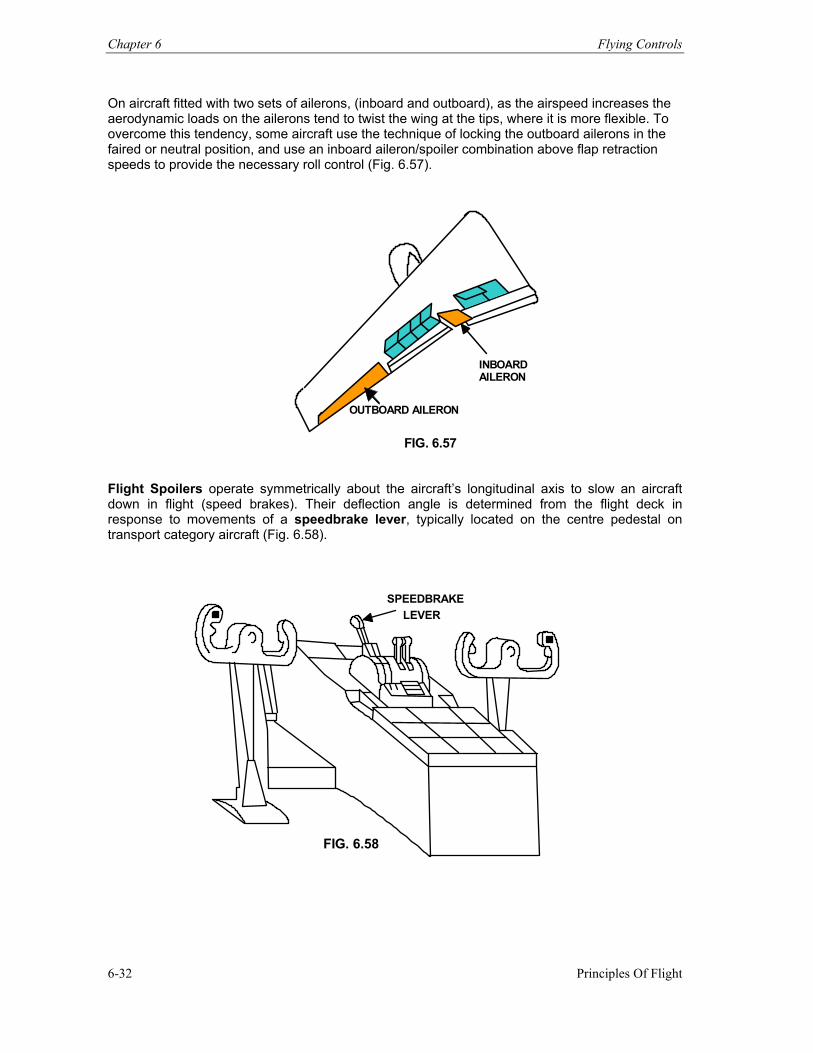
Chapter 6 Flying Controls
Principles Of Flight 6-32
On aircraft fitted with two sets of ailerons, (inboard and outboard), as the airspeed increases the aerodynamic loads on the ailerons tend to twist the wing at the tips, where it is more flexible. To overcome this tendency, some aircraft use the technique of locking the outboard ailerons in the faired or neutral position, and use an inboard aileron/spoiler combination above flap retraction speeds to provide the necessary roll control (Fig. 6.57).
INBOARDAILERON
OUTBOARD AILERON
FIG. 6.57
Flight Spoilers operate symmetrically about the aircraft’s longitudinal axis to slow an aircraft down in flight (speed brakes). Their deflection angle is determined from the flight deck in response to movements of a speedbrake lever, typically located on the centre pedestal on transport category aircraft (Fig. 6.58).
SPEEDBRAKELEVER
FIG. 6.58
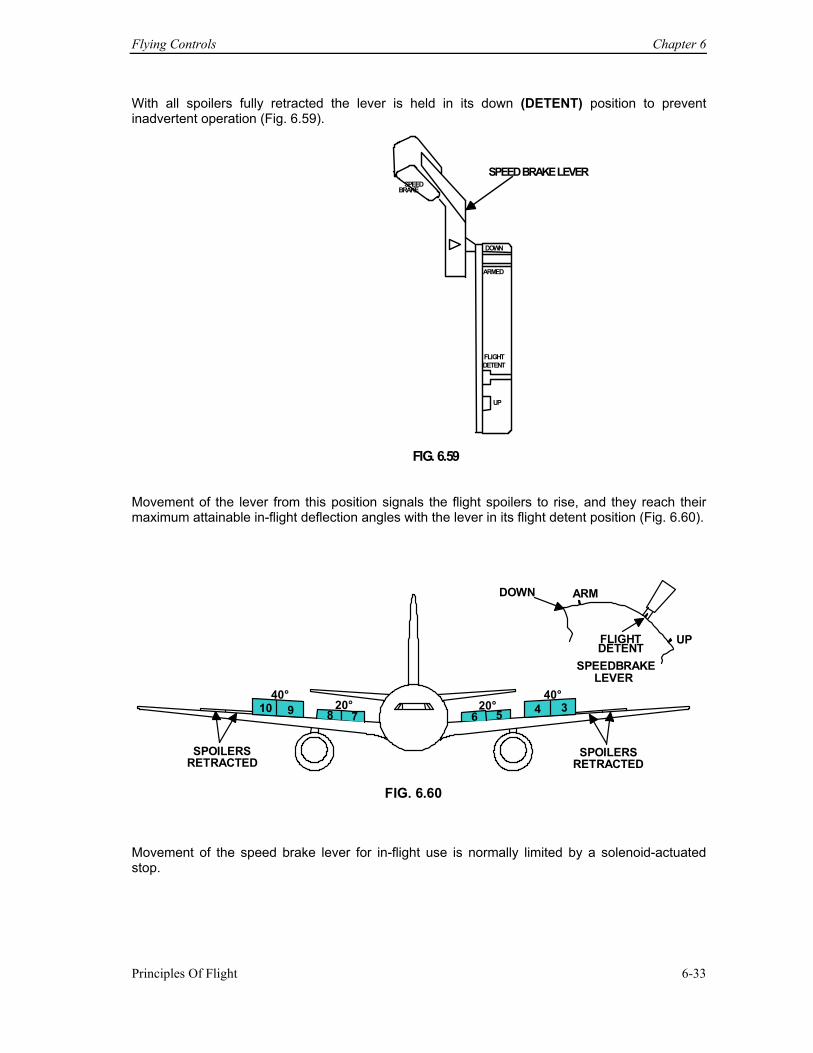
Flying Controls Chapter 6
Principles Of Flight 6-33
With all spoilers fully retracted the lever is held in its down (DETENT) position to prevent inadvertent operation (Fig. 6.59).
DOWN
ARMED
FLIGHTDETENT
UP
SPEEDBRAKE
SPEED BRAKE LEVER
FIG. 6.59
Movement of the lever from this position signals the flight spoilers to rise, and they reach their maximum attainable in-flight deflection angles with the lever in its flight detent position (Fig. 6.60).
10 9 8 7 6 5 4 340° 40°
20° 20°
SPOILERS RETRACTED SPOILERS
RETRACTED
DOWN ARM FLIGHT UP
SPEEDBRAKELEVER DETENT
FIG. 6.60
Movement of the speed brake lever for in-flight use is normally limited by a solenoid-actuated stop.
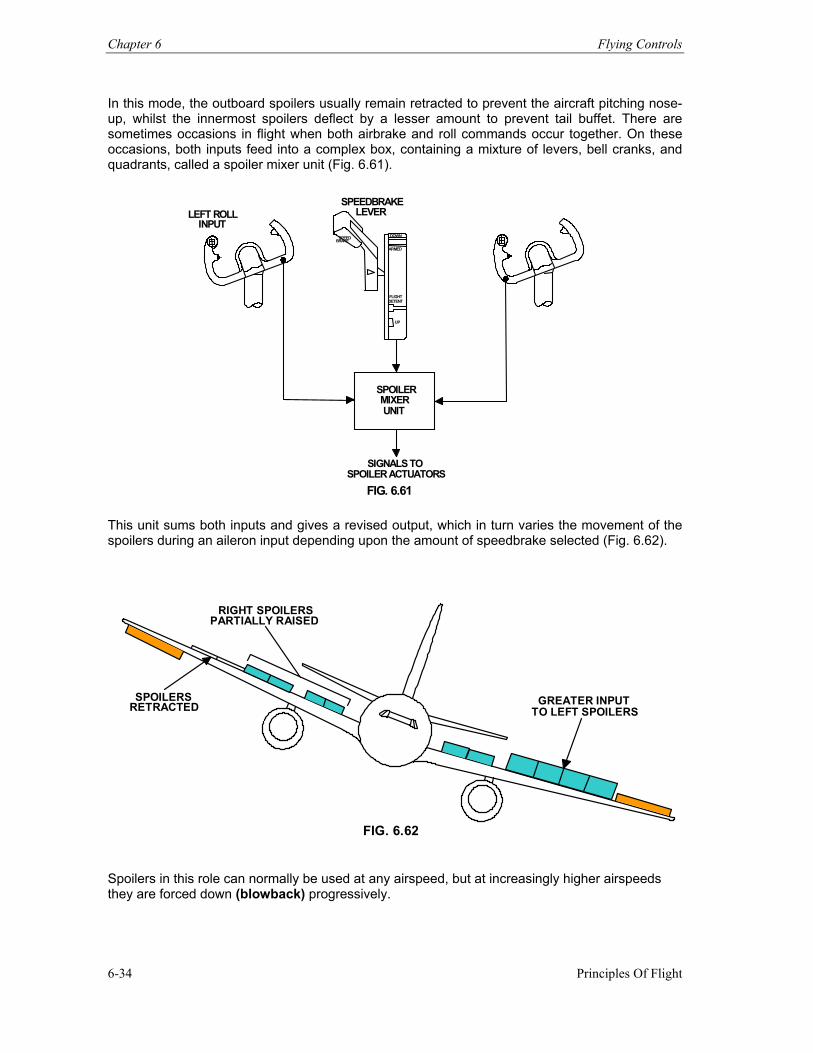
Chapter 6 Flying Controls
Principles Of Flight 6-34
In this mode, the outboard spoilers usually remain retracted to prevent the aircraft pitching nose-up, whilst the innermost spoilers deflect by a lesser amount to prevent tail buffet. There are sometimes occasions in flight when both airbrake and roll commands occur together. On these occasions, both inputs feed into a complex box, containing a mixture of levers, bell cranks, and quadrants, called a spoiler mixer unit (Fig. 6.61).
DOWN
ARMED
FLIGHTDETENT
UP
SPEEDBRAKE
SPOILERMIXERUNIT
LEFT ROLLINPUT
SPEEDBRAKELEVER
SIGNALS TOSPOILER ACTUATORS
FIG. 6.61
This unit sums both inputs and gives a revised output, which in turn varies the movement of the spoilers during an aileron input depending upon the amount of speedbrake selected (Fig. 6.62).
RIGHT SPOILERS
PARTIALLY RAISED
SPOILERS RETRACTED GREATER INPUT
TO LEFT SPOILERS
FIG. 6.62
Spoilers in this role can normally be used at any airspeed, but at increasingly higher airspeeds they are forced down (blowback) progressively.
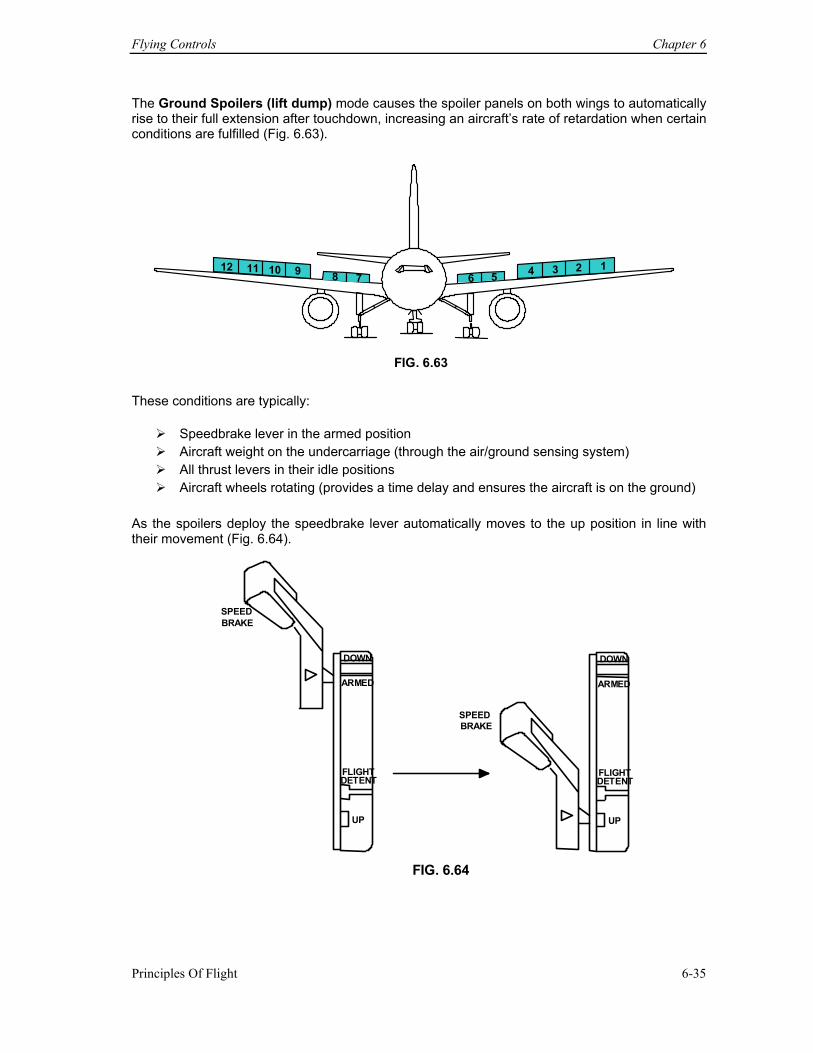
Flying Controls Chapter 6
Principles Of Flight 6-35
The Ground Spoilers (lift dump) mode causes the spoiler panels on both wings to automatically rise to their full extension after touchdown, increasing an aircraft’s rate of retardation when certain conditions are fulfilled (Fig. 6.63).
1 2 3456789 10 11 12
FIG. 6.63 These conditions are typically:
Speedbrake lever in the armed position Aircraft weight on the undercarriage (through the air/ground sensing system) All thrust levers in their idle positions Aircraft wheels rotating (provides a time delay and ensures the aircraft is on the ground)
As the spoilers deploy the speedbrake lever automatically moves to the up position in line with their movement (Fig. 6.64).
DOWN
ARMED
FLIGHTDETENT
UP
SPEED BRAKE
DOWN ARMED
FLIGHT DETENT
UP
SPEEDBRAKE
FIG. 6.64
Chapter 6 Flying Controls
Principles Of Flight 6-36
The maximum deflection angles are greater in the ground mode than the flight mode. With the spoilers in their fully extended position, approximately 80% of the wing/flap lift is destroyed and the aerodynamic drag of the aircraft more than doubles. The subsequent loss of lift causes the aircraft to fully settle on the main undercarriage and increases its potential braking force. The flaps remain in their landing configuration because of the drag benefits on deceleration. Should any of the thrust levers be advanced the speedbrake lever automatically moves to the down position and the spoilers retract.
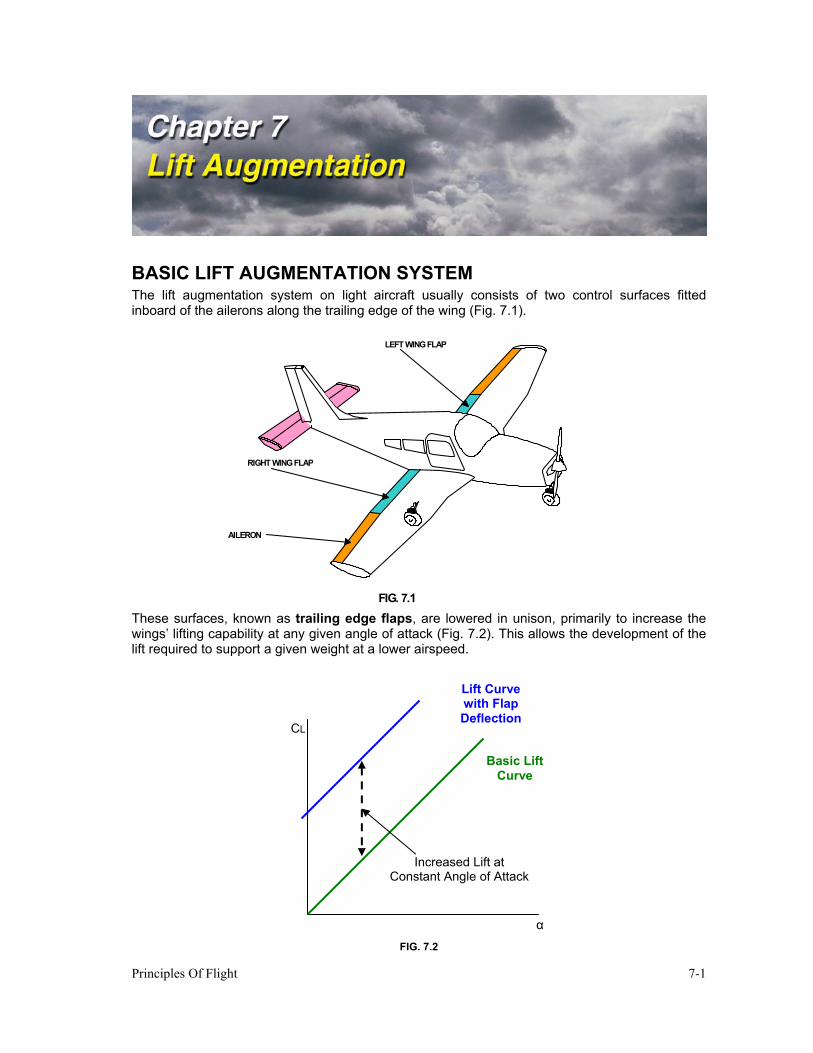
Principles Of Flight 7-1
BASIC LIFT AUGMENTATION SYSTEM The lift augmentation system on light aircraft usually consists of two control surfaces fitted inboard of the ailerons along the trailing edge of the wing (Fig. 7.1).
RIGHT WING FLAP
LEFT WING FLAP
AILERON
FIG. 7.1 These surfaces, known as trailing edge flaps, are lowered in unison, primarily to increase the wings’ lifting capability at any given angle of attack (Fig. 7.2). This allows the development of the lift required to support a given weight at a lower airspeed.
FIG. 7.2
CL
α
Basic Lift Curve
Lift Curve with Flap Deflection
Increased Lift at Constant Angle of Attack
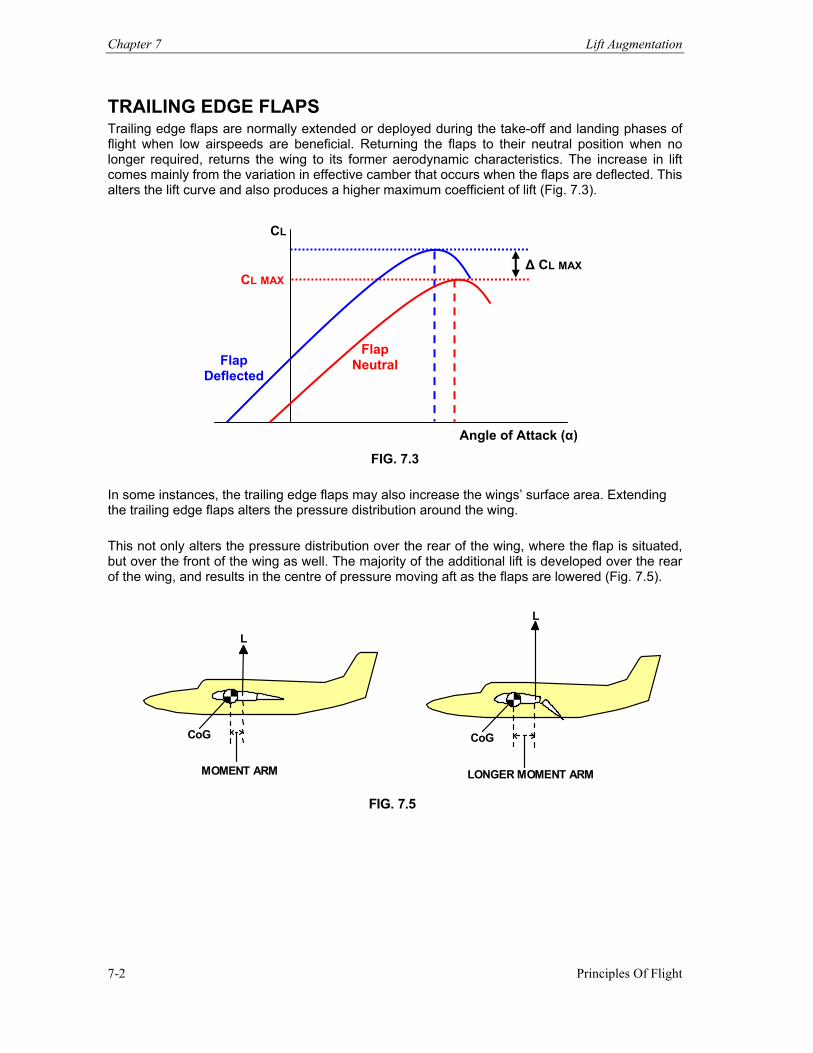
Chapter 7 Lift Augmentation
Principles Of Flight 7-2
TRAILING EDGE FLAPS Trailing edge flaps are normally extended or deployed during the take-off and landing phases of flight when low airspeeds are beneficial. Returning the flaps to their neutral position when no longer required, returns the wing to its former aerodynamic characteristics. The increase in lift comes mainly from the variation in effective camber that occurs when the flaps are deflected. This alters the lift curve and also produces a higher maximum coefficient of lift (Fig. 7.3).
FIG. 7.3
In some instances, the trailing edge flaps may also increase the wings’ surface area. Extending the trailing edge flaps alters the pressure distribution around the wing. This not only alters the pressure distribution over the rear of the wing, where the flap is situated, but over the front of the wing as well. The majority of the additional lift is developed over the rear of the wing, and results in the centre of pressure moving aft as the flaps are lowered (Fig. 7.5).
CoG
L
CoG
L
LONGER MOMENT ARM MOMENT ARM FIG. 7.5
Angle of Attack (α)
CL
CL MAX ∆ CL MAX
Flap Neutral Flap
Deflected
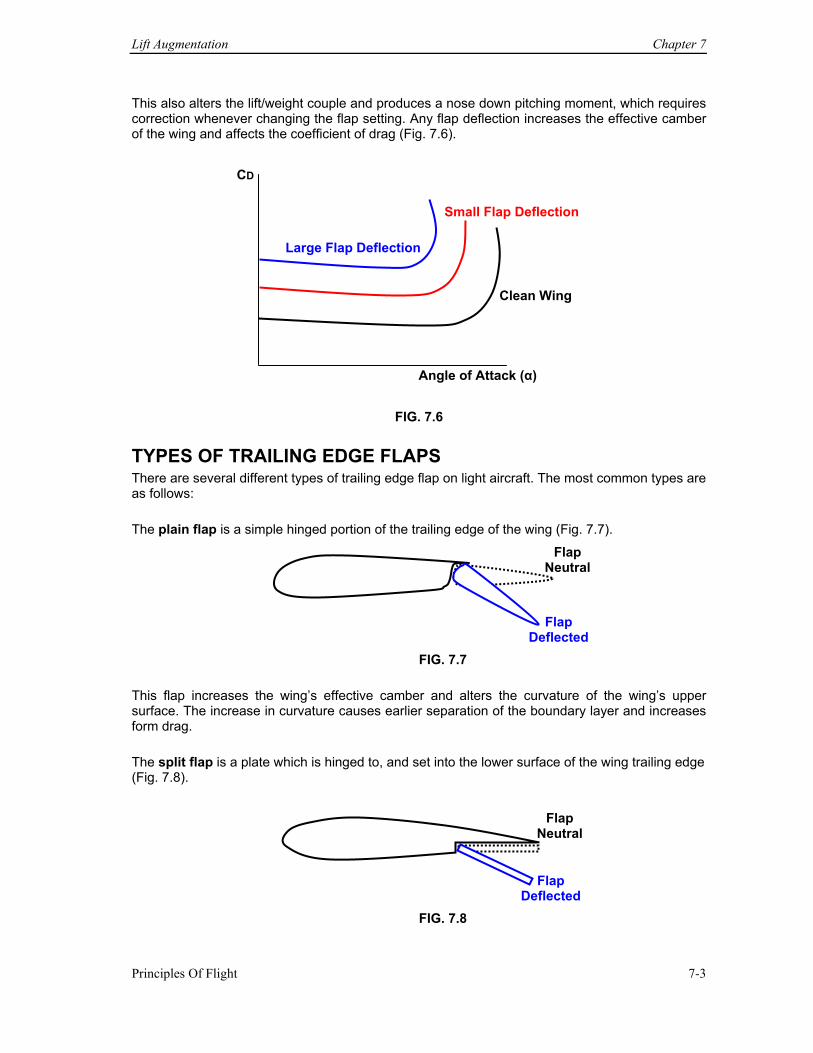
Lift Augmentation Chapter 7
Principles Of Flight 7-3
This also alters the lift/weight couple and produces a nose down pitching moment, which requires correction whenever changing the flap setting. Any flap deflection increases the effective camber of the wing and affects the coefficient of drag (Fig. 7.6).
FIG. 7.6
TYPES OF TRAILING EDGE FLAPS There are several different types of trailing edge flap on light aircraft. The most common types are as follows:
The plain flap is a simple hinged portion of the trailing edge of the wing (Fig. 7.7).
FIG. 7.7
This flap increases the wing’s effective camber and alters the curvature of the wing’s upper surface. The increase in curvature causes earlier separation of the boundary layer and increases form drag.
The split flap is a plate which is hinged to, and set into the lower surface of the wing trailing edge (Fig. 7.8).
FIG. 7.8
Angle of Attack (α)
CD
Clean Wing
Small Flap Deflection
Large Flap Deflection
Flap Neutral
Flap Deflected
Flap Neutral
Flap Deflected
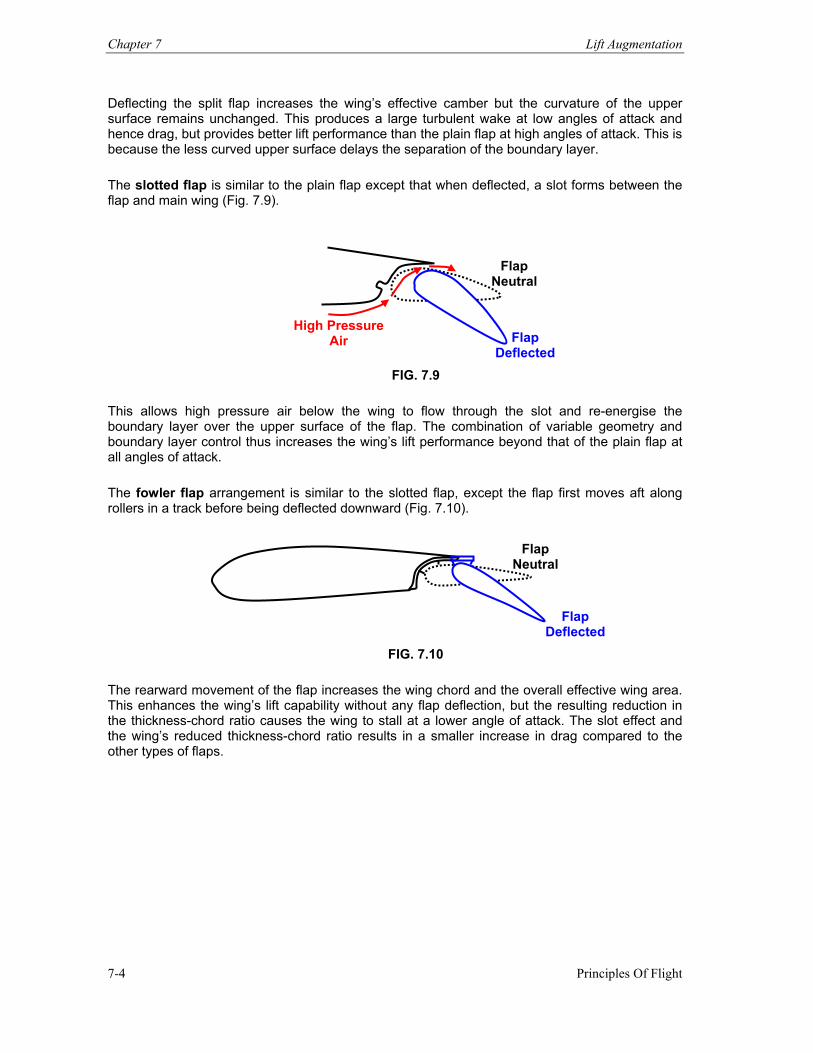
Chapter 7 Lift Augmentation
Principles Of Flight 7-4
Deflecting the split flap increases the wing’s effective camber but the curvature of the upper surface remains unchanged. This produces a large turbulent wake at low angles of attack and hence drag, but provides better lift performance than the plain flap at high angles of attack. This is because the less curved upper surface delays the separation of the boundary layer. The slotted flap is similar to the plain flap except that when deflected, a slot forms between the flap and main wing (Fig. 7.9).
FIG. 7.9
This allows high pressure air below the wing to flow through the slot and re-energise the boundary layer over the upper surface of the flap. The combination of variable geometry and boundary layer control thus increases the wing’s lift performance beyond that of the plain flap at all angles of attack. The fowler flap arrangement is similar to the slotted flap, except the flap first moves aft along rollers in a track before being deflected downward (Fig. 7.10).
FIG. 7.10
The rearward movement of the flap increases the wing chord and the overall effective wing area. This enhances the wing’s lift capability without any flap deflection, but the resulting reduction in the thickness-chord ratio causes the wing to stall at a lower angle of attack. The slot effect and the wing’s reduced thickness-chord ratio results in a smaller increase in drag compared to the other types of flaps.
Flap Neutral
Flap Deflected
High Pressure Air
Flap Neutral
Flap Deflected
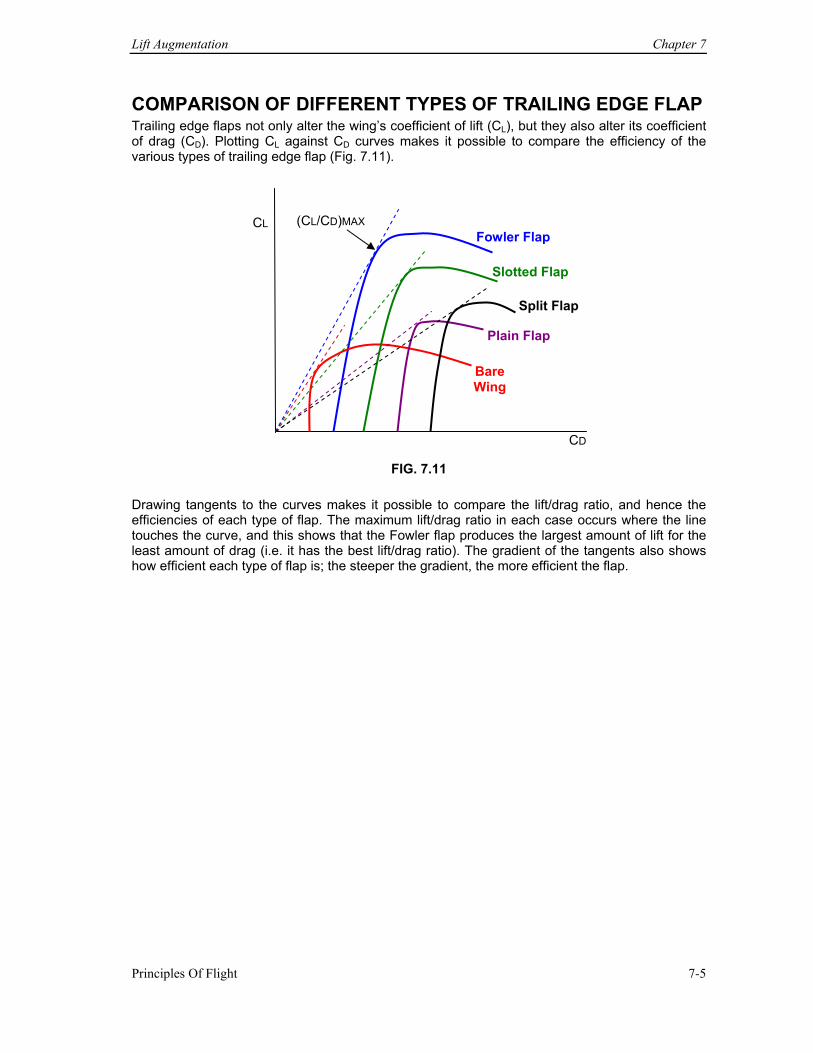
Lift Augmentation Chapter 7
Principles Of Flight 7-5
COMPARISON OF DIFFERENT TYPES OF TRAILING EDGE FLAP Trailing edge flaps not only alter the wing’s coefficient of lift (CL), but they also alter its coefficient of drag (CD). Plotting CL against CD curves makes it possible to compare the efficiency of the various types of trailing edge flap (Fig. 7.11).
FIG. 7.11
Drawing tangents to the curves makes it possible to compare the lift/drag ratio, and hence the efficiencies of each type of flap. The maximum lift/drag ratio in each case occurs where the line touches the curve, and this shows that the Fowler flap produces the largest amount of lift for the least amount of drag (i.e. it has the best lift/drag ratio). The gradient of the tangents also shows how efficient each type of flap is; the steeper the gradient, the more efficient the flap.
CL
CD
Bare Wing
Plain Flap
Split Flap
Slotted Flap
Fowler Flap (CL/CD)MAX
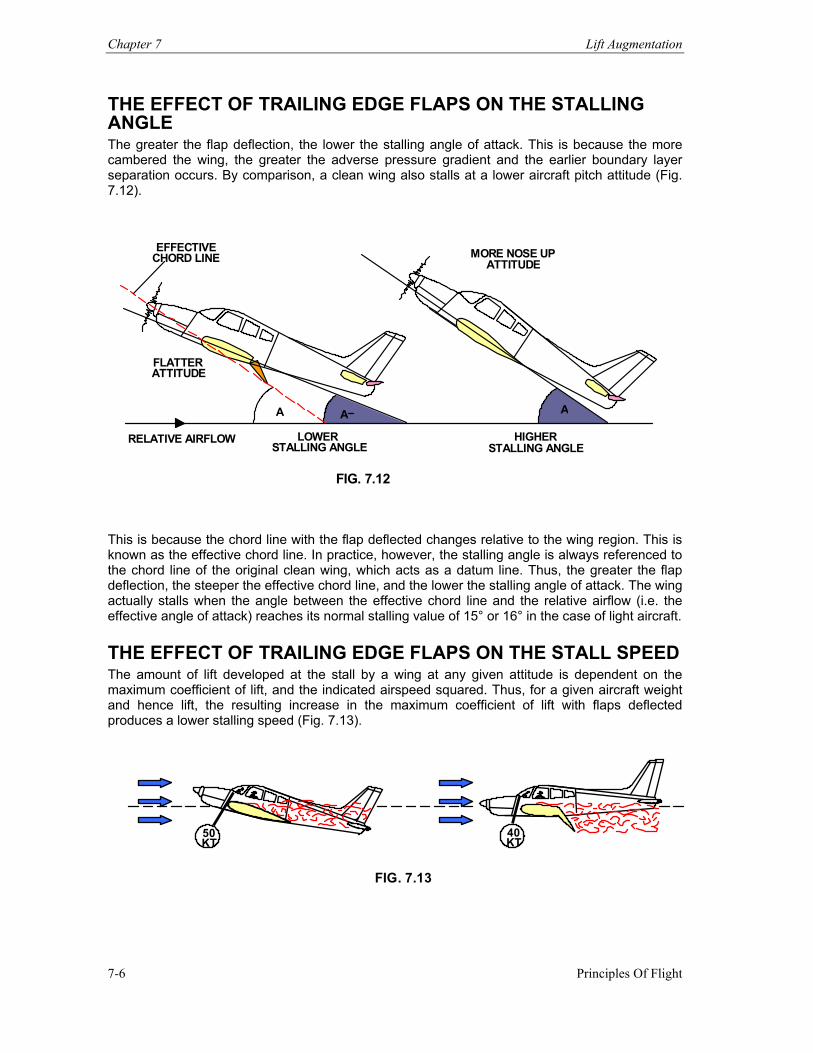
Chapter 7 Lift Augmentation
Principles Of Flight 7-6
THE EFFECT OF TRAILING EDGE FLAPS ON THE STALLING ANGLE The greater the flap deflection, the lower the stalling angle of attack. This is because the more cambered the wing, the greater the adverse pressure gradient and the earlier boundary layer separation occurs. By comparison, a clean wing also stalls at a lower aircraft pitch attitude (Fig. 7.12).
A AA
MORE NOSE UPATTITUDE
EFFECTIVE CHORD LINE
FLATTER ATTITUDE
RELATIVE AIRFLOW LOWERSTALLING ANGLE
HIGHERSTALLING ANGLE
FIG. 7.12
This is because the chord line with the flap deflected changes relative to the wing region. This is known as the effective chord line. In practice, however, the stalling angle is always referenced to the chord line of the original clean wing, which acts as a datum line. Thus, the greater the flap deflection, the steeper the effective chord line, and the lower the stalling angle of attack. The wing actually stalls when the angle between the effective chord line and the relative airflow (i.e. the effective angle of attack) reaches its normal stalling value of 15° or 16° in the case of light aircraft. THE EFFECT OF TRAILING EDGE FLAPS ON THE STALL SPEED The amount of lift developed at the stall by a wing at any given attitude is dependent on the maximum coefficient of lift, and the indicated airspeed squared. Thus, for a given aircraft weight and hence lift, the resulting increase in the maximum coefficient of lift with flaps deflected produces a lower stalling speed (Fig. 7.13).
50 KT 40
KT
FIG. 7.13
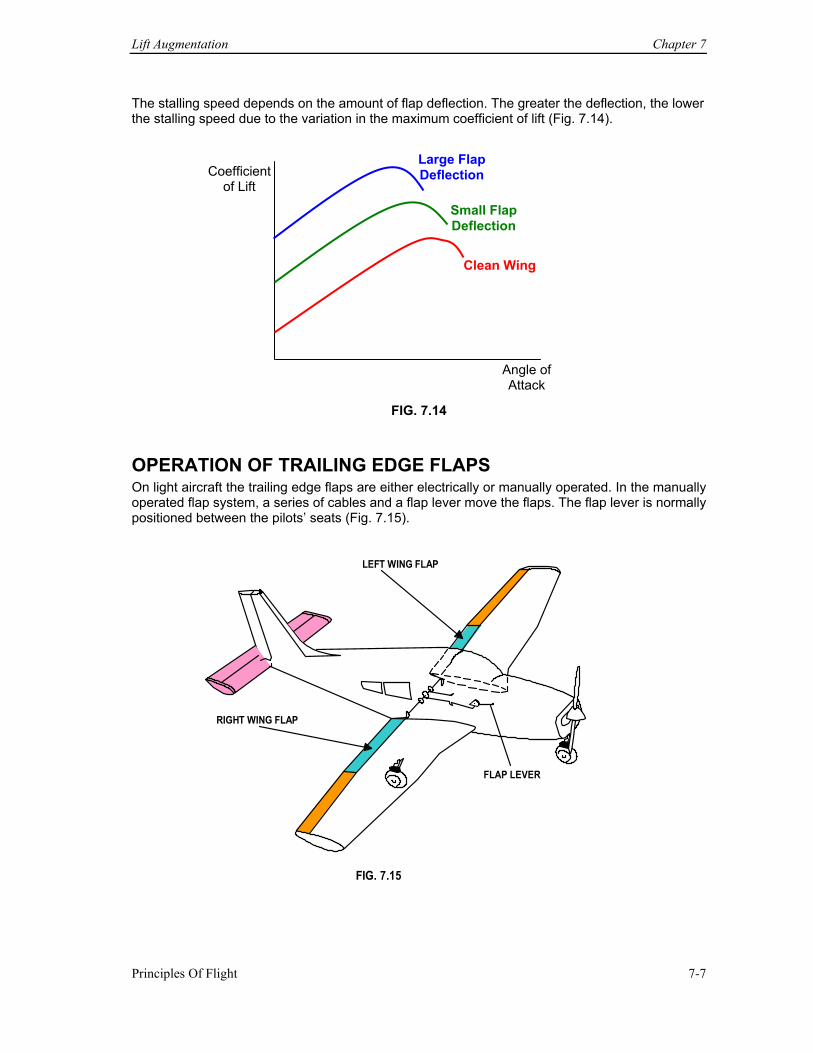
Lift Augmentation Chapter 7
Principles Of Flight 7-7
The stalling speed depends on the amount of flap deflection. The greater the deflection, the lower the stalling speed due to the variation in the maximum coefficient of lift (Fig. 7.14).
FIG. 7.14
OPERATION OF TRAILING EDGE FLAPS On light aircraft the trailing edge flaps are either electrically or manually operated. In the manually operated flap system, a series of cables and a flap lever move the flaps. The flap lever is normally positioned between the pilots’ seats (Fig. 7.15).
RIGHT WING FLAP
LEFT WING FLAP
FLAP LEVER
FIG. 7.15
Angle of Attack
Coefficient of Lift
Large Flap Deflection
Small Flap Deflection
Clean Wing
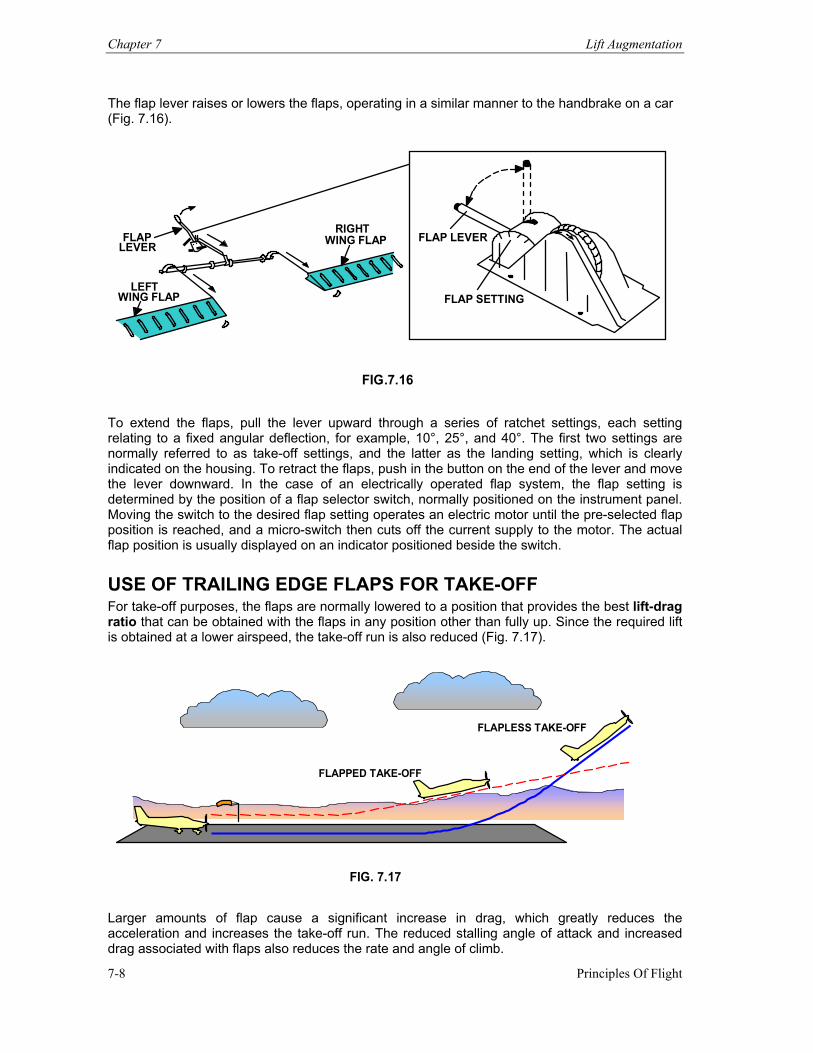
Chapter 7 Lift Augmentation
Principles Of Flight 7-8
The flap lever raises or lowers the flaps, operating in a similar manner to the handbrake on a car (Fig. 7.16).
FLAP LEVER
FLAP SETTING
FLAP WING FLAP
LEFT WING FLAP
RIGHTLEVER
FIG.7.16
To extend the flaps, pull the lever upward through a series of ratchet settings, each setting relating to a fixed angular deflection, for example, 10°, 25°, and 40°. The first two settings are normally referred to as take-off settings, and the latter as the landing setting, which is clearly indicated on the housing. To retract the flaps, push in the button on the end of the lever and move the lever downward. In the case of an electrically operated flap system, the flap setting is determined by the position of a flap selector switch, normally positioned on the instrument panel. Moving the switch to the desired flap setting operates an electric motor until the pre-selected flap position is reached, and a micro-switch then cuts off the current supply to the motor. The actual flap position is usually displayed on an indicator positioned beside the switch.
USE OF TRAILING EDGE FLAPS FOR TAKE-OFF For take-off purposes, the flaps are normally lowered to a position that provides the best lift-drag ratio that can be obtained with the flaps in any position other than fully up. Since the required lift is obtained at a lower airspeed, the take-off run is also reduced (Fig. 7.17).
FLAPPED TAKE-OFF
FLAPLESS TAKE-OFF
FIG. 7.17 Larger amounts of flap cause a significant increase in drag, which greatly reduces the acceleration and increases the take-off run. The reduced stalling angle of attack and increased drag associated with flaps also reduces the rate and angle of climb.
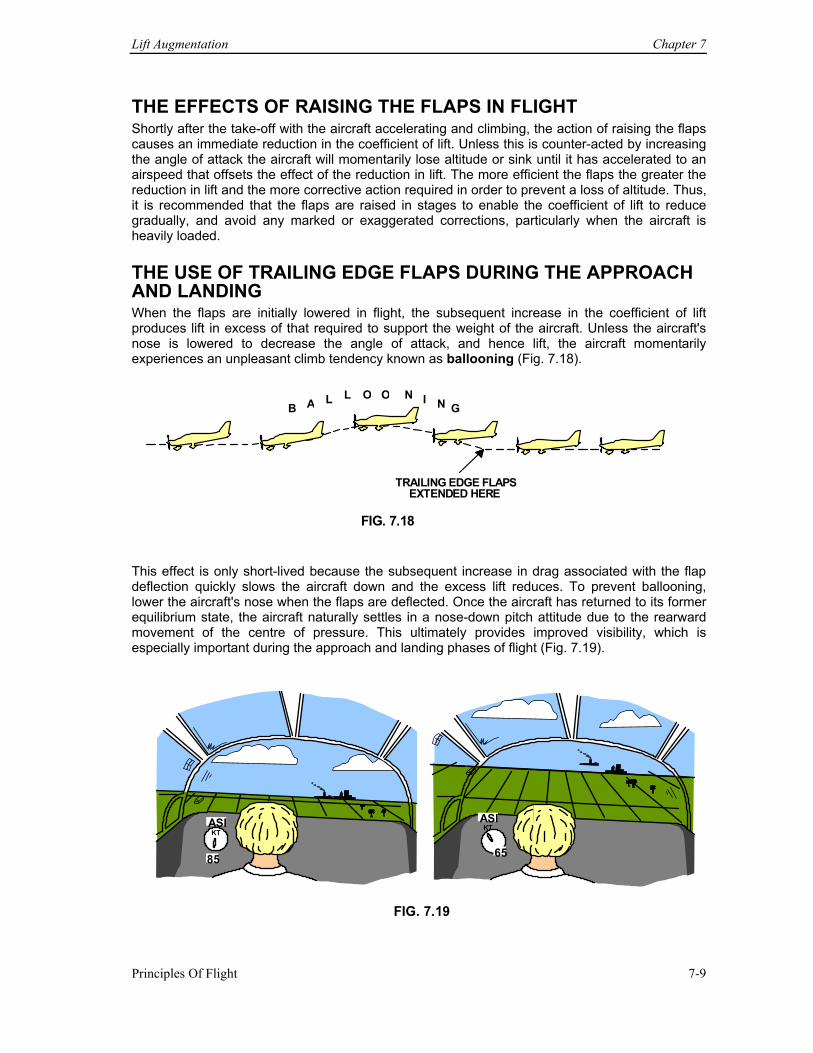
Lift Augmentation Chapter 7
Principles Of Flight 7-9
THE EFFECTS OF RAISING THE FLAPS IN FLIGHT Shortly after the take-off with the aircraft accelerating and climbing, the action of raising the flaps causes an immediate reduction in the coefficient of lift. Unless this is counter-acted by increasing the angle of attack the aircraft will momentarily lose altitude or sink until it has accelerated to an airspeed that offsets the effect of the reduction in lift. The more efficient the flaps the greater the reduction in lift and the more corrective action required in order to prevent a loss of altitude. Thus, it is recommended that the flaps are raised in stages to enable the coefficient of lift to reduce gradually, and avoid any marked or exaggerated corrections, particularly when the aircraft is heavily loaded. THE USE OF TRAILING EDGE FLAPS DURING THE APPROACH AND LANDING When the flaps are initially lowered in flight, the subsequent increase in the coefficient of lift produces lift in excess of that required to support the weight of the aircraft. Unless the aircraft's nose is lowered to decrease the angle of attack, and hence lift, the aircraft momentarily experiences an unpleasant climb tendency known as ballooning (Fig. 7.18).
B A L L O O N I N G
TRAILING EDGE FLAPSEXTENDED HERE
FIG. 7.18
This effect is only short-lived because the subsequent increase in drag associated with the flap deflection quickly slows the aircraft down and the excess lift reduces. To prevent ballooning, lower the aircraft's nose when the flaps are deflected. Once the aircraft has returned to its former equilibrium state, the aircraft naturally settles in a nose-down pitch attitude due to the rearward movement of the centre of pressure. This ultimately provides improved visibility, which is especially important during the approach and landing phases of flight (Fig. 7.19).
ASI 85
KT
FIG. 7.19
KT
65
ASI
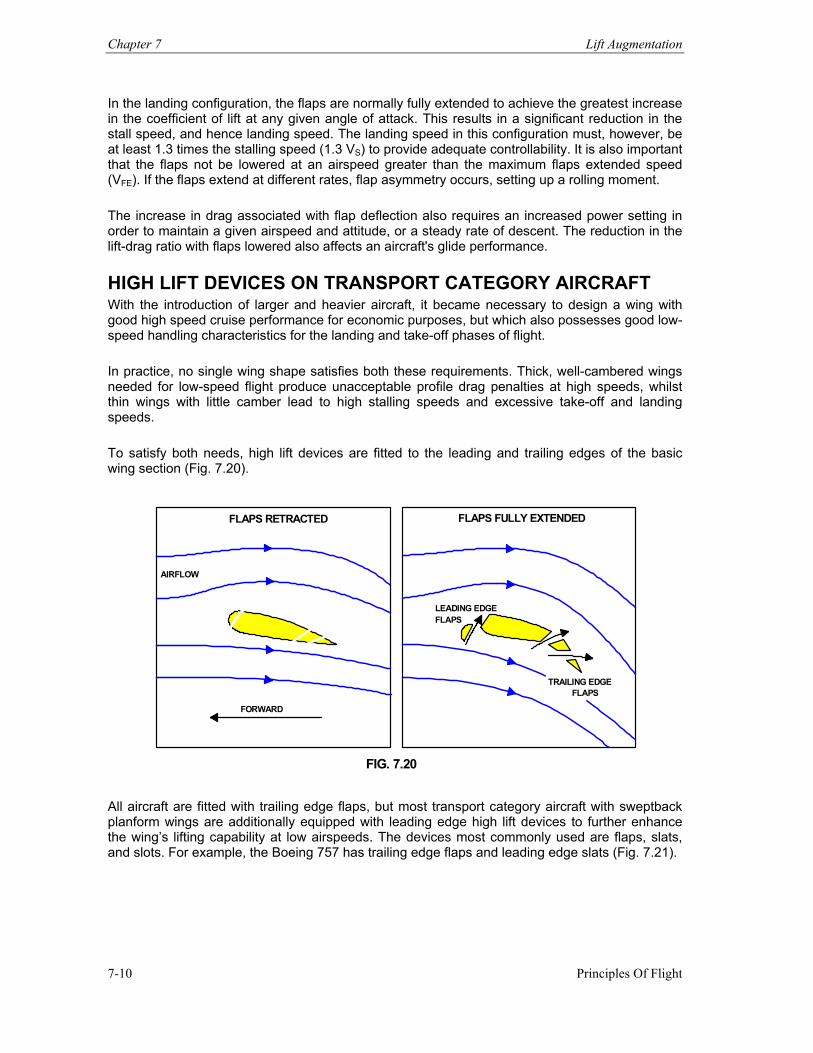
Chapter 7 Lift Augmentation
Principles Of Flight 7-10
In the landing configuration, the flaps are normally fully extended to achieve the greatest increase in the coefficient of lift at any given angle of attack. This results in a significant reduction in the stall speed, and hence landing speed. The landing speed in this configuration must, however, be at least 1.3 times the stalling speed (1.3 VS) to provide adequate controllability. It is also important that the flaps not be lowered at an airspeed greater than the maximum flaps extended speed (VFE). If the flaps extend at different rates, flap asymmetry occurs, setting up a rolling moment. The increase in drag associated with flap deflection also requires an increased power setting in order to maintain a given airspeed and attitude, or a steady rate of descent. The reduction in the lift-drag ratio with flaps lowered also affects an aircraft's glide performance. HIGH LIFT DEVICES ON TRANSPORT CATEGORY AIRCRAFT With the introduction of larger and heavier aircraft, it became necessary to design a wing with good high speed cruise performance for economic purposes, but which also possesses good low-speed handling characteristics for the landing and take-off phases of flight. In practice, no single wing shape satisfies both these requirements. Thick, well-cambered wings needed for low-speed flight produce unacceptable profile drag penalties at high speeds, whilst thin wings with little camber lead to high stalling speeds and excessive take-off and landing speeds. To satisfy both needs, high lift devices are fitted to the leading and trailing edges of the basic wing section (Fig. 7.20).
FLAPS RETRACTED FLAPS FULLY EXTENDED
AIRFLOW
FORWARD
LEADING EDGEFLAPS
TRAILING EDGE FLAPS
FIG. 7.20
All aircraft are fitted with trailing edge flaps, but most transport category aircraft with sweptback planform wings are additionally equipped with leading edge high lift devices to further enhance the wing’s lifting capability at low airspeeds. The devices most commonly used are flaps, slats, and slots. For example, the Boeing 757 has trailing edge flaps and leading edge slats (Fig. 7.21).
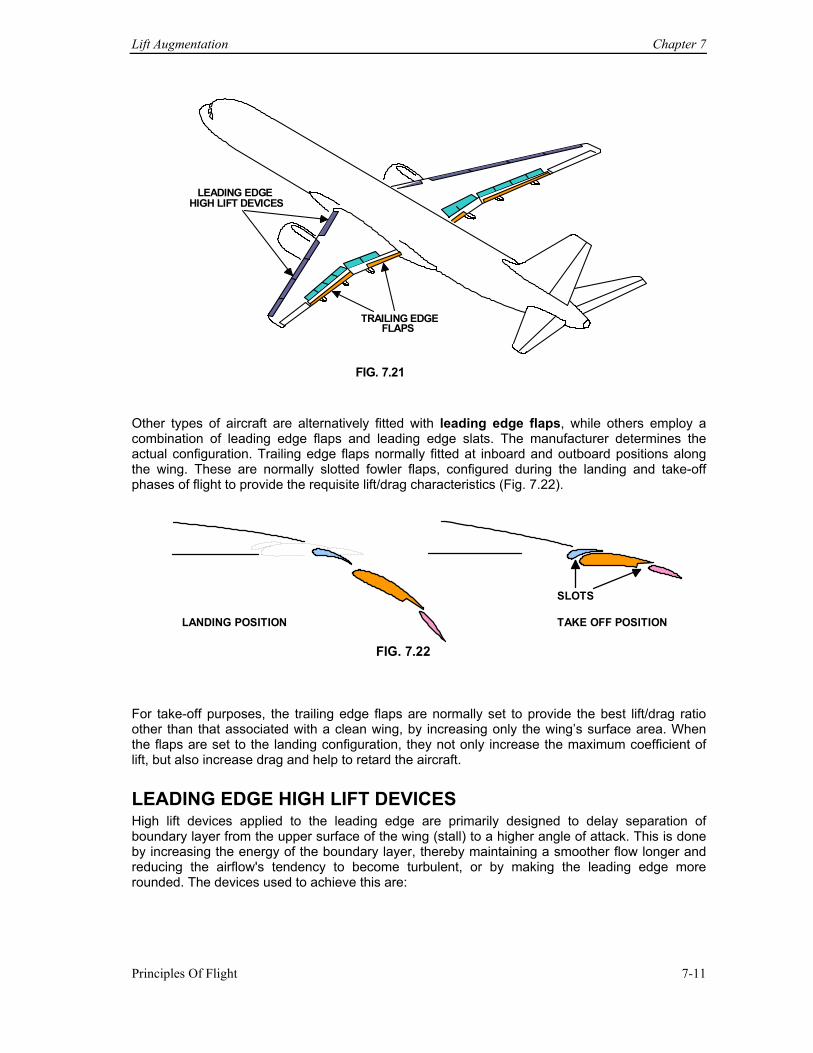
Lift Augmentation Chapter 7
Principles Of Flight 7-11
LEADING EDGE HIGH LIFT DEVICES
TRAILING EDGEFLAPS
FIG. 7.21
Other types of aircraft are alternatively fitted with leading edge flaps, while others employ a combination of leading edge flaps and leading edge slats. The manufacturer determines the actual configuration. Trailing edge flaps normally fitted at inboard and outboard positions along the wing. These are normally slotted fowler flaps, configured during the landing and take-off phases of flight to provide the requisite lift/drag characteristics (Fig. 7.22).
LANDING POSITION FIG. 7.22
SLOTS TAKE OFF POSITION
For take-off purposes, the trailing edge flaps are normally set to provide the best lift/drag ratio other than that associated with a clean wing, by increasing only the wing’s surface area. When the flaps are set to the landing configuration, they not only increase the maximum coefficient of lift, but also increase drag and help to retard the aircraft.
LEADING EDGE HIGH LIFT DEVICES High lift devices applied to the leading edge are primarily designed to delay separation of boundary layer from the upper surface of the wing (stall) to a higher angle of attack. This is done by increasing the energy of the boundary layer, thereby maintaining a smoother flow longer and reducing the airflow's tendency to become turbulent, or by making the leading edge more rounded. The devices used to achieve this are:
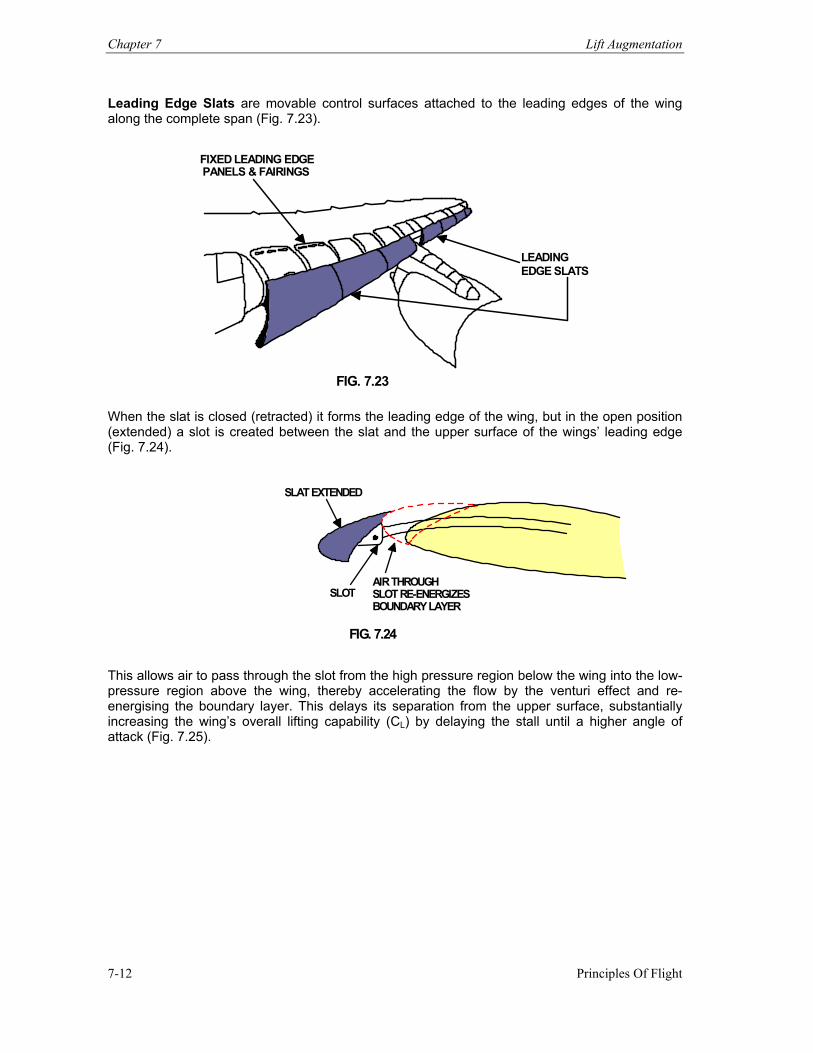
Chapter 7 Lift Augmentation
Principles Of Flight 7-12
Leading Edge Slats are movable control surfaces attached to the leading edges of the wing along the complete span (Fig. 7.23).
FIXED LEADING EDGE PANELS & FAIRINGS
LEADINGEDGE SLATS
FIG. 7.23
When the slat is closed (retracted) it forms the leading edge of the wing, but in the open position (extended) a slot is created between the slat and the upper surface of the wings’ leading edge (Fig. 7.24).
SLAT EXTENDED
SLOTAIR THROUGHSLOT RE-ENERGIZESBOUNDARY LAYER
FIG. 7.24
This allows air to pass through the slot from the high pressure region below the wing into the low-pressure region above the wing, thereby accelerating the flow by the venturi effect and re-energising the boundary layer. This delays its separation from the upper surface, substantially increasing the wing’s overall lifting capability (CL) by delaying the stall until a higher angle of attack (Fig. 7.25).
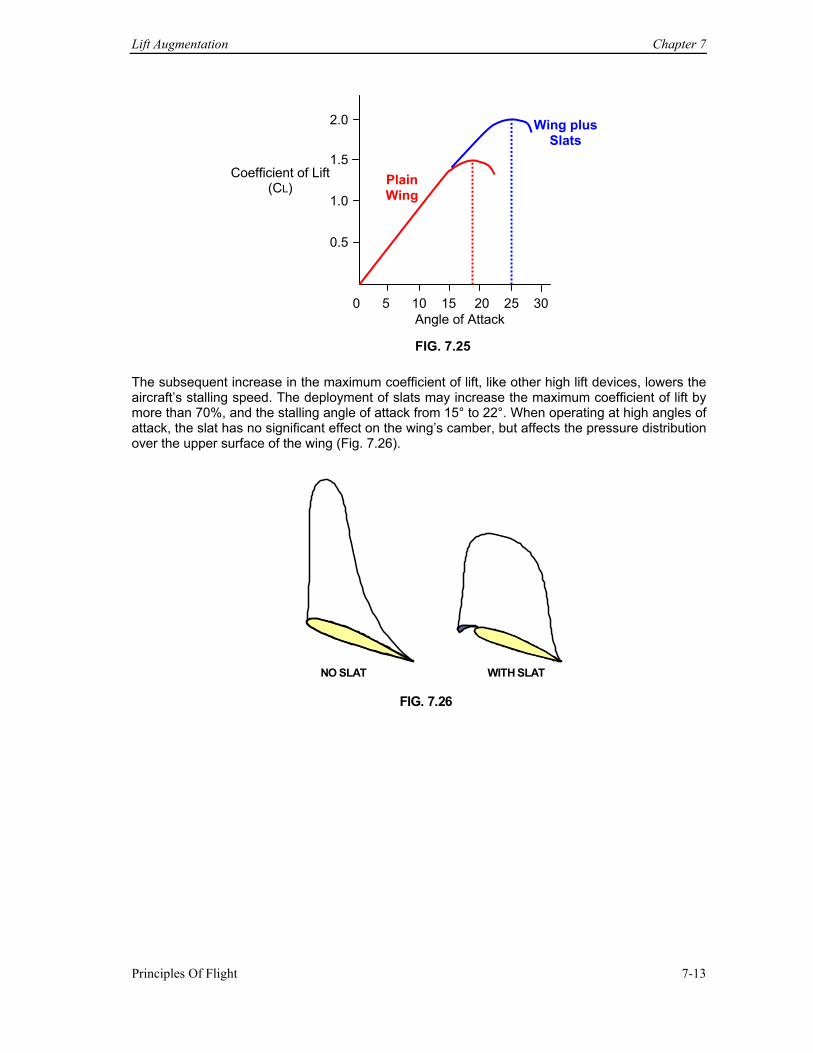
Lift Augmentation Chapter 7
Principles Of Flight 7-13
FIG. 7.25
The subsequent increase in the maximum coefficient of lift, like other high lift devices, lowers the aircraft’s stalling speed. The deployment of slats may increase the maximum coefficient of lift by more than 70%, and the stalling angle of attack from 15° to 22°. When operating at high angles of attack, the slat has no significant effect on the wing’s camber, but affects the pressure distribution over the upper surface of the wing (Fig. 7.26).
NO SLAT WITH SLAT
FIG. 7.26
2.0
1.5
1.0
0.5
0 5 10 15 20 25 30Angle of Attack
Coefficient of Lift (CL)
Wing plus Slats
Plain Wing
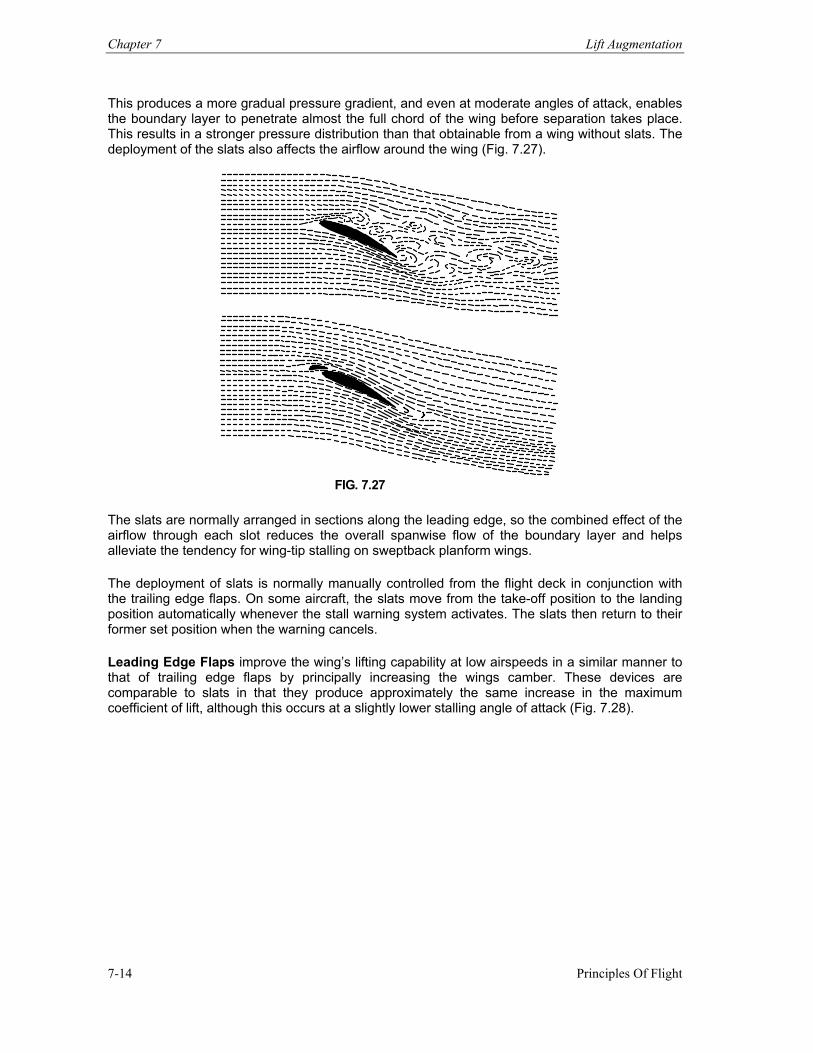
Chapter 7 Lift Augmentation
Principles Of Flight 7-14
This produces a more gradual pressure gradient, and even at moderate angles of attack, enables the boundary layer to penetrate almost the full chord of the wing before separation takes place. This results in a stronger pressure distribution than that obtainable from a wing without slats. The deployment of the slats also affects the airflow around the wing (Fig. 7.27).
FIG. 7.27
The slats are normally arranged in sections along the leading edge, so the combined effect of the airflow through each slot reduces the overall spanwise flow of the boundary layer and helps alleviate the tendency for wing-tip stalling on sweptback planform wings. The deployment of slats is normally manually controlled from the flight deck in conjunction with the trailing edge flaps. On some aircraft, the slats move from the take-off position to the landing position automatically whenever the stall warning system activates. The slats then return to their former set position when the warning cancels. Leading Edge Flaps improve the wing’s lifting capability at low airspeeds in a similar manner to that of trailing edge flaps by principally increasing the wings camber. These devices are comparable to slats in that they produce approximately the same increase in the maximum coefficient of lift, although this occurs at a slightly lower stalling angle of attack (Fig. 7.28).
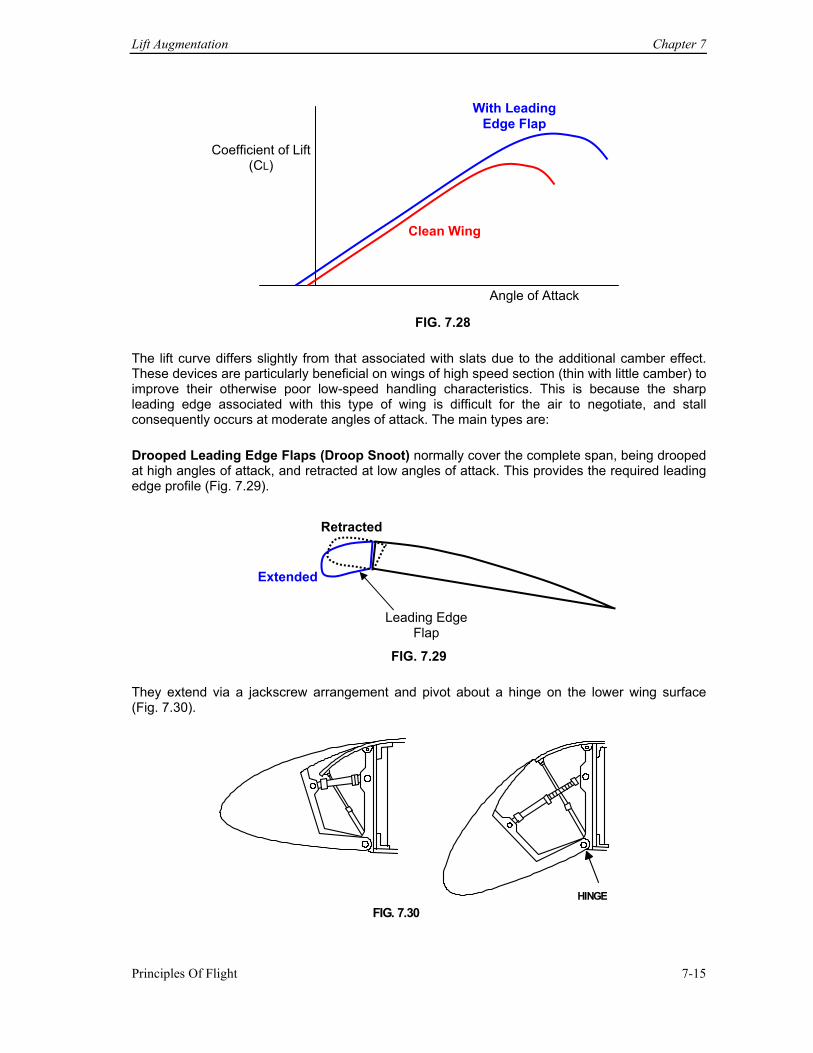
Lift Augmentation Chapter 7
Principles Of Flight 7-15
FIG. 7.28
The lift curve differs slightly from that associated with slats due to the additional camber effect. These devices are particularly beneficial on wings of high speed section (thin with little camber) to improve their otherwise poor low-speed handling characteristics. This is because the sharp leading edge associated with this type of wing is difficult for the air to negotiate, and stall consequently occurs at moderate angles of attack. The main types are: Drooped Leading Edge Flaps (Droop Snoot) normally cover the complete span, being drooped at high angles of attack, and retracted at low angles of attack. This provides the required leading edge profile (Fig. 7.29).
FIG. 7.29
They extend via a jackscrew arrangement and pivot about a hinge on the lower wing surface (Fig. 7.30).
HINGEFIG. 7.30
Angle of Attack
Coefficient of Lift (CL)
Clean Wing
With Leading Edge Flap
Extended
Retracted
Leading Edge Flap
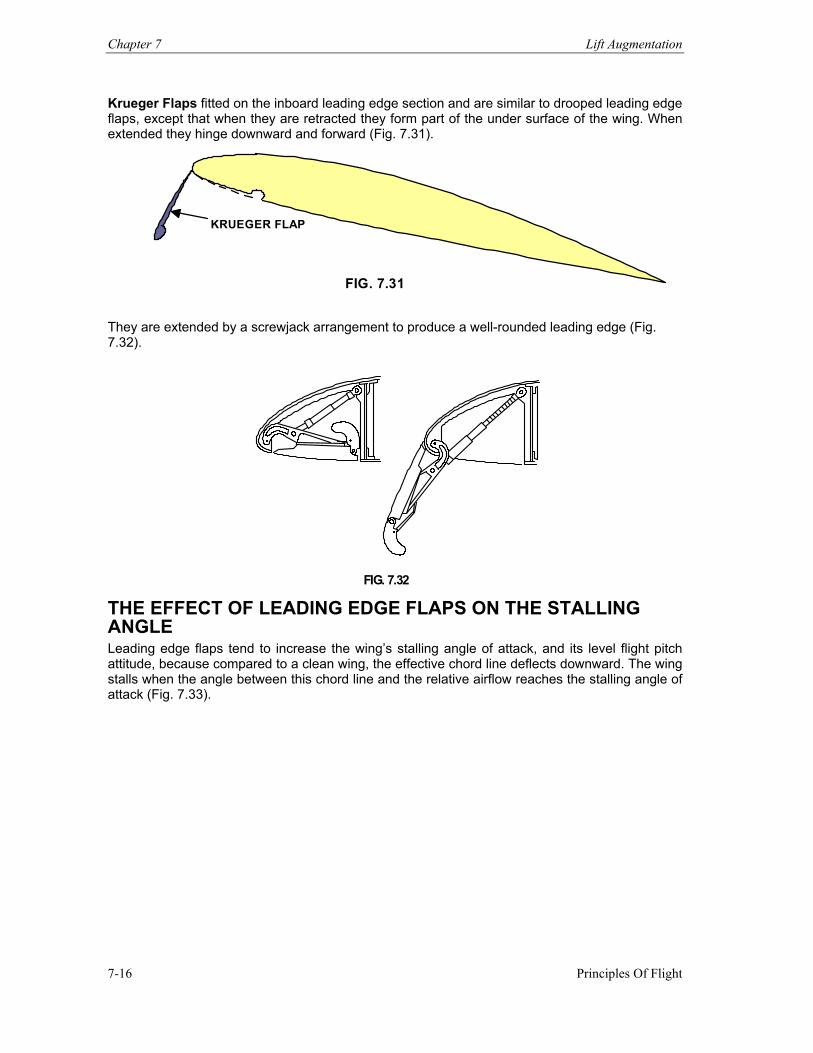
Chapter 7 Lift Augmentation
Principles Of Flight 7-16
Krueger Flaps fitted on the inboard leading edge section and are similar to drooped leading edge flaps, except that when they are retracted they form part of the under surface of the wing. When extended they hinge downward and forward (Fig. 7.31).
KRUEGER FLAP
FIG. 7.31
They are extended by a screwjack arrangement to produce a well-rounded leading edge (Fig. 7.32).
FIG. 7.32
THE EFFECT OF LEADING EDGE FLAPS ON THE STALLING ANGLE Leading edge flaps tend to increase the wing’s stalling angle of attack, and its level flight pitch attitude, because compared to a clean wing, the effective chord line deflects downward. The wing stalls when the angle between this chord line and the relative airflow reaches the stalling angle of attack (Fig. 7.33).
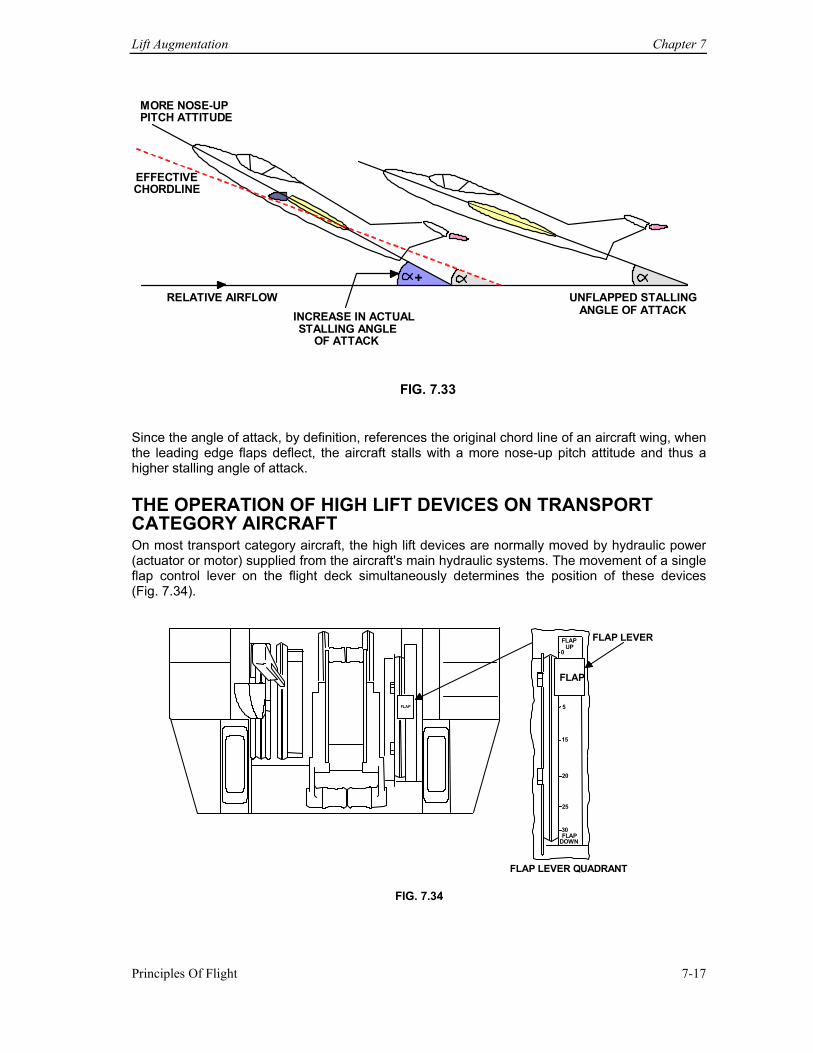
Lift Augmentation Chapter 7
Principles Of Flight 7-17
MORE NOSE-UP PITCH ATTITUDE
EFFECTIVE CHORDLINE
RELATIVE AIRFLOW INCREASE IN ACTUALSTALLING ANGLE
OF ATTACK
UNFLAPPED STALLINGANGLE OF ATTACK
+
FIG. 7.33
Since the angle of attack, by definition, references the original chord line of an aircraft wing, when the leading edge flaps deflect, the aircraft stalls with a more nose-up pitch attitude and thus a higher stalling angle of attack. THE OPERATION OF HIGH LIFT DEVICES ON TRANSPORT CATEGORY AIRCRAFT On most transport category aircraft, the high lift devices are normally moved by hydraulic power (actuator or motor) supplied from the aircraft's main hydraulic systems. The movement of a single flap control lever on the flight deck simultaneously determines the position of these devices (Fig. 7.34).
FLAP UP
FLAP 0
5
15
20
25
30FLAP
DOWN
FLAP LEVER
FLAP LEVER QUADRANT
FLAP
FIG. 7.34
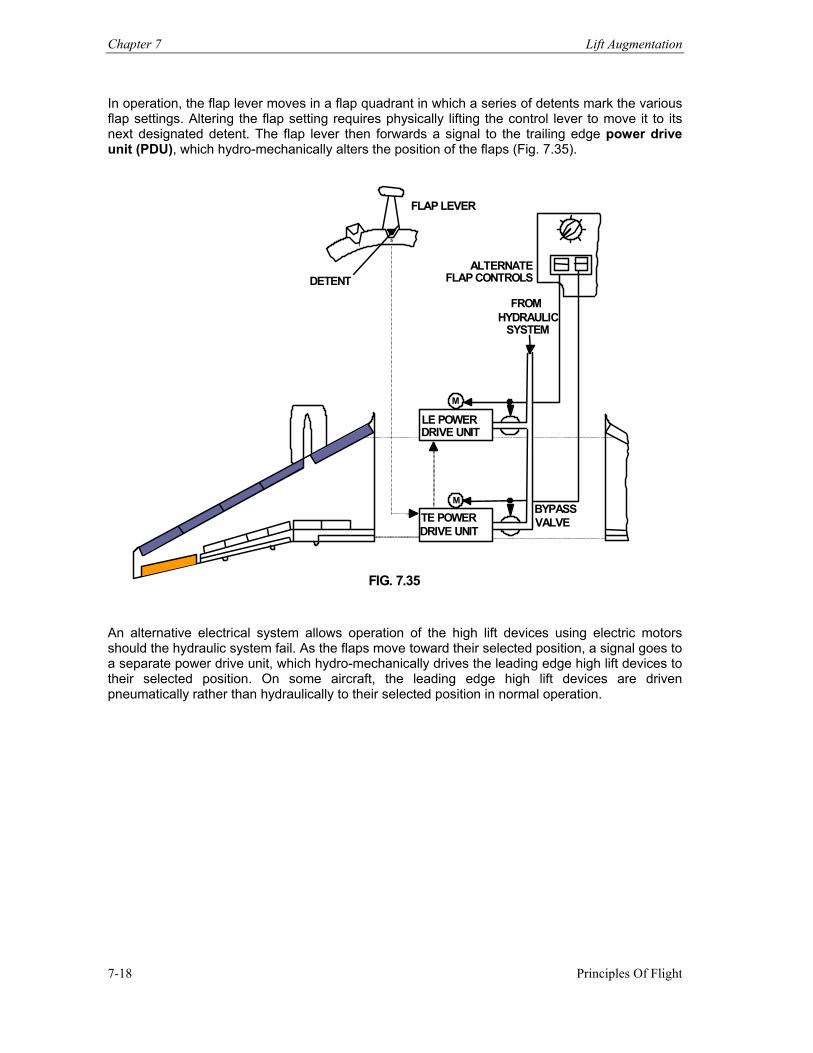
Chapter 7 Lift Augmentation
Principles Of Flight 7-18
In operation, the flap lever moves in a flap quadrant in which a series of detents mark the various flap settings. Altering the flap setting requires physically lifting the control lever to move it to its next designated detent. The flap lever then forwards a signal to the trailing edge power drive unit (PDU), which hydro-mechanically alters the position of the flaps (Fig. 7.35).
FLAP LEVER
DETENT
15
ALTERNATEFLAP CONTROLS
HYDRAULICSYSTEM
FROM
M
M
LE POWER
TE POWER
DRIVE UNIT
DRIVE UNIT
BYPASS VALVE
FIG. 7.35
An alternative electrical system allows operation of the high lift devices using electric motors should the hydraulic system fail. As the flaps move toward their selected position, a signal goes to a separate power drive unit, which hydro-mechanically drives the leading edge high lift devices to their selected position. On some aircraft, the leading edge high lift devices are driven pneumatically rather than hydraulically to their selected position in normal operation.
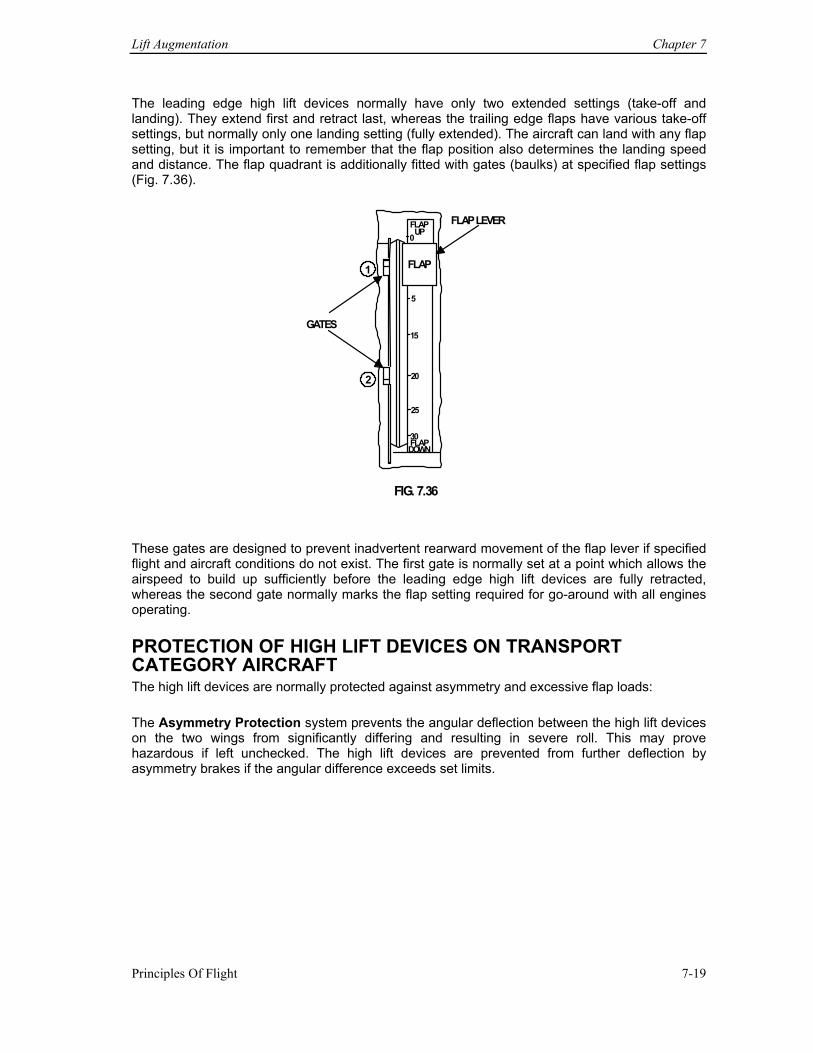
Lift Augmentation Chapter 7
Principles Of Flight 7-19
The leading edge high lift devices normally have only two extended settings (take-off and landing). They extend first and retract last, whereas the trailing edge flaps have various take-off settings, but normally only one landing setting (fully extended). The aircraft can land with any flap setting, but it is important to remember that the flap position also determines the landing speed and distance. The flap quadrant is additionally fitted with gates (baulks) at specified flap settings (Fig. 7.36).
FLAPUP
FLAP
0
5
15
20
25
30FLAPDOWN
FLAP LEVER
GATES
1
2
FIG. 7.36
These gates are designed to prevent inadvertent rearward movement of the flap lever if specified flight and aircraft conditions do not exist. The first gate is normally set at a point which allows the airspeed to build up sufficiently before the leading edge high lift devices are fully retracted, whereas the second gate normally marks the flap setting required for go-around with all engines operating. PROTECTION OF HIGH LIFT DEVICES ON TRANSPORT CATEGORY AIRCRAFT The high lift devices are normally protected against asymmetry and excessive flap loads: The Asymmetry Protection system prevents the angular deflection between the high lift devices on the two wings from significantly differing and resulting in severe roll. This may prove hazardous if left unchecked. The high lift devices are prevented from further deflection by asymmetry brakes if the angular difference exceeds set limits.
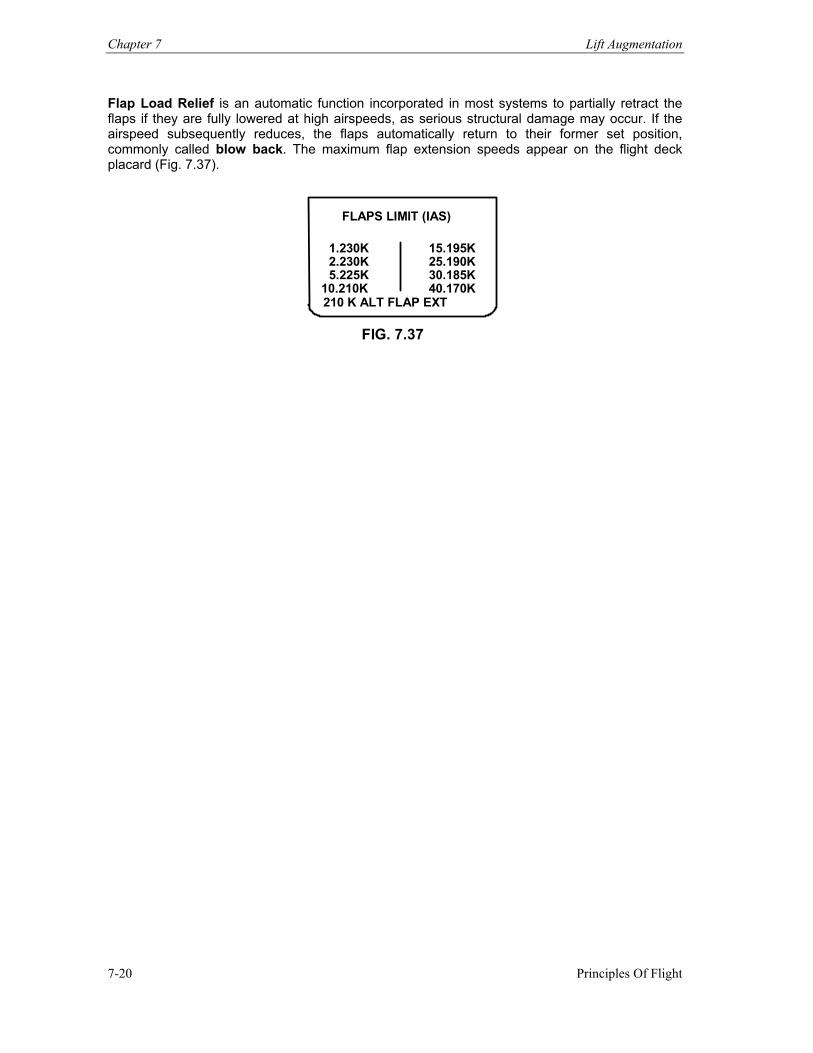
Chapter 7 Lift Augmentation
Principles Of Flight 7-20
Flap Load Relief is an automatic function incorporated in most systems to partially retract the flaps if they are fully lowered at high airspeeds, as serious structural damage may occur. If the airspeed subsequently reduces, the flaps automatically return to their former set position, commonly called blow back. The maximum flap extension speeds appear on the flight deck placard (Fig. 7.37).
FLAPS LIMIT (IAS)
1.230K2.230K5.225K
10.210K
15.195K25.190K30.185K40.170K
210 K ALT FLAP EXT
FIG. 7.37
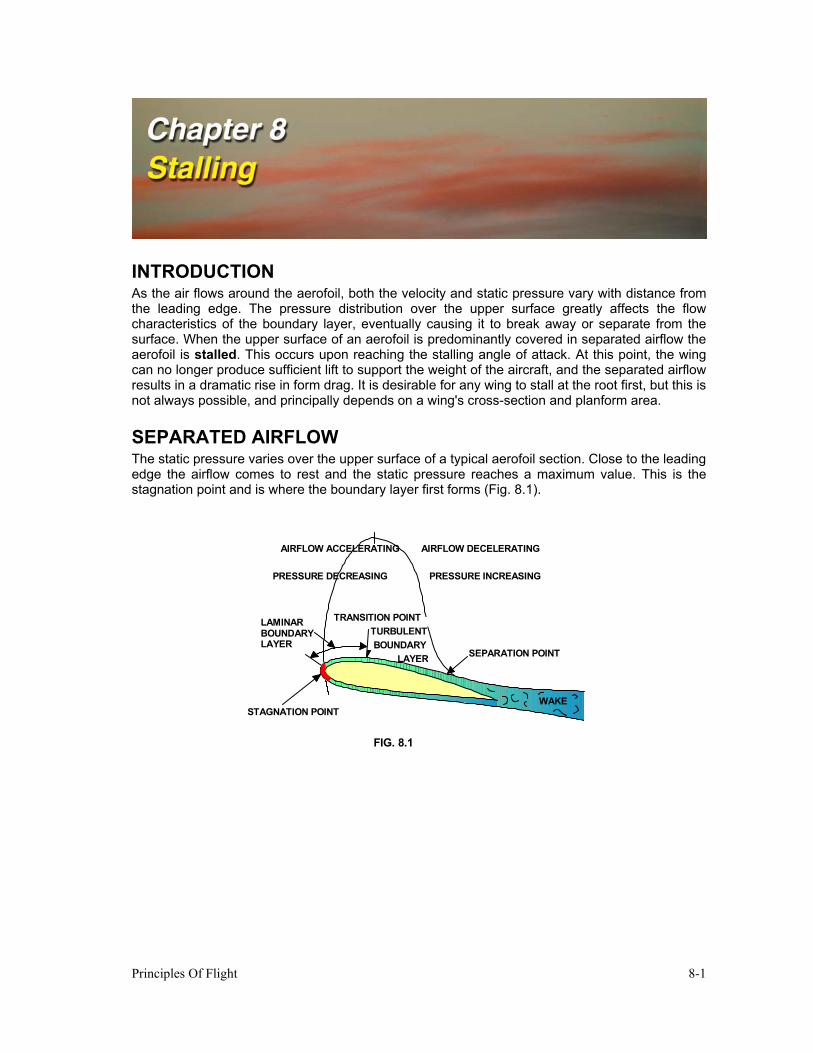
Principles Of Flight 8-1
INTRODUCTION As the air flows around the aerofoil, both the velocity and static pressure vary with distance from the leading edge. The pressure distribution over the upper surface greatly affects the flow characteristics of the boundary layer, eventually causing it to break away or separate from the surface. When the upper surface of an aerofoil is predominantly covered in separated airflow the aerofoil is stalled. This occurs upon reaching the stalling angle of attack. At this point, the wing can no longer produce sufficient lift to support the weight of the aircraft, and the separated airflow results in a dramatic rise in form drag. It is desirable for any wing to stall at the root first, but this is not always possible, and principally depends on a wing's cross-section and planform area. SEPARATED AIRFLOW The static pressure varies over the upper surface of a typical aerofoil section. Close to the leading edge the airflow comes to rest and the static pressure reaches a maximum value. This is the stagnation point and is where the boundary layer first forms (Fig. 8.1).
STAGNATION POINT
SEPARATION POINT
TRANSITION POINT
AIRFLOW ACCELERATING
PRESSURE DECREASING
AIRFLOW DECELERATING
PRESSURE INCREASING
TURBULENT
LAYER
WAKE
BOUNDARY
LAMINAR BOUNDARY LAYER
FIG. 8.1
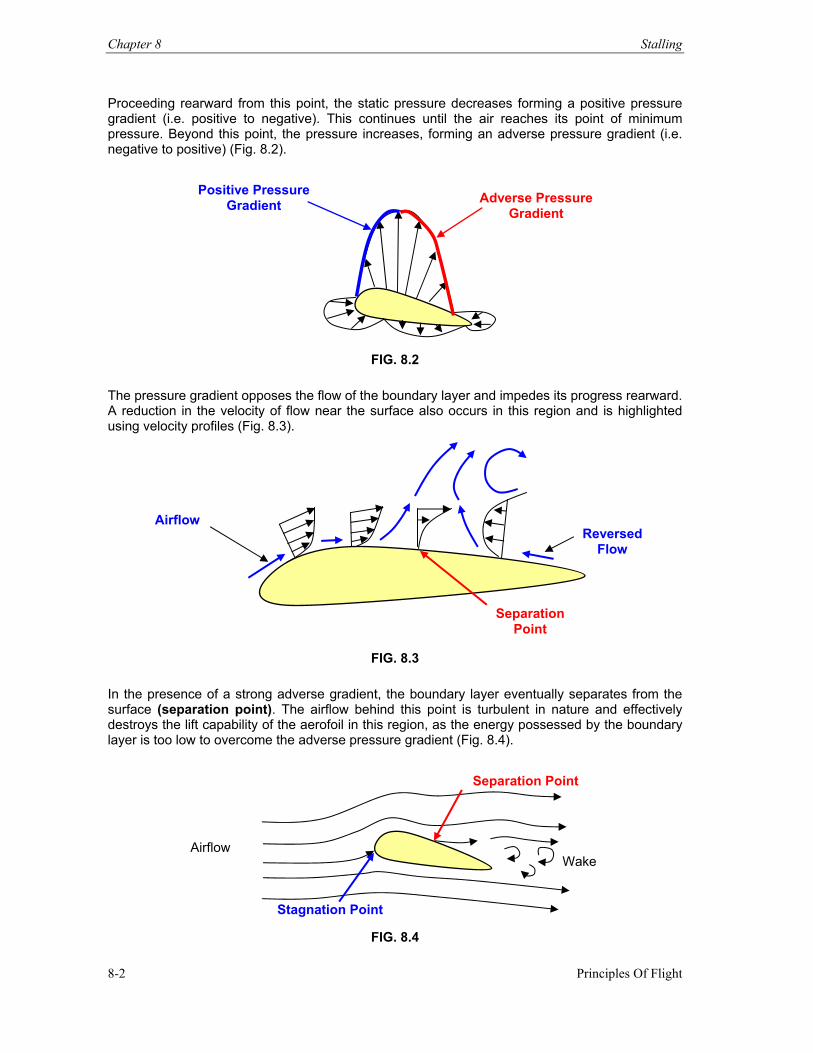
Chapter 8 Stalling
Principles Of Flight 8-2
Proceeding rearward from this point, the static pressure decreases forming a positive pressure gradient (i.e. positive to negative). This continues until the air reaches its point of minimum pressure. Beyond this point, the pressure increases, forming an adverse pressure gradient (i.e. negative to positive) (Fig. 8.2).
FIG. 8.2
The pressure gradient opposes the flow of the boundary layer and impedes its progress rearward. A reduction in the velocity of flow near the surface also occurs in this region and is highlighted using velocity profiles (Fig. 8.3).
FIG. 8.3
In the presence of a strong adverse gradient, the boundary layer eventually separates from the surface (separation point). The airflow behind this point is turbulent in nature and effectively destroys the lift capability of the aerofoil in this region, as the energy possessed by the boundary layer is too low to overcome the adverse pressure gradient (Fig. 8.4).
FIG. 8.4
Positive Pressure Gradient Adverse Pressure
Gradient
Airflow Reversed
Flow
Separation Point
Separation Point
Stagnation Point
Wake Airflow
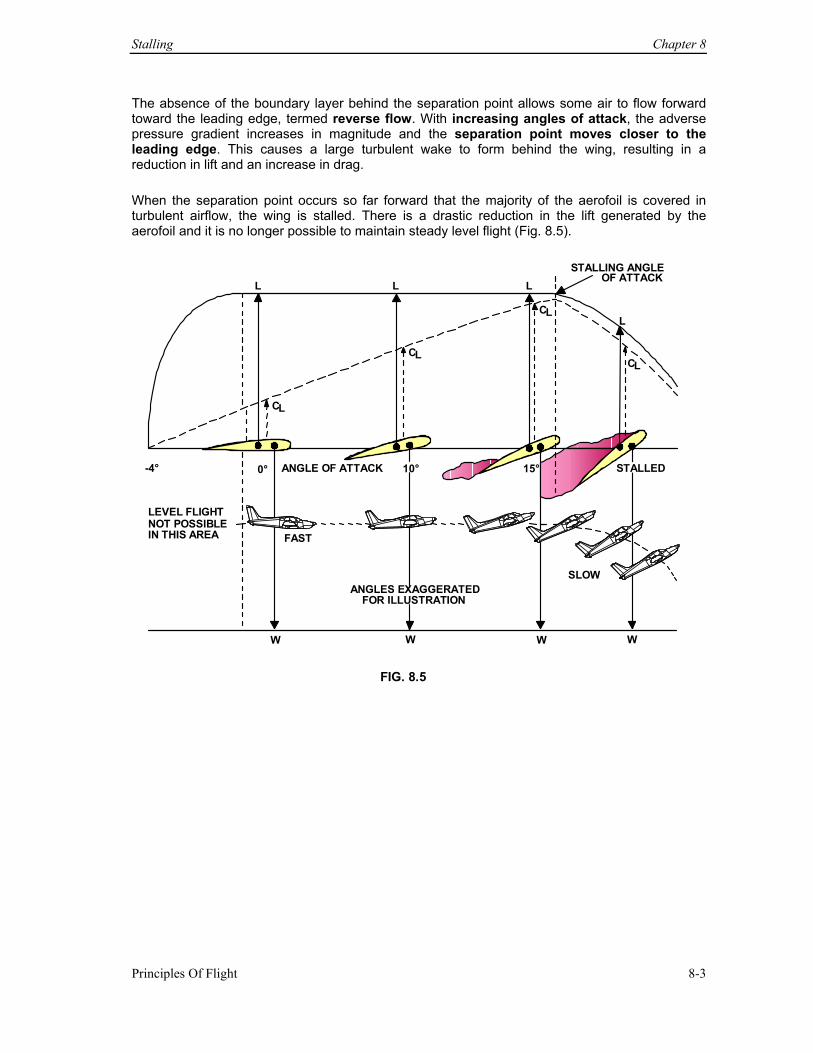
Stalling Chapter 8
Principles Of Flight 8-3
The absence of the boundary layer behind the separation point allows some air to flow forward toward the leading edge, termed reverse flow. With increasing angles of attack, the adverse pressure gradient increases in magnitude and the separation point moves closer to the leading edge. This causes a large turbulent wake to form behind the wing, resulting in a reduction in lift and an increase in drag. When the separation point occurs so far forward that the majority of the aerofoil is covered in turbulent airflow, the wing is stalled. There is a drastic reduction in the lift generated by the aerofoil and it is no longer possible to maintain steady level flight (Fig. 8.5).
CL
STALLING ANGLEOF ATTACK
ANGLES EXAGGERATEDFOR ILLUSTRATION
LEVEL FLIGHT NOT POSSIBLE IN THIS AREA
-4° 0° 10° 15° STALLEDANGLE OF ATTACK
FAST
L L L
L
W W W W
C L
CLC L
FIG. 8.5
SLOW
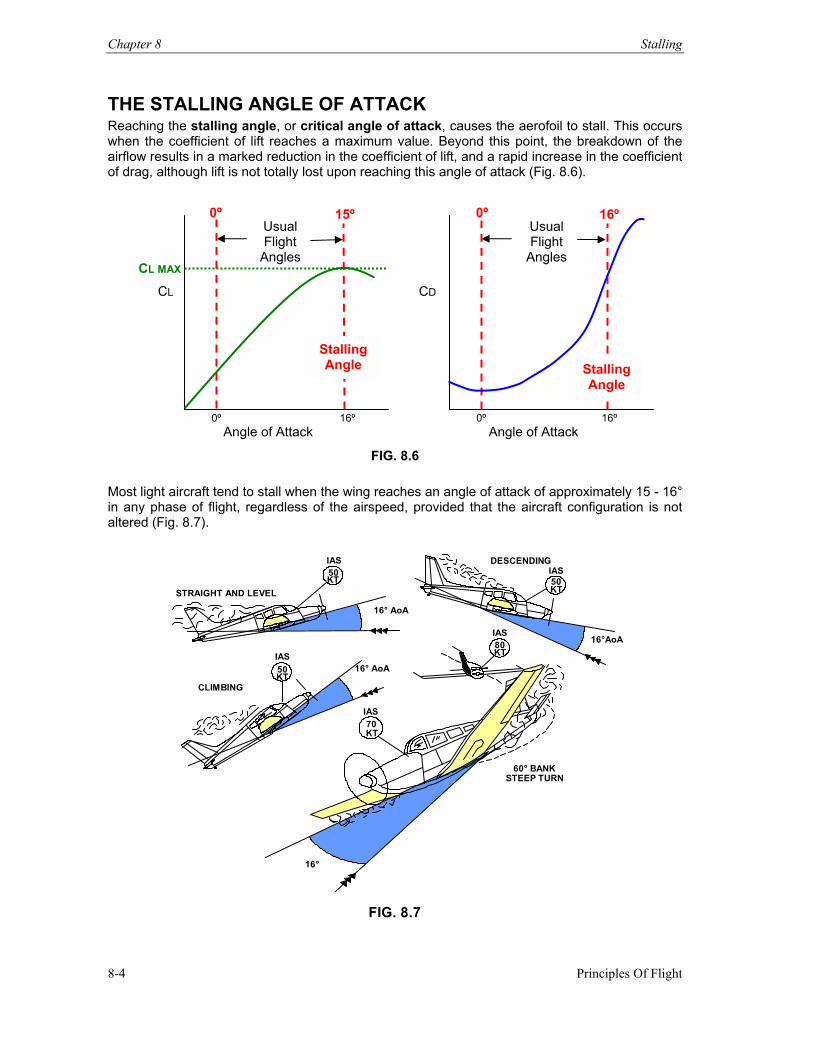
Chapter 8 Stalling
Principles Of Flight 8-4
THE STALLING ANGLE OF ATTACK Reaching the stalling angle, or critical angle of attack, causes the aerofoil to stall. This occurs when the coefficient of lift reaches a maximum value. Beyond this point, the breakdown of the airflow results in a marked reduction in the coefficient of lift, and a rapid increase in the coefficient of drag, although lift is not totally lost upon reaching this angle of attack (Fig. 8.6).
FIG. 8.6
Most light aircraft tend to stall when the wing reaches an angle of attack of approximately 15 - 16° in any phase of flight, regardless of the airspeed, provided that the aircraft configuration is not altered (Fig. 8.7).
16°
70KT
IAS
60° BANKSTEEP TURN
16° AoA
16°AoA 16° AoA
STRAIGHT AND LEVEL IAS50KT
50 KT IAS
CLIMBING
50KT
IASDESCENDING
IAS80KT
FIG. 8.7
Angle of Attack
CD
0º Usual Flight
Angles
0º 16º
16º
0º 16º
Usual Flight
Angles
Angle of Attack
CL
0º 15º
Stalling Angle Stalling
Angle
CL MAX
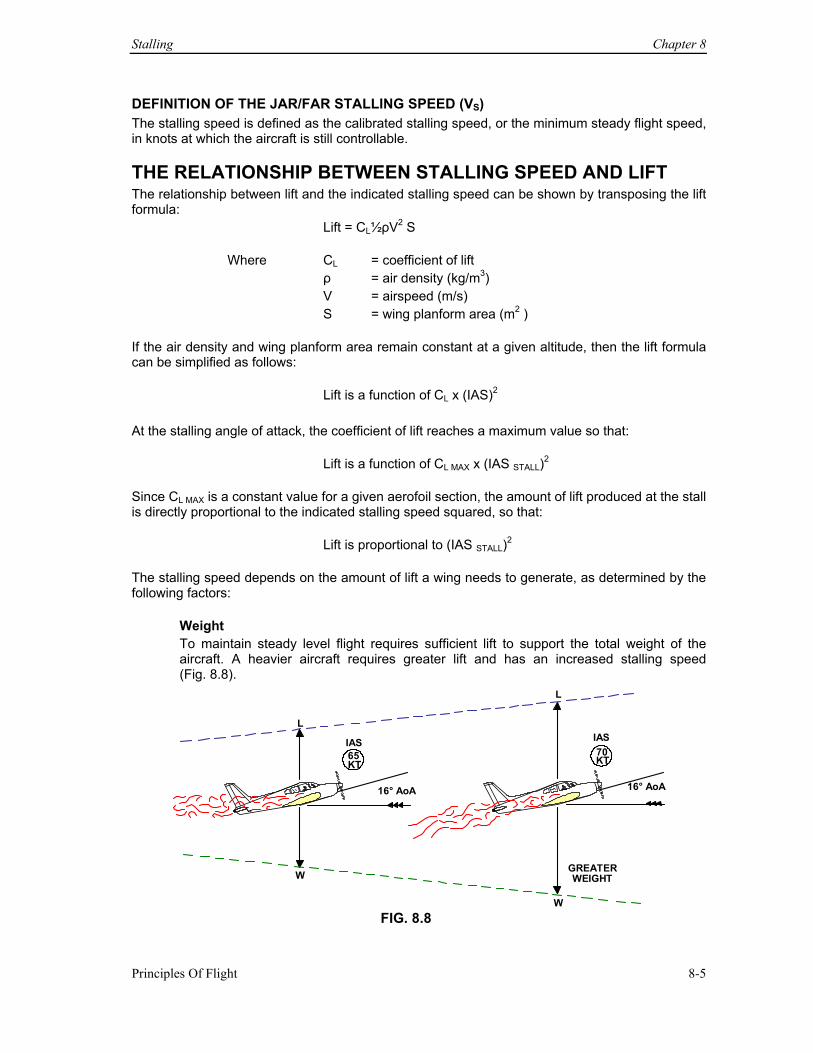
Stalling Chapter 8
Principles Of Flight 8-5
DEFINITION OF THE JAR/FAR STALLING SPEED (VS) The stalling speed is defined as the calibrated stalling speed, or the minimum steady flight speed, in knots at which the aircraft is still controllable.
THE RELATIONSHIP BETWEEN STALLING SPEED AND LIFT The relationship between lift and the indicated stalling speed can be shown by transposing the lift formula: Lift = CL½ρV2 S
Where CL = coefficient of lift ρ = air density (kg/m3) V = airspeed (m/s) S = wing planform area (m2 )
If the air density and wing planform area remain constant at a given altitude, then the lift formula can be simplified as follows: Lift is a function of CL x (IAS)2
At the stalling angle of attack, the coefficient of lift reaches a maximum value so that: Lift is a function of CL MAX x (IAS STALL)2
Since CL MAX is a constant value for a given aerofoil section, the amount of lift produced at the stall is directly proportional to the indicated stalling speed squared, so that: Lift is proportional to (IAS STALL)2 The stalling speed depends on the amount of lift a wing needs to generate, as determined by the following factors:
Weight To maintain steady level flight requires sufficient lift to support the total weight of the aircraft. A heavier aircraft requires greater lift and has an increased stalling speed (Fig. 8.8).
16° AoA
IAS65KT
16° AoA
IAS 70 KT
L L
W W
GREATER WEIGHT
FIG. 8.8
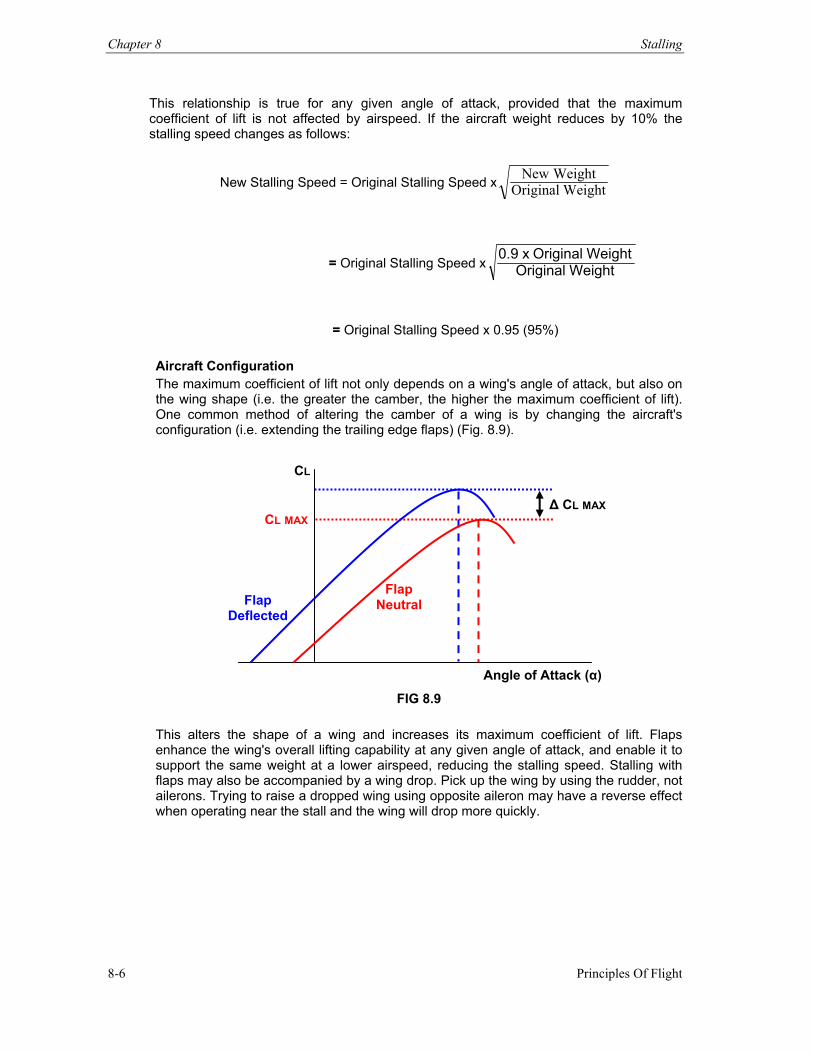
Chapter 8 Stalling
Principles Of Flight 8-6
This relationship is true for any given angle of attack, provided that the maximum coefficient of lift is not affected by airspeed. If the aircraft weight reduces by 10% the stalling speed changes as follows:
New Stalling Speed = Original Stalling Speed x WeightOriginal WeightNew
= Original Stalling Speed x WeightOriginal WeightOriginal x 0.9
= Original Stalling Speed x 0.95 (95%) Aircraft Configuration The maximum coefficient of lift not only depends on a wing's angle of attack, but also on the wing shape (i.e. the greater the camber, the higher the maximum coefficient of lift). One common method of altering the camber of a wing is by changing the aircraft's configuration (i.e. extending the trailing edge flaps) (Fig. 8.9).
FIG 8.9
This alters the shape of a wing and increases its maximum coefficient of lift. Flaps enhance the wing's overall lifting capability at any given angle of attack, and enable it to support the same weight at a lower airspeed, reducing the stalling speed. Stalling with flaps may also be accompanied by a wing drop. Pick up the wing by using the rudder, not ailerons. Trying to raise a dropped wing using opposite aileron may have a reverse effect when operating near the stall and the wing will drop more quickly.
Angle of Attack (α)
CL
CL MAX ∆ CL MAX
Flap Neutral Flap
Deflected
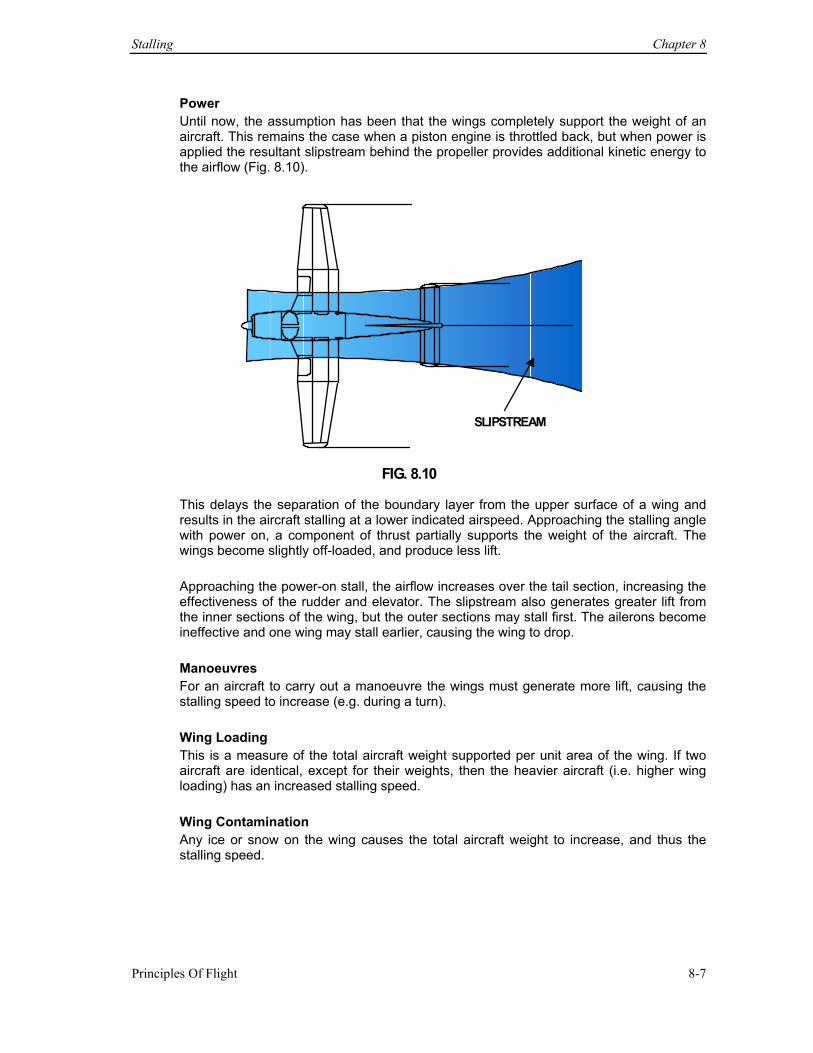
Stalling Chapter 8
Principles Of Flight 8-7
Power Until now, the assumption has been that the wings completely support the weight of an aircraft. This remains the case when a piston engine is throttled back, but when power is applied the resultant slipstream behind the propeller provides additional kinetic energy to the airflow (Fig. 8.10).
SLIPSTREAM
FIG. 8.10
This delays the separation of the boundary layer from the upper surface of a wing and results in the aircraft stalling at a lower indicated airspeed. Approaching the stalling angle with power on, a component of thrust partially supports the weight of the aircraft. The wings become slightly off-loaded, and produce less lift. Approaching the power-on stall, the airflow increases over the tail section, increasing the effectiveness of the rudder and elevator. The slipstream also generates greater lift from the inner sections of the wing, but the outer sections may stall first. The ailerons become ineffective and one wing may stall earlier, causing the wing to drop.
Manoeuvres For an aircraft to carry out a manoeuvre the wings must generate more lift, causing the stalling speed to increase (e.g. during a turn). Wing Loading This is a measure of the total aircraft weight supported per unit area of the wing. If two aircraft are identical, except for their weights, then the heavier aircraft (i.e. higher wing loading) has an increased stalling speed.
Wing Contamination Any ice or snow on the wing causes the total aircraft weight to increase, and thus the stalling speed.
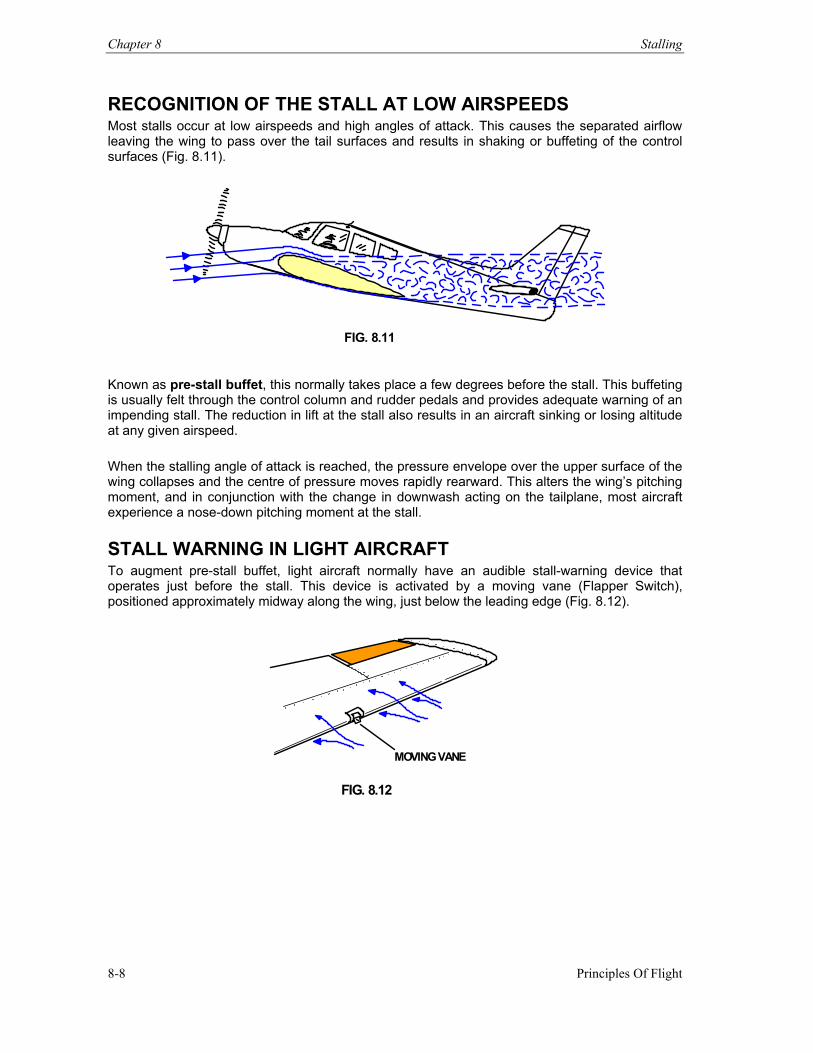
Chapter 8 Stalling
Principles Of Flight 8-8
RECOGNITION OF THE STALL AT LOW AIRSPEEDS Most stalls occur at low airspeeds and high angles of attack. This causes the separated airflow leaving the wing to pass over the tail surfaces and results in shaking or buffeting of the control surfaces (Fig. 8.11).
FIG. 8.11
Known as pre-stall buffet, this normally takes place a few degrees before the stall. This buffeting is usually felt through the control column and rudder pedals and provides adequate warning of an impending stall. The reduction in lift at the stall also results in an aircraft sinking or losing altitude at any given airspeed. When the stalling angle of attack is reached, the pressure envelope over the upper surface of the wing collapses and the centre of pressure moves rapidly rearward. This alters the wing’s pitching moment, and in conjunction with the change in downwash acting on the tailplane, most aircraft experience a nose-down pitching moment at the stall. STALL WARNING IN LIGHT AIRCRAFT To augment pre-stall buffet, light aircraft normally have an audible stall-warning device that operates just before the stall. This device is activated by a moving vane (Flapper Switch), positioned approximately midway along the wing, just below the leading edge (Fig. 8.12).
MOVING VANE
FIG. 8.12
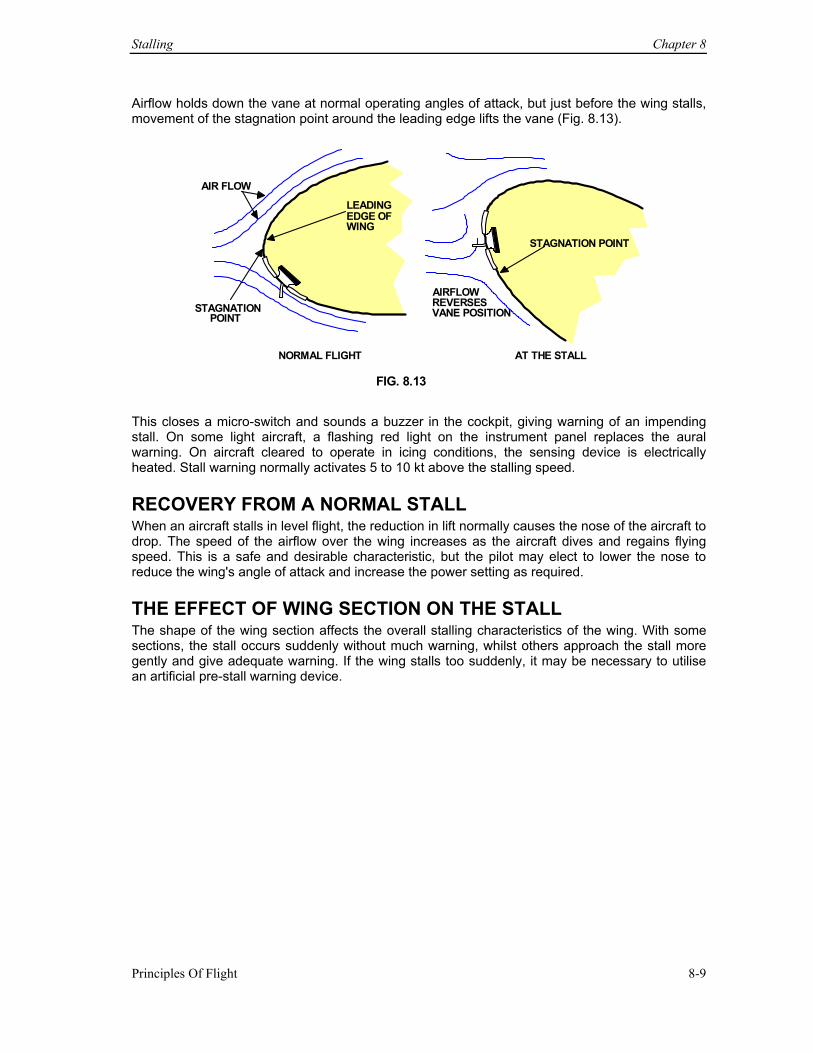
Stalling Chapter 8
Principles Of Flight 8-9
Airflow holds down the vane at normal operating angles of attack, but just before the wing stalls, movement of the stagnation point around the leading edge lifts the vane (Fig. 8.13).
LEADINGEDGE OFWING
STAGNATION POINT
AIR FLOW
NORMAL FLIGHT
STAGNATION POINT
AIRFLOWREVERSESVANE POSITION
AT THE STALL FIG. 8.13
This closes a micro-switch and sounds a buzzer in the cockpit, giving warning of an impending stall. On some light aircraft, a flashing red light on the instrument panel replaces the aural warning. On aircraft cleared to operate in icing conditions, the sensing device is electrically heated. Stall warning normally activates 5 to 10 kt above the stalling speed. RECOVERY FROM A NORMAL STALL When an aircraft stalls in level flight, the reduction in lift normally causes the nose of the aircraft to drop. The speed of the airflow over the wing increases as the aircraft dives and regains flying speed. This is a safe and desirable characteristic, but the pilot may elect to lower the nose to reduce the wing's angle of attack and increase the power setting as required. THE EFFECT OF WING SECTION ON THE STALL The shape of the wing section affects the overall stalling characteristics of the wing. With some sections, the stall occurs suddenly without much warning, whilst others approach the stall more gently and give adequate warning. If the wing stalls too suddenly, it may be necessary to utilise an artificial pre-stall warning device.
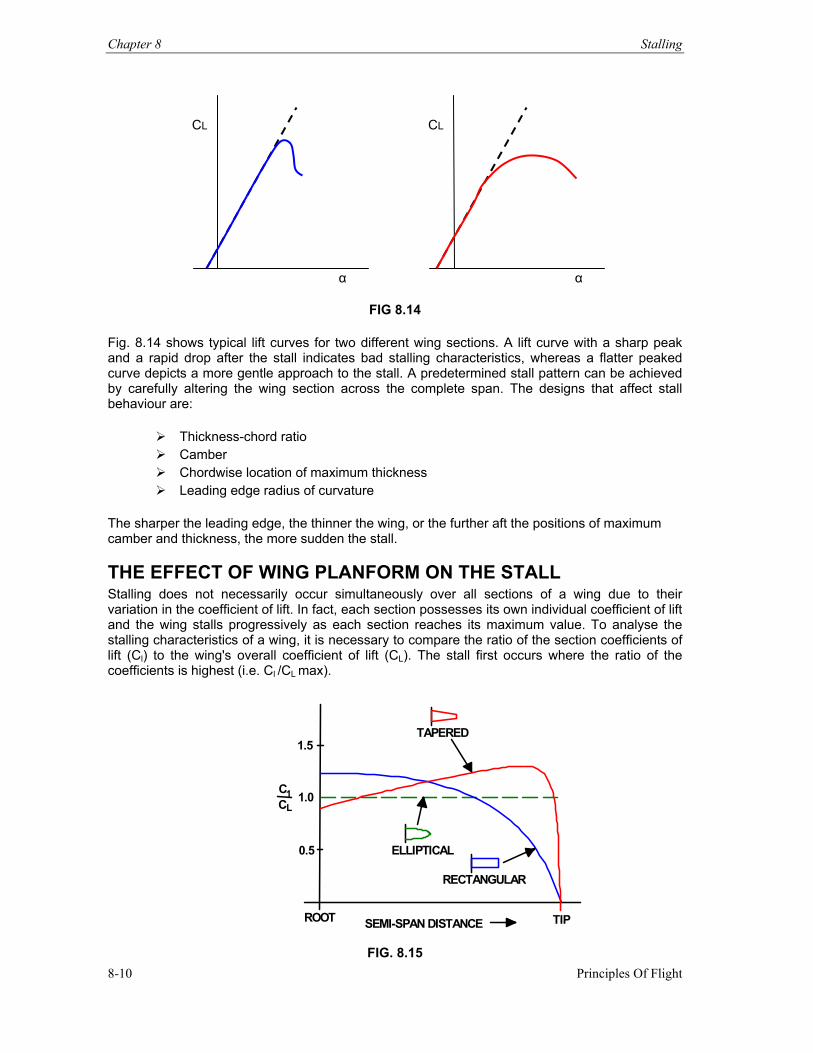
Chapter 8 Stalling
Principles Of Flight 8-10
FIG 8.14
Fig. 8.14 shows typical lift curves for two different wing sections. A lift curve with a sharp peak and a rapid drop after the stall indicates bad stalling characteristics, whereas a flatter peaked curve depicts a more gentle approach to the stall. A predetermined stall pattern can be achieved by carefully altering the wing section across the complete span. The designs that affect stall behaviour are:
Thickness-chord ratio Camber Chordwise location of maximum thickness Leading edge radius of curvature
The sharper the leading edge, the thinner the wing, or the further aft the positions of maximum camber and thickness, the more sudden the stall.
THE EFFECT OF WING PLANFORM ON THE STALL Stalling does not necessarily occur simultaneously over all sections of a wing due to their variation in the coefficient of lift. In fact, each section possesses its own individual coefficient of lift and the wing stalls progressively as each section reaches its maximum value. To analyse the stalling characteristics of a wing, it is necessary to compare the ratio of the section coefficients of lift (Cl) to the wing's overall coefficient of lift (CL). The stall first occurs where the ratio of the coefficients is highest (i.e. Cl /CL max).
1.5
1.0
0.5
ROOT TIP
C L C
TAPERED
ELLIPTICAL
RECTANGULAR
SEMI-SPAN DISTANCE
1
FIG. 8.15
CL
α
CL
α
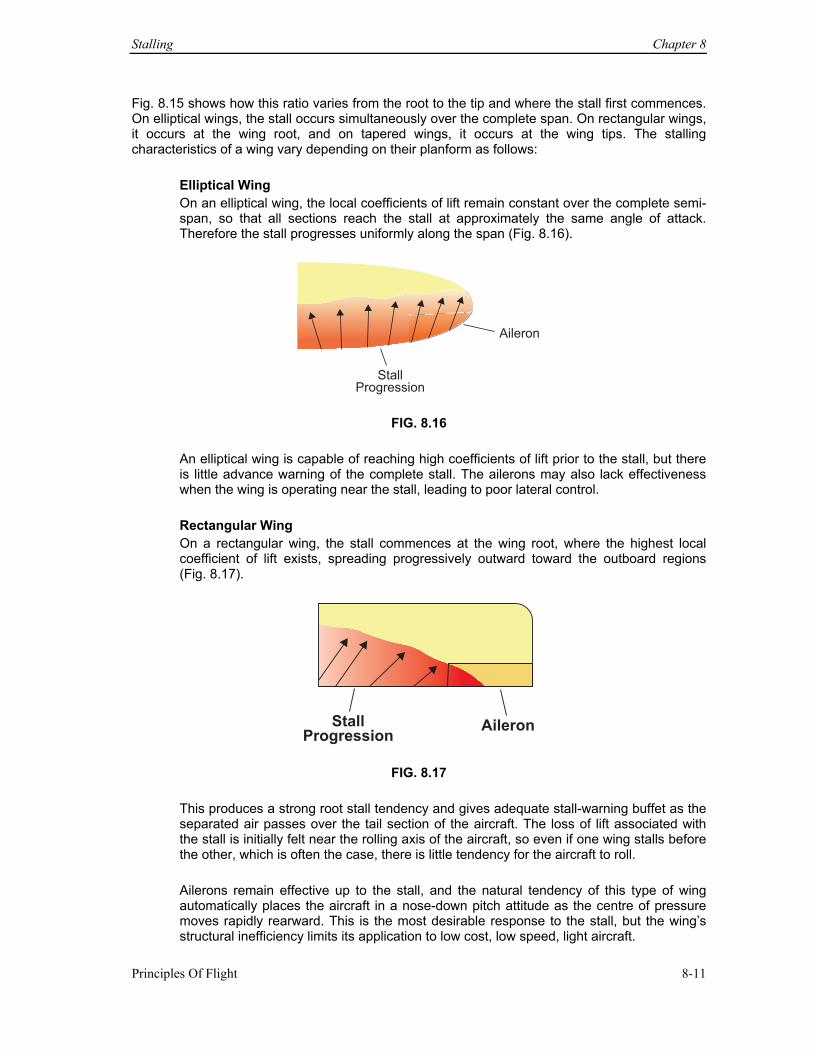
Stalling Chapter 8
Principles Of Flight 8-11
Fig. 8.15 shows how this ratio varies from the root to the tip and where the stall first commences. On elliptical wings, the stall occurs simultaneously over the complete span. On rectangular wings, it occurs at the wing root, and on tapered wings, it occurs at the wing tips. The stalling characteristics of a wing vary depending on their planform as follows:
Elliptical Wing On an elliptical wing, the local coefficients of lift remain constant over the complete semi-span, so that all sections reach the stall at approximately the same angle of attack. Therefore the stall progresses uniformly along the span (Fig. 8.16).
Aileron
StallProgression
FIG. 8.16
An elliptical wing is capable of reaching high coefficients of lift prior to the stall, but there is little advance warning of the complete stall. The ailerons may also lack effectiveness when the wing is operating near the stall, leading to poor lateral control.
Rectangular Wing On a rectangular wing, the stall commences at the wing root, where the highest local coefficient of lift exists, spreading progressively outward toward the outboard regions (Fig. 8.17).
StallProgression
Aileron
FIG. 8.17
This produces a strong root stall tendency and gives adequate stall-warning buffet as the separated air passes over the tail section of the aircraft. The loss of lift associated with the stall is initially felt near the rolling axis of the aircraft, so even if one wing stalls before the other, which is often the case, there is little tendency for the aircraft to roll. Ailerons remain effective up to the stall, and the natural tendency of this type of wing automatically places the aircraft in a nose-down pitch attitude as the centre of pressure moves rapidly rearward. This is the most desirable response to the stall, but the wing’s structural inefficiency limits its application to low cost, low speed, light aircraft.
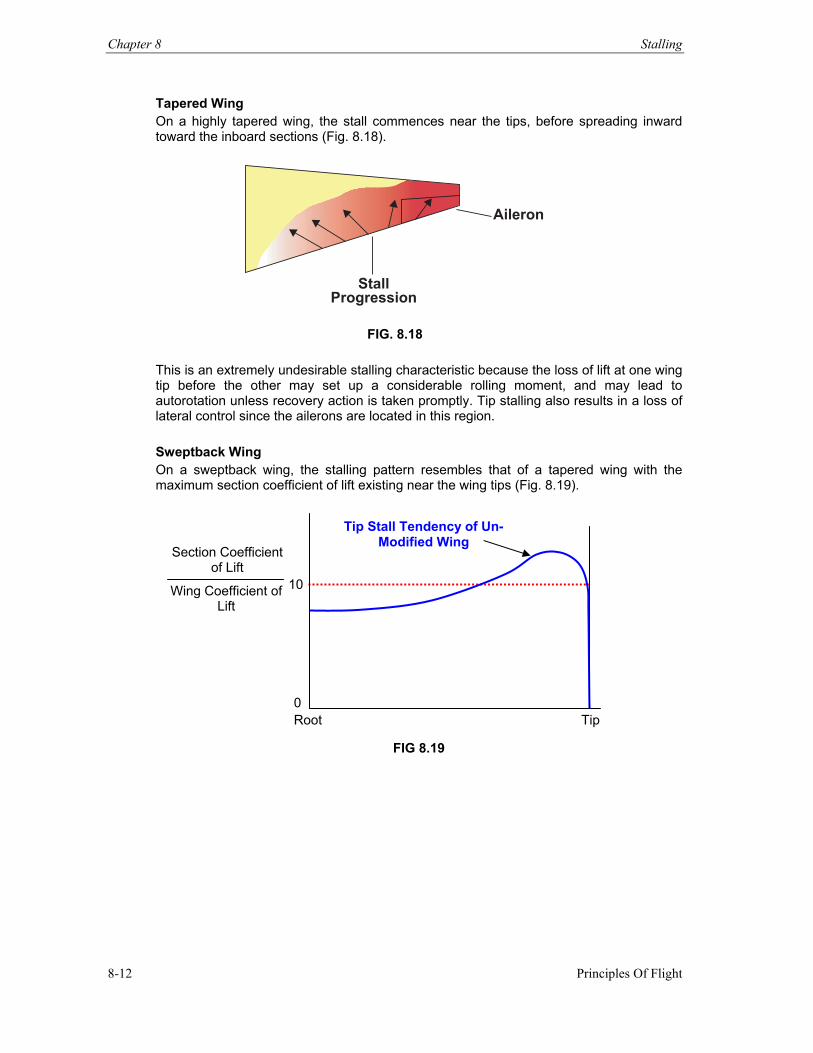
Chapter 8 Stalling
Principles Of Flight 8-12
Tapered Wing On a highly tapered wing, the stall commences near the tips, before spreading inward toward the inboard sections (Fig. 8.18).
StallProgression
Aileron
FIG. 8.18
This is an extremely undesirable stalling characteristic because the loss of lift at one wing tip before the other may set up a considerable rolling moment, and may lead to autorotation unless recovery action is taken promptly. Tip stalling also results in a loss of lateral control since the ailerons are located in this region.
Sweptback Wing On a sweptback wing, the stalling pattern resembles that of a tapered wing with the maximum section coefficient of lift existing near the wing tips (Fig. 8.19).
FIG 8.19
Root Tip 0
10
Section Coefficient of Lift
Wing Coefficient of Lift
Tip Stall Tendency of Un-Modified Wing
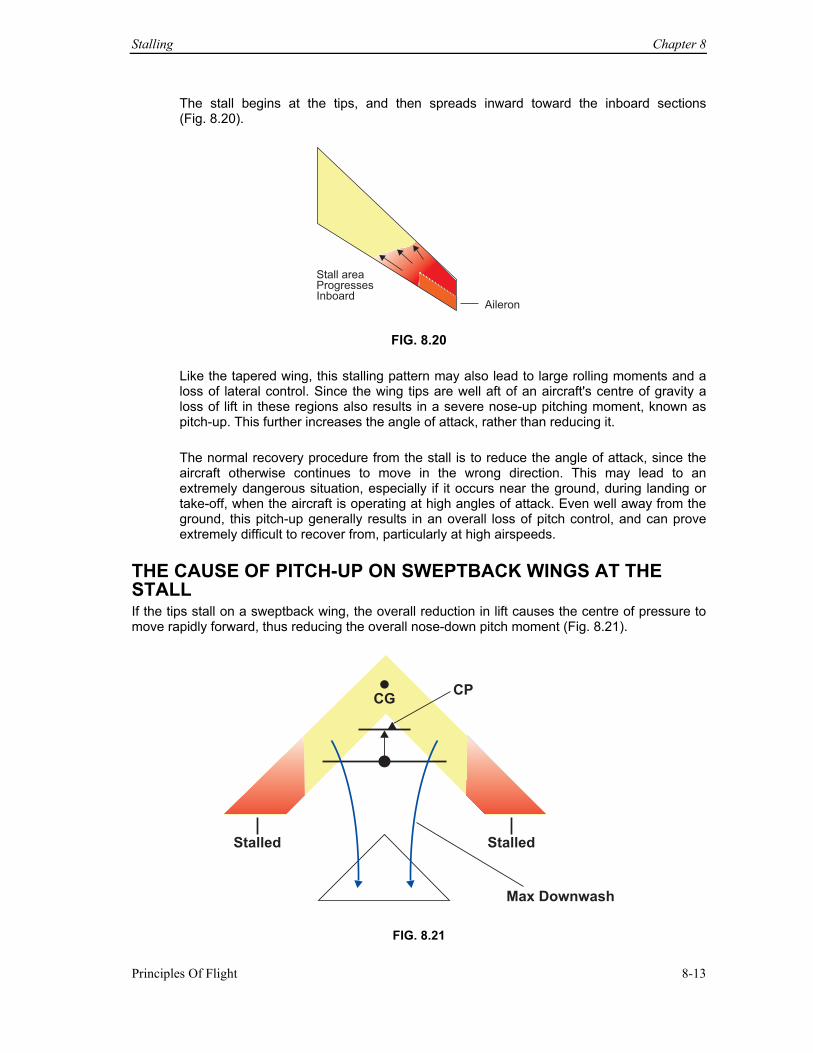
Stalling Chapter 8
Principles Of Flight 8-13
The stall begins at the tips, and then spreads inward toward the inboard sections (Fig. 8.20).
Stall areaProgressesInboard
Aileron
FIG. 8.20 Like the tapered wing, this stalling pattern may also lead to large rolling moments and a loss of lateral control. Since the wing tips are well aft of an aircraft's centre of gravity a loss of lift in these regions also results in a severe nose-up pitching moment, known as pitch-up. This further increases the angle of attack, rather than reducing it. The normal recovery procedure from the stall is to reduce the angle of attack, since the aircraft otherwise continues to move in the wrong direction. This may lead to an extremely dangerous situation, especially if it occurs near the ground, during landing or take-off, when the aircraft is operating at high angles of attack. Even well away from the ground, this pitch-up generally results in an overall loss of pitch control, and can prove extremely difficult to recover from, particularly at high airspeeds.
THE CAUSE OF PITCH-UP ON SWEPTBACK WINGS AT THE STALL If the tips stall on a sweptback wing, the overall reduction in lift causes the centre of pressure to move rapidly forward, thus reducing the overall nose-down pitch moment (Fig. 8.21).
Stalled Stalled
Max Downwash
CGCP
FIG. 8.21
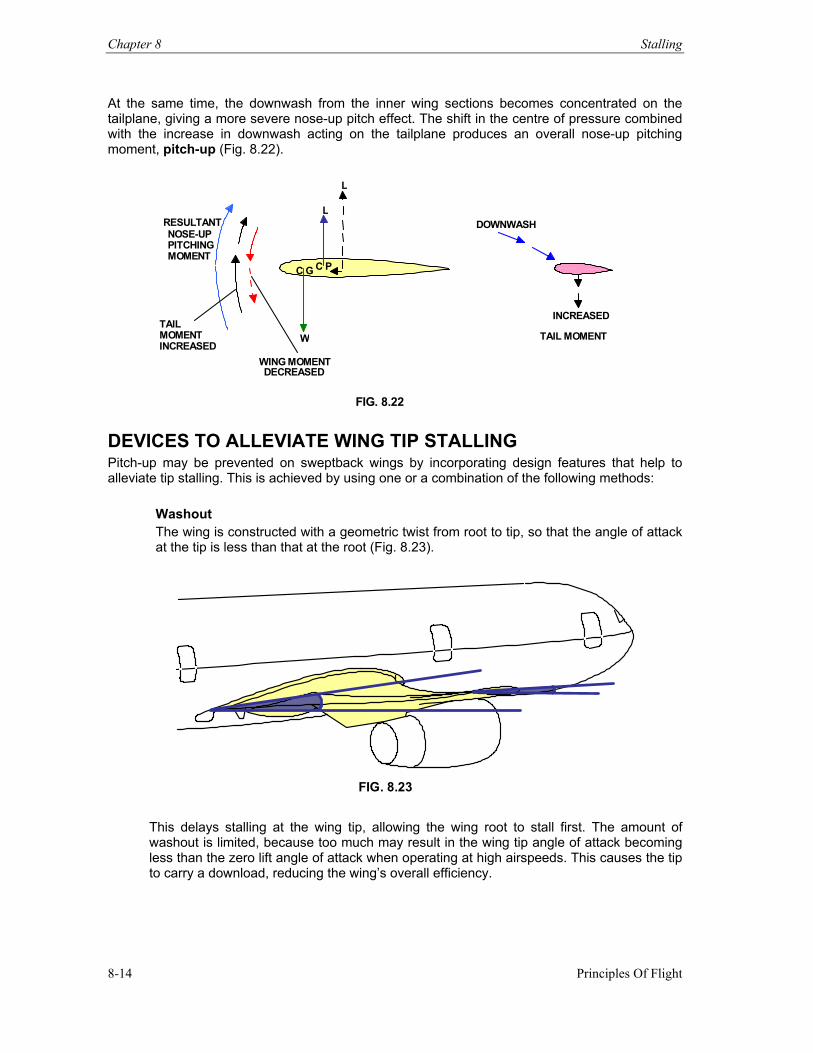
Chapter 8 Stalling
Principles Of Flight 8-14
At the same time, the downwash from the inner wing sections becomes concentrated on the tailplane, giving a more severe nose-up pitch effect. The shift in the centre of pressure combined with the increase in downwash acting on the tailplane produces an overall nose-up pitching moment, pitch-up (Fig. 8.22).
L
L
W
RESULTANT DOWNWASH
INCREASED TAIL MOMENT
C G C P
WING MOMENTDECREASED
NOSE-UP PITCHING MOMENT
TAIL MOMENT INCREASED
FIG. 8.22
DEVICES TO ALLEVIATE WING TIP STALLING Pitch-up may be prevented on sweptback wings by incorporating design features that help to alleviate tip stalling. This is achieved by using one or a combination of the following methods:
Washout The wing is constructed with a geometric twist from root to tip, so that the angle of attack at the tip is less than that at the root (Fig. 8.23).
FIG. 8.23 This delays stalling at the wing tip, allowing the wing root to stall first. The amount of washout is limited, because too much may result in the wing tip angle of attack becoming less than the zero lift angle of attack when operating at high airspeeds. This causes the tip to carry a download, reducing the wing’s overall efficiency.
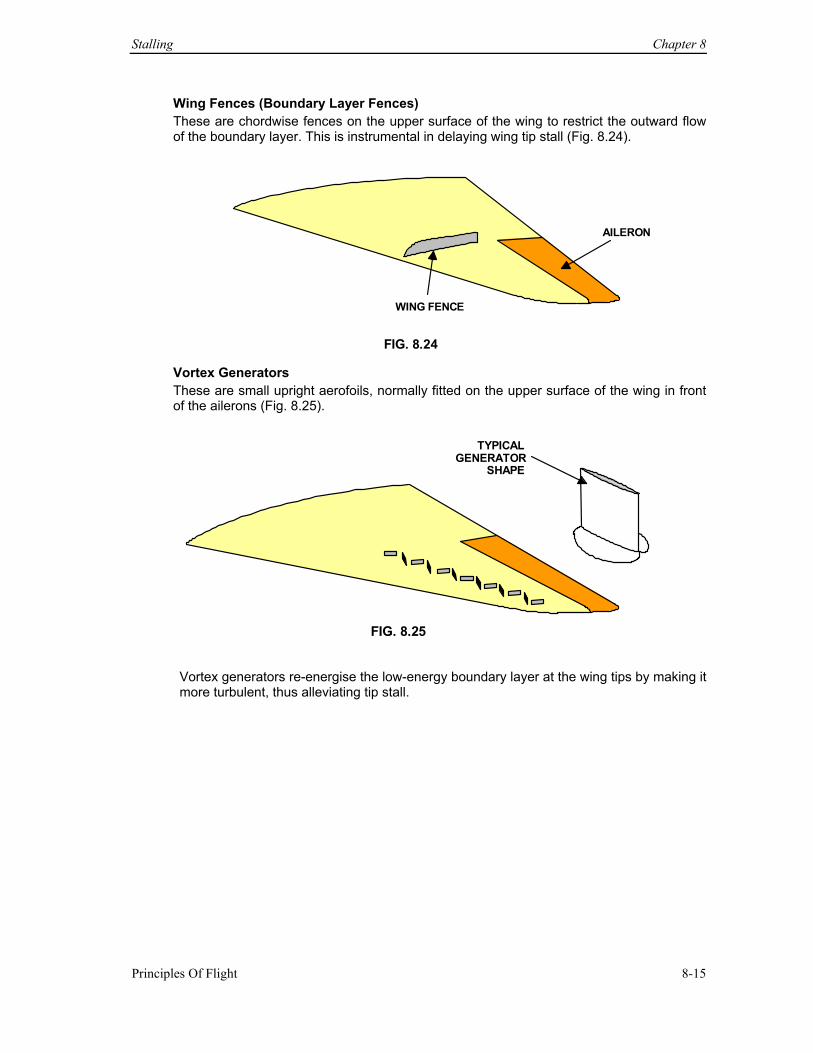
Stalling Chapter 8
Principles Of Flight 8-15
Wing Fences (Boundary Layer Fences) These are chordwise fences on the upper surface of the wing to restrict the outward flow of the boundary layer. This is instrumental in delaying wing tip stall (Fig. 8.24).
WING FENCE
AILERON
FIG. 8.24
Vortex Generators These are small upright aerofoils, normally fitted on the upper surface of the wing in front of the ailerons (Fig. 8.25).
FIG. 8.25
TYPICALGENERATOR
SHAPE
Vortex generators re-energise the low-energy boundary layer at the wing tips by making it more turbulent, thus alleviating tip stall.
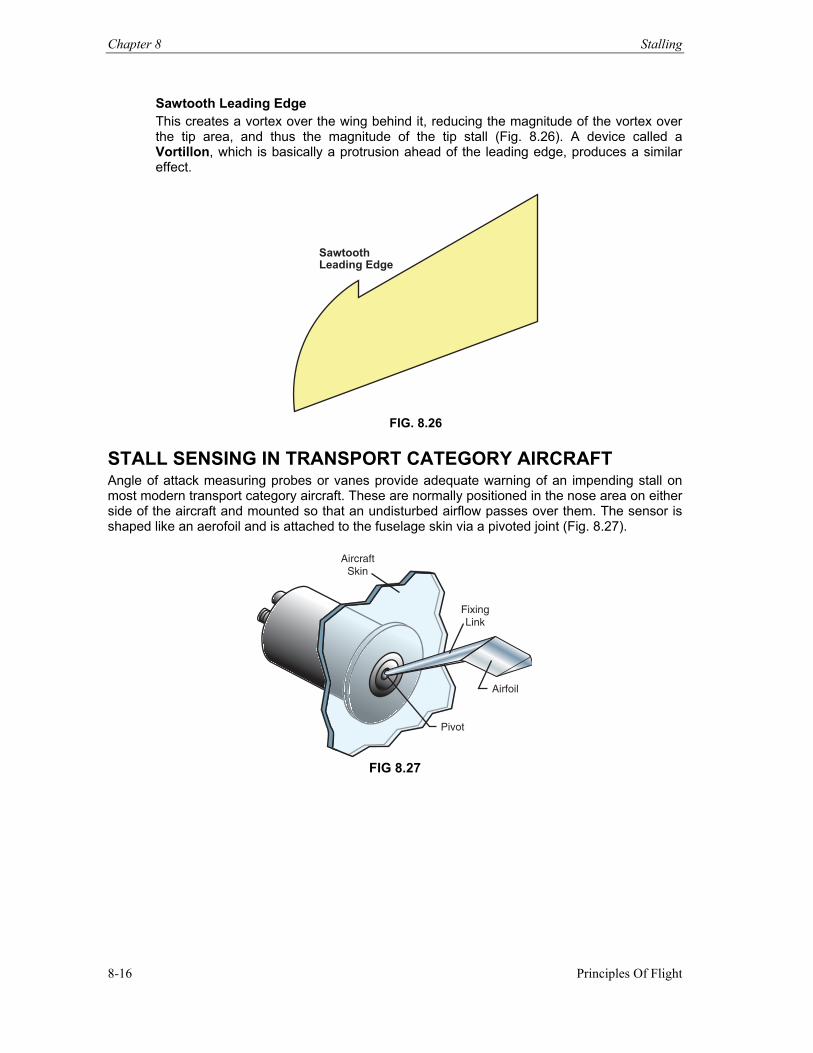
Chapter 8 Stalling
Principles Of Flight 8-16
Sawtooth Leading Edge This creates a vortex over the wing behind it, reducing the magnitude of the vortex over the tip area, and thus the magnitude of the tip stall (Fig. 8.26). A device called a Vortillon, which is basically a protrusion ahead of the leading edge, produces a similar effect.
Sawtooth Leading Edge
FIG. 8.26
STALL SENSING IN TRANSPORT CATEGORY AIRCRAFT Angle of attack measuring probes or vanes provide adequate warning of an impending stall on most modern transport category aircraft. These are normally positioned in the nose area on either side of the aircraft and mounted so that an undisturbed airflow passes over them. The sensor is shaped like an aerofoil and is attached to the fuselage skin via a pivoted joint (Fig. 8.27).
Aircraft
Skin
FixingLink
Airfoil
Pivot
FIG 8.27
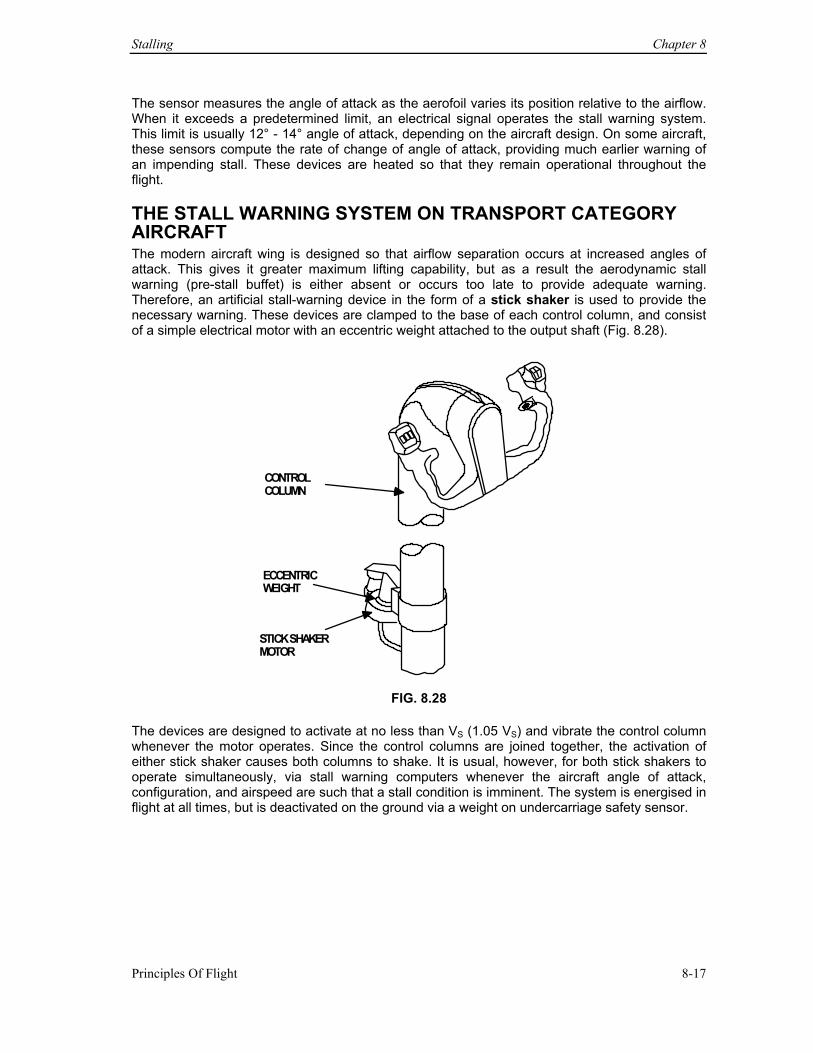
Stalling Chapter 8
Principles Of Flight 8-17
The sensor measures the angle of attack as the aerofoil varies its position relative to the airflow. When it exceeds a predetermined limit, an electrical signal operates the stall warning system. This limit is usually 12° - 14° angle of attack, depending on the aircraft design. On some aircraft, these sensors compute the rate of change of angle of attack, providing much earlier warning of an impending stall. These devices are heated so that they remain operational throughout the flight.
THE STALL WARNING SYSTEM ON TRANSPORT CATEGORY AIRCRAFT The modern aircraft wing is designed so that airflow separation occurs at increased angles of attack. This gives it greater maximum lifting capability, but as a result the aerodynamic stall warning (pre-stall buffet) is either absent or occurs too late to provide adequate warning. Therefore, an artificial stall-warning device in the form of a stick shaker is used to provide the necessary warning. These devices are clamped to the base of each control column, and consist of a simple electrical motor with an eccentric weight attached to the output shaft (Fig. 8.28).
CONTROL COLUMN
ECCENTRIC WEIGHT
STICK SHAKERMOTOR
FIG. 8.28
The devices are designed to activate at no less than VS (1.05 VS) and vibrate the control column whenever the motor operates. Since the control columns are joined together, the activation of either stick shaker causes both columns to shake. It is usual, however, for both stick shakers to operate simultaneously, via stall warning computers whenever the aircraft angle of attack, configuration, and airspeed are such that a stall condition is imminent. The system is energised in flight at all times, but is deactivated on the ground via a weight on undercarriage safety sensor.
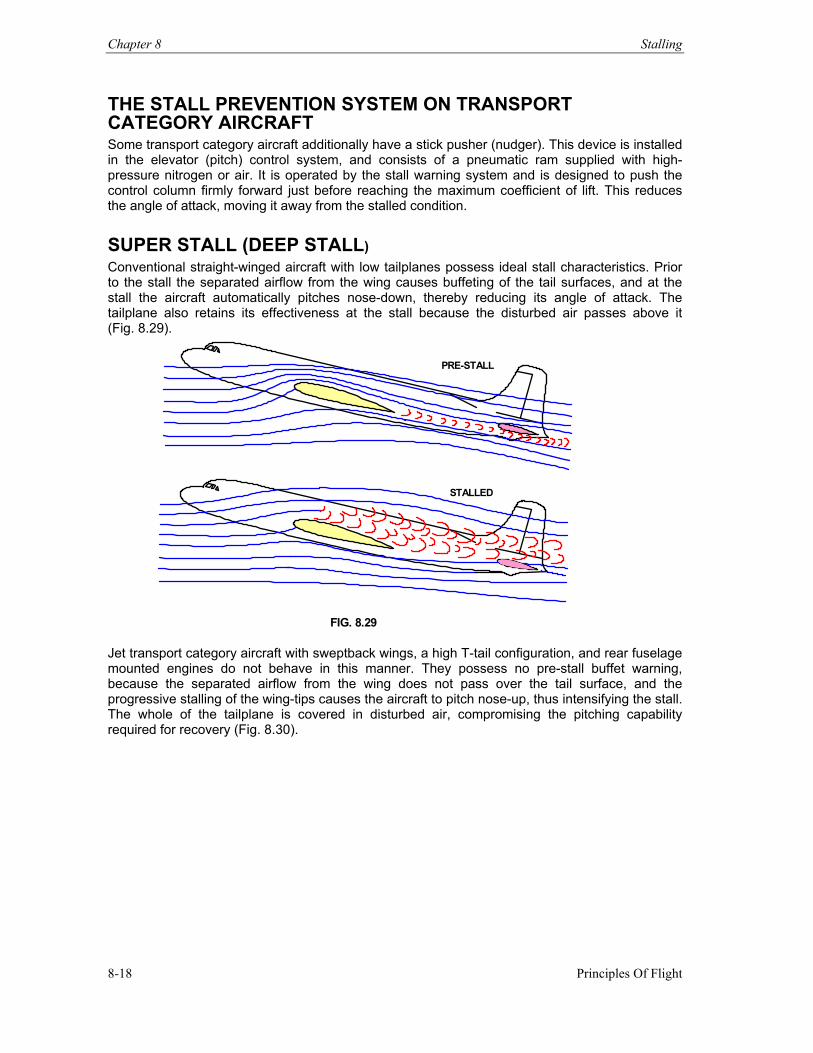
Chapter 8 Stalling
Principles Of Flight 8-18
THE STALL PREVENTION SYSTEM ON TRANSPORT CATEGORY AIRCRAFT Some transport category aircraft additionally have a stick pusher (nudger). This device is installed in the elevator (pitch) control system, and consists of a pneumatic ram supplied with high-pressure nitrogen or air. It is operated by the stall warning system and is designed to push the control column firmly forward just before reaching the maximum coefficient of lift. This reduces the angle of attack, moving it away from the stalled condition.
SUPER STALL (DEEP STALL) Conventional straight-winged aircraft with low tailplanes possess ideal stall characteristics. Prior to the stall the separated airflow from the wing causes buffeting of the tail surfaces, and at the stall the aircraft automatically pitches nose-down, thereby reducing its angle of attack. The tailplane also retains its effectiveness at the stall because the disturbed air passes above it (Fig. 8.29).
PRE-STALL
STALLED
FIG. 8.29
Jet transport category aircraft with sweptback wings, a high T-tail configuration, and rear fuselage mounted engines do not behave in this manner. They possess no pre-stall buffet warning, because the separated airflow from the wing does not pass over the tail surface, and the progressive stalling of the wing-tips causes the aircraft to pitch nose-up, thus intensifying the stall. The whole of the tailplane is covered in disturbed air, compromising the pitching capability required for recovery (Fig. 8.30).
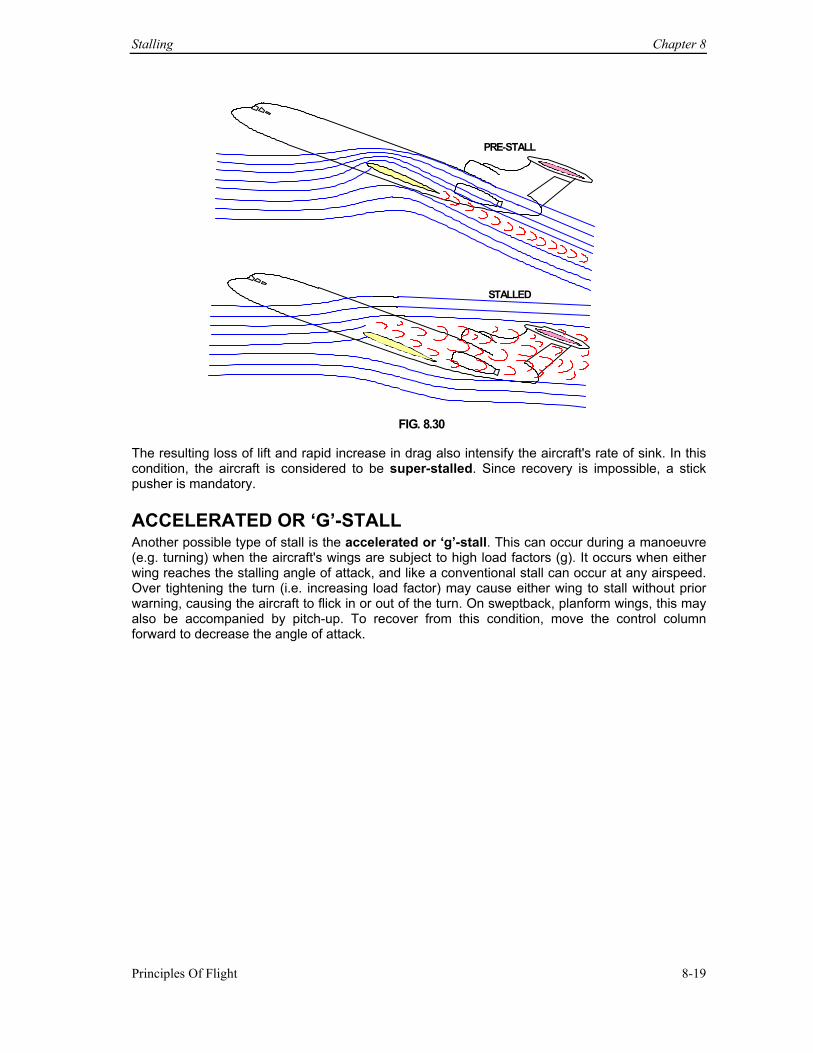
Stalling Chapter 8
Principles Of Flight 8-19
PRE-STALL
STALLED
FIG. 8.30
The resulting loss of lift and rapid increase in drag also intensify the aircraft's rate of sink. In this condition, the aircraft is considered to be super-stalled. Since recovery is impossible, a stick pusher is mandatory. ACCELERATED OR ‘G’-STALL Another possible type of stall is the accelerated or ‘g’-stall. This can occur during a manoeuvre (e.g. turning) when the aircraft's wings are subject to high load factors (g). It occurs when either wing reaches the stalling angle of attack, and like a conventional stall can occur at any airspeed. Over tightening the turn (i.e. increasing load factor) may cause either wing to stall without prior warning, causing the aircraft to flick in or out of the turn. On sweptback, planform wings, this may also be accompanied by pitch-up. To recover from this condition, move the control column forward to decrease the angle of attack.
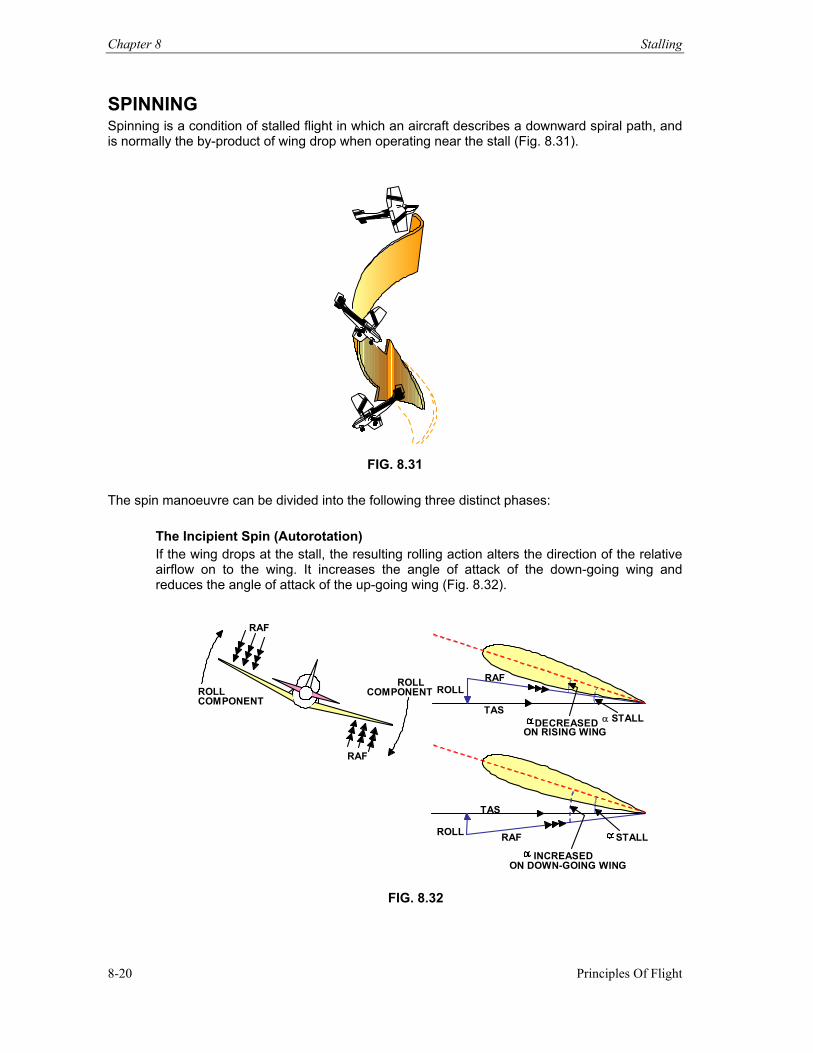
Chapter 8 Stalling
Principles Of Flight 8-20
SPINNING Spinning is a condition of stalled flight in which an aircraft describes a downward spiral path, and is normally the by-product of wing drop when operating near the stall (Fig. 8.31).
FIG. 8.31
The spin manoeuvre can be divided into the following three distinct phases:
The Incipient Spin (Autorotation) If the wing drops at the stall, the resulting rolling action alters the direction of the relative airflow on to the wing. It increases the angle of attack of the down-going wing and reduces the angle of attack of the up-going wing (Fig. 8.32).
RAF
RAF
ROLL ROLL
COMPONENT COMPONENTRAF
RAF
TAS
TAS
ROLL
ROLL
DECREASED ON RISING WING α STALL
STALL INCREASED
ON DOWN-GOING WING
FIG. 8.32
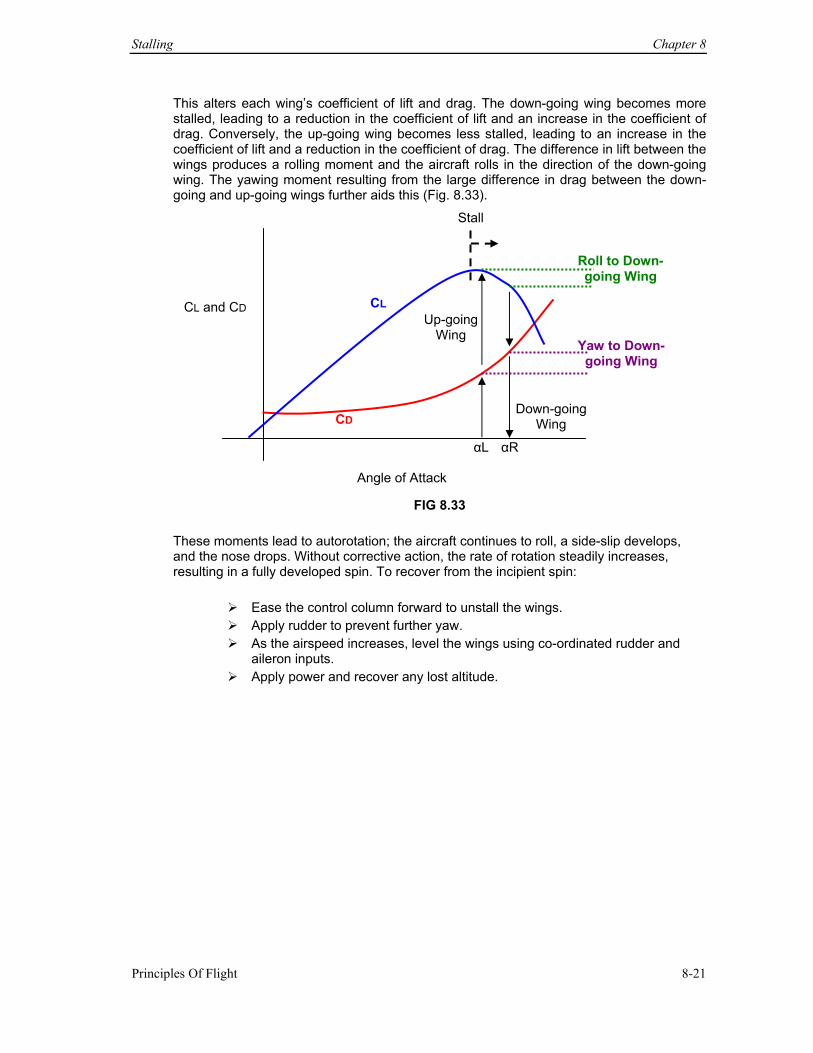
Stalling Chapter 8
Principles Of Flight 8-21
This alters each wing’s coefficient of lift and drag. The down-going wing becomes more stalled, leading to a reduction in the coefficient of lift and an increase in the coefficient of drag. Conversely, the up-going wing becomes less stalled, leading to an increase in the coefficient of lift and a reduction in the coefficient of drag. The difference in lift between the wings produces a rolling moment and the aircraft rolls in the direction of the down-going wing. The yawing moment resulting from the large difference in drag between the down-going and up-going wings further aids this (Fig. 8.33).
FIG 8.33
These moments lead to autorotation; the aircraft continues to roll, a side-slip develops, and the nose drops. Without corrective action, the rate of rotation steadily increases, resulting in a fully developed spin. To recover from the incipient spin:
Ease the control column forward to unstall the wings. Apply rudder to prevent further yaw. As the airspeed increases, level the wings using co-ordinated rudder and
aileron inputs. Apply power and recover any lost altitude.
CL and CD
Angle of Attack
CL
CD
Stall
Up-going Wing
Down-going Wing
Roll to Down-going Wing
Yaw to Down-going Wing
αL αR
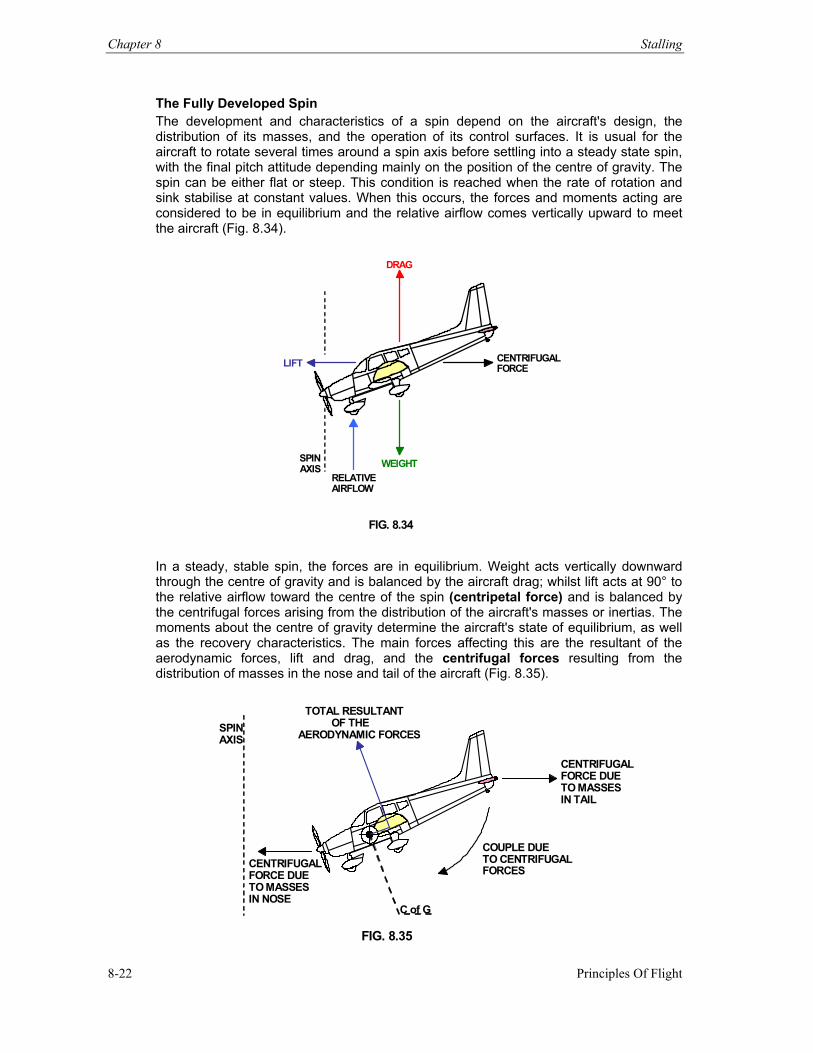
Chapter 8 Stalling
Principles Of Flight 8-22
The Fully Developed Spin The development and characteristics of a spin depend on the aircraft's design, the distribution of its masses, and the operation of its control surfaces. It is usual for the aircraft to rotate several times around a spin axis before settling into a steady state spin, with the final pitch attitude depending mainly on the position of the centre of gravity. The spin can be either flat or steep. This condition is reached when the rate of rotation and sink stabilise at constant values. When this occurs, the forces and moments acting are considered to be in equilibrium and the relative airflow comes vertically upward to meet the aircraft (Fig. 8.34).
LIFT
WEIGHTSPIN AXIS
RELATIVEAIRFLOW
CENTRIFUGALFORCE
DRAG
FIG. 8.34
In a steady, stable spin, the forces are in equilibrium. Weight acts vertically downward through the centre of gravity and is balanced by the aircraft drag; whilst lift acts at 90° to the relative airflow toward the centre of the spin (centripetal force) and is balanced by the centrifugal forces arising from the distribution of the aircraft's masses or inertias. The moments about the centre of gravity determine the aircraft's state of equilibrium, as well as the recovery characteristics. The main forces affecting this are the resultant of the aerodynamic forces, lift and drag, and the centrifugal forces resulting from the distribution of masses in the nose and tail of the aircraft (Fig. 8.35).
C of G
CENTRIFUGAL
CENTRIFUGAL
FORCE DUE
FORCE DUE
TO MASSES
TO MASSES
IN NOSE
IN TAIL
COUPLE DUETO CENTRIFUGAL FORCES
TOTAL RESULTANTOF THE
AERODYNAMIC FORCESSPIN AXIS
FIG. 8.35
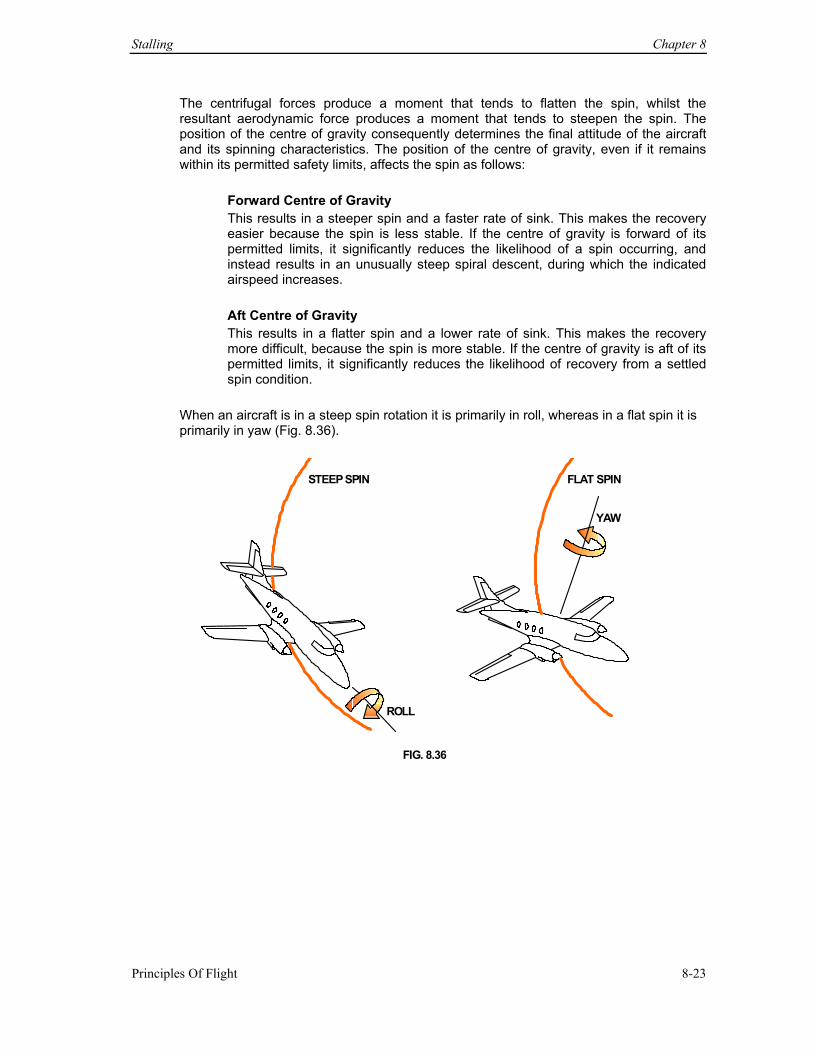
Stalling Chapter 8
Principles Of Flight 8-23
The centrifugal forces produce a moment that tends to flatten the spin, whilst the resultant aerodynamic force produces a moment that tends to steepen the spin. The position of the centre of gravity consequently determines the final attitude of the aircraft and its spinning characteristics. The position of the centre of gravity, even if it remains within its permitted safety limits, affects the spin as follows:
Forward Centre of Gravity This results in a steeper spin and a faster rate of sink. This makes the recovery easier because the spin is less stable. If the centre of gravity is forward of its permitted limits, it significantly reduces the likelihood of a spin occurring, and instead results in an unusually steep spiral descent, during which the indicated airspeed increases.
Aft Centre of Gravity This results in a flatter spin and a lower rate of sink. This makes the recovery more difficult, because the spin is more stable. If the centre of gravity is aft of its permitted limits, it significantly reduces the likelihood of recovery from a settled spin condition.
When an aircraft is in a steep spin rotation it is primarily in roll, whereas in a flat spin it is primarily in yaw (Fig. 8.36).
STEEP SPIN
ROLL
YAW FLAT SPIN
FIG. 8.36
Chapter 8 Stalling
Principles Of Flight 8-24
RECOVERY FROM A SPIN Spin recovery, like recovery from a simple stall, requires re-attachment of the separated airflow over the wings. For a successful recovery from a spin, it is necessary to first stop the yawing moment and reduce the rolling moment. The usual recovery technique is to:
Centralise the control surfaces and reduce the power setting. Verify the direction of spin on the turn and balance indicator and apply full opposite
rudder. Allow the rudder to become effective, then ease the control column forward to reduce
the angle of attack and unstall the wings. As the rotation stops, centralise the rudder, level the wings, and gently pull out of the
ensuing dive. Apply power and climb the aircraft to regain any lost altitude.
Note: When pulling out of the ensuing dive, be careful to prevent an accelerated or ‘g’-stall, and subsequent entry into another spin.
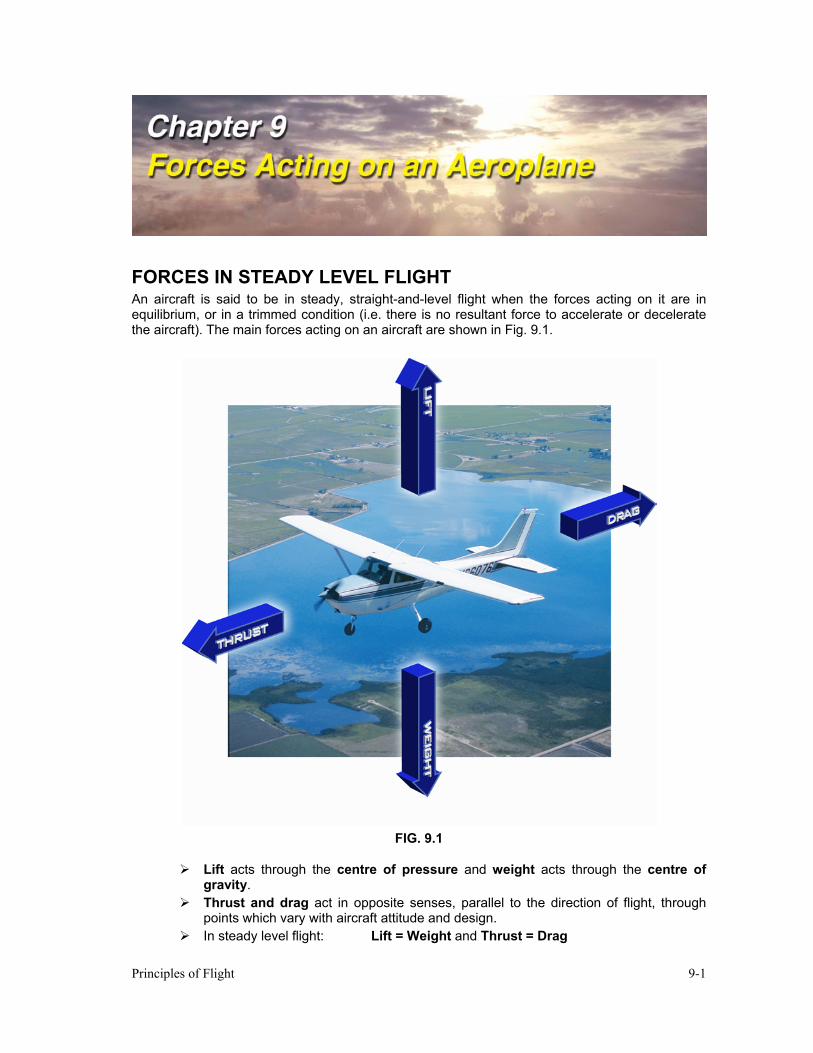
Principles of Flight 9-1
FORCES IN STEADY LEVEL FLIGHT An aircraft is said to be in steady, straight-and-level flight when the forces acting on it are in equilibrium, or in a trimmed condition (i.e. there is no resultant force to accelerate or decelerate the aircraft). The main forces acting on an aircraft are shown in Fig. 9.1.
FIG. 9.1
Lift acts through the centre of pressure and weight acts through the centre of gravity.
Thrust and drag act in opposite senses, parallel to the direction of flight, through points which vary with aircraft attitude and design.
In steady level flight: Lift = Weight and Thrust = Drag
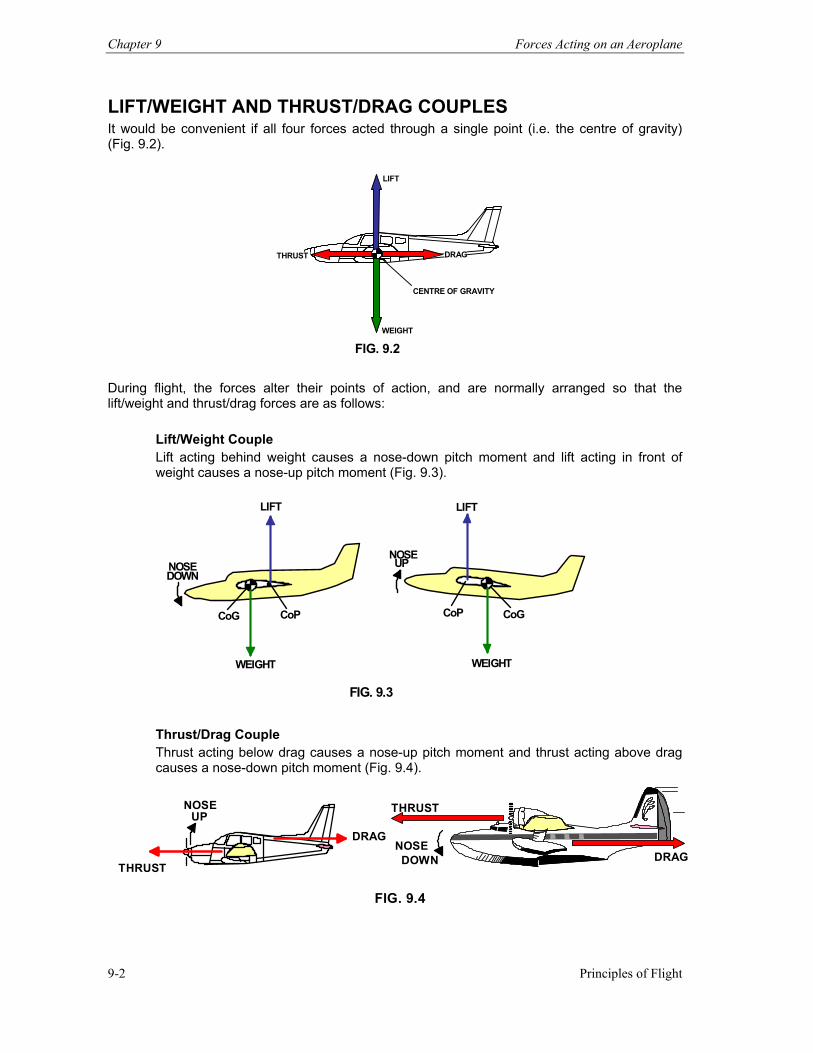
Chapter 9 Forces Acting on an Aeroplane
Principles of Flight 9-2
LIFT/WEIGHT AND THRUST/DRAG COUPLES It would be convenient if all four forces acted through a single point (i.e. the centre of gravity) (Fig. 9.2).
LIFT
WEIGHT
DRAGTHRUST
CENTRE OF GRAVITY
FIG. 9.2 During flight, the forces alter their points of action, and are normally arranged so that the lift/weight and thrust/drag forces are as follows:
Lift/Weight Couple Lift acting behind weight causes a nose-down pitch moment and lift acting in front of weight causes a nose-up pitch moment (Fig. 9.3).
CoG
LIFT
WEIGHT
CoP
NOSE DOWN
CoG
LIFT
WEIGHT
CoP
NOSEUP
FIG. 9.3
Thrust/Drag Couple Thrust acting below drag causes a nose-up pitch moment and thrust acting above drag causes a nose-down pitch moment (Fig. 9.4).
THRUST
NOSEDOWN DRAG
THRUST DRAG
NOSE UP
FIG. 9.4
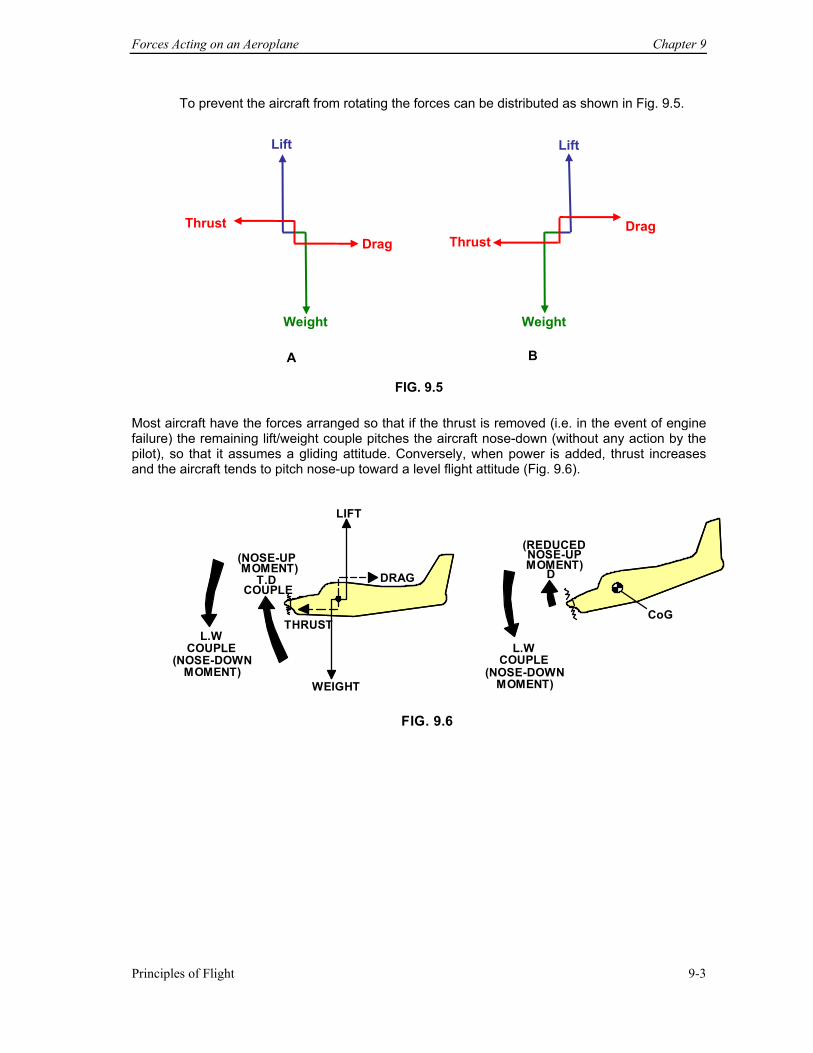
Forces Acting on an Aeroplane Chapter 9
Principles of Flight 9-3
To prevent the aircraft from rotating the forces can be distributed as shown in Fig. 9.5.
FIG. 9.5
Most aircraft have the forces arranged so that if the thrust is removed (i.e. in the event of engine failure) the remaining lift/weight couple pitches the aircraft nose-down (without any action by the pilot), so that it assumes a gliding attitude. Conversely, when power is added, thrust increases and the aircraft tends to pitch nose-up toward a level flight attitude (Fig. 9.6).
LIFT
THRUST
DRAG
WEIGHT
(NOSE-UP MOMENT)
T.D COUPLE
L.W COUPLE
(NOSE-DOWN MOMENT)
NOSE-UP MOMENT)
D
L.WCOUPLE
(NOSE-DOWNMOMENT)
CoG
(REDUCED
FIG. 9.6
Thrust
Lift
Weight
Drag
Weight
Lift
Thrust Drag
A B
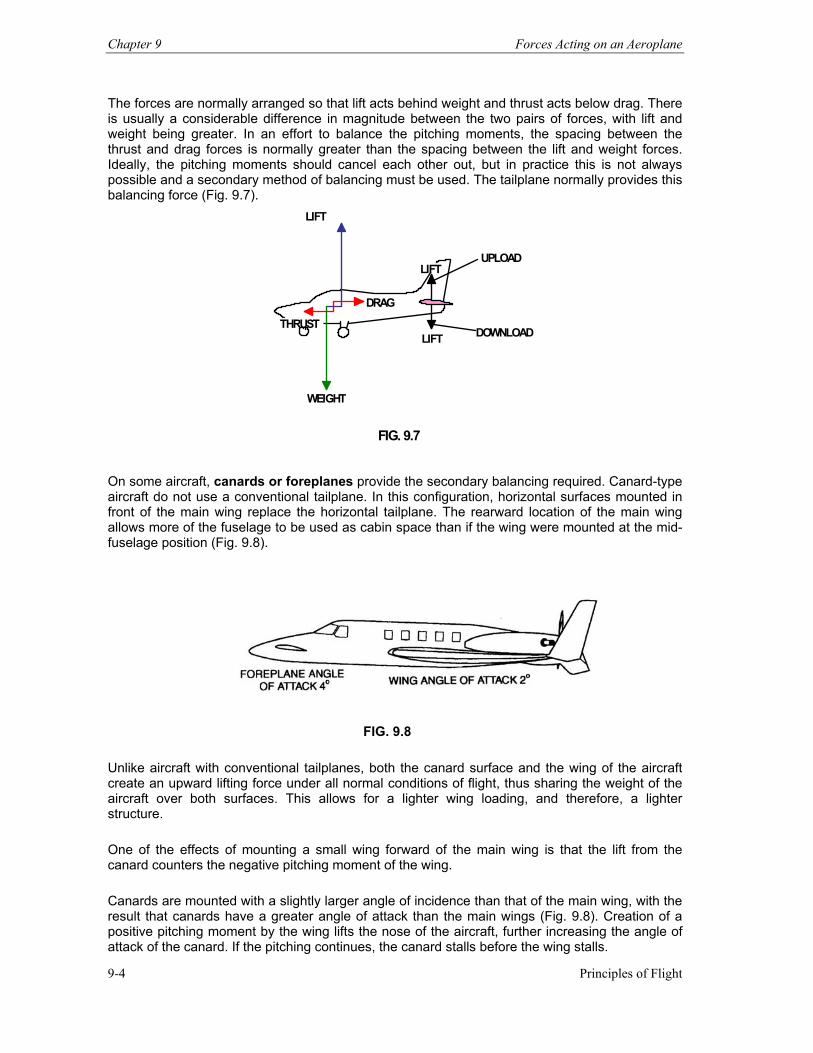
Chapter 9 Forces Acting on an Aeroplane
Principles of Flight 9-4
The forces are normally arranged so that lift acts behind weight and thrust acts below drag. There is usually a considerable difference in magnitude between the two pairs of forces, with lift and weight being greater. In an effort to balance the pitching moments, the spacing between the thrust and drag forces is normally greater than the spacing between the lift and weight forces. Ideally, the pitching moments should cancel each other out, but in practice this is not always possible and a secondary method of balancing must be used. The tailplane normally provides this balancing force (Fig. 9.7).
THRUST
LIFT
WEIGHT
DRAG
LIFT
LIFTUPLOAD
DOWNLOAD
FIG. 9.7
On some aircraft, canards or foreplanes provide the secondary balancing required. Canard-type aircraft do not use a conventional tailplane. In this configuration, horizontal surfaces mounted in front of the main wing replace the horizontal tailplane. The rearward location of the main wing allows more of the fuselage to be used as cabin space than if the wing were mounted at the mid-fuselage position (Fig. 9.8).
Unlike aircraft with conventional tailplanes, both the canard surface and the wing of the aircraft create an upward lifting force under all normal conditions of flight, thus sharing the weight of the aircraft over both surfaces. This allows for a lighter wing loading, and therefore, a lighter structure. One of the effects of mounting a small wing forward of the main wing is that the lift from the canard counters the negative pitching moment of the wing. Canards are mounted with a slightly larger angle of incidence than that of the main wing, with the result that canards have a greater angle of attack than the main wings (Fig. 9.8). Creation of a positive pitching moment by the wing lifts the nose of the aircraft, further increasing the angle of attack of the canard. If the pitching continues, the canard stalls before the wing stalls.
FIG. 9.8
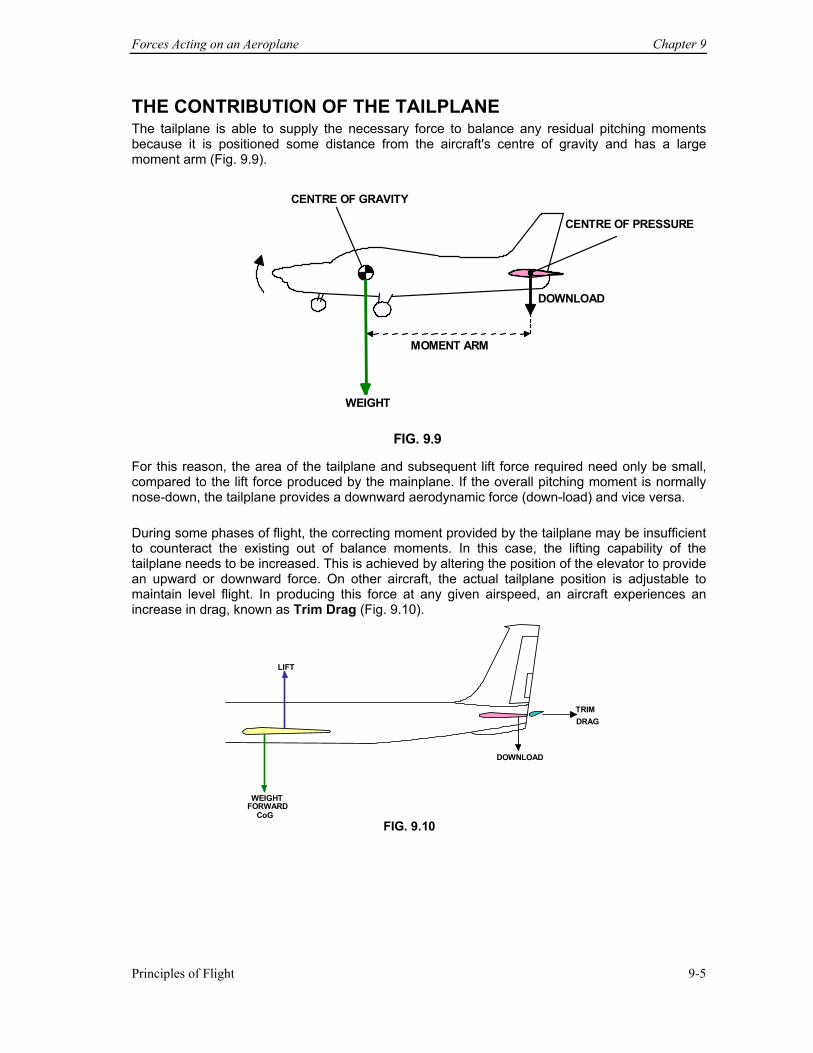
Forces Acting on an Aeroplane Chapter 9
Principles of Flight 9-5
THE CONTRIBUTION OF THE TAILPLANE The tailplane is able to supply the necessary force to balance any residual pitching moments because it is positioned some distance from the aircraft's centre of gravity and has a large moment arm (Fig. 9.9).
MOMENT ARM
DOWNLOAD
CENTRE OF PRESSURE
WEIGHT
CENTRE OF GRAVITY
FIG. 9.9
For this reason, the area of the tailplane and subsequent lift force required need only be small, compared to the lift force produced by the mainplane. If the overall pitching moment is normally nose-down, the tailplane provides a downward aerodynamic force (down-load) and vice versa. During some phases of flight, the correcting moment provided by the tailplane may be insufficient to counteract the existing out of balance moments. In this case, the lifting capability of the tailplane needs to be increased. This is achieved by altering the position of the elevator to provide an upward or downward force. On other aircraft, the actual tailplane position is adjustable to maintain level flight. In producing this force at any given airspeed, an aircraft experiences an increase in drag, known as Trim Drag (Fig. 9.10).
LIFT
WEIGHT FORWARD
CoG
DOWNLOAD
TRIM DRAG
FIG. 9.10
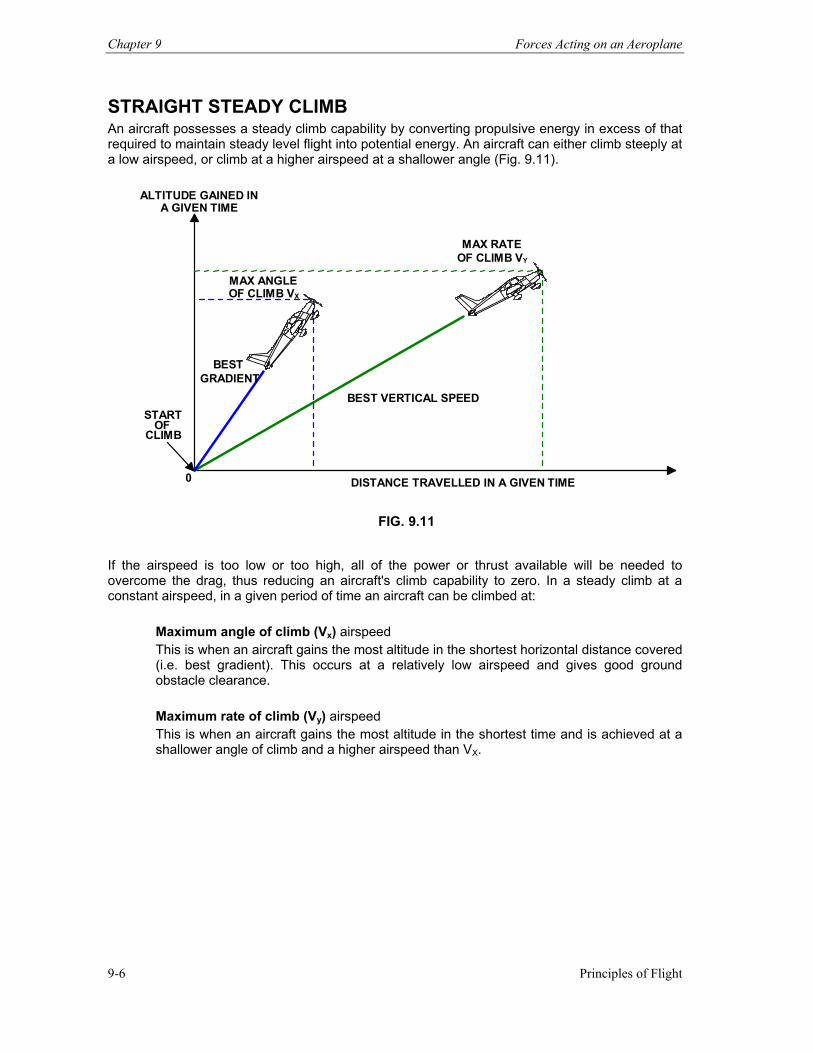
Chapter 9 Forces Acting on an Aeroplane
Principles of Flight 9-6
STRAIGHT STEADY CLIMB An aircraft possesses a steady climb capability by converting propulsive energy in excess of that required to maintain steady level flight into potential energy. An aircraft can either climb steeply at a low airspeed, or climb at a higher airspeed at a shallower angle (Fig. 9.11).
MAX ANGLE OF CLIMB VX
MAX RATEOF CLIMB VY
ALTITUDE GAINED IN A GIVEN TIME
0 DISTANCE TRAVELLED IN A GIVEN TIME
BEST VERTICAL SPEED
BEST GRADIENT
START OF
CLIMB
FIG. 9.11
If the airspeed is too low or too high, all of the power or thrust available will be needed to overcome the drag, thus reducing an aircraft's climb capability to zero. In a steady climb at a constant airspeed, in a given period of time an aircraft can be climbed at:
Maximum angle of climb (Vx) airspeed This is when an aircraft gains the most altitude in the shortest horizontal distance covered (i.e. best gradient). This occurs at a relatively low airspeed and gives good ground obstacle clearance. Maximum rate of climb (Vy) airspeed This is when an aircraft gains the most altitude in the shortest time and is achieved at a shallower angle of climb and a higher airspeed than VX.
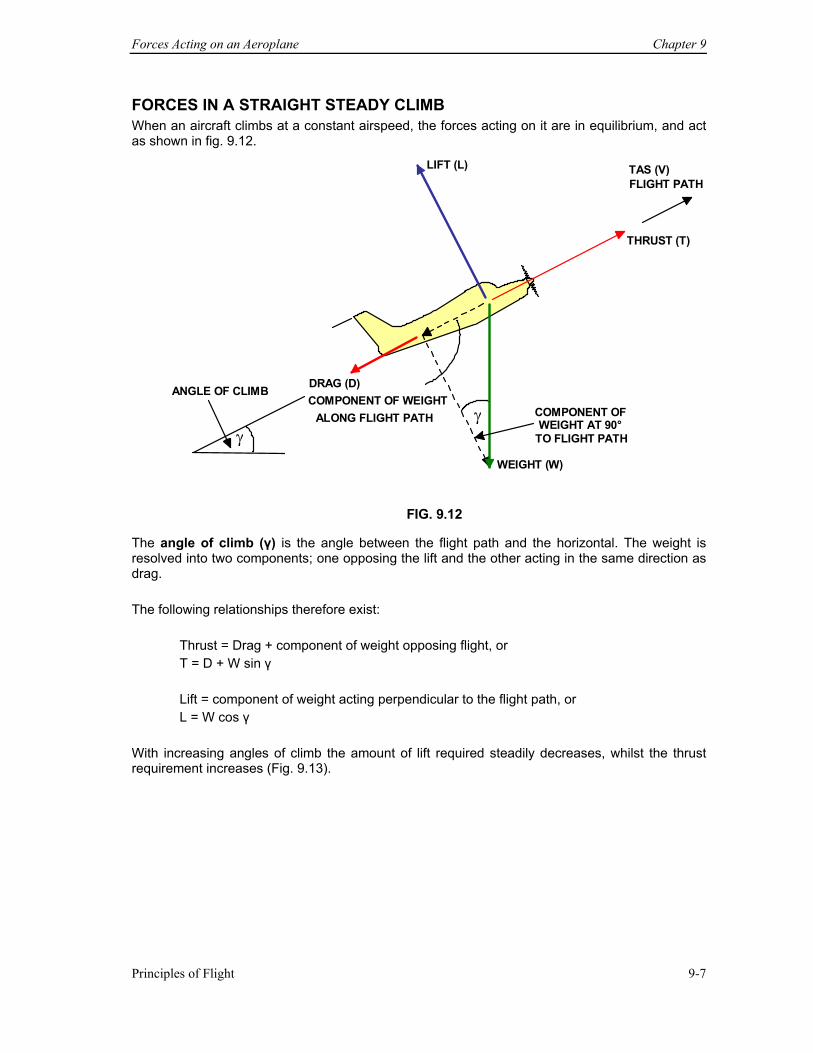
Forces Acting on an Aeroplane Chapter 9
Principles of Flight 9-7
FORCES IN A STRAIGHT STEADY CLIMB When an aircraft climbs at a constant airspeed, the forces acting on it are in equilibrium, and act as shown in fig. 9.12.
COMPONENT OF WEIGHTALONG FLIGHT PATH
FLIGHT PATH
ANGLE OF CLIMB COMPONENT OF WEIGHT AT 90°
TO FLIGHT PATH
DRAG (D)
LIFT (L)
THRUST (T)
TAS (V)
WEIGHT (W)
FIG. 9.12
γ
γ
The angle of climb (γ) is the angle between the flight path and the horizontal. The weight is resolved into two components; one opposing the lift and the other acting in the same direction as drag. The following relationships therefore exist: Thrust = Drag + component of weight opposing flight, or
T = D + W sin γ
Lift = component of weight acting perpendicular to the flight path, or L = W cos γ
With increasing angles of climb the amount of lift required steadily decreases, whilst the thrust requirement increases (Fig. 9.13).
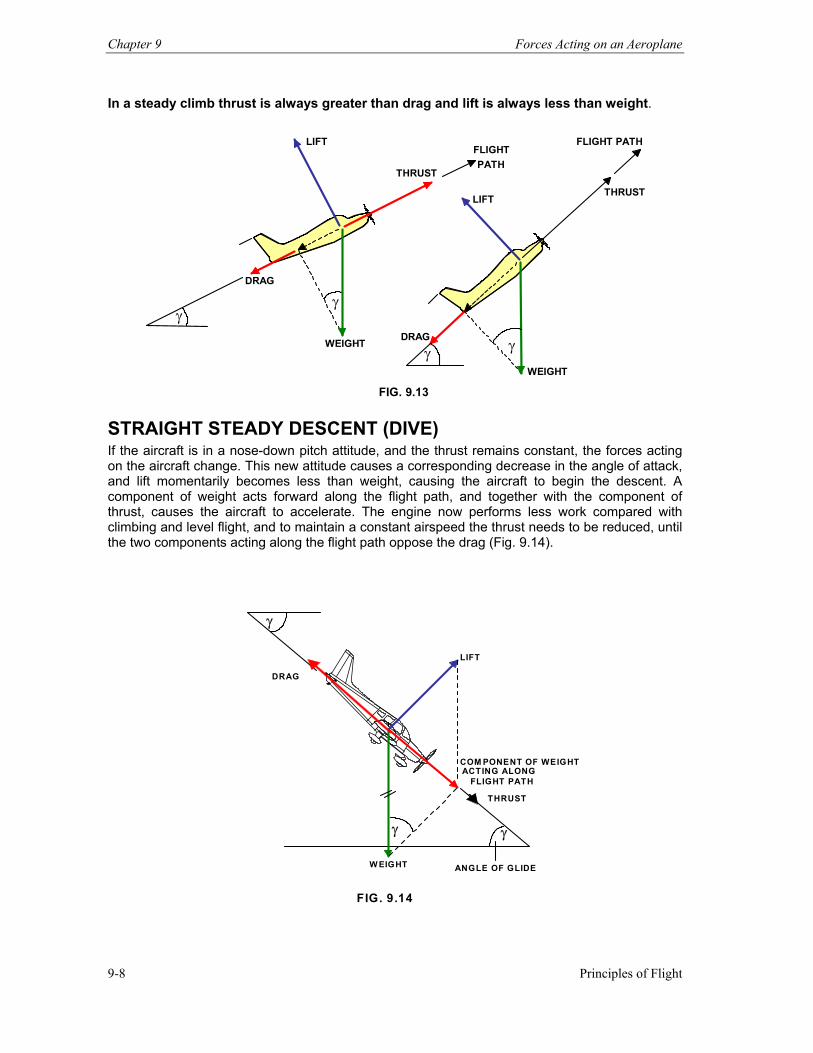
Chapter 9 Forces Acting on an Aeroplane
Principles of Flight 9-8
In a steady climb thrust is always greater than drag and lift is always less than weight.
FLIGHTPATH
LIFT
DRAG
THRUST
WEIGHT
FIG. 9.13
FLIGHT PATH
THRUST LIFT
DRAG
WEIGHT
γ
γ
γ
γ
STRAIGHT STEADY DESCENT (DIVE) If the aircraft is in a nose-down pitch attitude, and the thrust remains constant, the forces acting on the aircraft change. This new attitude causes a corresponding decrease in the angle of attack, and lift momentarily becomes less than weight, causing the aircraft to begin the descent. A component of weight acts forward along the flight path, and together with the component of thrust, causes the aircraft to accelerate. The engine now performs less work compared with climbing and level flight, and to maintain a constant airspeed the thrust needs to be reduced, until the two components acting along the flight path oppose the drag (Fig. 9.14).
DRAG
THRUST
LIFT
W EIGHT ANGLE OF GLIDE
COM PONENT OF WEIGHT ACTING ALONG
FLIGHT PATH
γ
FIG. 9.14
γ γ
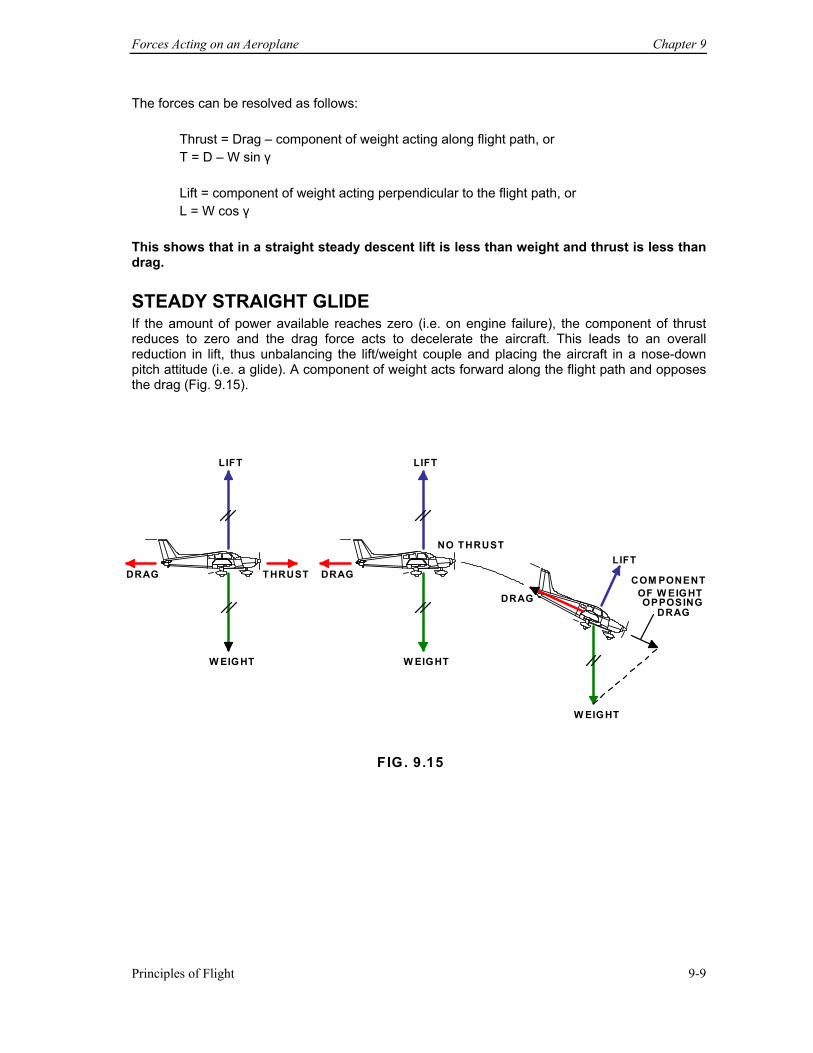
Forces Acting on an Aeroplane Chapter 9
Principles of Flight 9-9
The forces can be resolved as follows: Thrust = Drag – component of weight acting along flight path, or
T = D – W sin γ Lift = component of weight acting perpendicular to the flight path, or
L = W cos γ This shows that in a straight steady descent lift is less than weight and thrust is less than drag. STEADY STRAIGHT GLIDE If the amount of power available reaches zero (i.e. on engine failure), the component of thrust reduces to zero and the drag force acts to decelerate the aircraft. This leads to an overall reduction in lift, thus unbalancing the lift/weight couple and placing the aircraft in a nose-down pitch attitude (i.e. a glide). A component of weight acts forward along the flight path and opposes the drag (Fig. 9.15).
LIFT
DRAG
W EIG HT
T HRUST
LIFT
DRAG
W EIGHT
NO THRUST
DRAG
W EIGHT
LIFT COM PONENT
OF W EIGHTOPPOSING
DRAG
FIG. 9.15
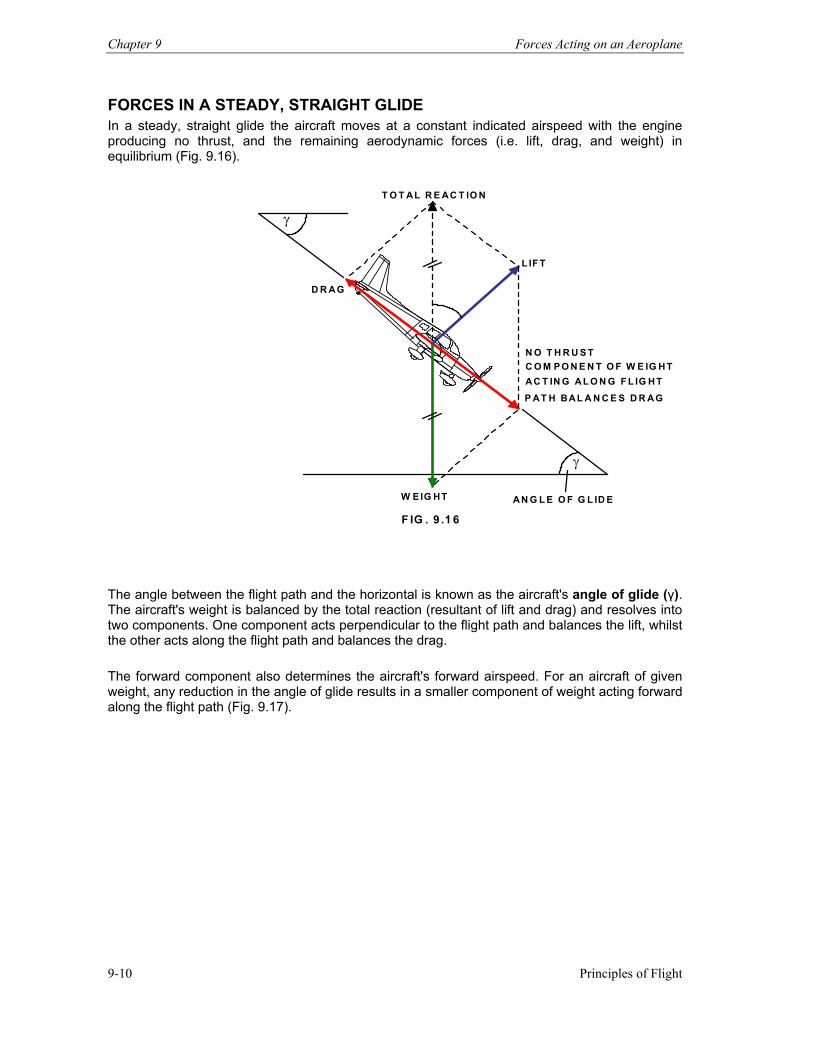
Chapter 9 Forces Acting on an Aeroplane
Principles of Flight 9-10
FORCES IN A STEADY, STRAIGHT GLIDE In a steady, straight glide the aircraft moves at a constant indicated airspeed with the engine producing no thrust, and the remaining aerodynamic forces (i.e. lift, drag, and weight) in equilibrium (Fig. 9.16).
D R A G
T O T AL R E AC T IO N
L IF T
W E IG HT A N G L E O F G L ID E
N O T H R U S T C O M P O N E N T O F W E IG H TAC T IN G A L O N G F L IG H T
P AT H BAL A N C E S D R AG
F IG . 9 .1 6
γ
γ
The angle between the flight path and the horizontal is known as the aircraft's angle of glide (γ). The aircraft's weight is balanced by the total reaction (resultant of lift and drag) and resolves into two components. One component acts perpendicular to the flight path and balances the lift, whilst the other acts along the flight path and balances the drag. The forward component also determines the aircraft's forward airspeed. For an aircraft of given weight, any reduction in the angle of glide results in a smaller component of weight acting forward along the flight path (Fig. 9.17).
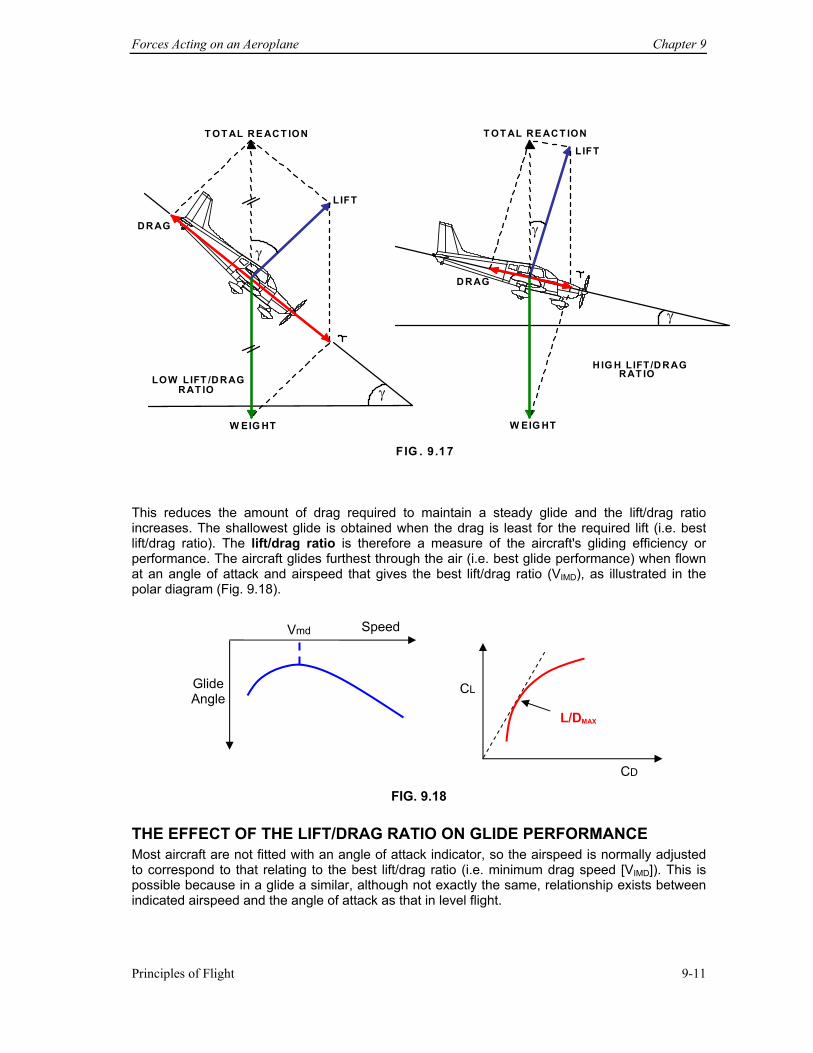
Forces Acting on an Aeroplane Chapter 9
Principles of Flight 9-11
DR AG
T OT AL RE ACT ION
LIFT
W EIG HT
LOW LIFT /D RAG RAT IO
D RAG
LIFT T OT AL RE ACT ION
H IG H LIFT/D RAGRAT IO
FIG . 9.17
γ
γ
γ
γ
W EIG HT
This reduces the amount of drag required to maintain a steady glide and the lift/drag ratio increases. The shallowest glide is obtained when the drag is least for the required lift (i.e. best lift/drag ratio). The lift/drag ratio is therefore a measure of the aircraft's gliding efficiency or performance. The aircraft glides furthest through the air (i.e. best glide performance) when flown at an angle of attack and airspeed that gives the best lift/drag ratio (VIMD), as illustrated in the polar diagram (Fig. 9.18).
FIG. 9.18
THE EFFECT OF THE LIFT/DRAG RATIO ON GLIDE PERFORMANCE Most aircraft are not fitted with an angle of attack indicator, so the airspeed is normally adjusted to correspond to that relating to the best lift/drag ratio (i.e. minimum drag speed [VIMD]). This is possible because in a glide a similar, although not exactly the same, relationship exists between indicated airspeed and the angle of attack as that in level flight.
Glide Angle
Speed
CL
CD
L/DMAX
Vmd
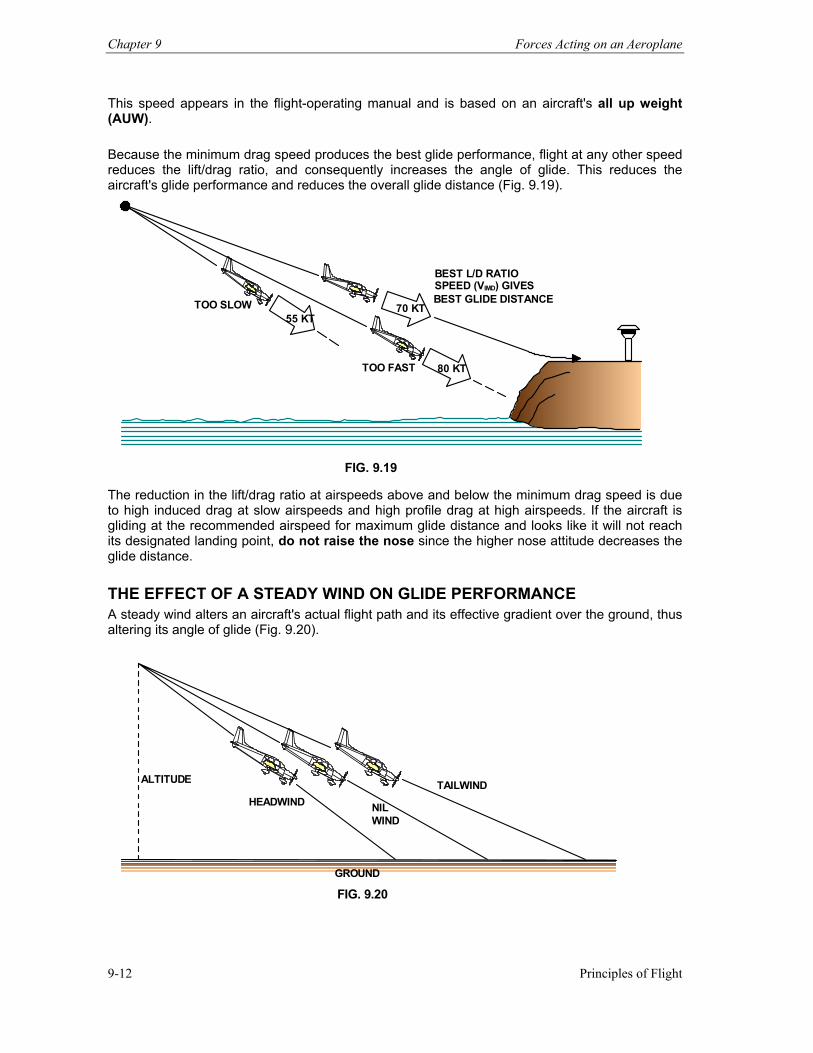
Chapter 9 Forces Acting on an Aeroplane
Principles of Flight 9-12
This speed appears in the flight-operating manual and is based on an aircraft's all up weight (AUW). Because the minimum drag speed produces the best glide performance, flight at any other speed reduces the lift/drag ratio, and consequently increases the angle of glide. This reduces the aircraft's glide performance and reduces the overall glide distance (Fig. 9.19).
TOO SLOW
TOO FAST
70 KT
80 KT
55 KT
BEST L/D RATIOSPEED (VIMD) GIVESBEST GLIDE DISTANCE
FIG. 9.19
The reduction in the lift/drag ratio at airspeeds above and below the minimum drag speed is due to high induced drag at slow airspeeds and high profile drag at high airspeeds. If the aircraft is gliding at the recommended airspeed for maximum glide distance and looks like it will not reach its designated landing point, do not raise the nose since the higher nose attitude decreases the glide distance. THE EFFECT OF A STEADY WIND ON GLIDE PERFORMANCE A steady wind alters an aircraft's actual flight path and its effective gradient over the ground, thus altering its angle of glide (Fig. 9.20).
ALTITUDE
GROUND
FIG. 9.20
TAILWIND
NIL WIND
HEADWIND
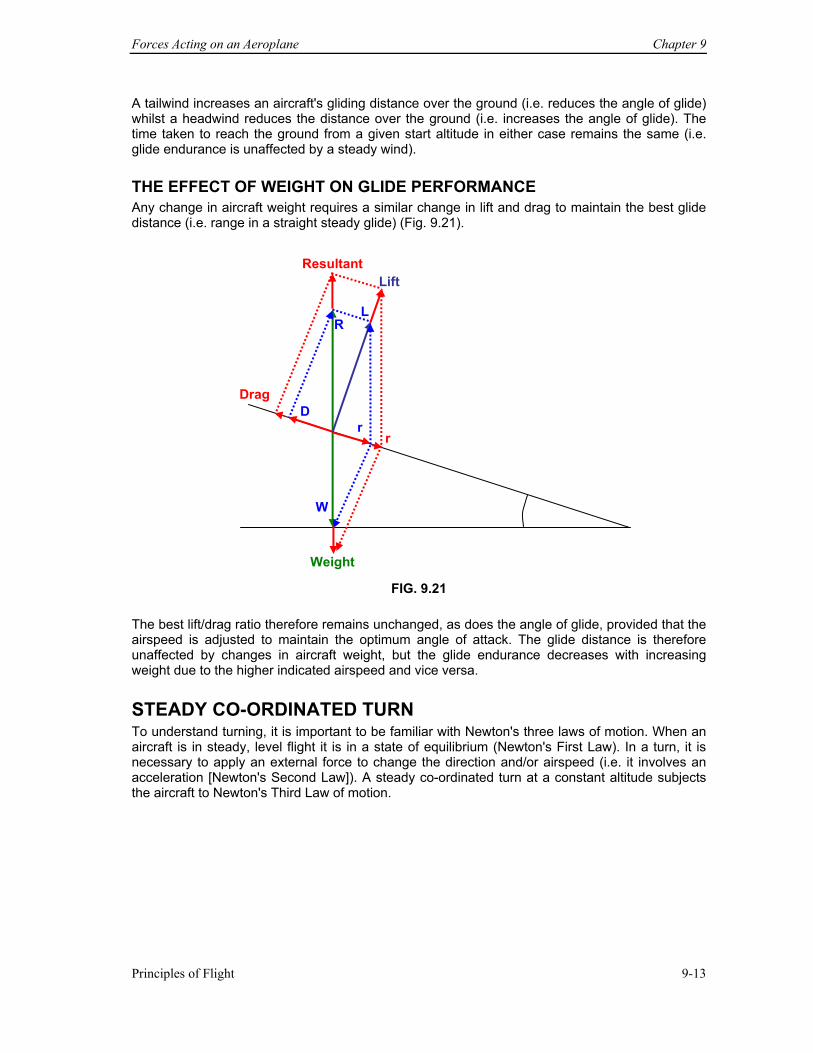
Forces Acting on an Aeroplane Chapter 9
Principles of Flight 9-13
A tailwind increases an aircraft's gliding distance over the ground (i.e. reduces the angle of glide) whilst a headwind reduces the distance over the ground (i.e. increases the angle of glide). The time taken to reach the ground from a given start altitude in either case remains the same (i.e. glide endurance is unaffected by a steady wind). THE EFFECT OF WEIGHT ON GLIDE PERFORMANCE Any change in aircraft weight requires a similar change in lift and drag to maintain the best glide distance (i.e. range in a straight steady glide) (Fig. 9.21).
FIG. 9.21
The best lift/drag ratio therefore remains unchanged, as does the angle of glide, provided that the airspeed is adjusted to maintain the optimum angle of attack. The glide distance is therefore unaffected by changes in aircraft weight, but the glide endurance decreases with increasing weight due to the higher indicated airspeed and vice versa. STEADY CO-ORDINATED TURN To understand turning, it is important to be familiar with Newton's three laws of motion. When an aircraft is in steady, level flight it is in a state of equilibrium (Newton's First Law). In a turn, it is necessary to apply an external force to change the direction and/or airspeed (i.e. it involves an acceleration [Newton's Second Law]). A steady co-ordinated turn at a constant altitude subjects the aircraft to Newton's Third Law of motion.
Weight
Drag
Lift Resultant
R
D
W
L
r r
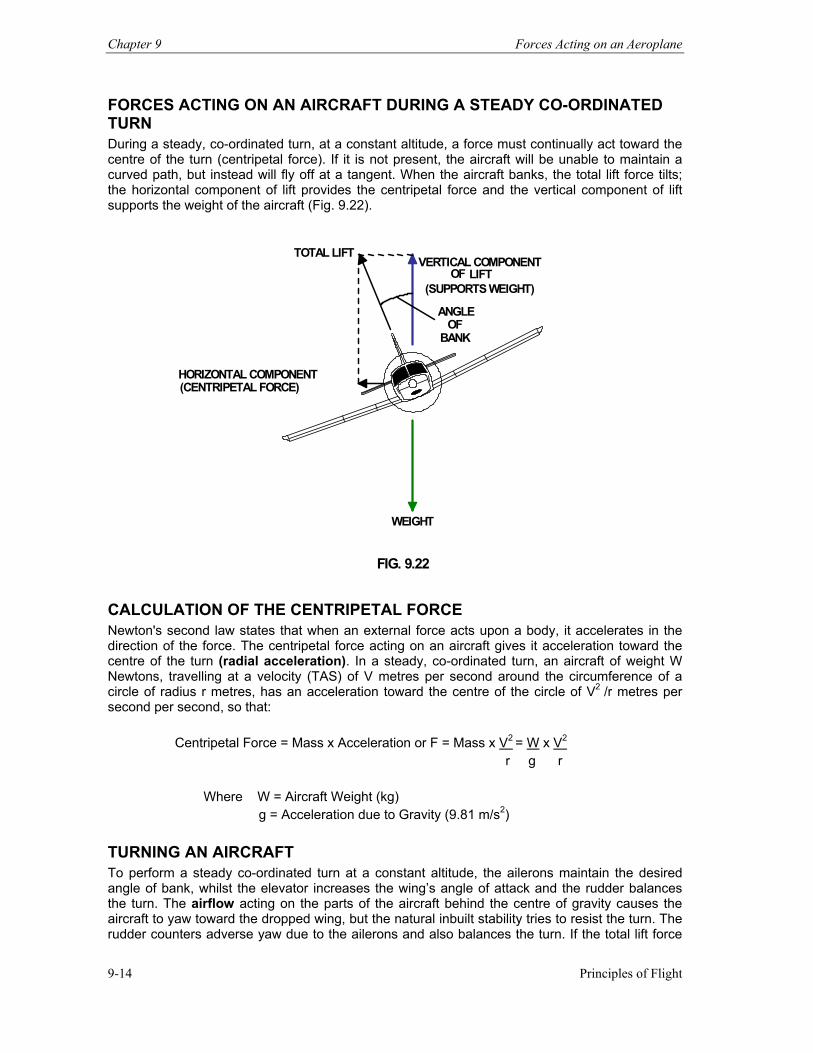
Chapter 9 Forces Acting on an Aeroplane
Principles of Flight 9-14
FORCES ACTING ON AN AIRCRAFT DURING A STEADY CO-ORDINATED TURN During a steady, co-ordinated turn, at a constant altitude, a force must continually act toward the centre of the turn (centripetal force). If it is not present, the aircraft will be unable to maintain a curved path, but instead will fly off at a tangent. When the aircraft banks, the total lift force tilts; the horizontal component of lift provides the centripetal force and the vertical component of lift supports the weight of the aircraft (Fig. 9.22).
TOTAL LIFTVERTICAL COMPONENT
(SUPPORTS WEIGHT)
HORIZONTAL COMPONENT (CENTRIPETAL FORCE)
LIFT
WEIGHT
ANGLEOF
BANK
OF
FIG. 9.22
CALCULATION OF THE CENTRIPETAL FORCE Newton's second law states that when an external force acts upon a body, it accelerates in the direction of the force. The centripetal force acting on an aircraft gives it acceleration toward the centre of the turn (radial acceleration). In a steady, co-ordinated turn, an aircraft of weight W Newtons, travelling at a velocity (TAS) of V metres per second around the circumference of a circle of radius r metres, has an acceleration toward the centre of the circle of V2 /r metres per second per second, so that:
Centripetal Force = Mass x Acceleration or F = Mass x V2 = W x V2
r g r
Where W = Aircraft Weight (kg) g = Acceleration due to Gravity (9.81 m/s2) TURNING AN AIRCRAFT To perform a steady co-ordinated turn at a constant altitude, the ailerons maintain the desired angle of bank, whilst the elevator increases the wing’s angle of attack and the rudder balances the turn. The airflow acting on the parts of the aircraft behind the centre of gravity causes the aircraft to yaw toward the dropped wing, but the natural inbuilt stability tries to resist the turn. The rudder counters adverse yaw due to the ailerons and also balances the turn. If the total lift force
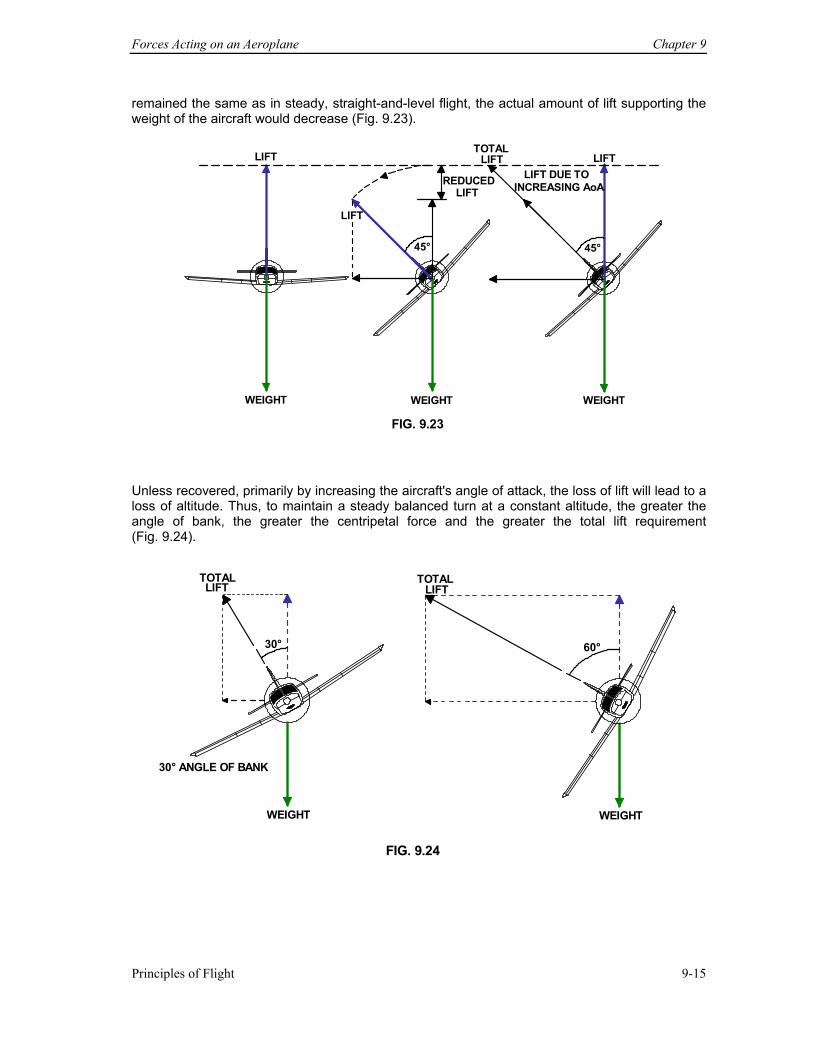
Forces Acting on an Aeroplane Chapter 9
Principles of Flight 9-15
remained the same as in steady, straight-and-level flight, the actual amount of lift supporting the weight of the aircraft would decrease (Fig. 9.23).
LIFT
WEIGHT
REDUCEDLIFT
LIFT
45°
WEIGHT
45°
WEIGHT
LIFT TOTALLIFT
LIFT DUE TO INCREASING AoA
FIG. 9.23
Unless recovered, primarily by increasing the aircraft's angle of attack, the loss of lift will lead to a loss of altitude. Thus, to maintain a steady balanced turn at a constant altitude, the greater the angle of bank, the greater the centripetal force and the greater the total lift requirement (Fig. 9.24).
30°
LIFT
WEIGHT
30° ANGLE OF BANK
60°
LIFT
WEIGHT
TOTAL TOTAL
FIG. 9.24
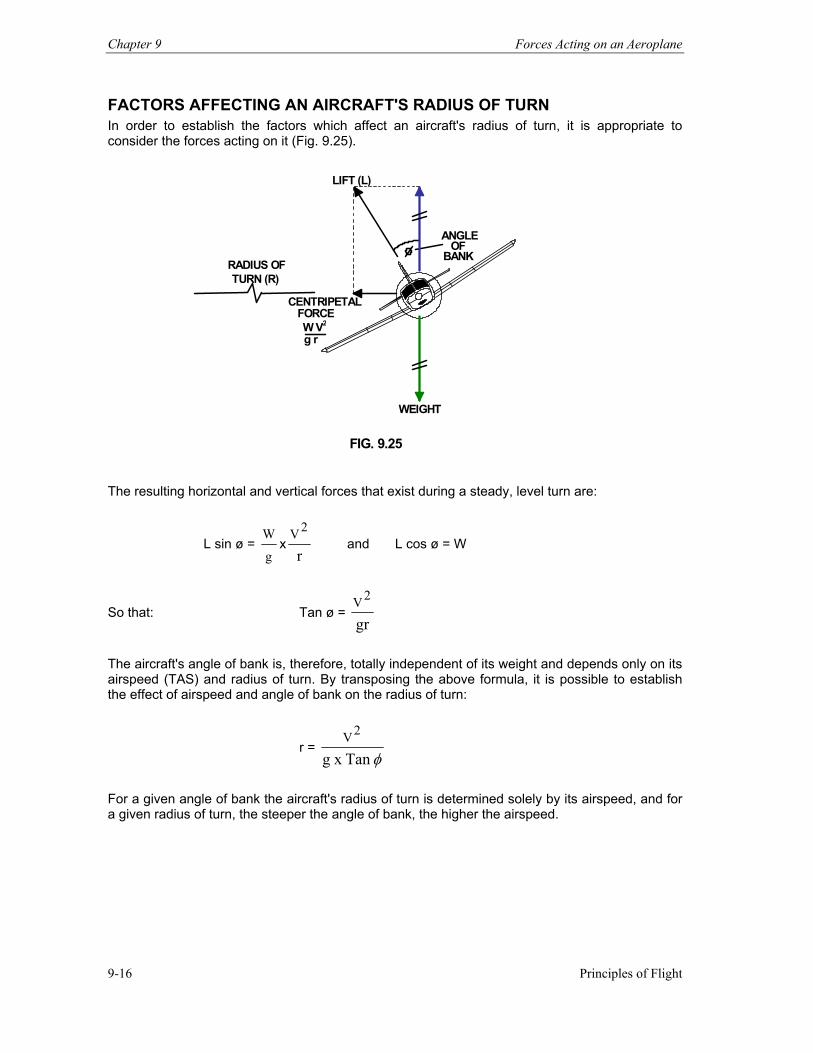
Chapter 9 Forces Acting on an Aeroplane
Principles of Flight 9-16
FACTORS AFFECTING AN AIRCRAFT'S RADIUS OF TURN In order to establish the factors which affect an aircraft's radius of turn, it is appropriate to consider the forces acting on it (Fig. 9.25).
WEIGHT
ANGLEOF
BANK
LIFT (L)
RADIUS OF TURN (R)
CENTRIPETALFORCE
g r W V2
FIG. 9.25
The resulting horizontal and vertical forces that exist during a steady, level turn are:
L sin ø = g
Wx
r
2V and L cos ø = W
So that: Tan ø = gr
2V
The aircraft's angle of bank is, therefore, totally independent of its weight and depends only on its airspeed (TAS) and radius of turn. By transposing the above formula, it is possible to establish the effect of airspeed and angle of bank on the radius of turn:
r = φTan x g
2V
For a given angle of bank the aircraft's radius of turn is determined solely by its airspeed, and for a given radius of turn, the steeper the angle of bank, the higher the airspeed.
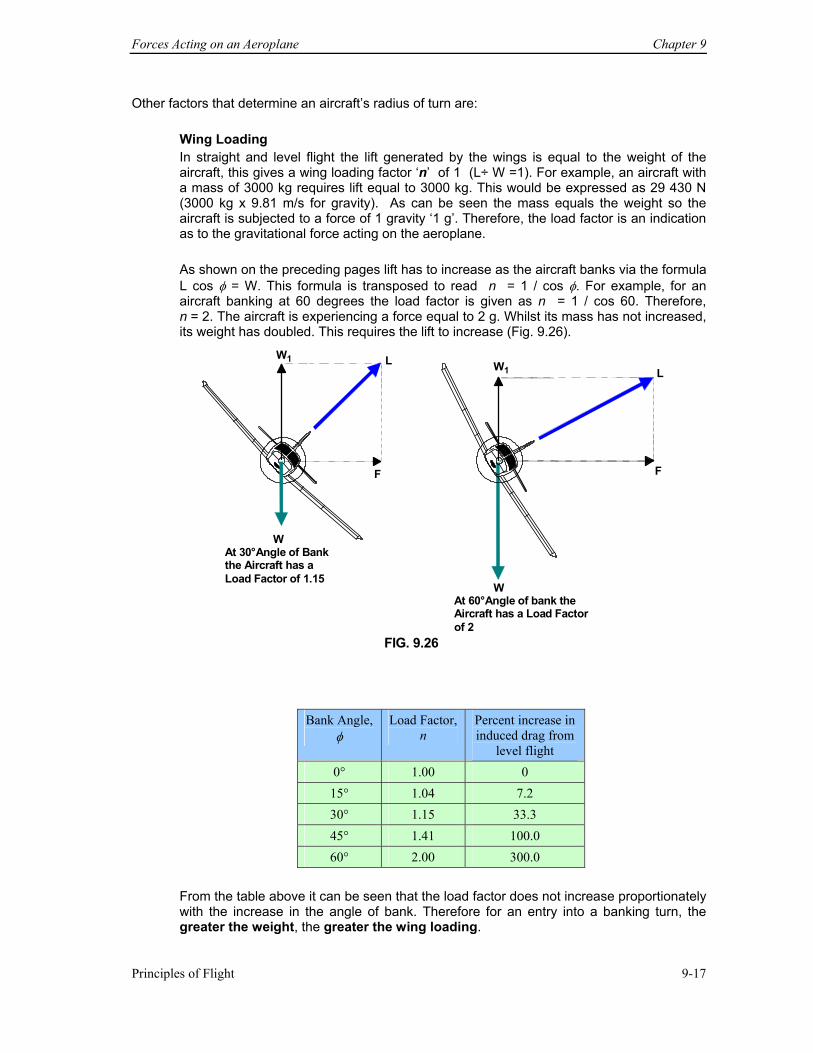
Forces Acting on an Aeroplane Chapter 9
Principles of Flight 9-17
Other factors that determine an aircraft’s radius of turn are:
Wing Loading In straight and level flight the lift generated by the wings is equal to the weight of the aircraft, this gives a wing loading factor ‘n’ of 1 (L÷ W =1). For example, an aircraft with a mass of 3000 kg requires lift equal to 3000 kg. This would be expressed as 29 430 N (3000 kg x 9.81 m/s for gravity). As can be seen the mass equals the weight so the aircraft is subjected to a force of 1 gravity ‘1 g’. Therefore, the load factor is an indication as to the gravitational force acting on the aeroplane. As shown on the preceding pages lift has to increase as the aircraft banks via the formula L cos φ = W. This formula is transposed to read n = 1 / cos φ. For example, for an aircraft banking at 60 degrees the load factor is given as n = 1 / cos 60. Therefore, n = 2. The aircraft is experiencing a force equal to 2 g. Whilst its mass has not increased, its weight has doubled. This requires the lift to increase (Fig. 9.26).
Bank Angle, φ
Load Factor, n
Percent increase in induced drag from
level flight 0° 1.00 0 15° 1.04 7.2 30° 1.15 33.3 45° 1.41 100.0 60° 2.00 300.0
From the table above it can be seen that the load factor does not increase proportionately with the increase in the angle of bank. Therefore for an entry into a banking turn, the greater the weight, the greater the wing loading.
W At 30°Angle of Bank the Aircraft has a Load Factor of 1.15
FIG. 9.26
W At 60°Angle of bank the Aircraft has a Load Factor of 2
W 1 L
F
W1 L
F
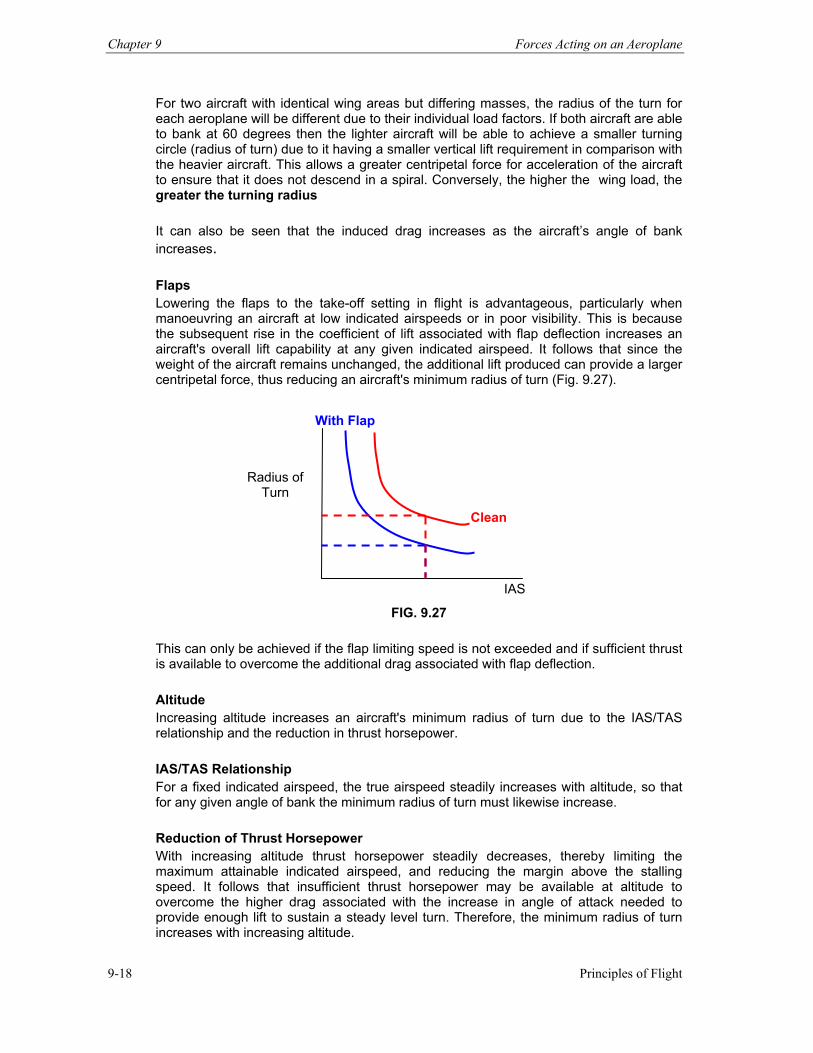
Chapter 9 Forces Acting on an Aeroplane
Principles of Flight 9-18
For two aircraft with identical wing areas but differing masses, the radius of the turn for each aeroplane will be different due to their individual load factors. If both aircraft are able to bank at 60 degrees then the lighter aircraft will be able to achieve a smaller turning circle (radius of turn) due to it having a smaller vertical lift requirement in comparison with the heavier aircraft. This allows a greater centripetal force for acceleration of the aircraft to ensure that it does not descend in a spiral. Conversely, the higher the wing load, the greater the turning radius
It can also be seen that the induced drag increases as the aircraft’s angle of bank increases. Flaps Lowering the flaps to the take-off setting in flight is advantageous, particularly when manoeuvring an aircraft at low indicated airspeeds or in poor visibility. This is because the subsequent rise in the coefficient of lift associated with flap deflection increases an aircraft's overall lift capability at any given indicated airspeed. It follows that since the weight of the aircraft remains unchanged, the additional lift produced can provide a larger centripetal force, thus reducing an aircraft's minimum radius of turn (Fig. 9.27).
FIG. 9.27
This can only be achieved if the flap limiting speed is not exceeded and if sufficient thrust is available to overcome the additional drag associated with flap deflection. Altitude Increasing altitude increases an aircraft's minimum radius of turn due to the IAS/TAS relationship and the reduction in thrust horsepower.
IAS/TAS Relationship For a fixed indicated airspeed, the true airspeed steadily increases with altitude, so that for any given angle of bank the minimum radius of turn must likewise increase. Reduction of Thrust Horsepower With increasing altitude thrust horsepower steadily decreases, thereby limiting the maximum attainable indicated airspeed, and reducing the margin above the stalling speed. It follows that insufficient thrust horsepower may be available at altitude to overcome the higher drag associated with the increase in angle of attack needed to provide enough lift to sustain a steady level turn. Therefore, the minimum radius of turn increases with increasing altitude.
Radius of Turn
IAS
Clean
With Flap
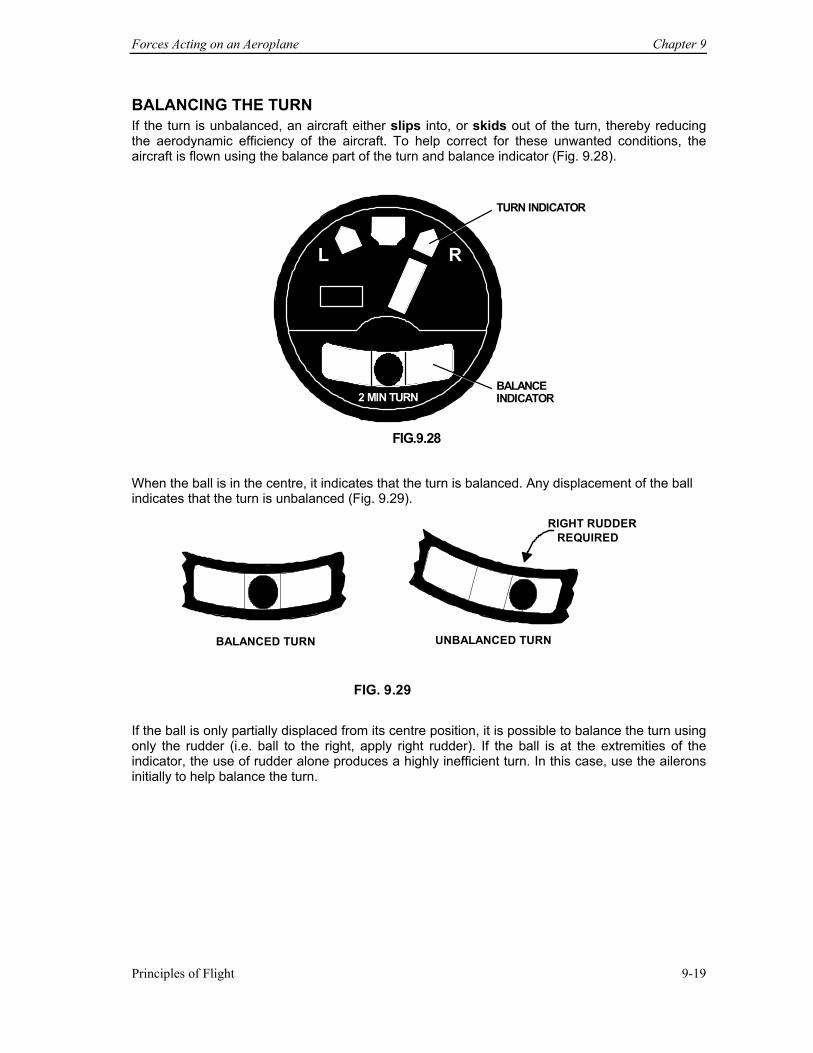
Forces Acting on an Aeroplane Chapter 9
Principles of Flight 9-19
BALANCING THE TURN If the turn is unbalanced, an aircraft either slips into, or skids out of the turn, thereby reducing the aerodynamic efficiency of the aircraft. To help correct for these unwanted conditions, the aircraft is flown using the balance part of the turn and balance indicator (Fig. 9.28).
2 MIN TURN
L R
TURN INDICATOR
BALANCEINDICATOR
FIG.9.28
When the ball is in the centre, it indicates that the turn is balanced. Any displacement of the ball indicates that the turn is unbalanced (Fig. 9.29).
BALANCED TURN UNBALANCED TURN
RIGHT RUDDER REQUIRED
FIG. 9.29
If the ball is only partially displaced from its centre position, it is possible to balance the turn using only the rudder (i.e. ball to the right, apply right rudder). If the ball is at the extremities of the indicator, the use of rudder alone produces a highly inefficient turn. In this case, use the ailerons initially to help balance the turn.
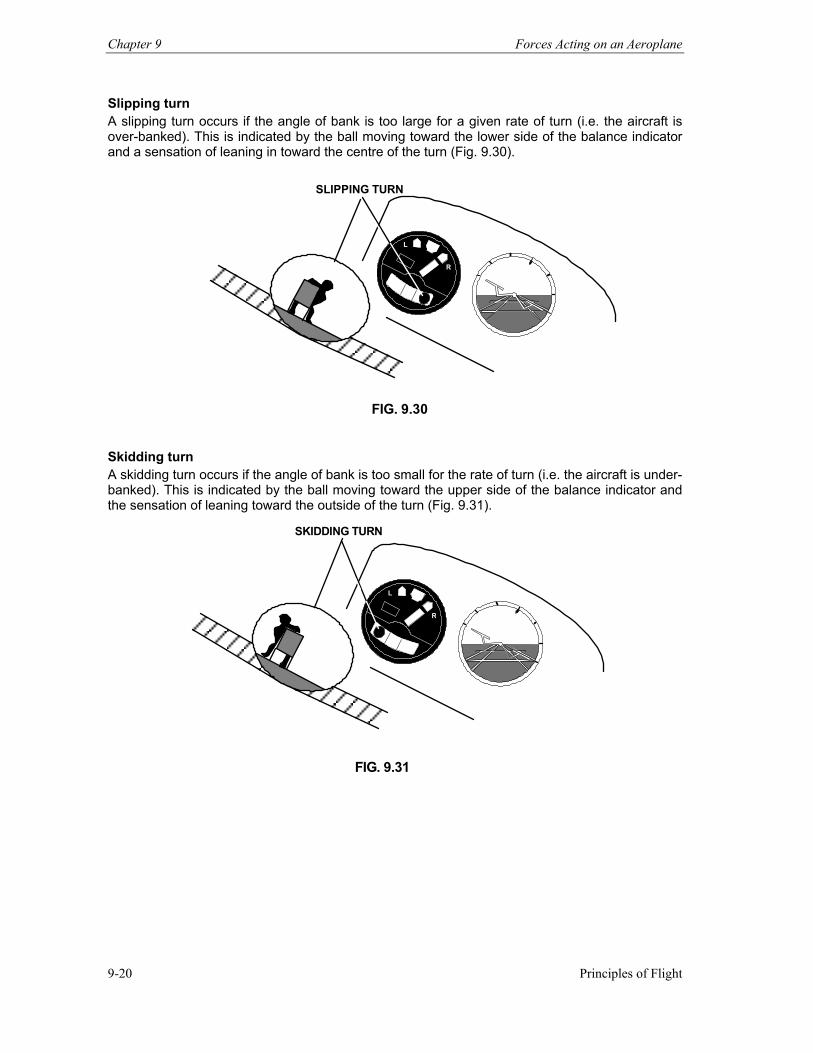
Chapter 9 Forces Acting on an Aeroplane
Principles of Flight 9-20
Slipping turn A slipping turn occurs if the angle of bank is too large for a given rate of turn (i.e. the aircraft is over-banked). This is indicated by the ball moving toward the lower side of the balance indicator and a sensation of leaning in toward the centre of the turn (Fig. 9.30).
L
R
SLIPPING TURN
FIG. 9.30
Skidding turn A skidding turn occurs if the angle of bank is too small for the rate of turn (i.e. the aircraft is under-banked). This is indicated by the ball moving toward the upper side of the balance indicator and the sensation of leaning toward the outside of the turn (Fig. 9.31).
L
R
SKIDDING TURN
FIG. 9.31

Forces Acting on an Aeroplane Chapter 9
Principles of Flight 9-21
Balanced turn During a balanced turn the ball remains in the centre of the balance indicator and the pilot remains upright in the seat relative to the aircraft, with no tendency to lean (Fig. 9.32).
L
R
BALANCED TURN
FIG. 9.32
Any deviation from a balanced turn is corrected by applying rudder according to the position of the ball. By maintaining the ball in the centre the pilot will maintain a balanced turn. RATE OF TURN This is measurement of how long it takes for an aircraft to turn, measured in degrees per second. This is particularly important during instrument flying where rate-1 turns are usually carried out at a rate of 3° per second. This means that the aircraft turns through 180° in 1 minute, or 360° in 2 minutes. A steeper angle of bank is required to carry out a rate-1 turn at higher airspeeds. LOAD FACTOR The additional lift required to maintain a steady, co-ordinated turn at a constant altitude places an increased structural loading on the aircraft’s wings. This is because the wings need to produce lift in excess of the aircraft weight to provide the necessary centripetal force. A ratio exists between the total lift produced by the wings and the weight of the aircraft. This gives a measure of the structural loading that occurs during a balanced turn. This ratio is termed the load factor.
Load factor = AUW
Lift Total
In straight and steady level flight the load factor is one, but during a turn the increased lift requirement produces a value greater than one. A relationship exists between angle of bank and load factor, such that:
Load Factor = AUW
Lift Total =
cos1
φ
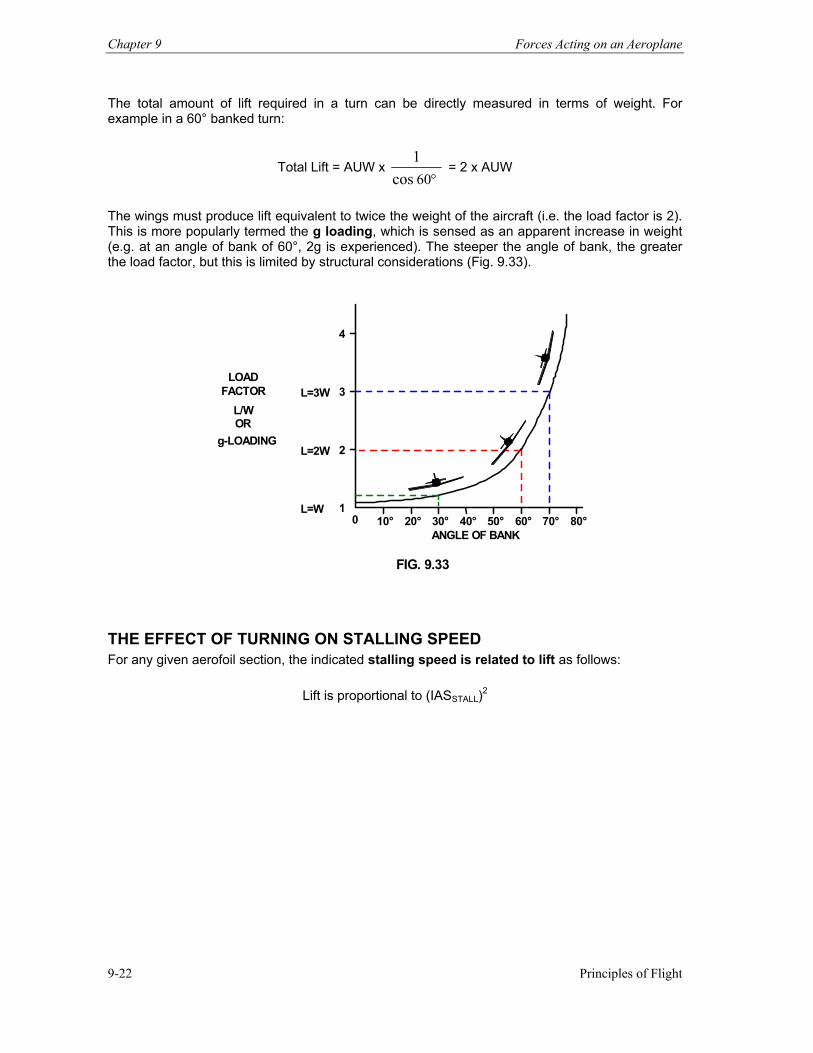
Chapter 9 Forces Acting on an Aeroplane
Principles of Flight 9-22
The total amount of lift required in a turn can be directly measured in terms of weight. For example in a 60° banked turn:
Total Lift = AUW x cos
106 °
= 2 x AUW
The wings must produce lift equivalent to twice the weight of the aircraft (i.e. the load factor is 2). This is more popularly termed the g loading, which is sensed as an apparent increase in weight (e.g. at an angle of bank of 60°, 2g is experienced). The steeper the angle of bank, the greater the load factor, but this is limited by structural considerations (Fig. 9.33).
FIG. 9.33
4
3
2
10 20° 40°10° 30° 50° 60° 70° 80°
L=2W
L=3W
L=W
LOAD FACTOR
L/W OR
g-LOADING
ANGLE OF BANK
THE EFFECT OF TURNING ON STALLING SPEED For any given aerofoil section, the indicated stalling speed is related to lift as follows:
Lift is proportional to (IASSTALL)2
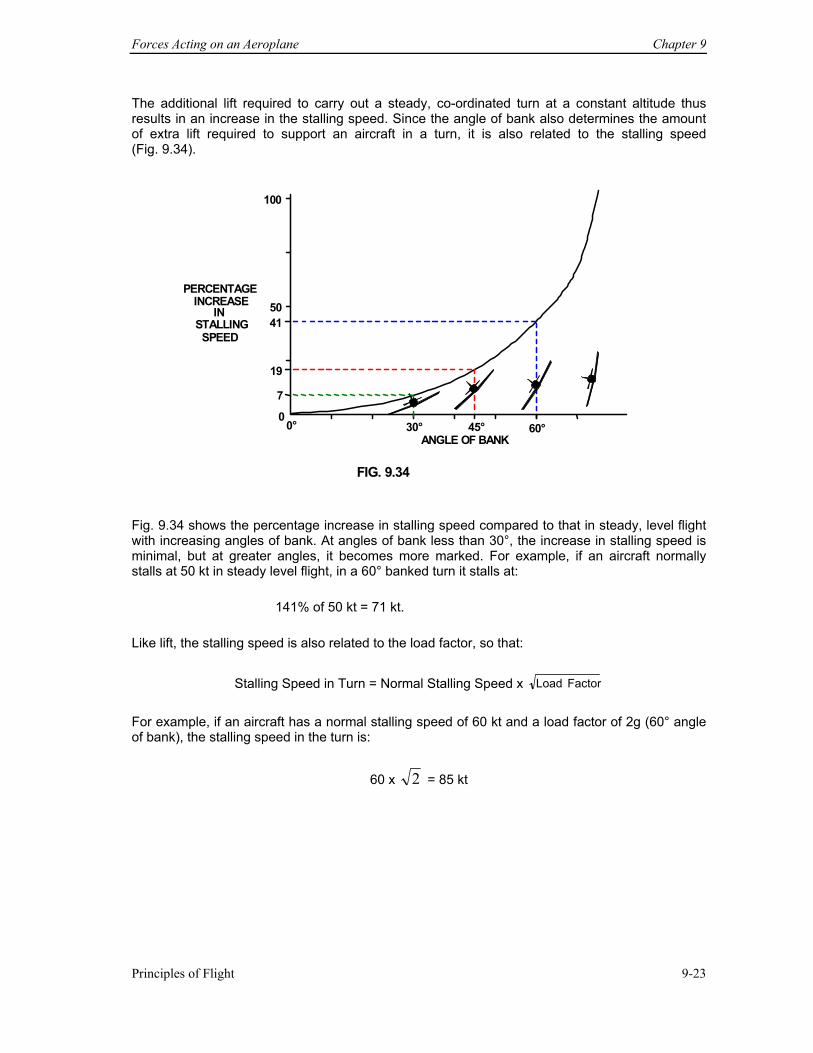
Forces Acting on an Aeroplane Chapter 9
Principles of Flight 9-23
The additional lift required to carry out a steady, co-ordinated turn at a constant altitude thus results in an increase in the stalling speed. Since the angle of bank also determines the amount of extra lift required to support an aircraft in a turn, it is also related to the stalling speed (Fig. 9.34).
FIG. 9.34
100
50 41
19 7 0
0° 30° 45° 60°ANGLE OF BANK
PERCENTAGE INCREASE
IN STALLING SPEED
Fig. 9.34 shows the percentage increase in stalling speed compared to that in steady, level flight with increasing angles of bank. At angles of bank less than 30°, the increase in stalling speed is minimal, but at greater angles, it becomes more marked. For example, if an aircraft normally stalls at 50 kt in steady level flight, in a 60° banked turn it stalls at: 141% of 50 kt = 71 kt. Like lift, the stalling speed is also related to the load factor, so that:
Stalling Speed in Turn = Normal Stalling Speed x Factor Load For example, if an aircraft has a normal stalling speed of 60 kt and a load factor of 2g (60° angle of bank), the stalling speed in the turn is:
60 x 2 = 85 kt
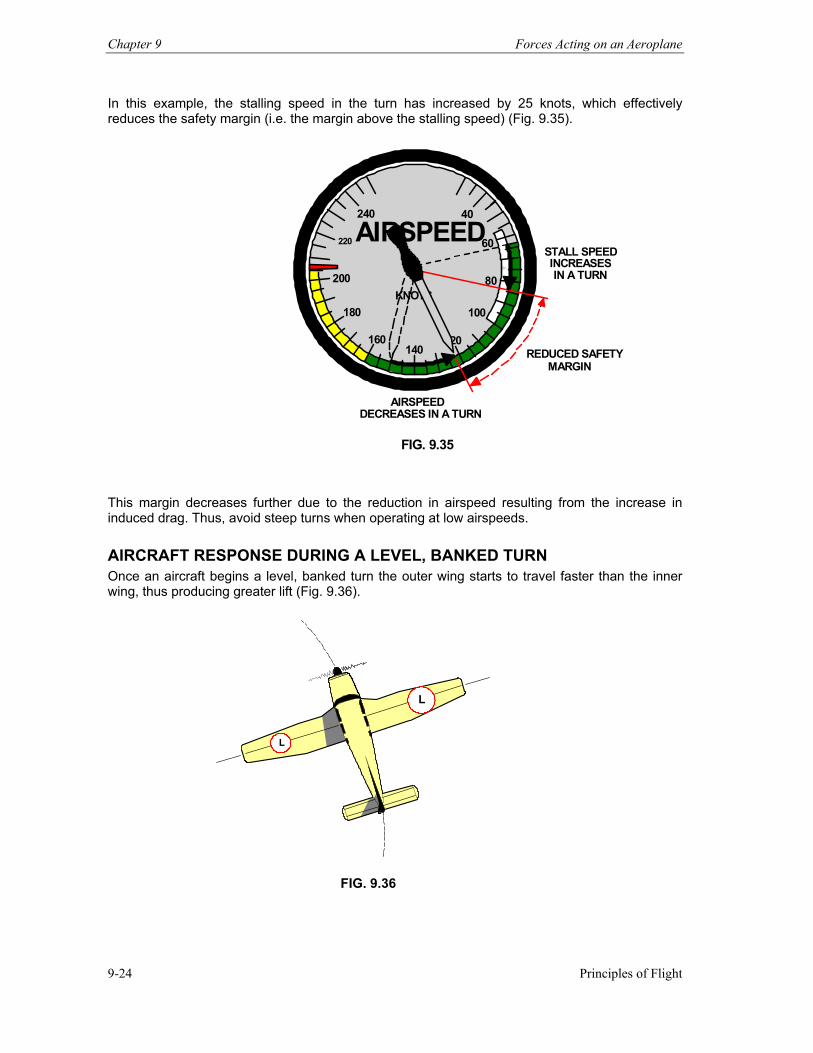
Chapter 9 Forces Acting on an Aeroplane
Principles of Flight 9-24
In this example, the stalling speed in the turn has increased by 25 knots, which effectively reduces the safety margin (i.e. the margin above the stalling speed) (Fig. 9.35).
40
60
80
100
120140
160
180
200
220
240
AIRSPEED
KNOTS
STALL SPEED INCREASES IN A TURN
REDUCED SAFETY MARGIN
AIRSPEEDDECREASES IN A TURN
FIG. 9.35
This margin decreases further due to the reduction in airspeed resulting from the increase in induced drag. Thus, avoid steep turns when operating at low airspeeds. AIRCRAFT RESPONSE DURING A LEVEL, BANKED TURN Once an aircraft begins a level, banked turn the outer wing starts to travel faster than the inner wing, thus producing greater lift (Fig. 9.36).
L
L
FIG. 9.36
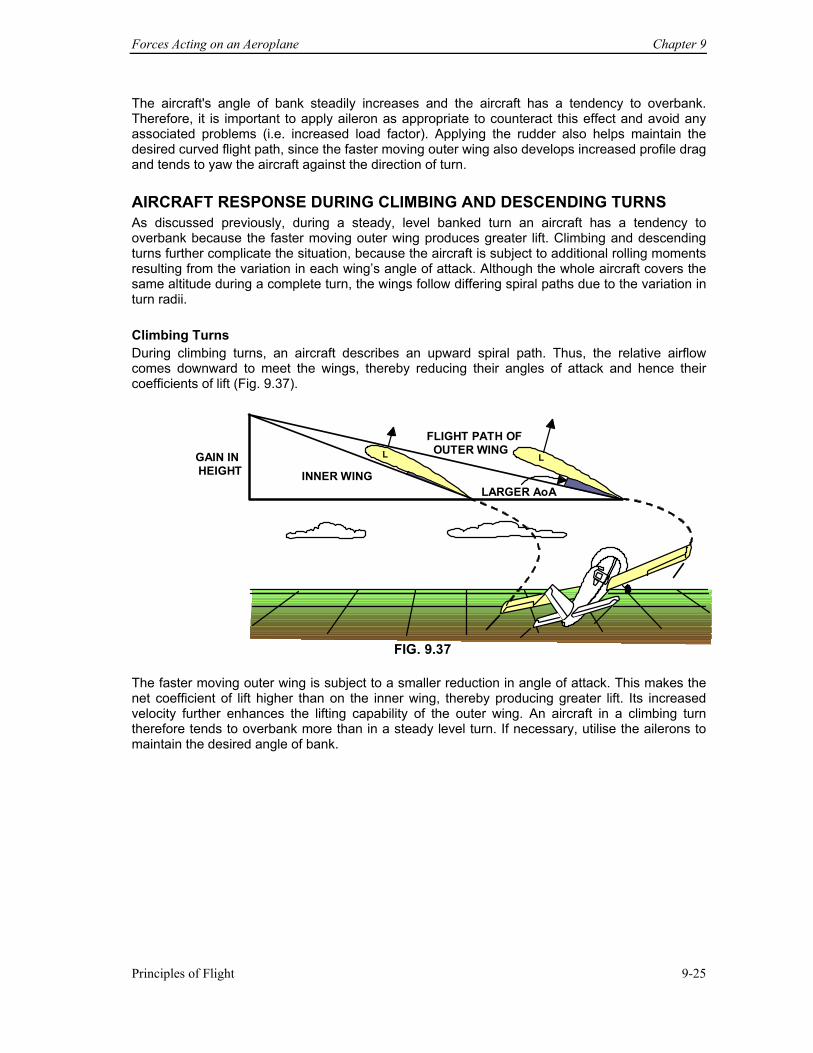
Forces Acting on an Aeroplane Chapter 9
Principles of Flight 9-25
The aircraft's angle of bank steadily increases and the aircraft has a tendency to overbank. Therefore, it is important to apply aileron as appropriate to counteract this effect and avoid any associated problems (i.e. increased load factor). Applying the rudder also helps maintain the desired curved flight path, since the faster moving outer wing also develops increased profile drag and tends to yaw the aircraft against the direction of turn. AIRCRAFT RESPONSE DURING CLIMBING AND DESCENDING TURNS As discussed previously, during a steady, level banked turn an aircraft has a tendency to overbank because the faster moving outer wing produces greater lift. Climbing and descending turns further complicate the situation, because the aircraft is subject to additional rolling moments resulting from the variation in each wing’s angle of attack. Although the whole aircraft covers the same altitude during a complete turn, the wings follow differing spiral paths due to the variation in turn radii. Climbing Turns During climbing turns, an aircraft describes an upward spiral path. Thus, the relative airflow comes downward to meet the wings, thereby reducing their angles of attack and hence their coefficients of lift (Fig. 9.37).
L L
INNER WING
FLIGHT PATH OF OUTER WING
LARGER AoA
GAIN IN HEIGHT
FIG. 9.37 The faster moving outer wing is subject to a smaller reduction in angle of attack. This makes the net coefficient of lift higher than on the inner wing, thereby producing greater lift. Its increased velocity further enhances the lifting capability of the outer wing. An aircraft in a climbing turn therefore tends to overbank more than in a steady level turn. If necessary, utilise the ailerons to maintain the desired angle of bank.
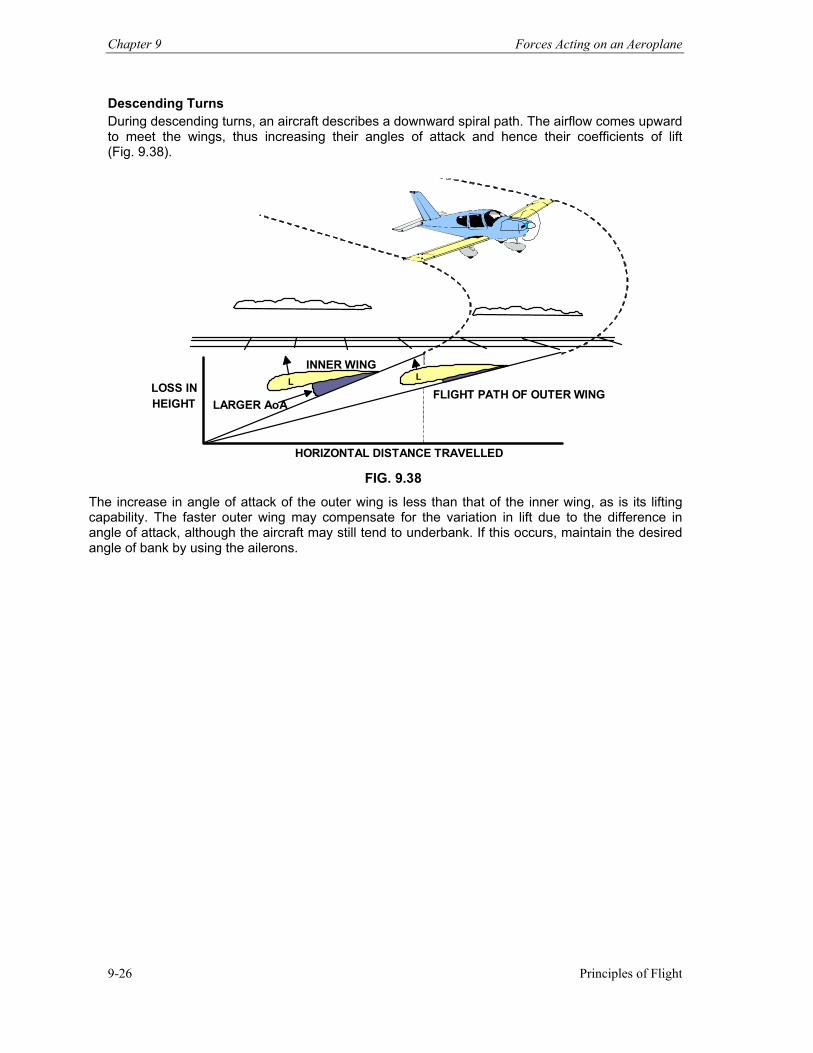
Chapter 9 Forces Acting on an Aeroplane
Principles of Flight 9-26
Descending Turns During descending turns, an aircraft describes a downward spiral path. The airflow comes upward to meet the wings, thus increasing their angles of attack and hence their coefficients of lift (Fig. 9.38).
LARGER AoA
INNER WING
FLIGHT PATH OF OUTER WING
HORIZONTAL DISTANCE TRAVELLED
LOSS IN HEIGHT
LL
FIG. 9.38The increase in angle of attack of the outer wing is less than that of the inner wing, as is its lifting capability. The faster outer wing may compensate for the variation in lift due to the difference in angle of attack, although the aircraft may still tend to underbank. If this occurs, maintain the desired angle of bank by using the ailerons.
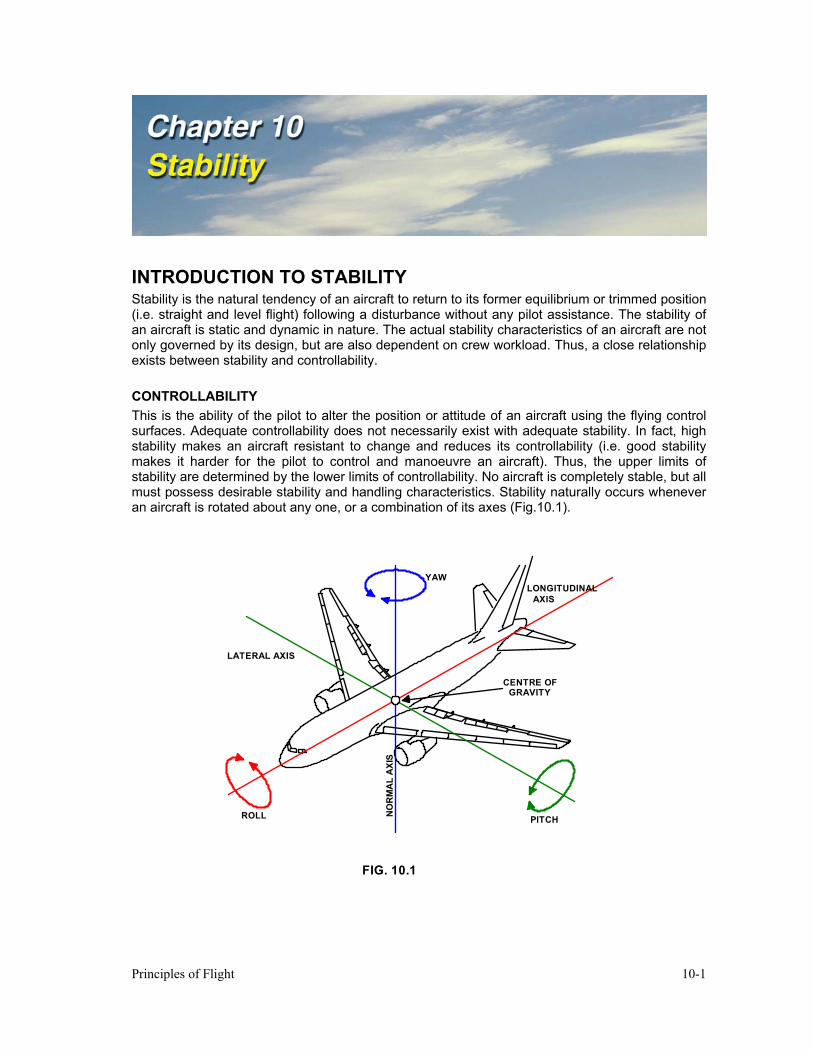
Principles of Flight 10-1
INTRODUCTION TO STABILITY Stability is the natural tendency of an aircraft to return to its former equilibrium or trimmed position (i.e. straight and level flight) following a disturbance without any pilot assistance. The stability of an aircraft is static and dynamic in nature. The actual stability characteristics of an aircraft are not only governed by its design, but are also dependent on crew workload. Thus, a close relationship exists between stability and controllability. CONTROLLABILITY This is the ability of the pilot to alter the position or attitude of an aircraft using the flying control surfaces. Adequate controllability does not necessarily exist with adequate stability. In fact, high stability makes an aircraft resistant to change and reduces its controllability (i.e. good stability makes it harder for the pilot to control and manoeuvre an aircraft). Thus, the upper limits of stability are determined by the lower limits of controllability. No aircraft is completely stable, but all must possess desirable stability and handling characteristics. Stability naturally occurs whenever an aircraft is rotated about any one, or a combination of its axes (Fig.10.1).
NO
RM
AL
AXI
S
LATERAL AXIS
LONGITUDINAL AXIS
ROLL
YAW
PITCH
CENTRE OFGRAVITY
FIG. 10.1
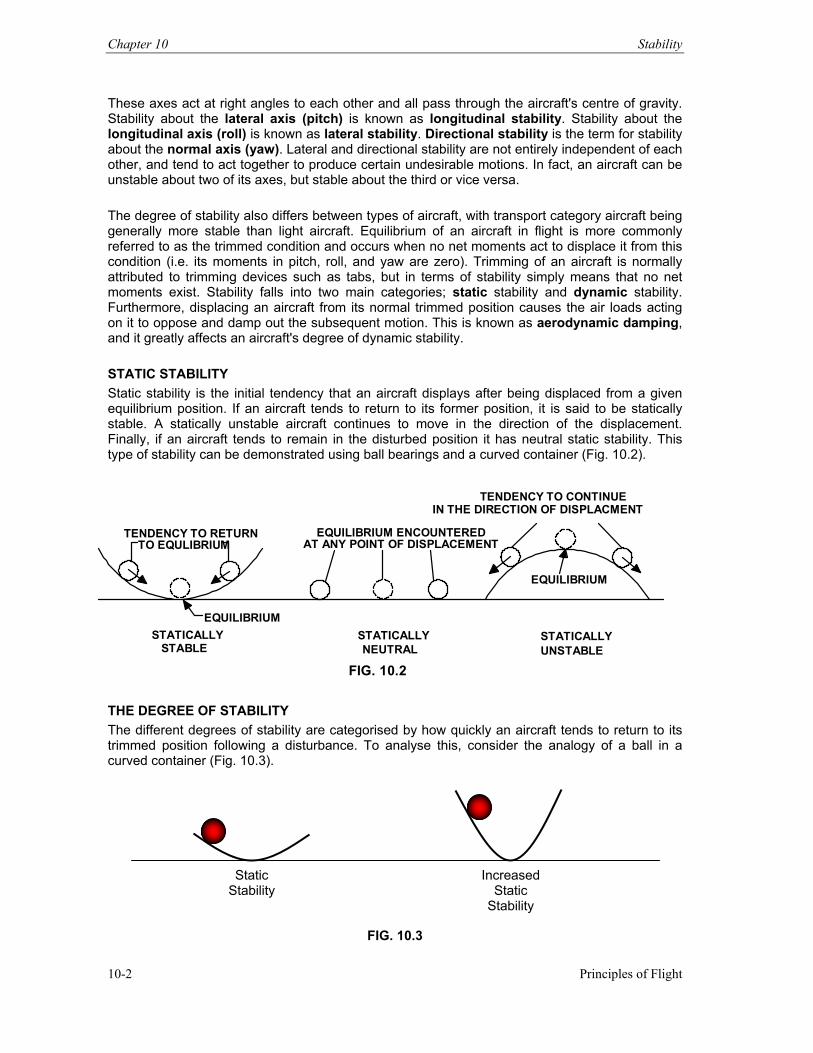
Chapter 10 Stability
Principles of Flight 10-2
These axes act at right angles to each other and all pass through the aircraft's centre of gravity. Stability about the lateral axis (pitch) is known as longitudinal stability. Stability about the longitudinal axis (roll) is known as lateral stability. Directional stability is the term for stability about the normal axis (yaw). Lateral and directional stability are not entirely independent of each other, and tend to act together to produce certain undesirable motions. In fact, an aircraft can be unstable about two of its axes, but stable about the third or vice versa. The degree of stability also differs between types of aircraft, with transport category aircraft being generally more stable than light aircraft. Equilibrium of an aircraft in flight is more commonly referred to as the trimmed condition and occurs when no net moments act to displace it from this condition (i.e. its moments in pitch, roll, and yaw are zero). Trimming of an aircraft is normally attributed to trimming devices such as tabs, but in terms of stability simply means that no net moments exist. Stability falls into two main categories; static stability and dynamic stability. Furthermore, displacing an aircraft from its normal trimmed position causes the air loads acting on it to oppose and damp out the subsequent motion. This is known as aerodynamic damping, and it greatly affects an aircraft's degree of dynamic stability. STATIC STABILITY Static stability is the initial tendency that an aircraft displays after being displaced from a given equilibrium position. If an aircraft tends to return to its former position, it is said to be statically stable. A statically unstable aircraft continues to move in the direction of the displacement. Finally, if an aircraft tends to remain in the disturbed position it has neutral static stability. This type of stability can be demonstrated using ball bearings and a curved container (Fig. 10.2).
TENDENCY TO RETURN
TO EQULIBRIUM
EQUILIBRIUM STATICALLY
STABLE
EQUILIBRIUM ENCOUNTEREDAT ANY POINT OF DISPLACEMENT
STATICALLYNEUTRAL
EQUILIBRIUM
STATICALLY UNSTABLE
TENDENCY TO CONTINUE IN THE DIRECTION OF DISPLACMENT
FIG. 10.2
THE DEGREE OF STABILITY The different degrees of stability are categorised by how quickly an aircraft tends to return to its trimmed position following a disturbance. To analyse this, consider the analogy of a ball in a curved container (Fig. 10.3).
FIG. 10.3
Static Stability
Increased Static
Stability
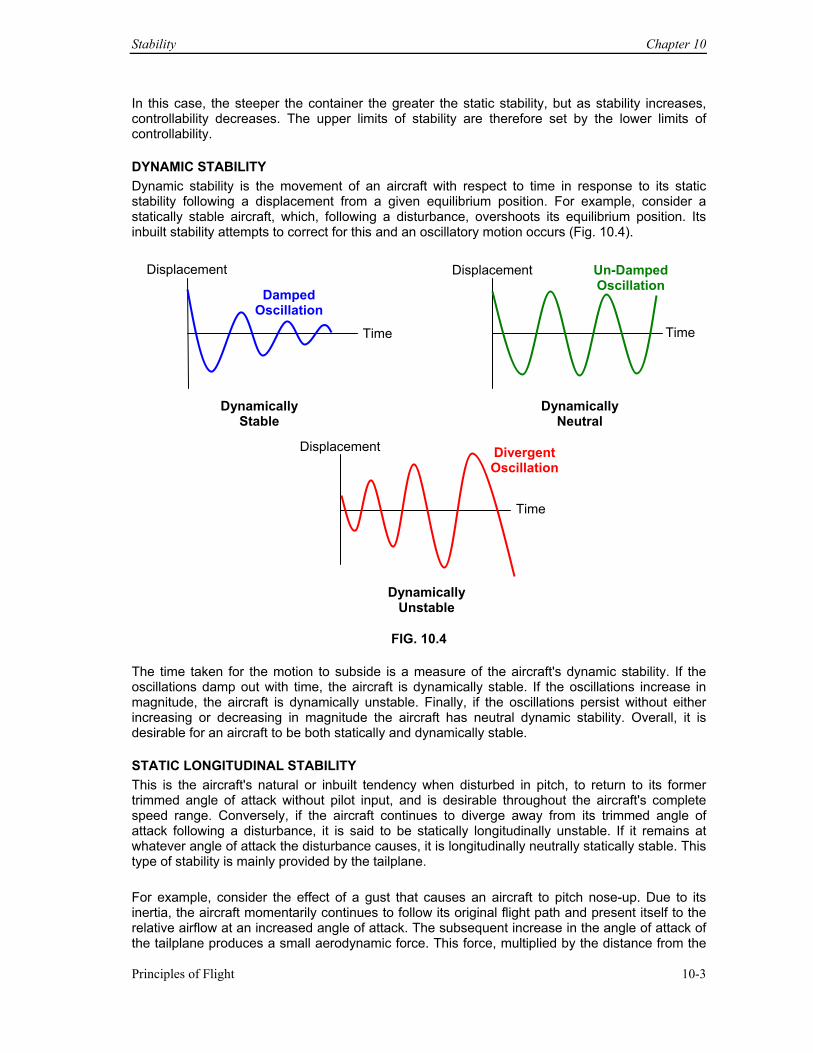
Stability Chapter 10
Principles of Flight 10-3
In this case, the steeper the container the greater the static stability, but as stability increases, controllability decreases. The upper limits of stability are therefore set by the lower limits of controllability. DYNAMIC STABILITY Dynamic stability is the movement of an aircraft with respect to time in response to its static stability following a displacement from a given equilibrium position. For example, consider a statically stable aircraft, which, following a disturbance, overshoots its equilibrium position. Its inbuilt stability attempts to correct for this and an oscillatory motion occurs (Fig. 10.4).
FIG. 10.4
The time taken for the motion to subside is a measure of the aircraft's dynamic stability. If the oscillations damp out with time, the aircraft is dynamically stable. If the oscillations increase in magnitude, the aircraft is dynamically unstable. Finally, if the oscillations persist without either increasing or decreasing in magnitude the aircraft has neutral dynamic stability. Overall, it is desirable for an aircraft to be both statically and dynamically stable. STATIC LONGITUDINAL STABILITY This is the aircraft's natural or inbuilt tendency when disturbed in pitch, to return to its former trimmed angle of attack without pilot input, and is desirable throughout the aircraft's complete speed range. Conversely, if the aircraft continues to diverge away from its trimmed angle of attack following a disturbance, it is said to be statically longitudinally unstable. If it remains at whatever angle of attack the disturbance causes, it is longitudinally neutrally statically stable. This type of stability is mainly provided by the tailplane. For example, consider the effect of a gust that causes an aircraft to pitch nose-up. Due to its inertia, the aircraft momentarily continues to follow its original flight path and present itself to the relative airflow at an increased angle of attack. The subsequent increase in the angle of attack of the tailplane produces a small aerodynamic force. This force, multiplied by the distance from the
Dynamically Stable
Dynamically Neutral
Dynamically Unstable
Displacement Displacement
Displacement
Time Time
Time
Damped Oscillation
Un-Damped Oscillation
Divergent Oscillation
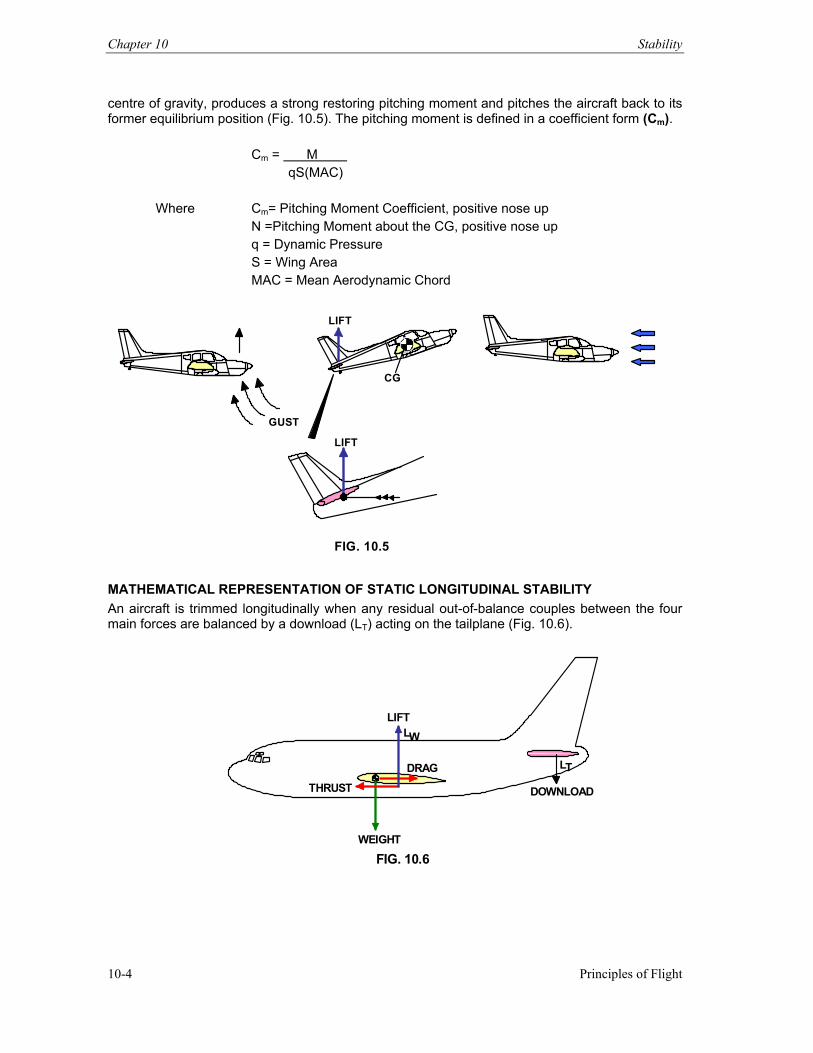
Chapter 10 Stability
Principles of Flight 10-4
centre of gravity, produces a strong restoring pitching moment and pitches the aircraft back to its former equilibrium position (Fig. 10.5). The pitching moment is defined in a coefficient form (Cm).
Cm = M qS(MAC)
Where Cm= Pitching Moment Coefficient, positive nose up N =Pitching Moment about the CG, positive nose up
q = Dynamic Pressure S = Wing Area MAC = Mean Aerodynamic Chord
GUST
CG
LIFT
LIFT
FIG. 10.5
MATHEMATICAL REPRESENTATION OF STATIC LONGITUDINAL STABILITY An aircraft is trimmed longitudinally when any residual out-of-balance couples between the four main forces are balanced by a download (LT) acting on the tailplane (Fig. 10.6).
LIFTLW
DRAG
THRUST
WEIGHT
DOWNLOAD LT
FIG. 10.6
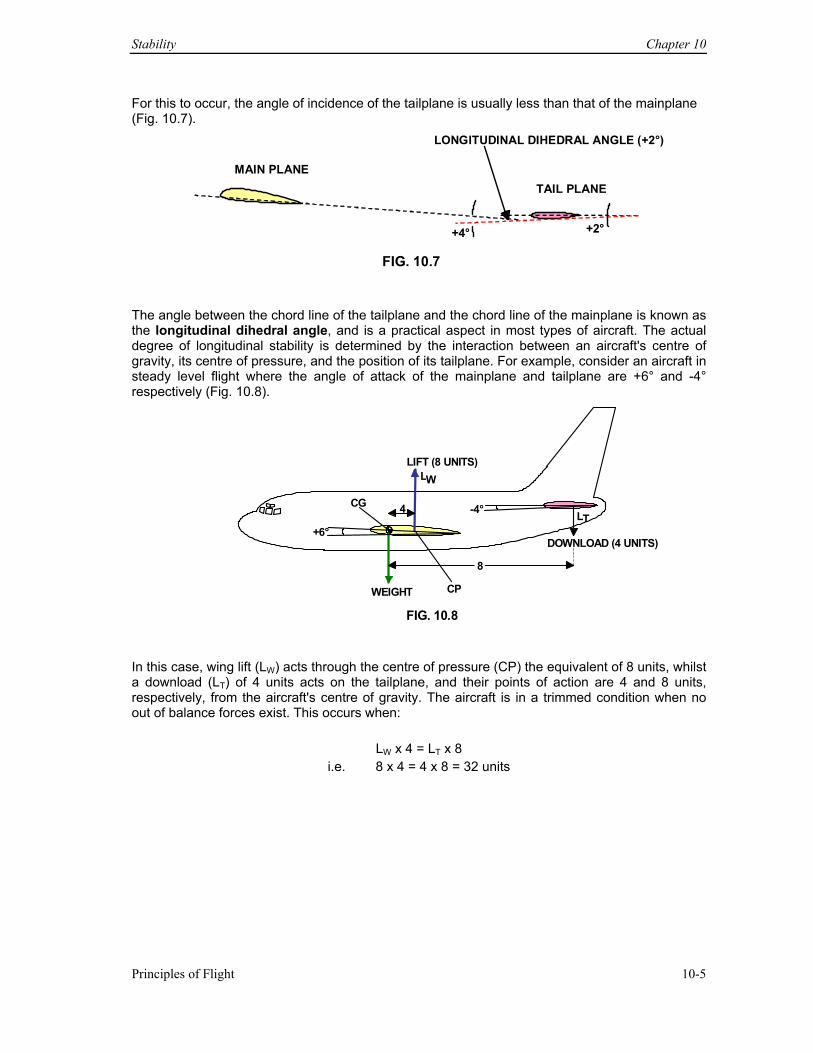
Stability Chapter 10
Principles of Flight 10-5
For this to occur, the angle of incidence of the tailplane is usually less than that of the mainplane (Fig. 10.7).
MAIN PLANE
TAIL PLANE
+4° +2°
LONGITUDINAL DIHEDRAL ANGLE (+2°)
FIG. 10.7
The angle between the chord line of the tailplane and the chord line of the mainplane is known as the longitudinal dihedral angle, and is a practical aspect in most types of aircraft. The actual degree of longitudinal stability is determined by the interaction between an aircraft's centre of gravity, its centre of pressure, and the position of its tailplane. For example, consider an aircraft in steady level flight where the angle of attack of the mainplane and tailplane are +6° and -4° respectively (Fig. 10.8).
LIFT (8 UNITS)
LW
WEIGHT
DOWNLOAD (4 UNITS)
L T 4
+6°
-4°CG
CP
8
FIG. 10.8
In this case, wing lift (LW) acts through the centre of pressure (CP) the equivalent of 8 units, whilst a download (LT) of 4 units acts on the tailplane, and their points of action are 4 and 8 units, respectively, from the aircraft's centre of gravity. The aircraft is in a trimmed condition when no out of balance forces exist. This occurs when:
LW x 4 = LT x 8 i.e. 8 x 4 = 4 x 8 = 32 units
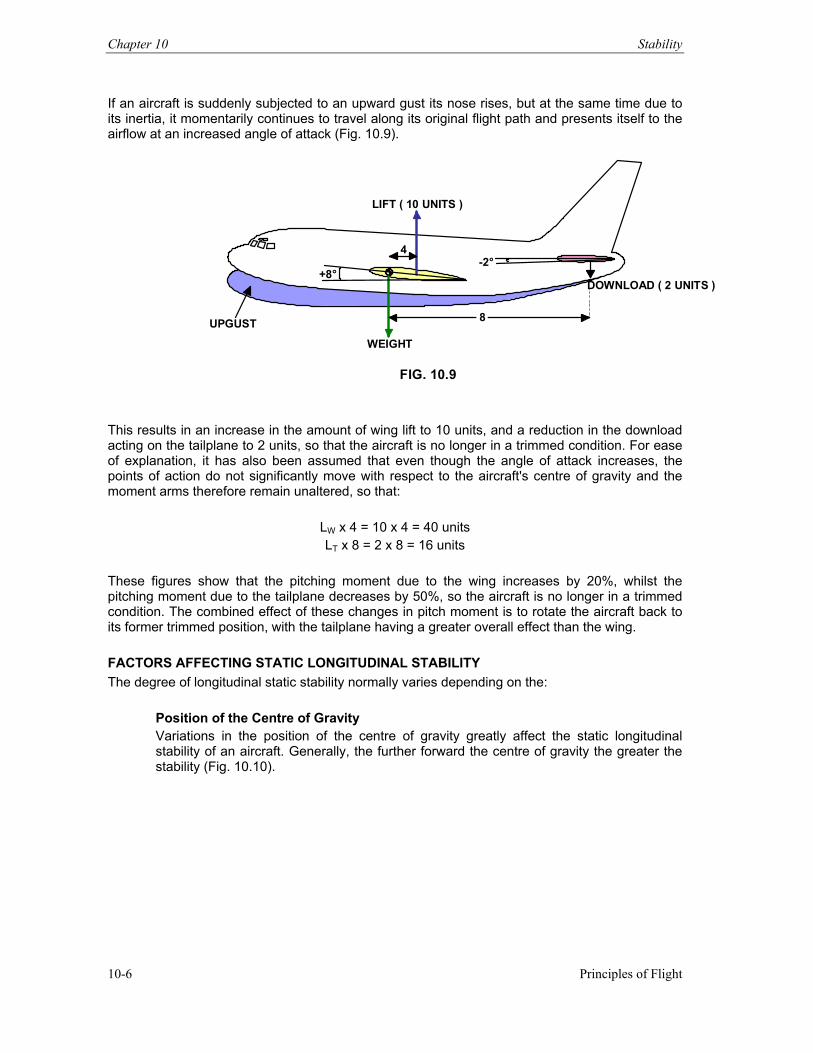
Chapter 10 Stability
Principles of Flight 10-6
If an aircraft is suddenly subjected to an upward gust its nose rises, but at the same time due to its inertia, it momentarily continues to travel along its original flight path and presents itself to the airflow at an increased angle of attack (Fig. 10.9).
4
+8°-2°
8UPGUST
LIFT ( 10 UNITS )
DOWNLOAD ( 2 UNITS )
WEIGHT
FIG. 10.9
This results in an increase in the amount of wing lift to 10 units, and a reduction in the download acting on the tailplane to 2 units, so that the aircraft is no longer in a trimmed condition. For ease of explanation, it has also been assumed that even though the angle of attack increases, the points of action do not significantly move with respect to the aircraft's centre of gravity and the moment arms therefore remain unaltered, so that:
LW x 4 = 10 x 4 = 40 units LT x 8 = 2 x 8 = 16 units
These figures show that the pitching moment due to the wing increases by 20%, whilst the pitching moment due to the tailplane decreases by 50%, so the aircraft is no longer in a trimmed condition. The combined effect of these changes in pitch moment is to rotate the aircraft back to its former trimmed position, with the tailplane having a greater overall effect than the wing. FACTORS AFFECTING STATIC LONGITUDINAL STABILITY The degree of longitudinal static stability normally varies depending on the:
Position of the Centre of Gravity Variations in the position of the centre of gravity greatly affect the static longitudinal stability of an aircraft. Generally, the further forward the centre of gravity the greater the stability (Fig. 10.10).
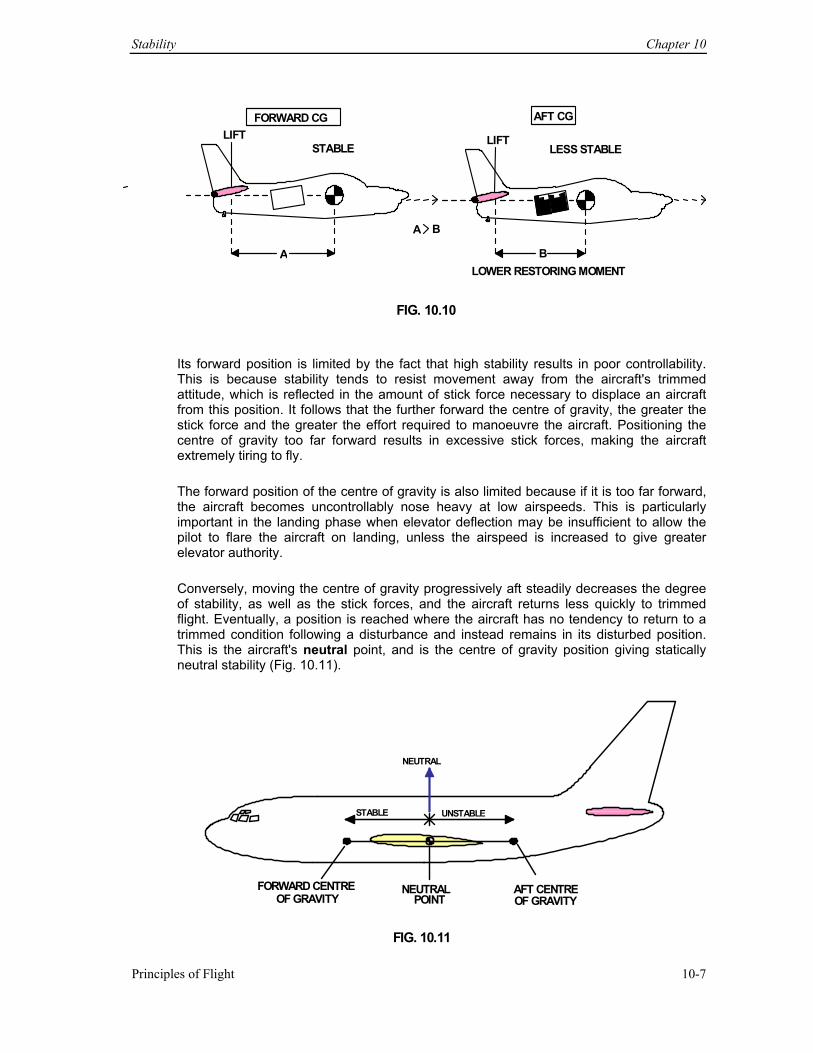
Stability Chapter 10
Principles of Flight 10-7
A
LIFT STABLE
FORWARD CG AFT CG LESS STABLE LIFT
BLOWER RESTORING MOMENT
A B
FIG. 10.10
Its forward position is limited by the fact that high stability results in poor controllability. This is because stability tends to resist movement away from the aircraft's trimmed attitude, which is reflected in the amount of stick force necessary to displace an aircraft from this position. It follows that the further forward the centre of gravity, the greater the stick force and the greater the effort required to manoeuvre the aircraft. Positioning the centre of gravity too far forward results in excessive stick forces, making the aircraft extremely tiring to fly. The forward position of the centre of gravity is also limited because if it is too far forward, the aircraft becomes uncontrollably nose heavy at low airspeeds. This is particularly important in the landing phase when elevator deflection may be insufficient to allow the pilot to flare the aircraft on landing, unless the airspeed is increased to give greater elevator authority. Conversely, moving the centre of gravity progressively aft steadily decreases the degree of stability, as well as the stick forces, and the aircraft returns less quickly to trimmed flight. Eventually, a position is reached where the aircraft has no tendency to return to a trimmed condition following a disturbance and instead remains in its disturbed position. This is the aircraft's neutral point, and is the centre of gravity position giving statically neutral stability (Fig. 10.11).
NEUTRAL
UNSTABLESTABLE
AFT CENTRE OF GRAVITY NEUTRAL
POINTFORWARD CENTRE
OF GRAVITY
FIG. 10.11
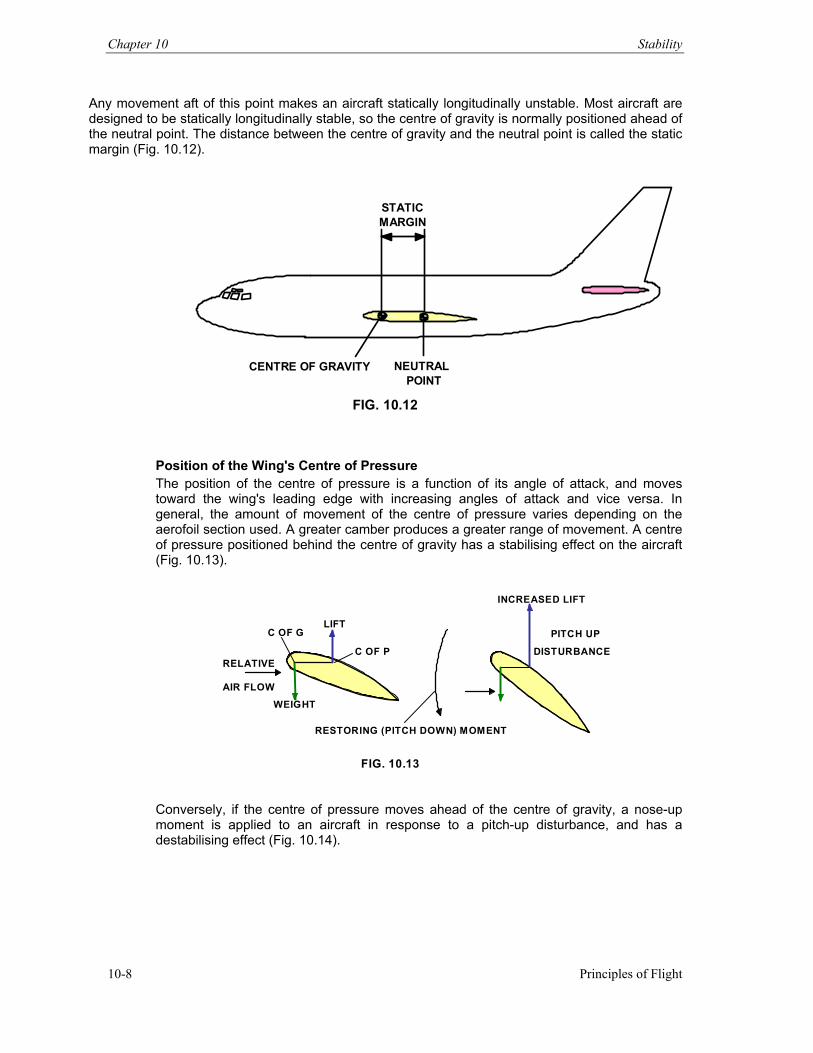
Chapter 10 Stability
Principles of Flight 10-8
Any movement aft of this point makes an aircraft statically longitudinally unstable. Most aircraft are designed to be statically longitudinally stable, so the centre of gravity is normally positioned ahead of the neutral point. The distance between the centre of gravity and the neutral point is called the static margin (Fig. 10.12).
NEUTRALPOINT
CENTRE OF GRAVITY
STATICMARGIN
FIG. 10.12
Position of the Wing's Centre of Pressure The position of the centre of pressure is a function of its angle of attack, and moves toward the wing's leading edge with increasing angles of attack and vice versa. In general, the amount of movement of the centre of pressure varies depending on the aerofoil section used. A greater camber produces a greater range of movement. A centre of pressure positioned behind the centre of gravity has a stabilising effect on the aircraft (Fig. 10.13).
LIFTC OF G
C OF P
WEIGHT
RELATIVE AIR FLOW
INCREASED LIFT
PITCH UP DISTURBANCE
RESTORING (PITCH DOWN) MOMENT
FIG. 10.13
Conversely, if the centre of pressure moves ahead of the centre of gravity, a nose-up moment is applied to an aircraft in response to a pitch-up disturbance, and has a destabilising effect (Fig. 10.14).
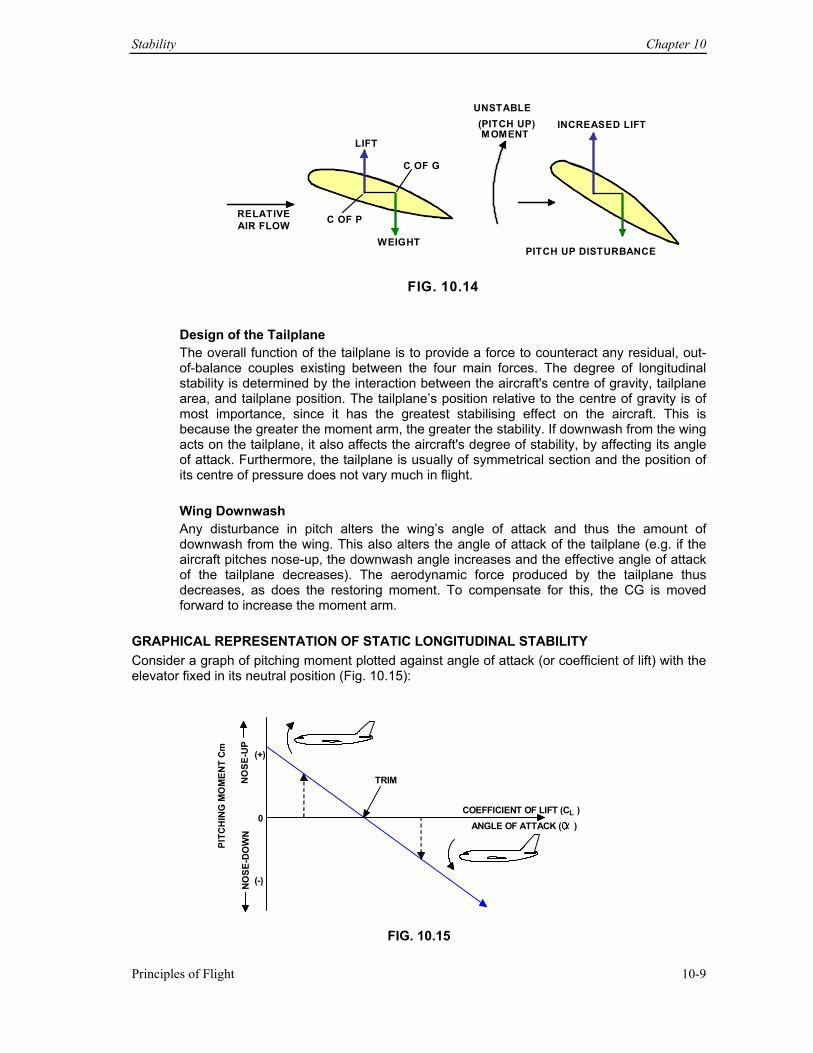
Stability Chapter 10
Principles of Flight 10-9
LIFT
C OF G
C OF P
WEIGHT
RELATIVE AIR FLOW
UNSTABLE(PITCH UP)M OMENT
INCREASED LIFT
PITCH UP DISTURBANCE
FIG. 10.14
Design of the Tailplane The overall function of the tailplane is to provide a force to counteract any residual, out-of-balance couples existing between the four main forces. The degree of longitudinal stability is determined by the interaction between the aircraft's centre of gravity, tailplane area, and tailplane position. The tailplane’s position relative to the centre of gravity is of most importance, since it has the greatest stabilising effect on the aircraft. This is because the greater the moment arm, the greater the stability. If downwash from the wing acts on the tailplane, it also affects the aircraft's degree of stability, by affecting its angle of attack. Furthermore, the tailplane is usually of symmetrical section and the position of its centre of pressure does not vary much in flight.
Wing Downwash Any disturbance in pitch alters the wing’s angle of attack and thus the amount of downwash from the wing. This also alters the angle of attack of the tailplane (e.g. if the aircraft pitches nose-up, the downwash angle increases and the effective angle of attack of the tailplane decreases). The aerodynamic force produced by the tailplane thus decreases, as does the restoring moment. To compensate for this, the CG is moved forward to increase the moment arm.
GRAPHICAL REPRESENTATION OF STATIC LONGITUDINAL STABILITY Consider a graph of pitching moment plotted against angle of attack (or coefficient of lift) with the elevator fixed in its neutral position (Fig. 10.15):
TRIM
PITC
HIN
G M
OM
ENT
Cm
(+)
0
(-)
COEFFICIENT OF LIFT (C ) L ANGLE OF ATTACK ( )
NO
SE-U
P
N
OSE
-DO
WN
FIG. 10.15
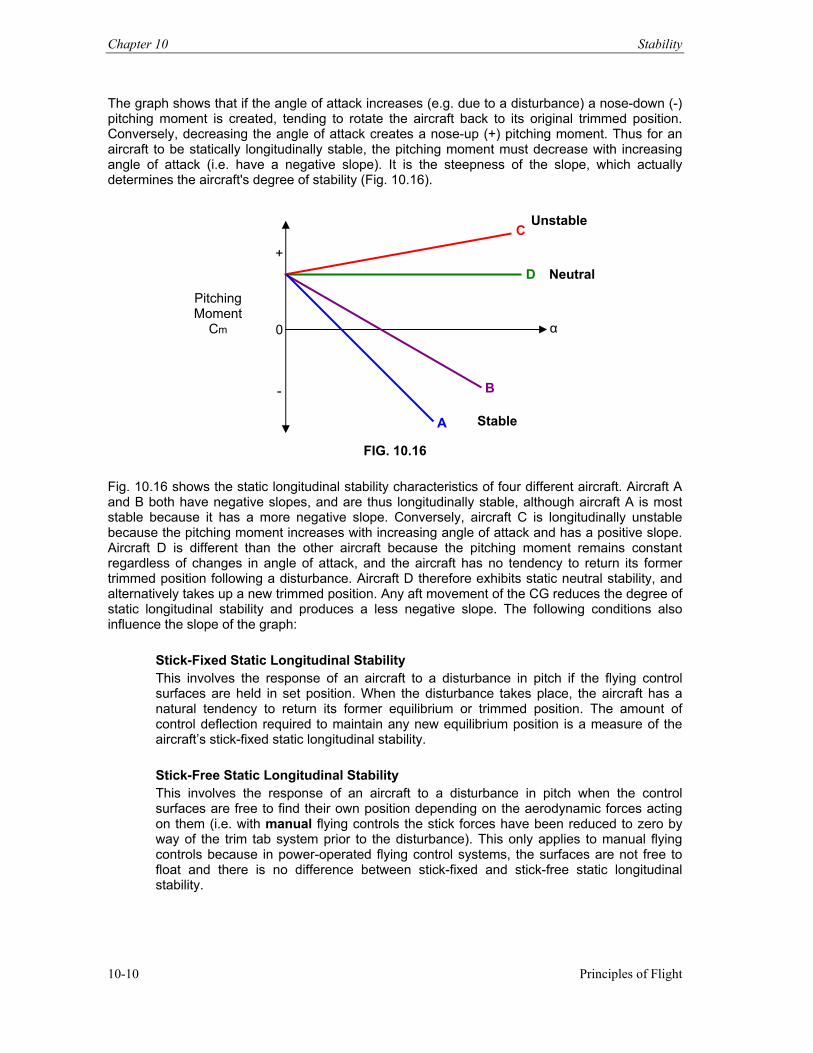
Chapter 10 Stability
Principles of Flight 10-10
The graph shows that if the angle of attack increases (e.g. due to a disturbance) a nose-down (-) pitching moment is created, tending to rotate the aircraft back to its original trimmed position. Conversely, decreasing the angle of attack creates a nose-up (+) pitching moment. Thus for an aircraft to be statically longitudinally stable, the pitching moment must decrease with increasing angle of attack (i.e. have a negative slope). It is the steepness of the slope, which actually determines the aircraft's degree of stability (Fig. 10.16).
FIG. 10.16
Fig. 10.16 shows the static longitudinal stability characteristics of four different aircraft. Aircraft A and B both have negative slopes, and are thus longitudinally stable, although aircraft A is most stable because it has a more negative slope. Conversely, aircraft C is longitudinally unstable because the pitching moment increases with increasing angle of attack and has a positive slope. Aircraft D is different than the other aircraft because the pitching moment remains constant regardless of changes in angle of attack, and the aircraft has no tendency to return its former trimmed position following a disturbance. Aircraft D therefore exhibits static neutral stability, and alternatively takes up a new trimmed position. Any aft movement of the CG reduces the degree of static longitudinal stability and produces a less negative slope. The following conditions also influence the slope of the graph:
Stick-Fixed Static Longitudinal Stability This involves the response of an aircraft to a disturbance in pitch if the flying control surfaces are held in set position. When the disturbance takes place, the aircraft has a natural tendency to return its former equilibrium or trimmed position. The amount of control deflection required to maintain any new equilibrium position is a measure of the aircraft’s stick-fixed static longitudinal stability.
Stick-Free Static Longitudinal Stability This involves the response of an aircraft to a disturbance in pitch when the control surfaces are free to find their own position depending on the aerodynamic forces acting on them (i.e. with manual flying controls the stick forces have been reduced to zero by way of the trim tab system prior to the disturbance). This only applies to manual flying controls because in power-operated flying control systems, the surfaces are not free to float and there is no difference between stick-fixed and stick-free static longitudinal stability.
Pitching Moment
Cm
+ 0 -
α
A
B
D
C
Stable
Neutral
Unstable
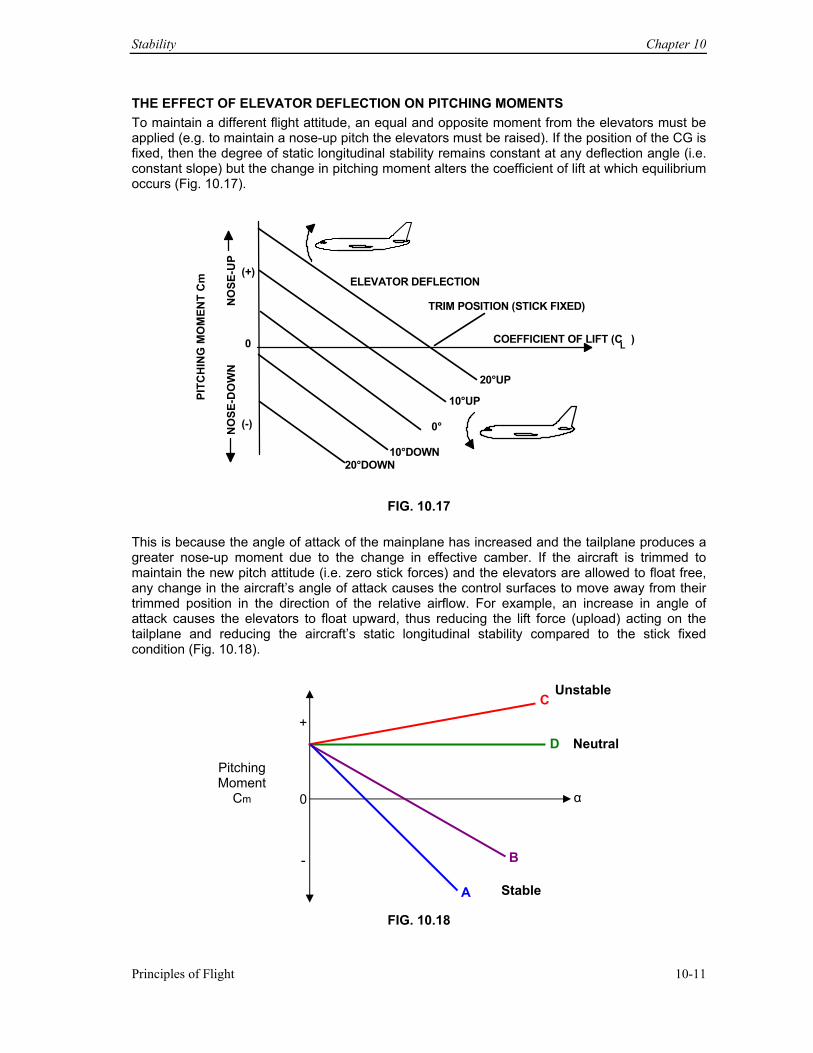
Stability Chapter 10
Principles of Flight 10-11
THE EFFECT OF ELEVATOR DEFLECTION ON PITCHING MOMENTS To maintain a different flight attitude, an equal and opposite moment from the elevators must be applied (e.g. to maintain a nose-up pitch the elevators must be raised). If the position of the CG is fixed, then the degree of static longitudinal stability remains constant at any deflection angle (i.e. constant slope) but the change in pitching moment alters the coefficient of lift at which equilibrium occurs (Fig. 10.17).
TRIM POSITION (STICK FIXED)
10°UP 0° 10°DOWN 20°DOWN
20°UP
PITC
HIN
G M
OM
ENT
Cm (+)
0
(-)
COEFFICIENT OF LIFT (C ) L
ELEVATOR DEFLECTION
NO
SE-U
P
NO
SE-D
OW
N
FIG. 10.17
This is because the angle of attack of the mainplane has increased and the tailplane produces a greater nose-up moment due to the change in effective camber. If the aircraft is trimmed to maintain the new pitch attitude (i.e. zero stick forces) and the elevators are allowed to float free, any change in the aircraft’s angle of attack causes the control surfaces to move away from their trimmed position in the direction of the relative airflow. For example, an increase in angle of attack causes the elevators to float upward, thus reducing the lift force (upload) acting on the tailplane and reducing the aircraft’s static longitudinal stability compared to the stick fixed condition (Fig. 10.18).
FIG. 10.18
Pitching Moment
Cm
+ 0 -
α
A
B
D
C
Stable
Neutral
Unstable
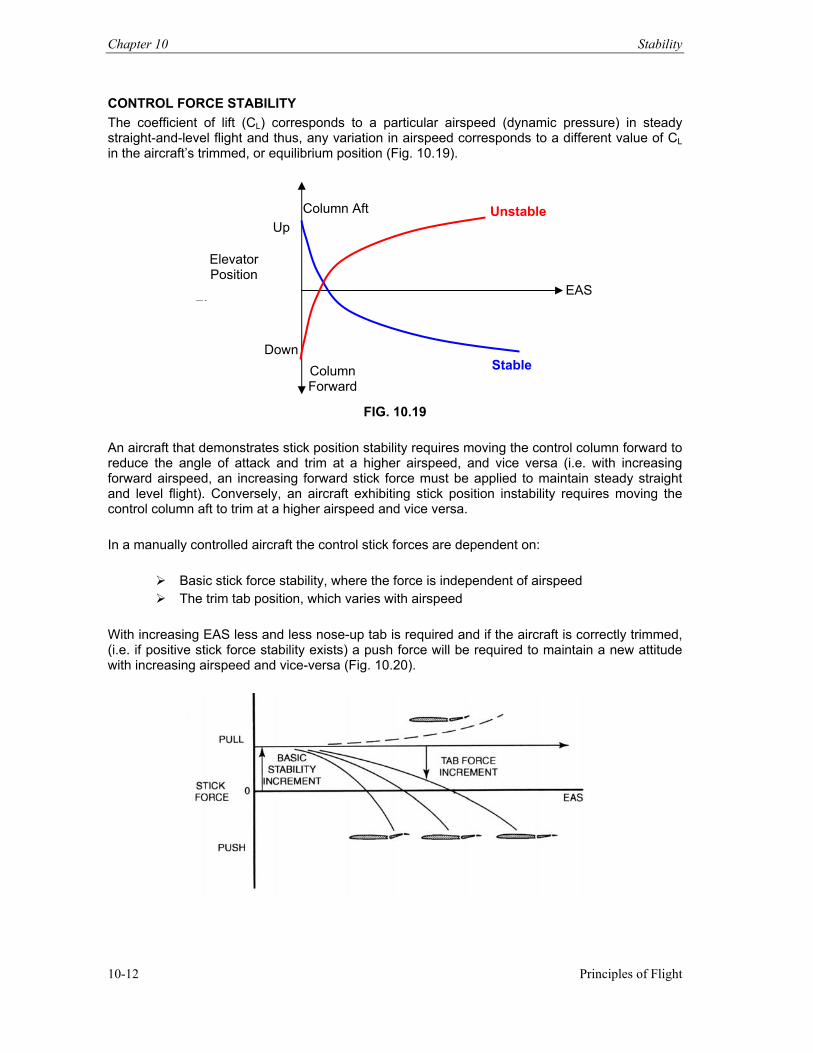
Chapter 10 Stability
Principles of Flight 10-12
CONTROL FORCE STABILITY The coefficient of lift (CL) corresponds to a particular airspeed (dynamic pressure) in steady straight-and-level flight and thus, any variation in airspeed corresponds to a different value of CL in the aircraft’s trimmed, or equilibrium position (Fig. 10.19).
FIG. 10.19
An aircraft that demonstrates stick position stability requires moving the control column forward to reduce the angle of attack and trim at a higher airspeed, and vice versa (i.e. with increasing forward airspeed, an increasing forward stick force must be applied to maintain steady straight and level flight). Conversely, an aircraft exhibiting stick position instability requires moving the control column aft to trim at a higher airspeed and vice versa. In a manually controlled aircraft the control stick forces are dependent on:
Basic stick force stability, where the force is independent of airspeed The trim tab position, which varies with airspeed
With increasing EAS less and less nose-up tab is required and if the aircraft is correctly trimmed, (i.e. if positive stick force stability exists) a push force will be required to maintain a new attitude with increasing airspeed and vice-versa (Fig. 10.20).
Elevator Position
El t
Up
Down
EAS
Stable
Unstable
Column Forward
Column Aft
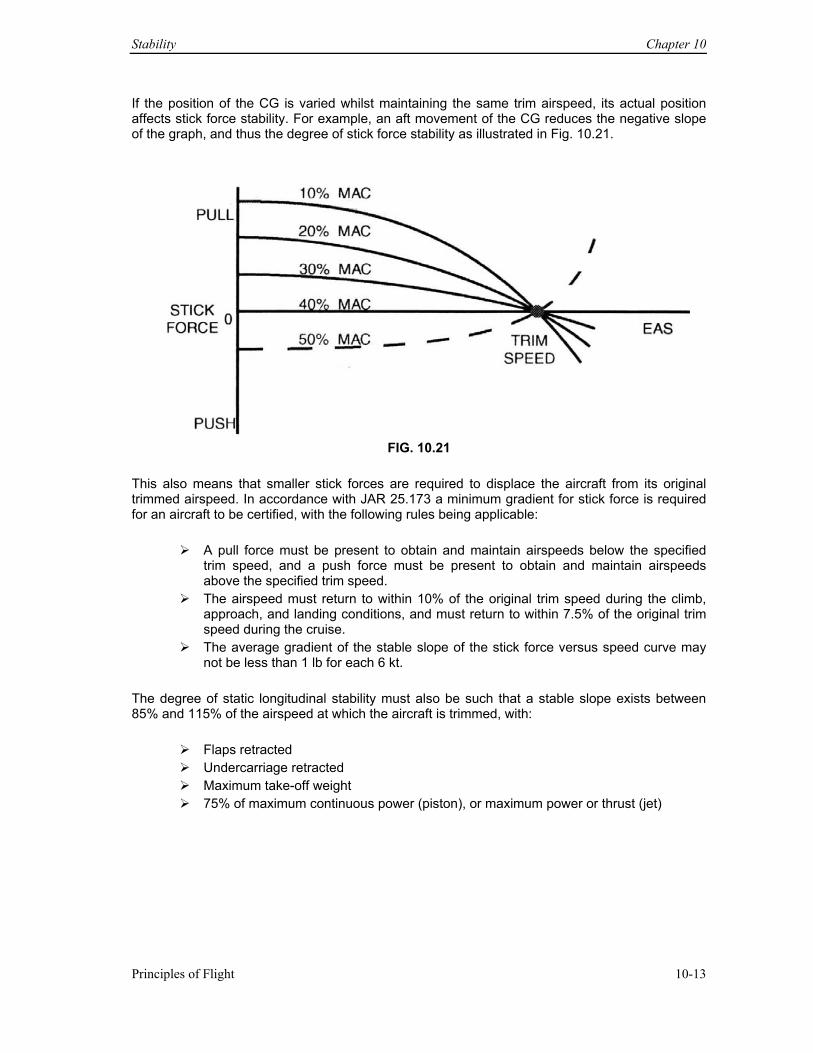
Stability Chapter 10
Principles of Flight 10-13
If the position of the CG is varied whilst maintaining the same trim airspeed, its actual position affects stick force stability. For example, an aft movement of the CG reduces the negative slope of the graph, and thus the degree of stick force stability as illustrated in Fig. 10.21.
FIG. 10.21
This also means that smaller stick forces are required to displace the aircraft from its original trimmed airspeed. In accordance with JAR 25.173 a minimum gradient for stick force is required for an aircraft to be certified, with the following rules being applicable:
A pull force must be present to obtain and maintain airspeeds below the specified trim speed, and a push force must be present to obtain and maintain airspeeds above the specified trim speed.
The airspeed must return to within 10% of the original trim speed during the climb, approach, and landing conditions, and must return to within 7.5% of the original trim speed during the cruise.
The average gradient of the stable slope of the stick force versus speed curve may not be less than 1 lb for each 6 kt.
The degree of static longitudinal stability must also be such that a stable slope exists between 85% and 115% of the airspeed at which the aircraft is trimmed, with:
Flaps retracted Undercarriage retracted Maximum take-off weight 75% of maximum continuous power (piston), or maximum power or thrust (jet)
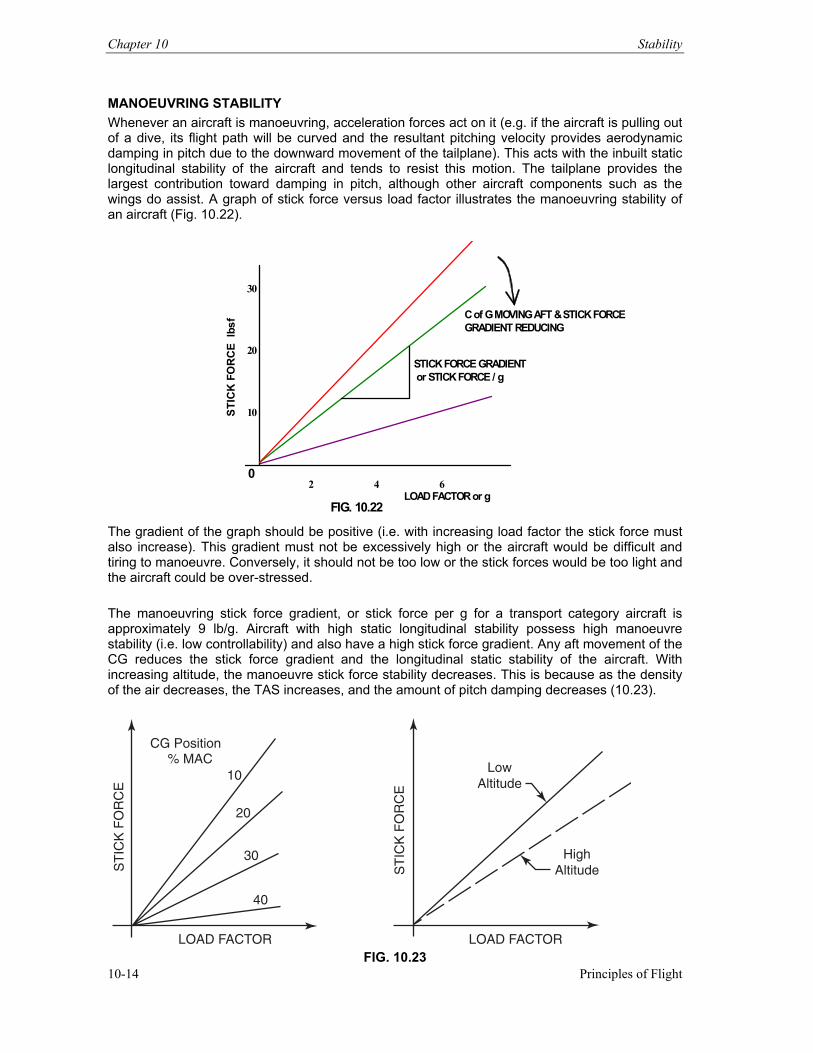
Chapter 10 Stability
Principles of Flight 10-14
MANOEUVRING STABILITY Whenever an aircraft is manoeuvring, acceleration forces act on it (e.g. if the aircraft is pulling out of a dive, its flight path will be curved and the resultant pitching velocity provides aerodynamic damping in pitch due to the downward movement of the tailplane). This acts with the inbuilt static longitudinal stability of the aircraft and tends to resist this motion. The tailplane provides the largest contribution toward damping in pitch, although other aircraft components such as the wings do assist. A graph of stick force versus load factor illustrates the manoeuvring stability of an aircraft (Fig. 10.22). 30 20 10 2 4 6
STICK FORCE GRADIENT or STICK FORCE / g
C of G MOVING AFT & STICK FORCE GRADIENT REDUCING
0
ST
ICK
FO
RC
E lb
sf
LOAD FACTOR or g FIG. 10.22
The gradient of the graph should be positive (i.e. with increasing load factor the stick force must also increase). This gradient must not be excessively high or the aircraft would be difficult and tiring to manoeuvre. Conversely, it should not be too low or the stick forces would be too light and the aircraft could be over-stressed. The manoeuvring stick force gradient, or stick force per g for a transport category aircraft is approximately 9 lb/g. Aircraft with high static longitudinal stability possess high manoeuvre stability (i.e. low controllability) and also have a high stick force gradient. Any aft movement of the CG reduces the stick force gradient and the longitudinal static stability of the aircraft. With increasing altitude, the manoeuvre stick force stability decreases. This is because as the density of the air decreases, the TAS increases, and the amount of pitch damping decreases (10.23).
LOAD FACTOR
CG Position% MAC
ST
ICK
FO
RC
E
10
20
30
40
LOAD FACTOR
ST
ICK
FO
RC
E
LowAltitude
HighAltitude
FIG. 10.23
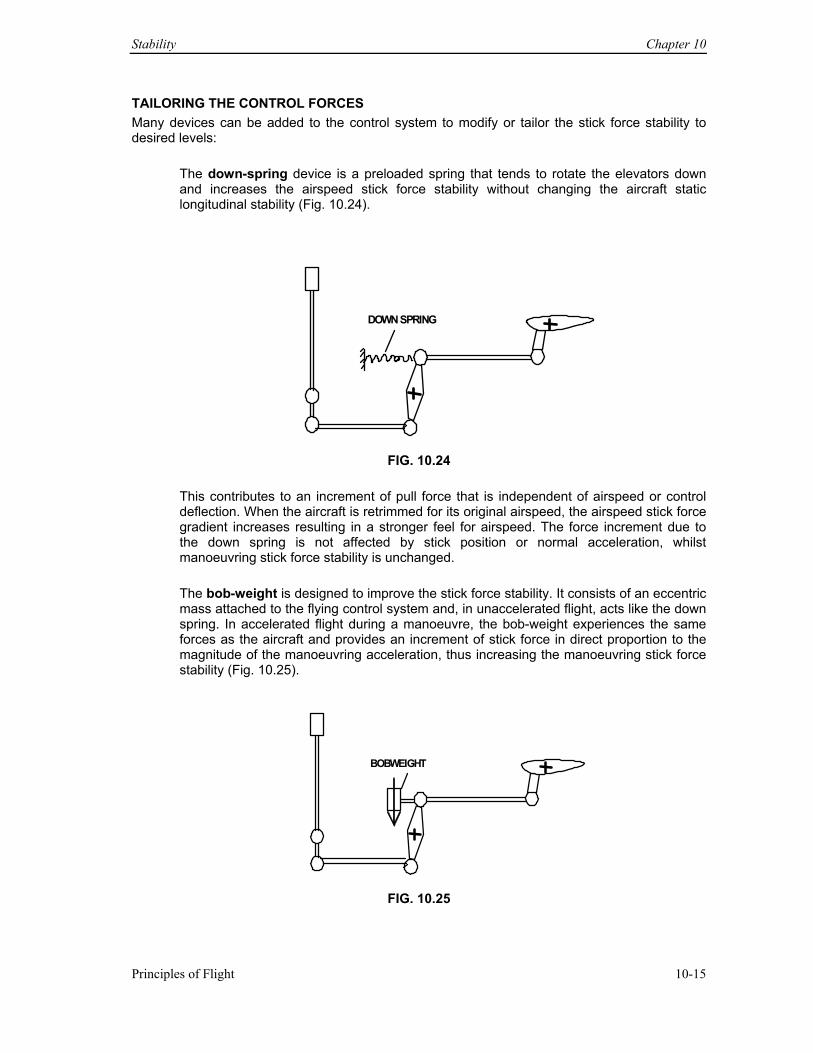
Stability Chapter 10
Principles of Flight 10-15
TAILORING THE CONTROL FORCES Many devices can be added to the control system to modify or tailor the stick force stability to desired levels:
The down-spring device is a preloaded spring that tends to rotate the elevators down and increases the airspeed stick force stability without changing the aircraft static longitudinal stability (Fig. 10.24).
DOWN SPRING
FIG. 10.24
This contributes to an increment of pull force that is independent of airspeed or control deflection. When the aircraft is retrimmed for its original airspeed, the airspeed stick force gradient increases resulting in a stronger feel for airspeed. The force increment due to the down spring is not affected by stick position or normal acceleration, whilst manoeuvring stick force stability is unchanged.
The bob-weight is designed to improve the stick force stability. It consists of an eccentric mass attached to the flying control system and, in unaccelerated flight, acts like the down spring. In accelerated flight during a manoeuvre, the bob-weight experiences the same forces as the aircraft and provides an increment of stick force in direct proportion to the magnitude of the manoeuvring acceleration, thus increasing the manoeuvring stick force stability (Fig. 10.25).
BOBWEIGHT
FIG. 10.25
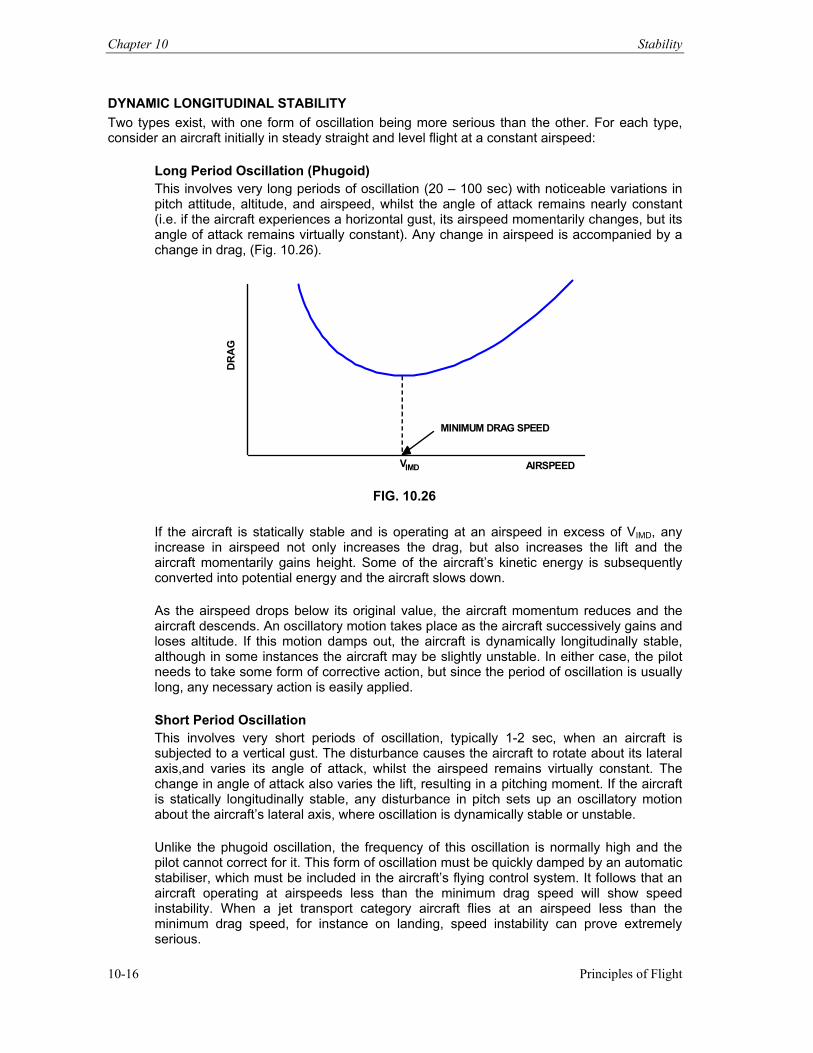
Chapter 10 Stability
Principles of Flight 10-16
DYNAMIC LONGITUDINAL STABILITY Two types exist, with one form of oscillation being more serious than the other. For each type, consider an aircraft initially in steady straight and level flight at a constant airspeed:
Long Period Oscillation (Phugoid) This involves very long periods of oscillation (20 – 100 sec) with noticeable variations in pitch attitude, altitude, and airspeed, whilst the angle of attack remains nearly constant (i.e. if the aircraft experiences a horizontal gust, its airspeed momentarily changes, but its angle of attack remains virtually constant). Any change in airspeed is accompanied by a change in drag, (Fig. 10.26).
D
RA
G
MINIMUM DRAG SPEED
AIRSPEED VIMD
FIG. 10.26
If the aircraft is statically stable and is operating at an airspeed in excess of VIMD, any increase in airspeed not only increases the drag, but also increases the lift and the aircraft momentarily gains height. Some of the aircraft’s kinetic energy is subsequently converted into potential energy and the aircraft slows down. As the airspeed drops below its original value, the aircraft momentum reduces and the aircraft descends. An oscillatory motion takes place as the aircraft successively gains and loses altitude. If this motion damps out, the aircraft is dynamically longitudinally stable, although in some instances the aircraft may be slightly unstable. In either case, the pilot needs to take some form of corrective action, but since the period of oscillation is usually long, any necessary action is easily applied. Short Period Oscillation This involves very short periods of oscillation, typically 1-2 sec, when an aircraft is subjected to a vertical gust. The disturbance causes the aircraft to rotate about its lateral axis,and varies its angle of attack, whilst the airspeed remains virtually constant. The change in angle of attack also varies the lift, resulting in a pitching moment. If the aircraft is statically longitudinally stable, any disturbance in pitch sets up an oscillatory motion about the aircraft’s lateral axis, where oscillation is dynamically stable or unstable. Unlike the phugoid oscillation, the frequency of this oscillation is normally high and the pilot cannot correct for it. This form of oscillation must be quickly damped by an automatic stabiliser, which must be included in the aircraft’s flying control system. It follows that an aircraft operating at airspeeds less than the minimum drag speed will show speed instability. When a jet transport category aircraft flies at an airspeed less than the minimum drag speed, for instance on landing, speed instability can prove extremely serious.
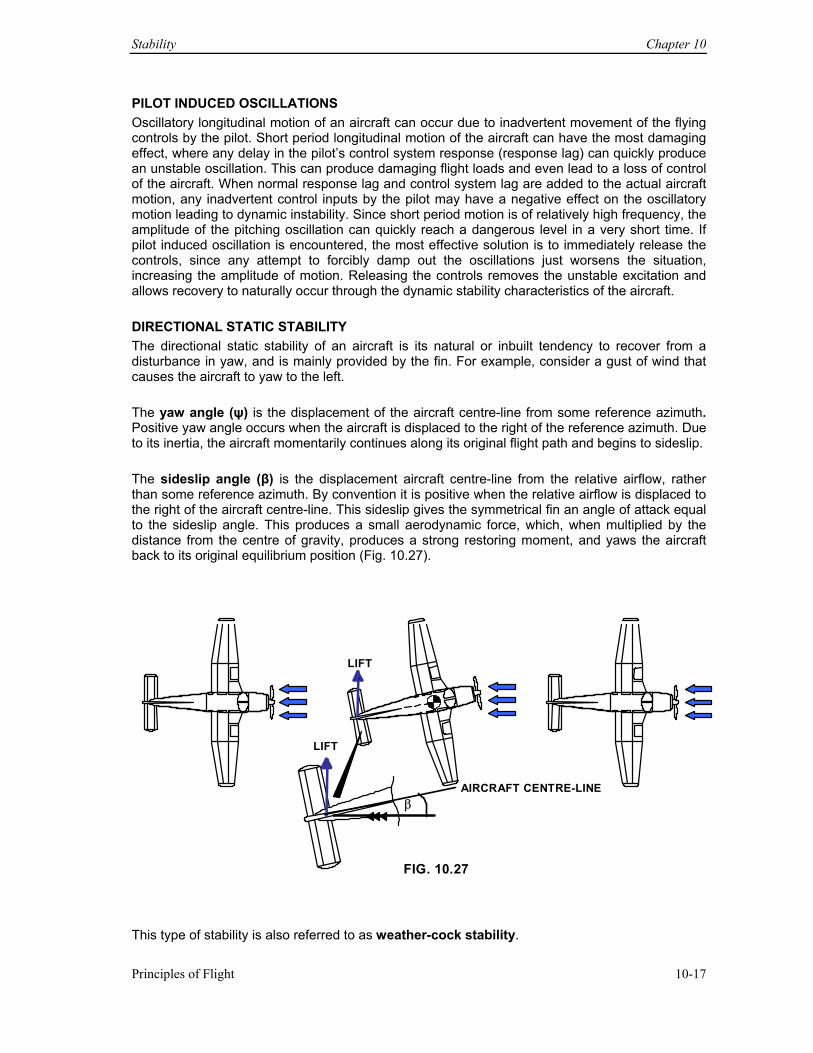
Stability Chapter 10
Principles of Flight 10-17
PILOT INDUCED OSCILLATIONS Oscillatory longitudinal motion of an aircraft can occur due to inadvertent movement of the flying controls by the pilot. Short period longitudinal motion of the aircraft can have the most damaging effect, where any delay in the pilot’s control system response (response lag) can quickly produce an unstable oscillation. This can produce damaging flight loads and even lead to a loss of control of the aircraft. When normal response lag and control system lag are added to the actual aircraft motion, any inadvertent control inputs by the pilot may have a negative effect on the oscillatory motion leading to dynamic instability. Since short period motion is of relatively high frequency, the amplitude of the pitching oscillation can quickly reach a dangerous level in a very short time. If pilot induced oscillation is encountered, the most effective solution is to immediately release the controls, since any attempt to forcibly damp out the oscillations just worsens the situation, increasing the amplitude of motion. Releasing the controls removes the unstable excitation and allows recovery to naturally occur through the dynamic stability characteristics of the aircraft. DIRECTIONAL STATIC STABILITY The directional static stability of an aircraft is its natural or inbuilt tendency to recover from a disturbance in yaw, and is mainly provided by the fin. For example, consider a gust of wind that causes the aircraft to yaw to the left. The yaw angle (ψ) is the displacement of the aircraft centre-line from some reference azimuth. Positive yaw angle occurs when the aircraft is displaced to the right of the reference azimuth. Due to its inertia, the aircraft momentarily continues along its original flight path and begins to sideslip. The sideslip angle (β) is the displacement aircraft centre-line from the relative airflow, rather than some reference azimuth. By convention it is positive when the relative airflow is displaced to the right of the aircraft centre-line. This sideslip gives the symmetrical fin an angle of attack equal to the sideslip angle. This produces a small aerodynamic force, which, when multiplied by the distance from the centre of gravity, produces a strong restoring moment, and yaws the aircraft back to its original equilibrium position (Fig. 10.27).
AIRCRAFT CENTRE-LINE β
LIFT
FIG. 10.27
LIFT
This type of stability is also referred to as weather-cock stability.
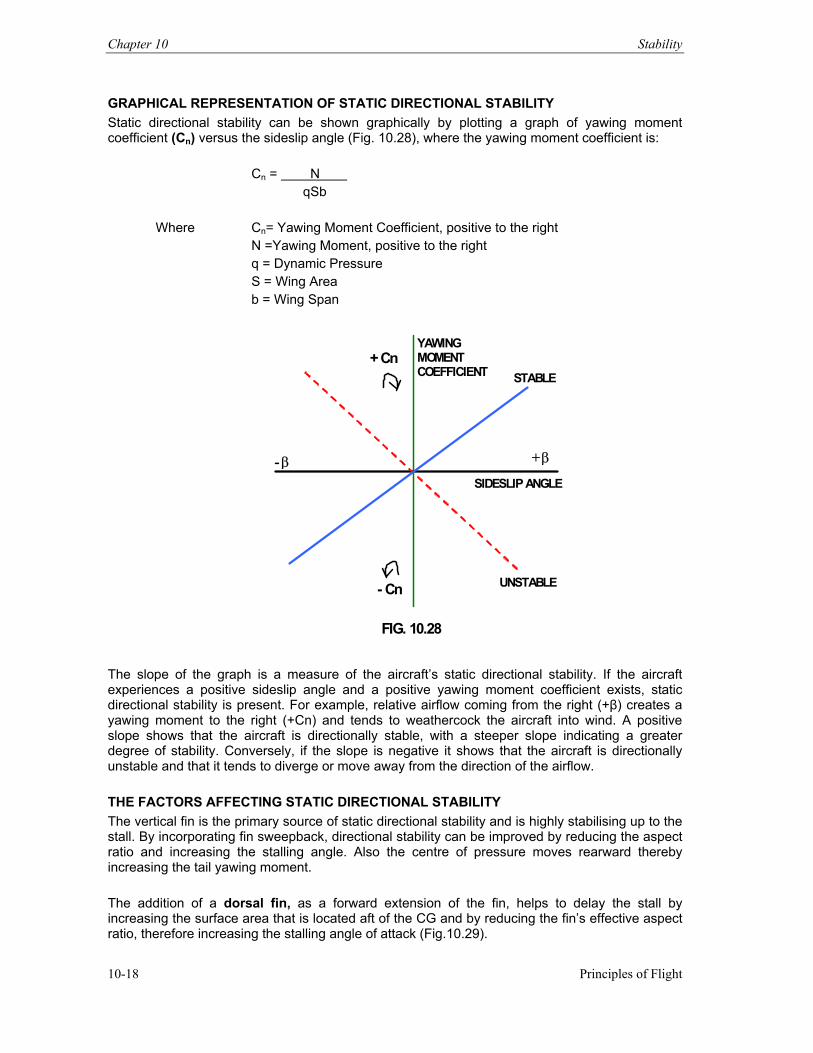
Chapter 10 Stability
Principles of Flight 10-18
GRAPHICAL REPRESENTATION OF STATIC DIRECTIONAL STABILITY Static directional stability can be shown graphically by plotting a graph of yawing moment coefficient (Cn) versus the sideslip angle (Fig. 10.28), where the yawing moment coefficient is: Cn = N qSb
Where Cn= Yawing Moment Coefficient, positive to the right N =Yawing Moment, positive to the right
q = Dynamic Pressure S = Wing Area b = Wing Span
STABLE
- β + β
UNSTABLE
YAWING MOMENT COEFFICIENT
- Cn
SIDESLIP ANGLE
+ Cn
FIG. 10.28
The slope of the graph is a measure of the aircraft’s static directional stability. If the aircraft experiences a positive sideslip angle and a positive yawing moment coefficient exists, static directional stability is present. For example, relative airflow coming from the right (+β) creates a yawing moment to the right (+Cn) and tends to weathercock the aircraft into wind. A positive slope shows that the aircraft is directionally stable, with a steeper slope indicating a greater degree of stability. Conversely, if the slope is negative it shows that the aircraft is directionally unstable and that it tends to diverge or move away from the direction of the airflow. THE FACTORS AFFECTING STATIC DIRECTIONAL STABILITY The vertical fin is the primary source of static directional stability and is highly stabilising up to the stall. By incorporating fin sweepback, directional stability can be improved by reducing the aspect ratio and increasing the stalling angle. Also the centre of pressure moves rearward thereby increasing the tail yawing moment. The addition of a dorsal fin, as a forward extension of the fin, helps to delay the stall by increasing the surface area that is located aft of the CG and by reducing the fin’s effective aspect ratio, therefore increasing the stalling angle of attack (Fig.10.29).
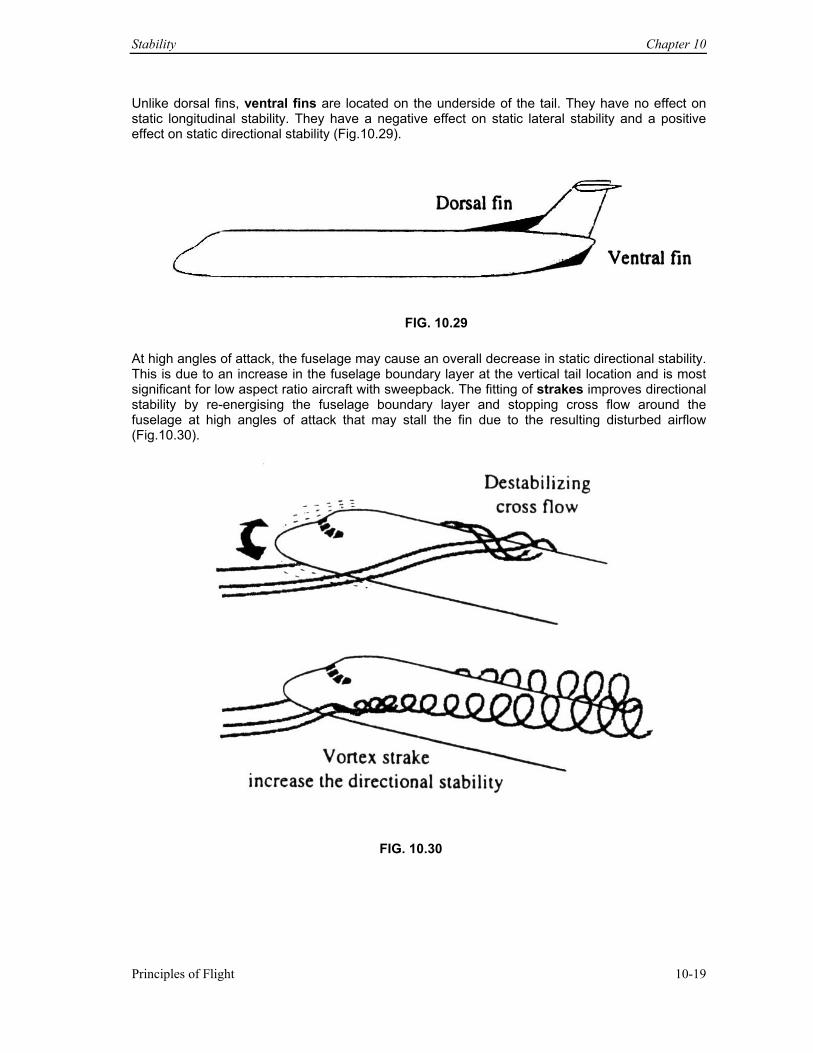
Stability Chapter 10
Principles of Flight 10-19
Unlike dorsal fins, ventral fins are located on the underside of the tail. They have no effect on static longitudinal stability. They have a negative effect on static lateral stability and a positive effect on static directional stability (Fig.10.29).
At high angles of attack, the fuselage may cause an overall decrease in static directional stability. This is due to an increase in the fuselage boundary layer at the vertical tail location and is most significant for low aspect ratio aircraft with sweepback. The fitting of strakes improves directional stability by re-energising the fuselage boundary layer and stopping cross flow around the fuselage at high angles of attack that may stall the fin due to the resulting disturbed airflow (Fig.10.30).
FIG. 10.29
FIG. 10.30
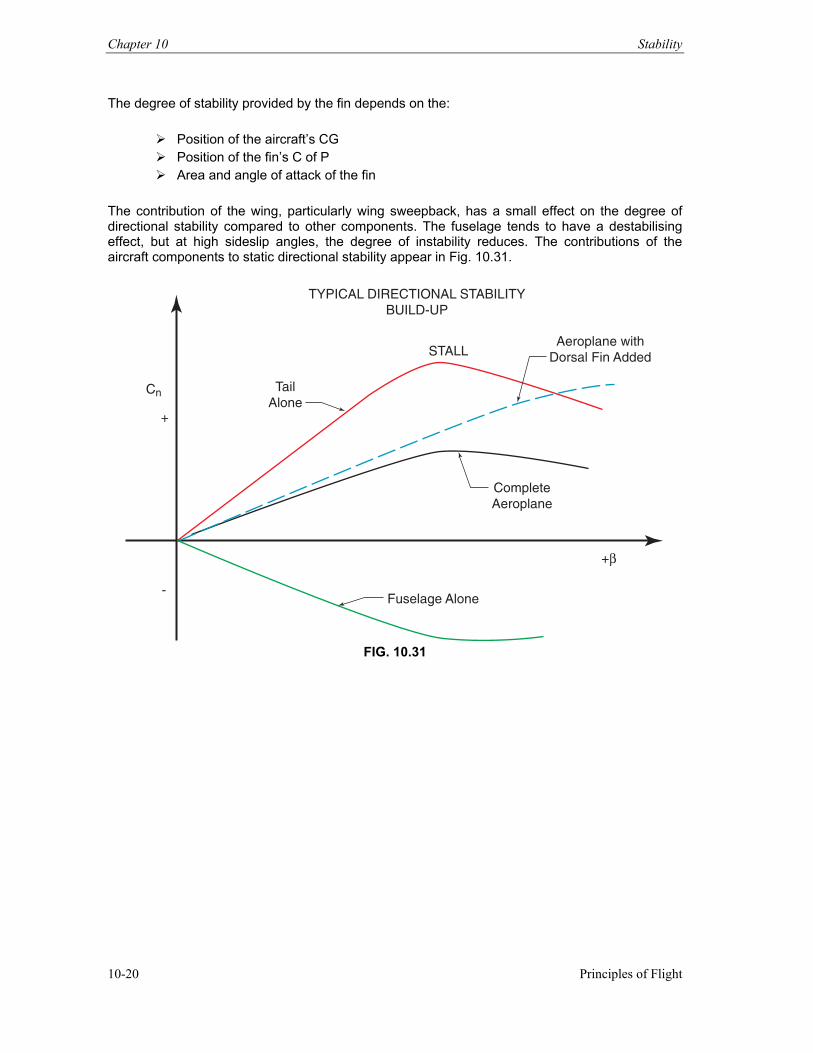
Chapter 10 Stability
Principles of Flight 10-20
The degree of stability provided by the fin depends on the:
Position of the aircraft’s CG Position of the fin’s C of P Area and angle of attack of the fin
The contribution of the wing, particularly wing sweepback, has a small effect on the degree of directional stability compared to other components. The fuselage tends to have a destabilising effect, but at high sideslip angles, the degree of instability reduces. The contributions of the aircraft components to static directional stability appear in Fig. 10.31.
Cn
+
-
TailAlone
STALL
Fuselage Alone
CompleteAeroplane
Aeroplane withDorsal Fin Added
+β
TYPICAL DIRECTIONAL STABILITYBUILD-UP
FIG. 10.31
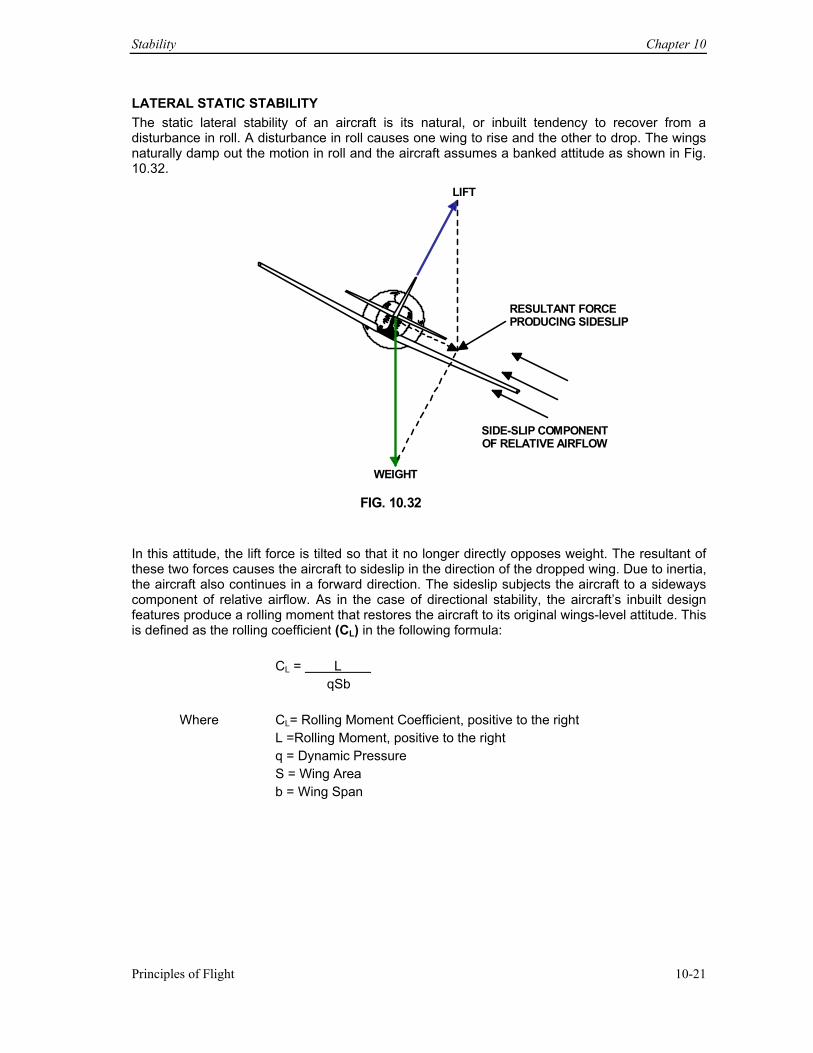
Stability Chapter 10
Principles of Flight 10-21
LATERAL STATIC STABILITY The static lateral stability of an aircraft is its natural, or inbuilt tendency to recover from a disturbance in roll. A disturbance in roll causes one wing to rise and the other to drop. The wings naturally damp out the motion in roll and the aircraft assumes a banked attitude as shown in Fig. 10.32.
LIFT
WEIGHT
RESULTANT FORCE PRODUCING SIDESLIP
SIDE-SLIP COMPONENT OF RELATIVE AIRFLOW
FIG. 10.32
In this attitude, the lift force is tilted so that it no longer directly opposes weight. The resultant of these two forces causes the aircraft to sideslip in the direction of the dropped wing. Due to inertia, the aircraft also continues in a forward direction. The sideslip subjects the aircraft to a sideways component of relative airflow. As in the case of directional stability, the aircraft’s inbuilt design features produce a rolling moment that restores the aircraft to its original wings-level attitude. This is defined as the rolling coefficient (CL) in the following formula:
CL = L qSb
Where CL= Rolling Moment Coefficient, positive to the right L =Rolling Moment, positive to the right
q = Dynamic Pressure S = Wing Area b = Wing Span
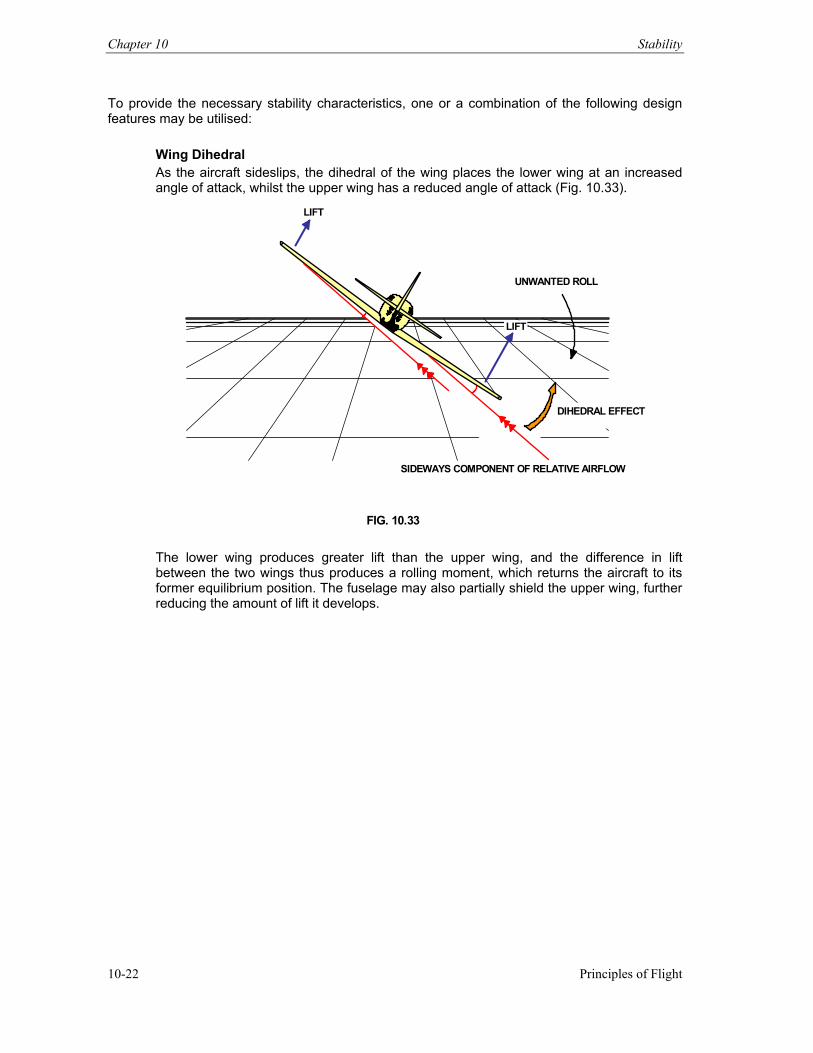
Chapter 10 Stability
Principles of Flight 10-22
To provide the necessary stability characteristics, one or a combination of the following design features may be utilised:
Wing Dihedral As the aircraft sideslips, the dihedral of the wing places the lower wing at an increased angle of attack, whilst the upper wing has a reduced angle of attack (Fig. 10.33).
SIDEWAYS COMPONENT OF RELATIVE AIRFLOW
DIHEDRAL EFFECT
UNWANTED ROLL
LIFT
LIFT
FIG. 10.33
The lower wing produces greater lift than the upper wing, and the difference in lift between the two wings thus produces a rolling moment, which returns the aircraft to its former equilibrium position. The fuselage may also partially shield the upper wing, further reducing the amount of lift it develops.
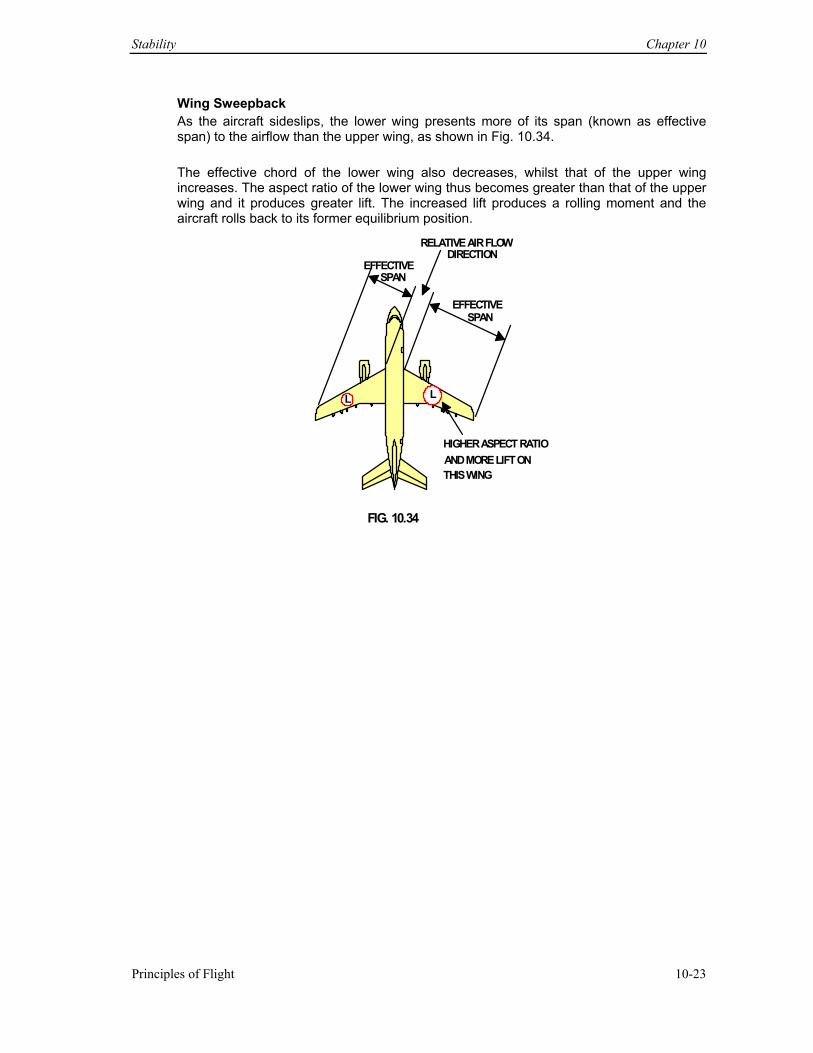
Stability Chapter 10
Principles of Flight 10-23
Wing Sweepback As the aircraft sideslips, the lower wing presents more of its span (known as effective span) to the airflow than the upper wing, as shown in Fig. 10.34. The effective chord of the lower wing also decreases, whilst that of the upper wing increases. The aspect ratio of the lower wing thus becomes greater than that of the upper wing and it produces greater lift. The increased lift produces a rolling moment and the aircraft rolls back to its former equilibrium position.
EFFECTIVESPAN
EFFECTIVESPAN
HIGHER ASPECT RATIOAND MORE LIFT ONTHIS WING
L L
RELATIVE AIR FLOWDIRECTION
FIG. 10.34
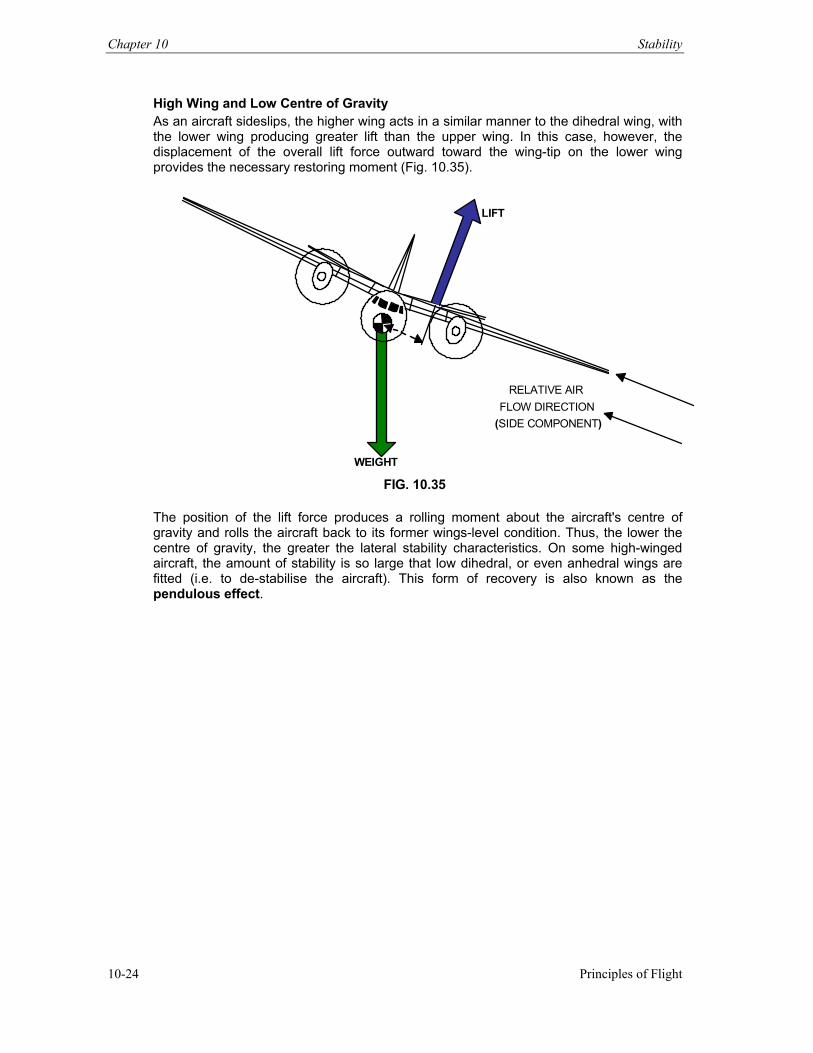
Chapter 10 Stability
Principles of Flight 10-24
High Wing and Low Centre of Gravity As an aircraft sideslips, the higher wing acts in a similar manner to the dihedral wing, with the lower wing producing greater lift than the upper wing. In this case, however, the displacement of the overall lift force outward toward the wing-tip on the lower wing provides the necessary restoring moment (Fig. 10.35).
WEIGHT
RELATIVE AIR FLOW DIRECTION
(SIDE COMPONENT)
FIG. 10.35
LIFT
The position of the lift force produces a rolling moment about the aircraft's centre of gravity and rolls the aircraft back to its former wings-level condition. Thus, the lower the centre of gravity, the greater the lateral stability characteristics. On some high-winged aircraft, the amount of stability is so large that low dihedral, or even anhedral wings are fitted (i.e. to de-stabilise the aircraft). This form of recovery is also known as the pendulous effect.
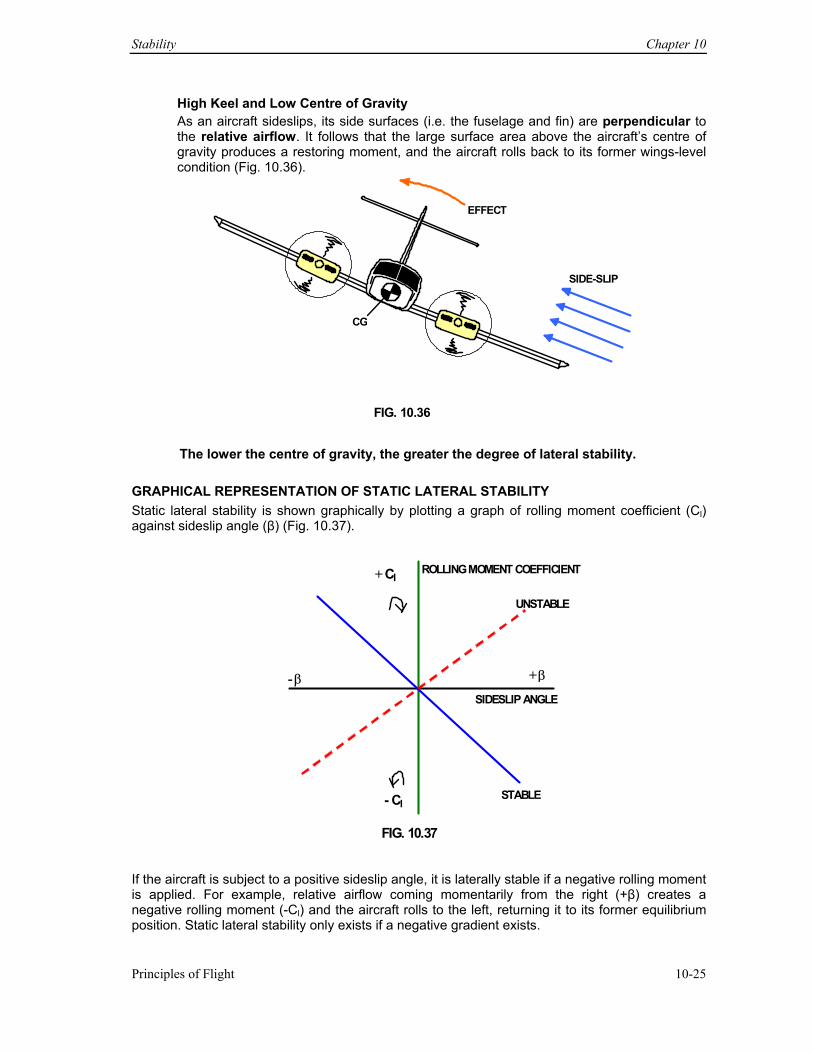
Stability Chapter 10
Principles of Flight 10-25
High Keel and Low Centre of Gravity As an aircraft sideslips, its side surfaces (i.e. the fuselage and fin) are perpendicular to the relative airflow. It follows that the large surface area above the aircraft’s centre of gravity produces a restoring moment, and the aircraft rolls back to its former wings-level condition (Fig. 10.36).
SIDE-SLIP
CG
EFFECT
FIG. 10.36
The lower the centre of gravity, the greater the degree of lateral stability.
GRAPHICAL REPRESENTATION OF STATIC LATERAL STABILITY Static lateral stability is shown graphically by plotting a graph of rolling moment coefficient (Cl) against sideslip angle (β) (Fig. 10.37). STABLE
- β + β
UNSTABLE
ROLLING MOMENT COEFFICIENT
- Cl
SIDESLIP ANGLE
+ Cl
FIG. 10.37
If the aircraft is subject to a positive sideslip angle, it is laterally stable if a negative rolling moment is applied. For example, relative airflow coming momentarily from the right (+β) creates a negative rolling moment (-Cl) and the aircraft rolls to the left, returning it to its former equilibrium position. Static lateral stability only exists if a negative gradient exists.
Chapter 10 Stability
Principles of Flight 10-26
FACTORS AFFECTING STATIC LATERAL STABILITY High-lift devices and power have a destabilising effect on static lateral stability by reducing the dihedral effect. Flap deflection causes the inboard section of the wing to become more effective and the C of P to move inboard closer to the aircraft’s longitudinal axis, reducing the rolling moment. INTERACTION BETWEEN LATERAL AND DIRECTIONAL STATIC STABILITY Until now, lateral and directional stability have been considered as completely separate items. However, the effects of lateral and directional stability are so closely interlinked that it is impossible to separate them. A disturbance which initially only involves lateral stability will, when the aircraft reacts, also involve directional stability at the same time. The main combinations of these types of stability are spiral instability and oscillatory instability.
Spiral Instability As previously established, the lateral stability of an aircraft depends on the forces that tend to return it to a wings-level condition following a wing drop. If an aircraft has a large fin, as the wing drops, a sideslip component acts on the keel surface (including the fin) tending to yaw the aircraft in the direction of the lower wing. If the aircraft's directional stability is greater than its roll stability the aircraft tries to align itself into the sideslip.
This causes the higher outer wing to accelerate and produce more lift than the lower inner wing. This, in turn, sets up a rolling moment toward the inner wing, increasing the angle of bank and resulting in further sideslip. When this occurs, the aircraft exhibits spiral instability. If left unchecked, this condition leads to a steep spiral dive. This tendency may be minimised by reducing the total fin area, which effectively reduces the aircraft's directional stability and its tendency to yaw in the direction of the dropped wing. Lateral stability is consequently more effective than directional stability, and the aircraft becomes more spirally stable.
Another method of minimising spiral instability is to increase the dihedral effect, although this leads to greater oscillatory instability. Spiral instability is normally considered less objectionable than oscillatory instability, so most aircraft are designed to be spirally unstable. With this characteristic, when the aircraft is yawed, either by the prolonged application of rudder or asymmetric power, a rolling moment in the direction of yaw occurs and the aircraft quickly enters a spiral dive. This can occur when flying at low airspeeds under asymmetric power conditions, when excessive yaw due to too much power is coupled with insufficient rudder control to balance it, and may quickly place an aircraft in a dangerous attitude.
Oscillatory Instability Oscillatory instability is more serious than spiral instability and is commonly found to a varying degree in combinations of high wing loading and sweepback, particularly at low indicated airspeeds and high altitude. It is characterised by a combined rolling and yawing movement, or wallowing motion. The aircraft continually yaws and rolls from side to side until corrective action or natural damping takes place. The main forms of oscillatory instability are Dutch roll, where roll predominates yaw, and snaking, where yaw predominates roll.
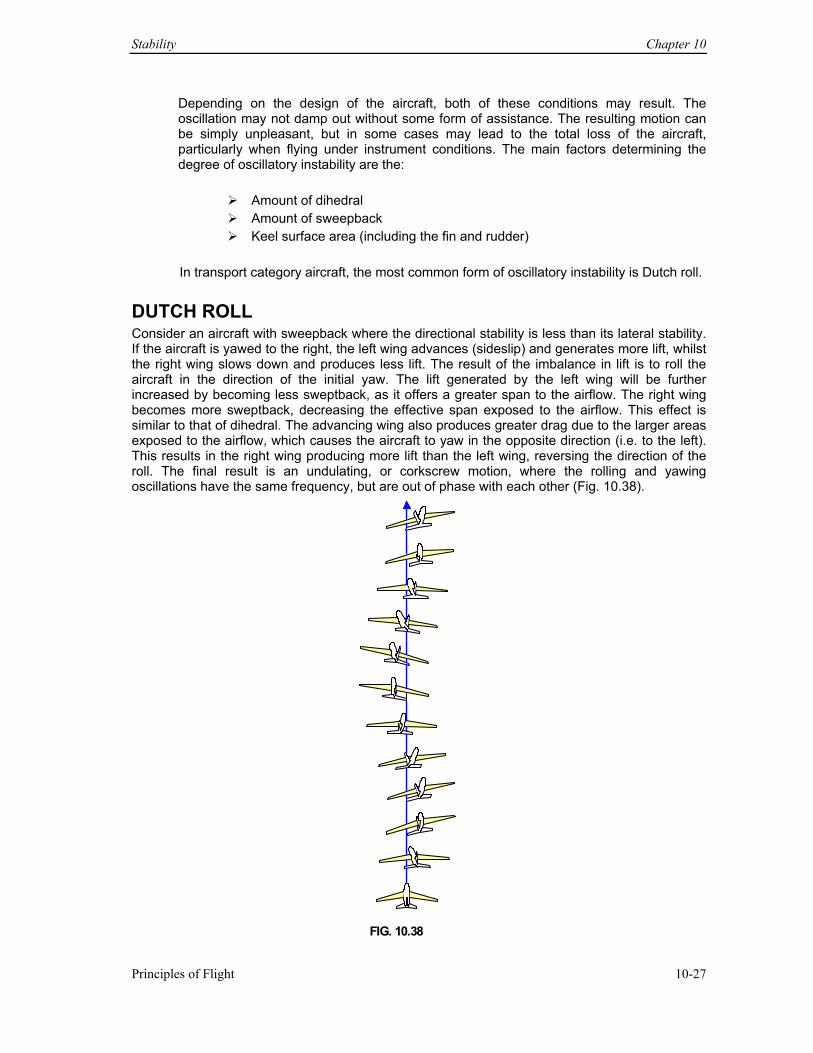
Stability Chapter 10
Principles of Flight 10-27
Depending on the design of the aircraft, both of these conditions may result. The oscillation may not damp out without some form of assistance. The resulting motion can be simply unpleasant, but in some cases may lead to the total loss of the aircraft, particularly when flying under instrument conditions. The main factors determining the degree of oscillatory instability are the:
Amount of dihedral Amount of sweepback Keel surface area (including the fin and rudder)
In transport category aircraft, the most common form of oscillatory instability is Dutch roll.
DUTCH ROLL Consider an aircraft with sweepback where the directional stability is less than its lateral stability. If the aircraft is yawed to the right, the left wing advances (sideslip) and generates more lift, whilst the right wing slows down and produces less lift. The result of the imbalance in lift is to roll the aircraft in the direction of the initial yaw. The lift generated by the left wing will be further increased by becoming less sweptback, as it offers a greater span to the airflow. The right wing becomes more sweptback, decreasing the effective span exposed to the airflow. This effect is similar to that of dihedral. The advancing wing also produces greater drag due to the larger areas exposed to the airflow, which causes the aircraft to yaw in the opposite direction (i.e. to the left). This results in the right wing producing more lift than the left wing, reversing the direction of the roll. The final result is an undulating, or corkscrew motion, where the rolling and yawing oscillations have the same frequency, but are out of phase with each other (Fig. 10.38).
FIG. 10.38
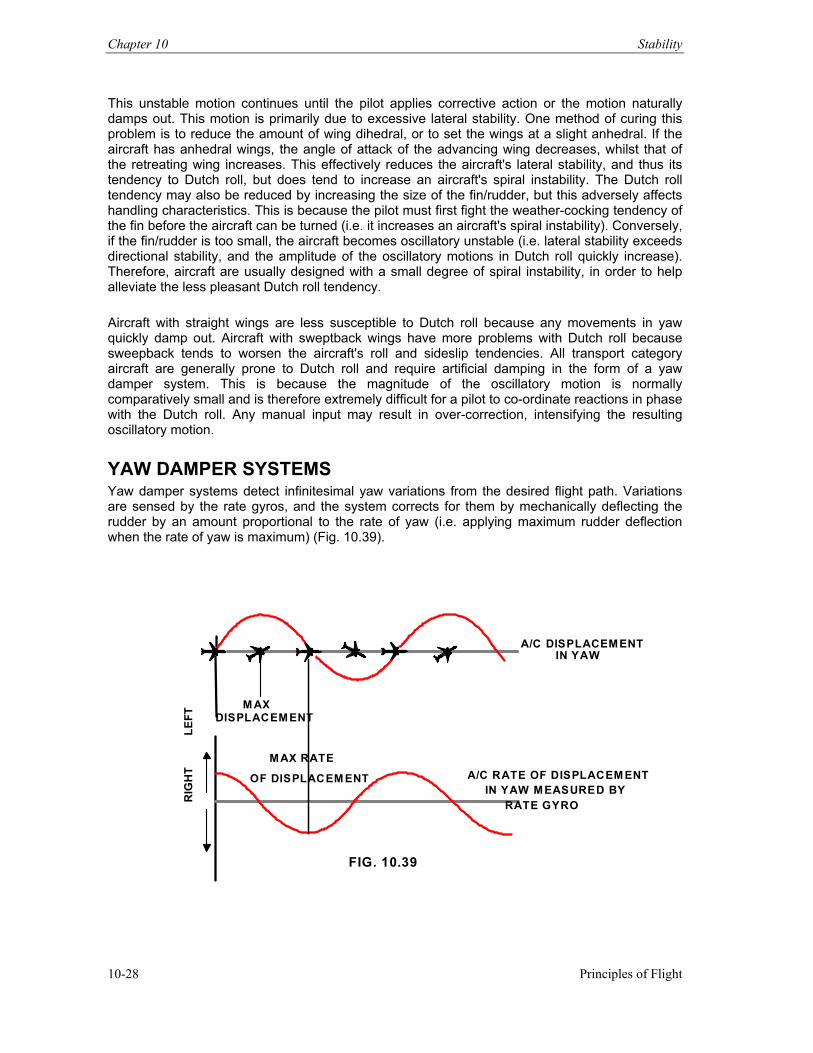
Chapter 10 Stability
Principles of Flight 10-28
This unstable motion continues until the pilot applies corrective action or the motion naturally damps out. This motion is primarily due to excessive lateral stability. One method of curing this problem is to reduce the amount of wing dihedral, or to set the wings at a slight anhedral. If the aircraft has anhedral wings, the angle of attack of the advancing wing decreases, whilst that of the retreating wing increases. This effectively reduces the aircraft's lateral stability, and thus its tendency to Dutch roll, but does tend to increase an aircraft's spiral instability. The Dutch roll tendency may also be reduced by increasing the size of the fin/rudder, but this adversely affects handling characteristics. This is because the pilot must first fight the weather-cocking tendency of the fin before the aircraft can be turned (i.e. it increases an aircraft's spiral instability). Conversely, if the fin/rudder is too small, the aircraft becomes oscillatory unstable (i.e. lateral stability exceeds directional stability, and the amplitude of the oscillatory motions in Dutch roll quickly increase). Therefore, aircraft are usually designed with a small degree of spiral instability, in order to help alleviate the less pleasant Dutch roll tendency. Aircraft with straight wings are less susceptible to Dutch roll because any movements in yaw quickly damp out. Aircraft with sweptback wings have more problems with Dutch roll because sweepback tends to worsen the aircraft's roll and sideslip tendencies. All transport category aircraft are generally prone to Dutch roll and require artificial damping in the form of a yaw damper system. This is because the magnitude of the oscillatory motion is normally comparatively small and is therefore extremely difficult for a pilot to co-ordinate reactions in phase with the Dutch roll. Any manual input may result in over-correction, intensifying the resulting oscillatory motion.
YAW DAMPER SYSTEMS Yaw damper systems detect infinitesimal yaw variations from the desired flight path. Variations are sensed by the rate gyros, and the system corrects for them by mechanically deflecting the rudder by an amount proportional to the rate of yaw (i.e. applying maximum rudder deflection when the rate of yaw is maximum) (Fig. 10.39).
M AX DISPLACEMENT
R
IGH
T
LEFT
A/C DISPLACEMENT IN YAW
A/C RATE OF DISPLACEM ENT IN YAW MEASURED BY
RATE GYRO
MAX RATE
OF DISPLACEM ENT
FIG. 10.39
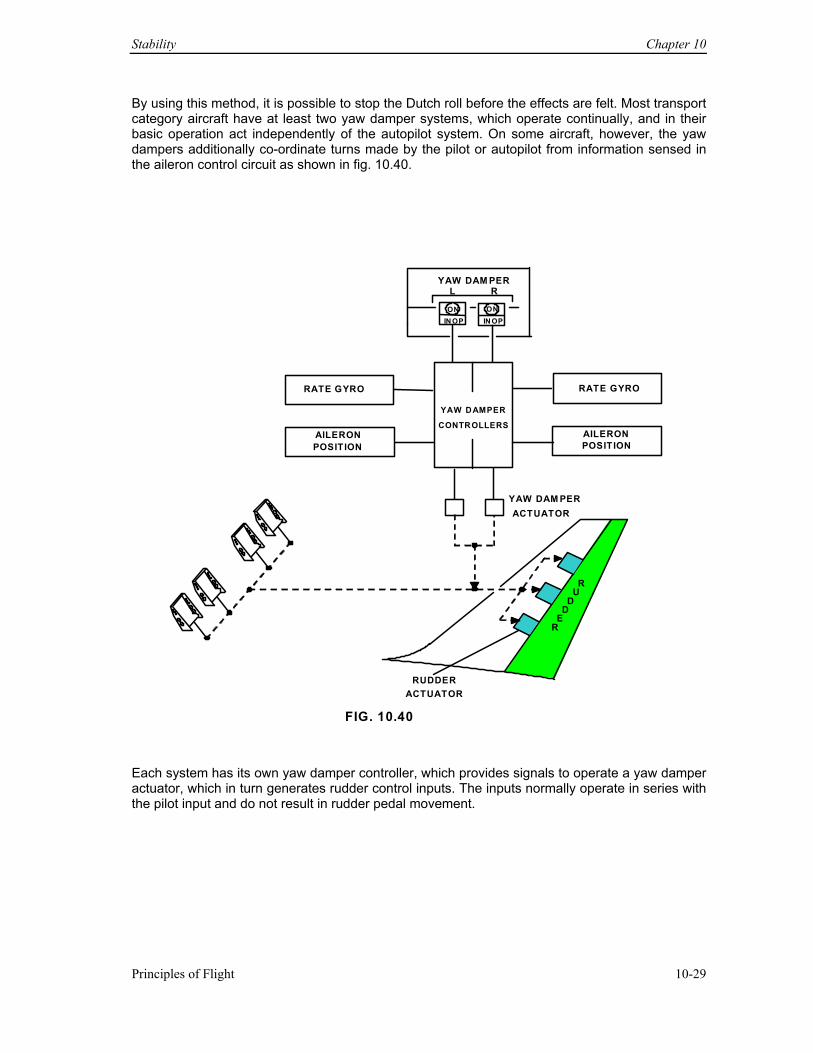
Stability Chapter 10
Principles of Flight 10-29
By using this method, it is possible to stop the Dutch roll before the effects are felt. Most transport category aircraft have at least two yaw damper systems, which operate continually, and in their basic operation act independently of the autopilot system. On some aircraft, however, the yaw dampers additionally co-ordinate turns made by the pilot or autopilot from information sensed in the aileron control circuit as shown in fig. 10.40.
YAW DAM PERL R
ON ONIN OP IN OP
YAW DAMPER
CONTROLLERS
RATE GYRO
AILERONPOSITION
RATE GYRO
AILERON POSITION
YAW DAM PER ACTUATOR
R U
D D
ER
RUDDERACTUATOR
FIG. 10.40
Each system has its own yaw damper controller, which provides signals to operate a yaw damper actuator, which in turn generates rudder control inputs. The inputs normally operate in series with the pilot input and do not result in rudder pedal movement.
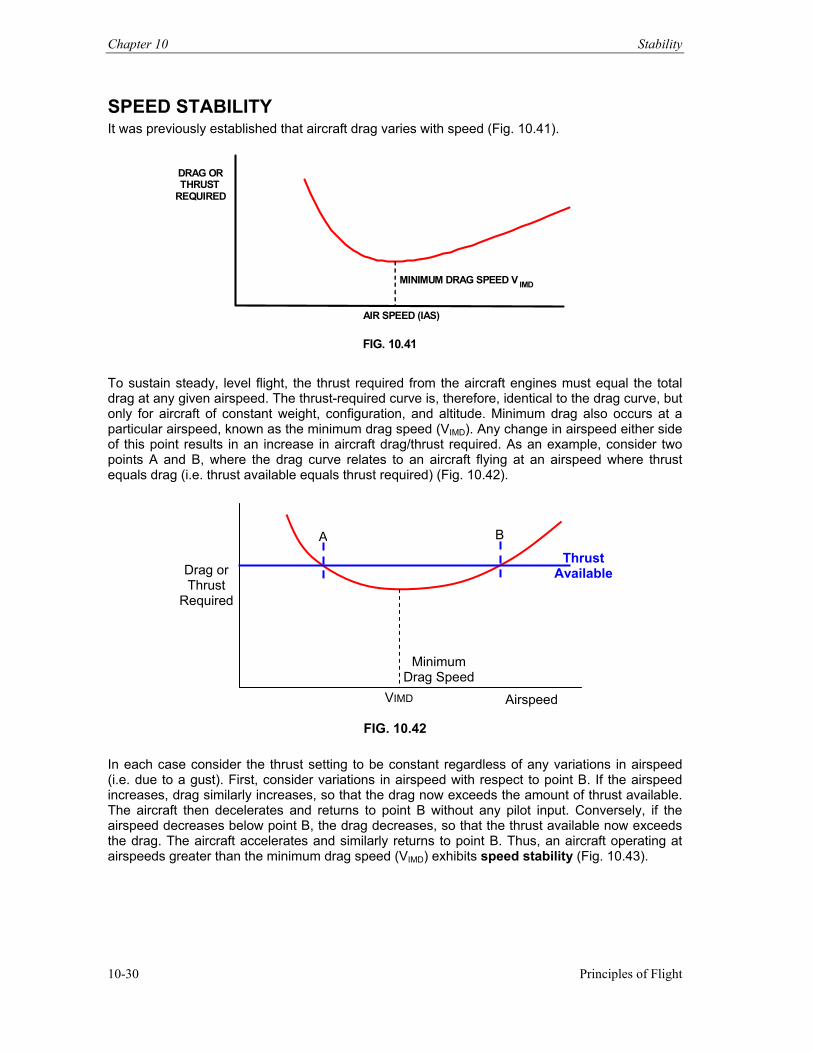
Chapter 10 Stability
Principles of Flight 10-30
SPEED STABILITY It was previously established that aircraft drag varies with speed (Fig. 10.41).
DRAG OR THRUST
REQUIRED
AIR SPEED (IAS)
MINIMUM DRAG SPEED V IMD
FIG. 10.41
To sustain steady, level flight, the thrust required from the aircraft engines must equal the total drag at any given airspeed. The thrust-required curve is, therefore, identical to the drag curve, but only for aircraft of constant weight, configuration, and altitude. Minimum drag also occurs at a particular airspeed, known as the minimum drag speed (VIMD). Any change in airspeed either side of this point results in an increase in aircraft drag/thrust required. As an example, consider two points A and B, where the drag curve relates to an aircraft flying at an airspeed where thrust equals drag (i.e. thrust available equals thrust required) (Fig. 10.42).
FIG. 10.42
In each case consider the thrust setting to be constant regardless of any variations in airspeed (i.e. due to a gust). First, consider variations in airspeed with respect to point B. If the airspeed increases, drag similarly increases, so that the drag now exceeds the amount of thrust available. The aircraft then decelerates and returns to point B without any pilot input. Conversely, if the airspeed decreases below point B, the drag decreases, so that the thrust available now exceeds the drag. The aircraft accelerates and similarly returns to point B. Thus, an aircraft operating at airspeeds greater than the minimum drag speed (VIMD) exhibits speed stability (Fig. 10.43).
Airspeed
Drag or Thrust
Required
Thrust Available
VIMD
Minimum Drag Speed
A B
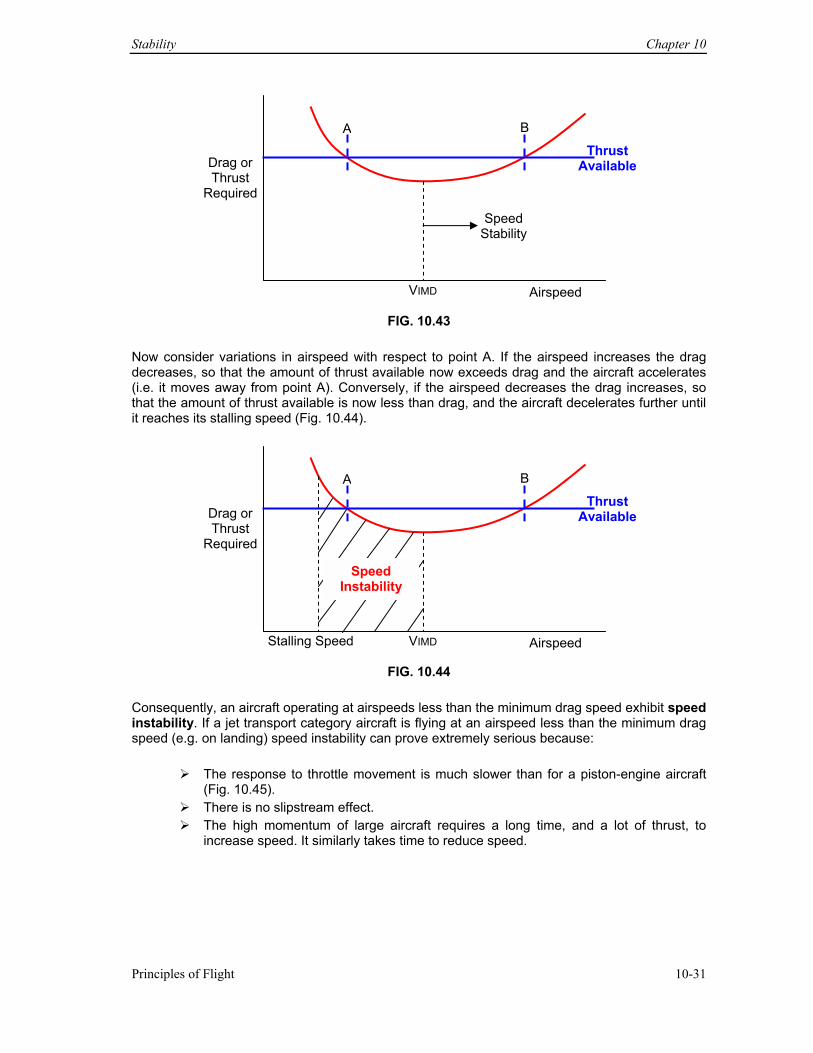
Stability Chapter 10
Principles of Flight 10-31
FIG. 10.43
Now consider variations in airspeed with respect to point A. If the airspeed increases the drag decreases, so that the amount of thrust available now exceeds drag and the aircraft accelerates (i.e. it moves away from point A). Conversely, if the airspeed decreases the drag increases, so that the amount of thrust available is now less than drag, and the aircraft decelerates further until it reaches its stalling speed (Fig. 10.44).
FIG. 10.44
Consequently, an aircraft operating at airspeeds less than the minimum drag speed exhibit speed instability. If a jet transport category aircraft is flying at an airspeed less than the minimum drag speed (e.g. on landing) speed instability can prove extremely serious because:
The response to throttle movement is much slower than for a piston-engine aircraft (Fig. 10.45).
There is no slipstream effect. The high momentum of large aircraft requires a long time, and a lot of thrust, to
increase speed. It similarly takes time to reduce speed.
Airspeed
Drag or Thrust
Required
Thrust Available
VIMD
Speed Stability
A B
Airspeed
Drag or Thrust
Required
Thrust Available
VIMD
A B
Stalling Speed
Speed Instability
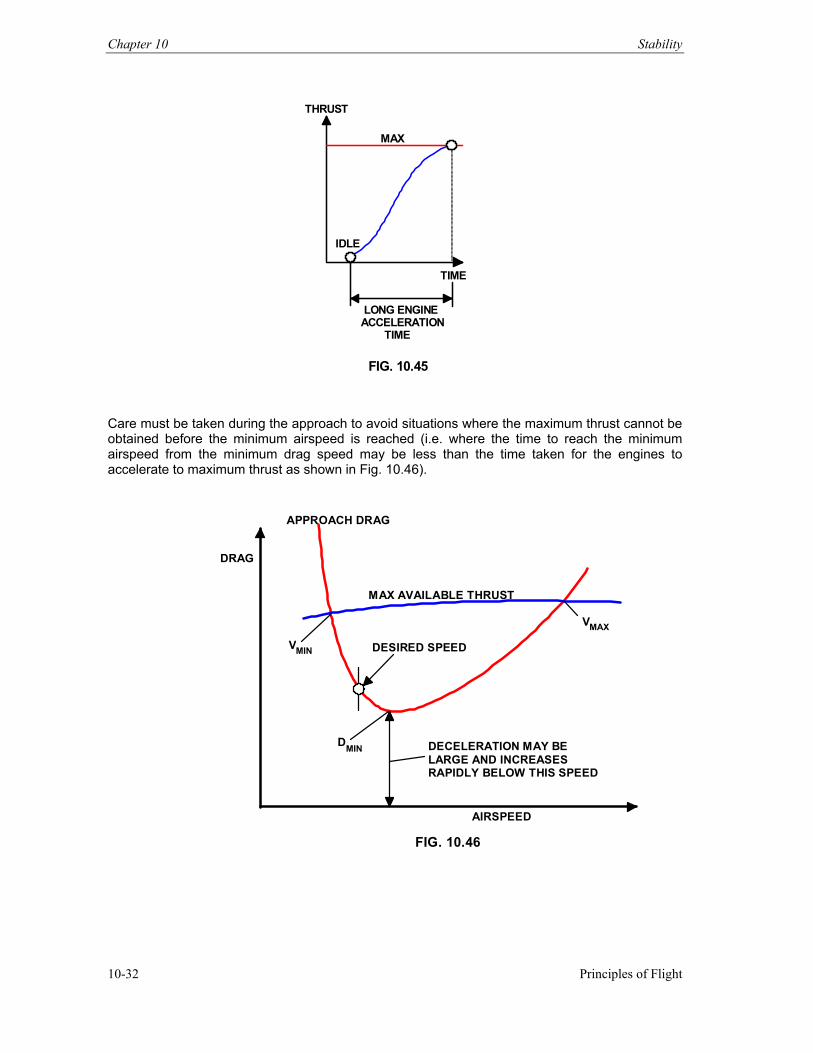
Chapter 10 Stability
Principles of Flight 10-32
THRUST
MAX
IDLE
TIME
LONG ENGINEACCELERATION
TIME
FIG. 10.45
Care must be taken during the approach to avoid situations where the maximum thrust cannot be obtained before the minimum airspeed is reached (i.e. where the time to reach the minimum airspeed from the minimum drag speed may be less than the time taken for the engines to accelerate to maximum thrust as shown in Fig. 10.46).
APPROACH DRAG
MAX AVAILABLE THRUST
DRAG
DESIRED SPEED
DECELERATION MAY BELARGE AND INCREASESRAPIDLY BELOW THIS SPEED
AIRSPEED
MIN V MAX V
MIND
FIG. 10.46
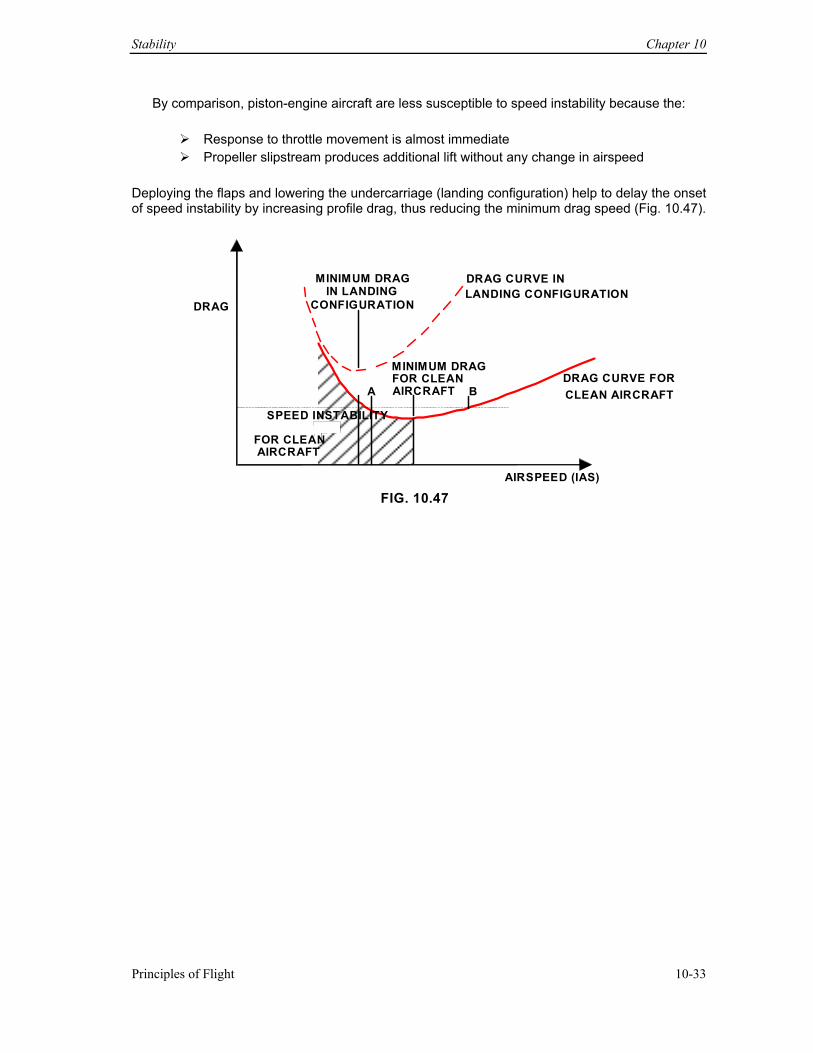
Stability Chapter 10
Principles of Flight 10-33
By comparison, piston-engine aircraft are less susceptible to speed instability because the:
Response to throttle movement is almost immediate Propeller slipstream produces additional lift without any change in airspeed
Deploying the flaps and lowering the undercarriage (landing configuration) help to delay the onset of speed instability by increasing profile drag, thus reducing the minimum drag speed (Fig. 10.47).
DRAG
AIRSPEED (IAS)
DRAG CURVE INLANDING CONFIGURATION
MINIMUM DRAGFOR CLEANAIRCRAFTA B
DRAG CURVE FORCLEAN AIRCRAFT
SPEED INSTABILITY
FOR CLEAN AIRCRAFT
MINIMUM DRAGIN LANDING
CONFIGURATION
FIG. 10.47
Chapter 10 Stability
Principles of Flight 10-34
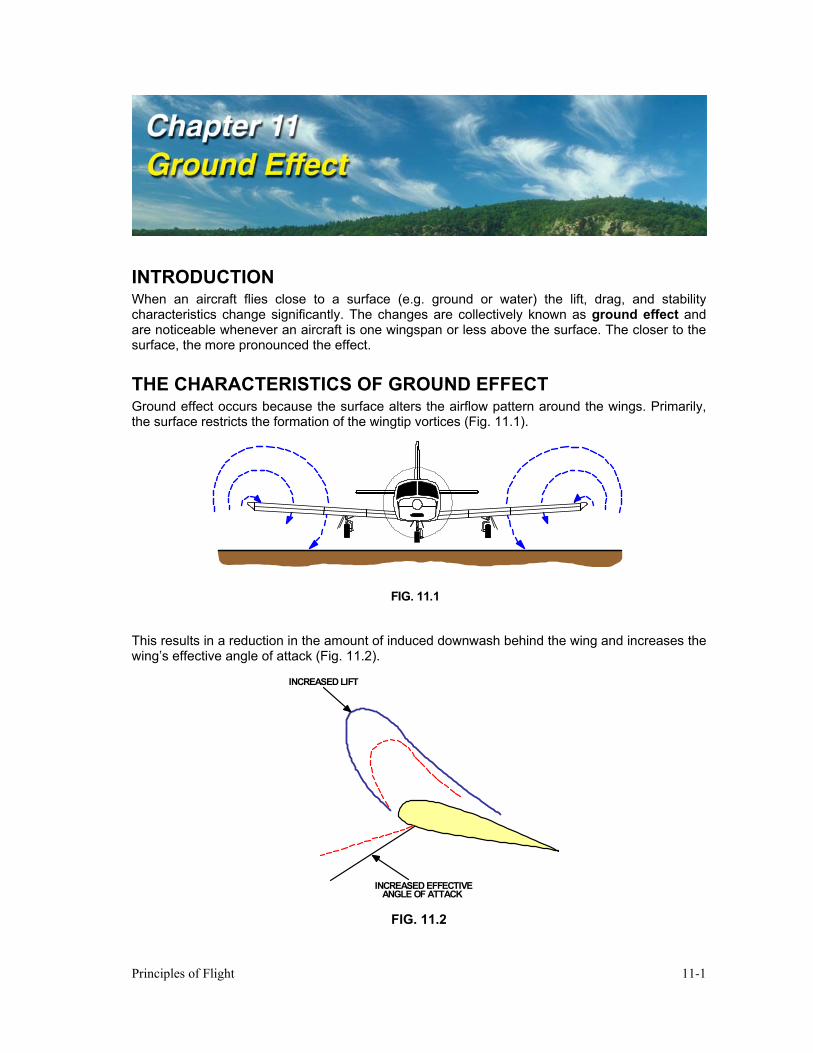
Principles of Flight 11-1
INTRODUCTION When an aircraft flies close to a surface (e.g. ground or water) the lift, drag, and stability characteristics change significantly. The changes are collectively known as ground effect and are noticeable whenever an aircraft is one wingspan or less above the surface. The closer to the surface, the more pronounced the effect.
THE CHARACTERISTICS OF GROUND EFFECT Ground effect occurs because the surface alters the airflow pattern around the wings. Primarily, the surface restricts the formation of the wingtip vortices (Fig. 11.1).
FIG. 11.1
This results in a reduction in the amount of induced downwash behind the wing and increases the wing’s effective angle of attack (Fig. 11.2).
INCREASED LIFT
INCREASED EFFECTIVEANGLE OF ATTACK
FIG. 11.2
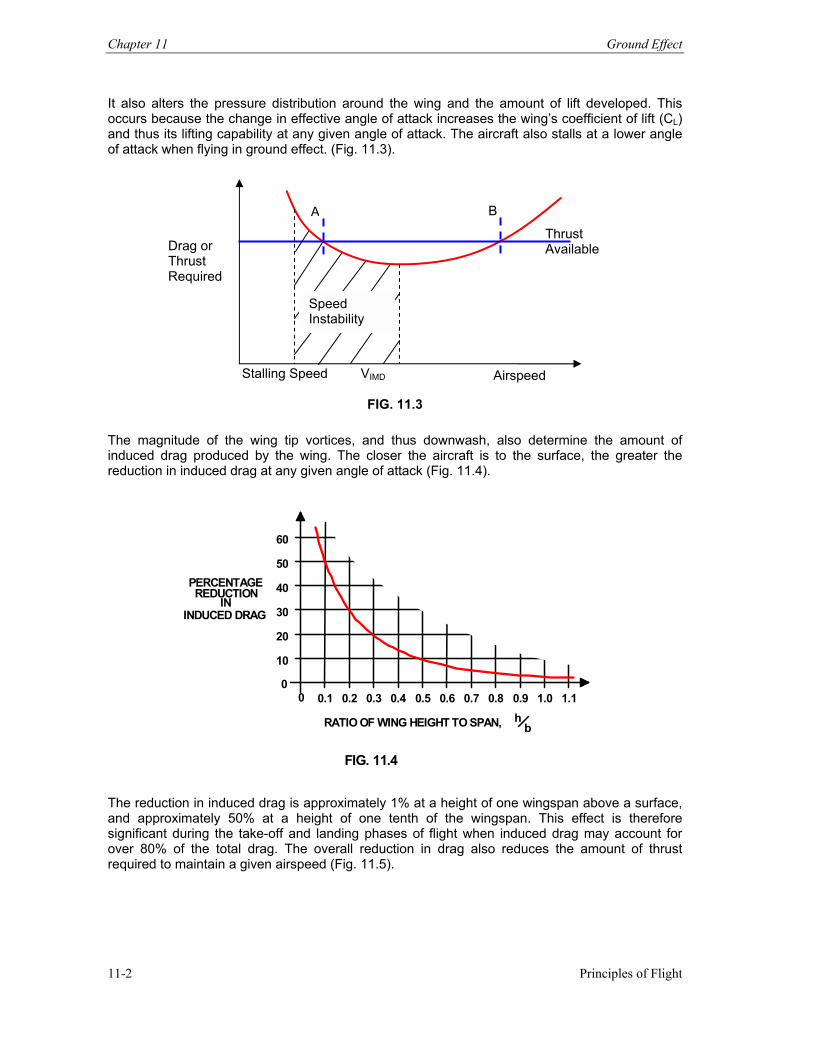
Chapter 11 Ground Effect
11-2 Principles of Flight
It also alters the pressure distribution around the wing and the amount of lift developed. This occurs because the change in effective angle of attack increases the wing’s coefficient of lift (CL) and thus its lifting capability at any given angle of attack. The aircraft also stalls at a lower angle of attack when flying in ground effect. (Fig. 11.3).
FIG. 11.3
The magnitude of the wing tip vortices, and thus downwash, also determine the amount of induced drag produced by the wing. The closer the aircraft is to the surface, the greater the reduction in induced drag at any given angle of attack (Fig. 11.4).
60 50 40 30 20 10 0
0 0.1 0.2 0.3 0.4 0.5 0.6 0.7 0.8 0.9 1.0 1.1 RATIO OF WING HEIGHT TO SPAN, h
b
PERCENTAGE REDUCTION
IN INDUCED DRAG
FIG. 11.4
The reduction in induced drag is approximately 1% at a height of one wingspan above a surface, and approximately 50% at a height of one tenth of the wingspan. This effect is therefore significant during the take-off and landing phases of flight when induced drag may account for over 80% of the total drag. The overall reduction in drag also reduces the amount of thrust required to maintain a given airspeed (Fig. 11.5).
Airspeed
Drag or Thrust Required
Thrust Available
VIMD
A B
Stalling Speed
Speed Instability
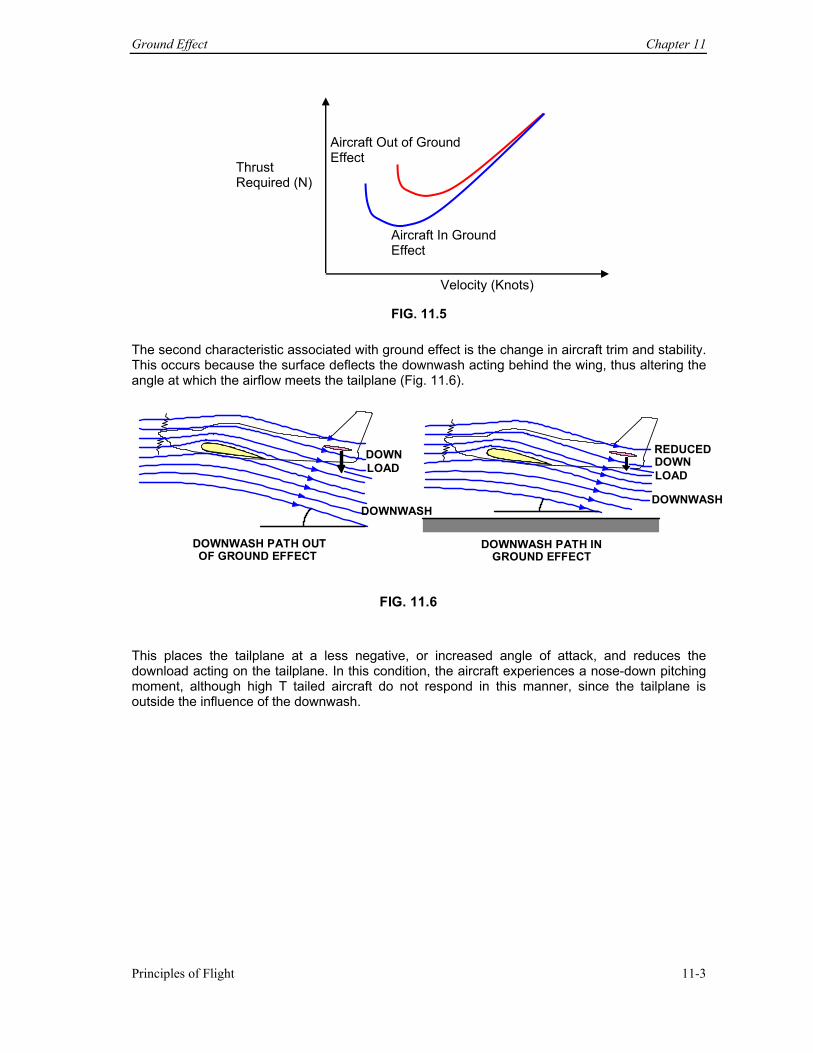
Ground Effect Chapter 11
Principles of Flight 11-3
FIG. 11.5
The second characteristic associated with ground effect is the change in aircraft trim and stability. This occurs because the surface deflects the downwash acting behind the wing, thus altering the angle at which the airflow meets the tailplane (Fig. 11.6).
DOWNWASH
DOWNWASH PATH OUT OF GROUND EFFECT DOWNWASH PATH IN
GROUND EFFECT
DOWNWASH
REDUCEDDOWN DOWN
LOADLOAD
FIG. 11.6
This places the tailplane at a less negative, or increased angle of attack, and reduces the download acting on the tailplane. In this condition, the aircraft experiences a nose-down pitching moment, although high T tailed aircraft do not respond in this manner, since the tailplane is outside the influence of the downwash.
Velocity (Knots)
Thrust Required (N)
Aircraft Out of Ground Effect
Aircraft In Ground Effect
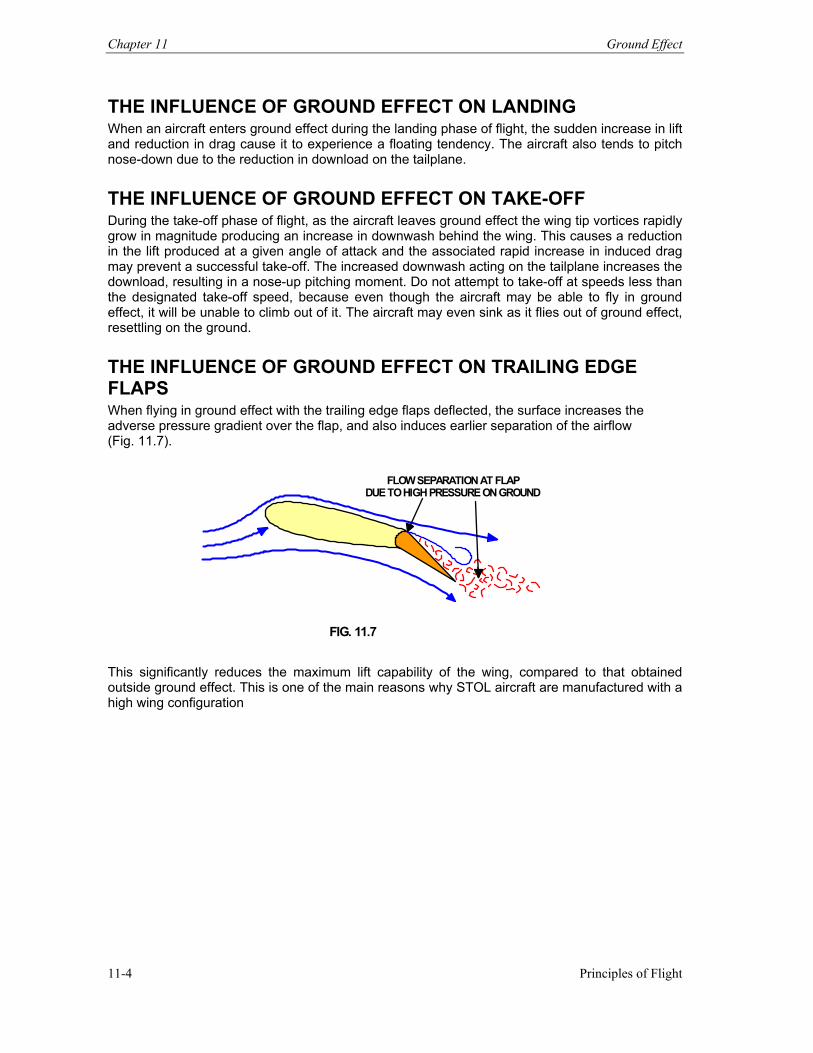
Chapter 11 Ground Effect
11-4 Principles of Flight
THE INFLUENCE OF GROUND EFFECT ON LANDING When an aircraft enters ground effect during the landing phase of flight, the sudden increase in lift and reduction in drag cause it to experience a floating tendency. The aircraft also tends to pitch nose-down due to the reduction in download on the tailplane.
THE INFLUENCE OF GROUND EFFECT ON TAKE-OFF During the take-off phase of flight, as the aircraft leaves ground effect the wing tip vortices rapidly grow in magnitude producing an increase in downwash behind the wing. This causes a reduction in the lift produced at a given angle of attack and the associated rapid increase in induced drag may prevent a successful take-off. The increased downwash acting on the tailplane increases the download, resulting in a nose-up pitching moment. Do not attempt to take-off at speeds less than the designated take-off speed, because even though the aircraft may be able to fly in ground effect, it will be unable to climb out of it. The aircraft may even sink as it flies out of ground effect, resettling on the ground.
THE INFLUENCE OF GROUND EFFECT ON TRAILING EDGE FLAPS When flying in ground effect with the trailing edge flaps deflected, the surface increases the adverse pressure gradient over the flap, and also induces earlier separation of the airflow (Fig. 11.7).
FLOW SEPARATION AT FLAPDUE TO HIGH PRESSURE ON GROUND
FIG. 11.7 This significantly reduces the maximum lift capability of the wing, compared to that obtained outside ground effect. This is one of the main reasons why STOL aircraft are manufactured with a high wing configuration
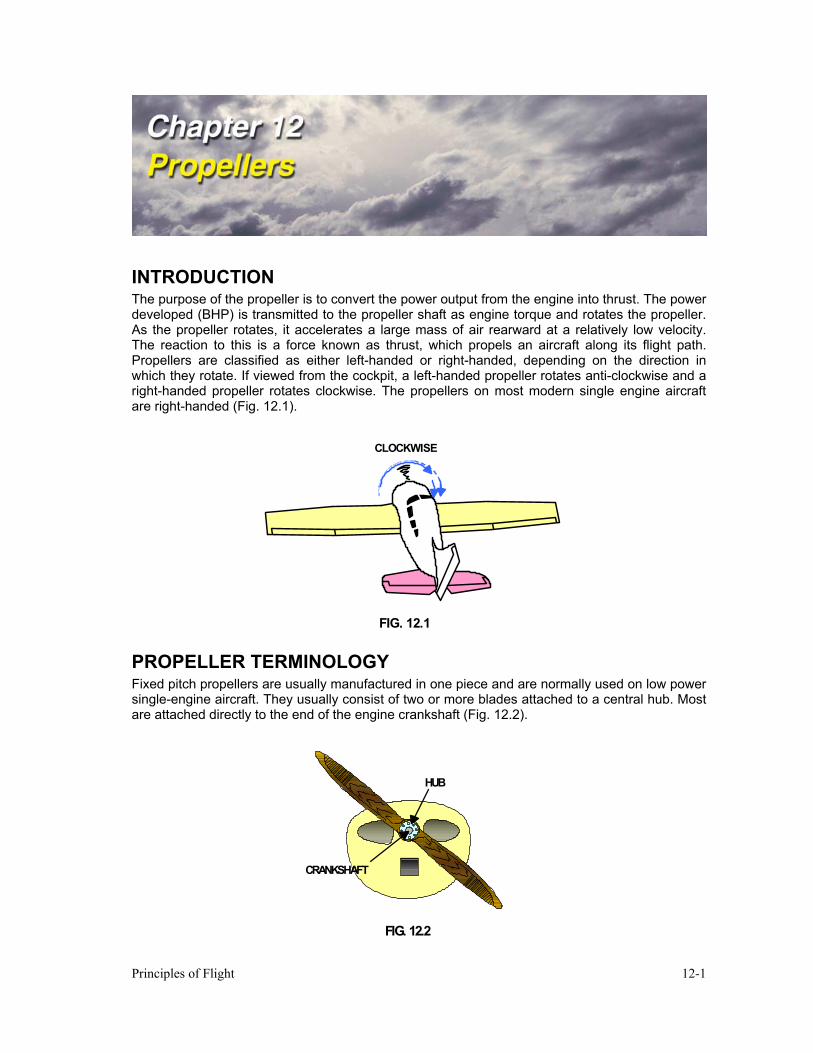
Principles of Flight 12-1
INTRODUCTION The purpose of the propeller is to convert the power output from the engine into thrust. The power developed (BHP) is transmitted to the propeller shaft as engine torque and rotates the propeller. As the propeller rotates, it accelerates a large mass of air rearward at a relatively low velocity. The reaction to this is a force known as thrust, which propels an aircraft along its flight path. Propellers are classified as either left-handed or right-handed, depending on the direction in which they rotate. If viewed from the cockpit, a left-handed propeller rotates anti-clockwise and a right-handed propeller rotates clockwise. The propellers on most modern single engine aircraft are right-handed (Fig. 12.1).
CLOCKWISE
FIG. 12.1
PROPELLER TERMINOLOGY Fixed pitch propellers are usually manufactured in one piece and are normally used on low power single-engine aircraft. They usually consist of two or more blades attached to a central hub. Most are attached directly to the end of the engine crankshaft (Fig. 12.2).
HUB
CRANKSHAFT
FIG. 12.2
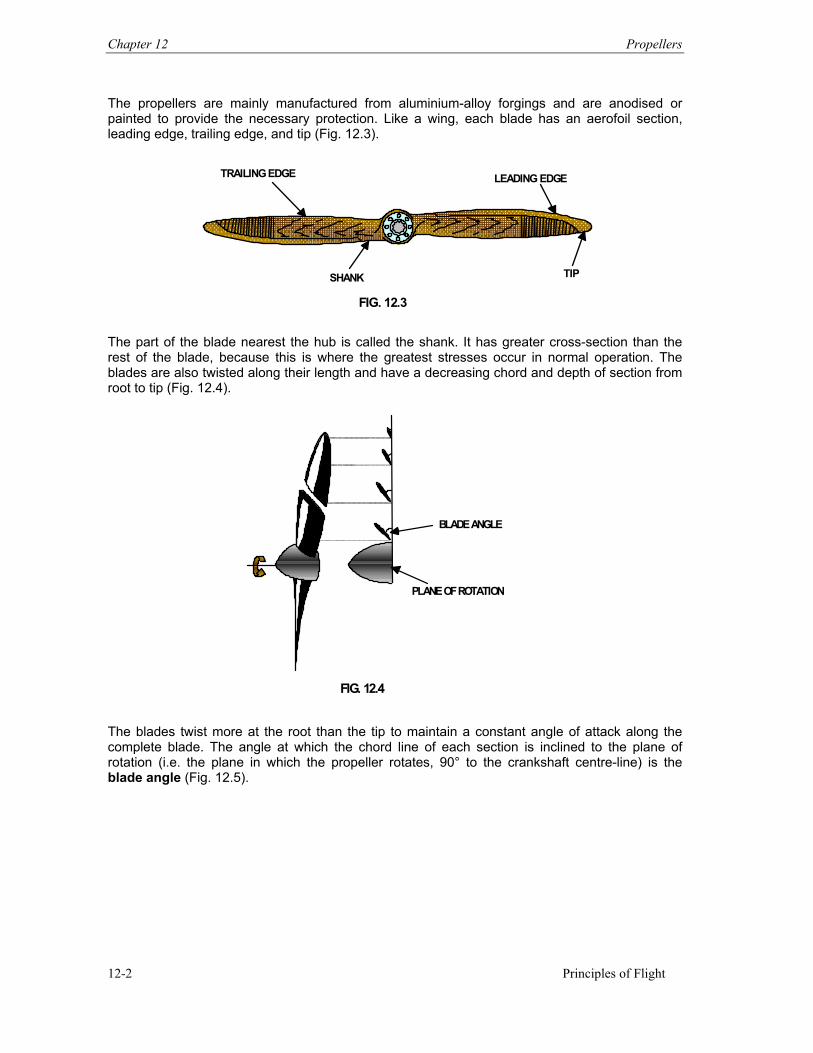
Chapter 12 Propellers
Principles of Flight 12-2
The propellers are mainly manufactured from aluminium-alloy forgings and are anodised or painted to provide the necessary protection. Like a wing, each blade has an aerofoil section, leading edge, trailing edge, and tip (Fig. 12.3).
TRAILING EDGE LEADING EDGE
SHANK TIP FIG. 12.3
The part of the blade nearest the hub is called the shank. It has greater cross-section than the rest of the blade, because this is where the greatest stresses occur in normal operation. The blades are also twisted along their length and have a decreasing chord and depth of section from root to tip (Fig. 12.4).
BLADE ANGLE
PLANE OF ROTATION
FIG. 12.4
The blades twist more at the root than the tip to maintain a constant angle of attack along the complete blade. The angle at which the chord line of each section is inclined to the plane of rotation (i.e. the plane in which the propeller rotates, 90° to the crankshaft centre-line) is the blade angle (Fig. 12.5).
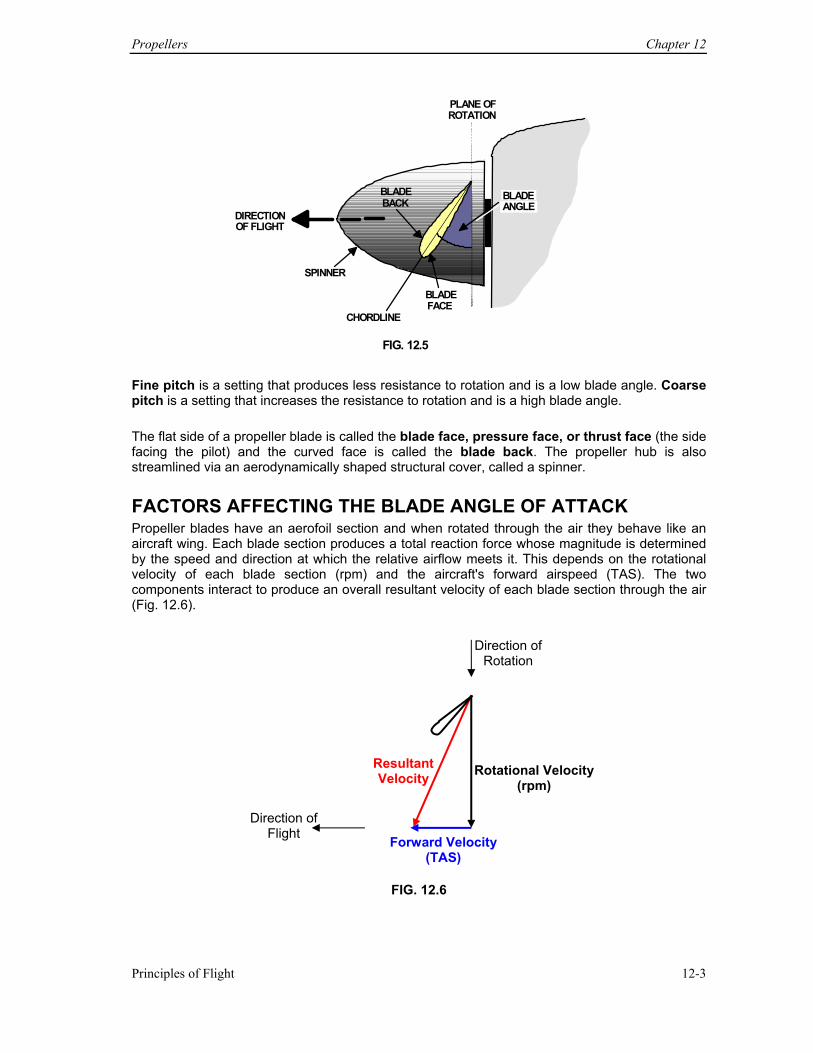
Propellers Chapter 12
Principles of Flight 12-3
PLANE OFROTATION
DIRECTION OF FLIGHT
SPINNER
BLADEFACE
BLADEBACK
CHORDLINE
BLADEANGLE
FIG. 12.5 Fine pitch is a setting that produces less resistance to rotation and is a low blade angle. Coarse pitch is a setting that increases the resistance to rotation and is a high blade angle. The flat side of a propeller blade is called the blade face, pressure face, or thrust face (the side facing the pilot) and the curved face is called the blade back. The propeller hub is also streamlined via an aerodynamically shaped structural cover, called a spinner.
FACTORS AFFECTING THE BLADE ANGLE OF ATTACK Propeller blades have an aerofoil section and when rotated through the air they behave like an aircraft wing. Each blade section produces a total reaction force whose magnitude is determined by the speed and direction at which the relative airflow meets it. This depends on the rotational velocity of each blade section (rpm) and the aircraft's forward airspeed (TAS). The two components interact to produce an overall resultant velocity of each blade section through the air (Fig. 12.6).
FIG. 12.6
Rotational Velocity (rpm)
Forward Velocity (TAS)
Resultant Velocity
Direction of Flight
Direction of Rotation
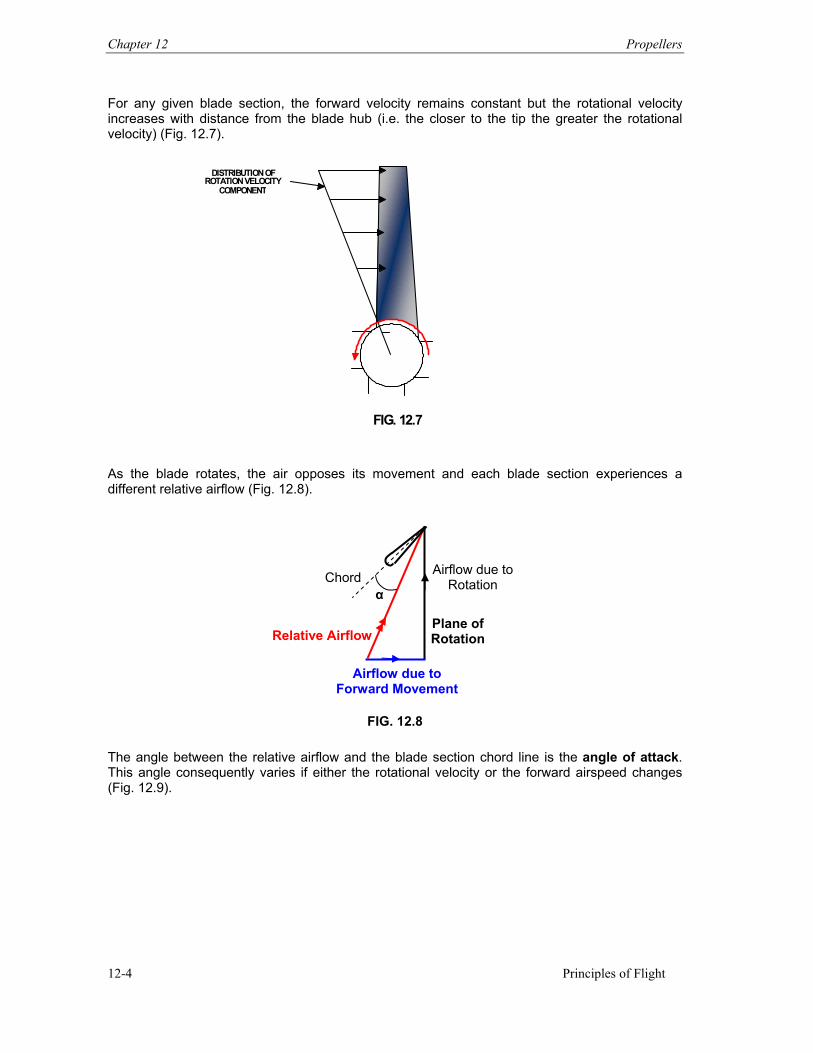
Chapter 12 Propellers
Principles of Flight 12-4
For any given blade section, the forward velocity remains constant but the rotational velocity increases with distance from the blade hub (i.e. the closer to the tip the greater the rotational velocity) (Fig. 12.7).
DISTRIBUTION OF ROTATION VELOCITY
COMPONENT
FIG. 12.7
As the blade rotates, the air opposes its movement and each blade section experiences a different relative airflow (Fig. 12.8).
FIG. 12.8
The angle between the relative airflow and the blade section chord line is the angle of attack. This angle consequently varies if either the rotational velocity or the forward airspeed changes (Fig. 12.9).
Plane of Rotation
Airflow due to Forward Movement
Relative Airflow
Chord Airflow due to Rotation
α
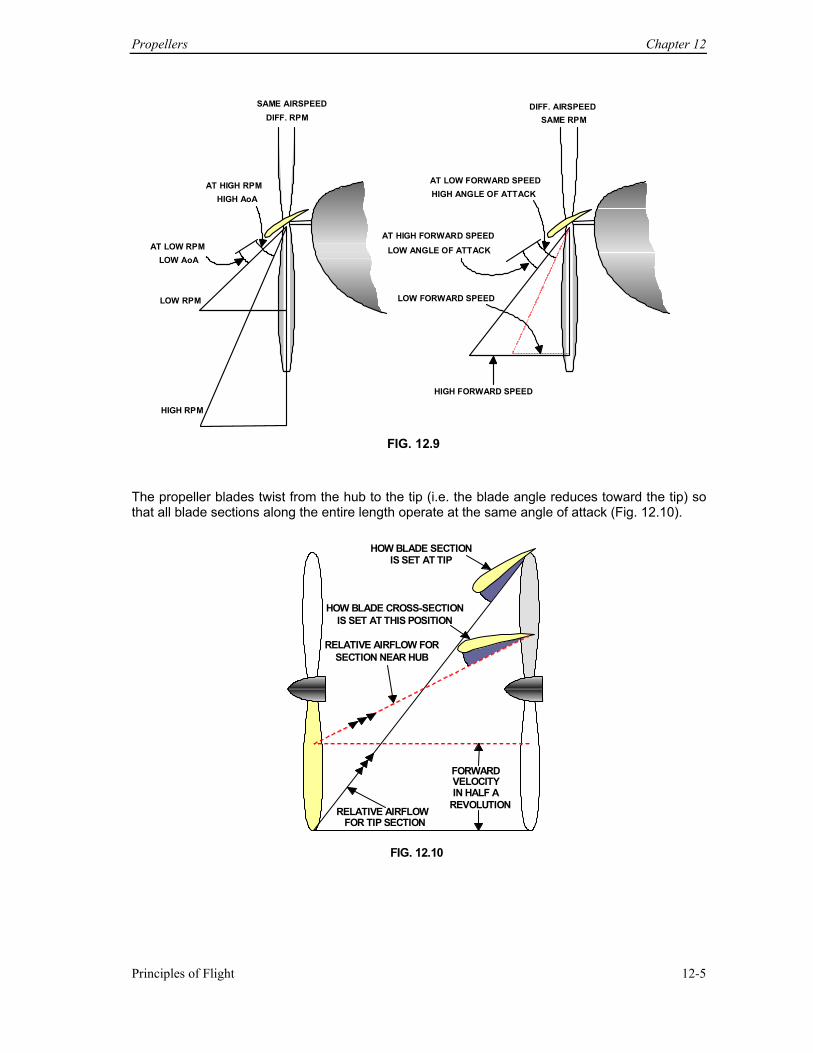
Propellers Chapter 12
Principles of Flight 12-5
AT LOW FORWARD SPEEDHIGH ANGLE OF ATTACK
AT HIGH FORWARD SPEEDLOW ANGLE OF ATTACK
LOW FORWARD SPEED
HIGH FORWARD SPEED
DIFF. AIRSPEED SAME RPM SAME AIRSPEED
DIFF. RPM
AT HIGH RPM HIGH AoA
AT LOW RPM LOW AoA
LOW RPM
HIGH RPM FIG. 12.9
The propeller blades twist from the hub to the tip (i.e. the blade angle reduces toward the tip) so that all blade sections along the entire length operate at the same angle of attack (Fig. 12.10).
HOW BLADE SECTIONIS SET AT TIP
HOW BLADE CROSS-SECTIONIS SET AT THIS POSITION
RELATIVE AIRFLOW FORSECTION NEAR HUB
FORWARDVELOCITYIN HALF A
REVOLUTIONRELATIVE AIRFLOWFOR TIP SECTION
FIG. 12.10
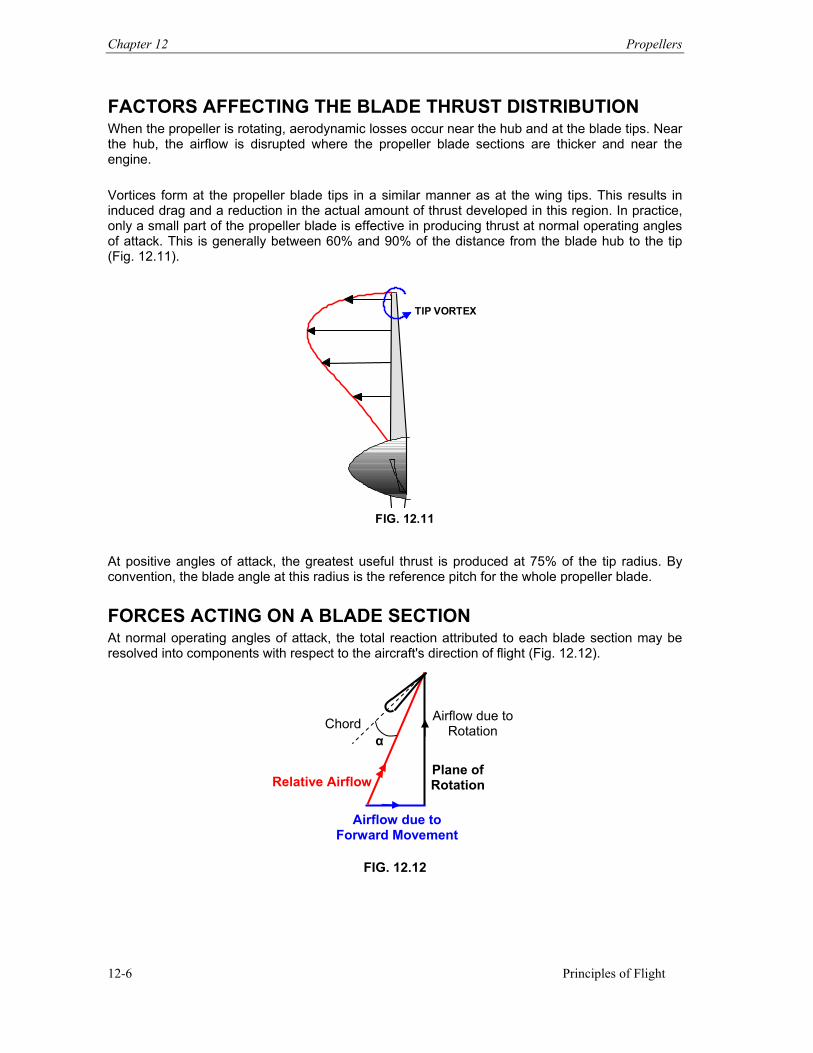
Chapter 12 Propellers
Principles of Flight 12-6
FACTORS AFFECTING THE BLADE THRUST DISTRIBUTION When the propeller is rotating, aerodynamic losses occur near the hub and at the blade tips. Near the hub, the airflow is disrupted where the propeller blade sections are thicker and near the engine. Vortices form at the propeller blade tips in a similar manner as at the wing tips. This results in induced drag and a reduction in the actual amount of thrust developed in this region. In practice, only a small part of the propeller blade is effective in producing thrust at normal operating angles of attack. This is generally between 60% and 90% of the distance from the blade hub to the tip (Fig. 12.11).
TIP VORTEX
FIG. 12.11
At positive angles of attack, the greatest useful thrust is produced at 75% of the tip radius. By convention, the blade angle at this radius is the reference pitch for the whole propeller blade.
FORCES ACTING ON A BLADE SECTION At normal operating angles of attack, the total reaction attributed to each blade section may be resolved into components with respect to the aircraft's direction of flight (Fig. 12.12).
FIG. 12.12
Plane of Rotation
Airflow due to Forward Movement
Relative Airflow
Chord Airflow due to Rotation
α
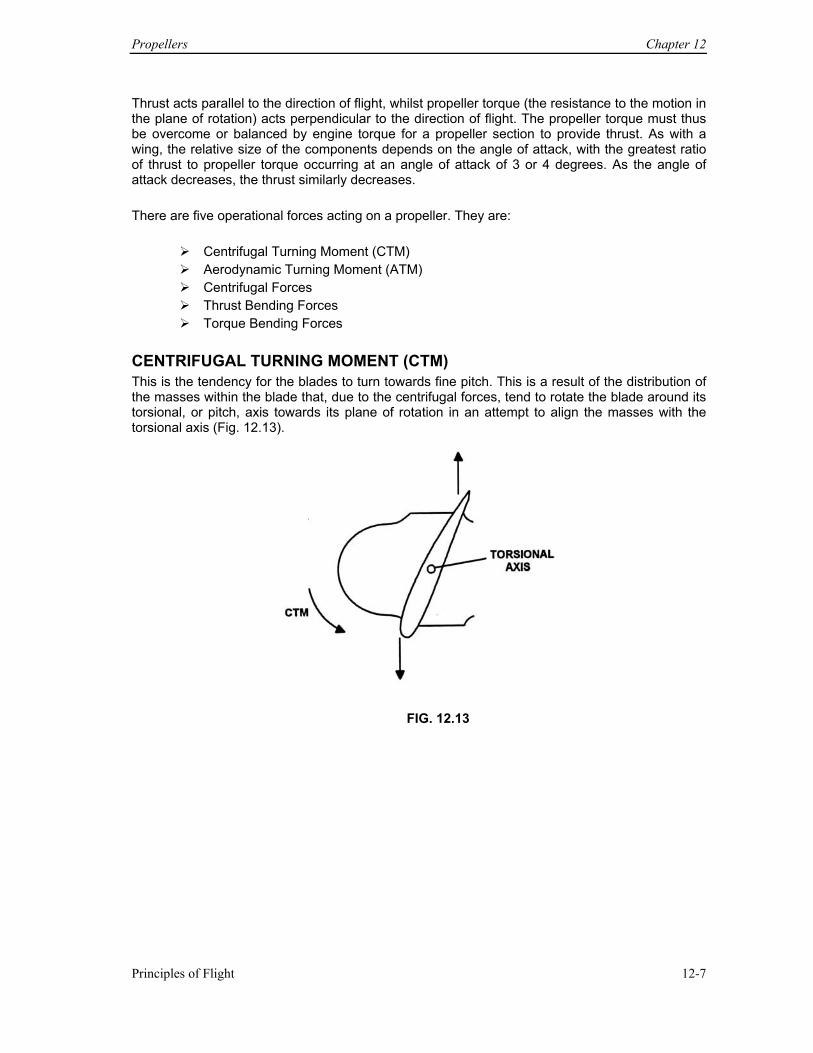
Propellers Chapter 12
Principles of Flight 12-7
Thrust acts parallel to the direction of flight, whilst propeller torque (the resistance to the motion in the plane of rotation) acts perpendicular to the direction of flight. The propeller torque must thus be overcome or balanced by engine torque for a propeller section to provide thrust. As with a wing, the relative size of the components depends on the angle of attack, with the greatest ratio of thrust to propeller torque occurring at an angle of attack of 3 or 4 degrees. As the angle of attack decreases, the thrust similarly decreases. There are five operational forces acting on a propeller. They are:
Centrifugal Turning Moment (CTM) Aerodynamic Turning Moment (ATM) Centrifugal Forces Thrust Bending Forces Torque Bending Forces
CENTRIFUGAL TURNING MOMENT (CTM) This is the tendency for the blades to turn towards fine pitch. This is a result of the distribution of the masses within the blade that, due to the centrifugal forces, tend to rotate the blade around its torsional, or pitch, axis towards its plane of rotation in an attempt to align the masses with the torsional axis (Fig. 12.13).
FIG. 12.13
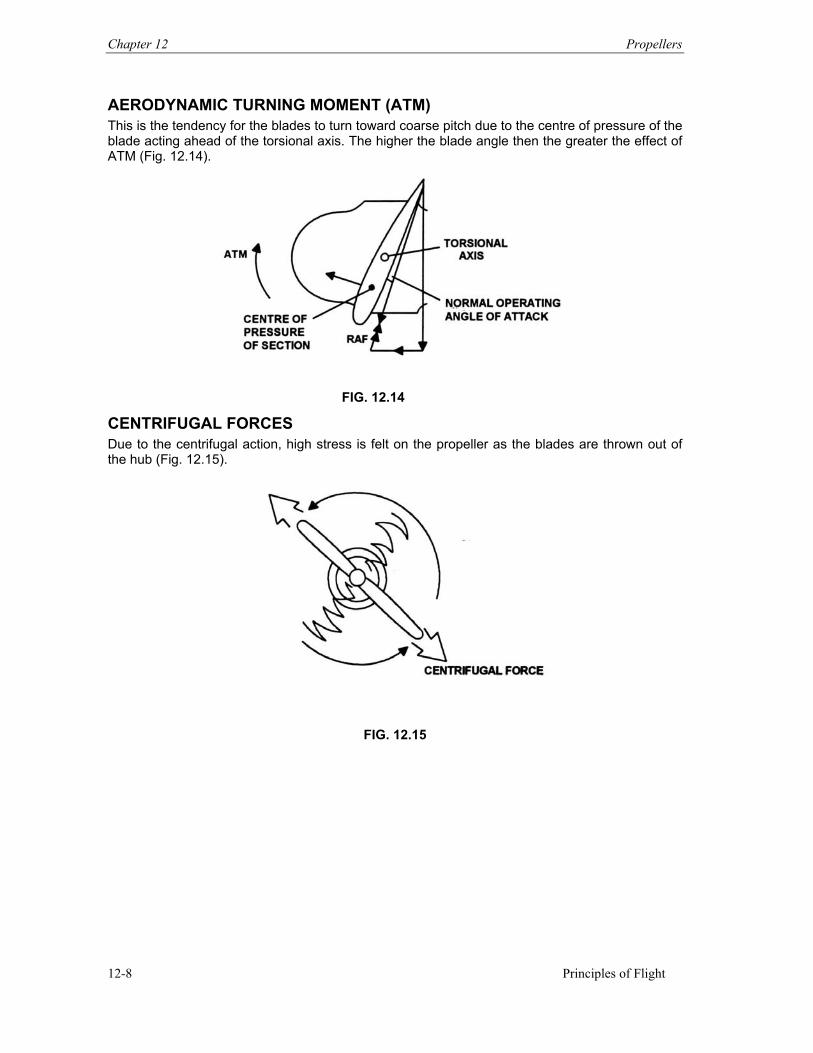
Chapter 12 Propellers
Principles of Flight 12-8
AERODYNAMIC TURNING MOMENT (ATM) This is the tendency for the blades to turn toward coarse pitch due to the centre of pressure of the blade acting ahead of the torsional axis. The higher the blade angle then the greater the effect of ATM (Fig. 12.14).
CENTRIFUGAL FORCES Due to the centrifugal action, high stress is felt on the propeller as the blades are thrown out of the hub (Fig. 12.15).
FIG. 12.15
FIG. 12.14
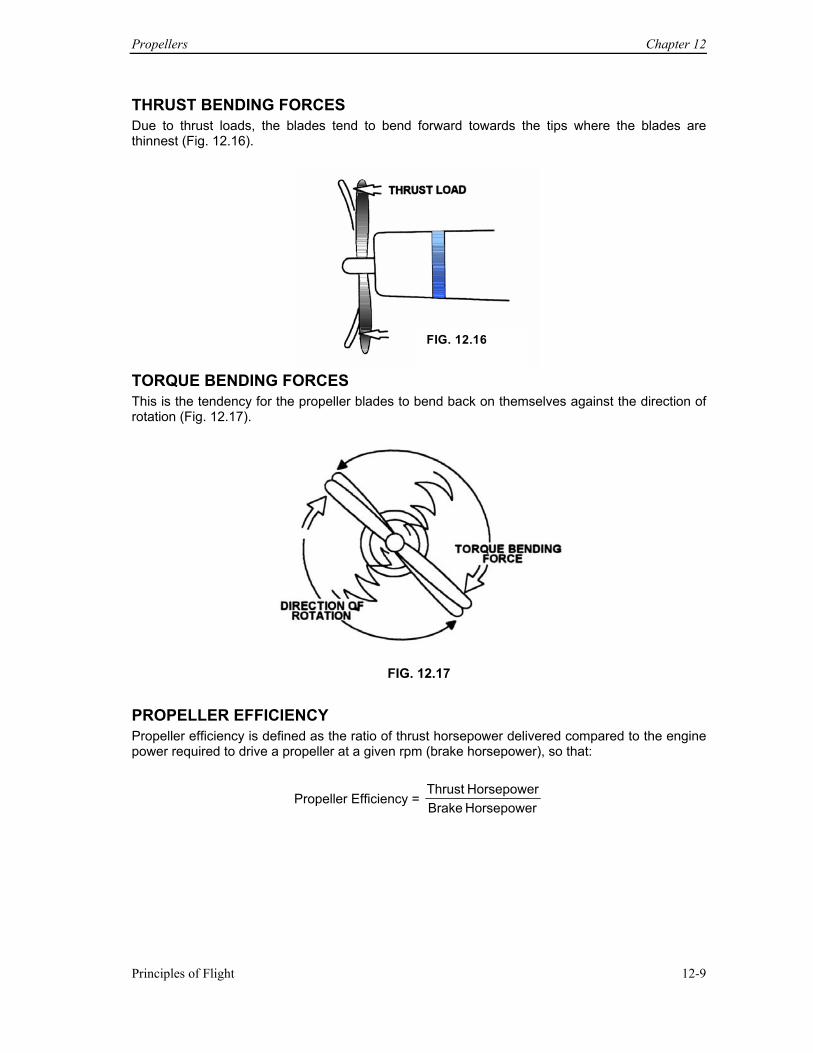
Propellers Chapter 12
Principles of Flight 12-9
THRUST BENDING FORCES Due to thrust loads, the blades tend to bend forward towards the tips where the blades are thinnest (Fig. 12.16).
FIG. 12.16
TORQUE BENDING FORCES This is the tendency for the propeller blades to bend back on themselves against the direction of rotation (Fig. 12.17).
FIG. 12.17
PROPELLER EFFICIENCY Propeller efficiency is defined as the ratio of thrust horsepower delivered compared to the engine power required to drive a propeller at a given rpm (brake horsepower), so that:
Propeller Efficiency = Horsepower BrakeHorsepower Thrust
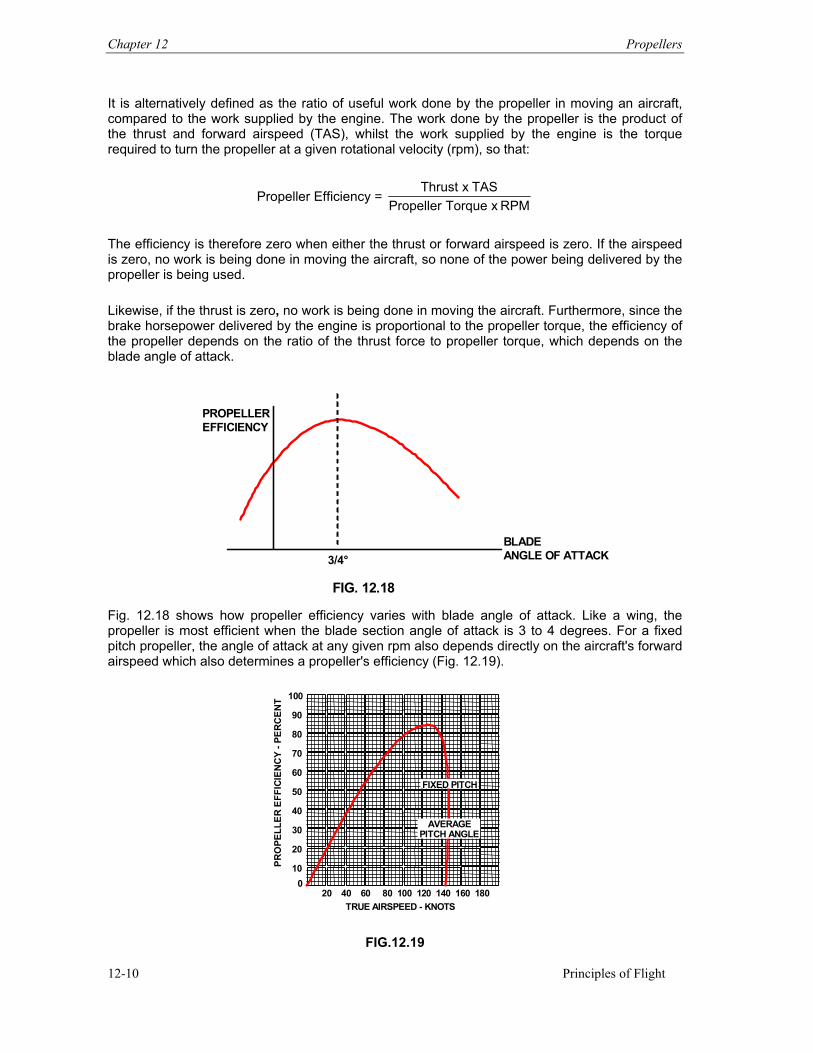
Chapter 12 Propellers
Principles of Flight 12-10
It is alternatively defined as the ratio of useful work done by the propeller in moving an aircraft, compared to the work supplied by the engine. The work done by the propeller is the product of the thrust and forward airspeed (TAS), whilst the work supplied by the engine is the torque required to turn the propeller at a given rotational velocity (rpm), so that:
Propeller Efficiency = RPM x Torque Propeller
TAS x Thrust
The efficiency is therefore zero when either the thrust or forward airspeed is zero. If the airspeed is zero, no work is being done in moving the aircraft, so none of the power being delivered by the propeller is being used. Likewise, if the thrust is zero, no work is being done in moving the aircraft. Furthermore, since the brake horsepower delivered by the engine is proportional to the propeller torque, the efficiency of the propeller depends on the ratio of the thrust force to propeller torque, which depends on the blade angle of attack.
PROPELLER EFFICIENCY
BLADEANGLE OF ATTACK 3/4°
FIG. 12.18
Fig. 12.18 shows how propeller efficiency varies with blade angle of attack. Like a wing, the propeller is most efficient when the blade section angle of attack is 3 to 4 degrees. For a fixed pitch propeller, the angle of attack at any given rpm also depends directly on the aircraft's forward airspeed which also determines a propeller's efficiency (Fig. 12.19).
100 90 80 70 60 50 40 30 20 10
0 20 40 60 80 100 120 140 160 180
PRO
PELL
ER E
FFIC
IEN
CY
- PER
CEN
T
TRUE AIRSPEED - KNOTS
FIXED PITCH
AVERAGEPITCH ANGLE
FIG.12.19
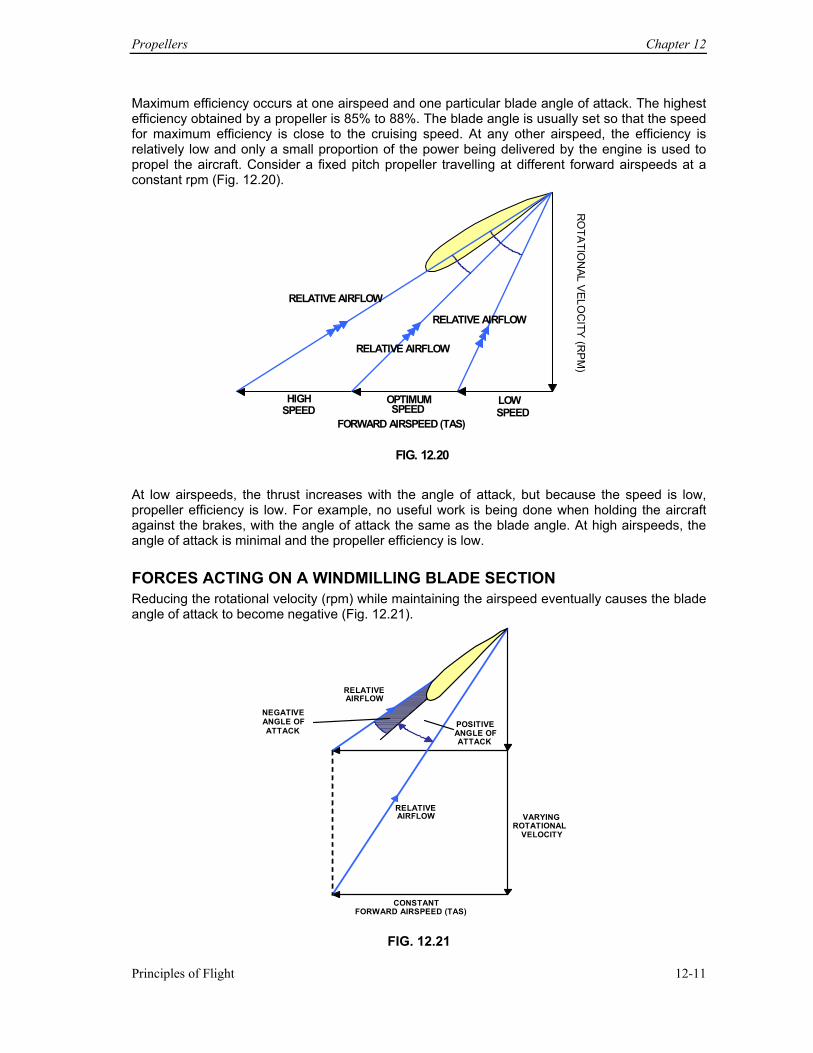
Propellers Chapter 12
Principles of Flight 12-11
Maximum efficiency occurs at one airspeed and one particular blade angle of attack. The highest efficiency obtained by a propeller is 85% to 88%. The blade angle is usually set so that the speed for maximum efficiency is close to the cruising speed. At any other airspeed, the efficiency is relatively low and only a small proportion of the power being delivered by the engine is used to propel the aircraft. Consider a fixed pitch propeller travelling at different forward airspeeds at a constant rpm (Fig. 12.20).
RELATIVE AIRFLOW
RO
TATIO
NAL V
ELOC
ITY (R
PM
)
HIGH SPEED OPTIMUM
SPEEDLOWSPEED
FORWARD AIRSPEED (TAS)
RELATIVE AIRFLOW
RELATIVE AIRFLOW
FIG. 12.20
At low airspeeds, the thrust increases with the angle of attack, but because the speed is low, propeller efficiency is low. For example, no useful work is being done when holding the aircraft against the brakes, with the angle of attack the same as the blade angle. At high airspeeds, the angle of attack is minimal and the propeller efficiency is low. FORCES ACTING ON A WINDMILLING BLADE SECTION Reducing the rotational velocity (rpm) while maintaining the airspeed eventually causes the blade angle of attack to become negative (Fig. 12.21).
RELATIVEAIRFLOW
RELATIVEAIRFLOW
NEGATIVE ANGLE OF ATTACK POSITIVE
ANGLE OFATTACK
VARYINGROTATIONAL
VELOCITY
CONSTANTFORWARD AIRSPEED (TAS)
FIG. 12.21
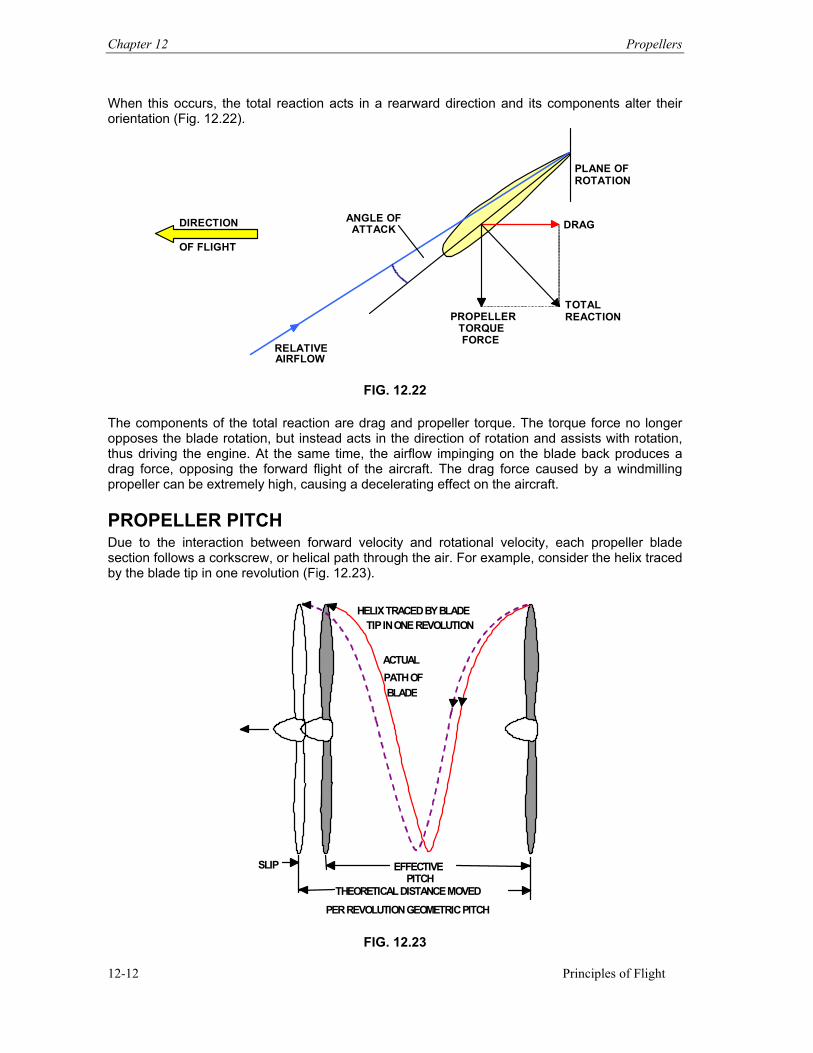
Chapter 12 Propellers
Principles of Flight 12-12
When this occurs, the total reaction acts in a rearward direction and its components alter their orientation (Fig. 12.22).
DIRECTION OF FLIGHT
ANGLE OFATTACK
RELATIVEAIRFLOW
PROPELLERTORQUEFORCE
PLANE OF ROTATION
DRAG
TOTAL REACTION
FIG. 12.22 The components of the total reaction are drag and propeller torque. The torque force no longer opposes the blade rotation, but instead acts in the direction of rotation and assists with rotation, thus driving the engine. At the same time, the airflow impinging on the blade back produces a drag force, opposing the forward flight of the aircraft. The drag force caused by a windmilling propeller can be extremely high, causing a decelerating effect on the aircraft.
PROPELLER PITCH Due to the interaction between forward velocity and rotational velocity, each propeller blade section follows a corkscrew, or helical path through the air. For example, consider the helix traced by the blade tip in one revolution (Fig. 12.23).
SLIP EFFECTIVEPITCH
THEORETICAL DISTANCE MOVED
PER REVOLUTION GEOMETRIC PITCH
HELIX TRACED BY BLADETIP IN ONE REVOLUTION
ACTUALPATH OFBLADE
FIG. 12.23
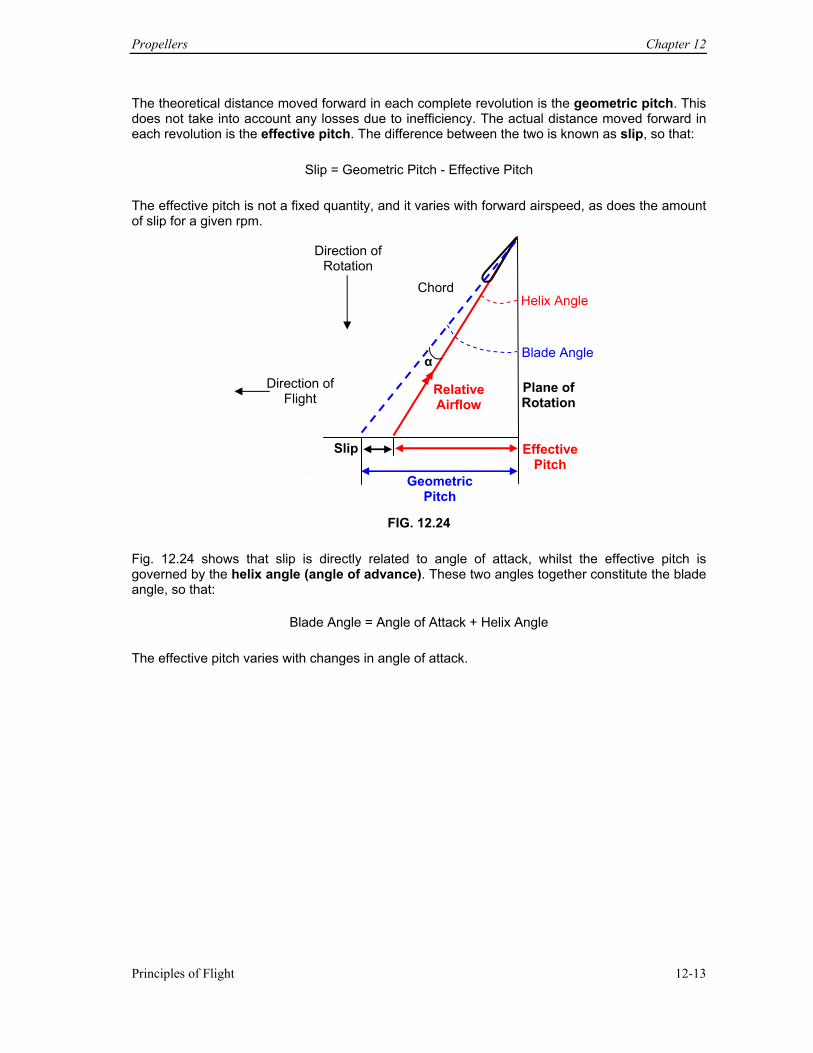
Propellers Chapter 12
Principles of Flight 12-13
The theoretical distance moved forward in each complete revolution is the geometric pitch. This does not take into account any losses due to inefficiency. The actual distance moved forward in each revolution is the effective pitch. The difference between the two is known as slip, so that:
Slip = Geometric Pitch - Effective Pitch The effective pitch is not a fixed quantity, and it varies with forward airspeed, as does the amount of slip for a given rpm.
FIG. 12.24
Fig. 12.24 shows that slip is directly related to angle of attack, whilst the effective pitch is governed by the helix angle (angle of advance). These two angles together constitute the blade angle, so that:
Blade Angle = Angle of Attack + Helix Angle The effective pitch varies with changes in angle of attack.
Plane of Rotation
Blade Angle
Relative Airflow
Chord
Direction of Rotation
α
Helix Angle
Direction of Flight
Geometric Pitch
Effective Pitch
Slip Sli
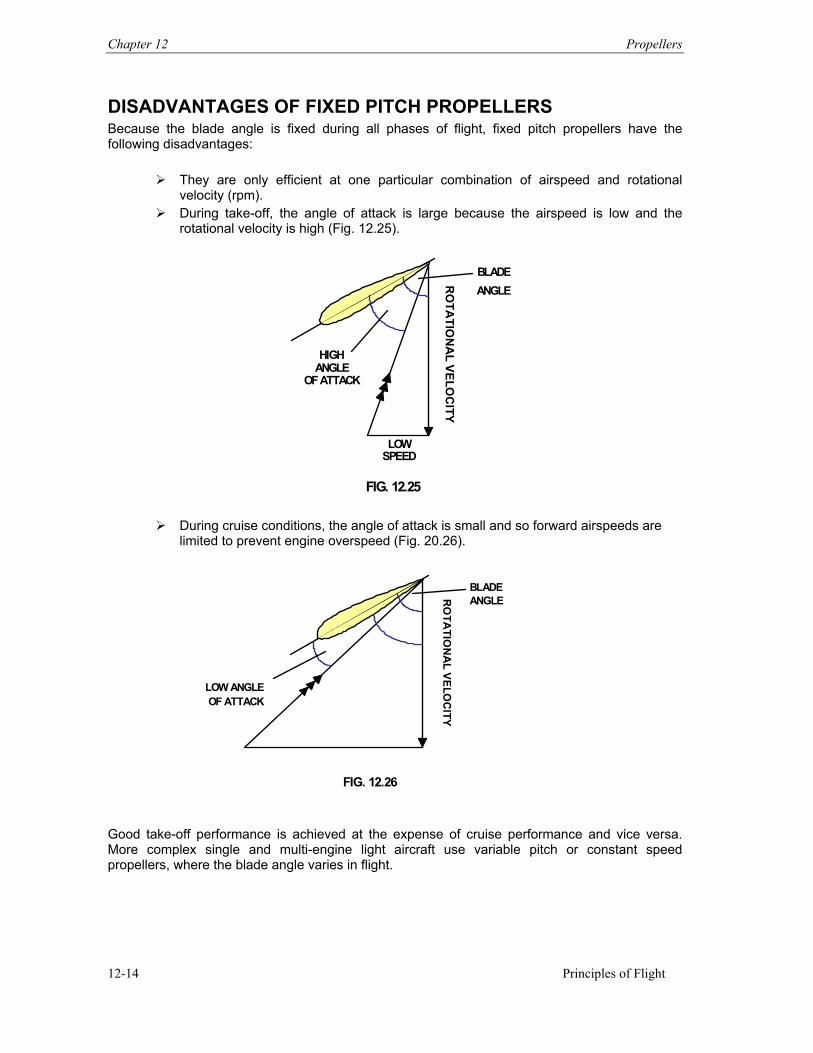
Chapter 12 Propellers
Principles of Flight 12-14
DISADVANTAGES OF FIXED PITCH PROPELLERS Because the blade angle is fixed during all phases of flight, fixed pitch propellers have the following disadvantages:
They are only efficient at one particular combination of airspeed and rotational velocity (rpm).
During take-off, the angle of attack is large because the airspeed is low and the rotational velocity is high (Fig. 12.25).
BLADEANGLE
RO
TATIO
NA
L VELOC
ITY
LOWSPEED
HIGHANGLE
OF ATTACK
FIG. 12.25
During cruise conditions, the angle of attack is small and so forward airspeeds are limited to prevent engine overspeed (Fig. 20.26).
FIG. 12.26
BLADE ANGLER
OTA
TION
AL VELO
CITY
LOW ANGLE OF ATTACK
Good take-off performance is achieved at the expense of cruise performance and vice versa. More complex single and multi-engine light aircraft use variable pitch or constant speed propellers, where the blade angle varies in flight.
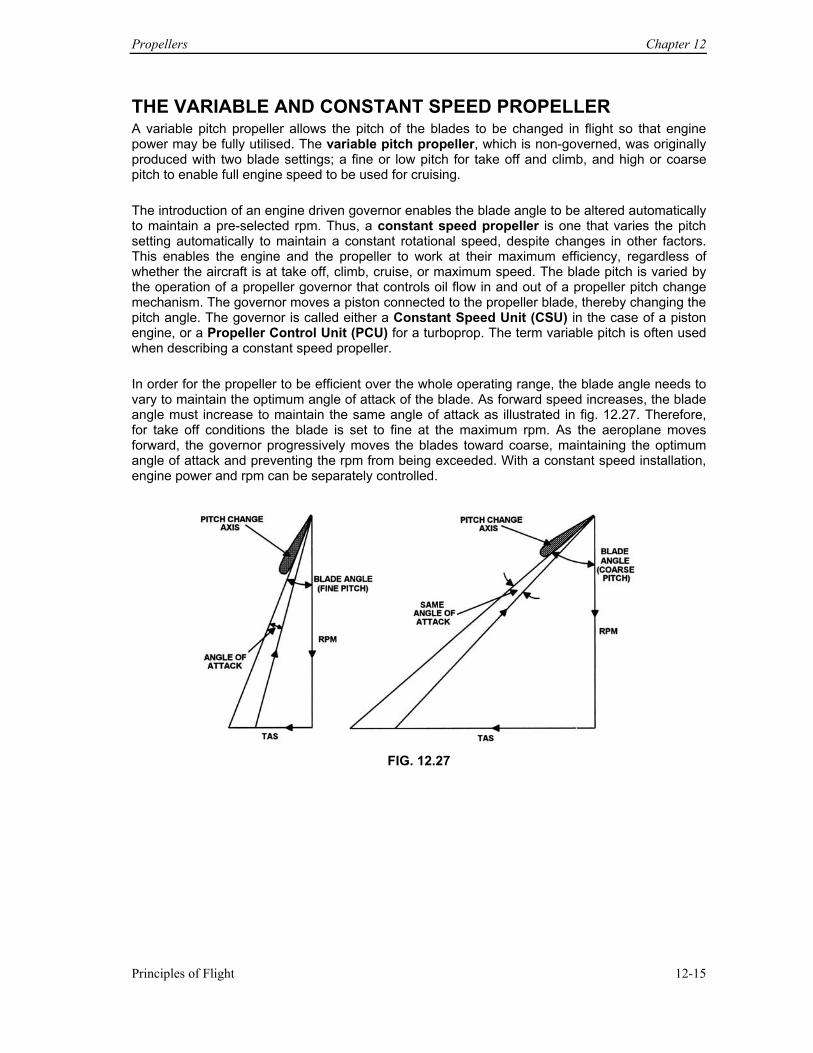
Propellers Chapter 12
Principles of Flight 12-15
THE VARIABLE AND CONSTANT SPEED PROPELLER A variable pitch propeller allows the pitch of the blades to be changed in flight so that engine power may be fully utilised. The variable pitch propeller, which is non-governed, was originally produced with two blade settings; a fine or low pitch for take off and climb, and high or coarse pitch to enable full engine speed to be used for cruising. The introduction of an engine driven governor enables the blade angle to be altered automatically to maintain a pre-selected rpm. Thus, a constant speed propeller is one that varies the pitch setting automatically to maintain a constant rotational speed, despite changes in other factors. This enables the engine and the propeller to work at their maximum efficiency, regardless of whether the aircraft is at take off, climb, cruise, or maximum speed. The blade pitch is varied by the operation of a propeller governor that controls oil flow in and out of a propeller pitch change mechanism. The governor moves a piston connected to the propeller blade, thereby changing the pitch angle. The governor is called either a Constant Speed Unit (CSU) in the case of a piston engine, or a Propeller Control Unit (PCU) for a turboprop. The term variable pitch is often used when describing a constant speed propeller. In order for the propeller to be efficient over the whole operating range, the blade angle needs to vary to maintain the optimum angle of attack of the blade. As forward speed increases, the blade angle must increase to maintain the same angle of attack as illustrated in fig. 12.27. Therefore, for take off conditions the blade is set to fine at the maximum rpm. As the aeroplane moves forward, the governor progressively moves the blades toward coarse, maintaining the optimum angle of attack and preventing the rpm from being exceeded. With a constant speed installation, engine power and rpm can be separately controlled.
FIG. 12.27
Chapter 12 Propellers
Principles of Flight 12-16
POWER ABSORPTION For maximum efficiency, the propeller must be capable of fully absorbing the engine’s maximum power output during its normal operating range as it accelerates air rearward. If the engine power exceeds the propeller torque, the propeller overspeeds, causing both the engine and propeller to become inefficient. A propeller’s capacity for absorbing power depends on the following design features:
Blade size (e.g. diameter, chord, area) Blade section (e.g. camber, thickness) Blade angle-pitch Number of blades
Installing an engine of greater power output allows any of these quantities to be increased, although each has its own limitations. A compromise is normally necessary in the final propeller design. The load on the engine created by the propeller also limits the engine speed. The blade diameter is an important factor since the greater the diameter the greater the tip speeds at a lower rpm, therefore allowing the tips to reach sonic velocity earlier. At sonic velocity, the compressibility effects reduce thrust and increase drag, therefore reducing the propeller efficiency. This effect also results in unacceptably high noise levels. One solution to reduce propeller noise is to obtain lower tip velocities by decreasing the diameter and increasing the number of blades.
PROPELLER SOLIDITY Solidity is the usual method of increasing the power absorption capability of the propeller and is a ratio between the solid part of the propeller disc and the circumference at a specified radius. Normally 70% tip radius is used, since this is the most efficient region of a propeller blade. There are two ways to increase solidity: increase the number of blades or the blade chord. It can be expressed by the following formula:
Solidity = Number of Blades x Chord at 70% Tip Radius Circumference at 70% Tip Radius
There is obviously a limit to the size and number of blades that can be fitted, but newer methods are constantly being developed, like the swept sabre sword shape that increases the solidity whilst safeguarding tip speed.
PROPELLER EFFECTS ON TAKE-OFF On take-off, rotation of a single-engine propeller causes an aircraft to swing to one side, particularly those fitted with a tail-dragger undercarriage. The main causes of this are:
Slipstream effect Torque reaction Gyroscopic effect Asymmetric blade effect
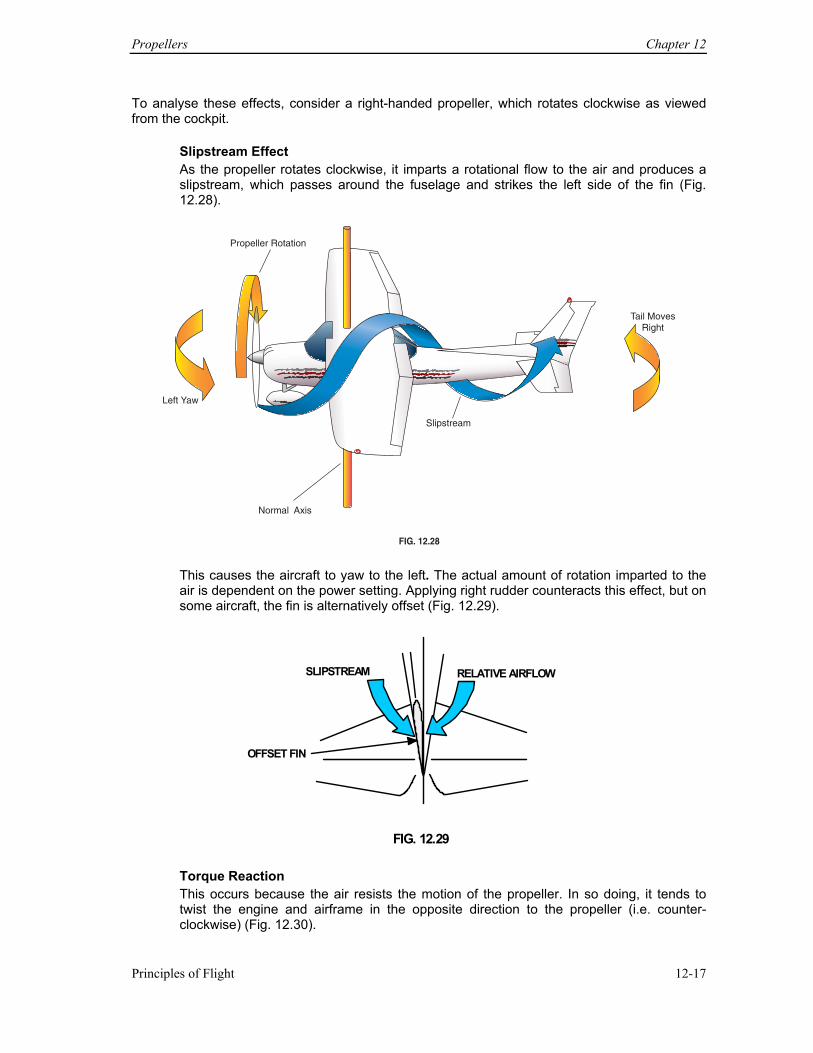
Propellers Chapter 12
Principles of Flight 12-17
To analyse these effects, consider a right-handed propeller, which rotates clockwise as viewed from the cockpit.
Slipstream Effect As the propeller rotates clockwise, it imparts a rotational flow to the air and produces a slipstream, which passes around the fuselage and strikes the left side of the fin (Fig. 12.28).
Propeller Rotation
Left Yaw
Tail MovesRight
Slipstream
Normal Axis
FIG. 12.28
This causes the aircraft to yaw to the left. The actual amount of rotation imparted to the air is dependent on the power setting. Applying right rudder counteracts this effect, but on some aircraft, the fin is alternatively offset (Fig. 12.29).
SLIPSTREAM RELATIVE AIRFLOW
OFFSET FIN
FIG. 12.29
Torque Reaction This occurs because the air resists the motion of the propeller. In so doing, it tends to twist the engine and airframe in the opposite direction to the propeller (i.e. counter-clockwise) (Fig. 12.30).
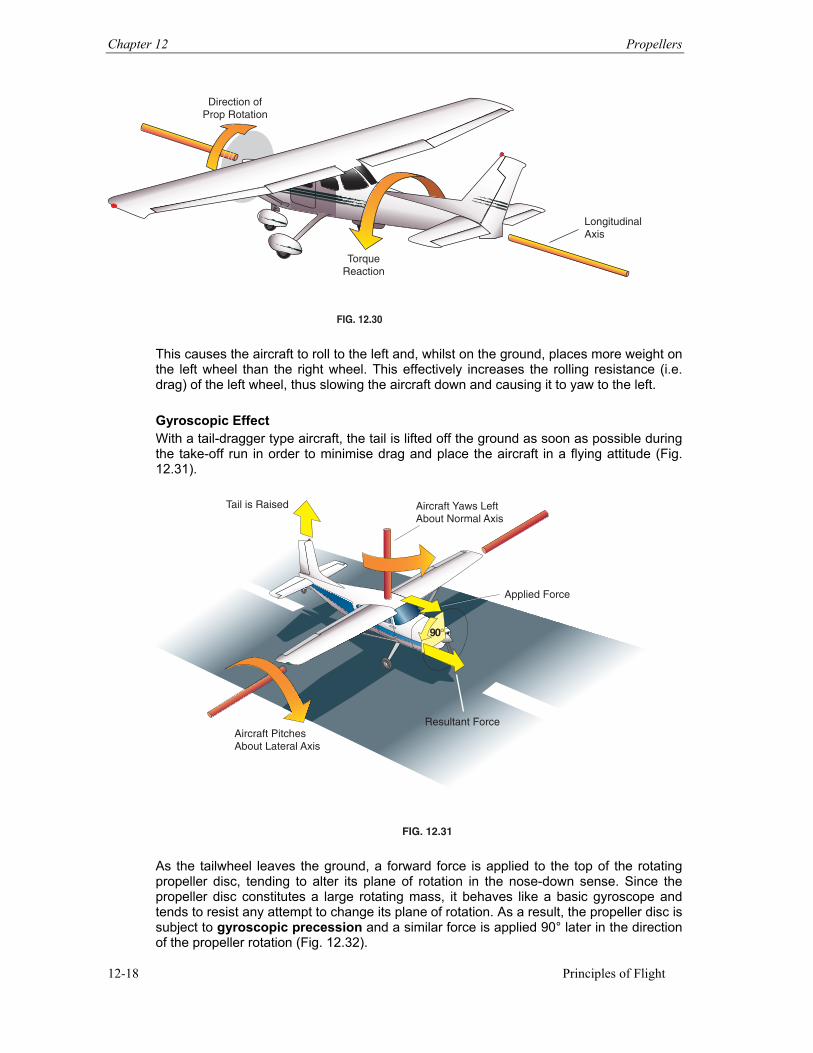
Chapter 12 Propellers
Principles of Flight 12-18
Direction ofProp Rotation
TorqueReaction
LongitudinalAxis
FIG. 12.30
This causes the aircraft to roll to the left and, whilst on the ground, places more weight on the left wheel than the right wheel. This effectively increases the rolling resistance (i.e. drag) of the left wheel, thus slowing the aircraft down and causing it to yaw to the left. Gyroscopic Effect With a tail-dragger type aircraft, the tail is lifted off the ground as soon as possible during the take-off run in order to minimise drag and place the aircraft in a flying attitude (Fig. 12.31).
Tail is Raised
Aircraft Pitches About Lateral Axis
Applied Force
Resultant Force
Aircraft Yaws Left About Normal Axis
90°
FIG. 12.31
As the tailwheel leaves the ground, a forward force is applied to the top of the rotating propeller disc, tending to alter its plane of rotation in the nose-down sense. Since the propeller disc constitutes a large rotating mass, it behaves like a basic gyroscope and tends to resist any attempt to change its plane of rotation. As a result, the propeller disc is subject to gyroscopic precession and a similar force is applied 90° later in the direction of the propeller rotation (Fig. 12.32).
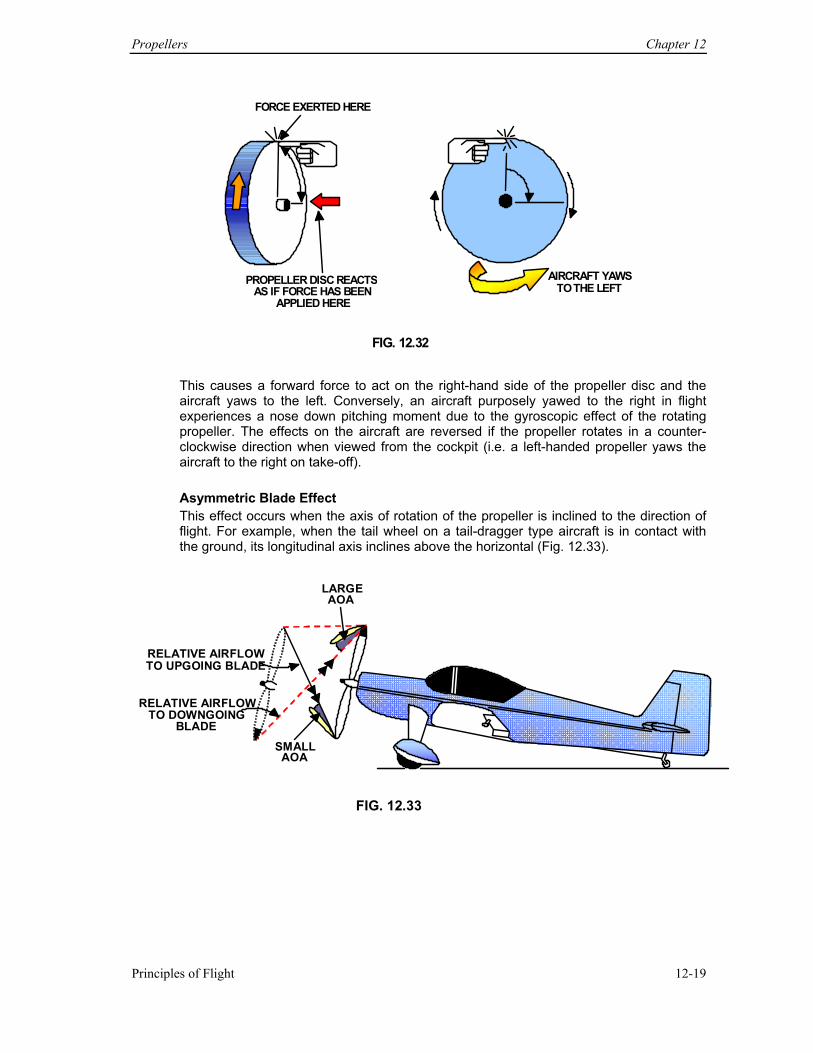
Propellers Chapter 12
Principles of Flight 12-19
FORCE EXERTED HERE
PROPELLER DISC REACTSAS IF FORCE HAS BEEN
APPLIED HERE
AIRCRAFT YAWS TO THE LEFT
FIG. 12.32
This causes a forward force to act on the right-hand side of the propeller disc and the aircraft yaws to the left. Conversely, an aircraft purposely yawed to the right in flight experiences a nose down pitching moment due to the gyroscopic effect of the rotating propeller. The effects on the aircraft are reversed if the propeller rotates in a counter-clockwise direction when viewed from the cockpit (i.e. a left-handed propeller yaws the aircraft to the right on take-off). Asymmetric Blade Effect This effect occurs when the axis of rotation of the propeller is inclined to the direction of flight. For example, when the tail wheel on a tail-dragger type aircraft is in contact with the ground, its longitudinal axis inclines above the horizontal (Fig. 12.33).
LARGEAOA
RELATIVE AIRFLOW TO UPGOING BLADE
RELATIVE AIRFLOW TO DOWNGOING
BLADE SMALL AOA
FIG. 12.33
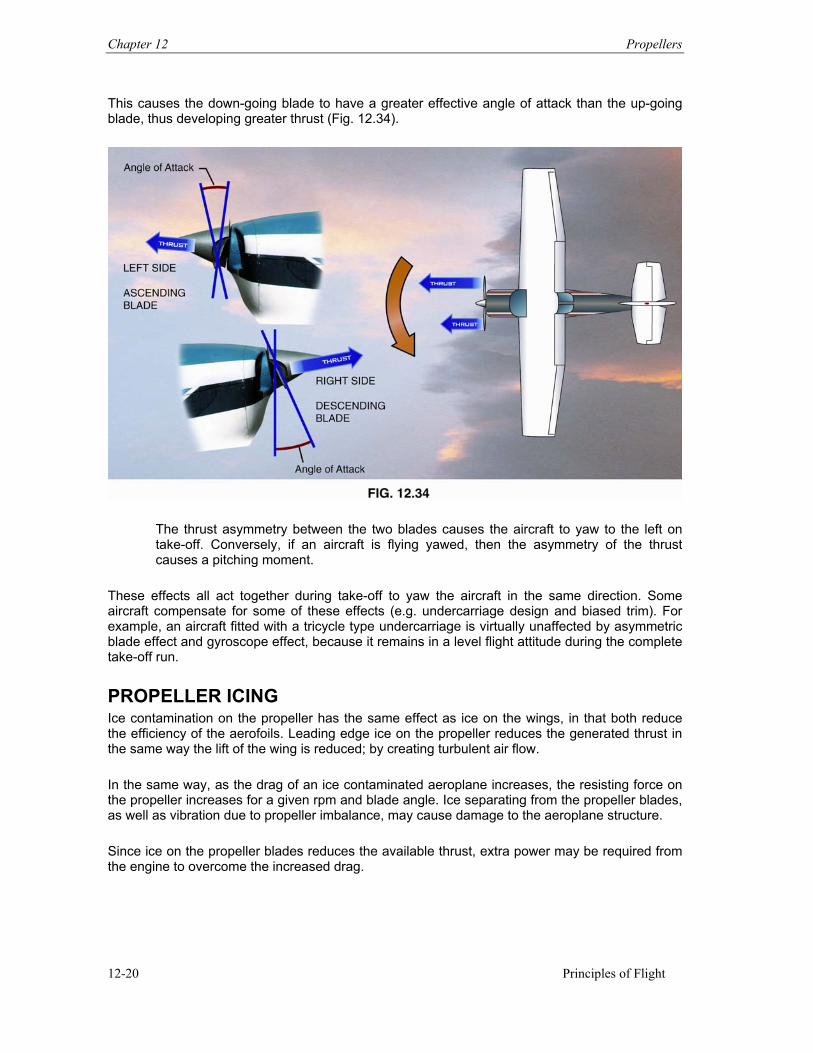
Chapter 12 Propellers
Principles of Flight 12-20
This causes the down-going blade to have a greater effective angle of attack than the up-going blade, thus developing greater thrust (Fig. 12.34).
The thrust asymmetry between the two blades causes the aircraft to yaw to the left on take-off. Conversely, if an aircraft is flying yawed, then the asymmetry of the thrust causes a pitching moment.
These effects all act together during take-off to yaw the aircraft in the same direction. Some aircraft compensate for some of these effects (e.g. undercarriage design and biased trim). For example, an aircraft fitted with a tricycle type undercarriage is virtually unaffected by asymmetric blade effect and gyroscope effect, because it remains in a level flight attitude during the complete take-off run. PROPELLER ICING Ice contamination on the propeller has the same effect as ice on the wings, in that both reduce the efficiency of the aerofoils. Leading edge ice on the propeller reduces the generated thrust in the same way the lift of the wing is reduced; by creating turbulent air flow. In the same way, as the drag of an ice contaminated aeroplane increases, the resisting force on the propeller increases for a given rpm and blade angle. Ice separating from the propeller blades, as well as vibration due to propeller imbalance, may cause damage to the aeroplane structure. Since ice on the propeller blades reduces the available thrust, extra power may be required from the engine to overcome the increased drag.
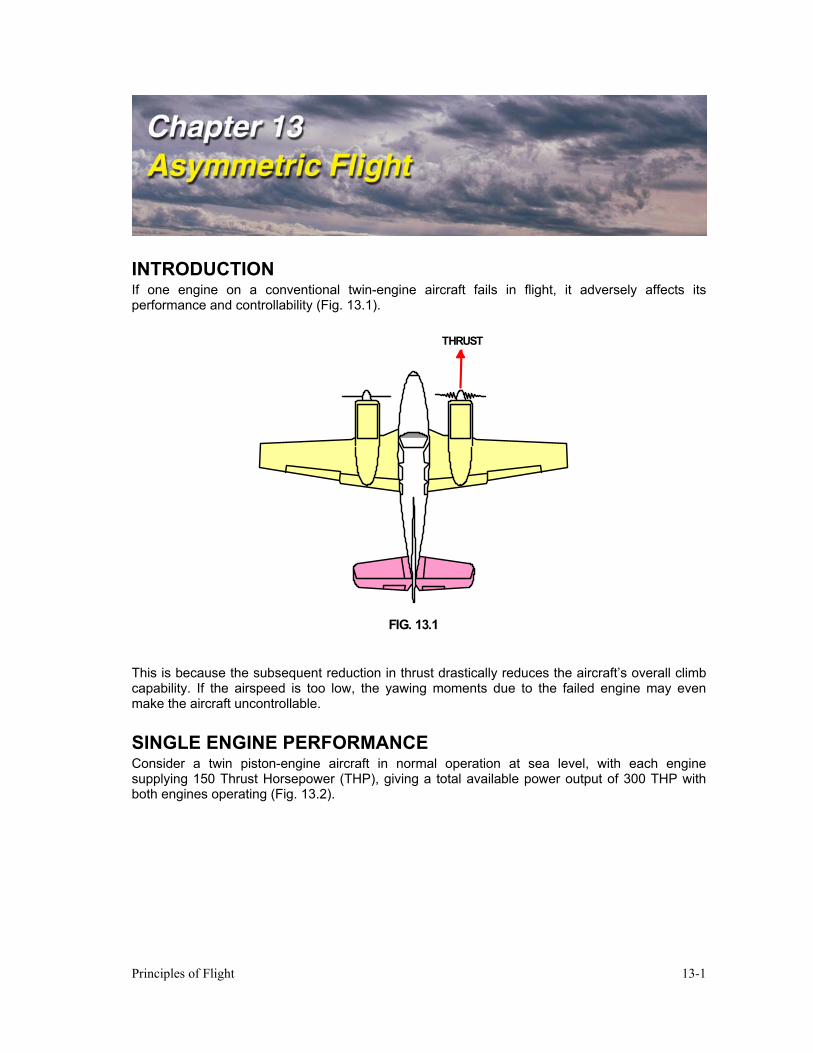
Principles of Flight 13-1
INTRODUCTION If one engine on a conventional twin-engine aircraft fails in flight, it adversely affects its performance and controllability (Fig. 13.1).
THRUST
FIG. 13.1
This is because the subsequent reduction in thrust drastically reduces the aircraft’s overall climb capability. If the airspeed is too low, the yawing moments due to the failed engine may even make the aircraft uncontrollable.
SINGLE ENGINE PERFORMANCE Consider a twin piston-engine aircraft in normal operation at sea level, with each engine supplying 150 Thrust Horsepower (THP), giving a total available power output of 300 THP with both engines operating (Fig. 13.2).
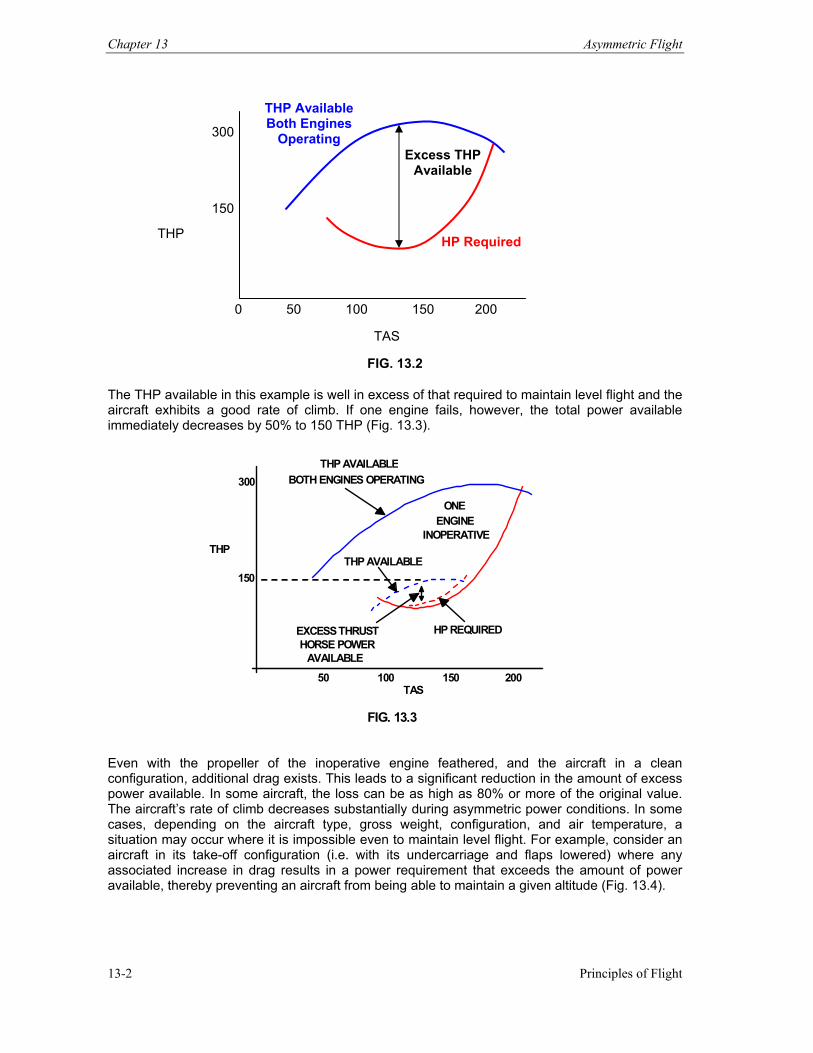
Chapter 13 Asymmetric Flight
Principles of Flight 13-2
FIG. 13.2
The THP available in this example is well in excess of that required to maintain level flight and the aircraft exhibits a good rate of climb. If one engine fails, however, the total power available immediately decreases by 50% to 150 THP (Fig. 13.3).
50 100 150 200
300
150
TAS
THP
THP AVAILABLEBOTH ENGINES OPERATING
EXCESS THRUSTHORSE POWER
AVAILABLE
THP AVAILABLE
HP REQUIRED
ONEENGINE
INOPERATIVE
FIG. 13.3
Even with the propeller of the inoperative engine feathered, and the aircraft in a clean configuration, additional drag exists. This leads to a significant reduction in the amount of excess power available. In some aircraft, the loss can be as high as 80% or more of the original value. The aircraft’s rate of climb decreases substantially during asymmetric power conditions. In some cases, depending on the aircraft type, gross weight, configuration, and air temperature, a situation may occur where it is impossible even to maintain level flight. For example, consider an aircraft in its take-off configuration (i.e. with its undercarriage and flaps lowered) where any associated increase in drag results in a power requirement that exceeds the amount of power available, thereby preventing an aircraft from being able to maintain a given altitude (Fig. 13.4).
TAS
0 50 100 150 200
THP
300
150
HP Required
THP Available Both Engines
Operating Excess THP
Available
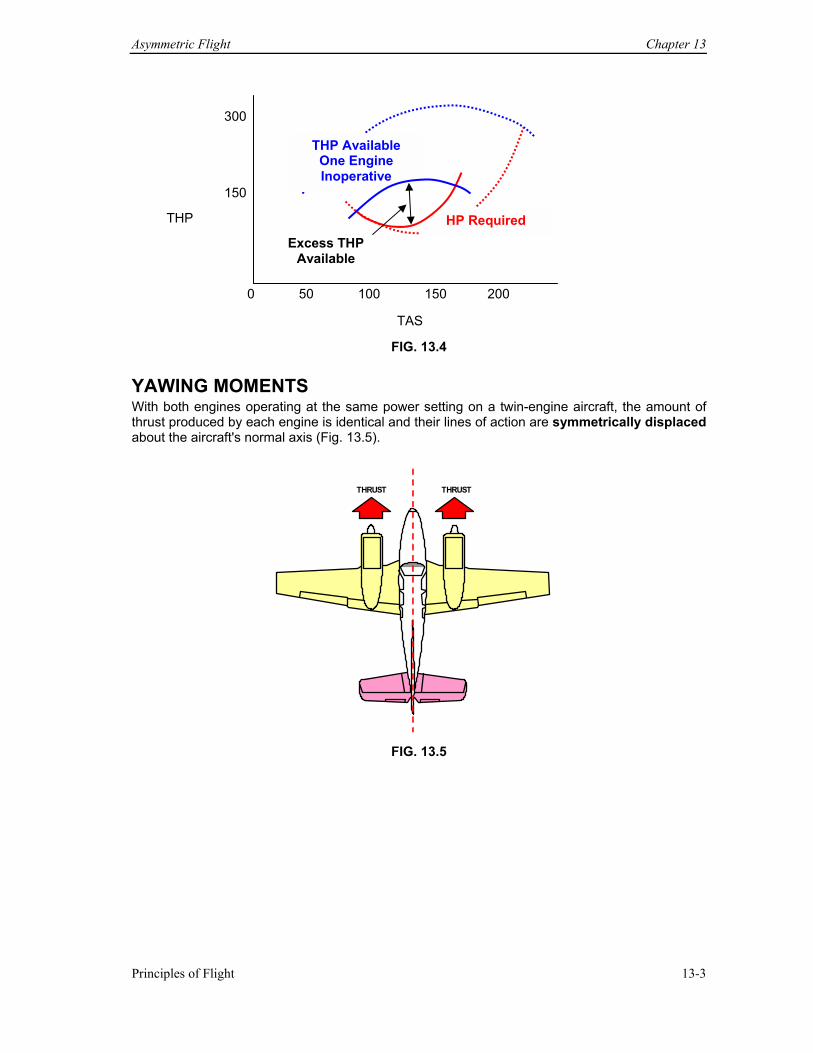
Asymmetric Flight Chapter 13
Principles of Flight 13-3
FIG. 13.4
YAWING MOMENTS With both engines operating at the same power setting on a twin-engine aircraft, the amount of thrust produced by each engine is identical and their lines of action are symmetrically displaced about the aircraft's normal axis (Fig. 13.5).
THRUST THRUST
FIG. 13.5
TAS
0 50 100 150 200
THP
300
150
HP Required Excess THP
Available
THP Available One Engine Inoperative
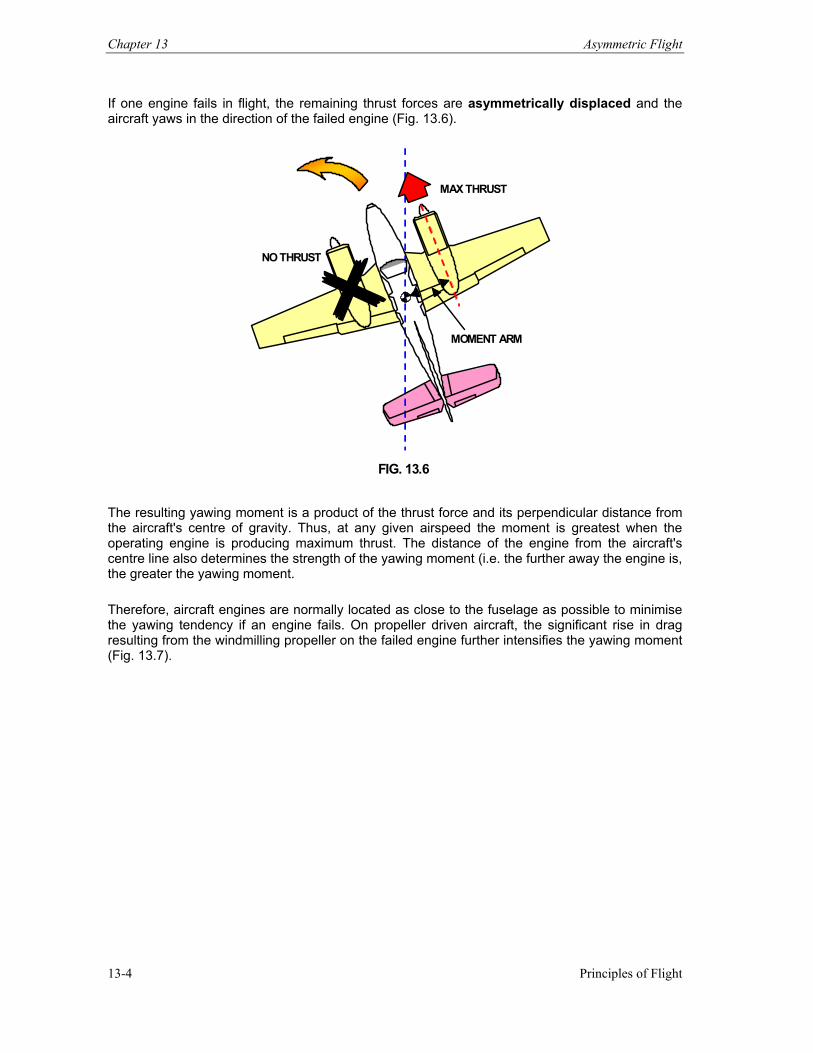
Chapter 13 Asymmetric Flight
Principles of Flight 13-4
If one engine fails in flight, the remaining thrust forces are asymmetrically displaced and the aircraft yaws in the direction of the failed engine (Fig. 13.6).
NO THRUST
MAX THRUST
MOMENT ARM
FIG. 13.6
The resulting yawing moment is a product of the thrust force and its perpendicular distance from the aircraft's centre of gravity. Thus, at any given airspeed the moment is greatest when the operating engine is producing maximum thrust. The distance of the engine from the aircraft's centre line also determines the strength of the yawing moment (i.e. the further away the engine is, the greater the yawing moment. Therefore, aircraft engines are normally located as close to the fuselage as possible to minimise the yawing tendency if an engine fails. On propeller driven aircraft, the significant rise in drag resulting from the windmilling propeller on the failed engine further intensifies the yawing moment (Fig. 13.7).
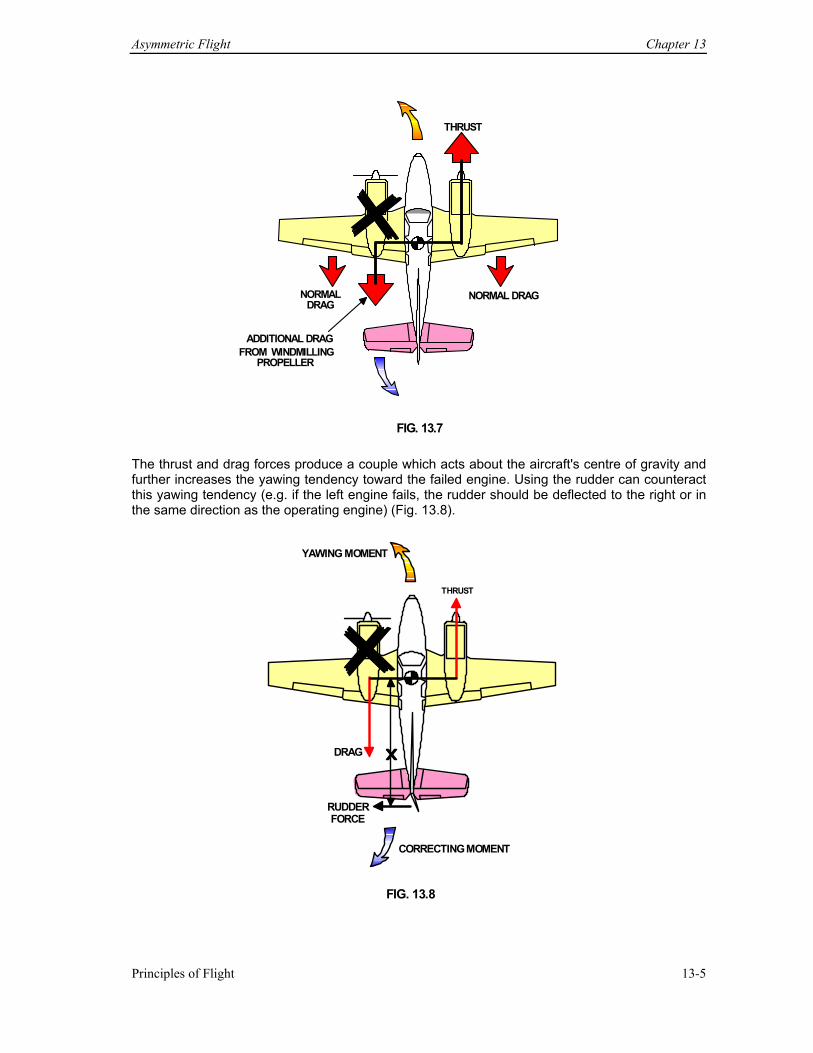
Asymmetric Flight Chapter 13
Principles of Flight 13-5
THRUST
NORMAL DRAG
ADDITIONAL DRAGFROM WINDMILLING
PROPELLER
NORMALDRAG
FIG. 13.7
The thrust and drag forces produce a couple which acts about the aircraft's centre of gravity and further increases the yawing tendency toward the failed engine. Using the rudder can counteract this yawing tendency (e.g. if the left engine fails, the rudder should be deflected to the right or in the same direction as the operating engine) (Fig. 13.8).
THRUST
YAWING MOMENT
DRAG
RUDDERFORCE
CORRECTING MOMENT
FIG. 13.8
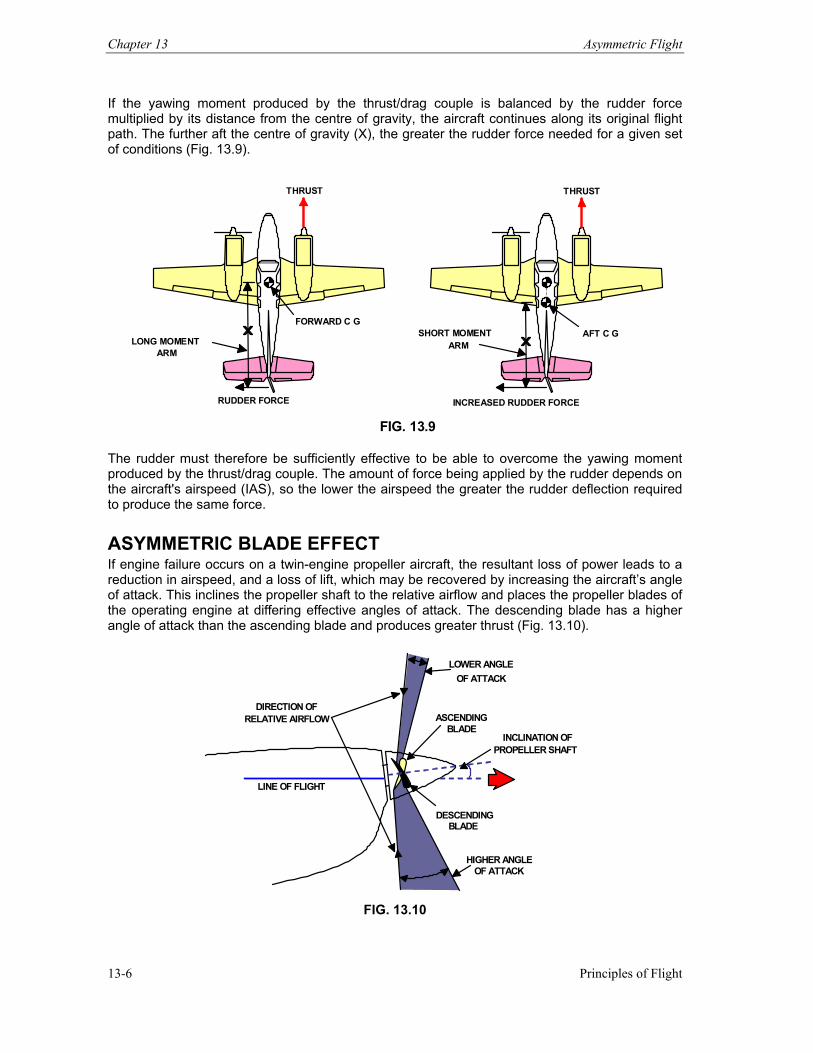
Chapter 13 Asymmetric Flight
Principles of Flight 13-6
If the yawing moment produced by the thrust/drag couple is balanced by the rudder force multiplied by its distance from the centre of gravity, the aircraft continues along its original flight path. The further aft the centre of gravity (X), the greater the rudder force needed for a given set of conditions (Fig. 13.9).
THRUST THRUST
LONG MOMENT SHORT MOMENT
ARM ARM
FORWARD C G AFT C G
RUDDER FORCE INCREASED RUDDER FORCE FIG. 13.9
The rudder must therefore be sufficiently effective to be able to overcome the yawing moment produced by the thrust/drag couple. The amount of force being applied by the rudder depends on the aircraft's airspeed (IAS), so the lower the airspeed the greater the rudder deflection required to produce the same force.
ASYMMETRIC BLADE EFFECT If engine failure occurs on a twin-engine propeller aircraft, the resultant loss of power leads to a reduction in airspeed, and a loss of lift, which may be recovered by increasing the aircraft’s angle of attack. This inclines the propeller shaft to the relative airflow and places the propeller blades of the operating engine at differing effective angles of attack. The descending blade has a higher angle of attack than the ascending blade and produces greater thrust (Fig. 13.10).
DIRECTION OF
RELATIVE AIRFLOW
LINE OF FLIGHT
LOWER ANGLEOF ATTACK
ASCENDING
DESCENDING
HIGHER ANGLEOF ATTACK
INCLINATION OF PROPELLER SHAFT
BLADE
BLADE
FIG. 13.10
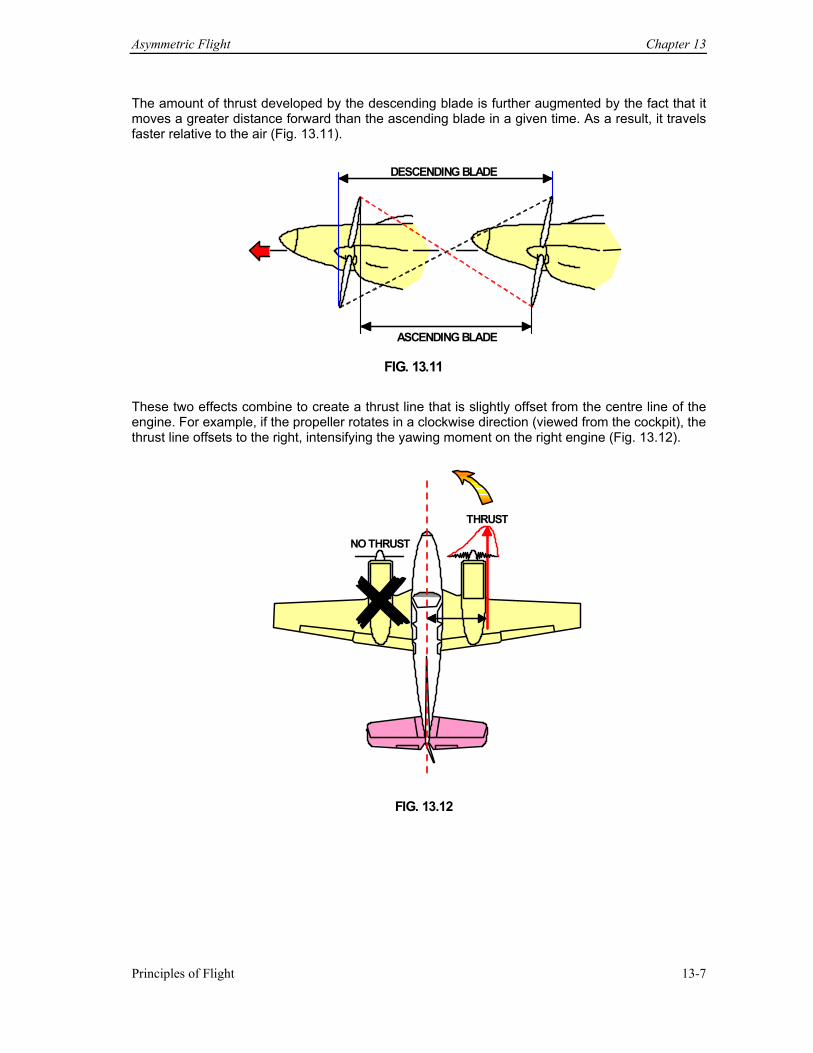
Asymmetric Flight Chapter 13
Principles of Flight 13-7
The amount of thrust developed by the descending blade is further augmented by the fact that it moves a greater distance forward than the ascending blade in a given time. As a result, it travels faster relative to the air (Fig. 13.11).
DESCENDING BLADE
ASCENDING BLADE
FIG. 13.11
These two effects combine to create a thrust line that is slightly offset from the centre line of the engine. For example, if the propeller rotates in a clockwise direction (viewed from the cockpit), the thrust line offsets to the right, intensifying the yawing moment on the right engine (Fig. 13.12).
NO THRUST
THRUST
FIG. 13.12
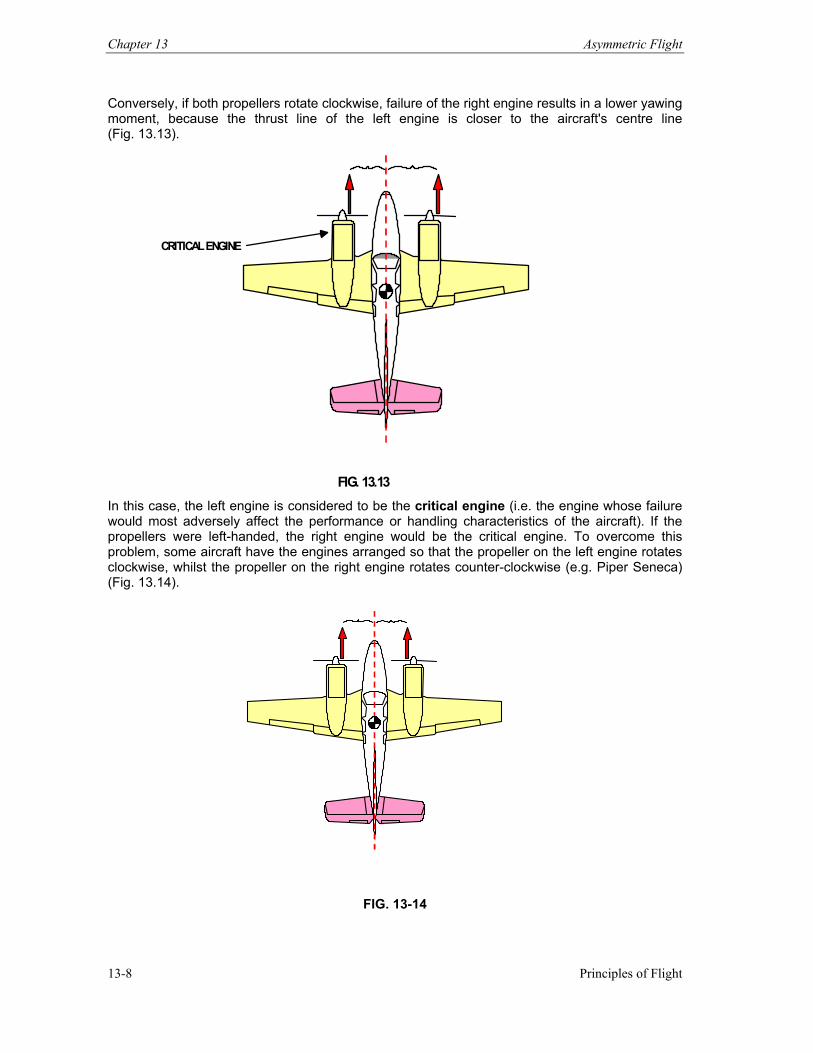
Chapter 13 Asymmetric Flight
Principles of Flight 13-8
Conversely, if both propellers rotate clockwise, failure of the right engine results in a lower yawing moment, because the thrust line of the left engine is closer to the aircraft's centre line (Fig. 13.13).
FIG. 13.13
CRITICAL ENGINE
In this case, the left engine is considered to be the critical engine (i.e. the engine whose failure would most adversely affect the performance or handling characteristics of the aircraft). If the propellers were left-handed, the right engine would be the critical engine. To overcome this problem, some aircraft have the engines arranged so that the propeller on the left engine rotates clockwise, whilst the propeller on the right engine rotates counter-clockwise (e.g. Piper Seneca) (Fig. 13.14).
FIG. 13-14
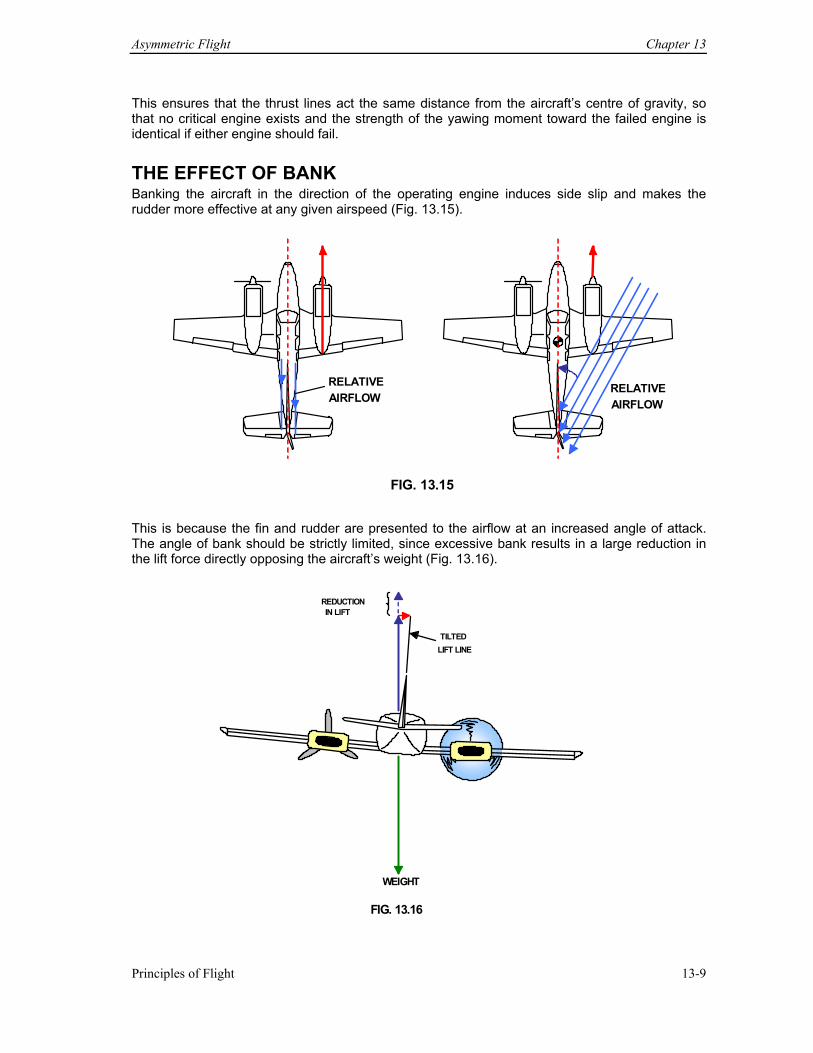
Asymmetric Flight Chapter 13
Principles of Flight 13-9
This ensures that the thrust lines act the same distance from the aircraft’s centre of gravity, so that no critical engine exists and the strength of the yawing moment toward the failed engine is identical if either engine should fail.
THE EFFECT OF BANK Banking the aircraft in the direction of the operating engine induces side slip and makes the rudder more effective at any given airspeed (Fig. 13.15).
RELATIVEAIRFLOW
RELATIVEAIRFLOW
FIG. 13.15
This is because the fin and rudder are presented to the airflow at an increased angle of attack. The angle of bank should be strictly limited, since excessive bank results in a large reduction in the lift force directly opposing the aircraft’s weight (Fig. 13.16).
TILTED
LIFT LINE
REDUCTION IN LIFT
WEIGHT
FIG. 13.16
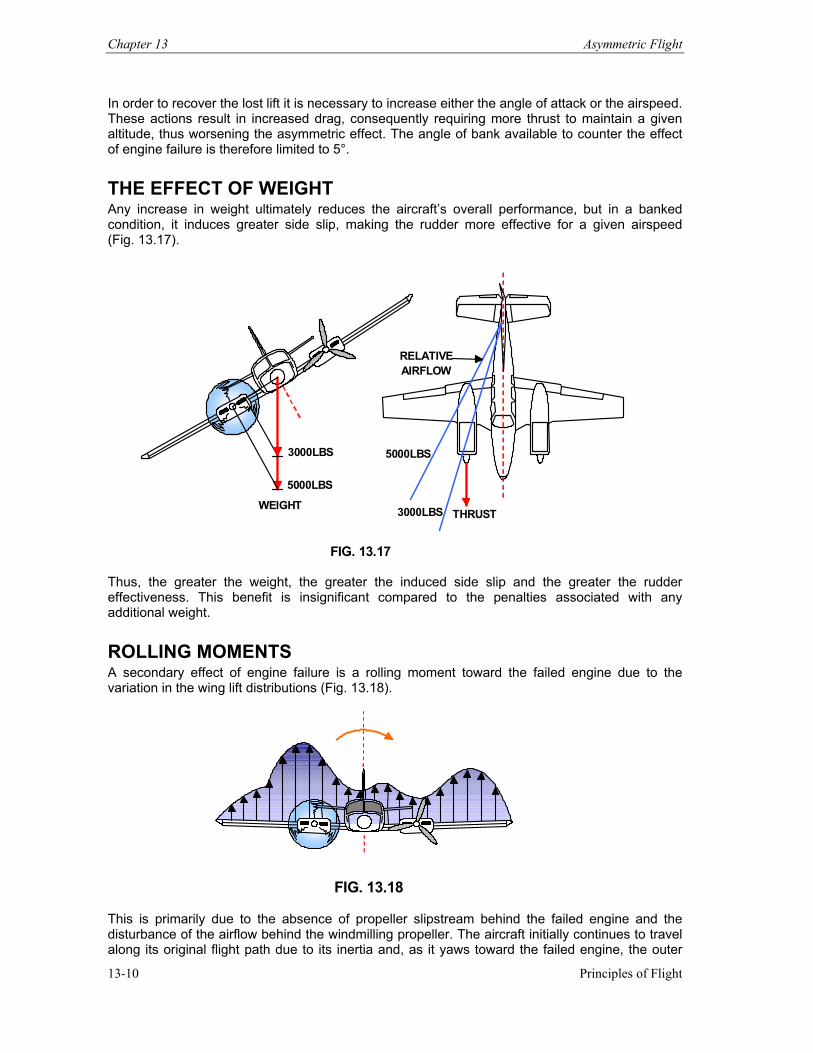
Chapter 13 Asymmetric Flight
Principles of Flight 13-10
In order to recover the lost lift it is necessary to increase either the angle of attack or the airspeed. These actions result in increased drag, consequently requiring more thrust to maintain a given altitude, thus worsening the asymmetric effect. The angle of bank available to counter the effect of engine failure is therefore limited to 5°.
THE EFFECT OF WEIGHT Any increase in weight ultimately reduces the aircraft’s overall performance, but in a banked condition, it induces greater side slip, making the rudder more effective for a given airspeed (Fig. 13.17).
THRUST3000LBS
5000LBS
RELATIVEAIRFLOW
3000LBS
5000LBS
WEIGHT
FIG. 13.17
Thus, the greater the weight, the greater the induced side slip and the greater the rudder effectiveness. This benefit is insignificant compared to the penalties associated with any additional weight.
ROLLING MOMENTS A secondary effect of engine failure is a rolling moment toward the failed engine due to the variation in the wing lift distributions (Fig. 13.18).
FIG. 13.18
This is primarily due to the absence of propeller slipstream behind the failed engine and the disturbance of the airflow behind the windmilling propeller. The aircraft initially continues to travel along its original flight path due to its inertia and, as it yaws toward the failed engine, the outer
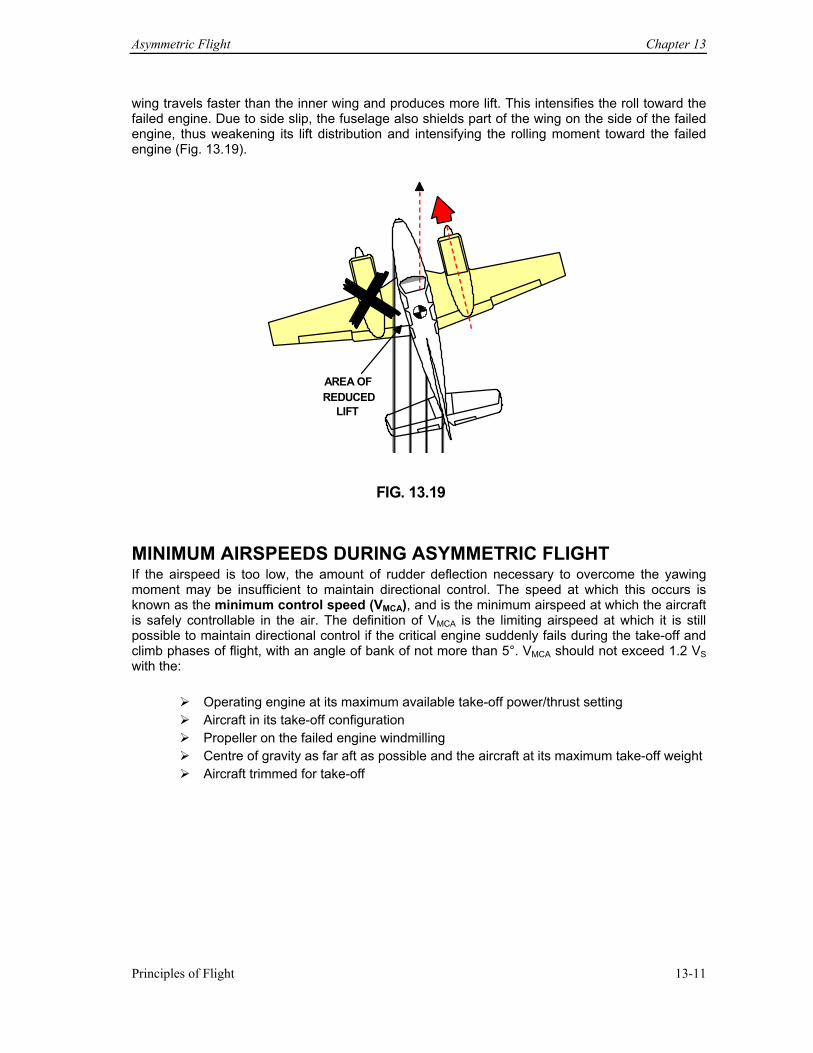
Asymmetric Flight Chapter 13
Principles of Flight 13-11
wing travels faster than the inner wing and produces more lift. This intensifies the roll toward the failed engine. Due to side slip, the fuselage also shields part of the wing on the side of the failed engine, thus weakening its lift distribution and intensifying the rolling moment toward the failed engine (Fig. 13.19).
AREA OF REDUCED
LIFT
FIG. 13.19
MINIMUM AIRSPEEDS DURING ASYMMETRIC FLIGHT If the airspeed is too low, the amount of rudder deflection necessary to overcome the yawing moment may be insufficient to maintain directional control. The speed at which this occurs is known as the minimum control speed (VMCA), and is the minimum airspeed at which the aircraft is safely controllable in the air. The definition of VMCA is the limiting airspeed at which it is still possible to maintain directional control if the critical engine suddenly fails during the take-off and climb phases of flight, with an angle of bank of not more than 5°. VMCA should not exceed 1.2 VS with the:
Operating engine at its maximum available take-off power/thrust setting Aircraft in its take-off configuration Propeller on the failed engine windmilling Centre of gravity as far aft as possible and the aircraft at its maximum take-off weight Aircraft trimmed for take-off
Chapter 13 Asymmetric Flight
Principles of Flight 13-12
If one engine fails when the aircraft is operating close to VMCA, it is vital to reduce the drag as soon as possible by feathering the propeller on the failed engine. If the critical engine fails during the take-off phase, maintain the airspeed above VMCG, which is the minimum control speed with the wheels still on the ground. The definition of VMCG is the minimum control speed on the ground during the take-off run when it is still possible to maintain directional control using the rudder only. VMCG must be established with the:
Aircraft in its most critical take-off configuration Operating engine at it maximum available power/thrust setting Centre of gravity as far aft as possible and the aircraft at its maximum take-off weight Aircraft trimmed for take-off
If the critical engine fails during the approach and landing phase of flight, maintain the airspeed above VMCL, which is the minimum control speed during the approach and landing. The definition of VMCL is the minimum control speed at which it is possible to maintain directional control in the landing configuration with an angle of bank of not more than 5°. VMCL must be established with the:
Aircraft in its most critical landing configuration and all engines operating Centre of gravity as far aft as possible and the aircraft at its maximum landing weight Propeller on the failed engine (propeller aircraft only) in the position it achieves
without pilot action, whilst maintaining a 3° glide slope Go-around power/thrust setting on the operating engine
VMCL is a fixed value for a given aircraft, but VMCA and VMCG both decrease with increasing altitude. TURNING FLIGHT The main factors which affect an aircraft turning under asymmetric power conditions are airspeed and the direction of the turn relative to the failed engine. For example, consider an aircraft where the left engine has failed and the yawing and rolling moments have been stabilised using right rudder. To initiate and hold a balanced left turn, the amount of right rudder needed to counteract the yaw has to be reduced, whilst a balanced right turn requires additional right rudder under the same conditions. If the airspeed is too low, turning toward the operating engine may reduce the control forces to a critical level. At low indicated airspeeds, it is therefore necessary to limit turns to only small angles of bank, since rudder deflection may become insufficient to maintain a balanced turn.
RECOGNITION OF A FAILED ENGINE In steady level flight, an engine failure on a twin-engine aircraft causes roll and yaw in the direction of the failed engine, unless corrective action is taken. Similarly, if an engine fails during a climbing or level turn, the aircraft tends to yaw toward the failed engine. Any engine failure in these conditions is easily recognisable and the aircraft remains controllable provided the airspeed remains above VMCA. Under low power conditions and relatively high airspeeds (e.g. during the descent) the yaw and roll forces resulting from an engine failure may be relatively small. An engine failure under these conditions is not easily recognisable.
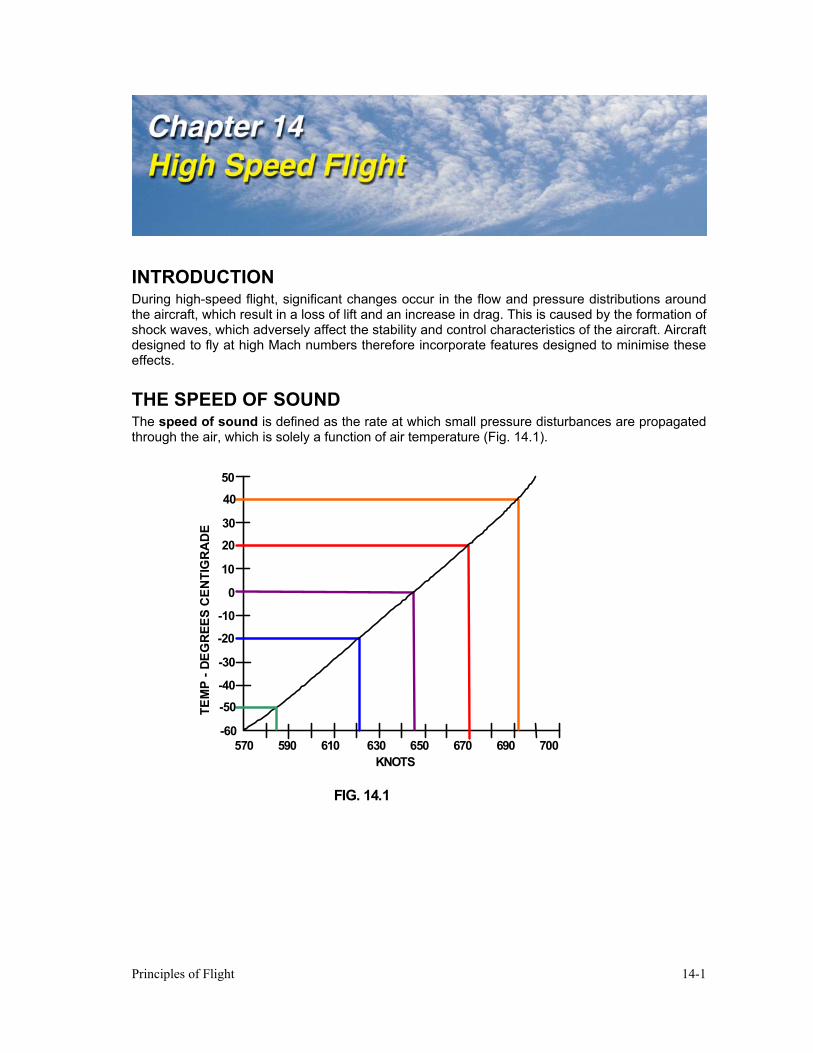
Principles of Flight 14-1
INTRODUCTION During high-speed flight, significant changes occur in the flow and pressure distributions around the aircraft, which result in a loss of lift and an increase in drag. This is caused by the formation of shock waves, which adversely affect the stability and control characteristics of the aircraft. Aircraft designed to fly at high Mach numbers therefore incorporate features designed to minimise these effects.
THE SPEED OF SOUND The speed of sound is defined as the rate at which small pressure disturbances are propagated through the air, which is solely a function of air temperature (Fig. 14.1).
50 40 30 20 10 0
-10 -20 -30 -40 -50 -60
570 590 610 630 650 670 690 700KNOTS
TEM
P - D
EGR
EES
CEN
TIG
RA
DE
FIG. 14.1
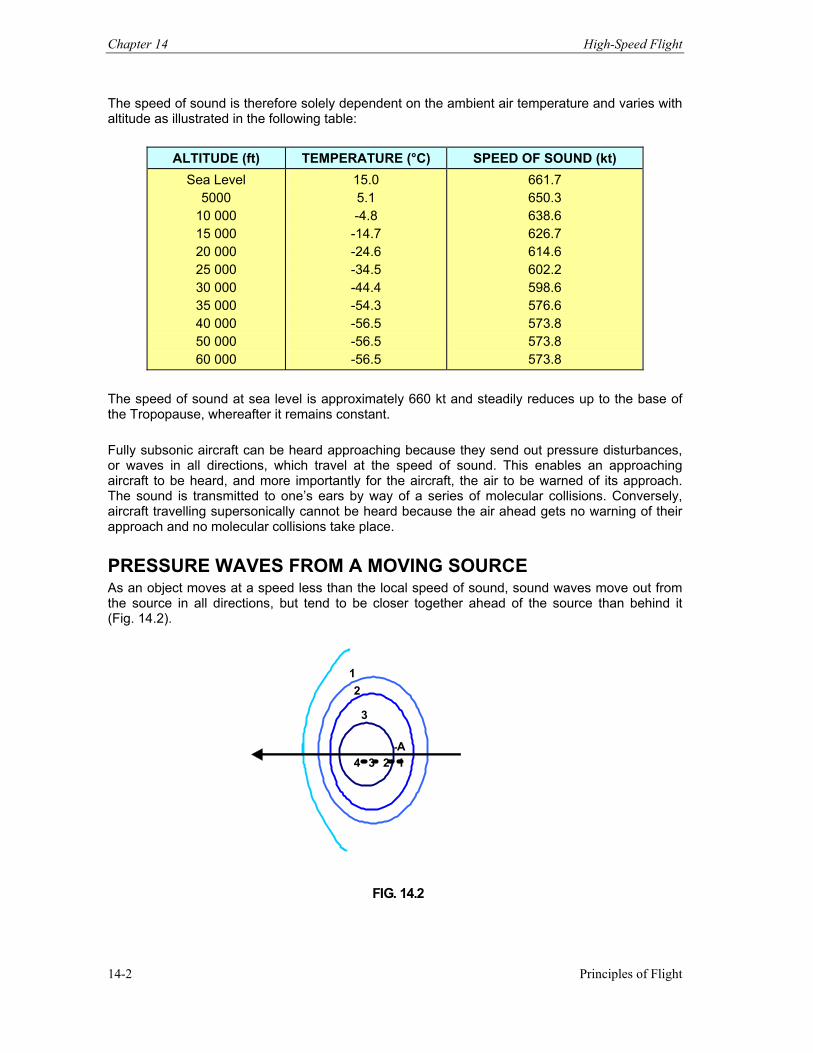
Chapter 14 High-Speed Flight
Principles of Flight 14-2
The speed of sound is therefore solely dependent on the ambient air temperature and varies with altitude as illustrated in the following table:
ALTITUDE (ft) TEMPERATURE (°C) SPEED OF SOUND (kt) Sea Level
5000 10 000 15 000 20 000 25 000 30 000 35 000 40 000 50 000 60 000
15.0 5.1 -4.8
-14.7 -24.6 -34.5 -44.4 -54.3 -56.5 -56.5 -56.5
661.7 650.3 638.6 626.7 614.6 602.2 598.6 576.6 573.8 573.8 573.8
The speed of sound at sea level is approximately 660 kt and steadily reduces up to the base of the Tropopause, whereafter it remains constant. Fully subsonic aircraft can be heard approaching because they send out pressure disturbances, or waves in all directions, which travel at the speed of sound. This enables an approaching aircraft to be heard, and more importantly for the aircraft, the air to be warned of its approach. The sound is transmitted to one’s ears by way of a series of molecular collisions. Conversely, aircraft travelling supersonically cannot be heard because the air ahead gets no warning of their approach and no molecular collisions take place.
PRESSURE WAVES FROM A MOVING SOURCE As an object moves at a speed less than the local speed of sound, sound waves move out from the source in all directions, but tend to be closer together ahead of the source than behind it (Fig. 14.2).
FIG. 14.2
2
3
-A
1
4 3 2 1
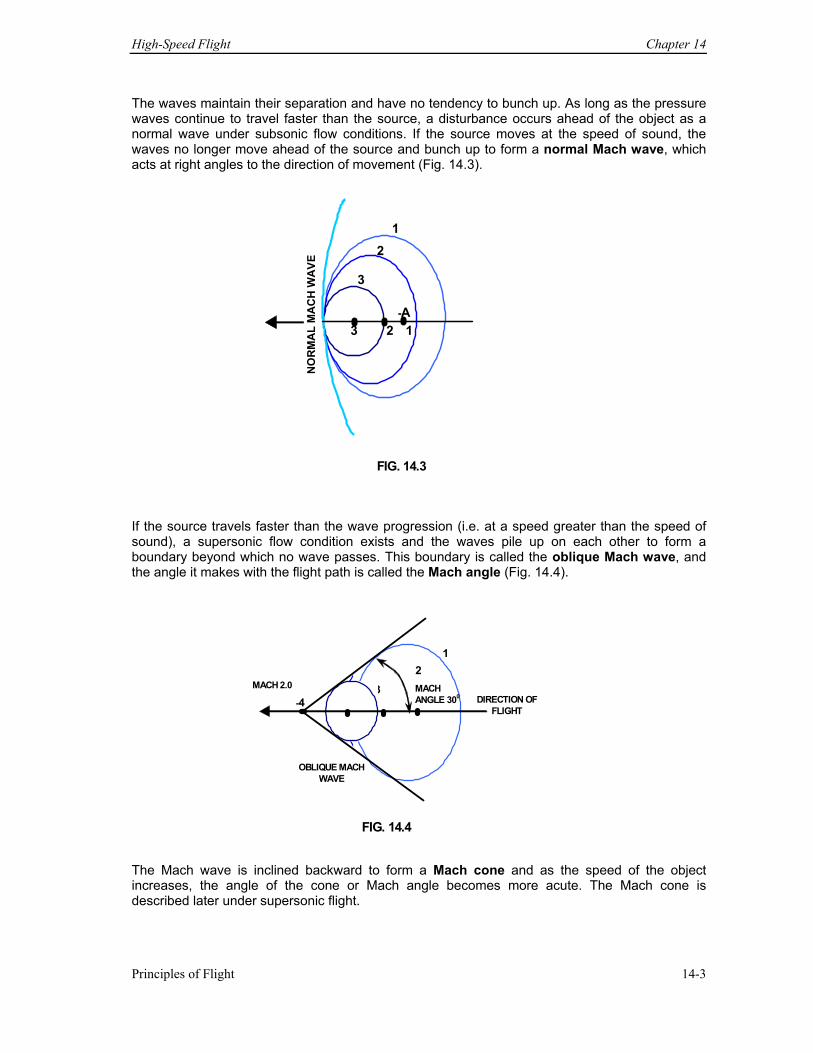
High-Speed Flight Chapter 14
Principles of Flight 14-3
The waves maintain their separation and have no tendency to bunch up. As long as the pressure waves continue to travel faster than the source, a disturbance occurs ahead of the object as a normal wave under subsonic flow conditions. If the source moves at the speed of sound, the waves no longer move ahead of the source and bunch up to form a normal Mach wave, which acts at right angles to the direction of movement (Fig. 14.3).
FIG. 14.3
2
3
-A
1
3 2 1 N
OR
MA
L M
AC
H W
AVE
If the source travels faster than the wave progression (i.e. at a speed greater than the speed of sound), a supersonic flow condition exists and the waves pile up on each other to form a boundary beyond which no wave passes. This boundary is called the oblique Mach wave, and the angle it makes with the flight path is called the Mach angle (Fig. 14.4).
MACH 2.0
FIG. 14.4
2
3 -4
1
OBLIQUE MACH WAVE
DIRECTION OF FLIGHT
MACH ANGLE 300
The Mach wave is inclined backward to form a Mach cone and as the speed of the object increases, the angle of the cone or Mach angle becomes more acute. The Mach cone is described later under supersonic flight.
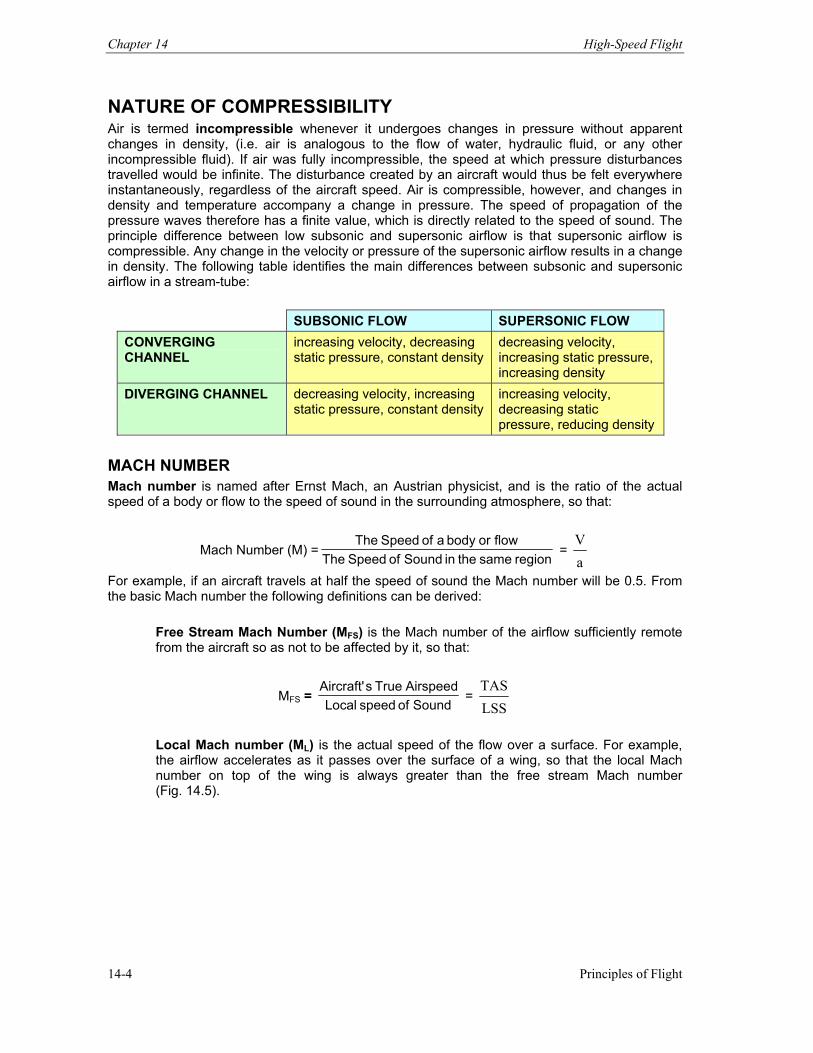
Chapter 14 High-Speed Flight
Principles of Flight 14-4
NATURE OF COMPRESSIBILITY Air is termed incompressible whenever it undergoes changes in pressure without apparent changes in density, (i.e. air is analogous to the flow of water, hydraulic fluid, or any other incompressible fluid). If air was fully incompressible, the speed at which pressure disturbances travelled would be infinite. The disturbance created by an aircraft would thus be felt everywhere instantaneously, regardless of the aircraft speed. Air is compressible, however, and changes in density and temperature accompany a change in pressure. The speed of propagation of the pressure waves therefore has a finite value, which is directly related to the speed of sound. The principle difference between low subsonic and supersonic airflow is that supersonic airflow is compressible. Any change in the velocity or pressure of the supersonic airflow results in a change in density. The following table identifies the main differences between subsonic and supersonic airflow in a stream-tube:
SUBSONIC FLOW SUPERSONIC FLOW CONVERGING CHANNEL
increasing velocity, decreasing static pressure, constant density
decreasing velocity, increasing static pressure, increasing density
DIVERGING CHANNEL decreasing velocity, increasing static pressure, constant density
increasing velocity, decreasing static pressure, reducing density
MACH NUMBER Mach number is named after Ernst Mach, an Austrian physicist, and is the ratio of the actual speed of a body or flow to the speed of sound in the surrounding atmosphere, so that:
Mach Number (M) =region same the in Sound of Speed The
flow orbody a of Speed The =
aV
For example, if an aircraft travels at half the speed of sound the Mach number will be 0.5. From the basic Mach number the following definitions can be derived:
Free Stream Mach Number (MFS) is the Mach number of the airflow sufficiently remote from the aircraft so as not to be affected by it, so that:
MFS = Sound of speed Local
AirspeedTrue sAircraft' =
LSSTAS
Local Mach number (ML) is the actual speed of the flow over a surface. For example, the airflow accelerates as it passes over the surface of a wing, so that the local Mach number on top of the wing is always greater than the free stream Mach number (Fig. 14.5).
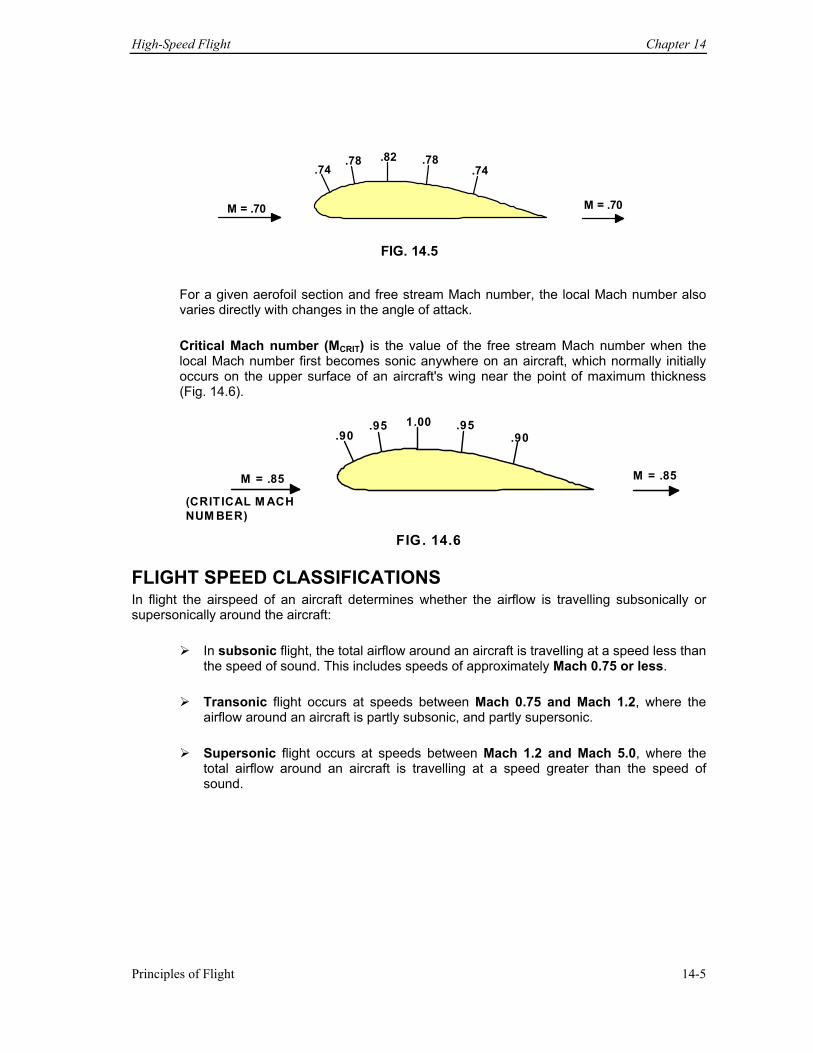
High-Speed Flight Chapter 14
Principles of Flight 14-5
.74.78 .82 .78
.74
M = .70 M = .70
FIG. 14.5
For a given aerofoil section and free stream Mach number, the local Mach number also varies directly with changes in the angle of attack.
Critical Mach number (MCRIT) is the value of the free stream Mach number when the local Mach number first becomes sonic anywhere on an aircraft, which normally initially occurs on the upper surface of an aircraft's wing near the point of maximum thickness (Fig. 14.6).
.90 .90.95 .951.00
M = .85 M = .85
(CRITICAL M ACH NUM BER)
FIG. 14.6
FLIGHT SPEED CLASSIFICATIONS In flight the airspeed of an aircraft determines whether the airflow is travelling subsonically or supersonically around the aircraft:
In subsonic flight, the total airflow around an aircraft is travelling at a speed less than the speed of sound. This includes speeds of approximately Mach 0.75 or less.
Transonic flight occurs at speeds between Mach 0.75 and Mach 1.2, where the
airflow around an aircraft is partly subsonic, and partly supersonic.
Supersonic flight occurs at speeds between Mach 1.2 and Mach 5.0, where the total airflow around an aircraft is travelling at a speed greater than the speed of sound.
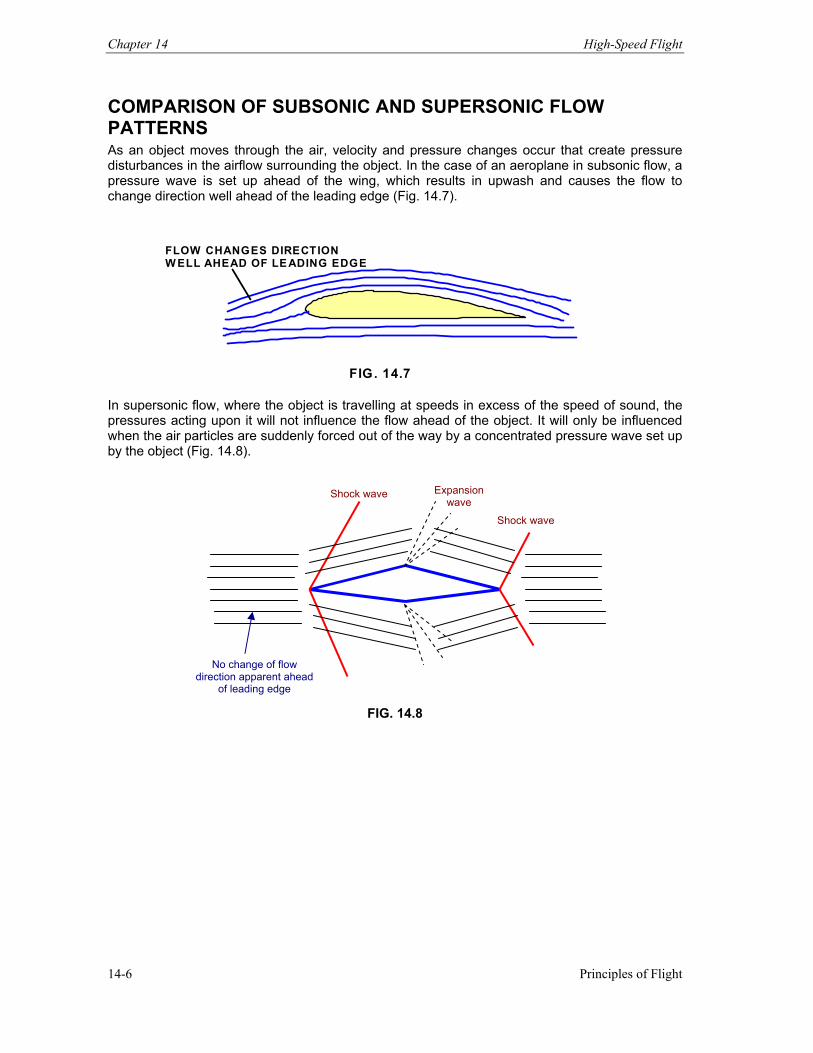
Chapter 14 High-Speed Flight
Principles of Flight 14-6
COMPARISON OF SUBSONIC AND SUPERSONIC FLOW PATTERNS As an object moves through the air, velocity and pressure changes occur that create pressure disturbances in the airflow surrounding the object. In the case of an aeroplane in subsonic flow, a pressure wave is set up ahead of the wing, which results in upwash and causes the flow to change direction well ahead of the leading edge (Fig. 14.7).
FLOW CHANGES DIRECTION W ELL AHEAD OF LE ADING EDGE
FIG. 14.7
In supersonic flow, where the object is travelling at speeds in excess of the speed of sound, the pressures acting upon it will not influence the flow ahead of the object. It will only be influenced when the air particles are suddenly forced out of the way by a concentrated pressure wave set up by the object (Fig. 14.8).
FIG. 14.8
Shock wave
Shock wave
Expansion wave
No change of flow direction apparent ahead
of leading edge
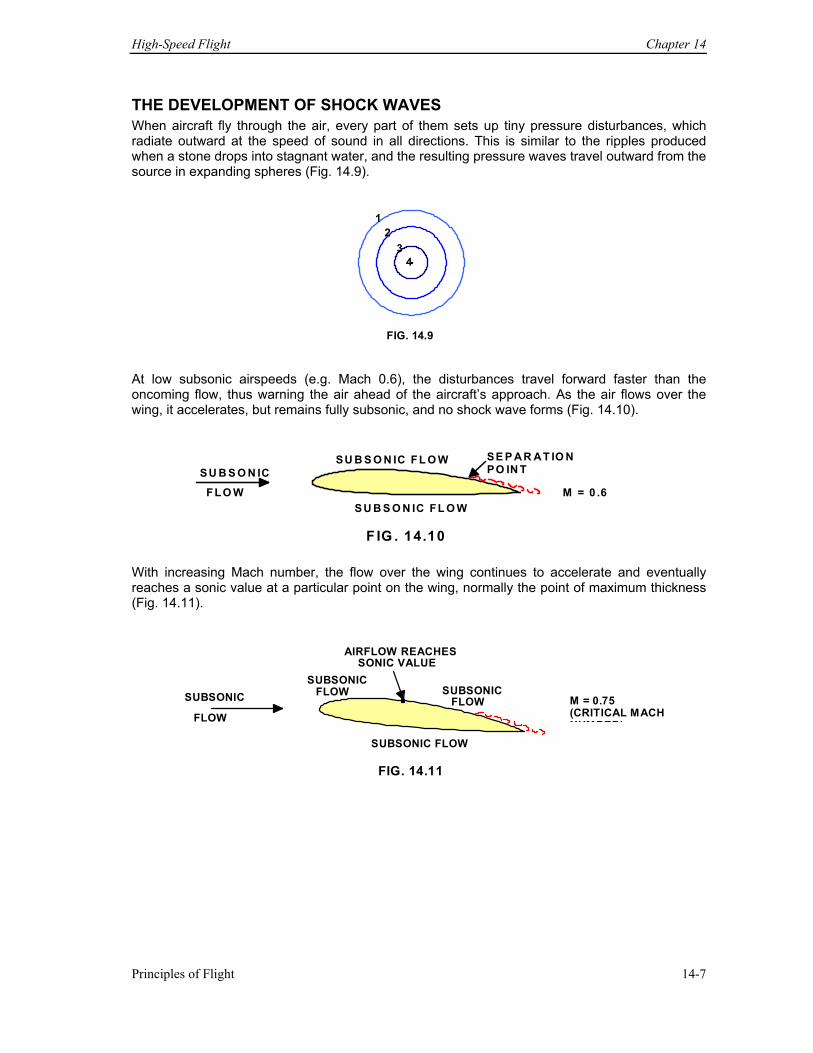
High-Speed Flight Chapter 14
Principles of Flight 14-7
THE DEVELOPMENT OF SHOCK WAVES When aircraft fly through the air, every part of them sets up tiny pressure disturbances, which radiate outward at the speed of sound in all directions. This is similar to the ripples produced when a stone drops into stagnant water, and the resulting pressure waves travel outward from the source in expanding spheres (Fig. 14.9).
12
34
FIG. 14.9
At low subsonic airspeeds (e.g. Mach 0.6), the disturbances travel forward faster than the oncoming flow, thus warning the air ahead of the aircraft’s approach. As the air flows over the wing, it accelerates, but remains fully subsonic, and no shock wave forms (Fig. 14.10).
F IG . 14.10
SU B S O N IC FLO W
SU B S O N IC FL O W SE P A R AT IO N PO IN T
SU B S O N IC FL O WM = 0 .6
With increasing Mach number, the flow over the wing continues to accelerate and eventually reaches a sonic value at a particular point on the wing, normally the point of maximum thickness (Fig. 14.11).
SUBSONIC
FLOW SUBSONIC
SUBSONICFLOWFLOW
SUBSONIC FLOW
AIRFLOW REACHESSONIC VALUE
M = 0.75 (CRITICAL MACH NUMBER)
FIG. 14.11
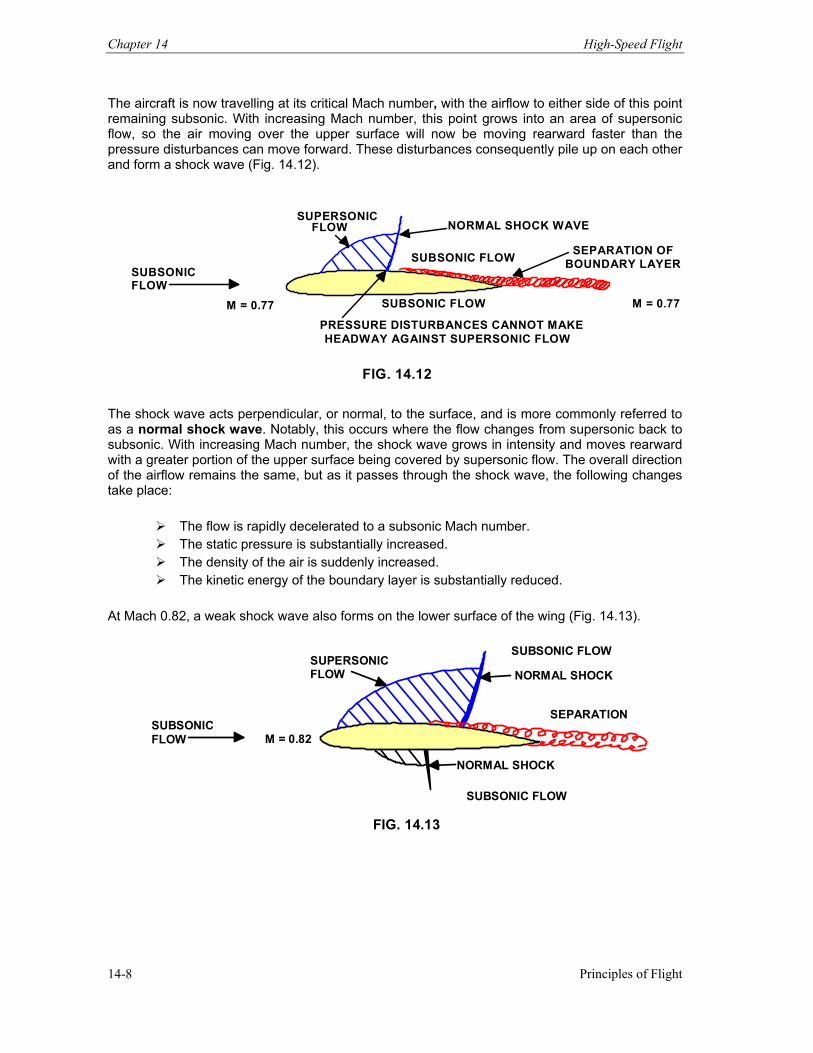
Chapter 14 High-Speed Flight
Principles of Flight 14-8
The aircraft is now travelling at its critical Mach number, with the airflow to either side of this point remaining subsonic. With increasing Mach number, this point grows into an area of supersonic flow, so the air moving over the upper surface will now be moving rearward faster than the pressure disturbances can move forward. These disturbances consequently pile up on each other and form a shock wave (Fig. 14.12).
SUBSONIC FLOW
M = 0.77 M = 0.77
SUPERSONICFLOW NORMAL SHOCK WAVE
SUBSONIC FLOW
SUBSONIC FLOW
SEPARATION OFBOUNDARY LAYER
PRESSURE DISTURBANCES CANNOT MAKE HEADWAY AGAINST SUPERSONIC FLOW
FIG. 14.12
The shock wave acts perpendicular, or normal, to the surface, and is more commonly referred to as a normal shock wave. Notably, this occurs where the flow changes from supersonic back to subsonic. With increasing Mach number, the shock wave grows in intensity and moves rearward with a greater portion of the upper surface being covered by supersonic flow. The overall direction of the airflow remains the same, but as it passes through the shock wave, the following changes take place:
The flow is rapidly decelerated to a subsonic Mach number. The static pressure is substantially increased. The density of the air is suddenly increased. The kinetic energy of the boundary layer is substantially reduced.
At Mach 0.82, a weak shock wave also forms on the lower surface of the wing (Fig. 14.13).
SUPERSONICFLOW
NORMAL SHOCK
NORMAL SHOCK SUBSONIC FLOW
SUBSONIC FLOW
SEPARATION M = 0.82 SUBSONIC
FLOW
FIG. 14.13
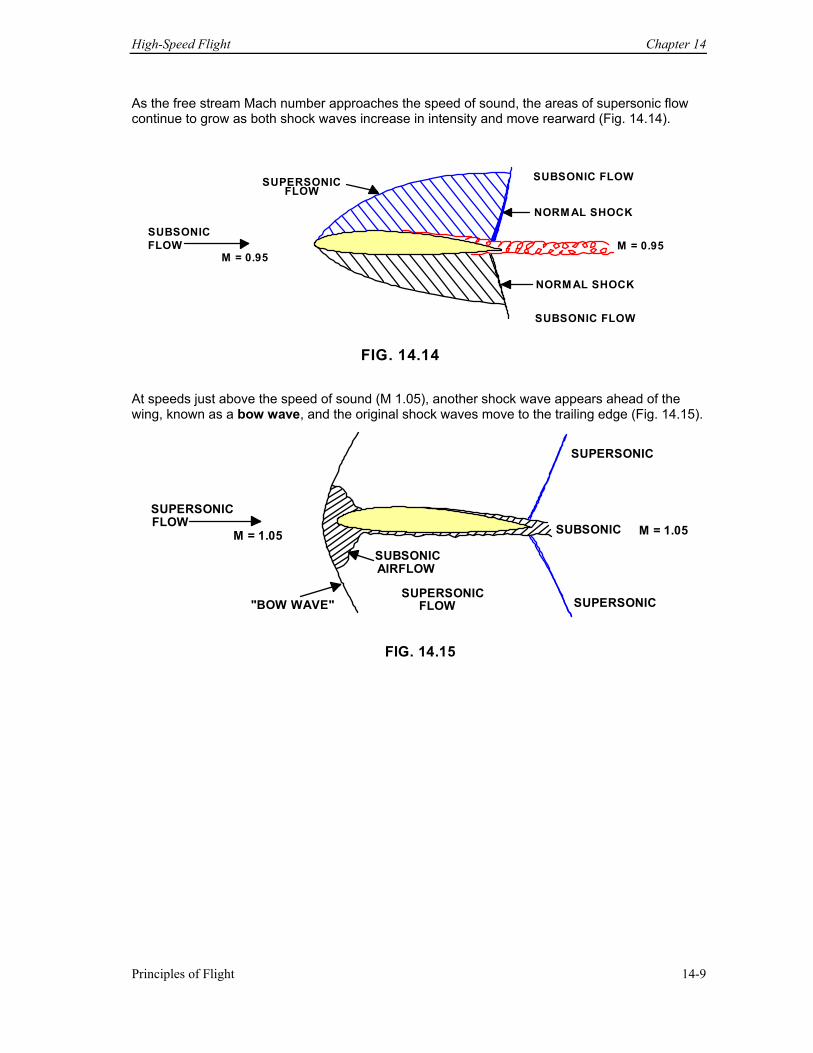
High-Speed Flight Chapter 14
Principles of Flight 14-9
As the free stream Mach number approaches the speed of sound, the areas of supersonic flow continue to grow as both shock waves increase in intensity and move rearward (Fig. 14.14).
SUPERSONICFLOW SUBSONIC FLOW
SUBSONIC FLOW NORM AL SHOCK
NORM AL SHOCK M = 0.95
M = 0.95 SUBSONIC FLOW
FIG. 14.14 At speeds just above the speed of sound (M 1.05), another shock wave appears ahead of the wing, known as a bow wave, and the original shock waves move to the trailing edge (Fig. 14.15).
SUPERSONIC
SUPERSONIC
SUPERSONIC
SUPERSONIC
FLOW
FLOW
SUBSONIC
SUBSONIC AIRFLOW
"BOW WAVE"
M = 1.05M = 1.05
FIG. 14.15
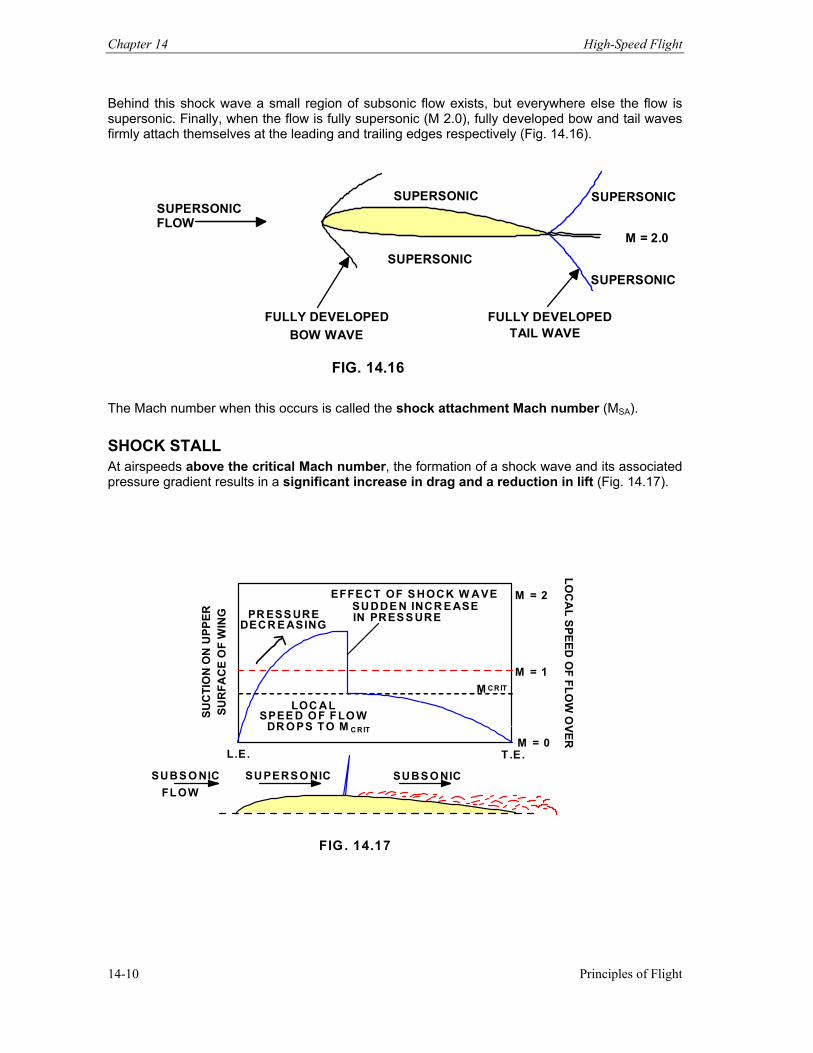
Chapter 14 High-Speed Flight
Principles of Flight 14-10
Behind this shock wave a small region of subsonic flow exists, but everywhere else the flow is supersonic. Finally, when the flow is fully supersonic (M 2.0), fully developed bow and tail waves firmly attach themselves at the leading and trailing edges respectively (Fig. 14.16).
SUPERSONIC SUPERSONIC
SUPERSONIC
SUPERSONIC
SUPERSONIC
FLOW
FULLY DEVELOPED FULLY DEVELOPED BOW WAVE TAIL WAVE
M = 2.0
FIG. 14.16 The Mach number when this occurs is called the shock attachment Mach number (MSA). SHOCK STALL At airspeeds above the critical Mach number, the formation of a shock wave and its associated pressure gradient results in a significant increase in drag and a reduction in lift (Fig. 14.17).
FIG. 14.17
SUC
TIO
N O
N U
PPER
SU
RFA
CE
OF
WIN
G
LOC
AL SPEED
OF FLO
W O
VER
L .E. T.E.
M = 2
M = 1
M = 0
EFFECT OF S HOCK W AVESUDDE N INCR E ASEIN PRES S URE
LOC ALSPEE D O F FLO W
DR O PS TO M CRIT
CRITM
SUBS O NICSUBS O NIC FLOW
SUPERS O NIC
PR ESS URE DECR E ASING
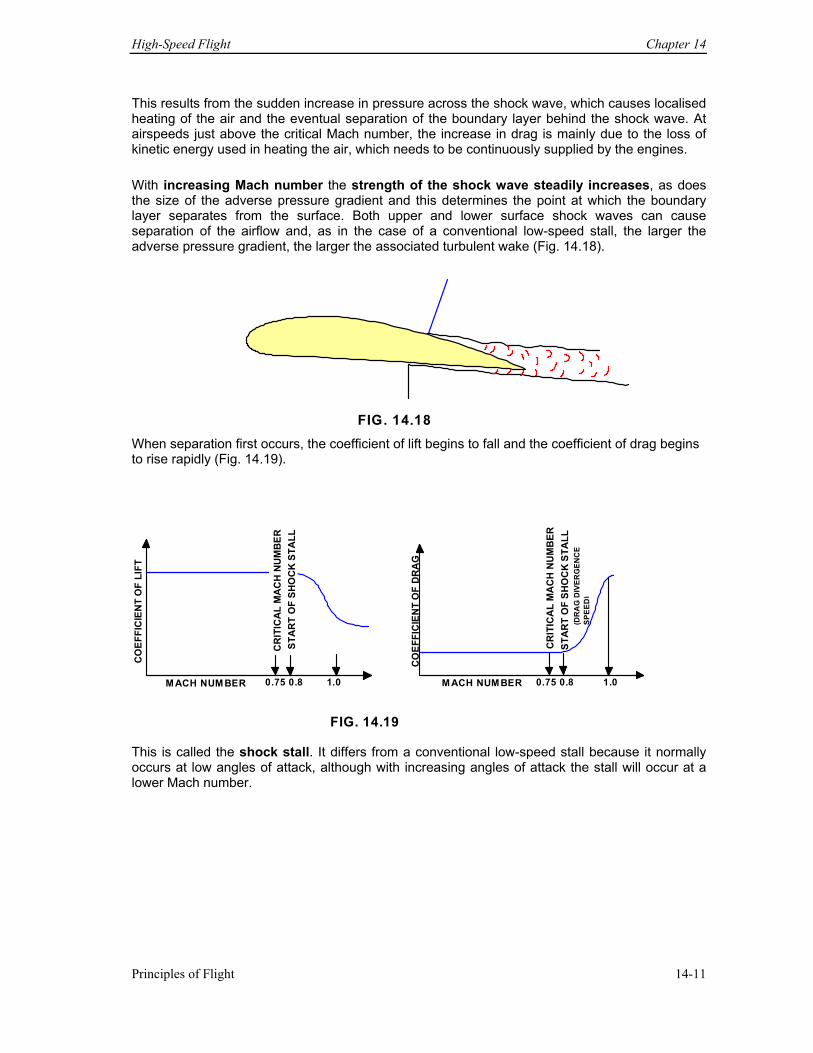
High-Speed Flight Chapter 14
Principles of Flight 14-11
This results from the sudden increase in pressure across the shock wave, which causes localised heating of the air and the eventual separation of the boundary layer behind the shock wave. At airspeeds just above the critical Mach number, the increase in drag is mainly due to the loss of kinetic energy used in heating the air, which needs to be continuously supplied by the engines. With increasing Mach number the strength of the shock wave steadily increases, as does the size of the adverse pressure gradient and this determines the point at which the boundary layer separates from the surface. Both upper and lower surface shock waves can cause separation of the airflow and, as in the case of a conventional low-speed stall, the larger the adverse pressure gradient, the larger the associated turbulent wake (Fig. 14.18).
FIG. 14.18When separation first occurs, the coefficient of lift begins to fall and the coefficient of drag begins to rise rapidly (Fig. 14.19).
CO
EFFI
CIE
NT
OF
LIFT
CO
EFFI
CIE
NT
OF
DR
AG
CR
ITIC
AL
MA
CH
NU
MB
ER
CR
ITIC
AL
MA
CH
NU
MB
ER
STA
RT
OF
SHO
CK
STA
LL
STA
RT
OF
SHO
CK
STA
LL
0.75 0.8 1.0 0.75 0.8 1.0 M ACH NUMBER MACH NUMBER
(DR
AG
DIV
ERG
ENC
E SP
EED
)
FIG. 14.19
This is called the shock stall. It differs from a conventional low-speed stall because it normally occurs at low angles of attack, although with increasing angles of attack the stall will occur at a lower Mach number.
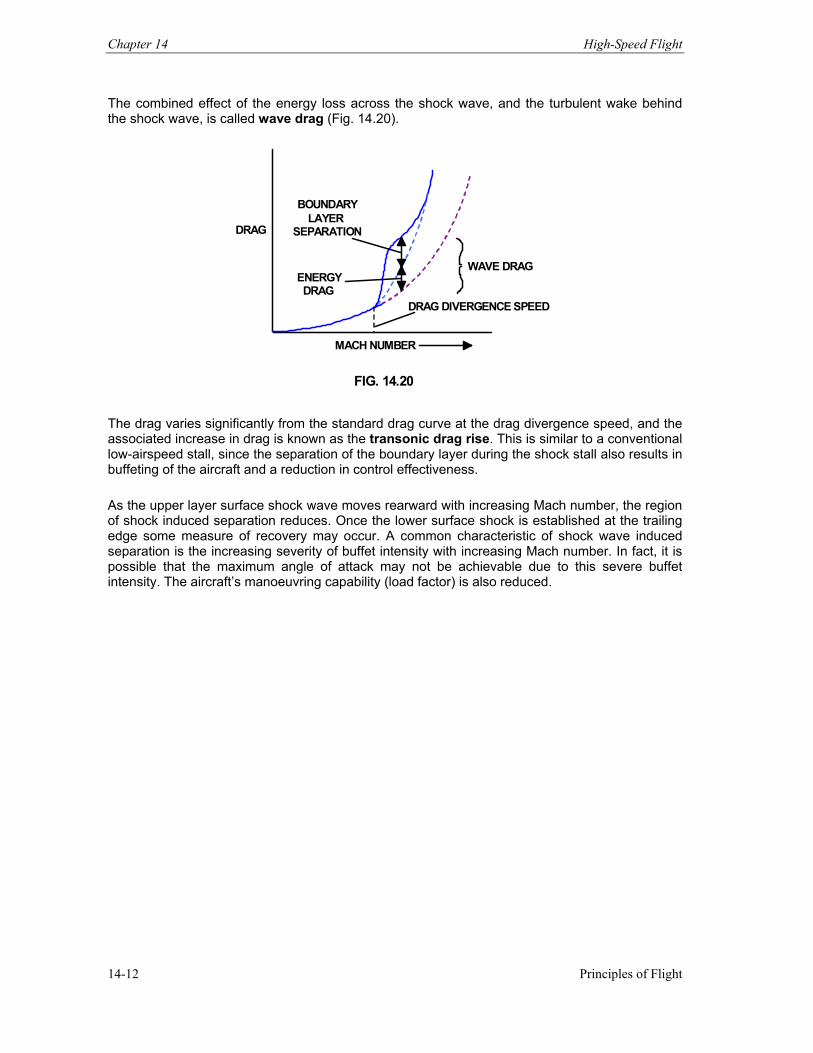
Chapter 14 High-Speed Flight
Principles of Flight 14-12
The combined effect of the energy loss across the shock wave, and the turbulent wake behind the shock wave, is called wave drag (Fig. 14.20).
DRAG BOUNDARY
LAYERSEPARATION
ENERGYDRAG
WAVE DRAG
DRAG DIVERGENCE SPEED
MACH NUMBER
FIG. 14.20
The drag varies significantly from the standard drag curve at the drag divergence speed, and the associated increase in drag is known as the transonic drag rise. This is similar to a conventional low-airspeed stall, since the separation of the boundary layer during the shock stall also results in buffeting of the aircraft and a reduction in control effectiveness. As the upper layer surface shock wave moves rearward with increasing Mach number, the region of shock induced separation reduces. Once the lower surface shock is established at the trailing edge some measure of recovery may occur. A common characteristic of shock wave induced separation is the increasing severity of buffet intensity with increasing Mach number. In fact, it is possible that the maximum angle of attack may not be achievable due to this severe buffet intensity. The aircraft’s manoeuvring capability (load factor) is also reduced.
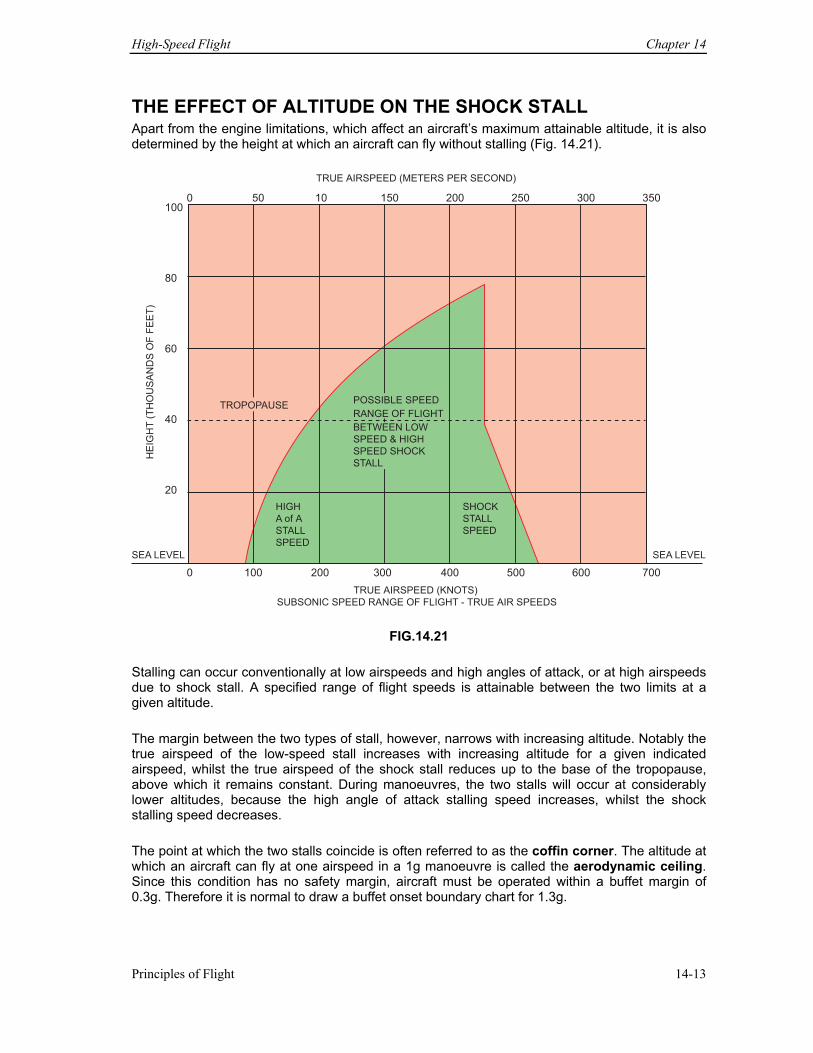
High-Speed Flight Chapter 14
Principles of Flight 14-13
THE EFFECT OF ALTITUDE ON THE SHOCK STALL Apart from the engine limitations, which affect an aircraft’s maximum attainable altitude, it is also determined by the height at which an aircraft can fly without stalling (Fig. 14.21).
0 50 10 150 200 250 300 350
0 100 200 300 400 500 600 700
TRUE AIRSPEED (METERS PER SECOND)
TRUE AIRSPEED (KNOTS)
SUBSONIC SPEED RANGE OF FLIGHT - TRUE AIR SPEEDS
100
80
60
40
20
HE
IGH
T (
TH
OU
SA
ND
S O
F F
EE
T)
SHOCK
STALL
SPEED
HIGH
A of A
STALL
SPEED
SEA LEVEL SEA LEVEL
TROPOPAUSEPOSSIBLE SPEED
RANGE OF FLIGHT
BETWEEN LOW
SPEED & HIGH
SPEED SHOCK
STALL
FIG.14.21 Stalling can occur conventionally at low airspeeds and high angles of attack, or at high airspeeds due to shock stall. A specified range of flight speeds is attainable between the two limits at a given altitude. The margin between the two types of stall, however, narrows with increasing altitude. Notably the true airspeed of the low-speed stall increases with increasing altitude for a given indicated airspeed, whilst the true airspeed of the shock stall reduces up to the base of the tropopause, above which it remains constant. During manoeuvres, the two stalls will occur at considerably lower altitudes, because the high angle of attack stalling speed increases, whilst the shock stalling speed decreases. The point at which the two stalls coincide is often referred to as the coffin corner. The altitude at which an aircraft can fly at one airspeed in a 1g manoeuvre is called the aerodynamic ceiling. Since this condition has no safety margin, aircraft must be operated within a buffet margin of 0.3g. Therefore it is normal to draw a buffet onset boundary chart for 1.3g.
Chapter 14 High-Speed Flight
Principles of Flight 14-14
BUFFET ONSET BOUNDARY CHART This chart is specific to a particular type of aircraft, and shows the relationship of altitude, load factor, cruise data, weight, Mach number, and IAS (Fig. 14.22). The chart can be used to find (1), the manoeuvre margin in terms of load factor and bank angle, and (2), the low and high-speed buffet for 1g flight. For the following examples, assume the following data: airspeed of M 0.72, a flight level of 350, a CG of 10% MAC and a gross mass of 50 000 kg.
1. Entering the chart at point A with the airspeed of M 0.72, a line is drawn vertically upward until it intersects the flight level curve of 35 000 ft at point B. Now a horizontal line is drawn to the right until it intersects the CG reference line at point C. From point C, a line is drawn back following the slope to point D, which is the 10% MAC point. Now a line is drawn horizontally to the right until it intersects the gross weight curve at point E. A line is then drawn vertically downward to intersect the load factor and bank angle scale to determine the values for the initial buffet, in this case 1.47g and 47° respectively.
2. Entering the chart at the 1g position, a line is drawn vertically upward until it intersects the
gross weight curve at point F. From point F, a horizontal line is drawn to the left to the 10% CG position and back to the CG reference line and then to the left to intersect the flight level curve of 35 000 ft at point G. From this point, a vertical line is drawn down until it intersects the speed scale at M 0.814, which is the 1g high-speed buffet boundary. To find the 1g low-speed buffet boundary, the horizontal line from point G is continued to point H on the flight level curve. A vertical line is drawn down until it intersects the speed scale, giving a speed of M 0.54 or 178 kt.
If the aircraft is assigned a different flight level but maintains its IAS, the Mach number will vary (e.g. if the altitude reduces the Mach number will reduce). This is particularly important if the aircraft is assigned a higher altitude than expected by Air Traffic Control and the pilot needs to be aware of the aircraft’s margin to buffet.
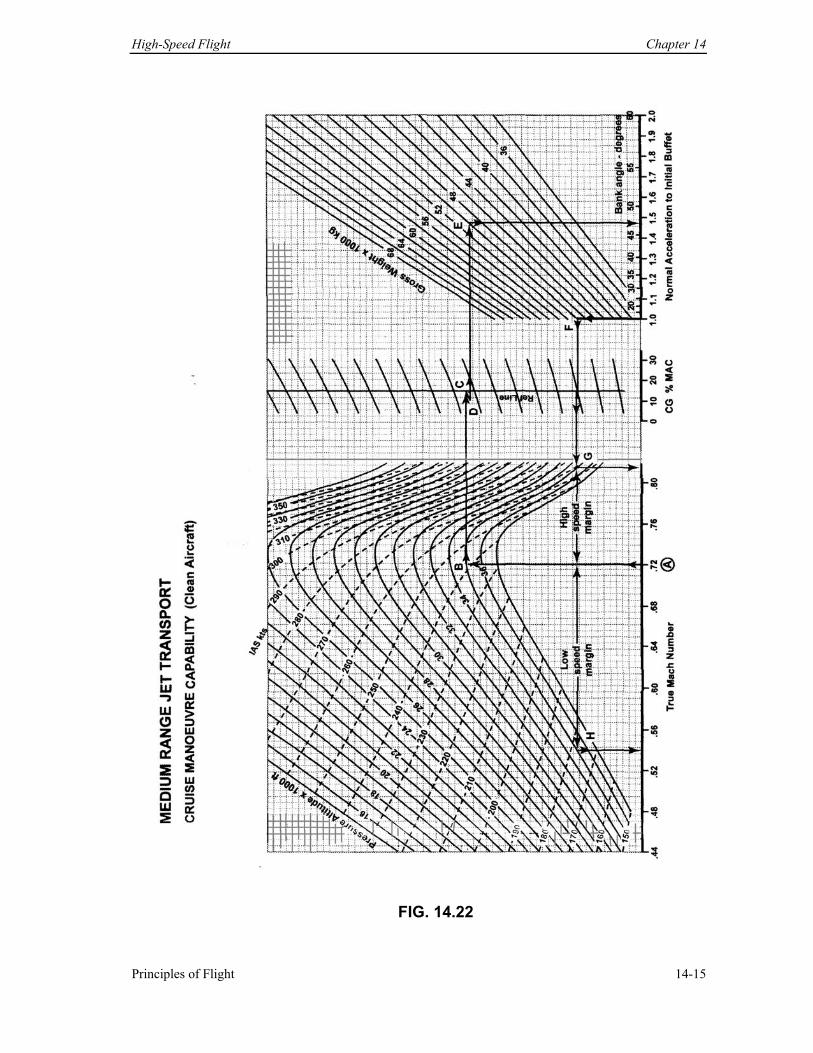
High-Speed Flight Chapter 14
Principles of Flight 14-15
FIG. 14.22
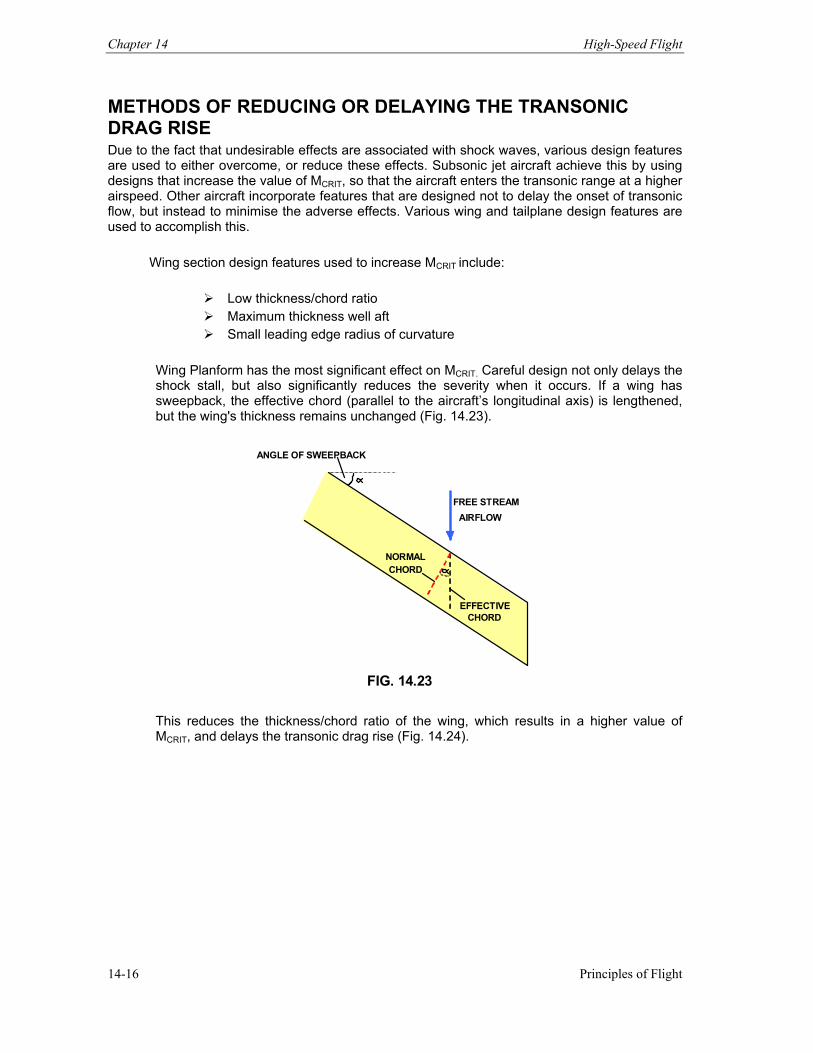
Chapter 14 High-Speed Flight
Principles of Flight 14-16
METHODS OF REDUCING OR DELAYING THE TRANSONIC DRAG RISE Due to the fact that undesirable effects are associated with shock waves, various design features are used to either overcome, or reduce these effects. Subsonic jet aircraft achieve this by using designs that increase the value of MCRIT, so that the aircraft enters the transonic range at a higher airspeed. Other aircraft incorporate features that are designed not to delay the onset of transonic flow, but instead to minimise the adverse effects. Various wing and tailplane design features are used to accomplish this.
Wing section design features used to increase MCRIT include:
Low thickness/chord ratio Maximum thickness well aft Small leading edge radius of curvature
Wing Planform has the most significant effect on MCRIT. Careful design not only delays the shock stall, but also significantly reduces the severity when it occurs. If a wing has sweepback, the effective chord (parallel to the aircraft’s longitudinal axis) is lengthened, but the wing's thickness remains unchanged (Fig. 14.23).
ANGLE OF SWEEPBACK
FREE STREAMAIRFLOW
NORMALCHORD
EFFECTIVECHORD
FIG. 14.23 This reduces the thickness/chord ratio of the wing, which results in a higher value of MCRIT, and delays the transonic drag rise (Fig. 14.24).
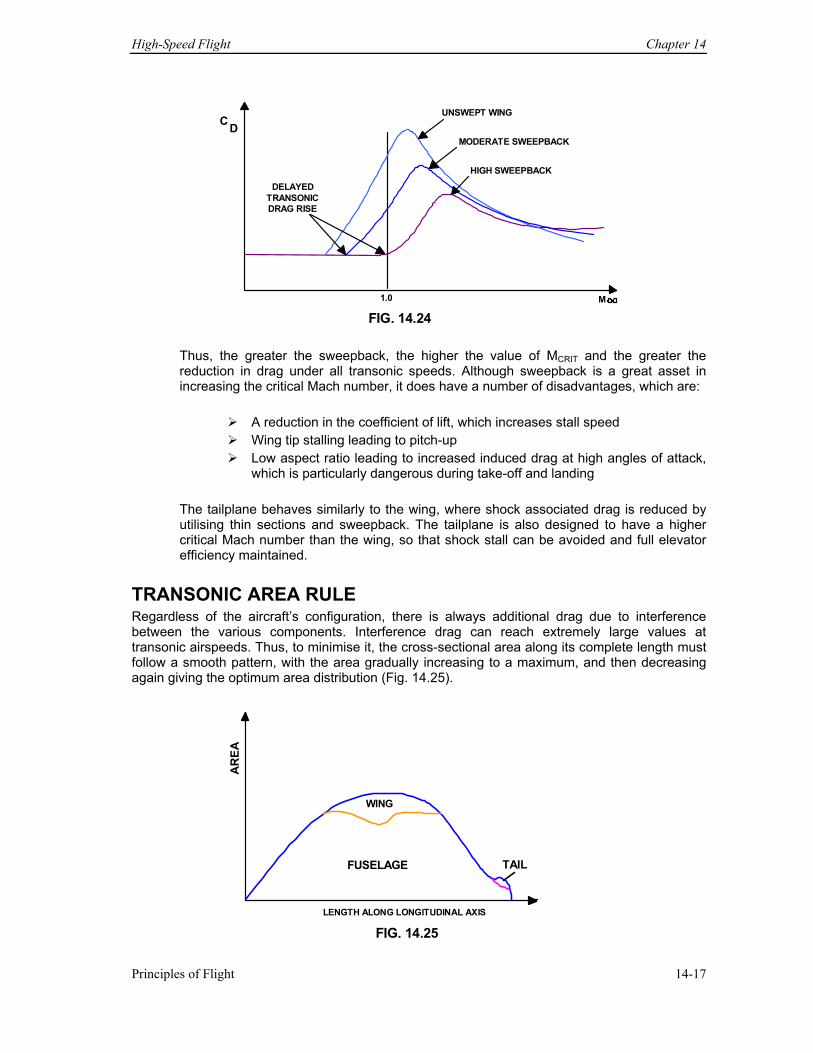
High-Speed Flight Chapter 14
Principles of Flight 14-17
DELAYED TRANSONIC DRAG RISE
UNSWEPT WING
MODERATE SWEEPBACK
HIGH SWEEPBACK
1.0
C D
M FIG. 14.24
Thus, the greater the sweepback, the higher the value of MCRIT and the greater the reduction in drag under all transonic speeds. Although sweepback is a great asset in increasing the critical Mach number, it does have a number of disadvantages, which are:
A reduction in the coefficient of lift, which increases stall speed Wing tip stalling leading to pitch-up Low aspect ratio leading to increased induced drag at high angles of attack,
which is particularly dangerous during take-off and landing
The tailplane behaves similarly to the wing, where shock associated drag is reduced by utilising thin sections and sweepback. The tailplane is also designed to have a higher critical Mach number than the wing, so that shock stall can be avoided and full elevator efficiency maintained.
TRANSONIC AREA RULE Regardless of the aircraft’s configuration, there is always additional drag due to interference between the various components. Interference drag can reach extremely large values at transonic airspeeds. Thus, to minimise it, the cross-sectional area along its complete length must follow a smooth pattern, with the area gradually increasing to a maximum, and then decreasing again giving the optimum area distribution (Fig. 14.25).
WING
FUSELAGE TAIL
LENGTH ALONG LONGITUDINAL AXIS
AR
EA
FIG. 14.25
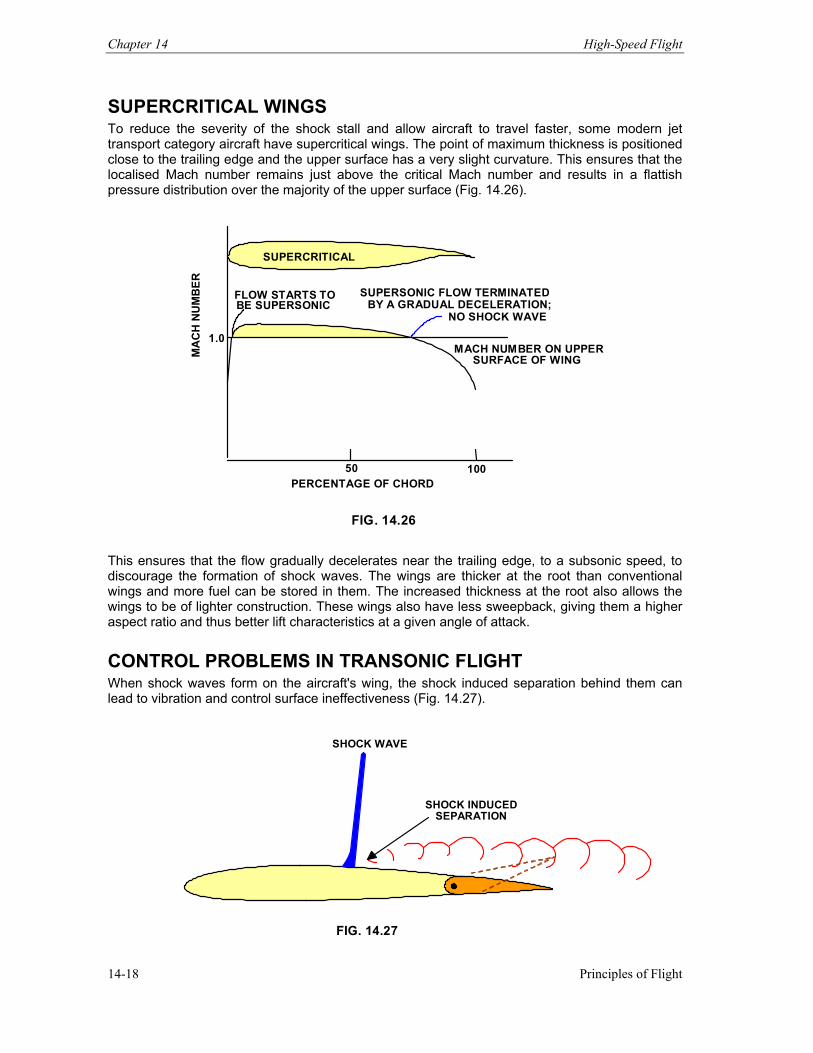
Chapter 14 High-Speed Flight
Principles of Flight 14-18
SUPERCRITICAL WINGS To reduce the severity of the shock stall and allow aircraft to travel faster, some modern jet transport category aircraft have supercritical wings. The point of maximum thickness is positioned close to the trailing edge and the upper surface has a very slight curvature. This ensures that the localised Mach number remains just above the critical Mach number and results in a flattish pressure distribution over the majority of the upper surface (Fig. 14.26).
MA
CH
NU
MB
ER
1.0
50 100
SUPERCRITICAL
FLOW STARTS TOBE SUPERSONIC
SUPERSONIC FLOW TERMINATEDBY A GRADUAL DECELERATION;
NO SHOCK WAVE
MACH NUMBER ON UPPER SURFACE OF WING
PERCENTAGE OF CHORD
FIG. 14.26 This ensures that the flow gradually decelerates near the trailing edge, to a subsonic speed, to discourage the formation of shock waves. The wings are thicker at the root than conventional wings and more fuel can be stored in them. The increased thickness at the root also allows the wings to be of lighter construction. These wings also have less sweepback, giving them a higher aspect ratio and thus better lift characteristics at a given angle of attack.
CONTROL PROBLEMS IN TRANSONIC FLIGHT When shock waves form on the aircraft's wing, the shock induced separation behind them can lead to vibration and control surface ineffectiveness (Fig. 14.27).
SHOCK WAVE
SHOCK INDUCEDSEPARATION
FIG. 14.27
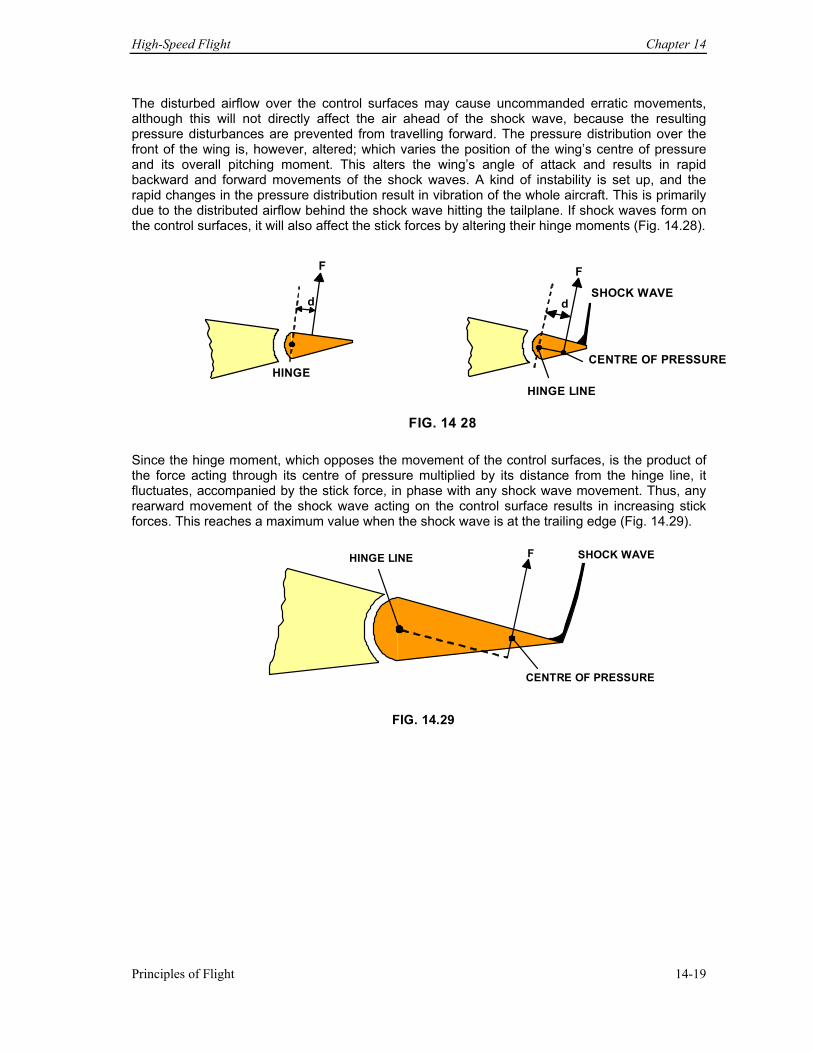
High-Speed Flight Chapter 14
Principles of Flight 14-19
The disturbed airflow over the control surfaces may cause uncommanded erratic movements, although this will not directly affect the air ahead of the shock wave, because the resulting pressure disturbances are prevented from travelling forward. The pressure distribution over the front of the wing is, however, altered; which varies the position of the wing’s centre of pressure and its overall pitching moment. This alters the wing’s angle of attack and results in rapid backward and forward movements of the shock waves. A kind of instability is set up, and the rapid changes in the pressure distribution result in vibration of the whole aircraft. This is primarily due to the distributed airflow behind the shock wave hitting the tailplane. If shock waves form on the control surfaces, it will also affect the stick forces by altering their hinge moments (Fig. 14.28).
FIG. 14 28
F F d d
HINGE
SHOCK WAVE
CENTRE OF PRESSURE
HINGE LINE
Since the hinge moment, which opposes the movement of the control surfaces, is the product of the force acting through its centre of pressure multiplied by its distance from the hinge line, it fluctuates, accompanied by the stick force, in phase with any shock wave movement. Thus, any rearward movement of the shock wave acting on the control surface results in increasing stick forces. This reaches a maximum value when the shock wave is at the trailing edge (Fig. 14.29).
HINGE LINE F SHOCK WAVE
CENTRE OF PRESSURE
FIG. 14.29
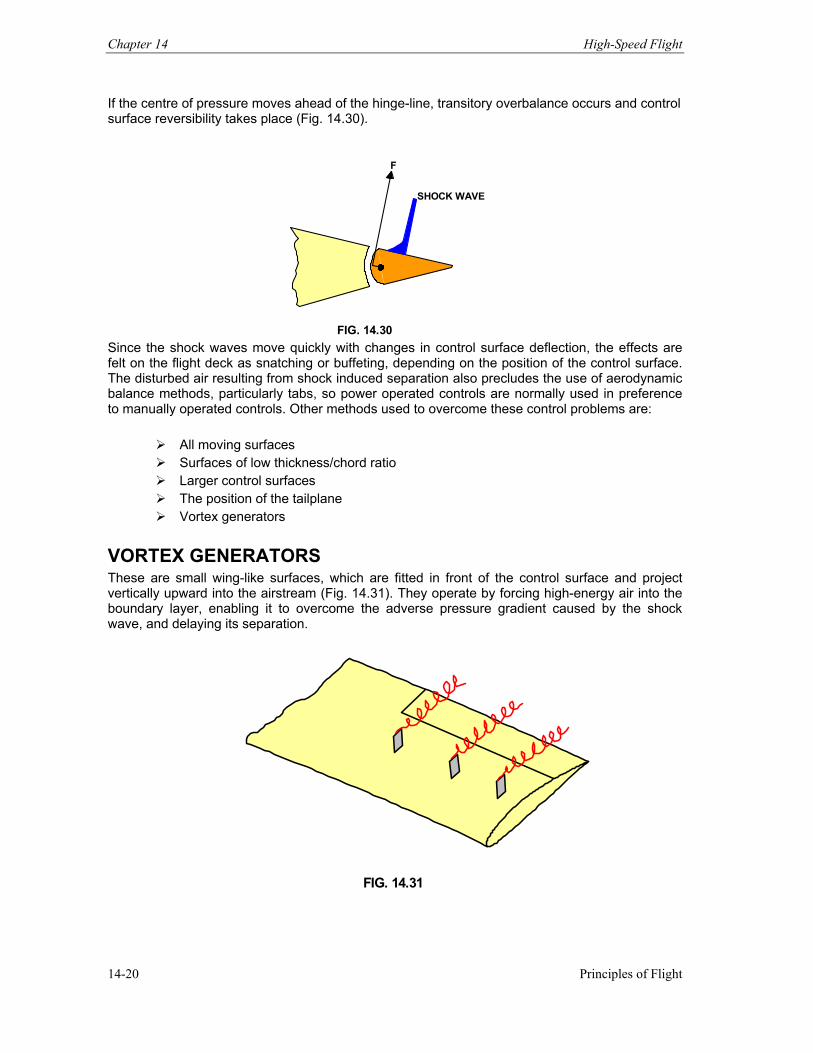
Chapter 14 High-Speed Flight
Principles of Flight 14-20
If the centre of pressure moves ahead of the hinge-line, transitory overbalance occurs and control surface reversibility takes place (Fig. 14.30).
F
SHOCK WAVE
FIG. 14.30 Since the shock waves move quickly with changes in control surface deflection, the effects are felt on the flight deck as snatching or buffeting, depending on the position of the control surface. The disturbed air resulting from shock induced separation also precludes the use of aerodynamic balance methods, particularly tabs, so power operated controls are normally used in preference to manually operated controls. Other methods used to overcome these control problems are:
All moving surfaces Surfaces of low thickness/chord ratio Larger control surfaces The position of the tailplane Vortex generators
VORTEX GENERATORS These are small wing-like surfaces, which are fitted in front of the control surface and project vertically upward into the airstream (Fig. 14.31). They operate by forcing high-energy air into the boundary layer, enabling it to overcome the adverse pressure gradient caused by the shock wave, and delaying its separation.
FIG. 14.31
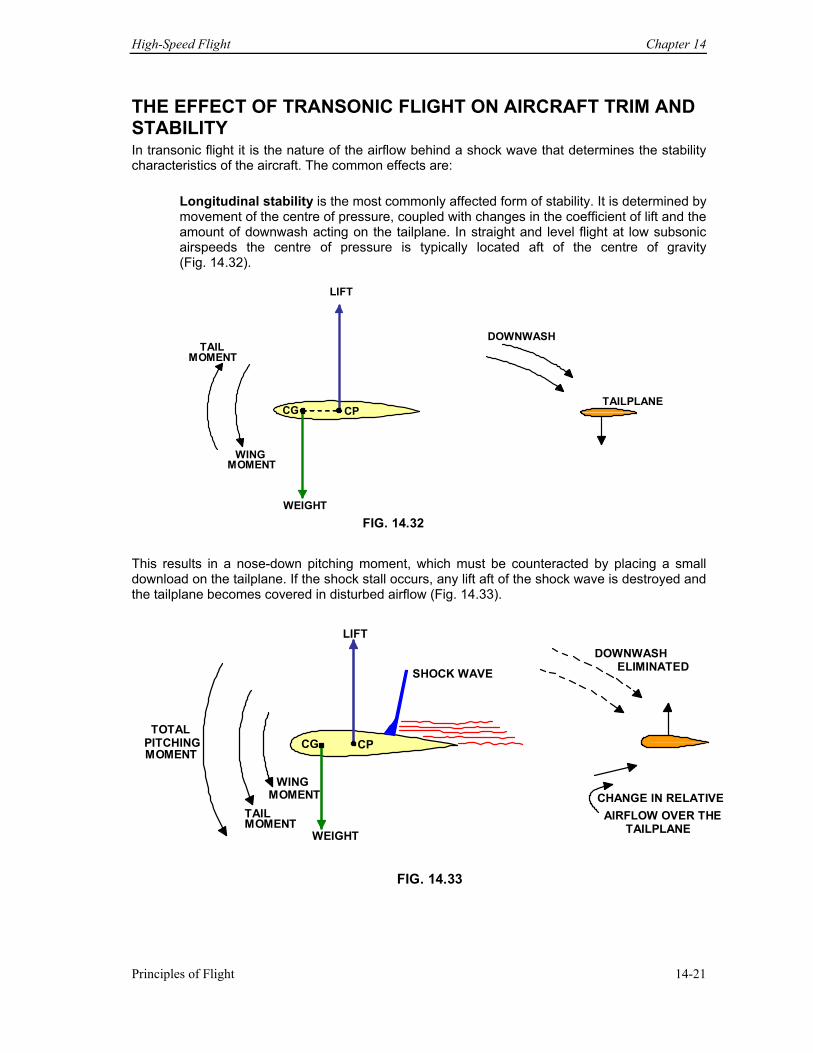
High-Speed Flight Chapter 14
Principles of Flight 14-21
THE EFFECT OF TRANSONIC FLIGHT ON AIRCRAFT TRIM AND STABILITY In transonic flight it is the nature of the airflow behind a shock wave that determines the stability characteristics of the aircraft. The common effects are:
Longitudinal stability is the most commonly affected form of stability. It is determined by movement of the centre of pressure, coupled with changes in the coefficient of lift and the amount of downwash acting on the tailplane. In straight and level flight at low subsonic airspeeds the centre of pressure is typically located aft of the centre of gravity (Fig. 14.32).
LIFT
WEIGHT
DOWNWASH
TAILPLANE
WING MOMENT
TAIL MOMENT
CG CP
FIG. 14.32
This results in a nose-down pitching moment, which must be counteracted by placing a small download on the tailplane. If the shock stall occurs, any lift aft of the shock wave is destroyed and the tailplane becomes covered in disturbed airflow (Fig. 14.33).
LIFT
SHOCK WAVE
WEIGHT
WING MOMENT
TAIL MOMENT
TOTAL PITCHING MOMENT CG CP
DOWNWASHELIMINATED
CHANGE IN RELATIVEAIRFLOW OVER THE
TAILPLANE
FIG. 14.33
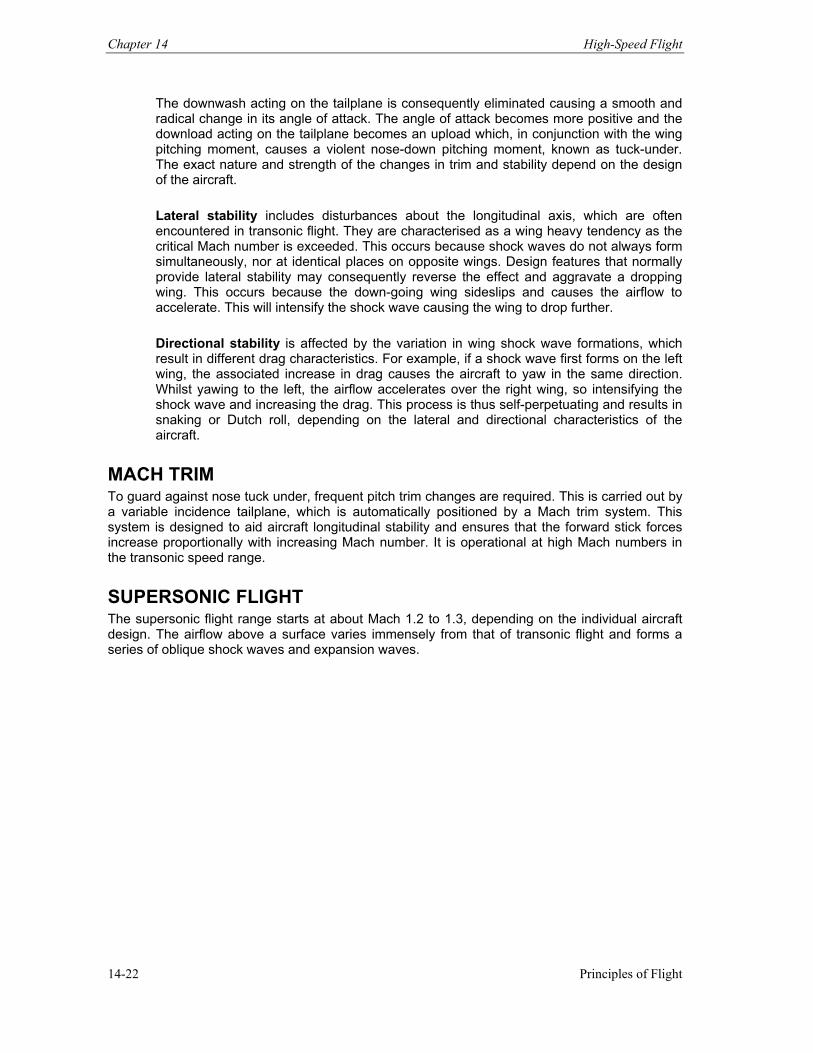
Chapter 14 High-Speed Flight
Principles of Flight 14-22
The downwash acting on the tailplane is consequently eliminated causing a smooth and radical change in its angle of attack. The angle of attack becomes more positive and the download acting on the tailplane becomes an upload which, in conjunction with the wing pitching moment, causes a violent nose-down pitching moment, known as tuck-under. The exact nature and strength of the changes in trim and stability depend on the design of the aircraft.
Lateral stability includes disturbances about the longitudinal axis, which are often encountered in transonic flight. They are characterised as a wing heavy tendency as the critical Mach number is exceeded. This occurs because shock waves do not always form simultaneously, nor at identical places on opposite wings. Design features that normally provide lateral stability may consequently reverse the effect and aggravate a dropping wing. This occurs because the down-going wing sideslips and causes the airflow to accelerate. This will intensify the shock wave causing the wing to drop further. Directional stability is affected by the variation in wing shock wave formations, which result in different drag characteristics. For example, if a shock wave first forms on the left wing, the associated increase in drag causes the aircraft to yaw in the same direction. Whilst yawing to the left, the airflow accelerates over the right wing, so intensifying the shock wave and increasing the drag. This process is thus self-perpetuating and results in snaking or Dutch roll, depending on the lateral and directional characteristics of the aircraft.
MACH TRIM To guard against nose tuck under, frequent pitch trim changes are required. This is carried out by a variable incidence tailplane, which is automatically positioned by a Mach trim system. This system is designed to aid aircraft longitudinal stability and ensures that the forward stick forces increase proportionally with increasing Mach number. It is operational at high Mach numbers in the transonic speed range.
SUPERSONIC FLIGHT The supersonic flight range starts at about Mach 1.2 to 1.3, depending on the individual aircraft design. The airflow above a surface varies immensely from that of transonic flight and forms a series of oblique shock waves and expansion waves.
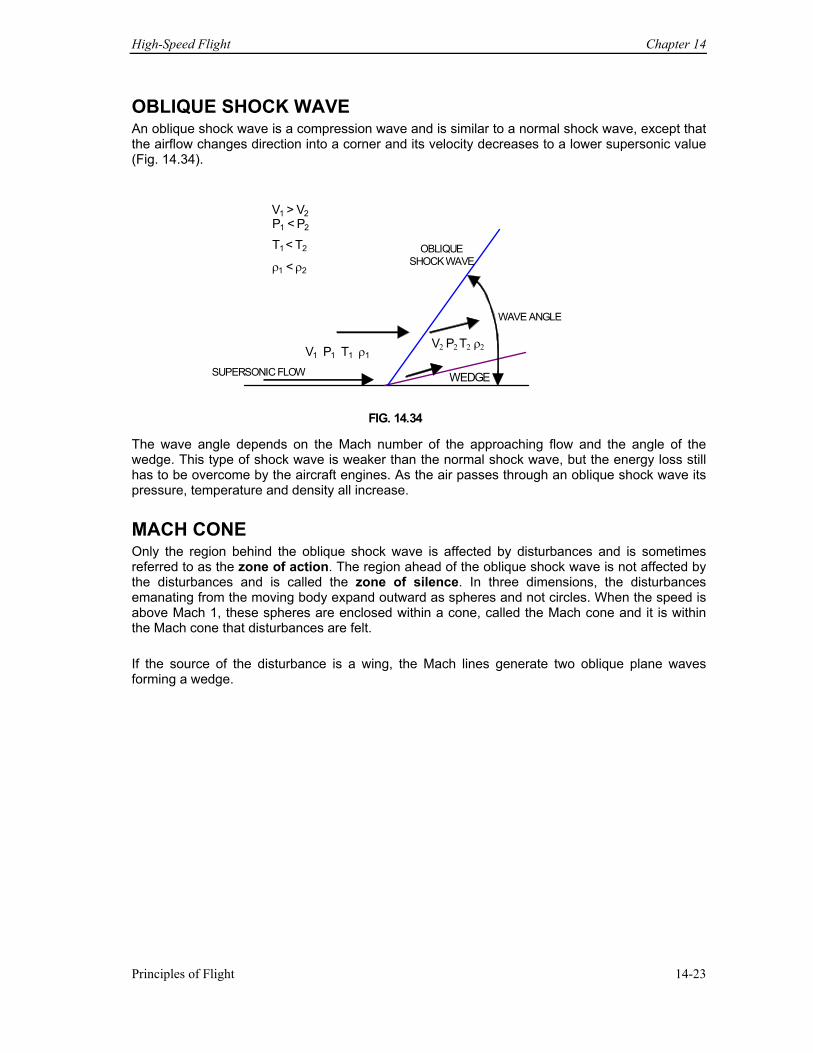
High-Speed Flight Chapter 14
Principles of Flight 14-23
OBLIQUE SHOCK WAVE An oblique shock wave is a compression wave and is similar to a normal shock wave, except that the airflow changes direction into a corner and its velocity decreases to a lower supersonic value (Fig. 14.34).
SUPERSONIC FLOW
FIG. 14.34
OBLIQUE SHOCK WAVE
V1 > V2 P1 < P2
T1 < T2
ρ1 < ρ2
V1 P1 T1 ρ1 V2 P2 T2 ρ2
WEDGE
WAVE ANGLE
The wave angle depends on the Mach number of the approaching flow and the angle of the wedge. This type of shock wave is weaker than the normal shock wave, but the energy loss still has to be overcome by the aircraft engines. As the air passes through an oblique shock wave its pressure, temperature and density all increase.
MACH CONE Only the region behind the oblique shock wave is affected by disturbances and is sometimes referred to as the zone of action. The region ahead of the oblique shock wave is not affected by the disturbances and is called the zone of silence. In three dimensions, the disturbances emanating from the moving body expand outward as spheres and not circles. When the speed is above Mach 1, these spheres are enclosed within a cone, called the Mach cone and it is within the Mach cone that disturbances are felt. If the source of the disturbance is a wing, the Mach lines generate two oblique plane waves forming a wedge.
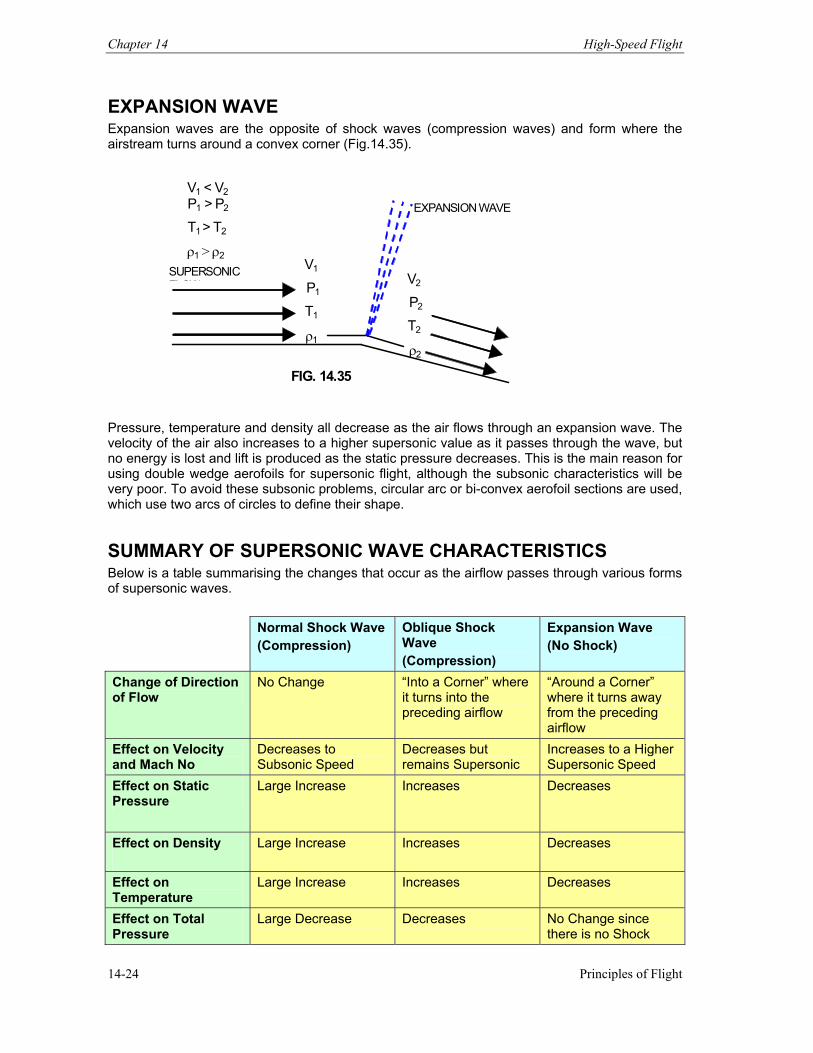
Chapter 14 High-Speed Flight
Principles of Flight 14-24
EXPANSION WAVE Expansion waves are the opposite of shock waves (compression waves) and form where the airstream turns around a convex corner (Fig.14.35).
EXPANSION WAVE
SUPERSONIC FLOW
FIG. 14.35
V1 < V2 P1 > P2 T1 > T2
ρ1 > ρ2 V1
P1
T1
ρ1
V2
P2
T2
ρ2
Pressure, temperature and density all decrease as the air flows through an expansion wave. The velocity of the air also increases to a higher supersonic value as it passes through the wave, but no energy is lost and lift is produced as the static pressure decreases. This is the main reason for using double wedge aerofoils for supersonic flight, although the subsonic characteristics will be very poor. To avoid these subsonic problems, circular arc or bi-convex aerofoil sections are used, which use two arcs of circles to define their shape.
SUMMARY OF SUPERSONIC WAVE CHARACTERISTICS Below is a table summarising the changes that occur as the airflow passes through various forms of supersonic waves. Normal Shock Wave
(Compression) Oblique Shock Wave (Compression)
Expansion Wave (No Shock)
Change of Direction of Flow
No Change “Into a Corner” where it turns into the preceding airflow
“Around a Corner” where it turns away from the preceding airflow
Effect on Velocity and Mach No
Decreases to Subsonic Speed
Decreases but remains Supersonic
Increases to a Higher Supersonic Speed
Effect on Static Pressure
Large Increase Increases Decreases
Effect on Density
Large Increase Increases Decreases
Effect on Temperature
Large Increase Increases Decreases
Effect on Total Pressure
Large Decrease Decreases No Change since there is no Shock
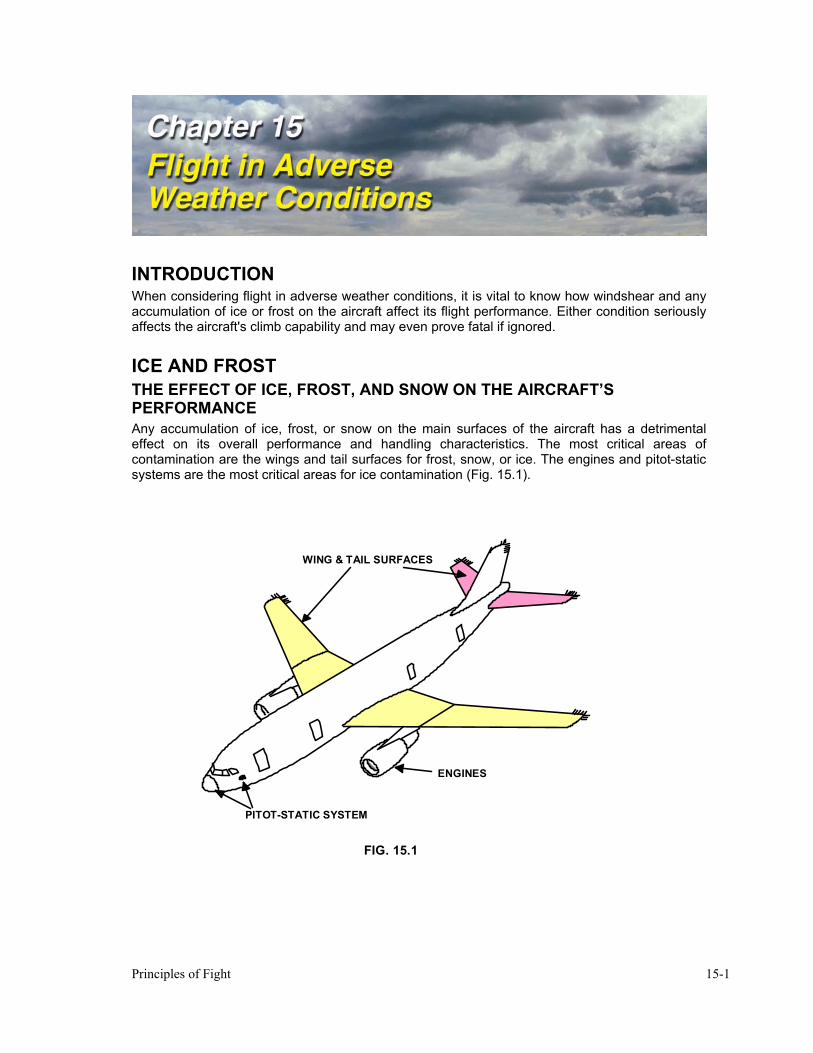
Principles of Fight 15-1
INTRODUCTION When considering flight in adverse weather conditions, it is vital to know how windshear and any accumulation of ice or frost on the aircraft affect its flight performance. Either condition seriously affects the aircraft's climb capability and may even prove fatal if ignored.
ICE AND FROST THE EFFECT OF ICE, FROST, AND SNOW ON THE AIRCRAFT’S PERFORMANCE Any accumulation of ice, frost, or snow on the main surfaces of the aircraft has a detrimental effect on its overall performance and handling characteristics. The most critical areas of contamination are the wings and tail surfaces for frost, snow, or ice. The engines and pitot-static systems are the most critical areas for ice contamination (Fig. 15.1).
FIG. 15.1
WING & TAIL SURFACES
PITOT-STATIC SYSTEM
ENGINES
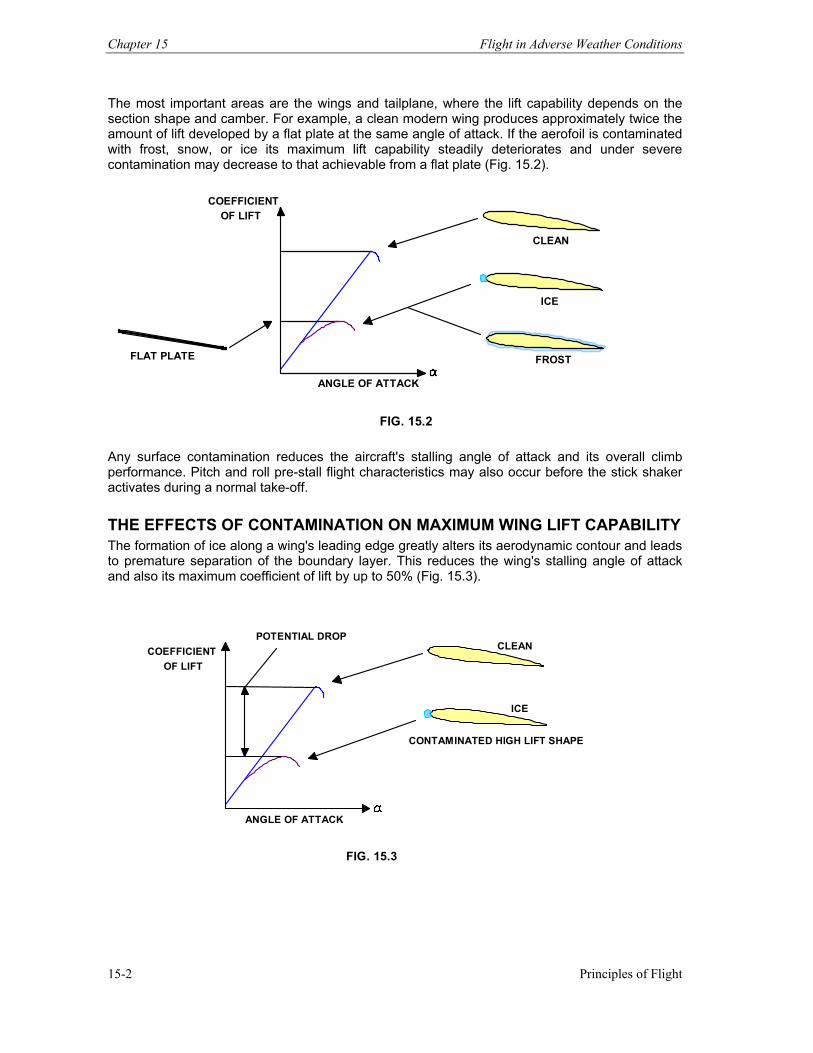
Chapter 15 Flight in Adverse Weather Conditions
Principles of Flight 15-2
The most important areas are the wings and tailplane, where the lift capability depends on the section shape and camber. For example, a clean modern wing produces approximately twice the amount of lift developed by a flat plate at the same angle of attack. If the aerofoil is contaminated with frost, snow, or ice its maximum lift capability steadily deteriorates and under severe contamination may decrease to that achievable from a flat plate (Fig. 15.2).
FLAT PLATE
CLEAN
ICE
FROST ANGLE OF ATTACK
COEFFICIENT OF LIFT
FIG. 15.2
Any surface contamination reduces the aircraft's stalling angle of attack and its overall climb performance. Pitch and roll pre-stall flight characteristics may also occur before the stick shaker activates during a normal take-off. THE EFFECTS OF CONTAMINATION ON MAXIMUM WING LIFT CAPABILITY The formation of ice along a wing's leading edge greatly alters its aerodynamic contour and leads to premature separation of the boundary layer. This reduces the wing's stalling angle of attack and also its maximum coefficient of lift by up to 50% (Fig. 15.3).
CLEAN
ICE
ANGLE OF ATTACK
POTENTIAL DROP
CONTAMINATED HIGH LIFT SHAPE
COEFFICIENT OF LIFT
FIG. 15.3
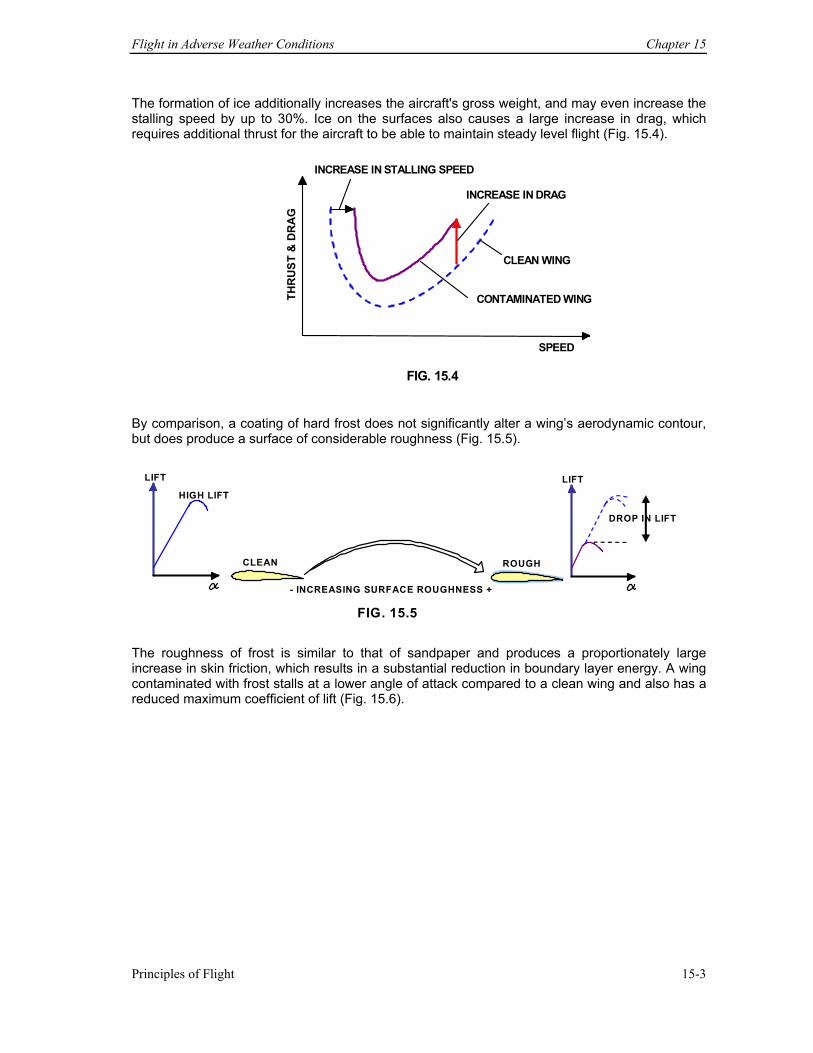
Flight in Adverse Weather Conditions Chapter 15
Principles of Flight 15-3
The formation of ice additionally increases the aircraft's gross weight, and may even increase the stalling speed by up to 30%. Ice on the surfaces also causes a large increase in drag, which requires additional thrust for the aircraft to be able to maintain steady level flight (Fig. 15.4).
THR
UST
& D
RA
G
INCREASE IN STALLING SPEED
INCREASE IN DRAG
CLEAN WING
CONTAMINATED WING
SPEED FIG. 15.4
By comparison, a coating of hard frost does not significantly alter a wing’s aerodynamic contour, but does produce a surface of considerable roughness (Fig. 15.5).
LIFT HIGH LIFT
CLEAN - INCREASING SURFACE ROUGHNESS +
ROUGH
LIFT
DROP IN LIFT
FIG. 15.5 The roughness of frost is similar to that of sandpaper and produces a proportionately large increase in skin friction, which results in a substantial reduction in boundary layer energy. A wing contaminated with frost stalls at a lower angle of attack compared to a clean wing and also has a reduced maximum coefficient of lift (Fig. 15.6).
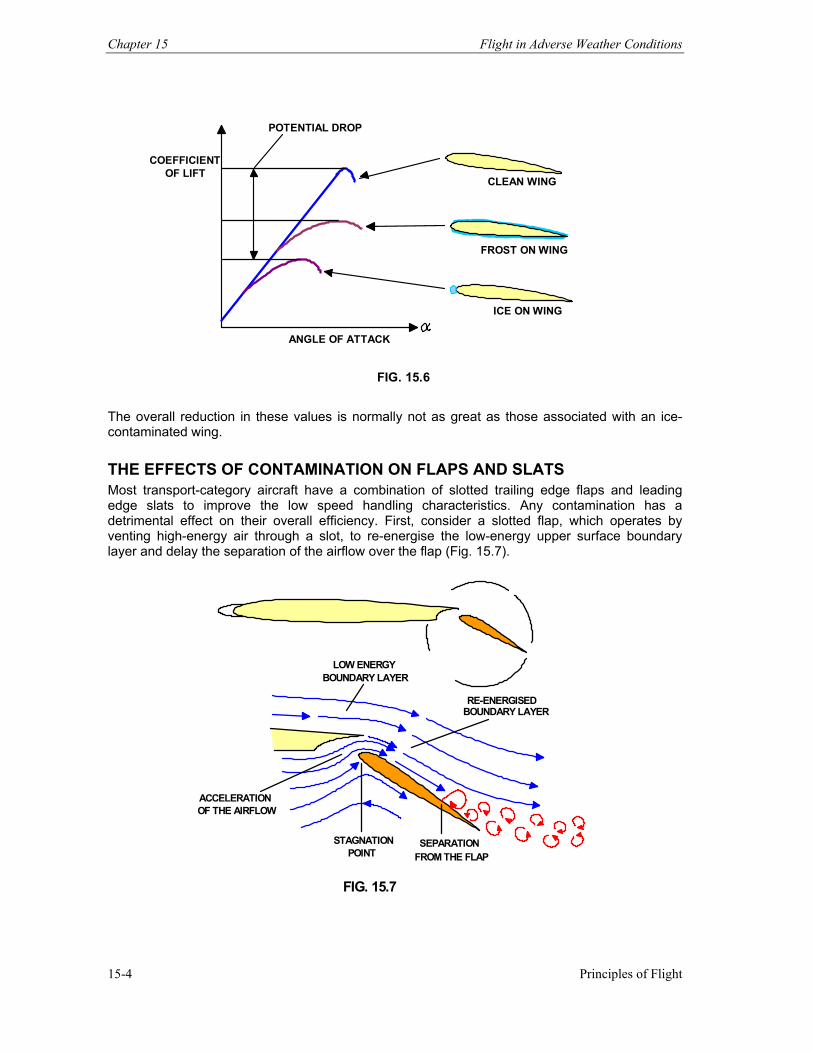
Chapter 15 Flight in Adverse Weather Conditions
Principles of Flight 15-4
CLEAN WING
ICE ON WING
FROST ON WING
POTENTIAL DROP
ANGLE OF ATTACK
COEFFICIENT OF LIFT
FIG. 15.6
The overall reduction in these values is normally not as great as those associated with an ice-contaminated wing. THE EFFECTS OF CONTAMINATION ON FLAPS AND SLATS Most transport-category aircraft have a combination of slotted trailing edge flaps and leading edge slats to improve the low speed handling characteristics. Any contamination has a detrimental effect on their overall efficiency. First, consider a slotted flap, which operates by venting high-energy air through a slot, to re-energise the low-energy upper surface boundary layer and delay the separation of the airflow over the flap (Fig. 15.7).
LOW ENERGY BOUNDARY LAYER
RE-ENERGISED BOUNDARY LAYER
ACCELERATION
STAGNATION SEPARATION POINT
OF THE AIRFLOW
FROM THE FLAP
FIG. 15.7
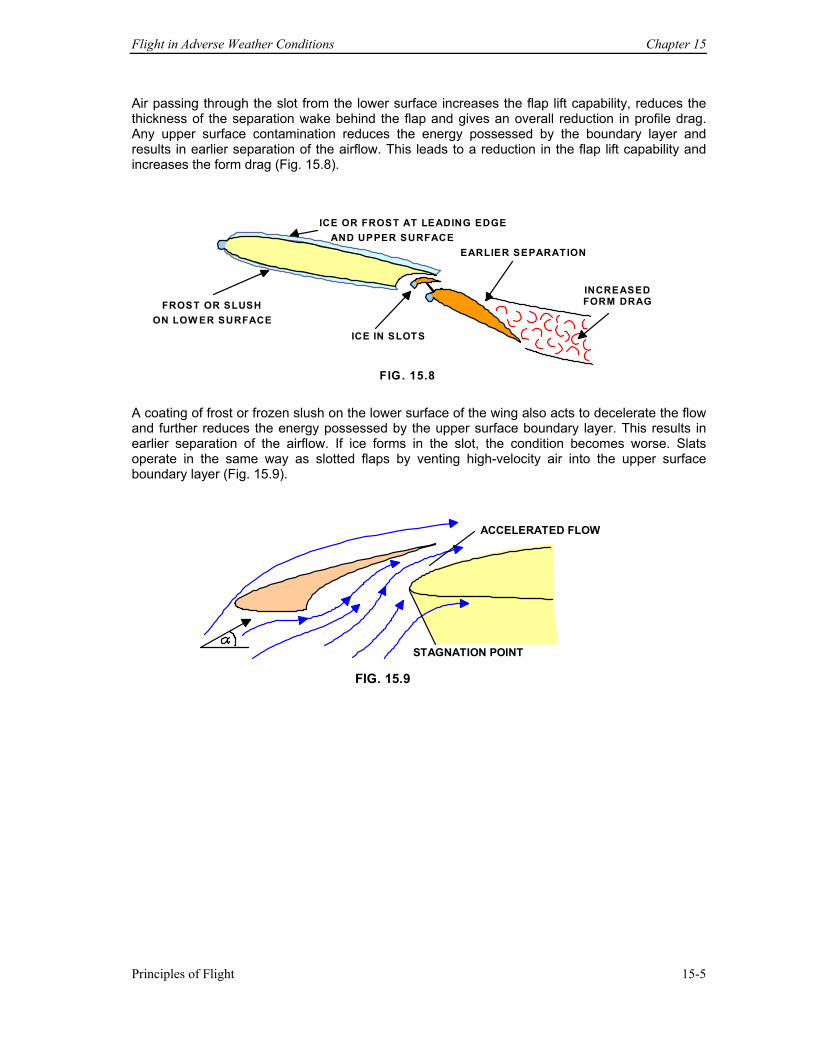
Flight in Adverse Weather Conditions Chapter 15
Principles of Flight 15-5
Air passing through the slot from the lower surface increases the flap lift capability, reduces the thickness of the separation wake behind the flap and gives an overall reduction in profile drag. Any upper surface contamination reduces the energy possessed by the boundary layer and results in earlier separation of the airflow. This leads to a reduction in the flap lift capability and increases the form drag (Fig. 15.8).
ICE OR FROST AT LEADING EDGEAND UPPER SURFACE
FROST OR SLUSH ON LOW ER SURFACE
ICE IN SLOTS
EARLIER SEPARATION INCREASED FORM DRAG
FIG. 15.8
A coating of frost or frozen slush on the lower surface of the wing also acts to decelerate the flow and further reduces the energy possessed by the upper surface boundary layer. This results in earlier separation of the airflow. If ice forms in the slot, the condition becomes worse. Slats operate in the same way as slotted flaps by venting high-velocity air into the upper surface boundary layer (Fig. 15.9).
ACCELERATED FLOW
STAGNATION POINT
FIG. 15.9
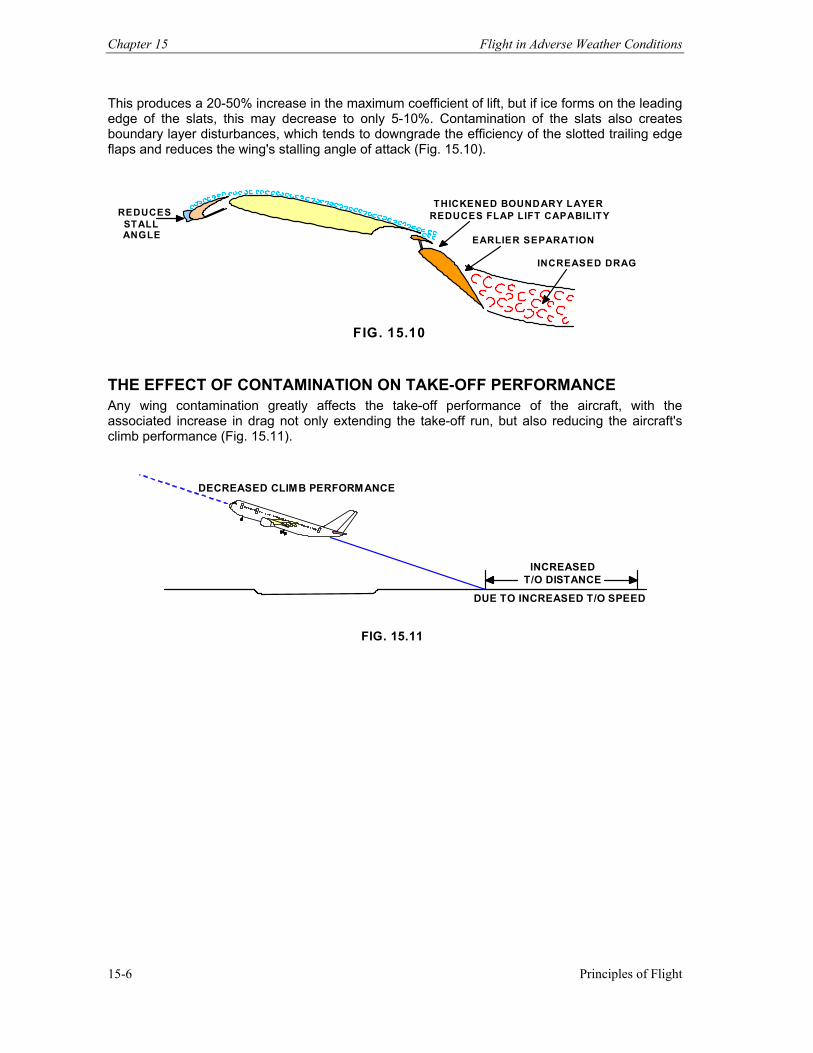
Chapter 15 Flight in Adverse Weather Conditions
Principles of Flight 15-6
This produces a 20-50% increase in the maximum coefficient of lift, but if ice forms on the leading edge of the slats, this may decrease to only 5-10%. Contamination of the slats also creates boundary layer disturbances, which tends to downgrade the efficiency of the slotted trailing edge flaps and reduces the wing's stalling angle of attack (Fig. 15.10).
INCREASED DRAG
THICKENED BOUNDARY LAYER REDUCES FLAP LIFT CAPABILITY
EARLIER SEPARATION REDUCES
STALL ANGLE
FIG. 15.10
THE EFFECT OF CONTAMINATION ON TAKE-OFF PERFORMANCE Any wing contamination greatly affects the take-off performance of the aircraft, with the associated increase in drag not only extending the take-off run, but also reducing the aircraft's climb performance (Fig. 15.11).
INCREASED T/O DISTANCE
DUE TO INCREASED T/O SPEED
DECREASED CLIMB PERFORMANCE
FIG. 15.11
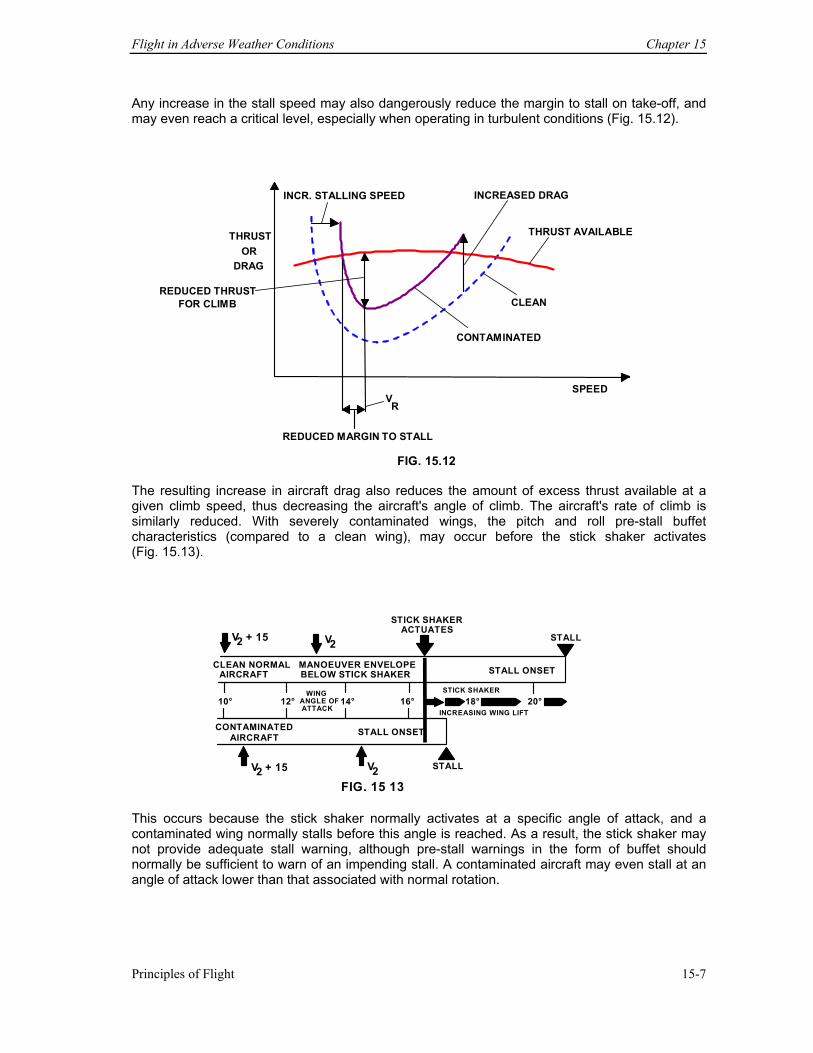
Flight in Adverse Weather Conditions Chapter 15
Principles of Flight 15-7
Any increase in the stall speed may also dangerously reduce the margin to stall on take-off, and may even reach a critical level, especially when operating in turbulent conditions (Fig. 15.12).
THRUST OR
DRAG
INCR. STALLING SPEED INCREASED DRAG
THRUST AVAILABLE
CLEAN
CONTAMINATED
SPEED
REDUCED MARGIN TO STALL
REDUCED THRUST FOR CLIMB
VR
FIG. 15.12
The resulting increase in aircraft drag also reduces the amount of excess thrust available at a given climb speed, thus decreasing the aircraft's angle of climb. The aircraft's rate of climb is similarly reduced. With severely contaminated wings, the pitch and roll pre-stall buffet characteristics (compared to a clean wing), may occur before the stick shaker activates (Fig. 15.13).
10° 12° 14° 16° 18° 20°
CLEAN NORMAL MANOEUVER ENVELOPEAIRCRAFT BELOW STICK SHAKER
STICK SHAKERACTUATES
STALL
STALL
STALL ONSET
CONTAMINATEDAIRCRAFT STALL ONSET
WINGANGLE OFATTACK
STICK SHAKER
INCREASING WING LIFT
V + 152
V + 152
2V
2V
FIG. 15 13
This occurs because the stick shaker normally activates at a specific angle of attack, and a contaminated wing normally stalls before this angle is reached. As a result, the stick shaker may not provide adequate stall warning, although pre-stall warnings in the form of buffet should normally be sufficient to warn of an impending stall. A contaminated aircraft may even stall at an angle of attack lower than that associated with normal rotation.
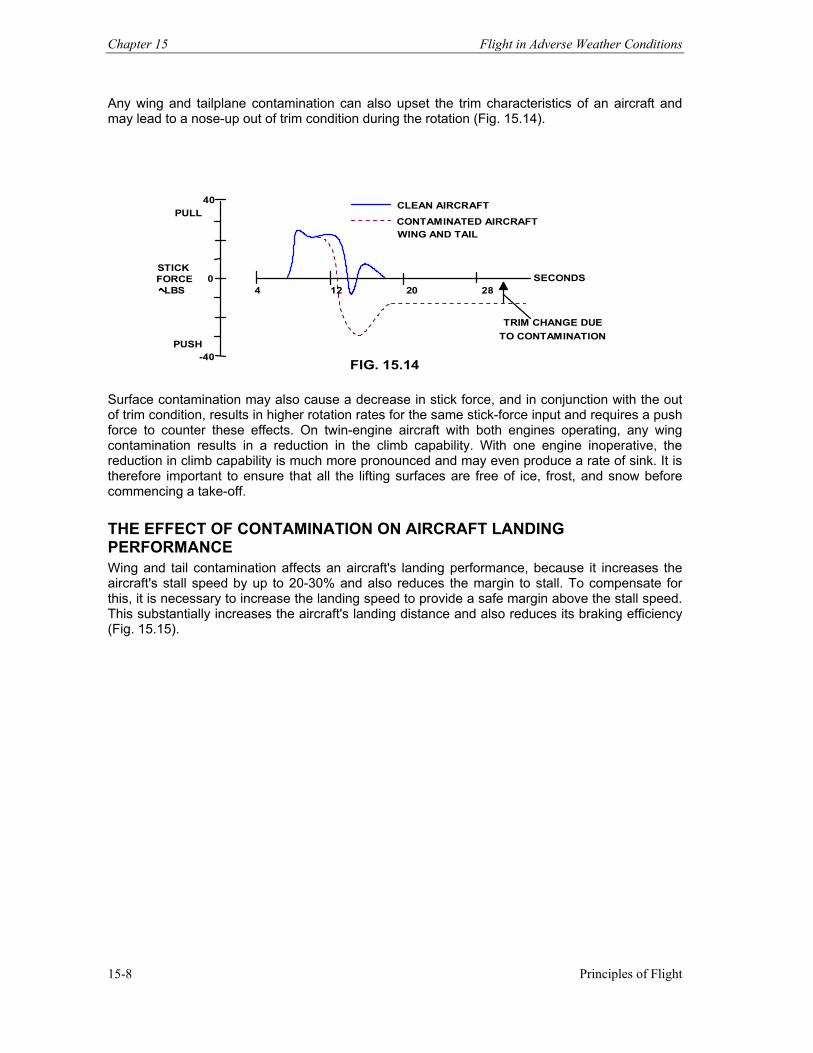
Chapter 15 Flight in Adverse Weather Conditions
Principles of Flight 15-8
Any wing and tailplane contamination can also upset the trim characteristics of an aircraft and may lead to a nose-up out of trim condition during the rotation (Fig. 15.14).
CLEAN AIRCRAFT
CONTAMINATED AIRCRAFTWING AND TAIL
PULL
PUSH
SECONDS
40
0
-40
STICK FORCE
LBS 4 12 20 28
TRIM CHANGE DUE TO CONTAMINATION
FIG. 15.14
Surface contamination may also cause a decrease in stick force, and in conjunction with the out of trim condition, results in higher rotation rates for the same stick-force input and requires a push force to counter these effects. On twin-engine aircraft with both engines operating, any wing contamination results in a reduction in the climb capability. With one engine inoperative, the reduction in climb capability is much more pronounced and may even produce a rate of sink. It is therefore important to ensure that all the lifting surfaces are free of ice, frost, and snow before commencing a take-off. THE EFFECT OF CONTAMINATION ON AIRCRAFT LANDING PERFORMANCE Wing and tail contamination affects an aircraft's landing performance, because it increases the aircraft's stall speed by up to 20-30% and also reduces the margin to stall. To compensate for this, it is necessary to increase the landing speed to provide a safe margin above the stall speed. This substantially increases the aircraft's landing distance and also reduces its braking efficiency (Fig. 15.15).
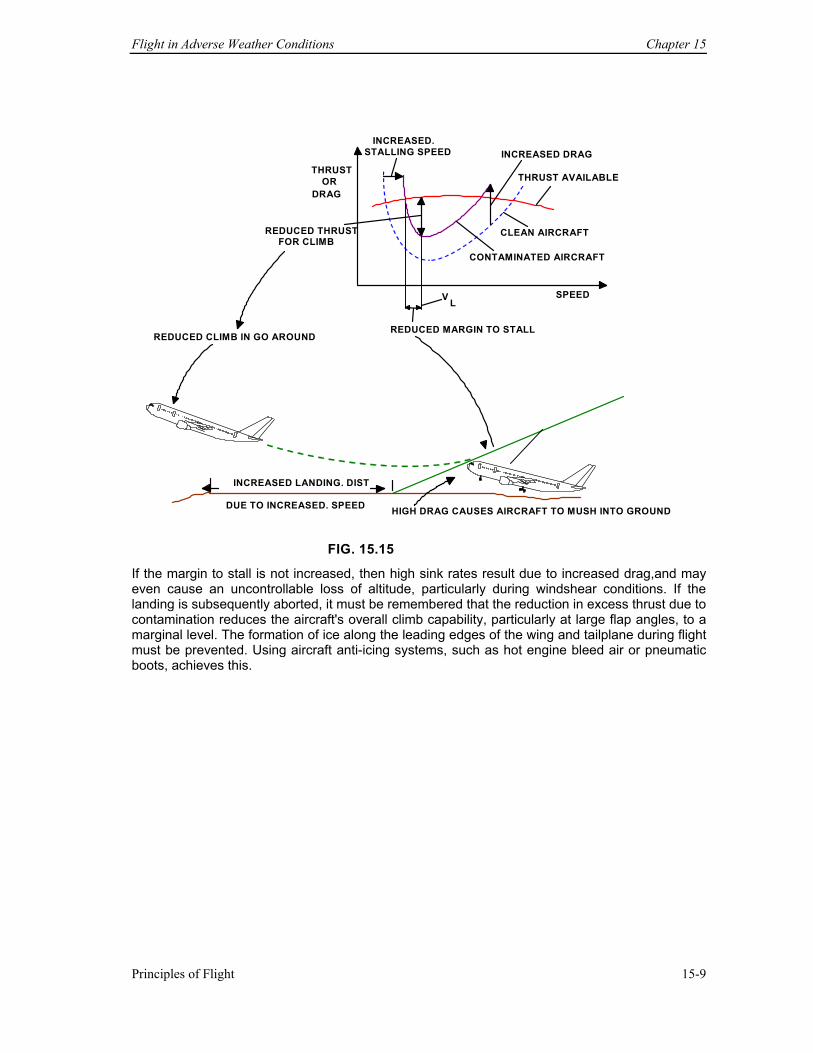
Flight in Adverse Weather Conditions Chapter 15
Principles of Flight 15-9
THRUSTOR
DRAG
INCREASED. STALLING SPEED INCREASED DRAG
THRUST AVAILABLE
CLEAN AIRCRAFT CONTAMINATED AIRCRAFT
SPEED REDUCED MARGIN TO STALL
REDUCED THRUSTFOR CLIMB
V L
INCREASED LANDING. DIST
REDUCED CLIMB IN GO AROUND
HIGH DRAG CAUSES AIRCRAFT TO MUSH INTO GROUND
FIG. 15.15
DUE TO INCREASED. SPEED
If the margin to stall is not increased, then high sink rates result due to increased drag,and may even cause an uncontrollable loss of altitude, particularly during windshear conditions. If the landing is subsequently aborted, it must be remembered that the reduction in excess thrust due to contamination reduces the aircraft's overall climb capability, particularly at large flap angles, to a marginal level. The formation of ice along the leading edges of the wing and tailplane during flight must be prevented. Using aircraft anti-icing systems, such as hot engine bleed air or pneumatic boots, achieves this.
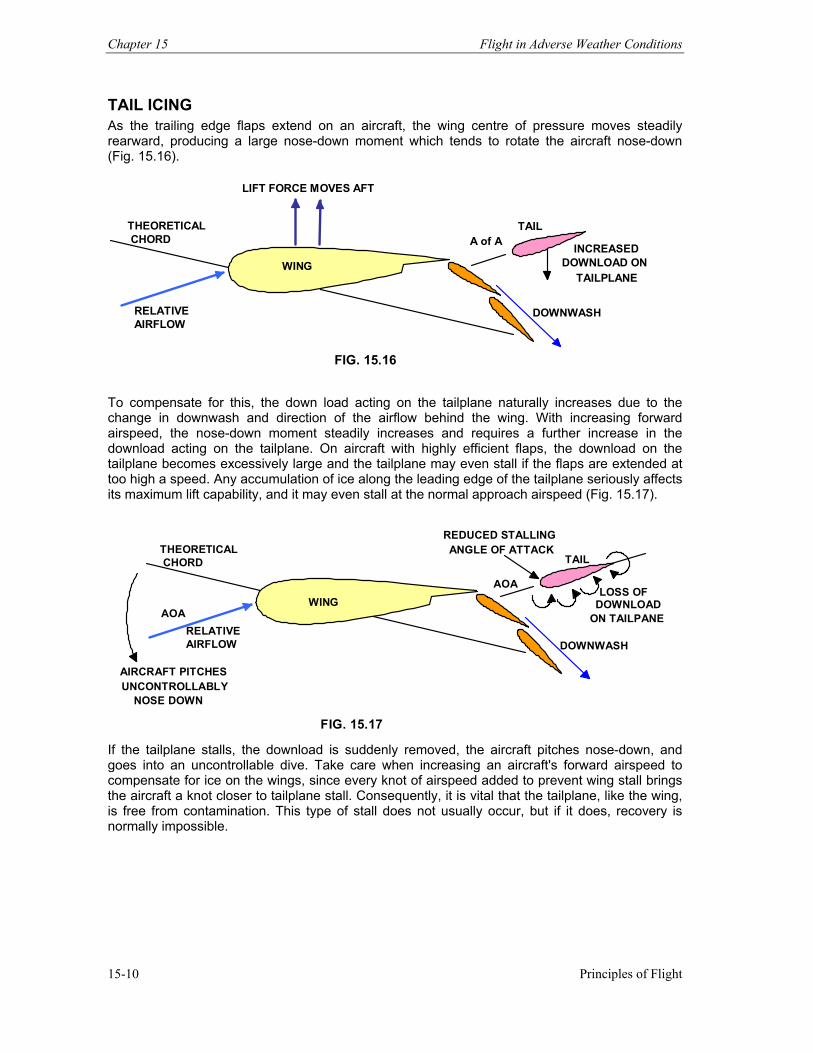
Chapter 15 Flight in Adverse Weather Conditions
Principles of Flight 15-10
TAIL ICING As the trailing edge flaps extend on an aircraft, the wing centre of pressure moves steadily rearward, producing a large nose-down moment which tends to rotate the aircraft nose-down (Fig. 15.16).
LIFT FORCE MOVES AFT
THEORETICAL CHORD
RELATIVE AIRFLOW
A of A
DOWNWASH
INCREASED DOWNLOAD ON
TAILPLANE WING TAIL
FIG. 15.16
To compensate for this, the down load acting on the tailplane naturally increases due to the change in downwash and direction of the airflow behind the wing. With increasing forward airspeed, the nose-down moment steadily increases and requires a further increase in the download acting on the tailplane. On aircraft with highly efficient flaps, the download on the tailplane becomes excessively large and the tailplane may even stall if the flaps are extended at too high a speed. Any accumulation of ice along the leading edge of the tailplane seriously affects its maximum lift capability, and it may even stall at the normal approach airspeed (Fig. 15.17).
THEORETICAL CHORD
RELATIVE AIRFLOW
AOA
AOA DOWNWASH
WING
TAIL REDUCED STALLINGANGLE OF ATTACK
LOSS OF DOWNLOAD
ON TAILPANE
UNCONTROLLABLY AIRCRAFT PITCHES NOSE DOWN
FIG. 15.17
If the tailplane stalls, the download is suddenly removed, the aircraft pitches nose-down, and goes into an uncontrollable dive. Take care when increasing an aircraft's forward airspeed to compensate for ice on the wings, since every knot of airspeed added to prevent wing stall brings the aircraft a knot closer to tailplane stall. Consequently, it is vital that the tailplane, like the wing, is free from contamination. This type of stall does not usually occur, but if it does, recovery is normally impossible.
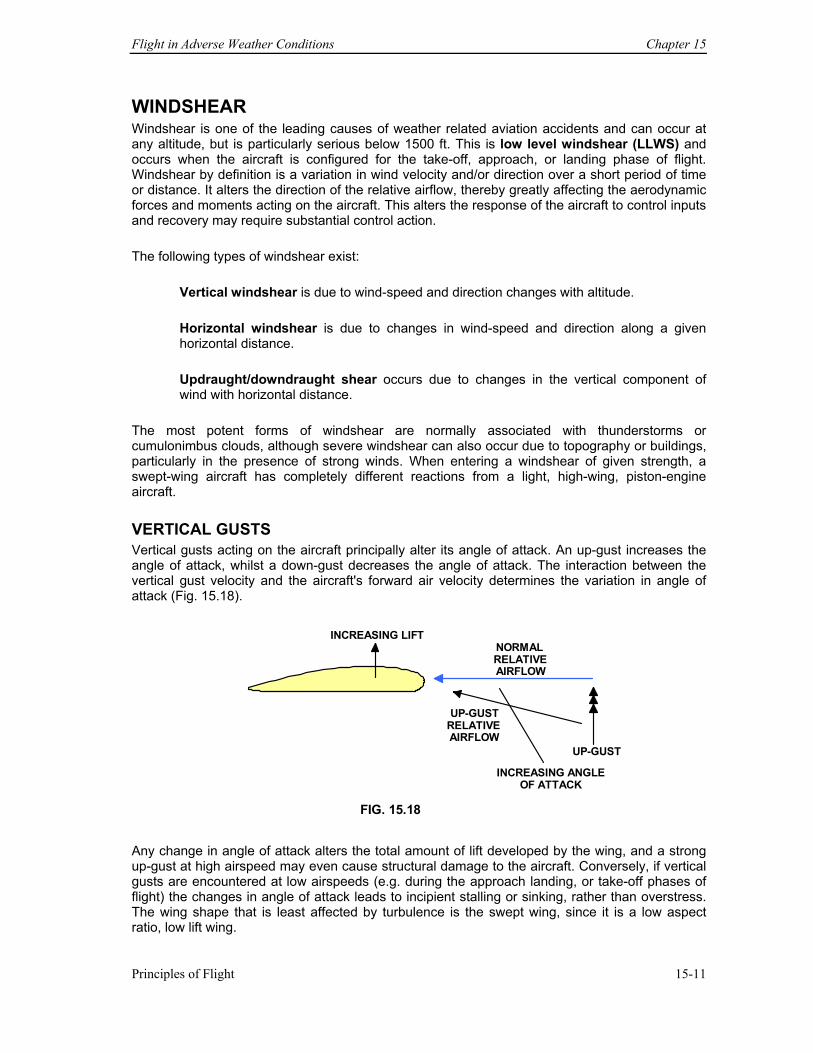
Flight in Adverse Weather Conditions Chapter 15
Principles of Flight 15-11
WINDSHEAR Windshear is one of the leading causes of weather related aviation accidents and can occur at any altitude, but is particularly serious below 1500 ft. This is low level windshear (LLWS) and occurs when the aircraft is configured for the take-off, approach, or landing phase of flight. Windshear by definition is a variation in wind velocity and/or direction over a short period of time or distance. It alters the direction of the relative airflow, thereby greatly affecting the aerodynamic forces and moments acting on the aircraft. This alters the response of the aircraft to control inputs and recovery may require substantial control action. The following types of windshear exist:
Vertical windshear is due to wind-speed and direction changes with altitude. Horizontal windshear is due to changes in wind-speed and direction along a given horizontal distance. Updraught/downdraught shear occurs due to changes in the vertical component of wind with horizontal distance.
The most potent forms of windshear are normally associated with thunderstorms or cumulonimbus clouds, although severe windshear can also occur due to topography or buildings, particularly in the presence of strong winds. When entering a windshear of given strength, a swept-wing aircraft has completely different reactions from a light, high-wing, piston-engine aircraft. VERTICAL GUSTS Vertical gusts acting on the aircraft principally alter its angle of attack. An up-gust increases the angle of attack, whilst a down-gust decreases the angle of attack. The interaction between the vertical gust velocity and the aircraft's forward air velocity determines the variation in angle of attack (Fig. 15.18).
INCREASING LIFTNORMALRELATIVEAIRFLOW
UP-GUSTRELATIVEAIRFLOW
UP-GUST INCREASING ANGLE
OF ATTACK FIG. 15.18
Any change in angle of attack alters the total amount of lift developed by the wing, and a strong up-gust at high airspeed may even cause structural damage to the aircraft. Conversely, if vertical gusts are encountered at low airspeeds (e.g. during the approach landing, or take-off phases of flight) the changes in angle of attack leads to incipient stalling or sinking, rather than overstress. The wing shape that is least affected by turbulence is the swept wing, since it is a low aspect ratio, low lift wing.
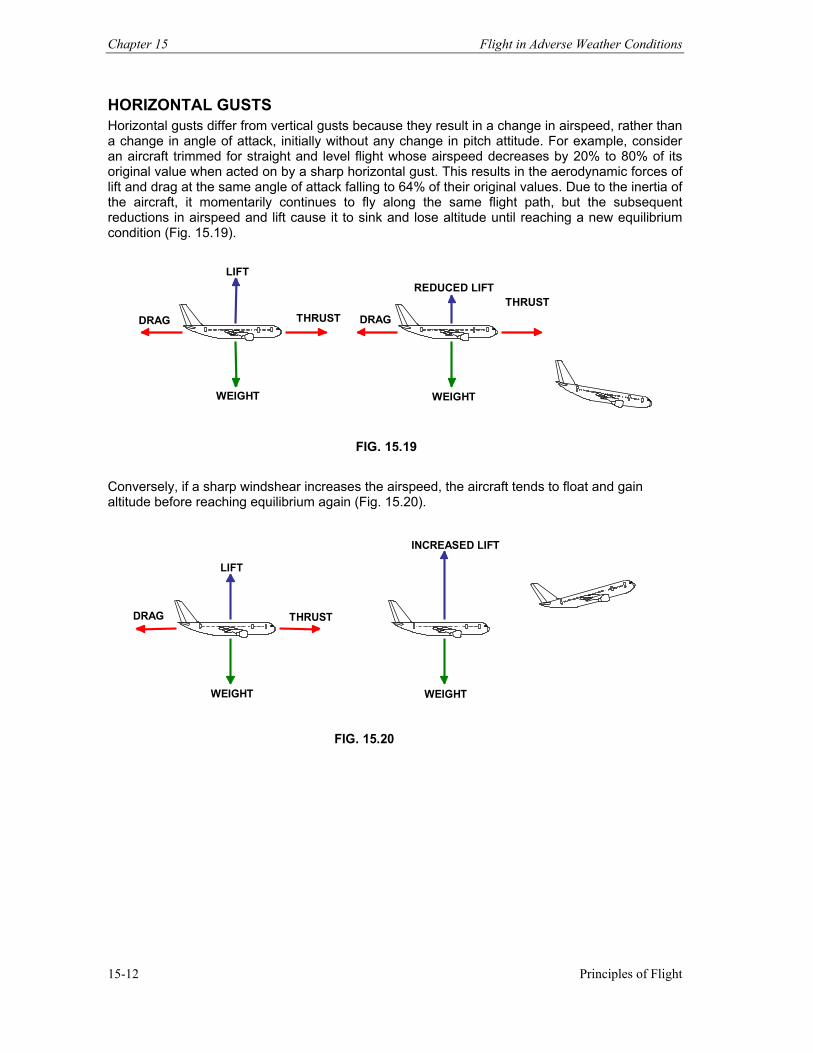
Chapter 15 Flight in Adverse Weather Conditions
Principles of Flight 15-12
HORIZONTAL GUSTS Horizontal gusts differ from vertical gusts because they result in a change in airspeed, rather than a change in angle of attack, initially without any change in pitch attitude. For example, consider an aircraft trimmed for straight and level flight whose airspeed decreases by 20% to 80% of its original value when acted on by a sharp horizontal gust. This results in the aerodynamic forces of lift and drag at the same angle of attack falling to 64% of their original values. Due to the inertia of the aircraft, it momentarily continues to fly along the same flight path, but the subsequent reductions in airspeed and lift cause it to sink and lose altitude until reaching a new equilibrium condition (Fig. 15.19).
WEIGHT
REDUCED LIFTTHRUST
DRAG
WEIGHT
LIFT
THRUSTDRAG
FIG. 15.19
Conversely, if a sharp windshear increases the airspeed, the aircraft tends to float and gain altitude before reaching equilibrium again (Fig. 15.20).
INCREASED LIFT
WEIGHTWEIGHT
LIFT
THRUSTDRAG
FIG. 15.20
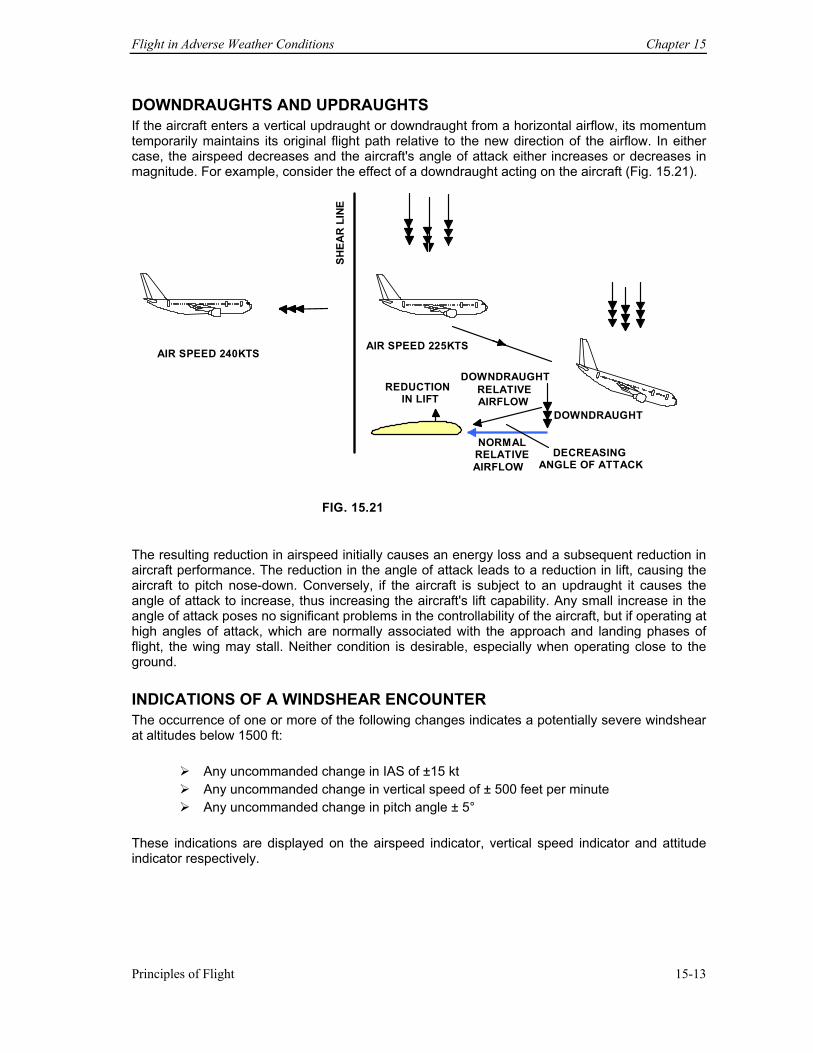
Flight in Adverse Weather Conditions Chapter 15
Principles of Flight 15-13
DOWNDRAUGHTS AND UPDRAUGHTS If the aircraft enters a vertical updraught or downdraught from a horizontal airflow, its momentum temporarily maintains its original flight path relative to the new direction of the airflow. In either case, the airspeed decreases and the aircraft's angle of attack either increases or decreases in magnitude. For example, consider the effect of a downdraught acting on the aircraft (Fig. 15.21).
AIR SPEED 240KTS SH
EAR
LIN
E AIR SPEED 225KTS
REDUCTIONIN LIFT
DOWNDRAUGHTRELATIVEAIRFLOW
DOWNDRAUGHT
NORMALRELATIVE AIRFLOW
DECREASING ANGLE OF ATTACK
FIG. 15.21
The resulting reduction in airspeed initially causes an energy loss and a subsequent reduction in aircraft performance. The reduction in the angle of attack leads to a reduction in lift, causing the aircraft to pitch nose-down. Conversely, if the aircraft is subject to an updraught it causes the angle of attack to increase, thus increasing the aircraft's lift capability. Any small increase in the angle of attack poses no significant problems in the controllability of the aircraft, but if operating at high angles of attack, which are normally associated with the approach and landing phases of flight, the wing may stall. Neither condition is desirable, especially when operating close to the ground. INDICATIONS OF A WINDSHEAR ENCOUNTER The occurrence of one or more of the following changes indicates a potentially severe windshear at altitudes below 1500 ft:
Any uncommanded change in IAS of ±15 kt Any uncommanded change in vertical speed of ± 500 feet per minute Any uncommanded change in pitch angle ± 5°
These indications are displayed on the airspeed indicator, vertical speed indicator and attitude indicator respectively.
Chapter 15 Flight in Adverse Weather Conditions
Principles of Flight 15-14
GENERAL RECOVERY FROM A WINDSHEAR ENCOUNTER Take the following actions to counter the effects of a windshear at low altitude:
Briskly increase power (full thrust if necessary). Increase the pitch attitude to check the descent. Co-ordinate power and pitch. If on the approach, be prepared to carry out a missed approach rather than risk
landing from a destabilised condition. RECOVERY FROM A WINDSHEAR ENCOUNTER DURING THE TAKE-OFF, APPROACH, AND LANDING If preventative action following a windshear encounter is unsuccessful, or flight path control becomes marginal below 500 ft during the take-off or landing phases of flight the following actions should be carried out simultaneously:
Disengage the auto-throttle and aggressively advance the thrust levers to ensure maximum rated thrust is attained.
Disengage the auto-pilot and smoothly increase the aircraft pitch attitude using the stick shaker as an upper limit if necessary in order to check the descent.
Except where a windshear escape guidance mode is incorporated, use the attitude director indicator as the primary reference for pitch attitude during the recovery from a windshear encounter and generally ignore flight director guidance. The aircraft configuration (e.g. undercarriage and flaps) should remain the same until the vertical flight path is under control. Any attempt to regain lost airspeed should also be disregarded until ground contact is no longer a factor.
Note: During the recovery, refer to the vertical speed indicator and altimeter when co-ordinating power and pitch attitude until the rate of sink decreases to zero, or a positive rate of climb is achieved. Conversely, if a windshear encounter occurs near the normal point of rotation, indicated by a sudden rise in IAS and quickly followed by a decrease in airspeed, the subsequent loss of lift may totally preclude a successful take-off. If there is insufficient runway to stop at this stage, then either increasing the airspeed and/or increasing the pitch attitude can alternatively obtain the required lift. Additional thrust also helps to accelerate the aircraft, but if the remaining runway is insufficient to reach the normal take-off speed, even at maximum thrust, the pitch attitude should be increased to make use of the available airspeed in order to generate enough lift, thus trading airspeed for altitude.
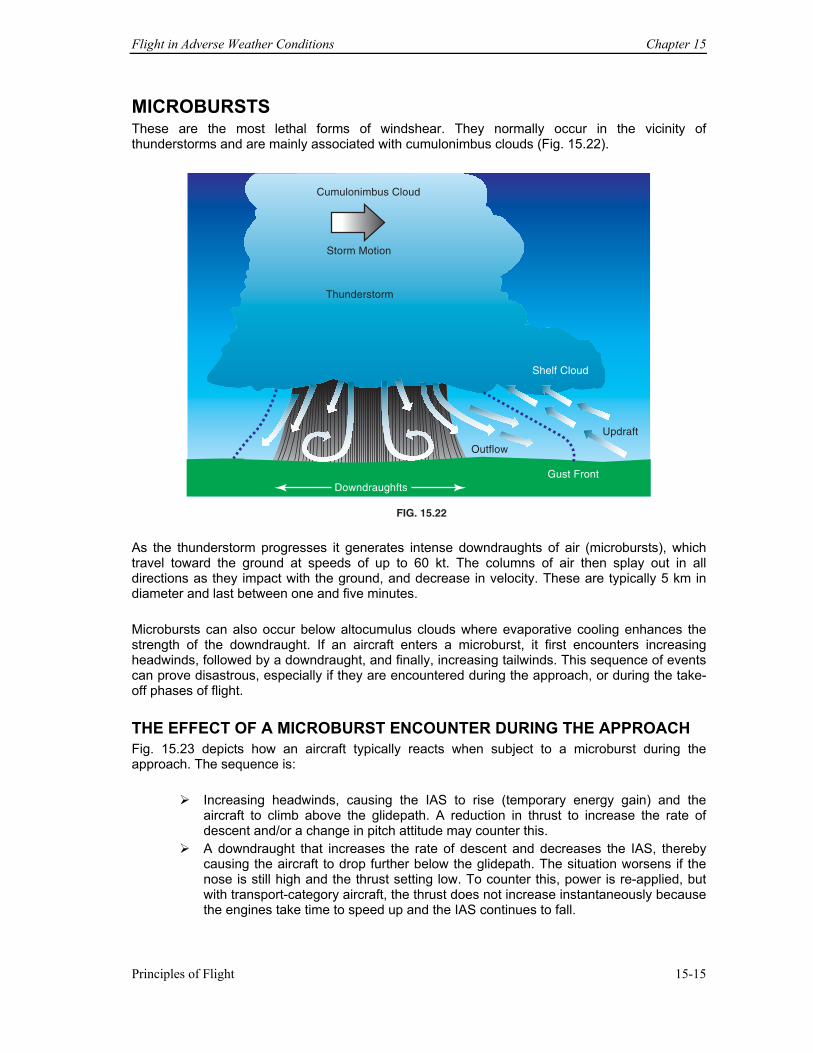
Flight in Adverse Weather Conditions Chapter 15
Principles of Flight 15-15
MICROBURSTS These are the most lethal forms of windshear. They normally occur in the vicinity of thunderstorms and are mainly associated with cumulonimbus clouds (Fig. 15.22).
Storm Motion
Outflow
Updraft
Gust FrontDowndraughfts
Shelf Cloud
FIG. 15.22
Cumulonimbus Cloud
Thunderstorm
As the thunderstorm progresses it generates intense downdraughts of air (microbursts), which travel toward the ground at speeds of up to 60 kt. The columns of air then splay out in all directions as they impact with the ground, and decrease in velocity. These are typically 5 km in diameter and last between one and five minutes. Microbursts can also occur below altocumulus clouds where evaporative cooling enhances the strength of the downdraught. If an aircraft enters a microburst, it first encounters increasing headwinds, followed by a downdraught, and finally, increasing tailwinds. This sequence of events can prove disastrous, especially if they are encountered during the approach, or during the take-off phases of flight. THE EFFECT OF A MICROBURST ENCOUNTER DURING THE APPROACH Fig. 15.23 depicts how an aircraft typically reacts when subject to a microburst during the approach. The sequence is:
Increasing headwinds, causing the IAS to rise (temporary energy gain) and the aircraft to climb above the glidepath. A reduction in thrust to increase the rate of descent and/or a change in pitch attitude may counter this.
A downdraught that increases the rate of descent and decreases the IAS, thereby causing the aircraft to drop further below the glidepath. The situation worsens if the nose is still high and the thrust setting low. To counter this, power is re-applied, but with transport-category aircraft, the thrust does not increase instantaneously because the engines take time to speed up and the IAS continues to fall.
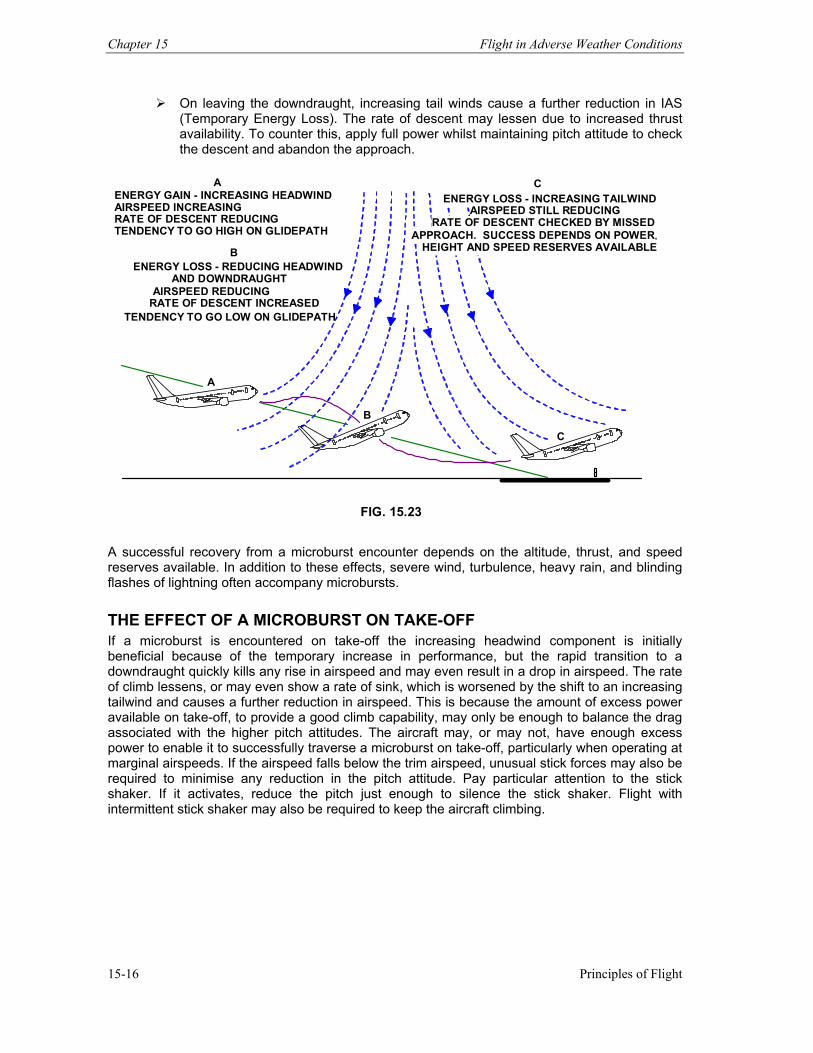
Chapter 15 Flight in Adverse Weather Conditions
Principles of Flight 15-16
On leaving the downdraught, increasing tail winds cause a further reduction in IAS (Temporary Energy Loss). The rate of descent may lessen due to increased thrust availability. To counter this, apply full power whilst maintaining pitch attitude to check the descent and abandon the approach.
A ENERGY GAIN - INCREASING HEADWINDAIRSPEED INCREASING RATE OF DESCENT REDUCING TENDENCY TO GO HIGH ON GLIDEPATH
B ENERGY LOSS - REDUCING HEADWIND
AND DOWNDRAUGHT AIRSPEED REDUCING
RATE OF DESCENT INCREASED TENDENCY TO GO LOW ON GLIDEPATH
CENERGY LOSS - INCREASING TAILWIND
AIRSPEED STILL REDUCING RATE OF DESCENT CHECKED BY MISSED
APPROACH. SUCCESS DEPENDS ON POWER,HEIGHT AND SPEED RESERVES AVAILABLE
A B
C
FIG. 15.23
A successful recovery from a microburst encounter depends on the altitude, thrust, and speed reserves available. In addition to these effects, severe wind, turbulence, heavy rain, and blinding flashes of lightning often accompany microbursts. THE EFFECT OF A MICROBURST ON TAKE-OFF If a microburst is encountered on take-off the increasing headwind component is initially beneficial because of the temporary increase in performance, but the rapid transition to a downdraught quickly kills any rise in airspeed and may even result in a drop in airspeed. The rate of climb lessens, or may even show a rate of sink, which is worsened by the shift to an increasing tailwind and causes a further reduction in airspeed. This is because the amount of excess power available on take-off, to provide a good climb capability, may only be enough to balance the drag associated with the higher pitch attitudes. The aircraft may, or may not, have enough excess power to enable it to successfully traverse a microburst on take-off, particularly when operating at marginal airspeeds. If the airspeed falls below the trim airspeed, unusual stick forces may also be required to minimise any reduction in the pitch attitude. Pay particular attention to the stick shaker. If it activates, reduce the pitch just enough to silence the stick shaker. Flight with intermittent stick shaker may also be required to keep the aircraft climbing.
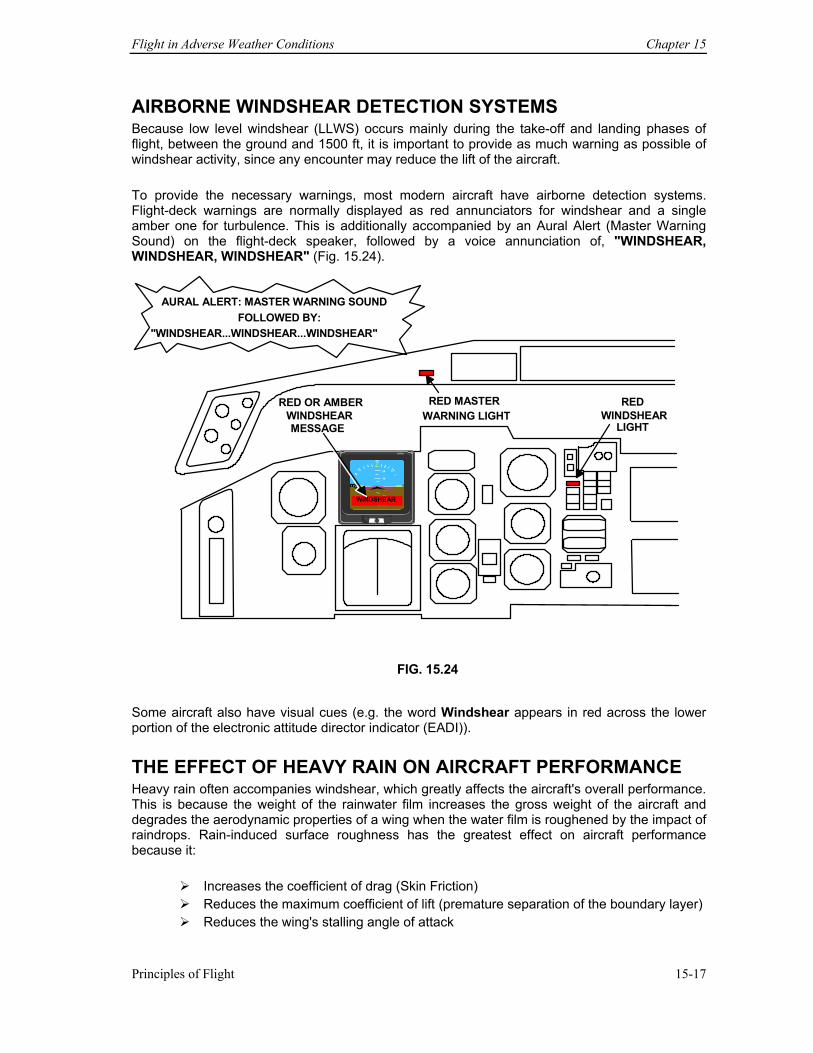
Flight in Adverse Weather Conditions Chapter 15
Principles of Flight 15-17
AIRBORNE WINDSHEAR DETECTION SYSTEMS Because low level windshear (LLWS) occurs mainly during the take-off and landing phases of flight, between the ground and 1500 ft, it is important to provide as much warning as possible of windshear activity, since any encounter may reduce the lift of the aircraft. To provide the necessary warnings, most modern aircraft have airborne detection systems. Flight-deck warnings are normally displayed as red annunciators for windshear and a single amber one for turbulence. This is additionally accompanied by an Aural Alert (Master Warning Sound) on the flight-deck speaker, followed by a voice annunciation of, "WINDSHEAR, WINDSHEAR, WINDSHEAR" (Fig. 15.24).
1 7
10
20
10
20
Collins
65
AURAL ALERT: MASTER WARNING SOUNDFOLLOWED BY:
"WINDSHEAR...WINDSHEAR...WINDSHEAR"
RED MASTERWARNING LIGHT
RED OR AMBERWINDSHEARMESSAGE
RED WINDSHEAR
LIGHT
WINDSHEAR
FIG. 15.24
Some aircraft also have visual cues (e.g. the word Windshear appears in red across the lower portion of the electronic attitude director indicator (EADI)). THE EFFECT OF HEAVY RAIN ON AIRCRAFT PERFORMANCE Heavy rain often accompanies windshear, which greatly affects the aircraft's overall performance. This is because the weight of the rainwater film increases the gross weight of the aircraft and degrades the aerodynamic properties of a wing when the water film is roughened by the impact of raindrops. Rain-induced surface roughness has the greatest effect on aircraft performance because it:
Increases the coefficient of drag (Skin Friction) Reduces the maximum coefficient of lift (premature separation of the boundary layer) Reduces the wing's stalling angle of attack

Chapter 15 Flight in Adverse Weather Conditions
Principles of Flight 15-18
Principles of Flight 16-1
INTRODUCTION All structural components of an aircraft are made up of members manufactured from various materials, and are designed to safely distribute the forces or stresses acting on the aircraft. However, some components do not carry any structural stresses, and are designed purely to provide a streamlined shape (e.g. engine cowlings and wing fairings). The various structures must also be capable of dissipating additional stresses that exist during the manoeuvring phases of flight (e.g. banking and turning) when an aircraft is subject to acceleration forces (g forces). All aircraft are built to safely accommodate the highest stress level anticipated during normal operations (i.e. the maximum load the structure must withstand without sustaining permanent damage). All aircraft also have a specific range of g forces and speeds at which they can be safely operated. During the normal working life of the aircraft, the structure is also constantly subjected to varying stresses due to:
Flight manoeuvres Atmospheric turbulence Ground loads Cabin pressurisation and depressurisation Thermal effects Vibrations
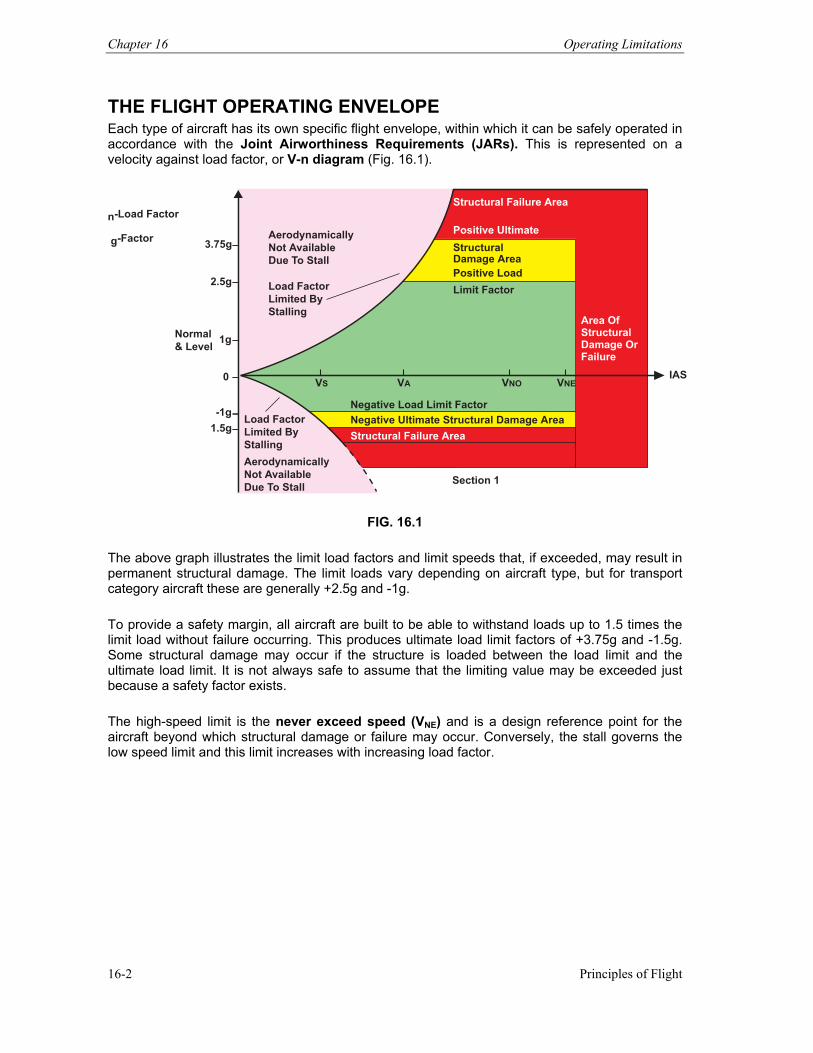
Chapter 16 Operating Limitations
Principles of Flight 16-2
THE FLIGHT OPERATING ENVELOPE Each type of aircraft has its own specific flight envelope, within which it can be safely operated in accordance with the Joint Airworthiness Requirements (JARs). This is represented on a velocity against load factor, or V-n diagram (Fig. 16.1).
VS VA VNO VNE
3.75g
2.5g
1g
0
-1g
1.5g
Section 1
Limit Factor
Negative Load Limit Factor
Positive Load
Structural Failure Area
Positive Ultimate
StructuralDamage Area
Normal
& Level
Area OfStructuralDamage OrFailure
IAS
n-Load Factor
g-Factor Aerodynamically
Not Available
Due To Stall
Load Factor
Limited By
Stalling
Load Factor
Limited By
Stalling
Aerodynamically
Not Available
Due To Stall
Negative Ultimate Structural Damage Area
Structural Failure Area
FIG. 16.1 The above graph illustrates the limit load factors and limit speeds that, if exceeded, may result in permanent structural damage. The limit loads vary depending on aircraft type, but for transport category aircraft these are generally +2.5g and -1g. To provide a safety margin, all aircraft are built to be able to withstand loads up to 1.5 times the limit load without failure occurring. This produces ultimate load limit factors of +3.75g and -1.5g. Some structural damage may occur if the structure is loaded between the load limit and the ultimate load limit. It is not always safe to assume that the limiting value may be exceeded just because a safety factor exists. The high-speed limit is the never exceed speed (VNE) and is a design reference point for the aircraft beyond which structural damage or failure may occur. Conversely, the stall governs the low speed limit and this limit increases with increasing load factor.
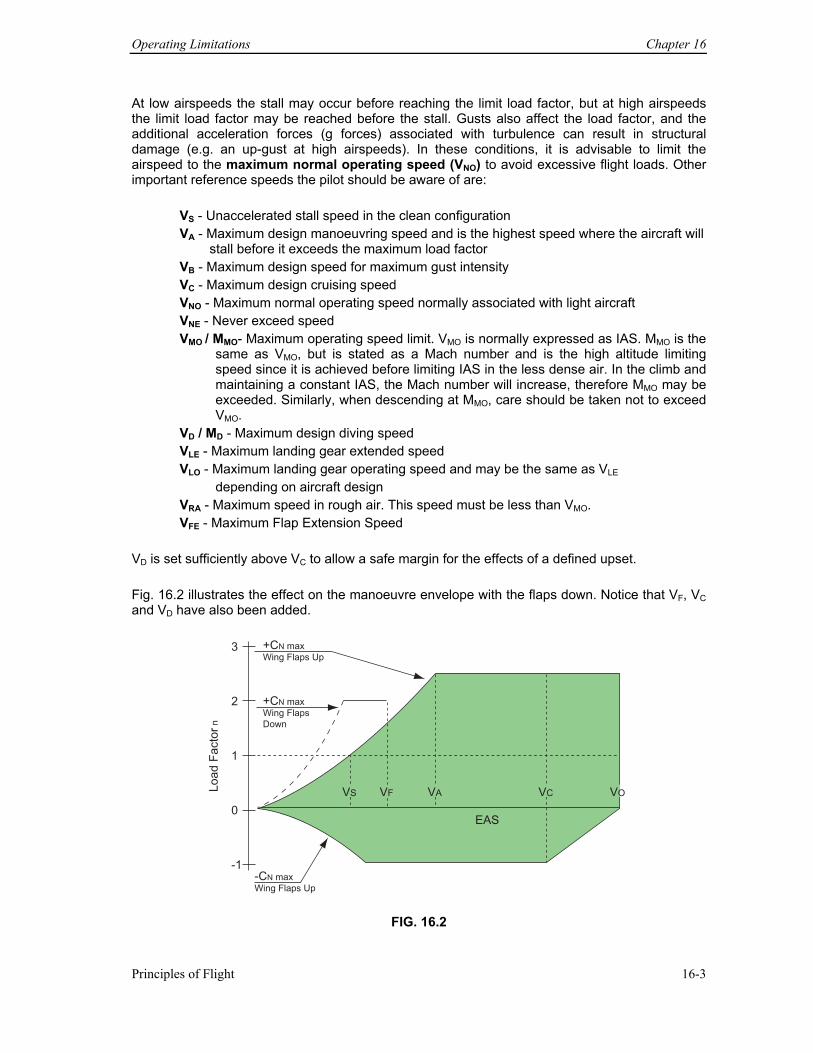
Operating Limitations Chapter 16
Principles of Flight 16-3
At low airspeeds the stall may occur before reaching the limit load factor, but at high airspeeds the limit load factor may be reached before the stall. Gusts also affect the load factor, and the additional acceleration forces (g forces) associated with turbulence can result in structural damage (e.g. an up-gust at high airspeeds). In these conditions, it is advisable to limit the airspeed to the maximum normal operating speed (VNO) to avoid excessive flight loads. Other important reference speeds the pilot should be aware of are:
VS - Unaccelerated stall speed in the clean configuration VA - Maximum design manoeuvring speed and is the highest speed where the aircraft will
stall before it exceeds the maximum load factor VB - Maximum design speed for maximum gust intensity VC - Maximum design cruising speed VNO - Maximum normal operating speed normally associated with light aircraft VNE - Never exceed speed VMO / MMO- Maximum operating speed limit. VMO is normally expressed as IAS. MMO is the
same as VMO, but is stated as a Mach number and is the high altitude limiting speed since it is achieved before limiting IAS in the less dense air. In the climb and maintaining a constant IAS, the Mach number will increase, therefore MMO may be exceeded. Similarly, when descending at MMO, care should be taken not to exceed VMO.
VD / MD - Maximum design diving speed VLE - Maximum landing gear extended speed VLO - Maximum landing gear operating speed and may be the same as VLE
depending on aircraft design VRA - Maximum speed in rough air. This speed must be less than VMO. VFE - Maximum Flap Extension Speed
VD is set sufficiently above VC to allow a safe margin for the effects of a defined upset. Fig. 16.2 illustrates the effect on the manoeuvre envelope with the flaps down. Notice that VF, VC and VD have also been added.
EAS
VS VF VA VC VO
3
2
1
0
-1
+CN max
Wing Flaps Up
+CN max
Wing Flaps
Down
-CN max
Wing Flaps Up
Lo
ad
Fa
cto
r n
FIG. 16.2
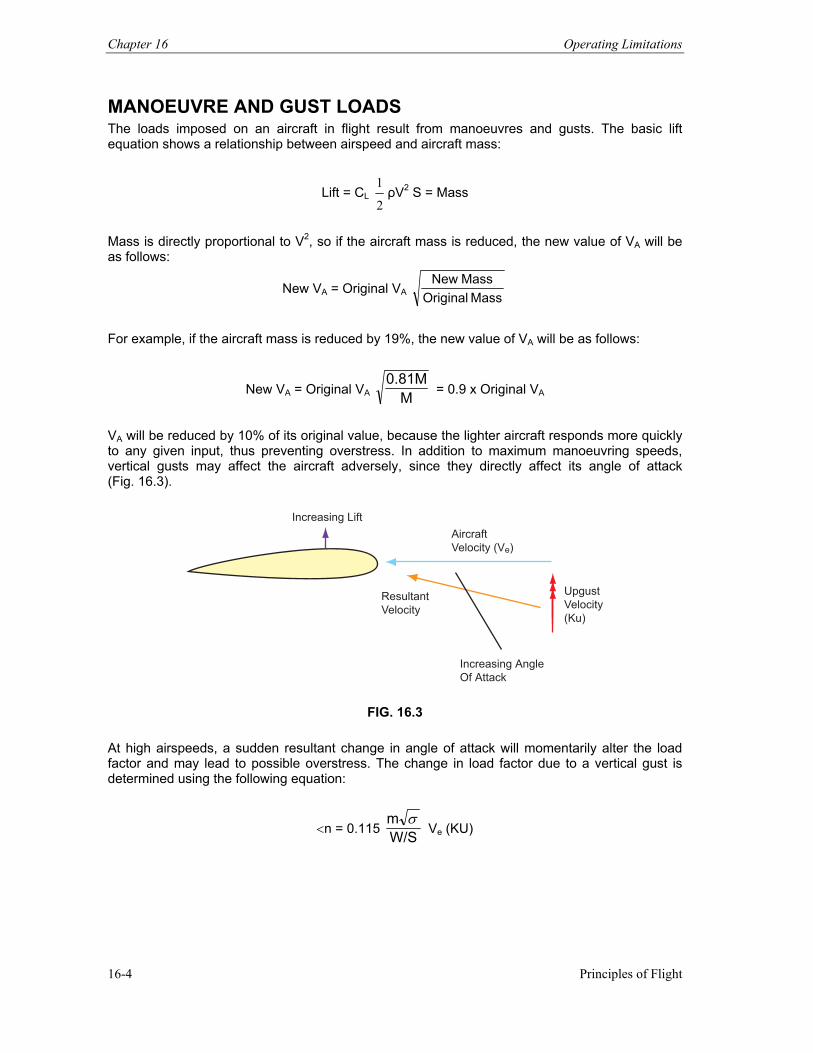
Chapter 16 Operating Limitations
Principles of Flight 16-4
MANOEUVRE AND GUST LOADS The loads imposed on an aircraft in flight result from manoeuvres and gusts. The basic lift equation shows a relationship between airspeed and aircraft mass:
Lift = CL 2
1ρV2 S = Mass
Mass is directly proportional to V2, so if the aircraft mass is reduced, the new value of VA will be as follows:
New VA = Original VA Mass Original
MassNew
For example, if the aircraft mass is reduced by 19%, the new value of VA will be as follows:
New VA = Original VA M0.81M
= 0.9 x Original VA
VA will be reduced by 10% of its original value, because the lighter aircraft responds more quickly to any given input, thus preventing overstress. In addition to maximum manoeuvring speeds, vertical gusts may affect the aircraft adversely, since they directly affect its angle of attack (Fig. 16.3).
Increasing Angle
Of Attack
Increasing Lift
Aircraft
Velocity (Ve)
Resultant
Velocity
Upgust
Velocity
(Ku)
FIG. 16.3
At high airspeeds, a sudden resultant change in angle of attack will momentarily alter the load factor and may lead to possible overstress. The change in load factor due to a vertical gust is determined using the following equation:
<n = 0.115 W/Sm σ
Ve (KU)
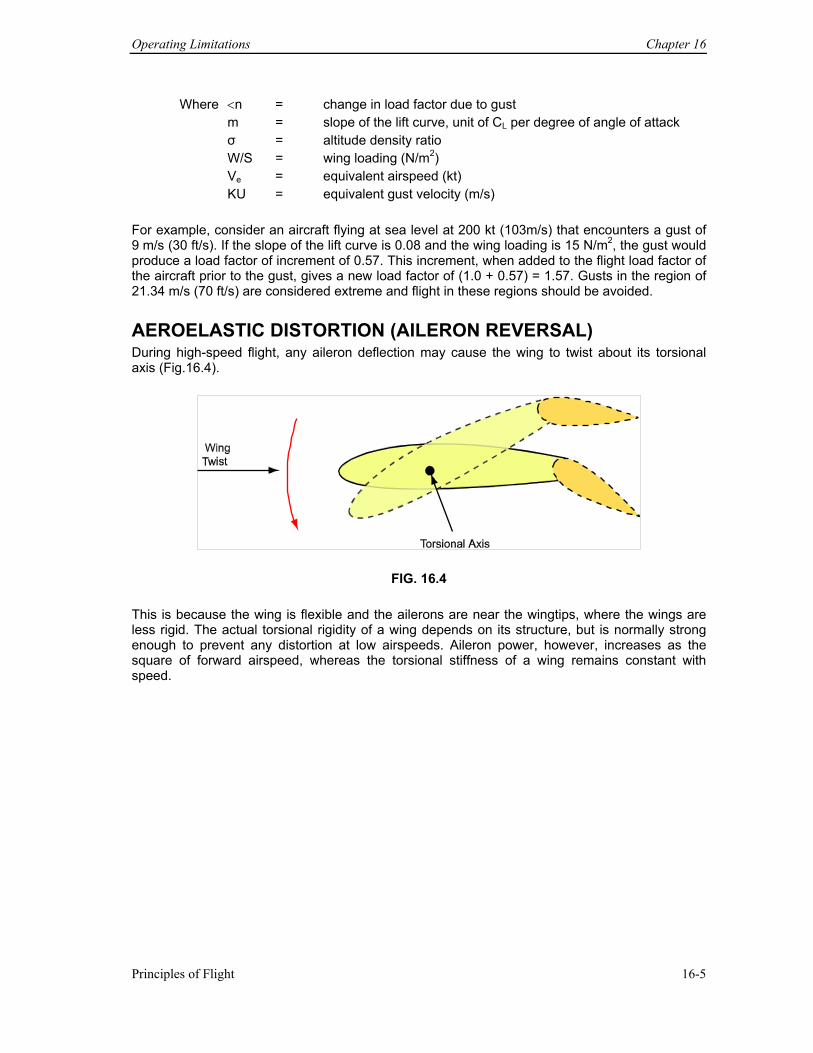
Operating Limitations Chapter 16
Principles of Flight 16-5
Where <n = change in load factor due to gust m = slope of the lift curve, unit of CL per degree of angle of attack σ = altitude density ratio W/S = wing loading (N/m2) Ve = equivalent airspeed (kt) KU = equivalent gust velocity (m/s) For example, consider an aircraft flying at sea level at 200 kt (103m/s) that encounters a gust of 9 m/s (30 ft/s). If the slope of the lift curve is 0.08 and the wing loading is 15 N/m2, the gust would produce a load factor of increment of 0.57. This increment, when added to the flight load factor of the aircraft prior to the gust, gives a new load factor of (1.0 + 0.57) = 1.57. Gusts in the region of 21.34 m/s (70 ft/s) are considered extreme and flight in these regions should be avoided.
AEROELASTIC DISTORTION (AILERON REVERSAL) During high-speed flight, any aileron deflection may cause the wing to twist about its torsional axis (Fig.16.4).
FIG. 16.4 This is because the wing is flexible and the ailerons are near the wingtips, where the wings are less rigid. The actual torsional rigidity of a wing depends on its structure, but is normally strong enough to prevent any distortion at low airspeeds. Aileron power, however, increases as the square of forward airspeed, whereas the torsional stiffness of a wing remains constant with speed.
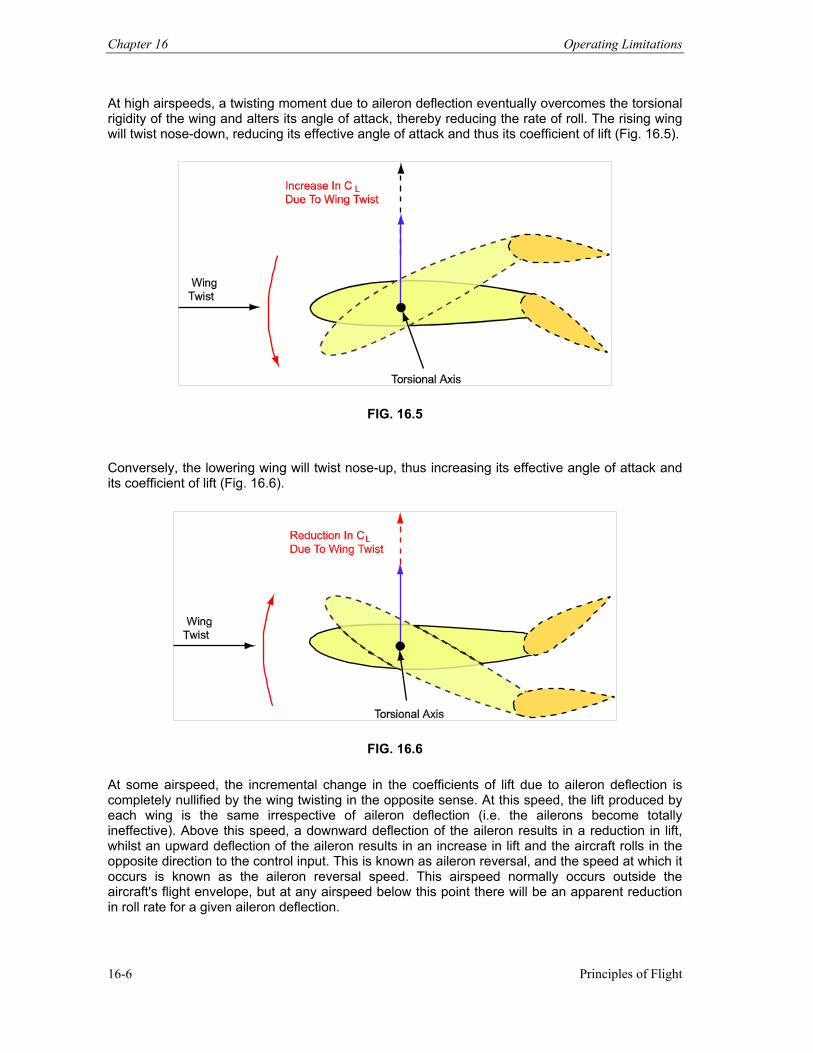
Chapter 16 Operating Limitations
Principles of Flight 16-6
At high airspeeds, a twisting moment due to aileron deflection eventually overcomes the torsional rigidity of the wing and alters its angle of attack, thereby reducing the rate of roll. The rising wing will twist nose-down, reducing its effective angle of attack and thus its coefficient of lift (Fig. 16.5).
FIG. 16.5
Conversely, the lowering wing will twist nose-up, thus increasing its effective angle of attack and its coefficient of lift (Fig. 16.6).
FIG. 16.6
At some airspeed, the incremental change in the coefficients of lift due to aileron deflection is completely nullified by the wing twisting in the opposite sense. At this speed, the lift produced by each wing is the same irrespective of aileron deflection (i.e. the ailerons become totally ineffective). Above this speed, a downward deflection of the aileron results in a reduction in lift, whilst an upward deflection of the aileron results in an increase in lift and the aircraft rolls in the opposite direction to the control input. This is known as aileron reversal, and the speed at which it occurs is known as the aileron reversal speed. This airspeed normally occurs outside the aircraft's flight envelope, but at any airspeed below this point there will be an apparent reduction in roll rate for a given aileron deflection.
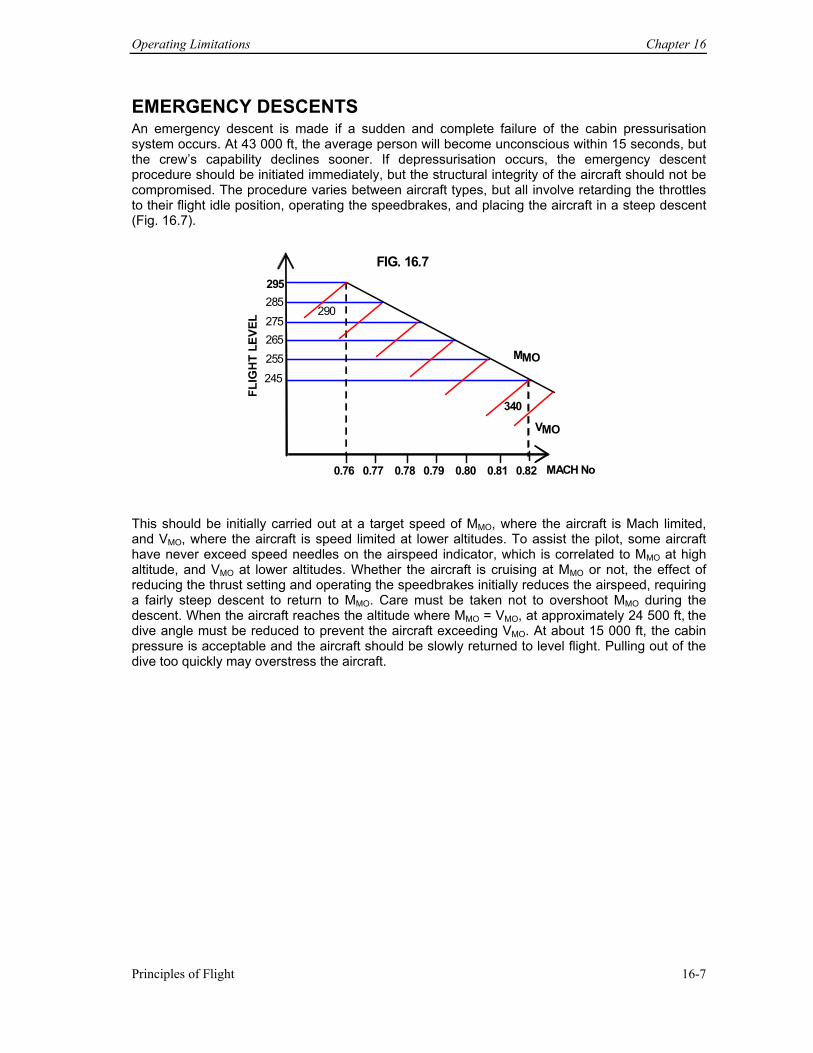
Operating Limitations Chapter 16
Principles of Flight 16-7
EMERGENCY DESCENTS An emergency descent is made if a sudden and complete failure of the cabin pressurisation system occurs. At 43 000 ft, the average person will become unconscious within 15 seconds, but the crew’s capability declines sooner. If depressurisation occurs, the emergency descent procedure should be initiated immediately, but the structural integrity of the aircraft should not be compromised. The procedure varies between aircraft types, but all involve retarding the throttles to their flight idle position, operating the speedbrakes, and placing the aircraft in a steep descent (Fig. 16.7).
FIG. 16.7295
MMO
0.76 0.77 0.78 0.79 0.80 0.81 0.82
FLIG
HT
LEVE
L
MACH No
285
275 265 255
245
VMO
290
340
This should be initially carried out at a target speed of MMO, where the aircraft is Mach limited, and VMO, where the aircraft is speed limited at lower altitudes. To assist the pilot, some aircraft have never exceed speed needles on the airspeed indicator, which is correlated to MMO at high altitude, and VMO at lower altitudes. Whether the aircraft is cruising at MMO or not, the effect of reducing the thrust setting and operating the speedbrakes initially reduces the airspeed, requiring a fairly steep descent to return to MMO. Care must be taken not to overshoot MMO during the descent. When the aircraft reaches the altitude where MMO = VMO, at approximately 24 500 ft, the dive angle must be reduced to prevent the aircraft exceeding VMO. At about 15 000 ft, the cabin pressure is acceptable and the aircraft should be slowly returned to level flight. Pulling out of the dive too quickly may overstress the aircraft.
Chapter 16 Operating Limitations
Principles of Flight 16-8


![Flight! Magazin - Flight! Oktober 2012 [BEST OF]](https://img.pdfslide.us/doc/110x75/579053d21a28ab900c8dda9f/flight-magazin-flight-oktober-2012-best-of.jpg)