Embed Size (px)
Citation preview

Experimental Investigation of Energy, Bandwidth and Modulation on Spectrum
Sensingby
Jems Pradhan
1
Major Professor :Dr.Yanxiao Zhao Committee Members :Dr. Dimitrios E Anagnostou, Dr. Cassendra Degen
Master of Science in Electrical Engineering South Dakota School of Mines and Technology Rapid City, July 6, 2015
[email protected], July 6, 2015

2
OUTLINE
• BACKGROUND
• Energy-and-Bandwidth Spectrum Sensing (EBSS)
• Two-Stage Spectrum Sensing• Conclusion • Future Work
[email protected], July 6, 2015
Static and Dynamic Spectrum PolicySpectrum Sensing Methods
Experimental VerificationSensing performance comparison with energy detection
Theoretical Analysis Experimental Analysis

[email protected], July 6, 2015

5
Dynamic Spectrum Access
Dynamic Exclusive Use Model Open Sharing Mode Hierarchical Access
Model
Spectrum Property Rights
Dynamic Spectrum Allocation Spectrum Underlay Spectrum Overlay
[email protected], July 6, 2015
6
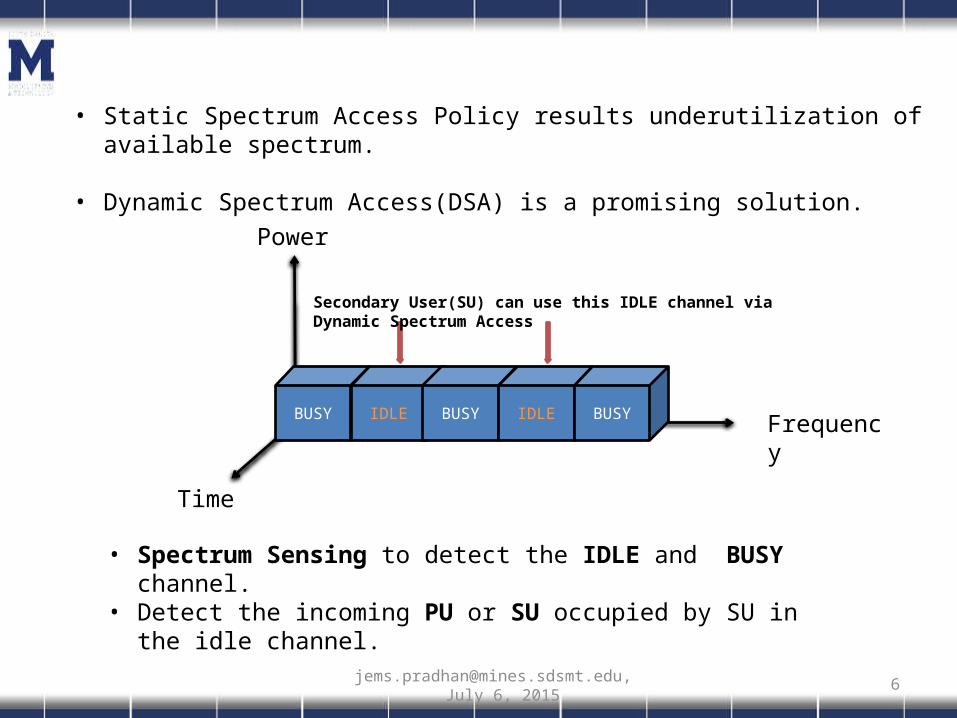
• Static Spectrum Access Policy results underutilization of available spectrum.
• Dynamic Spectrum Access(DSA) is a promising solution.
Frequency
Power
Time
BUSY IDLE BUSY IDLE BUSY
Secondary User(SU) can use this IDLE channel via Dynamic Spectrum Access
• Spectrum Sensing to detect the IDLE and BUSY channel.• Detect the incoming PU or SU occupied by SU in the idle channel.
[email protected], July 6, 2015

7
Spectrum Sensing Techniques:
[email protected], July 6, 2015
• Energy Detection Method: widely used
• Other Sensing Methods:
• Matched Filter Detection
• Waveform Based Sensing
• Radio Identification Based Sensing

8
Energy Detection Method:
ri= signal received by user Secondary User i ni = Additive White Gaussian Noise s= signal that Primary User transmits
λE= predefined Energy Threshold
[email protected], July 6, 2015

[email protected], July 6, 2015
9
Frequency (Channel)
Ener
gy L
evel
-------------------------------------------
Signal
NoiseEnergy Threshold
PROBLEM STATEMENT
Drawback of Energy Detection Method: What if the noise has an energy level greater than λE ?
Noise but considered as signal according to energy detection

10
Energy-and-Bandwidth Spectrum Sensing (EBSS):
λB = pre-defined bandwidth thresholdB = bandwidth of the received signal
• Energy of the received signal should be higher than the energy threshold .
• Bandwidth of the received signal should be higher than the bandwidth threshold.
(r > λE) AND (r > λB) =
False, if H0
True, if H1
[email protected], July 6, 2015

11
Principle of Energy Detection and EBSS
Frequency (Channel)
Ener
gy L
evel
Figure: Energy Detection Method
-------------------------------------------
Energy Threshold
False Alarm
Signal
Noise
Frequency (Channel)
Ener
gy L
evel
Figure: Energy-and Bandwidth Detection Method
-------------------------------------------
Energy Threshold
Signal
Noise
Noise
[email protected], July 6, 2015

12
SENSING PERFORMANCE
[email protected], July 6, 2015
• Sensing Performance Metrics– Probability of false alarm: Channel sensed busy when no signal is present– Probability of miss detection: Channel sensed idle when signal is present
P1f is the Probability of False alarm for Energy Detection Method
P1m is the Probability of Miss Detection for Energy Detection Method
P1f = Pr(r > λE / H0)
P1m = Pr(r < λE / H1)
P2f is the Probability of False Alarm for EBSS
P2m is the Probability of Miss Detection for EBSS
P2f = Pr[(r > λE) AND (b> λB) / H0]
P2m = Pr{NOT[(r > λE) AND (b> λB)] / H1}
= Pr{[(r < λE) OR (b < λB)] / H1}

14
GNU Radio and USRP
• GNU Radio Software is a free and open source software for Software Defined Radio.
• USRP N200.
• Motherboard (XILINX Spartan 3A-DSP 1800).• Daughter board XCVR2450.• Operating frequency range of XCVR2450 2.4-2.5GHz and 4.95-5.85GHz
which is an ISM band.• Antenna used is the VERT2450 vertical antenna with dual band (2.4 -
2.5 and 4.9 - 5.9 GHz).
[email protected], July 6, 2015
Received Signal LNA IF
DAUGHTER BOARD
ADC DDC
MOTHERBOARD
HOST COMPUTER GNU SOFTWARE

16
EXPERIMENTAL RESULTS
Frequency (GHz)
Ener
gy le
vel (
dB)
Figure: USRP trying to receive 2.4 GHz Signal when no signal was sent from the transmitter .
[email protected], July 6, 2015

17
Frequency (GHz)
Ener
gy le
vel (
dB)
Figure: USRP Device receiving 2.4 GHz signal when 2.4 GHz was sent from the transmitter.
[email protected], July 6, 2015
18
Frequency (GHz)
Ener
gy le
vel (
dB)
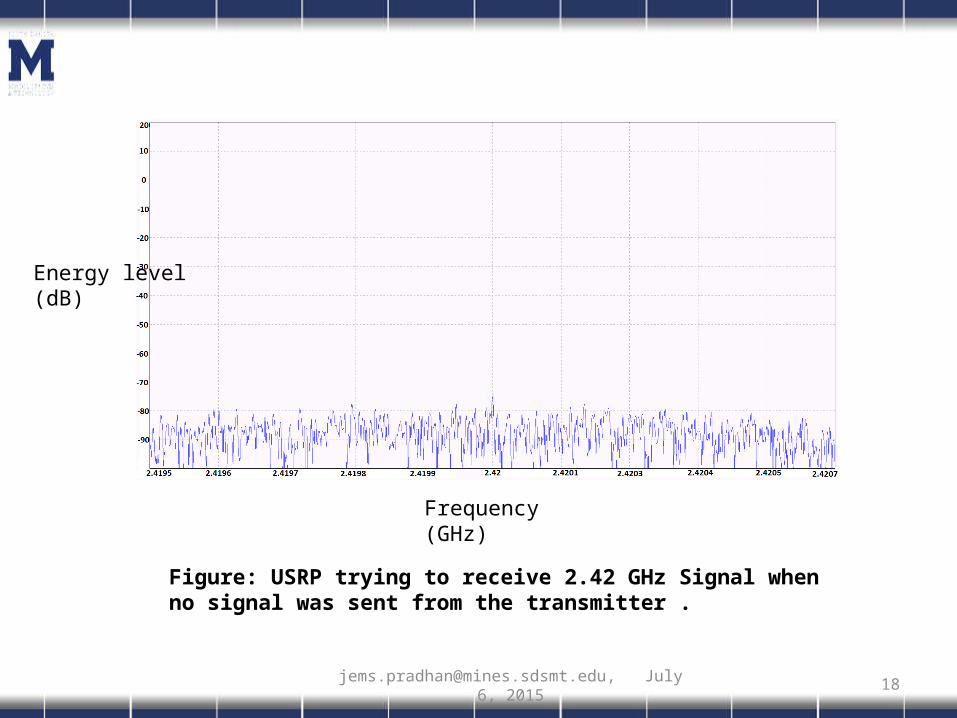
Figure: USRP trying to receive 2.42 GHz Signal when no signal was sent from the transmitter .
[email protected], July 6, 2015

19
Frequency (GHz)
Ener
gy le
vel (
dB)
Figure: USRP Device receiving 2.42 GHz signal when 2.42 GHz was sent from the transmitter.
[email protected], July 6, 2015
20
Frequency (GHz)
Ener
gy le
vel (
dB)
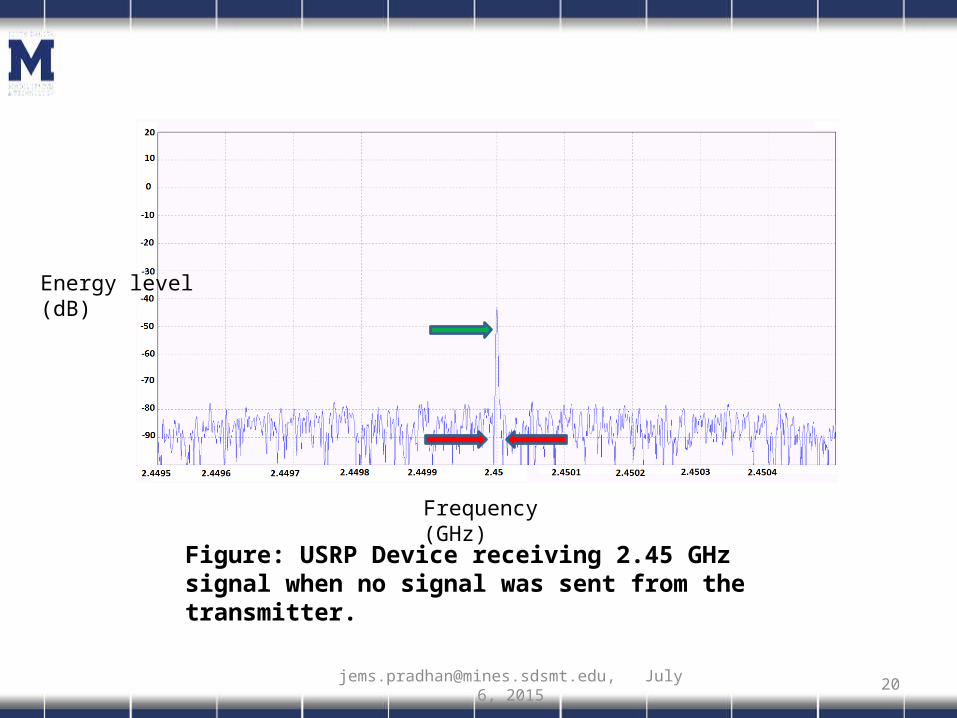
Figure: USRP Device receiving 2.45 GHz signal when no signal was sent from the transmitter.
[email protected], July 6, 2015
[email protected], July 6, 2015 21
Ener
gy le
vel (
dB)
Frequency (GHz)
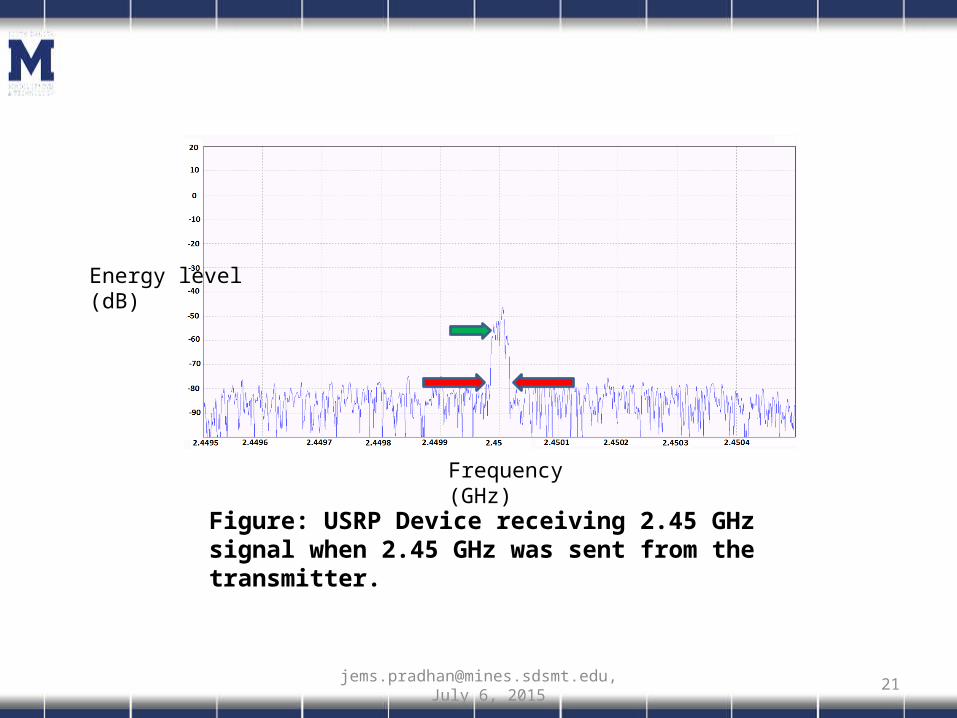
Figure: USRP Device receiving 2.45 GHz signal when 2.45 GHz was sent from the transmitter.

22
Frequency (GHz)
Ener
gy le
vel (
dB)
Figure: USRP Device receiving 5.1 GHz signal when no signal was sent from the transmitter.
[email protected], July 6, 2015

23
Frequency (GHz)
Ener
gy le
vel (
dB)
Figure: USRP Device receiving 5.1 GHz signal when 5.1 GHz signal was sent from the transmitter.
[email protected], July 6, 2015

[email protected], July 6, 2015
24
Performance Evaluation using Probabilities of False Alarm and Miss Detection of theoretical and practical energy detection

25
Performance Evaluation using Probabilities of False Alarm and Miss Detection
[email protected], July 6, 2015

26
• Theoretical analysis of Energy-and-Bandwidth Spectrum Sensing.
• Experimental Analysis of Energy-and-Bandwidth Spectrum Sensing.
• Analysis of Performance Metrics using Probability of False Alarm and Probability of Miss Detection.
[email protected], July 6, 2015
Question : Is the signal detected is originated from a PU or an SU ?

27
Two-Stage Spectrum Sensing Approach
• Utilizes Energy and Bandwidth of EBSS and also utilizes the Modulation to
distinguish channel from three states : H0(idle), H1(occupied by PU) and
H2(occupied by SU).
False, if H0
(r > λE) AND (b> λB) =
True, if H1 or H2
• H1 or H2 is detected based on the modulation scheme.
• PU and SU operate using different modulation scheme QPSK and BPSK respectively .
• SU with two demodulators to detect both QPSK and BPSK.
[email protected], July 6, 2015
29
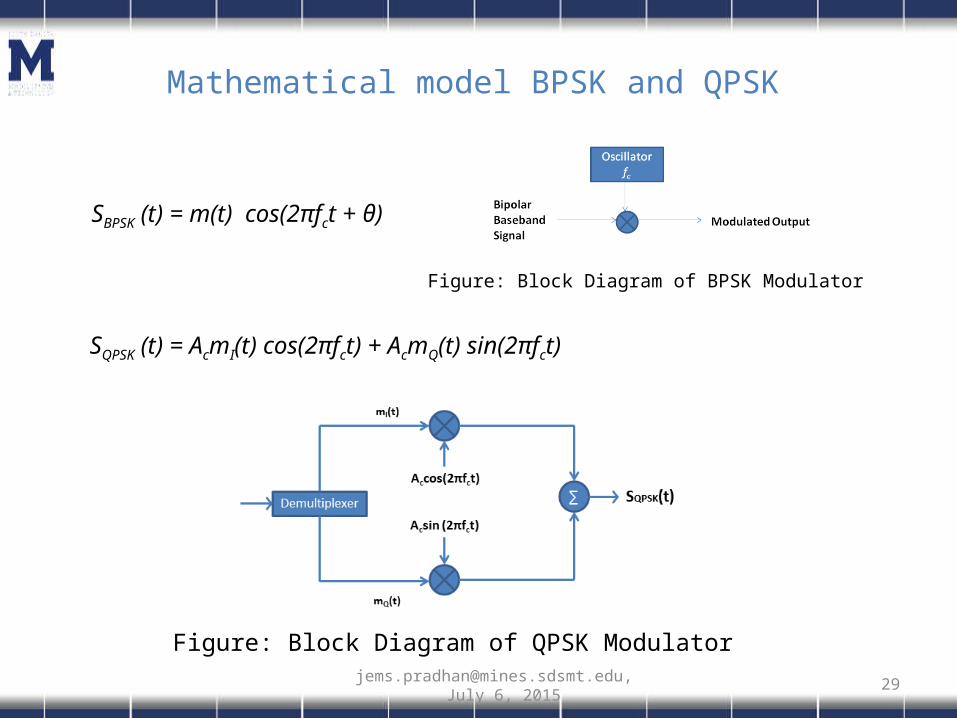
Mathematical model BPSK and QPSK
SBPSK (t) = m(t) cos(2πfct + θ)
Figure: Block Diagram of BPSK Modulator
SQPSK (t) = AcmI(t) cos(2πfct) + AcmQ(t) sin(2πfct)
Figure: Block Diagram of QPSK Modulator
[email protected], July 6, 2015
30
Square Law
Device
Band Pass Filter
Frequency Divider
Recovered Signal
Received Signal
Integrate and Dump
Circuit
Bit Sychronizer
m(t) cos(2πfct+θ)cos2(2πfct+θ) cos(4πfct+2θ) cos(2πfct+θ)
m(t) cos(2πfct+θ)
m(t) cos2(2πfct+θ)
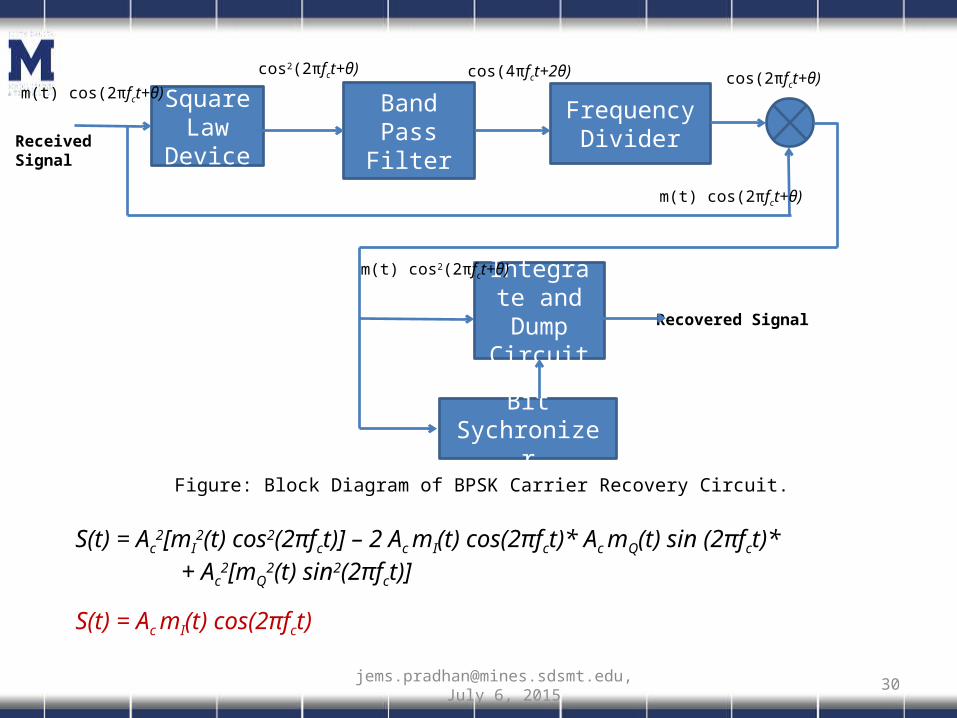
Figure: Block Diagram of BPSK Carrier Recovery Circuit.
S(t) = Ac2[mI
2(t) cos2(2πfct)] – 2 Ac mI(t) cos(2πfct)* Ac mQ(t) sin (2πfct)* + Ac
2[mQ2(t) sin2(2πfct)]
S(t) = Ac mI(t) cos(2πfct)
[email protected], July 6, 2015

31
EXPERIMENTAL SETUP II
Figure: Experimental Setup to analyze the effects of different modulation scheme.
[email protected], July 6, 2015

33
Figure: PU and SU using different demodulation techniques varying the data rate.
[email protected], July 6, 2015

34
• Analysis Based on packet by packet by considering frequency, data rate and modulation. SU uses BPSK and PU uses QPSK in all the experiments conducted hereafter.
Figure: A SU receiver (USRP N200) receiving BPSK signals at 2.47 GHz
[email protected], July 6, 2015

35
Figure: A PU receiver (USRP N200) receiving QPSK signals at 5.1 GHz
[email protected], July 6, 2015

36
Figure: SU receiving signals at 2.47 GHz modulated using BPSK when PUsending signals at 2.47001 GHz using QPSK
[email protected], July 6, 2015

37
Figure: An SU receiver receiving BPSK signals at 2.45 GHz when there is another SU transmitter at 2.45 GHz using BPSK.
[email protected], July 6, 2015
38
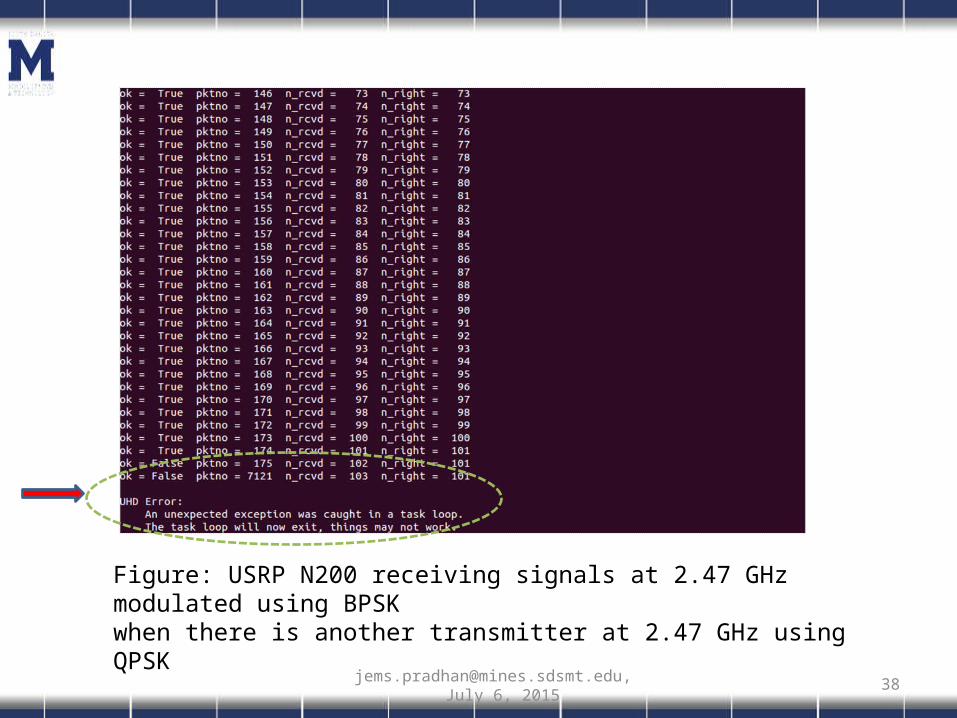
Figure: USRP N200 receiving signals at 2.47 GHz modulated using BPSKwhen there is another transmitter at 2.47 GHz using QPSK
[email protected], July 6, 2015

39
Figure: USRP N200 receiving signals at 2.49 GHz modulated using BPSKwhen there is a transmitter at 2.49 GHz using BPSK.
Figure: USRP N200 failing to receive signals at 2.49 GHz using QPSK whenthere is a transmitter at 2.49 GHz using BPSK
[email protected], July 6, 2015

40
PU Tx QPSK
Modulated
SU Tx BPSK
Modulated
SU Rx Equipped with
QPSK + BPSKDemodulators
Detected PU
Detected SU
Block Diagram of Proposed SU Receiver
[email protected], July 6, 2015
41
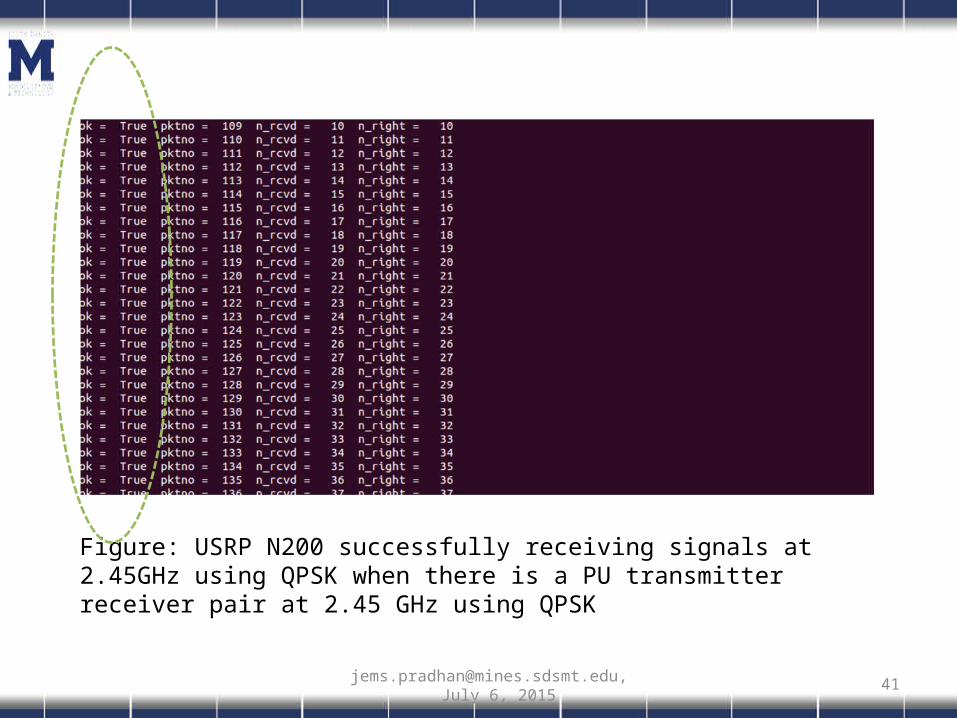
Figure: USRP N200 successfully receiving signals at 2.45GHz using QPSK when there is a PU transmitter receiver pair at 2.45 GHz using QPSK
[email protected], July 6, 2015

[email protected], July 6, 2015
42
CONCLUSION
• A new approach of spectrum sensing EBSS is proposed and experimentally verified.
• Spectrum performance has been drastically improved using EBSS compared to traditional energy detection method.
• A new method is proposed to identify the PU and SU signal using Energy, Bandwidth and Modulation Sensing Approach.

43
FUTURE WORK
• Sensing performance of EBSS will be analyzed theoretically.
• SU equipped with two demodulators and aware of the modulation implemented by PU and SU.
• Experiments are only conducted on ISM bands more experiments could be conducted on different frequency range.
[email protected], July 6, 2015

44
PUBLICATIONS• Zhao, Y., Pradhan, J., Huang, J., & Sun, H. (2014, October). Experimental
approach: energy-and-bandwidth spectrum sensing using GNU radio and USRP. In Proceedings of the 2014 Conference on Research in Adaptive and Convergent Systems (pp. 174-179). ACM.
• Zhao, Y., Pradhan, J., Huang, J., Luo, Y., & Pu, L. (2015). Joint energy-and-bandwidth spectrum sensing with GNU radio and USRP. ACM SIGAPP Applied Computing Review, 14(4), 40-49
[email protected], July 6, 2015