Embed Size (px)
Citation preview
lable at ScienceDirect
Journal of Environmental Management 131 (2013) 129e137
Contents lists avai
Journal of Environmental Management
journal homepage: www.elsevier .com/locate/ jenvman
Relationship between nitrogen concentration, light, and Zosteramarina habitat quality and survival in southeastern Massachusettsestuaries
Jennifer L. Benson*, David Schlezinger, Brian L. HowesDepartment of Estuarine and Ocean Sciences, School for Marine Science and Technology, University of Massachusetts Dartmouth, 706 South Rodney FrenchBlvd., New Bedford, MA 02744, USA
a r t i c l e i n f o
Article history:Received 21 March 2013Received in revised form15 September 2013Accepted 20 September 2013Available online
Keywords:EelgrassEutrophicationNitrogen thresholdLight intensityLight thresholdTransplant survival
* Corresponding author. Tel.: þ1 774 454 2706; faxE-mail address: [email protected] (J.L.
0301-4797/$ e see front matter � 2013 Elsevier Ltd.http://dx.doi.org/10.1016/j.jenvman.2013.09.033
a b s t r a c t
The relationship of eelgrass survival and habitat quality to water column nitrogen level, phytoplanktonbiomass, particulate matter, bottom light intensity, and light attenuation was quantified at 70 sites within19 Massachusetts estuaries through 4 growing seasons (2007e2009, 2011). Sites included a range ofeelgrass habitat quality, from stable productive eelgrass beds, to degraded beds, to areas that have lost alleelgrass coverage. Survival of transplanted eelgrass culms was used as a bio-indicator of habitat quality.Habitat quality based upon both changes in stability of eelgrass coverage and transplant survival waspositively related to light intensity and percent transmittance. Transplant survival was consistent withhabitat designations based upon long-term changes in eelgrass coverage, with lowest light coincidingwith areas that lost eelgrass in earlier decades. Bottom light declined in proportion to increases in totalnitrogen levels, phytoplankton biomass, and water column particulates determined from long-termwater quality data. Field surveys indicated that eelgrass survival required bottom light �100 mE/m2/sand healthy eelgrass existed where tidally-averaged total nitrogen was less than 0.34 mg/L, equivalent toa mid-ebb tide water-column total nitrogen of <0.37 mg/L. Traditional sampling of water column ni-trogen at mid-ebb tide was found to slightly overestimate the average nitrogen level over a completetidal cycle. However, since long-term, ebb-tide and tidally-averaged total nitrogen are correlated, it ispossible to use the monitoring average to guide management until tidally-averaged TN becomes avail-able. Nitrogen thresholds that support eelgrass communities provide a fundamental tool for managingthis habitat and for selection of transplant sites aimed at accelerating restoration of this resource underincreasing nitrogen loading of the coastal zone.
� 2013 Elsevier Ltd. All rights reserved.
1. Introduction
Management and protection of coastal water bodies has becomean area of intense focus on local, state, and federal levels. The CleanWater Act aims to set water quality standards and then regulatepollutants entering surface waters to meet those standards. Theprimary pollutant of concern for estuaries and bays in southeasternMassachusetts, as well as around the world, is nitrogen; andenrichment of this nutrient in coastal waters is increasing as pop-ulations grow within the coastal zone (Bricker et al., 1999). Quan-tifying the ability of estuaries to assimilate nitrogen without loss ofhabitat quality and setting realistic targets to restore degradedhabitat in eutrophic waters is fundamental for managing
: þ1 508 910 6371.Benson).
All rights reserved.
eutrophication and protecting estuarine resources as watershednitrogen inputs increase.
Seagrasses are sites of high productivity and provide essentialhabitat for many ecologically and economically important species(Thayer et al., 1984; Wood et al., 1969; Heck et al., 1995). Seagrassesare sensitive to nitrogen enrichment of coastal waters primarilybecause of their high light requirements of 15e25% of surfaceirradiance (Duarte, 1991; Dennison et al., 1993). Increasing nutrientavailability causes increased production of phytoplankton (Rytherand Dunston, 1971), epiphytic algae and macroalgae (Hauxwellet al., 2003), resulting in light limitation (Cambridge andMcComb, 1984) and seagrass decline (Harlin, 1993). At higherlevels, depletion of oxygen in bottomwater results due to increasedwater-column respiration and sediment oxygen demand associatedwith higher levels of organic matter production (Costa et al., 1992;Pickney et al., 2001 for review) and seagrass root growth andnutrient uptake is negatively impacted by tissue anoxia (Smith

J.L. Benson et al. / Journal of Environmental Management 131 (2013) 129e137130
et al., 1988; Zimmerman and Alberte, 1996). Seagrass has been lostin many areas such as Chesapeake Bay (Orth and Moore, 1983),Massachusetts (Costa, 1988; Short and Burdick, 1996; Costello andKenworthy, 2011), and globally where losses have been estimatedat 110 km2 yr�1 and accelerating (Waycott et al., 2009). With theloss of seagrass is the associated decline in animal habitats (Lee andOlsen, 1985; Nixon, 1995; Taylor et al., 1995; Deegan, 2002) andeconomic losses (e.g. tourism, fisheries).
While the links between eutrophication and eelgrass declinehave been well documented (Orth and Moore, 1983; Short andWyllie-Echeverria, 1996; Cloern, 2001; Orth et al., 2006), quanti-tative nitrogen-related water quality metrics have been moredifficult to determine. It is these quantitative habitat metrics thatare now needed to support the expanding efforts to restore andprotect this biologically diverse and economically importantresource.
Investigations have used seagrasses to designate healthy andproductive habitats with high water quality (Zieman, 1982; Thayeret al., 1984; Fonseca et al., 1990) and as specific indicators of waterquality (Dennison et al., 1993; Lee et al., 2004). Similarly, a directlinkage of eelgrass habitat quality to watershed nitrogen loads hasbeen attempted to investigate changes in seagrass biomass andproductivity (Tomasko et al., 1996; Short and Burdick, 1996;Hauxwell et al., 2003). However, the generalizability of theapproach is uncertain, since the same watershed nitrogen load willgenerate widely different eutrophying effects depending on thehydrodynamics of the receiving waters (i.e. the volume and flush-ing rate). Since eelgrass response in these systems is related to thenitrogen concentration that develops within specific eelgrass beds,dissolved inorganic nitrogen (DIN) levels have been used (Dennisonet al., 1993; Stevenson et al., 1993). However, DIN is rapidly trans-formed to organic forms in many estuaries, with only 1e3% of thenitrogen remaining as DIN (Collos and Slawyk, 1976; Wheeler et al.,1982). In contrast, total nitrogen represents the total fixed nitrogenpool, as dissolved and particulate organic forms as well as DIN, andobviates the need to address the rapid transformations of nitrogenin estuarine waters. In the present investigation, we use total ni-trogen (TN) levels instead of DIN, as a more robust indicator of thelevel of eutrophication.
Multiple parameter models, developed to assess the habitatrequirements supportive of healthy seagrass by determining thecritical water quality and light associated with submerged aquaticvegetation (Dennison et al., 1993; Stevenson et al., 1993) have hadmixed success. Sites exceeding the designated thresholds (lightattenuation, total suspended solids (TSS), chlorophyll a, dissolvedinorganic nitrogen (DIN), and dissolved inorganic phosphorus(DIP)) have significant seagrass survival (Moore et al., 1996). Inaddition, many previous models have generally focused on largeriverine estuaries like Chesapeake Bay (Dennison et al., 1993; Kempet al., 2004) and the North River in North Carolina (Biber et al.,2008), where TSS, DIP, or dissolved color may predominate,compared to small shallow temperate estuaries. The shallow es-tuaries of Massachusetts tend to be groundwater dominated withlittle inorganic sediment loading and TSS, and have light attenua-tion primarily from nutrient inputs resulting in situ phytoplanktonproductivity rather than riverine transport.
Both increased nitrogen concentration and decreased light havebeen correlated with inhibition of eelgrass growth and there hasbeen extensive research on the response of eelgrass to nitrogenenrichment (Burkholder et al., 1992; Short et al., 1995). However,the sequence of linked ecological processes initiated by changes innitrogen inputs and resulting in changes in eelgrass habitat qualityhas not been extensively studiedwithin the estuarine environment.Herewe track increased water column nitrogen to light attenuationand decreased bottom light, and determine their effect on natural
coverage and transplant survival of Zostera marina across south-eastern Massachusetts estuaries.
Using measured water quality parameters, we examine thecascading effects of nitrogen enrichment on water-column con-stituents resulting in reduced bottom light intensity, and how thesecoupled factors negatively affect eelgrass habitat and transplantsurvival. Seventy sites within nineteen estuaries in southeasternMassachusetts with varying degrees of eelgrass health rangingfrom present stable beds, to areas which historically supportedeelgrass (Costello and Kenworthy, 2011), both recently (1995) anddecades ago (1951), were analyzed with respect to trends in ni-trogen related water quality parameters and bottom light intensity.Eelgrass was transplanted at a sub-set of sites to assess survivalrelative to total nitrogen concentration and bottom light intensity.The relationships between TN levels, phytoplankton biomass, lightlevel and eelgrass survival and temporal stability of beds were usedto determine the existence of potential management thresholds forpredicting eelgrass survival and habitat quality.
2. Methodology
2.1. Study systems
Nineteen shallow estuaries throughout southeastern Massa-chusetts showing ranges of eelgrass coverage and nitrogenenrichment were evaluated (Fig. 1). Bottom light, light attenuationand percent surface transmittance, and associated water qualityparameters were measured at 70 locations distributed amongnineteen estuaries where long-term changes in eelgrass coverageand water quality had been previously determined. In addition, 52of the 70 sites with a range of nutrient related water quality andlight regimes were selected for determination of eelgrass trans-plant survival. The field studies were conducted throughout thegrowing season in 2007, 2008, 2009 and 2011.
Each estuarine location selected for the present study had morethan 10 years of summertime water quality measurements asso-ciated with the School for Marine Science and Technology, Uni-versity of Massachusetts Dartmouth (Massachusetts EstuariesProject (MEP) www.oceanscience.net/estuaries); as well as multi-year eelgrass coverage surveys by the Massachusetts Departmentof Environmental Protection (Costello and Kenworthy, 2011). Lo-cations were selected to include a variety of eelgrass habitat qualitybased upon the persistence of high quality beds and ranging fromhealthy (currently have healthy eelgrass beds, degraded (beds thatare thinning and/or have extensive epiphytes), lost recently (losthistoric beds between 1995 and 2001) and lost eelgrass coveragebetween 1951 and 1995.
2.2. Water quality sampling
Water quality parameters were measured during the summerperiod (mid-June to mid-September), when eutrophication relatedstresses are most pronounced in temperate estuaries. Measure-ments included Secchi and total depth, dissolved oxygen, tem-perature and light profiles. Bottom water samples were collectedby Niskin bottle and analyzed for particulate and dissolved organicnitrogen, ammonium and nitrate þ nitrite, as well as orthophos-phate, chlorophyll-a and pheophytin-a, and salinity. Samples weretransported to the laboratory in 1-L acid washed HDPE bottles indark coolers maintained at 4 �C. Upon return to the laboratory,water was filtered (pre-combusted 25 mm Whatman glass mi-crofiber (GF/F)), dried (at 60 �C to a constant weight), andanalyzed on a Perkin Elmer Series II CHN for particulate nitrogenand carbon (Kirsten, 1983). Pigment samples were transported indark 1-L bottles. Upon return to the laboratory w300 mL sub-

Fig. 1. Location of 19 southeastern Massachusetts estuaries wherein 70 sites were examined (stars).
J.L. Benson et al. / Journal of Environmental Management 131 (2013) 129e137 131
samples were filtered (0.22 mm Millipore membrane) for chloro-phyll-a and pheophytin-a analysis using a 90% acetone darkextraction and fluormetric analysis (Turner Designs 10-AU Fluo-rometer; Parsons et al., 1989). Dissolved nutrients were filtered inthe field (low nitrogen 0.2 mm cellulose acetate Geofilter) andtransported in 60 mL acid-washed polyethylene bottles on ice andassayed for ammonium by the indophenol/hypochlorite method(Scheiner, 1976), ortho-phosphate by the molybdate/ascorbic acidmethod (Murphy and Riley, 1962), and nitrate þ nitrite as N bycadmium reduction (QuikChem 8000 Lachat auto analyzer; Woodet al., 1967). Field profiles of bottom water dissolved oxygen andtemperature were made using a YSI 55 dissolved oxygen metercalibrated daily. The Coastal Systems Analytical Facility of theUniversity of Massachusetts Dartmouth School for Marine Scienceand Technology assayed all water quality data used in this study,either specifically for this thesis or for the Massachusetts EstuariesProject, in support of various municipal and state estuarinemonitoring programs.
2.3. Light measurements
Incident photosynthetically active radiation (PAR) was recordedevery 15min from June until October of each sampling season usingSmart sensors (S-LIA-M003) and HOBO� Weather Station loggerspositioned on docks or piers. Water-column light (total irradiance)and temperature were recorded w0.3 m above the bottom every15 min fromMay/June through October of each sampling season ateach water quality site (HOBO� Temperature/Light Pendant DataLogger, UA-002-64). Light sensors were cleaned and downloaded atbiweekly intervals and a profile of PARmeasured with a Li-cor� LI-250A light meter with a LI-193 Spherical Quantum Sensor (Photo-synthetic Photon Flux Fluence Rate (PPFFR) or Quantum ScalarIrradiance) was recorded in the 2008 and 2009 field seasons.
The PAR sensors measure light intensity over the spectral rangeof 400e700 nm, expressed in mmols/m2/s. Since the bottom watersensors, HOBO temperature/light pendants, measure total irradi-ance in lux from 150 to 1200 nm, it was necessary to develop anempirical relationship between the two types of sensors. Sensors ofboth types were compared in test basins using ambient light overseveral diurnal cycles. Each HOBO temperature/light pendant wasmatched with a PAR sensor to obtain pendant specific relationshipsto the PAR sensors. A polynomial curve fit was used to allow anestimate of PAR from the irradiance readings (n ¼ 26; r2 range0.95e1.00). With both the bottom light intensity and the surfacePAR measurement in the same units of mE/m2/s, these light mea-surements were used to determine the percent surface irradiancewithin the water column and to calculate extinction coefficientsaccording to the BeereLambert Law.
2.4. Eelgrass transplants
Eelgrass transplantation followed the TERF method (trans-planting eelgrass remotely using frames) (Short et al., 2002) and amodification of TERF (Lesche et al., 2006). The modified TERFapproach anchors the frame to the sediment surface with cornerstakes and uses biodegradable jute mesh to hold 50 eelgrass shootswithin the 0.25 m2 frame. Large established eelgrass beds with lowincidence of epiphytes, in close proximity to the 52 transplant lo-cations, were used to collect culms for the TERF assays. Less thanw50 shoots were collected from a 1 m2 area to prevent damage tothe donor bed. Eelgrass was held in seawater, affixed to the framesand deployed within 24 h of removal.
Based upon a comparison of eelgrass survival using the TERF andmodified TERF methods at 11 sites in 2007, which showed no sig-nificant difference in eelgrass transplant success, themodified TERFapproach was used for all the stations during the 2008, 2009, and
Eel Grass Habitat
HEALTHY DEGRADED LOST POST-1995 LOST POST-1951
To
ta
l N
itro
ge
n (m
g/L
)
0.0
0.1
0.2
0.3
0.4
0.5
0.6
0.7
To
ta
l C
hlo
ro
ph
yll a
Pig
me
nts
(g
/L)
0
2
4
6
8
10
Total Nitrogen
Total Pigments
Eelgrass Habitat
To
tal C
hlo
ro
ph
yll-a
P
ig
men
ts (µg
/L
)
HEALTHY DEGRADED LOST POST-1995 LOST POST-1951 Healthy Degraded Lost post-1995 Lost post-1951
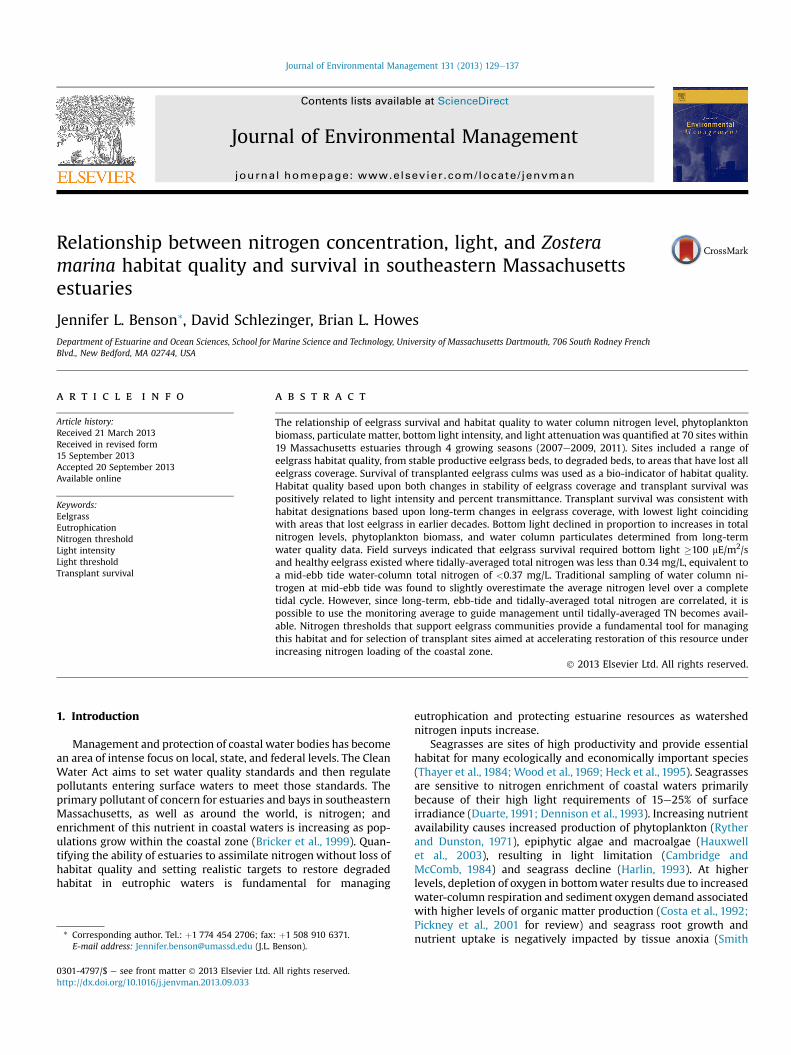
Fig. 2. Long-term total nitrogen and chlorophyll-a average concentrations (2000e10)in eelgrass areas that currently support healthy/stable beds, are degraded, or have lostcoverage post-1995, or between 1951 and 1995 in southeastern Massachusetts.
J.L. Benson et al. / Journal of Environmental Management 131 (2013) 129e137132
2011. The transplants were proximate to existing water qualitystations and historical eelgrass habitat. Eelgrass was initiallytransplanted in MayeJune of each year and shoots countedbiweekly in concert with other monitoring tasks. Transplant suc-cess was determined by both the number of living shoots in
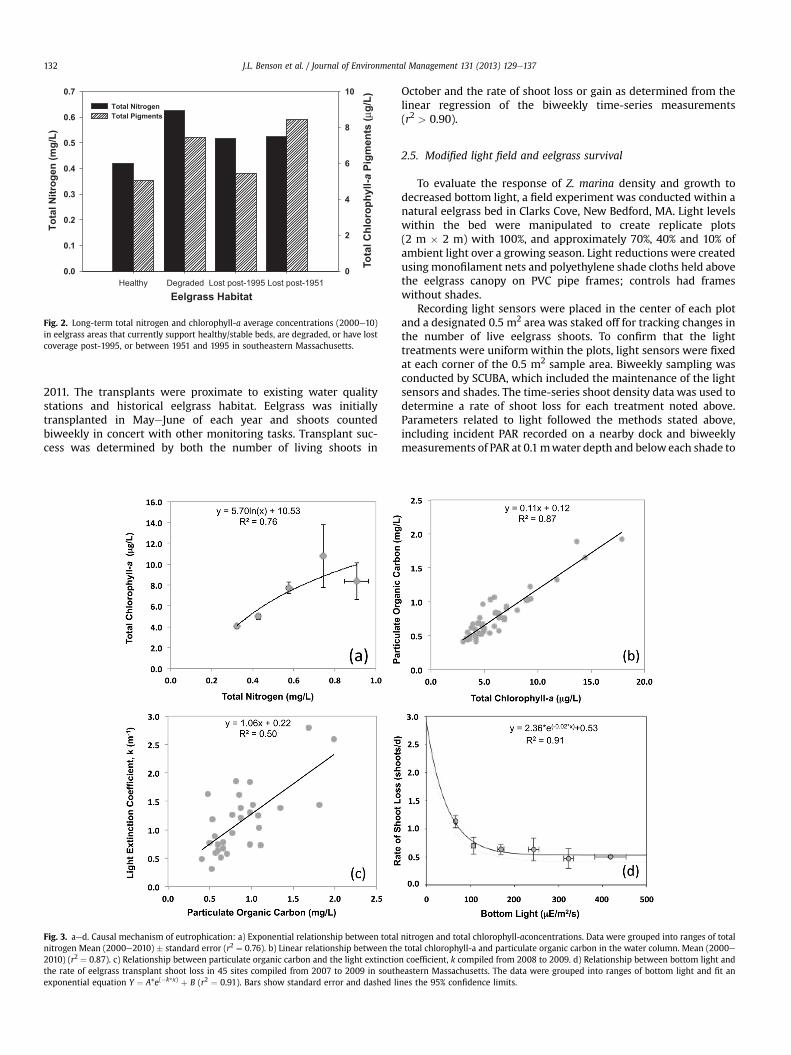
Fig. 3. aed. Causal mechanism of eutrophication: a) Exponential relationship between totalnitrogen Mean (2000e2010) � standard error (r2 ¼ 0.76). b) Linear relationship between the2010) (r2 ¼ 0.87). c) Relationship between particulate organic carbon and the light extinctiothe rate of eelgrass transplant shoot loss in 45 sites compiled from 2007 to 2009 in southexponential equation Y ¼ A*e(�k*x) þ B (r2 ¼ 0.91). Bars show standard error and dashed li
October and the rate of shoot loss or gain as determined from thelinear regression of the biweekly time-series measurements(r2 > 0.90).
2.5. Modified light field and eelgrass survival
To evaluate the response of Z. marina density and growth todecreased bottom light, a field experiment was conducted within anatural eelgrass bed in Clarks Cove, New Bedford, MA. Light levelswithin the bed were manipulated to create replicate plots(2 m � 2 m) with 100%, and approximately 70%, 40% and 10% ofambient light over a growing season. Light reductions were createdusing monofilament nets and polyethylene shade cloths held abovethe eelgrass canopy on PVC pipe frames; controls had frameswithout shades.
Recording light sensors were placed in the center of each plotand a designated 0.5 m2 area was staked off for tracking changes inthe number of live eelgrass shoots. To confirm that the lighttreatments were uniformwithin the plots, light sensors were fixedat each corner of the 0.5 m2 sample area. Biweekly sampling wasconducted by SCUBA, which included the maintenance of the lightsensors and shades. The time-series shoot density data was used todetermine a rate of shoot loss for each treatment noted above.Parameters related to light followed the methods stated above,including incident PAR recorded on a nearby dock and biweeklymeasurements of PAR at 0.1mwater depth and beloweach shade to
nitrogen and total chlorophyll-aconcentrations. Data were grouped into ranges of totaltotal chlorophyll-a and particulate organic carbon in the water column. Mean (2000e
n coefficient, k compiled from 2008 to 2009. d) Relationship between bottom light andeastern Massachusetts. The data were grouped into ranges of bottom light and fit annes the 95% confidence limits.
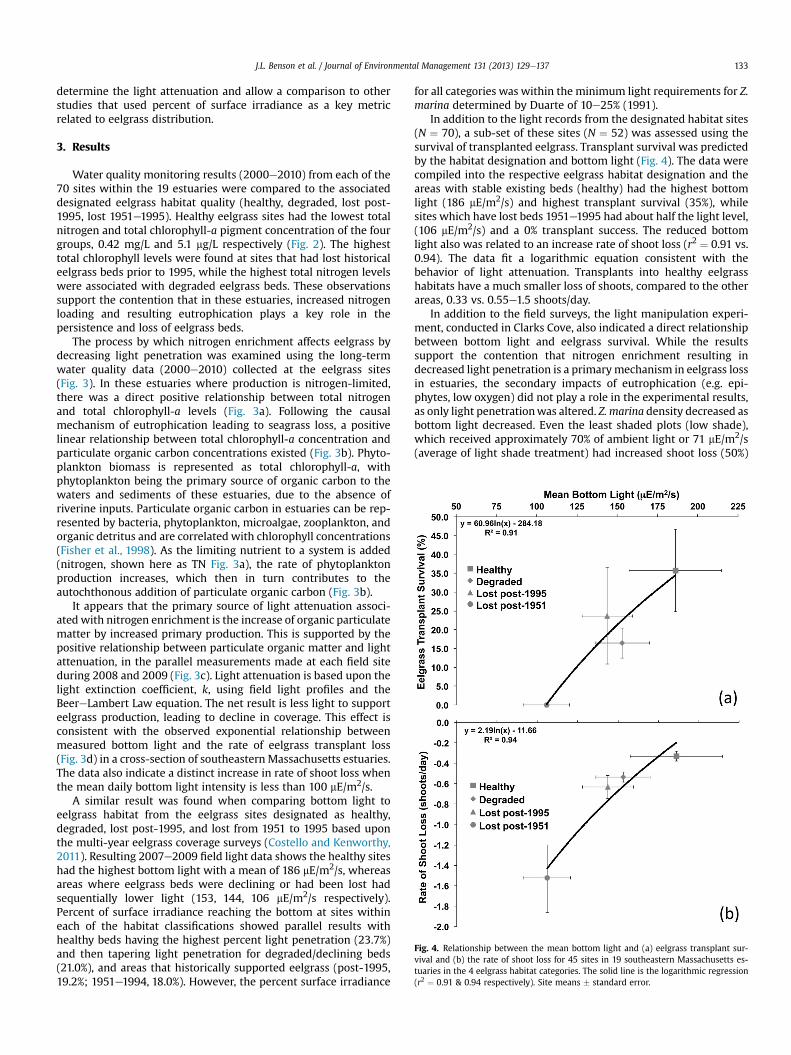
Fig. 4. Relationship between the mean bottom light and (a) eelgrass transplant sur-vival and (b) the rate of shoot loss for 45 sites in 19 southeastern Massachusetts es-tuaries in the 4 eelgrass habitat categories. The solid line is the logarithmic regression(r2 ¼ 0.91 & 0.94 respectively). Site means � standard error.
J.L. Benson et al. / Journal of Environmental Management 131 (2013) 129e137 133
determine the light attenuation and allow a comparison to otherstudies that used percent of surface irradiance as a key metricrelated to eelgrass distribution.
3. Results
Water quality monitoring results (2000e2010) from each of the70 sites within the 19 estuaries were compared to the associateddesignated eelgrass habitat quality (healthy, degraded, lost post-1995, lost 1951e1995). Healthy eelgrass sites had the lowest totalnitrogen and total chlorophyll-a pigment concentration of the fourgroups, 0.42 mg/L and 5.1 mg/L respectively (Fig. 2). The highesttotal chlorophyll levels were found at sites that had lost historicaleelgrass beds prior to 1995, while the highest total nitrogen levelswere associated with degraded eelgrass beds. These observationssupport the contention that in these estuaries, increased nitrogenloading and resulting eutrophication plays a key role in thepersistence and loss of eelgrass beds.
The process by which nitrogen enrichment affects eelgrass bydecreasing light penetration was examined using the long-termwater quality data (2000e2010) collected at the eelgrass sites(Fig. 3). In these estuaries where production is nitrogen-limited,there was a direct positive relationship between total nitrogenand total chlorophyll-a levels (Fig. 3a). Following the causalmechanism of eutrophication leading to seagrass loss, a positivelinear relationship between total chlorophyll-a concentration andparticulate organic carbon concentrations existed (Fig. 3b). Phyto-plankton biomass is represented as total chlorophyll-a, withphytoplankton being the primary source of organic carbon to thewaters and sediments of these estuaries, due to the absence ofriverine inputs. Particulate organic carbon in estuaries can be rep-resented by bacteria, phytoplankton, microalgae, zooplankton, andorganic detritus and are correlated with chlorophyll concentrations(Fisher et al., 1998). As the limiting nutrient to a system is added(nitrogen, shown here as TN Fig. 3a), the rate of phytoplanktonproduction increases, which then in turn contributes to theautochthonous addition of particulate organic carbon (Fig. 3b).
It appears that the primary source of light attenuation associ-ated with nitrogen enrichment is the increase of organic particulatematter by increased primary production. This is supported by thepositive relationship between particulate organic matter and lightattenuation, in the parallel measurements made at each field siteduring 2008 and 2009 (Fig. 3c). Light attenuation is based upon thelight extinction coefficient, k, using field light profiles and theBeereLambert Law equation. The net result is less light to supporteelgrass production, leading to decline in coverage. This effect isconsistent with the observed exponential relationship betweenmeasured bottom light and the rate of eelgrass transplant loss(Fig. 3d) in a cross-section of southeastern Massachusetts estuaries.The data also indicate a distinct increase in rate of shoot loss whenthe mean daily bottom light intensity is less than 100 mE/m2/s.
A similar result was found when comparing bottom light toeelgrass habitat from the eelgrass sites designated as healthy,degraded, lost post-1995, and lost from 1951 to 1995 based uponthe multi-year eelgrass coverage surveys (Costello and Kenworthy,2011). Resulting 2007e2009 field light data shows the healthy siteshad the highest bottom light with a mean of 186 mE/m2/s, whereasareas where eelgrass beds were declining or had been lost hadsequentially lower light (153, 144, 106 mE/m2/s respectively).Percent of surface irradiance reaching the bottom at sites withineach of the habitat classifications showed parallel results withhealthy beds having the highest percent light penetration (23.7%)and then tapering light penetration for degraded/declining beds(21.0%), and areas that historically supported eelgrass (post-1995,19.2%; 1951e1994, 18.0%). However, the percent surface irradiance
for all categories was within the minimum light requirements for Z.marina determined by Duarte of 10e25% (1991).
In addition to the light records from the designated habitat sites(N ¼ 70), a sub-set of these sites (N ¼ 52) was assessed using thesurvival of transplanted eelgrass. Transplant survival was predictedby the habitat designation and bottom light (Fig. 4). The data werecompiled into the respective eelgrass habitat designation and theareas with stable existing beds (healthy) had the highest bottomlight (186 mE/m2/s) and highest transplant survival (35%), whilesites which have lost beds 1951e1995 had about half the light level,(106 mE/m2/s) and a 0% transplant success. The reduced bottomlight also was related to an increase rate of shoot loss (r2 ¼ 0.91 vs.0.94). The data fit a logarithmic equation consistent with thebehavior of light attenuation. Transplants into healthy eelgrasshabitats have a much smaller loss of shoots, compared to the otherareas, 0.33 vs. 0.55e1.5 shoots/day.
In addition to the field surveys, the light manipulation experi-ment, conducted in Clarks Cove, also indicated a direct relationshipbetween bottom light and eelgrass survival. While the resultssupport the contention that nitrogen enrichment resulting indecreased light penetration is a primarymechanism in eelgrass lossin estuaries, the secondary impacts of eutrophication (e.g. epi-phytes, low oxygen) did not play a role in the experimental results,as only light penetrationwas altered. Z. marina density decreased asbottom light decreased. Even the least shaded plots (low shade),which received approximately 70% of ambient light or 71 mE/m2/s(average of light shade treatment) had increased shoot loss (50%)
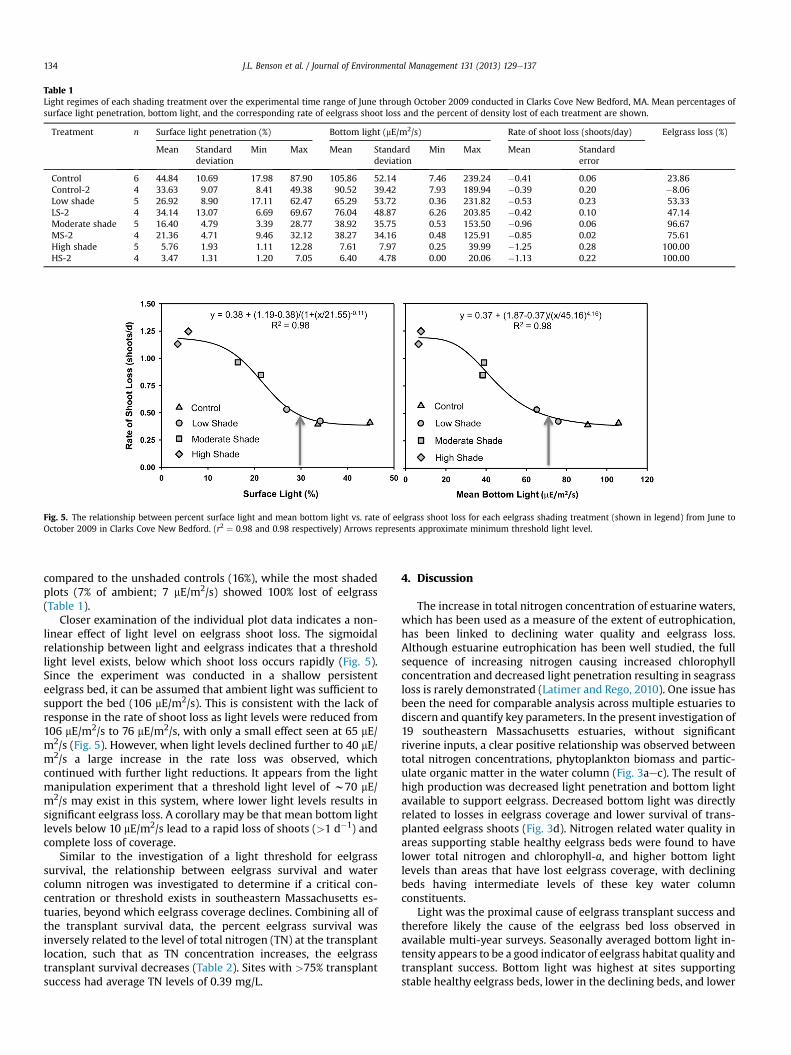
Table 1Light regimes of each shading treatment over the experimental time range of June through October 2009 conducted in Clarks Cove New Bedford, MA. Mean percentages ofsurface light penetration, bottom light, and the corresponding rate of eelgrass shoot loss and the percent of density lost of each treatment are shown.
Treatment n Surface light penetration (%) Bottom light (mE/m2/s) Rate of shoot loss (shoots/day) Eelgrass loss (%)
Mean Standarddeviation
Min Max Mean Standarddeviation
Min Max Mean Standarderror
Control 6 44.84 10.69 17.98 87.90 105.86 52.14 7.46 239.24 �0.41 0.06 23.86Control-2 4 33.63 9.07 8.41 49.38 90.52 39.42 7.93 189.94 �0.39 0.20 �8.06Low shade 5 26.92 8.90 17.11 62.47 65.29 53.72 0.36 231.82 �0.53 0.23 53.33LS-2 4 34.14 13.07 6.69 69.67 76.04 48.87 6.26 203.85 �0.42 0.10 47.14Moderate shade 5 16.40 4.79 3.39 28.77 38.92 35.75 0.53 153.50 �0.96 0.06 96.67MS-2 4 21.36 4.71 9.46 32.12 38.27 34.16 0.48 125.91 �0.85 0.02 75.61High shade 5 5.76 1.93 1.11 12.28 7.61 7.97 0.25 39.99 �1.25 0.28 100.00HS-2 4 3.47 1.31 1.20 7.05 6.40 4.78 0.00 20.06 �1.13 0.22 100.00
Fig. 5. The relationship between percent surface light and mean bottom light vs. rate of eelgrass shoot loss for each eelgrass shading treatment (shown in legend) from June toOctober 2009 in Clarks Cove New Bedford. (r2 ¼ 0.98 and 0.98 respectively) Arrows represents approximate minimum threshold light level.
J.L. Benson et al. / Journal of Environmental Management 131 (2013) 129e137134
compared to the unshaded controls (16%), while the most shadedplots (7% of ambient; 7 mE/m2/s) showed 100% lost of eelgrass(Table 1).
Closer examination of the individual plot data indicates a non-linear effect of light level on eelgrass shoot loss. The sigmoidalrelationship between light and eelgrass indicates that a thresholdlight level exists, below which shoot loss occurs rapidly (Fig. 5).Since the experiment was conducted in a shallow persistenteelgrass bed, it can be assumed that ambient light was sufficient tosupport the bed (106 mE/m2/s). This is consistent with the lack ofresponse in the rate of shoot loss as light levels were reduced from106 mE/m2/s to 76 mE/m2/s, with only a small effect seen at 65 mE/m2/s (Fig. 5). However, when light levels declined further to 40 mE/m2/s a large increase in the rate loss was observed, whichcontinued with further light reductions. It appears from the lightmanipulation experiment that a threshold light level of w70 mE/m2/s may exist in this system, where lower light levels results insignificant eelgrass loss. A corollary may be that mean bottom lightlevels below 10 mE/m2/s lead to a rapid loss of shoots (>1 d�1) andcomplete loss of coverage.
Similar to the investigation of a light threshold for eelgrasssurvival, the relationship between eelgrass survival and watercolumn nitrogen was investigated to determine if a critical con-centration or threshold exists in southeastern Massachusetts es-tuaries, beyond which eelgrass coverage declines. Combining all ofthe transplant survival data, the percent eelgrass survival wasinversely related to the level of total nitrogen (TN) at the transplantlocation, such that as TN concentration increases, the eelgrasstransplant survival decreases (Table 2). Sites with >75% transplantsuccess had average TN levels of 0.39 mg/L.
4. Discussion
The increase in total nitrogen concentration of estuarine waters,which has been used as a measure of the extent of eutrophication,has been linked to declining water quality and eelgrass loss.Although estuarine eutrophication has been well studied, the fullsequence of increasing nitrogen causing increased chlorophyllconcentration and decreased light penetration resulting in seagrassloss is rarely demonstrated (Latimer and Rego, 2010). One issue hasbeen the need for comparable analysis across multiple estuaries todiscern and quantify key parameters. In the present investigation of19 southeastern Massachusetts estuaries, without significantriverine inputs, a clear positive relationship was observed betweentotal nitrogen concentrations, phytoplankton biomass and partic-ulate organic matter in the water column (Fig. 3aec). The result ofhigh production was decreased light penetration and bottom lightavailable to support eelgrass. Decreased bottom light was directlyrelated to losses in eelgrass coverage and lower survival of trans-planted eelgrass shoots (Fig. 3d). Nitrogen related water quality inareas supporting stable healthy eelgrass beds were found to havelower total nitrogen and chlorophyll-a, and higher bottom lightlevels than areas that have lost eelgrass coverage, with decliningbeds having intermediate levels of these key water columnconstituents.
Light was the proximal cause of eelgrass transplant success andtherefore likely the cause of the eelgrass bed loss observed inavailable multi-year surveys. Seasonally averaged bottom light in-tensity appears to be a good indicator of eelgrass habitat quality andtransplant success. Bottom light was highest at sites supportingstable healthy eelgrass beds, lower in the declining beds, and lower

Table 2Relationship between eelgrass transplant survival and total nitrogen concentration.The data were sorted into ranges of transplant survival from 2007 to 2009, 2011 andcorresponding long-term total nitrogen concentration. Mean � standard error.
Eelgrass transplant survival (%) Total nitrogen (mg/L)
<25 0.68 � 0.1125e50 0.67 � 0.1150e75 0.49 � 0.12>75 0.39 � 0.03
0.0
0.1
0.2
0.3
0.4
0.5
0.6
0.7
0.8
0.9
Healthy Degraded Lost post-1995 Lost post-1951 No historic
eelgrass
To
tal N
itro
gen
(m
g/L
)
Eelgrass Habitat
Tidally Averaged
Long-term
Fig. 6. Comparison of tidally averaged and long-term, ebb-tide total nitrogen con-centrations (mg/L) between eelgrass habitats for all sites in twelve MassachusettsEstuaries Project (MEP) reports. The bars represent the upper 75th and lower 25thpercentile of TN data. The long-term TN in the MEP reports use data compiled for �3years.
J.L. Benson et al. / Journal of Environmental Management 131 (2013) 129e137 135
still in areas where eelgrass beds have been lost. The bottom lightranged from 153 to 186 mE/m2/s in areas where eelgrass beds werepresent, either as stable or declining beds. Sites which lost eelgrasscoverage between 1951 and 1995 had a low mean bottom light ofapproximately 100 mE/m2/s and were unable to support transplants(100%mortality), suggesting that a bottom light level>100 mE/m2/sshould exist before bed restoration via transplants is attempted(Fig. 4). In addition, as bottom light increases, the transplant sur-vival was found to increase exponentially, emphasizing theimportance of bottom light to eelgrass success (Fig. 4).
The light level required to support eelgrass can be furtherrefined based upon light manipulations of natural eelgrass beds.Surface light irradiance is an important measure for determiningthe presence of seagrass and its transplant survival because of itshigh light requirements ranging from 10% to 37% of surface lightirradiance (Duarte,1991; Olesen and Sand-Jensen,1993; Kenworthyand Fonseca,1996). In this experiment eelgrass loss can occur when<20% surface light reaches the bed, but at levels >25% surface lightirradiance eelgrass persisted. Surface light penetrations <20% leadto mean bottom light averages of 10e40 mE/m2/s and resulted in aloss of about 4 shoots d�1 m�2 (Fig. 5). The light levels to sustain thebeds (70 mE/m2/s) are higher than lab estimates of the lightcompensation point for eelgrass, 15e47.3 mE/m2/s (Dennison andAlberte, 1985; Olesen and Sand-Jensen, 1993). The compensationpoint describes the light intensity required to balance photosyn-thesis and respiration, while the light threshold determined in thisinvestigation represents a real world bottom light concentration(70 mE/m2/s) that support whole plants in situ (Fig. 5).
It appears that improved water clarity can be achieved byreducing the nitrogen loads entering the coastal systems and thusaid in the restoration process of Z. marina, through increasingbottom light levels. However, the level of total nitrogen that willprovide sufficient water clarity in these shallow estuaries has beendifficult to quantify, even though water depths are relatively uni-form. One problem has been that sampling of water column ni-trogen levels needs to be during a consistent time in the tidal cycle,as concentrations change from flood to ebb. The highest concen-tration at a single point in an estuary is at ebb slack tide, whenwater has been held the longest and the lowest concentration is atflood slack tide, when the dilution by offshore floodwaters isgreatest. To reduce variation due to the tidal cycle, most samplingprograms in southeastern Massachusetts collect water at mid-ebbtide or have developed water quality models that determine theaverage concentration over the tidal cycle based upon these mea-surements. In the present investigation, the critical total nitrogenlevel associated with stable eelgrass beds was examined using bothmethods.
The Massachusetts Estuaries Project (MEP) reports havecollected and studied the comprehensive water quality, nutrientloading, eelgrass coverage, benthic community, and hydrody-namics for many estuaries in southeastern Massachusetts todetermine ecosystem-wide health. These studies have shownelevated total nitrogen concentrations focused in the upper reachesof estuaries and loss of historic eelgrass coverage (Howes et al.,1999, 2003, 2006; Costello and Kenworthy, 2011). The MEP
reports are created by a collaborative effort between the CoastalSystems Program (University of Massachusetts-Dartmouth),Applied Coastal, the Cape Cod Commission, and the Departmentof Environmental Protection. These reports used a water qualityand hydrodynamic model (RMA-2, RMA-4) that include tidal in-formation, bathymetry, nitrogen and flow inputs and outputs, aswell as long-term, ebb-tide water quality data to calculate site-specific, tidally-averaged total nitrogen concentrationsthroughout each embayment (King, 1990). As noted above, tidally-averaged nitrogen represents the best estimate of the TN levelassociatedwith a location, such as an eelgrass bed, as it accounts forthe natural variation in concentration due to tidal exchanges.
Of the 19 estuaries included in the present study, the MEP es-timates of tidally-averaged total nitrogen levels associated with thewater quality sampling locations were available for 12 systems(http://www.oceanscience.net/estuaries). All of the stations used inthe reports showed the same pattern as results from the currentstudy, which only used sites that supported eelgrass at one time.The lowest tidally-averaged and ebb-tide total nitrogen was foundin healthy eelgrass sites, while the highest was found in sites withdegraded eelgrass (Fig. 6). Sites that have not supported eelgrass inthe past 60 years had the highest total nitrogen concentrations inboth the tidally averaged and long-term total nitrogen concentra-tion averages. Sites with healthy eelgrass had a tidally-averagedtotal nitrogen concentration of 0.34 mg/L and ebb tide TN of0.37 mg/L. However, a more conservative tool for establishingacceptable TN levels for management of eelgrass habitat andrestoration would be the 75th percentile of data. In this case the75th percentile of tidally-averaged TN was 0.36 mg/L or a long-term, ebb-tide TN of 0.38 mg/L in sites of healthy eelgrass. How-ever, since long-term, ebb-tide nitrogen is correlated with thetidally-averaged TN, it is possible to use the monitoring average toguide management until the tidally-averaged TN value becomesavailable.
In this study ebb-tide, tidally-averaged, and 75th percentile totalnitrogen concentrations were very similar, but the 75th percentileTN concentration would be more perceivable in larger or longerestuaries where volumes and residence time were greater. Reme-diation of nitrogen enrichment for the purposes of restoringimpaired habitat needs to set TN targets that are supportive ofbenthic infauna, high dissolved oxygen and low to moderatechlorophyll levels. Using eelgrass alone to set nitrogen

J.L. Benson et al. / Journal of Environmental Management 131 (2013) 129e137136
management targets, for example under the Clean Water Act, willresult in the most restrictive and inclusive target concentrationsince eelgrass is such a sensitive indicator of water quality.
The sites with degraded eelgrass were found to have the highesttotal nitrogen concentrations, yet the healthy eelgrass areas clearlyare associated with low TN and high bottom light. These resultsindicated that the presence of eelgrass is not descriptive enough todetermine target total nitrogen concentrations and grouping alleelgrass sites regardless of if they are stable or in decline obscuresthe relationship. The resolution gained by using specific eelgrasshealth increases the predictive power of using total nitrogen as agauge and determines areas with high priority for restoration. Sitesdeemed as degraded had one or all of the following characteristics:large amounts epiphytic algae, eelgrass that was being smotheredby macroalgae, and sparse thinning beds. These characteristicswere noted at sites specifically studied in this field research. Manyestuaries are losing eelgrass coverage rapidly and presence andcondition of this resource needs to be surveyed to determine thelevel and rate of degradation occurring.
5. Conclusions
Management actions to restore eelgrass should employ long-termwater quality monitoring data to determine when TN reacheslevels supportive of eelgrass. These water quality studies should besupplementedwith bottomwater light records before transplantingis attempted on a large scale. Total water column nitrogen is acommon environmental parameter collected in water qualitymonitoring and can be used to refine the target levels developed forsoutheastern Massachusetts estuaries and for application to otherestuaries, as site-specific targets provide the most efficient man-agement approach. The combination of TN and bottom light pro-vides amore robust approach, as TNalonedoes not take into accountwater depth. The strong relationship seen between TN and eelgrasshabitat and survival point to the efficacy of using TN as a criticalmetric in predicting eelgrass restoration success in shallow estu-aries. Although the depths were relatively shallow in this study, theunderlying process relating TN and bottom light intensity remaintrue for deeper estuaries in the absence of other sources of turbidityMany restoration projects are currently underway inMassachusettsembayments to lower estuarine nitrogen levels to the TN targetsindicated by this study, and continuedwater qualitymonitoring andperiodic transplant experiments and light measurements are beingused to assess habitat restoration.
Acknowledgments
We would like to sincerely thank Dr. Craig Taylor from WoodsHole Oceanographic Institute for his scientific expertise, technicalreview, and assistancewith curve fitting. In addition, we thank JohnRamsey and Roland Samimy from the Massachusetts EstuariesProject for providing the tidally averaged total nitrogen results.Field and laboratory assistance was provided by the researchers atthe Coastal Systems Program: Michael Bartlett, Sara SampieriHorvet, Dahlia Medeiros, Kaitlyn Shaw, Camille David, and theCoastal Systems summer interns. We also thank Three Bays Pres-ervation, Falmouth Pond Watchers, Chatham Water Quality Moni-toring Program, Yarmouth Water Quality Monitoring Program andthe Harwich Water Quality Program for providing water qualityinformation and note the dedication of their water quality moni-toring volunteers, without whom this work would not have beenpossible. Wewould also like to thank Ross Kessler and Steve Aubreyfor their assistance with the eelgrass transplanting method. Thisresearchwas funded through the Coastal Systems Program, SMAST-UMASS Dartmouth.
References
Biber, P.D., Gallegos, C.L., Kenworthy, W.J., 2008. Calibration of a bio-optical model inthe North River, North Carolina (Albemarle-Pamlico sound): a tool to evaluatewater quality impacts on seagrasses. Estuaries 31, 177e191.
Bricker, S.B., Clement, C.D., Pirhalla, D.E., Orlando, S.P., Farrow, D.R.G., 1999. NationalEstuarine Eutrophication Assessment: Effects of Nutrient Enrichment in theNation’s Estuaries. NOAA, National Ocean Service, Special Projects Office andthe National Centers for Coastal Ocean Science, Silver Spring, MD.
Burkholder, J.M., Mason, K.M., Glasgow Jr., H.B., 1992. Water-column nitrateenrichment promotes decline of eelgrass Zostera marina: evidence from sea-sonal mesocosm experiments. Mar. Ecol. Prog. Ser. 81, 163e178.
Cambridge, M.L., McComb, A.J., 1984. The loss of seagrass from Cockburn Sound,Western Australia. I. The time course and magnitude of seagrass decline inrelation to industrial development. Aquat. Bot. 20, 229e243.
Cloern, J.E., 2001. Our evolving conceptual model of the coastal eutrophicationproblem. Mar. Ecol. Prog. Ser. 210, 223e253.
Collos, Y., Slawyk, G., 1976. Significance of cellular nitrate content in natural pop-ulations of marine phytoplankton growing in shipboard cultures. Mar. Biol. 34(1), 27e32.
Costa, J.E., 1988. Distribution, Production and Historical Changes in Abundance ofEelgrass (Zostera marina) in Southeastern Massachusetts (Ph.D. dissertation).Boston University, Boston, MA.
Costa, J.E., Howes, B.L., Giblin, A., Valiela, I., 1992. Monitoring nitrogen and in-dicators of nitrogen to support management action in Buzzards Bay. In:McKenzie, et al. (Eds.), Ecological Indicators. Elsevier, London, pp. 497e529.
Costello, C.T., Kenworthy, W.J., 2011. Twelve-year mapping and change analysis ofeelgrass (Zostera marina) areal abundance in Massachusetts (USA) identifiesstatewide declines. Estuar. Coasts 34 (2), 232e242.
Deegan, L.A., 2002. Lessons learned: the effects of nutrient enrichment on thesupport of nekton by seagrass and salt marsh ecosystems. Estuaries 25 (4B),727e742.
Dennison, W.C., Alberte, R.S., 1985. Role of daily light period in the depth distri-bution of Zostera marina (eelgrass). Mar. Ecol. Prog. Ser. 25, 51e62.
Dennison, W.C., Orth, R.J., Moore, K.A., Stevenson, J.C., Carter, V., Kollar, S.,Bergstrom, P.W., Batiuk, R.A., 1993. Assessing water quality with submersedaquatic vegetation. BioScience 43 (2), 86e95.
Duarte, C.M., 1991. Seagrass depth limits. Aquat. Bot. 40 (4), 363e377.Fisher, T.R., Hagy, J.D., Rochelle-Newall, E., 1998. Dissolved and particulate organic
carbon in Chesapeake Bay. Estuaries 21 (2), 215e229.Fonseca, M.S., Kenworthy, W.J., Colby, D.R., Rittmaster, K.A., Thayer, G.W., 1990.
Comparisons of fauna among natural and transplanted eelgrass Zostera marinameadows: criteria for mitigation. Mar. Ecol. Prog. Ser. 65, 251e264.
Harlin, M.M., 1993. Changes in major plant groups following nutrient enrichment.In: McComb, J. (Ed.), Eutrophic Shallow Estuaries and Lagoons. CRC Press, Inc.,Boca Raton, FL, pp. 173e187.
Hauxwell, J., Cebrian, J., Valiela, I., 2003. Eelgrass (Zostera marina L.) loss intemperate estuaries: relationship to land-derived nitrogen loads and effect oflight limitation imposed by algae. Mar. Ecol. Prog. Ser. 247, 59e73.
Heck, K.L., Able, K., Rooman, C., Fahay, M., 1995. Composition, abundance, biomassand production of macrofauna in a New England estuary: comparisons amongeelgrass meadows and other nursery habitats. Estuaries 18, 379e389.
Howes, B.L., Williams, T., Rasmussen, M., 1999. Baywatchers II Nutrient RelatedWater Quality of Buzzards Bay Embayments: a Synthesis of BaywatchersMonitoring 1992e1998. The Coalition for Buzzards Bay, New Bedford, MA.
Howes, B., Kelley, S.W., Ramsey, J.S., Samimy, R., Schlezinger, D., Eichner, E., 2003.Linked Watershed-embayment Model to Determine Critical Nitrogen LoadingThresholds for Stage Harbor, Sulphur Springs, Taylors Pond, Bassing Harbor, andMuddy Creek, Chatham, Massachusetts. Massachusetts Estuaries Project, Mas-sachusetts Department of Environmental Protection, Boston, MA.
Howes, B., Kelley, S.W., Ramsey, J.S., Samimy, R., Schlezinger, D., Eichner, E., 2006.Linked Watershed-embayment Model to Determine Critical Nitrogen LoadingThresholds for Pleasant Bay, Chatham, Massachusetts. Massachusetts EstuariesProject, Massachusetts Department of Environmental Protection, Boston, MA.
Kemp, W.M., Batiuk, R., Bartleson, R., Bergstrom, P., Carter, V., Gallegos, C.L.,Hunley, W., Karrh, L., Koch, E.W., Landwehr, J.M., Moore, K.A., Murray, L.,Naylor, M., Rybicki, N.B., Stevenson, J.C., Wilcox, D.J., 2004. Habitat requirementsfor submerged aquatic vegetation in Chesapeake Bay: water quality, lightregime, and physical-chemical factors. Estuaries 27, 363e377.
Kenworthy, W., Fonseca, M., 1996. Light requirements of seagrasses Halodulewrightii and Syringodium filiforme derived from the relationship betweendiffuse light attenuation and maximum depth distributions. Estuaries 19, 740e750.
King, I.P., 1990. Program Documentation-RMA2-A Two Dimensional Finite ElementModel for Flow in Estuaries and Streams. Resource Management Associates,Lafayette, CA.
Kirsten, W., 1983. Organic Elemental Analysis: Ultramicro, Micro, and TraceMethods. Academic Press/Harcourt Brace Jovanovich, NY.
Latimer, J.S., Rego, S.A., 2010. Empirical relationship between eelgrass extent andpredicted water-shed derived nitrogen loading for shallow New England es-tuaries. Estuar. Coast. Shelf Sci. 90 (4), 231e240.
Lee, K.S., Short, F.T., Burdick, D.M., 2004. Development of a nutrient pollution in-dicator using the seagrass, Zostera marina, along nutrient gradients in threeNew England estuaries. Aquat. Bot. 78, 197e216.

J.L. Benson et al. / Journal of Environmental Management 131 (2013) 129e137 137
Lee, V., Olsen, S., 1985. Eutrophication and management initiatives for the control ofnutrient inputs to Rhode Island coastal lagoons. Estuaries 8, 191e202.
Lesche, A.S., Kessler, R.K., Estrella, B.T., 2006. Status of eelgrass restoration project.In: Estrella, B.T. (Ed.), Hubline Impact Assessment, Mitigation, and Restoration:Annual Progress Report of the Division of Marine Fisheries to the ExecutiveOffice of Environmental Affairs, July 1, 2005eJune 30, 2006, p. 92.
Moore, K.A., Neckles, H.A., Orth, R.J., 1996. Zostera marina (eelgrass) growth andsurvival along a gradient of nutrients and turbidity in the lower ChesapeakeBay. Mar. Ecol. Prog. Ser. 142, 247e259.
Murphy, J., Riley, J.P., 1962. A modified single solution method for determination ofphosphate in natural waters. Anal. Chim. Acta 27, 31e36.
Nixon, S.W., 1995. Coastal marine eutrophication: a definition, social causes, andfuture concerns. Ophelia 41, 199e219.
Olesen, B., Sand-Jensen, K., 1993. Seasonal acclimatization of eelgrass Zostera marinagrowth to light. Mar. Ecol. Prog. Ser. 94, 91e99.
Orth, R.J., Moore, K.A., 1983. Chesapeake Bay: an unprecedented decline in sub-merged aquatic vegetation. Science 222, 51e53.
Orth, R.J., Carruthers, T.J.B., Dennison, W.C., Duarte, C.M., Fourqurean, J.W.,Heck Jr., K.L., Hughes, A.R., Kendrick, G.A., Kenworthy, W.J., Olyarnik, S.,Short, F.T., Waycott, M., Williams, S.L., 2006. A global crisis for seagrass eco-systems. BioScience 56, 987e996.
Parsons, T.R., Maita, Y., Lalli, C., 1989. Manual of Chemical and Biological Methodsfor Seawater Analysis. Pergamon Press, p. 173.
Pickney, J.L., Paerl, H.W., Tester, P., Richardson, T.L., 2001. The role of nutrientloading and eutrophication in estuarine ecology. Environ. Health Perspect. 109,699e706.
Ryther, J.H., Dunston, W.M., 1971. Nitrogen, phosporus, and eutrophication in thecoastal environment. Science 171, 1008e1013.
Scheiner, D., 1976. Determination of ammonia and kjeldahl nitrogen by indophenolmethod. Water Res. 10, 31e36.
Short, F.T., Burdick, D.M., Kaldy, J.E., 1995. Mesocosm experiments quantify the effectsof eutrophication on eelgrass, Zostera marina. Limnol. Oceanogr. 40, 740e749.
Short, F.T., Burdick, D.M., 1996. Quantifying eelgrass habitat loss in relation tohousing development and nitrogen loading in Waquoit Bay. MassachusettsEstuar. 19, 730e739.
Short, F.T., Wyllie-Echeverria, S., 1996. Natural and human induced disturbance ofseagrasses. Environ. Conserv. 23, 17e27.
Short, F.T., Short, C.A., Burdick-Whitney, C.L., 2002. A Manual for Community-basedEelgrass Restoration. Report to the NOAA Restoration Center. Jackson EstuarineLaboratory, University of New Hampshire, Durham, NH, p. 54.
Smith, R.D., Pregnall, A.M., Alberte, R.S., 1988. Effects of anaerobiosis on rootmetabolism of Zostera marina (eelgrass): implications for survival in reducingsediments. Mar. Biol. 98, 131e141.
Stevenson, J.C., Staver, L.W., Staver, K.W.,1993.Water quality associatedwith survival ofsubmersed aquatic vegetation along an estuarine gradient. Estuaries 16, 348e361.
Taylor, D., Nixon, S., Granger, S., Buckley, B., 1995. Nutrient limitation and theeutrophication of coastal lagoons. Mar. Ecol. Prog. Ser. 127, 235e244.
Thayer, G.W., Kenworthy, W.J., Fonseca, M.S., 1984. The Ecology of EelgrassMeadows of the Atlantic Coast: a Community Profile. U.S. Fish and WildlifeService, p. 147. FWS/OBS-84/02.
Tomasko, D.A., Dawes, C.J., Hall, M.O., 1996. The effects of anthropogenic nutrientenrichment on turtle grass (Thalassia testudinum) in Sarasota Bay, Florida. Es-tuaries 19, 448e456.
Waycott, M., Duarte, C.M., Carruthers, T.J.B., Orth, R., Dennison, W.C., Olyarnic, S.,Calladine, A., Fourqurean, J.W., Heck Jr., K.L., Hughes, A.R., Kendrick, G.A.,Kenworthy, W.J., Short, F.T., Williams, S.L., 2009. Accelerating loss of seagrassesacross the globe threatens coastal ecosystems. PNAS 106 (30), 12377e12381.
Wheeler, P.A., Glibert, P.M., McCarthy, J.J., 1982. Ammonium uptake and incorpo-ration by Chesapeake Bay phytoplankton: short-term uptake kinetics. Limnol.Oceanogr. 27 (6), 1113e1128.
Wood, E., Armstrong, F., Richards, F., 1967. Determination of nitrate in sea water bycadmium copper reduction to nitrite. J. Mar. Biol. Ass. U.K 47, 23e31.
Wood, E.J.F., Odum, W.E., Zieman, J.C., 1969. Influence of sea grasses on the pro-ductivity of coastal lagoons. In: Lagunas Costeras. Un Simposio Mem. Simp.Intern. UNAM-UNESCO, Mexico, D.F., pp. 495e502. Nov. 1967.
Zieman, J.C., 1982. The Ecology of the Seagrasses of South Florida: a Community Profile.U.S. Fish & Wildlife Biological Services Program, pp. 124e126. FWS/OBS-82/25.
Zimmerman, R.C., Alberte, R.S., 1996. Effect of light/dark transition on carbontranslocation in eelgrass Zostera marina seedlings. Mar. Ecol. Prog. Ser. 136,305e309.

![Effect of Freshwater Influx on Phytoplankton in the ... · phytoplankton pigment composition and functionality in response to ecosystem changes in the southeastern US estuaries [10],](https://img.pdfslide.us/doc/110x75/5fc8002d998e1c47571eefeb/effect-of-freshwater-influx-on-phytoplankton-in-the-phytoplankton-pigment-composition.jpg)