Embed Size (px)
Citation preview
Teacher and learner behaviour in an online EFL workbook Krzysztof
Jedrzejewski [email protected]
Mikolaj Bogucki mikolaj.bogucki @pearson.com
Mikolaj Olszewski mikolaj.olszewski @pearson.com
Jan Zwolinski jan.zwolinski
@pearson.com
Kacper Lodzikowski
kacper.lodzikowski @pearson.com
All authors work for Pearson IOKI, Dabrowskiego 77, Poznan.
ABSTRACT In this paper, we present selected findings from our usage analysis of an online English Language Teaching (ELT) workbook. We focus on how teachers assign activities and how learners complete them.
Keywords ELT, network analysis, time on task
1. BACKGROUND MyEnglishLab for Speakout Pre-intermediate is an ELT workbook that accompanies a paper textbook. The aim of the product is for the teacher to assign auto-graded homework. On average, about 10 practice activities are assigned by the teachers within a week, with a 30% chance of assigning more than the average. Speakout consists of twelve units that cover 90-120 hours of teaching. Each unit contains about thirty assignable activities centred around grammar, vocabulary, listening, reading and writing. This paper is an exploratory study about how teachers assign such activities and how learners complete them.
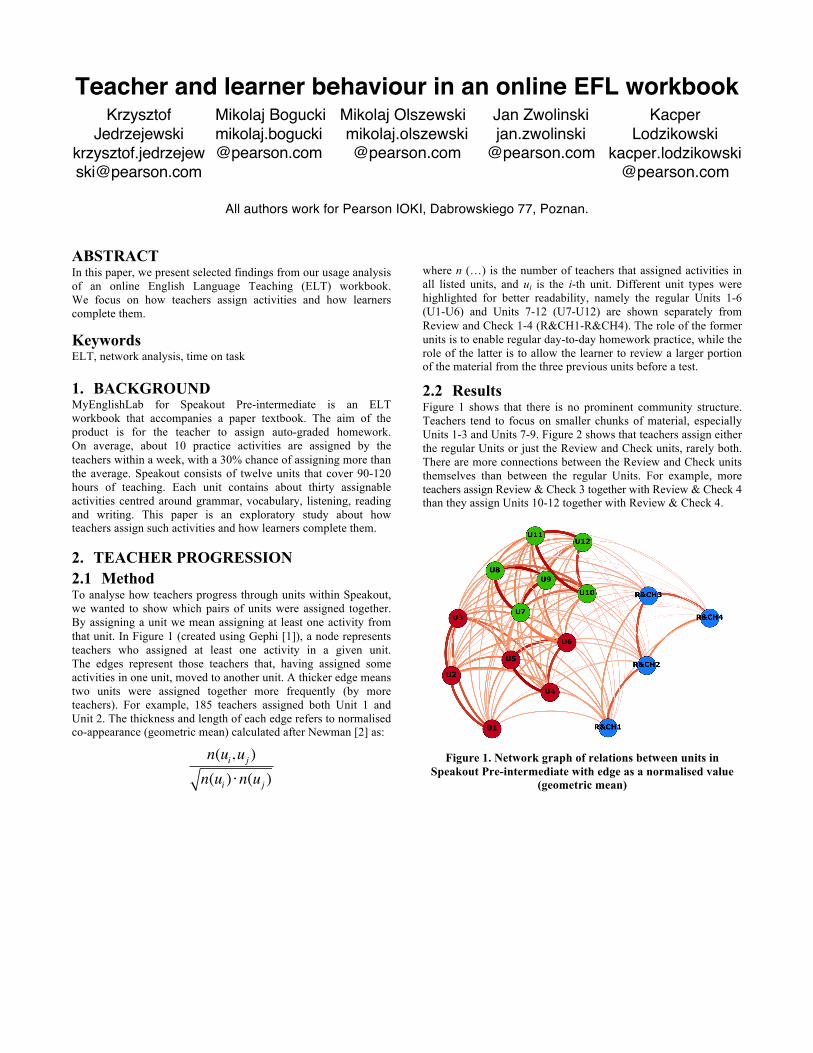
2. TEACHER PROGRESSION 2.1 Method To analyse how teachers progress through units within Speakout, we wanted to show which pairs of units were assigned together. By assigning a unit we mean assigning at least one activity from that unit. In Figure 1 (created using Gephi [1]), a node represents teachers who assigned at least one activity in a given unit. The edges represent those teachers that, having assigned some activities in one unit, moved to another unit. A thicker edge means two units were assigned together more frequently (by more teachers). For example, 185 teachers assigned both Unit 1 and Unit 2. The thickness and length of each edge refers to normalised co-appearance (geometric mean) calculated after Newman [2] as:
n(ui,uj )n(ui ) ⋅n(uj )
where n (…) is the number of teachers that assigned activities in all listed units, and ui is the i-th unit. Different unit types were highlighted for better readability, namely the regular Units 1-6 (U1-U6) and Units 7-12 (U7-U12) are shown separately from Review and Check 1-4 (R&CH1-R&CH4). The role of the former units is to enable regular day-to-day homework practice, while the role of the latter is to allow the learner to review a larger portion of the material from the three previous units before a test.
2.2 Results Figure 1 shows that there is no prominent community structure. Teachers tend to focus on smaller chunks of material, especially Units 1-3 and Units 7-9. Figure 2 shows that teachers assign either the regular Units or just the Review and Check units, rarely both. There are more connections between the Review and Check units themselves than between the regular Units. For example, more teachers assign Review & Check 3 together with Review & Check 4 than they assign Units 10-12 together with Review & Check 4.
Figure 1. Network graph of relations between units in
Speakout Pre-intermediate with edge as a normalised value (geometric mean)
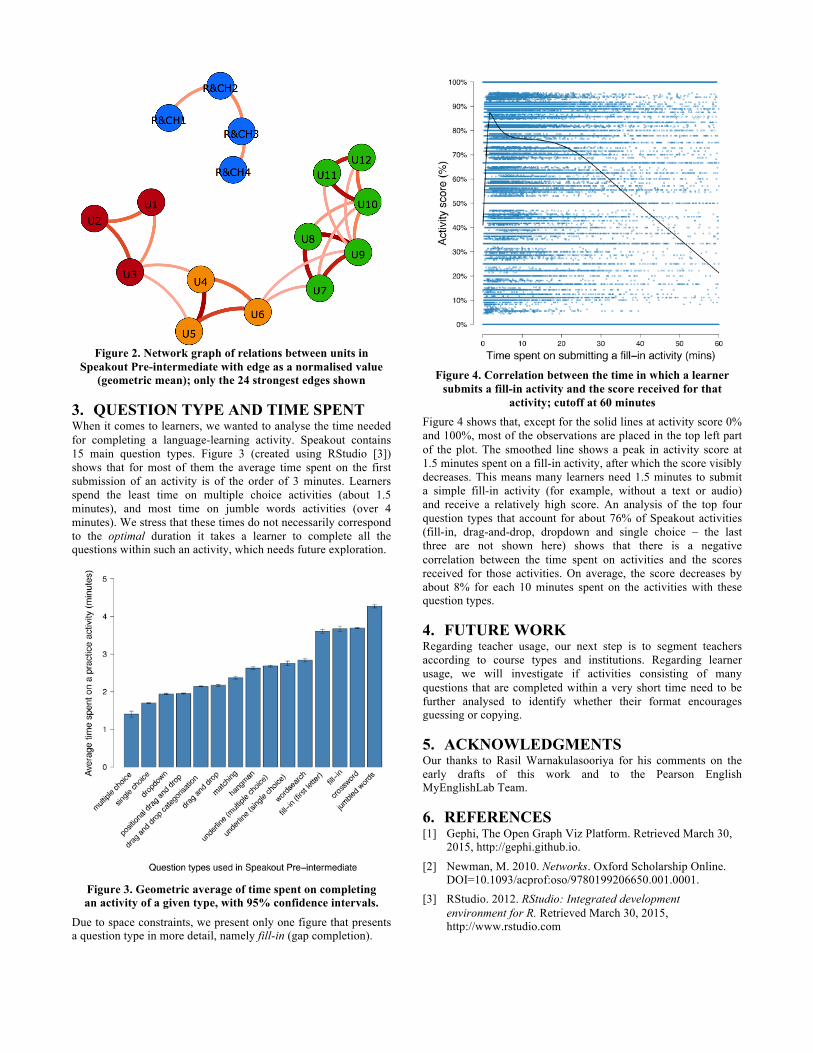
Figure 2. Network graph of relations between units in
Speakout Pre-intermediate with edge as a normalised value (geometric mean); only the 24 strongest edges shown
3. QUESTION TYPE AND TIME SPENT When it comes to learners, we wanted to analyse the time needed for completing a language-learning activity. Speakout contains 15 main question types. Figure 3 (created using RStudio [3]) shows that for most of them the average time spent on the first submission of an activity is of the order of 3 minutes. Learners spend the least time on multiple choice activities (about 1.5 minutes), and most time on jumble words activities (over 4 minutes). We stress that these times do not necessarily correspond to the optimal duration it takes a learner to complete all the questions within such an activity, which needs future exploration.
Figure 3. Geometric average of time spent on completing an activity of a given type, with 95% confidence intervals.
Due to space constraints, we present only one figure that presents a question type in more detail, namely fill-in (gap completion).
Figure 4. Correlation between the time in which a learner
submits a fill-in activity and the score received for that activity; cutoff at 60 minutes
Figure 4 shows that, except for the solid lines at activity score 0% and 100%, most of the observations are placed in the top left part of the plot. The smoothed line shows a peak in activity score at 1.5 minutes spent on a fill-in activity, after which the score visibly decreases. This means many learners need 1.5 minutes to submit a simple fill-in activity (for example, without a text or audio) and receive a relatively high score. An analysis of the top four question types that account for about 76% of Speakout activities (fill-in, drag-and-drop, dropdown and single choice – the last three are not shown here) shows that there is a negative correlation between the time spent on activities and the scores received for those activities. On average, the score decreases by about 8% for each 10 minutes spent on the activities with these question types.
4. FUTURE WORK Regarding teacher usage, our next step is to segment teachers according to course types and institutions. Regarding learner usage, we will investigate if activities consisting of many questions that are completed within a very short time need to be further analysed to identify whether their format encourages guessing or copying.
5. ACKNOWLEDGMENTS Our thanks to Rasil Warnakulasooriya for his comments on the early drafts of this work and to the Pearson English MyEnglishLab Team.
6. REFERENCES [1] Gephi, The Open Graph Viz Platform. Retrieved March 30,
2015, http://gephi.github.io.
[2] Newman, M. 2010. Networks. Oxford Scholarship Online. DOI=10.1093/acprof:oso/9780199206650.001.0001.
[3] RStudio. 2012. RStudio: Integrated development environment for R. Retrieved March 30, 2015, http://www.rstudio.com