Embed Size (px)
Citation preview

Notice to ASX
Vaughn Walton Assistant Company Secretary
Tim Paine Joint Company Secretary
Rio Tinto plc 6 St James’s Square, London SW1Y 4AD United Kingdom T +44 20 7781 1345 Registered in England No. 719885
Rio Tinto Limited 120 Collins Street Melbourne 3000 Australia T +61 3 9283 3333 Registered in Australia ABN 96 004 458 404
Creating leading Copper & Coal businesses – Jean-Sébastien Jacques Copper & Coal roadshow 1 June 2015 Attached is a presentation given on 1 June 2015 by Rio Tinto Copper & Coal chief executive Jean-Sébastien Jacques as part of an investor roadshow in the United States. The presentation is also available on Rio Tinto’s website at: www.riotinto.com/presentations
For
per
sona
l use
onl
y

Rio Tinto Copper & Coal RoadshowJune 2015
Creating leading copper
and coal businessesJean-Sébastien Jacques, chief executive, Copper & Coal
For
per
sona
l use
onl
y
©2015, Rio Tinto, All Rights Reserved
Cautionary statement
This presentation has been prepared by Rio Tinto plc and Rio Tinto Limited (“Rio Tinto”). By accessing/attending this presentation you acknowledge that you have read and understood the following statement. In this presentation all figures are US dollars unless stated otherwise.
Forward-looking statements
This document contains certain forward-looking statements with respect to the financial condition, results of operations and business of the Rio Tinto Group. These statements are forward-looking statements within the meaning of Section 27A of the US Securities Act of 1933, and Section 21E of the US Securities Exchange Act of 1934. The words “intend”, “aim”, “project”, “anticipate”, “estimate”, “plan”, “believes”, “expects”, “may”, “should”, “will”, “target”, “set to” or similar expressions, commonly identify such forward-looking statements.
Examples of forward-looking statements include those regarding estimated ore reserves, anticipated production or construction dates, costs, outputs and productive lives of assets or similar factors. Forward-looking statements involve known and unknown risks, uncertainties, assumptions and other factors set forth in this presentation.
For example, future ore reserves will be based in part on market prices that may vary significantly from current levels. These may materially affect the timing and feasibility of particular developments. Other factors include the ability to produce and transport products profitably, demand for our products, changes to the assumptions regarding the recoverable value of our tangible and intangible assets, the effect of foreign currency exchange rates on market prices and operating costs, and activities by governmental authorities, such as changes in taxation or regulation, and political uncertainty.
In light of these risks, uncertainties and assumptions, actual results could be materially different from projected future results expressed or implied by these forward-looking statements which speak only as to the date of this presentation. Except as required by applicable regulations or by law, the Rio Tinto Group does not undertake any obligation to publicly update or revise any forward-looking statements, whether as a result of new information or future events. The Group cannot guarantee that its forward-looking statements will not differ materially from actual results.
Disclaimer
Neither this presentation, nor the question and answer session, nor any part thereof, may be recorded, transcribed, distributed, published or reproduced in any form, except as permitted by Rio Tinto. By accessing/ attending this presentation, you agree with the foregoing and, upon request, you will promptly return any records or transcripts at the presentation without retaining any copies.
This presentation contains a number of non-IFRS financial measures. Rio Tinto management considers these to be key financial performance indicators of the business and they are defined and/or reconciled in Rio Tinto’s annual results press release and/or Annual report.
2
For
per
sona
l use
onl
y
©2015, Rio Tinto, All Rights Reserved
3
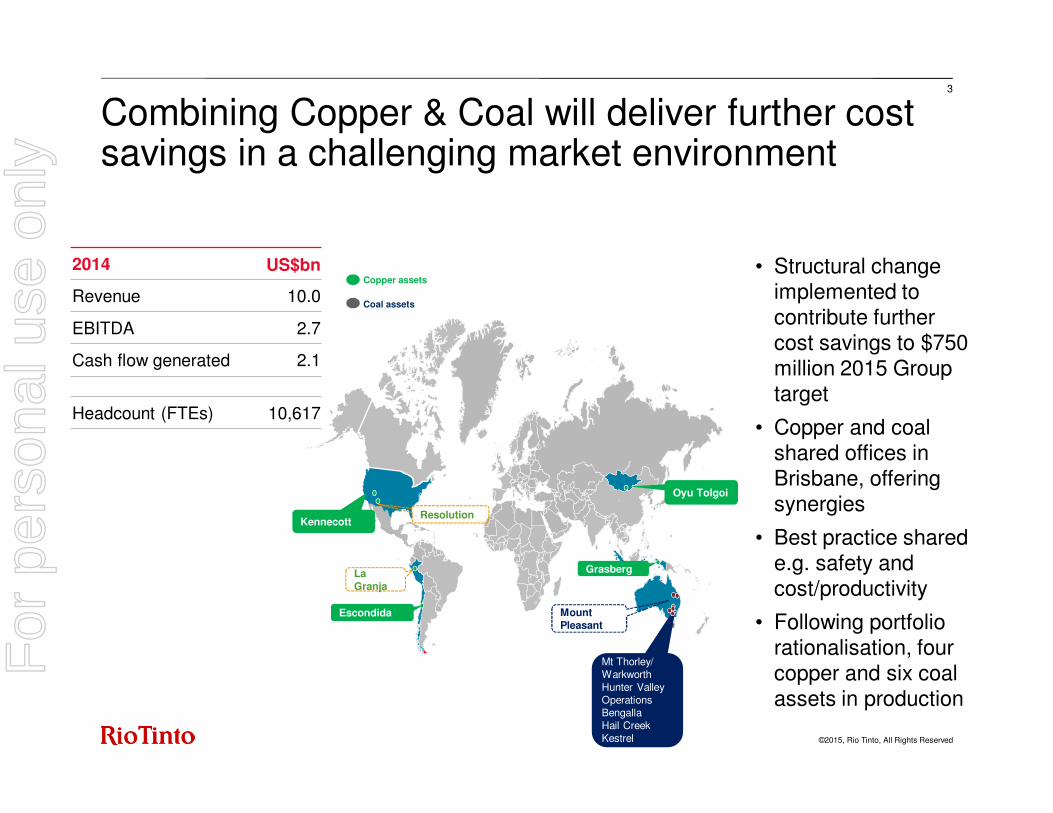
Combining Copper & Coal will deliver further cost savings in a challenging market environment
Copper assets
Coal assets
Kennecott
Escondida
Oyu Tolgoi
Mt Thorley/ WarkworthHunter Valley OperationsBengallaHail CreekKestrel
La Granja
Grasberg
Resolution
Mount Pleasant
• Structural change implemented to contribute further cost savings to $750 million 2015 Group target
• Copper and coal shared offices in Brisbane, offering synergies
• Best practice shared e.g. safety and cost/productivity
• Following portfolio rationalisation, four copper and six coal assets in production
2014 US$bn
Revenue 10.0
EBITDA 2.7
Cash flow generated 2.1
Headcount (FTEs) 10,617
For
per
sona
l use
onl
y
©2015, Rio Tinto, All Rights Reserved
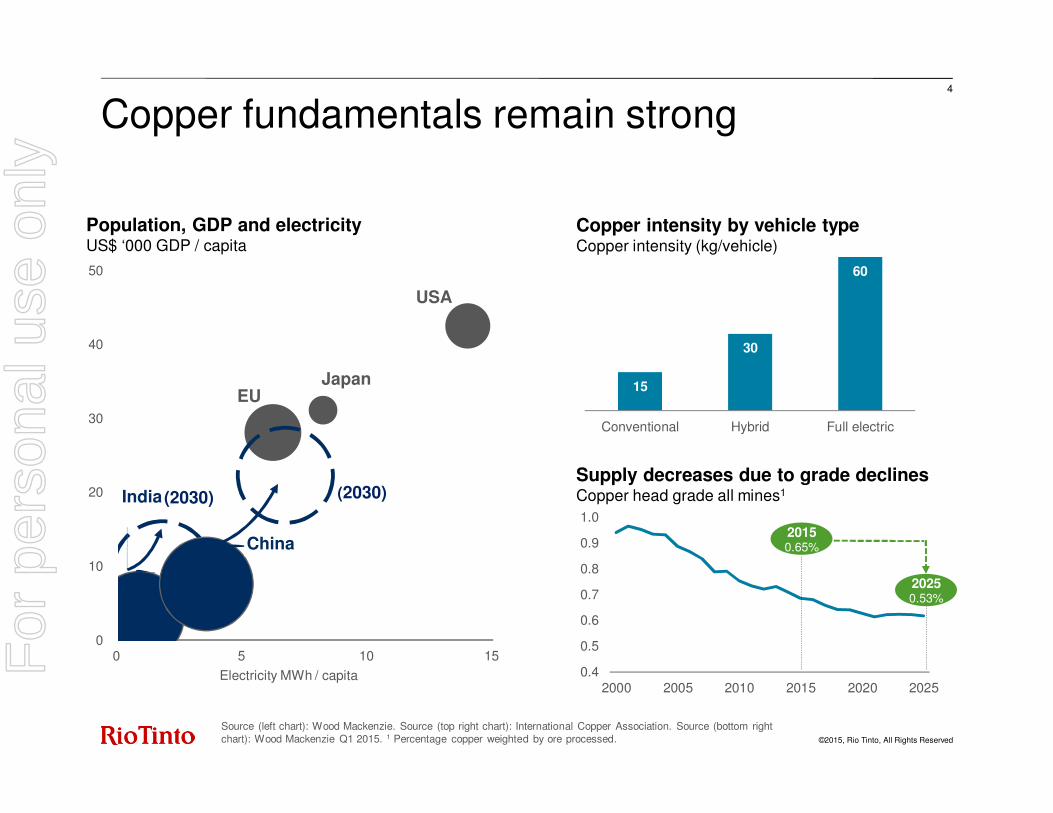
Copper fundamentals remain strong
0
10
20
30
40
50
0 5 10 15
Electricity MWh / capita
Population, GDP and electricityUS$ ‘000 GDP / capita
(2030)India
EU
USA
Japan
(2030)
China
15
30
60
Conventional Hybrid Full electric
Copper intensity by vehicle typeCopper intensity (kg/vehicle)
Supply decreases due to grade declinesCopper head grade all mines1
Source (left chart): Wood Mackenzie. Source (top right chart): International Copper Association. Source (bottom right chart): Wood Mackenzie Q1 2015. 1 Percentage copper weighted by ore processed.
0.4
0.5
0.6
0.7
0.8
0.9
1.0
2000 2005 2010 2015 2020 2025
20150.65%
20250.53%
4
For
per
sona
l use
onl
y

©2015, Rio Tinto, All Rights Reserved
2.25
2.50
2.75
3.00
3.25
3.50
Jan-14 Apr-14 Jul-14 Oct-14 Jan-15 Apr-15
Copper outlook continues to improve
Prices have recovered since Q1LME prices (US$/tonne)
1 January 2015 price
Attractive long-term fundamentalsCopper supply/demand (million tonnes)
• Firm fundamentals re-assert copper pricing support
• Supply continues to disappoint -disruptions running at 6% annualised year-to-date
• Chinese stimulus and loose monetary policy ex-China will be supportive of demand
• New supply additions incentivised over the last decade will peak in 2017
• Lack of new project approvals expected to see market return to deficit post-2017
12
14
16
18
20
22
24
2014 2016 2018 2020 2022 2024
Highly probable projects Base Case Production Primary demand
Oversupply / lower and volatile prices
Supply gap opening up
4-6Mt of additional capacity required
by 2025
Source (top chart): Wood Mackenzie Q1 2015. Source (bottom chart): Thomson Reuters.
5
For
per
sona
l use
onl
y

©2015, Rio Tinto, All Rights Reserved
Rio Tinto’s copper assets are world-class
400
300
200
100
018,00016,00014,00012,00010,0008,0006,0004,0002,0000
kt
Q4Q1 Q2 Q3
Oyu TolgoiEscondida
2015 copper equivalent cost curve (CuEq. costs vs. copper production)Copper equivalent cost including sustaining capex, deferred strip and royalties (c/lb)
Source: Wood Mackenzie (Q2 2015), Rio Tinto Q1’15 actual performance for Oyu Tolgoi and Kennecott Utah Copper. Escondida & Grasberg data from Wood Mackenzie.
GrasbergKennecott
6
For
per
sona
l use
onl
y
©2015, Rio Tinto, All Rights Reserved
Time
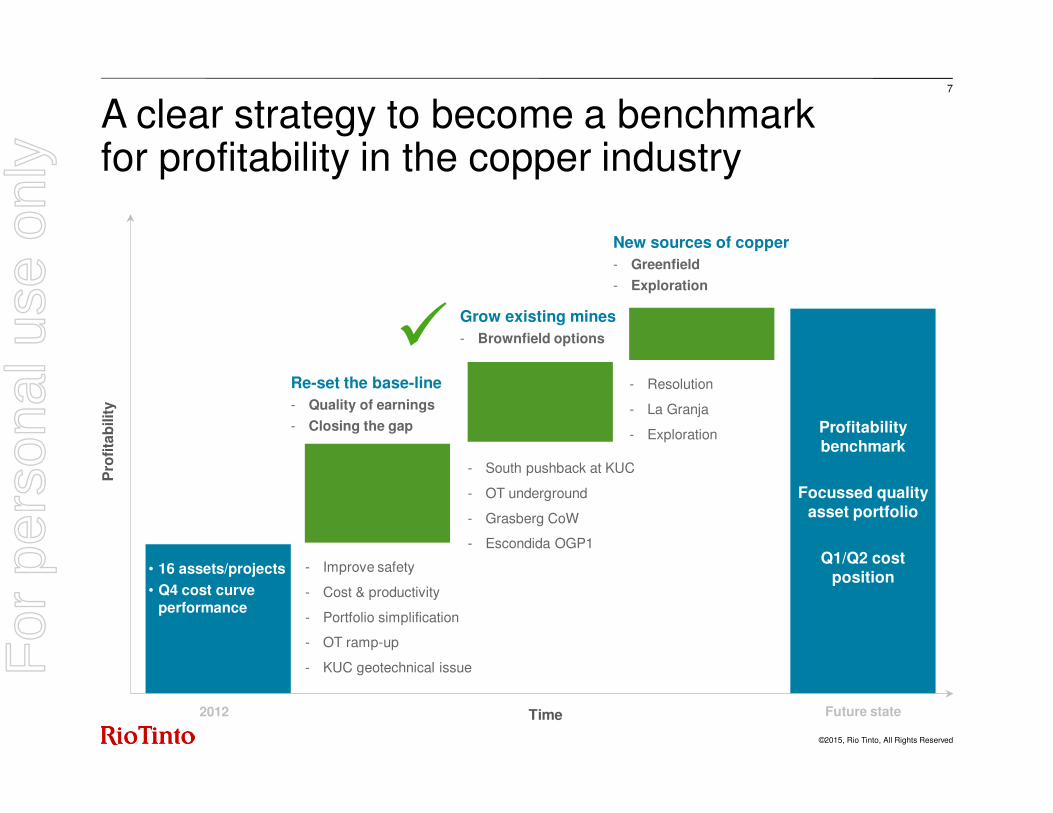
A clear strategy to become a benchmarkfor profitability in the copper industry
2012
- Improve safety
- Cost & productivity
- Portfolio simplification
- OT ramp-up
- KUC geotechnical issue
- South pushback at KUC
- OT underground
- Grasberg CoW
- Escondida OGP1
- Resolution
- La Granja
- Exploration Profitability benchmark
Focussed quality asset portfolio
Q1/Q2 cost position
Pro
fita
bilit
y
• 16 assets/projects
• Q4 cost curve performance
�
7
New sources of copper
- Greenfield
- Exploration
Grow existing mines
- Brownfield options
Re-set the base-line
- Quality of earnings
- Closing the gap
Future state
For
per
sona
l use
onl
y
©2015, Rio Tinto, All Rights Reserved
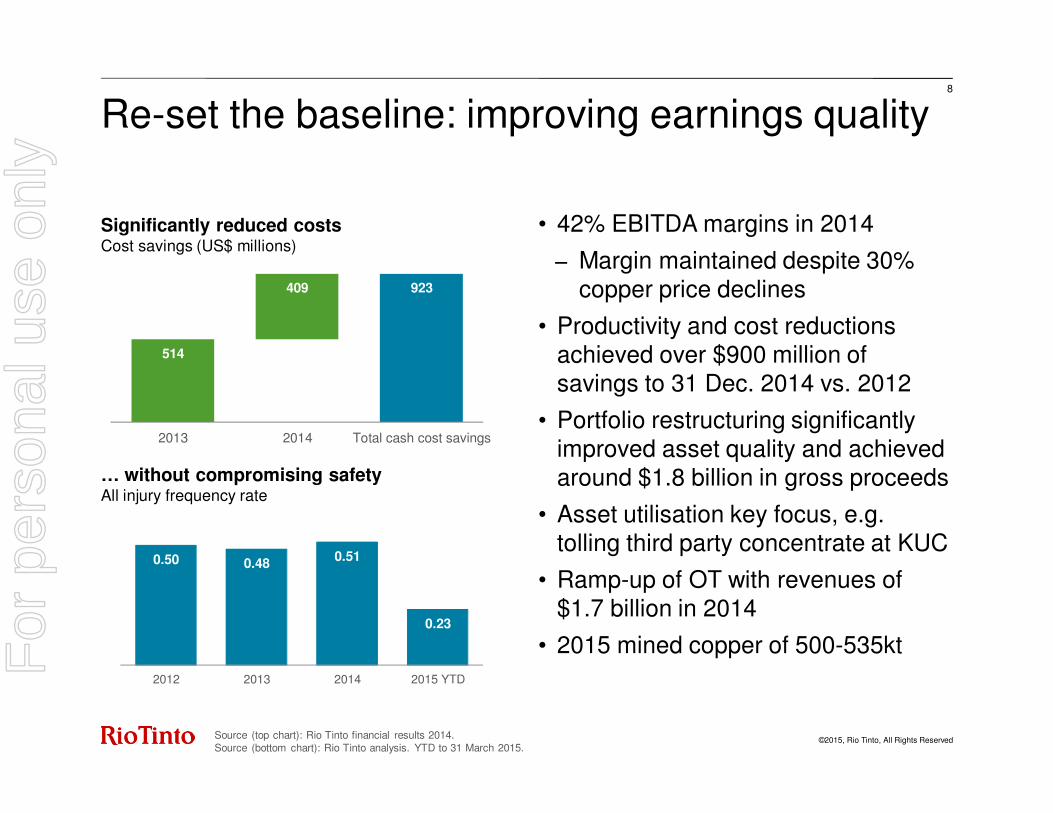
• 42% EBITDA margins in 2014
− Margin maintained despite 30% copper price declines
• Productivity and cost reductions achieved over $900 million of savings to 31 Dec. 2014 vs. 2012
• Portfolio restructuring significantly improved asset quality and achieved around $1.8 billion in gross proceeds
• Asset utilisation key focus, e.g. tolling third party concentrate at KUC
• Ramp-up of OT with revenues of $1.7 billion in 2014
• 2015 mined copper of 500-535kt
8
Re-set the baseline: improving earnings quality
… without compromising safetyAll injury frequency rate
Source (top chart): Rio Tinto financial results 2014.Source (bottom chart): Rio Tinto analysis. YTD to 31 March 2015.
Significantly reduced costsCost savings (US$ millions)
514
409 923
2013 2014 Total cash cost savings
0.50 0.48 0.51
0.23
2012 2013 2014 2015 YTD
For
per
sona
l use
onl
y
©2015, Rio Tinto, All Rights Reserved
9
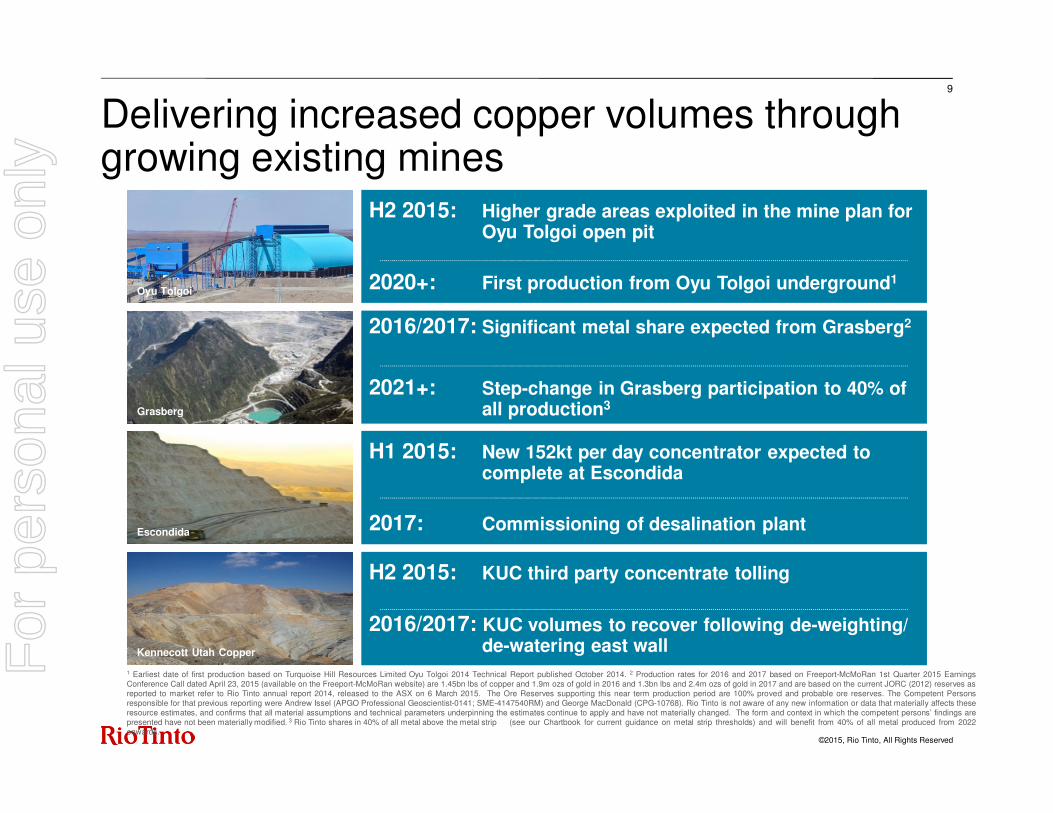
Delivering increased copper volumes through growing existing mines
H2 2015: KUC third party concentrate tolling
2016/2017: KUC volumes to recover following de-weighting/ de-watering east wall
H1 2015: New 152kt per day concentrator expected to complete at Escondida
2017: Commissioning of desalination plant
H2 2015: Higher grade areas exploited in the mine plan for Oyu Tolgoi open pit
2020+: First production from Oyu Tolgoi underground1
2016/2017: Significant metal share expected from Grasberg2
2021+: Step-change in Grasberg participation to 40% of all production3
1 Earliest date of first production based on Turquoise Hill Resources Limited Oyu Tolgoi 2014 Technical Report published October 2014. 2 Production rates for 2016 and 2017 based on Freeport-McMoRan 1st Quarter 2015 EarningsConference Call dated April 23, 2015 (available on the Freeport-McMoRan website) are 1.45bn lbs of copper and 1.9m ozs of gold in 2016 and 1.3bn lbs and 2.4m ozs of gold in 2017 and are based on the current JORC (2012) reserves asreported to market refer to Rio Tinto annual report 2014, released to the ASX on 6 March 2015. The Ore Reserves supporting this near term production period are 100% proved and probable ore reserves. The Competent Personsresponsible for that previous reporting were Andrew Issel (APGO Professional Geoscientist-0141; SME-4147540RM) and George MacDonald (CPG-10768). Rio Tinto is not aware of any new information or data that materially affects theseresource estimates, and confirms that all material assumptions and technical parameters underpinning the estimates continue to apply and have not materially changed. The form and context in which the competent persons’ findings arepresented have not been materially modified. 3 Rio Tinto shares in 40% of all metal above the metal strip (see our Chartbook for current guidance on metal strip thresholds) and will benefit from 40% of all metal produced from 2022onwards.
Oyu Tolgoi
Grasberg
Escondida
Kennecott Utah CopperFor
per
sona
l use
onl
y
©2015, Rio Tinto, All Rights Reserved
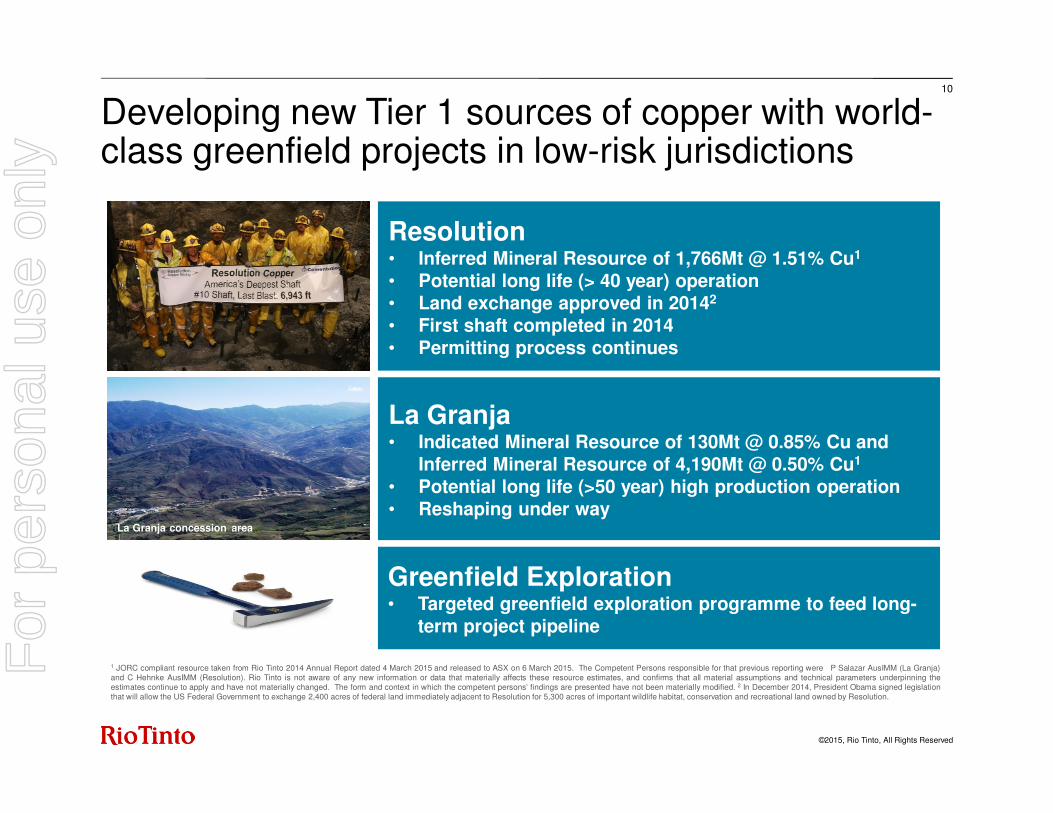
Resolution• Inferred Mineral Resource of 1,766Mt @ 1.51% Cu1
• Potential long life (> 40 year) operation • Land exchange approved in 20142
• First shaft completed in 2014• Permitting process continues
10
Developing new Tier 1 sources of copper with world-class greenfield projects in low-risk jurisdictions
La Granja• Indicated Mineral Resource of 130Mt @ 0.85% Cu and
Inferred Mineral Resource of 4,190Mt @ 0.50% Cu1
• Potential long life (>50 year) high production operation• Reshaping under way
La Granja concession area
1 JORC compliant resource taken from Rio Tinto 2014 Annual Report dated 4 March 2015 and released to ASX on 6 March 2015. The Competent Persons responsible for that previous reporting were P Salazar AusIMM (La Granja)and C Hehnke AusIMM (Resolution). Rio Tinto is not aware of any new information or data that materially affects these resource estimates, and confirms that all material assumptions and technical parameters underpinning theestimates continue to apply and have not materially changed. The form and context in which the competent persons’ findings are presented have not been materially modified. 2 In December 2014, President Obama signed legislationthat will allow the US Federal Government to exchange 2,400 acres of federal land immediately adjacent to Resolution for 5,300 acres of important wildlife habitat, conservation and recreational land owned by Resolution.
Greenfield Exploration• Targeted greenfield exploration programme to feed long-
term project pipeline
For
per
sona
l use
onl
y
©2015, Rio Tinto, All Rights Reserved
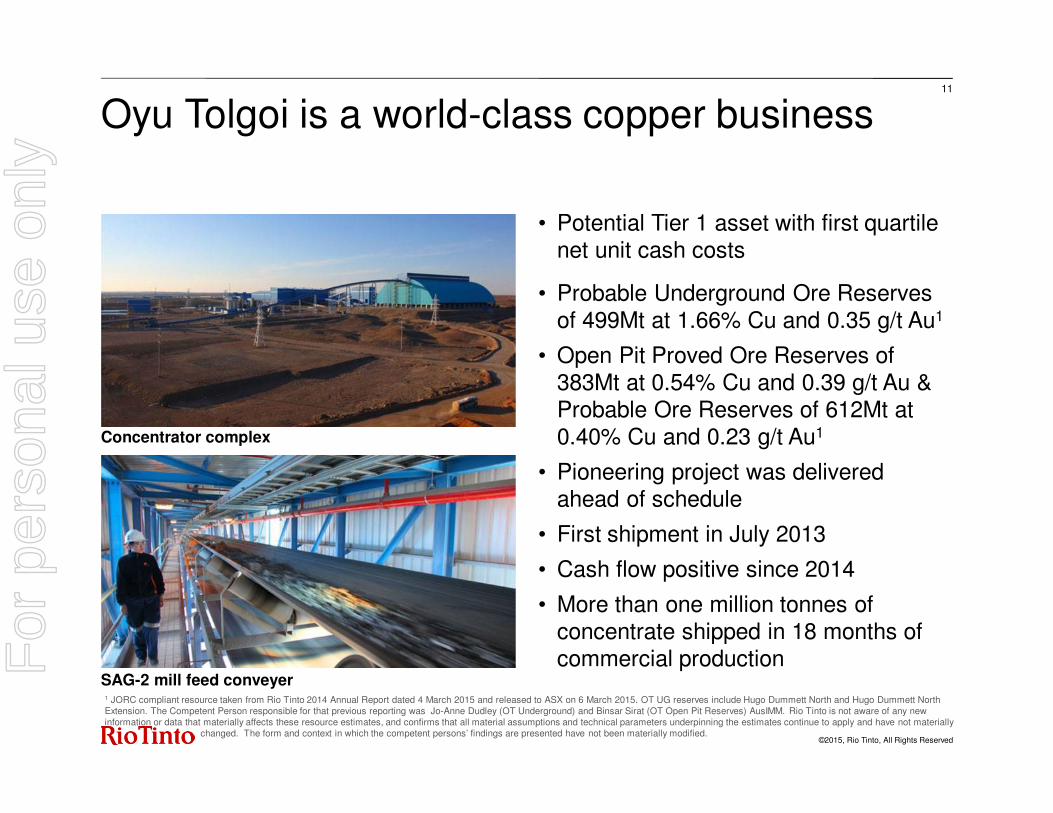
• Potential Tier 1 asset with first quartile net unit cash costs
• Probable Underground Ore Reserves of 499Mt at 1.66% Cu and 0.35 g/t Au1
• Open Pit Proved Ore Reserves of 383Mt at 0.54% Cu and 0.39 g/t Au & Probable Ore Reserves of 612Mt at 0.40% Cu and 0.23 g/t Au1
• Pioneering project was delivered ahead of schedule
• First shipment in July 2013
• Cash flow positive since 2014
• More than one million tonnes of concentrate shipped in 18 months of commercial production
Oyu Tolgoi is a world-class copper business11
Concentrator complex
SAG-2 mill feed conveyer1 JORC compliant resource taken from Rio Tinto 2014 Annual Report dated 4 March 2015 and released to ASX on 6 March 2015. OT UG reserves include Hugo Dummett North and Hugo Dummett North Extension. The Competent Person responsible for that previous reporting was Jo-Anne Dudley (OT Underground) and Binsar Sirat (OT Open Pit Reserves) AusIMM. Rio Tinto is not aware of any new information or data that materially affects these resource estimates, and confirms that all material assumptions and technical parameters underpinning the estimates continue to apply and have not materially
changed. The form and context in which the competent persons’ findings are presented have not been materially modified.
For
per
sona
l use
onl
y
©2015, Rio Tinto, All Rights Reserved
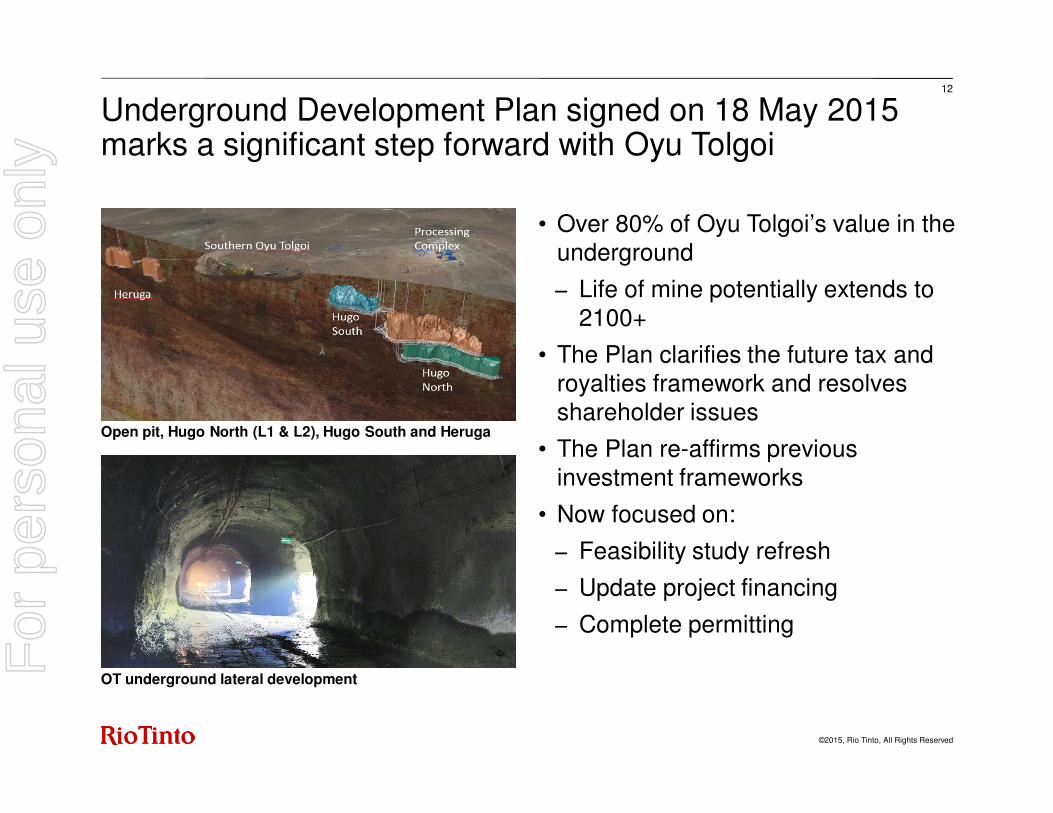
• Over 80% of Oyu Tolgoi’s value in the underground
− Life of mine potentially extends to 2100+
• The Plan clarifies the future tax and royalties framework and resolves shareholder issues
• The Plan re-affirms previous investment frameworks
• Now focused on:
− Feasibility study refresh
− Update project financing
− Complete permitting
12
Underground Development Plan signed on 18 May 2015 marks a significant step forward with Oyu Tolgoi
Open pit, Hugo North (L1 & L2), Hugo South and Heruga
OT underground lateral development
For
per
sona
l use
onl
y

©2014, Rio Tinto, All Rights Reserved
13
A clear strategy to create long term value
Strong long-term fundamentals despite short term volatility
Safety and focus on costs and productivity
Clear strategy to deliver sustainable value:
• Maximise value from existing operations
• Deliver brownfield growth options to leverage the next copper cycle
• Developing new Tier 1 sources of copper with world-class greenfield projects in low-risk jurisdictions
Four key operating assets
Two greenfield options
Oyu Tolgoi Kennecott
Escondida Grasberg
La Granja Resolution
For
per
sona
l use
onl
y

©2015, Rio Tinto, All Rights Reserved
3.35.3
8.1
4.7%
China power generation by sourcePetawatt hours, PWh of electricity generation
India power generation by sourcePetawatt hours, PWh of electricity generation
4.2
2030
13.2
2020
8.4
2010
Coal
Hydro
Gas
Nuclear
Renewables
0.71.3
2.4
3.3
2020
1.8
2010
1.0
2030
6.7%
Source: Wood Mackenzie Coal Market Service (H2 2014)
Coal will play a key role in the world’s future
Coal imports 266Mt 497Mt127Mt
63Mt 215MtCoal imports 368Mt
Coal CAGR 2010 to 2030
Coal CAGR 2010 to 2030
Solid demand growth in seaborne metallurgical coal driven by India and China Seaborne metallurgical coal demand (million tonnes)
188
225 244
59
70
93
45
57
70
2025
353
2015
292
407
2035
PCISemi-soft HCC
Source: Wood Mackenzie Metallurgical Coal Market Service H1 2015
+61Mt
+55Mt
Coal
Hydro
Gas
Nuclear
Renewables
14
For
per
sona
l use
onl
y
©2015, Rio Tinto, All Rights Reserved
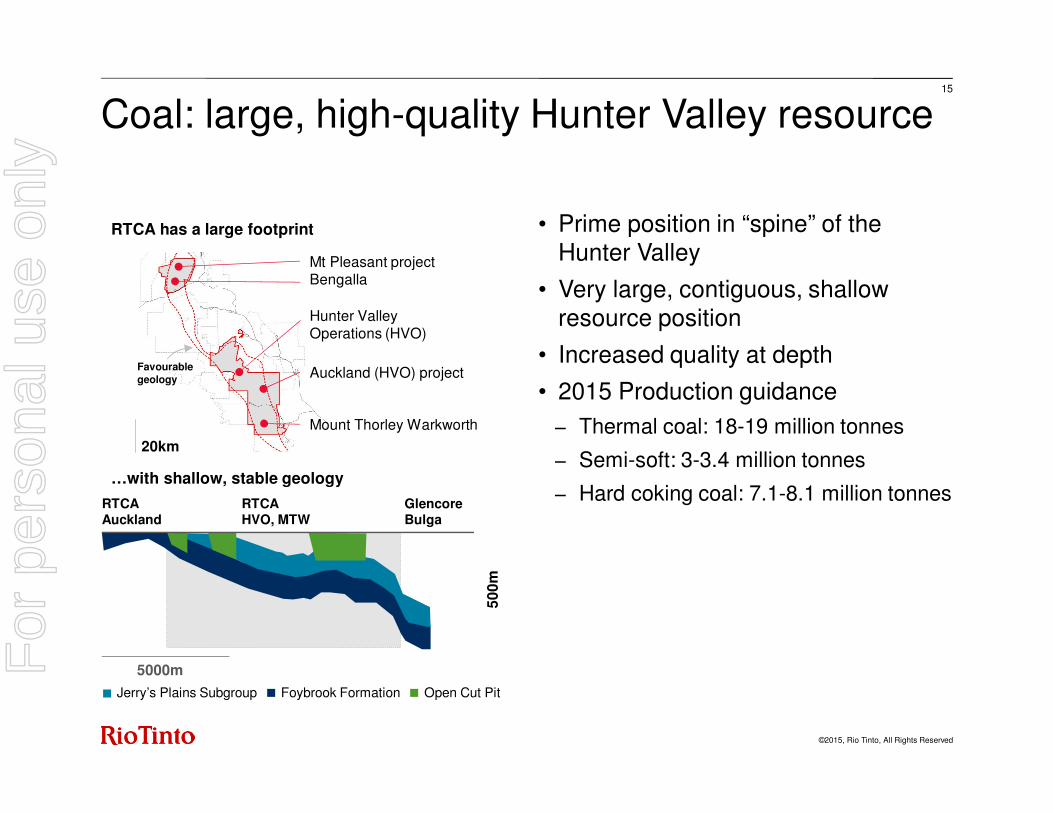
• Prime position in “spine” of theHunter Valley
• Very large, contiguous, shallowresource position
• Increased quality at depth
• 2015 Production guidance
− Thermal coal: 18-19 million tonnes
− Semi-soft: 3-3.4 million tonnes
− Hard coking coal: 7.1-8.1 million tonnes
15
Coal: large, high-quality Hunter Valley resource
RTCA has a large footprint
…with shallow, stable geology
Favourablegeology
Mt Pleasant projectBengalla
Hunter Valley Operations (HVO)
Auckland (HVO) project
Mount Thorley Warkworth
20km
Jerry’s Plains Subgroup Foybrook Formation Open Cut Pit
RTCA Auckland
50
0m
5000m
GlencoreBulga
RTCA HVO, MTW
For
per
sona
l use
onl
y

©2015, Rio Tinto, All Rights Reserved
Strategy to maximise value from our coal assets has been accelerated by combination with Copper
2012
Improve earnings quality:
Maximise value &cash from existing operations
First quartile operating practice
Scalable network of mines
Q1/Q2 margin position
Fre
e C
ash
Time
Industry standard efficiency:
• Rio Tinto Coal Australia
• Rio Tinto Coal Mozambique
Unlock network synergies:
Harness full asset potential through integrating operations
Create long-term options:
Realise value from and add to reserves & resources base
16
Future state
- Improve safety
- Cost & productivity
- Reshape portfolio
- Kestrel ramp-up
- Hunter blend
- Operations centre
- Reserve & resources
- LoM extension
- MP option
For
per
sona
l use
onl
y
©2015, Rio Tinto, All Rights Reserved
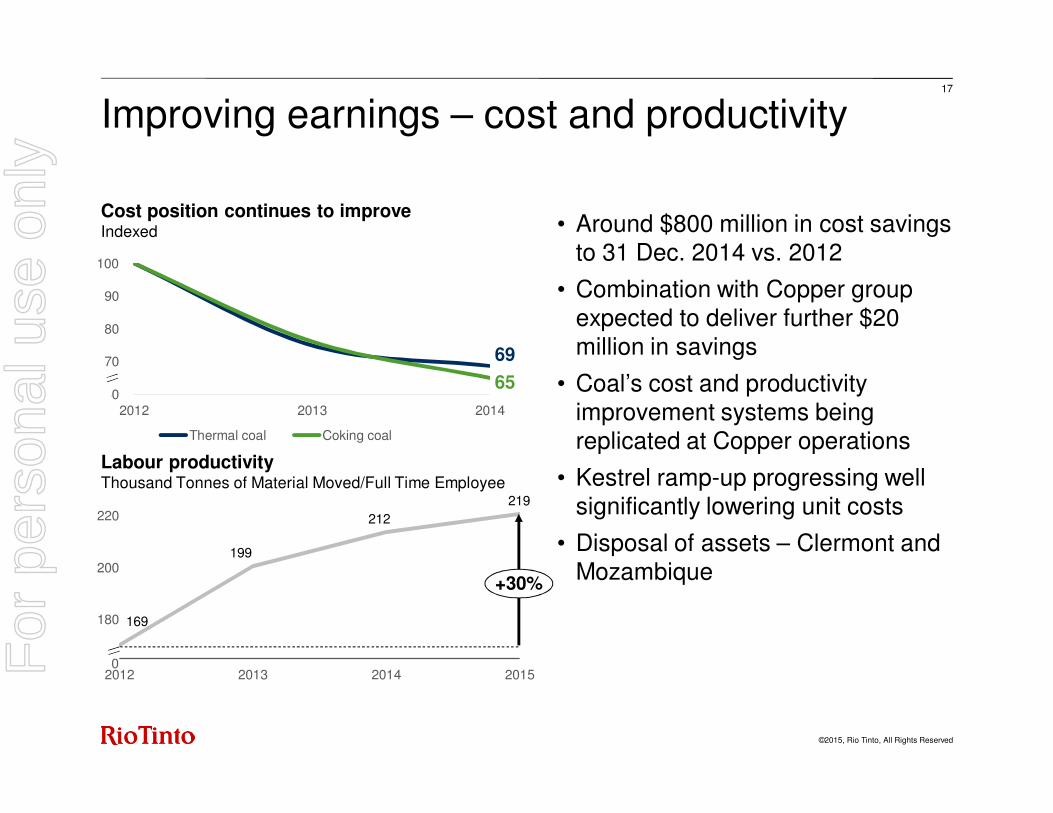
69
6560
70
80
90
100
2012 2013 2014
Thermal coal Coking coal
169
2012 2013 2014 2015
• Around $800 million in cost savings to 31 Dec. 2014 vs. 2012
• Combination with Copper group expected to deliver further $20 million in savings
• Coal’s cost and productivity improvement systems being replicated at Copper operations
• Kestrel ramp-up progressing well significantly lowering unit costs
• Disposal of assets – Clermont and Mozambique
17
Improving earnings – cost and productivity
Cost position continues to improveIndexed
Labour productivityThousand Tonnes of Material Moved/Full Time Employee
180
220
200
0
+30%
199
219
212
For
per
sona
l use
onl
y
©2015, Rio Tinto, All Rights Reserved
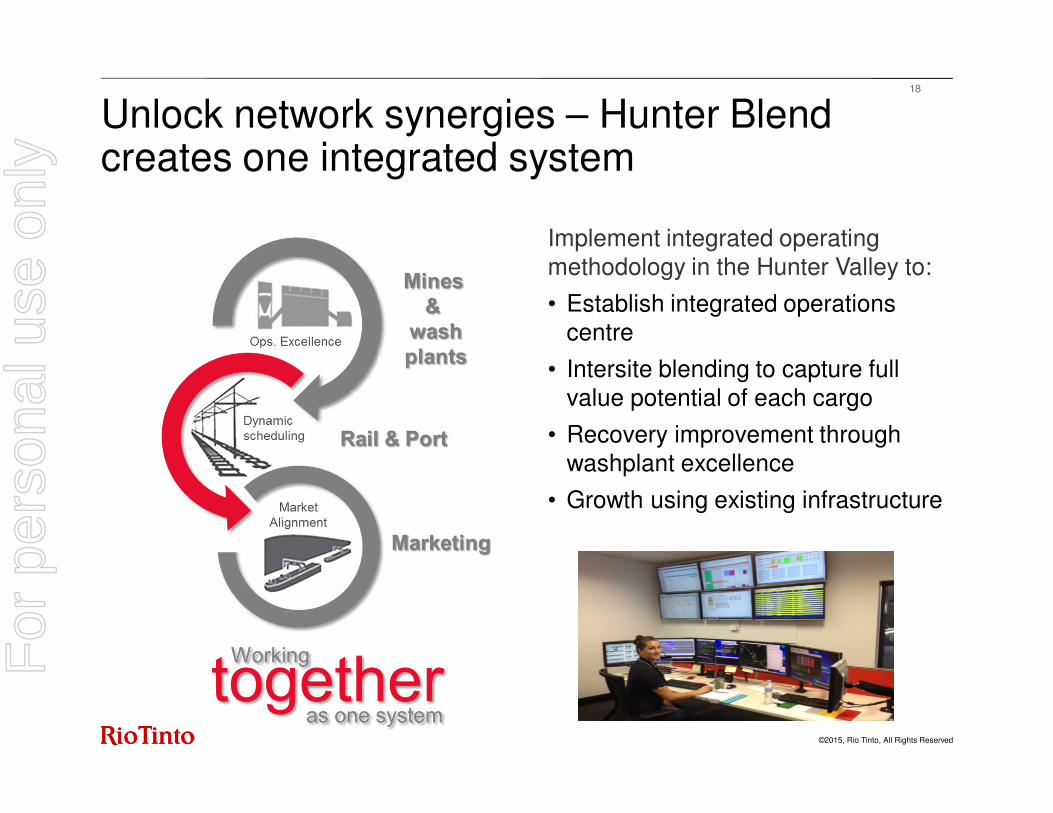
Implement integrated operating methodology in the Hunter Valley to:
• Establish integrated operations centre
• Intersite blending to capture full value potential of each cargo
• Recovery improvement through washplant excellence
• Growth using existing infrastructure
18
Unlock network synergies – Hunter Blend creates one integrated system
For
per
sona
l use
onl
y
©2015, Rio Tinto, All Rights Reserved
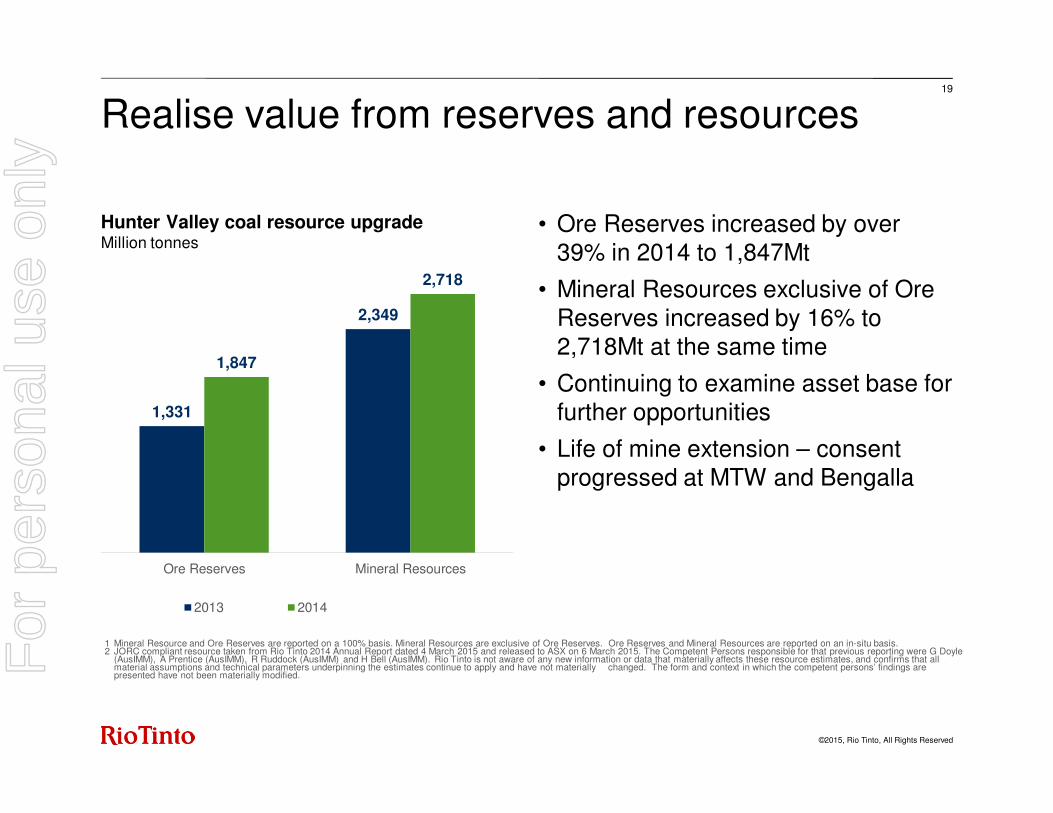
• Ore Reserves increased by over 39% in 2014 to 1,847Mt
• Mineral Resources exclusive of Ore Reserves increased by 16% to 2,718Mt at the same time
• Continuing to examine asset base for further opportunities
• Life of mine extension – consent progressed at MTW and Bengalla
19
Realise value from reserves and resources
Hunter Valley coal resource upgradeMillion tonnes
1 Mineral Resource and Ore Reserves are reported on a 100% basis. Mineral Resources are exclusive of Ore Reserves. Ore Reserves and Mineral Resources are reported on an in-situ basis.2 JORC compliant resource taken from Rio Tinto 2014 Annual Report dated 4 March 2015 and released to ASX on 6 March 2015. The Competent Persons responsible for that previous reporting were G Doyle
(AusIMM), A Prentice (AusIMM), R Ruddock (AusIMM) and H Bell (AusIMM). Rio Tinto is not aware of any new information or data that materially affects these resource estimates, and confirms that allmaterial assumptions and technical parameters underpinning the estimates continue to apply and have not materially changed. The form and context in which the competent persons’ findings are presented have not been materially modified.
1,331
2,349
1,847
2,718
Ore Reserves Mineral Resources
2013 2014
For
per
sona
l use
onl
y

©2015, Rio Tinto, All Rights Reserved
20
Creating leading copper & coal businesses
Copper
Long-life, low cost and expandable Tier 1 asset portfolio
Attractive margin/profitability through cost savings & portfolio restructuring
New 152ktpd concentrator at Escondidacompletes in H1 2015
Compelling medium-term growth options including OT
Copper volume step change in 2021+ as RT moves to 40% of Grasberg production
Resolution permitting continues
Coal
High quality asset base
Free cash flow positive in challenging market environment
Significant cost savings achieved
High quality product sold to premium markets (Japan, Korea etc.)
Kestrel ramp-up progressing well, with strong Q1’15 production
Hunter Blend project expected to deliver further efficiencies and reduce costsF
or p
erso
nal u
se o
nly


![Sébastien Plutniak – Curriculum vitæ · [6] 2020 Plutniak,Sébastien[2020b],«Durecoursauxsciencesstudiesdanslescontroverses scientifiques:uneillustrationarchéologique»,Zilsel.Science,technique,société,7,](https://img.pdfslide.us/doc/110x75/5fb061c5788a8d41a256a2b7/sbastien-plutniak-a-curriculum-vit-6-2020-plutniaksbastien2020bdurecoursauxsciencesstudiesdanslescontroverses.jpg)