Embed Size (px)
Citation preview
JD7105A Base Station Analyzer
User’s Manual
ww
w.jdsu.com
1 TABLE OF CONTENTS
TABLE OF CONTENTS
Table of Contents ..................................................................................................................................... 1List of Figures .......................................................................................................................................... 8List of Tables .......................................................................................................................................... 101.0 INTRODUCTION .................................................................................................................................. 1-2
Overview ....................................................................................................................................... 1-3JD7105A ................................................................................................................................ 1-3
JD7105A Highlights ....................................................................................................................... 1-4Advantage .............................................................................................................................. 1-4Functions ................................................................................................................................ 1-4Applicable Systems ................................................................................................................ 1-4
Safety Information ......................................................................................................................... 1-5Safety Symbol ........................................................................................................................ 1-5Safety Consideration .............................................................................................................. 1-5Input Power ............................................................................................................................ 1-6Electrostatic Discharge Precautions (ESD) ........................................................................... 1-7
2.0 GETTING STARTED ............................................................................................................................ 2-1Unpacking the JD7105A ................................................................................................................ 2-2JD7105A Standard Accessories .................................................................................................... 2-3Layout & Hard/Soft Keys ............................................................................................................... 2-4Front View ..................................................................................................................................... 2-5
Power Switch ......................................................................................................................... 2-6Mode ...................................................................................................................................... 2-6Soft Keys ................................................................................................................................ 2-6ESC ........................................................................................................................................ 2-6Save ....................................................................................................................................... 2-6Load ....................................................................................................................................... 2-7System ................................................................................................................................... 2-7Data Entry Key ....................................................................................................................... 2-9Freq/Chan .............................................................................................................................. 2-9Amplitude ............................................................................................................................. 2-10Trace/Display ....................................................................................................................... 2-12BW/AVG ............................................................................................................................... 2-13Marker .................................................................................................................................. 2-13Peak Search ......................................................................................................................... 2-14Measure ............................................................................................................................... 2-15Measure Setup ..................................................................................................................... 2-17
Top View ...................................................................................................................................... 2-18RF In .................................................................................................................................... 2-19DC 15V ~ 19V In .................................................................................................................. 2-19RF Out .................................................................................................................................. 2-19External In ............................................................................................................................ 2-19SYS I/O ................................................................................................................................ 2-19E1/T1 .................................................................................................................................... 2-20Grip ....................................................................................................................................... 2-20
3.0 SPECTRUM ANALYZER ...................................................................................................................... 3-1Spectrum Analyzer Introduction .................................................................................................... 3-2
Spectrum Analysis .................................................................................................................. 3-3Measurements Types ............................................................................................................. 3-4What is Spectrum ................................................................................................................... 3-5RBW ....................................................................................................................................... 3-6VBW ....................................................................................................................................... 3-6RF Attenuation ....................................................................................................................... 3-7
Using Spectrum Analyzer .............................................................................................................. 3-8How to Use Keys ........................................................................................................................... 3-9
Soft Keys ................................................................................................................................ 3-9ESC ........................................................................................................................................ 3-9Freq/Chan .............................................................................................................................. 3-9Amplitude ............................................................................................................................. 3-10Trace/Display ....................................................................................................................... 3-12BW/AVG ............................................................................................................................... 3-13
2 TABLE OF CONTENTS
Marker .................................................................................................................................. 3-14Peak Search ......................................................................................................................... 3-15Measure ............................................................................................................................... 3-15Measure Setup ..................................................................................................................... 3-16Display Overview ................................................................................................................. 3-18
Cable Connection ........................................................................................................................ 3-19Spectrum Analyzer Input Mode ................................................................................................... 3-20Select Channel Standard ............................................................................................................. 3-21
Select Channel Standard ..................................................................................................... 3-22Spectrum Measurement .............................................................................................................. 3-23
Attenuation, Average, Trace/Display .................................................................................... 3-24Spectrum Measurement Screen .......................................................................................... 3-25
Channel Power Measurement ..................................................................................................... 3-26Measurement Procedure ..................................................................................................... 3-26Channel Power Measurement Screen ................................................................................. 3-27
Occupied Bandwidth Measurement ............................................................................................ 3-28Measurement Procedure ..................................................................................................... 3-28Occupied Bandwidth Measurement Screen ......................................................................... 3-29
SEM Measurement ...................................................................................................................... 3-30Measurement Procedure ..................................................................................................... 3-30SEM Measurement Screen .................................................................................................. 3-31
ACP Measurement ...................................................................................................................... 3-32Measurement Procedure ..................................................................................................... 3-32ACP Measurement Screen .................................................................................................. 3-33
AM/FM Measurement .................................................................................................................. 3-34Measurement Procedure ..................................................................................................... 3-34
4.0 INTERFERENCE ANALYZER ................................................................................................................. 4-1Interference Analyzer Introduction ................................................................................................ 4-2
Spectrogram ........................................................................................................................... 4-3Received Signal Strength Indicator (RSSI) ............................................................................ 4-3
How to Use Keys ........................................................................................................................... 4-4Soft Keys ................................................................................................................................ 4-4ESC ........................................................................................................................................ 4-4Freq/Chan .............................................................................................................................. 4-4Amplitude ............................................................................................................................... 4-5Trace/Display ......................................................................................................................... 4-7BW/AVG ................................................................................................................................. 4-7Marker .................................................................................................................................... 4-8Peak Search ........................................................................................................................... 4-9Measure ................................................................................................................................. 4-9Measure Setup ....................................................................................................................... 4-9Display Overview ................................................................................................................. 4-10
Cable Connection ........................................................................................................................ 4-12Making Measurements ................................................................................................................ 4-13
Spectrogram ......................................................................................................................... 4-14RSSI ..................................................................................................................................... 4-15
5.0 CHANNEL SCANNER .......................................................................................................................... 5-1Channel Scanner Introduction ....................................................................................................... 5-2How to Use Keys ........................................................................................................................... 5-3
Soft Keys ................................................................................................................................ 5-3ESC ........................................................................................................................................ 5-3Freq/Chan .............................................................................................................................. 5-3Trace/Display ......................................................................................................................... 5-4BW/AVG ................................................................................................................................. 5-4Marker .................................................................................................................................... 5-5Peak Search ........................................................................................................................... 5-5Measure ................................................................................................................................. 5-5Measure setup ....................................................................................................................... 5-5Display Overview (General Channel Scanner ) ..................................................................... 5-6Display Overview (GSM Channel Scanner) ........................................................................... 5-7
Cable Connection .......................................................................................................................... 5-8Making Measurements .................................................................................................................. 5-9
General Channel Scanner ................................................................................................... 5-10GSM Channel scanner ......................................................................................................... 5-10
6.0 CDMA TX ANALYZER ........................................................................................................................ 6-1CDMA Analyzer Introduction ......................................................................................................... 6-2

3 TABLE OF CONTENTS
Concept of Channel Power Measurement ............................................................................. 6-3Modulation Accuracy (Rho) Measurement Concepts ............................................................ 6-3Code Domain Measurement Concepts .................................................................................. 6-4Spurious Emission Measurement Concepts .......................................................................... 6-5ACPR Measurement Concepts .............................................................................................. 6-5
Using CDMA Analyzer ................................................................................................................... 6-6How to Use Keys ........................................................................................................................... 6-7
Freq/Chan .............................................................................................................................. 6-7Amplitude ............................................................................................................................... 6-7Trace/Display ......................................................................................................................... 6-9BW/AVG ............................................................................................................................... 6-11Marker .................................................................................................................................. 6-12Peak Search ......................................................................................................................... 6-13Measure ............................................................................................................................... 6-13Measure Setup ..................................................................................................................... 6-14Display Overview ................................................................................................................. 6-15Setup .................................................................................................................................... 6-16
Frequency Setup .......................................................................................................... 6-16External Clock Setting .................................................................................................. 6-17
Channel Power Measurement ............................................................................................. 6-18Channel Power Procedure ............................................................................................ 6-19Channel Power Screen ................................................................................................. 6-19
Occupied Bandwidth Measurement ..................................................................................... 6-20Occupied Bandwidth Procedure ................................................................................... 6-20Occupied Bandwidth Screen ........................................................................................ 6-21
ACPR Measurement ............................................................................................................ 6-22ACPR Procedure .......................................................................................................... 6-23ACPR Screen ................................................................................................................ 6-24
Spurious Emission Mask (SEM) Measurement ................................................................... 6-25SEM Procedure ............................................................................................................. 6-25SEM Screen .................................................................................................................. 6-26
CDMA Code Domain Measurement ..................................................................................... 6-27CDP Measurement Procedure ...................................................................................... 6-27CDP Screen .................................................................................................................. 6-28cdma2000 CDP Measurement Items ............................................................................ 6-29
CDMA OTA Measurement .................................................................................................... 6-30OTA Measurement Procedure ...................................................................................... 6-30OTA Measurement Screen ........................................................................................... 6-31
7.0 EVDO TX ANALYZER ........................................................................................................................ 7-1EVDO Analyzer Introduction ......................................................................................................... 7-2
1xEV-DO Forward Link .......................................................................................................... 7-3Frame Structure ..................................................................................................................... 7-3Channel Power Measurement Concepts ............................................................................... 7-4Code Domain (Forward Link) Measurement Concepts ......................................................... 7-4Modulation Accuracy (Waveform Quality) Measurement Concepts ...................................... 7-5Occupied Bandwidth Measurement Concepts ....................................................................... 7-6Spurious Emissions and Adjacent Channel Power Measurement Concepts ......................... 7-6
Using EVDO Analyzer ................................................................................................................... 7-8How to Use Keys ........................................................................................................................... 7-9
Freq/Chan .............................................................................................................................. 7-9Amplitude ............................................................................................................................... 7-9Trace/Display ....................................................................................................................... 7-11BW/AVG ............................................................................................................................... 7-13Marker .................................................................................................................................. 7-14Peak Search ......................................................................................................................... 7-15Measure ............................................................................................................................... 7-16Measure Setup ..................................................................................................................... 7-16Display Overview ................................................................................................................. 7-17Setup .................................................................................................................................... 7-18
Frequency Setup .......................................................................................................... 7-18External Clock Setting .................................................................................................. 7-19Ext Ref Clock Interface Specification ............................................................................ 7-20
Channel Power Measurement ............................................................................................. 7-20Channel Power Procedure ............................................................................................ 7-21Channel Power Screen ................................................................................................. 7-21
Occupied Bandwidth Measurement ..................................................................................... 7-22

4 TABLE OF CONTENTS
Occupied Bandwidth Procedure ................................................................................... 7-22Occupied Bandwidth Screen ........................................................................................ 7-23
Spurious Emission Mask Measurement ............................................................................... 7-24SEM Procedure ............................................................................................................. 7-24SEM Screen .................................................................................................................. 7-24
ACPR Measurement ............................................................................................................ 7-25ACPR Procedure .......................................................................................................... 7-25ACPR Screen ................................................................................................................ 7-25
Code Domain Power ............................................................................................................ 7-26EV-DO Pilot Channel Measurement ............................................................................. 7-26EV-DO MAC Channel Measurement ............................................................................ 7-26EV-DO Traffic Channel Measurement .......................................................................... 7-26CDP Procedure ............................................................................................................. 7-27EV-DO Pilot Channel CDP ............................................................................................ 7-28EV-DO Pilot Channel Measurement Parameters ......................................................... 7-29EV-DO MAC Channel CDP ........................................................................................... 7-29EV-DO MAC Channel CDP Screen .............................................................................. 7-30EV-DO MAC Channel Measurement Parameters ........................................................ 7-30Required Specification for EV-DO MAC Channel ......................................................... 7-31EV-DO Data Channel Measurement ............................................................................. 7-31EV-DO Data Channel Measurement Screen ................................................................ 7-32EV-DO Traffic CDP Measurement Parameters ............................................................ 7-32Required Specification for EV-DO Traffic Channel ....................................................... 7-33
8.0 WCDMA TX ANALYZER .................................................................................................................... 8-1WCDMA Analyzer Introduction ...................................................................................................... 8-2
What is WCDMA .................................................................................................................... 8-3Channel Power Measurement Concept ................................................................................. 8-4Occupied Bandwidth Measurement Concept ......................................................................... 8-4Spurious Emission Mask Measurement Concept .................................................................. 8-5ACLR Measurement Concept ................................................................................................ 8-5Code Domain Measurement Concept .................................................................................... 8-6Modulation Accuracy (Rho) Measurement Concept .............................................................. 8-6
Using WCDMA Analyzer ................................................................................................................ 8-7How to Use Keys ........................................................................................................................... 8-8
Freq/Chan .............................................................................................................................. 8-8Amplitude ............................................................................................................................... 8-8Trace/Display ....................................................................................................................... 8-10BW/AVG ............................................................................................................................... 8-12Marker .................................................................................................................................. 8-13Peak Search ......................................................................................................................... 8-14Measure ............................................................................................................................... 8-15Measure Setup ..................................................................................................................... 8-15Display Overview ................................................................................................................. 8-16Setup .................................................................................................................................... 8-17
Frequency Setup .......................................................................................................... 8-17External Clock Setting .................................................................................................. 8-18
Channel Power Measurement ............................................................................................. 8-20Channel Power Procedure ............................................................................................ 8-20Channel Power Screen ................................................................................................. 8-21
Occupied Bandwidth Measurement ..................................................................................... 8-21Occupied Bandwidth Procedure ................................................................................... 8-22Occupied Bandwidth Screen ........................................................................................ 8-22
Spurious Emission Measurement ........................................................................................ 8-23SEM Procedure ............................................................................................................. 8-23SEM Screen .................................................................................................................. 8-24
ACLR Measurement ............................................................................................................. 8-24ACLR Procedure ........................................................................................................... 8-25ACLR Screen ................................................................................................................ 8-25
Code Domain Analysis (Demodulator) ................................................................................. 8-26CDP Procedure ............................................................................................................. 8-26CDP Screen .................................................................................................................. 8-27
WCDMA OTA Measurement ................................................................................................ 8-28OTA Measurement Procedure ...................................................................................... 8-28OTA Measurement Screen ........................................................................................... 8-29
9.0 GSM/EDGE TX ANALYZER ............................................................................................................... 9-1GSM/EDGE Analyzer Introduction ................................................................................................ 9-2

5 TABLE OF CONTENTS
What is GSM .......................................................................................................................... 9-3Time Slot ................................................................................................................................ 9-4Channel Power Measurement Concept ................................................................................. 9-4Spurious Emission Measurement Concept ............................................................................ 9-4Code Domain Measurement Concept (Demodulator) ........................................................... 9-5Phase & Frequency Error Measurement Concept ................................................................. 9-5Baseband I/Q Measurement Concept .................................................................................... 9-6
Using GSM/EDGE Tx Analyzer ..................................................................................................... 9-7How to Use Keys ........................................................................................................................... 9-8
Freq/Chan .............................................................................................................................. 9-8Amplitude ............................................................................................................................... 9-8Trace/Display ....................................................................................................................... 9-10BW/AVG ............................................................................................................................... 9-11Marker .................................................................................................................................. 9-12Peak Search ......................................................................................................................... 9-13Measure ............................................................................................................................... 9-13Measure Setup ..................................................................................................................... 9-14Display Overview ................................................................................................................. 9-15Setup .................................................................................................................................... 9-16
Frequency Setup .......................................................................................................... 9-16External Clock Setting .................................................................................................. 9-17
Channel Power Measurement ............................................................................................. 9-19Channel Power Procedure ............................................................................................ 9-19Channel Power Screen ................................................................................................. 9-20
Occupied Bandwidth Measurement ..................................................................................... 9-21Occupied Bandwidth Procedure ................................................................................... 9-21Occupied Bandwidth Screen ........................................................................................ 9-22
Spurious Emissions Measurement ....................................................................................... 9-23SEM Procedure ............................................................................................................. 9-23SEM Screen .................................................................................................................. 9-23
Power vs. Time Measurement ............................................................................................. 9-24PvT Procedure .............................................................................................................. 9-24PvT Screens ................................................................................................................. 9-25
I/Q Polar Vector Measurement ............................................................................................. 9-26I/Q Polar Vector Procedure ........................................................................................... 9-26I/Q Polar Vector Screen ................................................................................................ 9-27
I/Q Demodulated Bits Measurement .................................................................................... 9-28I/Q Demodulated Bits Procedure .................................................................................. 9-28I/Q Demodulated Bits Screen ....................................................................................... 9-29
GSM OTA Measurement ...................................................................................................... 9-30OTA Measurement Procedure ...................................................................................... 9-30OTA Measurement Screen ........................................................................................... 9-31
10.0 TD-SCDMA TX ANALYZER ........................................................................................................... 10-1TD-SCDMA Analyzer Introduction ............................................................................................... 10-2
Frame Structure ................................................................................................................... 10-3Time Slot .............................................................................................................................. 10-4DwPTS ................................................................................................................................. 10-5UpPTS .................................................................................................................................. 10-5GP ........................................................................................................................................ 10-5FDD vs. TDD ........................................................................................................................ 10-5
Using TD-SCDMA Tx Analyzer .................................................................................................... 10-6How to Use Keys ......................................................................................................................... 10-7
Freq/Chan ............................................................................................................................ 10-7Amplitude ............................................................................................................................. 10-7Trace/Display ....................................................................................................................... 10-9BW/AVG ............................................................................................................................. 10-10Marker ................................................................................................................................ 10-10Peak Search ....................................................................................................................... 10-12Measure ............................................................................................................................. 10-12Measure Setup ................................................................................................................... 10-13Display Overview ............................................................................................................... 10-16Setup .................................................................................................................................. 10-17
Frequency Setup ........................................................................................................ 10-17External Clock Setting ................................................................................................ 10-18
Channel Power Measurement ........................................................................................... 10-19Channel Power Procedure .......................................................................................... 10-19
6 TABLE OF CONTENTS
Channel Power Screen ............................................................................................... 10-20Occupied Bandwidth Measurement ................................................................................... 10-21
Occupied Bandwidth Procedure ................................................................................. 10-21Occupied Bandwidth Screen ...................................................................................... 10-22
Spectrum Emissions Measurement ................................................................................... 10-23SEM Procedure ........................................................................................................... 10-23SEM Screen ................................................................................................................ 10-23
ACLR Measurement ........................................................................................................... 10-24ACLR Procedure ......................................................................................................... 10-24ACLR Screen .............................................................................................................. 10-24
Power vs. Time Measurement ........................................................................................... 10-25P vs T Procedure ........................................................................................................ 10-25P vs T Screens ............................................................................................................ 10-26
Code Domain Power (Demodulator) .................................................................................. 10-28CDP Procedure ........................................................................................................... 10-28Code Power Screens .................................................................................................. 10-29
11.0 CABLE & ANTENNA ANALYZER ...................................................................................................... 11-1Cable and Antenna Analyzer Introduction ................................................................................... 11-2
Standing Wave Ratio ............................................................................................................ 11-3Practical implications of SWR .............................................................................................. 11-3Return loss ........................................................................................................................... 11-4DTF ...................................................................................................................................... 11-5Cable Loss ........................................................................................................................... 11-5
Using Cable and Antenna Analyzer ............................................................................................. 11-6How to Use Keys ......................................................................................................................... 11-7
Freq/Chan ............................................................................................................................ 11-7Amplitude ............................................................................................................................. 11-7Trace/Display ....................................................................................................................... 11-8BW/AVG ............................................................................................................................... 11-9Marker .................................................................................................................................. 11-9Peak Search ....................................................................................................................... 11-10Measure ............................................................................................................................. 11-10Measure Setup ................................................................................................................... 11-10
VSWR ......................................................................................................................................... 11-11VSWR Display ..................................................................................................................... 11-11Setting Frequency .............................................................................................................. 11-13Setting Trace Point ............................................................................................................. 11-19Scale Adjustment ............................................................................................................... 11-19Using Markers .................................................................................................................... 11-19Using Limit Line .................................................................................................................. 11-20DTF Display ....................................................................................................................... 11-21
DTF ............................................................................................................................................ 11-21DTF Display ....................................................................................................................... 11-21DTF Setup .......................................................................................................................... 11-23Scale Adjustment ............................................................................................................... 11-28Using Markers .................................................................................................................... 11-28Using Limit Line .................................................................................................................. 11-30
Cable Loss (One Port Measurement) ....................................................................................... 11-31Cable Loss Display ............................................................................................................ 11-31Setting Frequency .............................................................................................................. 11-33Scale Adjustment ............................................................................................................... 11-37Using Markers .................................................................................................................... 11-37Using Limit Line .................................................................................................................. 11-37
Gain/Loss (Two Ports Measurement) ........................................................................................ 11-39Gain/Loss Display .............................................................................................................. 11-39Setting Frequency .............................................................................................................. 11-41Scale Adjustment ............................................................................................................... 11-46Using Markers .................................................................................................................... 11-46Using Limit Line .................................................................................................................. 11-47
12.0 POWER METER ............................................................................................................................. 12-1Power Meter Introduction ............................................................................................................ 12-2Using RF Power Meter ................................................................................................................ 12-3How to Use Keys ......................................................................................................................... 12-4
Freq/Chan ............................................................................................................................ 12-4Display Overview ................................................................................................................. 12-5Cable Connection ................................................................................................................. 12-6
7 TABLE OF CONTENTS
Connecting Sensor ............................................................................................................... 12-7Measurement Procedure (internal) ...................................................................................... 12-9
Making Power Measurement ...................................................................................................... 12-9Measurement Procedure (using external power sensors) ................................................. 12-10Measurement Results ........................................................................................................ 12-11
13.0 E1 ANALYZER ............................................................................................................................... 13-1E1 Introduction ............................................................................................................................ 13-2
E1 Standard ......................................................................................................................... 13-3G.703/G.704 Framing ........................................................................................................... 13-3E1 Frame Structure .............................................................................................................. 13-4E1 vs. T1 .............................................................................................................................. 13-4E1 Pulse ............................................................................................................................... 13-5E1 Physicals ......................................................................................................................... 13-6Framing ................................................................................................................................ 13-7Line Code ............................................................................................................................. 13-7CRC-4 Error Detection ......................................................................................................... 13-8Alarms .................................................................................................................................. 13-9
Using E1 Analyzer ..................................................................................................................... 13-11How to Use Keys ....................................................................................................................... 13-12
Measure ............................................................................................................................. 13-12Measure Setup ................................................................................................................... 13-12Display Overview ............................................................................................................... 13-14
Measurement Setup .................................................................................................................. 13-15Connection Diagram .......................................................................................................... 13-16Terminate Mode ................................................................................................................. 13-17Bridge Mode ....................................................................................................................... 13-17Monitor Mode ..................................................................................................................... 13-17Loop Test ............................................................................................................................ 13-17
14.0 T1 ANALYZER ............................................................................................................................... 14-1T1 Introduction ............................................................................................................................ 14-2
T1 Bandwidth ....................................................................................................................... 14-3T1 Framing ........................................................................................................................... 14-3Line Code ............................................................................................................................. 14-4Alarms .................................................................................................................................. 14-6Physical Interface ................................................................................................................. 14-8
Using T1 Analyzer ....................................................................................................................... 14-9How to Use Keys ....................................................................................................................... 14-10
Measure ............................................................................................................................. 14-10Measure Setup ................................................................................................................... 14-10Display Overview ............................................................................................................... 14-13
Measurement Setup .................................................................................................................. 14-14Connection Diagram .................................................................................................................. 14-15Terminate Mode ......................................................................................................................... 14-16Bridge Mode .............................................................................................................................. 14-16Monitor Mode ............................................................................................................................ 14-16Loop Test ................................................................................................................................... 14-16
15.0 APPENDIX ..................................................................................................................................... 15-1APPENDIX A. SPECIFICATION ......................................................................................................... 15-2APPENDIX B. BATTERY SPECIFICATION ........................................................................................... 15-4APPENDIX C. CABLE LIST .............................................................................................................. 15-5APPENDIX D. BAND, FREQUENCY, CHANNEL STANDARD ................................................................. 15-7APPENDIX E. VSWR-RETURN LOSS CONVERSION TABLE ............................................................... 15-8ORDERING INFORMATION ............................................................................................................... 15-9
8 LIST OF FIGURES
LIST OF FIGURES
Figure 1 – Overview of Spectrum Analyzer Display ............................................................. 3-18Figure 2 – PA Output Port and RF In Port Connection ........................................................ 3-19Figure 3 – Monitor Port and RF In Port Connection ............................................................ 3-19Figure 4 – Example of Spectrum Measurement Screen ...................................................... 3-25Figure 5 – Example of Channel Power Measurement Screen ............................................ 3-27Figure 6 – Example of Occupied Bandwidth Measurement Screen .................................... 3-29Figure 7 – Example of SEM Measurement Screen ............................................................. 3-31Figure 8 – Example of ACP Measurement Screen .............................................................. 3-33Figure 9 – Overview of Interference Analyzer Display (Spectrogram) ................................. 4-10Figure 10 – Overview of Interference Analyzer Display (RSSI) ........................................... 4-11Figure 11 – Connection for Interference Analyzer ............................................................... 4-12Figure 12 – Overview of General Channel Scanner Display ................................................. 5-6Figure 13 – Overview of GSM Channel Scanner Display ...................................................... 5-7Figure 14 – PA Output Port and RF In Port Connection ........................................................ 5-8Figure 15 – Monitor Port and RF In Port Connection ............................................................ 5-8Figure 16 – Overview of CDMA Tx Analyzer Display ........................................................... 6-15Figure 17 – Ext Ref Clock Input Ports .................................................................................. 6-17Figure 18 – cdma2000 Channel Power Measurement Screen ............................................ 6-19Figure 19 – cdma2000 Occupied Bandwidth Measurement Screen ................................... 6-21Figure 20 – cdma2000 ACPR Measurement Screen ........................................................... 6-24Figure 21 – cdma2000 Emission Measurement Screen ...................................................... 6-26Figure 22 – cdma2000 CDP Measurement Screen ............................................................. 6-28Figure 23 – CDMA OTA Measurement Screen .................................................................... 6-31Figure 24 – 1xEv-DO Forward Link Structure ........................................................................ 7-3Figure 25 – Overview of 1xEVDO Tx Analyzer Display ....................................................... 7-17Figure 26 – Ext Ref Clock Input Ports .................................................................................. 7-19Figure 27 – EVDO Channel Power Measurement Screen .................................................. 7-21Figure 28 – EVDO Occupied Bandwidth Measurement Screen .......................................... 7-23Figure 29 – EVDO Emission Measurement Screen ............................................................ 7-24Figure 30 – EVDO ACPR Measurement Screen ................................................................. 7-25Figure 31 – 1xEV-DO Pilot CDP Measurement Result ........................................................ 7-28Figure 32 – 1xEV-DO MAC CDP Measurement Result ....................................................... 7-30Figure 33 – 1xEV-DO Data Measurement Result (Idle Slot) ............................................... 7-32Figure 34 – Overview of WCDMA Tx Analyzer Display ....................................................... 8-16Figure 35 – Ext Ref Clock Input Ports .................................................................................. 8-18Figure 36 – WCDMA Channel Power Measurement Screen ............................................... 8-21Figure 37 – WCDMA Occupied Bandwidth Measurement Screen ...................................... 8-22Figure 38 – WCDMA Spurious Emission Measurement Screen .......................................... 8-24Figure 39 – WCDMA ACLR Measurement Screen .............................................................. 8-25Figure 40 – WCDMA Code Domain Analysis Full Screen ................................................... 8-27Figure 41 – WCDMA Code Domain Analysis Zoomed Screen ............................................ 8-27Figure 42 – WCDMA OTA Measurement Screen ................................................................ 8-29Figure 43 – Overview of GSM Tx Analyzer Display ............................................................. 9-15Figure 44 – Ext Ref Clock Input Ports .................................................................................. 9-17Figure 45 – GSM/EDGE Channel Power Measurement Screen ......................................... 9-20Figure 46 – GSM/EDGE Occupied Bandwidth Measurement Screen ................................. 9-22Figure 47 – GSM/EDGE SEM Measurement Screen .......................................................... 9-23Figure 48 – GSM/EDGE P vs T (Slot) Measurement Screen .............................................. 9-25Figure 49 – GSM/EDGE P vs T (Frame) Measurement Screen .......................................... 9-25Figure 50 – GSM Polar Vector Measurement Screen ......................................................... 9-27Figure 51 – EDGE Polar Vector Measurement Screen ....................................................... 9-27Figure 52 – GSM Demodulated Data bits Analysis Screen ................................................. 9-29Figure 53 – EDGE Demodulated Data bits Analysis Screen ............................................... 9-29Figure 54 – GSM/EDGE OTA Measurement Screen ........................................................... 9-31Figure 55 – TD-SCDMA Frame Structure ............................................................................ 10-3Figure 56 – TD-SCDMA Resource Structure ....................................................................... 10-4Figure 57 – Overview of GSM Tx Analyzer Display ........................................................... 10-16Figure 58 – Ext Ref Clock Input Ports ................................................................................ 10-18Figure 59 – TD-SCDMA Channel Power Measurement Screen ........................................ 10-20Figure 60 – TD-SCDMA Occupied Bandwidth Measurement Screen ............................... 10-22
9 LIST OF FIGURES
Figure 61 – TD-SCDMA SEM Measurement Screen ......................................................... 10-23Figure 62 – TD-SCDMA SEM Measurement Screen ......................................................... 10-24Figure 63 – TD-SCDMA P vs T (Slot) Measurement Screen ............................................. 10-26Figure 64 – TD-SCDMA P vs T (Frame) Measurement Screen ......................................... 10-26Figure 65 – TD-SCDMA P vs T (Mask) Measurement Screen .......................................... 10-27Figure 66 – TD-SCDMA Code Power Measurement Screen ............................................. 10-29Figure 67 – TD-SCDMA Midamble Power Measurement Screen ..................................... 10-29Figure 68 – TD-SCDMA Symbol Data Measurement Screen ............................................ 10-30Figure 69 – TD-SCDMA Code Error Measurement Screen ............................................... 10-30Figure 70 – TD-SCDMA Constellation Measurement Screen ............................................ 10-31Figure 71 – VSWR Measurement Screen Display .............................................................. 11-11Figure 72 – Calibration for VSWR measurement .............................................................. 11-15Figure 73 – Calibration using extension cable ................................................................... 11-16Figure 74 – Connection for VSWR Measurement ............................................................. 11-18Figure 75 – Using Markers in VSWR Measurement Mode ................................................ 11-20Figure 76 – Limit Line Application ...................................................................................... 11-20Figure 77 – DTF Measurement Screen Display ................................................................ 11-21Figure 78 – Calibration for DTF measurement .................................................................. 11-25Figure 79 – Connection Diagram for DTF Measurement ................................................... 11-27Figure 80 – Using Markers in DTF Measurement Mode .................................................... 11-28Figure 81 – DTF Measurement in VSWR scale ................................................................. 11-29Figure 82 – DTF Measurement in Return Loss scale ........................................................ 11-29Figure 83 – Using Limit Line in DTF Measurement ........................................................... 11-30Figure 84 – Cable Loss Measurement Screen Display ..................................................... 11-31Figure 85 – Port Calibration for One Port Cable Loss Measurement ................................ 11-34Figure 86 – One Port Cable Loss Measurement Connection Diagram ............................. 11-36Figure 87 – Using Markers in Cable Loss Measurement Mode ........................................ 11-37Figure 88 – Using Limit Line in Cable Loss Measurement Mode ...................................... 11-38Figure 89 – Gain/Loss Measurement Screen Display ....................................................... 11-39Figure 90 – Two Ports Calibration for Gain/Loss Measurement ........................................ 11-42Figure 91 – Two Ports Gain/Loss Measurement Diagram ................................................. 11-44Figure 92 – Two Ports Gain Measurement w/+30dB Attenuator ....................................... 11-45Figure 93 – Using Markers in Cable Loss Measurement Mode ........................................ 11-46Figure 94 – Using Limit Line in Cable Loss Measurement Mode ...................................... 11-47Figure 95 – Power Meter Screen ......................................................................................... 12-5Figure 96 – Connection Diagram (Direct Connection) ......................................................... 12-6Figure 97 – Connection Diagram (Indirect Connection) ...................................................... 12-6Figure 98 – Power Sensor Connection (Terminating Type) ................................................. 12-7Figure 99 – Power Sensor Connection (Directional Type) ................................................... 12-8Figure 100 – RF Power Meter Measurement Results (Abs) .............................................. 12-11Figure 101 – RF Power Meter Measurement Results (Rel) ............................................... 12-12Figure 102 – E1 Frame Structure ......................................................................................... 13-4Figure 103 – Mask of the Pulse at 2.048 Mbps Interface .................................................... 13-5Figure 104 – AMI & HDB3 Line Coding ............................................................................... 13-8Figure 105 – E1 Analyzer Screen ...................................................................................... 13-14Figure 106 – Typical Connection Diagram for T1 Analysis ................................................ 13-16Figure 107 – T1 Bandwidth .................................................................................................. 14-3Figure 108 – D4 Frame Format ........................................................................................... 14-4Figure 109 – AMI Encoding .................................................................................................. 14-5Figure 110 – B8ZS Encoded Signal ..................................................................................... 14-6Figure 111 – Typical T1 Cabling ........................................................................................... 14-8Figure 112 – T1 Analyzer Screen ....................................................................................... 14-13Figure 113 – Typical Connection Diagram for T1 Analysis ................................................ 14-15

10 LIST OF TABLES
LIST OF TABLES Table 1 – Input Power Requirements ..................................................................................... 1-6Table 2 – JD7105A Accessory List ......................................................................................... 2-3Table 3 – Ref Level Setting Procedure ................................................................................ 2-10Table 4 – Ref Level Setting Procedure ................................................................................ 3-10Table 5 – VBW Corresponding to VBW/RBW Ratio ............................................................ 3-13Table 6 – Select Channel Standard ...................................................................................... 3-22Table 7 – Spectrum Measurement Procedure ..................................................................... 3-23Table 8 – Attenuation, Average, Trace/Display .................................................................... 3-24Table 9 – Channel Power Measurement Procedure ............................................................ 3-26Table 10 – Occupied Bandwidth Measurement Procedure .................................................. 3-28Table 11 – SEM Measurement Procedure ........................................................................... 3-30Table 12 – ACP Measurement Procedure ............................................................................ 3-32Table 13 – AM/FM Measurement Procedure ....................................................................... 3-34Table 11 – Ref Level Setting Procedure ................................................................................. 4-5Table 12 – VBW Corresponding to VBW/RBW Ratio ............................................................ 4-7Table 16 – Interference Analysis in Spectrogram View ........................................................ 4-14Table 17 – Interference Analysis in RSSI View .................................................................... 4-15Table 18 – General Channel Scanner .................................................................................. 5-10Table 19 – GSM Channel Scanner ...................................................................................... 5-10Table 20 – Ref Level Setting Procedure ................................................................................ 6-8Table 21 – Frequency Setup for Tx Analyzer ....................................................................... 6-16Table 22 – External Clock Operating Standard .................................................................... 6-17Table 23 – Ext. Ref. Clock Interface Spec ........................................................................... 6-18Table 24 – cdma2000 Channel Power Measurement Procedure ........................................ 6-19Table 25 – cdma2000 Occupied Bandwidth Measurement Procedure ................................ 6-20Table 26 – cdma2000 ACPR Measurement Procedure ....................................................... 6-23Table 27 – cdma2000 Emission Measurement Procedure .................................................. 6-25Table 28 – cdma2000 CDP Measurement Procedure ......................................................... 6-27Table 29 – CDMA OTA Measurement Procedure ................................................................ 6-30Table 30 – Ref Level Setting Procedure .............................................................................. 7-10Table 32 – Frequency Setup for Tx Analyzer ....................................................................... 7-18Table 32 – External Clock Operating Standard .................................................................... 7-19Table 33 – Ext. Ref. Clock Interface Spec ........................................................................... 7-20Table 34 – EVDO Channel Power Measurement Procedure ............................................... 7-21Table 35 – EVDO Occupied Bandwidth Measurement Procedure ...................................... 7-22Table 36 – EVDO Emission Measurement Procedure ......................................................... 7-24Table 37 – EVDO ACPR Measurement Procedure .............................................................. 7-25Table 38 – 1xEV-DO CDP Measurement Procedure ........................................................... 7-27Table 39 – Ref Level Setting Procedure ................................................................................ 8-9Table 40 – Frequency setup for Tx Analyzer ........................................................................ 8-17Table 41 – External Clock Operating Standard .................................................................... 8-18Table 42 – Ext. Ref. Clock Interface Spec ........................................................................... 8-19Table 43 – WCDMA Channel Power Measurement Procedure ........................................... 8-20Table 44 – WCDMA Occupied Bandwidth Measurement Procedure ................................... 8-22Table 45 – WCDMA Spurious Emission Measurement Procedure ...................................... 8-23Table 46 – WCDMA ACLR Measurement Procedure .......................................................... 8-25Table 47 – WCDMA Code Domain Analysis Procedure ....................................................... 8-26Table 48 – WCDMA OTA Measurement Procedure ............................................................. 8-28Table 49 – Ref Level Setting Procedure ................................................................................ 9-9Table 50 – Frequency setup for Tx Analyzer ........................................................................ 9-16Table 51 – External Clock Operating Standard .................................................................... 9-17Table 52 – Ext. Ref. Clock Interface Spec ........................................................................... 9-18Table 53 – GSM/EDGE Channel Power Measurement Procedure ..................................... 9-19Table 54 – GSM/EDGE Occupied Bandwidth Measurement Procedure ............................. 9-21Table 55 – GSM/EDGE SEM Measurement Procedure ...................................................... 9-23Table 56 – GSM/EDGE P vs T Measurement Procedure .................................................... 9-24Table 57 – GSM/EDGE I/Q Polar Vector Measurement Procedure ..................................... 9-26Table 58 – GSM/EDGE I/Q Demodulated Bits Measurement Procedure ............................ 9-28Table 59 – GSM/EDGE OTA Measurement Procedure ....................................................... 9-30Table 60 – FDD and TDD component comparison .............................................................. 10-5
LIST OF TABLES 11
Table 61 – Ref Level Setting Procedure .............................................................................. 10-8Table 62 – Frequency Setup for Tx Analyzer ..................................................................... 10-17Table 63 – External Clock Operating Standard .................................................................. 10-18Table 64 – Ext. Ref. Clock Interface Spec ......................................................................... 10-19Table 65 – TD-SCDMA Channel Power Measurement Procedure .................................... 10-19Table 66 – TD-SCDMA Occupied Bandwidth Measurement Procedure ............................ 10-21Table 67 – TD-SCDMA SEM Measurement Procedure ..................................................... 10-23Table 68 – TD-SCDMA ACLR Measurement Procedure ................................................... 10-24Table 69 – TD-SCDMA P vs T Measurement Procedure ................................................... 10-25Table 70 – TD-SCDMA Demodulator Measurement Procedure ........................................ 10-28Table 71 – Frequency Setting Procedure ........................................................................... 11-13Table 72 – Calibration Procedure ....................................................................................... 11-17Table 73 – DTF Setup Procedure ...................................................................................... 11-24Table 74 – Calibration Procedure ....................................................................................... 11-26Table 75 – Frequency Setting Procedure ........................................................................... 11-33Table 76 – Port Calibration Procedure for Cable Loss Measurement ............................... 11-35Table 77 – Cable Loss Measurement Procedure ............................................................... 11-36Table 78 – Frequency Setting Procedure ........................................................................... 11-41Table 79 – Normalization Procedure for Gain/Loss Measurement .................................... 11-43Table 80 – Normalization Procedure for Gain/Loss Measurement .................................... 11-44Table 81 – Types of Power Sensors .................................................................................... 12-7Table 82 – Power Measurement Procedure w/ Internal Power Meter ................................. 12-9Table 83 – RF Power Measurement Using External Power Sensor .................................. 12-10Table 84 – E1 vs. T1 ............................................................................................................ 13-4Table 85 – ITU-T G.703 2.048 Mbps Pulse Mask Specifications ......................................... 13-6Table 86 – E1 Analysis Procedure ..................................................................................... 13-15Table 87 – B8ZS Encoding .................................................................................................. 14-5Table 88 – T1 Analysis Procedure ..................................................................................... 14-14

This page intentionally left blank.
CH
1
INTRODUCTION 1-2
Chapter 1
1.0 INTRODUCTION
In this chapter
Overview....................................................................................................................................................... 1-3
JD7105A ............................................................................................................................................... 1-3 JD7105A Highlights ...................................................................................................................................... 1-4
Advantage ............................................................................................................................................ 1-4 Functions .............................................................................................................................................. 1-4 Applicable Systems .............................................................................................................................. 1-4
Safety Information ........................................................................................................................................ 1-5 Safety Symbol ...................................................................................................................................... 1-5 Safety Consideration ............................................................................................................................ 1-5 Input Power .......................................................................................................................................... 1-6 Electrostatic Discharge Precautions (ESD) .......................................................................................... 1-7

CH
1
1-3 INTRODUCTION
Chapter 1
JD7105A
OVERVIEW JD7105A Mobile Communication Service Providers face the critical need for
reduction of field maintenance and operating cost to deal with ever
increasing competition in the wireless service industry. The JD7105A is the
solution to this need by integrating all the functions to diagnose base
stations in a single field portable test solution. The JD7105A makes
service and maintenance activities on base station easier, simpler and
faster by performing all complicated test and measurement processes
through just a few key strokes.
JD7105A Base Station
Analyzer
CH
1
INTRODUCTION 1-4
Chapter 1
ADVANTAGE
FUNCTIONS
APPLICABLE SYSTEMS
JD7105A HIGHLIGHTS ADVANTAGE The JD7105A is an ‘integrated’ measurement solution that can be
operated either by external AC power or by its internal battery for field
applications.
The JD7105A user interface has been specifically designed for service
providers with customized menus and simple calibration procedures
enabling accurate and reliable measurement results.
FUNCTIONS Spectrum Analyzer
Transmission Analyzer
Cable & Antenna Analyzer
RF Power Meter
E1/T1 Analyzer
Interference Analyzer
Channel Scanner
Auto Measurement
APPLICABLE SYSTEMS cdmaOne
cdma2000
1xEV-DO
WCDMA/HSDPA
GSM/GPRS/EDGE
TD-SCDMA
CH
1
1-5 INTRODUCTION
Chapter 1
SAFETY SYMBOL
Warning
Caution
Notice
SAFETY CONSIDERATION
SAFETY INFORMATION SAFETY SYMBOL The following symbols must be observed for the proper operation of the
instrument.
WARNING denotes a hazard. It calls for attention to a procedure or
practice which if not performed correctly could result in a personal injury.
Do not proceed beyond a WARNING indication until all the conditions are
fully understood and met.
CAUTION denotes a caution. It calls for attention to a procedure or
practice which, if not performed correctly could result in a partial or totally
damage of the instrument. Do not proceed beyond a CAUTION indication
until all the conditions are fully understood and met.
NOTICE denotes additional information or direction of operation of the
instrument.
SAFETY CONSIDERATION This product is a Safety Class I product. The main power plug shall
only be inserted in a power socket outlet provided with a protective
ground terminal.
Only the supplied AC/DC power adaptor shall be used. JDSU is not
liable for any personal injury or product damage caused by using a
different power supply.
Removal of internal or external protective cover may cause
personal injury or damage to the instrument. JDSU is not liable for
any incident caused by unauthorized removal of such protective parts.
!
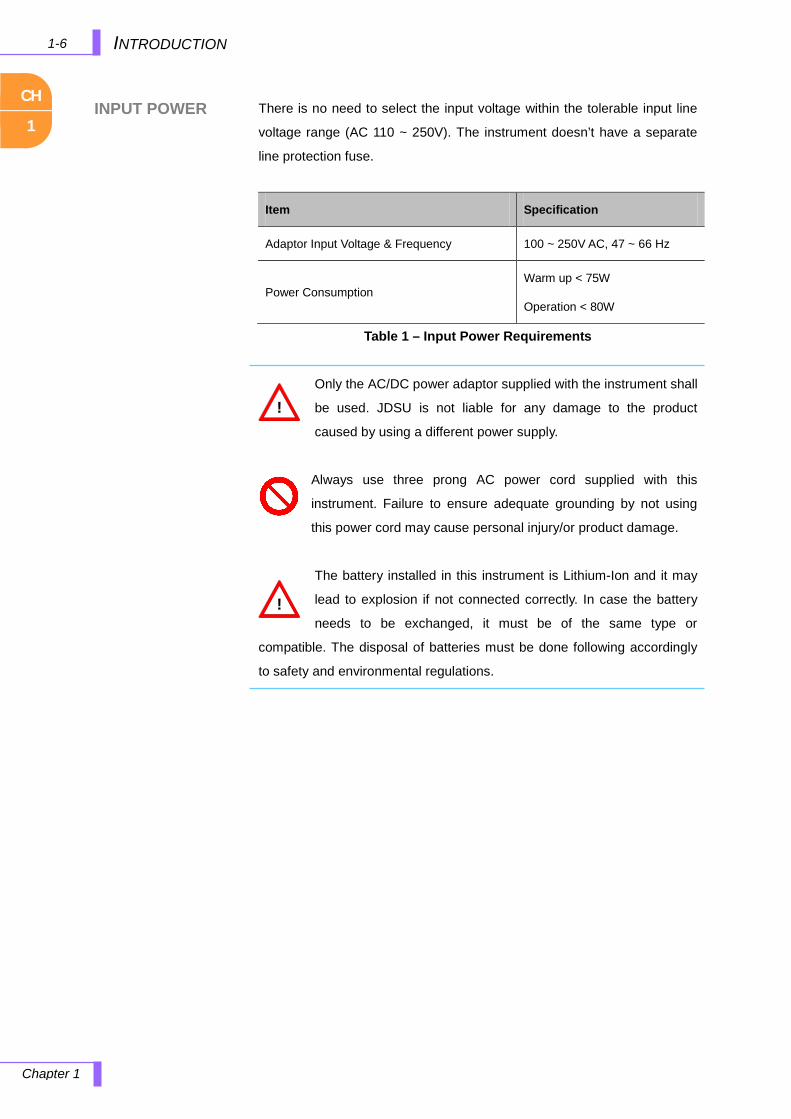
CH
1
INTRODUCTION 1-6
Chapter 1
INPUT POWER
There is no need to select the input voltage within the tolerable input line
voltage range (AC 110 ~ 250V). The instrument doesn’t have a separate
line protection fuse.
Table 1 – Input Power Requirements
Only the AC/DC power adaptor supplied with the instrument shall
be used. JDSU is not liable for any damage to the product
caused by using a different power supply.
Always use three prong AC power cord supplied with this
instrument. Failure to ensure adequate grounding by not using
this power cord may cause personal injury/or product damage.
The battery installed in this instrument is Lithium-Ion and it may
lead to explosion if not connected correctly. In case the battery
needs to be exchanged, it must be of the same type or
compatible. The disposal of batteries must be done following accordingly
to safety and environmental regulations.
Item Specification
Adaptor Input Voltage & Frequency 100 ~ 250V AC, 47 ~ 66 Hz
Power Consumption Warm up < 75W
Operation < 80W
!
!
CH
1
1-7 INTRODUCTION
Chapter 1
ELECTROSTATIC DISCHARGE PRECAUTIONS (ESD)
This instrument was manufactured in an ESD protected environment.
Semiconductor devices used in this product are susceptible to damage by
static discharge. Depending on the magnitude of the discharge,
semiconductor devices may be damaged by direct contact or mere
proximity of a static charge. This may cause performance degradation,
early failure or immediate destruction. Please use the following guidelines
to prevent ESD damage.
Before connecting the cable to the JD7105A terminal, short circuit the
center of the cable with an outside metal shield.
Before removing the connected cables or getting in contact with the
center pin, wear a wrist strap with 1 MΩ resistor connected to the
ground.
All equipment must be connected to the ground to avoid the
accumulation of static charges.

CH
2
2-1 GETTING STARTED
Chapter 2
2.0 GETTING STARTED
In this chapter
Unpacking the JD7105A ............................................................................................................................... 2-2 JD7105A Standard Accessories .................................................................................................................... 2-3 Layout & Hard/Soft Keys .............................................................................................................................. 2-4 Front View .................................................................................................................................................... 2-5
Power Switch ........................................................................................................................................ 2-6 Mode ..................................................................................................................................................... 2-6 Soft Keys .............................................................................................................................................. 2-6 ESC ...................................................................................................................................................... 2-6 Save ..................................................................................................................................................... 2-6 Load ...................................................................................................................................................... 2-7 System .................................................................................................................................................. 2-7 Data Entry Key ...................................................................................................................................... 2-9 Freq/Chan ............................................................................................................................................. 2-9 Amplitude ............................................................................................................................................ 2-10 Trace/Display ...................................................................................................................................... 2-12 BW/AVG.............................................................................................................................................. 2-13 Marker ................................................................................................................................................ 2-13 Peak Search ....................................................................................................................................... 2-14 Measure .............................................................................................................................................. 2-15 Measure Setup ................................................................................................................................... 2-17
Top View ..................................................................................................................................................... 2-18 RF In ................................................................................................................................................... 2-19 DC 15V ~ 19V In ................................................................................................................................. 2-19 RF Out ................................................................................................................................................ 2-19 External In .......................................................................................................................................... 2-19 SYS I/O ............................................................................................................................................... 2-19 E1/T1 .................................................................................................................................................. 2-20 Grip ....................................................................................................................................... 2-20
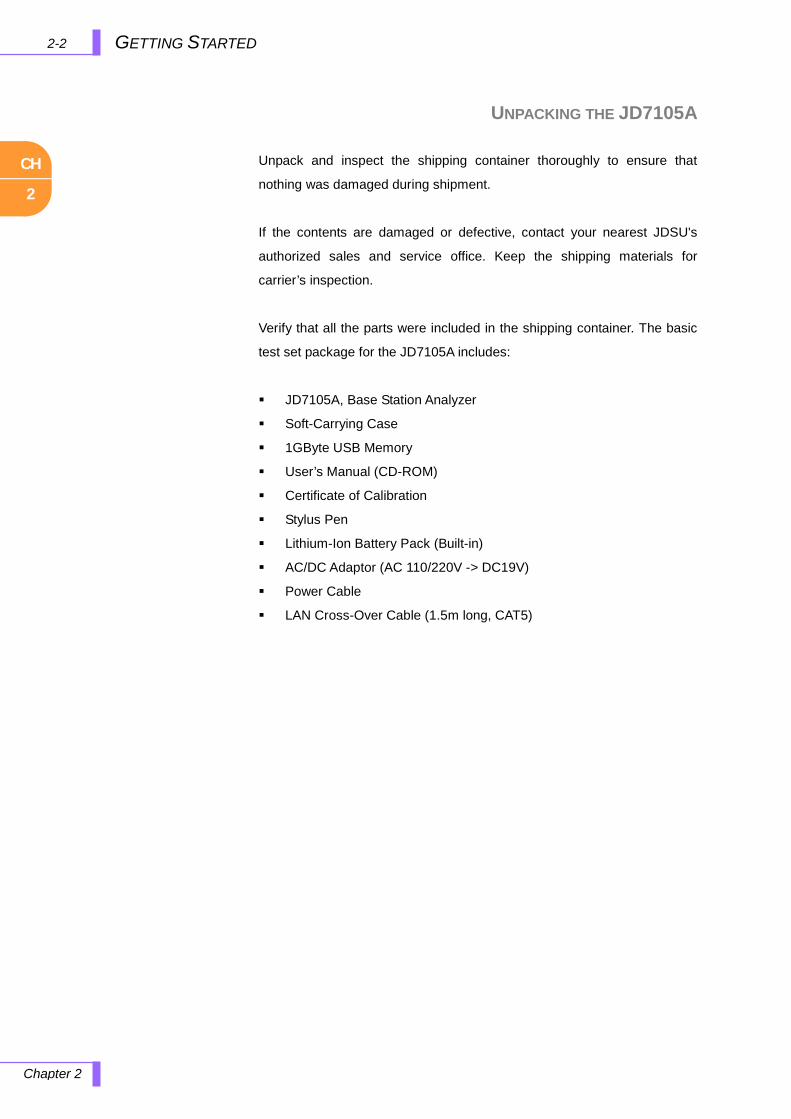
CH
2
GETTING STARTED 2-2
Chapter 2
UNPACKING THE JD7105A
Unpack and inspect the shipping container thoroughly to ensure that
nothing was damaged during shipment.
If the contents are damaged or defective, contact your nearest JDSU's
authorized sales and service office. Keep the shipping materials for
carrier’s inspection.
Verify that all the parts were included in the shipping container. The basic
test set package for the JD7105A includes:
JD7105A, Base Station Analyzer
Soft-Carrying Case
1GByte USB Memory
User’s Manual (CD-ROM)
Certificate of Calibration
Stylus Pen
Lithium-Ion Battery Pack (Built-in)
AC/DC Adaptor (AC 110/220V -> DC19V)
Power Cable
LAN Cross-Over Cable (1.5m long, CAT5)
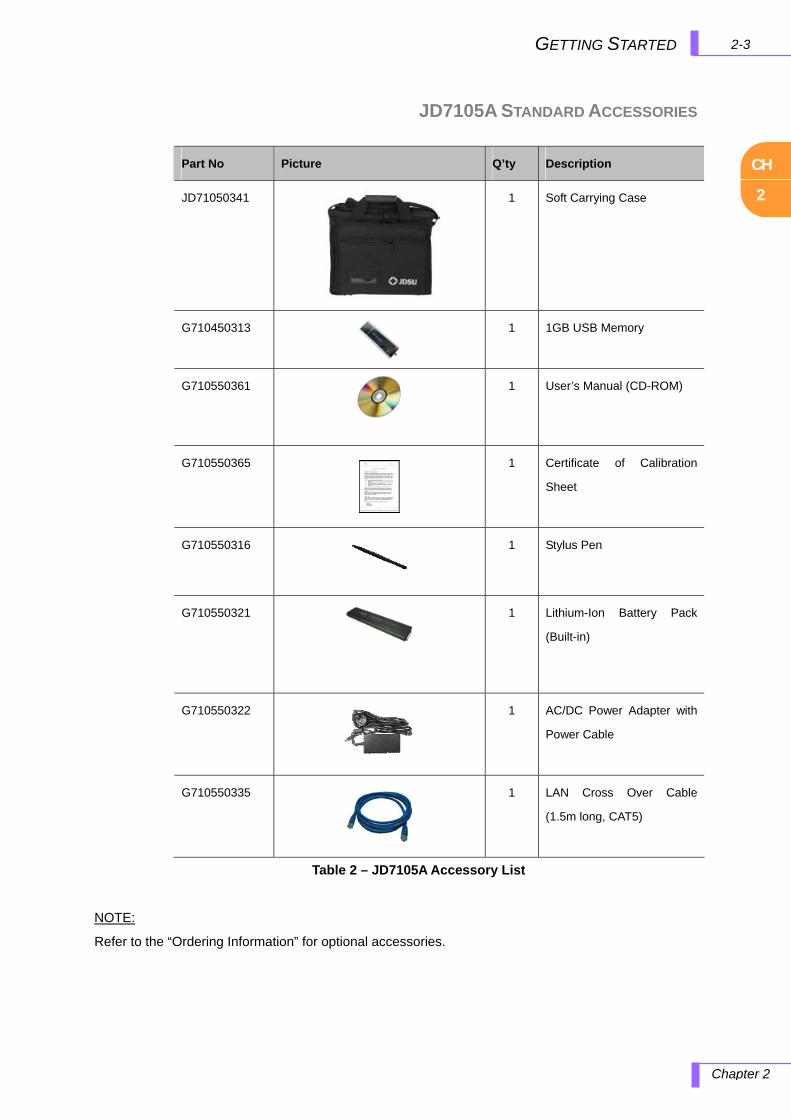
CH
2
2-3GETTING STARTED
Chapter 2
JD7105A STANDARD ACCESSORIES
Part No Picture Q’ty Description
JD71050341
1 Soft Carrying Case
G710450313
1 1GB USB Memory
G710550361
1 User’s Manual (CD-ROM)
G710550365
1 Certificate of Calibration
Sheet
G710550316
1 Stylus Pen
G710550321
1 Lithium-Ion Battery Pack
(Built-in)
G710550322
1 AC/DC Power Adapter with
Power Cable
G710550335
1 LAN Cross Over Cable
(1.5m long, CAT5)
Table 2 – JD7105A Accessory List
NOTE:
Refer to the “Ordering Information” for optional accessories.
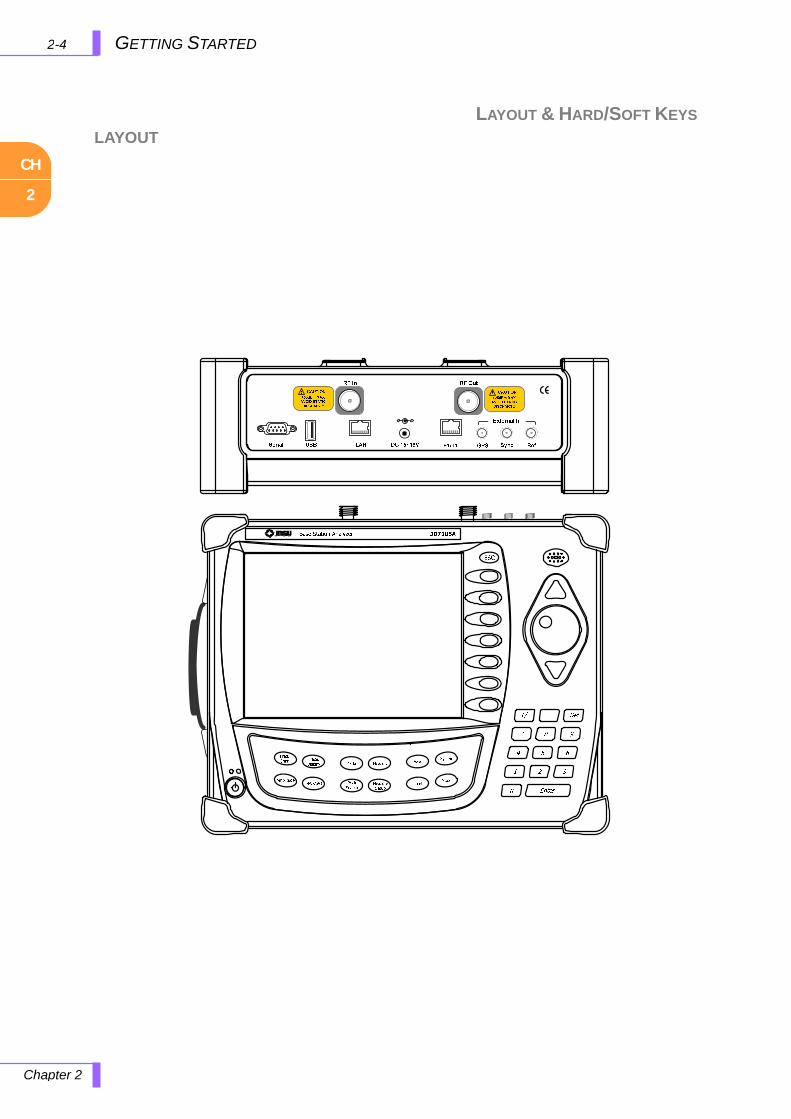
CH
2
GETTING STARTED 2-4
Chapter 2
LAYOUT
LAYOUT & HARD/SOFT KEYS
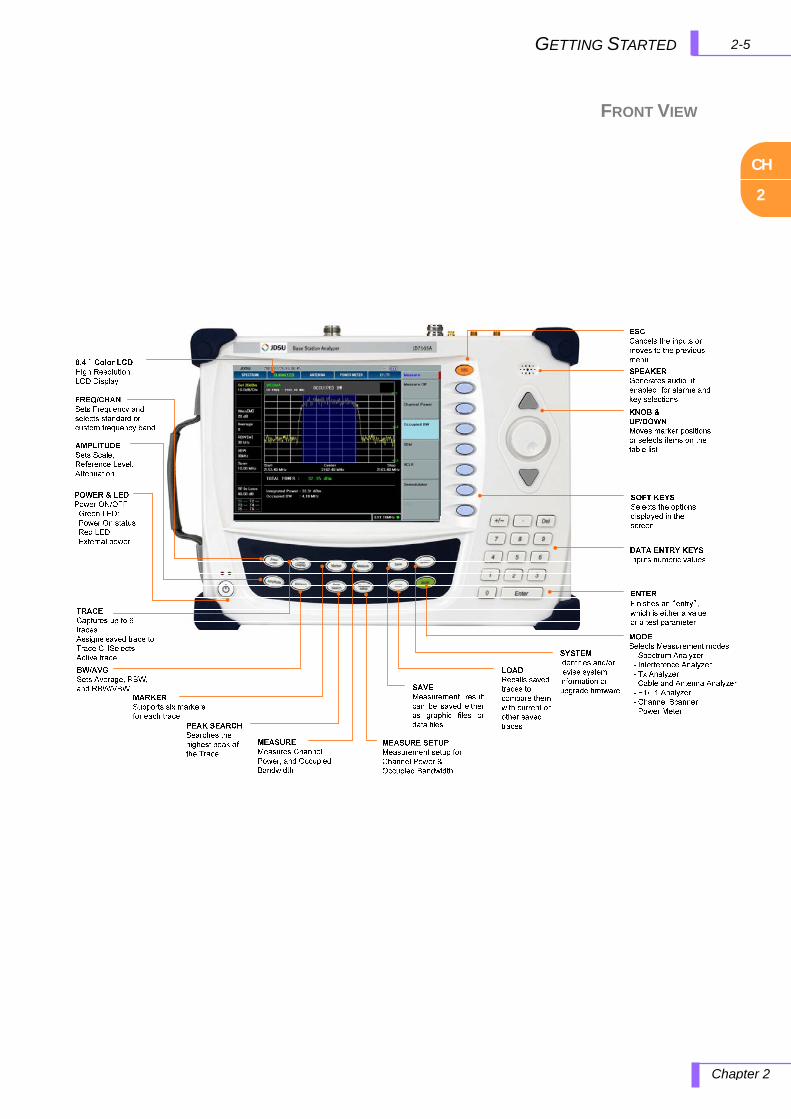
CH
2
2-5GETTING STARTED
Chapter 2
FRONT VIEW
CH
2
GETTING STARTED 2-6
Chapter 2
POWER SWITCH
MODE
SOFT KEYS ESC
SAVE
It powers the JD7105A on and off; when the JD7105A is on the green LED
is lit. When the external power is connected, through the AC/DC adaptor,
the red LED is lit.
The mode key is used to select the major functions of the JD7105A such
as Spectrum Analyzer, TX Analyzer, Antenna/Cable Analyzer, Power Meter,
and E1/T1 Analyzer.
Soft keys are used to activate a specific function, invoke other screen keys,
or to input specific value units. Selecting soft keys will highlight its caption
to show its selection. In case the soft keys are in the same menu layer but
cannot be displayed on one screen, a “More” or “” key on the bottom
corner will be displayed indicating the existence of additional soft keys.
The ESC key is used to move to the previous menu without changing the
current setup.
Measurement results can be saved either as graphic files or as data files.
All measurement results can be saved as graphic files. Spectrum
measurement results can also be saved as data files.
SAVE SCREEN: Saves current screen in a JPEG file. The file name can
be assigned by the user. If the file name is not assigned by the user, then
the instrument will automatically assign it based on the measurement
mode and the measurement time.
SAVE TRACE: Saves a captured trace in a data file. The file name
extension is *.tra. The user setup (Input Attenuation, RBW, VBW, offset,
Average, etc.). however not saved.
SAVE STATUS: This function saves the user setup configuration and the
calibration data. Up to 20 setups can be saved.
SAVE TO: Selects where the information will be saved, either into the
internal memory or into the external USB memory.
CH
2
2-7 GETTING STARTED
Chapter 2
LOAD
SYSTEM
LOAD SCREEN: This function recalls and displays a saved screen. The
active measurement continues to be measured, but it is not displayed on
the screen. Pressing any key removes the loaded screen and the active
measurement is displayed.
LOAD TRACE: This function is used to recall multiple traces for
comparison purposes.
When the instrument is in Cable and Antenna Analyzer mode, the
following changes happen automatically when a saved trace is recalled:
The frequency or distance setting of the current measurement mode
is changed automatically to fit into the recalled trace. On the upper
right corner of the screen, the frequency setting and the assigned
Trace number (Trace CH) of the recalled trace are displayed.
The Y scale unit is adjusted automatically to fit into the Y scale of the
recalled trace.
A second trace can be recalled, but it may not be loaded if its start
and stop points of the X scale are not identical to those of the first
loaded trace.
The trace with a different Y scale may not be seen on the screen even
if the trace information appears on the trace summary table on the
upper right corner of the display. When multiple traces with different Y
scale are loaded, the corresponding trace with the current Y scale is
only shown on the screen.
The System key enables users to verify the system information or to
change the instrument settings.
FREQ REF: Sets the Frequency References to improve measurement
accuracy. The Frequency reference can be selected as Internal, Ext
10MHz, Ext 13MHz, or Ext 15MHz.
TIME REF: Sets the Timing Reference. Time references can be selected
as Internal, External or GPS.
CH
2
GETTING STARTED 2-8
Chapter 2
LICENSE MANAGER: The JD7105A License Manager is a menu used to
select optional modules, which are activated by entering the
corresponding license number.
SELECT LICENSE: Select optional module to be licensed.
LICENSE CODE: Enter license code to enable selected optional
module.
DATE/TIME: Sets the time of the system clock.
ETHERNET CONFIG: Sets the instrument IP Address, Net Mask, and
Gateway for Ethernet communication.
SOUND: Activates or deactivates the beep sound when keys are pressed.
UPGRADE: Upgrades the firmware of the instrument.
LANGUAGE: Changes the language used of the instrument’s menu,
messages and information on the screen display.
SCREEN SAVER: Sets the time to enter into power saving mode. Power
saving mode is automatically activated when no key entry occurs during
the Sleep Time.
Sleep Time setting range: 1~200 minutes.
Power saving mode is turned off when Sleep Time is set to 0.
BRIGHTNESS: This key is used to adjust the brightness of the LCD
display. Adjustment can be made from 0 to 100% and the default setting is
30%.
FILE MANAGER: File manager provides following menu to copy or delete
the data of the instrument.
DELETE: Delete the selected file.
DELETE ALL: Delete all files saved in the instrument.
COPY TO USB: Copy the selected file to USB memory device.
COPY ALL TO USB: Copy all files from the instrument to USB
memory device.
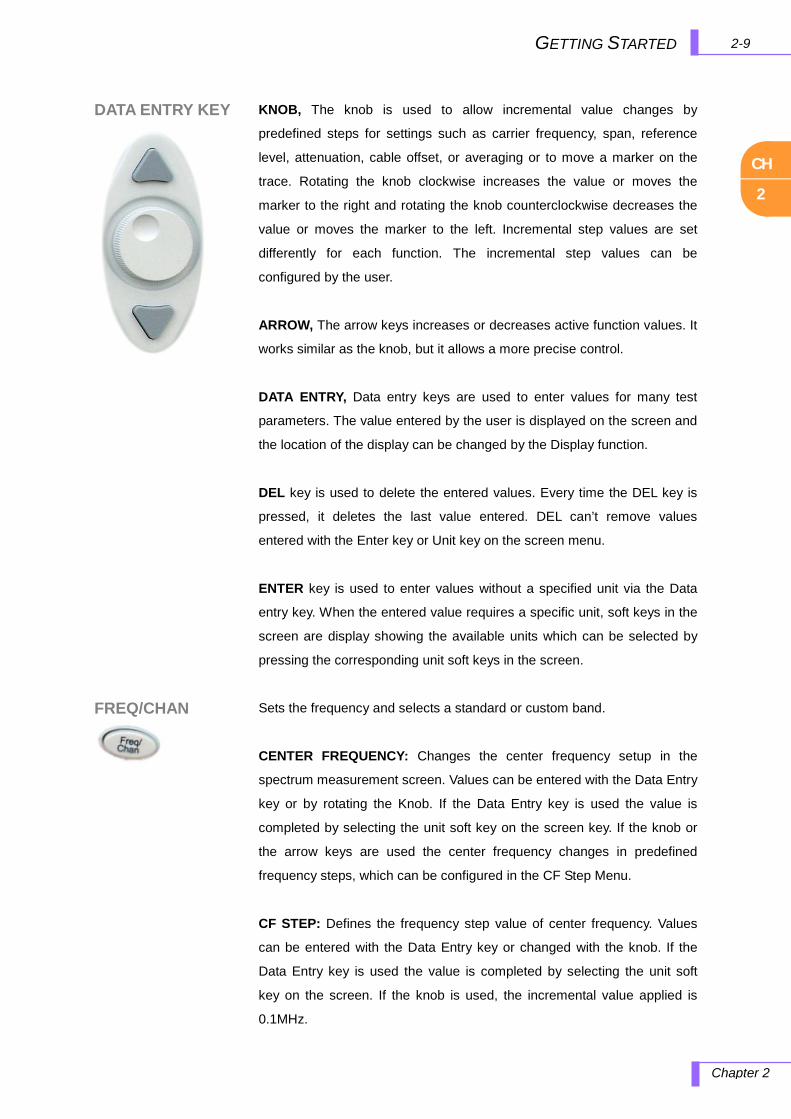
CH
2
2-9 GETTING STARTED
Chapter 2
DATA ENTRY KEY
FREQ/CHAN
KNOB, The knob is used to allow incremental value changes by
predefined steps for settings such as carrier frequency, span, reference
level, attenuation, cable offset, or averaging or to move a marker on the
trace. Rotating the knob clockwise increases the value or moves the
marker to the right and rotating the knob counterclockwise decreases the
value or moves the marker to the left. Incremental step values are set
differently for each function. The incremental step values can be
configured by the user.
ARROW, The arrow keys increases or decreases active function values. It
works similar as the knob, but it allows a more precise control.
DATA ENTRY, Data entry keys are used to enter values for many test
parameters. The value entered by the user is displayed on the screen and
the location of the display can be changed by the Display function.
DEL key is used to delete the entered values. Every time the DEL key is
pressed, it deletes the last value entered. DEL can’t remove values
entered with the Enter key or Unit key on the screen menu.
ENTER key is used to enter values without a specified unit via the Data
entry key. When the entered value requires a specific unit, soft keys in the
screen are display showing the available units which can be selected by
pressing the corresponding unit soft keys in the screen.
Sets the frequency and selects a standard or custom band.
CENTER FREQUENCY: Changes the center frequency setup in the
spectrum measurement screen. Values can be entered with the Data Entry
key or by rotating the Knob. If the Data Entry key is used the value is
completed by selecting the unit soft key on the screen key. If the knob or
the arrow keys are used the center frequency changes in predefined
frequency steps, which can be configured in the CF Step Menu.
CF STEP: Defines the frequency step value of center frequency. Values
can be entered with the Data Entry key or changed with the knob. If the
Data Entry key is used the value is completed by selecting the unit soft
key on the screen. If the knob is used, the incremental value applied is
0.1MHz.
CH
2
GETTING STARTED 2-10
Chapter 2
AMPLITUDE
CHANNEL STANDARD: A Channel Standard is a list to select "Channel
(number)", not frequency. When the unit is changed to "Chan", then
selects "Channel standard" from the list, the Center Frequency of the
display screen will be mapped according to the selected channel
standard. Selected channel number will be a center frequency within a
channel standard you recalled.
UNIT: Selects the unit to be used, either Frequency or Channel. When
the “Chan” is selected, the CF Step corresponds to Channel Step.
AUTO SCALE: The instrument can automatically set the scale to the
minimum and maximum values of a measurement on the Y-axis of the
graph for optimum display of the traces. Every time the AUTO SCALE key
is pressed, the top and bottom scales are set to the minimum and
maximum values with margin on the Y-axis of the screen display.
REFERENCE LEVEL: Sets the maximum range in the Y axis when using
the spectrum analyzer or TX Analyzer function.
Table 3 – Ref Level Setting Procedure
SCALE/DIV: Used only in Spectrum measurement screen, it represents
the value of one division on the horizontal scale. The default value is
10dB/Div and the Y-Scale is set to 100dB. Setting the value to 1dB per
division is possible with the Data Entry keys or the knob by selecting the
Scale Division key.
ATTENUATOR
AUTO: Input Attenuator’s value is automatically set depending on the
reference level. This is the default operation mode, so it is recommended
Step Description
Amplitude
[Ref Level]
<Enter values>
[dBm]/[-dBm] or [Ref Level]
Knob
Select from front Hard Key
Select from Screen Menu
Enter Ref. Level using Data entry key
Select from Screen Menu
Step= 10dB
CH
2
2-11 GETTING STARTED
Chapter 2
to use this mode unless a special measurement condition is needed.
MANUAL: Sets the In-Port attenuator’s value. The reference level
changes according to the change of the attenuator’s value, but the
attenuator’s value doesn’t change when the reference level is changed.
If the input signal level is lower than +30dBm or higher than
the allowable input limit per input attenuator’s value set by the
user (total input power must be lower than 0dBm when input
attenuation setting is +20dB), A “Final IF Overload” message will be
displayed on the upper side of the screen indicating that the input
attenuation’s value must be increased. When the instrument is exposed to
an over power condition for a long time, its performance may be degraded.
When the input power level exceeds +35dBm, an “Over
Power Alarm” message will be displayed on the screen and
the JD7105A disconnects its internal RF Input path and all the
measurements are stopped. In this case, disconnect the external input
signal and wait until the JD7105A measures the input signal level again
and the “Over Power Alarm” message is not displayed.
PRE AMP: Enables/Disables the internal pre-amplifier. Preamplifier is to
amplify a low-level input signal.
RF IN LOSS: Sets an external offset value. An offset consists of a cable
offset and a user offset, and the measurement result shows the value
reflecting both offset values. Even if an offset is set, the reference level is
automatically adjusted to avoid the waveform fitting out of the screen. An
offset value set in Spectrum mode have precedence over the offset value
set in Analysis Mode.
When an external offset value is set at 40dB in Spectrum Mode,
measurement result compensates 40dB at both Spectrum mode and
Analysis mode. However, if user resets external offset value as 35dB in
Analysis mode, 35dB offset value is applied only to the measurement
value made at Analysis mode, and the initial 40dB offset value remains for
the Spectrum mode.
!
!
CH
2
GETTING STARTED 2-12
Chapter 2
TRACE/DISPLAY
TRACE SELECT: Selects an active trace from T1 ~ T6. Every time Select
screen menu is pressed, the active trace changes. Trace numbers are
assigned to each captured traces or loaded traces.
TRACE VIEW: Hides or displays the trace number on the screen. Press
the Select screen menu key to choose the Trace number. Traces with
View set OFF are hidden from the screen. Setting View On restores
hidden traces and information on the window.
M: Max Hold
m: Min Hold
C: Captured Trace
W: Current Trace
L: Loaded Trace
TRACE CAPTURE: Captures a current trace on the screen with assigned
trace number.
CLEAR WRITE: Clear selected Trace and Write (Assign) current trace.
MAX HOLD: Sets Active trace Max Hold. Active trace compares newly
acquired data with the trace shown on the screen and displays the bigger
trace on the screen.
MIN HOLD: Sets Active trace Min Hold. Active trace compares newly
acquired data with the trace shown on the screen and displays the smaller
trace on the screen.
TRACE CLEAR: Deletes an active trace from the screen. The cleared
trace is not restored. It is used to select and delete a trace one by one
when multiple traces are displayed on the screen. Verify the traces to
delete with Trace View ON/OFF function in advance settings as cleared
traces cannot be restored.
CLEAR CURRENT: Deletes an active trace from the screen. The cleared
trace is not restored. It is used to select and delete a trace one by one
when multiple traces are displayed on the screen. Verify the traces to
delete with View ON/OFF function in advance settings as cleared traces
cannot be restored.
CH
2
2-13 GETTING STARTED
Chapter 2
BW/AVG
MARKER
CLEAR ALL: Deletes all traces from the instrument and initialize the trace
settings.
AVERAGE: Sets the number of measurements to be averaged for the
trace presentation. A maximum of 99 times of averaging can be set.
SWEEP CTRL: Selects the sweep method between “Continue” and “Hold”.
Marker is used to get the information about a specific trace. A total of six
Markers can be set and each marker can be used independently. The X
and Y coordinates of the trace are displayed when the maker is placed on
any position of the trace. As the position displaying Marker’s X and Y
coordinates may be slightly different for each measurement mode, refer to
the description of each measurement after this chapter.
MARKER SELECT: Selects an active marker which its position can be
changed with the knob or the arrow keys. The assigned number of active
markers is displayed on the Marker Select screen menu and the marker’s
number is also displayed next to the marker on the trace when the Marker
View On is selected.
MARKER VIEW: Hides or displays the selected marker on the screen. In
the same measurement mode markers appear at the previous positions
when the Marker View is turned off and on. If a measurement mode has
been changed, markers are not restored to their previous positions.
MARKER TYPE:
Selects the type of Marker to be displayed, Normal marker provide the
reading of its position and Delta marker provides the differences between
two sets of marker points.
NORMAL: Used to place a marker, along with the marker number,
1-6, on the trace.
DELTA: Delta Marker is associated with a Normal Marker, so a
Normal Maker must be set before a Delta marker is set. When a
Delta Marker is set, the position set by the Delta Marker becomes
the reference position of the Normal Marker and the Maker’s X
and Y values displays the difference compared with Delta Marker.

CH
2
GETTING STARTED 2-14
Chapter 2
PEAK SEARCH
MARKER TABLE:
Displays a table that contains all activated Marker information on the
bottom side of the screen, when the marker table is activated all X and Y
coordinates of the activated markers are displayed. Depending on the
selection in Draw Type, the maximum number of markers on the table is 6.
MARKER CLEAR ALL: Turns all markers off the screen. Markers are
redisplayed on the previous position if markers are turned back on. If a
measurement mode is changed, current settings are not restored.
MARKER EDIT: Sets the marker position manually. A pop-up window
appears for users to set the frequency by entering numeric values and the
marker position is moved to the setting frequency.
MARKER :
MARKERCF: Marker’s X coordinate is set as the Center
frequency of the spectrum.
MARKERSTART: Marker’s X coordinate is set as the Start
frequency of the spectrum.
MARKERSTOP: Marker’s X coordinate is set as the Stop
frequency of the spectrum.
Each time the Peak Search key is pressed, the Marker is positioned on
the highest peak of the Trace.
PEAK RIGHT: Moves the Marker to the highest peak to the right of its
current position.
PEAK LEFT: Moves Marker to the highest peak to the left from its current
position.
MAX SEARCH: Moves the Marker to the highest peak of the trace.
MIN SEARCH: Moves the Marker to the lowest peak of the trace.
ALWAYS PEAK: Moves the Marker automatically to the highest peak of
the trace every time the trace is refreshed.
CH
2
2-15 GETTING STARTED
Chapter 2
MEASURE
MEASURE OFF: Turns off the current measurement, when this key is
selected while the instrument is in Tx Analyzer mode, the main mode will
be changed to Spectrum Analyzer mode.
CHANNEL POWER: Channel Power measures the power within 1.23MHz
Bandwidth, and allows the user to set an Integration Bandwidth, Channel
Power Span, and the Average Number.
Measure Setup provides required settings for Channel Power
measurement. Also JDViewer, PC Application Software allows user to set
each parameter to import setting as a Mask.
MASK NAME: Used to import a Mask file that generated by
JDViewer, PC Application Software.
INTEGRATION BW: Sets the channel power measurement
bandwidth.
LIMIT ON/OFF: Enables/disables the high and low limits of the
channel power.
OCCUPIED BANDWIDTH: Occupied bandwidth is calculated as the
bandwidth containing 99% of the transmitted power. It also allows the user
to set the Occupied Bandwidth Power Percentage, Occupied Bandwidth
Span, and Average Number.
Measure Setup provides required settings for Occupied Bandwidth
measurement. Also JDViewer, PC Application Software allows user to set
each parameter to import setting as a Mask.
MASK NAME: Used to import a Mask file that generated by
JDViewer, PC Application Software.
OCC BW % PWR: Sets the measurement bandwidth in
percentage.
LIMIT ON/OFF: Enables/disables the high and low limits of the
channel power.
CH
2
GETTING STARTED 2-16
Chapter 2
SEM: Spurious Emission, Emission of a frequency which is outside the
necessary bandwidth and the level of which may be reduced without
affecting the corresponding transmission of the signal.
Measure Setup provides required setting for SEM measurement. Also
JDViewer, PC Application Software allows user to set each parameter to
import setting as a Mask.
MASK NAME: Used to import a Mask file that generated by
JDViewer, PC Application Software.
LIMIT ON/OFF: Enables/disables the high and low limits of the
channel power.
ACP: ACP is defined as the ratio between the amount of leakage power in
an adjacent channel and the total transmitted power in the channel.
Measure Setup provided required setting for ACP measurement. Also
JDViewer, PC Application Software allows user to set each parameter to
import setting as a Mask.
MASK NAME: Used to import a Mask file that generated by
JDViewer, PC Application Software.
LIMIT ON/OFF: Enables/disables the high and low limits of the
channel power.
AM/FM: The AM/FM demodulator operates using the power received from
radio waves and is designed for providing alternative way to identify
interfering signals.
DEMOD: Turns AM/FM Demodulator On/Off.
DEMOD AT: AM/FM Demodulator uses Marker position to
demodulate. There are 6 markers are available in different
frequencies and user can select the frequency to be
demodulated among M1 to M6.
CH
2
2-17 GETTING STARTED
Chapter 2
MEASURE SETUP
DEMOD MODE: Selects AM, FM or CW tone to be demodulated.
DWELL TIME: Sets interval of AM/FM demodulator. AM/FM
Demodulator demodulates for a period of time set by Dwell Time.
VOLUME: Used to adjust volume.
AUTO GAIN: Used to adjust internal gain of demodulator.
This key has different menus in conjunction with Measure key.
Operation in details will be described in each measurement mode.
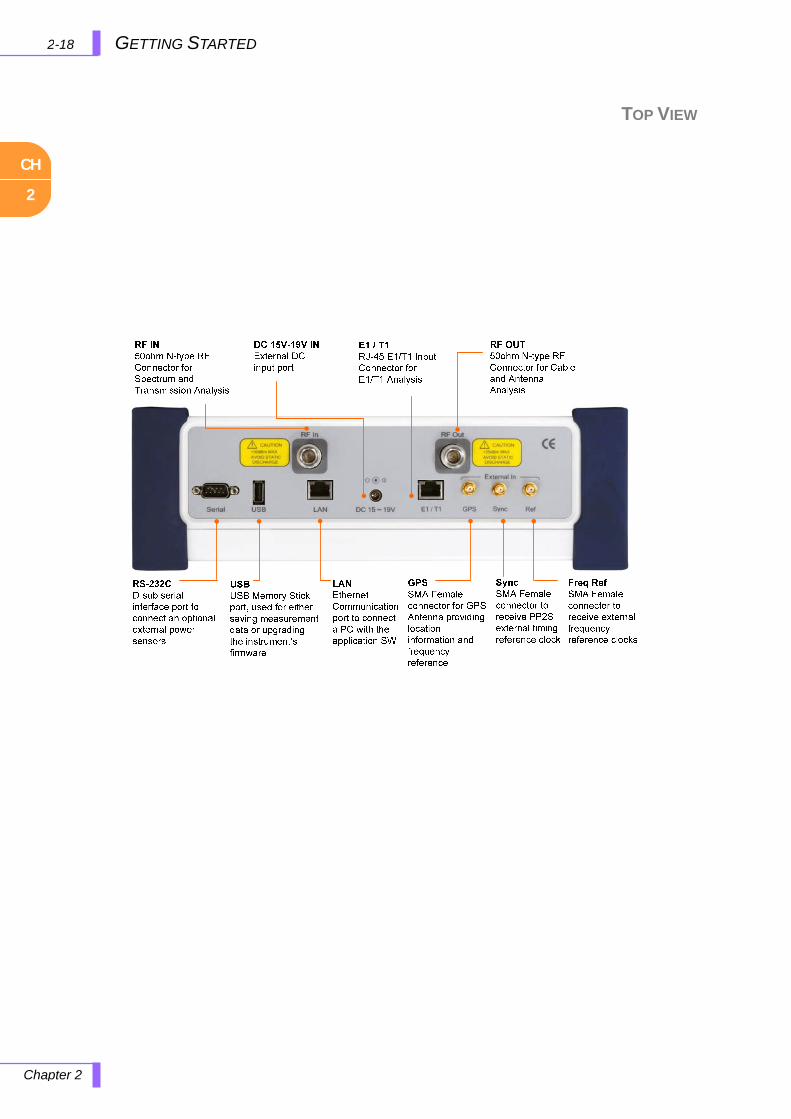
CH
2
GETTING STARTED 2-18
Chapter 2
TOP VIEW
CH
2
2-19 GETTING STARTED
Chapter 2
RF IN DC 15V ~ 19V IN RF OUT EXTERNAL IN
SYS I/O
Is a precise 50ohm N-type female connector, used as the input signal port
for spectrum analysis, TX analysis and RF power measurements.
The maximum power for RF In port is +30dBm. If the input
power exceeds the maximum allowable limit, it will degrade the
product performance and in worst case can damage the
instrument. Do not connect any power feed exceeding 1W directly to the
RF input port of the instrument.
DC 15V to 19V input port.
Is a precise 50ohm N-type female connector, used as the output signal
port for Cable and antenna analyzer.
Do not apply or connect power to this RF Out port. If the power
is applied, it will degrade the product performance and in worst
case can damage the product.
GPS: Is a SMA type female connector used for GPS antenna providing
location information and highly accurate reference.
SYNC: Is a SMA type female connector used to receive PP2S clock or
10msec synchronization signals from an external timing reference.
REF: Is a SMA type female connector, used to receive 10MHz, 13MHz, or
15MHz reference clock signals from an external frequency sources.
RS-232C: A serial interface port used to interface with one of the optional
power sensors.
USB: A USB1.1 master port used for external USB memory to extend the
instrument’s storage capability or to upgrade the instrument’s firmware.
Supports most USB memory devices with 32bit file system.
LAN: Ethernet communication port to connect a PC with the application
software.
!
!
CH
2
GETTING STARTED 2-20
Chapter 2
E1/T1
GRIP
E1/T1 input port to detect error or alarm from E1/T1 signal and to transmit
test pattern to E1/T1 transmission line connected through RF-45 cable
provided as an accessory.
A Grip is to carry the instrument for short distance. It is recommended to
use the instrument’s carrying case to move the instrument for long
distance.
CH
3
3-1 SPECTRUM ANALYZER
Chapter 3
3.0 SPECTRUM ANALYZER
In this chapter
Spectrum Analyzer Introduction .................................................................................................................... 3-2
Spectrum Analysis ................................................................................................................................ 3-3 Measurements Types ........................................................................................................................... 3-4 What is Spectrum.................................................................................................................................. 3-5 RBW ..................................................................................................................................................... 3-6 VBW ..................................................................................................................................................... 3-6 RF Attenuation ...................................................................................................................................... 3-7
Using Spectrum Analyzer ............................................................................................................................. 3-8 How to Use Keys .......................................................................................................................................... 3-9
Soft Keys .............................................................................................................................................. 3-9 ESC ...................................................................................................................................................... 3-9 Freq/Chan ............................................................................................................................................. 3-9 Amplitude ............................................................................................................................................ 3-10 Trace/Display ...................................................................................................................................... 3-12 BW/AVG.............................................................................................................................................. 3-13 Marker ................................................................................................................................................ 3-14 Peak Search ....................................................................................................................................... 3-15 Measure .............................................................................................................................................. 3-15 Measure Setup ................................................................................................................................... 3-16 Display Overview ................................................................................................................................ 3-18
Cable Connection ....................................................................................................................................... 3-19 Spectrum Analyzer Input Mode ................................................................................................................... 3-20 Select Channel Standard ............................................................................................................................ 3-21
Select Channel Standard .................................................................................................................... 3-22 Spectrum Measurement ............................................................................................................................. 3-23
Attenuation, Average, Trace/Display ................................................................................................... 3-24 Spectrum Measurement Screen ......................................................................................................... 3-25
Channel Power Measurement .................................................................................................................... 3-26 Measurement Procedure .................................................................................................................... 3-26 Channel Power Measurement Screen ................................................................................................ 3-27
Occupied Bandwidth Measurement ............................................................................................................ 3-28 Measurement Procedure .................................................................................................................... 3-28 Occupied Bandwidth Measurement Screen ........................................................................................ 3-29
SEM Measurement ..................................................................................................................................... 3-30 Measurement Procedure .................................................................................................................... 3-30 SEM Measurement Screen ................................................................................................................. 3-31
ACP Measurement ..................................................................................................................................... 3-32 Measurement Procedure .................................................................................................................... 3-32 ACP Measurement Screen ................................................................................................................. 3-33
AM/FM Measurement ................................................................................................................................. 3-34 Measurement Procedure .................................................................................................................... 3-34

CH
3
3-2
Chapter 3
SPECTRUM ANALYZER
SPECTRUM ANALYZER INTRODUCTION
This chapter provides the basic operation of the Spectrum Analysis
function of the JD7105A, as well as a description of measurements and
procedures when the JD7105A is in the Spectrum Analyzer Mode.
CH
3
3-3 SPECTRUM ANALYZER
Chapter 3
SPECTRUM ANALYSIS
In this section, we will define spectrum analysis as well as present a brief
introduction to the types of tests that are made with the spectrum and
signal analyzer functions. In order to make measurements on a signal
analyzer and to interpret the results correctly, it is important to understand
the characteristics of the analyzer.
If you are designing, manufacturing, or doing field service/repair of
electrical devices or systems, you need a tool that will help you analyze
the electrical signals that are passing through or being transmitted by your
system or device. By analyzing the characteristics of the signal once its
gone through the device/system, you can determine the performance, find
problems, troubleshoot, etc.
For these type of measurements it is needed a passive receiver, which it
doesn’t affect the signal, it just displays it in a comprehensive way on the
frequency domain, this is called a spectrum analyzer. Spectrum analyzers
usually display raw, unprocessed signal information such as voltage,
power, period, wave shape, sidebands, and frequency.
Depending on the application, a signal could have several different
characteristics. For example, in communications, in order to send
information such as voice or data, it must be modulated onto a higher
frequency carrier. A modulated signal will have specific characteristics
depending on the type of modulation used. When testing non-linear
devices such as amplifiers or mixers, it is important to understand how
distortion can be created. Understanding the characteristics of noise and
how a noise signal looks compared to other types of signals helps to
analyze devices and/or systems.
Understanding the important aspects of a spectrum analyzer for
measuring all of these types of signals will help you make more accurate
measurements and give you confidence that you are interpreting the
results correctly.
CH
3
3-4
Chapter 3
SPECTRUM ANALYZER
MEASUREMENTS TYPES
The most common measurements of a spectrum analyzer are modulation,
distortion, and noise. These three terms encompass many different
measurements.
Measuring the quality of the modulation is important for making sure the
system is working properly and that the information is being transmitted
correctly. Understanding the spectral content is important, especially in
communications where there is very limited bandwidth. The amount of
power being transmitted (for example, to overcome the channel
impairments in wireless systems) is another key measurement in
communications. Tests such as error vector magnitude, rho, modulation
quality, and occupied bandwidth are examples of modulation
measurements.
In communications, it is critical to measure distortion for both the receiver
and transmitter. Excessive harmonic distortion at the output of a
transmitter can interfere with other communication bands. The pre-
amplification stages in a receiver must be free of inter-modulation
distortion to prevent signal crosstalk. An example is the inter-modulation of
cable TV carriers that moves down the trunk of the distribution system and
distorts other channels on the same cable. Common distortion
measurements include inter-modulation, harmonics, ACPR, and spurious
emissions.
Noise is the most standard measurement and even the transmitted signal
can be noisy by definition. Any active circuit or device will generate noise.
Tests such as noise figure and signal-to-noise ratio (SNR) are important
for characterizing the performance of a device and/or its contribution to the
overall system noise. Tests on signals that look like noise tend to be
channel power, and occupied bandwidth.
For all of these measurements on the spectrum analyzer mode, it is
important to understand the operation of the spectrum analyzer and the
spectrum analyzer performance requirements for the specific
measurements.

CH
3
3-5 SPECTRUM ANALYZER
Chapter 3
WHAT IS SPECTRUM
A spectrum is a collection of sine waves that, when properly combined
produces a frequency-domain signal. Displaying complex signals a
frequency-domain provide an indication of its amplitude versus frequency
of each sine wave in the spectrum, making it easy to identify distorted
signals which contain multiple sine waves, as harmonics.
Before we get into the details of describing a spectrum analyzer, we might
first ask ourselves: “Just what is a spectrum and why would we want to
analyze it?” Our normal frame of reference is time. We note when certain
events occur. This includes electrical events. We can use an oscilloscope
to view the instantaneous value of a particular electrical event (or some
other event converted to volts through an appropriate transducer) as a
function of time. In other words, we use the oscilloscope to view the
waveform of a signal in the time domain. Time domain measurements
are also required to identify pulse rise and fall times, overshoot, and
ringing.
Fourier theory explains that any time-domain signal is made up of one or
multiple sine waves of particular frequency, amplitude, and phase. In other
words, we can transform a time-domain signal into its frequency-domain
equivalent. Measurements in the frequency domain tell us how much
energy is present at each particular frequency. If the signal that we wish
to analyze is periodic, as in our case here, Fourier also explains that the
constituent sine waves are separated in the frequency domain by 1/T,
where T is the period of the signal.
The frequency domain measurements provide unique benefits. People
involved in wireless communications are extremely interested in out-of-
band and spurious emissions. For example, cellular radio systems must
be verified for harmonics of the carrier signal that might interfere with other
systems operating at the same frequencies as the harmonics. Engineers
and technicians are also very concerned about distortion of the message
modulated onto a carrier. Third-order intermodulation (two tones of a
complex signal modulating each other) can be particularly troublesome
because the distortion components can fall within the band of interest and
so will not be filtered away.
CH
3
3-6
Chapter 3
SPECTRUM ANALYZER
RBW
VBW
The major components in a spectrum analyzer are the RF input attenuator,
mixer, IF (Intermediate Frequency) gain, IF filter, detector, video filter, local
oscillator, sweep generator, and LCD display.
The IF filter is a band pass filter, used as a "window", to detect signals. Its
bandwidth is referred as the analyzer’s resolution bandwidth (RBW) and
can be configured via the front panel of the instrument.
The RBW is used to adjust the vertical position of a signal on the display
without affecting the signal level at the input mixer. When changed, the
value of the reference level is changed accordingly. Since the reference
level should not change (i.e. the vertical position of displayed signals) the
input attenuator also changes, these two components are tied together.
The IF gain will automatically be changed to compensate for input
attenuator changes, so signals remain stationary on the instrument’s
display, and the reference level is not changed.
By providing a broad range of variable resolution bandwidth settings, the
instrument can be optimized for sweep and signal conditions, combining
frequency selectivity (the ability to resolve signals), signal-to-noise ratio
(SNR), and measurement speed.
When the RBW is narrowed, selectivity is improved (resolving both input
signals). This will also improve SNR. The sweep speed and trace update
rate, however, will degrade with a narrower RBWs. The optimum RBW
setting depends heavily on the characteristics of the signals of interest.
The video bandwidth (VBW) consists of a video filter as a low-pass filter
located after the envelope detector. This filter determines the bandwidth of
the video amplifier, and is used to average or smooth the trace displayed
by the instrument.
The spectrum analyzer displays the signal and noise so the closer a signal
is to the noise level; the more difficult is to be identified. By changing the
VBW, the peak-to-peak variations of noise can be decreased.

CH
3
3-7 SPECTRUM ANALYZER
Chapter 3
RF ATTENUATION
This type of signal smoothing is used to locate signals that otherwise
might be masked with noise. Changing the VBW does not improve
sensitivity; however, it does improve identification and repeatability when
making low-level measurements.
As a general rule, most field spectrum analyzer measurements are made
at a video bandwidth that is a factor of 10 to 100 less than the resolution
bandwidth. Thus, for a resolution bandwidth of 30 kHz, the typical video
bandwidth setting options are either 3 kHz or 300 Hz.
The RF Input Attenuator is a step attenuator located between the input
connector and the first mixer. It is also called the RF attenuator. It is used
to adjust the level of the signal incident upon the first mixer in order to
prevent a mixer gain compression and distortion due to high-level and/or
broadband signals.
An important aspect of the analyzer's internal noise that is often
overlooked is its effective level as a function of the RF input attenuator
setting. Since the internal noise is generated after the mixer, the RF input
attenuator has no effect on the actual noise level. However, the RF input
attenuator does affect the signal level at the input and therefore decreases
the signal-to-noise ratio (SNR) of the analyzer. The best SNR is with the
lowest possible RF input attenuation.
The RF input attenuator and IF gain are tied together, therefore, as the RF
input attenuation is increased by 10 dB, the IF gain will simultaneously
increase by 10 dB to compensate for the loss. As a result the signal
displayed stays constant, but the (amplified) noise level is increases by 10
dB.
CH
3
3-8
Chapter 3
SPECTRUM ANALYZER
USING SPECTRUM ANALYZER
The advantage of the Spectrum Analyzer is easy to verify the presence of
unwanted signals such as spurious and harmonics, which is normally very
hard to identify in Time domain analysis. Performance assurance in
wireless communication systems includes the observation of the out-of-
band signal characteristics in order to identify the presence of harmonic
signals. Harmonic signals of a carrier may interfere with other signals far
out of the transmission band, or harmonic signals from other transmitter
may interfere with in band signals affecting the spectral integrity.
In these days when wide variety of wireless communication services are
provided in frequency bands assigned very closely to each other, it is
critical to ensure that each communication service is carried out within
their assigned frequency band minimizing interference with adjacent
frequency bands. So, the Adjacent Channel Power Ratio, ACPR
characteristic of a power amplifier or other RF components is an important
factor in evaluating the system performance.
CH
3
3-9 SPECTRUM ANALYZER
Chapter 3
SOFT KEYS ESC FREQ/CHAN
HOW TO USE KEYS
This section provides a description of the instrument's keys used in the
Spectrum Analyzer mode.
Soft Keys
Soft keys are used to activate a specific function, invoke other screen keys,
or to input specific value units. Selecting soft keys will highlight its caption
to show its selection. In case the soft keys are in the same layer but
cannot be displayed, the “More” or “” key on the bottom corner will be
displayed indicating the existence of additional soft keys.
ESC
The ESC key is used to move to the previous Menu without changing the
current setup.
Freq/Chan
Sets the frequency band with either standard or custom frequency bands.
CENTER FREQUENCY: Changes the center frequency setup in the
spectrum measurement. Values can be entered with the Data Entry key,
the Knob or the arrow keys. When using the Data Entry key, the input is
completed by selecting the soft key with the corresponding value unit.
When using the Knob or the arrow keys, the center frequency changes in
predefined frequency steps. The frequency steps can be configured
selecting the CF Step Menu.
SPAN: This key is used to set the frequency range over which the
instrument will sweep.
START FREQUENCY: Changes the Start frequency in the spectrum
measurement. Values can be entered with the Data Entry key, the knob or
the arrow keys. When using the Data Entry key, the input is completed by
selecting the soft key with the corresponding value unit.
STOP FREQUENCY: Changes the Stop frequency in the spectrum
measurement. Values can be entered with the Data Entry key, the knob or
the arrow keys. When the Data Entry key is used the input is completed by
selecting the soft key with the corresponding value unit.
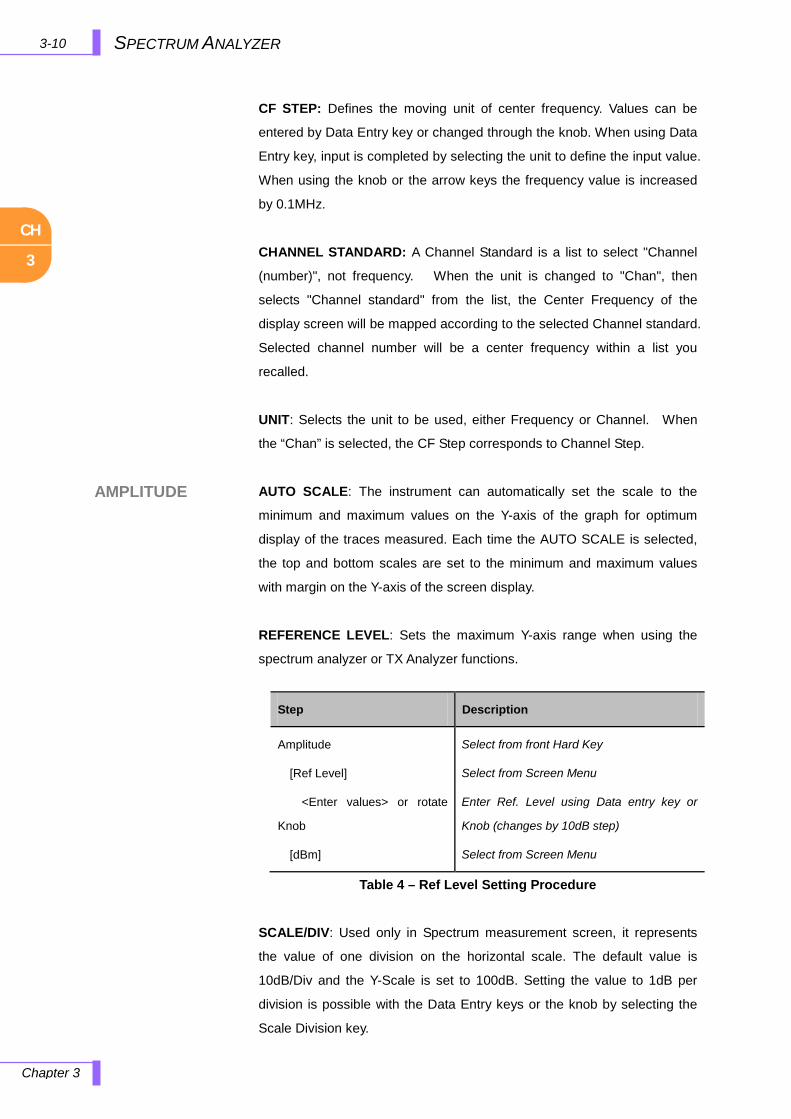
CH
3
3-10
Chapter 3
SPECTRUM ANALYZER
AMPLITUDE
CF STEP: Defines the moving unit of center frequency. Values can be
entered by Data Entry key or changed through the knob. When using Data
Entry key, input is completed by selecting the unit to define the input value.
When using the knob or the arrow keys the frequency value is increased
by 0.1MHz.
CHANNEL STANDARD: A Channel Standard is a list to select "Channel
(number)", not frequency. When the unit is changed to "Chan", then
selects "Channel standard" from the list, the Center Frequency of the
display screen will be mapped according to the selected Channel standard.
Selected channel number will be a center frequency within a list you
recalled.
UNIT: Selects the unit to be used, either Frequency or Channel. When
the “Chan” is selected, the CF Step corresponds to Channel Step.
AUTO SCALE: The instrument can automatically set the scale to the
minimum and maximum values on the Y-axis of the graph for optimum
display of the traces measured. Each time the AUTO SCALE is selected,
the top and bottom scales are set to the minimum and maximum values
with margin on the Y-axis of the screen display.
REFERENCE LEVEL: Sets the maximum Y-axis range when using the
spectrum analyzer or TX Analyzer functions.
Table 4 – Ref Level Setting Procedure
SCALE/DIV: Used only in Spectrum measurement screen, it represents
the value of one division on the horizontal scale. The default value is
10dB/Div and the Y-Scale is set to 100dB. Setting the value to 1dB per
division is possible with the Data Entry keys or the knob by selecting the
Scale Division key.
Step Description
Amplitude
[Ref Level]
<Enter values> or rotate
Knob
[dBm]
Select from front Hard Key
Select from Screen Menu
Enter Ref. Level using Data entry key or
Knob (changes by 10dB step)
Select from Screen Menu
CH
3
3-11 SPECTRUM ANALYZER
Chapter 3
ATTENUATOR
AUTO: Input Attenuator’s value is automatically set depending on the
reference level. This is the default operation mode, so it is recommended
to use this mode unless a special measurement condition is needed.
MANUAL: Sets the In-Port attenuator’s value. The reference level
changes according to the change of the attenuator’s value, but the
attenuator’s value doesn’t change when the reference level is changed.
If the input signal level is lower than +30dBm or higher than the
allowable input limit per input attenuator’s value set by the user
(total input power must be lower than 0dBm when input
attenuation setting is +20dB), A “Final IF Overload” message will be
displayed on the upper side of the screen indicating that the input
attenuation’s value must be increased. When the instrument is exposed to
an over power condition for a long time, its performance may be degraded.
When the input power level exceeds +35dBm, an “Over Power
Alarm” message will be displayed on the screen and the
JD7105A disconnects its internal RF Input path and all the
measurements are stopped. In this case, disconnect the external input
signal and wait until the JD7105A measures the input signal level again
and the “Over Power Alarm” message is not displayed.
PRE AMP: Enables/Disables the internal pre-amplifier. Preamplifier is to
amplify a low-level input signal.
RF IN LOSS: Sets an external offset value. An offset consists of a cable
offset and a user offset, and the measurement result shows the value
reflecting both offset values. Even if an offset is set, the reference level is
automatically adjusted to avoid the waveform fitting out of the screen. An
offset value set in Spectrum mode have precedence over the offset value
set in Analysis Mode.
When an external offset value is set at 40dB in Spectrum Mode,
measurement result compensates 40dB at both Spectrum mode and
!
!
CH
3
3-12
Chapter 3
SPECTRUM ANALYZER
TRACE/DISPLAY
Analysis mode. However, if user resets external offset value as 35dB in
Analysis mode, 35dB offset value is applied only to the measurement
value made at Analysis mode, and the initial 40dB offset value remains for
the Spectrum mode.
TRACE SELECT: Selects an active trace from T1 ~ T6. Every time Select
screen menu is pressed, the active trace changes. Trace numbers are
assigned to each captured traces or loaded traces.
TRACE VIEW: Hides or displays the trace number on the screen. Press
the Select screen menu key to choose the Trace number. Traces with
View set OFF are hidden from the screen. Setting View On restores
hidden traces and information on the window.
M: Max Hold
m: Min Hold
C: Captured Trace
W: Current Trace
L: Loaded Trace
TRACE CAPTURE: Captures a current trace on the screen with assigned
trace number.
CLEAR WRITE: Clear selected Trace and Write (Assign) current trace.
MAX HOLD: Sets Active trace Max Hold. Active trace compares newly
acquired data with the trace shown on the screen and displays the bigger
trace on the screen.
MIN HOLD: Sets Active trace Min Hold. Active trace compares newly
acquired data with the trace shown on the screen and displays the smaller
trace on the screen.
TRACE CLEAR: Deletes an active trace from the screen. The cleared
trace is not restored. It is used to select and delete a trace one by one
when multiple traces are displayed on the screen. Verify the traces to
delete with Trace View ON/OFF function in advance settings as cleared
traces cannot be restored.
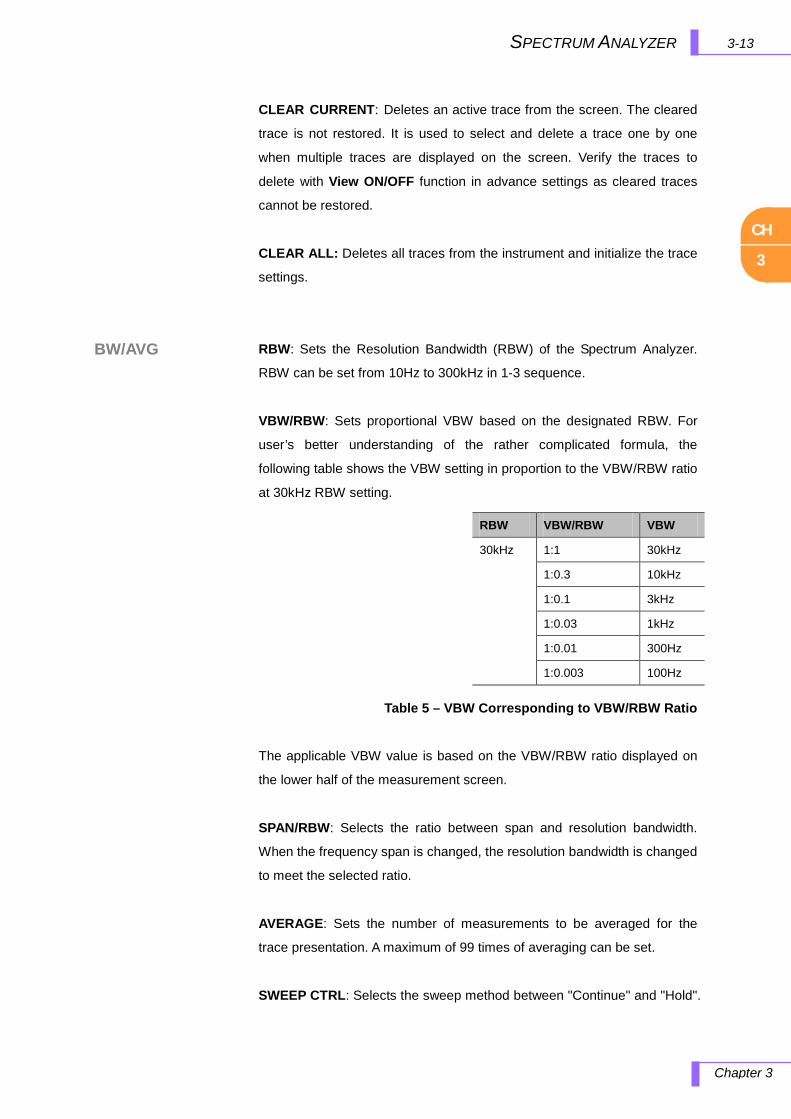
CH
3
3-13 SPECTRUM ANALYZER
Chapter 3
BW/AVG
CLEAR CURRENT: Deletes an active trace from the screen. The cleared
trace is not restored. It is used to select and delete a trace one by one
when multiple traces are displayed on the screen. Verify the traces to
delete with View ON/OFF function in advance settings as cleared traces
cannot be restored.
CLEAR ALL: Deletes all traces from the instrument and initialize the trace
settings.
RBW: Sets the Resolution Bandwidth (RBW) of the Spectrum Analyzer.
RBW can be set from 10Hz to 300kHz in 1-3 sequence.
VBW/RBW: Sets proportional VBW based on the designated RBW. For
user’s better understanding of the rather complicated formula, the
following table shows the VBW setting in proportion to the VBW/RBW ratio
at 30kHz RBW setting.
Table 5 – VBW Corresponding to VBW/RBW Ratio
The applicable VBW value is based on the VBW/RBW ratio displayed on
the lower half of the measurement screen.
SPAN/RBW: Selects the ratio between span and resolution bandwidth.
When the frequency span is changed, the resolution bandwidth is changed
to meet the selected ratio.
AVERAGE: Sets the number of measurements to be averaged for the
trace presentation. A maximum of 99 times of averaging can be set.
SWEEP CTRL: Selects the sweep method between "Continue" and "Hold".
RBW VBW/RBW VBW
30kHz 1:1 30kHz
1:0.3 10kHz
1:0.1 3kHz
1:0.03 1kHz
1:0.01 300Hz
1:0.003 100Hz
CH
3
3-14
Chapter 3
SPECTRUM ANALYZER
MARKER
Marker is used to get the information about a specific trace. A total of six
Markers can be set and each marker can be used independently. The X
and Y coordinates of the trace are displayed when the maker is placed on
any position of the trace. As the position displaying Marker’s X and Y
coordinates may be slightly different for each measurement mode, refer to
the description of each measurement after this chapter.
MARKER SELECT: Selects an active marker which its position can be
changed with the knob or the arrow keys. The assigned number of active
markers is displayed on the Marker Select screen menu and the marker’s
number is also displayed next to the marker on the trace when the Marker
View On is selected.
MARKER VIEW: Hides or displays the selected marker on the screen. In
the same measurement mode markers appear at the previous positions
when the Marker View is turned off and on. If a measurement mode has
been changed, markers are not restored to their previous positions.
MARKER TYPE:
Selects the type of Marker to be displayed, Normal marker provide the
reading of its position and Delta marker provides the differences between
two sets of marker points.
NORMAL: Used to place a marker, along with the marker number,
1-6, on the trace.
DELTA: Delta Marker is associated with a Normal Marker, so a
Normal Maker must be set before a Delta marker is set. When a
Delta Marker is set, the position set by the Delta Marker becomes
the reference position of the Normal Marker and the Maker’s X
and Y values displays the difference compared with Delta Marker.
MARKER TABLE:
Displays a table that contains all activated Marker information on the
bottom side of the screen, when the marker table is activated all X and Y
coordinates of the activated markers are displayed. Depending on the
selection in Draw Type, the maximum number of markers on the table is 6.
CH
3
3-15 SPECTRUM ANALYZER
Chapter 3
Marker (Cont’d)
PEAK SEARCH
MEASURE
MARKER CLEAR ALL: Turns all markers off the screen. Markers are
redisplayed on the previous position if markers are turned back on. If a
measurement mode is changed, current settings are not restored.
MARKER EDIT: Sets the marker position manually. A pop-up window
appears for users to set the frequency by entering numeric values and the
marker position is moved to the setting frequency.
MARKER :
MARKERCF: Marker’s X coordinate is set as the Center
frequency of the spectrum.
MARKERSTART: Marker’s X coordinate is set as the Start
frequency of the spectrum.
MARKERSTOP: Marker’s X coordinate is set as the Stop
frequency of the spectrum.
Each time the peak search key is pressed a marker is displayed on the
highest peak of the Trace.
PEAK RIGHT: Moves the marker to the next highest peak at the right of its
current position.
PEAK LEFT: Moves the marker to the next highest peak at the left of its
current position.
MAX SEARCH: Moves the marker to the highest peak of the trace.
MIN SEARCH: Moves the marker to the lowest peak of the trace.
ALWAYS PEAK: Moves the marker automatically to the highest peak of
the trace each time the trace is updated.
The Measure key selects the following measurements in Spectrum mode.
Channel Power
Occupied Bandwidth
SEM (Spectrum Emission Mask)
ACP (Adjacent Channel Power)
AM/FM

CH
3
3-16
Chapter 3
SPECTRUM ANALYZER
MEASURE SETUP
When “Channel Power, Occupied Bandwidth, SEM, ACP and AM/FM
mode” is selected, then Measure Setup provides the following
measurement parameters:
CHANNEL POWER MEASUREMENTS:
MASK NAME: Used to import a Mask file that generated by
JDViewer, PC Application Software.
INTEGRATION BW: Sets the channel power measurement
bandwidth.
LIMIT ON/OFF: Enables/disables the high and low limits of the
channel power.
OCCUPIED BANDWIDTH MEASUREMENTS:
MASK NAME: Used to import a Mask file that generated by
JDViewer, PC Application Software.
OCC BW % PWR: Sets the measurement bandwidth in
percentage.
LIMIT ON/OFF: Enables/disables the high and low limits of the
channel power.
SEM MEASUREMENTS:
MASK NAME: Used to import a Mask file that generated by
JDViewer, PC Application Software.
LIMIT ON/OFF: Enables/disables the high and low limits of the
channel power.
ACP MEASUREMENTS:
MASK NAME: Used to import a Mask file that generated by
JDViewer, PC Application Software.

CH
3
3-17 SPECTRUM ANALYZER
Chapter 3
Measure Setup (Cont’d)
LIMIT ON/OFF: Enables/disables the high and low limits of the
channel power.
AM/FM:
DEMOD: Turns AM/FM Demodulator On/Off.
DEMOD AT: AM/FM Demodulator uses Marker position to
demodulate. There are 6 markers are available in different
frequencies and user can select the frequency to be
demodulated among M1 to M6.
DEMOD MODE: Selects AM, FM or CW tone to be demodulated.
DWELL TIME: Sets interval of AM/FM demodulator. AM/FM
Demodulator demodulates for a period of time set by Dwell Time.
VOLUME: Used to adjust volume.
AUTO GAIN: Used to adjust internal gain of demodulator.

CH
3
3-18
Chapter 3
SPECTRUM ANALYZER
DISPLAY
OVERVIEW
① Reference Level, Scale Division, etc: Spectrum Window’s Y Scale
information
② Input Attenuation Information
[A]: Auto mode, [M]: Manual mode, [P]: Pre-amp On
③ Number of Averaging
④ Spectrum Window’s X Scale information, RBW, VBW setting value
⑤ Span Setting Information
⑥ User offset (Input Loss) Setting Information
⑦ Trace Information
C: Captured, M: Max Hold, m: Min Hold
⑧ Information on Marker Tables.
⑨ Information on Active Marker
⑩ Frequency selection key
⑪ Channel Standard selection button.
⑫ Unit selection key, choose either Frequency or Channel
Figure 1 – Overview of Spectrum Analyzer Display

CH
3
3-19SPECTRUM ANALYZER
Chapter 3
Direct Connection
Indirect Connection
CABLE CONNECTION
The maximum power for the RF-In port is 30dBm (1 Watt). If
the input signal level to be measured is greater than 30dBm,
use a High Power Attenuator to prevent damage when you
directly connect the signal to the instrument. Or, connect a signal from the
coupling port of a directional coupler.
Direct Connection
Indirect Connection
Figure 2 – PA Output Port and RF In Port Connection
Figure 3 – Monitor Port and RF In Port Connection
!

CH
3
3-20
Chapter 3
SPECTRUM ANALYZER
SPECTRUM ANALYZER INPUT MODE
The input circuit of the Spectrum Analyzer consists of an attenuator and an
amplifier. The function of the input circuit is to control the power level of
the input signal. If the input signal level is too high, the input circuit is
saturated resulting in a distorted signal. On the other hand, if the input
signal is too low, the S/N ratio becomes worse and makes it difficult to
perform an accurate measurement.
The default settings of the Spectrum measurement are the following:
Ref Level: 0dBm
Atten Mode: Auto
Attenuation: 20dB
RBW: 30kHz
VBW: 30kHz
Scale/Div: 10dB
Average: Off
CH
3
3-21 SPECTRUM ANALYZER
Chapter 3
SELECT CHANNEL STANDARD
Once a channel standard is selected, user can analyze the specific
channel by simply entering the channel number even without knowing the
particular center frequency of the carriers. By selecting the unit in
Freq/Chan to Chan, the center frequency setting method will be changed
to Channel number. The Channel standard is applicable to the following
settings:
Spectrum Analyzer
Channel Scanner
Interference Analyzer
Tx Analyzer
Power Meter
The channel standard in the instrument supports various signal standards.
(The APPENDIX D. BAND, FREQUENCY, CHANNEL STANDARD shows a table of
the signal standards available in the instrument).
Press the Freq/Chan key to display the Frequency menu
Press the Channel Standard soft key and use the Up/down Keys or
Knob to select the desired channel standard. (Whenever the channel
standard would be changed, the lowest channel number for the
standard is automatically assigned in the channel.)
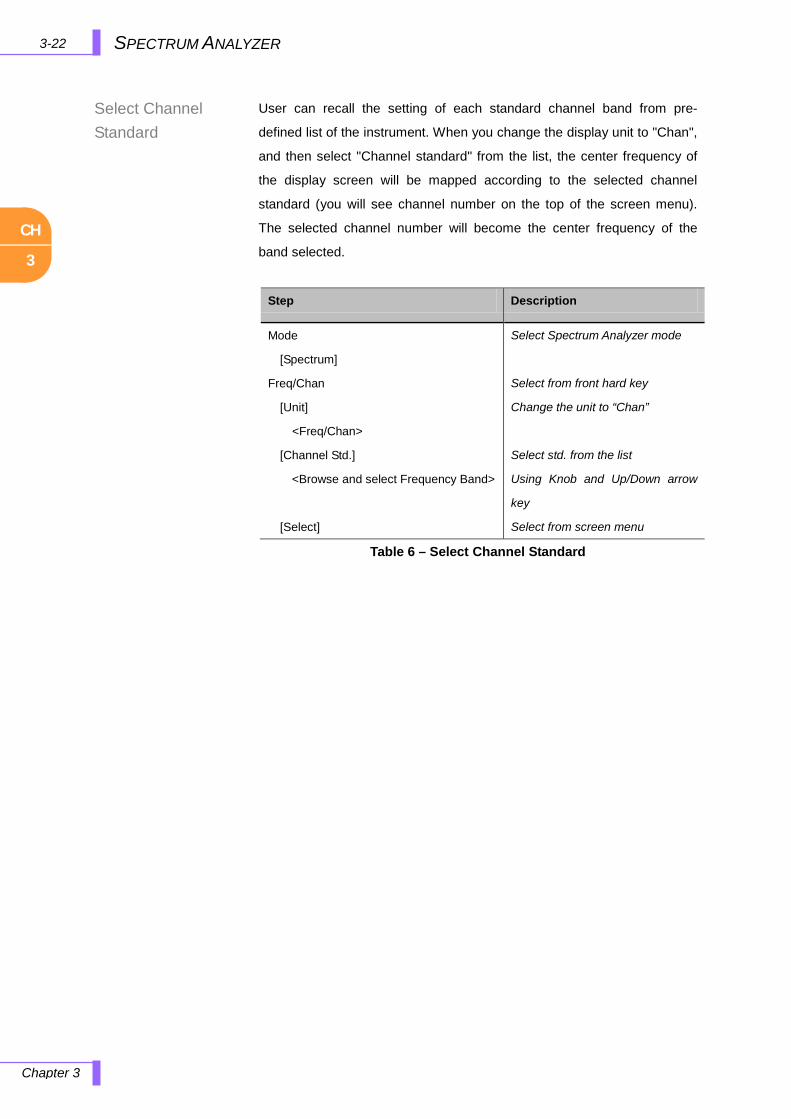
CH
3
3-22
Chapter 3
SPECTRUM ANALYZER
Select Channel Standard
User can recall the setting of each standard channel band from pre-
defined list of the instrument. When you change the display unit to "Chan",
and then select "Channel standard" from the list, the center frequency of
the display screen will be mapped according to the selected channel
standard (you will see channel number on the top of the screen menu).
The selected channel number will become the center frequency of the
band selected.
Table 6 – Select Channel Standard
Step Description
Mode
[Spectrum]
Freq/Chan
[Unit]
<Freq/Chan>
[Channel Std.]
<Browse and select Frequency Band>
[Select]
Select Spectrum Analyzer mode
Select from front hard key
Change the unit to “Chan”
Select std. from the list
Using Knob and Up/Down arrow
key
Select from screen menu
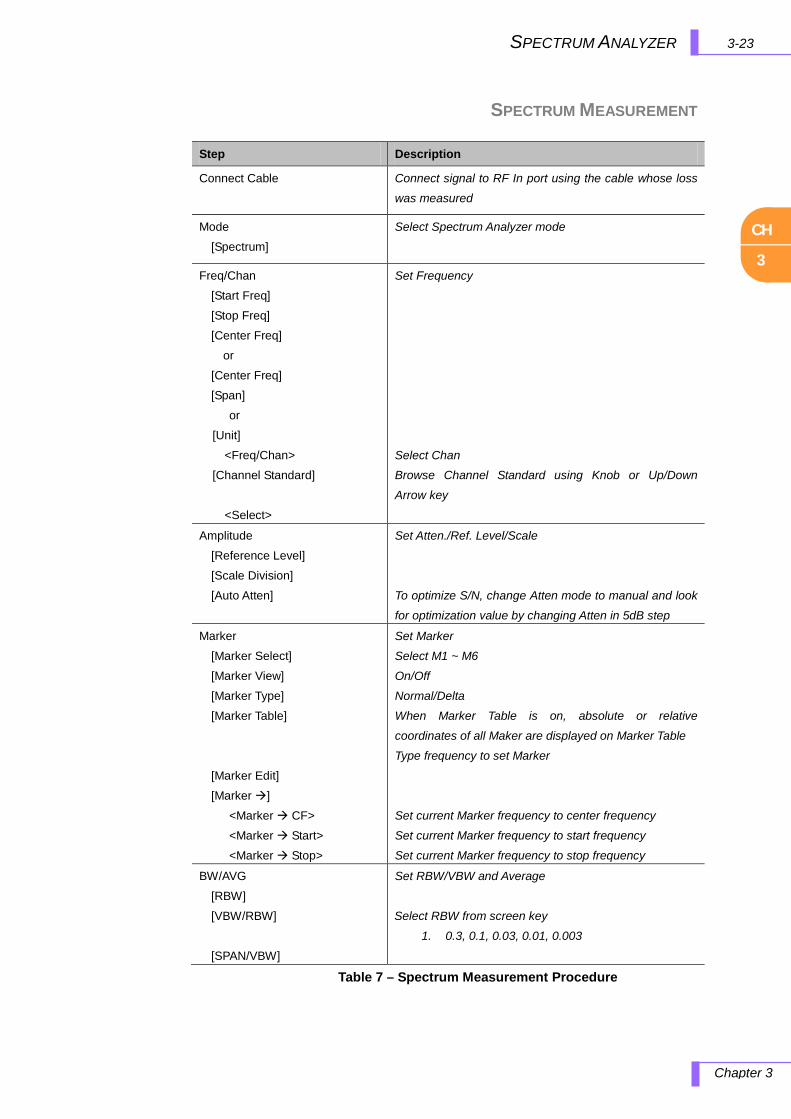
CH
3
3-23 SPECTRUM ANALYZER
Chapter 3
SPECTRUM MEASUREMENT
Table 7 – Spectrum Measurement Procedure
Step Description
Connect Cable Connect signal to RF In port using the cable whose loss
was measured
Mode
[Spectrum]
Select Spectrum Analyzer mode
Freq/Chan
[Start Freq]
[Stop Freq]
[Center Freq]
or
[Center Freq]
[Span]
or
[Unit]
<Freq/Chan>
[Channel Standard]
<Select>
Set Frequency
Select Chan
Browse Channel Standard using Knob or Up/Down
Arrow key
Amplitude
[Reference Level]
[Scale Division]
[Auto Atten]
Set Atten./Ref. Level/Scale
To optimize S/N, change Atten mode to manual and look
for optimization value by changing Atten in 5dB step
Marker
[Marker Select]
[Marker View]
[Marker Type]
[Marker Table]
[Marker Edit]
[Marker ]
<Marker CF>
<Marker Start>
<Marker Stop>
Set Marker
Select M1 ~ M6
On/Off
Normal/Delta
When Marker Table is on, absolute or relative
coordinates of all Maker are displayed on Marker Table
Type frequency to set Marker
Set current Marker frequency to center frequency
Set current Marker frequency to start frequency
Set current Marker frequency to stop frequency
BW/AVG
[RBW]
[VBW/RBW]
[SPAN/VBW]
Set RBW/VBW and Average
Select RBW from screen key
1. 0.3, 0.1, 0.03, 0.01, 0.003
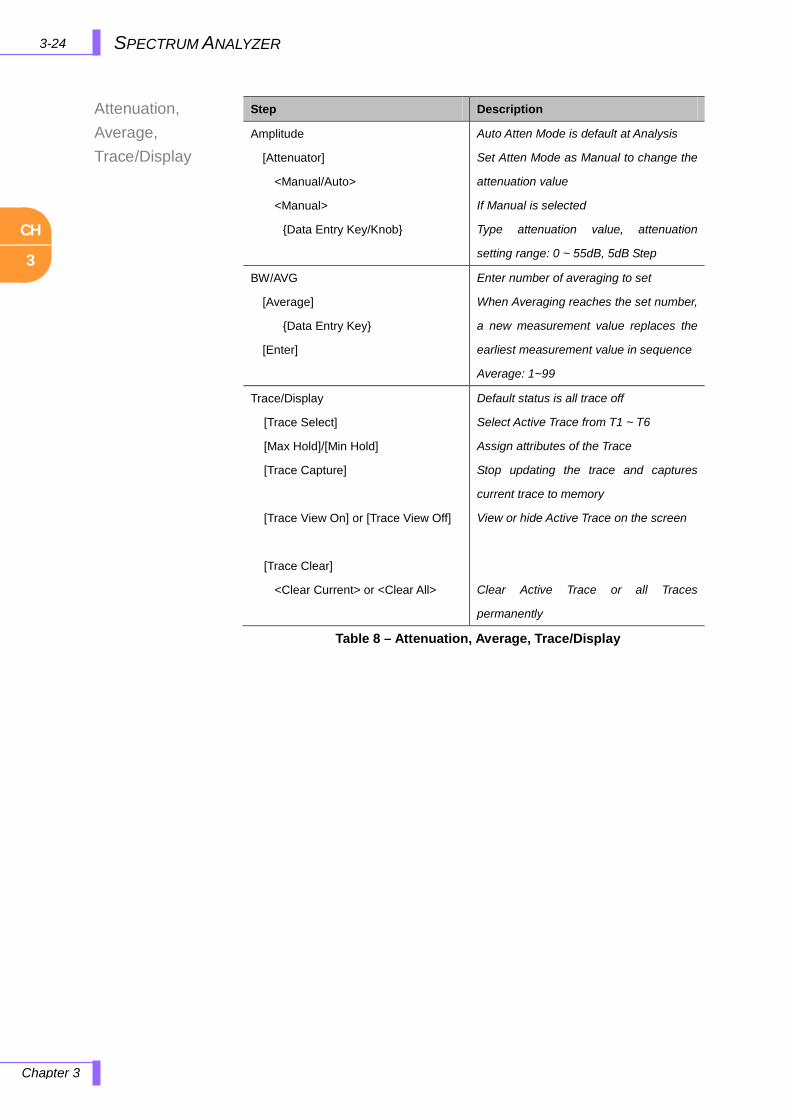
CH
3
3-24
Chapter 3
SPECTRUM ANALYZER
Attenuation, Average, Trace/Display
Table 8 – Attenuation, Average, Trace/Display
Step Description
Amplitude
[Attenuator]
<Manual/Auto>
<Manual>
Data Entry Key/Knob
Auto Atten Mode is default at Analysis
Set Atten Mode as Manual to change the
attenuation value
If Manual is selected
Type attenuation value, attenuation
setting range: 0 ~ 55dB, 5dB Step
BW/AVG
[Average]
Data Entry Key
[Enter]
Enter number of averaging to set
When Averaging reaches the set number,
a new measurement value replaces the
earliest measurement value in sequence
Average: 1~99
Trace/Display
[Trace Select]
[Max Hold]/[Min Hold]
[Trace Capture]
[Trace View On] or [Trace View Off]
[Trace Clear]
<Clear Current> or <Clear All>
Default status is all trace off
Select Active Trace from T1 ~ T6
Assign attributes of the Trace
Stop updating the trace and captures
current trace to memory
View or hide Active Trace on the screen
Clear Active Trace or all Traces
permanently
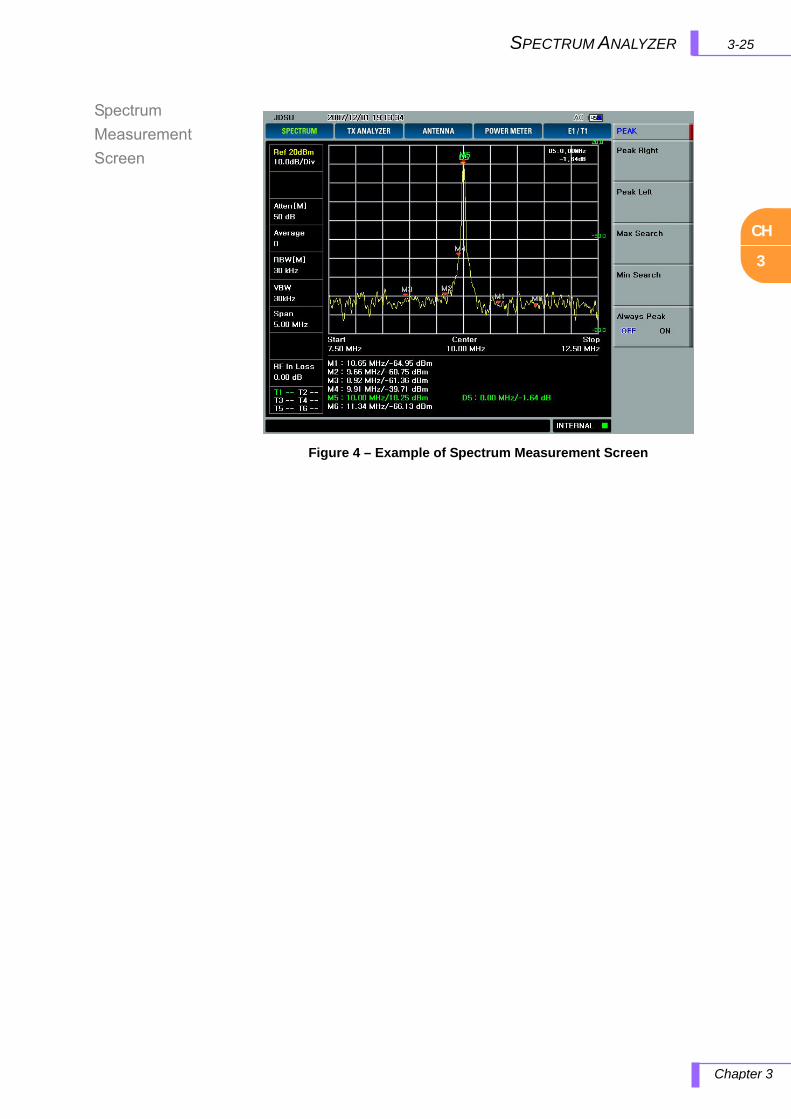
CH
3
3-25SPECTRUM ANALYZER
Chapter 3
Spectrum
Measurement
Screen
Figure 4 – Example of Spectrum Measurement Screen
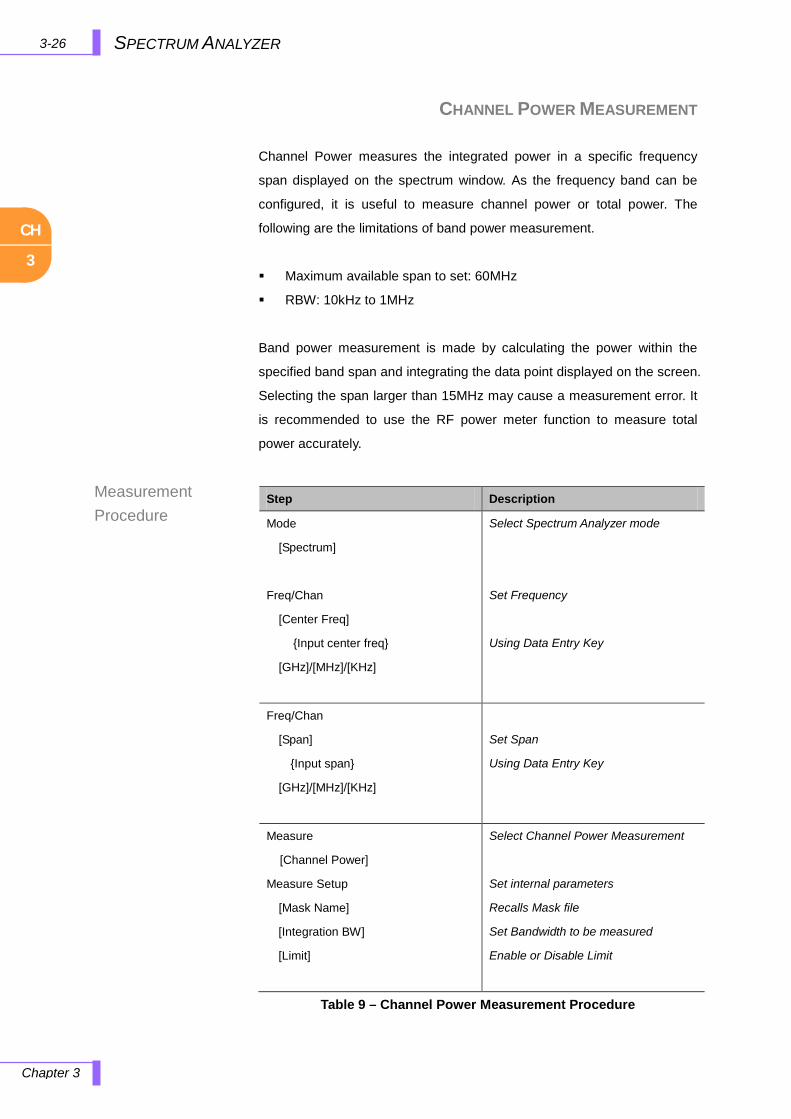
CH
3
3-26
Chapter 3
SPECTRUM ANALYZER
Measurement Procedure
CHANNEL POWER MEASUREMENT
Channel Power measures the integrated power in a specific frequency
span displayed on the spectrum window. As the frequency band can be
configured, it is useful to measure channel power or total power. The
following are the limitations of band power measurement.
Maximum available span to set: 60MHz
RBW: 10kHz to 1MHz
Band power measurement is made by calculating the power within the
specified band span and integrating the data point displayed on the screen.
Selecting the span larger than 15MHz may cause a measurement error. It
is recommended to use the RF power meter function to measure total
power accurately.
Measurement Procedure
Table 9 – Channel Power Measurement Procedure
Step Description
Mode
[Spectrum]
Freq/Chan
[Center Freq]
Input center freq
[GHz]/[MHz]/[KHz]
Select Spectrum Analyzer mode
Set Frequency
Using Data Entry Key
Freq/Chan
[Span]
Input span
[GHz]/[MHz]/[KHz]
Set Span
Using Data Entry Key
Measure
[Channel Power]
Measure Setup
[Mask Name]
[Integration BW]
[Limit]
Select Channel Power Measurement
Set internal parameters
Recalls Mask file
Set Bandwidth to be measured
Enable or Disable Limit

CH
3
3-27SPECTRUM ANALYZER
Chapter 3
Channel Power
Measurement
Screen
The following figure shows the measurement result of a Channel Power
for cdmaOne/cdma2000 Single FA; where the channel power span is set
to 1.23MHz (on the lower right corner of the screen).
Figure 5 – Example of Channel Power Measurement Screen
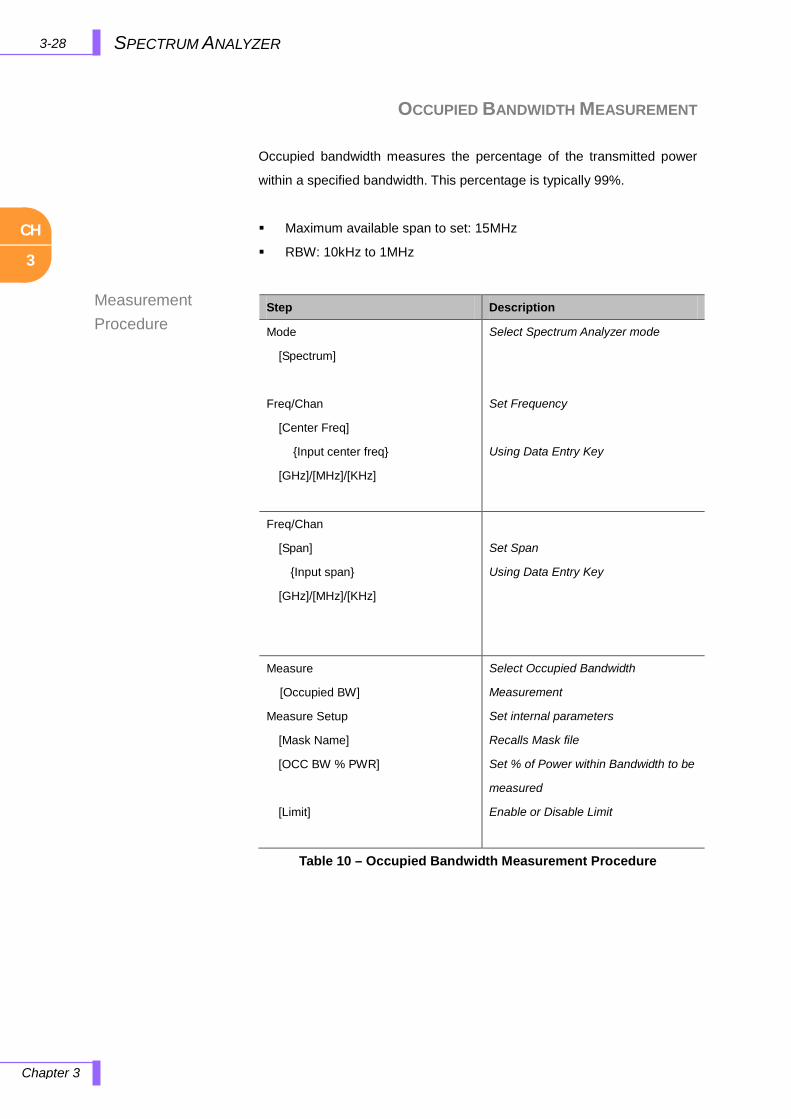
CH
3
3-28
Chapter 3
SPECTRUM ANALYZER
Measurement Procedure
OCCUPIED BANDWIDTH MEASUREMENT Measurement Procedure
Occupied bandwidth measures the percentage of the transmitted power
within a specified bandwidth. This percentage is typically 99%.
Maximum available span to set: 15MHz
RBW: 10kHz to 1MHz
Table 10 – Occupied Bandwidth Measurement Procedure
Step Description
Mode
[Spectrum]
Freq/Chan
[Center Freq]
Input center freq
[GHz]/[MHz]/[KHz]
Select Spectrum Analyzer mode
Set Frequency
Using Data Entry Key
Freq/Chan
[Span]
Input span
[GHz]/[MHz]/[KHz]
Set Span
Using Data Entry Key
Measure
[Occupied BW]
Measure Setup
[Mask Name]
[OCC BW % PWR]
[Limit]
Select Occupied Bandwidth
Measurement
Set internal parameters
Recalls Mask file
Set % of Power within Bandwidth to be
measured
Enable or Disable Limit
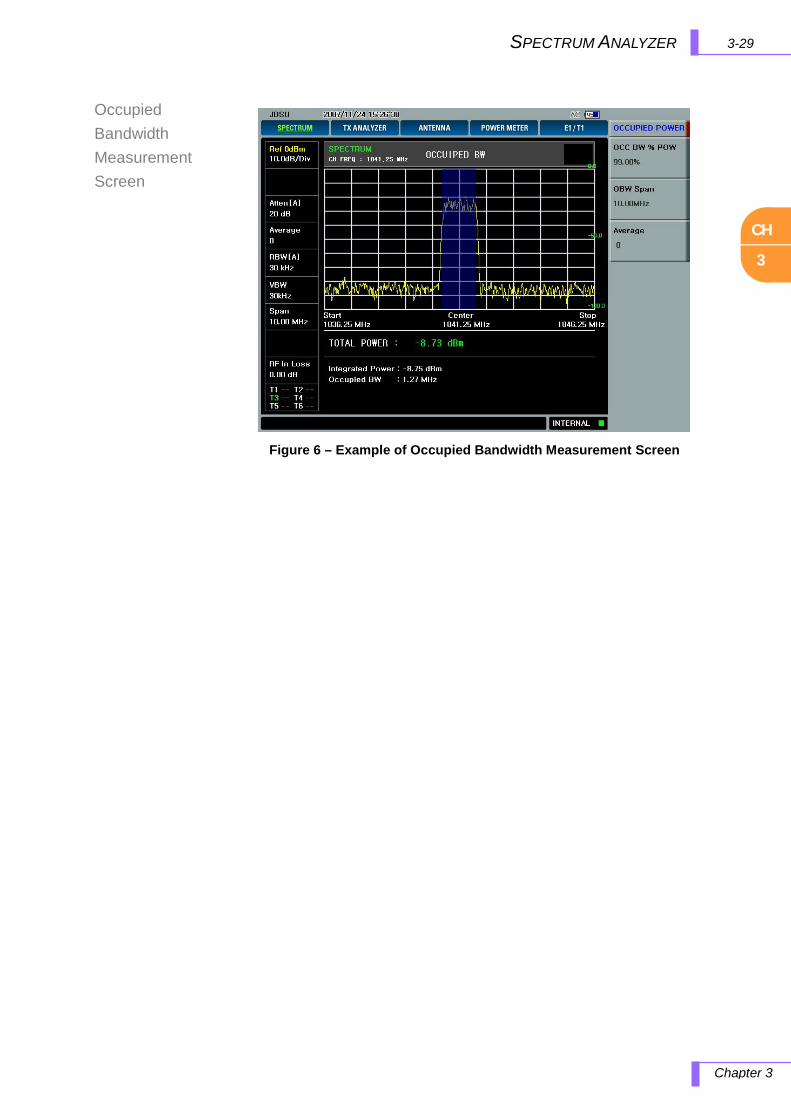
CH
3
3-29 SPECTRUM ANALYZER
Chapter 3
Occupied Bandwidth Measurement Screen
Figure 6 – Example of Occupied Bandwidth Measurement Screen
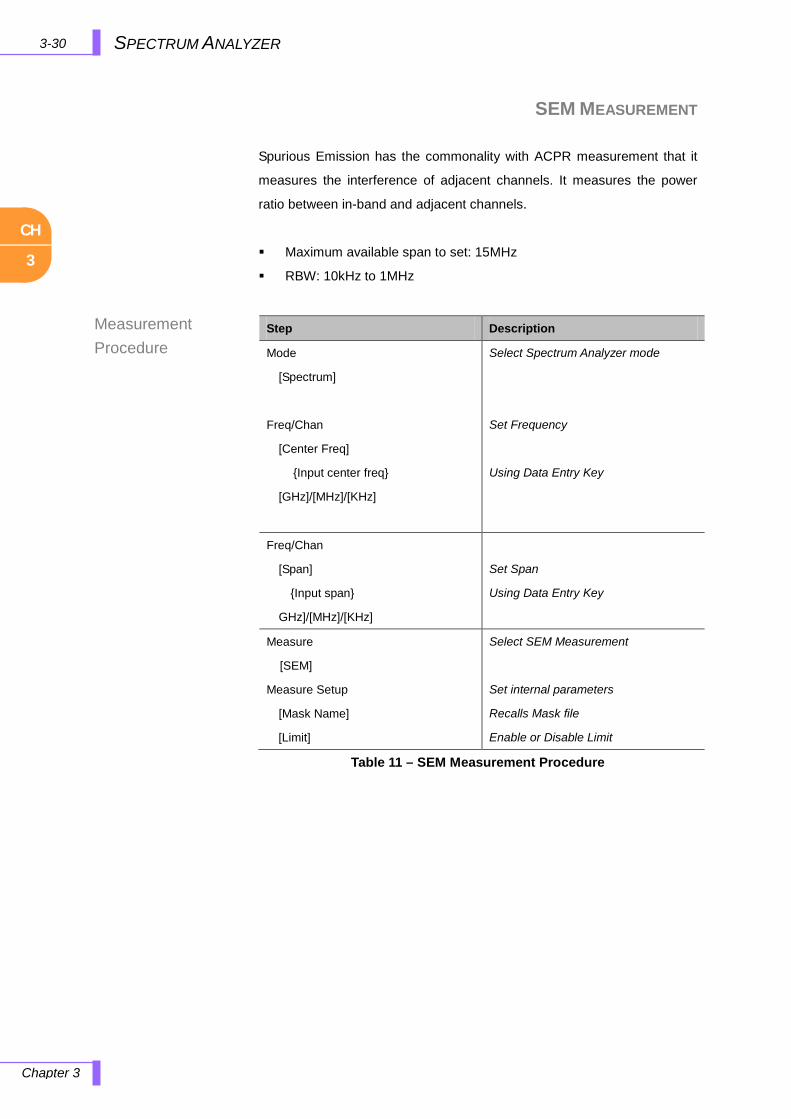
CH
3
3-30
Chapter 3
SPECTRUM ANALYZER
Measurement Procedure
SEM MEASUREMENT Measurement Procedure
Spurious Emission has the commonality with ACPR measurement that it
measures the interference of adjacent channels. It measures the power
ratio between in-band and adjacent channels.
Maximum available span to set: 15MHz
RBW: 10kHz to 1MHz
Table 11 – SEM Measurement Procedure
Step Description
Mode
[Spectrum]
Freq/Chan
[Center Freq]
Input center freq
[GHz]/[MHz]/[KHz]
Select Spectrum Analyzer mode
Set Frequency
Using Data Entry Key
Freq/Chan
[Span]
Input span
GHz]/[MHz]/[KHz]
Set Span
Using Data Entry Key
Measure
[SEM]
Measure Setup
[Mask Name]
[Limit]
Select SEM Measurement
Set internal parameters
Recalls Mask file
Enable or Disable Limit
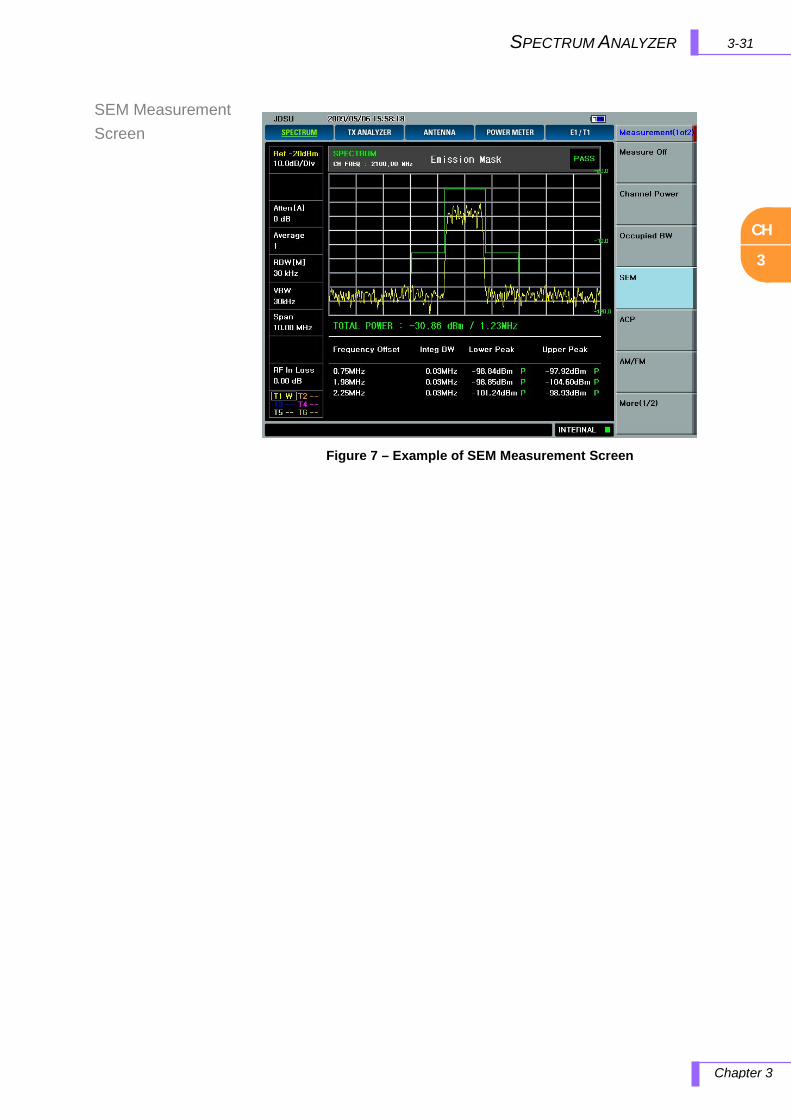
CH
3
3-31 SPECTRUM ANALYZER
Chapter 3
SEM Measurement Screen
Figure 7 – Example of SEM Measurement Screen
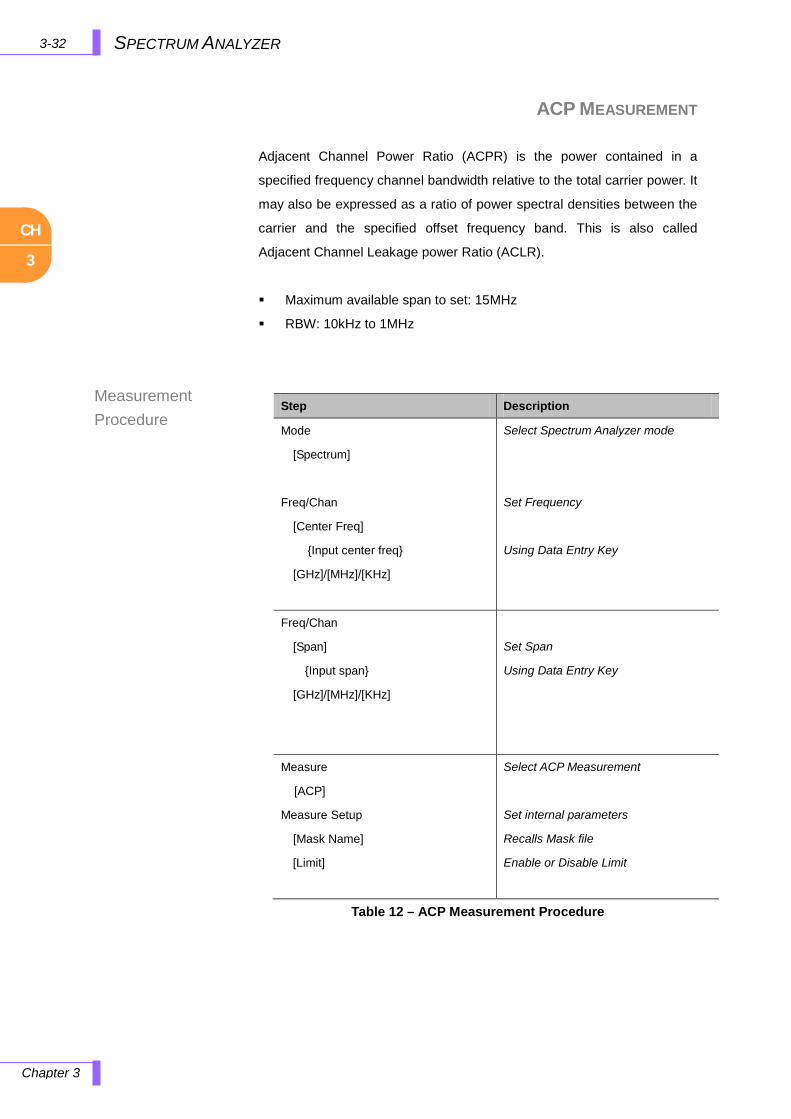
CH
3
3-32
Chapter 3
SPECTRUM ANALYZER
Measurement Procedure
ACP MEASUREMENT Measurement Procedure
Adjacent Channel Power Ratio (ACPR) is the power contained in a
specified frequency channel bandwidth relative to the total carrier power. It
may also be expressed as a ratio of power spectral densities between the
carrier and the specified offset frequency band. This is also called
Adjacent Channel Leakage power Ratio (ACLR).
Maximum available span to set: 15MHz
RBW: 10kHz to 1MHz
Table 12 – ACP Measurement Procedure
Step Description
Mode
[Spectrum]
Freq/Chan
[Center Freq]
Input center freq
[GHz]/[MHz]/[KHz]
Select Spectrum Analyzer mode
Set Frequency
Using Data Entry Key
Freq/Chan
[Span]
Input span
[GHz]/[MHz]/[KHz]
Set Span
Using Data Entry Key
Measure
[ACP]
Measure Setup
[Mask Name]
[Limit]
Select ACP Measurement
Set internal parameters
Recalls Mask file
Enable or Disable Limit

CH
3
3-33 SPECTRUM ANALYZER
Chapter 3
ACP Measurement Screen
Figure 8 – Example of ACP Measurement Screen
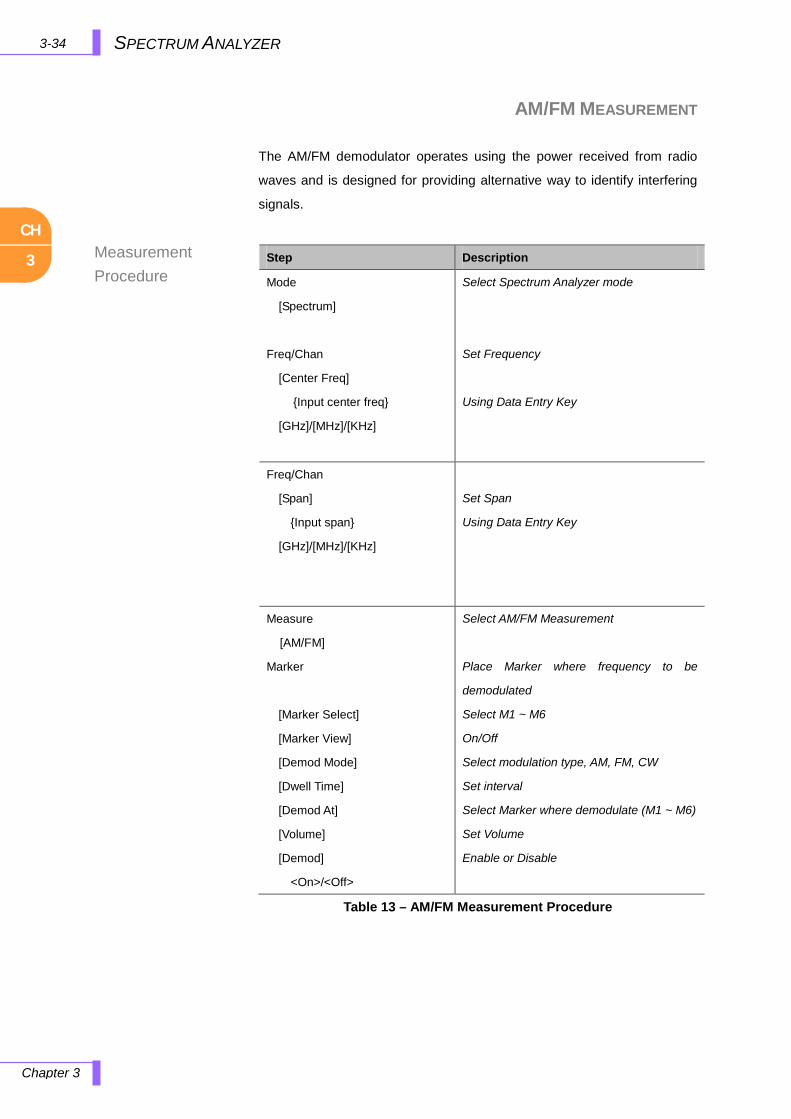
CH
3
3-34
Chapter 3
SPECTRUM ANALYZER
Measurement Procedure
AM/FM MEASUREMENT Measurement Procedure
The AM/FM demodulator operates using the power received from radio
waves and is designed for providing alternative way to identify interfering
signals.
Table 13 – AM/FM Measurement Procedure
Step Description
Mode
[Spectrum]
Freq/Chan
[Center Freq]
Input center freq
[GHz]/[MHz]/[KHz]
Select Spectrum Analyzer mode
Set Frequency
Using Data Entry Key
Freq/Chan
[Span]
Input span
[GHz]/[MHz]/[KHz]
Set Span
Using Data Entry Key
Measure
[AM/FM]
Marker
[Marker Select]
[Marker View]
[Demod Mode]
[Dwell Time]
[Demod At]
[Volume]
[Demod]
<On>/<Off>
Select AM/FM Measurement
Place Marker where frequency to be
demodulated
Select M1 ~ M6
On/Off
Select modulation type, AM, FM, CW
Set interval
Select Marker where demodulate (M1 ~ M6)
Set Volume
Enable or Disable
CH
4
4-1 INTERFERENCE ANALYZER
Chapter 4
4.0 INTERFERENCE ANALYZER
In this chapter
Interference Analyzer Introduction ................................................................................................................ 4-2
Spectrogram ......................................................................................................................................... 4-3 Received Signal Strength Indicator (RSSI) ........................................................................................... 4-3
How to Use Keys .......................................................................................................................................... 4-4 Soft Keys .............................................................................................................................................. 4-4 ESC ...................................................................................................................................................... 4-4 Freq/Chan ............................................................................................................................................. 4-4 Amplitude .............................................................................................................................................. 4-5 Trace/Display ........................................................................................................................................ 4-7 BW/AVG................................................................................................................................................ 4-7 Marker .................................................................................................................................................. 4-8 Peak Search ......................................................................................................................................... 4-9 Measure ................................................................................................................................................ 4-9 Measure Setup ..................................................................................................................................... 4-9 Display Overview ................................................................................................................................ 4-10
Cable Connection ....................................................................................................................................... 4-12 Making Measurements ............................................................................................................................... 4-13
Spectrogram ....................................................................................................................................... 4-14 RSSI ................................................................................................................................................... 4-15
CH
4
4-2 INTERFERENCE ANALYZER
Chapter 4
INTERFERENCE ANALYZER INTRODUCTION
Interference is becoming more prevalent in the wireless community with
the increasing number of transmitters coming on the air. Wireless service
providers have traditionally used spectrum analyzers to monitor service
channels, frequencies, adjacent spectrum, and to locate sources of
interference. Unfortunately, a spectrum analyzer can only show the
interfering signal to the user, who must then determine the source of the
interference. To solve interference problems, the user must understand the
RF environment, know which transmitters are operating nearby, and
identify any new or unlicensed emitters.
The complete hardware and software solution of the JD7105A is more
efficient and economical than most bench-top spectrum analyzers alone.
The JD7105A is a hand-held system, highly functional, and requires no
software development.
Users can record and view multiple frequency bands on a single JD7105A
to quickly resolve interference issues in a few steps. The system also
performs unattended data logging for hours, days, or even weeks for later
analysis, further reducing time spent in the field. Users can also save time
and money by remotely monitoring test locations and changing test
scenarios over an Ethernet connection, eliminating the need to travel to
and from test locations.
With the logging capability, users can collect data and essentially perform
unattended spectrum monitoring, capturing and storing the spectral data
to perform other tasks instead of spending time watching a display. By
logging data, the operator can see not only the event of interest, but also
the spectral data before and after the event.
Using the JD7105A is an excellent hand-held solution for customers who
need a spectrum monitoring solution but do not want to spend the time
developing their own code.
CH
4
4-3 INTERFERENCE ANALYZER
Chapter 4
SPECTROGRAM
RECEIVED SIGNAL STRENGTH INDICATOR (RSSI)
The Spectrogram mode is useful for tracking down the source of an
interfering signal. This measurement is done at user defined frequency
range. The power at a frequency (in dBm) is displayed along with a
spectrogram. This mode is especially useful when attempting to locate
an emitter using a directional antenna.
If you are using a directional antenna to receive the signal, you will see a
change in the amplitude of the tracked signal as you change the direction
of the antenna, and see a change in the Spectrogram color. The source of
the signal is located in the direction that results in the highest signal
strength.
A spectrogram is a three dimensional display.
The horizontal line or X-Axis of the spectrogram is frequency
The vertical line or Y-axis is time
And the color identification (spectrogram) indicates power level of the
tracked signal. As the signal strength increases, the color on the
spectrogram will change accordingly.
The RSSI - Received Signal Strength Indicator, is useful for observing
power levels of different frequencies over time.

CH
4
4-4 INTERFERENCE ANALYZER
Chapter 4
SOFT KEYS ESC FREQ/CHAN
HOW TO USE KEYS
This section provides the key aspects of the instrument’s keys in the
interference analyzer mode.
Soft Keys
Soft keys are used to activate a specific function, invoke other screen keys,
or to input specific value units. Selecting soft keys will highlight its caption
to show its selection. In case the soft keys are in the same layer but
cannot be displayed, the “More” or “” key on the bottom corner will be
displayed indicating the existence of additional soft keys.
ESC
The ESC key is used to move to the previous Menu without changing the
current setup.
Freq/Chan
Sets the frequency band with either standard or custom frequency bands.
CENTER FREQUENCY: Changes the center frequency setup in the
spectrum measurement. Values can be entered with the Data Entry key,
the Knob or the arrow keys. When using the Data Entry key, the input is
completed by selecting the soft key with the corresponding value unit.
When using the Knob or the arrow keys, the center frequency changes in
predefined frequency steps. The frequency steps can be configured
selecting the CF Step Menu.
SPAN: This key is used to set the frequency range over which the
instrument will sweep.
START FREQUENCY: Changes the Start frequency in the spectrum
measurement. Values can be entered with the Data Entry key, the knob or
the arrow keys. When using the Data Entry key, the input is completed by
selecting the soft key with the corresponding value unit.
STOP FREQUENCY: Changes the Stop frequency in the spectrum
measurement. Values can be entered with the Data Entry key, the knob or
the arrow keys. When the Data Entry key is used the input is completed by
selecting the soft key with the corresponding value unit.
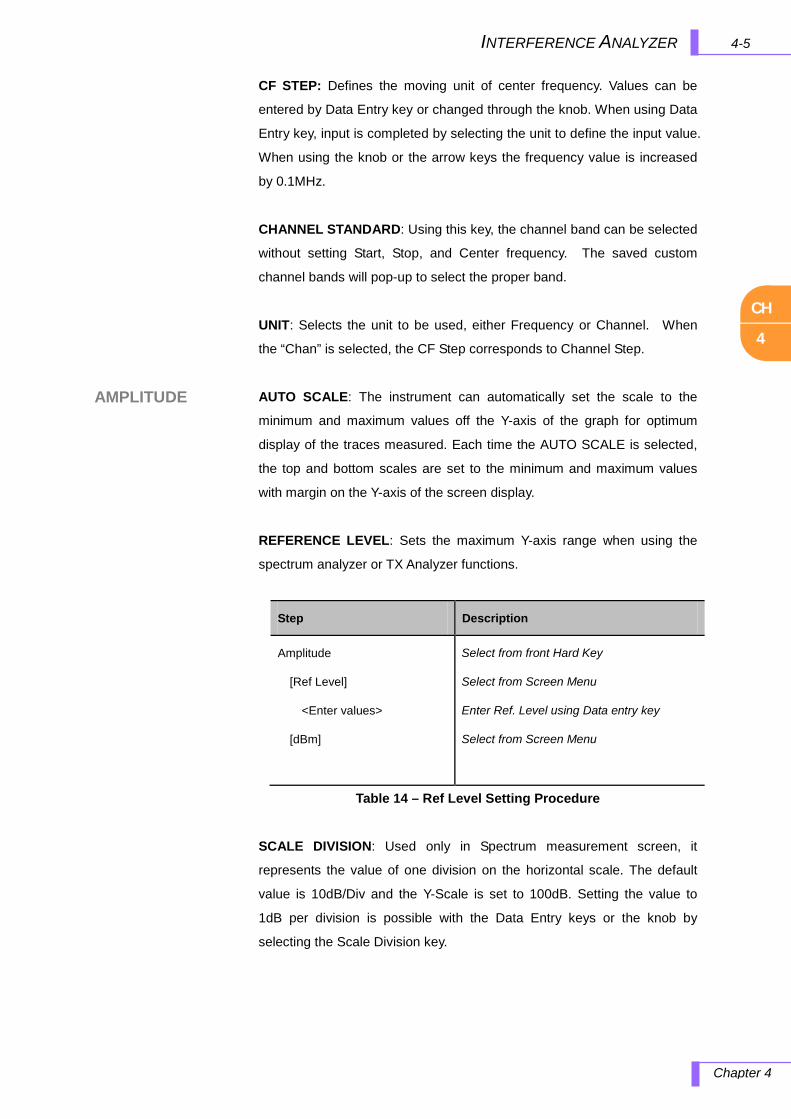
CH
4
4-5 INTERFERENCE ANALYZER
Chapter 4
AMPLITUDE
CF STEP: Defines the moving unit of center frequency. Values can be
entered by Data Entry key or changed through the knob. When using Data
Entry key, input is completed by selecting the unit to define the input value.
When using the knob or the arrow keys the frequency value is increased
by 0.1MHz.
CHANNEL STANDARD: Using this key, the channel band can be selected
without setting Start, Stop, and Center frequency. The saved custom
channel bands will pop-up to select the proper band.
UNIT: Selects the unit to be used, either Frequency or Channel. When
the “Chan” is selected, the CF Step corresponds to Channel Step.
AUTO SCALE: The instrument can automatically set the scale to the
minimum and maximum values off the Y-axis of the graph for optimum
display of the traces measured. Each time the AUTO SCALE is selected,
the top and bottom scales are set to the minimum and maximum values
with margin on the Y-axis of the screen display.
REFERENCE LEVEL: Sets the maximum Y-axis range when using the
spectrum analyzer or TX Analyzer functions.
Step Description
Amplitude
[Ref Level]
<Enter values>
[dBm]
Select from front Hard Key
Select from Screen Menu
Enter Ref. Level using Data entry key
Select from Screen Menu
Table 14 – Ref Level Setting Procedure
SCALE DIVISION: Used only in Spectrum measurement screen, it
represents the value of one division on the horizontal scale. The default
value is 10dB/Div and the Y-Scale is set to 100dB. Setting the value to
1dB per division is possible with the Data Entry keys or the knob by
selecting the Scale Division key.
CH
4
4-6 INTERFERENCE ANALYZER
Chapter 4
ATTENUATOR
AUTO: Input Attenuator’s value is automatically set depending on the
reference level. This is the default operation mode, so it is recommended
to use this mode unless a special measurement condition is needed.
MANUAL: Sets the In-Port attenuator’s value. The reference level
changes according to the change of the attenuator’s value, but the
attenuator’s value doesn’t change when the reference level is changed.
If the input signal level is lower than +30dBm or higher than the
allowable input limit per input attenuator’s value set by the user
(total input power must be lower than 0dBm when input
attenuation setting is +20dB), A “Final IF Overload” message will be
displayed on the upper side of the screen indicating that the input
attenuation’s value must be increased. When the instrument is exposed to
an over power condition for a long time, its performance may be degraded.
When the input power level exceeds +35dBm, an “Over Power
Alarm” message will be displayed on the screen and the
JD7105A disconnects its internal RF Input path and all the
measurements are stopped. In this case, disconnect the external input
signal and wait until the JD7105A measures the input signal level again
and the “Over Power Alarm” message is not displayed.
PRE AMP: Enables/Disables the internal pre-amplifier. Preamplifier is to
amplify a low-level input signal.
RF IN LOSS: Sets an external offset value. An offset consists of a cable
offset and a user offset, and the measurement result shows the value
reflecting both offset values. Even if an offset is set, the reference level is
automatically adjusted to avoid the waveform fitting out of the screen. An
offset value set in Spectrum mode have precedence over the offset value
set in Analysis Mode.
When an external offset value is set at 40dB in Spectrum Mode,
measurement result compensates 40dB at both Spectrum mode and
!
!
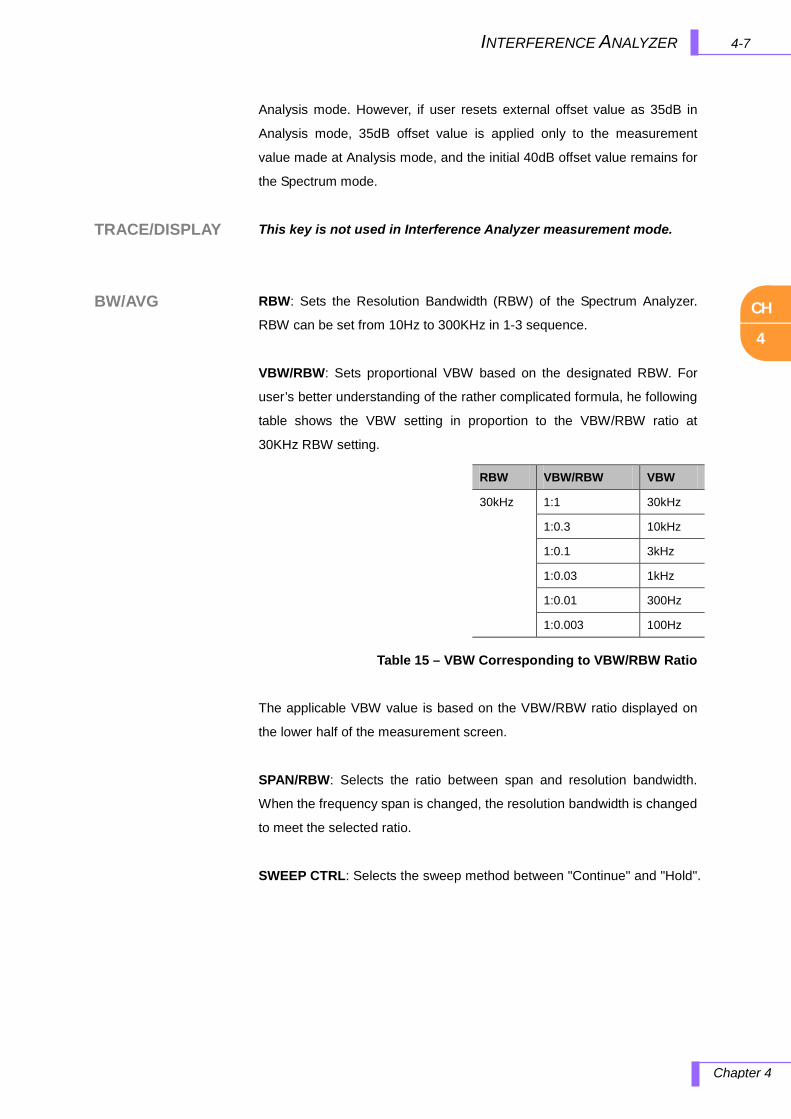
CH
4
4-7 INTERFERENCE ANALYZER
Chapter 4
TRACE/DISPLAY
BW/AVG
Analysis mode. However, if user resets external offset value as 35dB in
Analysis mode, 35dB offset value is applied only to the measurement
value made at Analysis mode, and the initial 40dB offset value remains for
the Spectrum mode.
This key is not used in Interference Analyzer measurement mode.
RBW: Sets the Resolution Bandwidth (RBW) of the Spectrum Analyzer.
RBW can be set from 10Hz to 300KHz in 1-3 sequence.
VBW/RBW: Sets proportional VBW based on the designated RBW. For
user’s better understanding of the rather complicated formula, he following
table shows the VBW setting in proportion to the VBW/RBW ratio at
30KHz RBW setting.
Table 15 – VBW Corresponding to VBW/RBW Ratio
The applicable VBW value is based on the VBW/RBW ratio displayed on
the lower half of the measurement screen.
SPAN/RBW: Selects the ratio between span and resolution bandwidth.
When the frequency span is changed, the resolution bandwidth is changed
to meet the selected ratio.
SWEEP CTRL: Selects the sweep method between "Continue" and "Hold".
RBW VBW/RBW VBW
30kHz 1:1 30kHz
1:0.3 10kHz
1:0.1 3kHz
1:0.03 1kHz
1:0.01 300Hz
1:0.003 100Hz
CH
4
4-8 INTERFERENCE ANALYZER
Chapter 4
MARKER
Marker is used to get the information about a specific trace. A total of six
Markers can be set and each marker can be used independently. The X
and Y coordinates of the trace are displayed when the maker is placed on
any position of the trace. As the position displaying Marker’s X and Y
coordinates may be slightly different for each measurement mode, refer to
the description of each measurement after this chapter.
MARKER SELECT: Selects an active marker which its position can be
changed with the knob or the arrow keys. The assigned number of active
markers is displayed on the Marker Select screen menu and the marker’s
number is also displayed next to the marker on the trace when the Marker
View On is selected.
MARKER VIEW: Hides or displays the selected marker on the screen. In
the same measurement mode markers appear at the previous positions
when the Marker View is turned off and on. If a measurement mode has
been changed, markers are not restored to their previous positions.
MARKER TYPE:
Selects the type of Marker to be displayed, Normal marker provide the
reading of its position and Delta marker provides the differences between
two sets of marker points.
NORMAL: Used to place a marker, along with the marker number,
1-6, on the trace.
DELTA: Delta Marker is associated with a Normal Marker, so a
Normal Maker must be set before a Delta marker is set. When a
Delta Marker is set, the position set by the Delta Marker becomes
the reference position of the Normal Marker and the Maker’s X
and Y values displays the difference compared with Delta Marker.
MARKER TABLE:
Displays a table that contains all activated Marker information on the
bottom side of the screen, when the marker table is activated all X and Y
coordinates of the activated markers are displayed. Depending on the
selection in Draw Type, the maximum number of markers on the table is 6.
CH
4
4-9 INTERFERENCE ANALYZER
Chapter 4
Marker (Cont’d)
PEAK SEARCH
MEASURE
MEASURE SETUP
MARKER CLEAR ALL: Turns all markers off the screen. Markers are
redisplayed on the previous position if markers are turned back on. If a
measurement mode is changed, current settings are not restored.
MARKER EDIT: Sets the marker position manually. A pop-up window
appears for users to set the frequency by entering numeric values and the
marker position is moved to the setting frequency.
MARKER :
MARKERCF: Marker’s X coordinate is set as the Center
frequency of the spectrum.
MARKERSTART: Marker’s X coordinate is set as the Start
frequency of the spectrum.
MARKERSTOP: Marker’s X coordinate is set as the Stop
frequency of the spectrum.
Each time the peak search key is pressed a marker is displayed on the
highest peak of the Trace.
PEAK RIGHT: Moves the marker to the next highest peak at the right of its
current position.
PEAK LEFT: Moves the marker to the next highest peak at the left of its
current position.
MAX SEARCH: Moves the marker to the highest peak of the trace.
MIN SEARCH: Moves the marker to the lowest peak of the trace.
ALWAYS PEAK: Moves the marker automatically to the highest peak of
the trace each time the trace is updated.
The Measure key selects “Spectrogram & RSSI” modes.
When “Interference Analyzer” is selected, then Measure Setup provides
the following measurement parameters:
SPECTROGRAM MEASUREMENTS:
Restart: Restarts the measurement.

CH
4
4-10 INTERFERENCE ANALYZER
Chapter 4
DISPLAY
OVERVIEW
Time Interval: Sets the time interval.
Auto Save: Saves the measurement data automatically to external
memory, USB.
Time Cursor: Sets the time cursor indicator (1~400).
RSSI MEASUREMENTS:
Restart: Restarts the measurement.
Alarm: Sets an alarm for up to 6 different frequencies.
Set Mask Value: Sets the mask value.
Auto Save: Saves the measurement data automatically to external
memory, USB.
① Reference Level, Scale Division of the Spectrum Window’s Y Scale
information
② Input Attenuation Information
[A]: Auto mode, [M]: Manual mode, [P]: Pre-amp On
③ Number of Averaging
④ Spectrum Window’s X Scale information, RBW, VBW setting value
⑤ Span Setting Information
⑥ Color identification (spectrogram) indicates power level of the
tracked signal
⑦ Restart measurement, by pressing Restart screen button, the
previous measurement will be disappear and restarted.
⑧ Set Time Interval, sets the interval of the measurement
Figure 9 – Overview of Interference Analyzer Display (Spectrogram)

CH
4
4-11INTERFERENCE ANALYZER
Chapter 4
⑨ Auto Save, saves the measurement data into data file
⑩ Set Time Cursor Indication, there are 400 measurement traces in a
single screen, user can check the previous measurement history by
setting Time Cursor
① Reference Level, Scale Division of the Spectrum Window’s Y Scale
information
② Input Attenuation Information
[A]: Auto mode, [M]: Manual mode, [P]: Pre-amp On
③ Spectrum Window’s X Scale information, RBW, VBW setting value
④ Span Setting Information
⑤ Alarm Mask Level Setting Information
⑥ Alarm Count Information, shows the number of alarms exceeded
user mask
⑦ Restart measurement, by pressing Restart screen button, the
previous measurement will be disappear and restarted.
⑧ Set Alarm (Marker1 ~ Marker6), user can set alarms individually up
to 6 different markers
⑨ Set Mask Level, sets the level of alarm mask
⑩ Auto Save, saves the measurement data into data file
1
2
3
4
5
6
7
8
9
10
Figure 10 – Overview of Interference Analyzer Display (RSSI)

CH
4
4-12 INTERFERENCE ANALYZER
Chapter 4
Connection
CABLE CONNECTION
The maximum power for the RF-In port is 30dBm (1 Watt). If
the input signal level to be measured is greater than 30dBm,
use a High Power Attenuator to prevent damage when you
directly connect the signal to the instrument. Or, connect a signal from the
coupling port of a directional coupler.
Figure 11 – Connection for Interference Analyzer
!
CH
4
4-13 INTERFERENCE ANALYZER
Chapter 4
MAKING MEASUREMENTS
The key measurement parameters of an interference analyzer are:
Spectrogram
RSSI (Received Signal Strength Indicator)
Once it has been identified a potential interfering signal using the
Spectrum Analyzer, you can use the interference analyzer function further
monitor the signal.
The typical steps to locate interference signals using the JD7105A Base
Station Analyzer are as follows:
1. Select Interference Analyzer mode.
2. Look at the spectrum on the bottom of the spectrogram display to
locate the suspected interfering signal.
3. Set a marker on the trace at the frequency of the interfering signal.
Try to use different markers at the different frequencies (you can
use up to 6 markers on 6 different frequencies).
4. Look at the assignments for these frequencies readout at the
bottom of the spectrum display.
5. Set time interval, which the spectrogram will be saved.
6. Select the RSSI mode to track in more detail the signals identified
with the markers (6 different frequency components are available
in one display). This will provide the power components on
those set frequencies over time.
The typical operating procedure to identify interference signal is as
follows:

CH
4
4-14 INTERFERENCE ANALYZER
Chapter 4
SPECTROGRAM
Table 16 – Interference Analysis in Spectrogram View
Step Description
Connect Antenna Connect antenna to RF In port
Mode
[Interference Analyzer]
[Spectrogram]
Select Interference Analyzer mode
Select spectrogram view
Freq/Chan
[Start Freq]
[Stop Freq]
[Center Freq]
or
[Center Freq]
[Span]
or
Select [Channel Standard]
Set Frequency
Amplitude
[Reference Level]
[Scale Division]
[Auto Atten]
Set Atten./Ref. Level/Scale
To optimize S/N, change Atten mode
to manual and look for optimization
value by changing Atten in 5dB step
Marker
[Marker Select]
[Marker View]
Set Marker to either carrier frequency
or the interfering signal(M1 ~ M6)
On/Off
Absolute or relative coordinates of all
Maker are displayed on spectrum
waveform screen
Measure Setup
[Time Interval]
Enter value
[Auto Save]
<On/Off>
Set the time interval
Set measurement interval
Set Auto save
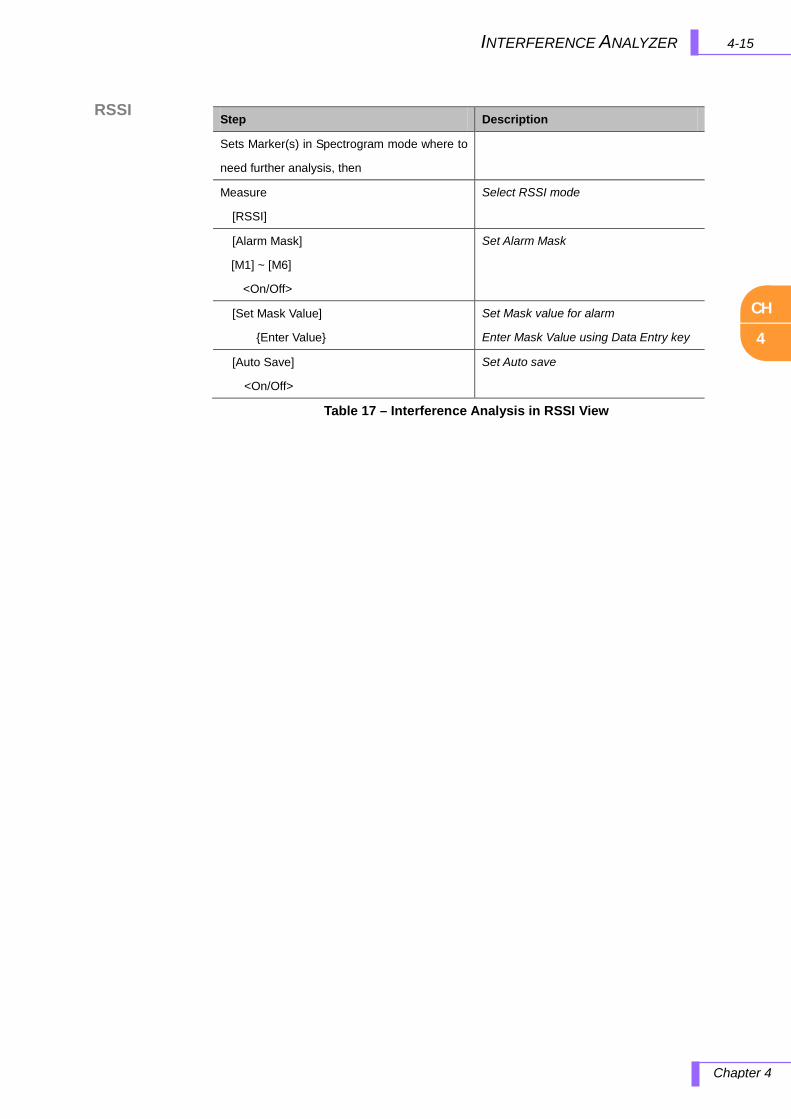
CH
4
4-15 INTERFERENCE ANALYZER
Chapter 4
RSSI
Table 17 – Interference Analysis in RSSI View
Step Description
Sets Marker(s) in Spectrogram mode where to
need further analysis, then
Measure
[RSSI]
Select RSSI mode
[Alarm Mask]
[M1] ~ [M6]
<On/Off>
Set Alarm Mask
[Set Mask Value]
Enter Value
Set Mask value for alarm
Enter Mask Value using Data Entry key
[Auto Save]
<On/Off>
Set Auto save
CH
5
5-1 CHANNEL SCANNER
Chapter 5
5.0 CHANNEL SCANNER
In this chapter
Channel Scanner Introduction ...................................................................................................................... 5-2 How to Use Keys .......................................................................................................................................... 5-3
Soft Keys .............................................................................................................................................. 5-3 ESC ...................................................................................................................................................... 5-3 Freq/Chan ............................................................................................................................................. 5-3 Trace/Display ........................................................................................................................................ 5-4 BW/AVG................................................................................................................................................ 5-4 Marker .................................................................................................................................................. 5-5 Peak Search ......................................................................................................................................... 5-5 Measure ................................................................................................................................................ 5-5 Measure setup ...................................................................................................................................... 5-5 Display Overview (General Channel Scanner ) .................................................................................... 5-6 Display Overview (GSM Channel Scanner) .......................................................................................... 5-7
Cable Connection ......................................................................................................................................... 5-8 Making Measurements ................................................................................................................................. 5-9
General Channel Scanner .................................................................................................................. 5-10 GSM Channel scanner ....................................................................................................................... 5-10
CH
5
5-2 CHANNEL SCANNER
Chapter 5
CHANNEL SCANNER INTRODUCTION
A Channel Scanner is a radio receiver that can automatically tune, or scan,
two or more discrete frequencies & multi-channels, indicating when it finds
a signal on one of them and then continuing scanning when that frequency
goes silent.
There are two different types of channel scanner functionalities in the
JD7105A, general channel scanner and GSM channel scanner. The
general channel scanner can measure up to 20 channels in GSM, CDMA
or WCDMA networks. Using existing format-based or custom parameters,
the user will be able to easily verify improper multi-channel power levels.
The GSM channel scanner has the function to display channel power and
related information up to 128 GSM down link signals. This channel
scanner can quickly identifies improper power levels that affect network
performance; this can be done either over the air or directly connected to
the cell site.
CH
5
5-3 CHANNEL SCANNER
Chapter 5
SOFT KEYS ESC
FREQ/CHAN
HOW TO USE KEYS
This section provides the key aspects of the instrument’s keys in the
General Channel Scanner mode.
Soft Keys
Soft keys are used to activate a specific function, invoke other screen keys,
or to input specific value units. Selecting soft keys will highlight its caption
to show its selection. In case the soft keys are in the same layer but
cannot be displayed, the “More” or “” key on the bottom corner will
display another screen menu.
ESC
The ESC key is used to move to the previous Menu without changing the
current setup.
Freq/Chan
For General Channel Scanner Mode, the following soft keys are available:
SCAN MODE: Changes the scan modes.
List: Calls up the list stored in the instrument.
Range: Sets frequency range to be scanned.
START: Changes the Start frequency in the channel scanner. Values can
be entered with the Data Entry key, the knob or the arrow keys. When
using the Data Entry key, the input is completed by selecting the soft key
with the corresponding value unit.
STEP SIZE: Sets frequency step incremental size.
INTEGRATED BANDWIDTH: Sets bandwidth to be measured.
CHANNEL STANDARD: Using this key, the channel band can be selected
without setting Start, Stop, and Center frequencies. The saved custom
channel bands will pop-up to select the proper band.
CS UNIT: Selects the unit of either the Frequency or the Channel. When
the “Chan” is selected, the CF Step corresponds to Channel Step.

CH
5
5-4 CHANNEL SCANNER
Chapter 5
TRACE/DISPLAY
BW/AVG
For GSM Channel Scanner Mode, the following soft keys are available:
SCAN MODE: Changes the scan modes.
Range: Sets frequency range to be scanned.
START FREQ: Changes the Start frequency in the channel scanner.
Values can be entered with the Data Entry key, the knob or the arrow keys.
When using the Data Entry key, the input is completed by selecting the
soft key with the corresponding value unit.
NUMBER OF CHANNELS: Sets the number of channel to be scanned.
CHANNEL STANDARD: Using this key, the channel band can be selected
without setting Start, Stop, and Center frequencies. The saved custom
channel bands will pop-up to select the proper band.
UNIT: Selects the unit to be used, either Frequency or Channel. When
the “Chan” is selected, the CF Step corresponds to Channel Step.
This key is not used in General Channel Scanner mode.
When the instrument is in GSM Channel Scanner Mode, a
Trace/Display key is used as below.
ZOOM START FREQ: Selects the start frequency of the zoomed screen.
For General Channel Scanner Mode, the following soft keys are available:
AVERAGE: Sets the number of measurements to be averaged for the
trace presentation. A maximum of 99 times of averaging can be set.
SWEEP CTRL: Selects the sweep method between "Continue" and
"Hold".
For GSM Channel Scanner Mode, the following soft keys are available:
SWEEP CTRL: Selects the sweep method between "Continue" and
"Hold".
CH
5
5-5 CHANNEL SCANNER
Chapter 5
MARKER
PEAK SEARCH
MEASURE
MEASURE SETUP
This key is not used in General or GSM Channel Scanner modes.
This key is not used in General or GSM Channel Scanner modes.
This key is not used in Channel Scanner mode.
When the instrument is in GSM Channel Scanner Mode, a Measure
key is used as below.
MEASURE ON/OFF: Turns the measurements on or off.
This key is not used in Genera or GSM Channel Scanner modes.
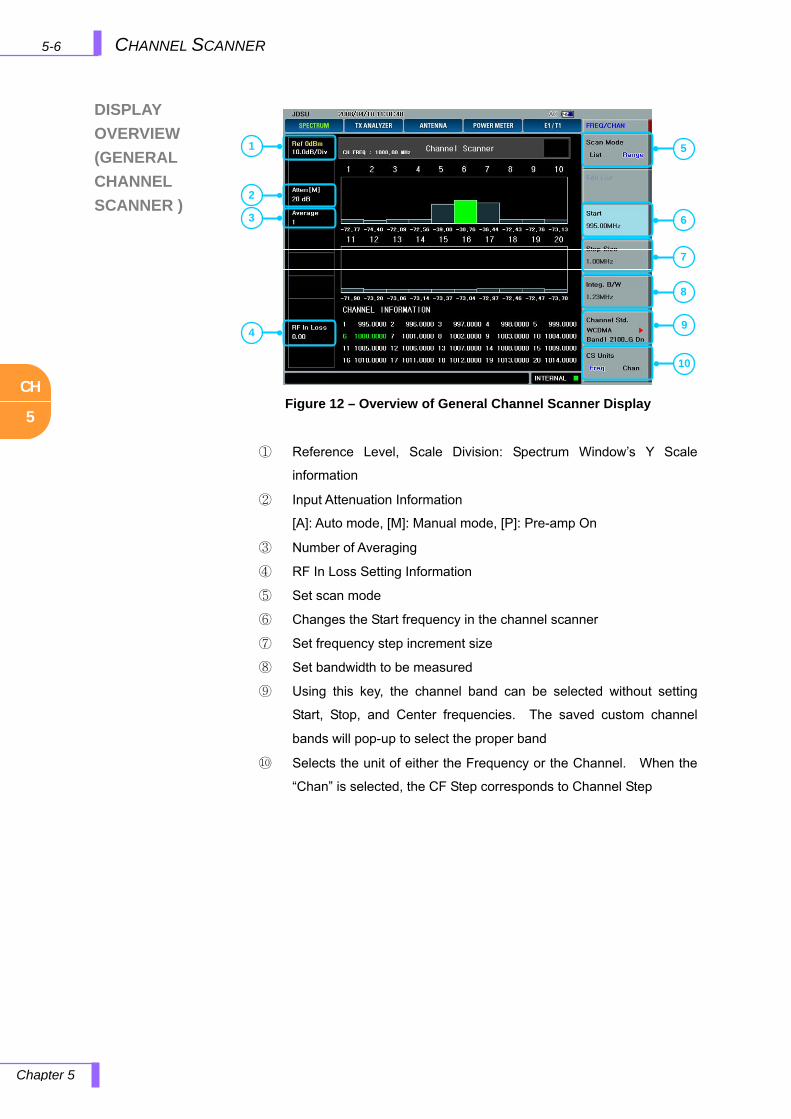
CH
5
5-6 CHANNEL SCANNER
Chapter 5
DISPLAY
OVERVIEW
(GENERAL
CHANNEL
SCANNER )
① Reference Level, Scale Division: Spectrum Window’s Y Scale
information
② Input Attenuation Information
[A]: Auto mode, [M]: Manual mode, [P]: Pre-amp On
③ Number of Averaging
④ RF In Loss Setting Information
⑤ Set scan mode
⑥ Changes the Start frequency in the channel scanner
⑦ Set frequency step increment size
⑧ Set bandwidth to be measured
⑨ Using this key, the channel band can be selected without setting
Start, Stop, and Center frequencies. The saved custom channel
bands will pop-up to select the proper band
⑩ Selects the unit of either the Frequency or the Channel. When the
“Chan” is selected, the CF Step corresponds to Channel Step
1
2
3
4
5
9
6
7
8
10
Figure 12 – Overview of General Channel Scanner Display
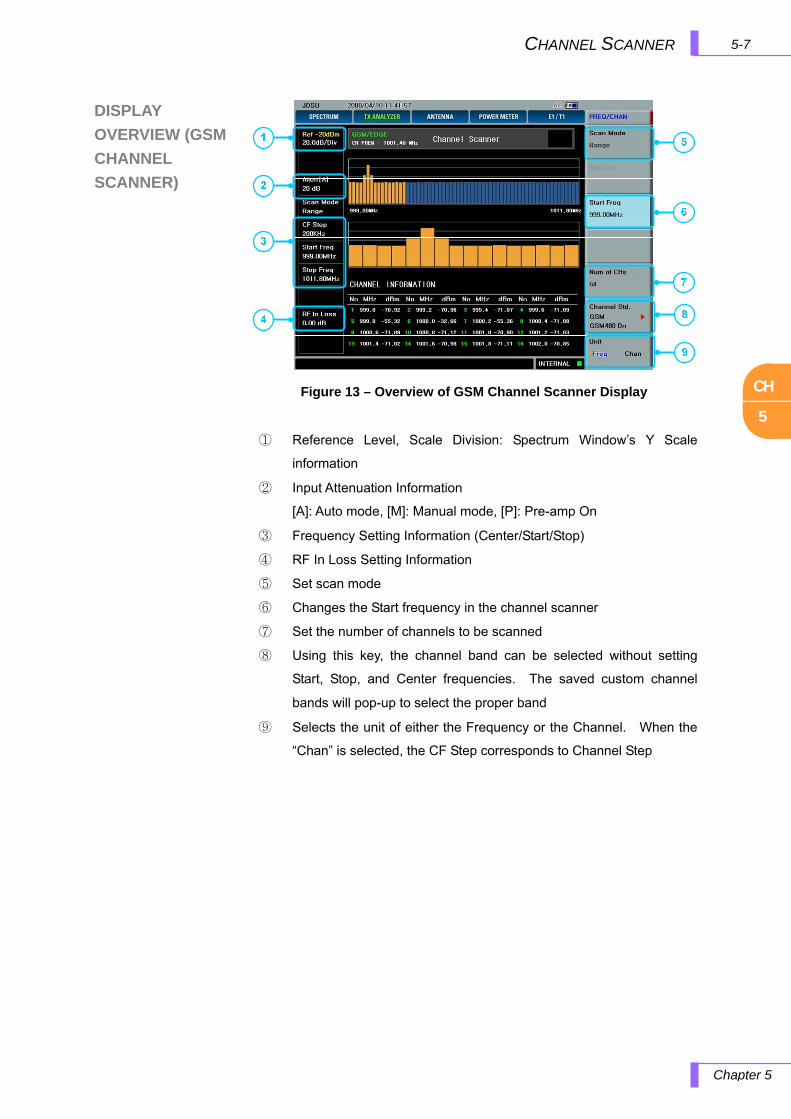
CH
5
5-7CHANNEL SCANNER
Chapter 5
DISPLAY
OVERVIEW (GSM
CHANNEL
SCANNER)
① Reference Level, Scale Division: Spectrum Window’s Y Scale
information
② Input Attenuation Information
[A]: Auto mode, [M]: Manual mode, [P]: Pre-amp On
③ Frequency Setting Information (Center/Start/Stop)
④ RF In Loss Setting Information
⑤ Set scan mode
⑥ Changes the Start frequency in the channel scanner
⑦ Set the number of channels to be scanned
⑧ Using this key, the channel band can be selected without setting
Start, Stop, and Center frequencies. The saved custom channel
bands will pop-up to select the proper band
⑨ Selects the unit of either the Frequency or the Channel. When the
“Chan” is selected, the CF Step corresponds to Channel Step
Figure 13 – Overview of GSM Channel Scanner Display
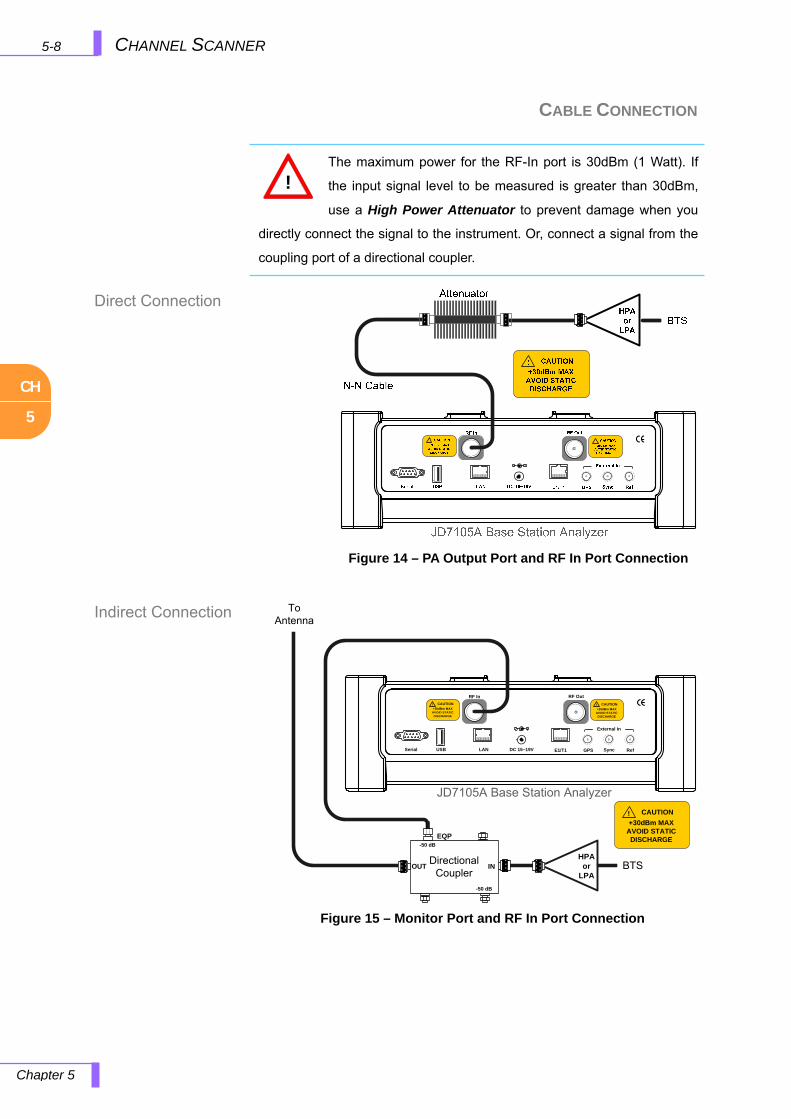
CH
5
5-8 CHANNEL SCANNER
Chapter 5
Direct Connection
Indirect Connection
CABLE CONNECTION
The maximum power for the RF-In port is 30dBm (1 Watt). If
the input signal level to be measured is greater than 30dBm,
use a High Power Attenuator to prevent damage when you
directly connect the signal to the instrument. Or, connect a signal from the
coupling port of a directional coupler.
Figure 14 – PA Output Port and RF In Port Connection
JD7105A Base Station Analyzer
RF In
! CAUTION+30dBm MAX
AVOID STATIC DISCHARGE
Sync RefDC 15~19VLANUSBSerial GPS
RF Out
E1/T1
! CAUTION+25dBm MAX
AVOID STATIC DISCHARGE
External In
To Antenna
DirectionalCoupler
EQP-50 dB
-50 dB
OUT IN BTSHPA or
LPA
! CAUTION
+30dBm MAXAVOID STATIC DISCHARGE
Figure 15 – Monitor Port and RF In Port Connection
!

CH
5
5-9 CHANNEL SCANNER
Chapter 5
MAKING MEASUREMENTS
The key measurement parameters of a channel scanner are:
General Channel Scanner
GSM Channel Scanner
The general channel scanner can measure up to 20 channels in GSM,
CDMA or WCDMA networks. Using existing format-based or custom
parameters, the user will be able to easily verify improper multi-channel
power levels.
The GSM channel scanner has the function to display channel power and
related information up to 128 GSM down link signals. This channel
scanner can quickly identifies improper power levels that affect network
performance; this can be done either over the air or directly connected to
the cell site.

CH
5
5-10 CHANNEL SCANNER
Chapter 5
GENERAL CHANNEL SCANNER
GSM CHANNEL SCANNER
Table 18 – General Channel Scanner
Before using GSM Channel Scanner, the instrument must be in GSM
Analyzer mode. The following procedure sets the GSM Channel Scanner
mode:
Table 19 – GSM Channel Scanner
Step Description
Mode
[Channel Scanner]
Select General Channel Scanner
mode
Freq/Chan
[Start]
Enter value
Set Frequency
[Step size]
Enter value
Set frequency step increment size
[Integ. BW]
Enter value
Set bandwidth to be measured
[CS Unit]
<Freq/Chan>
Set channel scanner unit to be
displayed
Step Description
Mode
[Tx Analyzer]
[GSM/EDGE]
Move to GSM Analyzer mode
[Channel Scanner]
Freq/Chan
[Start Freq]
Enter Value
Select GSM Channel Scanner
Set start frequency
[Num of CHs]
Enter Value
Set number of channels to be
scanned
[Unit]
<Freq/Chan>
Change the unit
[Measure]
<On/Off>
Starts measurement

CH
6
6-1 CDMA TX ANALYZER
Chapter 6
6.0 CDMA TX ANALYZER
In this chapter
CDMA Analyzer Introduction ......................................................................................................................... 6-2
Concept of Channel Power Measurement ............................................................................................ 6-3 Modulation Accuracy (Rho) Measurement Concepts ............................................................................ 6-3 Code Domain Measurement Concepts ................................................................................................. 6-4 Spurious Emission Measurement Concepts ......................................................................................... 6-5 ACPR Measurement Concepts ............................................................................................................. 6-5
Using CDMA Analyzer .................................................................................................................................. 6-6 How to Use Keys .......................................................................................................................................... 6-7
Freq/Chan ............................................................................................................................................. 6-7 Amplitude .............................................................................................................................................. 6-7 Trace/Display ........................................................................................................................................ 6-9 BW/AVG...............................................................................................................................................6-11 Marker ................................................................................................................................................ 6-12 Peak Search ....................................................................................................................................... 6-13 Measure .............................................................................................................................................. 6-13 Measure Setup ................................................................................................................................... 6-14 Display Overview ................................................................................................................................ 6-15 Setup .................................................................................................................................................. 6-16
Frequency Setup ........................................................................................................................ 6-16 External Clock Setting ................................................................................................................ 6-17
Channel Power Measurement ............................................................................................................ 6-18 Channel Power Procedure .......................................................................................................... 6-19 Channel Power Screen ............................................................................................................... 6-19
Occupied Bandwidth Measurement .................................................................................................... 6-20 Occupied Bandwidth Procedure ................................................................................................. 6-20 Occupied Bandwidth Screen ....................................................................................................... 6-21
ACPR Measurement ........................................................................................................................... 6-22 ACPR Procedure ........................................................................................................................ 6-23 ACPR Screen ............................................................................................................................. 6-24
Spurious Emission Mask (SEM) Measurement ................................................................................... 6-25 SEM Procedure .......................................................................................................................... 6-25 SEM Screen................................................................................................................................ 6-26
CDMA Code Domain Measurement.................................................................................................... 6-27 CDP Measurement Procedure .................................................................................................... 6-27 CDP Screen ................................................................................................................................ 6-28 cdma2000 CDP Measurement Items .......................................................................................... 6-29
CDMA OTA Measurement................................................................................................................... 6-30 OTA Measurement Procedure .................................................................................................... 6-30 OTA Measurement Screen .......................................................................................................... 6-31
CH
6
6-2 CDMA TX ANALYZER
Chapter 6
CDMA ANALYZER INTRODUCTION
cdma2000 is one of the proposals for the IMT-2000 requirements for a 3G
global wireless communications system. The 3GPP2 is implementing this
wideband CDMA system as a derivative of the IS-95-B CDMA system,
also known as cdmaOne. The 3GPP2 organizational partners are ARIB,
TTC, TIA, and TTA.1
CdmaOne uses dual BPSK (Binary Phase-Shifting Key) for the forward
link and OQPSK (Offset Quadrature Phase Shift Keying) for the reverse
link.
cdma2000 uses QPSK (Quadrature phase-shift keying) modulation for the
forward link and QPSK modulation with HPSK spreading for the reverse
link. Both forward and reverse links may have several channels, and
individual characteristics for each channel. The chip rate depends on the
mode selected.
This section provides the basic concepts of CDMA (cdmaOne &
cdma2000) communication systems, and explains how the measurements
are performed by the instrument.
CH
6
6-3 CDMA TX ANALYZER
Chapter 6
CONCEPT OF CHANNEL POWER MEASUREMENT
MODULATION ACCURACY (RHO) MEASUREMENT CONCEPTS
The Channel Power measurement is a common test used in the wireless
industry to measure the total transmitted power of a radio within a defined
frequency channel.
The Channel Power measurement reports the total transmitted power
within the channel bandwidth (1.23MHz for cdmaOne). The measurement
acquires a number of points representing the input signal in the time
domain. It transforms this information into the frequency domain using
Fast Fourier Transform (FFT) and then calculates the channel power. The
effective resolution bandwidth of the frequency domain trace is
proportional to the number of points acquired for the FFT.
To improve repeatability, either the number of averages or the number of
data points can be increased with a longer time record. The channel
power trace is shown in the graph window, while the absolute channel
power in dBm and the mean power spectral density in dBm/Hz are shown
in the text window.
Rho is one of the key modulation quality metrics, along with EVM (error
vector modulation) and CDP (code domain power).
Rho is the ratio between the correlated power in a single coded channel
and the total signal power. This is a simplified case of code domain power
since this measurement is made on a single coded channel.
This measurement takes into account all possible error factors in the
entire transmission chain including baseband filtering, I/Q modulation
anomalies, filter amplitude, phase variation, and power amplifier distortion.
This provides an overall indication of the transmitter's performance level.
CH
6
6-4 CDMA TX ANALYZER
Chapter 6
CODE DOMAIN MEASUREMENT CONCEPTS
The code domain measurement displays the power for each of the 64
Walsh channels, relative to the total power inside a 1.23 MHz bandwidth
centered at the Center Frequency. Each Walsh channel level is displayed
as an individual vertical bar. Because this is a relative measurement, the
unit of measure is dB (not dBm or watts). This allows a comparison of
signal levels between the Pilot, Sync, Paging, and Traffic channels.
Rho: Rho is one of the key modulation quality metrics, along with EVM
and code domain power. Rho is the ratio between the correlated power in
a single coded channel and the total signal power. This is a simplified case
of code domain power since this measurement is made on a single coded
channel.
Time Offset: Time Offset indicates how well the transmitter’s signal is
time-aligned to the system time. The displayed value takes into account
the PN Sequence offset Index of the transmitter.
Frequency Error: Frequency Error is the frequency difference between
the transmitter’s actual center frequency and the frequency (or channel)
entered.
Pilot Power: It is the relative power of the pilot channel (Walsh code 0)
with respect to the carrier’s power.
Sync Power: It is the relative power of the sync channel (Walsh code 32)
with respect to the carrier’s power.
Paging Power: Is the relative power of the paging channel (Walsh code 1)
with respect to the carrier’s power.
Average Traffic Channel Power: It is the average relative power of the
active traffic channels with respect to the carrier power. Traffic channels
are defined as all of the Walsh codes except Walsh 0,1and 32. A traffic
channel is active if its coding power is greater than the active threshold
parameter selected.
CH
6
6-5 CDMA TX ANALYZER
Chapter 6
SPURIOUS EMISSION MEASUREMENT CONCEPTS
ACPR MEASUREMENT CONCEPTS
Measures the spurious emissions in the transmitter’s band relative to the
selected channel power. The transmitter’s band spectrum is measured in
several frequency segments using resolution bandwidths as specified by
the standard. The channel power (integrated power in a 1.23 MHz
bandwidth) is measured first, and then it is used as a reference for the
measurement limit levels. The spectrum, centered around the carrier as
well as above and below the carrier, is then measured. For each spectrum
segment, the measurement looks for the spectrum peak closest to the limit
and reports it as the Worst Spur.
Adjacent Channel Power Ratio (ACPR), as it applies to cdmaOne, is the
power contained in a specified frequency channel bandwidth relative to the
total carrier power. It may also be expressed as a ratio of power spectral
density between the carrier and the specified offset frequency band.
As a composite measurement of out-of-channel emissions, ACPR
combines both in-band and out-of-band specifications to provide useful
figures-of-merit for spectral growth and emissions produced by
components and circuit blocks without the need to perform a full spectrum
emissions mask measurement.
This ACPR measurement analyzes the total power levels within the
defined carrier bandwidth and at given frequency offset on both sides of
the carrier frequency.
It uses an integration bandwidth method that performs a time domain data
acquisition and applies FFT to get a frequency domain trace. In this
measurement, the channel integration bandwidth is analyzed using the
automatically defined resolution bandwidth (RBW), which is much
narrower than the channel bandwidth. The measurement computes an
average power of the channel over a specified number of data acquisitions,
automatically compensating for resolution bandwidth and noise bandwidth.
CH
6
6-6 CDMA TX ANALYZER
Chapter 6
USING CDMA ANALYZER
This section provides a procedure for the transmission analysis function to
test the transmitter’s performance of CDMA (cdmaOne & cdma2000)
systems.
The JD7105A provides the following analysis tools for CDMA system.
Channel Power
Occupied Bandwidth
Spurious Emission
ACPR
Demodulator (Code Domain Analyzer)
OTA
Auto Measure
CH
6
6-7 CDMA TX ANALYZER
Chapter 6
FREQ/CHAN
AMPLITUDE
HOW TO USE KEYS
This section provides guidance on the use of the instrument’s keys in
CDMA Tx Analyzer mode.
Freq/Chan
Sets the Frequency by selecting standard or custom frequency bands.
CENTER FREQUENCY: Changes the center frequency setup in the
spectrum measurement. Values can be entered with the Data Entry key,
the Knob or the arrow keys. When using the Data Entry key, the input is
completed by selecting the soft key with the corresponding value unit.
When using the Knob or the arrow keys, the center frequency changes in
predefined frequency steps. The frequency steps can be configured
selecting the CF Step Menu.
CF STEP: Defines the moving unit of center frequency. Values can be
entered by Data Entry key or changed through the knob. When using Data
Entry key, input is completed by selecting the unit to define the input value.
When using the knob or the arrow keys the frequency value is increased
by 0.1MHz.
CHANNEL STANDARD: Using this key, the channel band can be selected
without setting Start, Stop, and Center frequencies. The saved custom
channel bands will pop-up to select the proper band.
UNIT: Selects the unit to be used, either Frequency or Channel. When
the “Chan” is selected, the CF Step corresponds to Channel Step.
Amplitude
When the instrument is in Channel Power, Occupied Bandwidth, SEM,
and ACPR measurement mode, an Amplitude key is used as below.
AUTO SCALE: The instrument can automatically set the scale to the
minimum and maximum values off the Y-axis of the graph for optimum
display of the traces measured. Each time the AUTO SCALE is selected,
the top and bottom scales are set to the minimum and maximum values
with margin on the Y-axis of the screen display.

CH
6
6-8 CDMA TX ANALYZER
Chapter 6
REFERENCE LEVEL: Sets Y-axis maximum range when using the
spectrum analyzer or Tx Analyzer functions.
Step Description
Amplitude
[Ref Level]
<Enter values>
[dBm]/[-dBm] or [Ref Level]
Knob
Select from front Hard Key
Select from Screen Menu
Enter Ref. Level using Data entry key
Select from Screen Menu
Step= 10dB
Table 20 – Ref Level Setting Procedure
ATTENUATOR
AUTO: Input Attenuator’s value is automatically set depending on the
reference level. This is the default operation mode, so it is recommended
to use this mode unless a special measurement condition is needed.
MANUAL: Sets the In-Port attenuator’s value. The reference level
changes according to the change of the attenuator’s value, but the
attenuator’s value doesn’t change when the reference level is changed.
If the input signal level is lower than +30dBm or higher than the
allowable input limit per input attenuator’s value set by the user
(total input power must be lower than 0dBm when input
attenuation setting is +20dB), A “Final IF Overload” message will be
displayed on the upper side of the screen indicating that the input
attenuation’s value must be increased. When the instrument is exposed to
an over power condition for a long time, its performance may be degraded.
When the input power level exceeds +35dBm, an “Over Power
Alarm” message will be displayed on the screen and the
JD7105A disconnects its internal RF Input path and all the
measurements are stopped. In this case, disconnect the external input
signal and wait until the JD7105A measures the input signal level again
and the “Over Power Alarm” message is not displayed.
!
!
CH
6
6-9 CDMA TX ANALYZER
Chapter 6
TRACE/DISPLAY
RF IN LOSS: Sets an external offset value. An offset consists of a cable
offset and a user offset, and the measurement result shows the value
reflecting both offset values. Even if an offset is set, the reference level is
automatically adjusted to avoid the waveform fitting out of the screen. An
offset value set in Spectrum mode have precedence over the offset value
set in Analysis Mode.
When the instrument is in Demodulator mode, an Amplitude key is
used as below.
ATTENUATOR
AUTO: Input Attenuator’s value is automatically set depending on the
reference level. This is the default operation mode, so it is recommended
to use this mode unless a special measurement condition is needed.
MANUAL: Sets the In-Port attenuator’s value. The reference level
changes according to the change of the attenuator’s value, but the
attenuator’s value doesn’t change when the reference level is changed.
REFERENCE: Selects the Relative or Absolute value to be displayed.
REL: The code domain power is measured relative to channel power.
ABS: The code domain power is measured absolute to channel power.
RF IN LOSS: Sets an external offset value. An offset consists of a cable
offset and a user offset, and the measurement result shows the value
reflecting both offset values. Even if an offset is set, the reference level is
automatically adjusted to avoid the waveform fitting out of the screen. An
offset value set in Spectrum mode have precedence over the offset value
set in Analysis Mode.
This key is not used in ACPR measurement mode.
When the instrument is in Channel Power, Occupied Bandwidth, SEM,
measurement mode, a Trace/Display key is used as below.
TRACE SELECT: Selects an active trace from T1 ~ T6. Every time Select
screen menu is pressed, the active trace changes. Trace numbers are
assigned to each captured traces or loaded traces.
CH
6
6-10 CDMA TX ANALYZER
Chapter 6
TRACE VIEW: Hides or displays the trace number on the screen. Press
the Select screen menu key to choose the Trace number. Traces with
View set OFF are hidden from the screen. Setting View On restores
hidden traces and information on the window.
M: Max Hold
m: Min Hold
C: Captured Trace
W: Current Trace
L: Loaded Trace
TRACE CAPTURE: Captures a current trace on the screen with assigned
trace number.
CLEAR WRITE: Clear selected Trace and Write (Assign) current trace.
MAX HOLD: Sets Active trace Max Hold. Active trace compares newly
acquired data with the trace shown on the screen and displays the bigger
trace on the screen.
MIN HOLD: Sets Active trace Min Hold. Active trace compares newly
acquired data with the trace shown on the screen and displays the smaller
trace on the screen.
TRACE CLEAR: Deletes an active trace from the screen. The cleared
trace is not restored. It is used to select and delete a trace one by one
when multiple traces are displayed on the screen. Verify the traces to
delete with Trace View ON/OFF function in advance settings as cleared
traces cannot be restored.
CLEAR CURRENT: Deletes an active trace from the screen. The cleared
trace is not restored. It is used to select and delete a trace one by one
when multiple traces are displayed on the screen. Verify the traces to
delete with View ON/OFF function in advance settings as cleared traces
cannot be restored.
CLEAR ALL: Deletes all traces from the instrument and initialize the trace
settings.
CH
6
6-11 CDMA TX ANALYZER
Chapter 6
BW/AVG
When the instrument is in Demodulator mode, a Trace/Display key is
used as below.
WALSH CODE: Selects the Walsh Code to be displayed between 64 or
128.
CODOGRAM: Selects codogram view.
CODOGRAM OFF/ON: Turns Codogram view On/Off.
RESET/RESTART: Reset current measurement and restart.
TIME INTERVAL: Selects AM, FM or CW tone to be
demodulated.
AUTO SAVE: Saves the measurement data automatically to
external memory, USB.
TIME CURSOR: Sets Time Cursor on the measurement.
AVERAGE: Sets the number of measurements to be averaged for the
trace presentation. A maximum of 99 times of averaging can be set.
SWEEP CTRL: Selects the sweep method between "Continue" and "Hold".
When the instrument is in Demodulator mode, an BW/AVG key is
used as below.
SWEEP CTRL: Selects the sweep method between "Continue" and "Hold".
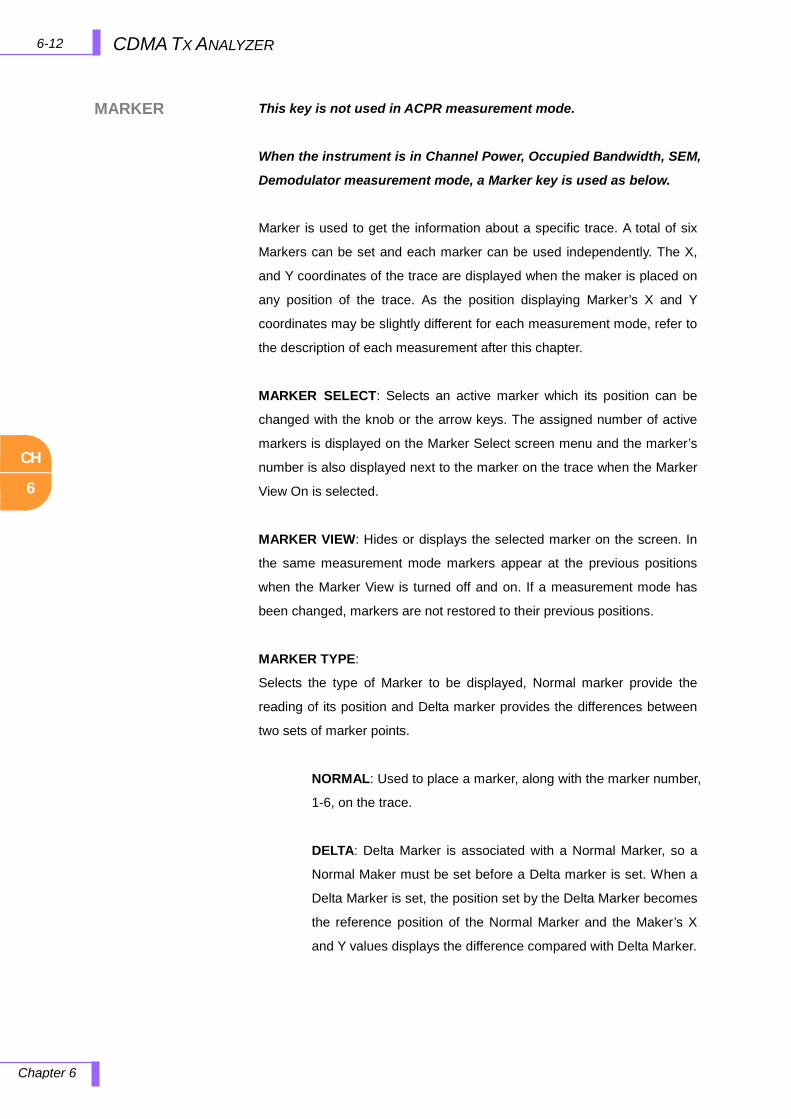
CH
6
6-12 CDMA TX ANALYZER
Chapter 6
MARKER
This key is not used in ACPR measurement mode.
When the instrument is in Channel Power, Occupied Bandwidth, SEM,
Demodulator measurement mode, a Marker key is used as below.
Marker is used to get the information about a specific trace. A total of six
Markers can be set and each marker can be used independently. The X,
and Y coordinates of the trace are displayed when the maker is placed on
any position of the trace. As the position displaying Marker’s X and Y
coordinates may be slightly different for each measurement mode, refer to
the description of each measurement after this chapter.
MARKER SELECT: Selects an active marker which its position can be
changed with the knob or the arrow keys. The assigned number of active
markers is displayed on the Marker Select screen menu and the marker’s
number is also displayed next to the marker on the trace when the Marker
View On is selected.
MARKER VIEW: Hides or displays the selected marker on the screen. In
the same measurement mode markers appear at the previous positions
when the Marker View is turned off and on. If a measurement mode has
been changed, markers are not restored to their previous positions.
MARKER TYPE:
Selects the type of Marker to be displayed, Normal marker provide the
reading of its position and Delta marker provides the differences between
two sets of marker points.
NORMAL: Used to place a marker, along with the marker number,
1-6, on the trace.
DELTA: Delta Marker is associated with a Normal Marker, so a
Normal Maker must be set before a Delta marker is set. When a
Delta Marker is set, the position set by the Delta Marker becomes
the reference position of the Normal Marker and the Maker’s X
and Y values displays the difference compared with Delta Marker.
CH
6
6-13 CDMA TX ANALYZER
Chapter 6
PEAK SEARCH
MEASURE
MARKER CLEAR ALL: Turns all markers off the screen. Markers are
redisplayed on the previous position if markers are turned back on. If a
measurement mode is changed, current settings are not restored.
MARKER EDIT: Sets the marker position manually. A pop-up window
appears for users to set the frequency by entering numeric values and the
marker position is moved to the setting frequency.
This key is not used in ACPR measurement mode.
When the instrument is in Channel Power, Occupied Bandwidth, SEM,
Demodulator measurement mode, a Peak Search key is used as
below.
Each time Peak Search key is pressed, a marker is displayed on the
highest peak of the Trace.
PEAK RIGHT: Moves the marker to the next highest peak at the right of its
current position.
PEAK LEFT: Moves the marker to the next highest peak at the left of its
current position.
MAX SEARCH: Moves the marker to the highest peak of the trace.
MIN SEARCH: Moves the marker to the lowest peak of the trace.
ALWAYS PEAK: Moves the marker automatically to the highest peak of
the trace each time the trace is updated.
When the instrument is in Tx Analyzer Mode, Measure key is used to
select measurement menu listed below.
Channel Power Measurement Occupied Bandwidth Measurement SEM Measurement ACPR Measurement Demodulator Measurement OTA Measurement Auto Measure
CH
6
6-14 CDMA TX ANALYZER
Chapter 6
MEASURE SETUP
This key is not used when the instrument is in Channel Power,
Occupied Bandwidth, SEM, and ACPR measurement mode.
When the instrument is in Demodulator mode, a Measure Setup key
is used as below.
THRESHOLD: Indicates which codes are considered active.
Q PAGING CHANNEL: Q paging channel indicates the power of Quick
Page Walsh code 80.
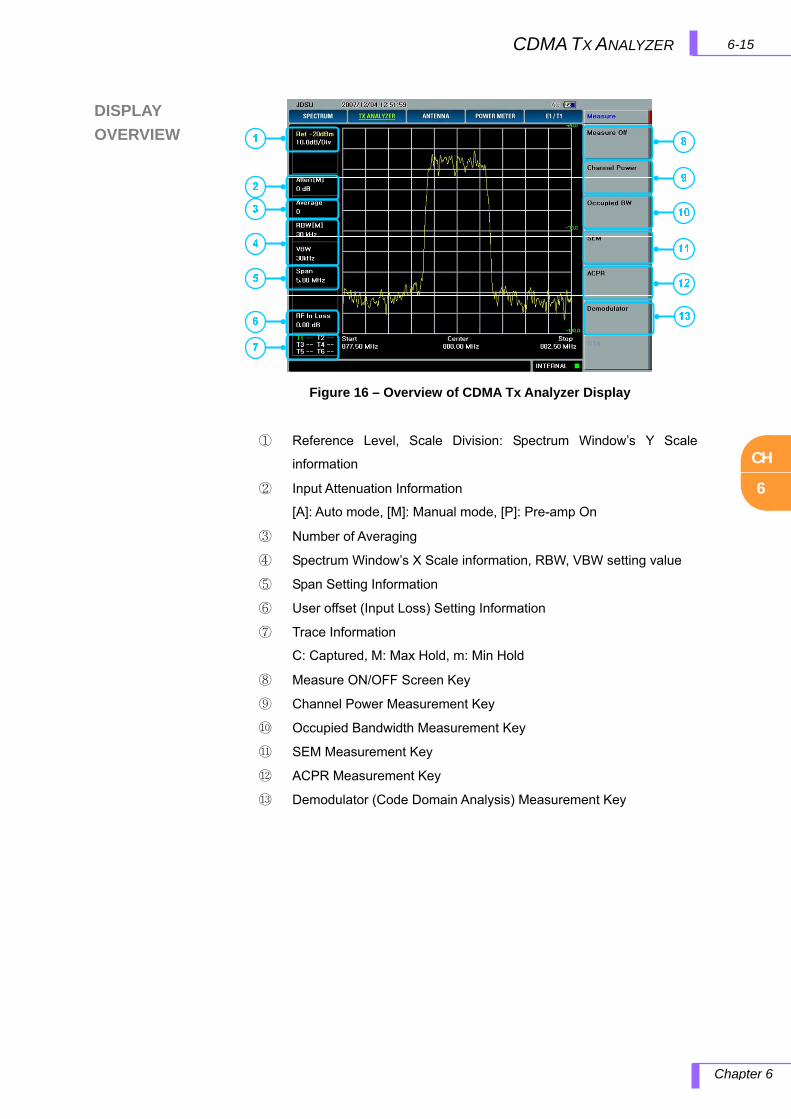
CH
6
6-15CDMA TX ANALYZER
Chapter 6
DISPLAY
OVERVIEW
① Reference Level, Scale Division: Spectrum Window’s Y Scale
information
② Input Attenuation Information
[A]: Auto mode, [M]: Manual mode, [P]: Pre-amp On
③ Number of Averaging
④ Spectrum Window’s X Scale information, RBW, VBW setting value
⑤ Span Setting Information
⑥ User offset (Input Loss) Setting Information
⑦ Trace Information
C: Captured, M: Max Hold, m: Min Hold
⑧ Measure ON/OFF Screen Key
⑨ Channel Power Measurement Key
⑩ Occupied Bandwidth Measurement Key
⑪ SEM Measurement Key
⑫ ACPR Measurement Key
⑬ Demodulator (Code Domain Analysis) Measurement Key
Figure 16 – Overview of CDMA Tx Analyzer Display
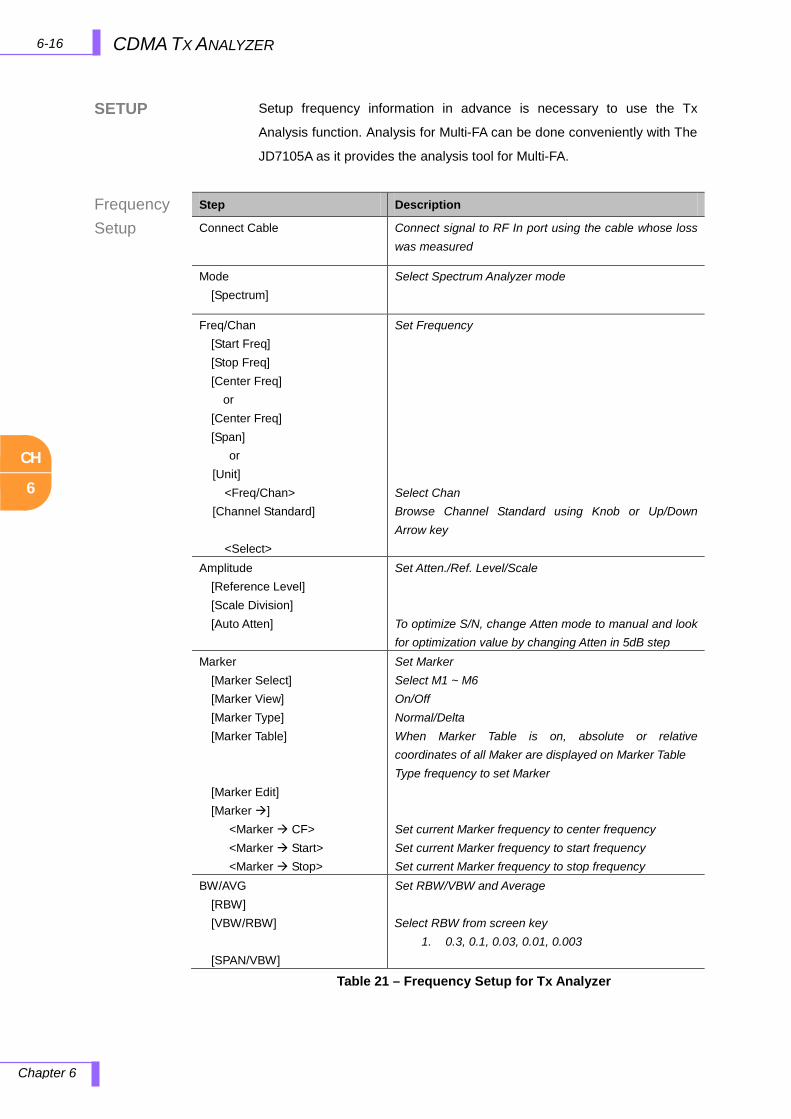
CH
6
6-16 CDMA TX ANALYZER
Chapter 6
SETUP
Frequency Setup
Setup frequency information in advance is necessary to use the Tx
Analysis function. Analysis for Multi-FA can be done conveniently with The
JD7105A as it provides the analysis tool for Multi-FA.
Table 21 – Frequency Setup for Tx Analyzer
Step Description
Connect Cable Connect signal to RF In port using the cable whose loss was measured
Mode [Spectrum]
Select Spectrum Analyzer mode
Freq/Chan [Start Freq] [Stop Freq] [Center Freq]
or [Center Freq] [Span]
or [Unit] <Freq/Chan> [Channel Standard] <Select>
Set Frequency Select Chan Browse Channel Standard using Knob or Up/Down Arrow key
Amplitude [Reference Level] [Scale Division] [Auto Atten]
Set Atten./Ref. Level/Scale To optimize S/N, change Atten mode to manual and look for optimization value by changing Atten in 5dB step
Marker [Marker Select] [Marker View] [Marker Type] [Marker Table] [Marker Edit] [Marker ] <Marker CF>
<Marker Start> <Marker Stop>
Set Marker Select M1 ~ M6 On/Off Normal/Delta When Marker Table is on, absolute or relative coordinates of all Maker are displayed on Marker Table Type frequency to set Marker Set current Marker frequency to center frequency Set current Marker frequency to start frequency Set current Marker frequency to stop frequency
BW/AVG [RBW] [VBW/RBW] [SPAN/VBW]
Set RBW/VBW and Average Select RBW from screen key
1. 0.3, 0.1, 0.03, 0.01, 0.003

CH
6
6-17CDMA TX ANALYZER
Chapter 6
External Clock
Setting
Standards
To enhance the reliability of Code Domain measurement results, The
JD7105A and Base Station must be synchronized. When external clock is
not supplied, The JD7105A works with built-in internal High Accuracy Time
Base. However, some measurement results may exhibit inaccurate value
if it is not synchronized with signal source. Therefore, it is highly
recommended to use the same reference clock as signal source. Sync
Mode can be changed in Setup.
Table 22 – External Clock Operating Standard
Clock Type Reference Port Switching
Standard
10MHz Internal Internal 10MHz Default
External External Ref
Clock
Ext Ref In (SMA) Automatic
switching
(Input signal level
>-3dBm)
External GPS GPS clock GPS (SMA) Automatic
switching (GPS
signal received)
PP2S Internal Internal Sync Default
External External Sync Even Sec/ Sync In
(BNC)
Manual switching
External GPS GPS GPS (SMA) Manual switching
Figure 17 – Ext Ref Clock Input Ports
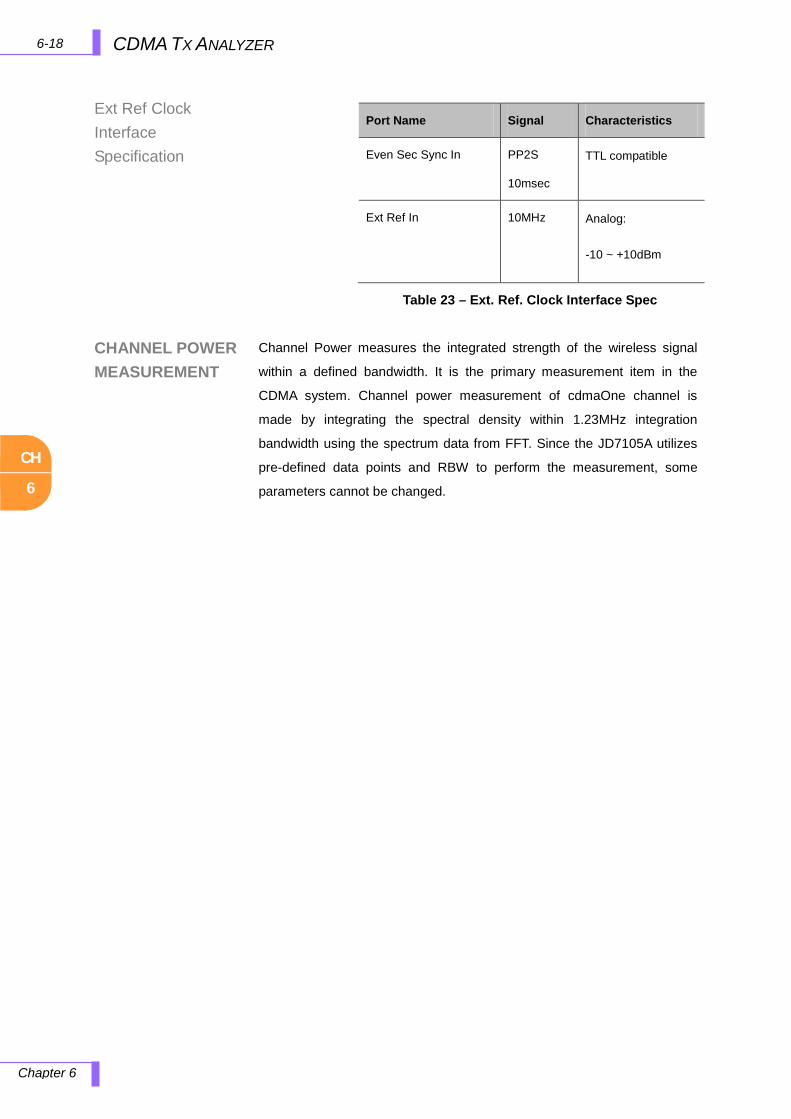
CH
6
6-18 CDMA TX ANALYZER
Chapter 6
Ext Ref Clock Interface Specification
CHANNEL POWER MEASUREMENT
Table 23 – Ext. Ref. Clock Interface Spec
Channel Power measures the integrated strength of the wireless signal
within a defined bandwidth. It is the primary measurement item in the
CDMA system. Channel power measurement of cdmaOne channel is
made by integrating the spectral density within 1.23MHz integration
bandwidth using the spectrum data from FFT. Since the JD7105A utilizes
pre-defined data points and RBW to perform the measurement, some
parameters cannot be changed.
Port Name Signal Characteristics
Even Sec Sync In PP2S
10msec
TTL compatible
Ext Ref In 10MHz Analog:
-10 ~ +10dBm
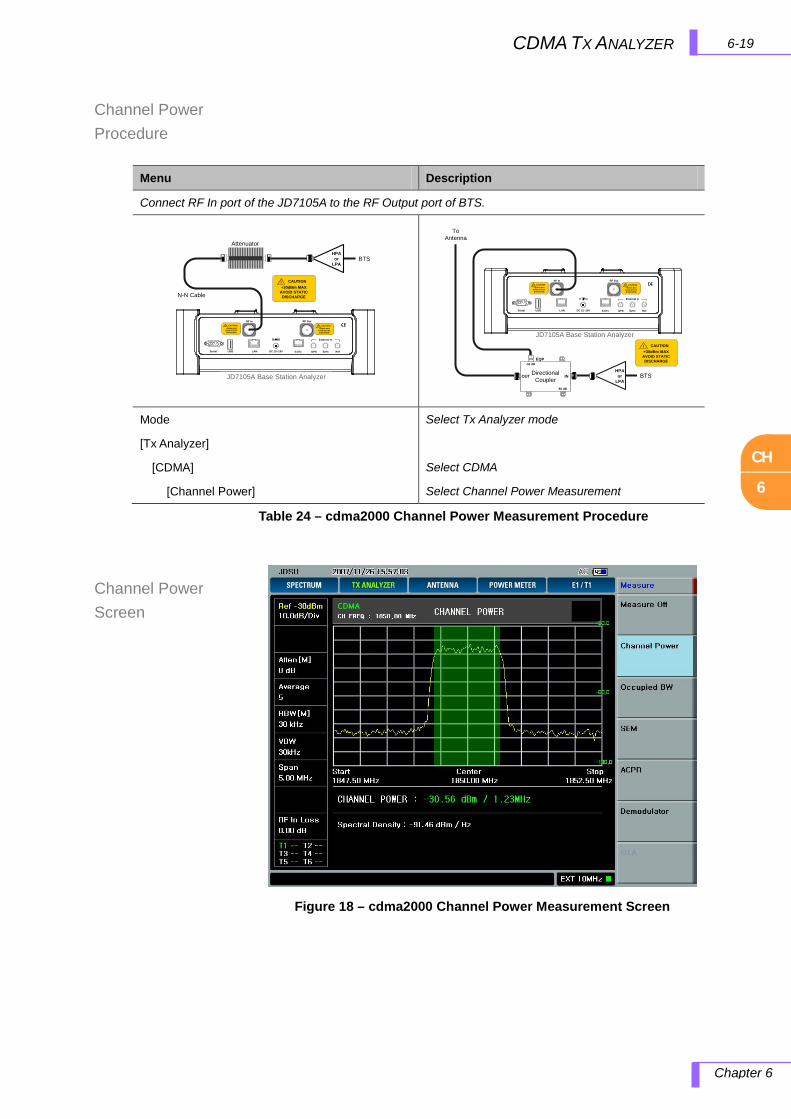
CH
6
6-19 CDMA TX ANALYZER
Chapter 6
Channel Power Procedure
Channel Power Screen
Table 24 – cdma2000 Channel Power Measurement Procedure
Menu Description
Connect RF In port of the JD7105A to the RF Output port of BTS.
RF In! CAUTION+30dBm MAX
AVOID STATIC DISCHARGE
Sync RefDC 15~19VLANUSBSerial GPS
RF Out
E1/T1
! CAUTION+25dBm MAX
AVOID STATIC DISCHARGE
External In
JD7105A Base Station Analyzer
N-N Cable
! CAUTION+30dBm MAX
AVOID STATIC DISCHARGE
BTSHPA
or LPA
Attenuator
JD7105A Base Station Analyzer
RF In! CAUTION+30dBm MAX
AVOID STATIC DISCHARGE
Sync RefDC 15~19VLANUSBSerial GPS
RF Out
E1/T1
! CAUTION+25dBm MAX
AVOID STATIC DISCHARGE
External In
To Antenna
DirectionalCoupler
EQP-50 dB
-50 dB
OUT IN BTSHPA
or LPA
! CAUTION+30dBm MAX
AVOID STATIC DISCHARGE
Mode
[Tx Analyzer]
[CDMA]
[Channel Power]
Select Tx Analyzer mode
Select CDMA
Select Channel Power Measurement
Figure 18 – cdma2000 Channel Power Measurement Screen
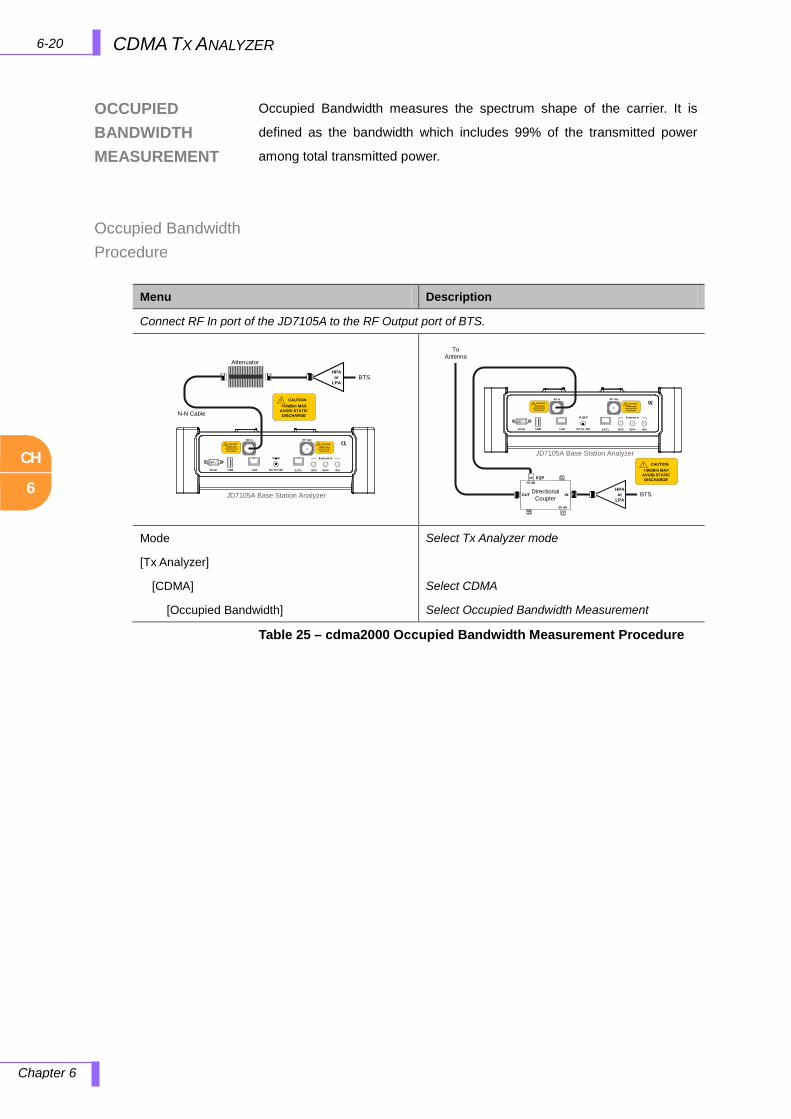
CH
6
6-20 CDMA TX ANALYZER
Chapter 6
OCCUPIED BANDWIDTH MEASUREMENT
Occupied Bandwidth Procedure
Occupied Bandwidth measures the spectrum shape of the carrier. It is
defined as the bandwidth which includes 99% of the transmitted power
among total transmitted power.
Table 25 – cdma2000 Occupied Bandwidth Measurement Procedure
Menu Description
Connect RF In port of the JD7105A to the RF Output port of BTS.
RF In! CAUTION+30dBm MAX
AVOID STATIC DISCHARGE
Sync RefDC 15~19VLANUSBSerial GPS
RF Out
E1/T1
! CAUTION+25dBm MAX
AVOID STATIC DISCHARGE
External In
JD7105A Base Station Analyzer
N-N Cable
! CAUTION+30dBm MAX
AVOID STATIC DISCHARGE
BTSHPA
or LPA
Attenuator
JD7105A Base Station Analyzer
RF In! CAUTION+30dBm MAX
AVOID STATIC DISCHARGE
Sync RefDC 15~19VLANUSBSerial GPS
RF Out
E1/T1
! CAUTION+25dBm MAX
AVOID STATIC DISCHARGE
External In
To Antenna
DirectionalCoupler
EQP-50 dB
-50 dB
OUT IN BTSHPA
or LPA
! CAUTION+30dBm MAX
AVOID STATIC DISCHARGE
Mode
[Tx Analyzer]
[CDMA]
[Occupied Bandwidth]
Select Tx Analyzer mode
Select CDMA
Select Occupied Bandwidth Measurement
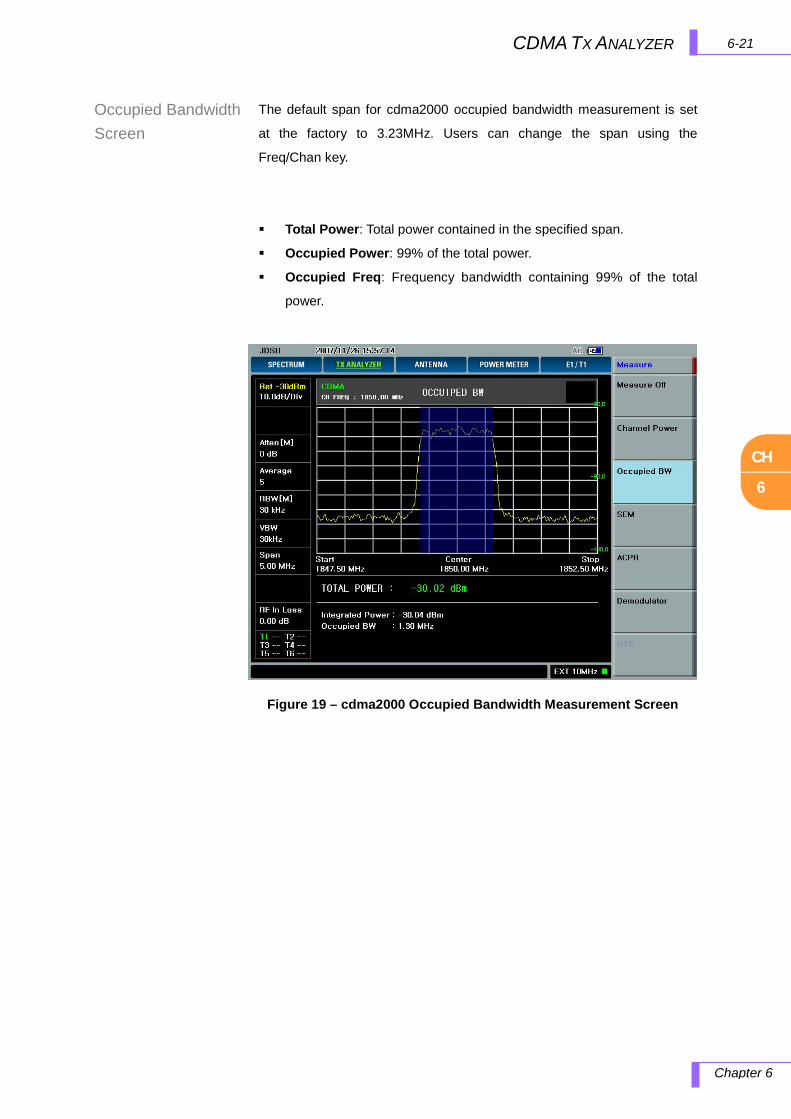
CH
6
6-21 CDMA TX ANALYZER
Chapter 6
Occupied Bandwidth Screen
The default span for cdma2000 occupied bandwidth measurement is set
at the factory to 3.23MHz. Users can change the span using the
Freq/Chan key.
Total Power: Total power contained in the specified span.
Occupied Power: 99% of the total power.
Occupied Freq: Frequency bandwidth containing 99% of the total
power.
Figure 19 – cdma2000 Occupied Bandwidth Measurement Screen
CH
6
6-22 CDMA TX ANALYZER
Chapter 6
ACPR MEASUREMENT
Adjacent Channel Power Ratio (ACPR) is defined as the ratio of the
average power in the adjacent frequency channel (or offset) to the
average power in the transmitted frequency channel. It may also be
expressed as the ratio of the integrated signal power in the adjacent
channel to the integrated signal power in the main channel, which is
defined as ACLR (Adjacent Channel Leakage Ratio).
To maintain a quality call by avoiding channel interference, it is important
to measure and reduce any adjacent channel leakage power transmitted
from a mobile phone. The following is a list of factors that degrade the
ACPR characteristics.
Fault occurs in the control of the DC power supplied to power
amplifier (PA), RF power control of PA, or I,Q control in the Base
Station.
Fault in PA gain control caused by increased distortion.
Increased harmonics due to the degradation of PA’s linearity.
The increase in induced power to adjacent channel caused by degraded
ACPR characteristics increases the noise in the in-band of the adjacent
channel, which results in a call quality degradation.
In-band noise in CDMA system not only degrades communication quality,
but also becomes a major factor of reduction of call capacity.
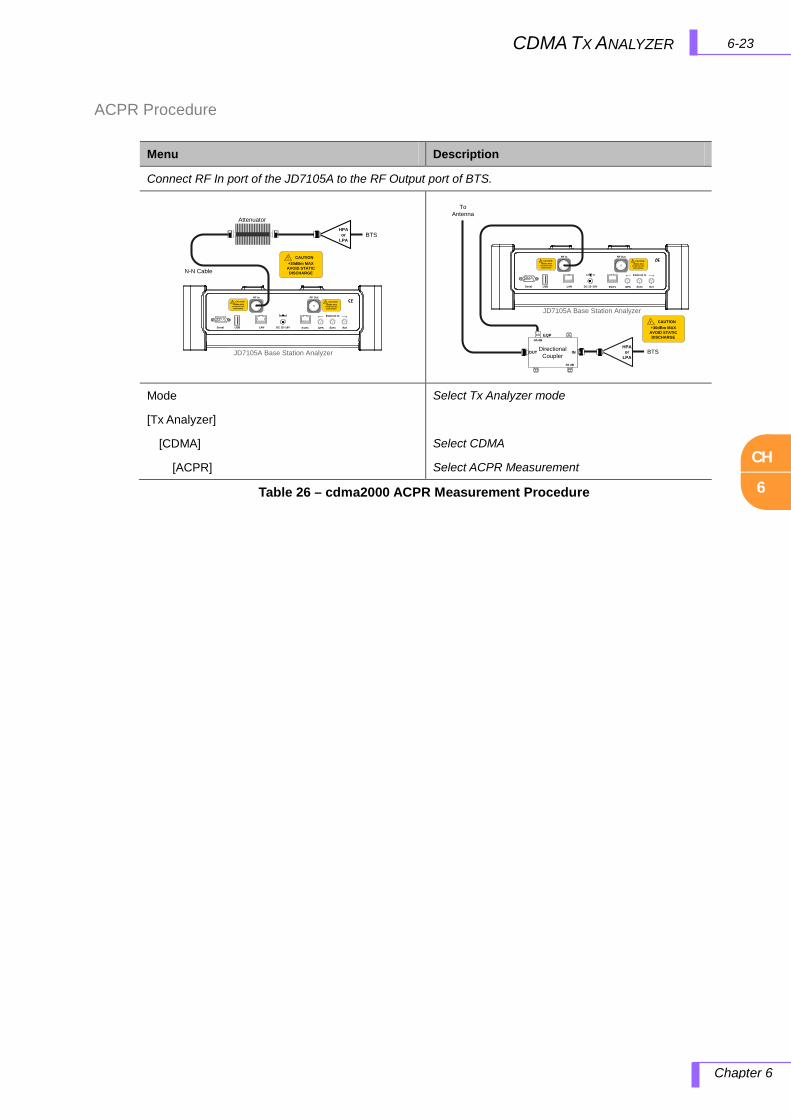
CH
6
6-23 CDMA TX ANALYZER
Chapter 6
ACPR Procedure
Table 26 – cdma2000 ACPR Measurement Procedure
Menu Description
Connect RF In port of the JD7105A to the RF Output port of BTS.
RF In! CAUTION+30dBm MAX
AVOID STATIC DISCHARGE
Sync RefDC 15~19VLANUSBSerial GPS
RF Out
E1/T1
! CAUTION+25dBm MAX
AVOID STATIC DISCHARGE
External In
JD7105A Base Station Analyzer
N-N Cable
! CAUTION+30dBm MAX
AVOID STATIC DISCHARGE
BTSHPA or
LPA
Attenuator
JD7105A Base Station Analyzer
RF In! CAUTION+30dBm MAX
AVOID STATIC DISCHARGE
Sync RefDC 15~19VLANUSBSerial GPS
RF Out
E1/T1
! CAUTION+25dBm MAX
AVOID STATIC DISCHARGE
External In
To Antenna
DirectionalCoupler
EQP-50 dB
-50 dB
OUT IN BTSHPA
or LPA
! CAUTION+30dBm MAX
AVOID STATIC DISCHARGE
Mode
[Tx Analyzer]
[CDMA]
[ACPR]
Select Tx Analyzer mode
Select CDMA
Select ACPR Measurement
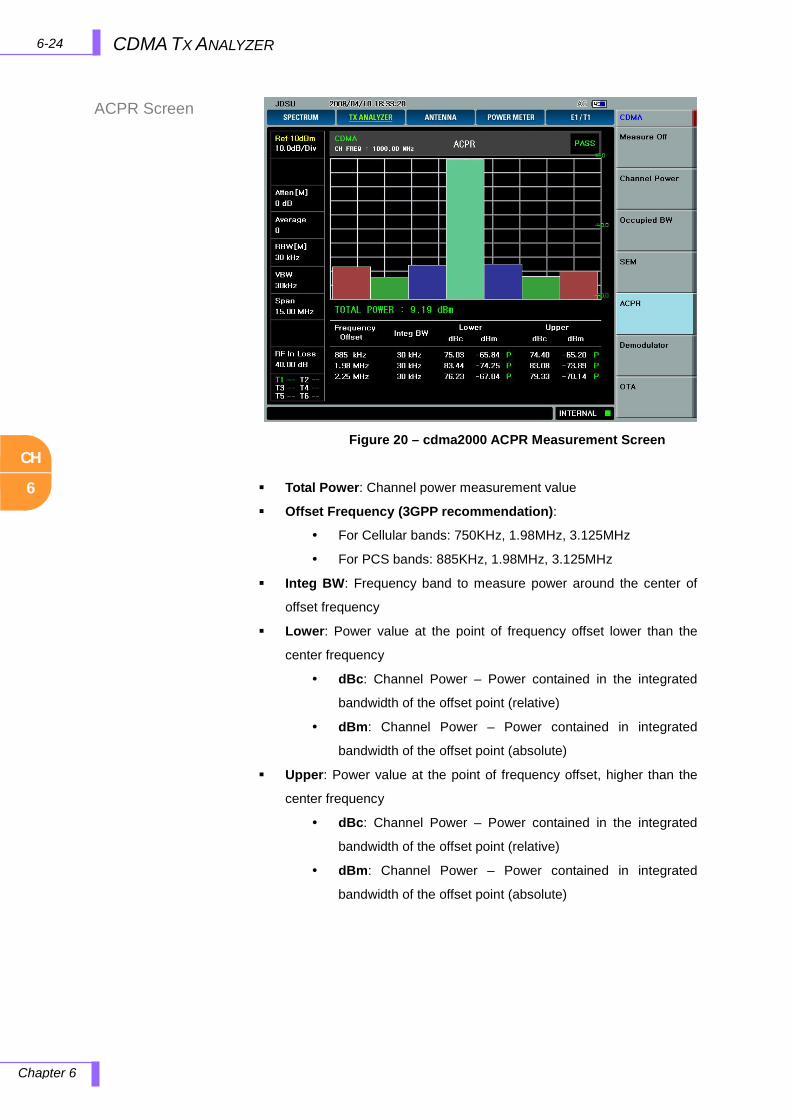
CH
6
6-24 CDMA TX ANALYZER
Chapter 6
ACPR Screen
Total Power: Channel power measurement value
Offset Frequency (3GPP recommendation):
For Cellular bands: 750KHz, 1.98MHz, 3.125MHz
For PCS bands: 885KHz, 1.98MHz, 3.125MHz
Integ BW: Frequency band to measure power around the center of
offset frequency
Lower: Power value at the point of frequency offset lower than the
center frequency
dBc: Channel Power – Power contained in the integrated
bandwidth of the offset point (relative)
dBm: Channel Power – Power contained in integrated
bandwidth of the offset point (absolute)
Upper: Power value at the point of frequency offset, higher than the
center frequency
dBc: Channel Power – Power contained in the integrated
bandwidth of the offset point (relative)
dBm: Channel Power – Power contained in integrated
bandwidth of the offset point (absolute)
Figure 20 – cdma2000 ACPR Measurement Screen
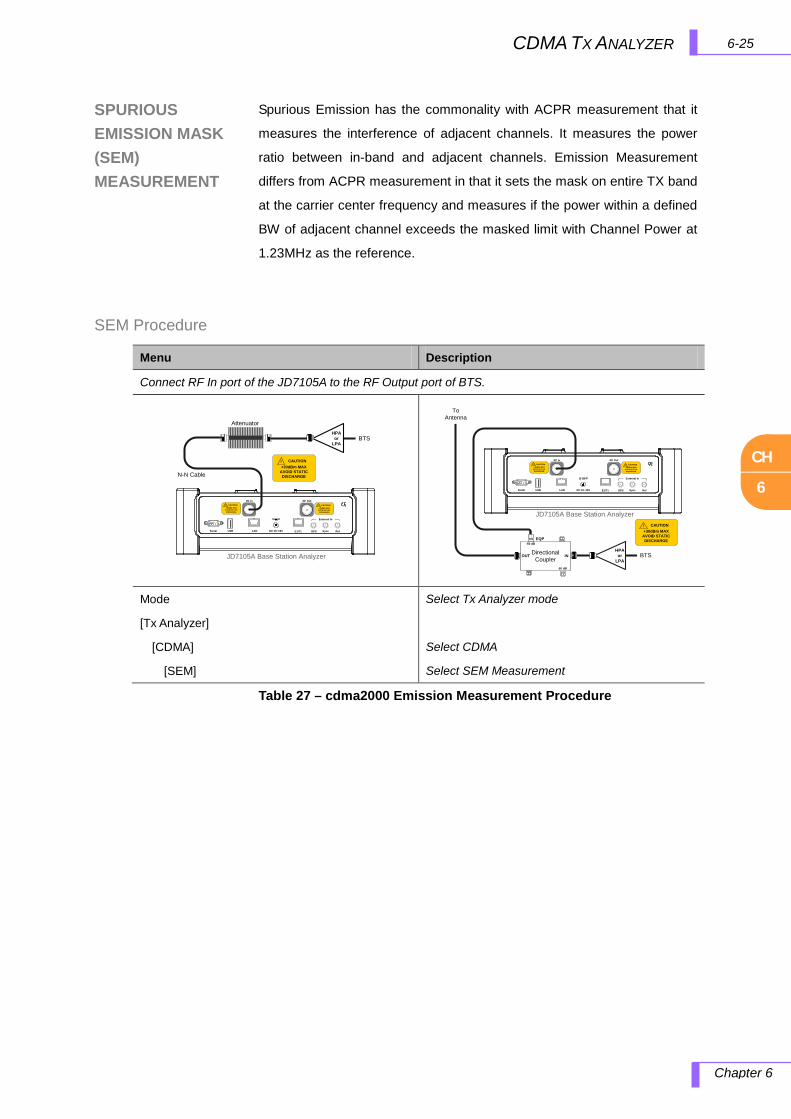
CH
6
6-25 CDMA TX ANALYZER
Chapter 6
SPURIOUS EMISSION MASK (SEM) MEASUREMENT
SEM Procedure
Spurious Emission has the commonality with ACPR measurement that it
measures the interference of adjacent channels. It measures the power
ratio between in-band and adjacent channels. Emission Measurement
differs from ACPR measurement in that it sets the mask on entire TX band
at the carrier center frequency and measures if the power within a defined
BW of adjacent channel exceeds the masked limit with Channel Power at
1.23MHz as the reference.
Table 27 – cdma2000 Emission Measurement Procedure
Menu Description
Connect RF In port of the JD7105A to the RF Output port of BTS.
RF In! CAUTION+30dBm MAX
AVOID STATIC DISCHARGE
Sync RefDC 15~19VLANUSBSerial GPS
RF Out
E1/T1
! CAUTION+25dBm MAX
AVOID STATIC DISCHARGE
External In
JD7105A Base Station Analyzer
N-N Cable
! CAUTION+30dBm MAX
AVOID STATIC DISCHARGE
BTSHPA
or LPA
Attenuator
JD7105A Base Station Analyzer
RF In! CAUTION+30dBm MAX
AVOID STATIC DISCHARGE
Sync RefDC 15~19VLANUSBSerial GPS
RF Out
E1/T1
! CAUTION+25dBm MAX
AVOID STATIC DISCHARGE
External In
To Antenna
DirectionalCoupler
EQP-50 dB
-50 dB
OUT IN BTSHPA
or LPA
! CAUTION+30dBm MAX
AVOID STATIC DISCHARGE
Mode
[Tx Analyzer]
[CDMA]
[SEM]
Select Tx Analyzer mode
Select CDMA
Select SEM Measurement
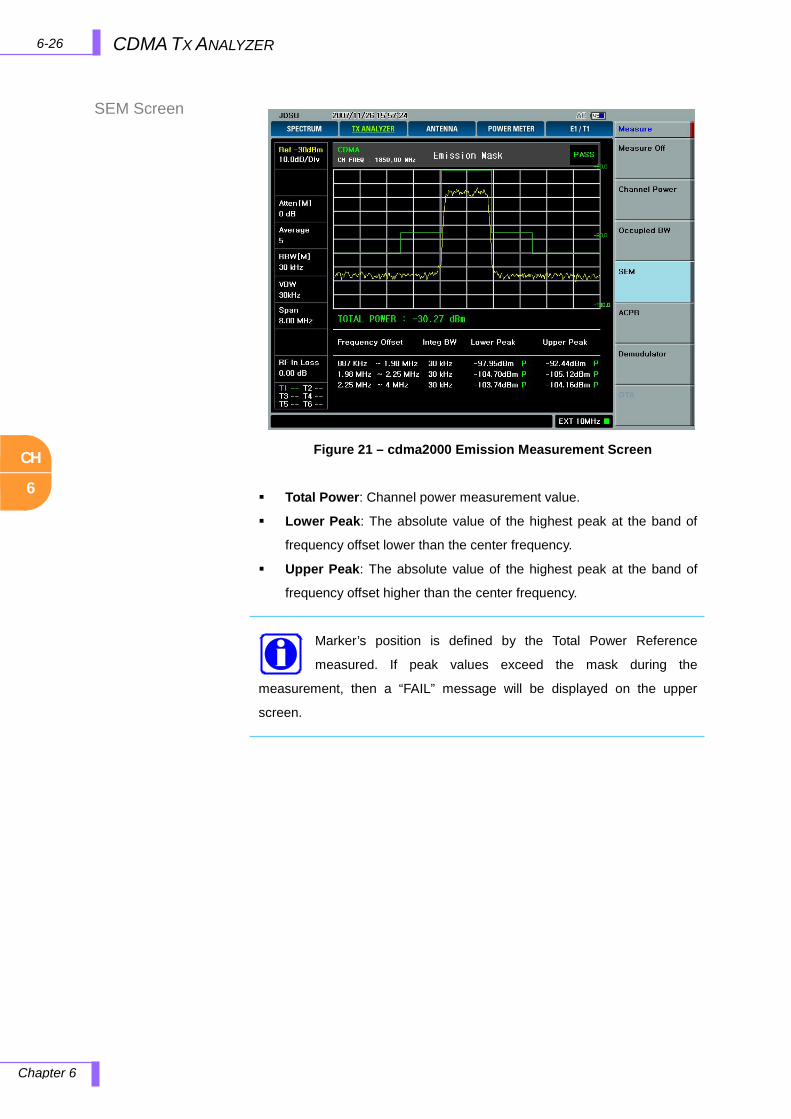
CH
6
6-26 CDMA TX ANALYZER
Chapter 6
SEM Screen
Total Power: Channel power measurement value.
Lower Peak: The absolute value of the highest peak at the band of
frequency offset lower than the center frequency.
Upper Peak: The absolute value of the highest peak at the band of
frequency offset higher than the center frequency.
Marker’s position is defined by the Total Power Reference
measured. If peak values exceed the mask during the
measurement, then a “FAIL” message will be displayed on the upper
screen.
Figure 21 – cdma2000 Emission Measurement Screen
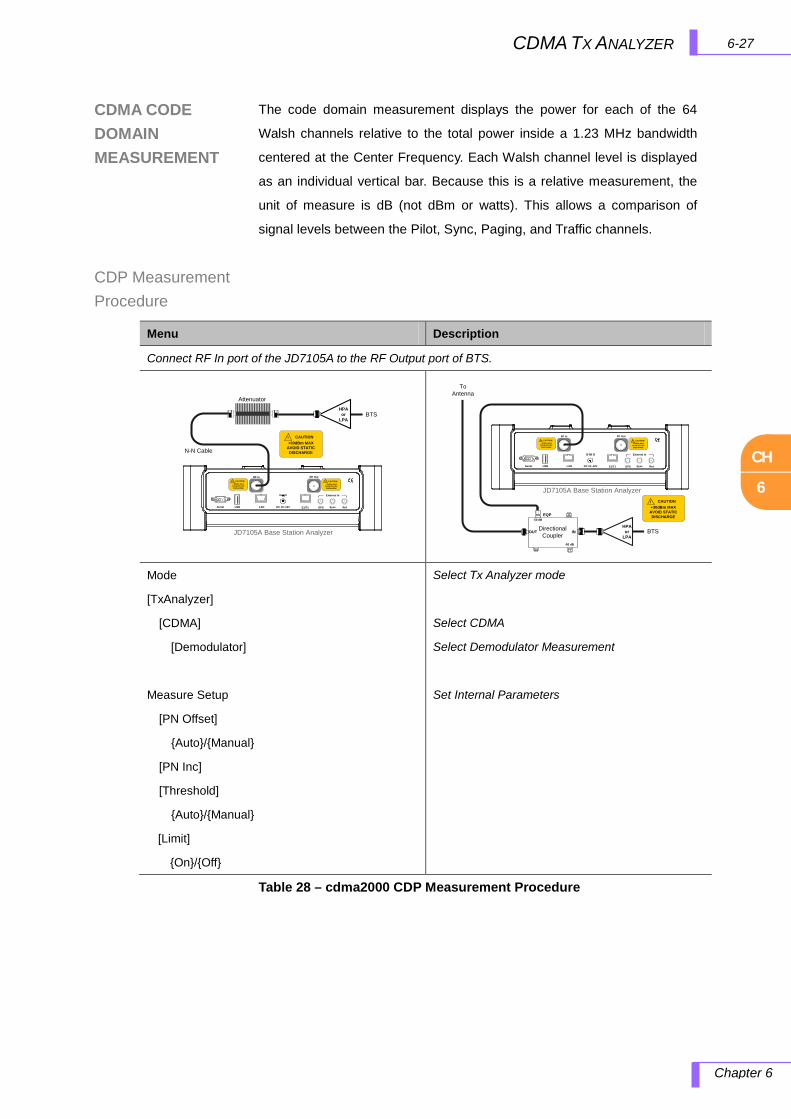
CH
6
6-27 CDMA TX ANALYZER
Chapter 6
CDMA CODE DOMAIN MEASUREMENT
CDP Measurement Procedure
The code domain measurement displays the power for each of the 64
Walsh channels relative to the total power inside a 1.23 MHz bandwidth
centered at the Center Frequency. Each Walsh channel level is displayed
as an individual vertical bar. Because this is a relative measurement, the
unit of measure is dB (not dBm or watts). This allows a comparison of
signal levels between the Pilot, Sync, Paging, and Traffic channels.
Table 28 – cdma2000 CDP Measurement Procedure
Menu Description
Connect RF In port of the JD7105A to the RF Output port of BTS.
RF In! CAUTION+30dBm MAX
AVOID STATIC DISCHARGE
Sync RefDC 15~19VLANUSBSerial GPS
RF Out
E1/T1
! CAUTION+25dBm MAX
AVOID STATIC DISCHARGE
External In
JD7105A Base Station Analyzer
N-N Cable
! CAUTION+30dBm MAX
AVOID STATIC DISCHARGE
BTSHPA or
LPA
Attenuator
JD7105A Base Station Analyzer
RF In! CAUTION+30dBm MAX
AVOID STATIC DISCHARGE
Sync RefDC 15~19VLANUSBSerial GPS
RF Out
E1/T1
! CAUTION+25dBm MAX
AVOID STATIC DISCHARGE
External In
To Antenna
DirectionalCoupler
EQP-50 dB
-50 dB
OUT IN BTSHPA
or LPA
! CAUTION+30dBm MAX
AVOID STATIC DISCHARGE
Mode
[TxAnalyzer]
[CDMA]
[Demodulator]
Measure Setup
[PN Offset]
Auto/Manual
[PN Inc]
[Threshold]
Auto/Manual
[Limit]
On/Off
Select Tx Analyzer mode
Select CDMA
Select Demodulator Measurement
Set Internal Parameters
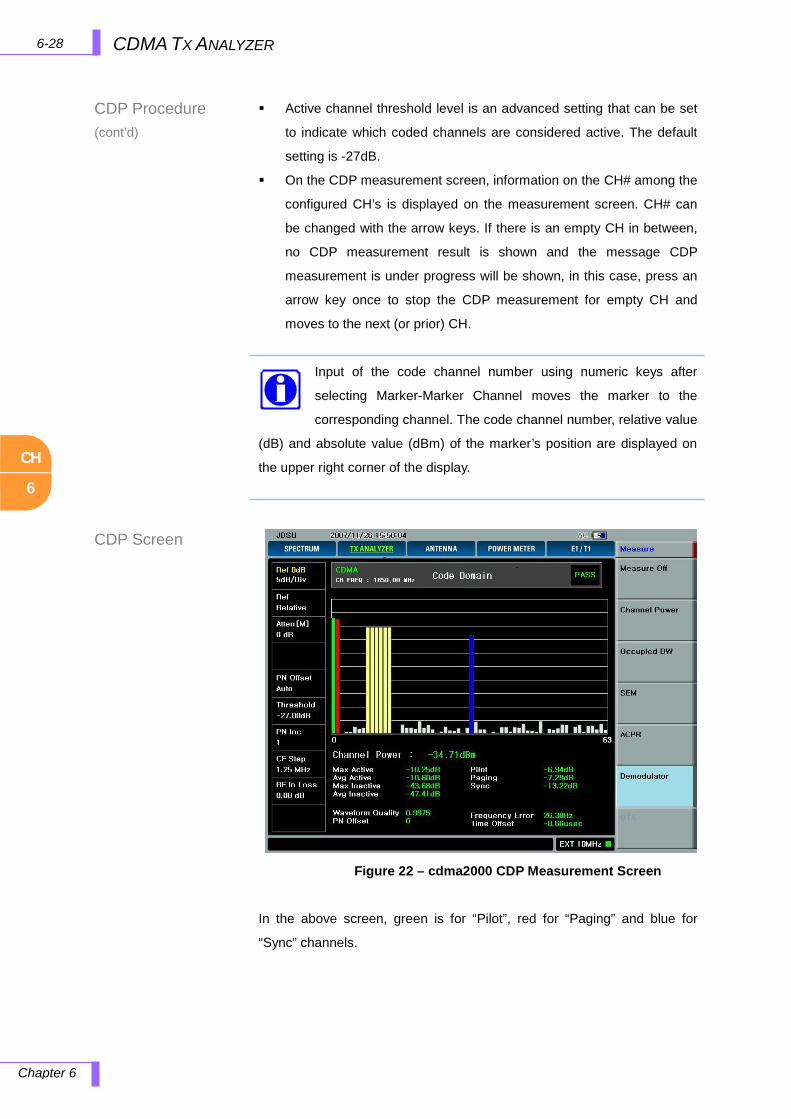
CH
6
6-28 CDMA TX ANALYZER
Chapter 6
CDP Procedure (cont’d)
CDP Screen
Active channel threshold level is an advanced setting that can be set
to indicate which coded channels are considered active. The default
setting is -27dB.
On the CDP measurement screen, information on the CH# among the
configured CH’s is displayed on the measurement screen. CH# can
be changed with the arrow keys. If there is an empty CH in between,
no CDP measurement result is shown and the message CDP
measurement is under progress will be shown, in this case, press an
arrow key once to stop the CDP measurement for empty CH and
moves to the next (or prior) CH.
Input of the code channel number using numeric keys after
selecting Marker-Marker Channel moves the marker to the
corresponding channel. The code channel number, relative value
(dB) and absolute value (dBm) of the marker’s position are displayed on
the upper right corner of the display.
In the above screen, green is for “Pilot”, red for “Paging” and blue for
“Sync” channels.
Figure 22 – cdma2000 CDP Measurement Screen

CH
6
6-29 CDMA TX ANALYZER
Chapter 6
cdma2000 CDP Measurement Items
Ec/Io
Pilot Channel Power(dBm)/Channel Power (dBm)
Sync Walsh Channel Power
Sync Channel Power(dBm)/Channel Power (dBm)
Paging Walsh Channel Power
Paging Channel Power(dBm)/Channel Power (dBm)
Traffic Walsh Channel Level
Traffic Channel Power(dBm)/Channel Power(dBm)
Frequency Error
Frequency difference between the center frequency of the
transmitter’s (BTS) and the frequency entered
Time offset
Time Offset compares the PN offset timing with the overall system
time. This measurement checks the start of PN offset in comparison
to either the GPS signal or the Even Second clock signal
Waveform Quality (Rho)
Rho = Correlated Power / Channel Power
Rho measures the modulation quality for a CDMA transmitter along
with EVM and Walsh Channel Power. It includes all errors occurred
along the transmitter chain such as base band filtering, abnormality of
I/Q modulator and distortion in power amplifier. A perfect Rho value is
1.0 indicating that all of the power is being transmitted correctly
Max Active
The highest value of active channel among Walsh code channels
except W64, W164, and W3264
Active Set: Threshold Level to discriminate Active Channel and
Inactive Channel (Factory Set: -27dB)
Average Active
∑ Traffic Channel Power / # of Traffic Channels
Max Inactive
Highest level among Inactive channels
Active Set: Threshold Level to discriminate Active Channel and
Inactive Channel (Factory Set: -27dB)
Average Inactive
∑ Uncorrelated Walsh Channel Power/ # of Inactive Channels
Pilot Power (dBm)
Incoming RF Channel Power + Ec/Io
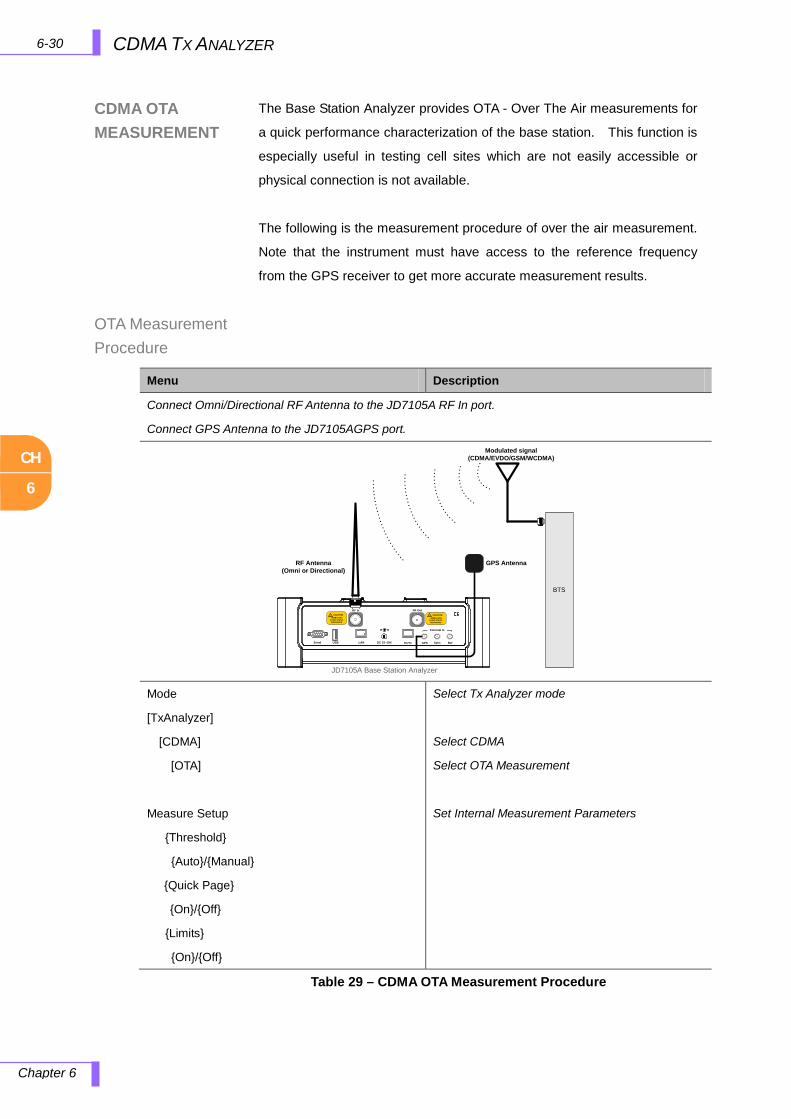
CH
6
6-30 CDMA TX ANALYZER
Chapter 6
CDMA OTA MEASUREMENT
OTA Measurement Procedure
The Base Station Analyzer provides OTA - Over The Air measurements for
a quick performance characterization of the base station. This function is
especially useful in testing cell sites which are not easily accessible or
physical connection is not available.
The following is the measurement procedure of over the air measurement.
Note that the instrument must have access to the reference frequency
from the GPS receiver to get more accurate measurement results.
Table 29 – CDMA OTA Measurement Procedure
Menu Description
Connect Omni/Directional RF Antenna to the JD7105A RF In port.
Connect GPS Antenna to the JD7105AGPS port.
RF In! CAUTION+30dBm MAX
AVOID STATIC DISCHARGE
Sync RefDC 15~19VLANUSBSerial GPS
RF Out
E1/T1
! CAUTION+25dBm MAX
AVOID STATIC DISCHARGE
External In
BTS
Modulated signal (CDMA/EVDO/GSM/WCDMA)
RF Antenna (Omni or Directional)
JD7105A Base Station Analyzer
GPS Antenna
Mode
[TxAnalyzer]
[CDMA]
[OTA]
Measure Setup
Threshold
Auto/Manual
Quick Page
On/Off
Limits
On/Off
Select Tx Analyzer mode
Select CDMA
Select OTA Measurement
Set Internal Measurement Parameters
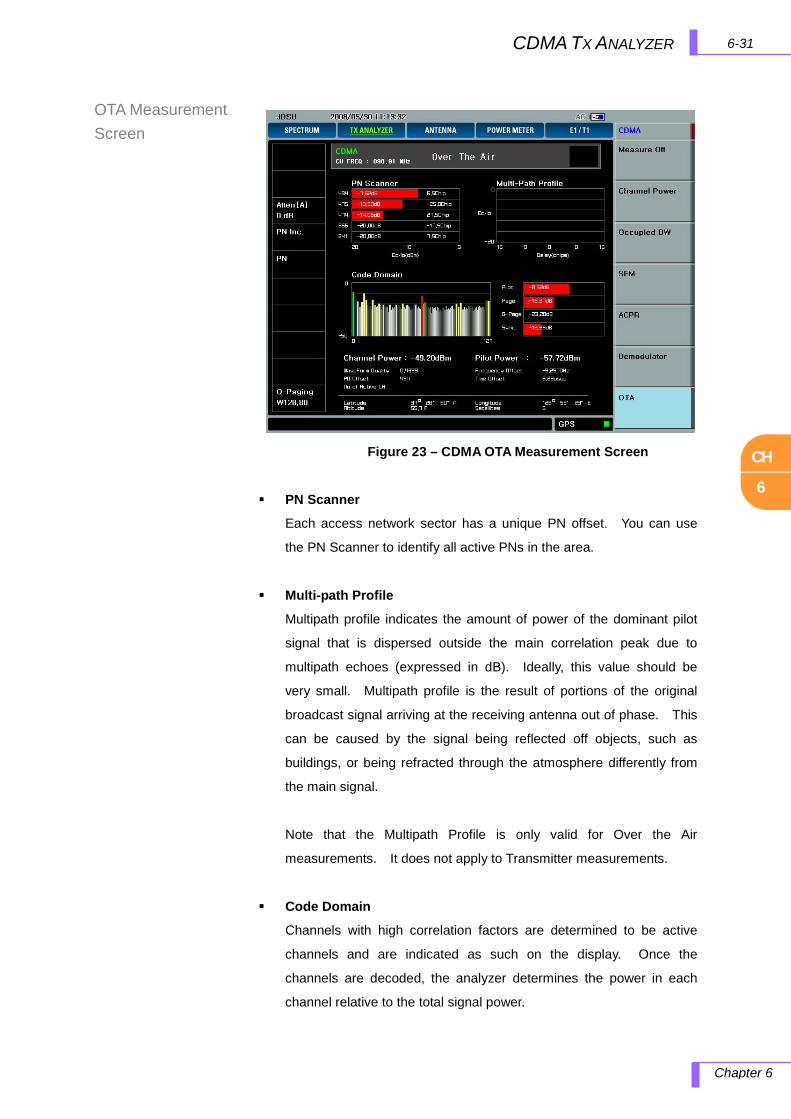
CH
6
6-31 CDMA TX ANALYZER
Chapter 6
OTA Measurement Screen
PN Scanner
Each access network sector has a unique PN offset. You can use
the PN Scanner to identify all active PNs in the area.
Multi-path Profile
Multipath profile indicates the amount of power of the dominant pilot
signal that is dispersed outside the main correlation peak due to
multipath echoes (expressed in dB). Ideally, this value should be
very small. Multipath profile is the result of portions of the original
broadcast signal arriving at the receiving antenna out of phase. This
can be caused by the signal being reflected off objects, such as
buildings, or being refracted through the atmosphere differently from
the main signal.
Note that the Multipath Profile is only valid for Over the Air
measurements. It does not apply to Transmitter measurements.
Code Domain
Channels with high correlation factors are determined to be active
channels and are indicated as such on the display. Once the
channels are decoded, the analyzer determines the power in each
channel relative to the total signal power.
Figure 23 – CDMA OTA Measurement Screen
CH
6
6-32 CDMA TX ANALYZER
Chapter 6
This measurement helps to verify that each code channel is operating
at its proper level and helps to identify problems throughout the
transmitter design from the coding to the RF section. System
imperfections, such as amplifier non-linearity, will present themselves
as an undesired distribution of power in the code domain.
Channel Power (dBm)
The channel power measurement measures the channel power within
a specified bandwidth (default of 1.23 MHz).
Pilot Power (dBm)
Incoming RF Channel Power + Ec/Io.
Ec/Io = Pilot Channel Power/Channel Power
Waveform Quality (rho)
Measure the correlated power to total power. The rho limit for CDMA
base stations as specified in the TIA IS-97 document is 0.912,
indicating that 91.2% of the correlated pilot power is contained in the
total transmission power.
Note that waveform quality, rho might be less than 0.912 when over
the air measurement due to an air-interface.
PN Offset
It is a “short code” sequence that provides a unique identifier for each
sector of each cell site. The PN Offsets are applied to the I and Q
signals before modulation. PN Offsets are offset in time by 52.08μs
and they repeat every 26.666ms. This yields 512 unique short code
sequences (0-511). The access terminal needs the PN Offset to
decode information in the Pilot and MAC channels, which are
transmitted by the access network.
Frequency Offset
To ensure that each CDMA transmitter is on its frequency and not
interfering with other CDMA channels, the standards specify very tight
frequency error performance, known as frequency tolerance. In the
PCS bands, the specification is ±0.05 parts per million, which
translates to only ±99Hz at a carrier frequency of 1980 MHz. In the
cellular bands, a CDMA transmitter must be within about 40Hz of
CH
6
6-33 CDMA TX ANALYZER
Chapter 6
absolute frequency (±0.05 ppm at a carrier frequency of 800 MHz).
To accurately measure the frequency, the test equipment must have
access to the reference frequency from the GPS receiver.
Time Offset
Each sector of each base station site operates on the same frequency
channel, and is distinguished from the others by a “PN offset”
sequence in the CDMA system. The PN offsets are offset in time by
52.08μs (64 chips) each and they repeat every 26.666ms (32768
chips). This yields 512 PN codes (32768/64), where each has a
unique offset.
The time offset measurement compares the time of the repeat to the
offset from the even-second clock (base station, or GPS time). The
CDMA standards specify a maximum offset of 10 microseconds, but 3
microseconds is a recommended maximum. If the time offset of the
target cell is too far from that of the current site, the handoff will not
happen.
This is the only transmitter test that requires the even-second clock
signal from the base station. Other transmitter tests can be
performed without this connection.
CH
7
7-1
EVDO TX ANALYZER
Chapter 7
7.0 EVDO TX ANALYZER
In this chapter
EVDO Analyzer Introduction ......................................................................................................................... 7-2
1xEV-DO Forward Link ......................................................................................................................... 7-3 Frame Structure .................................................................................................................................... 7-3 Channel Power Measurement Concepts .............................................................................................. 7-4 Code Domain (Forward Link) Measurement Concepts ......................................................................... 7-4 Modulation Accuracy (Waveform Quality) Measurement Concepts ...................................................... 7-5 Occupied Bandwidth Measurement Concepts ...................................................................................... 7-6 Spurious Emissions and Adjacent Channel Power Measurement Concepts ........................................ 7-6
Using EVDO Analyzer .................................................................................................................................. 7-8 How to Use Keys .......................................................................................................................................... 7-9
Freq/Chan ............................................................................................................................................. 7-9 Amplitude .............................................................................................................................................. 7-9 Trace/Display .......................................................................................................................................7-11 BW/AVG.............................................................................................................................................. 7-13 Marker ................................................................................................................................................ 7-14 Peak Search ....................................................................................................................................... 7-15 Measure .............................................................................................................................................. 7-16 Measure Setup ................................................................................................................................... 7-16 Display Overview ................................................................................................................................ 7-17 Setup .................................................................................................................................................. 7-18
Frequency Setup ........................................................................................................................ 7-18 External Clock Setting ................................................................................................................ 7-19 Ext Ref Clock Interface Specification .......................................................................................... 7-20
Channel Power Measurement ............................................................................................................ 7-20 Channel Power Procedure .......................................................................................................... 7-21 Channel Power Screen ............................................................................................................... 7-21
Occupied Bandwidth Measurement .................................................................................................... 7-22 Occupied Bandwidth Procedure ................................................................................................. 7-22 Occupied Bandwidth Screen ....................................................................................................... 7-23
Spurious Emission Mask Measurement .............................................................................................. 7-24 SEM Procedure .......................................................................................................................... 7-24 SEM Screen................................................................................................................................ 7-24
ACPR Measurement ........................................................................................................................... 7-25 ACPR Procedure ........................................................................................................................ 7-25 ACPR Screen ............................................................................................................................. 7-25
Code Domain Power ........................................................................................................................... 7-26 EV-DO Pilot Channel Measurement ........................................................................................... 7-26 EV-DO MAC Channel Measurement .......................................................................................... 7-26 EV-DO Traffic Channel Measurement ......................................................................................... 7-26 CDP Procedure ........................................................................................................................... 7-27 EV-DO Pilot Channel CDP .......................................................................................................... 7-28 EV-DO Pilot Channel Measurement Parameters ........................................................................ 7-29 EV-DO MAC Channel CDP ......................................................................................................... 7-29 EV-DO MAC Channel CDP Screen ............................................................................................ 7-30 EV-DO MAC Channel Measurement Parameters ....................................................................... 7-30 Required Specification for EV-DO MAC Channel........................................................................ 7-31 EV-DO Data Channel Measurement ........................................................................................... 7-31 EV-DO Data Channel Measurement Screen............................................................................... 7-32 EV-DO Traffic CDP Measurement Parameters ........................................................................... 7-32 Required Specification for EV-DO Traffic Channel ...................................................................... 7-33
CH
7
7-2 CDMA TX ANALYZER
Chapter 7
EVDO ANALYZER INTRODUCTION
1xEV-DO is the name applied to the first single-channel evolution (1xEV)
of 3GPP2 communications system optimized for data only (-DO). As 1xEV-
DO has evolved from cdma2000 (voice) systems and has structural
similarity with cdma2000, this section will describe the differences
between 1xEV-DO and cdma2000.
1xEV-DO uses what it is known as High Rate Packet Data, using the
same final spread rate of 1.2288 Mcps as does cdma2000 SR1. It also
uses the same digital filter to reduce the final modulation bandwidth; as a
result, 1xEV-DO is spectrally compatible with cdma2000 SR1. Both 1xEV-
DO and cdma2000 SR1 can utilize the same amplifiers, combiners, and
antennas, which reduces the implementation cost of 1xEV-DO.
Although 1xEV-DO is compatible with much of the existing infrastructure of
cdma2000, the two systems cannot occupy the same channel
simultaneously. Each 1xEV-DO channel requires a paired 1.25 MHz clear
channel; therefore it cannot be overlaid with cdma2000 channels.
1xEV-DO requires a dedicated CDMA channel (1.25 MHz) for the packet-
data system. This channel cannot carry any voice. The system uses the
exact chip rate and emission filters that are used in cdma2000 and IS-95
CDMA systems, so the new system is spectrally identical to legacy
systems.
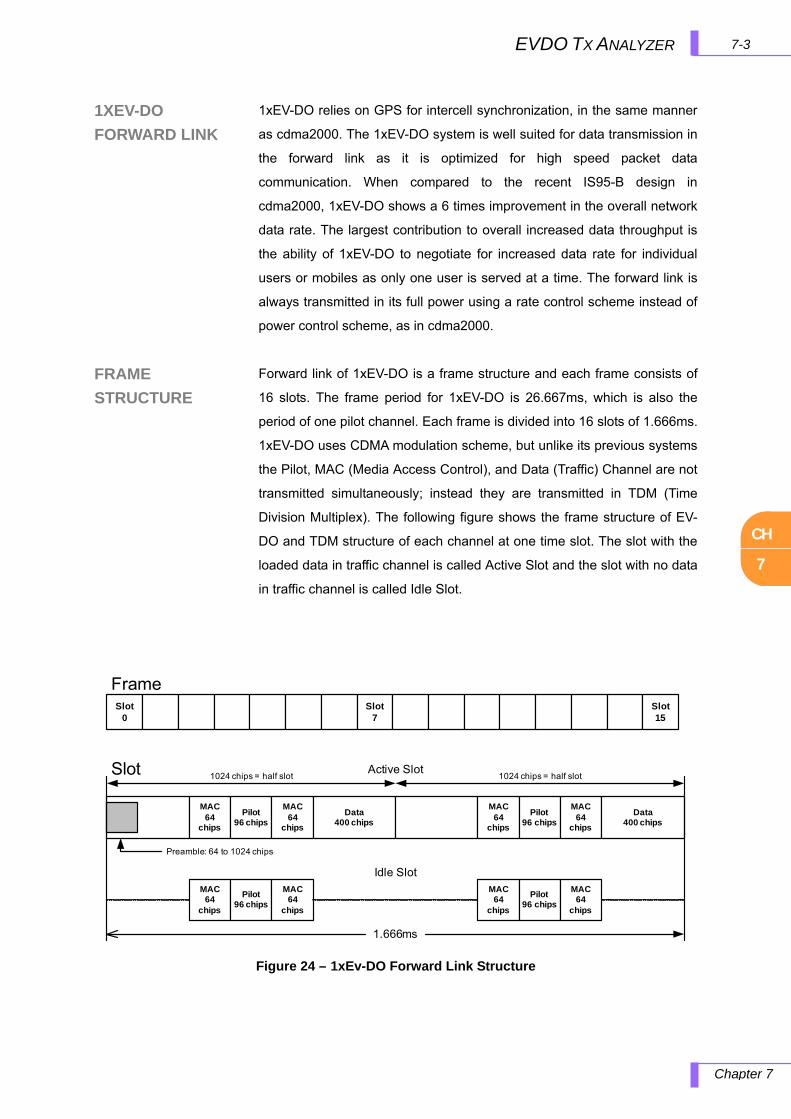
CH
7
7-3EVDO TX ANALYZER
Chapter 7
1XEV-DO
FORWARD LINK
FRAME
STRUCTURE
1xEV-DO relies on GPS for intercell synchronization, in the same manner
as cdma2000. The 1xEV-DO system is well suited for data transmission in
the forward link as it is optimized for high speed packet data
communication. When compared to the recent IS95-B design in
cdma2000, 1xEV-DO shows a 6 times improvement in the overall network
data rate. The largest contribution to overall increased data throughput is
the ability of 1xEV-DO to negotiate for increased data rate for individual
users or mobiles as only one user is served at a time. The forward link is
always transmitted in its full power using a rate control scheme instead of
power control scheme, as in cdma2000.
Forward link of 1xEV-DO is a frame structure and each frame consists of
16 slots. The frame period for 1xEV-DO is 26.667ms, which is also the
period of one pilot channel. Each frame is divided into 16 slots of 1.666ms.
1xEV-DO uses CDMA modulation scheme, but unlike its previous systems
the Pilot, MAC (Media Access Control), and Data (Traffic) Channel are not
transmitted simultaneously; instead they are transmitted in TDM (Time
Division Multiplex). The following figure shows the frame structure of EV-
DO and TDM structure of each channel at one time slot. The slot with the
loaded data in traffic channel is called Active Slot and the slot with no data
in traffic channel is called Idle Slot.
Slot0
Slot7
Slot 15
MAC64
chips
Pilot96 chips
MAC64
chips
Data400 chips
Frame
Active Slot
MAC64
chips
Pilot96 chips
MAC64
chips
Data400 chips
MAC64
chips
Pilot96 chips
MAC64
chips
MAC64
chips
Pilot96 chips
MAC64
chips
Preamble: 64 to 1024 chips
1024 chips = half slot 1024 chips = half slot
Idle Slot
1.666ms
Slot
Figure 24 – 1xEv-DO Forward Link Structure

CH
7
7-4 CDMA TX ANALYZER
Chapter 7
CHANNEL POWER MEASUREMENT CONCEPTS
CODE DOMAIN (FORWARD LINK) MEASUREMENT CONCEPTS
The Channel Power measurement is a common test used in the wireless
industry to measure the total transmitted power of a radio within a defined
frequency channel. This procedure measures the total power within the
defined channel for 1xEV-DO. This measurement is applied the design,
characterization, evaluation, and verification of transmitters and their
components, or devices, for base stations and mobile stations.
For 1xEV-DO, depending on the installed measurement personality
revision and measurement selection, the test device is fixed to a base
station.
The Channel Power measurement reports the total transmitted power
within the channel bandwidth, 1.23 MHz for the 1xEV-DO mode. The
measurement acquires a number of points representing the input signal in
the time domain. It transforms this information into the frequency domain
using FFT and then calculates the channel power.
Since the code domain measurements de-spread and descramble the
1xEV-DO signal into its physical channels, the number of active channels
of various symbol rates (which are denoted by widths) can be observed.
The width of the channel is inversely proportional to the Walsh code length
in number of bits. In the code domain, there is a fixed amount of code
space for a given chip rate. Therefore, by using the different Walsh codes,
the system can dynamically allocate the code spaces for high speed data
users.
This code domain power composite view provides information about the
in-channel characteristics of the 1xEV-DO signal. It directly informs the
user of the active channels with their individual channel powers. The
composite view also shows which data rates are active and the
corresponding amount of code space used. The following are conditions
under which a general unlock can occur: the Pilot signal is too low in
power or no Pilot signal is available, the frequency error is too large, or a
frequency inversion is present.
CH
7
7-5
EVDO TX ANALYZER
Chapter 7
MODULATION ACCURACY (WAVEFORM QUALITY) MEASUREMENT CONCEPTS
When the level of the code domain noise floor is too high, relative to a
reference or an expected level, one of the possible causes might be due
to CW interference, like local oscillator feed through or spurs. I/Q
modulation impairments can be another source of this uncorrelated noise.
The I/Q demodulation measurements can reveal errors such as I/Q gain
imbalance or I/Q Quadrature error.
This procedure measures the power levels of the spread channels in
composite RF channels.
The code domain measurement displays the power for each of the spread
channels, relative to the total power within the 1.230 MHz channel
bandwidth centered at the center frequency. Each spread channel level is
displayed as an individual vertical bar with a different width determined by
a spread rate. Because this is a relative measurement, the unit of
measure is dB (not dBm or watts). This allows a comparison of signal
levels between the Pilot, MAC, and Traffic channels.
Rho is one of the key modulation quality metrics, along with EVM and
code domain power. Rho is the ratio of the correlated power in a single
coded channel to the total signal power. This is a simplified case of code
domain power since this measurement is made on a single coded channel.
This measurement takes into account all possible error mechanisms in the
entire transmission chain including baseband filtering, I/Q modulation
anomalies, filter amplitude, phase nonlinearities, and power amplifier
distortion. This provides an overall indication of the performance level of
the transmitter.
In a digitally modulated signal, it is possible to predict what the ideal
magnitude and phase of the carrier should be at any time, based on the
transmitted data sequence. The transmitter’s modulated signal is
compared to an ideal signal vector. The difference between these two
vectors is sampled and processed using DSP. Rho values are in the range
of 0.000 to 1.000. A value of 1.000 indicates perfect correlation to the
reference (high modulation quality).
CH
7
7-6 CDMA TX ANALYZER
Chapter 7
OCCUPIED BANDWIDTH MEASUREMENT CONCEPTS
SPURIOUS EMISSIONS AND ADJACENT CHANNEL POWER MEASUREMENT CONCEPTS
Occupied bandwidth measurements express the percentage of the
transmitted power within a specified bandwidth. This percentage is
typically 99%.
The spectrum shape of a 1xEV-DO signal can give useful qualitative
insight into transmitter operation. Any distortion to the spectrum shape can
indicate problems of the transmitter’s performance.
The instrument uses digital signal processing (DSP) to sample the input
signal and convert it to the frequency domain. With the instrument tuned to
a fixed center frequency, samples are digitized at a high rate with DSP
hardware, and then converted to the frequency domain with FFT software.
The total power within the measured frequency span is integrated for its
100% of power. The frequencies of 0.5% of the total power are then
calculated to get 99.0% bandwidth.
Spurious Emissions Mask (SEM) & Adjacent Channel Power (ACP)
measurements include the in-band and out-of-band adjacent channel
power and spurious emissions. ACP, as it applies to 1xEV-DO, is the
power contained in a specified frequency channel bandwidth relative to the
carrier frequency. It may also be expressed as power spectral density
between the carrier and the specified offset frequency band.
As a composite measurement of out-of-channel emissions, Spurious
Emissions and ACP combines both in-band and out-of-band specifications
to provide useful values of figure-of-merit for spectral re-growth as well as
spurious emissions produced by nonlinear components and circuit blocks.
To maintain a quality data transmission and avoid adjacent channel
interference, it is necessary to measure and reduce the adjacent channel
power transmitted by an access network. The characteristics of adjacent
channel power are mainly determined by the transmitter design, in
particular the power amplifiers and the low-pass filters.
Adjacent channel power is defined by 1xEV-DO standard as the total
power within the bandwidth of ±15 kHz, with the filters edge at 750 kHz
offset from the carrier frequency.

CH
7
7-7
EVDO TX ANALYZER
Chapter 7
Spurious Emissions and Adjacent Channel Power Measurement Concepts (cont’d)
This ACP measurement analyzes the total power levels within the defined
carrier bandwidth at given frequency offsets on both sides of the carrier's
frequency. Also, the SEM measures spurious signal levels in given offsets
or region frequencies and relates them to the carrier power. These
measurements require the user to specify measurement bandwidths of the
carrier channel and each of the offset frequency pairs up to 5. Each pair
may be defined with unique measurement bandwidth.
A reference channel integration bandwidth method is used to measure the
carrier channel power, and offset or region power. When “ACP” is selected,
the adjacent channel power measurement is made with the optimized
region and limits settings. When “SEM” is selected, the conducted
spurious emissions measurements are made with the optimized parameter
settings. This integration bandwidth (IBW) method performs a data
acquisition. In this process, the reference channel integration bandwidth
(Meas. BW) is analyzed using the defined resolution bandwidth (Res. BW),
which is narrower than the channel bandwidth. The measurement
computes an average power of the channel, offset, or region over a
specified number of data acquisition, automatically compensating for
resolution bandwidth and noise bandwidth.
CH
7
7-8 CDMA TX ANALYZER
Chapter 7
USING EVDO ANALYZER
This section describes the analysis function to test the proper transmitter
performance of EVDO systems.
The JD7105A provides the following analysis for 1xEV-DO system.
Channel Power
Occupied Bandwidth
Spurious Emission
ACPR
Demodulator (Code Domain Analyzer)
OTA
Auto Measure

CH
7
7-9
EVDO TX ANALYZER
Chapter 7
FREQ/CHAN
AMPLITUDE
HOW TO USE KEYS
This section provides the keys used in 1x EVDO Tx Analysis mode.
Freq/Chan
Sets the Frequency by selecting standard or custom frequency bands.
CENTER FREQUENCY: Changes the center frequency setup in the
spectrum measurement. Values can be entered with the Data Entry key,
the Knob or the arrow keys. When using the Data Entry key, the input is
completed by selecting the soft key with the corresponding value unit.
When using the Knob or the arrow keys, the center frequency changes in
predefined frequency steps. The frequency steps can be configured
selecting the CF Step Menu.
CF STEP: Defines the moving unit of center frequency. Values can be
entered by Data Entry key or changed through the knob. When using Data
Entry key, input is completed by selecting the unit input value. When using
the knob or the arrow keys the frequency value is increased by 0.1MHz.
CHANNEL STANDARD: Using this key, the channel band can be selected
without setting Start, Stop, and Center frequencies. The saved custom
channel bands will pop-up to select the proper band.
UNIT: Selects the unit to be used, either Frequency or Channel. When
the “Chan” is selected, the CF Step corresponds to Channel Step.
Amplitude
When the instrument is in Channel Power, Occupied Bandwidth, SEM,
and ACPR measurement mode, an Amplitude key is used as below.
AUTO SCALE: The instrument can automatically set the scale to the
minimum and maximum values off the Y-axis of the graph for optimum
display of the traces measured. Each time the AUTO SCALE is selected,
the top and bottom scales are set to the minimum and maximum values
with margin on the Y-axis of the screen display.
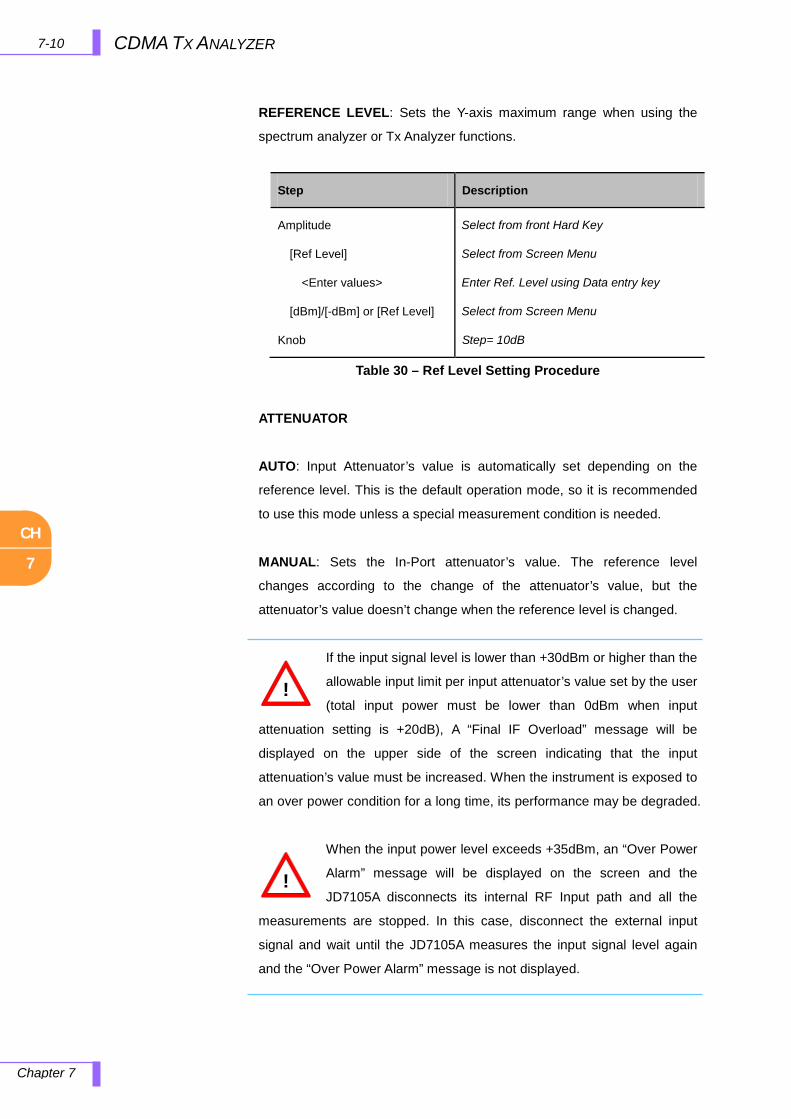
CH
7
7-10 CDMA TX ANALYZER
Chapter 7
REFERENCE LEVEL: Sets the Y-axis maximum range when using the
spectrum analyzer or Tx Analyzer functions.
Step Description
Amplitude
[Ref Level]
<Enter values>
[dBm]/[-dBm] or [Ref Level]
Knob
Select from front Hard Key
Select from Screen Menu
Enter Ref. Level using Data entry key
Select from Screen Menu
Step= 10dB
Table 30 – Ref Level Setting Procedure
ATTENUATOR
AUTO: Input Attenuator’s value is automatically set depending on the
reference level. This is the default operation mode, so it is recommended
to use this mode unless a special measurement condition is needed.
MANUAL: Sets the In-Port attenuator’s value. The reference level
changes according to the change of the attenuator’s value, but the
attenuator’s value doesn’t change when the reference level is changed.
If the input signal level is lower than +30dBm or higher than the
allowable input limit per input attenuator’s value set by the user
(total input power must be lower than 0dBm when input
attenuation setting is +20dB), A “Final IF Overload” message will be
displayed on the upper side of the screen indicating that the input
attenuation’s value must be increased. When the instrument is exposed to
an over power condition for a long time, its performance may be degraded.
When the input power level exceeds +35dBm, an “Over Power
Alarm” message will be displayed on the screen and the
JD7105A disconnects its internal RF Input path and all the
measurements are stopped. In this case, disconnect the external input
signal and wait until the JD7105A measures the input signal level again
and the “Over Power Alarm” message is not displayed.
!
!
CH
7
7-11
EVDO TX ANALYZER
Chapter 7
TRACE/DISPLAY
RF IN LOSS: Sets an external offset value. An offset consists of a cable
offset and a user offset, and the measurement result shows the value
reflecting both offset values. Even if an offset is set, the reference level is
automatically adjusted to avoid the waveform fitting out of the screen. An
offset value set in Spectrum mode have precedence over the offset value
set in Analysis Mode.
When the instrument is in Demodulator mode, an Amplitude key is
used as below.
ATTENUATOR
AUTO: Input Attenuator’s value is automatically set depending on the
reference level. This is the default operation mode, so it is recommended
to use this mode unless a special measurement condition is needed.
MANUAL: Sets the In-Port attenuator’s value. The reference level
changes according to the change of the attenuator’s value, but the
attenuator’s value doesn’t change when the reference level is changed.
REFERENCE: Selects the relative or absolute value to be displayed.
REL: The code domain power is measured relative to channel power.
ABS: The code domain power is measured absolute to channel power.
RF IN LOSS: Sets an external offset value. An offset consists of a cable
offset and a user offset, and the measurement result shows the value
reflecting both offset values. Even if an offset is set, the reference level is
automatically adjusted to avoid the waveform fitting out of the screen. An
offset value set in Spectrum mode have precedence over the offset value
set in Analysis Mode.
This key is not used in ACPR measurement mode.
When the instrument is in Channel Power, Occupied Bandwidth, SEM,
measurement mode, a Trace/Display key is used as below.
TRACE SELECT: Selects an active trace from T1 ~ T6. Every time Select
screen menu is pressed, the active trace changes. Trace numbers are
assigned to each captured traces or loaded traces.
CH
7
7-12 CDMA TX ANALYZER
Chapter 7
TRACE VIEW: Hides or displays the trace number on the screen. Press
the Select screen menu key to choose the Trace number. Traces with
View set OFF are hidden from the screen. Setting View On restores
hidden traces and information on the window.
M: Max Hold
m: Min Hold
C: Captured Trace
W: Current Trace
L: Loaded Trace
TRACE CAPTURE: Captures a current trace on the screen with assigned
trace number.
CLEAR WRITE: Clear selected Trace and Write (Assign) current trace.
MAX HOLD: Sets Active trace Max Hold. Active trace compares newly
acquired data with the trace shown on the screen and displays the bigger
trace on the screen.
MIN HOLD: Sets Active trace Min Hold. Active trace compares newly
acquired data with the trace shown on the screen and displays the smaller
trace on the screen.
TRACE CLEAR: Deletes an active trace from the screen. The cleared
trace is not restored. It is used to select and delete a trace one by one
when multiple traces are displayed on the screen. Verify the traces to
delete with Trace View ON/OFF function in advance settings as cleared
traces cannot be restored.
CLEAR CURRENT: Deletes an active trace from the screen. The cleared
trace is not restored. It is used to select and delete a trace one by one
when multiple traces are displayed on the screen. Verify the traces to
delete with View ON/OFF function in advance settings as cleared traces
cannot be restored.
CLEAR ALL: Deletes all traces from the instrument and initialize the trace
settings.
CH
7
7-13
EVDO TX ANALYZER
Chapter 7
BW/AVG
When the instrument is in Demodulator mode, a Trace/Display key is
used as below.
MAC CDP: Selects between Mac Index or Walsh Code. Code Domain
power changes by selecting Max index (or Walsh code).
CODOGRAM: Selects codogram view.
CODOGRAM OFF/ON: Turns Codogram view On/Off.
RESET/RESTART: Reset current measurement and restart.
TIME INTERVAL: Selects AM, FM or CW tone to be
demodulated.
AUTO SAVE: Saves the measurement data automatically to
external memory, USB.
TIME CURSOR: Sets Time Cursor on the measurement.
AVERAGE: Sets the number of measurements to be averaged for the
trace presentation. A maximum of 99 times of averaging can be set.
SWEEP CTRL: Selects the sweep method between "Continue" and "Hold".
When the instrument is in Demodulator mode, an BW/AVG key is
used as below.
SWEEP CTRL: Selects the sweep method between "Continue" and "Hold".
CH
7
7-14 CDMA TX ANALYZER
Chapter 7
MARKER
This key is not used in ACPR measurement mode.
When the instrument is in Channel Power, Occupied Bandwidth, SEM,
Demodulator measurement mode, a Marker key is used as below.
Marker is used to get the information about a specific trace. A total of six
Markers can be set and each marker can be used independently. The X,
and Y coordinates of the trace are displayed when the maker is placed on
any position of the trace. As the position displaying Marker’s X and Y
coordinates may be slightly different for each measurement mode, refer to
the description of each measurement after this chapter.
MARKER SELECT: Selects an active marker which its position can be
changed with the knob or the arrow keys. The assigned number of active
markers is displayed on the Marker Select screen menu and the marker’s
number is also displayed next to the marker on the trace when the Marker
View On is selected.
MARKER VIEW: Hides or displays the selected marker on the screen. In
the same measurement mode markers appear at the previous positions
when the Marker View is turned off and on. If a measurement mode has
been changed, markers are not restored to their previous positions.
MARKER TYPE:
Selects the type of Marker to be displayed, Normal marker provide the
reading of its position and Delta marker provides the differences between
two sets of marker points.
NORMAL: Used to place a marker, along with the marker number,
1-6, on the trace.
DELTA: Delta Marker is associated with a Normal Marker, so a
Normal Maker must be set before a Delta marker is set. When a
Delta Marker is set, the position set by the Delta Marker becomes
the reference position of the Normal Marker and the Maker’s X
and Y values displays the difference compared with Delta Marker.
CH
7
7-15
EVDO TX ANALYZER
Chapter 7
PEAK SEARCH
MARKER CLEAR ALL: Turns all markers off the screen. Markers are
redisplayed on the previous position if markers are turned back on. If a
measurement mode is changed, current settings are not restored.
MARKER EDIT: Sets the marker position manually. A pop-up window
appears for users to set the frequency by entering numeric values and the
marker position is moved to the setting frequency.
This key is not used in ACPR measurement mode.
When the instrument is in Channel Power, Occupied Bandwidth, SEM,
Demodulator measurement mode, a Peak Search key is used as
below.
Each time Peak Search key is pressed, a marker is displayed on the
highest peak of the Trace.
PEAK RIGHT: Moves the marker to the next highest peak at the right of its
current position.
PEAK LEFT: Moves the marker to the next highest peak at the left of its
current position.
MAX SEARCH: Moves the marker to the highest peak of the trace.
MIN SEARCH: Moves the marker to the lowest peak of the trace.
ALWAYS PEAK: Moves the marker automatically to the highest peak of
the trace each time the trace is updated.
CH
7
7-16 CDMA TX ANALYZER
Chapter 7
MEASURE
MEASURE SETUP
When the instrument is in Tx Analyzer Mode, Measure key is used to
select measurement menu listed below.
Channel Power Measurement Occupied Bandwidth Measurement SEM Measurement ACPR Measurement Demodulator Measurement OTA Measurement Auto Measure This key is not in used when the instrument is in Channel Power,
Occupied Bandwidth, SEM, and ACPR measurement mode.
When the instrument is in Demodulator mode, a Measure Setup key
is used as below.
THRESHOLD: Indicates which codes are considered active.
CDP TYPE: CDP type parameter is used to specify whether you are
dispreading pilot, MAC64 and Data.
LIMITS ON/OFF: Enable or Disable Limits.
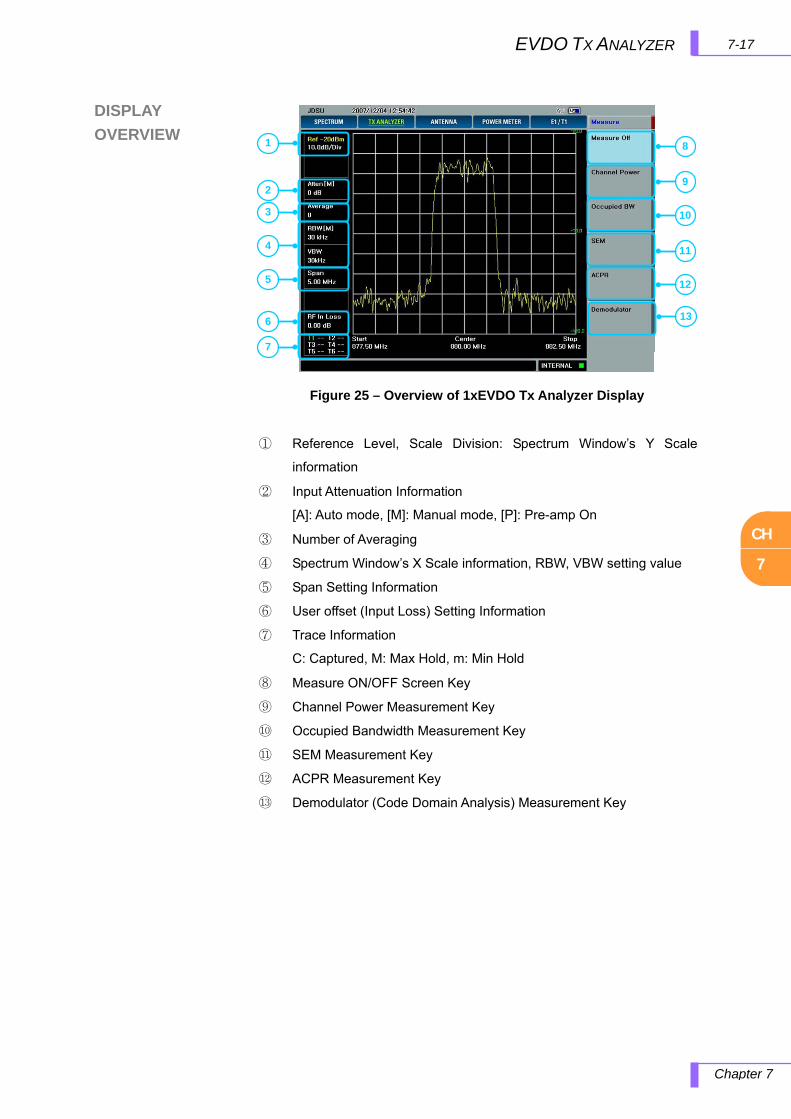
CH
7
7-17EVDO TX ANALYZER
Chapter 7
DISPLAY
OVERVIEW
① Reference Level, Scale Division: Spectrum Window’s Y Scale
information
② Input Attenuation Information
[A]: Auto mode, [M]: Manual mode, [P]: Pre-amp On
③ Number of Averaging
④ Spectrum Window’s X Scale information, RBW, VBW setting value
⑤ Span Setting Information
⑥ User offset (Input Loss) Setting Information
⑦ Trace Information
C: Captured, M: Max Hold, m: Min Hold
⑧ Measure ON/OFF Screen Key
⑨ Channel Power Measurement Key
⑩ Occupied Bandwidth Measurement Key
⑪ SEM Measurement Key
⑫ ACPR Measurement Key
⑬ Demodulator (Code Domain Analysis) Measurement Key
1
2
3
4
5
6
7
8
13
9
10
11
12
Figure 25 – Overview of 1xEVDO Tx Analyzer Display
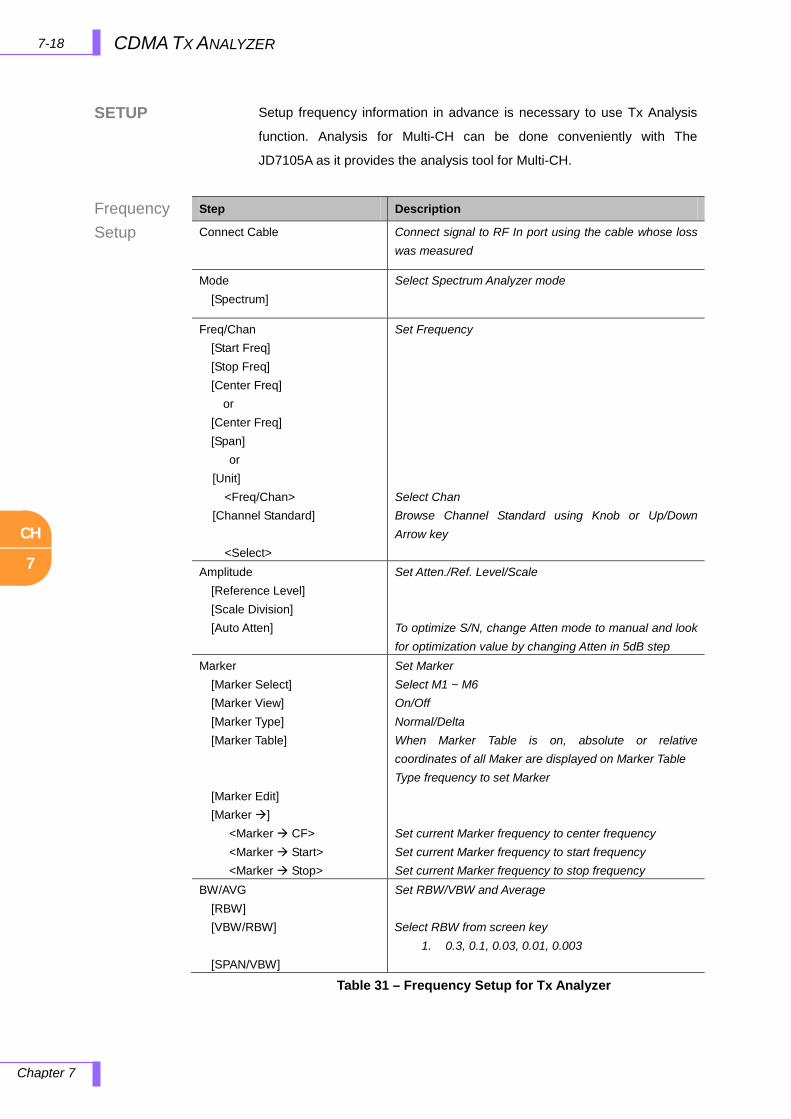
CH
7
7-18 CDMA TX ANALYZER
Chapter 7
SETUP
Frequency Setup
Setup frequency information in advance is necessary to use Tx Analysis
function. Analysis for Multi-CH can be done conveniently with The
JD7105A as it provides the analysis tool for Multi-CH.
Table 31 – Frequency Setup for Tx Analyzer
Step Description
Connect Cable Connect signal to RF In port using the cable whose loss was measured
Mode [Spectrum]
Select Spectrum Analyzer mode
Freq/Chan [Start Freq] [Stop Freq] [Center Freq]
or [Center Freq] [Span]
or [Unit] <Freq/Chan> [Channel Standard] <Select>
Set Frequency Select Chan Browse Channel Standard using Knob or Up/Down Arrow key
Amplitude [Reference Level] [Scale Division] [Auto Atten]
Set Atten./Ref. Level/Scale To optimize S/N, change Atten mode to manual and look for optimization value by changing Atten in 5dB step
Marker [Marker Select] [Marker View] [Marker Type] [Marker Table] [Marker Edit] [Marker ] <Marker CF>
<Marker Start> <Marker Stop>
Set Marker Select M1 ~ M6 On/Off Normal/Delta When Marker Table is on, absolute or relative coordinates of all Maker are displayed on Marker Table Type frequency to set Marker Set current Marker frequency to center frequency Set current Marker frequency to start frequency Set current Marker frequency to stop frequency
BW/AVG [RBW] [VBW/RBW] [SPAN/VBW]
Set RBW/VBW and Average Select RBW from screen key
1. 0.3, 0.1, 0.03, 0.01, 0.003
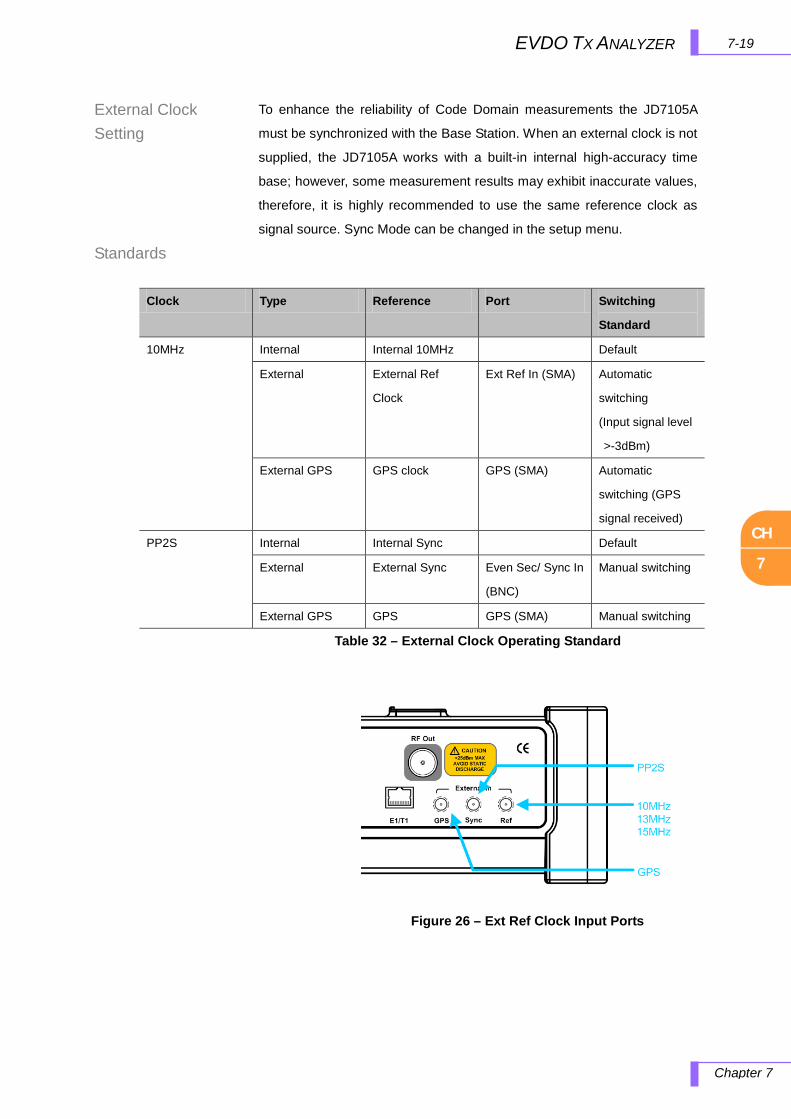
CH
7
7-19
EVDO TX ANALYZER
Chapter 7
External Clock Setting
Standards
To enhance the reliability of Code Domain measurements the JD7105A
must be synchronized with the Base Station. When an external clock is not
supplied, the JD7105A works with a built-in internal high-accuracy time
base; however, some measurement results may exhibit inaccurate values,
therefore, it is highly recommended to use the same reference clock as
signal source. Sync Mode can be changed in the setup menu.
Table 32 – External Clock Operating Standard
Clock Type Reference Port Switching
Standard
10MHz Internal Internal 10MHz Default
External External Ref
Clock
Ext Ref In (SMA) Automatic
switching
(Input signal level
>-3dBm)
External GPS GPS clock GPS (SMA) Automatic
switching (GPS
signal received)
PP2S Internal Internal Sync Default
External External Sync Even Sec/ Sync In
(BNC)
Manual switching
External GPS GPS GPS (SMA) Manual switching
Figure 26 – Ext Ref Clock Input Ports

CH
7
7-20 CDMA TX ANALYZER
Chapter 7
Ext Ref Clock Interface Specification
CHANNEL POWER MEASUREMENT
Table 33 – Ext. Ref. Clock Interface Spec
Channel Power measures the integrated strength of the wireless signal
within a defined bandwidth. It is the primary measurement in the CDMA
systems. Channel power measurement of cdmaOne channel is made by
integrating the spectral density within 1.23MHz integration bandwidth
using the spectrum data from FFT. Since the JD7105A utilizes pre-defined
data points and RBW to perform the measurement, some parameters
cannot be changed.
Port Name Signal Characteristics
Even Sec Sync In PP2S
10msec
TTL compatible
Ext Ref In 10MHz Analog:
-10 ~ +10dBm
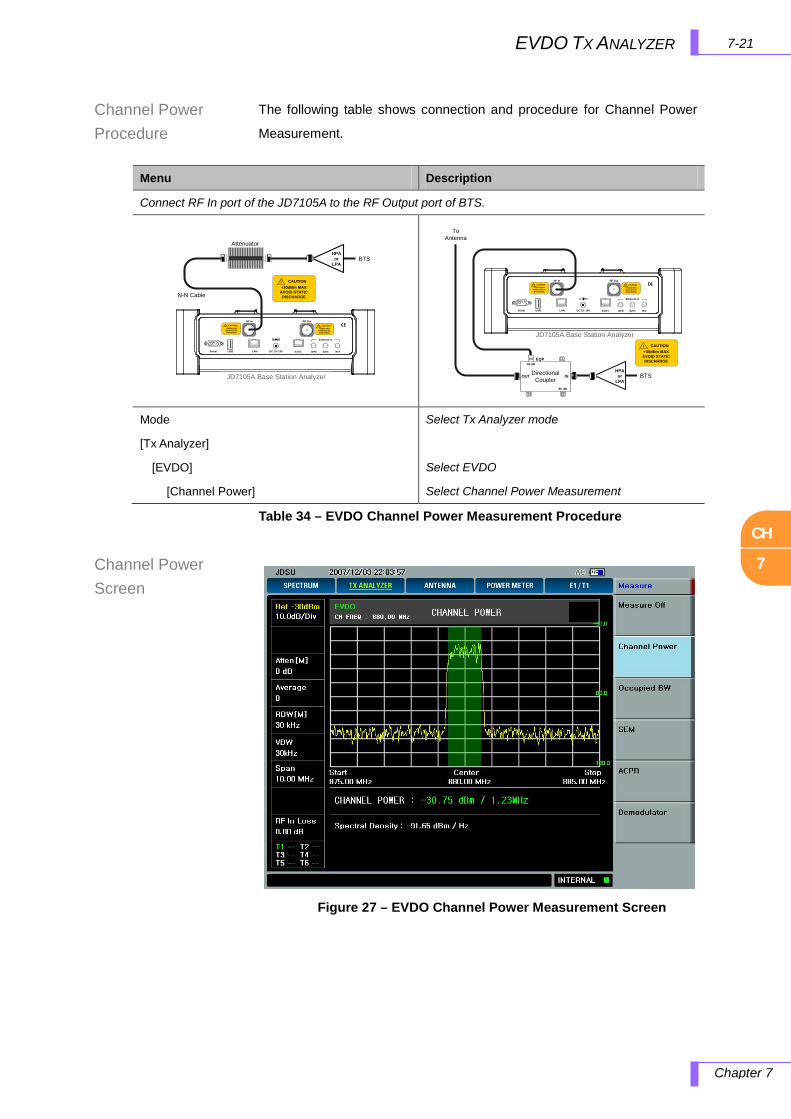
CH
7
7-21
EVDO TX ANALYZER
Chapter 7
Channel Power Procedure
Channel Power Screen
The following table shows connection and procedure for Channel Power
Measurement.
Table 34 – EVDO Channel Power Measurement Procedure
Menu Description
Connect RF In port of the JD7105A to the RF Output port of BTS.
RF In! CAUTION+30dBm MAX
AVOID STATIC DISCHARGE
Sync RefDC 15~19VLANUSBSerial GPS
RF Out
E1/T1
! CAUTION+25dBm MAX
AVOID STATIC DISCHARGE
External In
JD7105A Base Station Analyzer
N-N Cable
! CAUTION+30dBm MAX
AVOID STATIC DISCHARGE
BTSHPA
or LPA
Attenuator
JD7105A Base Station Analyzer
RF In! CAUTION+30dBm MAX
AVOID STATIC DISCHARGE
Sync RefDC 15~19VLANUSBSerial GPS
RF Out
E1/T1
! CAUTION+25dBm MAX
AVOID STATIC DISCHARGE
External In
To Antenna
DirectionalCoupler
EQP-50 dB
-50 dB
OUT IN BTSHPA
or LPA
! CAUTION+30dBm MAX
AVOID STATIC DISCHARGE
Mode
[Tx Analyzer]
[EVDO]
[Channel Power]
Select Tx Analyzer mode
Select EVDO
Select Channel Power Measurement
Figure 27 – EVDO Channel Power Measurement Screen
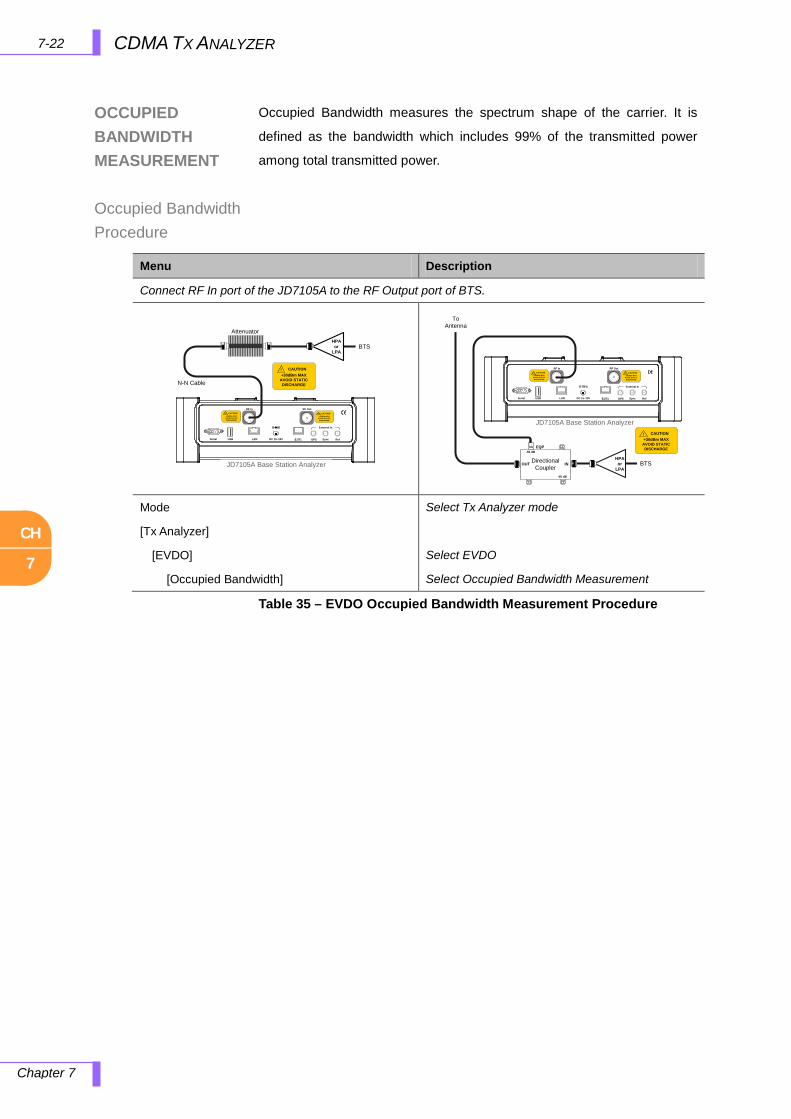
CH
7
7-22 CDMA TX ANALYZER
Chapter 7
OCCUPIED BANDWIDTH MEASUREMENT
Occupied Bandwidth Procedure
Occupied Bandwidth measures the spectrum shape of the carrier. It is
defined as the bandwidth which includes 99% of the transmitted power
among total transmitted power.
Table 35 – EVDO Occupied Bandwidth Measurement Procedure
Menu Description
Connect RF In port of the JD7105A to the RF Output port of BTS.
RF In! CAUTION+30dBm MAX
AVOID STATIC DISCHARGE
Sync RefDC 15~19VLANUSBSerial GPS
RF Out
E1/T1
! CAUTION+25dBm MAX
AVOID STATIC DISCHARGE
External In
JD7105A Base Station Analyzer
N-N Cable
! CAUTION+30dBm MAX
AVOID STATIC DISCHARGE
BTSHPA
or LPA
Attenuator
JD7105A Base Station Analyzer
RF In! CAUTION+30dBm MAX
AVOID STATIC DISCHARGE
Sync RefDC 15~19VLANUSBSerial GPS
RF Out
E1/T1
! CAUTION+25dBm MAX
AVOID STATIC DISCHARGE
External In
To Antenna
DirectionalCoupler
EQP-50 dB
-50 dB
OUT IN BTSHPA
or LPA
! CAUTION+30dBm MAX
AVOID STATIC DISCHARGE
Mode
[Tx Analyzer]
[EVDO]
[Occupied Bandwidth]
Select Tx Analyzer mode
Select EVDO
Select Occupied Bandwidth Measurement
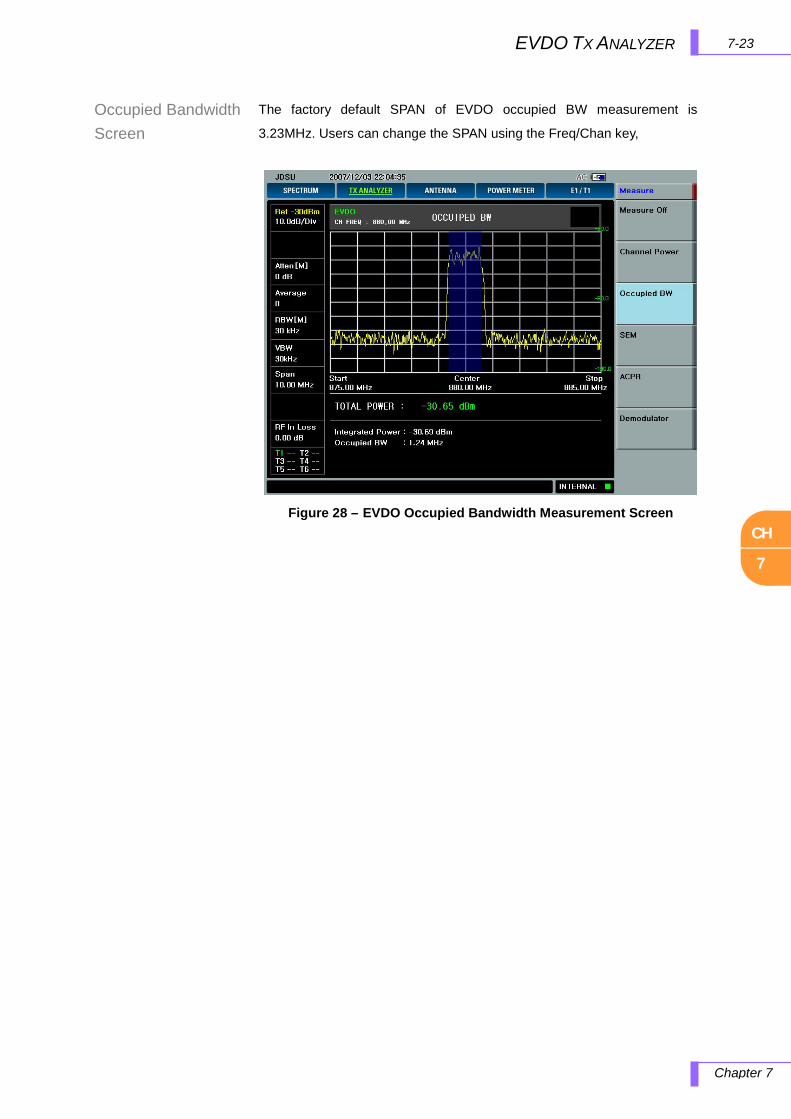
CH
7
7-23
EVDO TX ANALYZER
Chapter 7
Occupied Bandwidth Screen
The factory default SPAN of EVDO occupied BW measurement is
3.23MHz. Users can change the SPAN using the Freq/Chan key,
Figure 28 – EVDO Occupied Bandwidth Measurement Screen
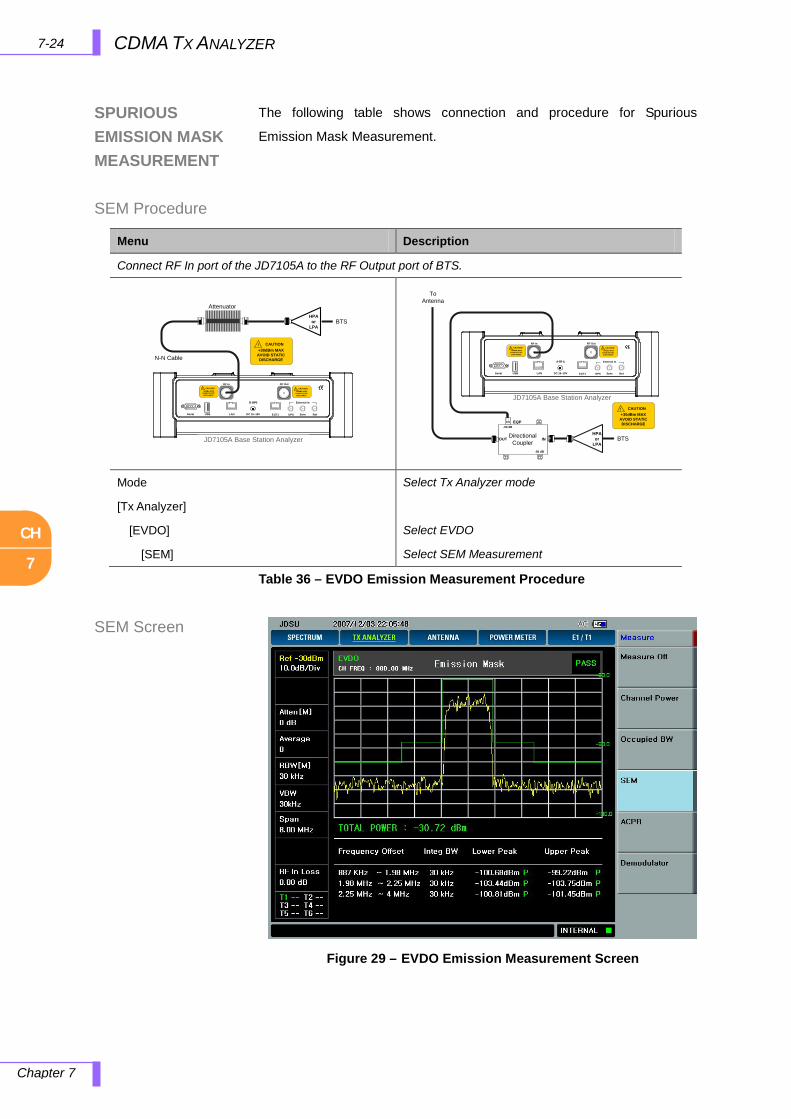
CH
7
7-24 CDMA TX ANALYZER
Chapter 7
SPURIOUS EMISSION MASK MEASUREMENT
SEM Procedure
SEM Screen
The following table shows connection and procedure for Spurious
Emission Mask Measurement.
Table 36 – EVDO Emission Measurement Procedure
Menu Description
Connect RF In port of the JD7105A to the RF Output port of BTS.
RF In! CAUTION+30dBm MAX
AVOID STATIC DISCHARGE
Sync RefDC 15~19VLANUSBSerial GPS
RF Out
E1/T1
! CAUTION+25dBm MAX
AVOID STATIC DISCHARGE
External In
JD7105A Base Station Analyzer
N-N Cable
! CAUTION+30dBm MAX
AVOID STATIC DISCHARGE
BTSHPA or
LPA
Attenuator
JD7105A Base Station Analyzer
RF In! CAUTION+30dBm MAX
AVOID STATIC DISCHARGE
Sync RefDC 15~19VLANUSBSerial GPS
RF Out
E1/T1
! CAUTION+25dBm MAX
AVOID STATIC DISCHARGE
External In
To Antenna
DirectionalCoupler
EQP-50 dB
-50 dB
OUT IN BTSHPA
or LPA
! CAUTION+30dBm MAX
AVOID STATIC DISCHARGE
Mode
[Tx Analyzer]
[EVDO]
[SEM]
Select Tx Analyzer mode
Select EVDO
Select SEM Measurement
Figure 29 – EVDO Emission Measurement Screen
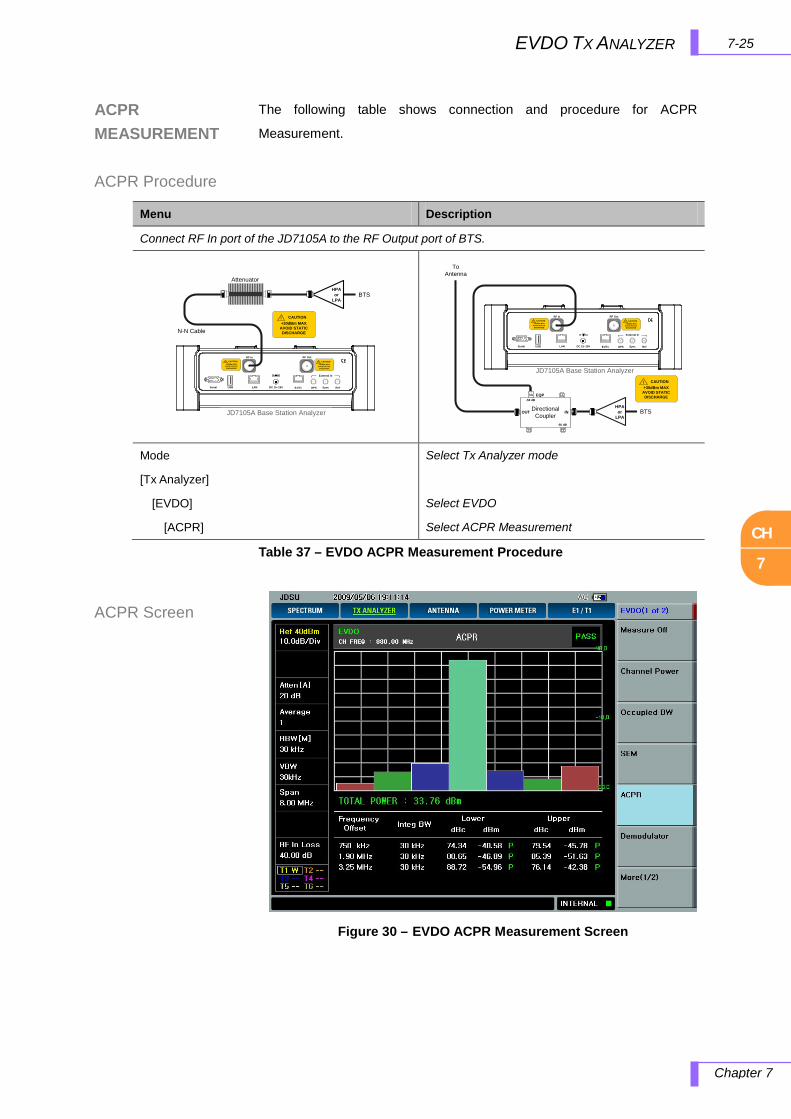
CH
7
7-25
EVDO TX ANALYZER
Chapter 7
ACPR MEASUREMENT
ACPR Procedure
ACPR Screen
The following table shows connection and procedure for ACPR
Measurement.
Table 37 – EVDO ACPR Measurement Procedure
Menu Description
Connect RF In port of the JD7105A to the RF Output port of BTS.
RF In! CAUTION+30dBm MAX
AVOID STATIC DISCHARGE
Sync RefDC 15~19VLANUSBSerial GPS
RF Out
E1/T1
! CAUTION+25dBm MAX
AVOID STATIC DISCHARGE
External In
JD7105A Base Station Analyzer
N-N Cable
! CAUTION+30dBm MAX
AVOID STATIC DISCHARGE
BTSHPA
or LPA
Attenuator
JD7105A Base Station Analyzer
RF In! CAUTION+30dBm MAX
AVOID STATIC DISCHARGE
Sync RefDC 15~19VLANUSBSerial GPS
RF Out
E1/T1
! CAUTION+25dBm MAX
AVOID STATIC DISCHARGE
External In
To Antenna
DirectionalCoupler
EQP-50 dB
-50 dB
OUT IN BTSHPA
or LPA
! CAUTION+30dBm MAX
AVOID STATIC DISCHARGE
Mode
[Tx Analyzer]
[EVDO]
[ACPR]
Select Tx Analyzer mode
Select EVDO
Select ACPR Measurement
Figure 30 – EVDO ACPR Measurement Screen
CH
7
7-26 CDMA TX ANALYZER
Chapter 7
CODE DOMAIN POWER
EV-DO Pilot Channel Measurement
EV-DO MAC Channel Measurement
EV-DO Traffic Channel Measurement
In 1xEV-DO the code channel is not superposed simultaneously with the
transmission channels. As they are transmitted in TDM, only one channel
is transmitted at a time. Therefore, 1xEV-DO CDP measurement displays
each Walsh code power of each physical channel at a time. Also, as I-
channel and Q-channel transmit different code channel for Pilot Channel
and MAC channel, 1xEV-DO measurement displays each I/Q channels
separately unlike cdmaOne or cdma2000. 1xEV-DO CDP measures the
correlated power with Walsh code and the code channel power is
expressed in dB as it is normalized to the total signal power.
Code Domain error can occur due to wrong configuration of channel
elements consisting of each channel and/or network software, impaired
Base band, RF chain, faults in amplifiers, or I/Q gain imbalance.
Pilot Channel Power (dBm)
Waveform Quality
Time Offset
Frequency Offset
Standard for UONC Level is not applied to Pilot Channel.
MAC Channel Power (dBm)
I/Q channel Orthogonality (I/Q Impairment Test)
UOCN < -27dB
Number of Existing RA Channel > 1 ea
16 code power of traffic channel in active slot = 1/16 of the nominal
power, i.e., -12.04dB ± 0.5dB.
In idle slot, traffic channel doesn’t conform to above standard
and shows irregular code level.
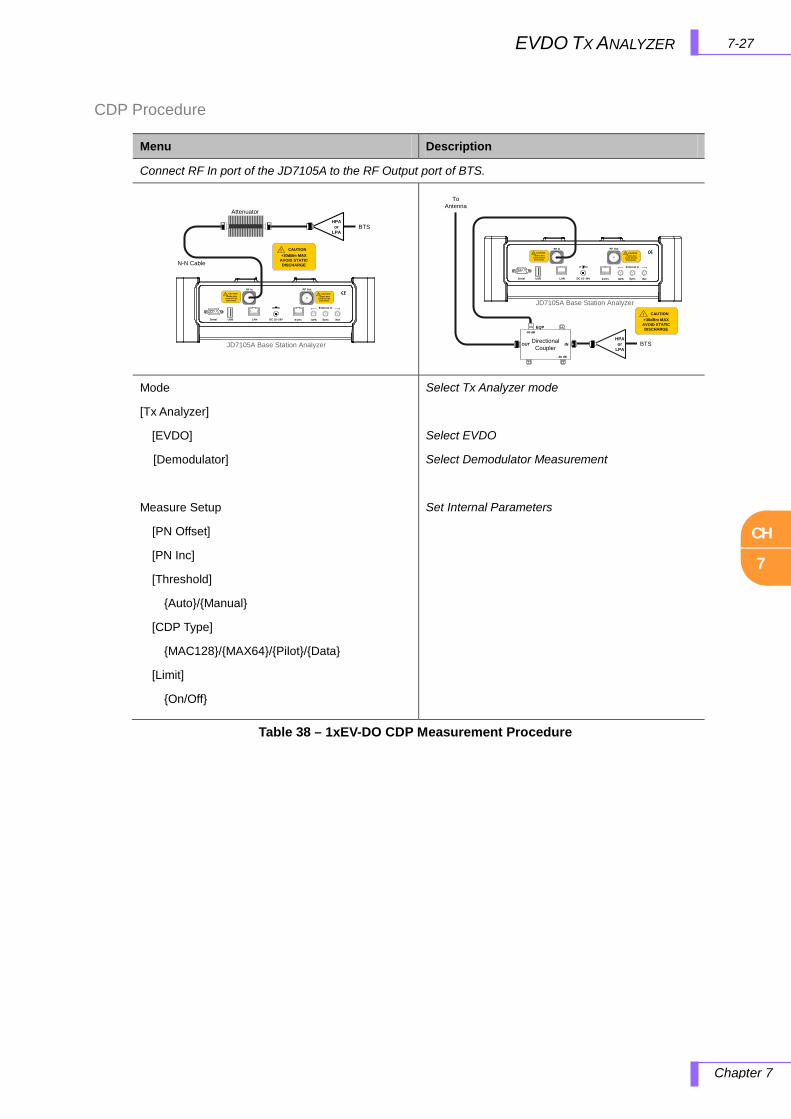
CH
7
7-27
EVDO TX ANALYZER
Chapter 7
CDP Procedure
Table 38 – 1xEV-DO CDP Measurement Procedure
Menu Description
Connect RF In port of the JD7105A to the RF Output port of BTS.
RF In! CAUTION+30dBm MAX
AVOID STATIC DISCHARGE
Sync RefDC 15~19VLANUSBSerial GPS
RF Out
E1/T1
! CAUTION+25dBm MAX
AVOID STATIC DISCHARGE
External In
JD7105A Base Station Analyzer
N-N Cable
! CAUTION+30dBm MAX
AVOID STATIC DISCHARGE
BTSHPA
or LPA
Attenuator
JD7105A Base Station Analyzer
RF In! CAUTION+30dBm MAX
AVOID STATIC DISCHARGE
Sync RefDC 15~19VLANUSBSerial GPS
RF Out
E1/T1
! CAUTION+25dBm MAX
AVOID STATIC DISCHARGE
External In
To Antenna
DirectionalCoupler
EQP-50 dB
-50 dB
OUT IN BTSHPA
or LPA
! CAUTION+30dBm MAX
AVOID STATIC DISCHARGE
Mode
[Tx Analyzer]
[EVDO]
[Demodulator]
Measure Setup
[PN Offset]
[PN Inc]
[Threshold]
Auto/Manual
[CDP Type]
MAC128/MAX64/Pilot/Data
[Limit]
On/Off
Select Tx Analyzer mode
Select EVDO
Select Demodulator Measurement
Set Internal Parameters

CH
7
7-28 CDMA TX ANALYZER
Chapter 7
CDP Procedure (Cont’d)
EV-DO Pilot Channel CDP
Active Set Threshold is the reference to differentiate active from
inactive channels and the default is -27dB.
CDP Measurement shows which channel (CH) number is currently
displayed, which can be changed using the arrow keys. In case there
is an empty CH in-between, CDP measurement is not shown and the
message indicating the measurement is in progress is displayed
continuously. In this case, pressing the arrow keys will stop the
measurement for the empty CH and moves to the next (or previous)
CH.
The Pilot Channel spreads in 32 Walsh Code and only the number “0” of
the I-channel carries the Pilot Code Channel and all the other code
channels are not used. There is no specific standard for Pilot Channel
CDP measurement, except the measurement to verify if the Pilot Code
Channel should be high enough to differentiate with the noise power of the
unoccupied channels.
Figure 31 – 1xEV-DO Pilot CDP Measurement Result
CH
7
7-29
EVDO TX ANALYZER
Chapter 7
EV-DO Pilot Channel Measurement Parameters
EV-DO MAC Channel CDP
Average Power: Average Power of Time Slot (dBm)
Pilot Power: Pilot Channel Power (dBm)
I/Q Max Active: Peak value among Active channel level
I/Q Average Active: Average value of Active channel level
I/Q Max InActive: Peak value among In-Active channel level
I/Q Avg InActive: Average value of In-Active channel level
PN: PN number of the measured EV-DO signal
Frequency Error: Measurement of the carrier’s center frequency
accuracy transmitted from the BTS. The deviation from the measured
center frequency and the specified center frequency is displayed in
Hz.
Time offset: Value to express the level of alignment between BTS
transmission signal and the system time. The time offset between the
BTS reference clock taking PN sequence (PP2S, 1PPS or 10msec)
and the transmission signal.
Pilot Rho (Waveform Quality): Rho = Correlated Power / Channel
Power
Rho is the parameter to express the modulation quality, including
EVM and Walsh Channel Power. It covers all errors occurred along
the transmission chain such as fault at base-band filtering, fault at I/Q
modulator, and distortion in power amplifiers.
MAC Channel uses 64 Walsh codes consisting of 1 RA (Reverse Activity)
channel, 59 RPC (Reverse Power Control) channels and 4 reserved
channels. RA channel transmits data to all AT simultaneously and RPC
channels are used to control the power level of each AT within the sector.
Information is transmitted to each I/Q channel where I-channel uses 0 ~31
and Q-channel uses 32 ~63.

CH
7
7-30 CDMA TX ANALYZER
Chapter 7
EV-DO MAC Channel CDP Screen
EV-DO MAC Channel Measurement Parameters
MAC Channel Walsh Channel Allocation Standard
W64i/2 for MAC Index i = 0,2,4,…,62
W64(i-1)/2 + 32 for MAC Index i = 1,3,5,…,63
In I Channel, number 0,2,4....62 Walsh channels are assigned to
number 0 to 31 Walsh code space. Thirty two channels after number
32 are not assigned to I channel.
In Q Channel, number 1,3,5....63 Walsh channels are assigned to
number 33 to 63 Walsh code space. Thirty two channels, from
number 0 to 31 channels, are not assigned to Q channel.
Average Power: Average Power of Time Slot (dBm)
Pilot Power: MAC Channel Power (dBm)
I/Q Max Active: Peak value among Active channel levels
I/Q Average Active: Average value of Active channel levels
I/Q Max InActive: Peak value among In-Active channel levels
I/Q Avg InActive: Average value of In-Active channel levels
PN: PN number of the measured EV-DO signal
Figure 32 – 1xEV-DO MAC CDP Measurement Result
CH
7
7-31
EVDO TX ANALYZER
Chapter 7
EV-DO MAC Channel Measurement Parameters (cont’d)
Required Specification for EV-DO MAC Channel
EV-DO Data Channel Measurement
Frequency Error: Measurement for the carrier’s center frequency
accuracy transmitted from the BTS. The measured deviation from the
center frequency and the specified center frequency displayed in Hz.
Time offset: Value to express the level of alignment between the BTS
transmission signal and the system time. Time offset between BTS
reference clock taking PN sequence (PP2S, 1PPS or 10msec) and
transmission signal.
MAC Rho (Waveform Quality): Rho = Correlated Power / Channel
Power
Rho is the parameter to express the modulation quality including EVM
and Walsh Channel Power. It covers all errors occurred along the
transmission chain such as fault at base-band filtering, fault at I/Q
modulator, and distortion in power amplifiers.
3GPP2 recommends UOCN to be under -27dB in 1xEV-DO MAC CDP.
Traffic channel spreads in W16 Walsh code and 16 code channels are
assigned to a single user, not all 16 channels are users, data transmission,
I-channels, and Q-channels are assigned the same codes unlike MAC or
Pilot Channel. Therefore I/Q is not displayed separately in Traffic Channel
and the sum of I/Q power is displayed like cdmaOne and cdma2000.
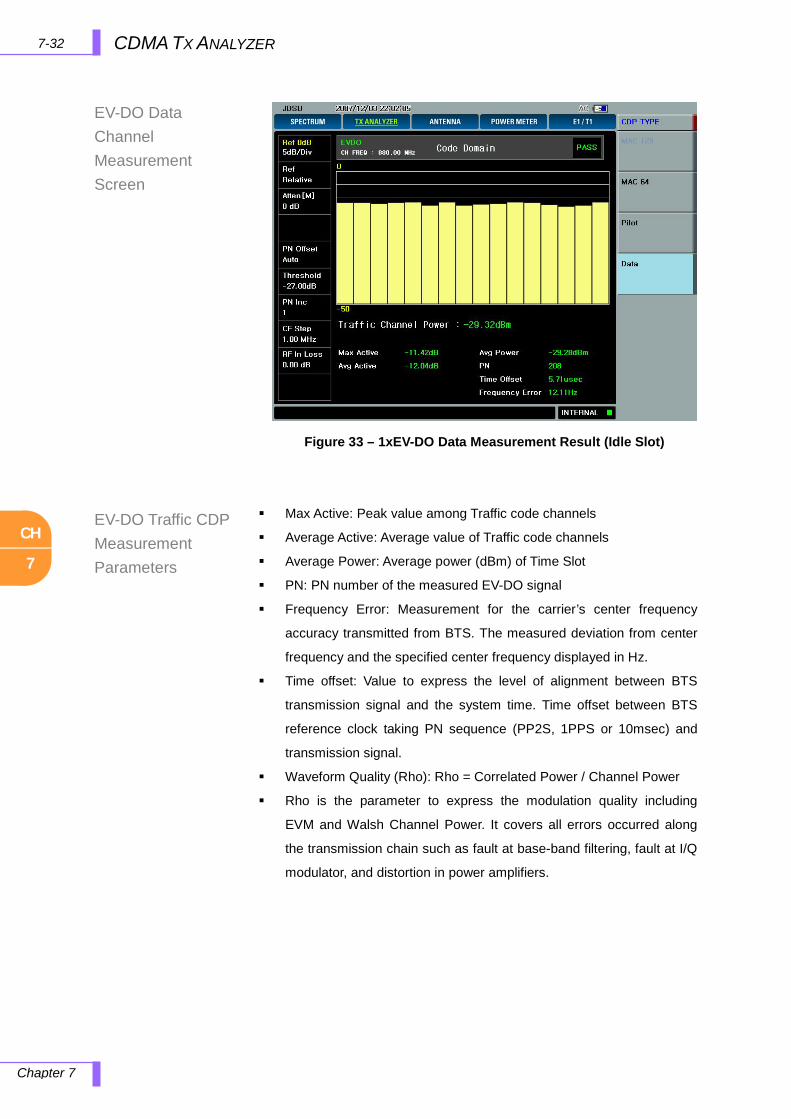
CH
7
7-32 CDMA TX ANALYZER
Chapter 7
EV-DO Data Channel Measurement Screen
EV-DO Traffic CDP Measurement Parameters
Max Active: Peak value among Traffic code channels
Average Active: Average value of Traffic code channels
Average Power: Average power (dBm) of Time Slot
PN: PN number of the measured EV-DO signal
Frequency Error: Measurement for the carrier’s center frequency
accuracy transmitted from BTS. The measured deviation from center
frequency and the specified center frequency displayed in Hz.
Time offset: Value to express the level of alignment between BTS
transmission signal and the system time. Time offset between BTS
reference clock taking PN sequence (PP2S, 1PPS or 10msec) and
transmission signal.
Waveform Quality (Rho): Rho = Correlated Power / Channel Power
Rho is the parameter to express the modulation quality including
EVM and Walsh Channel Power. It covers all errors occurred along
the transmission chain such as fault at base-band filtering, fault at I/Q
modulator, and distortion in power amplifiers.
Figure 33 – 1xEV-DO Data Measurement Result (Idle Slot)
CH
7
7-33
EVDO TX ANALYZER
Chapter 7
Required Specification for EV-DO Traffic Channel
3GPP2 requires for active slots, that the size of each Walsh channel
power is 1/16 of the nominal power.
In Active slot, the size of each Walsh channel power is 1/16 of the
nominal power.
Nominal Power/16= 0.0625= -12.04dB
Single Walsh channel power = -12.04±0.5 dB
CH
8
8-1 WCDMA TX ANALYZER
Chapter 8
8.0 WCDMA TX ANALYZER
In this chapter
WCDMA Analyzer Introduction ..................................................................................................................... 8-2
What is WCDMA ................................................................................................................................... 8-3 Channel Power Measurement Concept ................................................................................................ 8-4 Occupied Bandwidth Measurement Concept ........................................................................................ 8-4 Spurious Emission Mask Measurement Concept ................................................................................. 8-5 ACLR Measurement Concept ............................................................................................................... 8-5 Code Domain Measurement Concept ................................................................................................... 8-6 Modulation Accuracy (Rho) Measurement Concept.............................................................................. 8-6
Using WCDMA Analyzer ............................................................................................................................... 8-7 How to Use Keys .......................................................................................................................................... 8-8
Freq/Chan ............................................................................................................................................. 8-8 Amplitude .............................................................................................................................................. 8-8 Trace/Display ...................................................................................................................................... 8-10 BW/AVG.............................................................................................................................................. 8-12 Marker ................................................................................................................................................ 8-13 Peak Search ....................................................................................................................................... 8-14 Measure .............................................................................................................................................. 8-15 Measure Setup ................................................................................................................................... 8-15 Display Overview ................................................................................................................................ 8-16 Setup .................................................................................................................................................. 8-17
Frequency Setup ........................................................................................................................ 8-17 External Clock Setting ................................................................................................................ 8-18
Channel Power Measurement ............................................................................................................ 8-20 Channel Power Procedure .......................................................................................................... 8-20 Channel Power Screen ............................................................................................................... 8-21
Occupied Bandwidth Measurement .................................................................................................... 8-21 Occupied Bandwidth Procedure ................................................................................................. 8-22 Occupied Bandwidth Screen ....................................................................................................... 8-22
Spurious Emission Measurement ....................................................................................................... 8-23 SEM Procedure .......................................................................................................................... 8-23 SEM Screen................................................................................................................................ 8-24
ACLR Measurement ........................................................................................................................... 8-24 ACLR Procedure ......................................................................................................................... 8-25 ACLR Screen .............................................................................................................................. 8-25
Code Domain Analysis (Demodulator) ................................................................................................ 8-26 CDP Procedure ........................................................................................................................... 8-26 CDP Screen ................................................................................................................................ 8-27
WCDMA OTA Measurement ............................................................................................................... 8-28 OTA Measurement Procedure .................................................................................................... 8-28 OTA Measurement Screen .......................................................................................................... 8-29
CH
8
8-2 WCDMA TX ANALYZER
Chapter 8
WCDMA ANALYZER INTRODUCTION
WCDMA is a wideband spread-spectrum mobile air interface that utilizes
the direct sequence Code Division Multiple Access signaling method (or
CDMA) to achieve higher speeds and support more users compared to
the implementation of time division multiplexing (TDMA) used by 2G GSM
networks.
Features:
Radio channels are 5MHz wide.
Chip rate of 3.84 Mcps
Supports two basic duplex modes, frequency division and time
division. Current systems use frequency division, one frequency for
uplink and another for downlink. For time division, FOMA uses 16
slots per radio frame, where as UMTS uses 15 slots per radio frame.
Employs coherent detection on uplink and downlink based on the use
of pilot symbols.
Supports inter-cell asynchronous operation.
Variable mission on a 10 ms frame basis.
Multi-code transmission.
Adaptive power control based on SIR (Signal-to-Interference Ratio).
Multiuser detection and smart antennas can be used to increase
capacity and coverage.
Multiple types of handoff between different cells including soft handoff,
softer handoff and hard handoff.
CH
8
8-3 WCDMA TX ANALYZER
Chapter 8
WHAT IS WCDMA
W-CDMA is a Code Division Multiple Access (CDMA) system. As opposed
to Time Division Multiple Access (TDMA), in CDMA, all users transmit at
the same time. Frequency divisions are still used, but at a much greater
bandwidth.
In addition, multiple users share the same frequency carrier. Each user’s
signal uses a unique code that appears to be noise except to the correct
receiver. Therefore, the term channel describes a combination of carrier
frequency and codes. Correlation techniques allow a receiver to decode
one signal among many transmitted on the same carrier at the same time.
A difference between W-CDMA and earlier 2G CDMA systems (like IS-95)
is that W-CDMA uses a wider bandwidth (3.84 MHz, as opposed to 1.23
MHz for IS-95).
W-CDMA is a direct sequence spread-spectrum that supports wider RF
bandwidths, typically from 5 to 20 MHz. W-CDMA uses correlative codes
to distinguish one user from another. Frequency division is still used, as is
done with Frequency Division Multiple Access (FDMA) and Time Division
Multiple Access (TDMA), but in a much larger bandwidth such as 5 MHz or
greater. An initial baseband data rate is spread to a transmitted bit rate of
3.840 Mcps, which is also called chip rate or spread data rate. W-CDMA
realizes increased capacity from 1:1 frequency reuse and sectored cells.
The capacity limit is soft. That is, capacity can be increased with some
degradation of the error rate or voice quality.

CH
8
8-4 WCDMA TX ANALYZER
Chapter 8
CHANNEL POWER MEASUREMENT CONCEPT
OCCUPIED BANDWIDTH MEASUREMENT CONCEPT
The Channel Power measurement is a common test used in the wireless
industry to measure the total transmitted power of a radio within a defined
frequency channel. This procedure measures the total power within the
defined channel for W-CDMA. This measurement is applied to design,
characterize, evaluate, and verify transmitters and their components or
devices for base stations and mobile stations.
The Channel Power measurement shows the total transmitted power
within the channel integration bandwidth, 5.00 MHz for the W-CDMA mode.
The measurement acquires a number of points representing the input
signal in the time domain. It transforms this information into the frequency
domain using FFT and then calculates the channel power.
To improve repeatability, the number of averaging is increased. The
channel power graph is shown in the graph window, while the absolute
channel power in dBm and the mean power spectral density in dBm/Hz
are shown in the text window.
Occupied Bandwidth measures the bandwidth containing 99% of the
total transmitted power. The spectrum shape of a W-CDMA signal can give
a useful qualitative insight into the transmitter’s operation. Any distortion to
the spectrum shape might be an indication of degradation of the
transmitter's performance.
With the instrument tuned to a fixed center frequency, samples are
digitized at a high rate with DSP hardware, and then converted to the
frequency domain with FFT software.
The total absolute power within the measurement frequency span is
integrated for its 100% of power. The lower and upper frequencies
containing 0.5% each of the total power are then calculated to get 99.0%
bandwidth.
CH
8
8-5 WCDMA TX ANALYZER
Chapter 8
SPURIOUS EMISSION MASK MEASUREMENT CONCEPT
ACLR MEASUREMENT CONCEPT
The Spectrum Emission Mask (SEM) measurement includes the in-
band and out-of-band spurious emissions. As it applies to W-CDMA, this is
the power contained in a specified frequency bandwidth, at certain offsets,
relative to the total carrier power. It may also be expressed as a ratio of
power spectral densities between the carrier and the specified offset
frequency band. It provides useful figures-of-merit for the spectral re-
growth and emissions produced by components and circuit blocks, without
the rigor of performing a full SEM measurement.
The SEM measures spurious signal levels in up to five pairs of offset or
region frequencies and relates them to the carrier power. The reference
channel integration bandwidth method is used to measure the carrier
channel power and offset or region powers. When Offset is selected, SEM
measurements are made relative to the carrier channel frequency
bandwidth. When Region is selected, absolute SEM measurements are
made, specifying the start and stop RF frequencies. In this process, the
reference channel integration bandwidth is analyzed using the
automatically defined resolution bandwidth, which is much narrower than
the channel bandwidth. The results are displayed both as relative power in
dBc, and as absolute power in dBm.
Adjacent Channel Power Ratio (ACPR), as it applies to W-CDMA, is the
power contained in a specified frequency channel bandwidth relative to the
total carrier power. It may also be expressed as a ratio of power spectral
densities between the carrier and the specified offset frequency band. This
is also called Adjacent Channel Leakage power Ratio (ACLR).
ACPR combines both in-band and out-of-band specifications to provide
useful figures-of-merit for spectral re-growth and emissions produced by
components and circuit blocks without the rigor of performing a full SEM
measurement.
CH
8
8-6 WCDMA TX ANALYZER
Chapter 8
CODE DOMAIN MEASUREMENT CONCEPT
MODULATION ACCURACY (RHO) MEASUREMENT CONCEPT
Code domain power is an analysis of the distribution of signal power
across the set of code channels, normalized to the total signal power. To
analyze the composite waveform, each channel is decoded using a code-
correlation algorithm. This algorithm determines the correlation coefficient
factor for each code. Once the channels are decoded, the power in each
code channel is determined. Since the code domain measurements de-
spread and descramble the W-CDMA signal into its physical channels, the
number of active channels of various symbol rates (which are denoted by
widths) can be observed. The width of the channel is inversely
proportional to the Orthogonal Variable Spreading Factor (OVSF) code
length in number of bits. In the code domain, there is a fixed amount of
code space for a given chip rate. Therefore, by using the different OVSF
codes, the system can dynamically allocate the code space for lower rate
voice users versus high speed data users.
The code domain power composite view provides information about the in-
channel characteristics of the W-CDMA signal. It directly informs the user
of the active channels with their individual channel power. The composite
view also shows which data rates are active and the corresponding
amount of code space used.
Error vector magnitude (EVM) is defined in 3GPP conformance tests for
both downlink and uplink. EVM is a common modulation quality metric
widely used in digital communications. Mod accuracy (composite EVM)
measures the EVM of the multi-code channel signal. It is valuable for
evaluating the quality of the transmitter for a multi-channel signal,
detecting spreading or scrambling errors, identifying certain problems
between baseband and RF sections, and analyzing errors that cause high
interference in the signal.
Rho is one of the key modulation quality metrics, along with EVM and
Code Domain Power. Rho is the ratio of the correlated power in a multi
coded channel to the total signal power. This measurement takes into
account all possible error mechanisms in the entire transmission chain
including: baseband filtering, I/Q modulation anomalies, filter amplitude,
phase deviation, and power amplifier distortions. This provides an overall
indication of the performance level of the transmitter.
CH
8
8-7 WCDMA TX ANALYZER
Chapter 8
USING WCDMA ANALYZER
This section provides details about the W-CDMA communications system
and explains how the various measurements are performed by the
instrument.
The JD7105A provides the following analysis tools for WCDMA system.
Channel Power
Occupied Bandwidth
Spurious Emission
ACPR (ACLR)
Demodulator (Code Domain Analyzer)
OTA
Auto Measure
CH
8
8-8 WCDMA TX ANALYZER
Chapter 8
FREQ/CHAN
AMPLITUDE
HOW TO USE KEYS
This section describes the instrument’s keys used in WCDMA Tx Analyzer
mode.
Freq/Chan
Sets the Frequency by selecting standard or custom frequency bands.
CENTER FREQUENCY: Changes the center frequency setup in the
spectrum measurement. Values can be entered with the Data Entry key,
the Knob or the arrow keys. When using the Data Entry key, the input is
completed by selecting the soft key with the corresponding value unit.
When using the Knob or the arrow keys, the center frequency changes in
predefined frequency steps. The frequency steps can be configured
selecting the CF Step Menu.
CF STEP: Defines the moving unit of center frequency. Values can be
entered by Data Entry key or changed through the knob. When using Data
Entry key, input is completed by selecting the unit to define the input value.
When using the knob or the arrow keys the frequency value is increased
by 0.1MHz.
CHANNEL STANDARD: Using this key, the channel band can be selected
without setting Start, Stop, and Center frequencies. The saved custom
channel bands will pop-up to select the proper band.
UNIT: Selects the unit to be used, either Frequency or Channel. When
the “Chan” is selected, the CF Step corresponds to Channel Step.
Amplitude
When the instrument is in Channel Power, Occupied Bandwidth, SEM,
or ACLR measurement mode, an Amplitude key is used as below.
AUTO SCALE: The instrument can automatically set the scale to the
minimum and maximum values off the Y-axis of the graph for optimum
display of the traces measured. Each time the AUTO SCALE is selected,
the top and bottom scales are set to the minimum and maximum values
with margin on the Y-axis of the screen display.
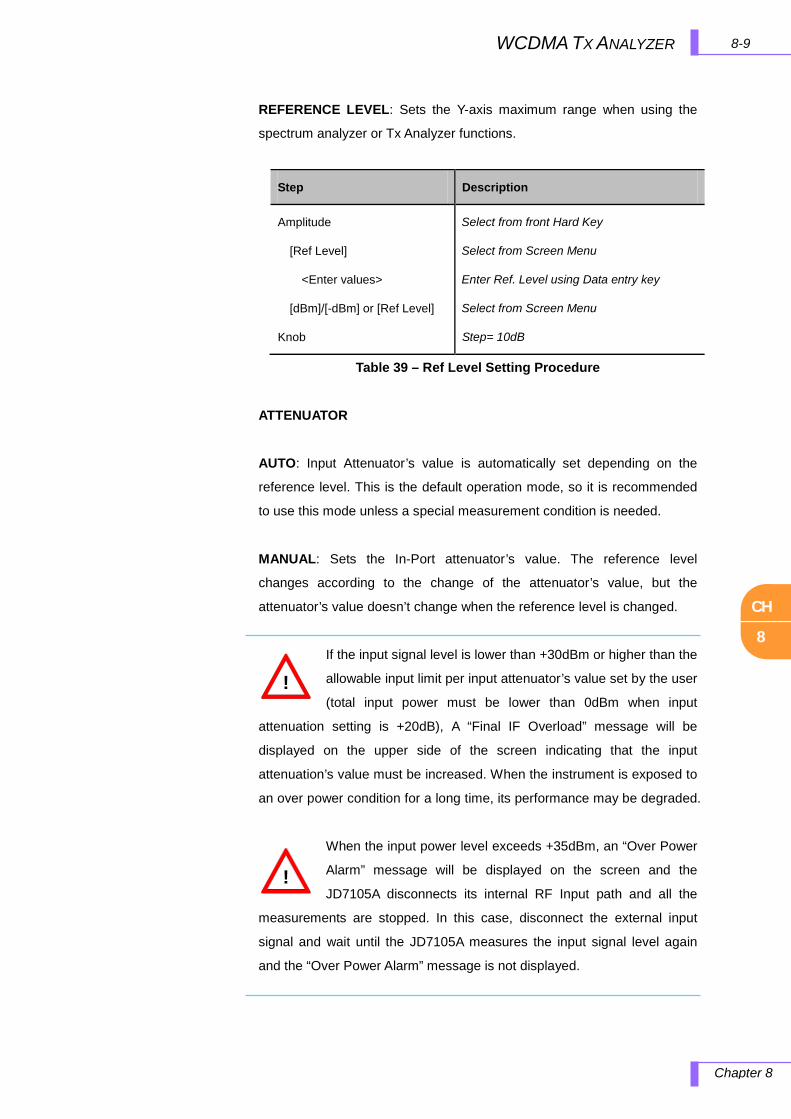
CH
8
8-9 WCDMA TX ANALYZER
Chapter 8
REFERENCE LEVEL: Sets the Y-axis maximum range when using the
spectrum analyzer or Tx Analyzer functions.
Step Description
Amplitude
[Ref Level]
<Enter values>
[dBm]/[-dBm] or [Ref Level]
Knob
Select from front Hard Key
Select from Screen Menu
Enter Ref. Level using Data entry key
Select from Screen Menu
Step= 10dB
Table 39 – Ref Level Setting Procedure
ATTENUATOR
AUTO: Input Attenuator’s value is automatically set depending on the
reference level. This is the default operation mode, so it is recommended
to use this mode unless a special measurement condition is needed.
MANUAL: Sets the In-Port attenuator’s value. The reference level
changes according to the change of the attenuator’s value, but the
attenuator’s value doesn’t change when the reference level is changed.
If the input signal level is lower than +30dBm or higher than the
allowable input limit per input attenuator’s value set by the user
(total input power must be lower than 0dBm when input
attenuation setting is +20dB), A “Final IF Overload” message will be
displayed on the upper side of the screen indicating that the input
attenuation’s value must be increased. When the instrument is exposed to
an over power condition for a long time, its performance may be degraded.
When the input power level exceeds +35dBm, an “Over Power
Alarm” message will be displayed on the screen and the
JD7105A disconnects its internal RF Input path and all the
measurements are stopped. In this case, disconnect the external input
signal and wait until the JD7105A measures the input signal level again
and the “Over Power Alarm” message is not displayed.
!
!
CH
8
8-10 WCDMA TX ANALYZER
Chapter 8
TRACE/DISPLAY
RF IN LOSS: Sets an external offset value. An offset consists of a cable
offset and a user offset, and the measurement result shows the value
reflecting both offset values. Even if an offset is set, the reference level is
automatically adjusted to avoid the waveform fitting out of the screen. An
offset value set in Spectrum mode have precedence over the offset value
set in Analysis Mode.
When the instrument is in Demodulator mode, an Amplitude key is
used as below.
ATTENUATOR
AUTO: Input Attenuator’s value is automatically set depending on the
reference level. This is the default operation mode, so it is recommended
to use this mode unless a special measurement condition is needed.
MANUAL: Sets the In-Port attenuator’s value. The reference level
changes according to the change of the attenuator’s value, but the
attenuator’s value doesn’t change when the reference level is changed.
REFERENCE: Selects the relative or absolute value to be displayed.
REL: The code domain power is measured relative to channel power.
ABS: The code domain power is measured absolute to channel power.
RF IN LOSS: Sets an external offset value. An offset consists of a cable
offset and a user offset, and the measurement result shows the value
reflecting both offset values. Even if an offset is set, the reference level is
automatically adjusted to avoid the waveform fitting out of the screen. An
offset value set in Spectrum mode have precedence over the offset value
set in Analysis Mode.
This key is not used in ACPR measurement mode.
When the instrument is in Channel Power, Occupied Bandwidth, or
SEM measurement mode, a Trace/Display key is used as below.
TRACE SELECT: Selects an active trace from T1 ~ T6. Every time Select
screen menu is pressed, the active trace changes. Trace numbers are
assigned to each captured traces or loaded traces.
CH
8
8-11 WCDMA TX ANALYZER
Chapter 8
TRACE VIEW: Hides or displays the trace number on the screen. Press
the Select screen menu key to choose the Trace number. Traces with
View set OFF are hidden from the screen. Setting View On restores
hidden traces and information on the window.
M: Max Hold
m: Min Hold
C: Captured Trace
W: Current Trace
L: Loaded Trace
TRACE CAPTURE: Captures a current trace on the screen with assigned
trace number.
CLEAR WRITE: Clear selected Trace and Write (Assign) current trace.
MAX HOLD: Sets Active trace Max Hold. Active trace compares newly
acquired data with the trace shown on the screen and displays the bigger
trace on the screen.
MIN HOLD: Sets Active trace Min Hold. Active trace compares newly
acquired data with the trace shown on the screen and displays the smaller
trace on the screen.
TRACE CLEAR: Deletes an active trace from the screen. The cleared
trace is not restored. It is used to select and delete a trace one by one
when multiple traces are displayed on the screen. Verify the traces to
delete with Trace View ON/OFF function in advance settings as cleared
traces cannot be restored.
CLEAR CURRENT: Deletes an active trace from the screen. The cleared
trace is not restored. It is used to select and delete a trace one by one
when multiple traces are displayed on the screen. Verify the traces to
delete with View ON/OFF function in advance settings as cleared traces
cannot be restored.
CLEAR ALL: Deletes all traces from the instrument and initialize the trace
settings.
CH
8
8-12 WCDMA TX ANALYZER
Chapter 8
BW/AVG
When the instrument is in Demodulator mode, the following keys are
also available.
VIEW (ZOOM, FULL): Selects Full or Zoomed screen
POSITION: Assigns the zoom start position
WIDTH (32, 64, 128, 256): Selects the Walsh code width to be displayed
CODOGRAM: Selects codogram view.
CODOGRAM OFF/ON: Turns Codogram view On/Off.
RESET/RESTART: Reset current measurement and restart.
TIME INTERVAL: Selects AM, FM or CW tone to be
demodulated.
AUTO SAVE: Saves the measurement data automatically to
external memory, USB.
TIME CURSOR: Sets Time Cursor on the measurement.
AVERAGE: Sets the number of measurements to be averaged for the
trace presentation. A maximum of 99 times of averaging can be set.
SWEEP CTRL: Selects the sweep method between "Continue" and "Hold".
When the instrument is in Demodulator mode, a BW/AVG key is used
as below.
SWEEP CTRL: Selects the sweep method between "Continue" and "Hold".
CH
8
8-13 WCDMA TX ANALYZER
Chapter 8
MARKER
This key is not used in ACLR measurement mode.
When the instrument is in Channel Power, Occupied Bandwidth, SEM,
or Demodulator measurement mode, a Marker key is used as below.
Marker is used to get the information about a specific trace. A total of six
Markers can be set and each marker can be used independently. The X,
and Y coordinates of the trace are displayed when the maker is placed on
any position of the trace. As the position displaying Marker’s X and Y
coordinates may be slightly different for each measurement mode, refer to
the description of each measurement after this chapter.
MARKER SELECT: Selects an active marker which its position can be
changed with the knob or the arrow keys. The assigned number of active
markers is displayed on the Marker Select screen menu and the marker’s
number is also displayed next to the marker on the trace when the Marker
View On is selected.
MARKER VIEW: Hides or displays the selected marker on the screen. In
the same measurement mode markers appear at the previous positions
when the Marker View is turned off and on. If a measurement mode has
been changed, markers are not restored to their previous positions.
MARKER TYPE:
Selects the type of Marker to be displayed, Normal marker provide the
reading of its position and Delta marker provides the differences between
two sets of marker points.
NORMAL: Used to place a marker, along with the marker number,
1-6, on the trace.
DELTA: Delta Marker is associated with a Normal Marker, so a
Normal Maker must be set before a Delta marker is set. When a
Delta Marker is set, the position set by the Delta Marker becomes
the reference position of the Normal Marker and the Maker’s X
and Y values displays the difference compared with Delta Marker.

CH
8
8-14 WCDMA TX ANALYZER
Chapter 8
PEAK SEARCH
MARKER CLEAR ALL: Turns all markers off the screen. Markers are
redisplayed on the previous position if markers are turned back on. If a
measurement mode is changed, current settings are not restored.
MARKER EDIT: Sets the marker position manually. A pop-up window
appears for users to set the frequency by entering numeric values and the
marker position is moved to the setting frequency.
This key is not used in ACPR measurement mode.
When the instrument is in Channel Power, Occupied Bandwidth, SEM,
or Demodulator measurement mode, a Peak Search key is used as
below.
Each time Peak Search key is pressed, a marker is displayed on the
highest peak of the Trace.
PEAK RIGHT: Moves the marker to the next highest peak at the right of its
current position.
PEAK LEFT: Moves the marker to the next highest peak at the left of its
current position.
MAX SEARCH: Moves the marker to the highest peak of the trace.
MIN SEARCH: Moves the marker to the lowest peak of the trace.
ALWAYS PEAK: Moves the marker automatically to the highest peak of
the trace each time the trace is updated.
CH
8
8-15 WCDMA TX ANALYZER
Chapter 8
MEASURE
MEASURE SETUP
When the instrument is in Tx Analyzer Mode, Measure key is used to
select measurement menu listed below.
Channel Power Measurement Occupied Bandwidth Measurement SEM Measurement ACLR Measurement Demodulator Measurement OTA Measurement Auto Measure
This key is not used in Channel Power, Occupied Bandwidth, SEM,
and ACLR measurement mode.
When the instrument is in Demodulator mode, a Measure Setup Key
is used as below.
SCRAMBLE: Selects the scramble code between Auto and Manual.
THRESHOLD: Sets the threshold value between Auto and Manual (default
is -27dBm).
S-CCPCH
S-CCPCH Enable: On/Off
Spreading Factor
Channel No
PICH
S-CCPCH Enable: On/Off
Spreading Factor
Channel No
LIMIT: Sets the limit on and off.
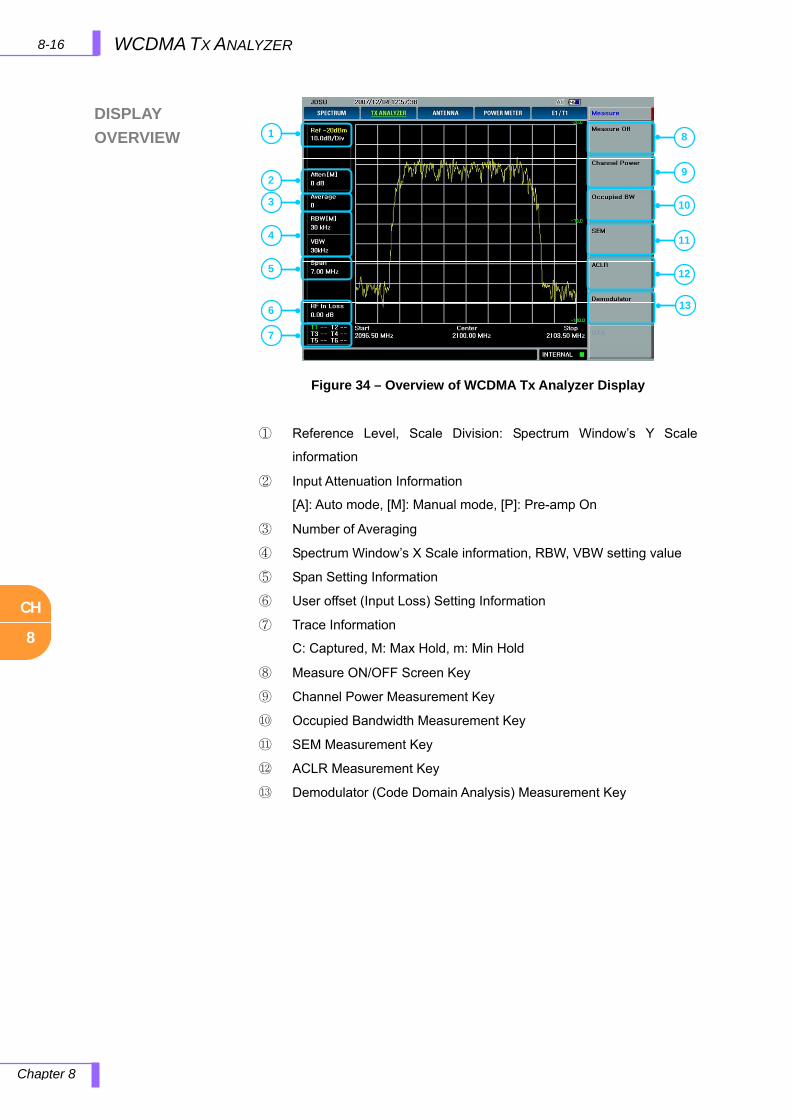
CH
8
8-16 WCDMA TX ANALYZER
Chapter 8
DISPLAY
OVERVIEW
① Reference Level, Scale Division: Spectrum Window’s Y Scale
information
② Input Attenuation Information
[A]: Auto mode, [M]: Manual mode, [P]: Pre-amp On
③ Number of Averaging
④ Spectrum Window’s X Scale information, RBW, VBW setting value
⑤ Span Setting Information
⑥ User offset (Input Loss) Setting Information
⑦ Trace Information
C: Captured, M: Max Hold, m: Min Hold
⑧ Measure ON/OFF Screen Key
⑨ Channel Power Measurement Key
⑩ Occupied Bandwidth Measurement Key
⑪ SEM Measurement Key
⑫ ACLR Measurement Key
⑬ Demodulator (Code Domain Analysis) Measurement Key
1
2
3
4
5
6
7
8
13
9
10
11
12
Figure 34 – Overview of WCDMA Tx Analyzer Display
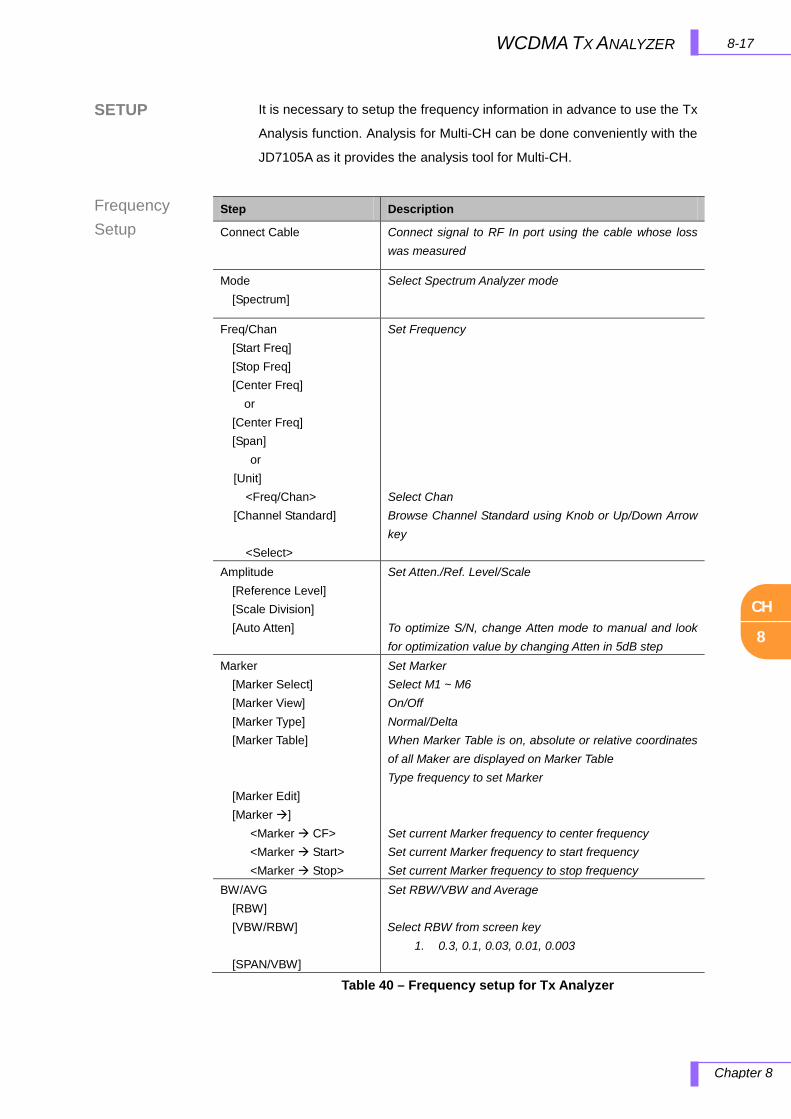
CH
8
8-17 WCDMA TX ANALYZER
Chapter 8
SETUP
Frequency Setup
It is necessary to setup the frequency information in advance to use the Tx
Analysis function. Analysis for Multi-CH can be done conveniently with the
JD7105A as it provides the analysis tool for Multi-CH.
Table 40 – Frequency setup for Tx Analyzer
Step Description
Connect Cable Connect signal to RF In port using the cable whose loss was measured
Mode [Spectrum]
Select Spectrum Analyzer mode
Freq/Chan [Start Freq] [Stop Freq] [Center Freq]
or [Center Freq] [Span]
or [Unit] <Freq/Chan> [Channel Standard] <Select>
Set Frequency Select Chan Browse Channel Standard using Knob or Up/Down Arrow key
Amplitude [Reference Level] [Scale Division] [Auto Atten]
Set Atten./Ref. Level/Scale To optimize S/N, change Atten mode to manual and look for optimization value by changing Atten in 5dB step
Marker [Marker Select] [Marker View] [Marker Type] [Marker Table] [Marker Edit] [Marker ] <Marker CF>
<Marker Start> <Marker Stop>
Set Marker Select M1 ~ M6 On/Off Normal/Delta When Marker Table is on, absolute or relative coordinates of all Maker are displayed on Marker Table Type frequency to set Marker Set current Marker frequency to center frequency Set current Marker frequency to start frequency Set current Marker frequency to stop frequency
BW/AVG [RBW] [VBW/RBW] [SPAN/VBW]
Set RBW/VBW and Average Select RBW from screen key
1. 0.3, 0.1, 0.03, 0.01, 0.003
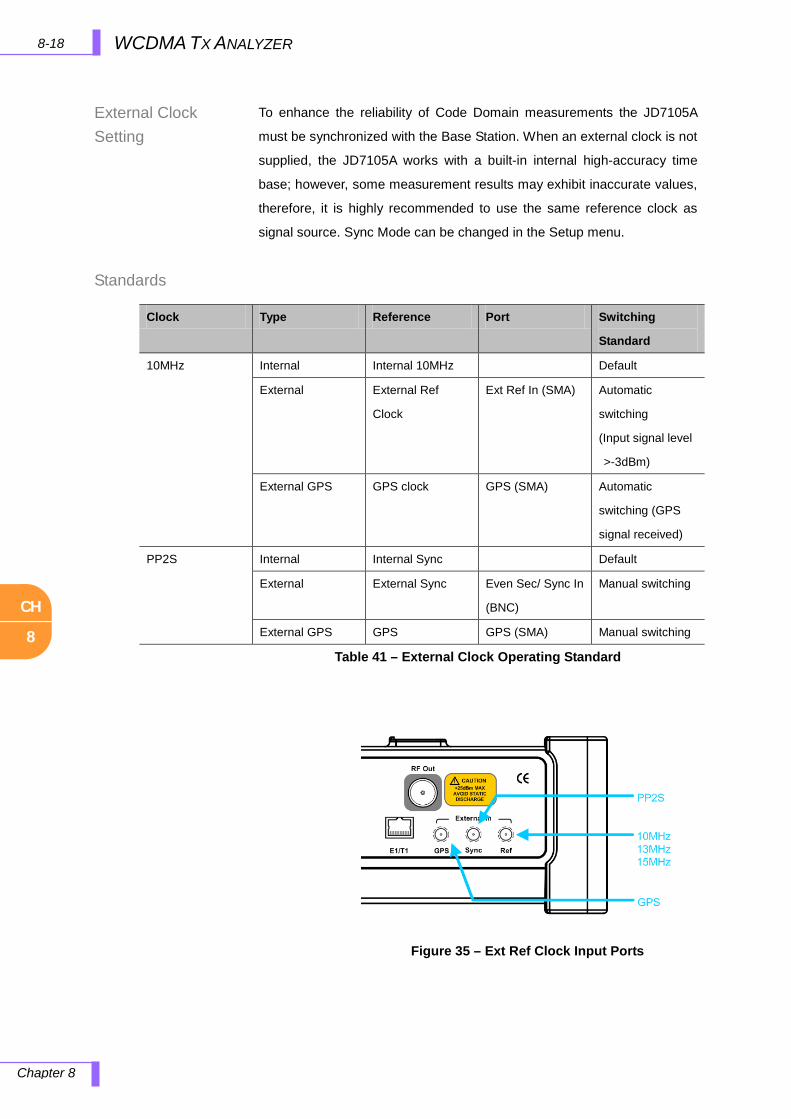
CH
8
8-18 WCDMA TX ANALYZER
Chapter 8
External Clock Setting
Standards
To enhance the reliability of Code Domain measurements the JD7105A
must be synchronized with the Base Station. When an external clock is not
supplied, the JD7105A works with a built-in internal high-accuracy time
base; however, some measurement results may exhibit inaccurate values,
therefore, it is highly recommended to use the same reference clock as
signal source. Sync Mode can be changed in the Setup menu.
Table 41 – External Clock Operating Standard
Clock Type Reference Port Switching
Standard
10MHz Internal Internal 10MHz Default
External External Ref
Clock
Ext Ref In (SMA) Automatic
switching
(Input signal level
>-3dBm)
External GPS GPS clock GPS (SMA) Automatic
switching (GPS
signal received)
PP2S Internal Internal Sync Default
External External Sync Even Sec/ Sync In
(BNC)
Manual switching
External GPS GPS GPS (SMA) Manual switching
Figure 35 – Ext Ref Clock Input Ports

CH
8
8-19 WCDMA TX ANALYZER
Chapter 8
Ext Ref Clock Interface Specification
Table 42 – Ext. Ref. Clock Interface Spec
Port Name Signal Characteristics
Even Sec Sync In PP2S
10msec
TTL compatible
Ext Ref In 10MHz Analog:
-10 ~ +10dBm
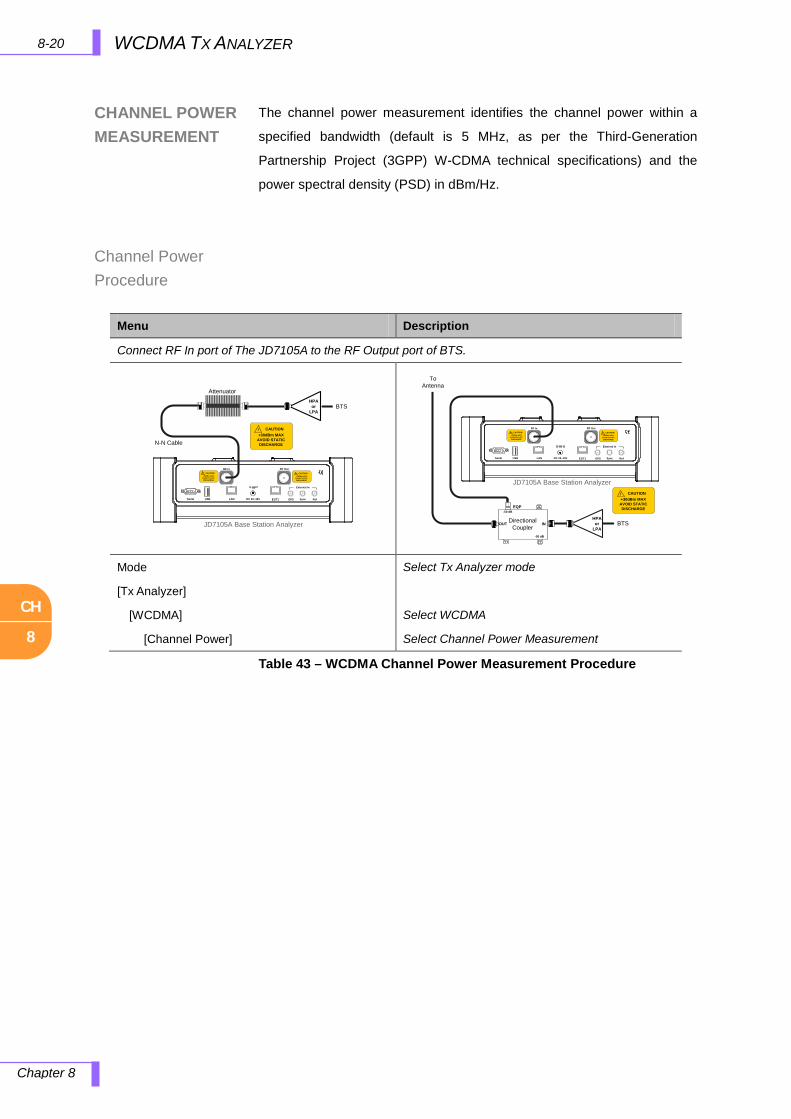
CH
8
8-20 WCDMA TX ANALYZER
Chapter 8
CHANNEL POWER MEASUREMENT
Channel Power Procedure
The channel power measurement identifies the channel power within a
specified bandwidth (default is 5 MHz, as per the Third-Generation
Partnership Project (3GPP) W-CDMA technical specifications) and the
power spectral density (PSD) in dBm/Hz.
Table 43 – WCDMA Channel Power Measurement Procedure
Menu Description
Connect RF In port of The JD7105A to the RF Output port of BTS.
RF In! CAUTION+30dBm MAX
AVOID STATIC DISCHARGE
Sync RefDC 15~19VLANUSBSerial GPS
RF Out
E1/T1
! CAUTION+25dBm MAX
AVOID STATIC DISCHARGE
External In
JD7105A Base Station Analyzer
N-N Cable
! CAUTION+30dBm MAX
AVOID STATIC DISCHARGE
BTSHPA or
LPA
Attenuator
JD7105A Base Station Analyzer
RF In! CAUTION+30dBm MAX
AVOID STATIC DISCHARGE
Sync RefDC 15~19VLANUSBSerial GPS
RF Out
E1/T1
! CAUTION+25dBm MAX
AVOID STATIC DISCHARGE
External In
To Antenna
DirectionalCoupler
EQP-50 dB
-50 dB
OUT IN BTSHPA
or LPA
! CAUTION+30dBm MAX
AVOID STATIC DISCHARGE
Mode
[Tx Analyzer]
[WCDMA]
[Channel Power]
Select Tx Analyzer mode
Select WCDMA
Select Channel Power Measurement

CH
8
8-21 WCDMA TX ANALYZER
Chapter 8
Channel Power Screen
OCCUPIED BANDWIDTH MEASUREMENT
The 3GPP specifications requires the occupied bandwidth (OBW) of a
transmitted W-CDMA signal to be less than 5 MHz, where occupied
bandwidth is defined as the bandwidth containing 99% of the total channel
power. In this measurement, the total power of the displayed span is
measured. Then the power is measured inward from the right and left
extremes until 0.5% of the power is accounted for each of the upper and
lower part of the span and the calculated difference is the occupied
bandwidth.
Figure 36 – WCDMA Channel Power Measurement Screen
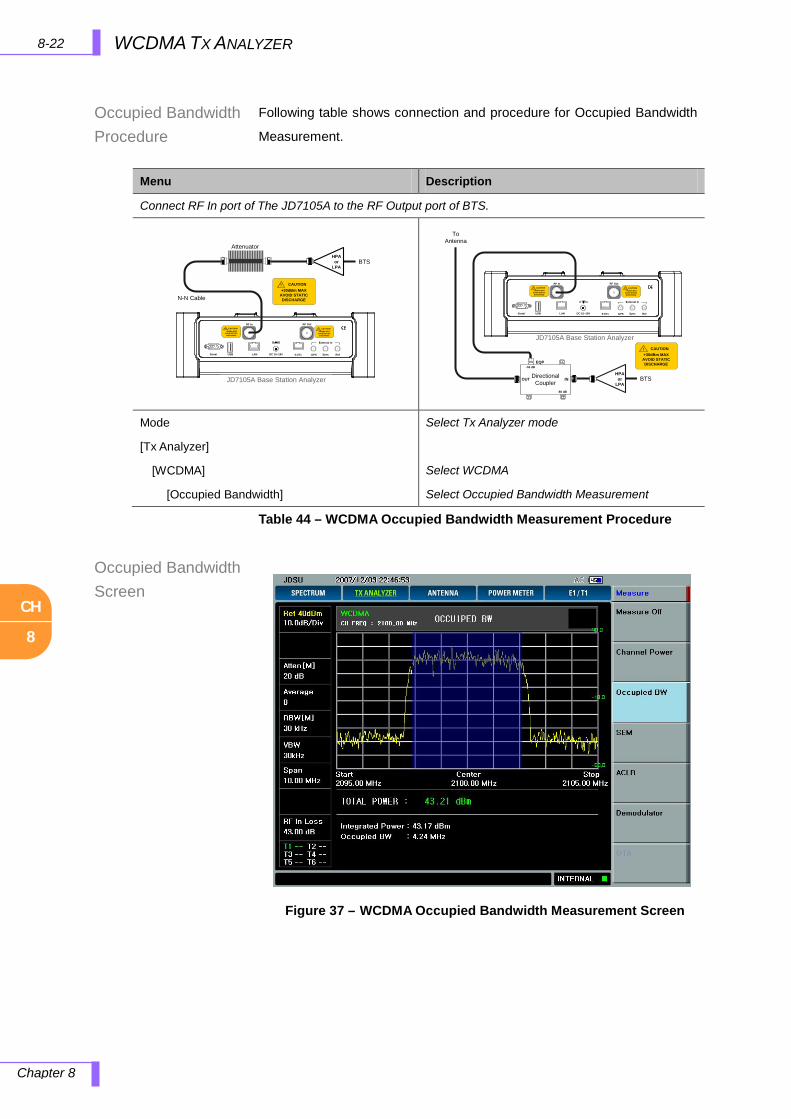
CH
8
8-22 WCDMA TX ANALYZER
Chapter 8
Occupied Bandwidth Procedure
Occupied Bandwidth Screen
Following table shows connection and procedure for Occupied Bandwidth
Measurement.
Table 44 – WCDMA Occupied Bandwidth Measurement Procedure
Menu Description
Connect RF In port of The JD7105A to the RF Output port of BTS.
RF In! CAUTION+30dBm MAX
AVOID STATIC DISCHARGE
Sync RefDC 15~19VLANUSBSerial GPS
RF Out
E1/T1
! CAUTION+25dBm MAX
AVOID STATIC DISCHARGE
External In
JD7105A Base Station Analyzer
N-N Cable
! CAUTION+30dBm MAX
AVOID STATIC DISCHARGE
BTSHPA
or LPA
Attenuator
JD7105A Base Station Analyzer
RF In! CAUTION+30dBm MAX
AVOID STATIC DISCHARGE
Sync RefDC 15~19VLANUSBSerial GPS
RF Out
E1/T1
! CAUTION+25dBm MAX
AVOID STATIC DISCHARGE
External In
To Antenna
DirectionalCoupler
EQP-50 dB
-50 dB
OUT IN BTSHPA
or LPA
! CAUTION+30dBm MAX
AVOID STATIC DISCHARGE
Mode
[Tx Analyzer]
[WCDMA]
[Occupied Bandwidth]
Select Tx Analyzer mode
Select WCDMA
Select Occupied Bandwidth Measurement
Figure 37 – WCDMA Occupied Bandwidth Measurement Screen
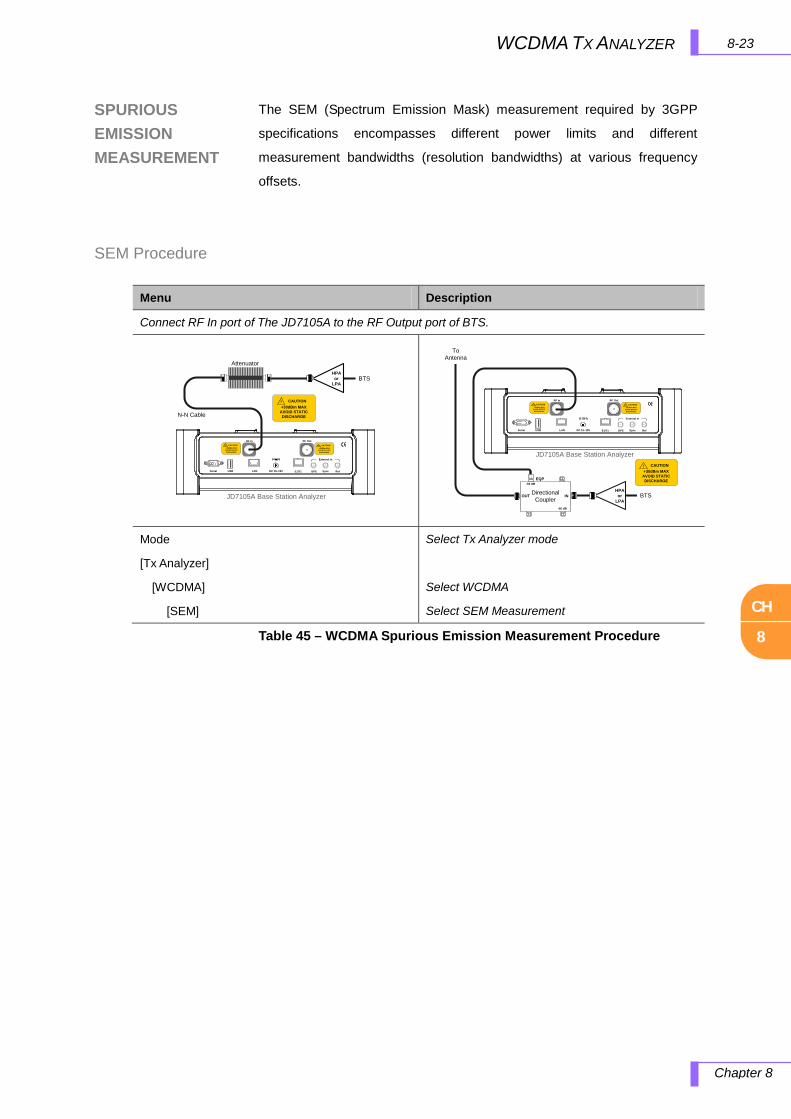
CH
8
8-23 WCDMA TX ANALYZER
Chapter 8
SPURIOUS EMISSION MEASUREMENT
SEM Procedure
The SEM (Spectrum Emission Mask) measurement required by 3GPP
specifications encompasses different power limits and different
measurement bandwidths (resolution bandwidths) at various frequency
offsets.
Table 45 – WCDMA Spurious Emission Measurement Procedure
Menu Description
Connect RF In port of The JD7105A to the RF Output port of BTS.
RF In! CAUTION+30dBm MAX
AVOID STATIC DISCHARGE
Sync RefDC 15~19VLANUSBSerial GPS
RF Out
E1/T1
! CAUTION+25dBm MAX
AVOID STATIC DISCHARGE
External In
JD7105A Base Station Analyzer
N-N Cable
! CAUTION+30dBm MAX
AVOID STATIC DISCHARGE
BTSHPA
or LPA
Attenuator
JD7105A Base Station Analyzer
RF In! CAUTION+30dBm MAX
AVOID STATIC DISCHARGE
Sync RefDC 15~19VLANUSBSerial GPS
RF Out
E1/T1
! CAUTION+25dBm MAX
AVOID STATIC DISCHARGE
External In
To Antenna
DirectionalCoupler
EQP-50 dB
-50 dB
OUT IN BTSHPA
or LPA
! CAUTION+30dBm MAX
AVOID STATIC DISCHARGE
Mode
[Tx Analyzer]
[WCDMA]
[SEM]
Select Tx Analyzer mode
Select WCDMA
Select SEM Measurement

CH
8
8-24 WCDMA TX ANALYZER
Chapter 8
SEM Screen
ACLR MEASUREMENT
The ACPR, designated by the 3GPP W-CDMA specifications as the
adjacent channel leakage power ratio (ACLR), is a measure of the power
in adjacent channels relative to the transmitted power. The standard
requires the power of both the transmitted and adjacent channels be
measured through a root raised cosine filter (RRC) with a roll-off factor of
0.22. The W-CDMA ACPR measurement performed in this exercise can
measure up to five adjacent channel pairs with 3GPP compliance. The
RRC filter defaults to “On” when the measurement is first activated, but
may be disabled.
Figure 38 – WCDMA Spurious Emission Measurement Screen
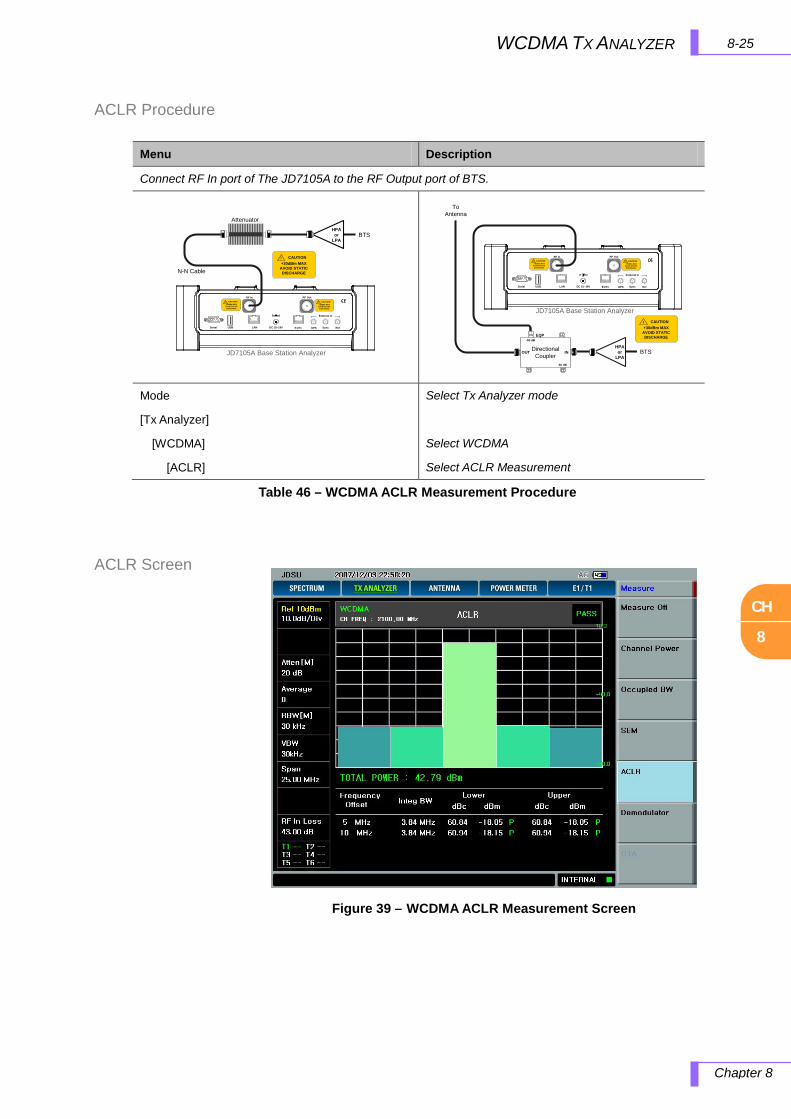
CH
8
8-25 WCDMA TX ANALYZER
Chapter 8
ACLR Procedure
ACLR Screen
Table 46 – WCDMA ACLR Measurement Procedure
Menu Description
Connect RF In port of The JD7105A to the RF Output port of BTS.
RF In! CAUTION+30dBm MAX
AVOID STATIC DISCHARGE
Sync RefDC 15~19VLANUSBSerial GPS
RF Out
E1/T1
! CAUTION+25dBm MAX
AVOID STATIC DISCHARGE
External In
JD7105A Base Station Analyzer
N-N Cable
! CAUTION+30dBm MAX
AVOID STATIC DISCHARGE
BTSHPA
or LPA
Attenuator
JD7105A Base Station Analyzer
RF In! CAUTION+30dBm MAX
AVOID STATIC DISCHARGE
Sync RefDC 15~19VLANUSBSerial GPS
RF Out
E1/T1
! CAUTION+25dBm MAX
AVOID STATIC DISCHARGE
External In
To Antenna
DirectionalCoupler
EQP-50 dB
-50 dB
OUT IN BTSHPA
or LPA
! CAUTION+30dBm MAX
AVOID STATIC DISCHARGE
Mode
[Tx Analyzer]
[WCDMA]
[ACLR]
Select Tx Analyzer mode
Select WCDMA
Select ACLR Measurement
Figure 39 – WCDMA ACLR Measurement Screen
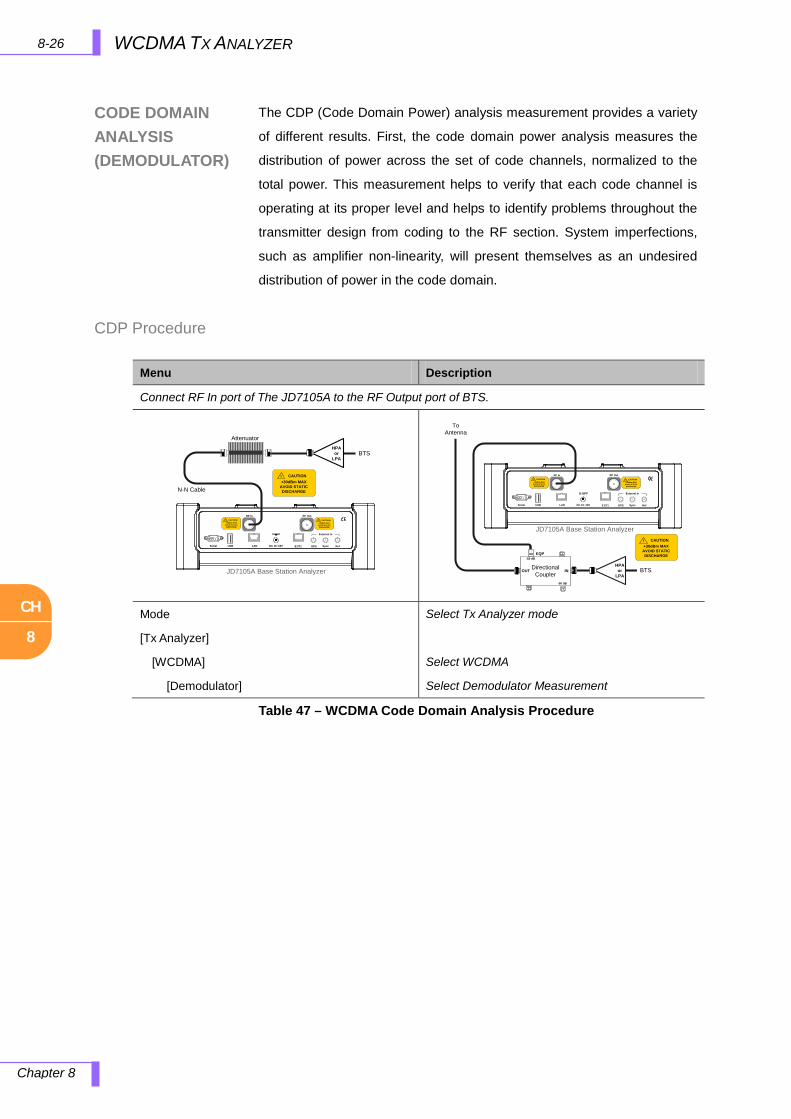
CH
8
8-26 WCDMA TX ANALYZER
Chapter 8
CODE DOMAIN ANALYSIS (DEMODULATOR)
CDP Procedure
The CDP (Code Domain Power) analysis measurement provides a variety
of different results. First, the code domain power analysis measures the
distribution of power across the set of code channels, normalized to the
total power. This measurement helps to verify that each code channel is
operating at its proper level and helps to identify problems throughout the
transmitter design from coding to the RF section. System imperfections,
such as amplifier non-linearity, will present themselves as an undesired
distribution of power in the code domain.
Table 47 – WCDMA Code Domain Analysis Procedure
Menu Description
Connect RF In port of The JD7105A to the RF Output port of BTS.
RF In! CAUTION+30dBm MAX
AVOID STATIC DISCHARGE
Sync RefDC 15~19VLANUSBSerial GPS
RF Out
E1/T1
! CAUTION+25dBm MAX
AVOID STATIC DISCHARGE
External In
JD7105A Base Station Analyzer
N-N Cable
! CAUTION+30dBm MAX
AVOID STATIC DISCHARGE
BTSHPA
or LPA
Attenuator
JD7105A Base Station Analyzer
RF In! CAUTION+30dBm MAX
AVOID STATIC DISCHARGE
Sync RefDC 15~19VLANUSBSerial GPS
RF Out
E1/T1
! CAUTION+25dBm MAX
AVOID STATIC DISCHARGE
External In
To Antenna
DirectionalCoupler
EQP-50 dB
-50 dB
OUT IN BTSHPA
or LPA
! CAUTION+30dBm MAX
AVOID STATIC DISCHARGE
Mode
[Tx Analyzer]
[WCDMA]
[Demodulator]
Select Tx Analyzer mode
Select WCDMA
Select Demodulator Measurement
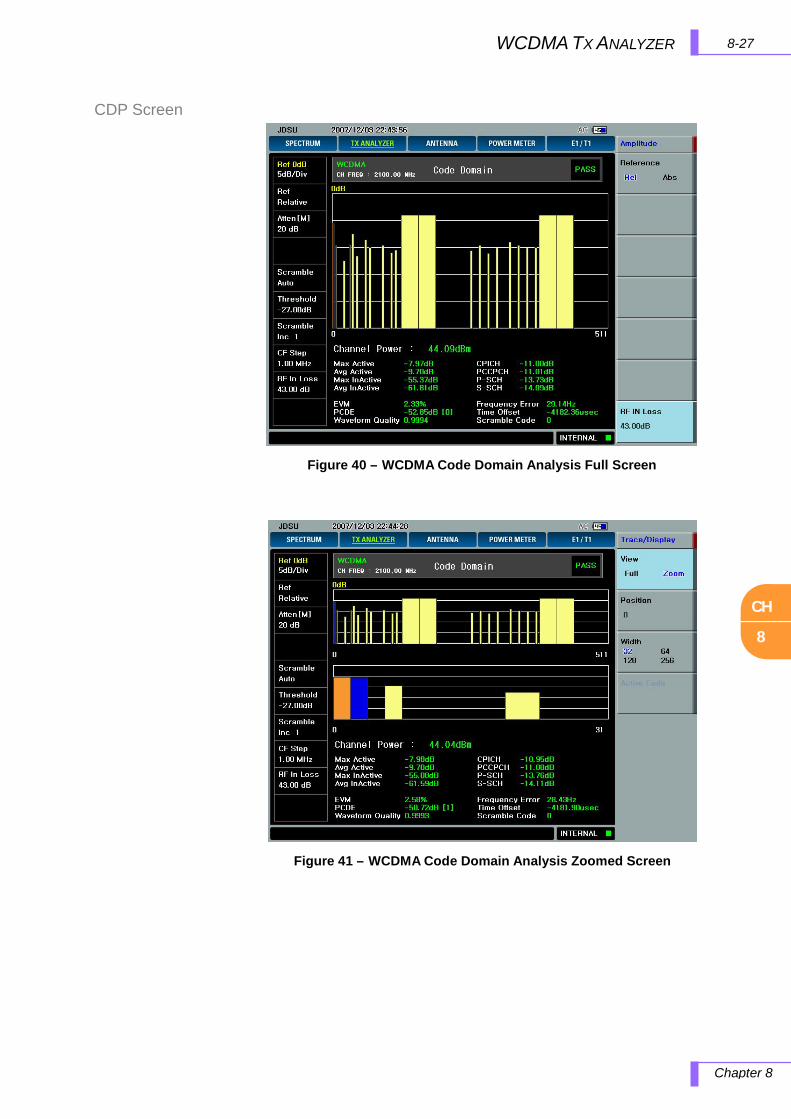
CH
8
8-27 WCDMA TX ANALYZER
Chapter 8
CDP Screen
Figure 40 – WCDMA Code Domain Analysis Full Screen
Figure 41 – WCDMA Code Domain Analysis Zoomed Screen
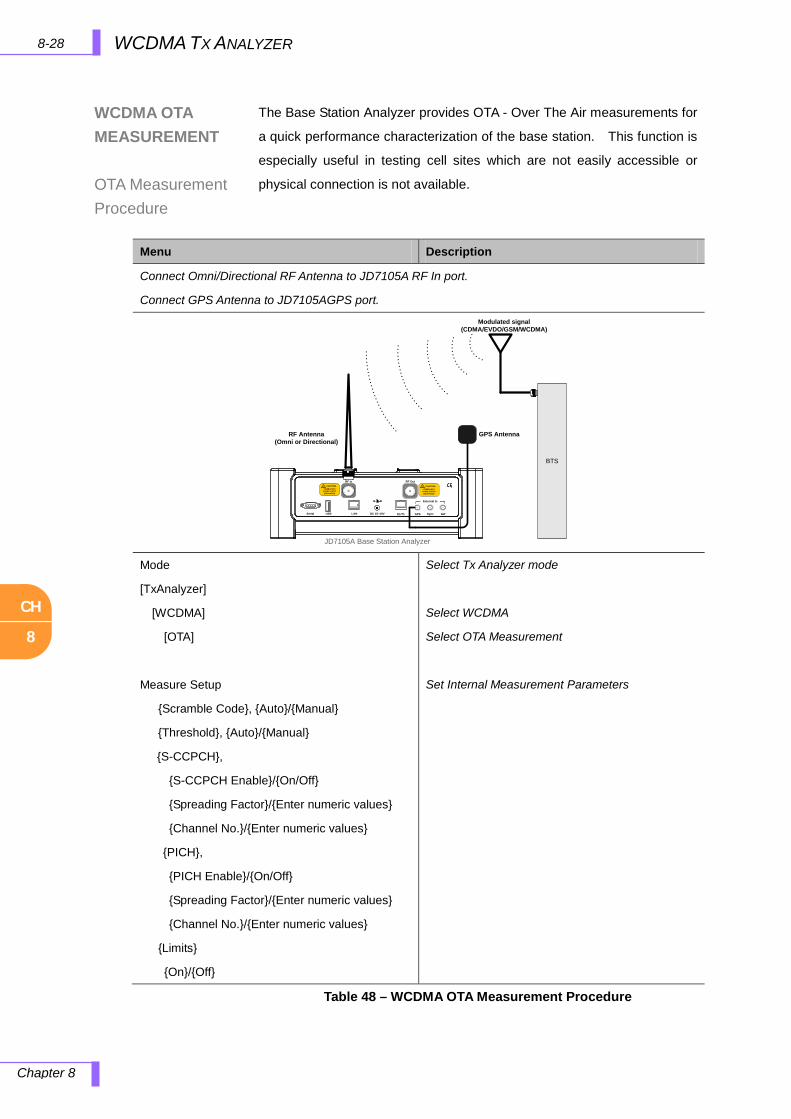
CH
8
8-28 WCDMA TX ANALYZER
Chapter 8
WCDMA OTA MEASUREMENT
OTA Measurement Procedure
The Base Station Analyzer provides OTA - Over The Air measurements for
a quick performance characterization of the base station. This function is
especially useful in testing cell sites which are not easily accessible or
physical connection is not available.
Table 48 – WCDMA OTA Measurement Procedure
Menu Description
Connect Omni/Directional RF Antenna to JD7105A RF In port.
Connect GPS Antenna to JD7105AGPS port.
RF In! CAUTION+30dBm MAX
AVOID STATIC DISCHARGE
Sync RefDC 15~19VLANUSBSerial GPS
RF Out
E1/T1
! CAUTION+25dBm MAX
AVOID STATIC DISCHARGE
External In
BTS
Modulated signal (CDMA/EVDO/GSM/WCDMA)
RF Antenna (Omni or Directional)
JD7105A Base Station Analyzer
GPS Antenna
Mode
[TxAnalyzer]
[WCDMA]
[OTA]
Measure Setup
Scramble Code, Auto/Manual
Threshold, Auto/Manual
S-CCPCH,
S-CCPCH Enable/On/Off
Spreading Factor/Enter numeric values
Channel No./Enter numeric values
PICH,
PICH Enable/On/Off
Spreading Factor/Enter numeric values
Channel No./Enter numeric values
Limits
On/Off
Select Tx Analyzer mode
Select WCDMA
Select OTA Measurement
Set Internal Measurement Parameters
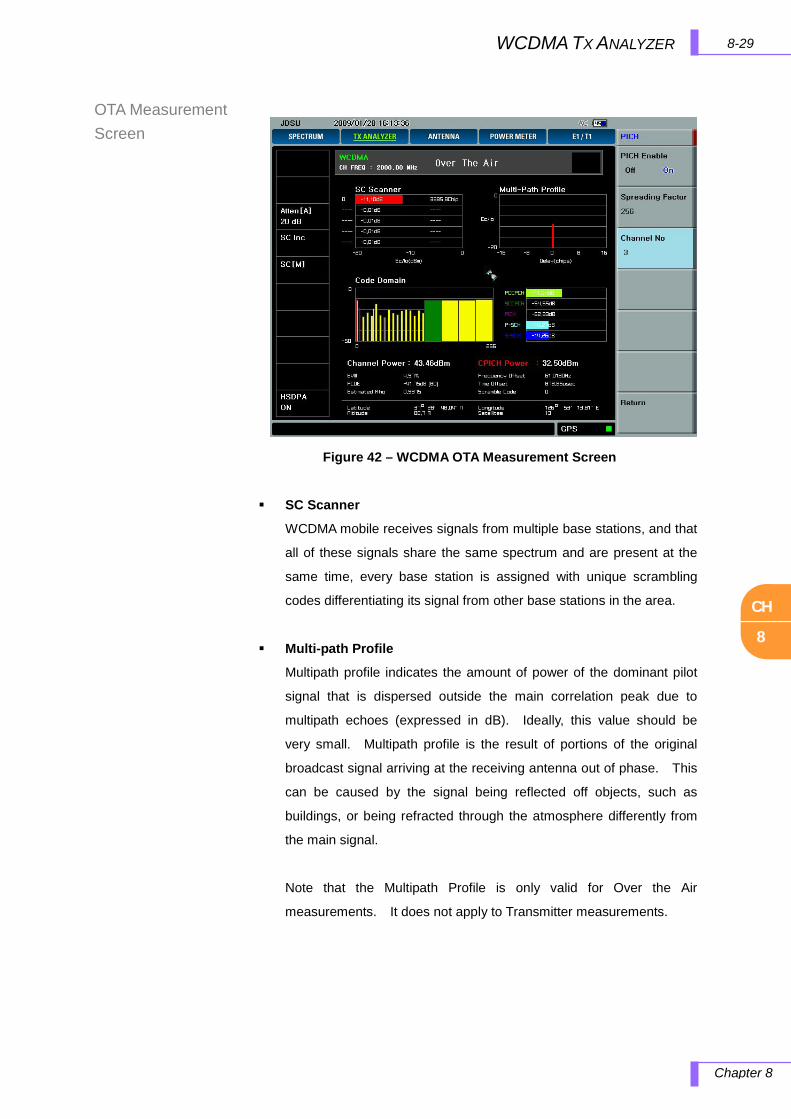
CH
8
8-29 WCDMA TX ANALYZER
Chapter 8
OTA Measurement Screen
SC Scanner
WCDMA mobile receives signals from multiple base stations, and that
all of these signals share the same spectrum and are present at the
same time, every base station is assigned with unique scrambling
codes differentiating its signal from other base stations in the area.
Multi-path Profile
Multipath profile indicates the amount of power of the dominant pilot
signal that is dispersed outside the main correlation peak due to
multipath echoes (expressed in dB). Ideally, this value should be
very small. Multipath profile is the result of portions of the original
broadcast signal arriving at the receiving antenna out of phase. This
can be caused by the signal being reflected off objects, such as
buildings, or being refracted through the atmosphere differently from
the main signal.
Note that the Multipath Profile is only valid for Over the Air
measurements. It does not apply to Transmitter measurements.
Figure 42 – WCDMA OTA Measurement Screen
CH
8
8-30 WCDMA TX ANALYZER
Chapter 8
Code Domain
Channels with high correlation factors are determined to be active
channels and are indicated as such on the display. Once the
channels are decoded, the analyzer determines the power of each
channel relative to the total signal power.
This measurement helps to verify that each code channel is operating
at its proper level and helps to identify problems throughout the
transmitter design from the coding to the RF section. System
imperfections, such as the non-linearity of amplifiers, will present
themselves as an undesired distribution of power in the code domain.
Channel Power (dBm)
The channel power measurement indicates the channel power within
a specified bandwidth (default of 3.84MHz).
CPICH Power (dBm)
The CPICH power is the total power in the dominant pilot signal,
expressed in dBm.
Latitude, Longitude, Altitude, Satellites Information
If a GPS antenna is supplied and locked to the satellites, then the
positioning information will be displayed on the bottom of the screen.
CH
9
9-1 GSM/EDGE TX ANALYZER
Chapter 9
9.0 GSM/EDGE TX ANALYZER
In this chapter
GSM/EDGE Analyzer Introduction ................................................................................................................ 9-2
What is GSM ........................................................................................................................................ 9-3 Time Slot ............................................................................................................................................... 9-4 Channel Power Measurement Concept ................................................................................................ 9-4 Spurious Emission Measurement Concept ........................................................................................... 9-4 Code Domain Measurement Concept (Demodulator) ........................................................................... 9-5 Phase & Frequency Error Measurement Concept ................................................................................ 9-5 Baseband I/Q Measurement Concept ................................................................................................... 9-6
Using GSM/EDGE Tx Analyzer .................................................................................................................... 9-7 How to Use Keys .......................................................................................................................................... 9-8
Freq/Chan ............................................................................................................................................. 9-8 Amplitude .............................................................................................................................................. 9-8 Trace/Display ...................................................................................................................................... 9-10 BW/AVG...............................................................................................................................................9-11 Marker ................................................................................................................................................ 9-12 Peak Search ....................................................................................................................................... 9-13 Measure .............................................................................................................................................. 9-13 Measure Setup ................................................................................................................................... 9-14 Display Overview ................................................................................................................................ 9-15 Setup .................................................................................................................................................. 9-16
Frequency Setup ........................................................................................................................ 9-16 External Clock Setting ................................................................................................................ 9-17
Channel Power Measurement ............................................................................................................ 9-19 Channel Power Procedure .......................................................................................................... 9-19 Channel Power Screen ............................................................................................................... 9-20
Occupied Bandwidth Measurement .................................................................................................... 9-21 Occupied Bandwidth Procedure ................................................................................................. 9-21 Occupied Bandwidth Screen ....................................................................................................... 9-22
Spurious Emissions Measurement ..................................................................................................... 9-23 SEM Procedure .......................................................................................................................... 9-23 SEM Screen................................................................................................................................ 9-23
Power vs. Time Measurement ............................................................................................................ 9-24 PvT Procedure ............................................................................................................................ 9-24 PvT Screens ............................................................................................................................... 9-25
I/Q Polar Vector Measurement ........................................................................................................... 9-26 I/Q Polar Vector Procedure ......................................................................................................... 9-26 I/Q Polar Vector Screen .............................................................................................................. 9-27
I/Q Demodulated Bits Measurement ................................................................................................... 9-28 I/Q Demodulated Bits Procedure ................................................................................................ 9-28 I/Q Demodulated Bits Screen ..................................................................................................... 9-29
GSM OTA Measurement ..................................................................................................................... 9-30 OTA Measurement Procedure .................................................................................................... 9-30 OTA Measurement Screen .......................................................................................................... 9-31
CH
9
9-2 GSM/EDGE TX ANALYZER
Chapter 9
GSM/EDGE ANALYZER INTRODUCTION
GSM (Global System for Mobile Communications) is a digital cellular
standard that uses time division multiple access (TDMA) multiplexing
scheme and Gaussian minimum shift keying (GMSK) modulation.
EDGE (Enhanced Data Rates for GSM Evolution), is an enhancement to
GSM that promises to deliver true third-generation (3G) wireless services
such as multimedia and other broadband applications. It uses TDMA and
3π/8 8PSK (phase shift keying) modulation.
The GSM standards define a radio communications system that works
properly only if each component operates within precise specifications.
Essentially, a compromise is established between the link quality
experienced by an individual user and the level of interference
experienced by others. Mobiles and base stations must transmit enough
power, with sufficient fidelity to maintain a call with acceptable quality,
without transmitting excessive power into the frequency channels and
timeslots allocated to others. Receivers must have adequate sensitivity
and selectivity to acquire and demodulate a low-level signal.
This section presents the fundamental RF parametric measurements
necessary to characterize GSM/EDGE base transceiver stations and their
components.

CH
9
9-3 GSM/EDGE TX ANALYZER
Chapter 9
WHAT IS GSM
GSM standard defines a voice and data over-air interface between a
mobile radio and the system infrastructure. EDGE (Enhanced Data Rates
for GSM Evolution) enhances the GSM standard by implementing a new
modulation format and filtering designed to provide higher data rates in the
same spectrum. EDGE and GSM signals can be transmitted on the same
frequency, occupying different timeslots, and both use existing GSM
equipment. The GSM digital communications standard employs an 8:1
TDMA, allowing eight channels to use one carrier frequency
simultaneously. The 270.833 kbits/second raw bit rate is modulated on the
RF carrier using Gaussian Minimum Shift Keying (GMSK). The standard
includes multiple traffic channels, a control channel, and a cell broadcast
channel.
The GSM specification defines a channel spacing of 200 kHz. GSM 900,
GSM 450, GSM 480, GSM 850, DCS 1800, and PCS 1900 are GSM-
defined frequency bands. The term GSM 900 is used for any GSM or
EDGE system operating in the 900 MHz band, which includes P-GSM, E-
GSM, and R-GSM.
Primary (or standard) GSM 900 band (P-GSM) is the original GSM band.
Extended GSM 900 band (E-GSM) includes all the P-GSM bands and an
additional 50 channels. Railway GSM 900 band (R-GSM) includes all the
E-GSM band plus additional channels. GSM 450, GSM 480, GSM 700,
and GSM 850 are additional GSM-defined frequency bands that provide
additional bandwidth availability.
DCS 1800 is an adaptation of GSM 900, created to allow smaller cell sizes
for higher system capacity. PCS 1900 is intended to be identical to DCS
1800 except for frequency allocation and power levels. The term GSM
1800 is sometimes used for DCS 1800, and the term GSM 1900 is
sometimes used for PCS 1900.
CH
9
9-4 GSM/EDGE TX ANALYZER
Chapter 9
TIME SLOT
CHANNEL POWER MEASUREMENT CONCEPT
SPURIOUS EMISSION MEASUREMENT CONCEPT
EDGE and GSM use Time Division Multiple Access (TDMA) which divides
each RF channel into eight individual timeslots, thus allowing eight users
to share a single carrier frequency. Users are synchronized to transmit in
series, each in their assigned timeslot. A user may only transmit every
4.62 ms during their timeslot which is 577 μs long. The eight timeslots are
numbered 0 to 7. The 4.62 ms required to cycle through all eight timeslots
is called a frame.
The Channel Power measures in-channel power for GSM and EDGE
systems. GSM and EDGE systems use dynamic power control to ensure
that each link is maintained with minimum power. This gives two
fundamental benefits: overall system interference is kept to a minimum
and, in the case of mobile stations, battery life is maximized. The Channel
Power measurement determines the average power of an RF signal burst
at or above a specified threshold value. The threshold value may be
absolute, or relative to the peak value of the signal.
The purpose of the Channel Power measurement is to determine the
power delivered to the antenna system on the RF channel under test. The
instrument acquires a GSM or EDGE signal in the time domain. The
average power level above the threshold is then computed and displayed.
The Tx Band Spur measurement verifies the transmitter is not
transmitting undesirable energy into the transmitted band. This energy
may cause interference to other users on the GSM system.
The modulation process in a transmitter causes the continuous wave
(CW) carrier to spread spectrally. This is referred to as “spectrum due to
modulation and wideband noise.” Defects in the transmission chain may
cause the spectrum to excessively spread, resulting in interference with
other frequency bands. Measuring the spectrum due to modulation can be
thought of as making an adjacent channel power (ACP) measurement
where several adjacent channels are considered. GSM transmitters ramp
RF power rapidly. The transmitted RF carrier power versus time
measurement is used to ensure that this process happens at the correct
times and fast enough.
CH
9
9-5 GSM/EDGE TX ANALYZER
Chapter 9
CODE DOMAIN MEASUREMENT CONCEPT (DEMODULATOR)
PHASE & FREQUENCY ERROR MEASUREMENT CONCEPT
However, if RF power is ramped too quickly, undesirable spectral
components will arise in the transmitted signal. This upsets the “spectrum
due to switching,” which again results in interference with other frequency
bands. Spectrum due to modulation and spectrum due to switching
measurements are usually grouped together and known as the output RF
spectrum. The GSM 3GPP specifications have particular restrictions on
output RF spectrum for a series of frequencies. Verification of compliance
with the 3GPP requires up to 80 dB of dynamic range.
Power vs. Time, Power vs. Time (PvT) measures the mean transmission
power during the “useful part” of GSM bursts and verifies that the power
ramp fits within the defined mask. PvT also lets you view the rise, fall, and
“useful part” of the GSM burst. Using the “Multi-Slot” function, up to eight
slots in a frame can be viewed at a time. GSM is a TDMA scheme with
eight time slots, or bursts, per RF channel; if the burst does not occur at
exactly the right time, or if the burst is irregular, then other adjacent
timeslots can experience interference. Because of this, the industry
standards specify a tight mask for the TDMA burst.
The PvT measurement provides masks for both BTS (Base Transceiver
Station) and MS (mobile station). The timing masks are referenced to the
transition from bit 13 to bit 14 of the mid-amble training sequence. For
GMSK measurements, the 0 dB reference is determined by measuring the
mean transmitted power during the “useful part” of the burst.
Phase and frequency error are the measurements of modulation quality
for GSM. Since GSM uses relative phase to transmit information, the
phase and frequency accuracy of the transmitter are critical to the system
performance and ultimately transmission coverage.
GSM receivers rely on the phase and frequency quality of the 0.3 GMSK
signal in order to achieve the expected carrier to noise performance. A
transmitter with high phase and frequency error is often still able to
support phone calls during a functional test. However, it tends to be more
difficult for mobiles to maintain communication at the edges of the cell,
with low signal levels, or under fading and doppler conditions.
CH
9
9-6 GSM/EDGE TX ANALYZER
Chapter 9
BASEBAND I/Q MEASUREMENT CONCEPT
The phase error of the signal is measured by computing the difference
between the phase of the transmitted signal and the phase of a
theoretically signal. The instrument samples the transmitter output in order
to capture the actual phase trajectory. This is then demodulated and the
ideal phase trajectory is mathematically derived. The error signal is
obtained by subtracting one from the other.
This measurement displays the frequency and phase errors numerically
and graphically, showing the binary representation of the demodulated
data bits.
In transmitters, the baseband I/Q refers to signals that are composed of
individual I/Q modulators, before the I and Q component signals are
combined, and before the up-conversion to IF or RF frequencies. In
receivers, baseband I/Q analysis is used to test the I and Q components
of I/Q demodulators, after an RF signal has been down-converted and
demodulated.
Many measurements related to the characteristics of I and Q signals can
be made when mixed and up-converted to signals in the RF spectrum.
However, measurements which relate to the characteristics of an up-
converted signal that lie beyond the bandwidth available to the baseband
I/Q Input circuit can not be measured (the limits are up to 5 MHz
bandwidth for individual I and Q signals, and up to 10 MHz for composite
I/Q signals).
Some measurements are appropriate for use with both RF and baseband
I/Q signals without any modification, while others must be altered. Some
examples of measurements with identical results are QPSK EVM, Code
Domain, and CCDF. For Spectrum measurements, identical results include
the I and Q waveform and the I/Q polar representation. For waveform
measurements, identical results include I/Q waveform view, signal
envelope view, and I/Q polar view.
At RF frequencies, power measurements are conventionally displayed on
a logarithmic vertical scale in dBm, whereas measurements of baseband
signals using baseband I/Q inputs may be conveniently displayed as
voltage using a linear vertical scale as well as a log scale.
CH
9
9-7 GSM/EDGE TX ANALYZER
Chapter 9
USING GSM/EDGE TX ANALYZER
This section provides details about the GSM and EDGE communications
system and explains how the various measurements are performed by the
instrument.
The JD7105A provides the following analysis tools for GSM/EDGE system.
Channel Power
Occupied Bandwidth
RMS Phase Error
Peak Phase Error
Power vs. Time (Slot, Frame)
Frequency Error
TSC Code
IQ Origin Offset
Constellation
Data Bit Analysis
OTA
Auto Measure
CH
9
9-8 GSM/EDGE TX ANALYZER
Chapter 9
FREQ/CHAN
AMPLITUDE
HOW TO USE KEYS
The following describes the primary use of the keys in GSM Tx Analyzer
mode.
Freq/Chan
Sets Frequency and selects standard or custom frequency bands.
CENTER FREQUENCY: Changes the center frequency setup in the
spectrum measurement screen. Values can be entered with the data entry
keys, the arrow keys, or the knob. When data entry keys are used the
input is completed with the unit selection to define the input value. When
the arrow keys or the knob are used, the center frequency changes in
predefined CF steps; the CF steps are user definable in the CF Step Menu.
CF STEP: Defines the center frequency step units; values can be entered
with the data entry key or the knob. When the data entry keys are used,
the input is completed by selecting the unit to define the input value on the
screen key. When the knob is used, the incremental value is 0.1MHz.
CHANNEL STANDARD: Using this key, the channel band can be selected
without setting Start, Stop, and Center frequencies. The saved custom
channel bands will pop-up to select the proper band.
UNIT: Selects the unit to be used, either Frequency or Channel. When
the “Chan” is selected, the CF Step corresponds to Channel Step.
Amplitude
When the instrument is in Channel Power, Occupied Bandwidth, SEM,
and ACLR measurement mode, an Amplitude key is used as below.
AUTO SCALE: The instrument can automatically set the scale to the
minimum and maximum values of a measurement on the Y-axis of the
graph for optimum traces display. Every time the AUTO SCALE key is
selected, the top and bottom scales are set to the minimum and maximum
values with margin on the Y-axis of the screen display.
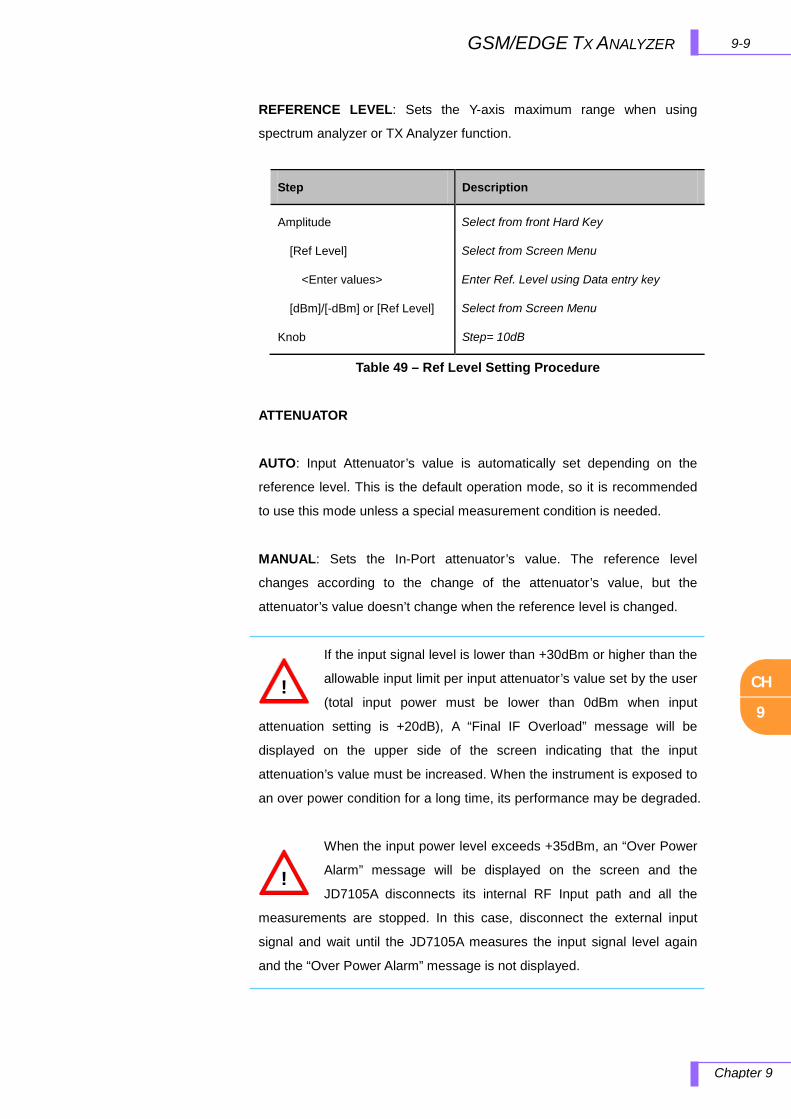
CH
9
9-9 GSM/EDGE TX ANALYZER
Chapter 9
REFERENCE LEVEL: Sets the Y-axis maximum range when using
spectrum analyzer or TX Analyzer function.
Step Description
Amplitude
[Ref Level]
<Enter values>
[dBm]/[-dBm] or [Ref Level]
Knob
Select from front Hard Key
Select from Screen Menu
Enter Ref. Level using Data entry key
Select from Screen Menu
Step= 10dB
Table 49 – Ref Level Setting Procedure
ATTENUATOR
AUTO: Input Attenuator’s value is automatically set depending on the
reference level. This is the default operation mode, so it is recommended
to use this mode unless a special measurement condition is needed.
MANUAL: Sets the In-Port attenuator’s value. The reference level
changes according to the change of the attenuator’s value, but the
attenuator’s value doesn’t change when the reference level is changed.
If the input signal level is lower than +30dBm or higher than the
allowable input limit per input attenuator’s value set by the user
(total input power must be lower than 0dBm when input
attenuation setting is +20dB), A “Final IF Overload” message will be
displayed on the upper side of the screen indicating that the input
attenuation’s value must be increased. When the instrument is exposed to
an over power condition for a long time, its performance may be degraded.
When the input power level exceeds +35dBm, an “Over Power
Alarm” message will be displayed on the screen and the
JD7105A disconnects its internal RF Input path and all the
measurements are stopped. In this case, disconnect the external input
signal and wait until the JD7105A measures the input signal level again
and the “Over Power Alarm” message is not displayed.
!
!
CH
9
9-10 GSM/EDGE TX ANALYZER
Chapter 9
TRACE/DISPLAY
RF IN LOSS: Sets an external offset value. An offset consists of a cable
offset and a user offset, and the measurement result shows the value
reflecting both offset values. Even if an offset is set, the reference level is
automatically adjusted to avoid the waveform fitting out of the screen. An
offset value set in Spectrum mode have precedence over the offset value
set in Analysis Mode.
When the instrument is in Channel Scanner mode, there is an
additional menu as described below.
REFERENCE LEVEL: Sets the Y-axis maximum range when using the
spectrum analyzer or Tx Analyzer functions.
RF IN LOSS: Sets an external offset value. An offset consists of a cable
offset and a user offset, and the measurement result shows the value
reflecting both offset values. Even if an offset is set, the reference level is
automatically adjusted to avoid the waveform fitting out of the screen. An
offset value set in Spectrum mode have precedence over the offset value
set in Analysis Mode.
This key is not used in GSM Analyzer measurement mode.
When the instrument is in GSM Spectrum measurement mode, a
Trace/Display key is used as below.
TRACE SELECT: Selects an active trace from T1 ~ T6. Every time Select
screen menu is pressed, the active trace changes. Trace numbers are
assigned to each captured traces or loaded traces.
TRACE VIEW: Hides or displays the trace number on the screen. Press
the Select screen menu key to choose the Trace number. Traces with
View set OFF are hidden from the screen. Setting View On restores
hidden traces and information on the window.
M: Max Hold
m: Min Hold
C: Captured Trace
W: Current Trace
L: Loaded Trace

CH
9
9-11 GSM/EDGE TX ANALYZER
Chapter 9
BW/AVG
TRACE CAPTURE: Captures a current trace on the screen with assigned
trace number.
CLEAR WRITE: Clear selected Trace and Write (Assign) current trace.
MAX HOLD: Sets Active trace Max Hold. Active trace compares newly
acquired data with the trace shown on the screen and displays the bigger
trace on the screen.
MIN HOLD: Sets Active trace Min Hold. Active trace compares newly
acquired data with the trace shown on the screen and displays the smaller
trace on the screen.
TRACE CLEAR: Deletes an active trace from the screen. The cleared
trace is not restored. It is used to select and delete a trace one by one
when multiple traces are displayed on the screen. Verify the traces to
delete with Trace View ON/OFF function in advance settings as cleared
traces cannot be restored.
CLEAR CURRENT: Deletes an active trace from the screen. The cleared
trace is not restored. It is used to select and delete a trace one by one
when multiple traces are displayed on the screen. Verify the traces to
delete with View ON/OFF function in advance settings as cleared traces
cannot be restored.
CLEAR ALL: Deletes all traces from the instrument and initialize the trace
settings.
When the instrument is in Channel Scanner mode, a Trace/Display
key is used as below.
ZOOM START FREQ: Selects the start frequency of the zoom screen.
AVERAGE: Sets the average number of traces. A maximum of 99 times of
averaging can be set.
SWEEP CTRL: Selects the sweep method between "Continue" and "Hold".

CH
9
9-12 GSM/EDGE TX ANALYZER
Chapter 9
MARKER
This key is not used in GSM/EDGE Analyzer mode.
When the instrument is in GSM/EDGE Spectrum or Channel Scanner
mode, a Marker key is used as below.
Marker is used to get the information about a specific trace. A total of six
Markers can be set and each marker can be used independently. The X,
and Y coordinates of the trace are displayed when the maker is placed on
any position of the trace. As the position displaying Marker’s X and Y
coordinates may be slightly different for each measurement mode, refer to
the description of each measurement after this chapter.
MARKER SELECT: Selects an active marker which its position can be
changed with the knob or the arrow keys. The assigned number of active
markers is displayed on the Marker Select screen menu and the marker’s
number is also displayed next to the marker on the trace when the Marker
View On is selected.
MARKER VIEW: Hides or displays the selected marker on the screen. In
the same measurement mode markers appear at the previous positions
when the Marker View is turned off and on. If a measurement mode has
been changed, markers are not restored to their previous positions.
MARKER TYPE:
Selects the type of Marker to be displayed, Normal marker provide the
reading of its position and Delta marker provides the differences between
two sets of marker points.
NORMAL: Used to place a marker, along with the marker number,
1-6, on the trace.
DELTA: Delta Marker is associated with a Normal Marker, so a
Normal Maker must be set before a Delta marker is set. When a
Delta Marker is set, the position set by the Delta Marker becomes
the reference position of the Normal Marker and the Maker’s X
and Y values displays the difference compared with Delta Marker.

CH
9
9-13 GSM/EDGE TX ANALYZER
Chapter 9
PEAK SEARCH
MEASURE
MARKER CLEAR ALL: Turns all markers off the screen. Markers are
redisplayed on the previous position if markers are turned back on. If a
measurement mode is changed, current settings are not restored.
MARKER EDIT: Sets the marker position manually. A pop-up window
appears for users to set the frequency by entering numeric values and the
marker position is moved to the setting frequency.
This key is not used in GSM Analyzer and Channel Scanner mode.
When the instrument is in GSM Spectrum mode, a Peak Search key
is used as below.
Each time Peak Search key is pressed, a marker is displayed on the
highest peak of the Trace.
PEAK RIGHT: Moves the marker to the next highest peak at the right of its
current position.
PEAK LEFT: Moves the marker to the next highest peak at the left of its
current position.
MAX SEARCH: Moves the marker to the highest peak of the trace.
MIN SEARCH: Moves the marker to the lowest peak of the trace.
ALWAYS PEAK: Moves the marker automatically to the highest peak of
the trace each time the trace is updated.
When the instrument is in Tx Analyzer Mode, Measure key is used to
select measurement menu listed below.
Channel Scanner Measurement
Channel Power Measurement
Occupied Bandwidth Measurement
SEM Measurement
Demodulator Measurement
OTA Measurement
Auto Measure
CH
9
9-14 GSM/EDGE TX ANALYZER
Chapter 9
MEASURE SETUP
This key is not used in Channel Scanner measurement mode.
When the instrument is in Channel Power, Occupied Bandwidth, SEM
and Demodulator mode, a Measure Setup Key is used as below.
GSM/EDGE: Selects the GSM/EDGE signal standards (auto-detect is
default).
TRIGGER: Selects the trigger sources.
RF BURST: Sets the trigger level when using the RF Burst
(wideband) Trigger. The value is relative to the peak of the signal.
RF Burst is also known as RF Envelope.
INTERNAL FB (FREE BURST): Sets the trigger level to FB if
there is a Frequency Burst signal.
RF BURST & TS (TRAINING SEQUENCE): Sets the trigger level
to Training Sequence Code.
FREE: Sets the Free Trigger (Auto Trigger).
EXTERNAL: Sets the trigger level to external sync reference.
DELAY: Sets the delay in either us (micro-second) or symbol.
RX FILTER: Sets the internal Rx filter bandwidth (100k/200k/400k/624k)
CF OFFSET: Sets the offset on the center frequency
PSK
PSK DC Offset: Sets the PSK DC Offset
PSK Constellation: Sets the PSK constellation observation mode

CH
9
9-15GSM/EDGE TX ANALYZER
Chapter 9
DISPLAY
OVERVIEW
① Reference Level, Scale Division: Spectrum Window’s Y Scale
information
② Input Attenuation Information
[A]: Auto mode, [M]: Manual mode, [P]: Pre-amp On
③ Number of Averaging
④ Delay & Trigger Mode Setting Information
⑤ GSM/EDGE Selection Information
⑥ Rx (Receive) Filter Setting Information
⑦ User offset (Input Loss) Setting Information
⑧ Frequency Offset Information
⑨ Measure ON/OFF Screen Key
⑩ Channel Power Measurement Key
⑪ Occupied Bandwidth Measurement Key
⑫ SEM Measurement Key
⑬ Demodulator (Code Domain Analysis) Measurement Key (PvsT-Slot
or Frame, I/Q Polar Vector, Data Bit Measurement)
⑭ Channel Scanner Measurement
Figure 43 – Overview of GSM Tx Analyzer Display
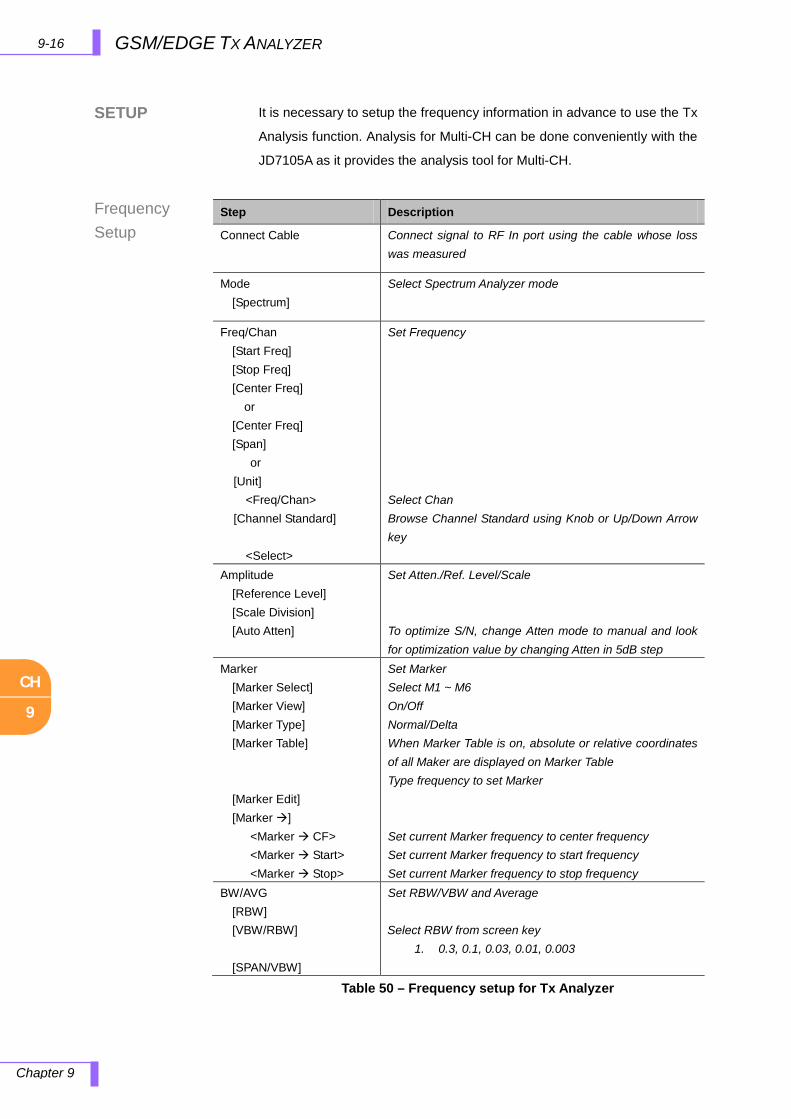
CH
9
9-16 GSM/EDGE TX ANALYZER
Chapter 9
SETUP
Frequency Setup
It is necessary to setup the frequency information in advance to use the Tx
Analysis function. Analysis for Multi-CH can be done conveniently with the
JD7105A as it provides the analysis tool for Multi-CH.
Table 50 – Frequency setup for Tx Analyzer
Step Description
Connect Cable Connect signal to RF In port using the cable whose loss was measured
Mode [Spectrum]
Select Spectrum Analyzer mode
Freq/Chan [Start Freq] [Stop Freq] [Center Freq]
or [Center Freq] [Span]
or [Unit] <Freq/Chan> [Channel Standard] <Select>
Set Frequency Select Chan Browse Channel Standard using Knob or Up/Down Arrow key
Amplitude [Reference Level] [Scale Division] [Auto Atten]
Set Atten./Ref. Level/Scale To optimize S/N, change Atten mode to manual and look for optimization value by changing Atten in 5dB step
Marker [Marker Select] [Marker View] [Marker Type] [Marker Table] [Marker Edit] [Marker ] <Marker CF>
<Marker Start> <Marker Stop>
Set Marker Select M1 ~ M6 On/Off Normal/Delta When Marker Table is on, absolute or relative coordinates of all Maker are displayed on Marker Table Type frequency to set Marker Set current Marker frequency to center frequency Set current Marker frequency to start frequency Set current Marker frequency to stop frequency
BW/AVG [RBW] [VBW/RBW] [SPAN/VBW]
Set RBW/VBW and Average Select RBW from screen key
1. 0.3, 0.1, 0.03, 0.01, 0.003
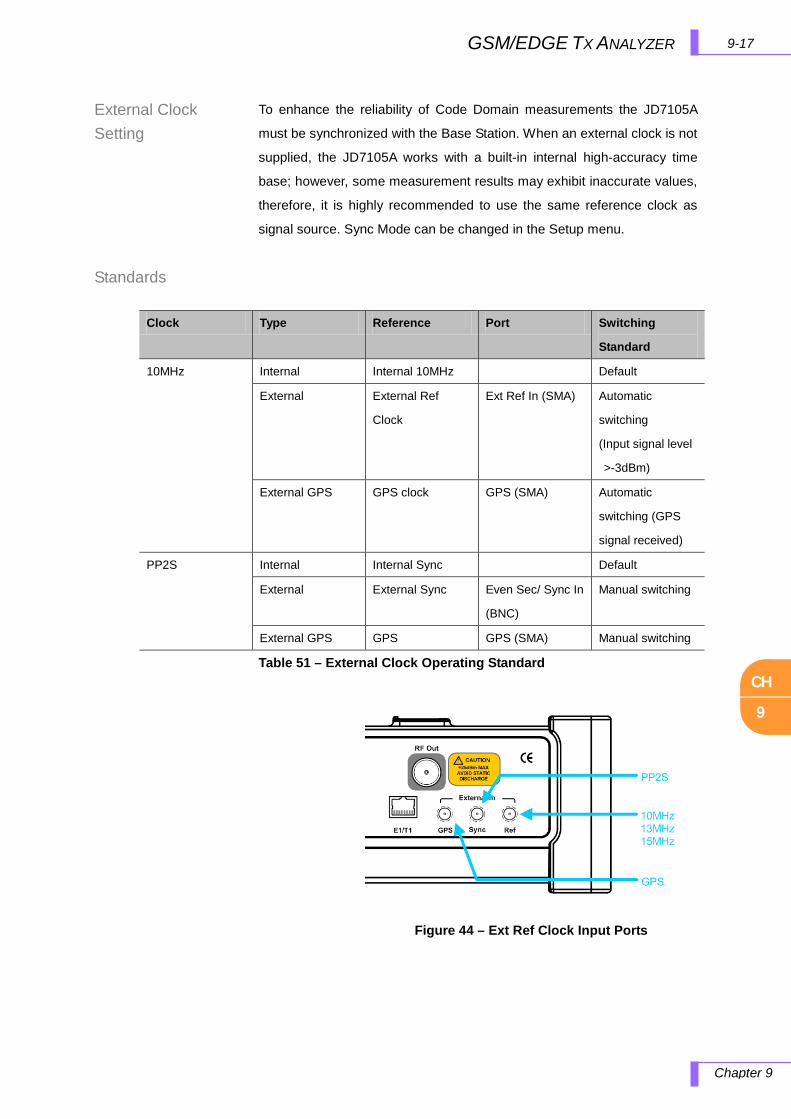
CH
9
9-17 GSM/EDGE TX ANALYZER
Chapter 9
External Clock Setting
Standards
To enhance the reliability of Code Domain measurements the JD7105A
must be synchronized with the Base Station. When an external clock is not
supplied, the JD7105A works with a built-in internal high-accuracy time
base; however, some measurement results may exhibit inaccurate values,
therefore, it is highly recommended to use the same reference clock as
signal source. Sync Mode can be changed in the Setup menu.
Table 51 – External Clock Operating Standard
Clock Type Reference Port Switching
Standard
10MHz Internal Internal 10MHz Default
External External Ref
Clock
Ext Ref In (SMA) Automatic
switching
(Input signal level
>-3dBm)
External GPS GPS clock GPS (SMA) Automatic
switching (GPS
signal received)
PP2S Internal Internal Sync Default
External External Sync Even Sec/ Sync In
(BNC)
Manual switching
External GPS GPS GPS (SMA) Manual switching
Figure 44 – Ext Ref Clock Input Ports
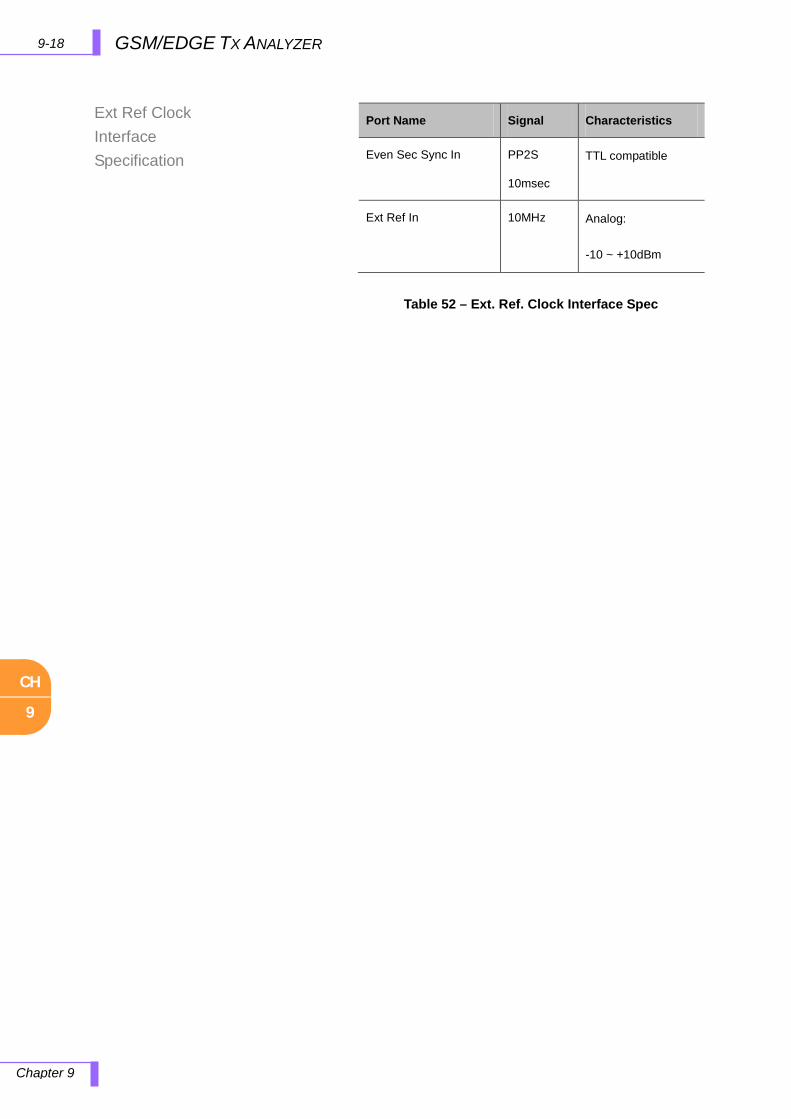
CH
9
9-18 GSM/EDGE TX ANALYZER
Chapter 9
Ext Ref Clock Interface Specification
Table 52 – Ext. Ref. Clock Interface Spec
Port Name Signal Characteristics
Even Sec Sync In PP2S
10msec
TTL compatible
Ext Ref In 10MHz Analog:
-10 ~ +10dBm
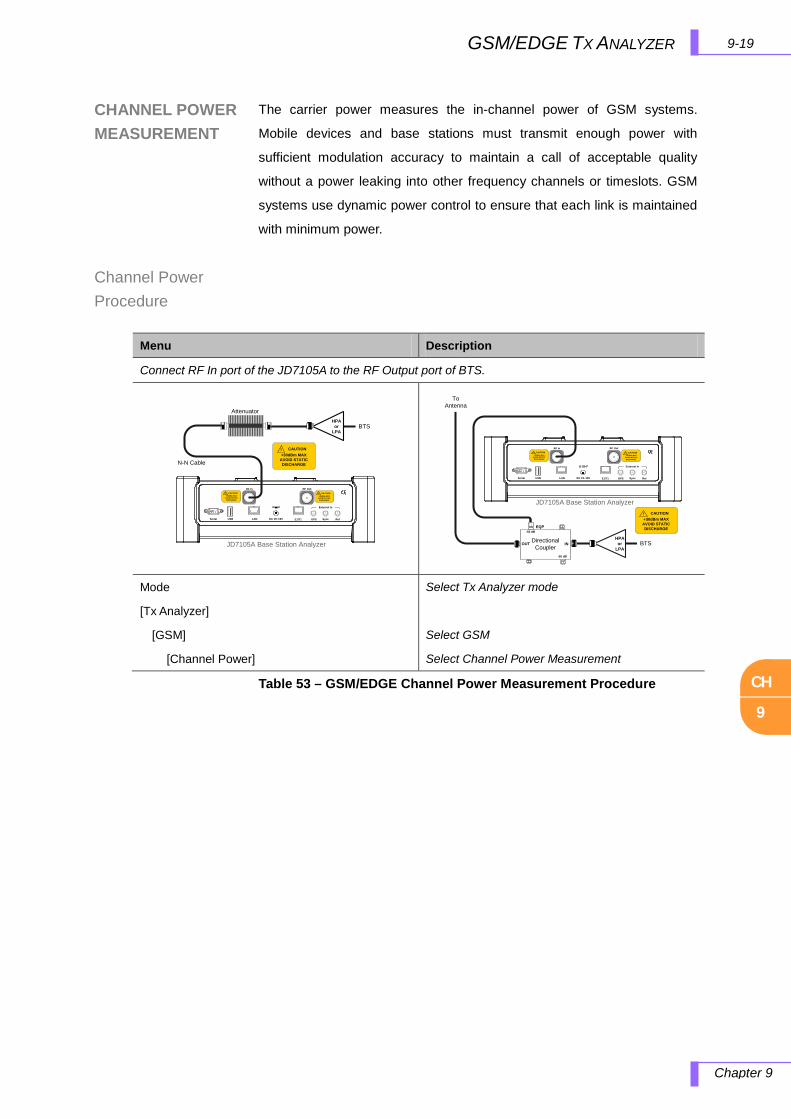
CH
9
9-19 GSM/EDGE TX ANALYZER
Chapter 9
CHANNEL POWER MEASUREMENT
Channel Power Procedure
The carrier power measures the in-channel power of GSM systems.
Mobile devices and base stations must transmit enough power with
sufficient modulation accuracy to maintain a call of acceptable quality
without a power leaking into other frequency channels or timeslots. GSM
systems use dynamic power control to ensure that each link is maintained
with minimum power.
Table 53 – GSM/EDGE Channel Power Measurement Procedure
Menu Description
Connect RF In port of the JD7105A to the RF Output port of BTS.
RF In! CAUTION+30dBm MAX
AVOID STATIC DISCHARGE
Sync RefDC 15~19VLANUSBSerial GPS
RF Out
E1/T1
! CAUTION+25dBm MAX
AVOID STATIC DISCHARGE
External In
JD7105A Base Station Analyzer
N-N Cable
! CAUTION+30dBm MAX
AVOID STATIC DISCHARGE
BTSHPA
or LPA
Attenuator
JD7105A Base Station Analyzer
RF In! CAUTION+30dBm MAX
AVOID STATIC DISCHARGE
Sync RefDC 15~19VLANUSBSerial GPS
RF Out
E1/T1
! CAUTION+25dBm MAX
AVOID STATIC DISCHARGE
External In
To Antenna
DirectionalCoupler
EQP-50 dB
-50 dB
OUT IN BTSHPA
or LPA
! CAUTION+30dBm MAX
AVOID STATIC DISCHARGE
Mode
[Tx Analyzer]
[GSM]
[Channel Power]
Select Tx Analyzer mode
Select GSM
Select Channel Power Measurement
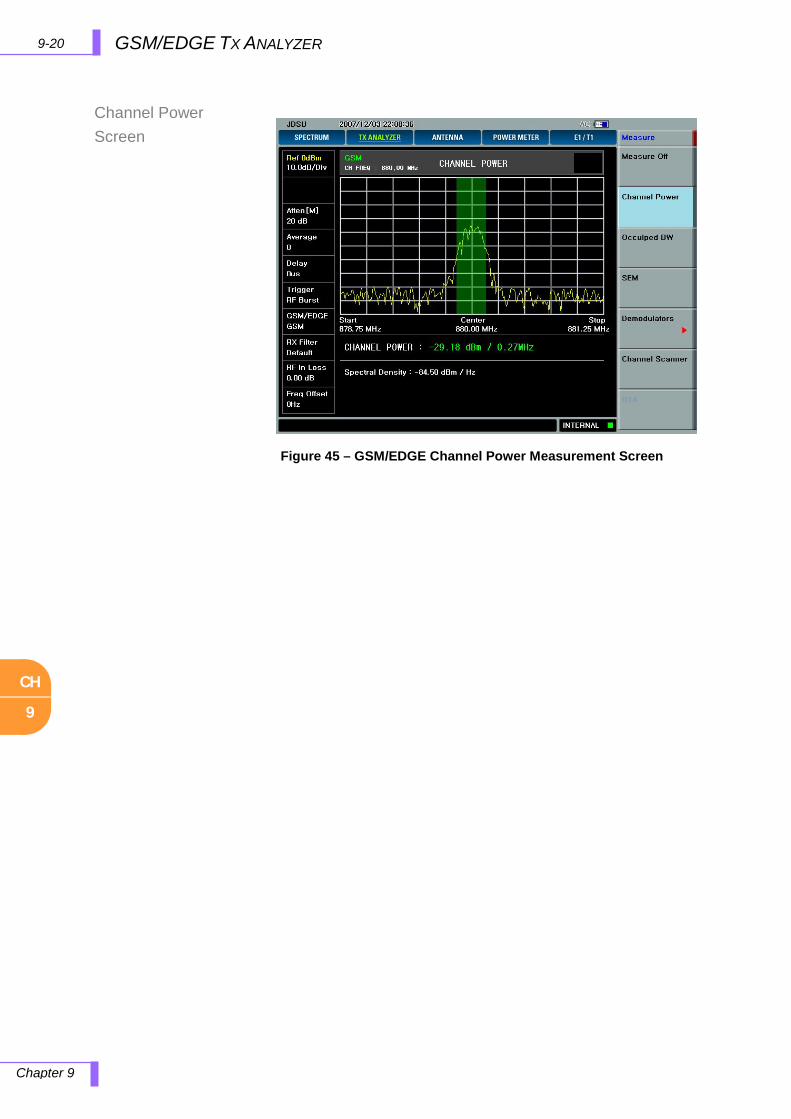
CH
9
9-20 GSM/EDGE TX ANALYZER
Chapter 9
Channel Power Screen
Figure 45 – GSM/EDGE Channel Power Measurement Screen
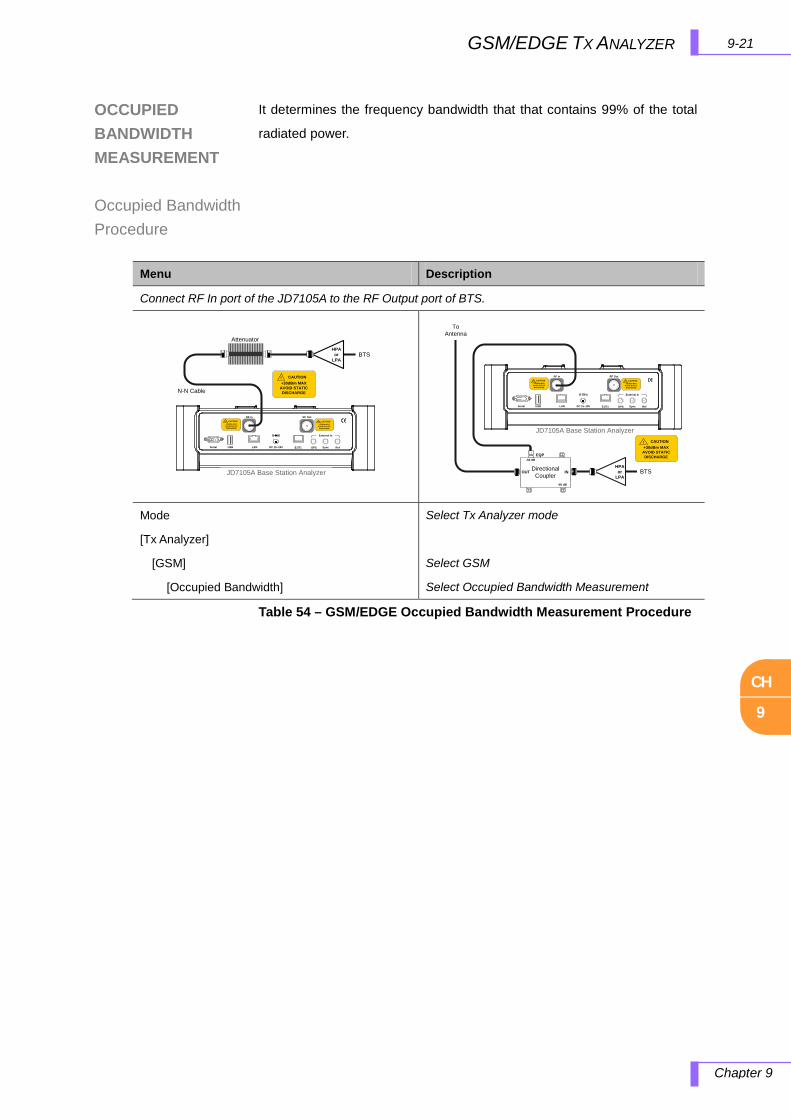
CH
9
9-21 GSM/EDGE TX ANALYZER
Chapter 9
OCCUPIED BANDWIDTH MEASUREMENT
Occupied Bandwidth Procedure
It determines the frequency bandwidth that that contains 99% of the total
radiated power.
Table 54 – GSM/EDGE Occupied Bandwidth Measurement Procedure
Menu Description
Connect RF In port of the JD7105A to the RF Output port of BTS.
RF In! CAUTION+30dBm MAX
AVOID STATIC DISCHARGE
Sync RefDC 15~19VLANUSBSerial GPS
RF Out
E1/T1
! CAUTION+25dBm MAX
AVOID STATIC DISCHARGE
External In
JD7105A Base Station Analyzer
N-N Cable
! CAUTION+30dBm MAX
AVOID STATIC DISCHARGE
BTSHPA
or LPA
Attenuator
JD7105A Base Station Analyzer
RF In! CAUTION+30dBm MAX
AVOID STATIC DISCHARGE
Sync RefDC 15~19VLANUSBSerial GPS
RF Out
E1/T1
! CAUTION+25dBm MAX
AVOID STATIC DISCHARGE
External In
To Antenna
DirectionalCoupler
EQP-50 dB
-50 dB
OUT IN BTSHPA
or LPA
! CAUTION+30dBm MAX
AVOID STATIC DISCHARGE
Mode
[Tx Analyzer]
[GSM]
[Occupied Bandwidth]
Select Tx Analyzer mode
Select GSM
Select Occupied Bandwidth Measurement

CH
9
9-22 GSM/EDGE TX ANALYZER
Chapter 9
Occupied Bandwidth Screen
Figure 46 – GSM/EDGE Occupied Bandwidth Measurement Screen
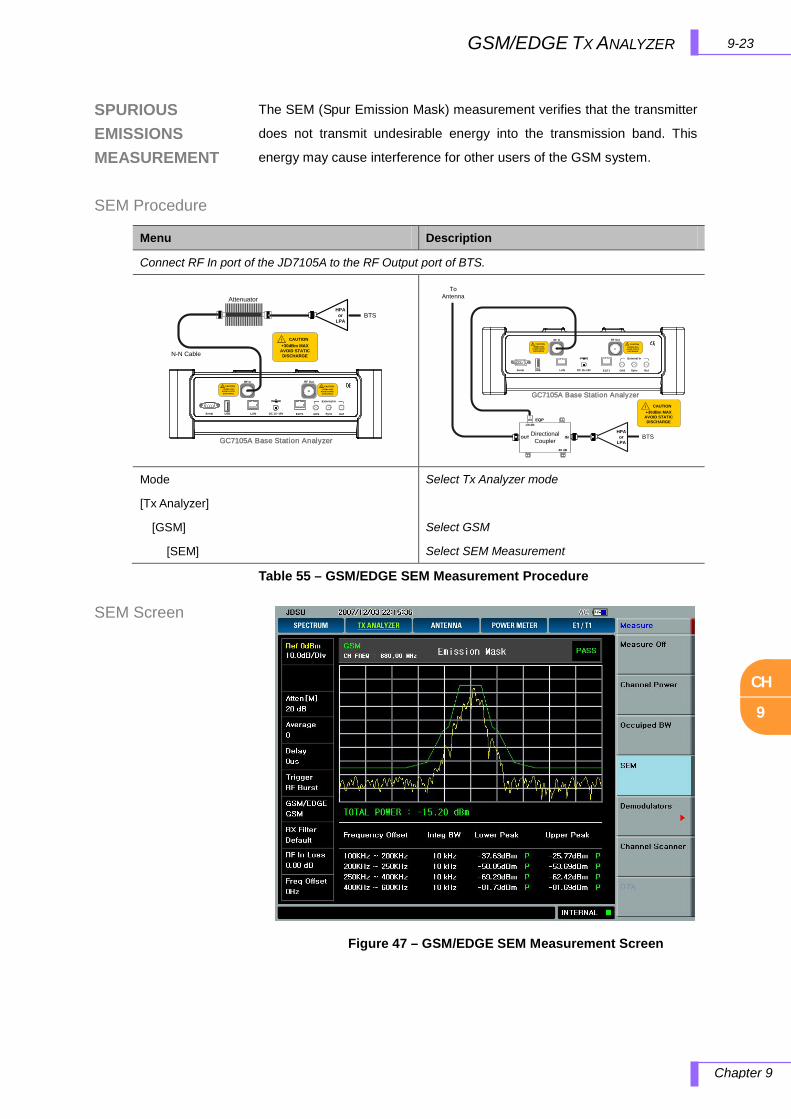
CH
9
9-23 GSM/EDGE TX ANALYZER
Chapter 9
SPURIOUS EMISSIONS MEASUREMENT
SEM Procedure
SEM Screen
The SEM (Spur Emission Mask) measurement verifies that the transmitter
does not transmit undesirable energy into the transmission band. This
energy may cause interference for other users of the GSM system.
Table 55 – GSM/EDGE SEM Measurement Procedure
Menu Description
Connect RF In port of the JD7105A to the RF Output port of BTS.
RF In! CAUTION+30dBm MAX
AVOID STATIC DISCHARGE
Sync RefDC 15~19VLANUSBSerial GPS
RF Out
E1/T1
! CAUTION+25dBm MAX
AVOID STATIC DISCHARGE
External In
GC7105A Base Station Analyzer
N-N Cable
! CAUTION+30dBm MAX
AVOID STATIC DISCHARGE
BTSHPA
or LPA
Attenuator
GC7105A Base Station Analyzer
RF In! CAUTION+30dBm MAX
AVOID STATIC DISCHARGE
Sync RefDC 15~19VLANUSBSerial GPS
RF Out
E1/T1
! CAUTION+25dBm MAX
AVOID STATIC DISCHARGE
External In
To Antenna
DirectionalCoupler
EQP-50 dB
-50 dB
OUT IN BTSHPA or
LPA
! CAUTION+30dBm MAX
AVOID STATIC DISCHARGE
Mode
[Tx Analyzer]
[GSM]
[SEM]
Select Tx Analyzer mode
Select GSM
Select SEM Measurement
Figure 47 – GSM/EDGE SEM Measurement Screen
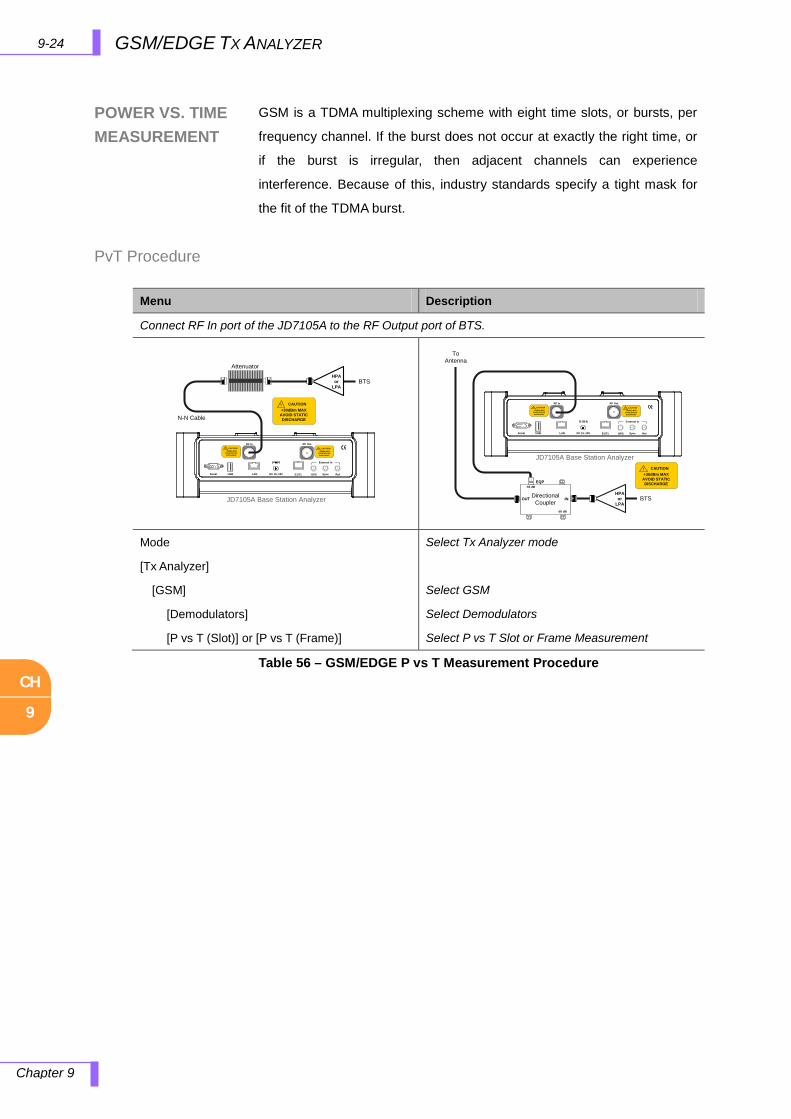
CH
9
9-24 GSM/EDGE TX ANALYZER
Chapter 9
POWER VS. TIME MEASUREMENT
PvT Procedure
GSM is a TDMA multiplexing scheme with eight time slots, or bursts, per
frequency channel. If the burst does not occur at exactly the right time, or
if the burst is irregular, then adjacent channels can experience
interference. Because of this, industry standards specify a tight mask for
the fit of the TDMA burst.
Table 56 – GSM/EDGE P vs T Measurement Procedure
Menu Description
Connect RF In port of the JD7105A to the RF Output port of BTS.
RF In! CAUTION+30dBm MAX
AVOID STATIC DISCHARGE
Sync RefDC 15~19VLANUSBSerial GPS
RF Out
E1/T1
! CAUTION+25dBm MAX
AVOID STATIC DISCHARGE
External In
JD7105A Base Station Analyzer
N-N Cable
! CAUTION+30dBm MAX
AVOID STATIC DISCHARGE
BTSHPA
or LPA
Attenuator
JD7105A Base Station Analyzer
RF In! CAUTION+30dBm MAX
AVOID STATIC DISCHARGE
Sync RefDC 15~19VLANUSBSerial GPS
RF Out
E1/T1
! CAUTION+25dBm MAX
AVOID STATIC DISCHARGE
External In
To Antenna
DirectionalCoupler
EQP-50 dB
-50 dB
OUT IN BTSHPA
or LPA
! CAUTION+30dBm MAX
AVOID STATIC DISCHARGE
Mode
[Tx Analyzer]
[GSM]
[Demodulators]
[P vs T (Slot)] or [P vs T (Frame)]
Select Tx Analyzer mode
Select GSM
Select Demodulators
Select P vs T Slot or Frame Measurement

CH
9
9-25 GSM/EDGE TX ANALYZER
Chapter 9
PvT Screens
Figure 48 – GSM/EDGE P vs T (Slot) Measurement Screen
Figure 49 – GSM/EDGE P vs T (Frame) Measurement Screen
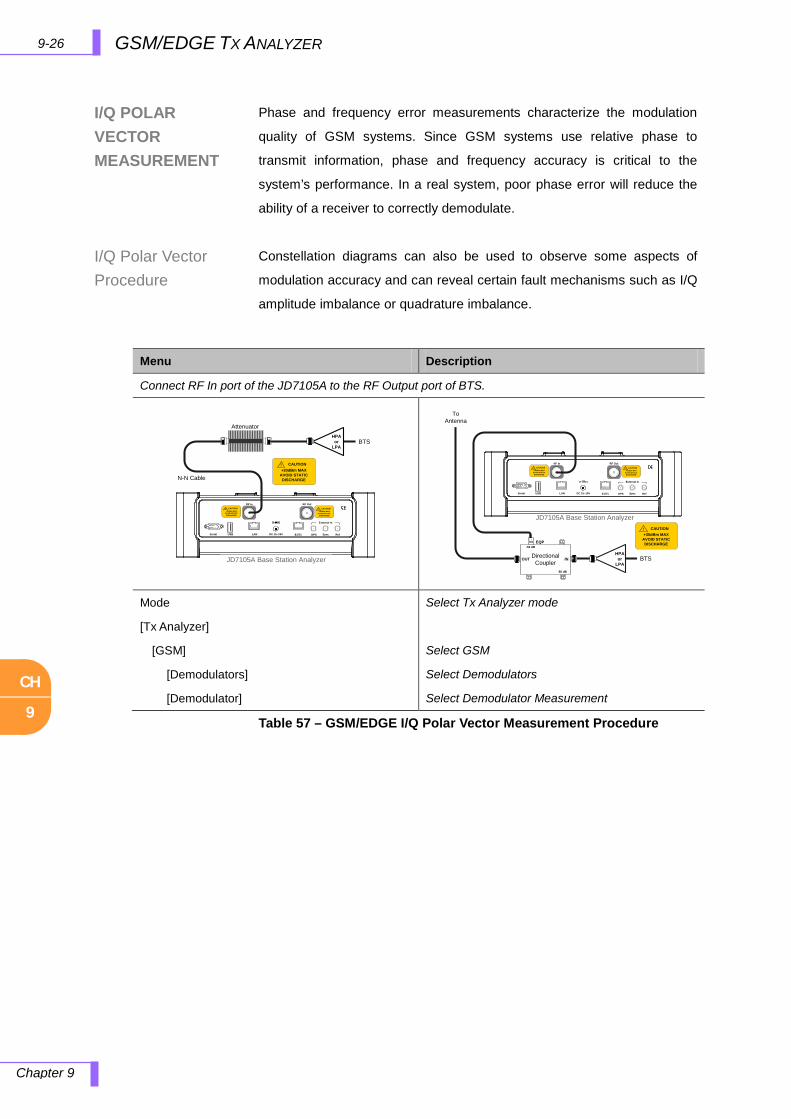
CH
9
9-26 GSM/EDGE TX ANALYZER
Chapter 9
I/Q POLAR VECTOR MEASUREMENT
I/Q Polar Vector Procedure
Phase and frequency error measurements characterize the modulation
quality of GSM systems. Since GSM systems use relative phase to
transmit information, phase and frequency accuracy is critical to the
system’s performance. In a real system, poor phase error will reduce the
ability of a receiver to correctly demodulate.
Constellation diagrams can also be used to observe some aspects of
modulation accuracy and can reveal certain fault mechanisms such as I/Q
amplitude imbalance or quadrature imbalance.
Table 57 – GSM/EDGE I/Q Polar Vector Measurement Procedure
Menu Description
Connect RF In port of the JD7105A to the RF Output port of BTS.
RF In! CAUTION+30dBm MAX
AVOID STATIC DISCHARGE
Sync RefDC 15~19VLANUSBSerial GPS
RF Out
E1/T1
! CAUTION+25dBm MAX
AVOID STATIC DISCHARGE
External In
JD7105A Base Station Analyzer
N-N Cable
! CAUTION+30dBm MAX
AVOID STATIC DISCHARGE
BTSHPA
or LPA
Attenuator
JD7105A Base Station Analyzer
RF In! CAUTION+30dBm MAX
AVOID STATIC DISCHARGE
Sync RefDC 15~19VLANUSBSerial GPS
RF Out
E1/T1
! CAUTION+25dBm MAX
AVOID STATIC DISCHARGE
External In
To Antenna
DirectionalCoupler
EQP-50 dB
-50 dB
OUT IN BTSHPA
or LPA
! CAUTION+30dBm MAX
AVOID STATIC DISCHARGE
Mode
[Tx Analyzer]
[GSM]
[Demodulators]
[Demodulator]
Select Tx Analyzer mode
Select GSM
Select Demodulators
Select Demodulator Measurement

CH
9
9-27 GSM/EDGE TX ANALYZER
Chapter 9
I/Q Polar Vector Screen
Figure 50 – GSM Polar Vector Measurement Screen
Figure 51 – EDGE Polar Vector Measurement Screen
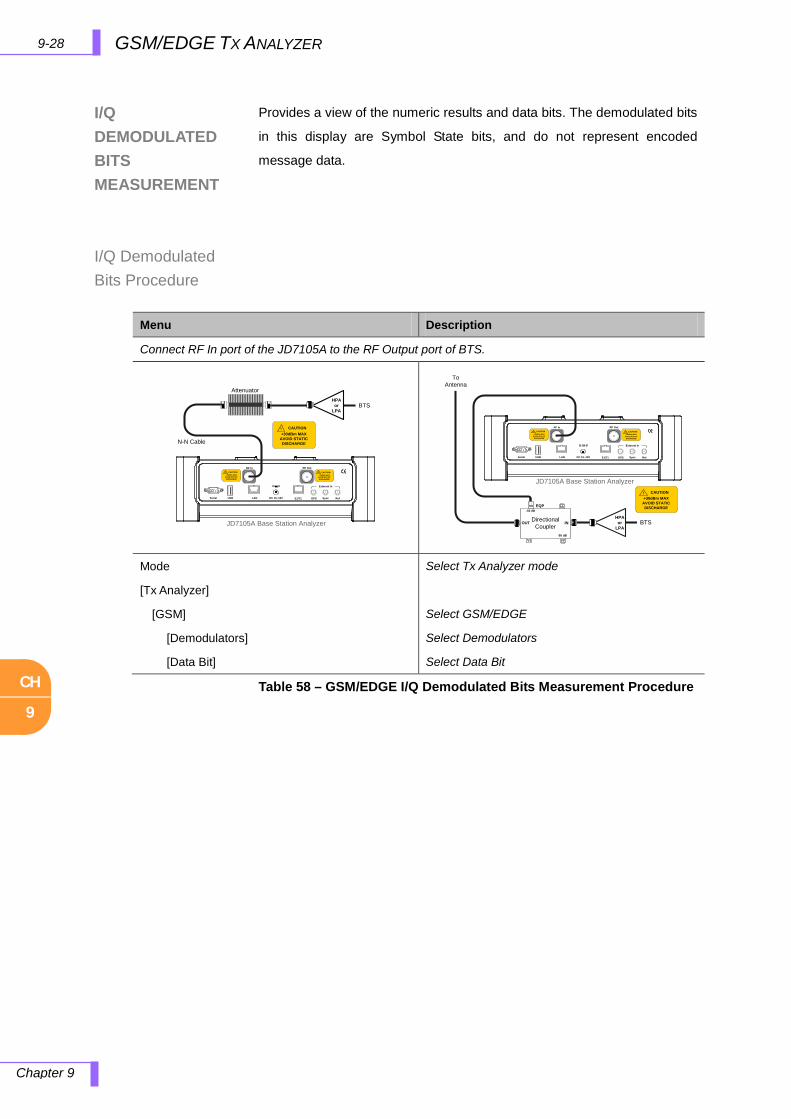
CH
9
9-28 GSM/EDGE TX ANALYZER
Chapter 9
I/Q DEMODULATED BITS MEASUREMENT
I/Q Demodulated Bits Procedure
Provides a view of the numeric results and data bits. The demodulated bits
in this display are Symbol State bits, and do not represent encoded
message data.
Table 58 – GSM/EDGE I/Q Demodulated Bits Measurement Procedure
Menu Description
Connect RF In port of the JD7105A to the RF Output port of BTS.
RF In! CAUTION+30dBm MAX
AVOID STATIC DISCHARGE
Sync RefDC 15~19VLANUSBSerial GPS
RF Out
E1/T1
! CAUTION+25dBm MAX
AVOID STATIC DISCHARGE
External In
JD7105A Base Station Analyzer
N-N Cable
! CAUTION+30dBm MAX
AVOID STATIC DISCHARGE
BTSHPA
or LPA
Attenuator
JD7105A Base Station Analyzer
RF In! CAUTION+30dBm MAX
AVOID STATIC DISCHARGE
Sync RefDC 15~19VLANUSBSerial GPS
RF Out
E1/T1
! CAUTION+25dBm MAX
AVOID STATIC DISCHARGE
External In
To Antenna
DirectionalCoupler
EQP-50 dB
-50 dB
OUT IN BTSHPA
or LPA
! CAUTION+30dBm MAX
AVOID STATIC DISCHARGE
Mode
[Tx Analyzer]
[GSM]
[Demodulators]
[Data Bit]
Select Tx Analyzer mode
Select GSM/EDGE
Select Demodulators
Select Data Bit
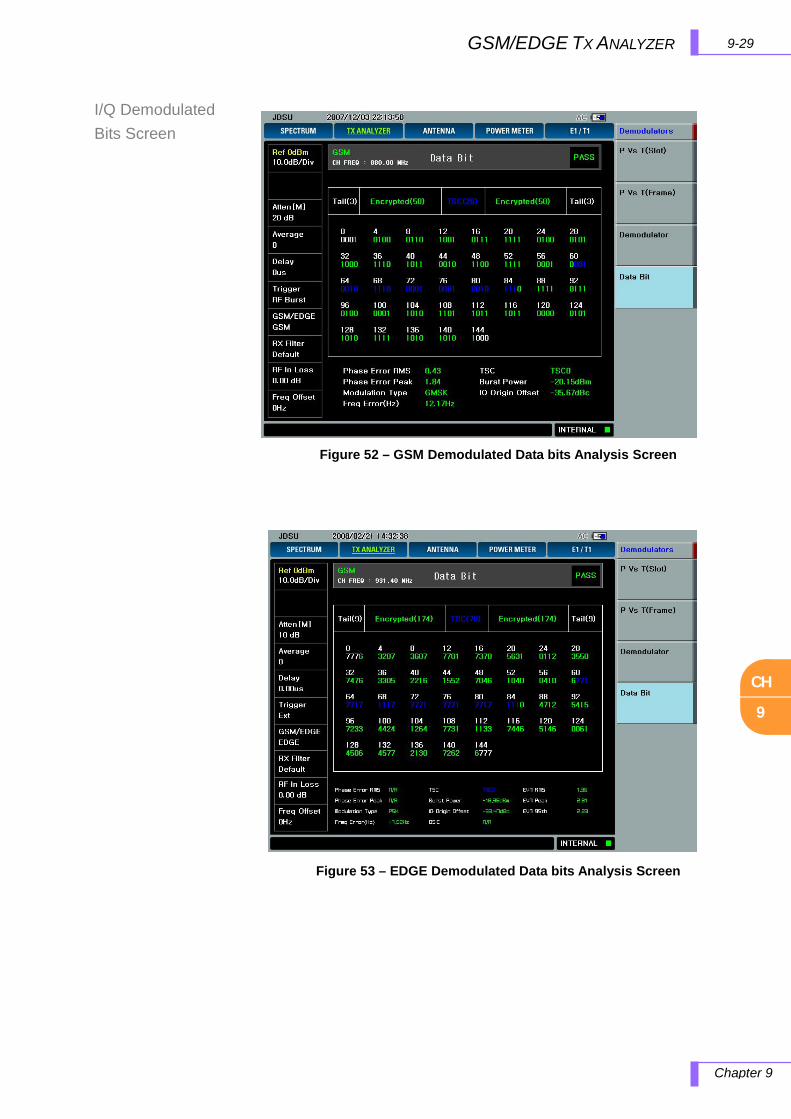
CH
9
9-29 GSM/EDGE TX ANALYZER
Chapter 9
I/Q Demodulated Bits Screen
Figure 52 – GSM Demodulated Data bits Analysis Screen
Figure 53 – EDGE Demodulated Data bits Analysis Screen
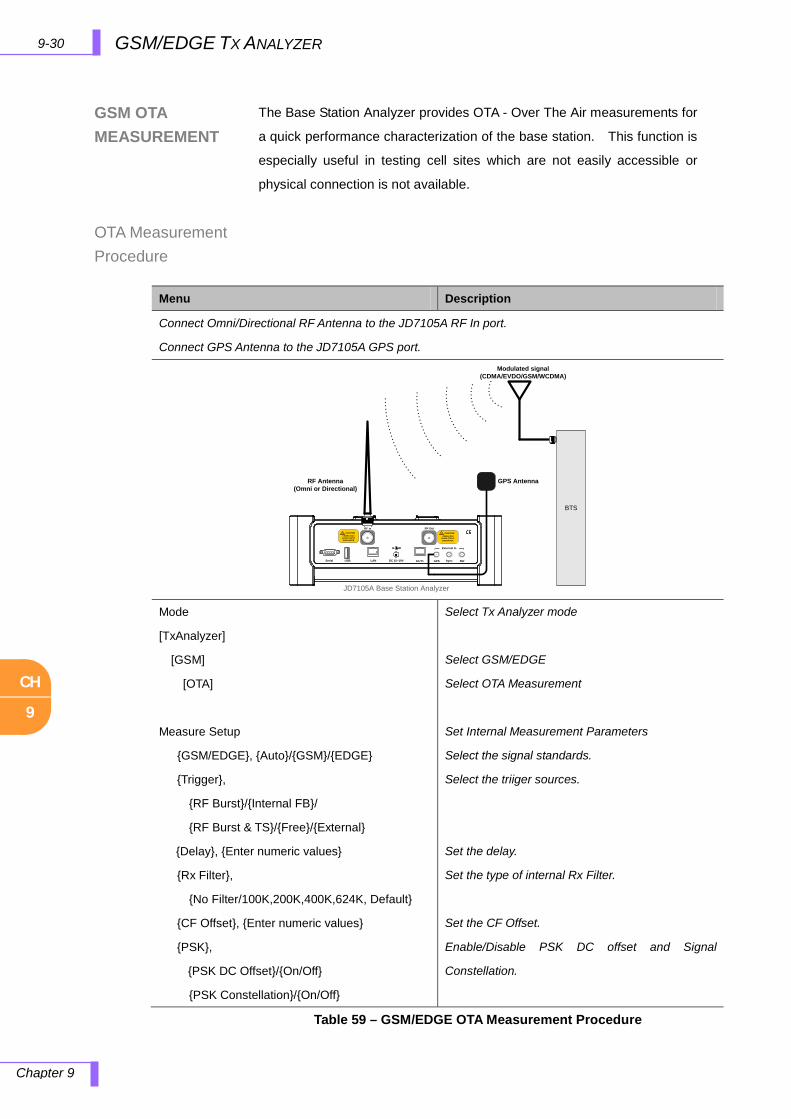
CH
9
9-30 GSM/EDGE TX ANALYZER
Chapter 9
GSM OTA MEASUREMENT
OTA Measurement Procedure
The Base Station Analyzer provides OTA - Over The Air measurements for
a quick performance characterization of the base station. This function is
especially useful in testing cell sites which are not easily accessible or
physical connection is not available.
Table 59 – GSM/EDGE OTA Measurement Procedure
Menu Description
Connect Omni/Directional RF Antenna to the JD7105A RF In port.
Connect GPS Antenna to the JD7105A GPS port.
RF In! CAUTION+30dBm MAX
AVOID STATIC DISCHARGE
Sync RefDC 15~19VLANUSBSerial GPS
RF Out
E1/T1
! CAUTION+25dBm MAX
AVOID STATIC DISCHARGE
External In
BTS
Modulated signal (CDMA/EVDO/GSM/WCDMA)
RF Antenna (Omni or Directional)
JD7105A Base Station Analyzer
GPS Antenna
Mode
[TxAnalyzer]
[GSM]
[OTA]
Measure Setup
GSM/EDGE, Auto/GSM/EDGE
Trigger,
RF Burst/Internal FB/
RF Burst & TS/Free/External
Delay, Enter numeric values
Rx Filter,
No Filter/100K,200K,400K,624K, Default
CF Offset, Enter numeric values
PSK,
PSK DC Offset/On/Off
PSK Constellation/On/Off
Select Tx Analyzer mode
Select GSM/EDGE
Select OTA Measurement
Set Internal Measurement Parameters
Select the signal standards.
Select the triiger sources.
Set the delay.
Set the type of internal Rx Filter.
Set the CF Offset.
Enable/Disable PSK DC offset and Signal
Constellation.
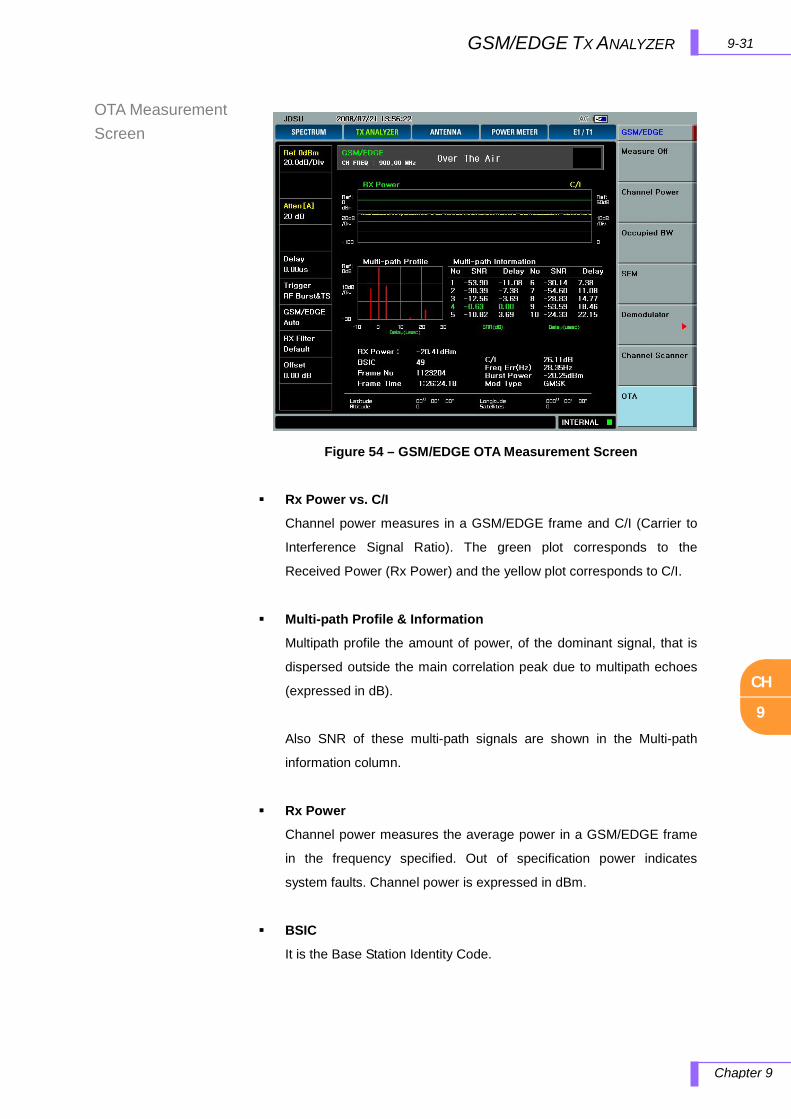
CH
9
9-31 GSM/EDGE TX ANALYZER
Chapter 9
OTA Measurement Screen
Rx Power vs. C/I
Channel power measures in a GSM/EDGE frame and C/I (Carrier to
Interference Signal Ratio). The green plot corresponds to the
Received Power (Rx Power) and the yellow plot corresponds to C/I.
Multi-path Profile & Information
Multipath profile the amount of power, of the dominant signal, that is
dispersed outside the main correlation peak due to multipath echoes
(expressed in dB).
Also SNR of these multi-path signals are shown in the Multi-path
information column.
Rx Power
Channel power measures the average power in a GSM/EDGE frame
in the frequency specified. Out of specification power indicates
system faults. Channel power is expressed in dBm.
BSIC
It is the Base Station Identity Code.
Figure 54 – GSM/EDGE OTA Measurement Screen

CH
9
9-32 GSM/EDGE TX ANALYZER
Chapter 9
Frame No
TDMA frames are numbered by a frame number (FN). The frame
number is cyclic and have a range of 0 to 3h 28min 53s 760ms as
defined in 3GPP TS 45.010. The frame number will be incremented at
the end of each TDMA frame.
Frame Time
The time contained in the measured frame.
C/I (Carrier to Interference Ratio)
Carrier to Interference Ratio is the ratio of the desired carrier power to
the undesired interference signal power in dB.
Frequency Error
The increase in frequency error of a GSM input signal, which meets
the frequency accuracy requirements of 3GPP recommendation, shall
be lower than 0.05ppm
Burst Power
Burst power is the average power over the useful part of the first
active burst GSM/EDGE slot. A GSM/EDGE signal has eight time
slots in a frame.
Modulation Type
The modulation type indicates the detected modulation from the
received signal, the GSM uses GMSK and the EDGE uses 8PSK.
Latitude, Longitude, Altitude, Satellites Information
If GPS antenna used and locked to the GPS satellite, then the
positioning information will be displayed on the bottom of the screen.
CH
10
10-1 TD-SCDMA TX ANALYZER
Chapter 10
10.0 TD-SCDMA TX ANALYZER
In this chapter
TD-SCDMA Analyzer Introduction .............................................................................................................. 10-2
Frame Structure .................................................................................................................................. 10-3 Time Slot ............................................................................................................................................. 10-4 DwPTS ............................................................................................................................................... 10-5 UpPTS ................................................................................................................................................ 10-5 GP ...................................................................................................................................................... 10-5 FDD vs. TDD ...................................................................................................................................... 10-5
Using TD-SCDMA Tx Analyzer ................................................................................................................... 10-6 How to Use Keys ........................................................................................................................................ 10-7
Freq/Chan ........................................................................................................................................... 10-7 Amplitude ............................................................................................................................................ 10-7 Trace/Display ...................................................................................................................................... 10-9 BW/AVG............................................................................................................................................ 10-10 Marker .............................................................................................................................................. 10-10 Peak Search ..................................................................................................................................... 10-12 Measure ............................................................................................................................................ 10-12 Measure Setup ................................................................................................................................. 10-13 Display Overview .............................................................................................................................. 10-16 Setup ................................................................................................................................................ 10-17
Frequency Setup ...................................................................................................................... 10-17 External Clock Setting .............................................................................................................. 10-18
Channel Power Measurement .......................................................................................................... 10-19 Channel Power Procedure ........................................................................................................ 10-19 Channel Power Screen ............................................................................................................. 10-20
Occupied Bandwidth Measurement .................................................................................................. 10-21 Occupied Bandwidth Procedure ............................................................................................... 10-21 Occupied Bandwidth Screen ..................................................................................................... 10-22
Spectrum Emissions Measurement .................................................................................................. 10-23 SEM Procedure ........................................................................................................................ 10-23 SEM Screen.............................................................................................................................. 10-23
ACLR Measurement ......................................................................................................................... 10-24 ACLR Procedure ....................................................................................................................... 10-24 ACLR Screen ............................................................................................................................ 10-24
Power vs. Time Measurement .......................................................................................................... 10-25 P vs T Procedure ...................................................................................................................... 10-25 P vs T Screens .......................................................................................................................... 10-26
Code Domain Power (Demodulator) ................................................................................................. 10-28 CDP Procedure ......................................................................................................................... 10-28 Code Power Screens ................................................................................................................ 10-29
CH
10
Chapter 10
10-2 TD-SCDMA TX ANALYZER
TD-SCDMA ANALYZER INTRODUCTION
Time Division-Synchronous Code Division Multiple Access, or TD-SCDMA,
is a 3G mobile telecommunications standard, being pursued in the
People's Republic of China by the Chinese Academy of
Telecommunications Technology (CATT), and it uses TDD, in contrast to
the FDD scheme used by W-CDMA.
TD-SCDMA offers several unique characteristics for 3G services. In
particular its TDD nature allows TD-SCDMA to master asymmetric
services more efficiently than other 3G standards. Uplink and downlink
resources are flexibly assigned according to traffic needs, and flexible data
rate ranging from 1.2 Kbit/s to 2Mbit/s are provided. This is especially
helpful in an environment with increasing data traffic (mobile data), which
tends to be asymmetric, often requiring little uplink throughput, but
significant bandwidth for downloading information (mobile Internet).
Many radio technologies, such as GSM, EDGE, W-CDMA or cdma2000,
require separate bands for uplink and downlink (paired FDD spectrum). In
this case with asymmetric loads, such as Internet access, portions of the
spectrum are occupied but not used for data transfer. These idle resources
cannot be utilized for any other service, leading to an inefficient use of the
spectrum.
On the contrary, TD-SCDMA adapts the uplink/downlink ratio according to
the data load within a single unpaired frequency, thus utilizing the
spectrum more efficiently. Highly effective technologies like smart
antennas, joint detection and dynamic channel allocation are integral
features of the TD-SCDMA radio standard. They contribute to minimize
intra-cell interference (typical of every CDMA technology) and inter-cell
interference leading to a considerable improvement of the spectrum
efficiency.
Following sub-clause describes the basic frame and resource structure of
TD-SCDMA.
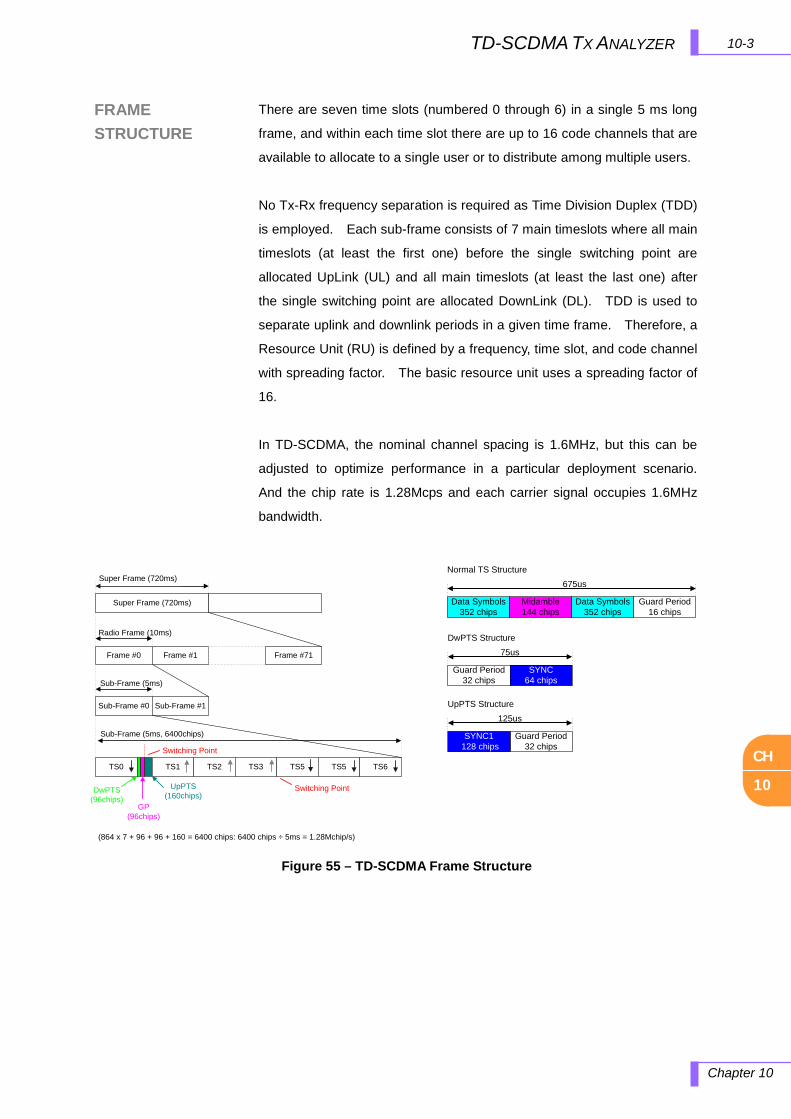
CH
10
10-3 TD-SCDMA TX ANALYZER
Chapter 10
FRAME STRUCTURE
There are seven time slots (numbered 0 through 6) in a single 5 ms long
frame, and within each time slot there are up to 16 code channels that are
available to allocate to a single user or to distribute among multiple users.
No Tx-Rx frequency separation is required as Time Division Duplex (TDD)
is employed. Each sub-frame consists of 7 main timeslots where all main
timeslots (at least the first one) before the single switching point are
allocated UpLink (UL) and all main timeslots (at least the last one) after
the single switching point are allocated DownLink (DL). TDD is used to
separate uplink and downlink periods in a given time frame. Therefore, a
Resource Unit (RU) is defined by a frequency, time slot, and code channel
with spreading factor. The basic resource unit uses a spreading factor of
16.
In TD-SCDMA, the nominal channel spacing is 1.6MHz, but this can be
adjusted to optimize performance in a particular deployment scenario.
And the chip rate is 1.28Mcps and each carrier signal occupies 1.6MHz
bandwidth.
Super Frame (720ms)
Frame #0 Frame #1 Frame #71
Radio Frame (10ms)
Sub-Frame #0 Sub-Frame #1
Sub-Frame (5ms)
TS0
Super Frame (720ms)
TS1 TS2 TS3 TS5 TS5 TS6
UpPTS (160chips)
DwPTS (96chips)
GP (96chips)
Switching Point
Sub-Frame (5ms, 6400chips)
Switching Point
(864 x 7 + 96 + 96 + 160 = 6400 chips: 6400 chips ÷ 5ms = 1.28Mchip/s)
Data Symbols352 chips
Midamble144 chips
Data Symbols352 chips
Guard Period16 chips
675usNormal TS Structure
Guard Period 32 chips
SYNC64 chips
75usDwPTS Structure
SYNC1 128 chips
Guard Period32 chips
125usUpPTS Structure
Figure 55 – TD-SCDMA Frame Structure
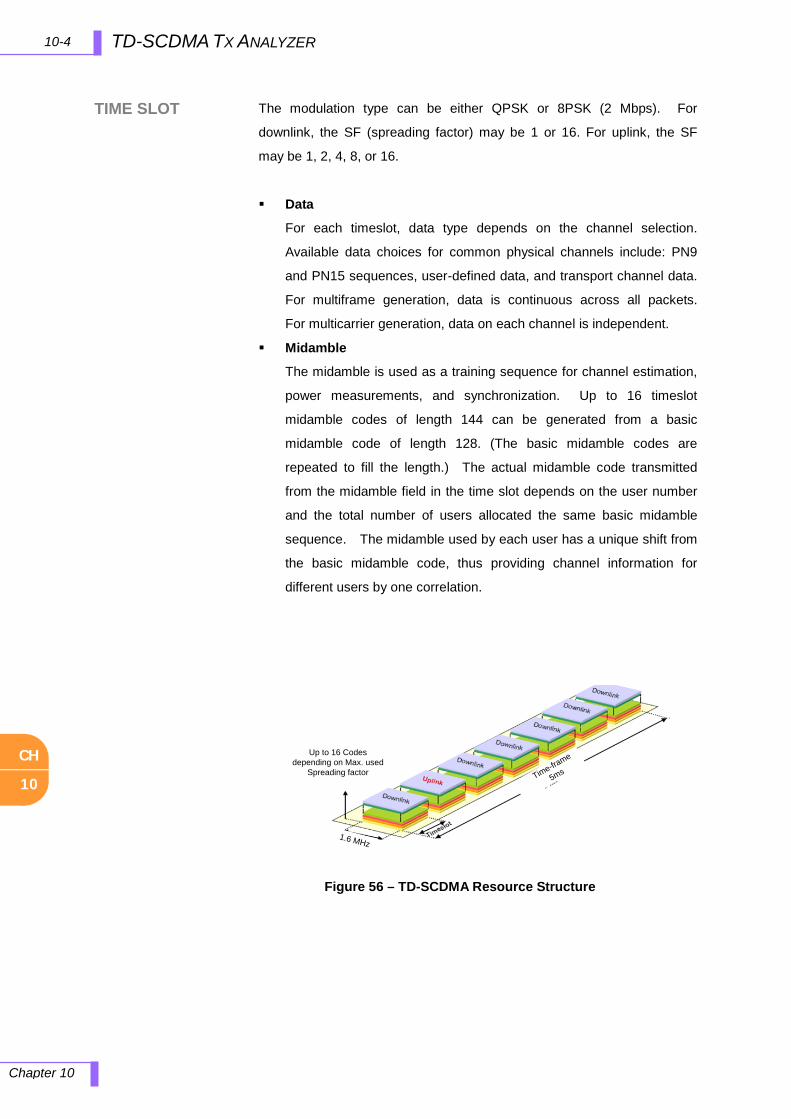
CH
10
Chapter 10
10-4 TD-SCDMA TX ANALYZER
TIME SLOT
The modulation type can be either QPSK or 8PSK (2 Mbps). For
downlink, the SF (spreading factor) may be 1 or 16. For uplink, the SF
may be 1, 2, 4, 8, or 16.
Data
For each timeslot, data type depends on the channel selection.
Available data choices for common physical channels include: PN9
and PN15 sequences, user-defined data, and transport channel data.
For multiframe generation, data is continuous across all packets.
For multicarrier generation, data on each channel is independent.
Midamble
The midamble is used as a training sequence for channel estimation,
power measurements, and synchronization. Up to 16 timeslot
midamble codes of length 144 can be generated from a basic
midamble code of length 128. (The basic midamble codes are
repeated to fill the length.) The actual midamble code transmitted
from the midamble field in the time slot depends on the user number
and the total number of users allocated the same basic midamble
sequence. The midamble used by each user has a unique shift from
the basic midamble code, thus providing channel information for
different users by one correlation.
Up to 16 Codes depending on Max. used
Spreading factor
1.6 MHz
Time-frame
5ms
Figure 56 – TD-SCDMA Resource Structure
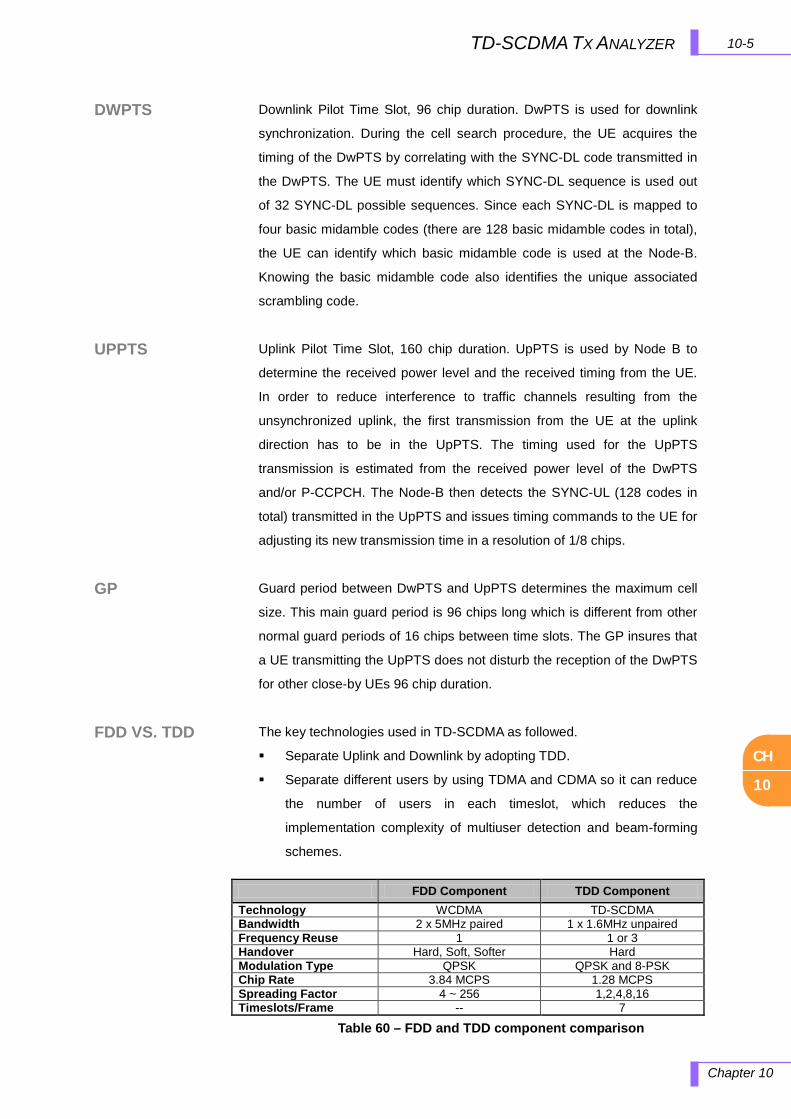
CH
10
10-5 TD-SCDMA TX ANALYZER
Chapter 10
DWPTS
UPPTS
GP
FDD VS. TDD
Downlink Pilot Time Slot, 96 chip duration. DwPTS is used for downlink
synchronization. During the cell search procedure, the UE acquires the
timing of the DwPTS by correlating with the SYNC-DL code transmitted in
the DwPTS. The UE must identify which SYNC-DL sequence is used out
of 32 SYNC-DL possible sequences. Since each SYNC-DL is mapped to
four basic midamble codes (there are 128 basic midamble codes in total),
the UE can identify which basic midamble code is used at the Node-B.
Knowing the basic midamble code also identifies the unique associated
scrambling code.
Uplink Pilot Time Slot, 160 chip duration. UpPTS is used by Node B to
determine the received power level and the received timing from the UE.
In order to reduce interference to traffic channels resulting from the
unsynchronized uplink, the first transmission from the UE at the uplink
direction has to be in the UpPTS. The timing used for the UpPTS
transmission is estimated from the received power level of the DwPTS
and/or P-CCPCH. The Node-B then detects the SYNC-UL (128 codes in
total) transmitted in the UpPTS and issues timing commands to the UE for
adjusting its new transmission time in a resolution of 1/8 chips.
Guard period between DwPTS and UpPTS determines the maximum cell
size. This main guard period is 96 chips long which is different from other
normal guard periods of 16 chips between time slots. The GP insures that
a UE transmitting the UpPTS does not disturb the reception of the DwPTS
for other close-by UEs 96 chip duration.
The key technologies used in TD-SCDMA as followed.
Separate Uplink and Downlink by adopting TDD.
Separate different users by using TDMA and CDMA so it can reduce
the number of users in each timeslot, which reduces the
implementation complexity of multiuser detection and beam-forming
schemes.
Table 60 – FDD and TDD component comparison
FDD Component TDD Component Technology WCDMA TD-SCDMA Bandwidth 2 x 5MHz paired 1 x 1.6MHz unpaired Frequency Reuse 1 1 or 3 Handover Hard, Soft, Softer Hard Modulation Type QPSK QPSK and 8-PSK Chip Rate 3.84 MCPS 1.28 MCPS Spreading Factor 4 ~ 256 1,2,4,8,16 Timeslots/Frame -- 7
CH
10
Chapter 10
10-6 TD-SCDMA TX ANALYZER
USING TD-SCDMA TX ANALYZER
This section provides details about the TD-SCDMA communications
system and explains how the various measurements are performed by the
instrument.
The JD7105A provides the following analysis tools for TD-SCDMA system.
Channel Power
Adjacent Channel Leakage Power Ration (ACLR)
Spurious Emission Mask (SEM)
Occupied Bandwidth
Code Power
Power vs. Time (Frame, Slot and Mask)
Timing Offset
Frequency Error
IQ Origin Offset (Constellation)
Multi-ACLR
OTA
Auto Measure
CH
10
10-7 TD-SCDMA TX ANALYZER
Chapter 10
FREQ/CHAN
AMPLITUDE
HOW TO USE KEYS
The following describes the primary use of the keys in TD-SCDMA Tx
Analyzer mode.
Freq/Chan
Sets Frequency and selects standard or custom frequency bands.
CENTER FREQUENCY: Changes the center frequency setup in the
spectrum measurement screen. Values can be entered with the data entry
keys, the arrow keys, or the knob. When data entry keys are used the
input is completed with the unit selection to define the input value. When
the arrow keys or the knob are used, the center frequency changes in
predefined CF steps; the CF steps are user definable in the CF Step Menu.
CF STEP: Defines the center frequency step units; values can be entered
with the data entry key or the knob. When the data entry keys are used,
the input is completed by selecting the unit to define the input value on the
screen key. When the knob is used, the incremental value is 0.1MHz.
CHANNEL STANDARD: Using this key, the channel band can be selected
without setting Start, Stop, and Center frequencies. The saved custom
channel bands will pop-up to select the proper band.
UNIT: Selects the unit to be used, either Frequency or Channel. When
the “Chan” is selected, the CF Step corresponds to Channel Step.
Amplitude
When the instrument is in Channel Power, Occupied Bandwidth, SEM,
and ACLR measurement mode, an Amplitude key is used as below.
AUTO SCALE: The instrument can automatically set the scale to the
minimum and maximum values of a measurement on the Y-axis of the
graph for optimum traces display. Every time the AUTO SCALE key is
selected, the top and bottom scales are set to the minimum and maximum
values with margin on the Y-axis of the screen display.
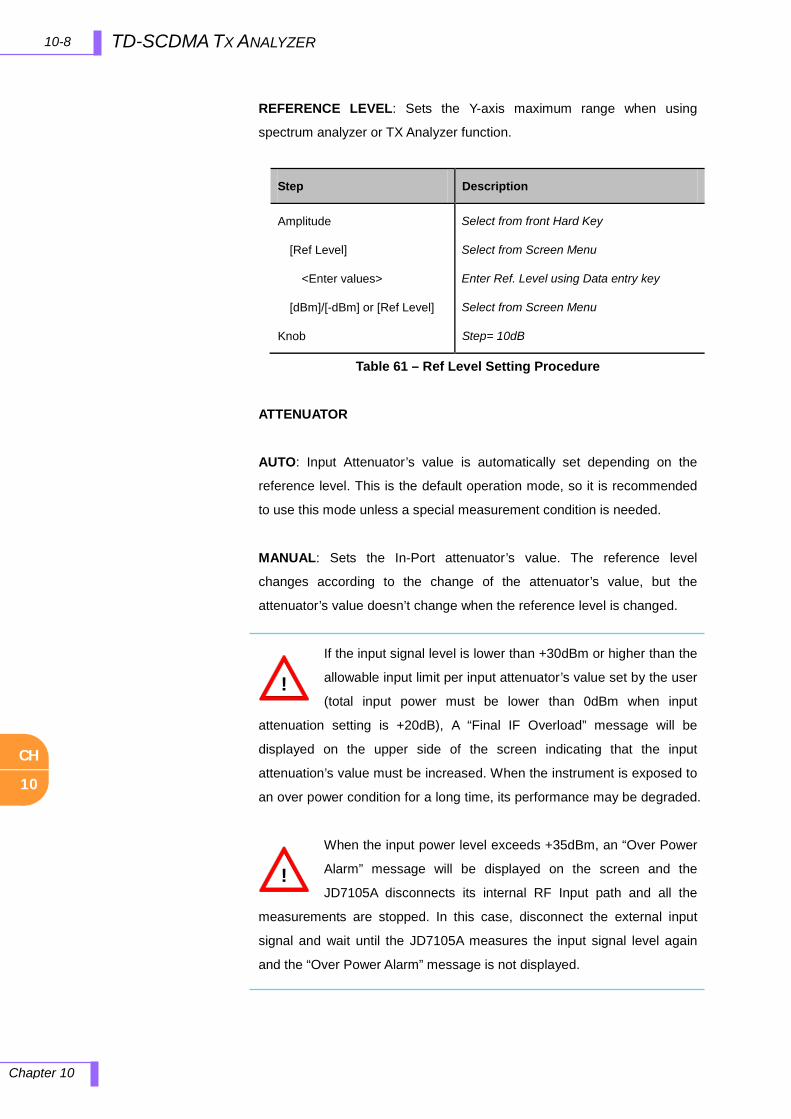
CH
10
Chapter 10
10-8 TD-SCDMA TX ANALYZER
REFERENCE LEVEL: Sets the Y-axis maximum range when using
spectrum analyzer or TX Analyzer function.
Step Description
Amplitude
[Ref Level]
<Enter values>
[dBm]/[-dBm] or [Ref Level]
Knob
Select from front Hard Key
Select from Screen Menu
Enter Ref. Level using Data entry key
Select from Screen Menu
Step= 10dB
Table 61 – Ref Level Setting Procedure
ATTENUATOR
AUTO: Input Attenuator’s value is automatically set depending on the
reference level. This is the default operation mode, so it is recommended
to use this mode unless a special measurement condition is needed.
MANUAL: Sets the In-Port attenuator’s value. The reference level
changes according to the change of the attenuator’s value, but the
attenuator’s value doesn’t change when the reference level is changed.
If the input signal level is lower than +30dBm or higher than the
allowable input limit per input attenuator’s value set by the user
(total input power must be lower than 0dBm when input
attenuation setting is +20dB), A “Final IF Overload” message will be
displayed on the upper side of the screen indicating that the input
attenuation’s value must be increased. When the instrument is exposed to
an over power condition for a long time, its performance may be degraded.
When the input power level exceeds +35dBm, an “Over Power
Alarm” message will be displayed on the screen and the
JD7105A disconnects its internal RF Input path and all the
measurements are stopped. In this case, disconnect the external input
signal and wait until the JD7105A measures the input signal level again
and the “Over Power Alarm” message is not displayed.
!
!
CH
10
10-9 TD-SCDMA TX ANALYZER
Chapter 10
TRACE/DISPLAY
RF IN LOSS: Sets an external offset value. An offset consists of a cable
offset and a user offset, and the measurement result shows the value
reflecting both offset values. Even if an offset is set, the reference level is
automatically adjusted to avoid the waveform fitting out of the screen. An
offset value set in Spectrum mode have precedence over the offset value
set in Analysis Mode.
This key is not used in TD-SCDMA Analyzer measurement mode.
When the instrument is in TD-SCDMA Spectrum measurement mode,
a Trace/Display key is used as below.
TRACE SELECT: Selects an active trace from T1 ~ T6. Every time Select
screen menu is pressed, the active trace changes. Trace numbers are
assigned to each captured traces or loaded traces.
TRACE VIEW: Hides or displays the trace number on the screen. Press
the Select screen menu key to choose the Trace number. Traces with
View set OFF are hidden from the screen. Setting View On restores
hidden traces and information on the window.
M: Max Hold
m: Min Hold
C: Captured Trace
W: Current Trace
L: Loaded Trace
TRACE CAPTURE: Captures a current trace on the screen with assigned
trace number.
CLEAR WRITE: Clear selected Trace and Write (Assign) current trace.
MAX HOLD: Sets Active trace Max Hold. Active trace compares newly
acquired data with the trace shown on the screen and displays the bigger
trace on the screen.

CH
10
Chapter 10
10-10 TD-SCDMA TX ANALYZER
BW/AVG
MARKER
TRACE CLEAR: Deletes an active trace from the screen. The cleared
trace is not restored. It is used to select and delete a trace one by one
when multiple traces are displayed on the screen. Verify the traces to
delete with Trace View ON/OFF function in advance settings as cleared
traces cannot be restored.
CLEAR CURRENT: Deletes an active trace from the screen. The cleared
trace is not restored. It is used to select and delete a trace one by one
when multiple traces are displayed on the screen. Verify the traces to
delete with View ON/OFF function in advance settings as cleared traces
cannot be restored.
CLEAR ALL: Deletes all traces from the instrument and initialize the trace
settings.
AVERAGE: Sets the average number of traces. A maximum of 99 times of
averaging can be set.
SWEEP CTRL: Selects the sweep method between “Continue” and “Hold”.
This key is not used in TD-SCDMA Analyzer mode.
When the instrument is in TD-SCDMA Spectrum mode, a Marker key
is used as below.
Marker is used to get the information about a specific trace. A total of six
Markers can be set and each marker can be used independently. The X,
and Y coordinates of the trace are displayed when the maker is placed on
any position of the trace. As the position displaying Marker’s X and Y
coordinates may be slightly different for each measurement mode, refer to
the description of each measurement after this chapter.
MARKER SELECT: Selects an active marker which its position can be
changed with the knob or the arrow keys. The assigned number of active
markers is displayed on the Marker Select screen menu and the marker’s
number is also displayed next to the marker on the trace when the Marker
View On is selected.
CH
10
10-11 TD-SCDMA TX ANALYZER
Chapter 10
MARKER VIEW: Hides or displays the selected marker on the screen. In
the same measurement mode markers appear at the previous positions
when the Marker View is turned off and on. If a measurement mode has
been changed, markers are not restored to their previous positions.
MARKER TYPE:
Selects the type of Marker to be displayed, Normal marker provide the
reading of its position and Delta marker provides the differences between
two sets of marker points.
NORMAL: Used to place a marker, along with the marker number,
1-6, on the trace.
DELTA: Delta Marker is associated with a Normal Marker, so a
Normal Maker must be set before a Delta marker is set. When a
Delta Marker is set, the position set by the Delta Marker becomes
the reference position of the Normal Marker and the Maker’s X
and Y values displays the difference compared with Delta Marker.
MARKER CLEAR ALL: Turns all markers off the screen. Markers are
redisplayed on the previous position if markers are turned back on. If a
measurement mode is changed, current settings are not restored.
MARKER EDIT: Sets the marker position manually. A pop-up window
appears for users to set the frequency by entering numeric values and the
marker position is moved to the setting frequency.

CH
10
Chapter 10
10-12 TD-SCDMA TX ANALYZER
PEAK SEARCH
MEASURE
This key is not used in TD-SCDMA Analyzer mode.
When the instrument is in TD-SCDMA Spectrum mode, a Peak Search
key is used as below.
Each time Peak Search key is pressed, a marker is displayed on the
highest peak of the Trace.
PEAK RIGHT: Moves the marker to the next highest peak at the right of its
current position.
PEAK LEFT: Moves the marker to the next highest peak at the left of its
current position.
MAX SEARCH: Moves the marker to the highest peak of the trace.
MIN SEARCH: Moves the marker to the lowest peak of the trace.
ALWAYS PEAK: Moves the marker automatically to the highest peak of
the trace each time the trace is updated.
When the instrument is in TD-SCDMA Spectrum or TD-SCDMA
Analyzer Mode, Measure key is used to select measurement menu
listed below.
Channel Power Measurement
Occupied Bandwidth Measurement
SEM Measurement
ACLR Measurement
Multi-ACLR Measurement
Demodulator Measurement
OTA Measurement
Auto Measure

CH
10
10-13 TD-SCDMA TX ANALYZER
Chapter 10
MEASURE SETUP
When the instrument is in Channel Power, Occupied Bandwidth, SEM,
and ACLR mode, a Measure Setup key is used as below.
TRIGGER MODE: Selects the trigger sources.
INTERNAL (RF BURST AND DWPTS): Sets the trigger point to
the internal frequency burst and DwPTS.
FREE: Sets the Free Trigger (Free Running).
EXTERNAL: Sets the trigger source to external sync reference.
GPS: Sets the trigger source to external GPS reference.
DELAY: Sets the delay in either us (micro-second) or symbol.
CF OFFSET: Sets the offset of the center frequency.
When the instrument is in Multi-ACLR mode, a Measure Setup key is
used as below.
TRIGGER MODE: Selects the trigger sources.
INTERNAL (RF BURST AND DWPTS): Sets the trigger point to
the internal frequency burst and DwPTS
FREE: Sets the Free Trigger (Free Running)
EXTERNAL: Sets the trigger source to external sync reference
GPS: Sets the trigger source to external GPS reference
DELAY: Sets the delay in either us (micro-second) or symbol.
CF OFFSET: Sets the offset of the center frequency.
LOWEST FREQ: Sets the lowest frequency to be measured.
HIGHEST FREQ: Sets the highest frequency to be measured.

CH
10
Chapter 10
10-14 TD-SCDMA TX ANALYZER
When the instrument is in Multi-ACLR mode, a Measure Setup key is
used as below.
TRIGGER MODE: Selects the trigger sources.
INTERNAL (RF BURST AND DWPTS): Sets the trigger point to
the internal frequency burst and DwPTS.
FREE: Sets the Free Trigger (Free Running).
EXTERNAL: Sets the trigger source to external sync reference.
GPS: Sets the trigger source to external GPS reference.
DELAY: Sets the delay in either us (micro-second) or symbol.
CF OFFSET: Sets the offset of the center frequency.
LOWEST FREQ: Sets the lowest frequency to be measured.
HIGHEST FREQ: Sets the highest frequency to be measured.
When the instrument is in Demodulator mode, a Measure Setup key
is used as below.
SCRAMBLE CODE: Sets the method of Scramble code search.
MANUAL: Search manually set by user.
AUTO: Auto Search.
TRIGGER MODE: Selects the trigger sources.
INTERNAL (RF BURST AND DWPTS): Sets the trigger point to
the internal frequency burst and DwPTS.
FREE: Sets the Free Trigger (Free Running).
EXTERNAL: Sets the trigger source to external sync reference.
CH
10
10-15 TD-SCDMA TX ANALYZER
Chapter 10
GPS: Sets the trigger source to external GPS reference.
SPREAD FACTOR: Sets the Spread Factor from Auto, SF1 ~ SF16. User
can designate Spread Factor by selecting SF1 ~ SF16.
MAX USER: Sets the number of users up to 16.
SLOT NUMBER: Sets the Time Slot number to be displayed in the
measurement screen. Slot number can be set from TS0 ~ TS6.
THRESHOLD: Sets the threshold level to get automatic pass/fail indication.
DETECT MODE: Selects the modulation types, Auto, QPSK, 8-PSK and
Peak. When Peak is selected, the instrument determines modulation
type by checking highest power component from QPSK, 8PSK or PEAK.
SCRAMBLE MAP: Sets the types of detecting method to determine
Midamble/Channel estimation either full search or max power search.
MAX: Determine using Max Power.
SPEC: Search based on TD-SCDMA specification.
DC ON/OFF: Turns DC component On or Off to calculate EVM, PCDE, etc.
DELAY: Sets the delay in either us (micro-second) or symbol.
CF OFFSET: Sets the offset of the center frequency.
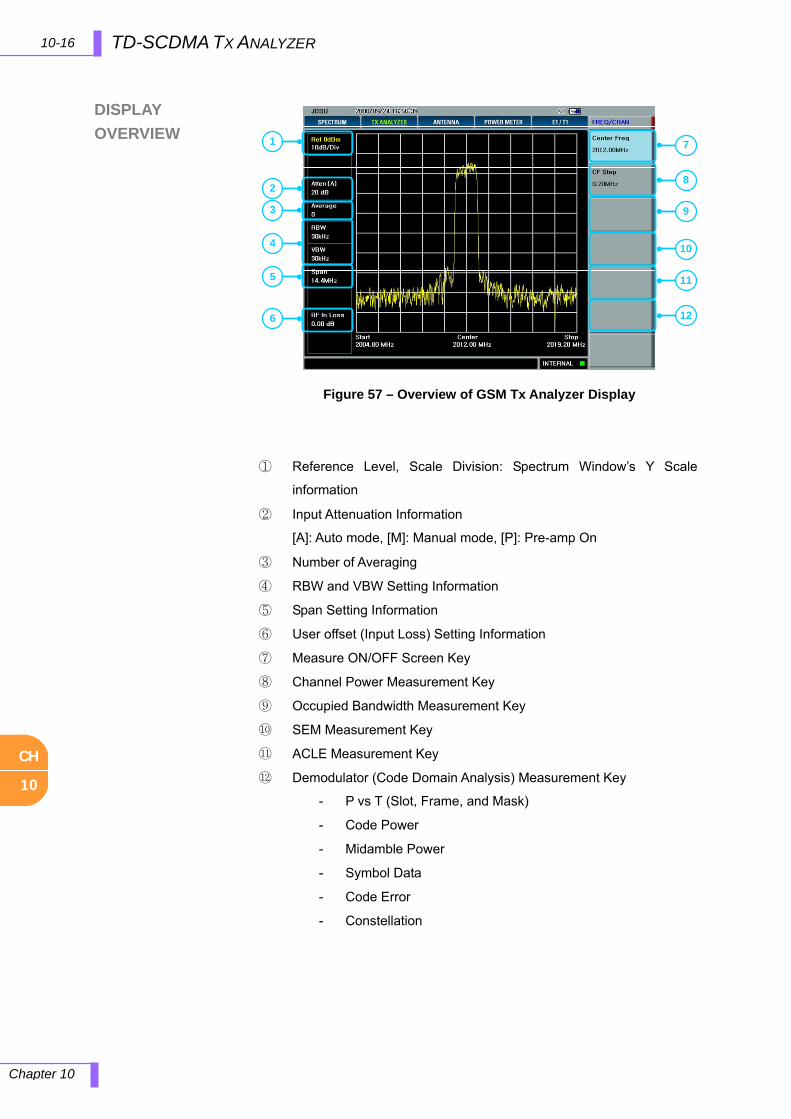
CH
10
Chapter 10
10-16 TD-SCDMA TX ANALYZER
DISPLAY
OVERVIEW
① Reference Level, Scale Division: Spectrum Window’s Y Scale
information
② Input Attenuation Information
[A]: Auto mode, [M]: Manual mode, [P]: Pre-amp On
③ Number of Averaging
④ RBW and VBW Setting Information
⑤ Span Setting Information
⑥ User offset (Input Loss) Setting Information
⑦ Measure ON/OFF Screen Key
⑧ Channel Power Measurement Key
⑨ Occupied Bandwidth Measurement Key
⑩ SEM Measurement Key
⑪ ACLE Measurement Key
⑫ Demodulator (Code Domain Analysis) Measurement Key
- P vs T (Slot, Frame, and Mask)
- Code Power
- Midamble Power
- Symbol Data
- Code Error
- Constellation
1
2
3
4
5
6
7
8
9
10
11
12
Figure 57 – Overview of GSM Tx Analyzer Display
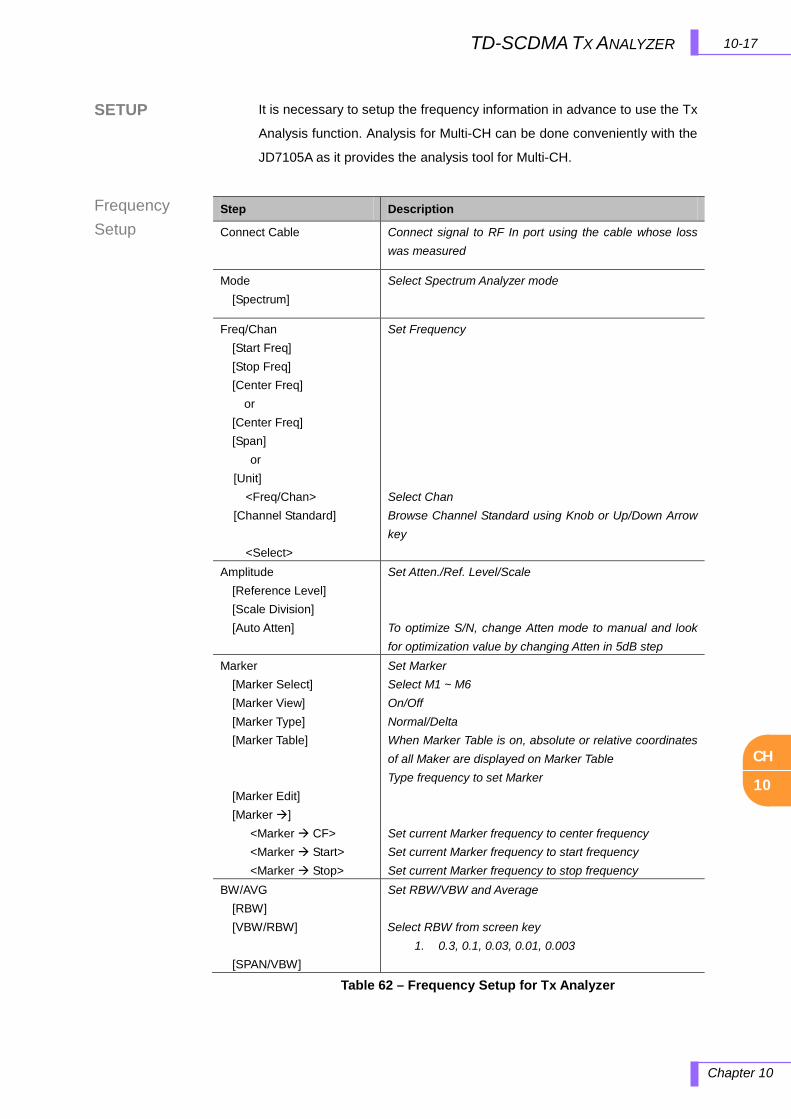
CH
10
10-17 TD-SCDMA TX ANALYZER
Chapter 10
SETUP
Frequency Setup
It is necessary to setup the frequency information in advance to use the Tx
Analysis function. Analysis for Multi-CH can be done conveniently with the
JD7105A as it provides the analysis tool for Multi-CH.
Table 62 – Frequency Setup for Tx Analyzer
Step Description
Connect Cable Connect signal to RF In port using the cable whose loss was measured
Mode [Spectrum]
Select Spectrum Analyzer mode
Freq/Chan [Start Freq] [Stop Freq] [Center Freq]
or [Center Freq] [Span]
or [Unit] <Freq/Chan> [Channel Standard] <Select>
Set Frequency Select Chan Browse Channel Standard using Knob or Up/Down Arrow key
Amplitude [Reference Level] [Scale Division] [Auto Atten]
Set Atten./Ref. Level/Scale To optimize S/N, change Atten mode to manual and look for optimization value by changing Atten in 5dB step
Marker [Marker Select] [Marker View] [Marker Type] [Marker Table] [Marker Edit] [Marker ] <Marker CF>
<Marker Start> <Marker Stop>
Set Marker Select M1 ~ M6 On/Off Normal/Delta When Marker Table is on, absolute or relative coordinates of all Maker are displayed on Marker Table Type frequency to set Marker Set current Marker frequency to center frequency Set current Marker frequency to start frequency Set current Marker frequency to stop frequency
BW/AVG [RBW] [VBW/RBW] [SPAN/VBW]
Set RBW/VBW and Average Select RBW from screen key
1. 0.3, 0.1, 0.03, 0.01, 0.003

CH
10
Chapter 10
10-18 TD-SCDMA TX ANALYZER
External Clock Setting
Standards
To enhance the reliability of Code Domain measurements the JD7105A
must be synchronized with the Base Station. When an external clock is not
supplied, the JD7105A works with a built-in internal high-accuracy time
base; however, some measurement results may exhibit inaccurate values,
therefore, it is highly recommended to use the same reference clock as
signal source. Sync Mode can be changed in the Setup menu.
Table 63 – External Clock Operating Standard
Clock Type Reference Port Switching
Standard
10MHz Internal Internal 10MHz Default
External External Ref
Clock
Ext Ref In (SMA) Automatic
switching
(Input signal level
>-3dBm)
External GPS GPS clock GPS (SMA) Automatic
switching (GPS
signal received)
PP2S Internal Internal Sync Default
External External Sync Even Sec/ Sync In
(BNC)
Manual switching
External GPS GPS GPS (SMA) Manual switching
Figure 58 – Ext Ref Clock Input Ports
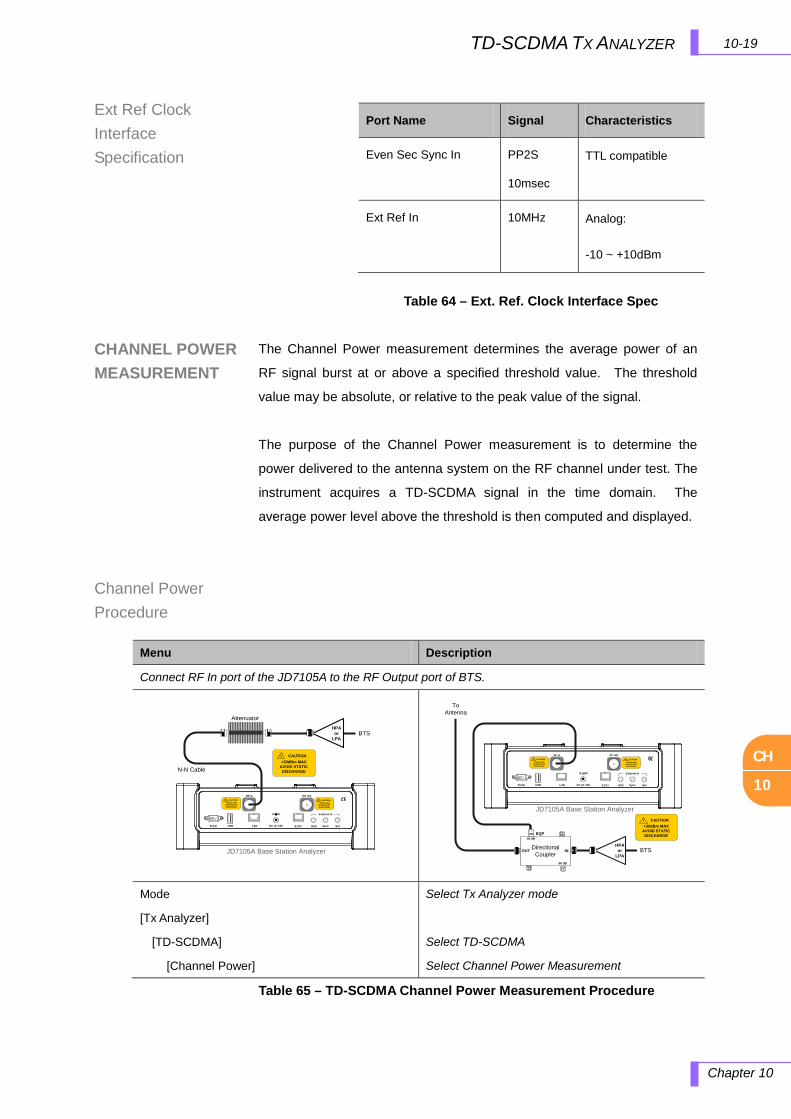
CH
10
10-19 TD-SCDMA TX ANALYZER
Chapter 10
Ext Ref Clock Interface Specification
CHANNEL POWER MEASUREMENT
Channel Power Procedure
Table 64 – Ext. Ref. Clock Interface Spec
The Channel Power measurement determines the average power of an
RF signal burst at or above a specified threshold value. The threshold
value may be absolute, or relative to the peak value of the signal.
The purpose of the Channel Power measurement is to determine the
power delivered to the antenna system on the RF channel under test. The
instrument acquires a TD-SCDMA signal in the time domain. The
average power level above the threshold is then computed and displayed.
Table 65 – TD-SCDMA Channel Power Measurement Procedure
Menu Description
Connect RF In port of the JD7105A to the RF Output port of BTS.
RF In! CAUTION+30dBm MAX
AVOID STATIC DISCHARGE
Sync RefDC 15~19VLANUSBSerial GPS
RF Out
E1/T1
! CAUTION+25dBm MAX
AVOID STATIC DISCHARGE
External In
JD7105A Base Station Analyzer
N-N Cable
! CAUTION+30dBm MAX
AVOID STATIC DISCHARGE
BTSHPA
or LPA
Attenuator
JD7105A Base Station Analyzer
RF In! CAUTION+30dBm MAX
AVOID STATIC DISCHARGE
Sync RefDC 15~19VLANUSBSerial GPS
RF Out
E1/T1
! CAUTION+25dBm MAX
AVOID STATIC DISCHARGE
External In
To Antenna
DirectionalCoupler
EQP-50 dB
-50 dB
OUT IN BTSHPA
or LPA
! CAUTION+30dBm MAX
AVOID STATIC DISCHARGE
Mode
[Tx Analyzer]
[TD-SCDMA]
[Channel Power]
Select Tx Analyzer mode
Select TD-SCDMA
Select Channel Power Measurement
Port Name Signal Characteristics
Even Sec Sync In PP2S
10msec
TTL compatible
Ext Ref In 10MHz Analog:
-10 ~ +10dBm

CH
10
Chapter 10
10-20 TD-SCDMA TX ANALYZER
Channel Power Screen
Figure 59 – TD-SCDMA Channel Power Measurement Screen
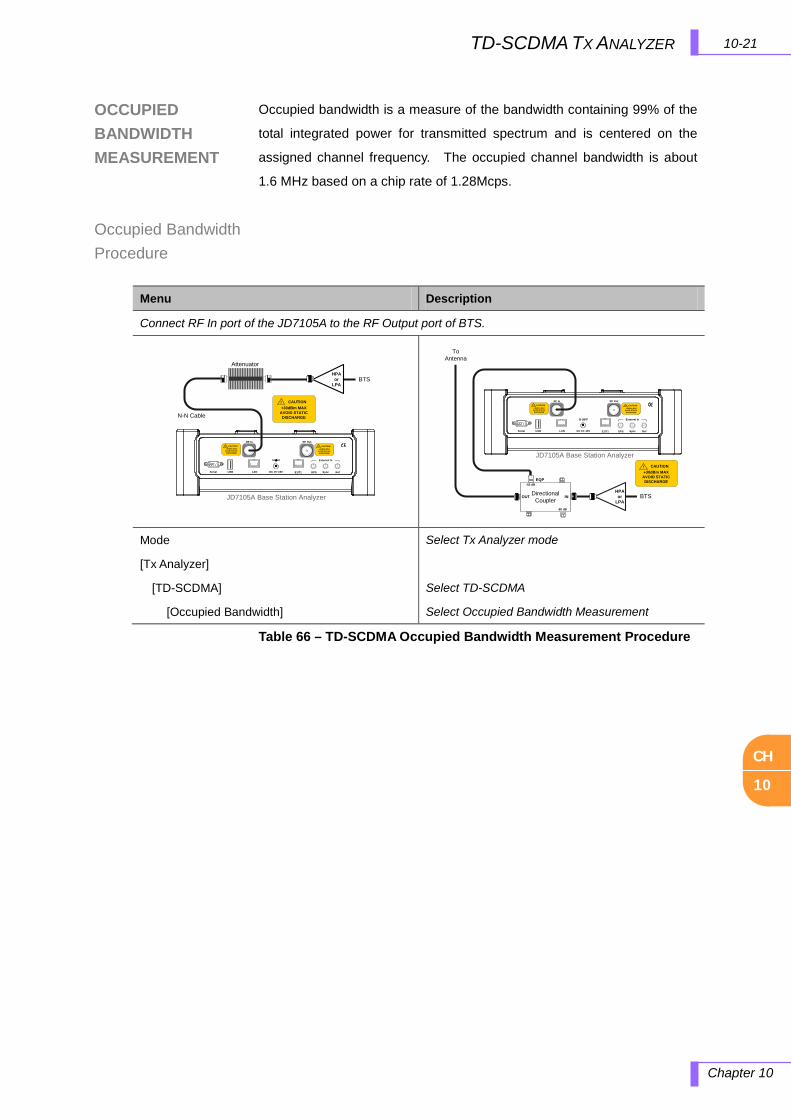
CH
10
10-21 TD-SCDMA TX ANALYZER
Chapter 10
OCCUPIED BANDWIDTH MEASUREMENT
Occupied Bandwidth Procedure
Occupied bandwidth is a measure of the bandwidth containing 99% of the
total integrated power for transmitted spectrum and is centered on the
assigned channel frequency. The occupied channel bandwidth is about
1.6 MHz based on a chip rate of 1.28Mcps.
Table 66 – TD-SCDMA Occupied Bandwidth Measurement Procedure
Menu Description
Connect RF In port of the JD7105A to the RF Output port of BTS.
RF In! CAUTION+30dBm MAX
AVOID STATIC DISCHARGE
Sync RefDC 15~19VLANUSBSerial GPS
RF Out
E1/T1
! CAUTION+25dBm MAX
AVOID STATIC DISCHARGE
External In
JD7105A Base Station Analyzer
N-N Cable
! CAUTION+30dBm MAX
AVOID STATIC DISCHARGE
BTSHPA
or LPA
Attenuator
JD7105A Base Station Analyzer
RF In! CAUTION+30dBm MAX
AVOID STATIC DISCHARGE
Sync RefDC 15~19VLANUSBSerial GPS
RF Out
E1/T1
! CAUTION+25dBm MAX
AVOID STATIC DISCHARGE
External In
To Antenna
DirectionalCoupler
EQP-50 dB
-50 dB
OUT IN BTSHPA
or LPA
! CAUTION+30dBm MAX
AVOID STATIC DISCHARGE
Mode
[Tx Analyzer]
[TD-SCDMA]
[Occupied Bandwidth]
Select Tx Analyzer mode
Select TD-SCDMA
Select Occupied Bandwidth Measurement

CH
10
Chapter 10
10-22 TD-SCDMA TX ANALYZER
Occupied Bandwidth Screen
Figure 60 – TD-SCDMA Occupied Bandwidth Measurement Screen
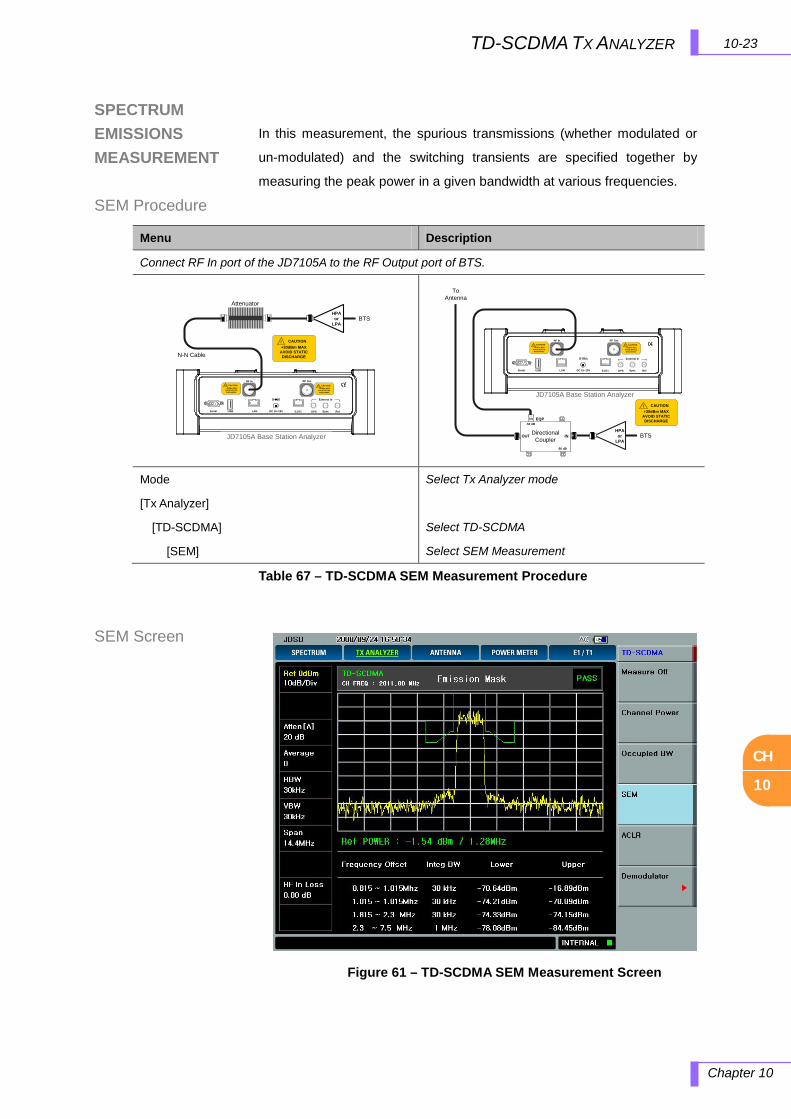
CH
10
10-23 TD-SCDMA TX ANALYZER
Chapter 10
SPECTRUM EMISSIONS MEASUREMENT
SEM Procedure
SEM Screen
In this measurement, the spurious transmissions (whether modulated or
un-modulated) and the switching transients are specified together by
measuring the peak power in a given bandwidth at various frequencies.
Table 67 – TD-SCDMA SEM Measurement Procedure
Menu Description
Connect RF In port of the JD7105A to the RF Output port of BTS.
RF In! CAUTION+30dBm MAX
AVOID STATIC DISCHARGE
Sync RefDC 15~19VLANUSBSerial GPS
RF Out
E1/T1
! CAUTION+25dBm MAX
AVOID STATIC DISCHARGE
External In
JD7105A Base Station Analyzer
N-N Cable
! CAUTION+30dBm MAX
AVOID STATIC DISCHARGE
BTSHPA
or LPA
Attenuator
JD7105A Base Station Analyzer
RF In! CAUTION+30dBm MAX
AVOID STATIC DISCHARGE
Sync RefDC 15~19VLANUSBSerial GPS
RF Out
E1/T1
! CAUTION+25dBm MAX
AVOID STATIC DISCHARGE
External In
To Antenna
DirectionalCoupler
EQP-50 dB
-50 dB
OUT IN BTSHPA
or LPA
! CAUTION+30dBm MAX
AVOID STATIC DISCHARGE
Mode
[Tx Analyzer]
[TD-SCDMA]
[SEM]
Select Tx Analyzer mode
Select TD-SCDMA
Select SEM Measurement
Figure 61 – TD-SCDMA SEM Measurement Screen
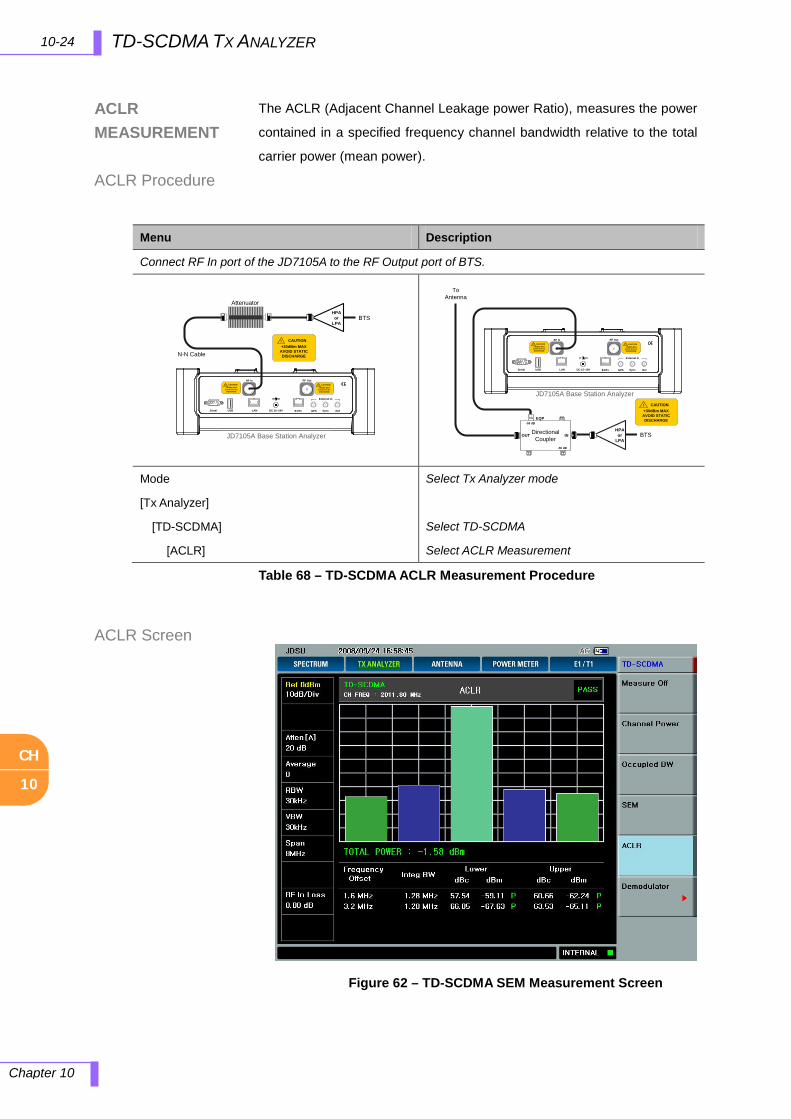
CH
10
Chapter 10
10-24 TD-SCDMA TX ANALYZER
ACLR MEASUREMENT
ACLR Procedure
ACLR Screen
The ACLR (Adjacent Channel Leakage power Ratio), measures the power
contained in a specified frequency channel bandwidth relative to the total
carrier power (mean power).
Table 68 – TD-SCDMA ACLR Measurement Procedure
Menu Description
Connect RF In port of the JD7105A to the RF Output port of BTS.
RF In! CAUTION+30dBm MAX
AVOID STATIC DISCHARGE
Sync RefDC 15~19VLANUSBSerial GPS
RF Out
E1/T1
! CAUTION+25dBm MAX
AVOID STATIC DISCHARGE
External In
JD7105A Base Station Analyzer
N-N Cable
! CAUTION+30dBm MAX
AVOID STATIC DISCHARGE
BTSHPA
or LPA
Attenuator
JD7105A Base Station Analyzer
RF In! CAUTION+30dBm MAX
AVOID STATIC DISCHARGE
Sync RefDC 15~19VLANUSBSerial GPS
RF Out
E1/T1
! CAUTION+25dBm MAX
AVOID STATIC DISCHARGE
External In
To Antenna
DirectionalCoupler
EQP-50 dB
-50 dB
OUT IN BTSHPA
or LPA
! CAUTION+30dBm MAX
AVOID STATIC DISCHARGE
Mode
[Tx Analyzer]
[TD-SCDMA]
[ACLR]
Select Tx Analyzer mode
Select TD-SCDMA
Select ACLR Measurement
Figure 62 – TD-SCDMA SEM Measurement Screen
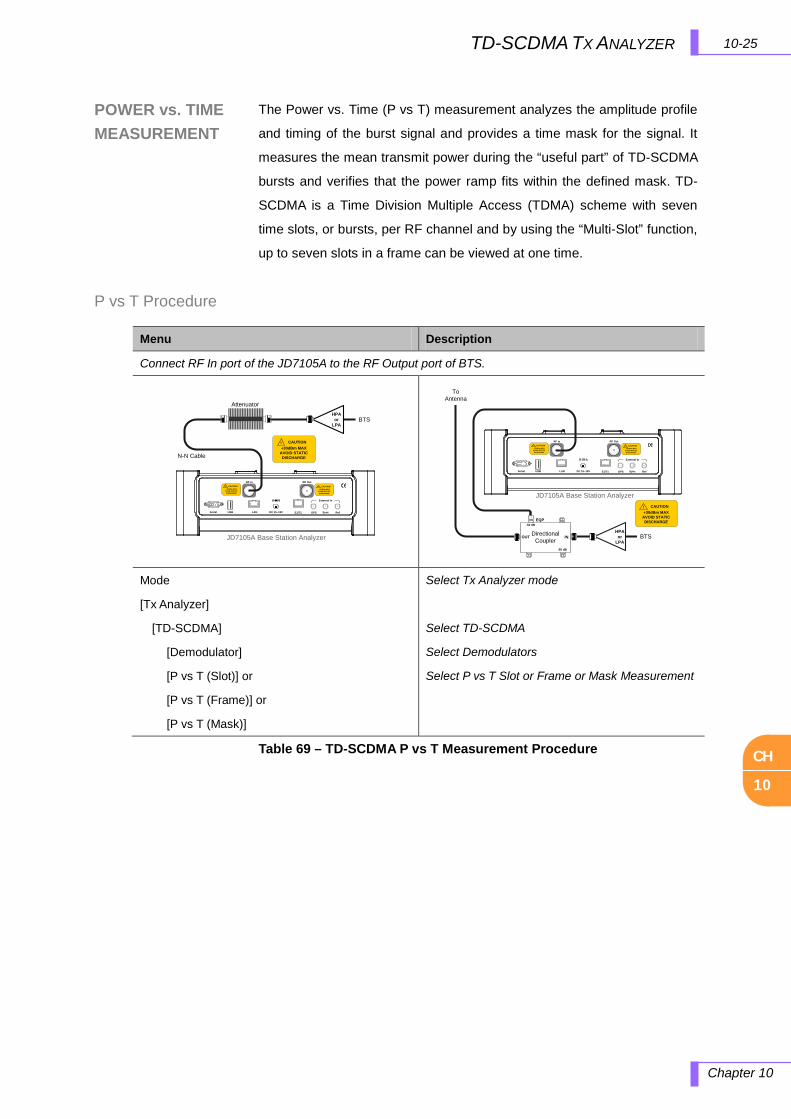
CH
10
10-25 TD-SCDMA TX ANALYZER
Chapter 10
POWER vs. TIME MEASUREMENT
P vs T Procedure
The Power vs. Time (P vs T) measurement analyzes the amplitude profile
and timing of the burst signal and provides a time mask for the signal. It
measures the mean transmit power during the “useful part” of TD-SCDMA
bursts and verifies that the power ramp fits within the defined mask. TD-
SCDMA is a Time Division Multiple Access (TDMA) scheme with seven
time slots, or bursts, per RF channel and by using the “Multi-Slot” function,
up to seven slots in a frame can be viewed at one time.
Table 69 – TD-SCDMA P vs T Measurement Procedure
Menu Description
Connect RF In port of the JD7105A to the RF Output port of BTS.
RF In! CAUTION+30dBm MAX
AVOID STATIC DISCHARGE
Sync RefDC 15~19VLANUSBSerial GPS
RF Out
E1/T1
! CAUTION+25dBm MAX
AVOID STATIC DISCHARGE
External In
JD7105A Base Station Analyzer
N-N Cable
! CAUTION+30dBm MAX
AVOID STATIC DISCHARGE
BTSHPA
or LPA
Attenuator
JD7105A Base Station Analyzer
RF In! CAUTION+30dBm MAX
AVOID STATIC DISCHARGE
Sync RefDC 15~19VLANUSBSerial GPS
RF Out
E1/T1
! CAUTION+25dBm MAX
AVOID STATIC DISCHARGE
External In
To Antenna
DirectionalCoupler
EQP-50 dB
-50 dB
OUT IN BTSHPA
or LPA
! CAUTION+30dBm MAX
AVOID STATIC DISCHARGE
Mode
[Tx Analyzer]
[TD-SCDMA]
[Demodulator]
[P vs T (Slot)] or
[P vs T (Frame)] or
[P vs T (Mask)]
Select Tx Analyzer mode
Select TD-SCDMA
Select Demodulators
Select P vs T Slot or Frame or Mask Measurement
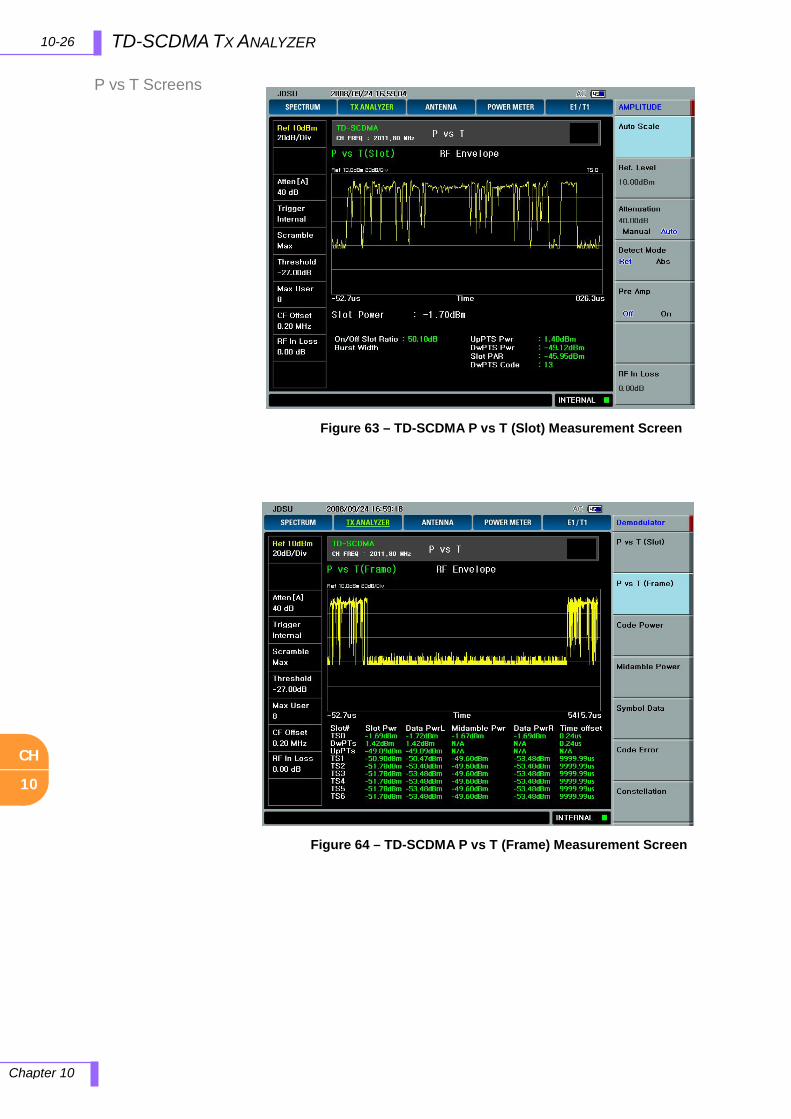
CH
10
Chapter 10
10-26 TD-SCDMA TX ANALYZER
P vs T Screens
Figure 63 – TD-SCDMA P vs T (Slot) Measurement Screen
Figure 64 – TD-SCDMA P vs T (Frame) Measurement Screen
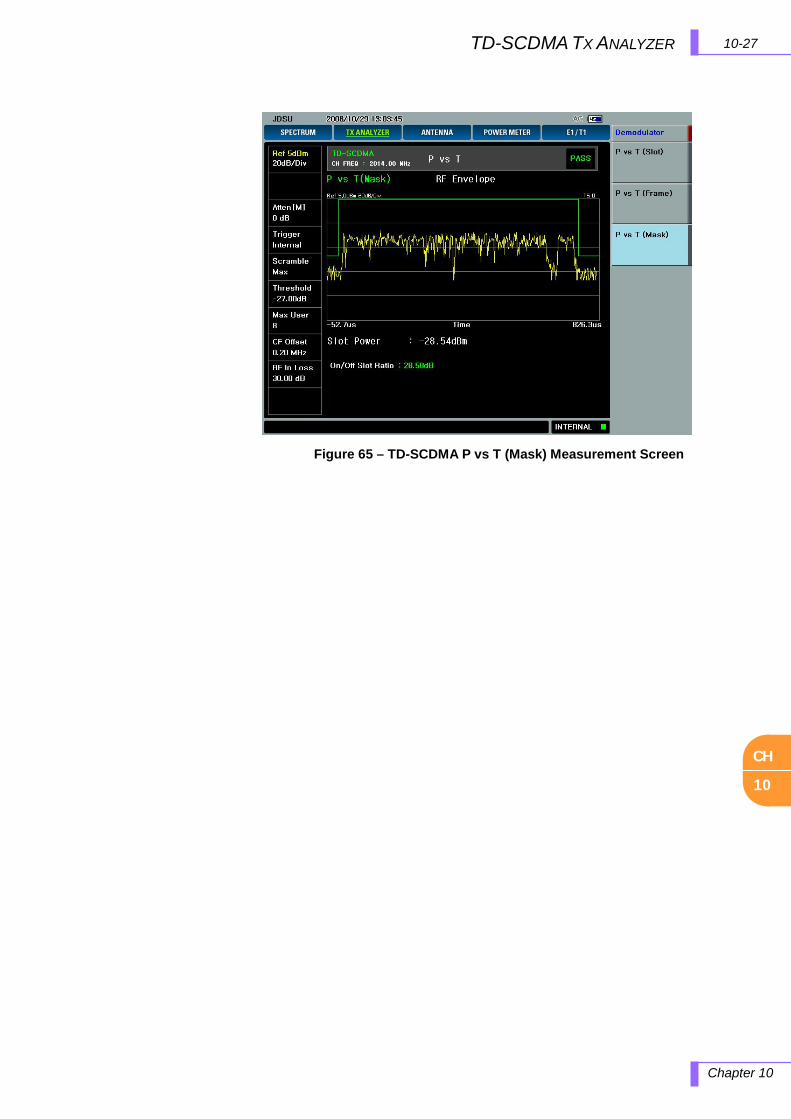
CH
10
10-27 TD-SCDMA TX ANALYZER
Chapter 10
Figure 65 – TD-SCDMA P vs T (Mask) Measurement Screen

CH
10
Chapter 10
10-28 TD-SCDMA TX ANALYZER
CODE DOMAIN POWER (DEMODULATOR)
CDP Procedure
TD-SCDMA receivers rely on the frequency or phase quality of the QPSK
or 8-PSK signal in order to achieve the expected carrier to noise
performance. A transmitter with high frequency or phase error is often
still able to support phone calls during a functional test.
This measurement displays the frequency errors numerically and
graphically, showing the binary representation of the demodulated data
bits of the received signal using Code Power, Midamble Power, Symbol
Data, Code Error and Constellation screens.
Table 70 – TD-SCDMA Demodulator Measurement Procedure
Menu Description
Connect RF In port of the JD7105A to the RF Output port of BTS.
RF In! CAUTION+30dBm MAX
AVOID STATIC DISCHARGE
Sync RefDC 15~19VLANUSBSerial GPS
RF Out
E1/T1
! CAUTION+25dBm MAX
AVOID STATIC DISCHARGE
External In
JD7105A Base Station Analyzer
N-N Cable
! CAUTION+30dBm MAX
AVOID STATIC DISCHARGE
BTSHPA
or LPA
Attenuator
JD7105A Base Station Analyzer
RF In! CAUTION+30dBm MAX
AVOID STATIC DISCHARGE
Sync RefDC 15~19VLANUSBSerial GPS
RF Out
E1/T1
! CAUTION+25dBm MAX
AVOID STATIC DISCHARGE
External In
To Antenna
DirectionalCoupler
EQP-50 dB
-50 dB
OUT IN BTSHPA
or LPA
! CAUTION+30dBm MAX
AVOID STATIC DISCHARGE
Mode
[Tx Analyzer]
[TD-SCDMA]
[Demodulator]
[Code Power] or
[Midamble Power] or
[Symbol Data] or
[Code Error] or
[Constellation]
Select Tx Analyzer mode
Select TD-SCDMA
Select Demodulators
Select Demodulator Measurements
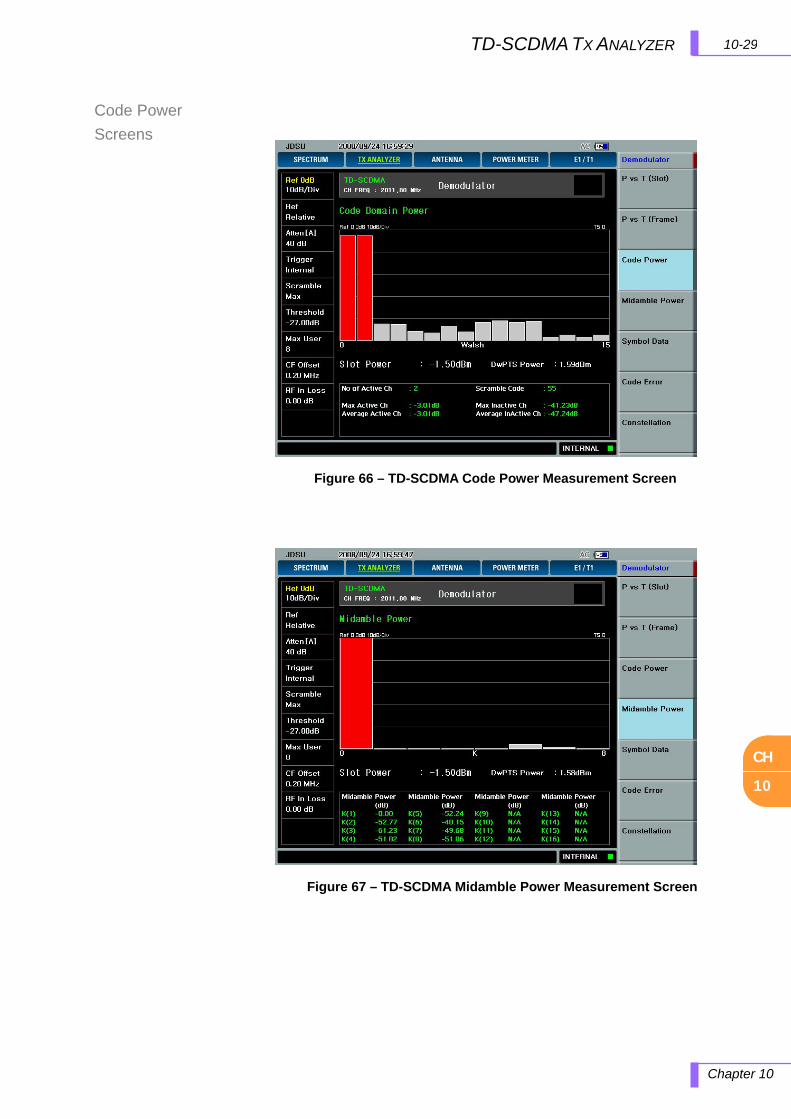
CH
10
10-29TD-SCDMA TX ANALYZER
Chapter 10
Code Power
Screens
Figure 66 – TD-SCDMA Code Power Measurement Screen
Figure 67 – TD-SCDMA Midamble Power Measurement Screen
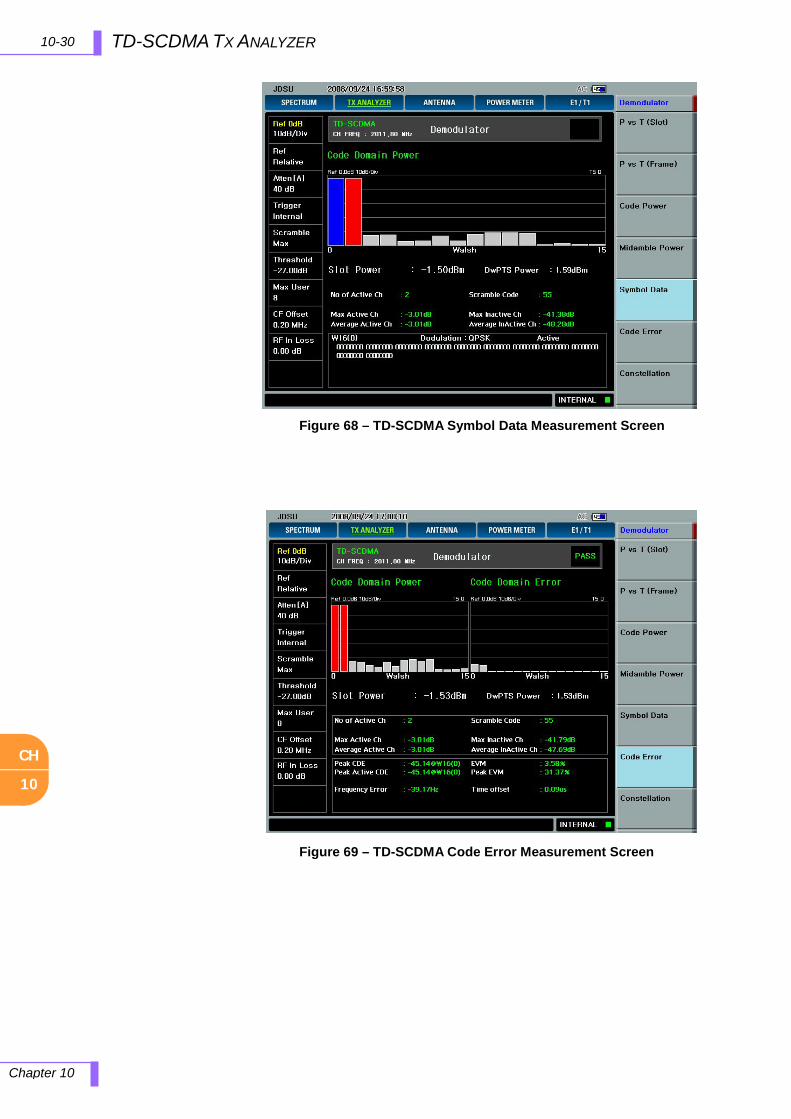
CH
10
Chapter 10
10-30 TD-SCDMA TX ANALYZER
Figure 68 – TD-SCDMA Symbol Data Measurement Screen
Figure 69 – TD-SCDMA Code Error Measurement Screen
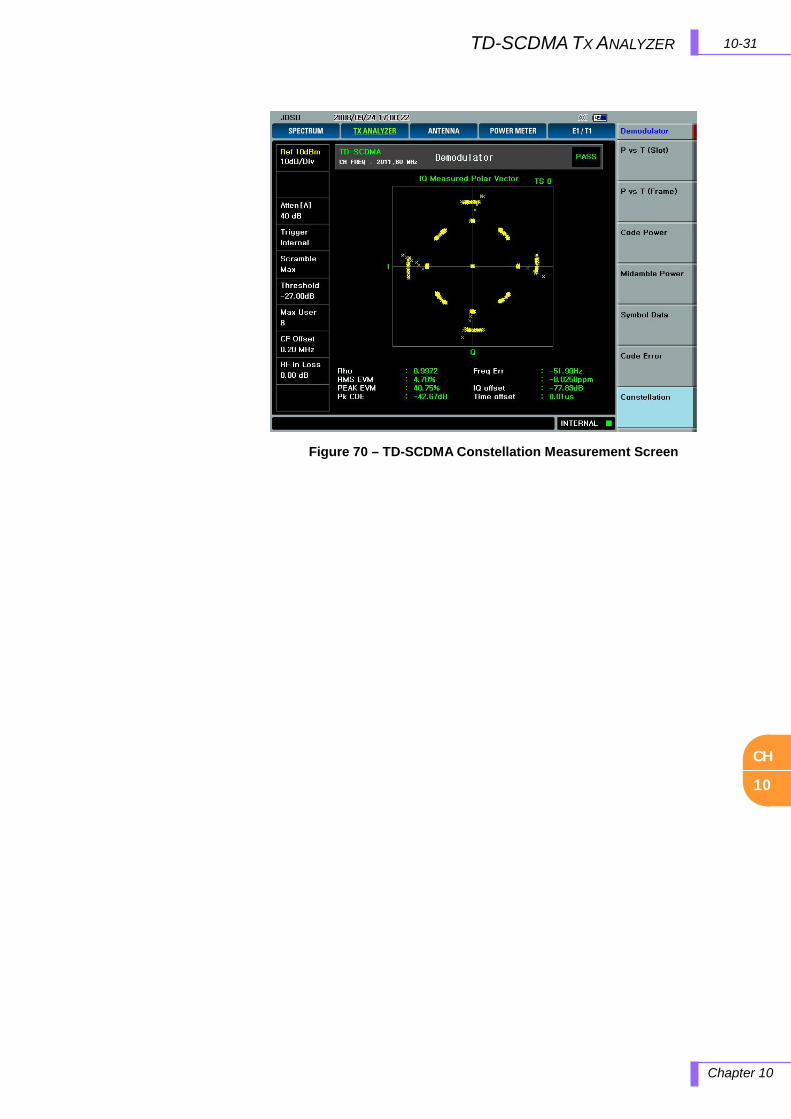
CH
10
10-31 TD-SCDMA TX ANALYZER
Chapter 10
Figure 70 – TD-SCDMA Constellation Measurement Screen
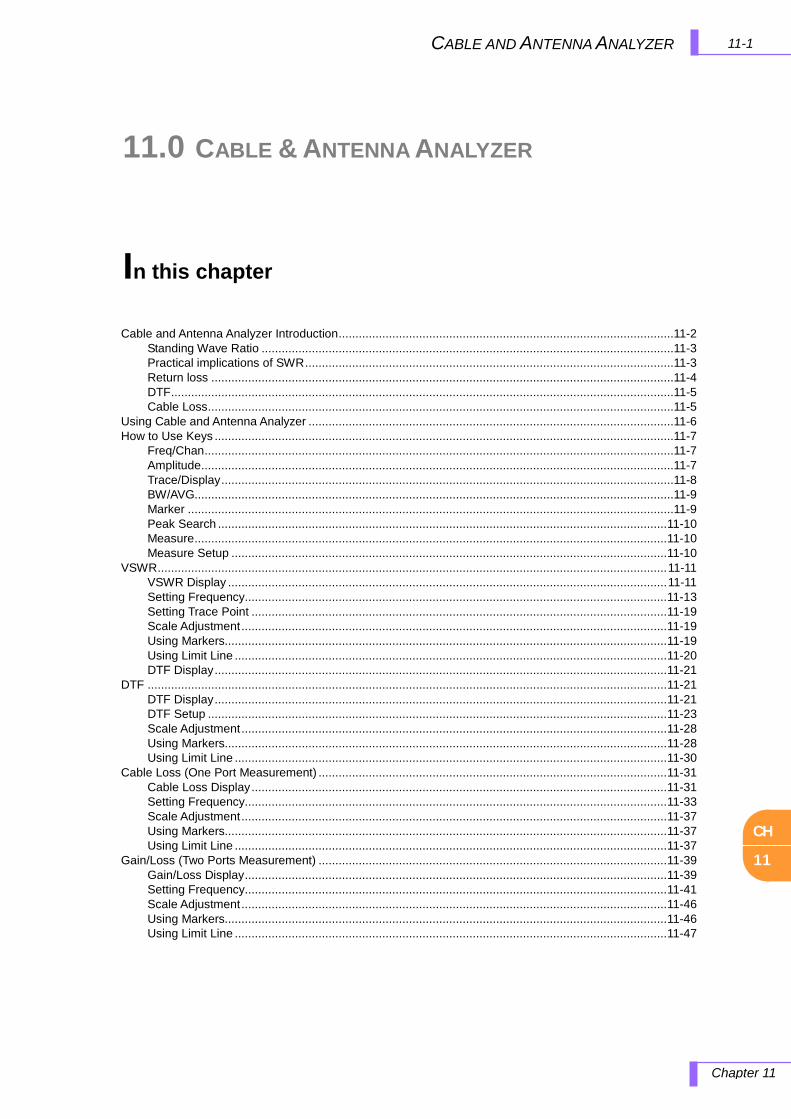
CH
11
11-1 CABLE AND ANTENNA ANALYZER
Chapter 11
11.0 CABLE & ANTENNA ANALYZER
In this chapter
Cable and Antenna Analyzer Introduction ....................................................................................................11-2
Standing Wave Ratio ...........................................................................................................................11-3 Practical implications of SWR ..............................................................................................................11-3 Return loss ..........................................................................................................................................11-4 DTF ......................................................................................................................................................11-5 Cable Loss ...........................................................................................................................................11-5
Using Cable and Antenna Analyzer .............................................................................................................11-6 How to Use Keys .........................................................................................................................................11-7
Freq/Chan ............................................................................................................................................11-7 Amplitude .............................................................................................................................................11-7 Trace/Display .......................................................................................................................................11-8 BW/AVG...............................................................................................................................................11-9 Marker .................................................................................................................................................11-9 Peak Search ...................................................................................................................................... 11-10 Measure ............................................................................................................................................. 11-10 Measure Setup .................................................................................................................................. 11-10
VSWR ........................................................................................................................................................ 11-11 VSWR Display ................................................................................................................................... 11-11 Setting Frequency.............................................................................................................................. 11-13 Setting Trace Point ............................................................................................................................ 11-19 Scale Adjustment ............................................................................................................................... 11-19 Using Markers.................................................................................................................................... 11-19 Using Limit Line ................................................................................................................................. 11-20 DTF Display ....................................................................................................................................... 11-21
DTF ........................................................................................................................................................... 11-21 DTF Display ....................................................................................................................................... 11-21 DTF Setup ......................................................................................................................................... 11-23 Scale Adjustment ............................................................................................................................... 11-28 Using Markers.................................................................................................................................... 11-28 Using Limit Line ................................................................................................................................. 11-30
Cable Loss (One Port Measurement) ........................................................................................................ 11-31 Cable Loss Display ............................................................................................................................ 11-31 Setting Frequency.............................................................................................................................. 11-33 Scale Adjustment ............................................................................................................................... 11-37 Using Markers.................................................................................................................................... 11-37 Using Limit Line ................................................................................................................................. 11-37
Gain/Loss (Two Ports Measurement) ........................................................................................................ 11-39 Gain/Loss Display .............................................................................................................................. 11-39 Setting Frequency.............................................................................................................................. 11-41 Scale Adjustment ............................................................................................................................... 11-46 Using Markers.................................................................................................................................... 11-46 Using Limit Line ................................................................................................................................. 11-47

CH
11
11-2 CABLE AND ANTENNA ANALYZER
Chapter 11
CABLE AND ANTENNA ANALYZER INTRODUCTION
A large number of abnormal cell site problems are typically caused by the
antenna system, cable and connectors, or both. It’s important to have the
right instrument available when either servicing or certifying cell sites for
operation.
The JD7105A Cable and Antenna Analyzer is a diagnostic tool needed to
accurately detect operational problems. The JD7105A has all of the
measurement functions necessary to accurately verify antenna systems
from Voltage Standing Wave Ratio (VSWR) to power measurements. In
addition, the JD7105A makes distance-to-fault measurements to
accurately pinpoint the fault’s location.
The Cable and Antenna Analyzer’s key measurements are:
VSWR
Distance to Fault
One Port Loss
Insertion Gain/Loss
To get maximum power into a load it is required that the load impedance
match the generator impedance. Any difference in impedance or
mismatching would not produce maximum power transfer. An impedance
mismatch at the antenna system produces a reflective 'traveling wave'
which goes in the opposite direction from the incident wave. As the two
traveling waves cross each other in opposite direction, it is produce an
interference pattern called a "standing wave". VSWR is the ratio between
the power sent forward to the cable and/or antenna and the amount of
power that is reflected back to the transmitter.
Some of the consequences of having a high VSWR condition in cellular
services are: dropped calls, poor reception, and an overall unacceptable
performance in the cell (or section of cell) covered by the base station
antenna. Therefore, the VSWR of the antenna system including the feed
line is one of the most critical factors in the service and maintenance of
the RF transmitter systems.
CH
11
11-3 CABLE AND ANTENNA ANALYZER
Chapter 11
STANDING WAVE RATIO
PRACTICAL IMPLICATIONS OF SWR
In telecommunications, standing wave ratio (SWR) is the ratio of the
amplitude of a partial standing wave at its maximum amplitude and at its
minimum, in an electrical transmission line.
The SWR is usually defined as a voltage ratio called the VSWR, for
voltage standing wave ratio. For example, the VSWR value 1.2:1 denotes
a maximum standing wave amplitude that is 1.2 times greater than the
minimum standing wave value. It is also possible to define the SWR in
terms of current, resulting in the ISWR, which has the same numerical
relationship. The power standing wave ratio (PSWR) is defined as the
square of the VSWR.
SWR has a number of implications that are directly applicable to RF radios.
SWR is an indicator of reflected waves bouncing back and forth within
the transmission line, and as such, an increase in SWR corresponds
to an increase in power in the line beyond the actual transmitted
power. This increased power will increase RF losses, as increased
voltage increases dielectric losses, and increased current increases
resistive losses.
A transmission line with matched impedances gives an ideal power
transfer; mismatched impedances give high SWR and reduced power
transfer.
Higher power in the transmission line also leaks back into the RF
radio, which may cause the radio to over heat.
The higher voltages associated with a sufficiently high SWR could
damage the transmitter. Solid state radios which have a lower
tolerance for high voltages may automatically reduce its output power
to prevent damage. The high voltages may also cause transmission
line dielectric to break down and/or to burn.
VSWR measurements may be taken to ensure that a waveguide is
contiguous and has no leaks or sharp bends. If such bends or holes
are present in the waveguide surface, they may diminish the
performance of transmitter and receiver equipment strings.
CH
11
11-4 CABLE AND ANTENNA ANALYZER
Chapter 11
PRACTICAL IMPLICATIONS OF SWR (cont’d)
RETURN LOSS
Another cause of bad VSWR in a waveguide is moisture build-up,
which can typically be prevented with silica gel or pressurization of
the waveguide with dry gas.
A very long run of coaxial cable especially at a frequency where the
cable itself is loose can appear to a radio as a matched load. The
power coming back is, in these cases, partially or almost completely
lost in the cable run.
In telecommunications, return loss is a measure of power reflected from
imperfections in an electrical or optical communications link. It is the ratio
(PR / PT), representing the power of the wave reflected from the
imperfection (PR) to that of the incident, or transmitted, wave, (PT). For
maximum transmitted power, the return loss should be as small as
possible, meaning the ratio PR / PT should be as small as possible.
Return loss is usually expressed in dB, the return loss value describes the
reduction in amplitude of the reflected energy, as compared to the forward
energy. It will always be a loss, and therefore a negative dB. However one
can write -3 dB as simply 3 dB of loss, dropping the negative sign and
adding loss. For example, if a device has 15 dB of return loss, the
reflected energy from that device (PR), is always 15 dB lower than the
transmitted energy (PT). When expressed in dB, larger (in magnitude)
negative numbers represent larger return losses and thus smaller
reflected power (PR).
In electrical systems, return losses often occur at junctions between
transmission lines and terminating impedances. It is a measure of the
dissimilarity between impedances in metallic transmission lines and loads.
For devices that are not perfect transmission lines or purely resistive loads,
the return loss value varies with the frequency of the transmitted signal.
CH
11
11-5 CABLE AND ANTENNA ANALYZER
Chapter 11
DTF
CABLE LOSS
While VSWR is an indicator to express the efficiency of the antenna’s
energy transmission, DTF is a measurement to identify the fault locations
in the antenna line system. Most of the antenna line system consists of
various types of coaxial cables, connectors and devices such as dividers
and surge arrestors.
Since VSWR is a measurement to verify the impedance discontinuity of
the total feed line system, it is necessary to perform DTF measurement to
identify the exact component that is contributing to the performance of the
line system. The DTF measurement makes it easy to identify the fault
location by displaying the relative distance of the signal reflections or
discontinuities from various points of the line system.
The cable loss measurement feature checks the signal attenuation level of
the cable system. The frequency band to measure the characteristics of a
cable must be calibrated before performing the cable loss measurement.
CH
11
11-6 CABLE AND ANTENNA ANALYZER
Chapter 11
USING CABLE AND ANTENNA ANALYZER
This section provides a basic usage of the keys in the Cable and Antenna
Analyzer and explains how the various measurements are performed by
the instrument.
CH
11
11-7 CABLE AND ANTENNA ANALYZER
Chapter 11
FREQ/CHAN
AMPLITUDE
HOW TO USE KEYS
The following describes the primary use of the keys in Cable and Antenna
Analyzer mode.
Freq/Chan
Sets the Frequency and selects standard or custom frequency bands.
START FREQUENCY: Changes the Start frequency in the spectrum
measurement. Values can be entered with the Data Entry key, the knob or
the arrow keys. When using the Data Entry key, the input is completed by
selecting the soft key with the corresponding value unit.
STOP FREQUENCY: Changes the Stop frequency in the spectrum
measurement. Values can be entered with the Data Entry key, the knob or
the arrow keys. When the Data Entry key is used the input is completed by
selecting the soft key with the corresponding value unit.
CENTER FREQUENCY: Changes the center frequency setup in the
spectrum measurement screen. Values can be entered with the data entry
keys, the arrow keys, or the knob. When data entry keys are used the
input is completed with the unit selection to define the input value. When
the arrow keys or the knob are used, the center frequency changes in
predefined CF steps; the CF steps are user definable in the CF Step Menu.
BAND LIST: The frequency band is selected without defining the start,
stop, and center frequencies. The saved custom bands window is shown
to select the bands available.
SPAN: This key is used to set the frequency range over which the
instrument will sweep.
Amplitude
AUTO SCALE: The instrument can automatically set the scale to the
minimum and maximum values of a measurement on the Y-axis of the
graph for optimum traces display. Every time the AUTO SCALE key is
selected, the top and bottom scales are set to the minimum and maximum
values with margin on the Y-axis of the screen.
MAX (TOP): Sets the maximum display range (Y-scale), which is the top of
the measurement screen.
CH
11
11-8 CABLE AND ANTENNA ANALYZER
Chapter 11
TRACE/DISPLAY
MIN (BOTTOM): Sets the minimum display range (Y-scale), which is the
bottom of the measurement screen.
SCALE: Changes Y-scale in VSWR or Return Loss.
LIMIT: Sets the limit to On or Off.
LIMIT LEVEL: Sets the limit level.
Selects the active trace. Each time this key is pressed, a new active trace
is selected.
SELECT: Selects an active trace. Every time Select screen menu is
pressed, the active trace changes. Channel numbers are assigned to each
captured traces or loaded traces. Refer to “Save & Load” for procedures to
load traces.
VIEW: Hides or displays the Trace CH on the screen. Press Select screen
menu key to choose the Trace CH. Traces with View set OFF are hidden
from the screen. The information about the hidden traces is also cleared
from the information window shown on the upper right of the screen.
Setting View On restores hidden traces and information on the window.
TRACE CAPTURE: Captures a current trace on the screen and assigns a
Trace CH. Refer to “Save & Load” for procedures to save traces.
TRACE INFO: Hides or displays the trace information window on the
upper right corner of the screen. This is used to view traces overlaid with
the trace information window.
CLEAR TRACE: Deletes an active trace channel from the screen. The
cleared channel is not restored. It is used to select and delete a trace
channel one by one when multiple channels are displayed on the screen.
Verify the channels to delete with View ON/OFF function in advance
settings as cleared channels cannot be restored.
CLEAR ALL: Deletes all channels from the instrument and initialize the
trace settings.
CH
11
11-9 CABLE AND ANTENNA ANALYZER
Chapter 11
BW/AVG
MARKER
SWEEP CTRL: Selects the sweep method between “Continue” and “Hold”.
Marker is used to get the information about a specific trace. A total of six
Markers can be set and each marker can be used independently. The X,
and Y coordinates of the trace are displayed when the maker is placed on
any position of the trace. As the position displaying Marker’s X and Y
coordinates may be slightly different for each measurement mode, refer to
the description of each measurement after this chapter.
SELECT: Selects an Active Marker whose position is moved by the
pressing Select key. The assigned number of an active marker is
displayed in red color on the Select screen menu and the marker’s
number is also displayed next to the marker on the trace.
MARKER VIEW: Hides or displays the selected marker on the screen. In
the same measurement mode markers appear at the previous positions
when the Marker View is turned off and on. If a measurement mode has
been changed, markers are not restored to their previous positions.
MARKER TYPE:
Selects the type of Marker to be displayed, Normal marker provide the
reading of its position and Delta marker provides the differences between
two sets of marker points.
NORMAL: Used to place a marker, along with the marker number,
1-6, on the trace.
DELTA: Delta Marker is associated with a Normal Marker, so a
Normal Maker must be set before a Delta marker is set. When a
Delta Marker is set, the position set by the Delta Marker becomes
the reference position of the Normal Marker and the Maker’s X
and Y values displays the difference compared with Delta Marker.
MARKER TABLE: Displays a table on the left side of the screen when
Marker Table is activated. All X and Y coordinates of the activated
markers are displayed on the table.
CH
11
11-10 CABLE AND ANTENNA ANALYZER
Chapter 11
PEAK SEARCH
MEASURE
MEASURE SETUP
MARKER CLEAR ALL: Turns all markers off the screen. Markers are
redisplayed on the previous position if markers are turned back on. If a
measurement mode is changed, current settings are not restored.
MARKER EDIT: Sets the marker position manually. A pop-up window
appears for users to set the frequency by entering numeric values and the
marker position is moved to the setting frequency.
Each time Peak Search key is pressed, a marker is displayed on the
highest peak of the Trace.
PEAK RIGHT: Moves the marker to the next highest peak at the right of its
current position.
PEAK LEFT: Moves the marker to the next highest peak at the left of its
current position.
MAX SEARCH: Moves the marker to the highest peak of the trace.
MIN SEARCH: Moves the marker to the lowest peak of the trace.
When the instrument is in the Cable and Antenna Analyzer
Measurement mode, a Measure key is used to select measurement
menu listed below.
VSWR
DTF
One Port Loss
Gain/Loss
CALIBRATION: Performs calibration using standard O-S-L calibration kit.
The instrument must be calibrated to get a reliable measurement result.
For best results, set the frequency and calibrate the instrument
immediately before taking any measurement.
DATA POINTS: Sets the data points or resolution to measure the trace.
The following trace point can be selected: 126, 251, 501, 1001

CH
11
11-11CABLE AND ANTENNA ANALYZER
Chapter 11
VSWR DISPLAY
VSWR VSWR DISPLAY
The following figure is a screen example when VSWR measurement mode
is selected. Various kinds of information related to the VSWR
measurement are shown on the screen.
① Calibration Info: Displays a calibration state on the measurement
frequency band that a user has selected. When the instrument is first
turned on, the state is “CAL OFF”. The symbol “CAL ON” is
displayed along with the execution time and frequency band after the
calibration is successfully completed.
② Y scale unit: It is the measurement unit of the Y-axis displayed for
the trace [Return Loss (dB), VSWR].
③ Trace Average: Indicates the average value of a single sweep over
the user setting frequency band.
④ Data Point: Sets the number of data points to take during a
measurement mode. The Trace Pont sets available are the following:
126, 251, 501, and 1001, Selecting 501 data points provides twice
as many measurement points as 251, but it takes approximately
twice as long for the trace to sweep and display.
⑤ Span: It is a user-defined frequency band. Changing the frequency
band doesn’t affect the sweep time, but affects the calibration.
Recalibration is required if the frequency setting is changed.
Figure 71 – VSWR Measurement Screen Display
CH
11
11-12 CABLE AND ANTENNA ANALYZER
Chapter 11
⑥ TOP & BOTTOM: Display range setting information.
⑦ Freq Band Info: The band name is displayed if the band is selected
from the band list stored in the instrument. If the user sets the start,
stop, center or span frequencies manually, the band name will show
“CUSTOM”.
Selecting trace points larger than needed for the measurement
will result in longer sweep times. It is recommended to select
high resolution trace points only when measuring wide
frequency bands or a precise measurement is required. The calibration is
effective even after the trace points are changed.
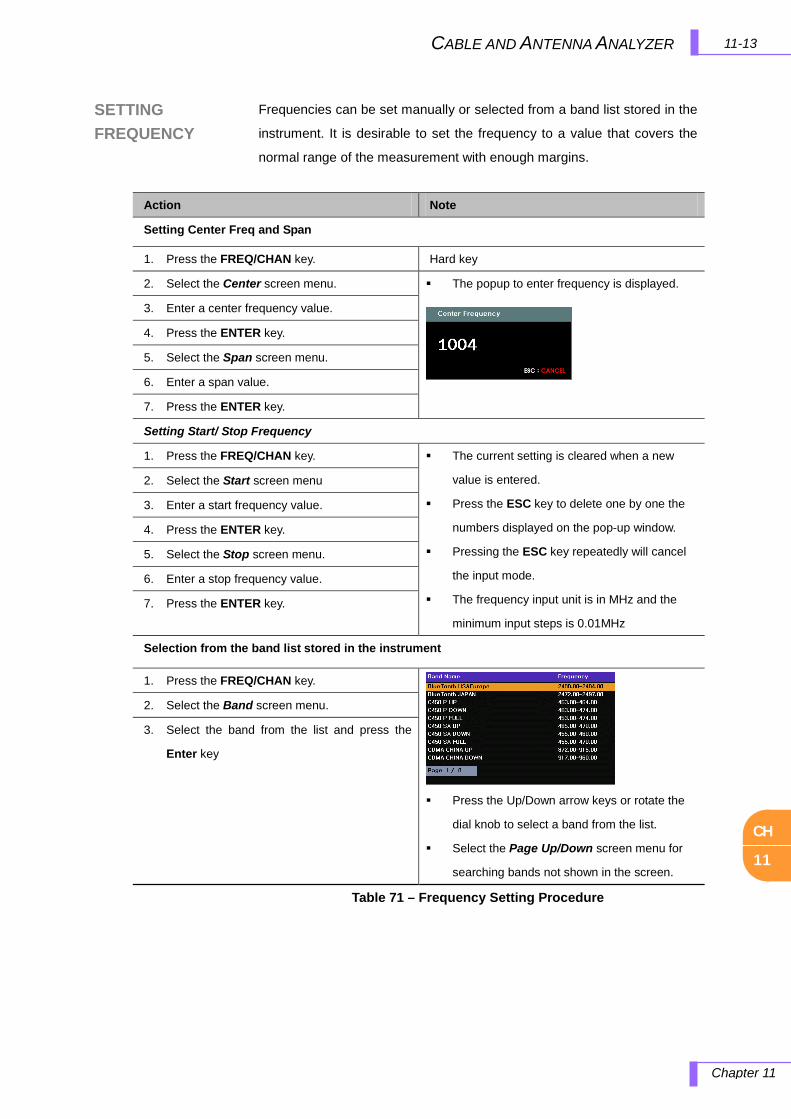
CH
11
11-13 CABLE AND ANTENNA ANALYZER
Chapter 11
SETTING FREQUENCY
Frequencies can be set manually or selected from a band list stored in the
instrument. It is desirable to set the frequency to a value that covers the
normal range of the measurement with enough margins.
Table 71 – Frequency Setting Procedure
Action Note
Setting Center Freq and Span
1. Press the FREQ/CHAN key. Hard key
2. Select the Center screen menu. The popup to enter frequency is displayed.
3. Enter a center frequency value.
4. Press the ENTER key.
5. Select the Span screen menu.
6. Enter a span value.
7. Press the ENTER key.
Setting Start/ Stop Frequency
1. Press the FREQ/CHAN key. The current setting is cleared when a new
value is entered.
Press the ESC key to delete one by one the
numbers displayed on the pop-up window.
Pressing the ESC key repeatedly will cancel
the input mode.
The frequency input unit is in MHz and the
minimum input steps is 0.01MHz
2. Select the Start screen menu
3. Enter a start frequency value.
4. Press the ENTER key.
5. Select the Stop screen menu.
6. Enter a stop frequency value.
7. Press the ENTER key.
Selection from the band list stored in the instrument
1. Press the FREQ/CHAN key.
Press the Up/Down arrow keys or rotate the
dial knob to select a band from the list.
Select the Page Up/Down screen menu for
searching bands not shown in the screen.
2. Select the Band screen menu.
3. Select the band from the list and press the
Enter key

CH
11
11-14 CABLE AND ANTENNA ANALYZER
Chapter 11
Changing the frequency settings will automatically turn
calibration OFF with the indication “CAL OFF” displayed on the
screen. Always set the frequency before calibrating the instrument.
Changing the trace points during the measurement doesn’t affect the
calibration.
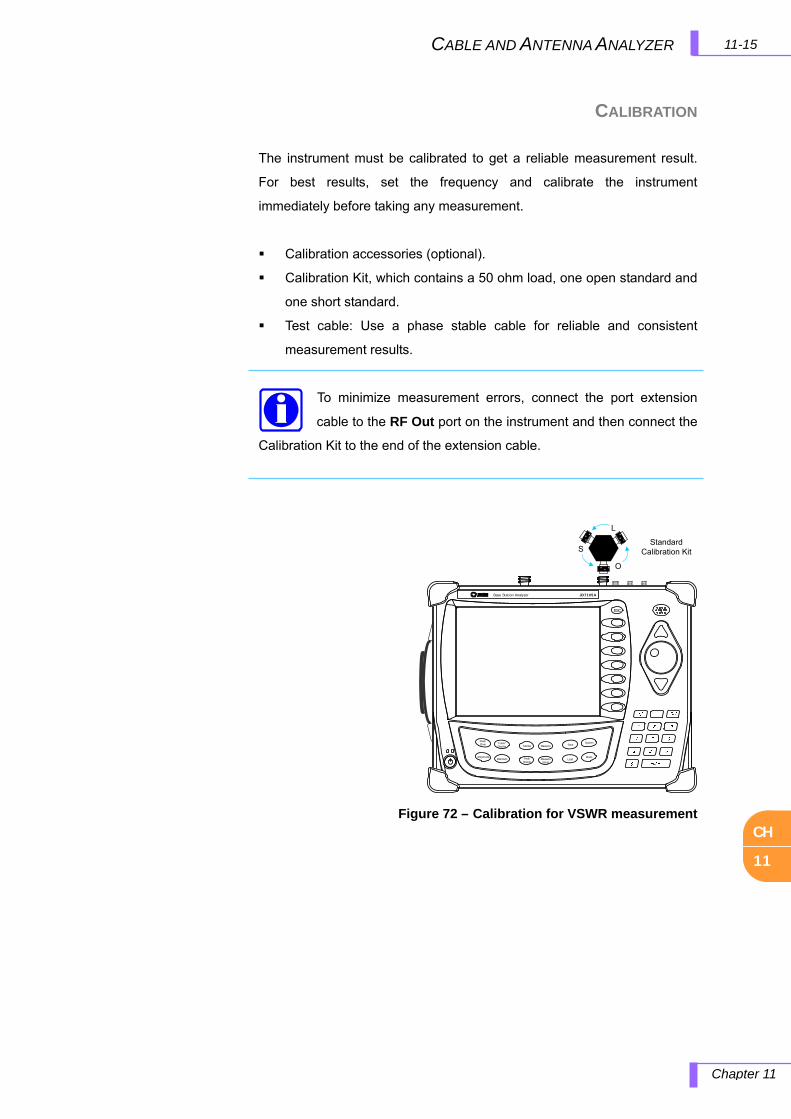
CH
11
11-15CABLE AND ANTENNA ANALYZER
Chapter 11
CALIBRATION
The instrument must be calibrated to get a reliable measurement result.
For best results, set the frequency and calibrate the instrument
immediately before taking any measurement.
Calibration accessories (optional).
Calibration Kit, which contains a 50 ohm load, one open standard and
one short standard.
Test cable: Use a phase stable cable for reliable and consistent
measurement results.
To minimize measurement errors, connect the port extension
cable to the RF Out port on the instrument and then connect the
Calibration Kit to the end of the extension cable.
ESC
Freq/Chan Trace/
Display Marker Measure
AmplitudeBW/AVG Peak
SearchMeasureSetup
Save
Load
System
Mode
Standard Calibration Kit
O
S
L
Base Station Analyzer JD7105A
Figure 72 – Calibration for VSWR measurement
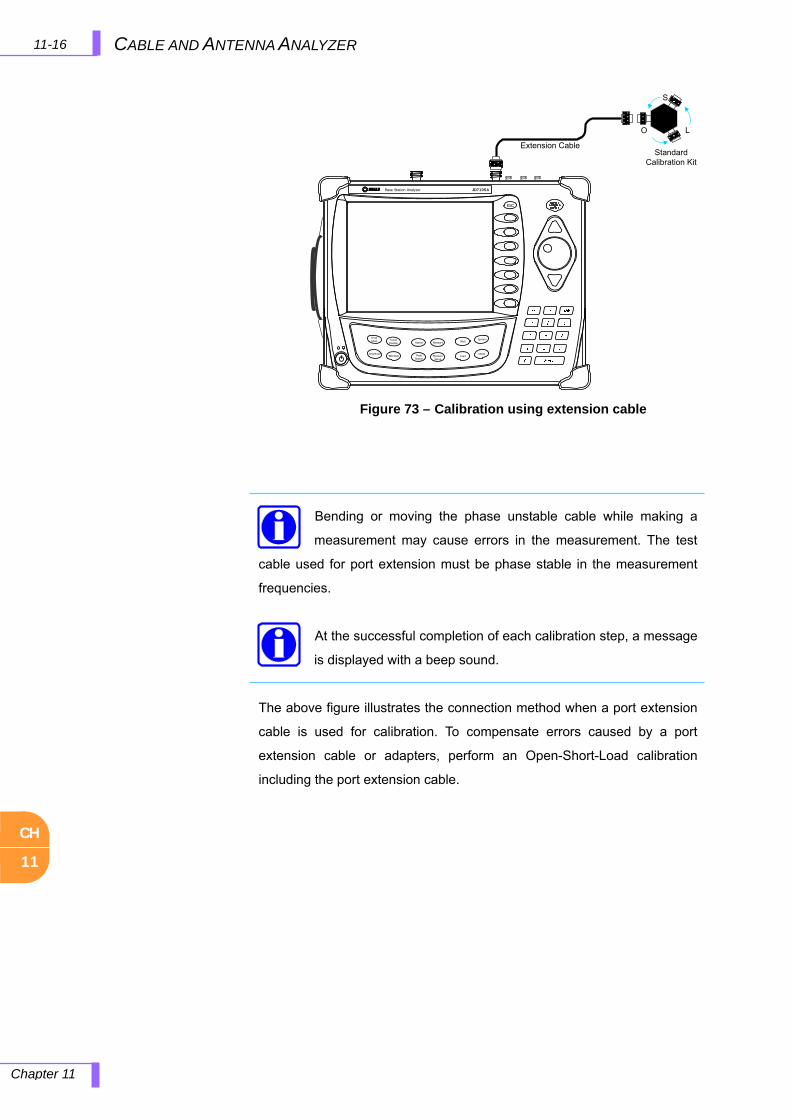
CH
11
11-16 CABLE AND ANTENNA ANALYZER
Chapter 11
Bending or moving the phase unstable cable while making a
measurement may cause errors in the measurement. The test
cable used for port extension must be phase stable in the measurement
frequencies.
At the successful completion of each calibration step, a message
is displayed with a beep sound.
The above figure illustrates the connection method when a port extension
cable is used for calibration. To compensate errors caused by a port
extension cable or adapters, perform an Open-Short-Load calibration
including the port extension cable.
Standard Calibration Kit
O
S
L
Extension Cable
ESC
Freq/Chan Trace/
Display Marker Measure
AmplitudeBW/AVG Peak
SearchMeasureSetup
Save
Load
System
Mode
Base Station Analyzer JD7105A
Figure 73 – Calibration using extension cable

CH
11
11-17 CABLE AND ANTENNA ANALYZER
Chapter 11
Table 72 – Calibration Procedure
Action Note
Performs Calibration after the frequency setting and test cable connections.
1. Call up the Measure Setup key
2. Press the Calibration key.
Hard function key
Screen menu key
3. Connect an Open standard Connect CAL Kit “Open” connector to the test cable.
4. Select the Open screen menu
When the Open screen menu is selected, a progress bar
is displayed to show the progress.
The message, “Open CAL Complete”, is displayed at its
completion.
5. Connect a Short standard Connect CAL Kit “Short” connector to the test cable.
6. Select the Short screen menu
When the Short screen menu is selected, a progress bar
is displayed to show the progress.
The message, “Short CAL Complete”, is displayed at its
completion.
7. Connect the 50ohm load Connect CAL Kit “Load” connector to the test cable.
8. Select the Load screen menu
When the Load screen menu is selected, a progress bar
is displayed to show the progress.
The message, “Load CAL Complete”, is displayed at its
completion.
Calibration state is changed to “CAL ON” after the Open-Short-Load calibration.
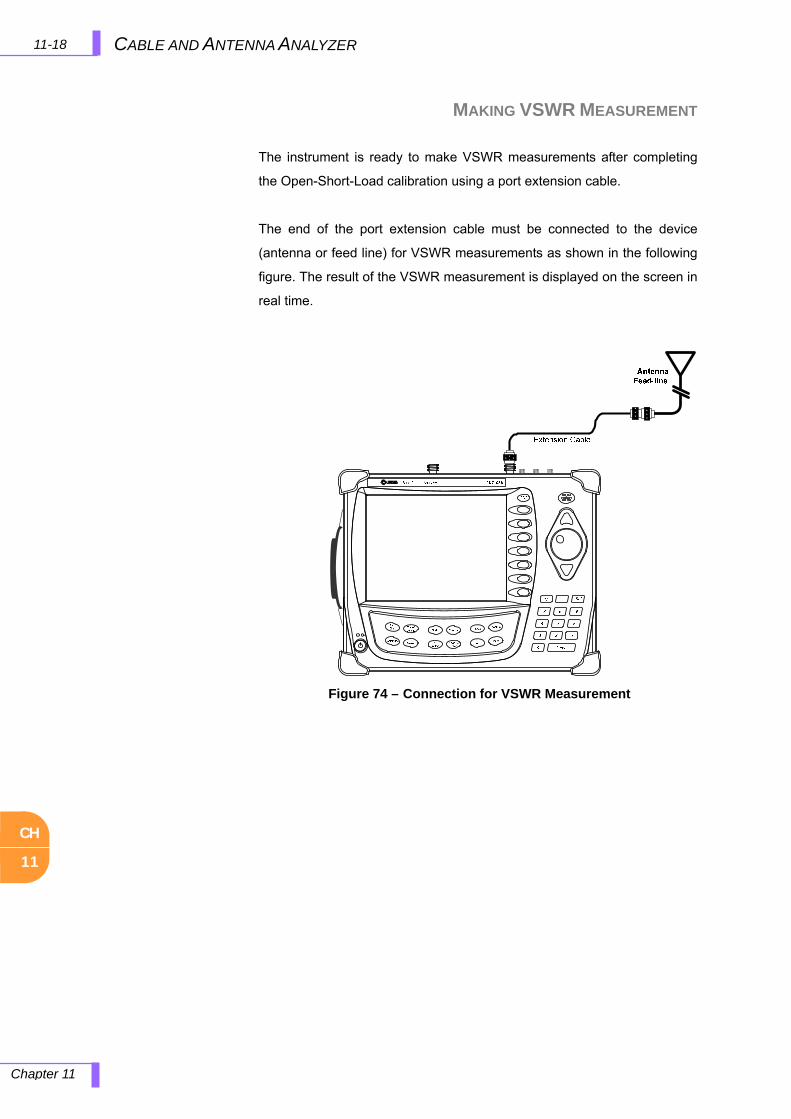
CH
11
11-18 CABLE AND ANTENNA ANALYZER
Chapter 11
MAKING VSWR MEASUREMENT
The instrument is ready to make VSWR measurements after completing
the Open-Short-Load calibration using a port extension cable.
The end of the port extension cable must be connected to the device
(antenna or feed line) for VSWR measurements as shown in the following
figure. The result of the VSWR measurement is displayed on the screen in
real time.
Figure 74 – Connection for VSWR Measurement

CH
11
11-19 CABLE AND ANTENNA ANALYZER
Chapter 11
!
SETTING TRACE POINT
SCALE ADJUSTMENT
USING MARKERS
After calibration, do not change the connection of the port
extension cable or the frequency setting. It may cause a
measurement error.
When the frequency setting is changed, a warning alarm will
sound and the calibration state will change to “CAL OFF”. In
this case, recalibrate the instrument using the Open-Short-Load standard.
The maximum allowable input level of the instrument is +25dBm.
Do not connect the RF Out port of the instrument directly to the
output port of the system. An over power input degrades the performance
of the instrument and may cause a malfunction of the instrument.
Do not connect the instrument to the antenna when there is a
risk of lightning. Electric shock may cause a malfunction or
damage the instrument.
Adjust a trace point to change the resolution of the VSWR measurement.
Changing the Trace Point doesn’t affect the calibration state.
Press the Amplitude key to set the maximum and minimum values on
the Y-scale manually.
Press the AUTO SCALE key to optimize the Y-scale and display the
entire trace.
Press the SCALE key to select the display unit of the Y-scale.
Scale adjustment doesn’t affect the calibration state.
Depending on the measurement setting, four or six markers can be used
simultaneously. The Y-axis value on a current trace is displayed next to
each marker on the screen, but the frequency information is not provided.
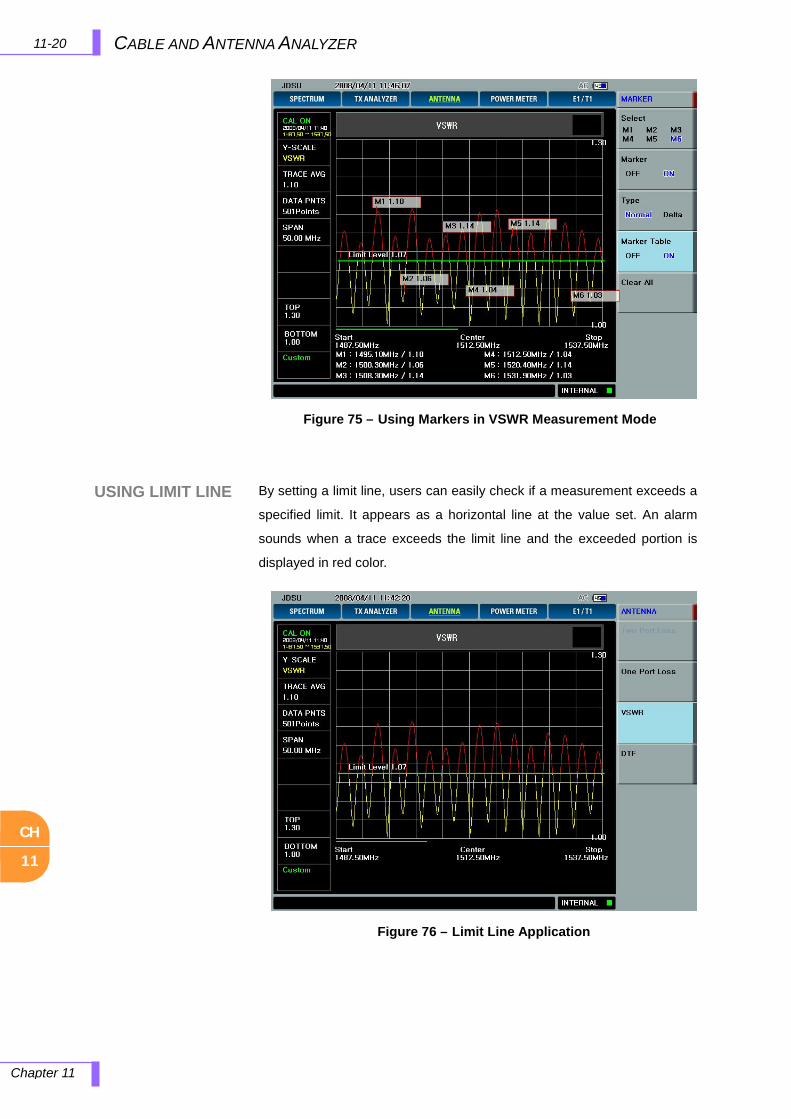
CH
11
11-20 CABLE AND ANTENNA ANALYZER
Chapter 11
USING LIMIT LINE
By setting a limit line, users can easily check if a measurement exceeds a
specified limit. It appears as a horizontal line at the value set. An alarm
sounds when a trace exceeds the limit line and the exceeded portion is
displayed in red color.
Figure 75 – Using Markers in VSWR Measurement Mode
Figure 76 – Limit Line Application

CH
11
11-21CABLE AND ANTENNA ANALYZER
Chapter 11
DTF DISPLAY
DTF DTF Display
The screen shown in the following figure is displayed when DTF
measurement mode is selected. The distance from the instrument is
shown in the X-axis, while the relative magnitude of the discontinuity is
shown in the Y-axis. The information related to the DTF measurement is
shown on the screen.
① Calibration Info: Displays a calibration state on the measurement
frequency band that a user has selected. When the instrument is first
turned on, the state is “CAL OFF”. The symbol “CAL ON” is
displayed along with the execution time and frequency band after the
calibration is successfully completed.
② Y scale unit: It is the measurement unit of the Y-axis displayed for
the trace [Return Loss (dB), VSWR].
③ MAX Distance: Displays the maximum measurable distance within
the user setting frequency band. Setting a narrow frequency band
will increase the measurable distance while setting a wide frequency
band will decrease the distance.
④ Data Point: Sets the number of data points to take during a
measurement mode. The Trace Pont sets available are the following:
126, 251, 501, and 1001, Selecting 501 data points provides twice
as many measurement points as 251, but it takes approximately
twice as long for the trace to sweep and display.
Figure 77 – DTF Measurement Screen Display
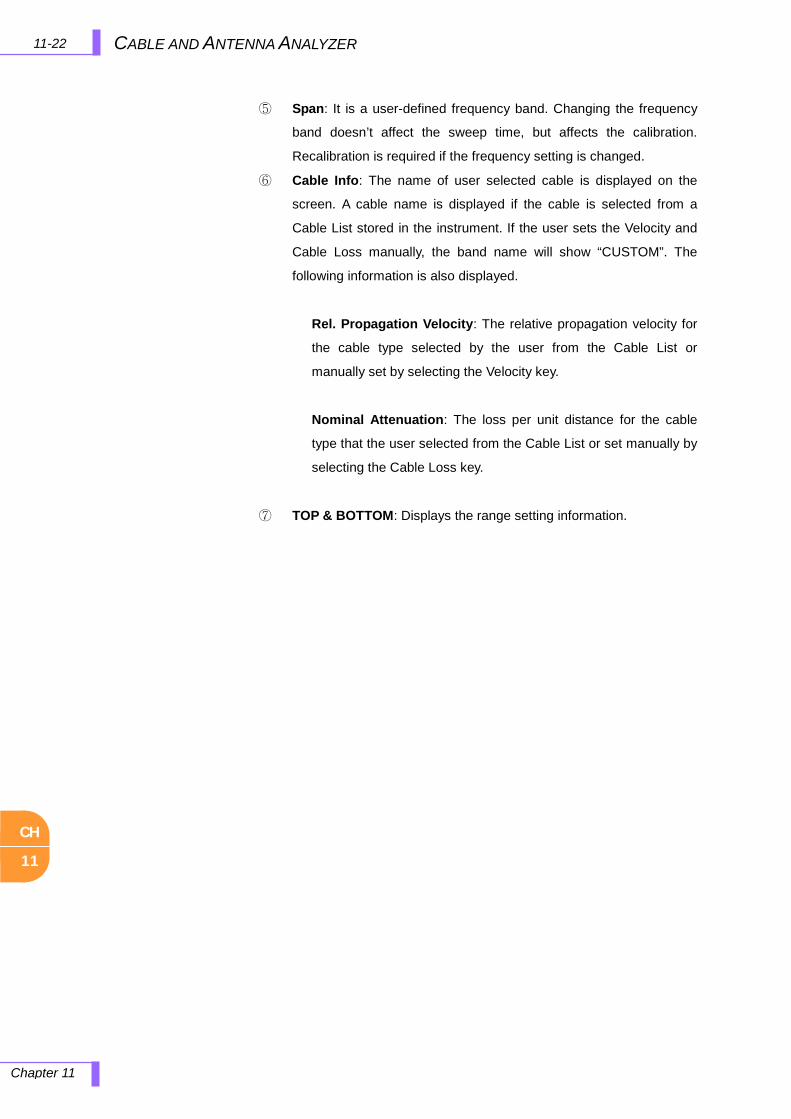
CH
11
11-22 CABLE AND ANTENNA ANALYZER
Chapter 11
⑤ Span: It is a user-defined frequency band. Changing the frequency
band doesn’t affect the sweep time, but affects the calibration.
Recalibration is required if the frequency setting is changed.
⑥ Cable Info: The name of user selected cable is displayed on the
screen. A cable name is displayed if the cable is selected from a
Cable List stored in the instrument. If the user sets the Velocity and
Cable Loss manually, the band name will show “CUSTOM”. The
following information is also displayed.
Rel. Propagation Velocity: The relative propagation velocity for
the cable type selected by the user from the Cable List or
manually set by selecting the Velocity key.
Nominal Attenuation: The loss per unit distance for the cable
type that the user selected from the Cable List or set manually by
selecting the Cable Loss key.
⑦ TOP & BOTTOM: Displays the range setting information.
CH
11
11-23 CABLE AND ANTENNA ANALYZER
Chapter 11
DTF SETUP
Sets the conditions for DTF measurements. The user setting parameters
for DTF measurements are the following:
Frequency Setting: Sets the start and stop frequencies to make a
measurement. If a specific frequency band has been set in VSWR
measurement mode, it can be applied to DTF measurement. To
change the maximum measurement distance or increase the
measurement resolution, is necessary to change the frequency
setting.
Distance Setting: The maximum measurable distance is displayed
on the left side of the screen depending on the frequency setting. Any
value within the maximum measurable distance can be set. Optimum
resolution is achieved when the user setting distance is the same as
the maximum measurable distance.
Cable Setting: Selects a cable type of the feed line. By using this key,
users can select the cable stored in the instrument without setting the
detailed parameters of the cable.
Setup: Used to change the setting of the cable parameters or change
the distance unit. It consists of the following sub menus:
Velocity: Sets the relative propagation delay of a cable. It
affects the calculation of the distance in the DTF
measurement.
Cable Loss: Sets the loss per distance unit of a cable. It
affects the peak level of the discontinuity in the DTF
measurement.
After calibration, do not change the connection of the port
extension cable or the frequency setting. It can cause a
measurement error. When the frequency setting is changed, a
warning alarm will sound and the calibration state will change to “CAL
OFF”. After changing the frequency setting, recalibrate the instrument
using the Open-Short-Load standard.
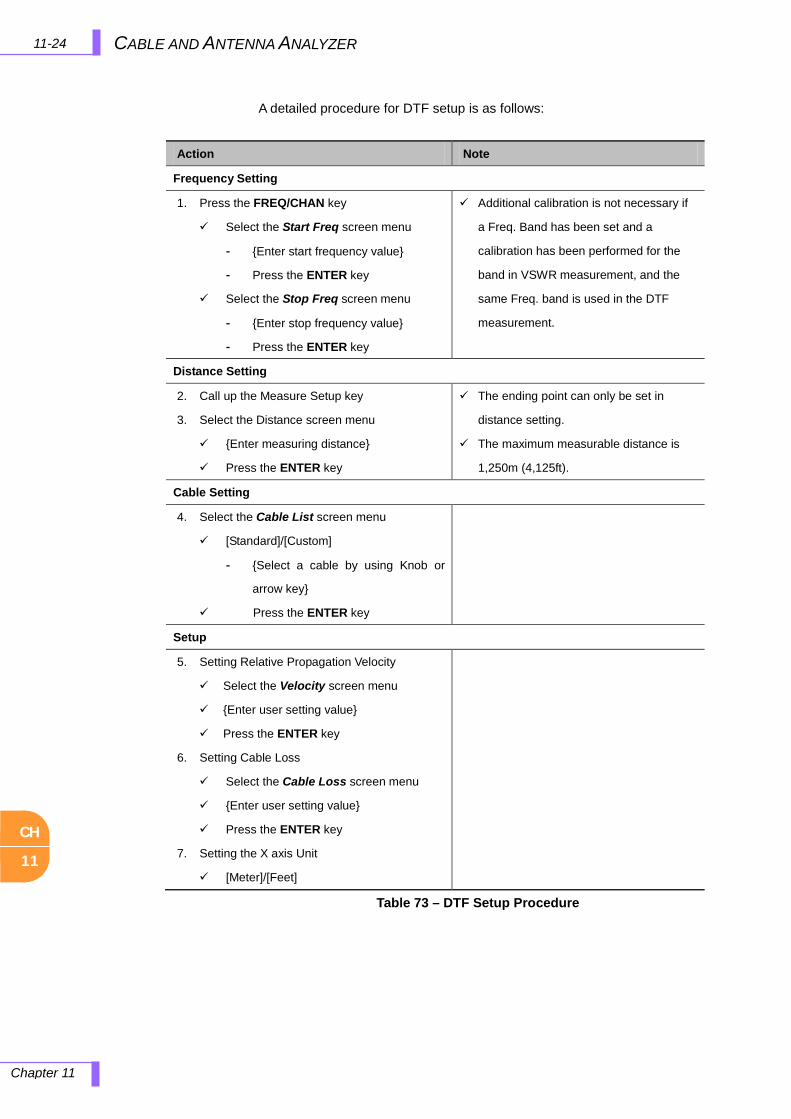
CH
11
11-24 CABLE AND ANTENNA ANALYZER
Chapter 11
A detailed procedure for DTF setup is as follows:
Table 73 – DTF Setup Procedure
Action Note
Frequency Setting
1. Press the FREQ/CHAN key
Select the Start Freq screen menu
- Enter start frequency value
- Press the ENTER key
Select the Stop Freq screen menu
- Enter stop frequency value
- Press the ENTER key
Additional calibration is not necessary if
a Freq. Band has been set and a
calibration has been performed for the
band in VSWR measurement, and the
same Freq. band is used in the DTF
measurement.
Distance Setting
2. Call up the Measure Setup key
3. Select the Distance screen menu
Enter measuring distance
Press the ENTER key
The ending point can only be set in
distance setting.
The maximum measurable distance is
1,250m (4,125ft).
Cable Setting
4. Select the Cable List screen menu
[Standard]/[Custom]
- Select a cable by using Knob or
arrow key
Press the ENTER key
Setup
5. Setting Relative Propagation Velocity
Select the Velocity screen menu
Enter user setting value
Press the ENTER key
6. Setting Cable Loss
Select the Cable Loss screen menu
Enter user setting value
Press the ENTER key
7. Setting the X axis Unit
[Meter]/[Feet]
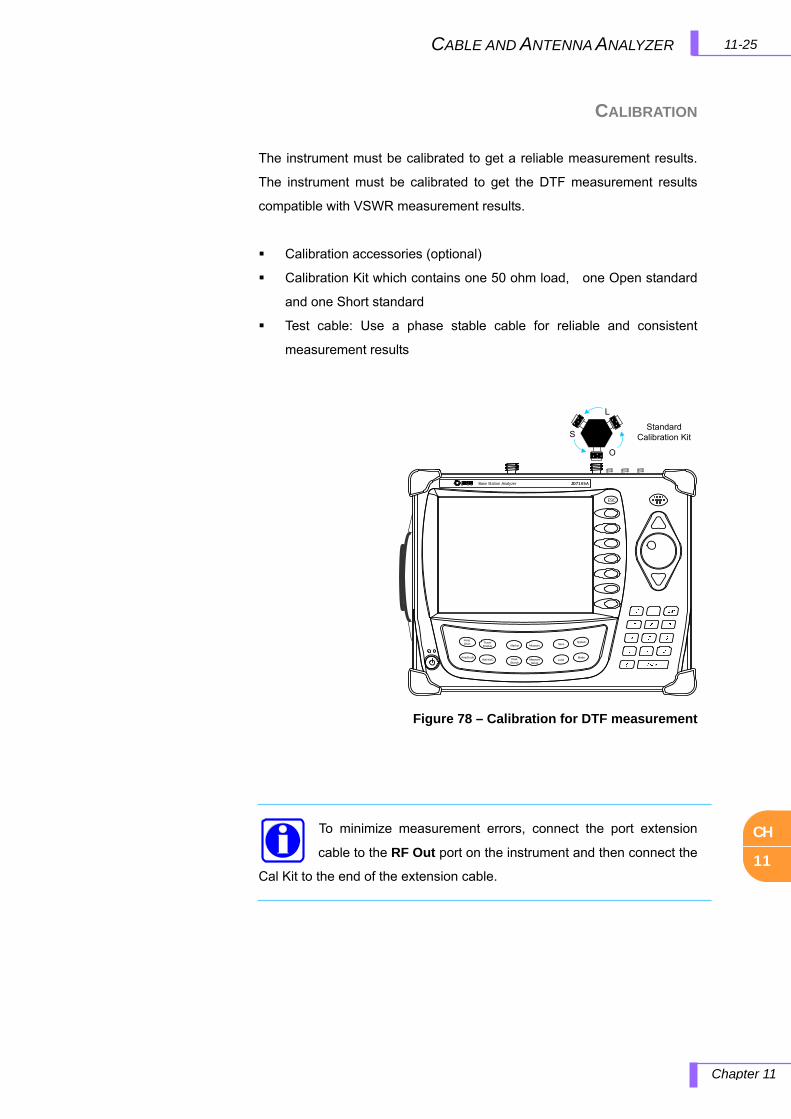
CH
11
11-25CABLE AND ANTENNA ANALYZER
Chapter 11
CALIBRATION
The instrument must be calibrated to get a reliable measurement results.
The instrument must be calibrated to get the DTF measurement results
compatible with VSWR measurement results.
Calibration accessories (optional)
Calibration Kit which contains one 50 ohm load, one Open standard
and one Short standard
Test cable: Use a phase stable cable for reliable and consistent
measurement results
To minimize measurement errors, connect the port extension
cable to the RF Out port on the instrument and then connect the
Cal Kit to the end of the extension cable.
ESC
Freq/Chan Trace/
Display Marker Measure
AmplitudeBW/AVG Peak
SearchMeasureSetup
Save
Load
System
Mode
Standard Calibration Kit
O
S
L
Base Station Analyzer JD7105A
Figure 78 – Calibration for DTF measurement
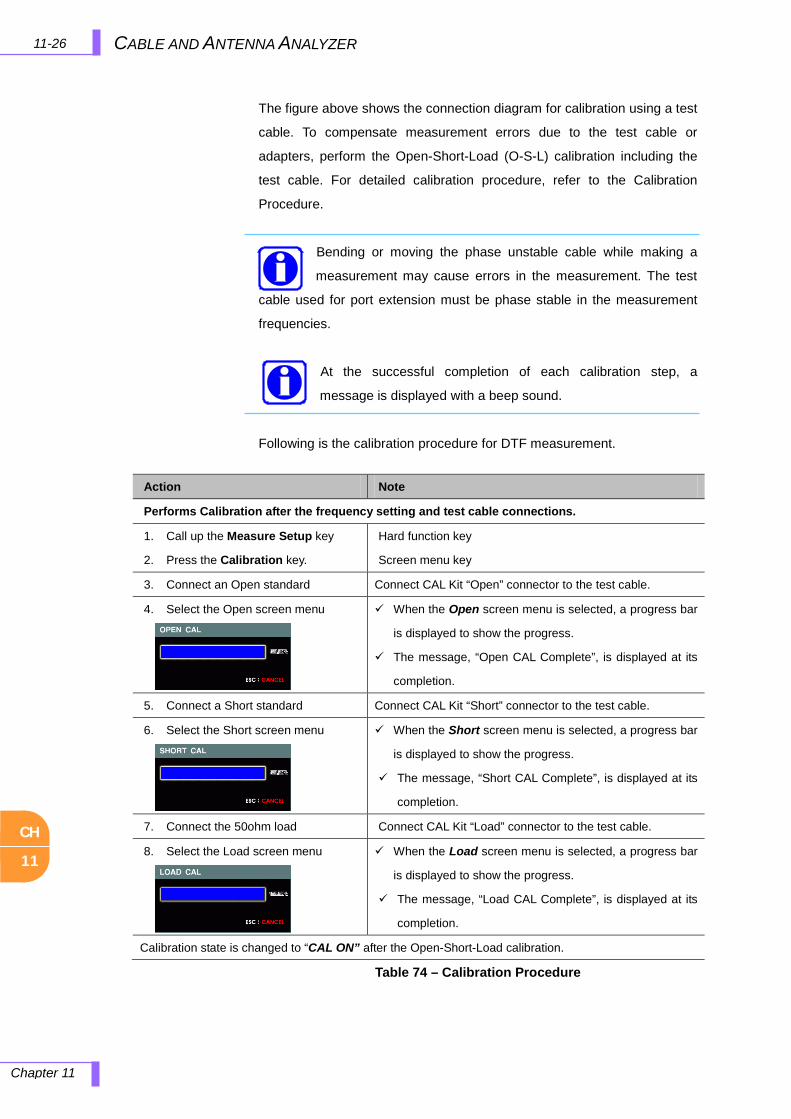
CH
11
11-26 CABLE AND ANTENNA ANALYZER
Chapter 11
The figure above shows the connection diagram for calibration using a test
cable. To compensate measurement errors due to the test cable or
adapters, perform the Open-Short-Load (O-S-L) calibration including the
test cable. For detailed calibration procedure, refer to the Calibration
Procedure.
Bending or moving the phase unstable cable while making a
measurement may cause errors in the measurement. The test
cable used for port extension must be phase stable in the measurement
frequencies.
At the successful completion of each calibration step, a
message is displayed with a beep sound.
Following is the calibration procedure for DTF measurement.
Table 74 – Calibration Procedure
Action Note
Performs Calibration after the frequency setting and test cable connections.
1. Call up the Measure Setup key
2. Press the Calibration key.
Hard function key
Screen menu key
3. Connect an Open standard Connect CAL Kit “Open” connector to the test cable.
4. Select the Open screen menu
When the Open screen menu is selected, a progress bar
is displayed to show the progress.
The message, “Open CAL Complete”, is displayed at its
completion.
5. Connect a Short standard Connect CAL Kit “Short” connector to the test cable.
6. Select the Short screen menu
When the Short screen menu is selected, a progress bar
is displayed to show the progress.
The message, “Short CAL Complete”, is displayed at its
completion.
7. Connect the 50ohm load Connect CAL Kit “Load” connector to the test cable.
8. Select the Load screen menu
When the Load screen menu is selected, a progress bar
is displayed to show the progress.
The message, “Load CAL Complete”, is displayed at its
completion.
Calibration state is changed to “CAL ON” after the Open-Short-Load calibration.

CH
11
11-27CABLE AND ANTENNA ANALYZER
Chapter 11
MAKING DTF MEASUREMENT
If a port extension cable is used to interconnect the instrument with the
transmission line, a measurement error can happen due to the sum of the
port extension cable length. By performing the O-S-L calibration at the end
of the port extension cable, the extension cable length will be
compensated and the fault location will be more accurately measured.
The maximum allowable input level of the instrument is +25dBm.
Do not connect the RF Out port directly to the system output port.
Exposure to the overpowered input may degrade the
performance of the instrument and may cause damage in the long run.
Do not connect the instrument to the antenna when there is a
risk of lightning. Electric shock may cause the malfunction or
breakdown of the instrument.
Figure 79 – Connection Diagram for DTF Measurement
!

CH
11
11-28 CABLE AND ANTENNA ANALYZER
Chapter 11
SCALE ADJUSTMENT
USING MARKERS
If O-S-L calibration has been done at the end of the port
extension cable for DTF measurement, the length of the port
extension cable is compensated automatically and is not included in the
distance to the point of discontinuity.
Press the Amplitude key to set the maximum and minimum values on
the Y-scale manually.
Press the AUTO SCALE key to optimize the Y-scale and display the
entire trace.
Press the SCALE key to select the display unit of the Y-scale.
Scale adjustment doesn’t affect the calibration state.
Depending on the display settings, four or six markers can be used
simultaneously. The distance of a current marker position is displayed next
to each marker on the screen. Activate the marker table to see both the
magnitude and distance information.
Figure 80 – Using Markers in DTF Measurement Mode
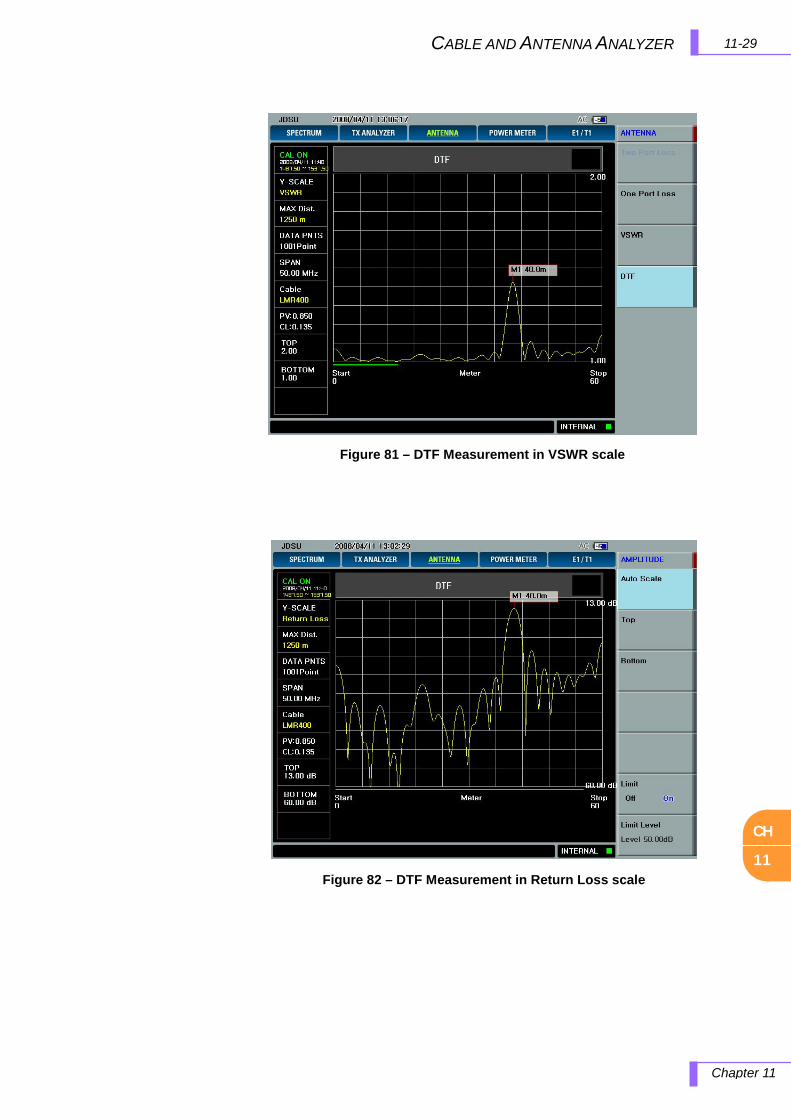
CH
11
11-29 CABLE AND ANTENNA ANALYZER
Chapter 11
Figure 81 – DTF Measurement in VSWR scale
Figure 82 – DTF Measurement in Return Loss scale
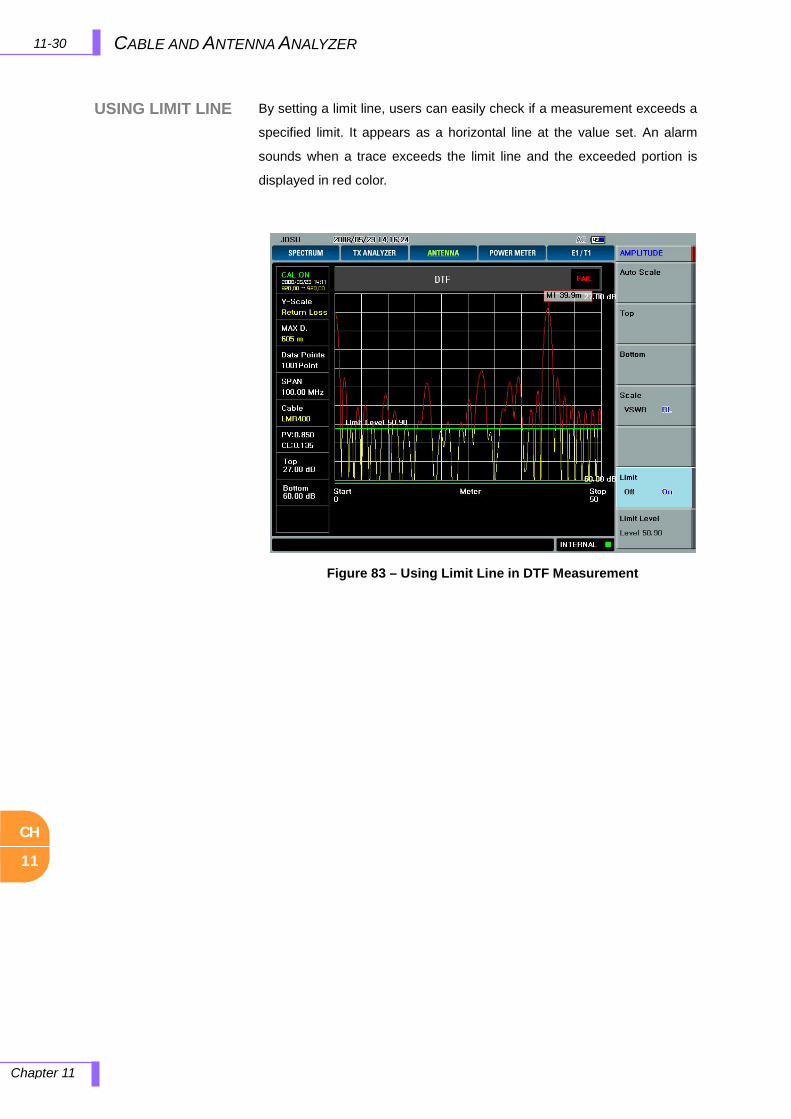
CH
11
11-30 CABLE AND ANTENNA ANALYZER
Chapter 11
USING LIMIT LINE
By setting a limit line, users can easily check if a measurement exceeds a
specified limit. It appears as a horizontal line at the value set. An alarm
sounds when a trace exceeds the limit line and the exceeded portion is
displayed in red color.
Figure 83 – Using Limit Line in DTF Measurement
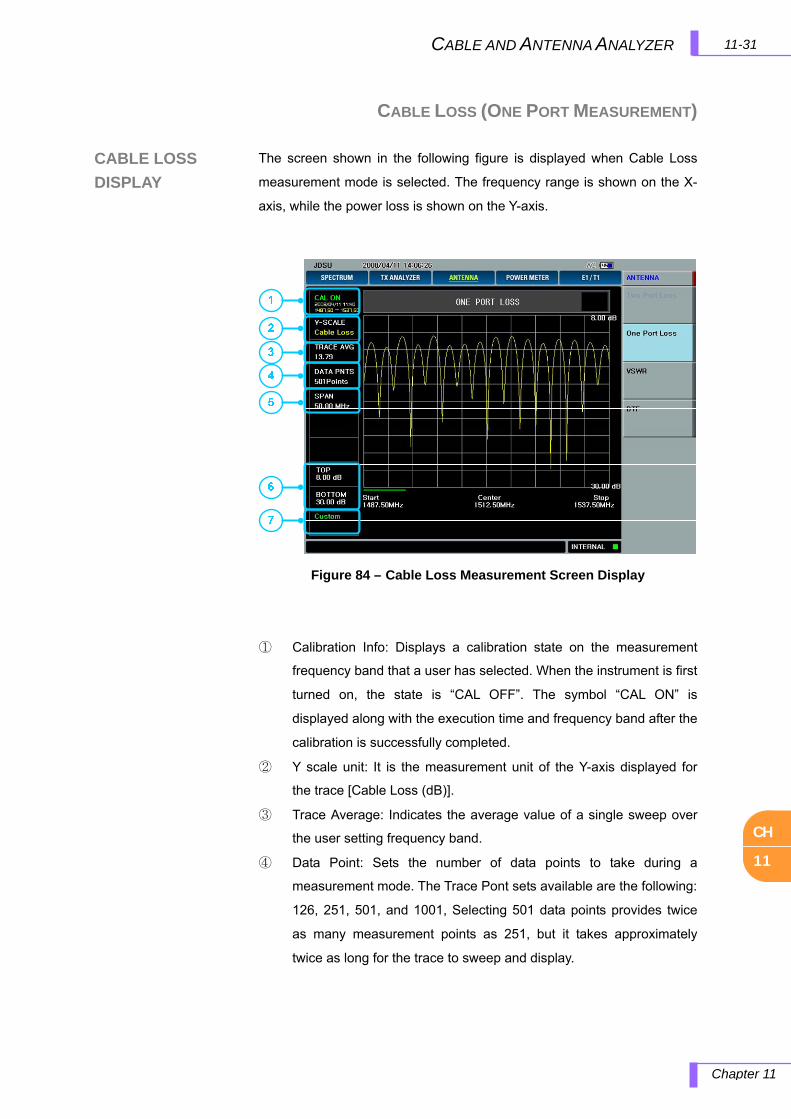
CH
11
11-31CABLE AND ANTENNA ANALYZER
Chapter 11
CABLE LOSS
DISPLAY
CABLE LOSS (ONE PORT MEASUREMENT) Cable Loss Display
The screen shown in the following figure is displayed when Cable Loss
measurement mode is selected. The frequency range is shown on the X-
axis, while the power loss is shown on the Y-axis.
① Calibration Info: Displays a calibration state on the measurement
frequency band that a user has selected. When the instrument is first
turned on, the state is “CAL OFF”. The symbol “CAL ON” is
displayed along with the execution time and frequency band after the
calibration is successfully completed.
② Y scale unit: It is the measurement unit of the Y-axis displayed for
the trace [Cable Loss (dB)].
③ Trace Average: Indicates the average value of a single sweep over
the user setting frequency band.
④ Data Point: Sets the number of data points to take during a
measurement mode. The Trace Pont sets available are the following:
126, 251, 501, and 1001, Selecting 501 data points provides twice
as many measurement points as 251, but it takes approximately
twice as long for the trace to sweep and display.
Figure 84 – Cable Loss Measurement Screen Display
CH
11
11-32 CABLE AND ANTENNA ANALYZER
Chapter 11
⑤ Span: It is a user-defined frequency band. Changing the frequency
band doesn’t affect the sweep time, but affects the calibration.
Recalibration is required if the frequency setting is changed.
⑥ TOP & BOTTOM: Displays the range setting information.
⑦ Cable Info: The name of user selected cable is displayed on the
screen. A cable name is displayed if the cable is selected from a
Cable List stored in the instrument. If the user sets the Velocity and
Cable Loss manually, the band name will show “CUSTOM”.
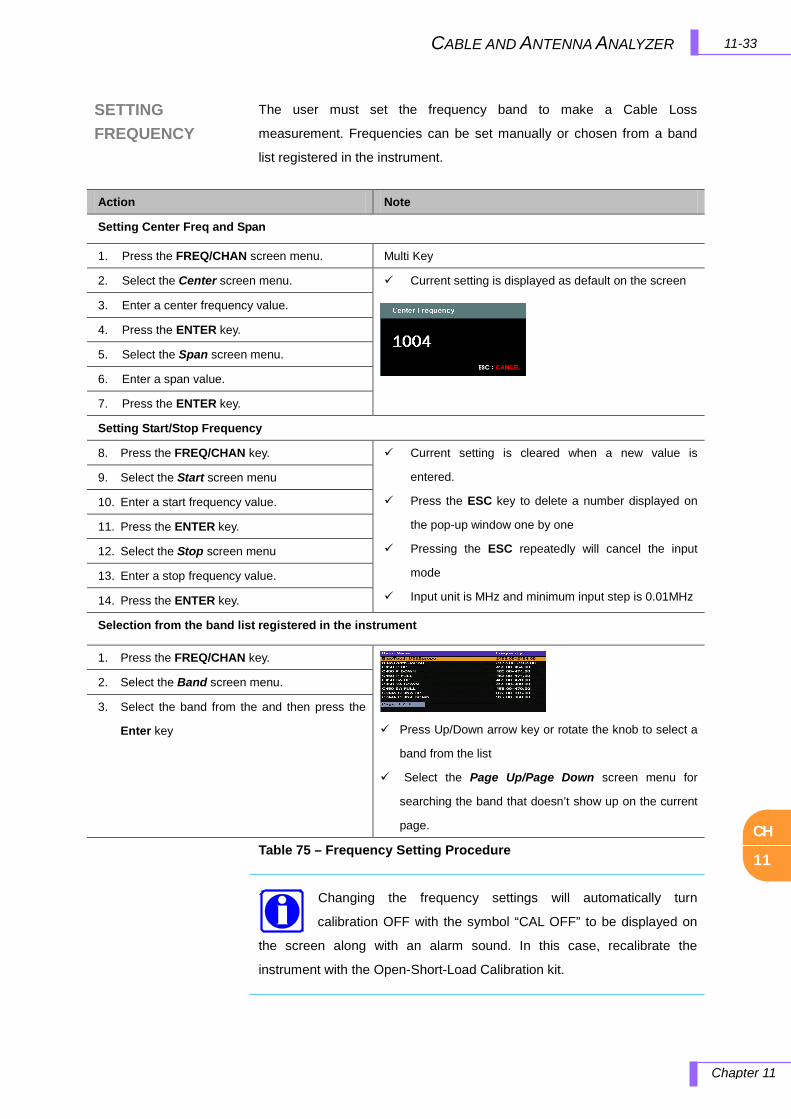
CH
11
11-33 CABLE AND ANTENNA ANALYZER
Chapter 11
SETTING FREQUENCY
The user must set the frequency band to make a Cable Loss
measurement. Frequencies can be set manually or chosen from a band
list registered in the instrument.
Table 75 – Frequency Setting Procedure
Changing the frequency settings will automatically turn
calibration OFF with the symbol “CAL OFF” to be displayed on
the screen along with an alarm sound. In this case, recalibrate the
instrument with the Open-Short-Load Calibration kit.
Action Note
Setting Center Freq and Span
1. Press the FREQ/CHAN screen menu. Multi Key
2. Select the Center screen menu. Current setting is displayed as default on the screen
3. Enter a center frequency value.
4. Press the ENTER key.
5. Select the Span screen menu.
6. Enter a span value.
7. Press the ENTER key.
Setting Start/Stop Frequency
8. Press the FREQ/CHAN key. Current setting is cleared when a new value is
entered.
Press the ESC key to delete a number displayed on
the pop-up window one by one
Pressing the ESC repeatedly will cancel the input
mode
Input unit is MHz and minimum input step is 0.01MHz
9. Select the Start screen menu
10. Enter a start frequency value.
11. Press the ENTER key.
12. Select the Stop screen menu
13. Enter a stop frequency value.
14. Press the ENTER key.
Selection from the band list registered in the instrument
1. Press the FREQ/CHAN key.
Press Up/Down arrow key or rotate the knob to select a
band from the list
Select the Page Up/Page Down screen menu for
searching the band that doesn’t show up on the current
page.
2. Select the Band screen menu.
3. Select the band from the and then press the
Enter key
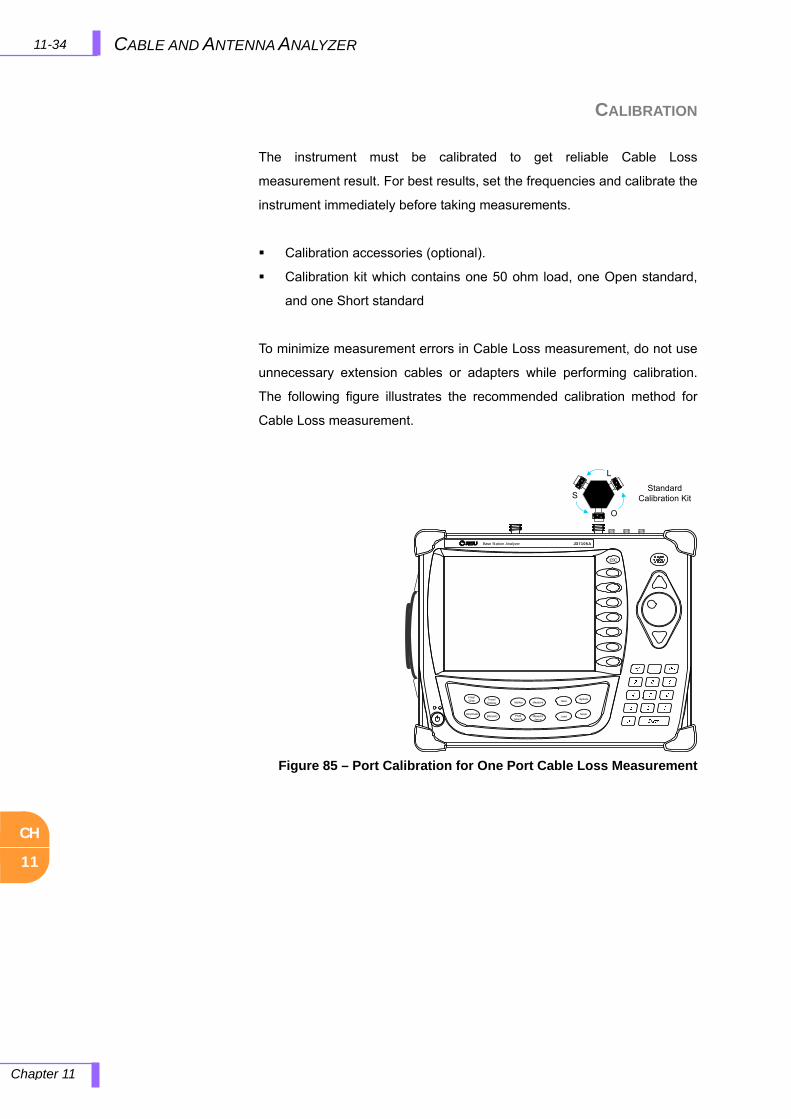
CH
11
11-34 CABLE AND ANTENNA ANALYZER
Chapter 11
CALIBRATION
The instrument must be calibrated to get reliable Cable Loss
measurement result. For best results, set the frequencies and calibrate the
instrument immediately before taking measurements.
Calibration accessories (optional).
Calibration kit which contains one 50 ohm load, one Open standard,
and one Short standard
To minimize measurement errors in Cable Loss measurement, do not use
unnecessary extension cables or adapters while performing calibration.
The following figure illustrates the recommended calibration method for
Cable Loss measurement.
ESC
Freq/Chan Trace/
Display Marker Measure
AmplitudeBW/AVG Peak
SearchMeasureSetup
Save
Load
System
Mode
Standard Calibration Kit
O
S
L
Base Station Analyzer JD7105A
Figure 85 – Port Calibration for One Port Cable Loss Measurement
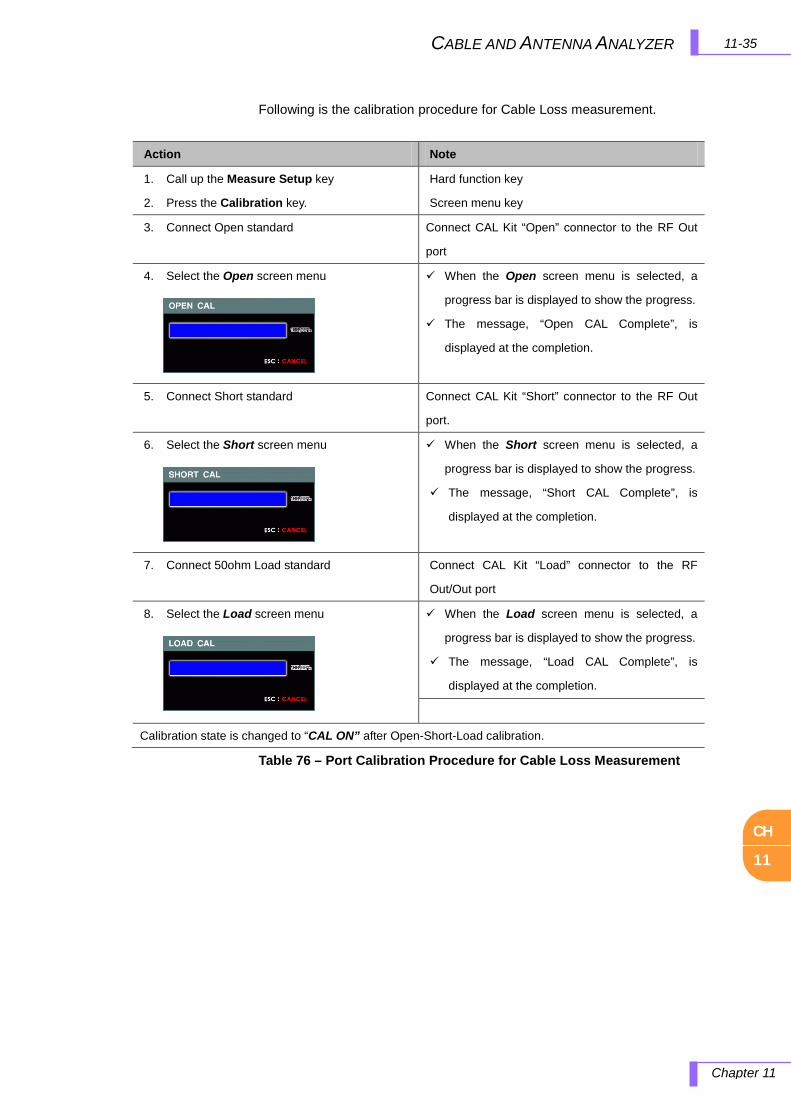
CH
11
11-35 CABLE AND ANTENNA ANALYZER
Chapter 11
Following is the calibration procedure for Cable Loss measurement.
Table 76 – Port Calibration Procedure for Cable Loss Measurement
Action Note
1. Call up the Measure Setup key
2. Press the Calibration key.
Hard function key
Screen menu key
3. Connect Open standard Connect CAL Kit “Open” connector to the RF Out
port
4. Select the Open screen menu
When the Open screen menu is selected, a
progress bar is displayed to show the progress.
The message, “Open CAL Complete”, is
displayed at the completion.
5. Connect Short standard Connect CAL Kit “Short” connector to the RF Out
port.
6. Select the Short screen menu
When the Short screen menu is selected, a
progress bar is displayed to show the progress.
The message, “Short CAL Complete”, is
displayed at the completion.
7. Connect 50ohm Load standard Connect CAL Kit “Load” connector to the RF
Out/Out port
8. Select the Load screen menu
When the Load screen menu is selected, a
progress bar is displayed to show the progress.
The message, “Load CAL Complete”, is
displayed at the completion.
Calibration state is changed to “CAL ON” after Open-Short-Load calibration.
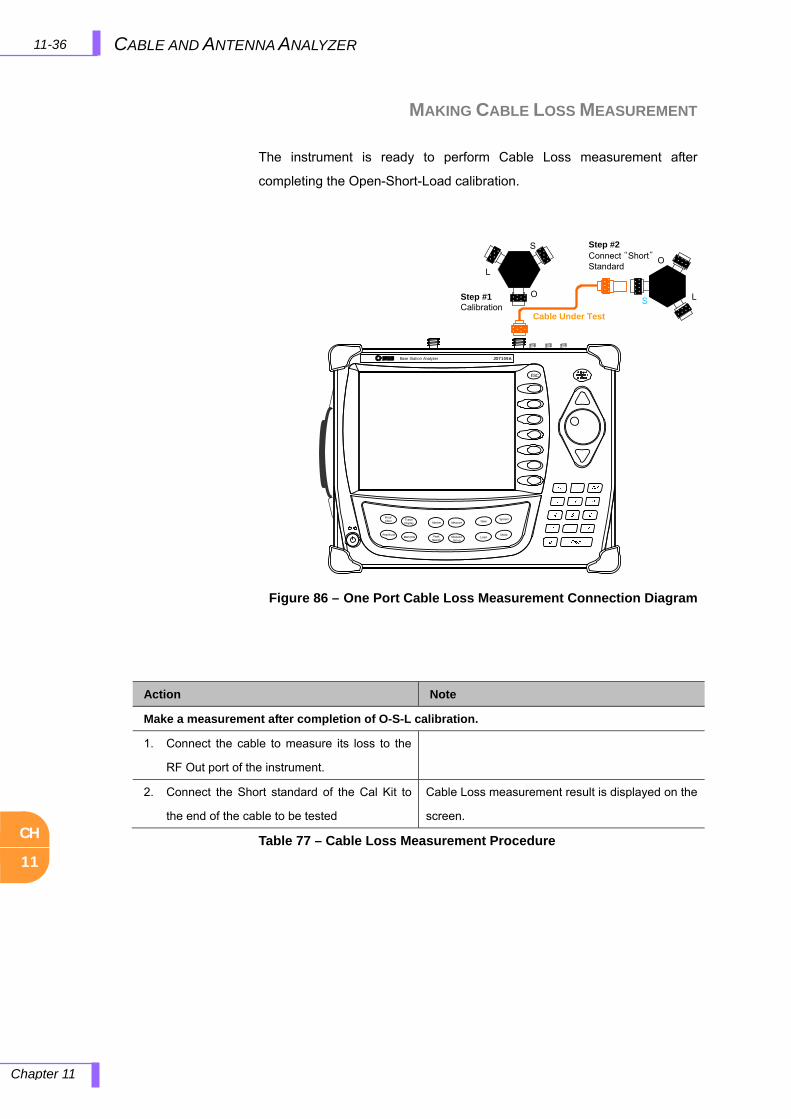
CH
11
11-36 CABLE AND ANTENNA ANALYZER
Chapter 11
MAKING CABLE LOSS MEASUREMENT
The instrument is ready to perform Cable Loss measurement after
completing the Open-Short-Load calibration.
Table 77 – Cable Loss Measurement Procedure
Step #2Connect “Short”Standard
Step #1Calibration
Cable Under Test
O
S
LO
S L
ESC
Freq/Chan Trace/
Display Marker Measure
AmplitudeBW/AVG Peak
SearchMeasureSetup
Save
Load
System
Mode
Base Station Analyzer JD7105A
Figure 86 – One Port Cable Loss Measurement Connection Diagram
Action Note
Make a measurement after completion of O-S-L calibration.
1. Connect the cable to measure its loss to the
RF Out port of the instrument.
2. Connect the Short standard of the Cal Kit to
the end of the cable to be tested
Cable Loss measurement result is displayed on the
screen.

CH
11
11-37 CABLE AND ANTENNA ANALYZER
Chapter 11
SCALE ADJUSTMENT
USING MARKERS
USING LIMIT LINE
Press the Amplitude key to set the maximum and minimum values on
the Y-scale manually.
Press the AUTO SCALE key to optimize the Y-scale and display the
entire trace.
Press the TOP/BOTTOM key to set the display min/max of the Y-
scale.
Scale adjustment doesn’t affect the normalization state.
On the measurement display, six markers can be used simultaneously.
The level of a current trace is displayed next to each marker on the screen,
but the frequency information is not provided. The frequency information
will be provided when Marker Table is enabled (Marker Table On).
By setting a limit line, users can easily check if a measurement exceeds a
specified limit. It appears as a horizontal line at the value set. An alarm
sounds when a trace exceeds the limit line and the exceeded portion is
displayed in red color.
Figure 87 – Using Markers in Cable Loss Measurement Mode
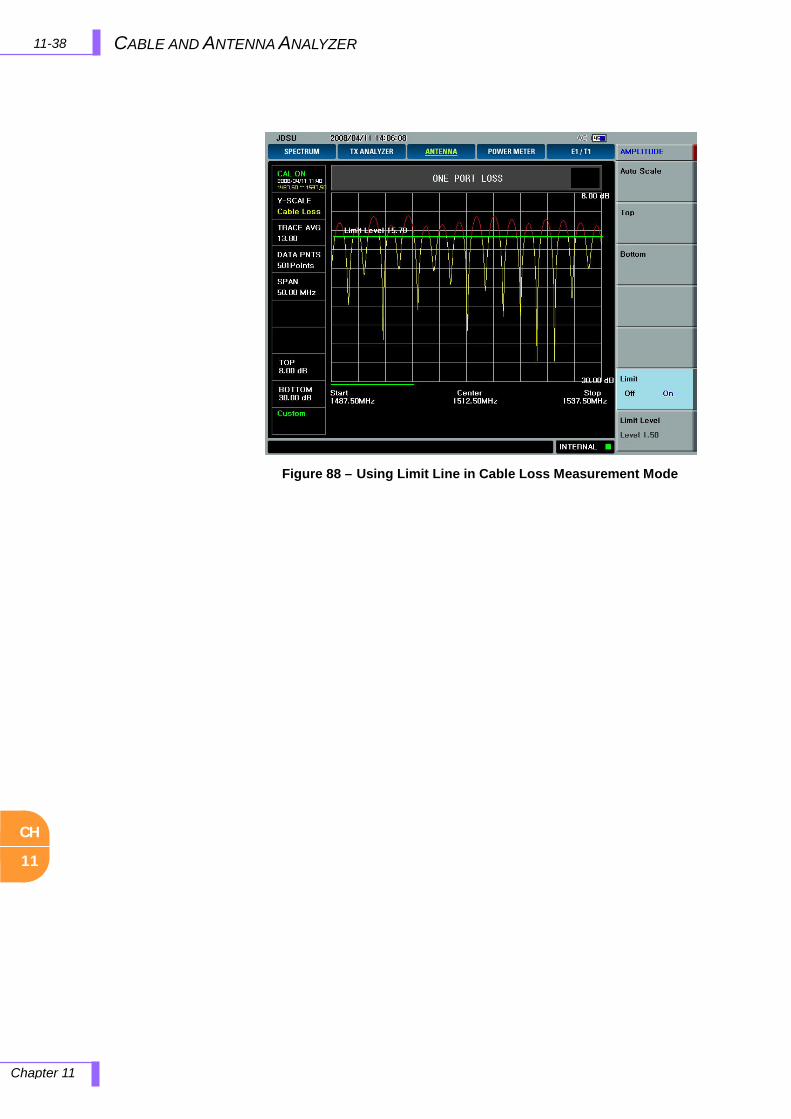
CH
11
11-38 CABLE AND ANTENNA ANALYZER
Chapter 11
Figure 88 – Using Limit Line in Cable Loss Measurement Mode
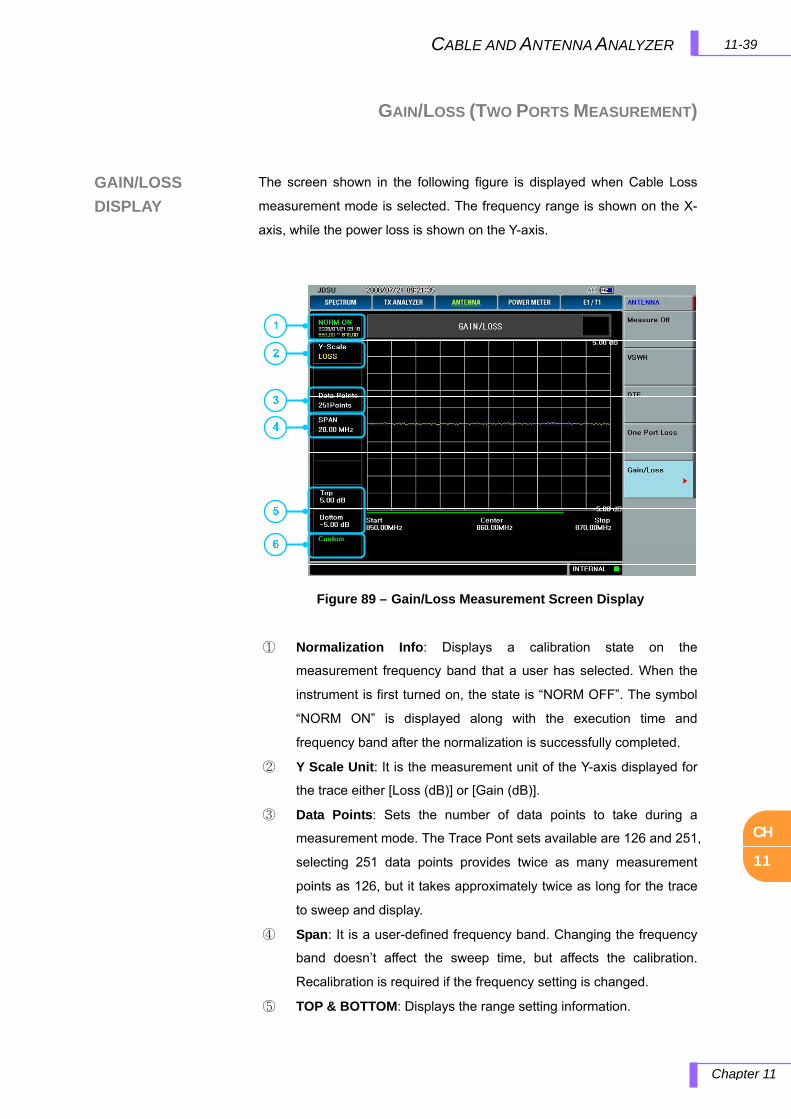
CH
11
11-39CABLE AND ANTENNA ANALYZER
Chapter 11
GAIN/LOSS
DISPLAY
GAIN/LOSS (TWO PORTS MEASUREMENT)
Gain/Loss Display
The screen shown in the following figure is displayed when Cable Loss
measurement mode is selected. The frequency range is shown on the X-
axis, while the power loss is shown on the Y-axis.
① Normalization Info: Displays a calibration state on the
measurement frequency band that a user has selected. When the
instrument is first turned on, the state is “NORM OFF”. The symbol
“NORM ON” is displayed along with the execution time and
frequency band after the normalization is successfully completed.
② Y Scale Unit: It is the measurement unit of the Y-axis displayed for
the trace either [Loss (dB)] or [Gain (dB)].
③ Data Points: Sets the number of data points to take during a
measurement mode. The Trace Pont sets available are 126 and 251,
selecting 251 data points provides twice as many measurement
points as 126, but it takes approximately twice as long for the trace
to sweep and display.
④ Span: It is a user-defined frequency band. Changing the frequency
band doesn’t affect the sweep time, but affects the calibration.
Recalibration is required if the frequency setting is changed.
⑤ TOP & BOTTOM: Displays the range setting information.
Figure 89 – Gain/Loss Measurement Screen Display
CH
11
11-40 CABLE AND ANTENNA ANALYZER
Chapter 11
⑥ Cable Info: The name of user selected cable is displayed on the
screen. A cable name is displayed if the cable is selected from a
Cable List stored in the instrument. If the user sets the Velocity and
Cable Loss manually, the band name will show “CUSTOM”.

CH
11
11-41 CABLE AND ANTENNA ANALYZER
Chapter 11
SETTING FREQUENCY
The user must set the frequency band to make a Gain/ Loss measurement.
Frequencies can be set manually or chosen from a band list registered in
the instrument.
Table 78 – Frequency Setting Procedure
Changing the frequency settings or Gain/Loss measurement will
automatically turn normalization OFF with the symbol “NORM
OFF” to be displayed on the screen along with an alarm sound. In this
case, recalibrate the instrument with the test cable.
Action Note
Setting Center Freq and Span
1. Press the FREQ/CHAN screen menu. Multi Key
2. Select the Center screen menu. Current setting is displayed as default on the screen
3. Enter a center frequency value.
4. Press the ENTER key.
5. Select the Span screen menu.
6. Enter a span value.
7. Press the ENTER key.
Setting Start/Stop Frequency
8. Press the FREQ/CHAN key. Current setting is cleared when a new value is
entered.
Press the ESC key to delete a number displayed on
the pop-up window one by one
Pressing the ESC repeatedly will cancel the input
mode
Input unit is MHz and minimum input step is 0.01MHz
9. Select the Start screen menu
10. Enter a start frequency value.
11. Press the ENTER key.
12. Select the Stop screen menu
13. Enter a stop frequency value.
14. Press the ENTER key.
Selection from the band list registered in the instrument
1. Press the FREQ/CHAN key.
Press Up/Down arrow key or rotate the knob to select a
band from the list
Select the Page Up/Page Down screen menu for
searching the band that doesn’t show up on the current
page.
2. Select the Band screen menu.
3. Select the band from the and then press the
Enter key
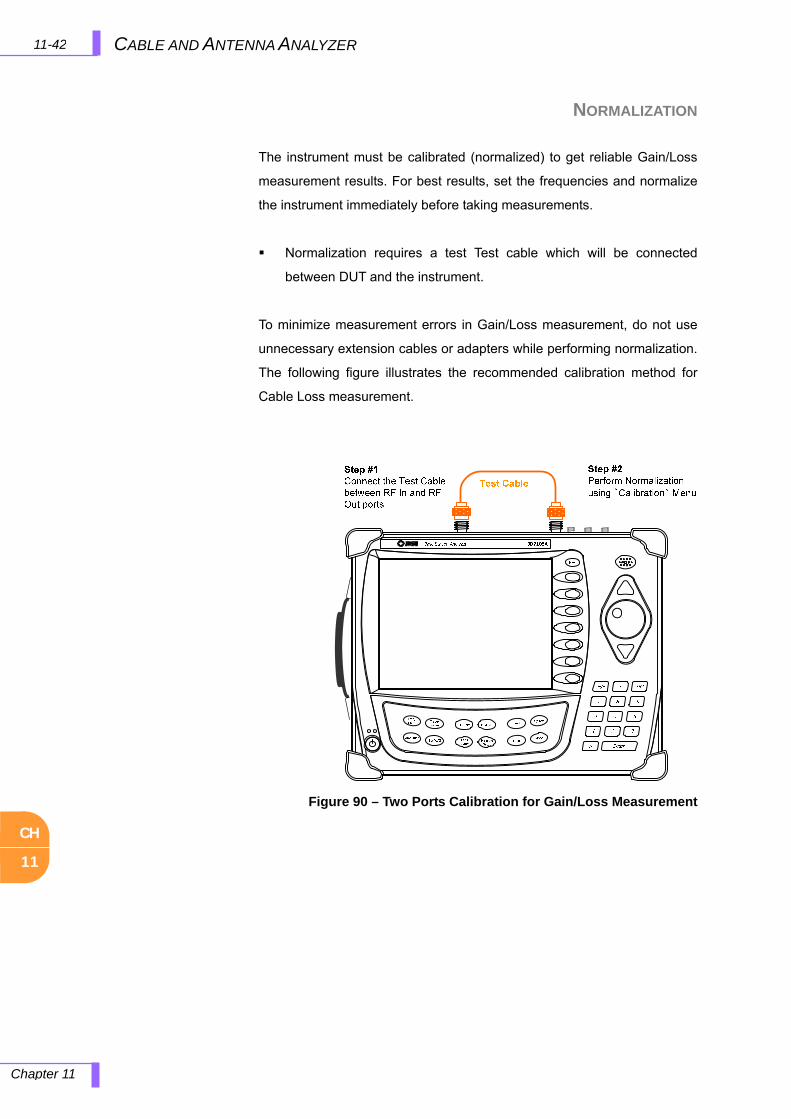
CH
11
11-42 CABLE AND ANTENNA ANALYZER
Chapter 11
NORMALIZATION
The instrument must be calibrated (normalized) to get reliable Gain/Loss
measurement results. For best results, set the frequencies and normalize
the instrument immediately before taking measurements.
Normalization requires a test Test cable which will be connected
between DUT and the instrument.
To minimize measurement errors in Gain/Loss measurement, do not use
unnecessary extension cables or adapters while performing normalization.
The following figure illustrates the recommended calibration method for
Cable Loss measurement.
Figure 90 – Two Ports Calibration for Gain/Loss Measurement
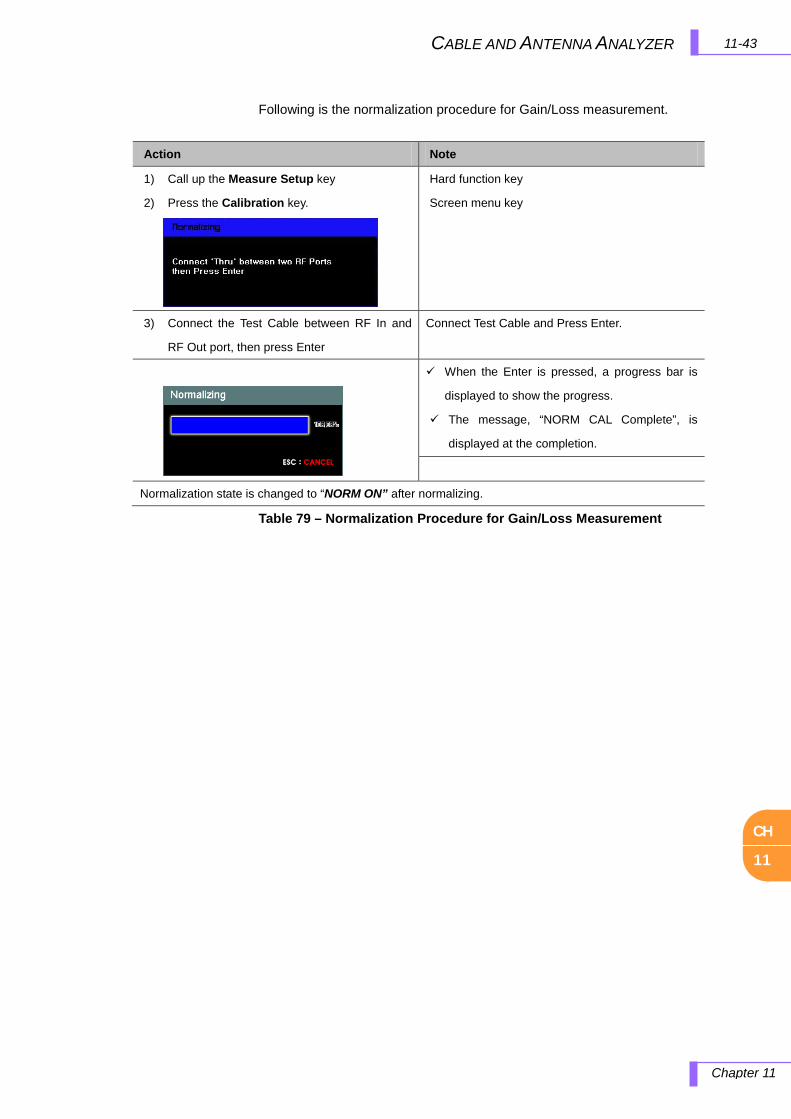
CH
11
11-43 CABLE AND ANTENNA ANALYZER
Chapter 11
Following is the normalization procedure for Gain/Loss measurement.
Table 79 – Normalization Procedure for Gain/Loss Measurement
Action Note
1) Call up the Measure Setup key
2) Press the Calibration key.
Hard function key
Screen menu key
3) Connect the Test Cable between RF In and
RF Out port, then press Enter
Connect Test Cable and Press Enter.
When the Enter is pressed, a progress bar is
displayed to show the progress.
The message, “NORM CAL Complete”, is
displayed at the completion.
Normalization state is changed to “NORM ON” after normalizing.
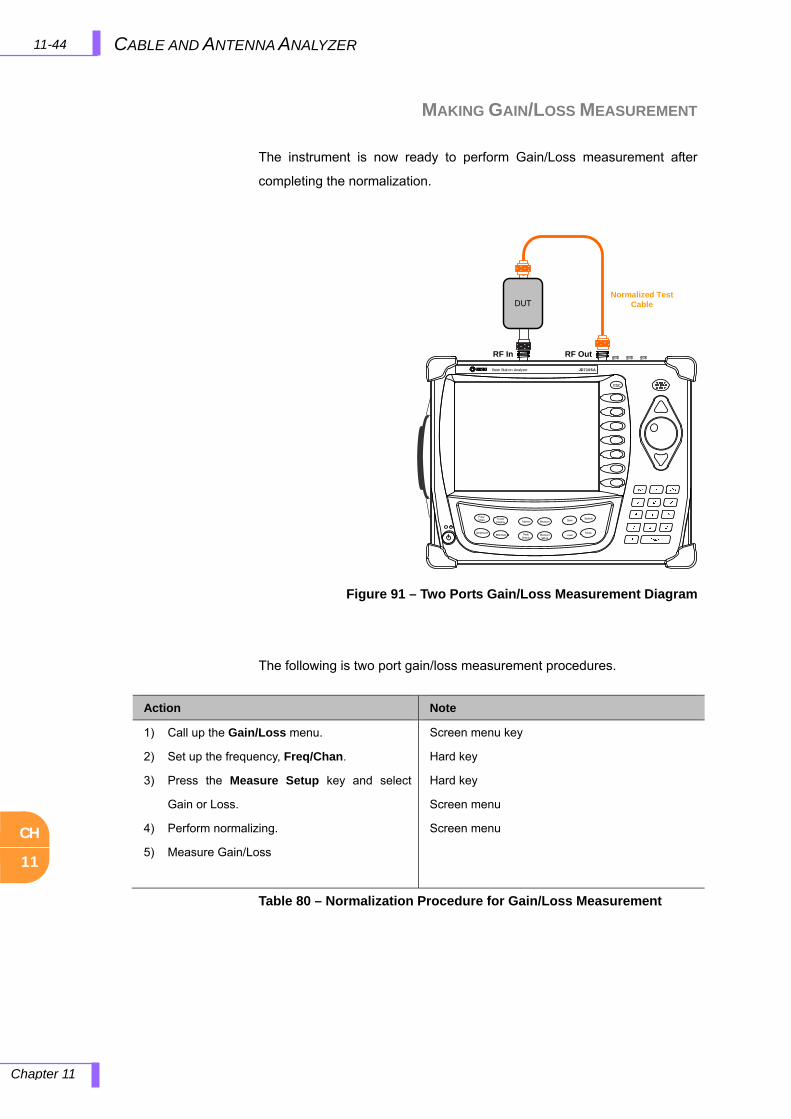
CH
11
11-44 CABLE AND ANTENNA ANALYZER
Chapter 11
MAKING GAIN/LOSS MEASUREMENT
The instrument is now ready to perform Gain/Loss measurement after
completing the normalization.
The following is two port gain/loss measurement procedures.
Table 80 – Normalization Procedure for Gain/Loss Measurement
Normalized Test CableDUT
ESC
Freq/Chan Trace/
Display Marker Measure
AmplitudeBW/AVG Peak
SearchMeasureSetup
Save
Load
System
Mode
Base Station Analyzer JD7105A
RF In RF Out
Figure 91 – Two Ports Gain/Loss Measurement Diagram
Action Note
1) Call up the Gain/Loss menu.
2) Set up the frequency, Freq/Chan.
3) Press the Measure Setup key and select
Gain or Loss.
4) Perform normalizing.
5) Measure Gain/Loss
Screen menu key
Hard key
Hard key
Screen menu
Screen menu
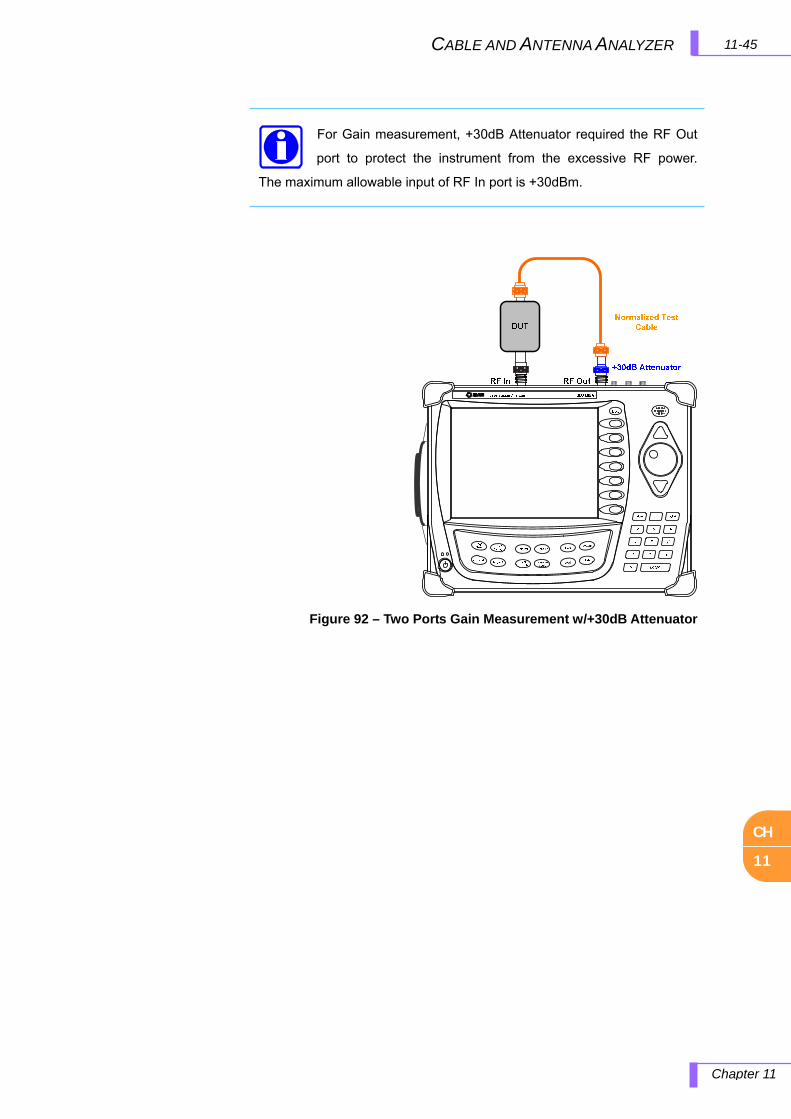
CH
11
11-45CABLE AND ANTENNA ANALYZER
Chapter 11
For Gain measurement, +30dB Attenuator required the RF Out
port to protect the instrument from the excessive RF power.
The maximum allowable input of RF In port is +30dBm.
Figure 92 – Two Ports Gain Measurement w/+30dB Attenuator
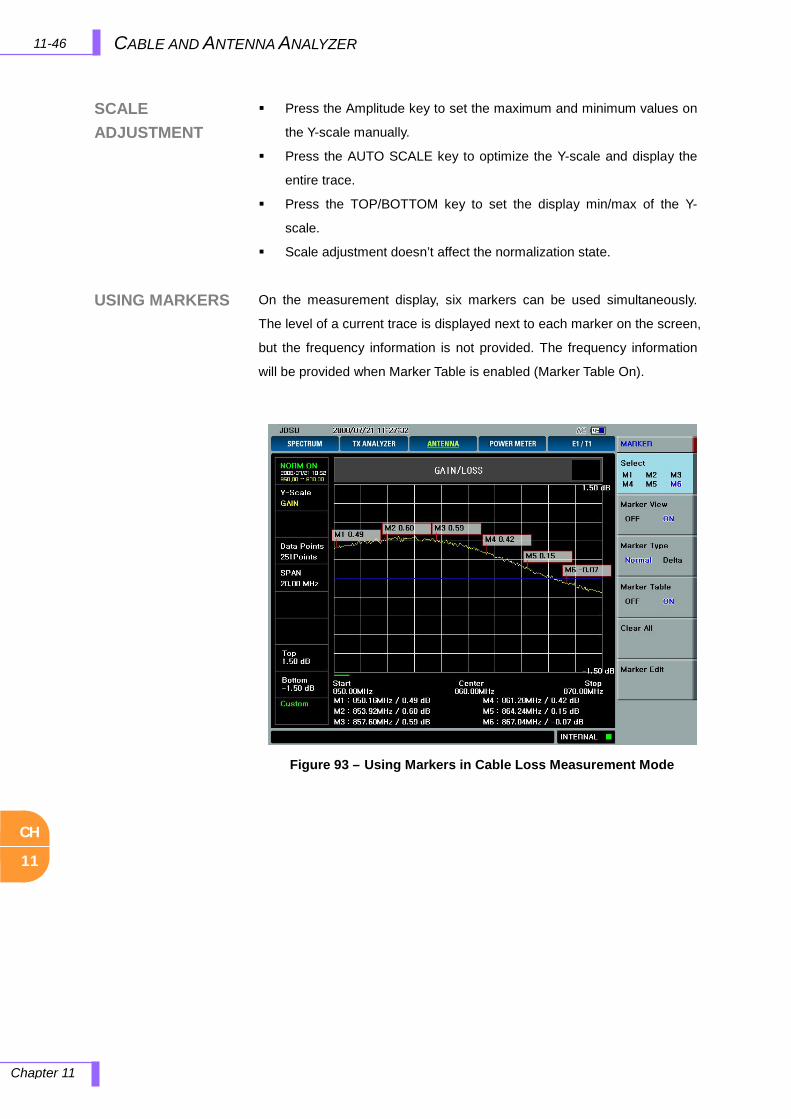
CH
11
11-46 CABLE AND ANTENNA ANALYZER
Chapter 11
SCALE ADJUSTMENT
USING MARKERS
Press the Amplitude key to set the maximum and minimum values on
the Y-scale manually.
Press the AUTO SCALE key to optimize the Y-scale and display the
entire trace.
Press the TOP/BOTTOM key to set the display min/max of the Y-
scale.
Scale adjustment doesn’t affect the normalization state.
On the measurement display, six markers can be used simultaneously.
The level of a current trace is displayed next to each marker on the screen,
but the frequency information is not provided. The frequency information
will be provided when Marker Table is enabled (Marker Table On).
Figure 93 – Using Markers in Cable Loss Measurement Mode

CH
11
11-47 CABLE AND ANTENNA ANALYZER
Chapter 11
USING LIMIT LINE
By setting a limit line, users can easily check if a measurement exceeds a
specified limit. It appears as a horizontal line at the value set. An alarm
sounds when a trace exceeds the limit line and the exceeded portion is
displayed in red color.
Figure 94 – Using Limit Line in Cable Loss Measurement Mode
12-1 POWER METER
Chapter 12
CH
12
12.0 POWER METER
In this chapter
Power Meter Introduction............................................................................................................................ 12-2 Using RF Power Meter ............................................................................................................................... 12-3 How to Use Keys ........................................................................................................................................ 12-4
Freq/Chan ........................................................................................................................................... 12-4 Display Overview ................................................................................................................................ 12-5 Cable Connection ............................................................................................................................... 12-6 Connecting Sensor ............................................................................................................................. 12-7 Measurement Procedure (internal) ..................................................................................................... 12-9
Making Power Measurement ...................................................................................................................... 12-9 Measurement Procedure (using external power sensors) ................................................................ 12-10 Measurement Results ........................................................................................................................ 12-11
12-2 POWER METER
Chapter 12
CH
12
POWER METER INTRODUCTION
The RF power measurement function of the JD7105A measures a wider
frequency range (up to 30MHz) compared to the Channel Power
Measurement. Its main application is the output measurement of an
integrated repeater.
The RF power meter of the JD7105A does not adopt conventional power
measurement techniques used on separate Power Sensors. Rather it
uses the band power measurement style based on spectrum
measurement results. Like general spectrum analyzer, measurement
accuracy may be degraded if the span is set too wide, since it limits the
display points within the measurement band. To prevent this, the JD7105A
measures RMS power from the raw data received from FFT in the defined
span, which results in an accurate power measurement independent of the
span setting, even without using a separate power sensor.
Also the JD7105A provides a logging function for measured power on the
screen to track variations. This function provides an accurate estimation of
BTS in operation where the output may continuously fluctuate.
12-3 POWER METER
Chapter 12
CH
12
USING RF POWER METER
The Power Meter measures the transmission power of the system. For
radio output power measurements it is required the use of optional
external power sensors. Two kinds of power sensors are available,
directional and terminating; their application depends on the type of power
measurement to be performed, in-service (directional) or out-of-service
(terminating).
12-4 POWER METER
Chapter 12
CH
12
FREQ/CHAN
HOW TO USE KEYS
This section describes the use of the keys in Power Meter mode. All
hard keys except Measure, Save, Load, System, Mode will be deactivated.
Menus for setting required parameters will be provided in Screen menu.
The following describes how to use screen menu keys in Cable and
Antenna Analyzer mode.
Freq/Chan
FREQUENCY: Sets the Frequency to be measured. Values can be
entered with the Data Entry key
CENTER FREQUENCY: Changes the center frequency.
SPAN: Sets the frequency range over which the instrument will
sweep.
START FREQUENCY: Changes the Start frequency
STOP FREQUENCY: Changes the Stop frequency.
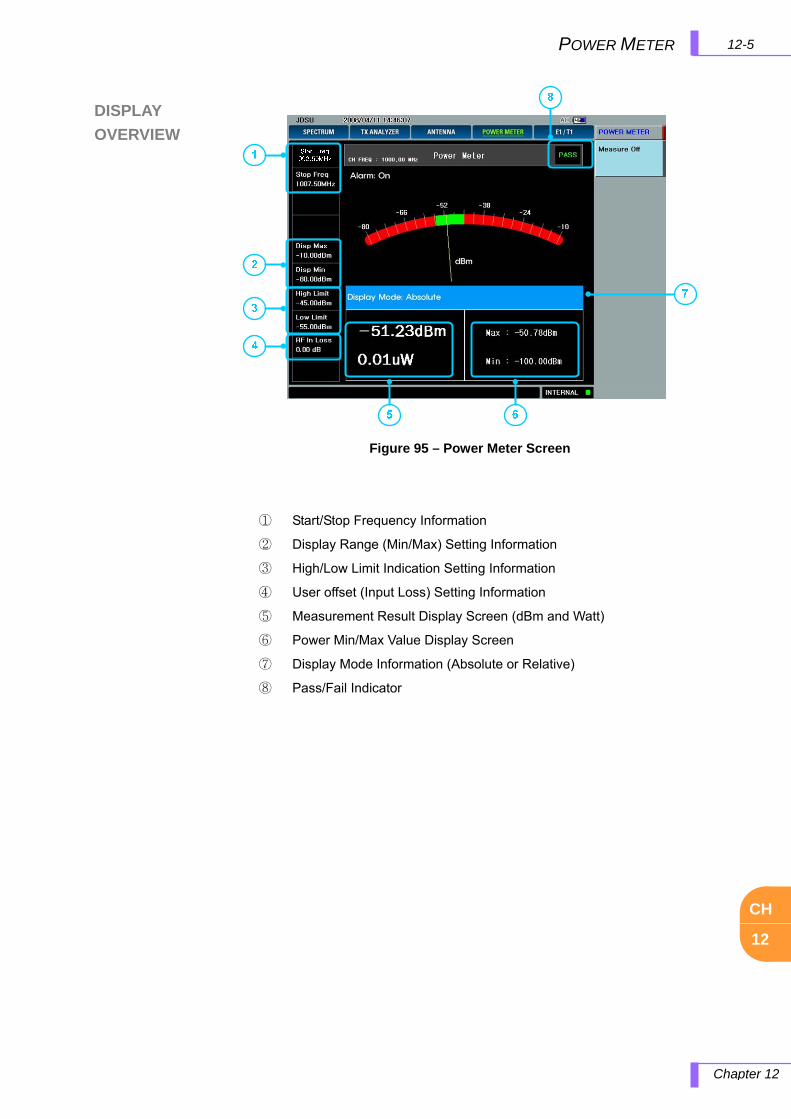
12-5POWER METER
Chapter 12
CH
12
DISPLAY
OVERVIEW
① Start/Stop Frequency Information
② Display Range (Min/Max) Setting Information
③ High/Low Limit Indication Setting Information
④ User offset (Input Loss) Setting Information
⑤ Measurement Result Display Screen (dBm and Watt)
⑥ Power Min/Max Value Display Screen
⑦ Display Mode Information (Absolute or Relative)
⑧ Pass/Fail Indicator
Figure 95 – Power Meter Screen
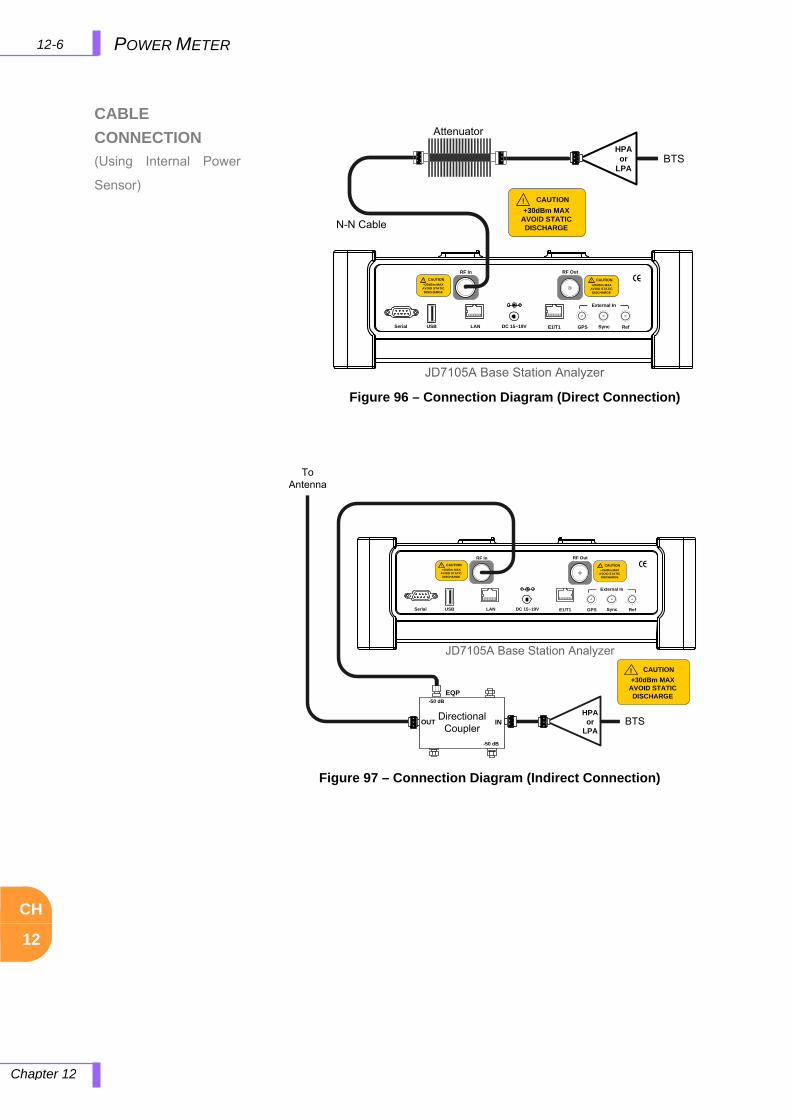
12-6 POWER METER
Chapter 12
CH
12
CABLE
CONNECTION
(Using Internal Power
Sensor)
RF In
! CAUTION+30dBm MAX
AVOID STATIC DISCHARGE
Sync RefDC 15~19VLANUSBSerial GPS
RF Out
E1/T1
! CAUTION+25dBm MAX
AVOID STATIC DISCHARGE
External In
JD7105A Base Station Analyzer
N-N Cable
! CAUTION
+30dBm MAXAVOID STATIC DISCHARGE
BTSHPA or
LPA
Attenuator
Figure 96 – Connection Diagram (Direct Connection)
JD7105A Base Station Analyzer
RF In
! CAUTION+30dBm MAX
AVOID STATIC DISCHARGE
Sync RefDC 15~19VLANUSBSerial GPS
RF Out
E1/T1
! CAUTION+25dBm MAX
AVOID STATIC DISCHARGE
External In
To Antenna
DirectionalCoupler
EQP-50 dB
-50 dB
OUT IN BTSHPA
or LPA
! CAUTION
+30dBm MAXAVOID STATIC DISCHARGE
Figure 97 – Connection Diagram (Indirect Connection)

12-7 POWER METER
Chapter 12
CH
12
CONNECTING SENSOR (Using Optional Power
Sensor)
Measuring transmission power of the system can be done either directly
from the instrument or with optional external power sensors. There are two
kinds of power sensors, directional or terminating power sensors, their
application depend on the type of transmission power signal to be
measured.
Table 81 – Types of Power Sensors
Part No Description Frequency Range Power Range
JD731A Directional Power Sensor 300 ~ 3800MHz
Average: +21.76 ~ +51.76dBm
(0.15 ~ 150W)
Peak: +36.02 ~ +56.02dBm
(4 ~ 400W)
JD732A Terminating Power Sensor 20 ~ 3800MHz
Average: -30 ~ +20dBm
(1uW ~ 100mW)
JD733A Directional Power Sensor 150 ~ 3500MHz +24dBm ~ 43dBm (0.25W ~ 20W)
JD724A-
50551
Average Power Sensor
(Terminating type)
20 ~ 3000MHz 0 ~ -30dBm
JD724A-
50552
Peak Power Sensor
(Terminating type)
20 ~ 4000MHz 0 ~ -40dBm
From BTS USB
JD73
2A
RF In! CAUTION+30dBm MAX
AVOID STATIC DISCHARGE
Sync RefDC 15~19VLANUSBSerial GPS
RF Out
E1/T1
! CAUTION+25dBm MAX
AVOID STATIC DISCHARGE
External In
JD7105A Base Station Analyzer
Figure 98 – Power Sensor Connection (Terminating Type)
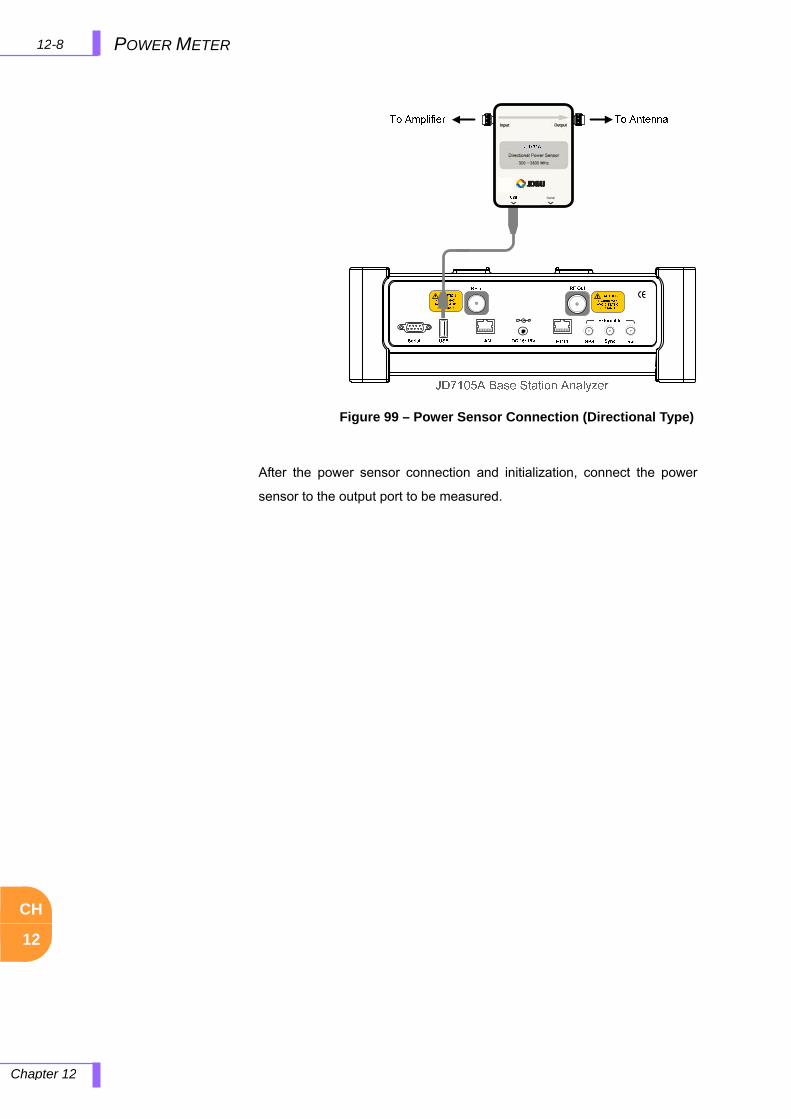
12-8 POWER METER
Chapter 12
CH
12
After the power sensor connection and initialization, connect the power
sensor to the output port to be measured.
Figure 99 – Power Sensor Connection (Directional Type)

12-9 POWER METER
Chapter 12
CH
12
Measurement Procedure (internal)
MAKING POWER MEASUREMENT
The following procedure is for the case using internal power meter, without
external power sensors.
Table 82 – Power Measurement Procedure w/ Internal Power Meter
Menu Description
Connect RF In port of the JD7105A to the RF Output port of BTS.
RF In! CAUTION+30dBm MAX
AVOID STATIC DISCHARGE
Sync RefDC 15~19VLANUSBSerial GPS
RF Out
E1/T1
! CAUTION+25dBm MAX
AVOID STATIC DISCHARGE
External In
GC7105A Base Station Analyzer
N-N Cable
! CAUTION+30dBm MAX
AVOID STATIC DISCHARGE
BTSHPA
or LPA
Attenuator
GC7105A Base Station Analyzer
RF In! CAUTION+30dBm MAX
AVOID STATIC DISCHARGE
Sync RefDC 15~19VLANUSBSerial GPS
RF Out
E1/T1
! CAUTION+25dBm MAX
AVOID STATIC DISCHARGE
External In
To Antenna
DirectionalCoupler
EQP-50 dB
-50 dB
OUT IN BTSHPA or
LPA
! CAUTION+30dBm MAX
AVOID STATIC DISCHARGE
[Mode]
[Power Meter] / Internal
Selects Power Meter Mode
Selects Internal Power Measurement
[Measure Setup]
[Frequency]
Center Freq
Span]
Start Freq
Stop Freq
Sets Frequency to be measured
Sets Center Frequency
Sets Span
Sets Start Frequency
Sets Stop Frequency
[Display Setup]
[Display] Abs/Rel
[Set Ref]
[Display Max]
[Display Min]
[External Offset]
[Limit Setup] On/Off
[Low Limit]
[High Limit]
[Reset]
Measurement Display Setting
Display method setting
Set current value as reference
Display range
Display range
External offset
Measurement Setting
High/Low Limit Setting
Reset the power meter measurement
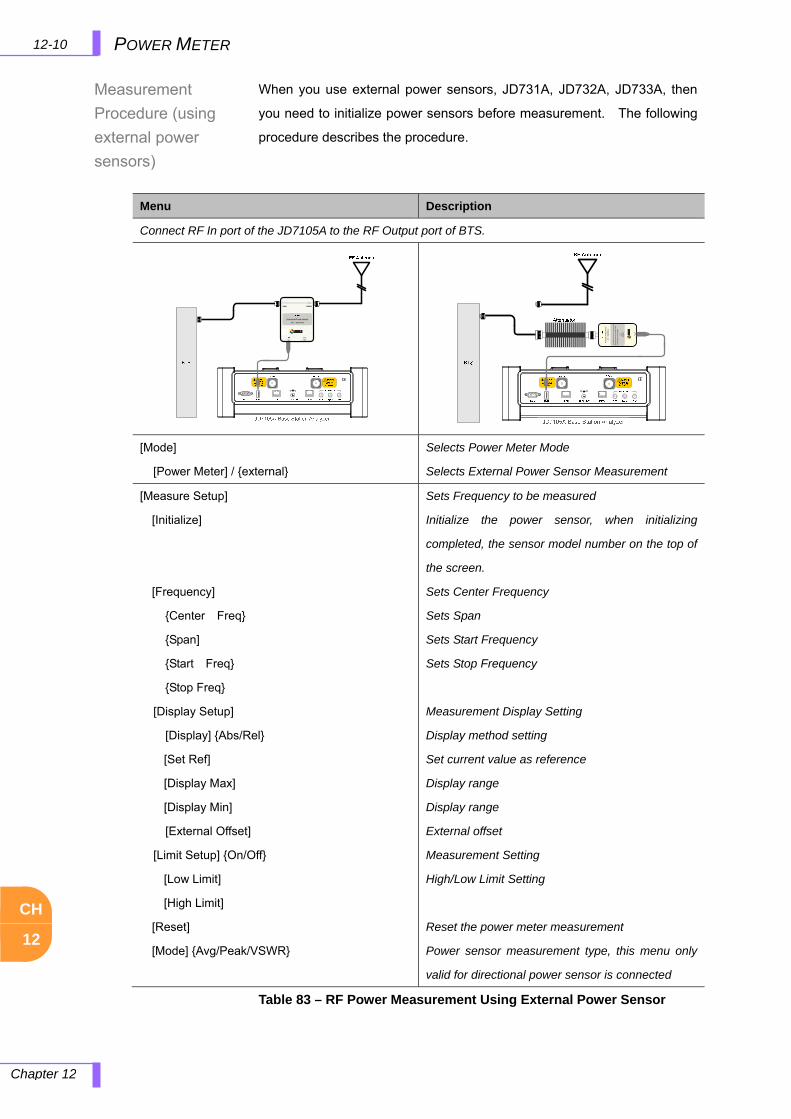
12-10 POWER METER
Chapter 12
CH
12
Measurement
Procedure (using
external power
sensors)
When you use external power sensors, JD731A, JD732A, JD733A, then
you need to initialize power sensors before measurement. The following
procedure describes the procedure.
Table 83 – RF Power Measurement Using External Power Sensor
Menu Description
Connect RF In port of the JD7105A to the RF Output port of BTS.
[Mode]
[Power Meter] / external
Selects Power Meter Mode
Selects External Power Sensor Measurement
[Measure Setup]
[Initialize]
[Frequency]
Center Freq
Span]
Start Freq
Stop Freq
Sets Frequency to be measured
Initialize the power sensor, when initializing
completed, the sensor model number on the top of
the screen.
Sets Center Frequency
Sets Span
Sets Start Frequency
Sets Stop Frequency
[Display Setup]
[Display] Abs/Rel
[Set Ref]
[Display Max]
[Display Min]
[External Offset]
[Limit Setup] On/Off
[Low Limit]
[High Limit]
[Reset]
[Mode] Avg/Peak/VSWR
Measurement Display Setting
Display method setting
Set current value as reference
Display range
Display range
External offset
Measurement Setting
High/Low Limit Setting
Reset the power meter measurement
Power sensor measurement type, this menu only
valid for directional power sensor is connected
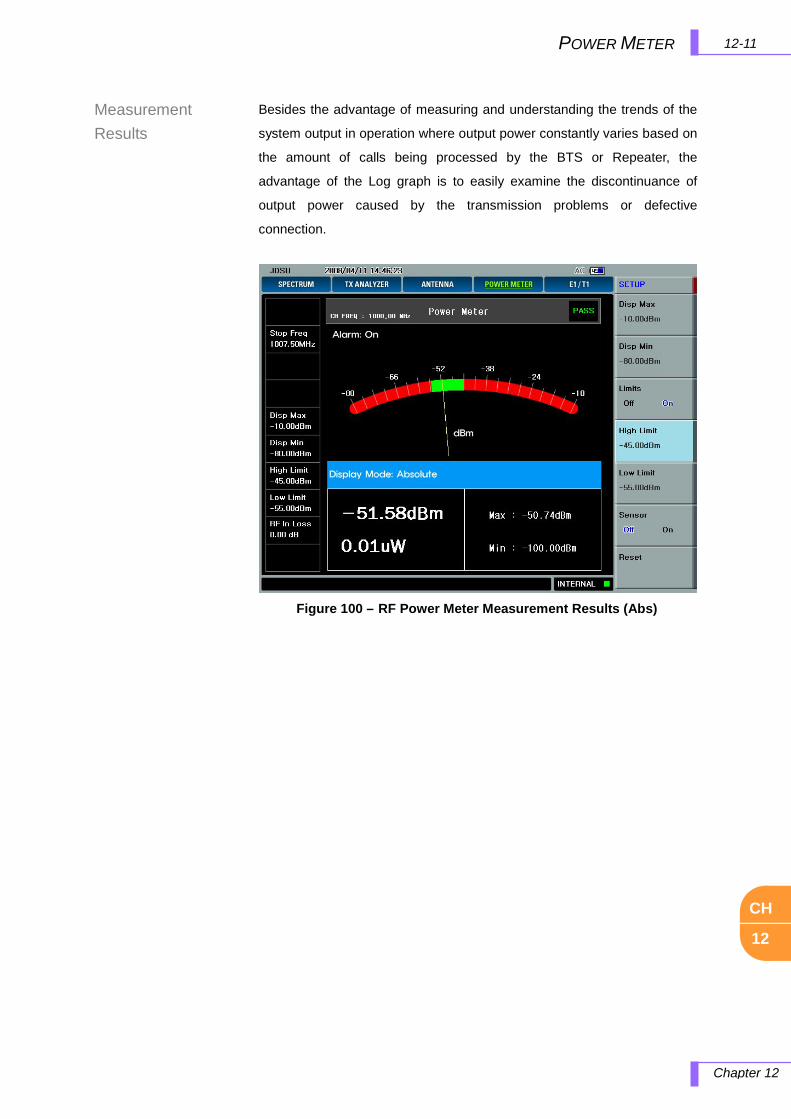
12-11 POWER METER
Chapter 12
CH
12
Measurement Results
Besides the advantage of measuring and understanding the trends of the
system output in operation where output power constantly varies based on
the amount of calls being processed by the BTS or Repeater, the
advantage of the Log graph is to easily examine the discontinuance of
output power caused by the transmission problems or defective
connection.
Figure 100 – RF Power Meter Measurement Results (Abs)
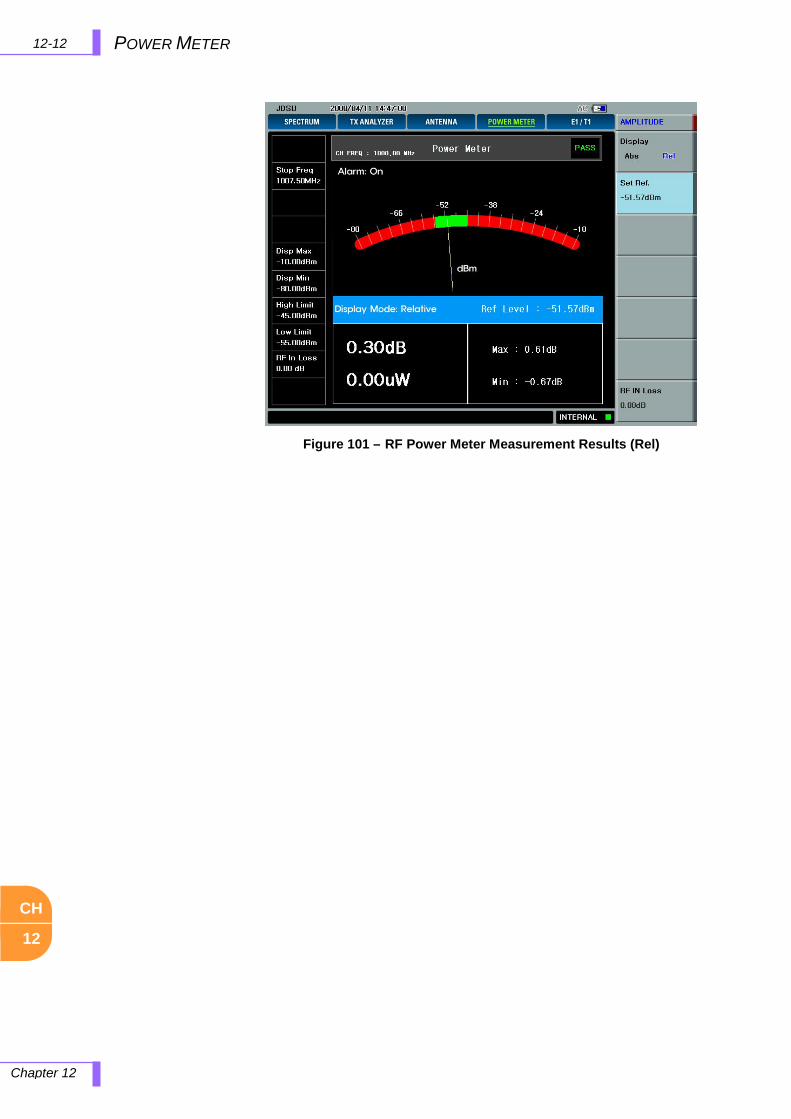
12-12 POWER METER
Chapter 12
CH
12
Figure 101 – RF Power Meter Measurement Results (Rel)
13-1 E1 ANALYZER
Chapter 13
CH
13
13.0 E1 ANALYZER
In this chapter
E1 Introduction ........................................................................................................................................... 13-2
E1 Standard ........................................................................................................................................ 13-3 G.703/G.704 Framing .......................................................................................................................... 13-3 E1 Frame Structure............................................................................................................................. 13-4 E1 vs. T1............................................................................................................................................. 13-4 E1 Pulse ............................................................................................................................................. 13-5 E1 Physicals ....................................................................................................................................... 13-6 Framing .............................................................................................................................................. 13-7 Line Code ........................................................................................................................................... 13-7 CRC-4 Error Detection ........................................................................................................................ 13-8 Alarms ................................................................................................................................................ 13-9
Using E1 Analyzer ..................................................................................................................................... 13-11 How to Use Keys ...................................................................................................................................... 13-12
Measure ............................................................................................................................................ 13-12 Measure Setup ................................................................................................................................. 13-12 Display Overview .............................................................................................................................. 13-14
Measurement Setup ................................................................................................................................. 13-15 Connection Diagram ......................................................................................................................... 13-16 Terminate Mode ................................................................................................................................ 13-17 Bridge Mode ..................................................................................................................................... 13-17 Monitor Mode .................................................................................................................................... 13-17 Loop Test .......................................................................................................................................... 13-17

13-2
Chapter 13
E1 ANALYZER
CH
13
E1 INTRODUCTION
The European Conference of Postal and Telecommunications
Administrations (CEPT) originally standardized the E-carrier system, which
revised and improved the earlier American T-carrier technology, and this
has now been adopted by the International Telecommunication Union
Telecommunication Standardization Sector (ITU-T).
The E-carrier standards form part of the Plesiochronous Digital Hierarchy
(PDH) where groups of E1 circuits may be bundled onto higher capacity
links between telephone exchanges or countries. This allows a network
operator to provide a private end-to-end E1 circuit between customers in
different countries that share single high capacity links in between.
Physically E1 is transmitted as 32 timeslots, but one is used for framing
and typically one allocated for signaling call setup and tear down. Unlike
Internet data services, E-carrier systems permanently allocate capacity for
a voice call for its entire duration. This ensures high call quality because
the transmission arrives with the same short delay (Latency) and capacity
at all times.

13-3 E1 ANALYZER
Chapter 13
CH
13
E1 STANDARD
G.703/G.704 FRAMING
The International CCITT framing format is adopted by most countries
(Europe, Central/South America, etc.). These facilities operate at 2.048
MBPS.
G.704: Synchronous Frame Structure
Used and Primary and Secondary
Hierarchical Levels
G.732: Characteristics of Primary PCM
Multiplex Equipment Operating at
2048 KBPS.
An E1 link operates over two separate sets of wires, usually twisted pair
cable. A nominal 2.4 Volt signal is encoded with pulses using a method
that avoids long periods without polarity changes. The line data rate is
2.048Mbit/s (full duplex, i.e. 2.048Mbit/s downstream and 2.048Mbit/s
upstream) which is split into 32 timeslots, each being allocated 8 bits in
turn. Thus each timeslot sends and receives an 8-bit sample 8000 times
per second (8x8000x32 = 2,048,000). This is ideal for voice telephone
calls where the voice is sampled into an 8 bit number at that data rate and
reconstructed at the other end.
One timeslot (TS1) is reserved for framing purposes, and alternately
transmits a fixed pattern. This allows the receiver to lock onto the start of
each frame and match up each channel in turn. The standards allow for a
full Cyclic Redundancy Check to be performed across all bits transmitted
in each frame, to detect if the circuit is losing bits (information), but this is
not always used.
One timeslot (TS16) is often reserved for signaling purposes, to control
call setup and teardown according to one of several standard
telecommunications protocols. This includes Channel Associated
Signaling (CAS) where a set of bits is used to replicate opening and
closing the circuit (as if picking up the telephone receiver and pulsing
digits on a rotary phone), or using tone signaling which is passed through
on the voice circuits themselves. More recent systems used Common
Channel Signaling (CCS) such as ISDN or Signaling System 7 (SS7)
which send short encoded messages with more information about the call
including caller ID, type of transmission required etc.
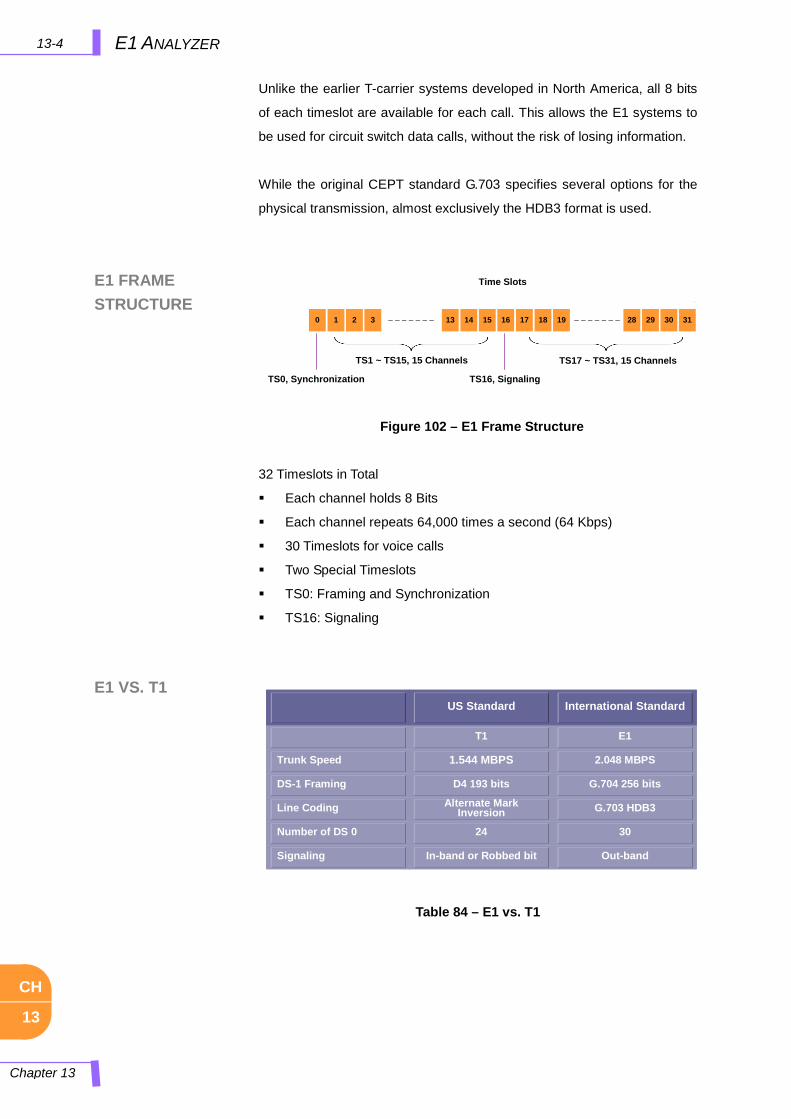
13-4
Chapter 13
E1 ANALYZER
CH
13
E1 FRAME STRUCTURE
E1 VS. T1
Unlike the earlier T-carrier systems developed in North America, all 8 bits
of each timeslot are available for each call. This allows the E1 systems to
be used for circuit switch data calls, without the risk of losing information.
While the original CEPT standard G.703 specifies several options for the
physical transmission, almost exclusively the HDB3 format is used.
32 Timeslots in Total
Each channel holds 8 Bits
Each channel repeats 64,000 times a second (64 Kbps)
30 Timeslots for voice calls
Two Special Timeslots
TS0: Framing and Synchronization
TS16: Signaling
Table 84 – E1 vs. T1
0
TS1 ~ TS15, 15 Channels
1 2 3 13 14 15 16 17 18 19 28 29 30 31
TS17 ~ TS31, 15 Channels
TS16, SignalingTS0, Synchronization
Time Slots
Figure 102 – E1 Frame Structure
US Standard International Standard
T1 E1
Trunk Speed 1.544 MBPS 2.048 MBPS
DS-1 Framing D4 193 bits G.704 256 bits
Line Coding Alternate Mark Inversion G.703 HDB3
Number of DS 0 24 30
Signaling In-band or Robbed bit Out-band
US Standard International Standard
T1 E1
Trunk Speed 1.544 MBPS 2.048 MBPS
DS-1 Framing D4 193 bits G.704 256 bits
Line Coding Alternate Mark Inversion G.703 HDB3
Number of DS 0 24 30
Signaling In-band or Robbed bit Out-band
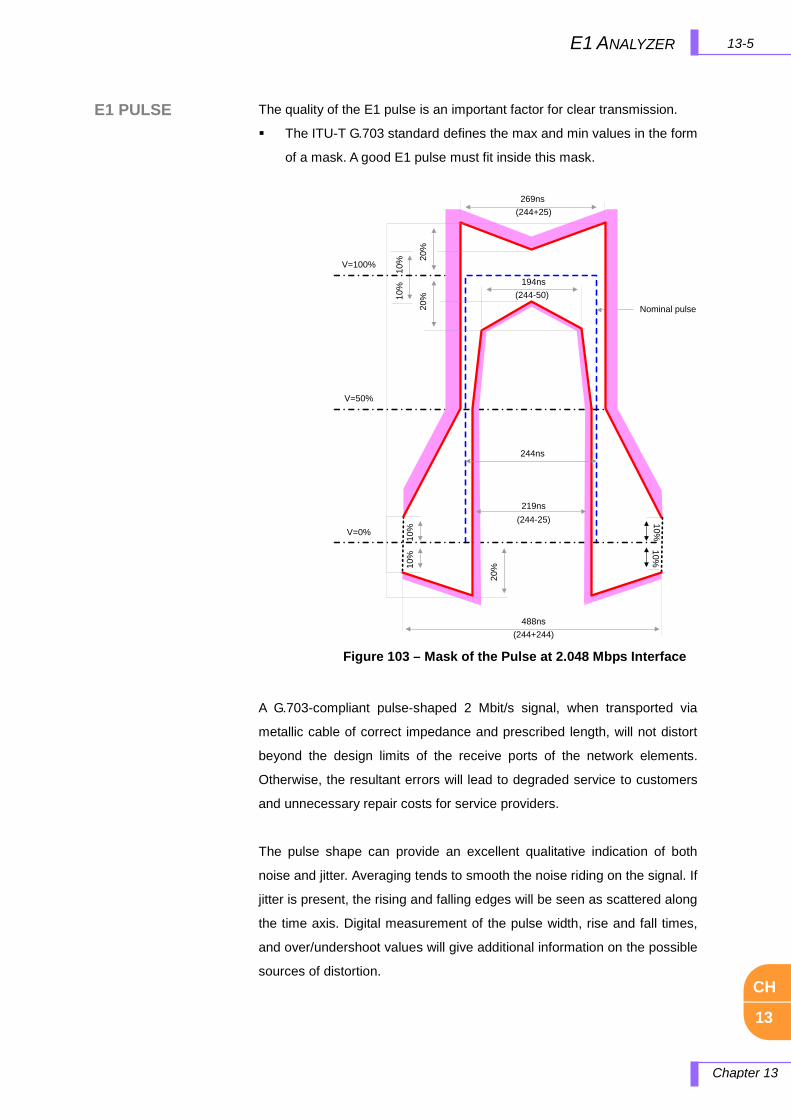
13-5 E1 ANALYZER
Chapter 13
CH
13
E1 PULSE
The quality of the E1 pulse is an important factor for clear transmission.
The ITU-T G.703 standard defines the max and min values in the form
of a mask. A good E1 pulse must fit inside this mask.
A G.703-compliant pulse-shaped 2 Mbit/s signal, when transported via
metallic cable of correct impedance and prescribed length, will not distort
beyond the design limits of the receive ports of the network elements.
Otherwise, the resultant errors will lead to degraded service to customers
and unnecessary repair costs for service providers.
The pulse shape can provide an excellent qualitative indication of both
noise and jitter. Averaging tends to smooth the noise riding on the signal. If
jitter is present, the rising and falling edges will be seen as scattered along
the time axis. Digital measurement of the pulse width, rise and fall times,
and over/undershoot values will give additional information on the possible
sources of distortion.
269ns(244+25)
194ns(244-50)
Nominal pulse
244ns
219ns(244-25)
488ns(244+244)
10%
10% 20
%20
%
V=100%
V=50%
V=0%
10%
10%
20%
10%10%
Figure 103 – Mask of the Pulse at 2.048 Mbps Interface
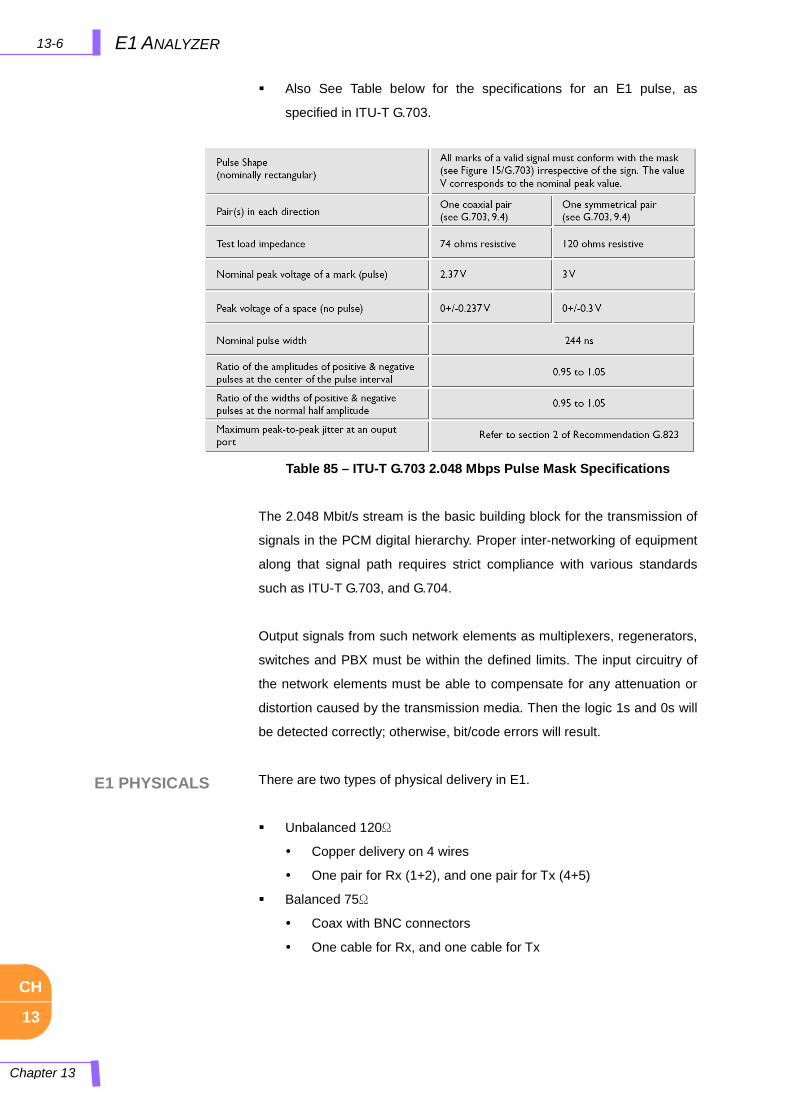
13-6
Chapter 13
E1 ANALYZER
CH
13
E1 PHYSICALS
Also See Table below for the specifications for an E1 pulse, as
specified in ITU-T G.703.
Table 85 – ITU-T G.703 2.048 Mbps Pulse Mask Specifications
The 2.048 Mbit/s stream is the basic building block for the transmission of
signals in the PCM digital hierarchy. Proper inter-networking of equipment
along that signal path requires strict compliance with various standards
such as ITU-T G.703, and G.704.
Output signals from such network elements as multiplexers, regenerators,
switches and PBX must be within the defined limits. The input circuitry of
the network elements must be able to compensate for any attenuation or
distortion caused by the transmission media. Then the logic 1s and 0s will
be detected correctly; otherwise, bit/code errors will result.
There are two types of physical delivery in E1.
Unbalanced 120Ω
Copper delivery on 4 wires
One pair for Rx (1+2), and one pair for Tx (4+5)
Balanced 75Ω
Coax with BNC connectors
One cable for Rx, and one cable for Tx
13-7 E1 ANALYZER
Chapter 13
CH
13
FRAMING
LINE CODE
Framing is necessary so any equipment receiving the E1 signal can
synchronize, identify, and extract the individual channels.
2M transmission utilizes two main types of framing:
Frame Alignment Signal (FAS)
Multi-Frame Alignment Signal (MFAS)
PCM-30 transmission systems use MFAS framing along with FAS
framing
In PCM-30 timeslots 1 through 15 correspond to channels 1
through 15, and timeslots 17 through 31 correspond to channels
16 through 30.
Timeslot 16 is used for the multi-frame alignment and Channel
Associated Signaling (CAS)
PCM-31 transmission systems use only FAS framing
In PCM-31 framing, timeslots 1 through 31 correspond to
channels 1 through 31.
Fractional E1 is not offered with unframed signals, because framing is
required to determine the location of timeslots.
Two types of line coding are used in a typical E1 2.048 Mbit/s network:
AMI and HDB3.
AMI line coding (Alternate Mark Inversion)
AMI is used to represent successive 1s’ values in a bitstream with
alternating positive and negative pulses to eliminate any DC offset. AMI is
not used in most 2.048 Mbit/s transmission because synchronization loss
may occur during long strings of zeros as there are no pulses.
HDB3 line coding (High Density Bipolar 3)
High Density Bipolar 3 (HDB3) line coding is used for transmission of 2
Mbps for two key reasons:
The HDB3 coded signal is DC-free. Therefore, the signal can be
transmitted through balanced transformers’ coupled circuits.
The clock recovery circuits of the receivers can operate well, even
though the data contains long strings of zeros.
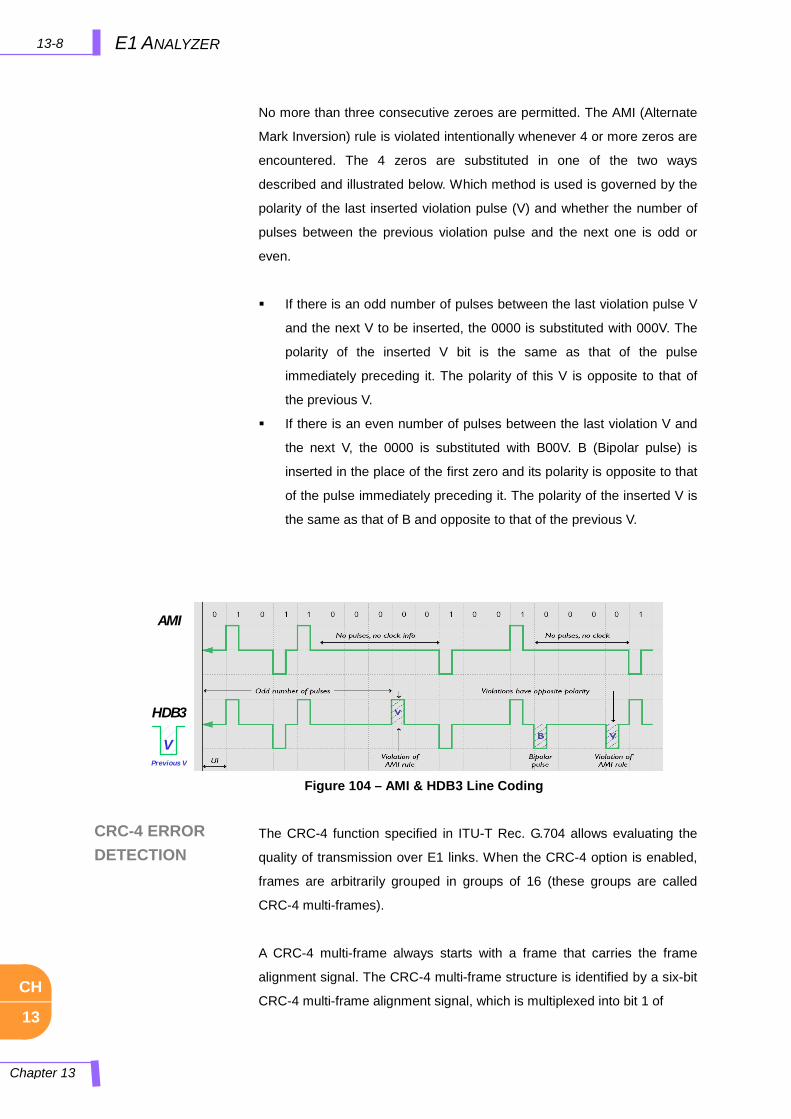
13-8
Chapter 13
E1 ANALYZER
CH
13
CRC-4 ERROR DETECTION
No more than three consecutive zeroes are permitted. The AMI (Alternate
Mark Inversion) rule is violated intentionally whenever 4 or more zeros are
encountered. The 4 zeros are substituted in one of the two ways
described and illustrated below. Which method is used is governed by the
polarity of the last inserted violation pulse (V) and whether the number of
pulses between the previous violation pulse and the next one is odd or
even.
If there is an odd number of pulses between the last violation pulse V
and the next V to be inserted, the 0000 is substituted with 000V. The
polarity of the inserted V bit is the same as that of the pulse
immediately preceding it. The polarity of this V is opposite to that of
the previous V.
If there is an even number of pulses between the last violation V and
the next V, the 0000 is substituted with B00V. B (Bipolar pulse) is
inserted in the place of the first zero and its polarity is opposite to that
of the pulse immediately preceding it. The polarity of the inserted V is
the same as that of B and opposite to that of the previous V.
The CRC-4 function specified in ITU-T Rec. G.704 allows evaluating the
quality of transmission over E1 links. When the CRC-4 option is enabled,
frames are arbitrarily grouped in groups of 16 (these groups are called
CRC-4 multi-frames).
A CRC-4 multi-frame always starts with a frame that carries the frame
alignment signal. The CRC-4 multi-frame structure is identified by a six-bit
CRC-4 multi-frame alignment signal, which is multiplexed into bit 1 of
AMI
HDB3
VPrevious V
Figure 104 – AMI & HDB3 Line Coding
13-9 E1 ANALYZER
Chapter 13
CH
13
ALARMS
timeslot 0 of each odd-numbered (1, 3, 5, etc.) frame of the CRC-4 multi-
frame, up to frame 11 of the multi-frame. Each CRC-4 multi-frame is
divided into two sub-multiframes of 8 frames (2048 bits) each.
The detection of errors is achieved by calculating a four-bit checksum on
each 2048-bit block (sub-multiframe). The four checksum bits calculated
on a given sub-multiframe are multiplexed, bit by bit, in bit 1 of timeslot 0
of each even-numbered frame of the next sub-multiframe.
At the receiving end, the checksum is calculated again on each sub-
multiframe and then compared against the original checksum (sent by the
transmitting end in the next sub-multiframe). The results are reported by
two bits multiplexed in bit 1 of timeslot 0 in frames 13, 15 of the CRC-4
multiframe, respectively. Errors are counted and used to prepare statistic
data on transmission performance.
E1 Signal LOS (Loss Of Signal)
The E1 Signal Loss alarm is defined as the absence of “marks” in the
incoming data – poor or no received signal level. When the E1 Signal LOS
is active, Frame Sync and Pattern Sync alarms may also be active. The
LOS condition occurs when no pulses have been detected on the line for
between 100 to 250 bit times. This is the highest state alarm where
nothing is detected on the line. The LOS may occur when a cable is not
plugged in or the far end equipment, which is the source of the signal, is
out of service.
Frame Sync
The Frame Sync alarm is declared when the LFA condition, also called an
out-of-frame (OOF) condition occur when there are errors in the incoming
framing pattern. The number of bit errors that provokes the condition
depends on the framing format.
Pattern Sync
The Loss of Pattern Sync alarm is specific to BER test equipment, and it
may only be observed on test equipment when performing out-of-service
testing. Pattern sync losses occur under conditions of significant bit errors,
and may be caused by poor received signal level due to faulty network
elements, or by one side bad of the connection pair, or line frequency
13-10
Chapter 13
E1 ANALYZER
CH
13
HDB3 (High Density Bipolar 3)
A HDB3 pulse pattern was detected on the incoming signal at the receive
port. Note that only certain patterns transmit HDB3 pulse patterns. The
pattern must contain at least 4 consecutive zeroes before a HDB3 pattern
is sent.
FAS RAI (Frame Alignment Signal)
Loss of frame alignment (also called loss of synchronization). This
condition is declared when too many errors are reported in the frame
alignment signal (FAS), e.g., when 3 or 4 FAS errors are detected in the
last 5 frames. Loss of frame alignment is cleared after no FAS errors are
detected in two consecutive frames.
AIS (Alarm Indication Signal)
The AIS signal is an unframed “all-ones” signal, and is used to maintain
line signal synchronization in case of loss of input signal, e.g., because an
alarm condition occurred in the equipment that supply the line signal. Note
that the equipment receiving an AIS signal loses frame synchronization.
CRC Error
A Cyclic Redundancy Check-4 (CRC-4) is often used in 2M transmission
to identify possible bit errors during in-service error monitoring.
CRC-4 is a checksum calculation which allows for the detection of
errors within the 2.048Mbit/s signal while it is in service. A discrepancy
indicates at least one bit error in the received signal.
CRC-4 error checking provides a most convenient method of identifying bit
errors within an in-service system, but provides only an approximate
measure of the circuit's true performance.

13-11 E1 ANALYZER
Chapter 13
CH
13
USING E1 ANALYZER
A portable test instrument, JD7105A, can be a useful tool to check the
overall health of the transmission system, and assist in locating the source
of problems or defects. At the physical layer, the parameters of interest are
bit rate (and its stability), jitter, wander, level, noise, code errors and pulse
shape distortion. A key test in this area is to verify that the signal pulse
shape conforms to the ITU-T G.703 recommendation.
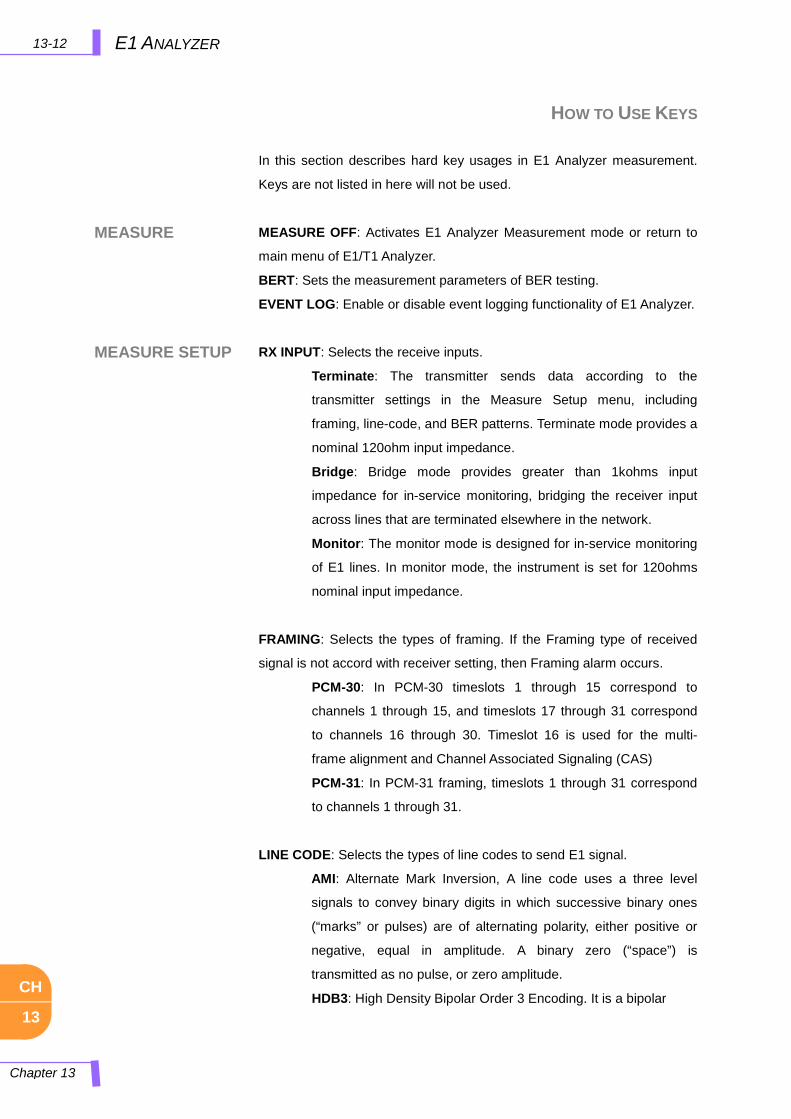
13-12
Chapter 13
E1 ANALYZER
CH
13
MEASURE
MEASURE SETUP
HOW TO USE KEYS
In this section describes hard key usages in E1 Analyzer measurement.
Keys are not listed in here will not be used.
Measure
MEASURE OFF: Activates E1 Analyzer Measurement mode or return to
main menu of E1/T1 Analyzer.
BERT: Sets the measurement parameters of BER testing.
EVENT LOG: Enable or disable event logging functionality of E1 Analyzer.
Measure Setup
RX INPUT: Selects the receive inputs.
Terminate: The transmitter sends data according to the
transmitter settings in the Measure Setup menu, including
framing, line-code, and BER patterns. Terminate mode provides a
nominal 120ohm input impedance.
Bridge: Bridge mode provides greater than 1kohms input
impedance for in-service monitoring, bridging the receiver input
across lines that are terminated elsewhere in the network.
Monitor: The monitor mode is designed for in-service monitoring
of E1 lines. In monitor mode, the instrument is set for 120ohms
nominal input impedance.
FRAMING: Selects the types of framing. If the Framing type of received
signal is not accord with receiver setting, then Framing alarm occurs.
PCM-30: In PCM-30 timeslots 1 through 15 correspond to
channels 1 through 15, and timeslots 17 through 31 correspond
to channels 16 through 30. Timeslot 16 is used for the multi-
frame alignment and Channel Associated Signaling (CAS)
PCM-31: In PCM-31 framing, timeslots 1 through 31 correspond
to channels 1 through 31.
LINE CODE: Selects the types of line codes to send E1 signal.
AMI: Alternate Mark Inversion, A line code uses a three level
signals to convey binary digits in which successive binary ones
(“marks” or pulses) are of alternating polarity, either positive or
negative, equal in amplitude. A binary zero (“space”) is
transmitted as no pulse, or zero amplitude.
HDB3: High Density Bipolar Order 3 Encoding. It is a bipolar
13-13 E1 ANALYZER
Chapter 13
CH
13
signaling technique (using both positive and negative pulses) based on
Alternate Mark Inversion (AMI). Extends AMI by inserting violation codes
whenever there is a run of 4 or more zeros.
PATTERN: Selects the types of patterns.
Off: No patterns are sent.
1-4: A four-bit pattern that contains a single one. Used to test
clock recovery.
1-8: An eight-bit pattern that contains a single one. Used to test
clock recovery.
All 1's: A pattern that causes line drivers to consume the
maximum power.
All 0's: A pattern that is often selected to verify HDB3
provisioning. Circuit will drop if optioned for AMI.
Alternate: A pattern that alternates between ones and zeroes.
CRC-4: Activate and Deactivate CRC-4. A method used to detect errors in
blocks of data transmitted across communication links. The detection is
determined by a formula applied at both the transmit and receive ends. E1
uses a 4 bit CRC (CRC-4) for error checking.
TX CLOCK: Selects the clock source to measure frequency and timing.
Int: Internal clock uses an internal oscillator, in case of external
reference is not available, the instrument does not transmit signal
to synchronized equipment, the instrument provides the clock to
the unit under test and most cases in Loopback test mode.
Rx: Transmit clock uses the frequency recovered from the
received signal (Network Loop), if accurate frequency
measurement is needed.
TX LBO (Transmit Line Build Out): Selects the line build out level.
Possible values for LBO are 0 dB, -6 dB.
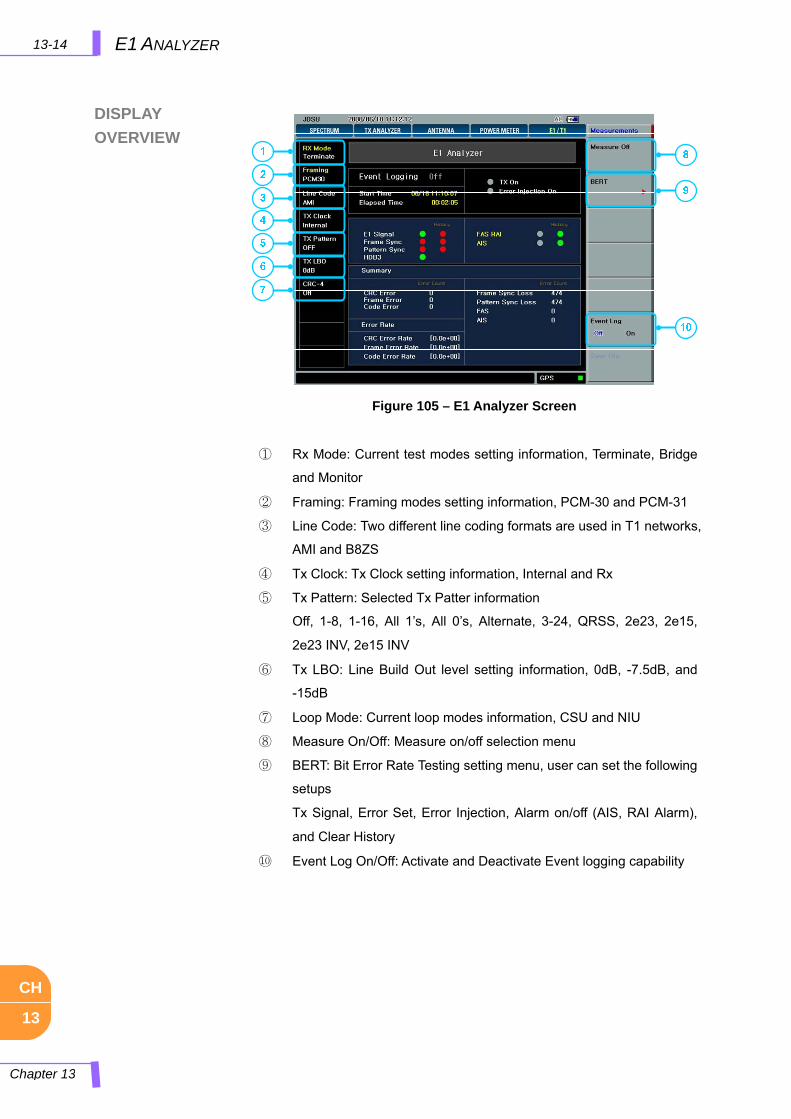
13-14
Chapter 13
E1 ANALYZER
CH
13
DISPLAY
OVERVIEW
① Rx Mode: Current test modes setting information, Terminate, Bridge
and Monitor
② Framing: Framing modes setting information, PCM-30 and PCM-31
③ Line Code: Two different line coding formats are used in T1 networks,
AMI and B8ZS
④ Tx Clock: Tx Clock setting information, Internal and Rx
⑤ Tx Pattern: Selected Tx Patter information
Off, 1-8, 1-16, All 1’s, All 0’s, Alternate, 3-24, QRSS, 2e23, 2e15,
2e23 INV, 2e15 INV
⑥ Tx LBO: Line Build Out level setting information, 0dB, -7.5dB, and
-15dB
⑦ Loop Mode: Current loop modes information, CSU and NIU
⑧ Measure On/Off: Measure on/off selection menu
⑨ BERT: Bit Error Rate Testing setting menu, user can set the following
setups
Tx Signal, Error Set, Error Injection, Alarm on/off (AIS, RAI Alarm),
and Clear History
⑩ Event Log On/Off: Activate and Deactivate Event logging capability
Figure 105 – E1 Analyzer Screen
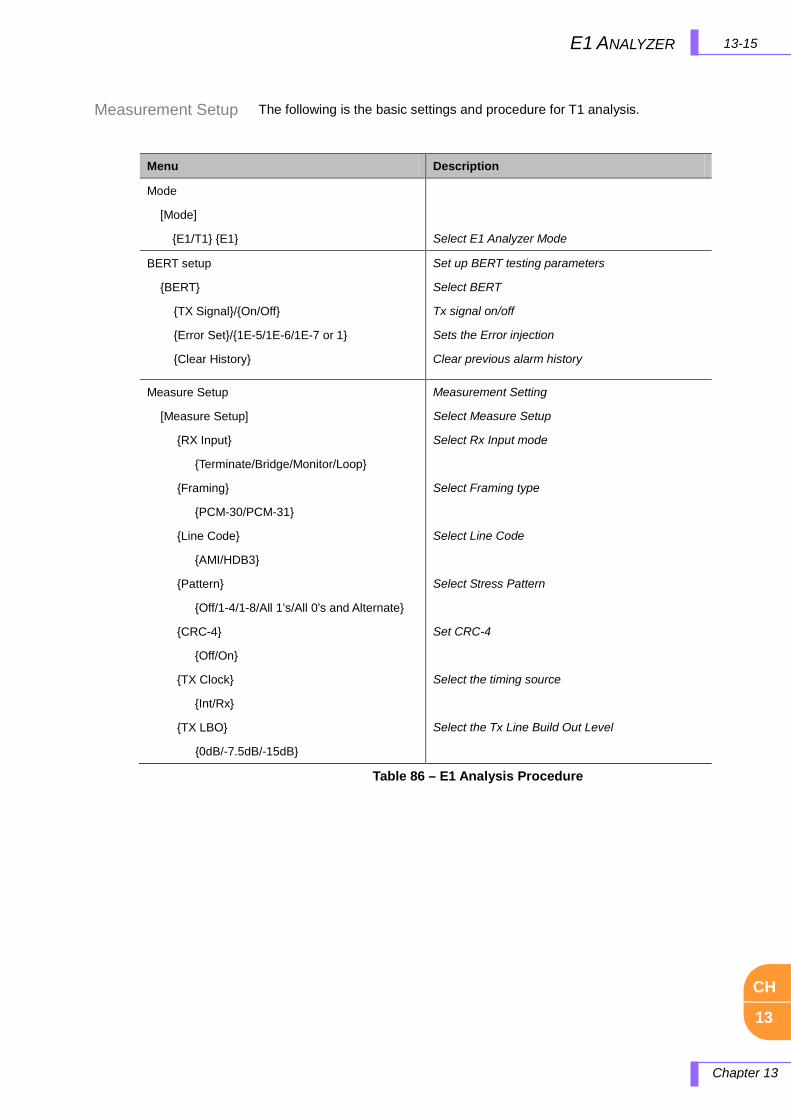
13-15 E1 ANALYZER
Chapter 13
CH
13
Measurement Setup
The following is the basic settings and procedure for T1 analysis.
Table 86 – E1 Analysis Procedure
Menu Description
Mode
[Mode]
E1/T1 E1
Select E1 Analyzer Mode
BERT setup
BERT
TX Signal/On/Off
Error Set/1E-5/1E-6/1E-7 or 1
Clear History
Set up BERT testing parameters
Select BERT
Tx signal on/off
Sets the Error injection
Clear previous alarm history
Measure Setup
[Measure Setup]
RX Input
Terminate/Bridge/Monitor/Loop
Framing
PCM-30/PCM-31
Line Code
AMI/HDB3
Pattern
Off/1-4/1-8/All 1’s/All 0’s and Alternate
CRC-4
Off/On
TX Clock
Int/Rx
TX LBO
0dB/-7.5dB/-15dB
Measurement Setting
Select Measure Setup
Select Rx Input mode
Select Framing type
Select Line Code
Select Stress Pattern
Set CRC-4
Select the timing source
Select the Tx Line Build Out Level
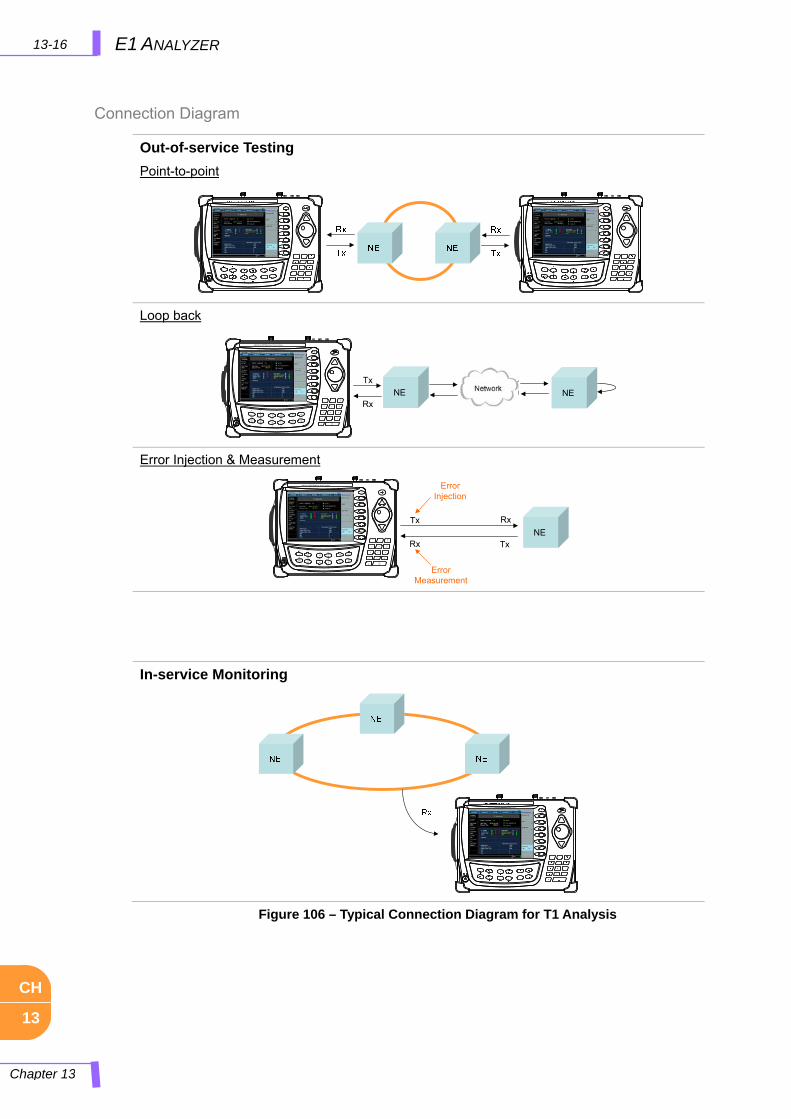
13-16
Chapter 13
E1 ANALYZER
CH
13
Connection Diagram
Figure 106 – Typical Connection Diagram for T1 Analysis
Out-of-service Testing
Point-to-point
Loop back
GenComm GC7105A Base Station Analyzer
ESC
+/-
. Del
7 8 9
4 5 6
1 2 3
0Enter
Freq/
Chan
Trace/Display
Marker
MeasureAm
plitude
BW/AVG
Peak Search
MeasureSetup
Save
Load
System
Mode
NE
Tx
RxNE
Error Injection & Measurement
GenComm GC7105A Base Station Analyzer
ESC
+/-
. Del
7 8 9
4 5 6
1 2 3
0Enter
Freq/
Chan
Trace/Display
Marker
MeasureAm
plitude
BW/AVG
Peak Search
MeasureSetup
Save
Load
System
Mode
NE
Tx
Rx
Rx
Tx
Error Injection
Error Measurement
In-service Monitoring
13-17 E1 ANALYZER
Chapter 13
CH
13
Terminate Mode
Bridge Mode
Monitor Mode
Loop Test
The Terminate mode is used when you wish to send and receive an E1
signal. The instrument terminates the received signal with a low
impedance termination, and requires that the circuit be disrupted for
testing.
The Bridge mode is similar to the Monitor mode. However, in the Bridge
mode, the instrument applies high impedance isolation resistors to the
circuit under test. This isolation circuitry will protect the signal from any
possible disruption. There is no need to plug into the TX jack of the test
set while in the BRIDGE mode, and there is no need to specify a test
pattern to be transmitted. However, the transmitter in the test set is
sending the selected test pattern, framing, coding, and CRC.
The Monitor (protected monitoring point) mode is used when a monitor
access is to be made. The network element has isolated the MON signal
from the live signal with high impedance resistors.
The Monitor mode is useful because it protects the live signal from any
possible disruptions caused by the testing process. It allows the technician
to observe the line while the customer is actually using it and to see if
there are any problems.
The Loop mode is used to terminate a signal and loop it through the
instrument. The incoming Rx signal is terminated, regenerated, and
retransmitted through the Tx connector. Code violations and frame errors
are eliminated in this loopback. This mode is similar to the Terminate
mode, but the instrument loops the signal internally instead of transmitting
the selected test pattern. There are two main applications for the Loop test,
used to loop a signal back to the direction which it came from. This is
normally done if the circuit is out of service. In the other application, one
direction of a live circuit is passed through the instrument in the Loop
mode.
14-1 T1 ANALYZER
Chapter 14
CH
14
14.0 T1 ANALYZER
In this chapter
T1 Introduction ............................................................................................................................................ 14-2
T1 Bandwidth ...................................................................................................................................... 14-3 T1 Framing ......................................................................................................................................... 14-3 Line Code ........................................................................................................................................... 14-4 Alarms ................................................................................................................................................ 14-6 Physical Interface ............................................................................................................................... 14-8
Using T1 Analyzer....................................................................................................................................... 14-9 How to Use Keys ...................................................................................................................................... 14-10
Measure ............................................................................................................................................ 14-10 Measure Setup ................................................................................................................................. 14-10 Display Overview .............................................................................................................................. 14-13
Measurement Setup ................................................................................................................................. 14-14 Connection Diagram ................................................................................................................................. 14-15 Terminate Mode ........................................................................................................................................ 14-16 Bridge Mode ............................................................................................................................................. 14-16 Monitor Mode ............................................................................................................................................ 14-16 Loop Test .................................................................................................................................................. 14-16

14-2 T1 ANALYZER
Chapter 14
CH
14
T1 INTRODUCTION
The T1 is what telephone companies have traditionally used to transport
digitized telephone conversations between central offices. As early as the
1960’s, a single T1 circuit made it possible for a telephone company to
deliver 24 high quality voice conversations. Since a T1 is a fully digital
service, there was no possibility of crosstalk, which is common in analog
carrier networks where copper pairs pickup emissions from neighboring
pairs. Significant increases in noise immunity were also achieved by
adopting this new digital transmission standard.
Since the early 1980’s, T1 service has been available to private industry
throughout the country. This document will discuss the various types of T1
measurement items, how to measure them, and understand the general
guidelines of T1 analysis using the JD7105A, Base Station Analyzer.
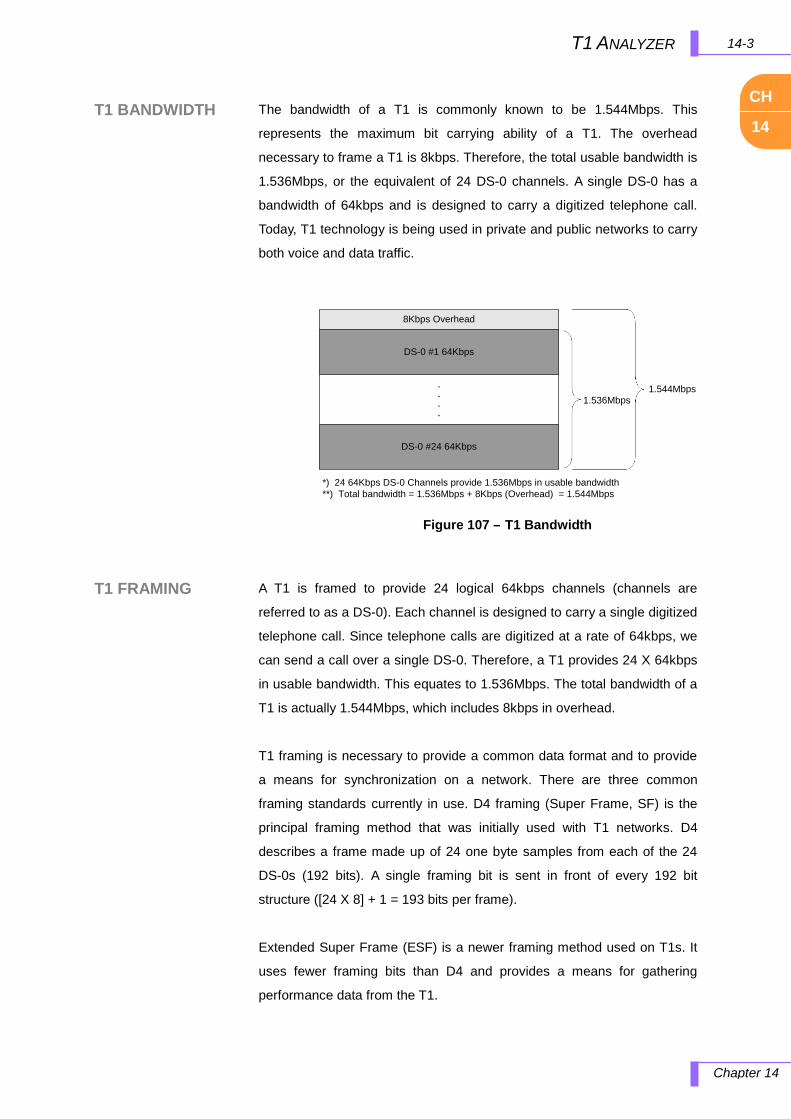
14-3 T1 ANALYZER
Chapter 14
CH
14
T1 BANDWIDTH
T1 FRAMING
The bandwidth of a T1 is commonly known to be 1.544Mbps. This
represents the maximum bit carrying ability of a T1. The overhead
necessary to frame a T1 is 8kbps. Therefore, the total usable bandwidth is
1.536Mbps, or the equivalent of 24 DS-0 channels. A single DS-0 has a
bandwidth of 64kbps and is designed to carry a digitized telephone call.
Today, T1 technology is being used in private and public networks to carry
both voice and data traffic.
A T1 is framed to provide 24 logical 64kbps channels (channels are
referred to as a DS-0). Each channel is designed to carry a single digitized
telephone call. Since telephone calls are digitized at a rate of 64kbps, we
can send a call over a single DS-0. Therefore, a T1 provides 24 X 64kbps
in usable bandwidth. This equates to 1.536Mbps. The total bandwidth of a
T1 is actually 1.544Mbps, which includes 8kbps in overhead.
T1 framing is necessary to provide a common data format and to provide
a means for synchronization on a network. There are three common
framing standards currently in use. D4 framing (Super Frame, SF) is the
principal framing method that was initially used with T1 networks. D4
describes a frame made up of 24 one byte samples from each of the 24
DS-0s (192 bits). A single framing bit is sent in front of every 192 bit
structure ([24 X 8] + 1 = 193 bits per frame).
Extended Super Frame (ESF) is a newer framing method used on T1s. It
uses fewer framing bits than D4 and provides a means for gathering
performance data from the T1.
8Kbps Overhead
DS-0 #1 64Kbps
.
.
.
.
DS-0 #24 64Kbps
1.536Mbps1.544Mbps
*) 24 64Kbps DS-0 Channels provide 1.536Mbps in usable bandwidth**) Total bandwidth = 1.536Mbps + 8Kbps (Overhead) = 1.544Mbps
Figure 107 – T1 Bandwidth
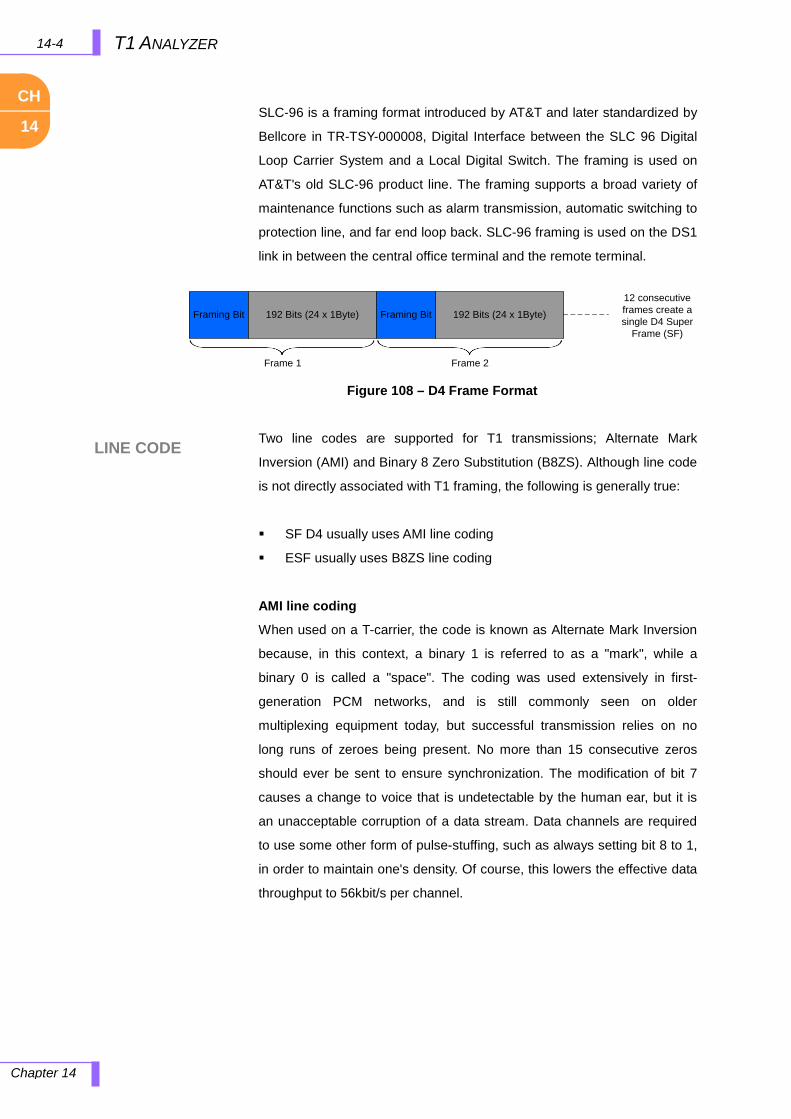
14-4 T1 ANALYZER
Chapter 14
CH
14
LINE CODE
SLC-96 is a framing format introduced by AT&T and later standardized by
Bellcore in TR-TSY-000008, Digital Interface between the SLC 96 Digital
Loop Carrier System and a Local Digital Switch. The framing is used on
AT&T's old SLC-96 product line. The framing supports a broad variety of
maintenance functions such as alarm transmission, automatic switching to
protection line, and far end loop back. SLC-96 framing is used on the DS1
link in between the central office terminal and the remote terminal.
Two line codes are supported for T1 transmissions; Alternate Mark
Inversion (AMI) and Binary 8 Zero Substitution (B8ZS). Although line code
is not directly associated with T1 framing, the following is generally true:
SF D4 usually uses AMI line coding
ESF usually uses B8ZS line coding
AMI line coding
When used on a T-carrier, the code is known as Alternate Mark Inversion
because, in this context, a binary 1 is referred to as a "mark", while a
binary 0 is called a "space". The coding was used extensively in first-
generation PCM networks, and is still commonly seen on older
multiplexing equipment today, but successful transmission relies on no
long runs of zeroes being present. No more than 15 consecutive zeros
should ever be sent to ensure synchronization. The modification of bit 7
causes a change to voice that is undetectable by the human ear, but it is
an unacceptable corruption of a data stream. Data channels are required
to use some other form of pulse-stuffing, such as always setting bit 8 to 1,
in order to maintain one's density. Of course, this lowers the effective data
throughput to 56kbit/s per channel.
Framing Bit 192 Bits (24 x 1Byte) Framing Bit 192 Bits (24 x 1Byte)
12 consecutive frames create a single D4 Super
Frame (SF)
Frame 1 Frame 2
Figure 108 – D4 Frame Format
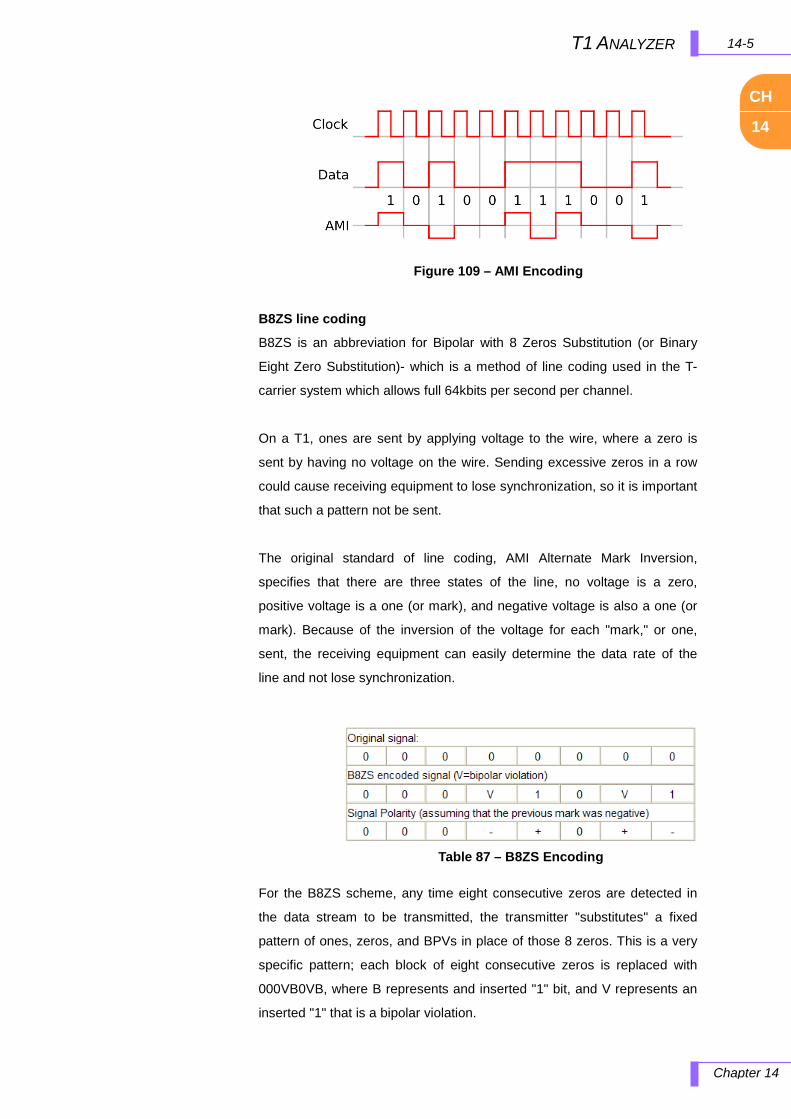
14-5 T1 ANALYZER
Chapter 14
CH
14
B8ZS line coding
B8ZS is an abbreviation for Bipolar with 8 Zeros Substitution (or Binary
Eight Zero Substitution)- which is a method of line coding used in the T-
carrier system which allows full 64kbits per second per channel.
On a T1, ones are sent by applying voltage to the wire, where a zero is
sent by having no voltage on the wire. Sending excessive zeros in a row
could cause receiving equipment to lose synchronization, so it is important
that such a pattern not be sent.
The original standard of line coding, AMI Alternate Mark Inversion,
specifies that there are three states of the line, no voltage is a zero,
positive voltage is a one (or mark), and negative voltage is also a one (or
mark). Because of the inversion of the voltage for each "mark," or one,
sent, the receiving equipment can easily determine the data rate of the
line and not lose synchronization.
For the B8ZS scheme, any time eight consecutive zeros are detected in
the data stream to be transmitted, the transmitter "substitutes" a fixed
pattern of ones, zeros, and BPVs in place of those 8 zeros. This is a very
specific pattern; each block of eight consecutive zeros is replaced with
000VB0VB, where B represents and inserted "1" bit, and V represents an
inserted "1" that is a bipolar violation.
Figure 109 – AMI Encoding
Table 87 – B8ZS Encoding
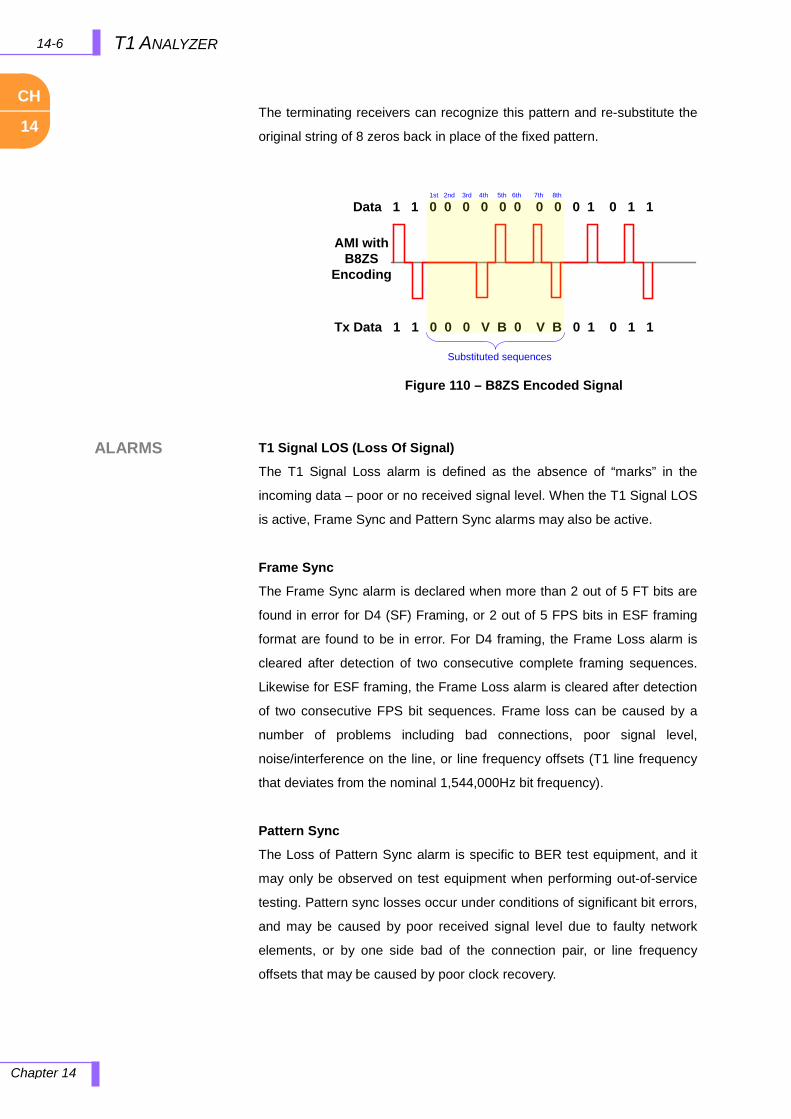
14-6 T1 ANALYZER
Chapter 14
CH
14
ALARMS
The terminating receivers can recognize this pattern and re-substitute the
original string of 8 zeros back in place of the fixed pattern.
T1 Signal LOS (Loss Of Signal)
The T1 Signal Loss alarm is defined as the absence of “marks” in the
incoming data – poor or no received signal level. When the T1 Signal LOS
is active, Frame Sync and Pattern Sync alarms may also be active.
Frame Sync
The Frame Sync alarm is declared when more than 2 out of 5 FT bits are
found in error for D4 (SF) Framing, or 2 out of 5 FPS bits in ESF framing
format are found to be in error. For D4 framing, the Frame Loss alarm is
cleared after detection of two consecutive complete framing sequences.
Likewise for ESF framing, the Frame Loss alarm is cleared after detection
of two consecutive FPS bit sequences. Frame loss can be caused by a
number of problems including bad connections, poor signal level,
noise/interference on the line, or line frequency offsets (T1 line frequency
that deviates from the nominal 1,544,000Hz bit frequency).
Pattern Sync
The Loss of Pattern Sync alarm is specific to BER test equipment, and it
may only be observed on test equipment when performing out-of-service
testing. Pattern sync losses occur under conditions of significant bit errors,
and may be caused by poor received signal level due to faulty network
elements, or by one side bad of the connection pair, or line frequency
offsets that may be caused by poor clock recovery.
Data 1 1 0 0 0 0 0 0 0 0 0 1 0 1 1
Tx Data 1 1 0 0 0 V B 0 V B 0 1 0 1 1
Substituted sequences
AMI with B8ZS
Encoding
1st 2nd 3rd 4th 5th 6th 7th 8th
Figure 110 – B8ZS Encoded Signal
14-7 T1 ANALYZER
Chapter 14
CH
14
B8ZS
Bipolar with 8-zero Substitution. A coding scheme in which the transmitter
“substitutes” a fixed pattern of ones, zeros, and BPVs in place of 8
consecutive zeros. This is a very specific pattern, each block of eight
consecutive zeros is replaced with 000VB0VB, where B represents and
inserted “1” bit, and V represents an inserted “1” that is a bipolar violation.
Red Alarm
Red alarm indicates the alarming equipment is unable to recover the
framing reliably. Corruption or loss of the signal will produce “red alarm.”
Connectivity has been lost toward the alarming equipment.
RAI
Remote Alarm Indication. A signal transmitted from terminal equipment in
the outgoing direction when it determines that it has lost the incoming
signal, or when it receives an AIS signal in the incoming direction. RAI is
also called the Yellow Alarm.
AIS (Alarm Indication Signal)
The AIS is also known as a "Keep Alive" or "Blue Alarm" signal. Blue alarm
indicates a disruption in the communication path between the terminal
equipment. Communication devices, such as repeaters and multiplexers
must see and produce line activity at the DS1 rate. If no signal is received
that fills those requirements, the communications device produces a
series of pulses on its output side to maintain the required activity. Those
pulses represent data “1” in all data and all framing time slots. This signal
maintains communication integrity while providing no framing to the
terminal equipment. The receiving equipment displays a “red alarm” and
sends the signal for “yellow alarm” to the far end because it has no
framing, but at maintenance interfaces the equipment will report “AIS” or
Alarm Indication Signal. AIS is also called “all ones” because of the data
and framing pattern.
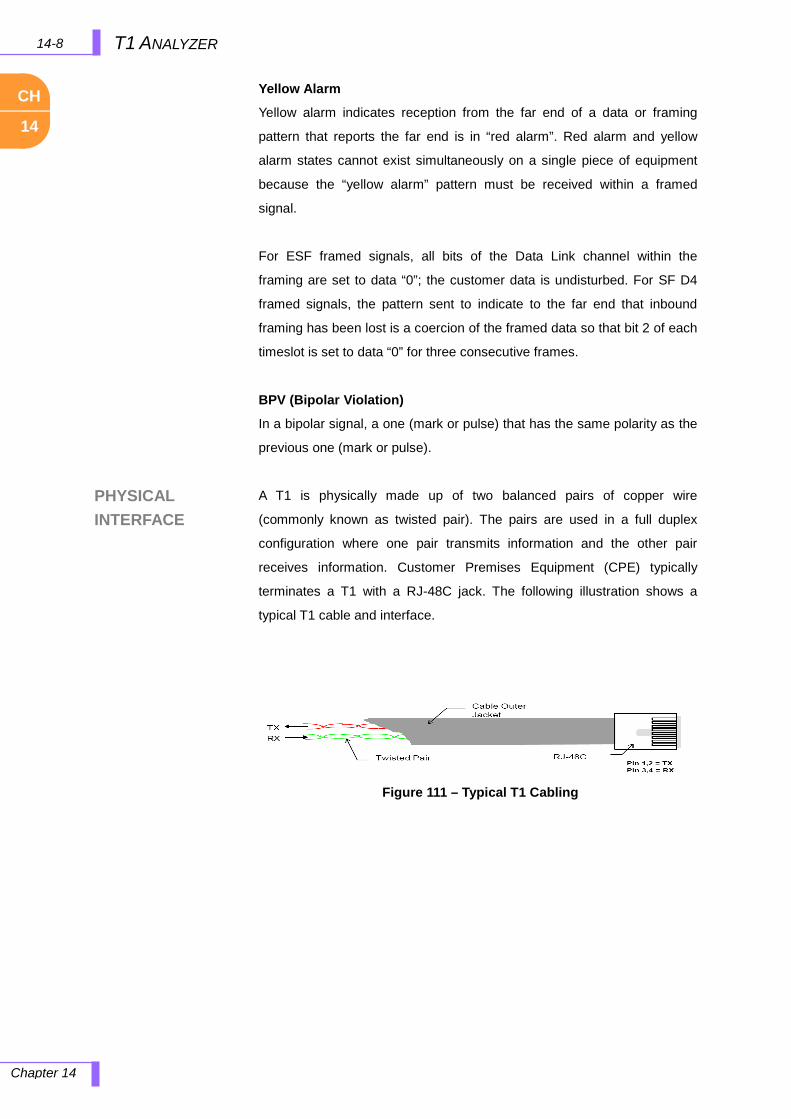
14-8 T1 ANALYZER
Chapter 14
CH
14
PHYSICAL INTERFACE
Yellow Alarm
Yellow alarm indicates reception from the far end of a data or framing
pattern that reports the far end is in “red alarm”. Red alarm and yellow
alarm states cannot exist simultaneously on a single piece of equipment
because the “yellow alarm” pattern must be received within a framed
signal.
For ESF framed signals, all bits of the Data Link channel within the
framing are set to data “0”; the customer data is undisturbed. For SF D4
framed signals, the pattern sent to indicate to the far end that inbound
framing has been lost is a coercion of the framed data so that bit 2 of each
timeslot is set to data “0” for three consecutive frames.
BPV (Bipolar Violation)
In a bipolar signal, a one (mark or pulse) that has the same polarity as the
previous one (mark or pulse).
A T1 is physically made up of two balanced pairs of copper wire
(commonly known as twisted pair). The pairs are used in a full duplex
configuration where one pair transmits information and the other pair
receives information. Customer Premises Equipment (CPE) typically
terminates a T1 with a RJ-48C jack. The following illustration shows a
typical T1 cable and interface.
Figure 111 – Typical T1 Cabling
14-9 T1 ANALYZER
Chapter 14
CH
14
USING T1 ANALYZER
The JDSU JD7105A provides a simple solution for all your T1 testing
needs, from basic transmission testing to BERT (Bit Error Rate Test)
testing.
The following sections provide basics performing a T1 Analyzer
Measurement.

14-10 T1 ANALYZER
Chapter 14
CH
14
MEASURE
MEASURE SETUP
HOW TO USE KEYS
In this section describes hard key usages in T1 Analyzer measurement.
Keys are not listed in here will not be used.
MEASURE MEASURE OFF: Activates T1 Analyzer Measurement mode or return to
main menu of E1/T1 Analyzer.
BERT: Sets the measurement parameters of BER testing.
LOOP TEST: Sets the measurement parameters of LOOP TEST.
Remote Loop Up: Activates external loop back, the instrument
sends request the loop back mode to the system.
Remote Loop Dn: Deactivates external loop back, the
instrument sends request the clear of loop back mode to the
system.
Self Loop Up: Activates internal loop back.
Self Loop Dn: Deactivates internal loop back, reverting the
instrument to a through mode.
EVENT LOG: Enables or disables event logging functionality of T1
Analyzer.
RX SIGNAL (VPP) OFF/ON: Enables or Disables Vpp.
MEASURE SETUP RX INPUT: Selects the receive inputs.
Terminate: The transmitter sends data according to the
transmitter settings in the Measure Setup menu, including
framing, line-code, and BER patterns. Terminate mode provides a
nominal 100ohm input impedance.
Bridge: Bridge mode provides greater than 1kohms input
impedance for in-service monitoring, bridging the receiver input
across lines that are terminated elsewhere in the network.
Monitor: The monitor mode is designed for in-service monitoring
of T1 lines. In monitor mode, the instrument is set for 100ohms
nominal input impedance.
14-11 T1 ANALYZER
Chapter 14
CH
14
FRAMING: Selects the types of framing. If the Framing type of received
signal is not accord with receiver setting, then Framing alarm occurs.
SF-D4 (Super Frame-D4): Group of 12 Frames, used to align
equipment for framing.
ESF (Extended Super Frame): Group of 24 Frames, used to
align equipment for framing, Uses 4K for a maintenance channel
(Facilities Data Link), 2K for CRC-6 checksum and 2K for
framing/synchronization.
LINE CODE: Selects the types of line codes to send T1 signal.
AMI: Alternate Mark Inversion, A line code uses a three level
signals to convey binary digits in which successive binary ones
(“marks” or pulses) are of alternating polarity, either positive or
negative, equal in amplitude. A binary zero (“space”) is
transmitted as no pulse, or zero amplitude.
B8ZS: Bipolar with 8-zero Substitution. A coding scheme in which
the transmitter "substitutes" a fixed pattern of ones, zeros, and
BPVs in place of 8 consecutive zeros.
PATTERN: Selects the types of patterns.
Off: No patterns are sent.
1-8: An eight-bit pattern that contains a single one. Used to test
clock recovery.
1-16: A sixteen-bit pattern that contains a single one. Used to test
clock recovery.
All 1's: A pattern that causes line drivers to consume the
maximum power.
All 0's: A pattern that is often selected to verify B8ZS
provisioning. Circuit will drop if optioned for AMI.
Alternate: A pattern that alternates between ones and zeroes.
3-24: A twenty-four bit-pattern containing 3 ones with the longest
length of consecutive zeroes constrained to fifteen. It has ones
density of 12.5% and is used to check clock recovery.
QRSS: A pseudorandom pattern that simulates live traffic on a
circuit. It is a very common test pattern
2e23: A pseudorandom pattern based on a 23 bit shift register.
2e15: A pseudorandom pattern based on a 15 bit shift register.
2e23 INV: Bit inversed pseudorandom pattern based on a 23 bit
shift register.
14-12 T1 ANALYZER
Chapter 14
CH
14
2e15 INV: Bit inversed pseudorandom pattern based on a 15 bit
shift register.
TX CLOCK: Selects the clock source to measure frequency and timing.
Int: Internal clock uses an internal oscillator, in case of external
reference is not available, the instrument does not transmit signal
to synchronized equipment, the instrument provides the clock to
the unit under test and most cases in Loopback test mode.
Rx: Transmit clock uses the frequency recovered from the
received signal (Network Loop), if accurate frequency
measurement is needed.
TX LBO (Transmit Line Build Out): Selects the line build out level.
Possible values for LBO are 0 dB, -7.5 dB, or -15 dB.
(0dB) is used for these cases.
- Test set is connected to the DSX front panel, to CSU, to NIU
or Channel Bank.
- Cabling less than about 130ft in-between test set and DSX.
- In most cases.
(-7.5, -15dB) are used for the below cases,
- Attenuation is needed where the T1 line is series connected
to 7.5dB, 15dB attenuator.
LOOP CODES
LINK: Select between In-Band and Data-Link. Use Data-Link
when framing is ESF.
Inband
Datalink
CSU: Select CSU (Channel Service Unit) codes.
NIU: Select NIU (Network Interface Unit) codes.

14-13T1 ANALYZER
Chapter 14
CH
14
DISPLAY
OVERVIEW
① Rx Mode: Current test modes setting information, Terminate, Bridge
and Monitor
② Framing: Framing modes setting information, SF-D4 and ESF
③ Line Code: Two different line coding formats are used in T1
networks, AMI and B8ZS
④ Tx Clock: Tx Clock setting information, Internal and Rx
⑤ Tx Pattern: Selected Tx Patter information
⑥ Off, 1-8, 1-16, All 1’s, All 0’s, Alternate, 3-24, QRSS, 2e23, 2e15,
2e23 INV, 2e15 INV
⑦ Tx LBO: Line Build Out level setting information, 0dB, -7.5dB, and
-15dB
⑧ Loop Mode: Current loop modes information, CSU and NIU
⑨ Loop Link: Inband and Datalink
⑩ Measure On/Off: Measure on/off selection menu
⑪ BERT: Bit Error Rate Testing setting menu, user can set the
following setups
⑫ Tx Signal, Error Set, Error Injection, Alarm on/off (AIS, RAI Alarm),
and Clear History
⑬ Loop Test: Remote Loop Up/Down, Self Loop Up/Down
⑭ Event Log On/Off: Activate and Deactivate Event logging capability
Figure 112 – T1 Analyzer Screen
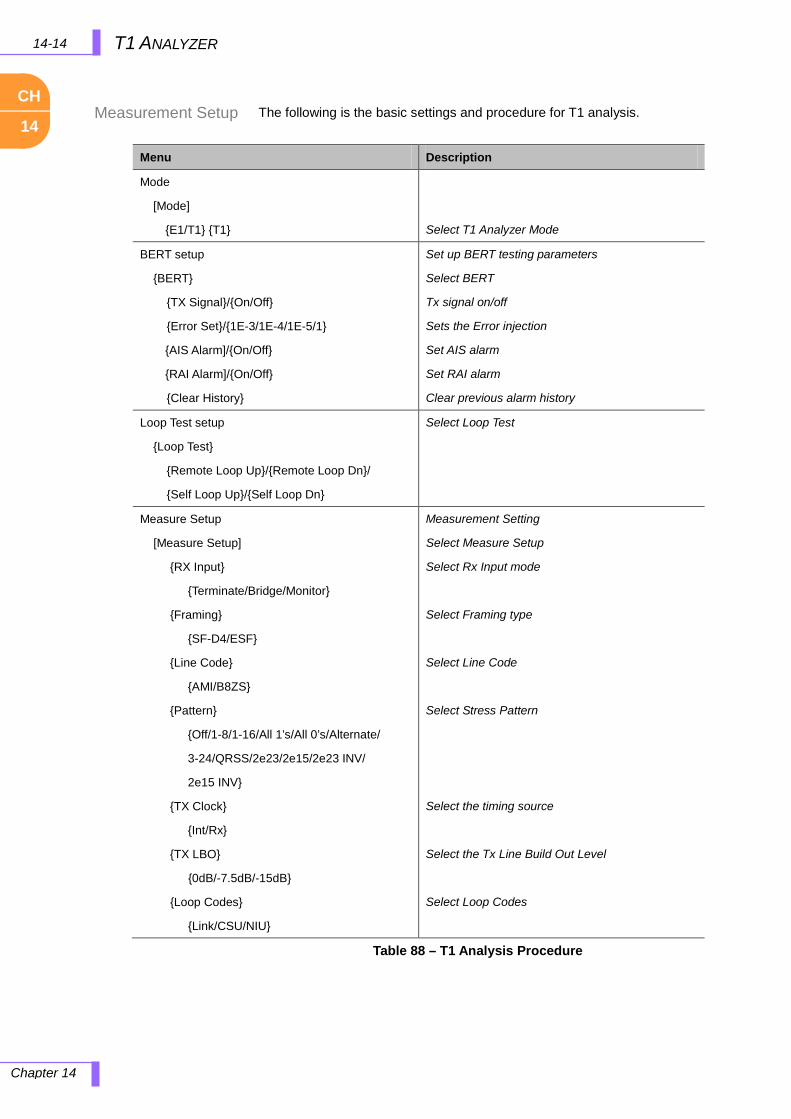
14-14 T1 ANALYZER
Chapter 14
CH
14
Measurement Setup
The following is the basic settings and procedure for T1 analysis.
Table 88 – T1 Analysis Procedure
Menu Description
Mode
[Mode]
E1/T1 T1
Select T1 Analyzer Mode
BERT setup
BERT
TX Signal/On/Off
Error Set/1E-3/1E-4/1E-5/1
AIS Alarm]/On/Off
RAI Alarm]/On/Off
Clear History
Set up BERT testing parameters
Select BERT
Tx signal on/off
Sets the Error injection
Set AIS alarm
Set RAI alarm
Clear previous alarm history
Loop Test setup
Loop Test
Remote Loop Up/Remote Loop Dn/
Self Loop Up/Self Loop Dn
Select Loop Test
Measure Setup
[Measure Setup]
RX Input
Terminate/Bridge/Monitor
Framing
SF-D4/ESF
Line Code
AMI/B8ZS
Pattern
Off/1-8/1-16/All 1’s/All 0’s/Alternate/
3-24/QRSS/2e23/2e15/2e23 INV/
2e15 INV
TX Clock
Int/Rx
TX LBO
0dB/-7.5dB/-15dB
Loop Codes
Link/CSU/NIU
Measurement Setting
Select Measure Setup
Select Rx Input mode
Select Framing type
Select Line Code
Select Stress Pattern
Select the timing source
Select the Tx Line Build Out Level
Select Loop Codes
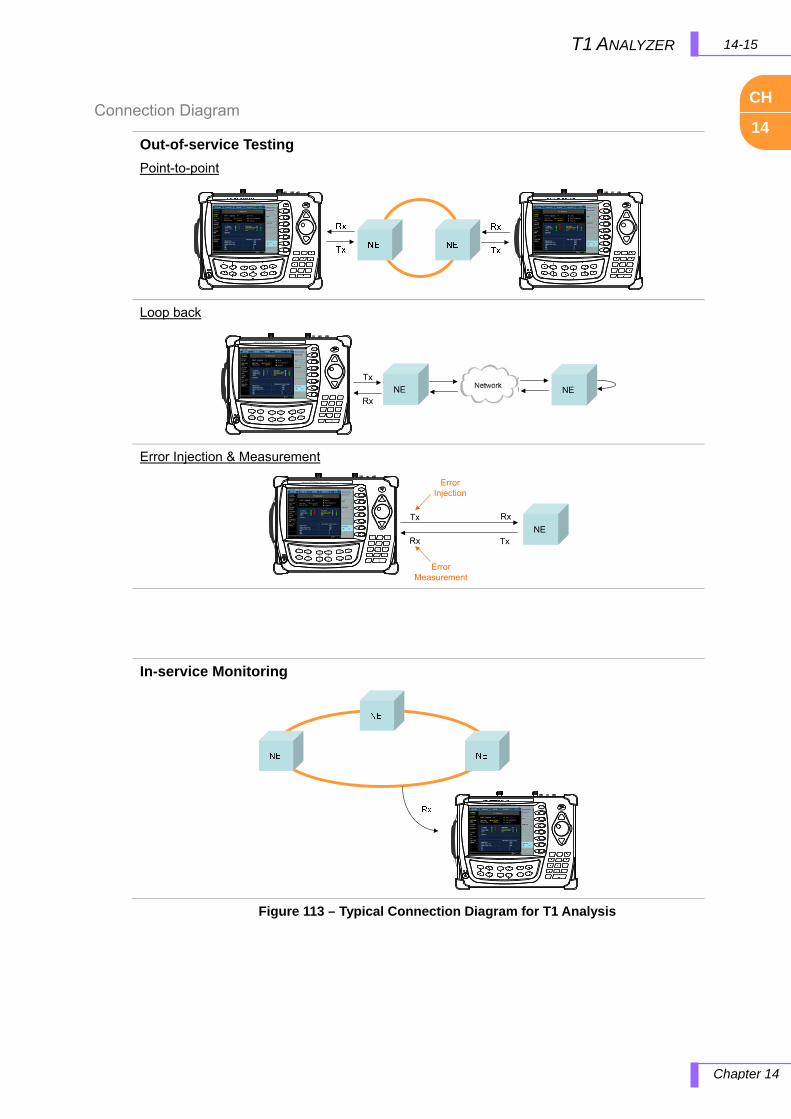
14-15T1 ANALYZER
Chapter 14
CH
14
Connection Diagram
Figure 113 – Typical Connection Diagram for T1 Analysis
Out-of-service Testing
Point-to-point
Loop back
GenComm GC7105A Base Station Analyzer
ESC
+/-
. Del
7 8 9
4 5 6
1 2 3
0Enter
Freq/
Chan
Trace/Display
Marker
MeasureAm
plitude
BW/AVG
Peak Search
MeasureSetup
Save
Load
System
Mode
NE
Tx
RxNE
Error Injection & Measurement
GenComm GC7105A Base Station Analyzer
ESC
+/-
. Del
7 8 9
4 5 6
1 2 3
0Enter
Freq/
Chan
Trace/Display
Marker
MeasureAm
plitude
BW/AVG
Peak Search
MeasureSetup
Save
Load
System
Mode
NE
Tx
Rx
Rx
Tx
Error Injection
Error Measurement
In-service Monitoring
14-16 T1 ANALYZER
Chapter 14
CH
14
Terminate Mode
Bridge Mode
Monitor Mode
Loop Test
It is out-of-service testing (removing live traffic from the T1 circuit before
testing begins), and is used for analyzing received T1 signal. The
transmitter sends data according to the Tx Clock setting, including framing,
line-code, and BER patterns. Terminate mode provides a nominal 100
ohm input impedance.
It is in-service monitoring test and bridging the receiver input across lines
that are terminated in the network without interrupting the signal.
In-service test, transmitter will activate to send test patterns.
Loopback mode is intended for out-of-service testing of T1 lines. In this
mode, the instrument performs a “line loopback” of the data from the
receiver to the transmitter.
15-1 APPENDIX
Appendix
APP
END
IX
15.0 APPENDIX
In this chapter
APPENDIX A. SPECIFICATION .......................................................................................................................... 15-2 APPENDIX B. BATTERY SPECIFICATION ............................................................................................................ 15-4 APPENDIX C. CABLE LIST .............................................................................................................................. 15-5 APPENDIX D. BAND, FREQUENCY, CHANNEL STANDARD ................................................................................... 15-7 APPENDIX E. VSWR-RETURN LOSS CONVERSION TABLE ................................................................................. 15-8 ORDERING INFORMATION ............................................................................................................................... 15-9
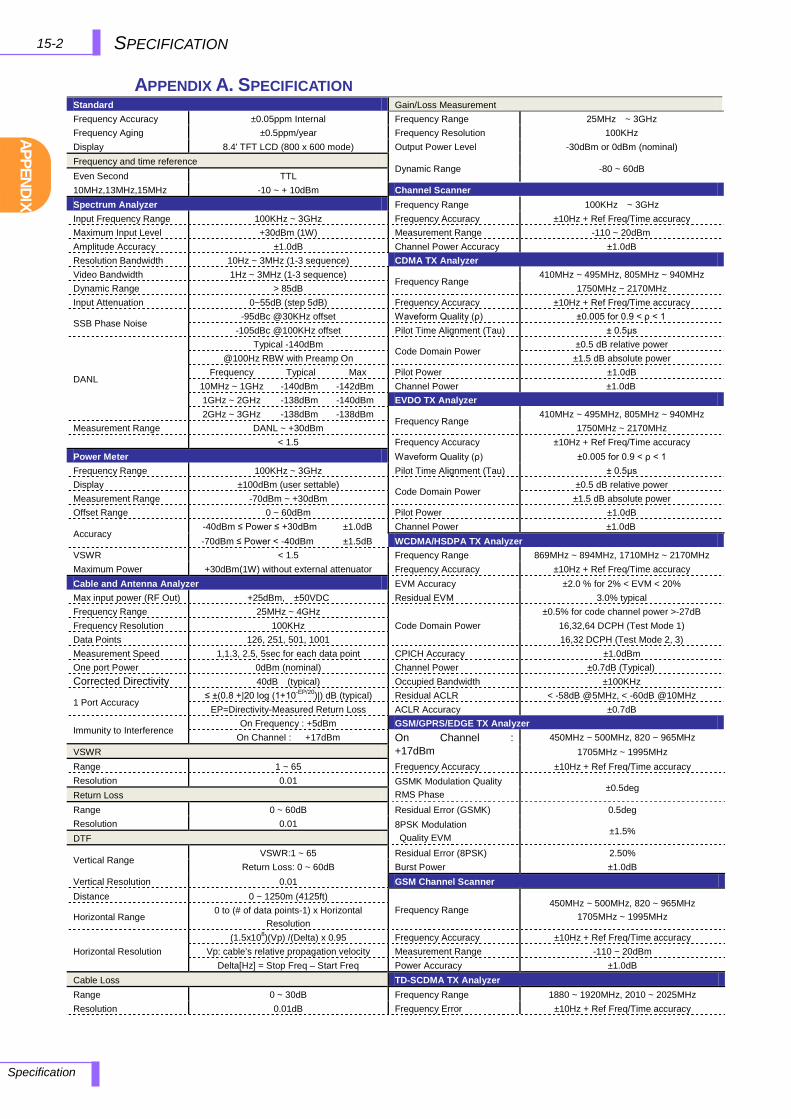
APPEN
DIX
15-2
Specification
SPECIFICATION
APPENDIX A. SPECIFICATION Standard Gain/Loss Measurement Frequency Accuracy ±0.05ppm Internal Frequency Range 25MHz ~ 3GHz Frequency Aging ±0.5ppm/year Frequency Resolution 100KHz Display 8.4' TFT LCD (800 x 600 mode) Output Power Level -30dBm or 0dBm (nominal) Frequency and time reference
Dynamic Range -80 ~ 60dB Even Second TTL 10MHz,13MHz,15MHz -10 ~ + 10dBm Channel Scanner Spectrum Analyzer Frequency Range 100KHz ~ 3GHz Input Frequency Range 100KHz ~ 3GHz Frequency Accuracy ±10Hz + Ref Freq/Time accuracy Maximum Input Level +30dBm (1W) Measurement Range -110 ~ 20dBm Amplitude Accuracy ±1.0dB Channel Power Accuracy ±1.0dB Resolution Bandwidth 10Hz ~ 3MHz (1-3 sequence) CDMA TX Analyzer Video Bandwidth 1Hz ~ 3MHz (1-3 sequence)
Frequency Range 410MHz ~ 495MHz, 805MHz ~ 940MHz
Dynamic Range > 85dB 1750MHz ~ 2170MHz Input Attenuation 0~55dB (step 5dB) Frequency Accuracy ±10Hz + Ref Freq/Time accuracy
SSB Phase Noise -95dBc @30KHz offset Waveform Quality (ρ) ±0.005 for 0.9 < ρ < 1
-105dBc @100KHz offset Pilot Time Alignment (Tau) ± 0.5μs
DANL
Typical -140dBm Code Domain Power
±0.5 dB relative power @100Hz RBW with Preamp On ±1.5 dB absolute power
Frequency Typical Max Pilot Power ±1.0dB 10MHz ~ 1GHz -140dBm -142dBm Channel Power ±1.0dB 1GHz ~ 2GHz -138dBm -140dBm EVDO TX Analyzer 2GHz ~ 3GHz -138dBm -138dBm
Frequency Range 410MHz ~ 495MHz, 805MHz ~ 940MHz
Measurement Range DANL ~ +30dBm 1750MHz ~ 2170MHz RF In VSWR < 1.5 Frequency Accuracy ±10Hz + Ref Freq/Time accuracy Power Meter Waveform Quality (ρ) ±0.005 for 0.9 < ρ < 1 Frequency Range 100KHz ~ 3GHz Pilot Time Alignment (Tau) ± 0.5μs Display ±100dBm (user settable)
Code Domain Power ±0.5 dB relative power
Measurement Range -70dBm ~ +30dBm ±1.5 dB absolute power Offset Range 0 ~ 60dBm Pilot Power ±1.0dB
Accuracy -40dBm ≤ Power ≤ +30dBm ±1.0dB Channel Power ±1.0dB -70dBm ≤ Power < -40dBm ±1.5dB WCDMA/HSDPA TX Analyzer
VSWR < 1.5 Frequency Range 869MHz ~ 894MHz, 1710MHz ~ 2170MHz Maximum Power +30dBm(1W) without external attenuator Frequency Accuracy ±10Hz + Ref Freq/Time accuracy Cable and Antenna Analyzer EVM Accuracy ±2.0 % for 2% < EVM < 20% Max input power (RF Out) +25dBm, ±50VDC Residual EVM 3.0% typical Frequency Range 25MHz ~ 4GHz
Code Domain Power ±0.5% for code channel power >-27dB
Frequency Resolution 100KHz 16,32,64 DCPH (Test Mode 1) Data Points 126, 251, 501, 1001 16,32 DCPH (Test Mode 2, 3) Measurement Speed 1,1.3, 2.5, 5sec for each data point CPICH Accuracy ±1.0dBm One port Power 0dBm (nominal) Channel Power ±0.7dB (Typical) Corrected Directivity 40dB (typical) Occupied Bandwidth ±100KHz
1 Port Accuracy ≤ ±(0.8 +|20 log (1+10-EP/20)|) dB (typical) Residual ACLR < -58dB @5MHz, < -60dB @10MHz
EP=Directivity-Measured Return Loss ACLR Accuracy ±0.7dB
Immunity to Interference On Frequency : +5dBm GSM/GPRS/EDGE TX Analyzer
On Channel : +17dBm On Channel : +17dBm
450MHz ~ 500MHz, 820 ~ 965MHz VSWR 1705MHz ~ 1995MHz Range 1 ~ 65 Frequency Accuracy ±10Hz + Ref Freq/Time accuracy Resolution 0.01 GSMK Modulation Quality
RMS Phase ±0.5deg
Return Loss Range 0 ~ 60dB Residual Error (GSMK) 0.5deg Resolution 0.01 8PSK Modulation
Quality EVM ±1.5%
DTF
Vertical Range VSWR:1 ~ 65 Residual Error (8PSK) 2.50%
Return Loss: 0 ~ 60dB Burst Power ±1.0dB Vertical Resolution 0.01 GSM Channel Scanner Distance 0 ~ 1250m (4125ft)
Frequency Range 450MHz ~ 500MHz, 820 ~ 965MHz
1705MHz ~ 1995MHz Horizontal Range 0 to (# of data points-1) x Horizontal
Resolution
Horizontal Resolution (1.5x10⁸)(Vp) /(Delta) x 0.95 Frequency Accuracy ±10Hz + Ref Freq/Time accuracy
Vp: cable’s relative propagation velocity Measurement Range -110 ~ 20dBm Delta[Hz] = Stop Freq – Start Freq Power Accuracy ±1.0dB
Cable Loss TD-SCDMA TX Analyzer Range 0 ~ 30dB Frequency Range 1880 ~ 1920MHz, 2010 ~ 2025MHz Resolution 0.01dB Frequency Error ±10Hz + Ref Freq/Time accuracy

APP
END
IX
15-3 SPECIFICATION
Specification
TD-SCDMA(Continued) Power Range Average: 0.15 ~ 150W (21.76 ~ 51.76dBm)
Residual EVM (rms) 2.0% typical for P-CCPCH slot & 1channel,
slot power > -50dBm Peak : 4 ~ 400W (36.02 ~ 56.02dBm) Measurement Uncertainty ±4% of reading + 0.05W 1,2
Time Error (Tau) ±0.2us Input Return Loss
≤2500MHz, 27dB Min Supported Modulation QPSK/8PSK > 2500MHz, 25dB Spread Factor Auto 1,2,4,8,16 Directivity 27dB Min
Channel Power (RRC) ±1dB typical for +10dBm to -40dBm
±1.5dB Max Insertion Loss < 1GHz, < 0.05dB 1 ~ 2GHz, < 0.1dB,
T1 Analyzer 2 ~ 3.8GHz < 0.13dB Error Detect Code BPV, Frame, CRC Connector Type N-Female on both ends Alarm Detection Red Alarm, Yellow Alarm, AIS Alarm JD733A Receive Level +6 ~ -36dB DSX Sensor Type Average and Peak Electrical Interface Frequency Range 150 ~ 3500MHz Connectors Rx/TX RJ48C (100Ω)
Power Range Average: 0.25 ~ 20W (24 ~ 43dBm)
Output 0dB, -7.5dB and -15dB Peak: 0.25 ~ 20W (24 ~ 43dBm) Line Code AMI, B8ZS Measurement Uncertainty ±4% of reading + 0.05W 1,2 Impedance 100Ω or 1000Ω (Bridge)
Input Return Loss ≤2500MHz, 27dB Min
Input > 2500MHz, 25dB Term/Bridge/Monitor 0 ~ -20dB Directivity 27dB Min Transmitter and Receiver
Insertion Loss < 1GHz, < 0.05dB
Framing D4,ESF 1 ~ 2GHz, < 0.1dB Channel Formats Full T1 2 ~ 3.5GHz < 0.13dB
Test Pattern 1-8, 1-16, ALL1, ALL0, 0101 Connector Type N-Female on both ends 3E-24, QRSS, 2E-23, 2E-15 Terminating Power Sensors (Optional) 2E-23 inverse, 2E-15 inverse JD732A, JD734A,JD736A
Additional Functions Sensor Type
Average (JD732A) Reference Clock Received or Internal Peak (JD734A) Event Log Capability Internal Memory or External USB Average and Peak (JD736A) Error Insertion 1E-5, 1E-6, 1E-7 Frequency Range 20 ~ 3800MHz Error Rate Count CRC, Frame Code Calculated BER Power Range -30 ~ +20dBm (1uW ~ 100mW) E1 Analyzer Measurement Uncertainty ±7% of reading1,2 Error Detect Code BPV, FAS, CRC-4 Connector Type N-Male Alarm Detection FAS RAI, MFAS RAI, AIS External Reference Clock Receive Level +6 ~ -36dB DSX 10,13,15MHz External Reference Electrical Interface Input Power -10 ~ +10dBm Connectors Rx/TX RJ48C (120Ω) Connector Type SMA Output 0dB, -6dB (ITU-T Rec.G.703) Even Second Line Code AMI, HDB3 Input Level TTL Compatible Impedance Term, Monitor 120Ω, Bridge > 1000Ω Connector Type SMA Input Environmental Condition Term/Bridge/Monitor 0 ~ -20dB Operating Temperature -5 ~ 50 (23 ~ 122 ) Transmitter and Receiver Storage Temperature -20 ~ 70 (-4 ~ 158)
Framing Unframed, PCM-30, PCM-30 with CRC Calibration Cycle 1 year
PCM-31, PCM-31 with CRC Dimension Channel Formats Full T1 Weight 5.6kg (12.1lbs) (Include Battery) Test Pattern 1-8, 1-16, ALL1, ALL0, 0101, 20ITU Size (W x H x D) 315x245x95mm (12.4'x9.6'x3.7') Additional Functions General Reference Clock Received or Internal Interface Ports Event Log Capability Internal Memory or External USB Serial 1 Port Error Insertion 1E-5, 1E-6, 1E-7 USB 1.1 1 Port Error Rate Count CRC, Frame Code Calculated BER 10Mbps LAN 1 Port High Accuracy Power Meter GPS Antenna (SMA) 1 Port (Requires Optional Directional/Terminating Power Sensor) Built-in Speaker Display Range -80 ~ +120dBm Battery (Lithium Ion) Offset Range 0 ~ 60dB Normal Voltage 10.8V Resolution 0.01dB or 0.1xW Normal Capacity 6840mA Directional power Sensors (Optional) Maximum Charge Voltage 12.6V JD731A Battery Operation Hour 1.5 Hours at full charge Sensor Type Average and Peak Power Supply Frequency Range 300 ~ 3800MHz AC Input 100 ~ 240V 2.5A, 50 ~ 60Hz
Specification and product description subject to change without notice.
1 Specification is provided at a temperature 25±10 2 CW Condition

APPEN
DIX
15-4 BATTERY SPECIFICATION
Battery Specification
APPENDIX B. BATTERY SPECIFICATION
HANDLING Avoid shorting the battery Do not immerse in water. Do not disassemble or deform the battery Do not expose to, or dispose of the battery in fire. Avoid excessive physical shock or vibration. Keep out of the reach of children. Never use a battery that appears to have suffered abuse.
STORAGE Store in a cool, dry and well-ventilated area.
NOMINAL VOLTAGE The battery nominal operating voltage is 10.8V.
ENVIRONMENTAL/SAFETY SPECIFICATIONS The battery complies with the following: EMC Directive Measures 89/336/EEC Low Voltage Directive 73/23/EEC Toxic Chemicals Directive 91/157/EEC “RoHS“ -directive 02/95/EC The battery has the following approvals and the pack is labeled accordingly: FCC CE
LIFE EXPECTANCY
Given normal storage & usage, user can expect the battery to deliver 80% or more of it's initial capacity after 300 charge/discharge cycles at 25°C.
SHELF LIFE
The batteries are shipped with between 80% and 90% rated capacity and this provides a minimum of 6 months shelf life, when stored at 25°C.
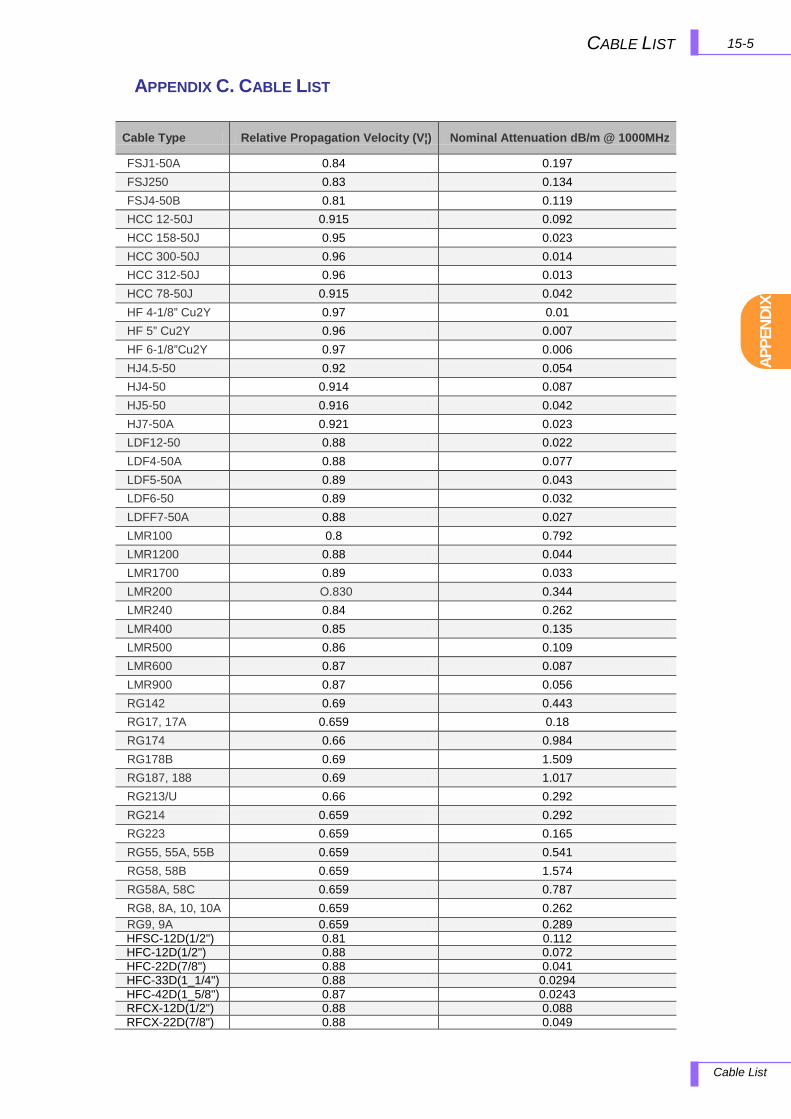
APP
END
IX
15-5 CABLE LIST
Cable List
APPENDIX C. CABLE LIST
Cable Type Relative Propagation Velocity (V¦) Nominal Attenuation dB/m @ 1000MHz
FSJ1-50A 0.84 0.197 FSJ250 0.83 0.134 FSJ4-50B 0.81 0.119 HCC 12-50J 0.915 0.092 HCC 158-50J 0.95 0.023 HCC 300-50J 0.96 0.014 HCC 312-50J 0.96 0.013 HCC 78-50J 0.915 0.042 HF 4-1/8” Cu2Y 0.97 0.01 HF 5” Cu2Y 0.96 0.007 HF 6-1/8”Cu2Y 0.97 0.006 HJ4.5-50 0.92 0.054 HJ4-50 0.914 0.087 HJ5-50 0.916 0.042 HJ7-50A 0.921 0.023 LDF12-50 0.88 0.022 LDF4-50A 0.88 0.077 LDF5-50A 0.89 0.043 LDF6-50 0.89 0.032 LDFF7-50A 0.88 0.027 LMR100 0.8 0.792 LMR1200 0.88 0.044 LMR1700 0.89 0.033 LMR200 O.830 0.344 LMR240 0.84 0.262 LMR400 0.85 0.135 LMR500 0.86 0.109 LMR600 0.87 0.087 LMR900 0.87 0.056 RG142 0.69 0.443 RG17, 17A 0.659 0.18 RG174 0.66 0.984 RG178B 0.69 1.509 RG187, 188 0.69 1.017 RG213/U 0.66 0.292 RG214 0.659 0.292 RG223 0.659 0.165 RG55, 55A, 55B 0.659 0.541 RG58, 58B 0.659 1.574 RG58A, 58C 0.659 0.787 RG8, 8A, 10, 10A 0.659 0.262 RG9, 9A 0.659 0.289 HFSC-12D(1/2") 0.81 0.112 HFC-12D(1/2") 0.88 0.072 HFC-22D(7/8") 0.88 0.041 HFC-33D(1_1/4") 0.88 0.0294 HFC-42D(1_5/8") 0.87 0.0243 RFCX-12D(1/2") 0.88 0.088 RFCX-22D(7/8") 0.88 0.049
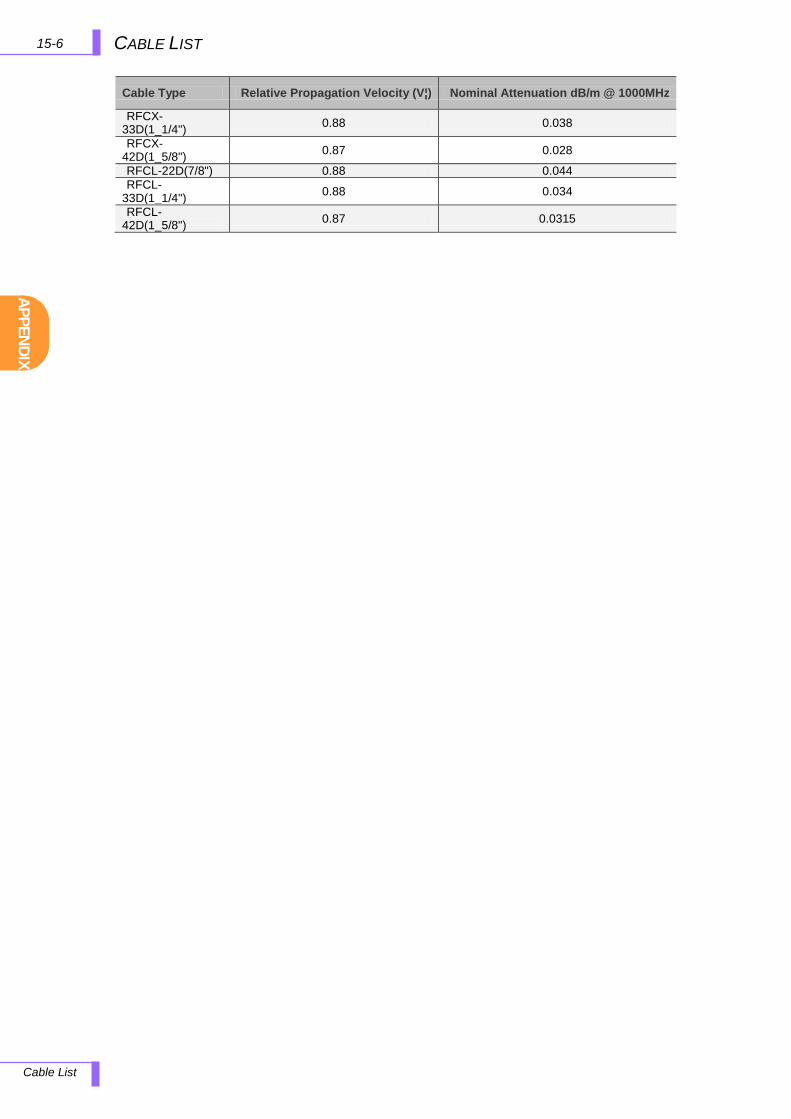
APPEN
DIX
CABLE LIST 15-6
Cable List
Cable Type Relative Propagation Velocity (V¦) Nominal Attenuation dB/m @ 1000MHz
RFCX-33D(1_1/4") 0.88 0.038
RFCX-42D(1_5/8") 0.87 0.028
RFCL-22D(7/8") 0.88 0.044 RFCL-
33D(1_1/4") 0.88 0.034
RFCL-42D(1_5/8") 0.87 0.0315

APP
END
IX
15-7 BAND, FREQUENCY, CHANNEL STANDARD
Band, Freq, Channel Std
APPENDIX D. BAND, FREQUENCY, CHANNEL STANDARD
Standard Uplink Downlink
Start Freq Stop Freq Valid Channels Start Freq Stop Freq Valid Channels
GSM
GSM450 450.4MHz 457.6MHz 259≤n≤293 460.4MHz 467.6MHz 259≤n≤293 GSM480 478.8MHz 486.0MHZ 306≤n≤340 488.8MHz 496.0MHz 306≤n≤340 GSM850 824MHz 849MHz 128≤n≤251 869MHz 894MHz 128≤n≤251 GSM900 890MHz 915MHz 1≤n≤124 935.0MHz 960MHz 1≤n≤124
EGSM900 880MHz 915MHz 0≤n≤124
925MHz 960MHz 0≤n≤124
975≤n≤1023 975≤n≤1023
RGSM900 876MHz 915MHz 0≤n≤124
921MHz 960MHz 0≤n≤124
955≤n≤1023 955≤n≤1023 DCS1800 1710MHz 1785MHz 512≤n≤885 1805.0MHz 1880MHz 512≤n≤885 PCS1900 1850MHz 1910MHz 512≤n≤810 1930MHz 1990MHz 512≤n≤810
CDMA
Band 0 (Cellular) 824MHz 849MHz 1≤n≤799
869MHz 894MHz 1≤n≤799
991≤n≤1023 991≤n≤1023 Band 1 (N.A. PCS) 1850MHz 1910MHz 0≤n≤1199 1930MHz 1990MHz 0≤n≤1199 Band 4 (Korean PCS) 1750MHz 1780MHz 0≤n≤599 1840MHz 1870MHz 0≤n≤599
Band 5 (NMT-450) 411.675MHz 483.480MHz
1≤n≤300
421.675MHZ 493.480MHz
1≤n≤300 539≤n≤871 539≤n≤871
1039≤n≤1473 1039≤n≤1473 1792≤n≤2016 1792≤n≤2016
Band 6 (IMT2000) 1920MHz 1980MHz 0≤n≤1199 2100MHz 2170MHZ 0≤n≤1199
Band 10 (2nd 800MHz) 806MHz 901MHz 0≤n≤719
851MHz 940MHz 0≤n≤719
720≤n≤919 720≤n≤919
WCDMA
Band I (2100-General) 1920 1980 9612≤n≤9888 2110 2170 10562≤n≤10838 Band II (1900-General)
1850 1910 9262≤n≤9538
1930 1990 9662≤n≤9938
Band II (1900-Additional) 12≤n≤287 412≤n≤687 Band IV (1700-General)
1710 1775 1312≤n≤1513
2100 2155 1537≤n≤1738
Band IV (1700-Additional) 1662≤n≤1862 1887≤n≤2087 Band V (850-General)
824 849 4132≤n≤4233
869 894 4357≤n≤4458
Band V (850-Additional) 782≤n≤862 1007≤n≤1087
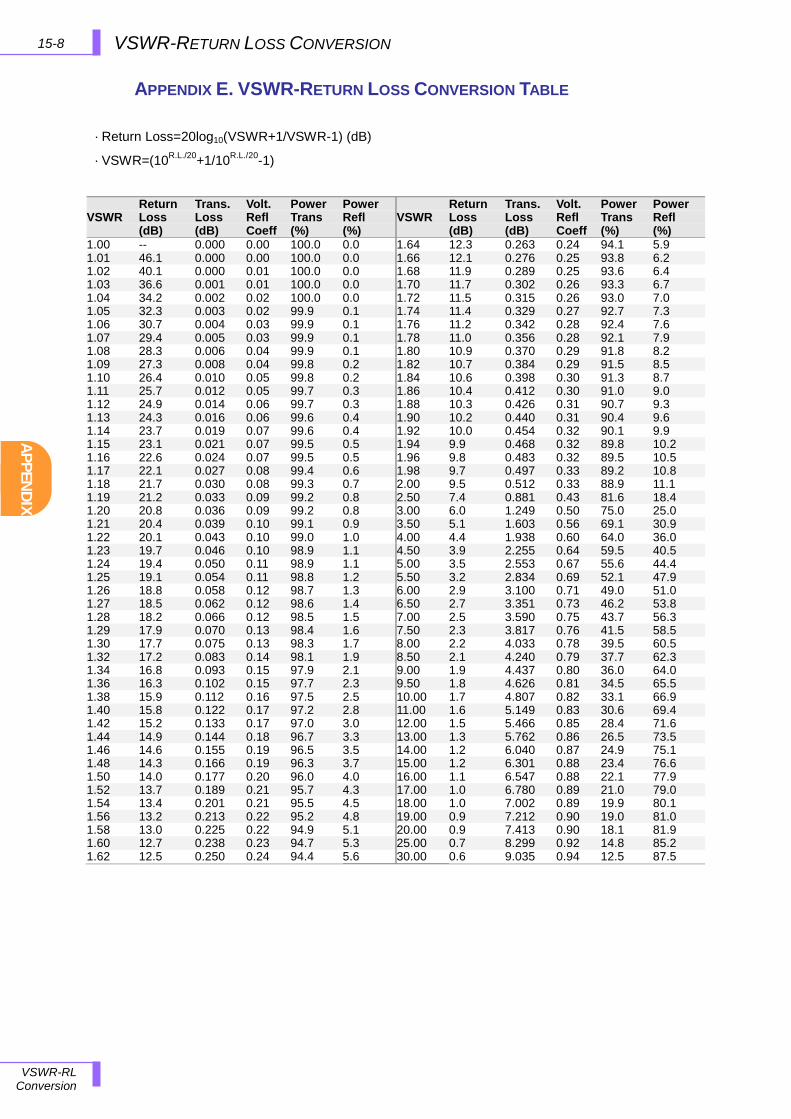
APPEN
DIX
15-8 VSWR-RETURN LOSS CONVERSION
VSWR-RL Conversion
APPENDIX E. VSWR-RETURN LOSS CONVERSION TABLE
· Return Loss=20log10(VSWR+1/VSWR-1) (dB)
· VSWR=(10R.L./20+1/10R.L./20-1)
VSWR Return Loss (dB)
Trans. Loss (dB)
Volt. Refl Coeff
Power Trans (%)
Power Refl (%)
VSWR Return Loss (dB)
Trans. Loss (dB)
Volt. Refl Coeff
Power Trans (%)
Power Refl (%)
1.00 -- 0.000 0.00 100.0 0.0 1.64 12.3 0.263 0.24 94.1 5.9 1.01 46.1 0.000 0.00 100.0 0.0 1.66 12.1 0.276 0.25 93.8 6.2 1.02 40.1 0.000 0.01 100.0 0.0 1.68 11.9 0.289 0.25 93.6 6.4 1.03 36.6 0.001 0.01 100.0 0.0 1.70 11.7 0.302 0.26 93.3 6.7 1.04 34.2 0.002 0.02 100.0 0.0 1.72 11.5 0.315 0.26 93.0 7.0 1.05 32.3 0.003 0.02 99.9 0.1 1.74 11.4 0.329 0.27 92.7 7.3 1.06 30.7 0.004 0.03 99.9 0.1 1.76 11.2 0.342 0.28 92.4 7.6 1.07 29.4 0.005 0.03 99.9 0.1 1.78 11.0 0.356 0.28 92.1 7.9 1.08 28.3 0.006 0.04 99.9 0.1 1.80 10.9 0.370 0.29 91.8 8.2 1.09 27.3 0.008 0.04 99.8 0.2 1.82 10.7 0.384 0.29 91.5 8.5 1.10 26.4 0.010 0.05 99.8 0.2 1.84 10.6 0.398 0.30 91.3 8.7 1.11 25.7 0.012 0.05 99.7 0.3 1.86 10.4 0.412 0.30 91.0 9.0 1.12 24.9 0.014 0.06 99.7 0.3 1.88 10.3 0.426 0.31 90.7 9.3 1.13 24.3 0.016 0.06 99.6 0.4 1.90 10.2 0.440 0.31 90.4 9.6 1.14 23.7 0.019 0.07 99.6 0.4 1.92 10.0 0.454 0.32 90.1 9.9 1.15 23.1 0.021 0.07 99.5 0.5 1.94 9.9 0.468 0.32 89.8 10.2 1.16 22.6 0.024 0.07 99.5 0.5 1.96 9.8 0.483 0.32 89.5 10.5 1.17 22.1 0.027 0.08 99.4 0.6 1.98 9.7 0.497 0.33 89.2 10.8 1.18 21.7 0.030 0.08 99.3 0.7 2.00 9.5 0.512 0.33 88.9 11.1 1.19 21.2 0.033 0.09 99.2 0.8 2.50 7.4 0.881 0.43 81.6 18.4 1.20 20.8 0.036 0.09 99.2 0.8 3.00 6.0 1.249 0.50 75.0 25.0 1.21 20.4 0.039 0.10 99.1 0.9 3.50 5.1 1.603 0.56 69.1 30.9 1.22 20.1 0.043 0.10 99.0 1.0 4.00 4.4 1.938 0.60 64.0 36.0 1.23 19.7 0.046 0.10 98.9 1.1 4.50 3.9 2.255 0.64 59.5 40.5 1.24 19.4 0.050 0.11 98.9 1.1 5.00 3.5 2.553 0.67 55.6 44.4 1.25 19.1 0.054 0.11 98.8 1.2 5.50 3.2 2.834 0.69 52.1 47.9 1.26 18.8 0.058 0.12 98.7 1.3 6.00 2.9 3.100 0.71 49.0 51.0 1.27 18.5 0.062 0.12 98.6 1.4 6.50 2.7 3.351 0.73 46.2 53.8 1.28 18.2 0.066 0.12 98.5 1.5 7.00 2.5 3.590 0.75 43.7 56.3 1.29 17.9 0.070 0.13 98.4 1.6 7.50 2.3 3.817 0.76 41.5 58.5 1.30 17.7 0.075 0.13 98.3 1.7 8.00 2.2 4.033 0.78 39.5 60.5 1.32 17.2 0.083 0.14 98.1 1.9 8.50 2.1 4.240 0.79 37.7 62.3 1.34 16.8 0.093 0.15 97.9 2.1 9.00 1.9 4.437 0.80 36.0 64.0 1.36 16.3 0.102 0.15 97.7 2.3 9.50 1.8 4.626 0.81 34.5 65.5 1.38 15.9 0.112 0.16 97.5 2.5 10.00 1.7 4.807 0.82 33.1 66.9 1.40 15.8 0.122 0.17 97.2 2.8 11.00 1.6 5.149 0.83 30.6 69.4 1.42 15.2 0.133 0.17 97.0 3.0 12.00 1.5 5.466 0.85 28.4 71.6 1.44 14.9 0.144 0.18 96.7 3.3 13.00 1.3 5.762 0.86 26.5 73.5 1.46 14.6 0.155 0.19 96.5 3.5 14.00 1.2 6.040 0.87 24.9 75.1 1.48 14.3 0.166 0.19 96.3 3.7 15.00 1.2 6.301 0.88 23.4 76.6 1.50 14.0 0.177 0.20 96.0 4.0 16.00 1.1 6.547 0.88 22.1 77.9 1.52 13.7 0.189 0.21 95.7 4.3 17.00 1.0 6.780 0.89 21.0 79.0 1.54 13.4 0.201 0.21 95.5 4.5 18.00 1.0 7.002 0.89 19.9 80.1 1.56 13.2 0.213 0.22 95.2 4.8 19.00 0.9 7.212 0.90 19.0 81.0 1.58 13.0 0.225 0.22 94.9 5.1 20.00 0.9 7.413 0.90 18.1 81.9 1.60 12.7 0.238 0.23 94.7 5.3 25.00 0.7 8.299 0.92 14.8 85.2 1.62 12.5 0.250 0.24 94.4 5.6 30.00 0.6 9.035 0.94 12.5 87.5
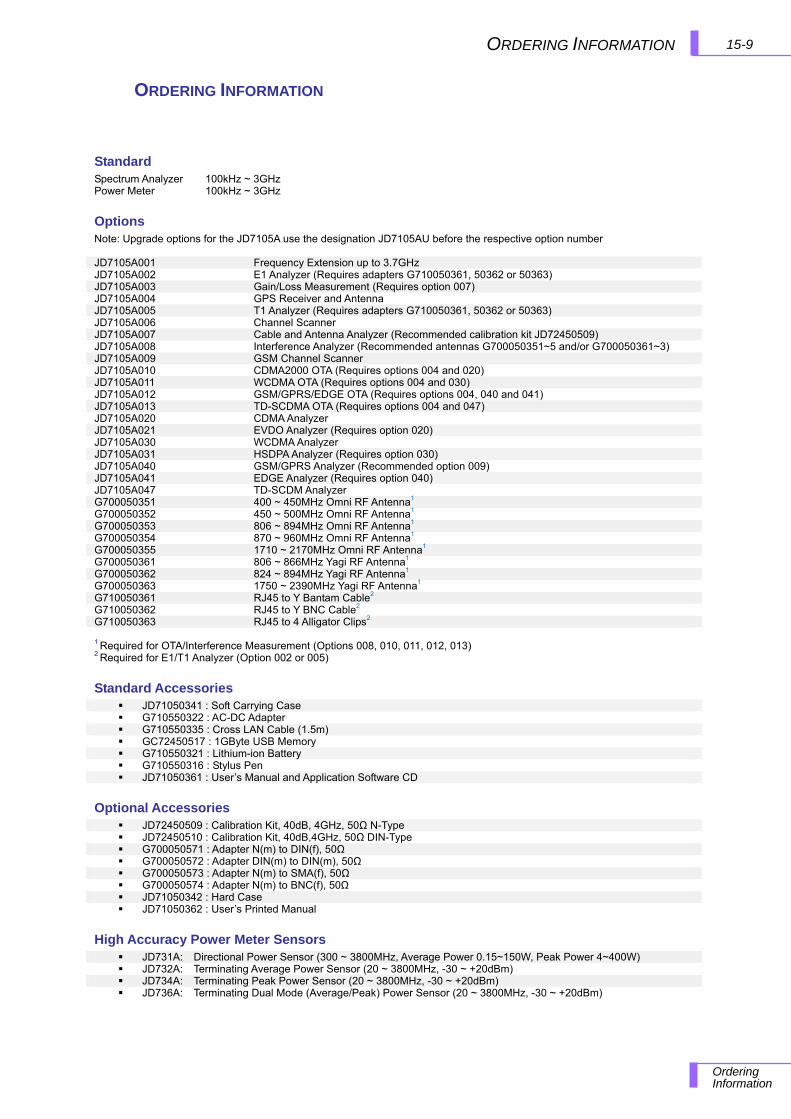
15-9ORDERING INFORMATION
Ordering Information
ORDERING INFORMATION
Standard Spectrum Analyzer 100kHz ~ 3GHz Power Meter 100kHz ~ 3GHz
Options Note: Upgrade options for the JD7105A use the designation JD7105AU before the respective option number JD7105A001 Frequency Extension up to 3.7GHz JD7105A002 E1 Analyzer (Requires adapters G710050361, 50362 or 50363) JD7105A003 Gain/Loss Measurement (Requires option 007) JD7105A004 GPS Receiver and Antenna JD7105A005 T1 Analyzer (Requires adapters G710050361, 50362 or 50363) JD7105A006 Channel Scanner JD7105A007 Cable and Antenna Analyzer (Recommended calibration kit JD72450509) JD7105A008 Interference Analyzer (Recommended antennas G700050351~5 and/or G700050361~3) JD7105A009 GSM Channel Scanner JD7105A010 CDMA2000 OTA (Requires options 004 and 020) JD7105A011 WCDMA OTA (Requires options 004 and 030) JD7105A012 GSM/GPRS/EDGE OTA (Requires options 004, 040 and 041) JD7105A013 TD-SCDMA OTA (Requires options 004 and 047) JD7105A020 CDMA Analyzer JD7105A021 EVDO Analyzer (Requires option 020) JD7105A030 WCDMA Analyzer JD7105A031 HSDPA Analyzer (Requires option 030) JD7105A040 GSM/GPRS Analyzer (Recommended option 009) JD7105A041 EDGE Analyzer (Requires option 040) JD7105A047 TD-SCDM Analyzer G700050351 400 ~ 450MHz Omni RF Antenna1 G700050352 450 ~ 500MHz Omni RF Antenna1 G700050353 806 ~ 894MHz Omni RF Antenna1 G700050354 870 ~ 960MHz Omni RF Antenna1 G700050355 1710 ~ 2170MHz Omni RF Antenna1 G700050361 806 ~ 866MHz Yagi RF Antenna1 G700050362 824 ~ 894MHz Yagi RF Antenna1 G700050363 1750 ~ 2390MHz Yagi RF Antenna1 G710050361 RJ45 to Y Bantam Cable2 G710050362 RJ45 to Y BNC Cable2 G710050363 RJ45 to 4 Alligator Clips2
1 Required for OTA/Interference Measurement (Options 008, 010, 011, 012, 013) 2 Required for E1/T1 Analyzer (Option 002 or 005)
Standard Accessories JD71050341 : Soft Carrying Case G710550322 : AC-DC Adapter G710550335 : Cross LAN Cable (1.5m) GC72450517 : 1GByte USB Memory G710550321 : Lithium-ion Battery G710550316 : Stylus Pen JD71050361 : User’s Manual and Application Software CD
Optional Accessories JD72450509 : Calibration Kit, 40dB, 4GHz, 50Ω N-Type JD72450510 : Calibration Kit, 40dB,4GHz, 50Ω DIN-Type G700050571 : Adapter N(m) to DIN(f), 50Ω G700050572 : Adapter DIN(m) to DIN(m), 50Ω G700050573 : Adapter N(m) to SMA(f), 50Ω G700050574 : Adapter N(m) to BNC(f), 50Ω JD71050342 : Hard Case JD71050362 : User’s Printed Manual
High Accuracy Power Meter Sensors JD731A: Directional Power Sensor (300 ~ 3800MHz, Average Power 0.15~150W, Peak Power 4~400W) JD732A: Terminating Average Power Sensor (20 ~ 3800MHz, -30 ~ +20dBm) JD734A: Terminating Peak Power Sensor (20 ~ 3800MHz, -30 ~ +20dBm) JD736A: Terminating Dual Mode (Average/Peak) Power Sensor (20 ~ 3800MHz, -30 ~ +20dBm)

Test & Measurement Regional Sales
NORTH AMERICA Tel: +1 866 228 3762 Fax: +1 301 353 9216
LATIN AMERICA Tel: +55 11 5503 3800 Fax: +55 11 5505 1598
ASIA PACIFIC Tel: +852 2892 0990 Fax: +852 2892 0770
EMEA Tel: +49 7121 86 2222 Fax: +49 7121 86 1222
© 2009 JDS Uniphase Corporation For the most recent specifications, visit www.jdsu.com. Document Release 1.7
JD7105A