Embed Size (px)
Citation preview
JD WETHERSPOON PLC
11 September 2009
Preliminary Results 2009
2
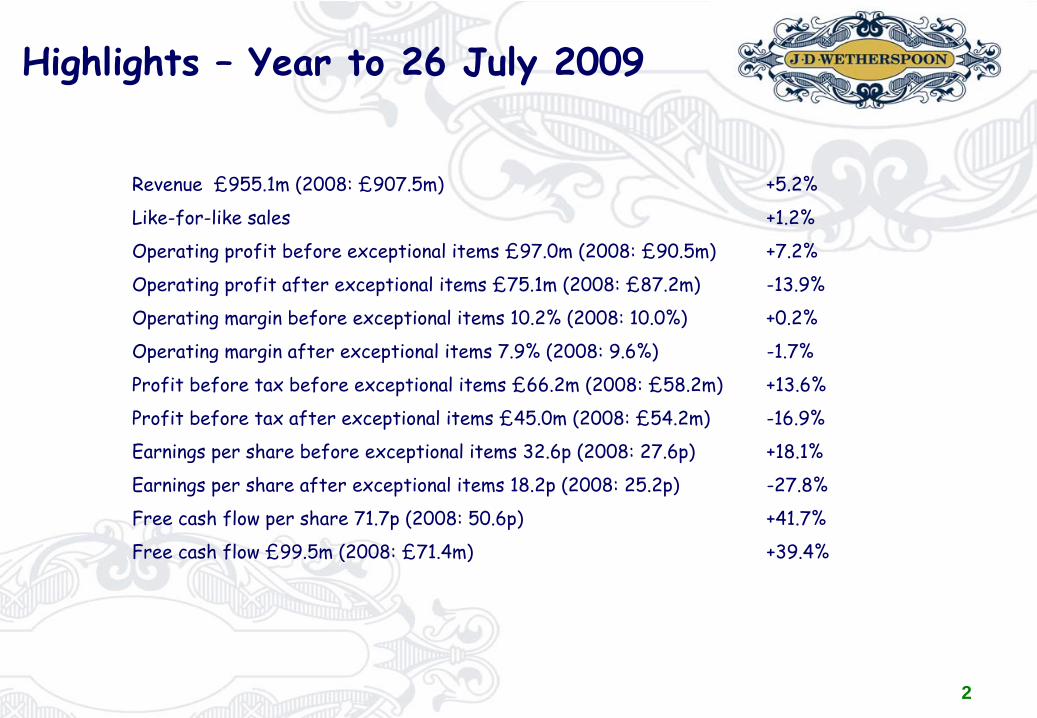
Highlights –
Year to 26 July 2009
Revenue £955.1m (2008: £907.5m)
+5.2%
Like-for-like sales
+1.2%
Operating profit before exceptional items £97.0m (2008: £90.5m)
+7.2%
Operating profit after exceptional items £75.1m (2008: £87.2m)
-13.9%
Operating margin before exceptional items 10.2% (2008: 10.0%)
+0.2%
Operating margin after exceptional items 7.9% (2008: 9.6%)
-1.7%
Profit before tax before exceptional items £66.2m (2008: £58.2m)
+13.6%
Profit before tax after exceptional items £45.0m (2008: £54.2m)
-16.9%
Earnings per share before exceptional items 32.6p (2008: 27.6p)
+18.1%
Earnings per share after exceptional items 18.2p (2008: 25.2p)
-27.8%
Free cash flow per share 71.7p (2008: 50.6p)
+41.7%
Free cash flow £99.5m (2008: £71.4m)
+39.4%
3
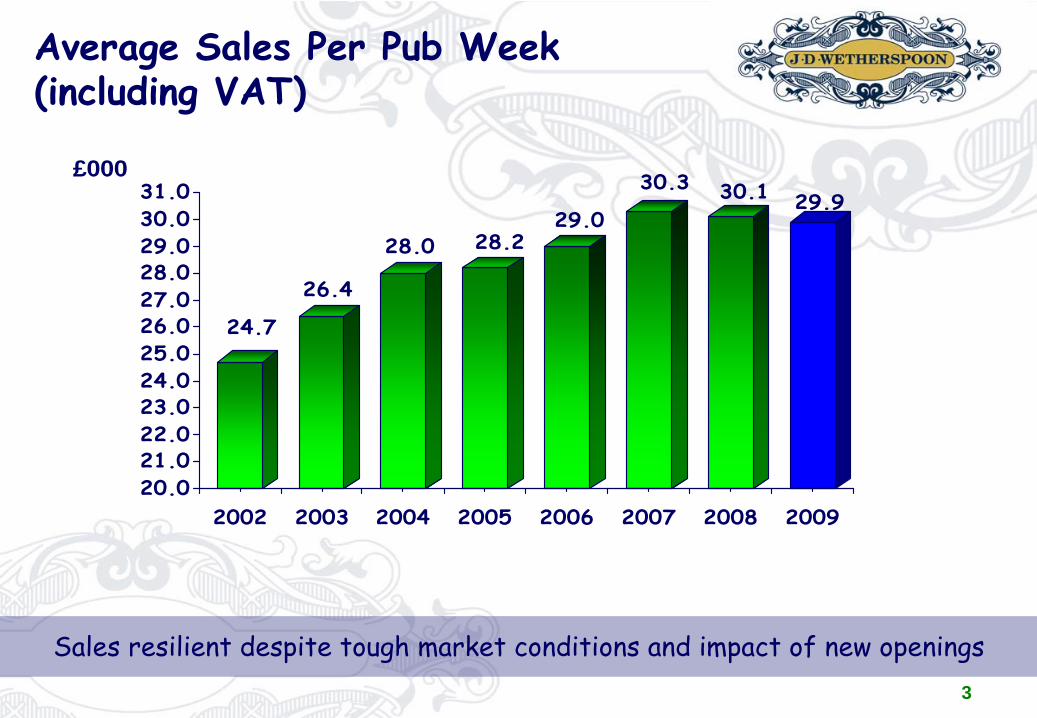
Average Sales Per Pub Week (including VAT)
24.7
26.4
28.0 28.229.0
30.3 30.1 29.9
20.021.022.023.024.025.026.027.028.029.030.031.0
£000
2002 2003 2004 2005 2006 2007 2008 2009
Sales resilient despite tough market conditions and impact of new openings
4
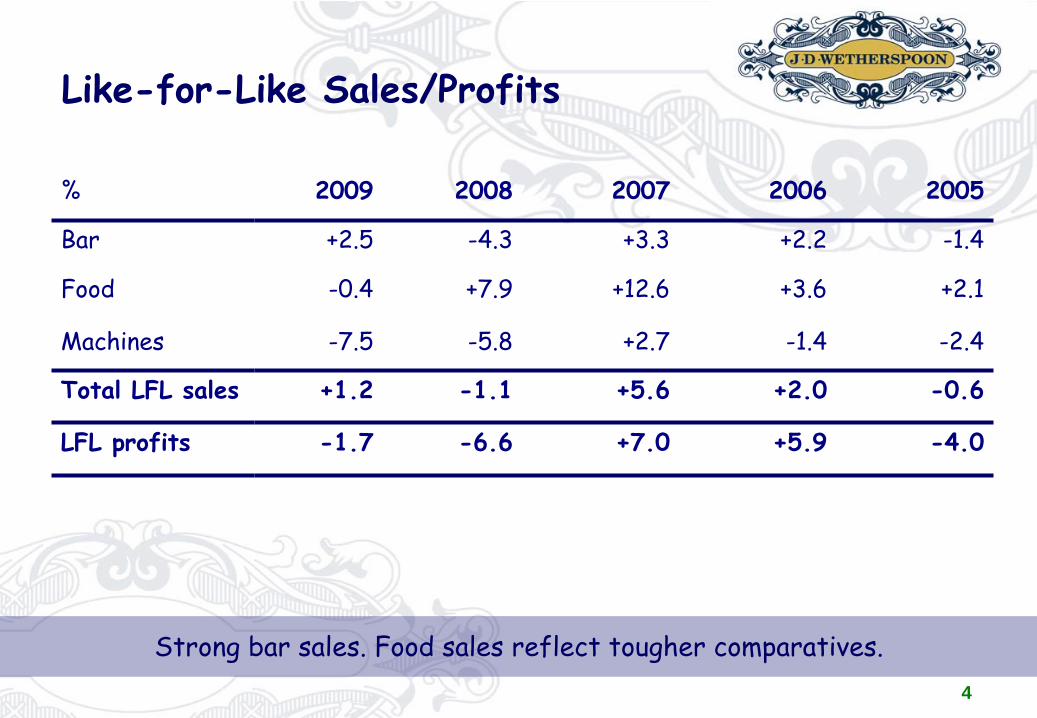
Like-for-Like Sales/Profits
Strong bar sales. Food sales reflect tougher comparatives.
% 2009 2008 2007 2006 2005
Bar +2.5 -4.3 +3.3 +2.2 -1.4
Food -0.4 +7.9 +12.6 +3.6 +2.1
Machines -7.5 -5.8 +2.7 -1.4 -2.4
Total LFL sales +1.2 -1.1 +5.6 +2.0 -0.6
LFL profits -1.7 -6.6 +7.0 +5.9 -4.0
5
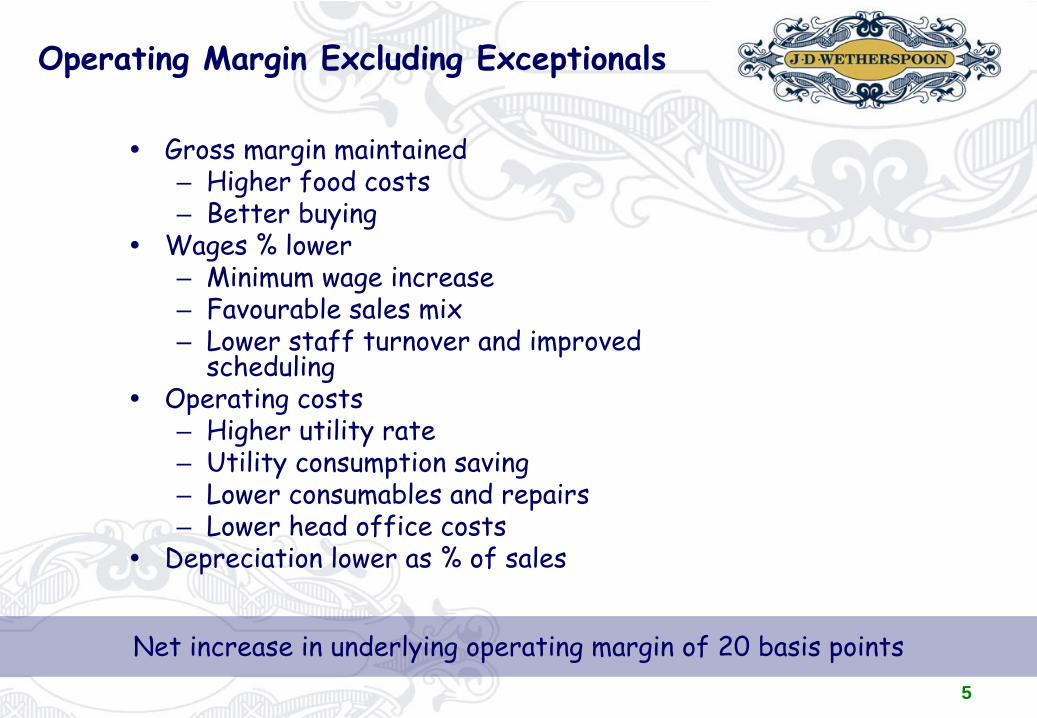
Operating Margin Excluding Exceptionals
Gross margin maintained– Higher food costs– Better buying
Wages % lower– Minimum wage increase– Favourable sales mix– Lower staff turnover and improved
schedulingOperating costs– Higher utility rate– Utility consumption saving– Lower consumables and repairs– Lower head office costs
Depreciation lower as % of sales
Net increase in underlying operating margin of 20 basis points
6
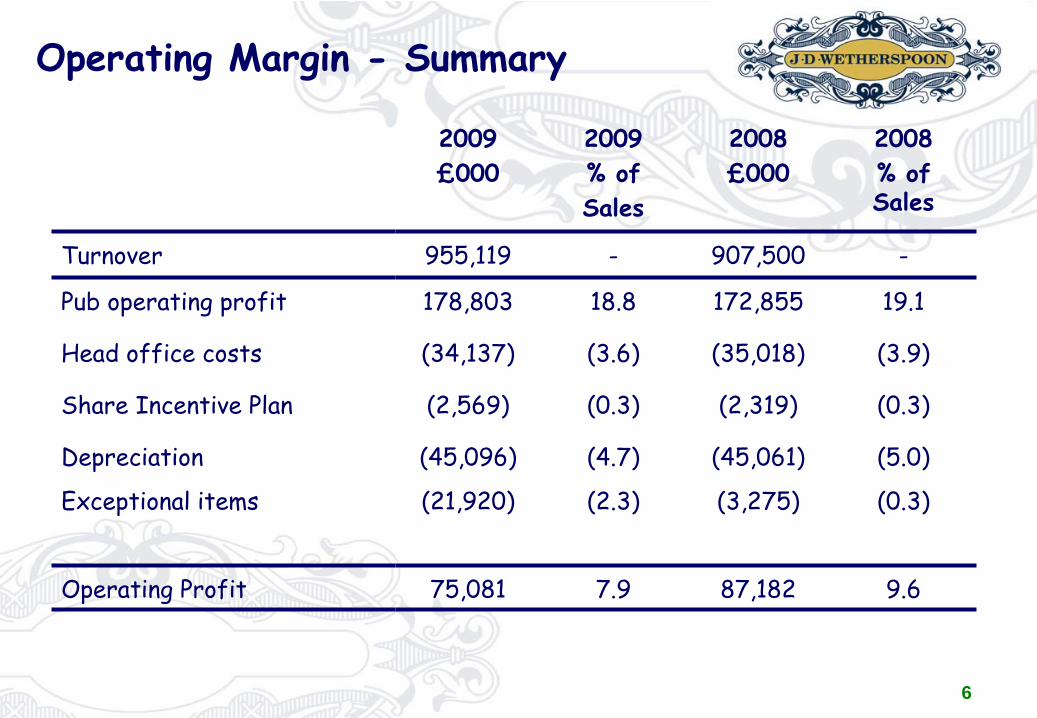
Operating Margin -
Summary
2009£000
2009% of Sales
2008£000
2008 % of Sales
Turnover 955,119 - 907,500 -
Pub operating profit 178,803 18.8 172,855 19.1
Head office costs (34,137) (3.6) (35,018) (3.9)
Share Incentive Plan (2,569) (0.3) (2,319) (0.3)
Depreciation (45,096) (4.7) (45,061) (5.0)
Exceptional items (21,920) (2.3) (3,275) (0.3)
Operating Profit 75,081 7.9 87,182 9.6
7
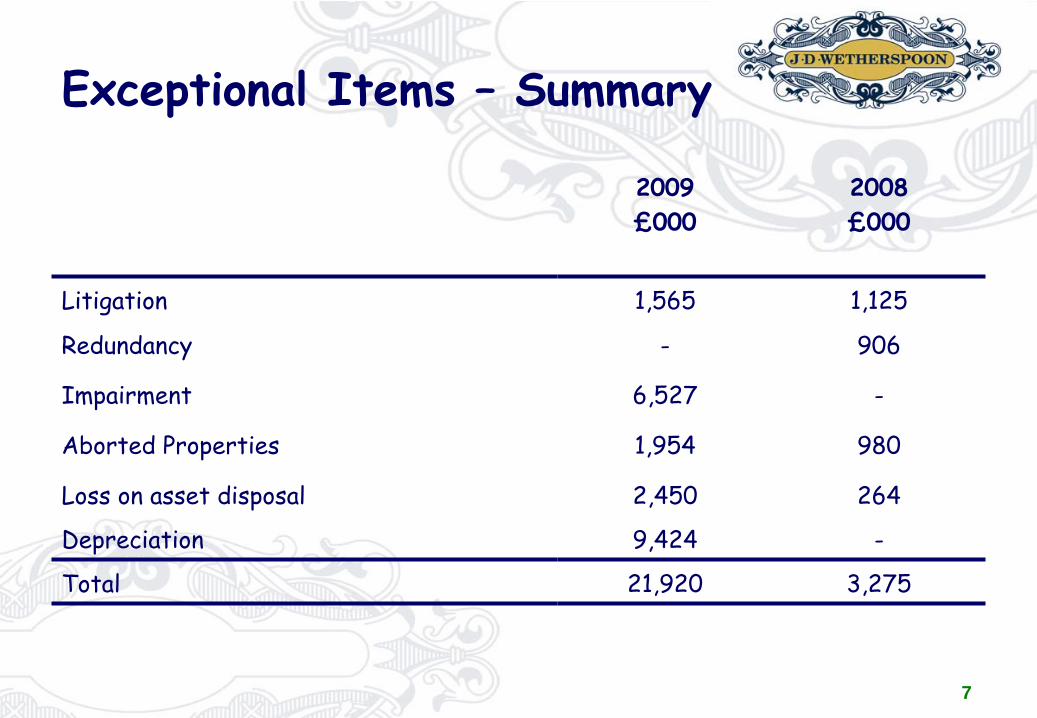
Exceptional Items –
Summary
2009£000
2008£000
Litigation 1,565 1,125
Redundancy - 906
Impairment 6,527 -
Aborted Properties 1,954 980
Loss on asset disposal 2,450 264
Depreciation 9,424 -
Total 21,920 3,275
8
Depreciation
Detailed review of fixed asset register
Some assets not depreciated in line with accounting policy
Exceptional charge relates to prior year impact
Current year impact c£800k
Reclassification of accumulated depreciation of £41.3m out of F & F and into short and long leasehold
NBV of F & F now £73.1m (2008: £46.3m)
F & F depreciation charge now £20.7m (2008: £28.2m)
Based on similar CAPEX spend as this year, would expect depreciation charge to remain relatively constant going forward
9
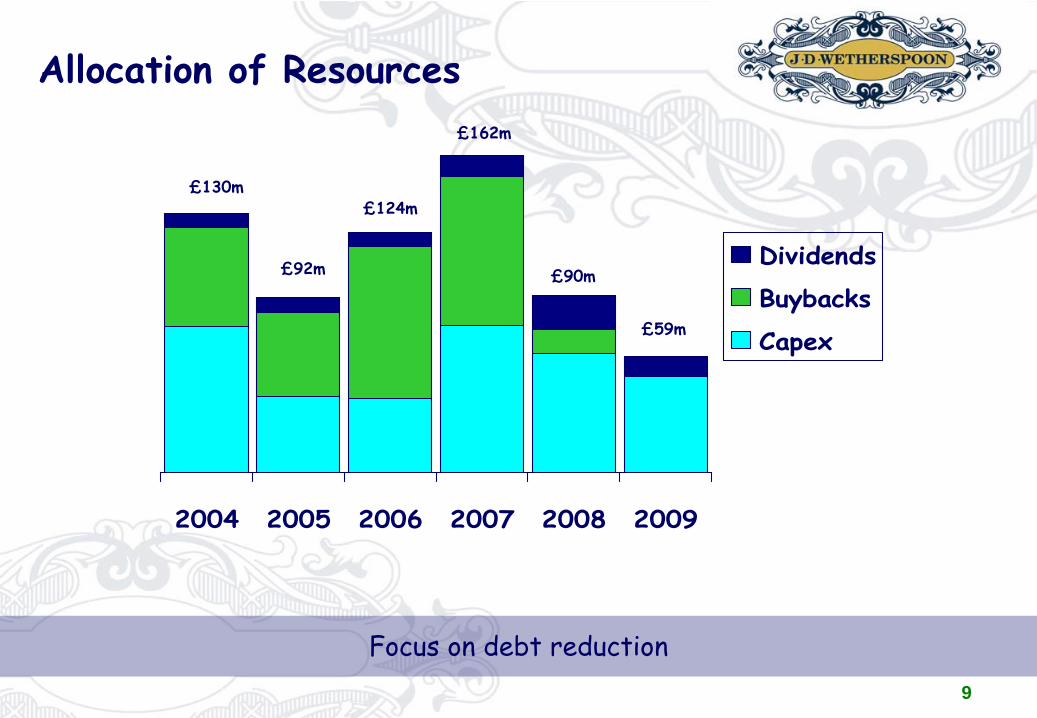
Allocation of Resources
2004 2005 2006 2007 2008 2009
Dividends
Buybacks
Capex
Focus on debt reduction
£130m
£92m
£124m
£162m
£90m
£59m
10
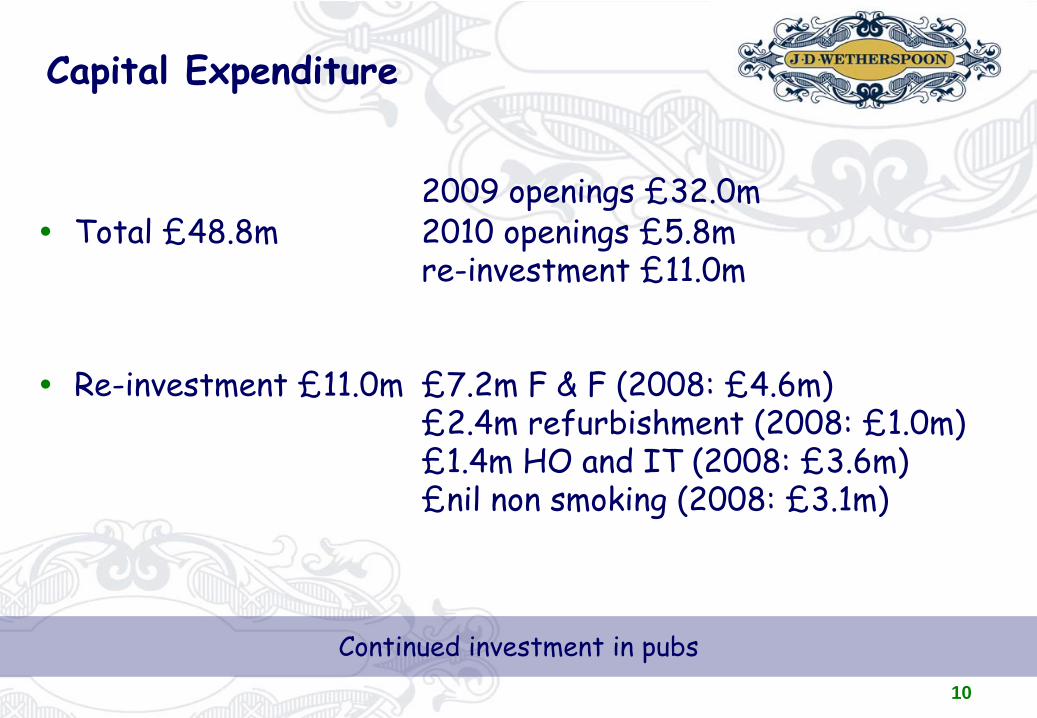
Capital Expenditure
2009 openings £32.0mTotal £48.8m 2010 openings £5.8m
re-investment £11.0m
Re-investment £11.0m £7.2m F & F (2008: £4.6m)£2.4m refurbishment (2008: £1.0m)£1.4m HO and IT (2008: £3.6m)£nil non smoking (2008: £3.1m)
Continued investment in pubs
11
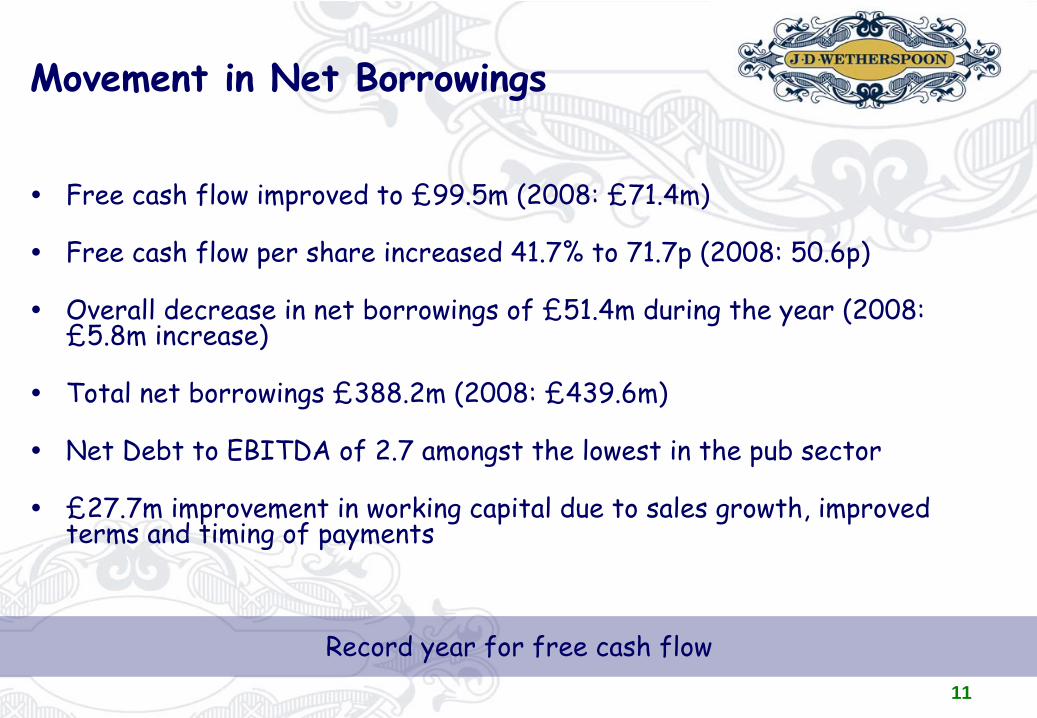
Movement in Net Borrowings
Free cash flow improved to £99.5m (2008: £71.4m)
Free cash flow per share increased 41.7% to 71.7p (2008: 50.6p)
Overall decrease in net borrowings of £51.4m during the year (2008: £5.8m increase)
Total net borrowings £388.2m (2008: £439.6m)
Net Debt to EBITDA of 2.7 amongst the lowest in the pub sector
£27.7m improvement in working capital due to sales growth, improved terms and timing of payments
Record year for free cash flow
12
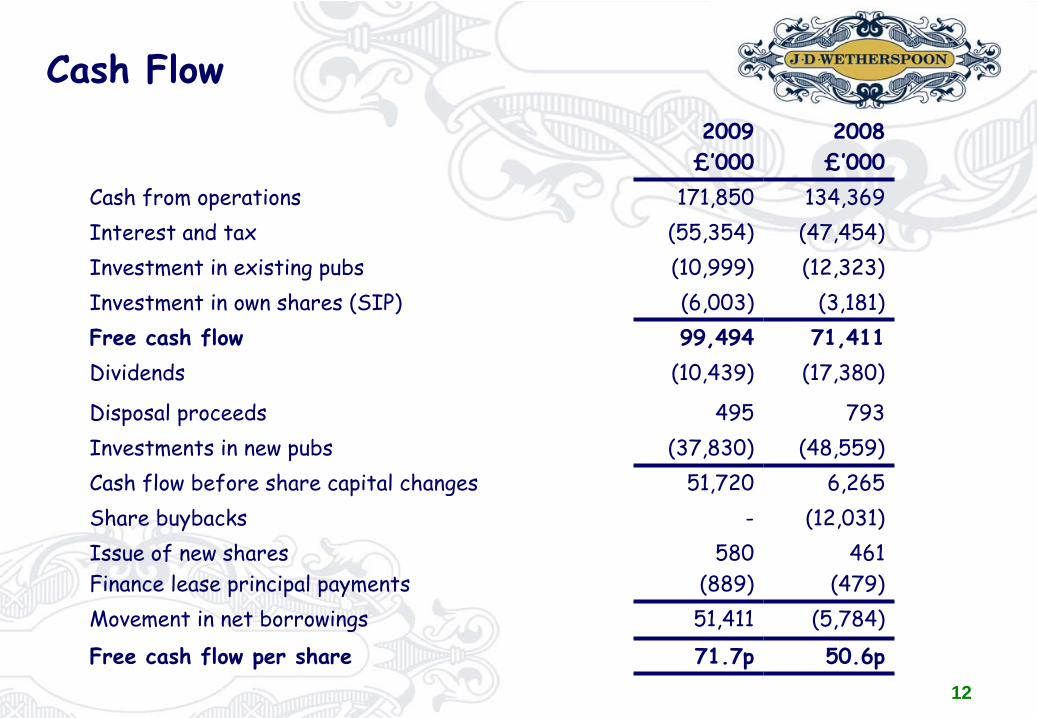
Cash Flow2009£’000
2008£’000
Cash from operations 171,850 134,369Interest and tax (55,354) (47,454)Investment in existing pubs (10,999) (12,323)Investment in own shares (SIP) (6,003) (3,181)Free cash flow 99,494 71,411Dividends (10,439) (17,380)
Disposal proceeds 495 793Investments in new pubs (37,830) (48,559)Cash flow before share capital changes 51,720 6,265Share buybacks - (12,031)Issue of new sharesFinance lease principal payments
580(889)
461(479)
Movement in net borrowings 51,411 (5,784)Free cash flow per share 71.7p 50.6p
13
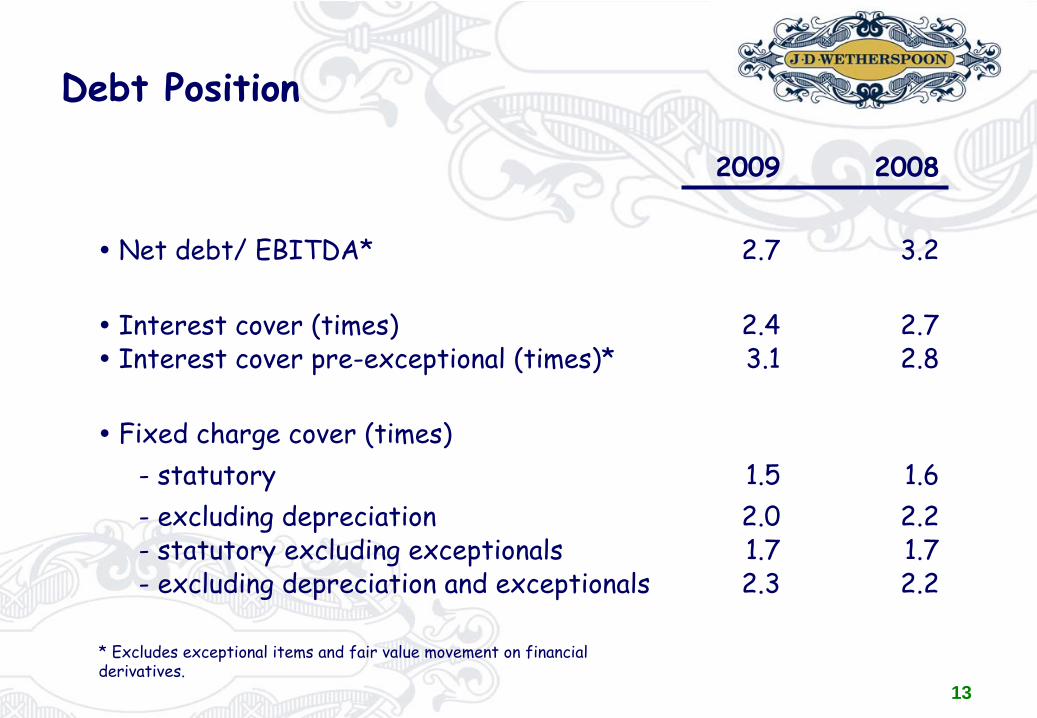
Debt Position
2009 2008
Net debt/ EBITDA* 2.7 3.2
Interest cover (times)Interest cover pre-exceptional (times)*
2.4 3.1
2.72.8
Fixed charge cover (times)-
statutory 1.5 1.6
- excluding depreciation -
statutory excluding exceptionals
-
excluding depreciation and exceptionals
2.01.72.3
2.21.72.2
* Excludes exceptional items and fair value movement on financial derivatives.
14
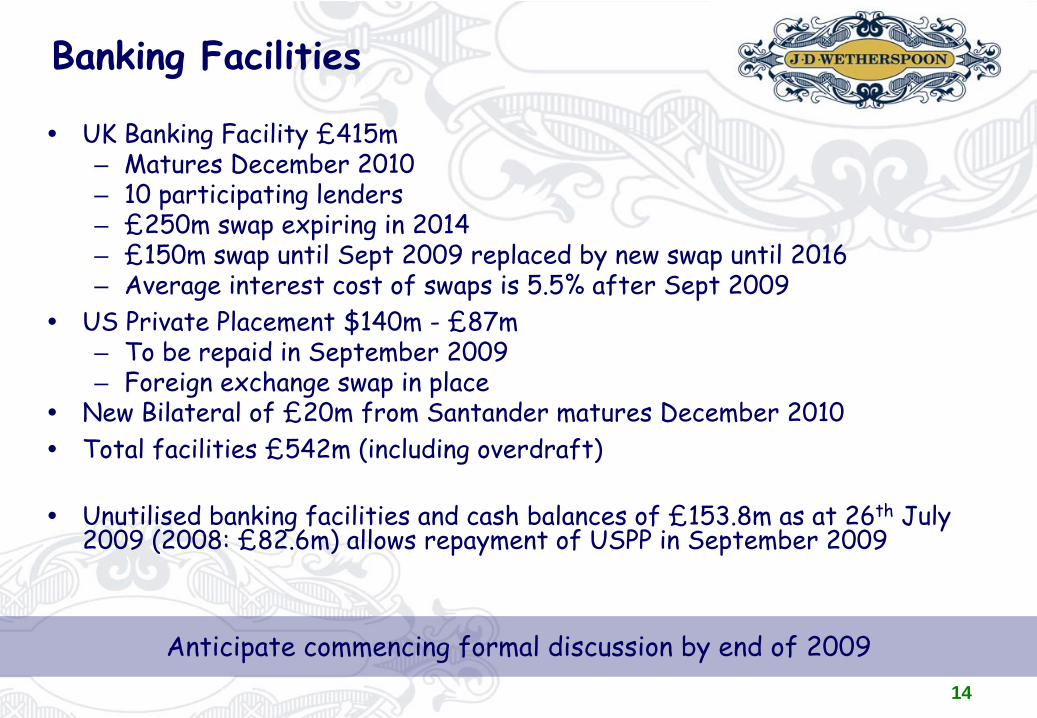
Banking Facilities
UK Banking Facility £415m– Matures December 2010– 10 participating lenders– £250m swap expiring in 2014– £150m swap until Sept 2009 replaced by new swap until 2016– Average interest cost of swaps is 5.5% after Sept 2009
US Private Placement $140m - £87m– To be repaid in September 2009– Foreign exchange swap in place
New Bilateral of £20m from Santander matures December 2010Total facilities £542m (including overdraft)
Unutilised banking facilities and cash balances of £153.8m as at 26th July 2009 (2008: £82.6m) allows repayment of USPP in September 2009
Anticipate commencing formal discussion by end of 2009
15
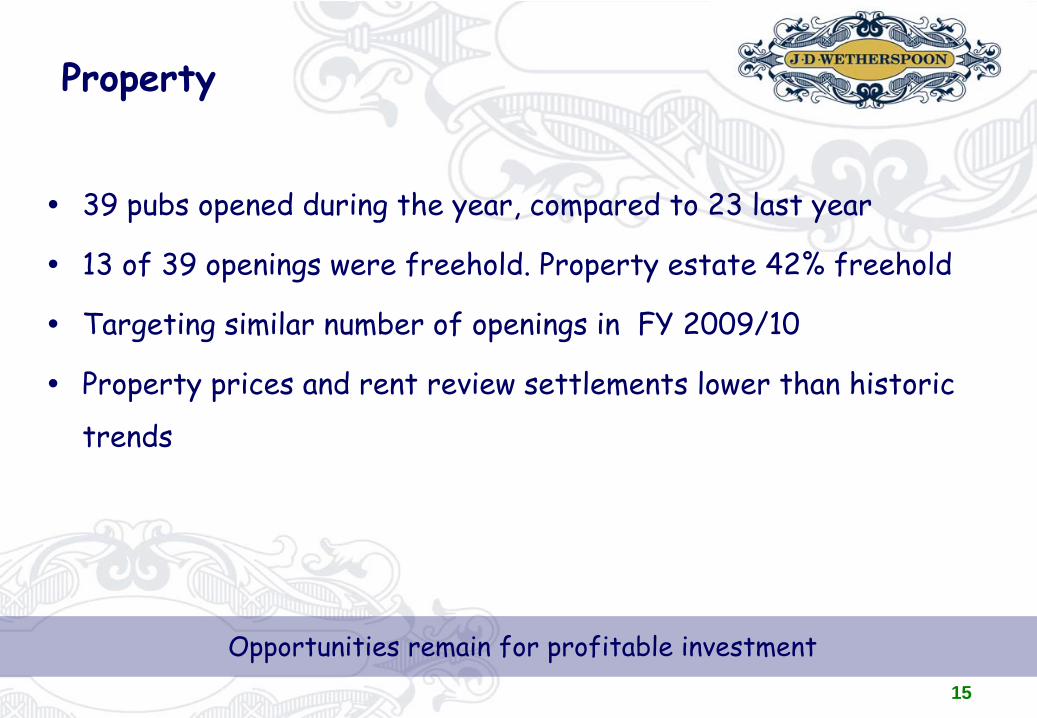
Property
39 pubs opened during the year, compared to 23 last year
13 of 39 openings were freehold. Property estate 42% freehold
Targeting similar number of openings in FY 2009/10
Property prices and rent review settlements lower than historic
trends
Opportunities remain for profitable investment
16
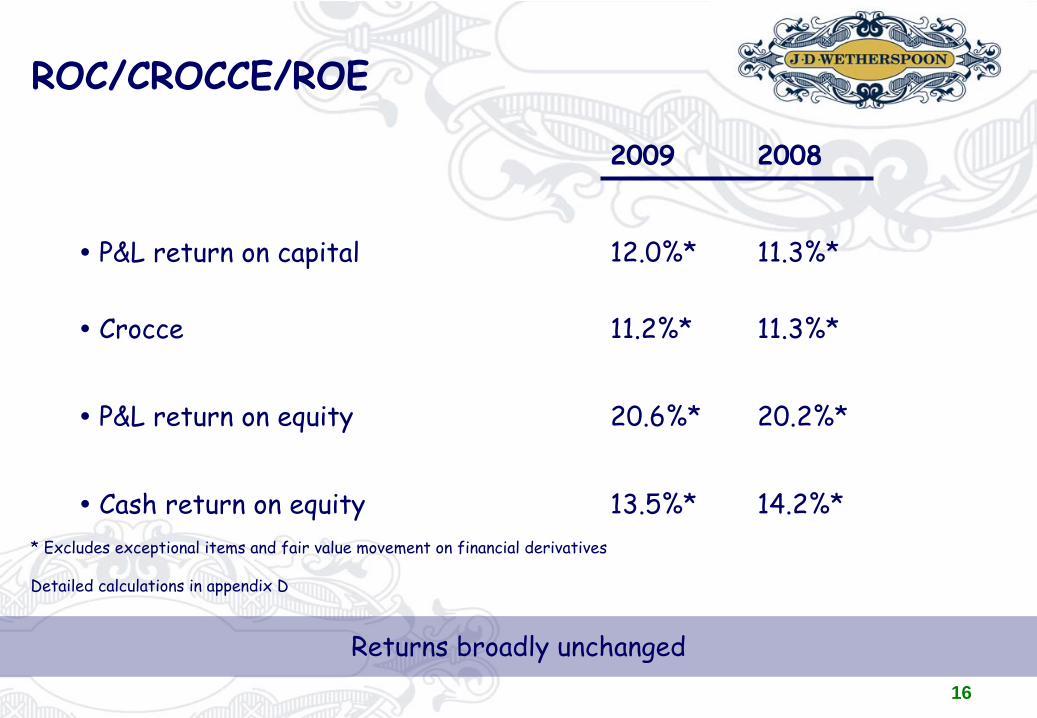
ROC/CROCCE/ROE
2009 2008
P&L return on capital 12.0%* 11.3%*
Crocce 11.2%* 11.3%*
P&L return on equity 20.6%* 20.2%*
Cash return on equity 13.5%* 14.2%** Excludes exceptional items and fair value movement on financial derivatives
Detailed calculations in appendix D
Returns broadly unchanged
17
Trading Performance Summary
Bar sales +2.5%
Food sales flat (tougher comparatives)
Increased costs offset by process and efficiency improvements
and favourable sales mix
18
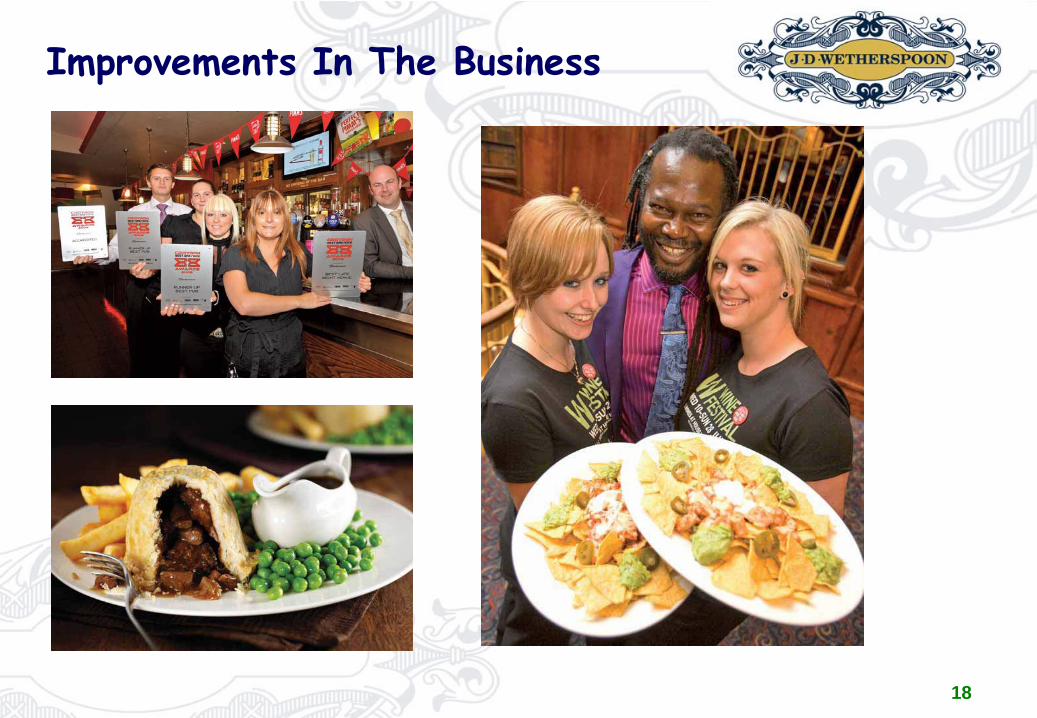
Improvements In The Business
19
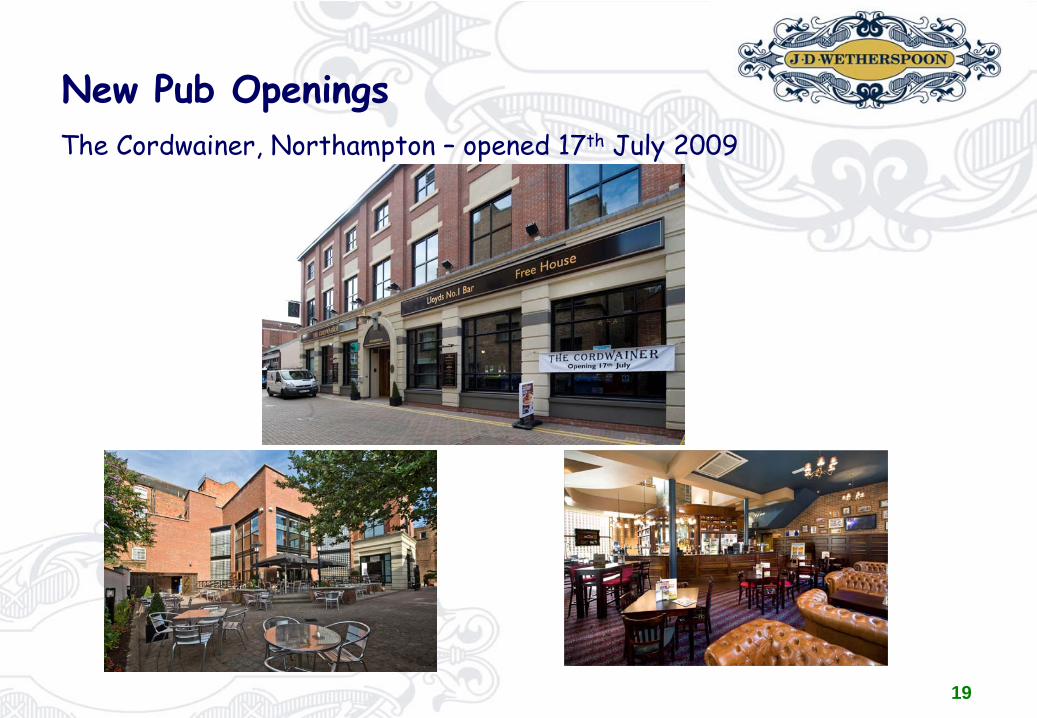
New Pub OpeningsThe Cordwainer, Northampton –
opened 17th
July 2009
20
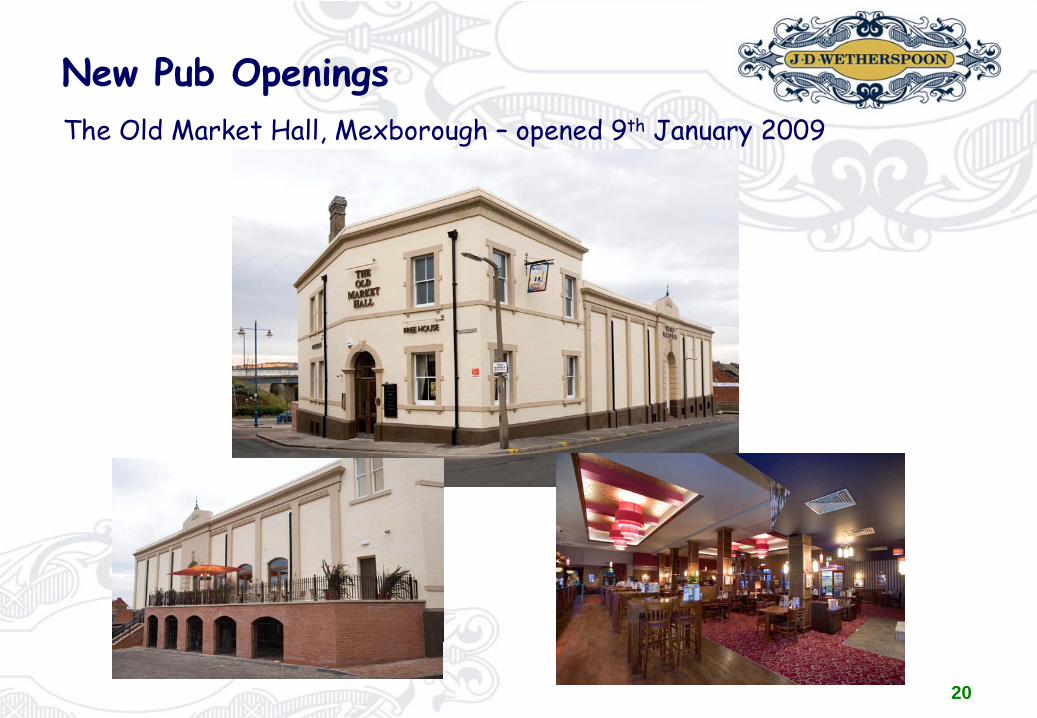
New Pub Openings The Old Market Hall, Mexborough
–
opened 9th
January 2009
21
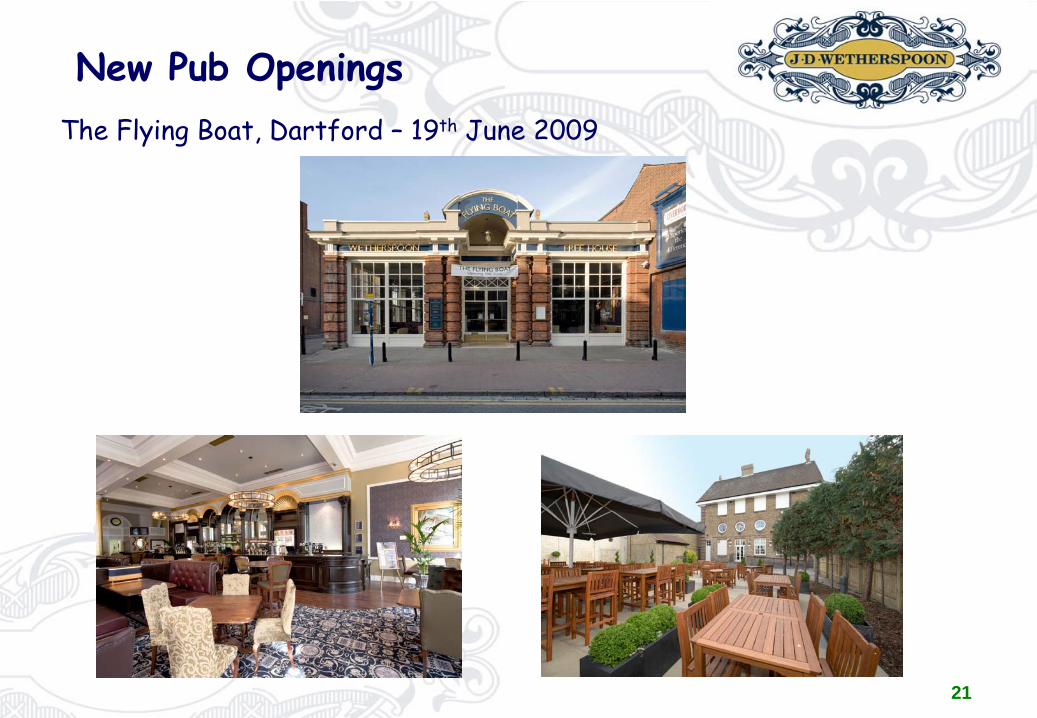
New Pub OpeningsThe Flying Boat, Dartford
–
19th
June 2009
22
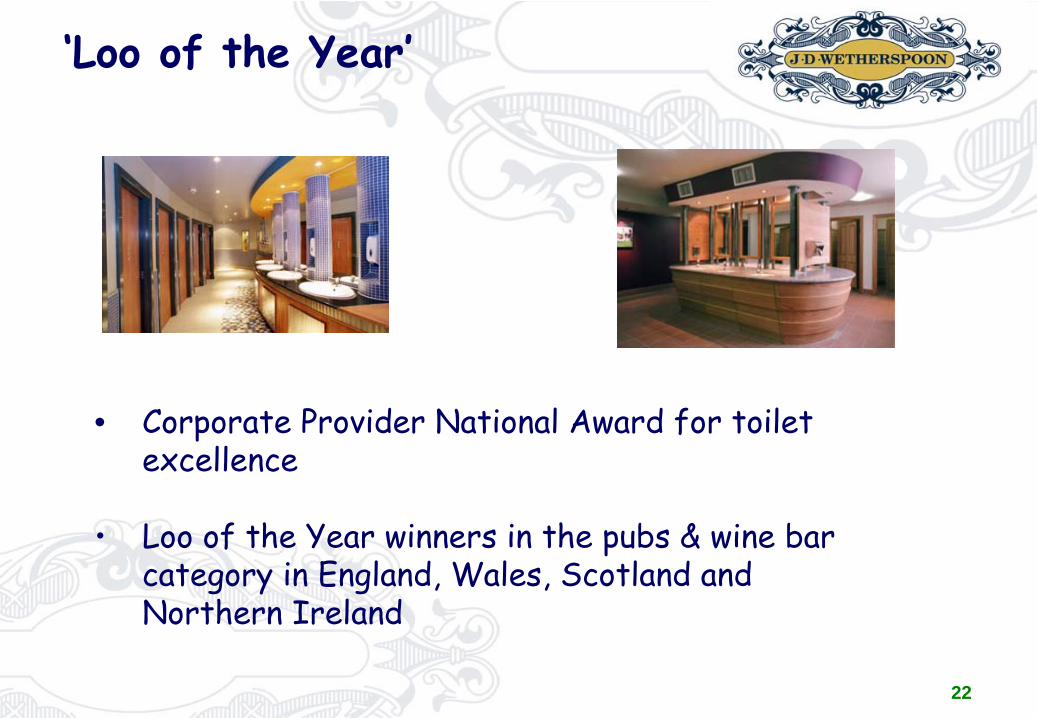
‘Loo of the Year’
• Corporate Provider National Award for toilet excellence
• Loo of the Year winners in the pubs & wine bar category in England, Wales, Scotland and Northern Ireland
23
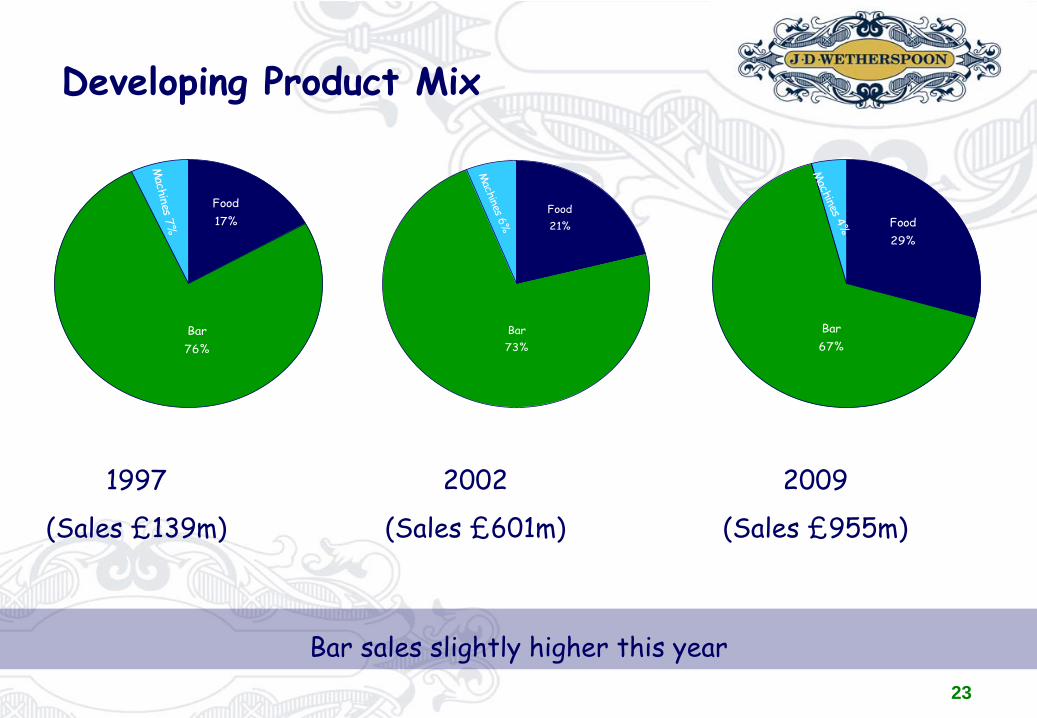
Developing Product Mix
Bar73%
Machines 6%
Food21%
Bar67%
Machines 4% Food
29%
1997
(Sales £139m)
2002
(Sales £601m)
Bar sales slightly higher this year
Bar76%
Machines 7%
Food17%
2009
(Sales £955m)
24
Real Ale & Wine
•
Uplift of 17% in traditional ales this year
•
The biggest real ale and wine festivals in the world –
in April 2009, we sold 3.3m pints of real ale in 20 days
•
Over 650 pubs –96% of the estate -
are Cask Marque accredited
•
JDW stocks over 600 guest ales over the year
•
193 of our pubs are in the CAMRA Good Beer Guide 2010 (2009: 173)
25
People & Training
•
Company employs over 20,000 people in full and part-time positions
•
We are recognised as one of ‘Britain’s Top Employers’
in a Guardian publication for 6 consecutive years
•
Comprehensive award winning employee training system
•
We offer an award winning national Diploma / Degree in Leisure Retail management to managers, in conjunction with Leeds Metropolitan University
•
Average length of service of pub mangers over 8 years
•
First pub retailer to have Learning & Skills Council funding contract recently awarded from government.
•
£20.5m paid in the year on employee bonuses and free shares
26
StandardsCQSMA
Cleanliness, Quality, Service, Maintenance & Atmosphere
Mystery Visit Programme using both External & Internal Callers
Objective to monitor & maintain standards
Detailed reports to provide feedback to the pubs
4,000 calls completed across the estate monthly
Scores contribute to pub bonus structure
Calls discussed at time of visit, followed by detailed form
Current results are the highest yet achieved
27
JDW –
Did You Know?
Number 2 restaurant brand in the UK after McDonalds
Eat Out magazine winner of MenuMasters ‘best menu’ in the Children's category
Third equal biggest coffee seller in UK after Starbucks and Costa
World’s no. 1 seller of ‘Tierra’, Lavazza’s sustainable coffee from Rainforest Alliance
Largest curry restaurant group in the UK
One of only 2 airport catering partners for BAA
Took Ruddles Best to third largest cask ale in the UK the week after launch
28
Current Trading and Outlook
Record sales in 6 weeks to 6th September 2009:
– Total sales +5.8%
– LFL sales +1.2%
Cost outlook better than in recent years re: minumum wage and energy
Seek to maintain current improvements and seek to make further improvements where possible
Stronger comparatives in the first half
Opportunities remain for profitable investment
Confident of future prospects
29
Appendices
A -
10-year financial graphs
B -
10-year trends
C -
Capital trends
D -
ROC/CROCCE/ROE calculations
30
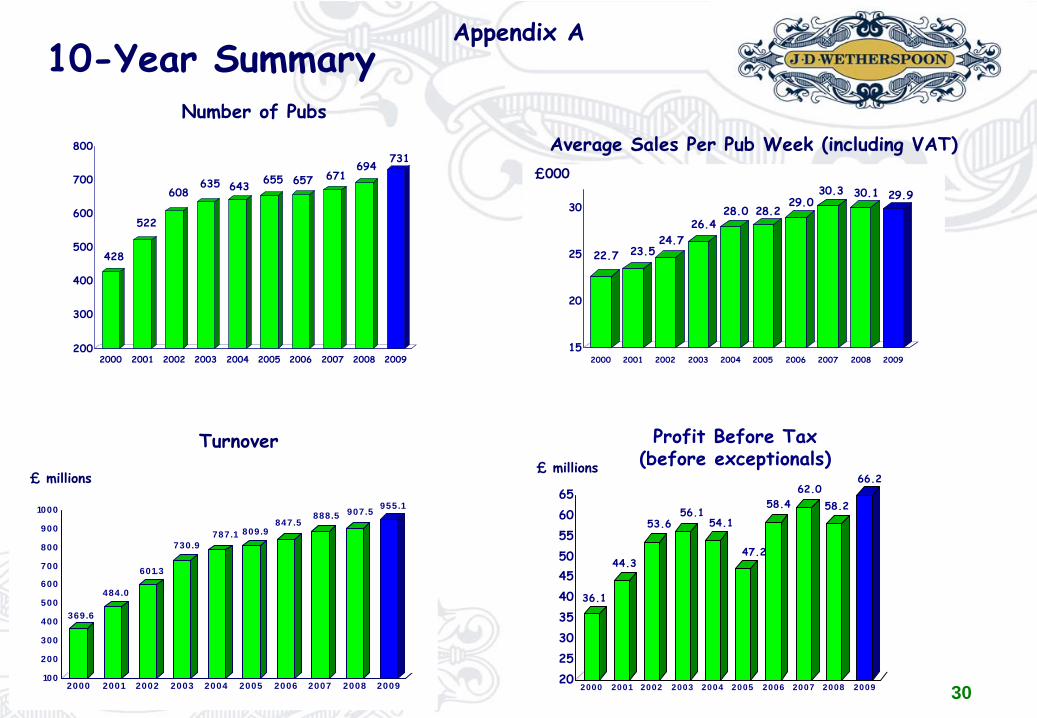
Number of Pubs
428
522
608635 643 655 657 671
694731
200
300
400
500
600
700
800
2000 2001 2002 2003 2004 2005 2006 2007 2008 2009
369.6
484.0
601.3
730.9787.1 809.9
847.5888.5 907.5 955.1
100
200
300
400
500
600
700
800
900
1000
2000 2001 2002 2003 2004 2005 2006 2007 2008 2009
£ millions
Turnover
36.1
44.3
53.656.1
54.1
47.2
58.462.0
58.2
66.2
20253035404550556065
2000 2001 2002 2003 2004 2005 2006 2007 2008 2009
Profit Before Tax (before exceptionals)
22.7 23.524.7
26.428.0 28.2
29.030.3 30.1 29.9
15
20
25
30
2000 2001 2002 2003 2004 2005 2006 2007 2008 2009
Average Sales Per Pub Week (including VAT)£000
10-Year SummaryAppendix A
£ millions
31
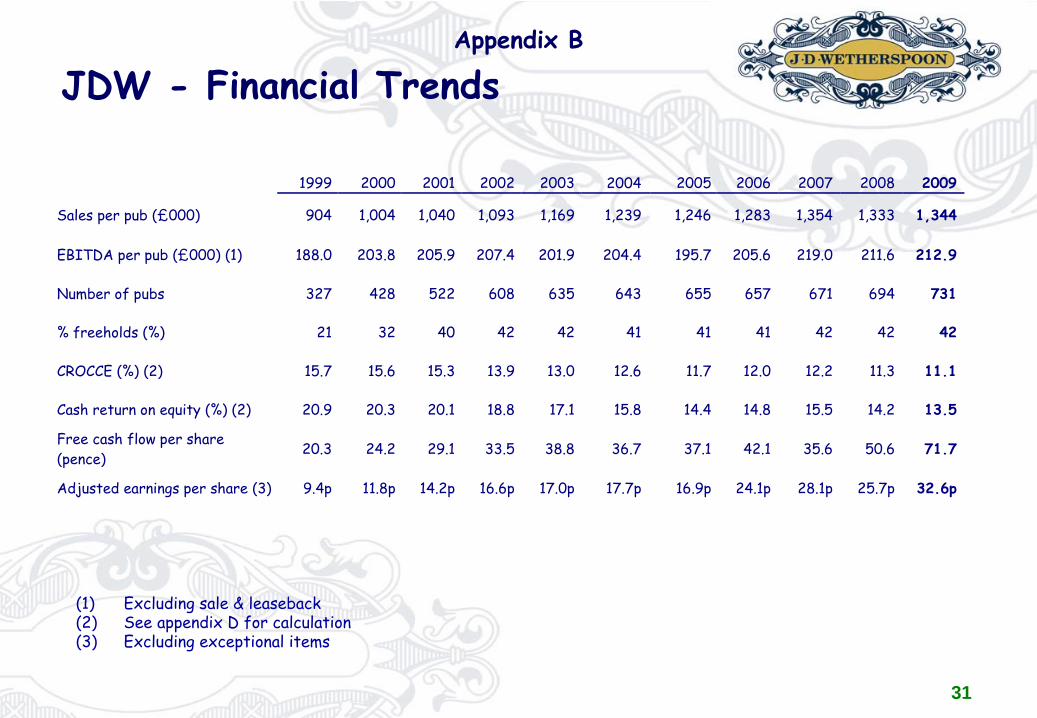
JDW -
Financial Trends
(1) Excluding sale & leaseback (2)
See appendix D for calculation(3)
Excluding exceptional items
1999 2000 2001 2002 2003
2004 2005
2006
2007
2008
2009
Sales per pub (£000) 904 1,004 1,040 1,093 1,169 1,239 1,246 1,283 1,354 1,333 1,344
EBITDA per pub (£000) (1) 188.0 203.8 205.9 207.4 201.9 204.4 195.7 205.6 219.0 211.6 212.9
Number of pubs 327 428 522 608 635 643 655 657 671 694 731
% freeholds (%) 21 32 40 42 42 41 41 41 42 42 42
CROCCE (%) (2) 15.7 15.6 15.3 13.9 13.0 12.6 11.7 12.0 12.2 11.3 11.1
Cash return on equity (%) (2) 20.9 20.3 20.1 18.8 17.1 15.8 14.4 14.8 15.5 14.2 13.5
Free cash flow per share (pence) 20.3 24.2 29.1 33.5 38.8 36.7 37.1 42.1 35.6 50.6 71.7
Adjusted earnings per share (3) 9.4p 11.8p 14.2p 16.6p 17.0p 17.7p 16.9p 24.1p 28.1p 25.7p 32.6p
Appendix B
32
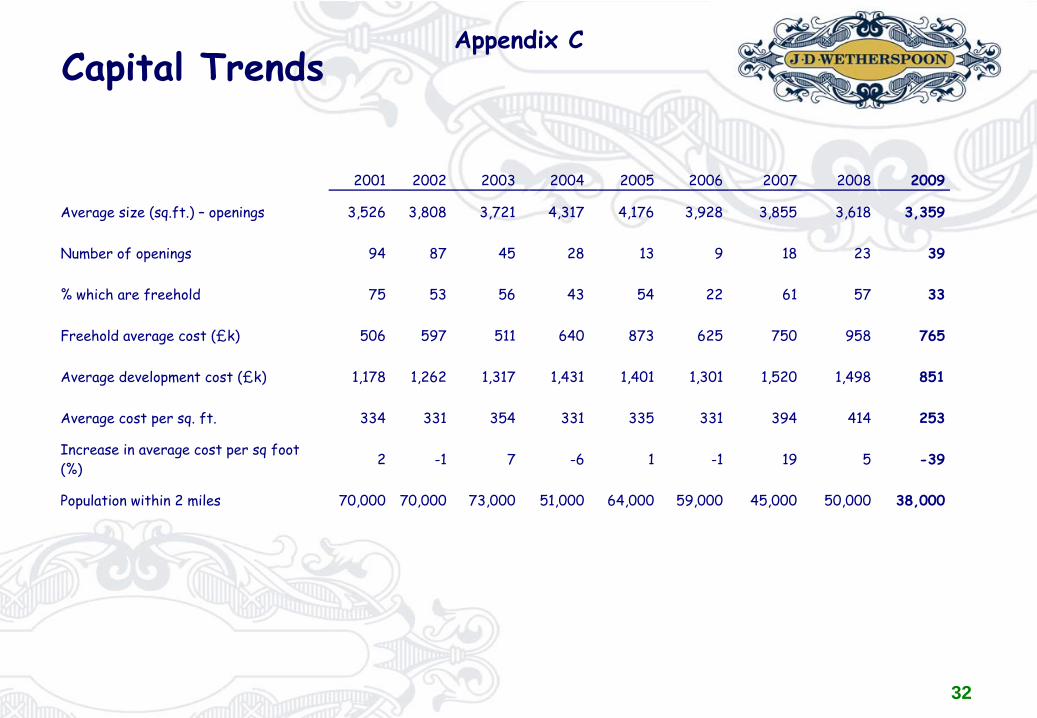
Capital TrendsAppendix C
2001
2002
2003
2004 2005
2006
2007 2008 2009
Average size (sq.ft.) – openings 3,526 3,808 3,721 4,317 4,176 3,928 3,855 3,618 3,359
Number of openings 94 87 45 28 13 9 18 23 39
% which are freehold 75 53 56 43 54 22 61 57 33
Freehold average cost (£k) 506 597 511 640 873 625 750 958 765
Average development cost (£k) 1,178 1,262 1,317 1,431 1,401 1,301 1,520 1,498 851
Average cost per sq. ft. 334 331 354 331 335 331 394 414 253
Increase in average cost per sq foot (%) 2 -1 7 -6 1 -1 19 5 -39
Population within 2 miles 70,000 70,000 73,000 51,000 64,000 59,000 45,000 50,000 38,000
33
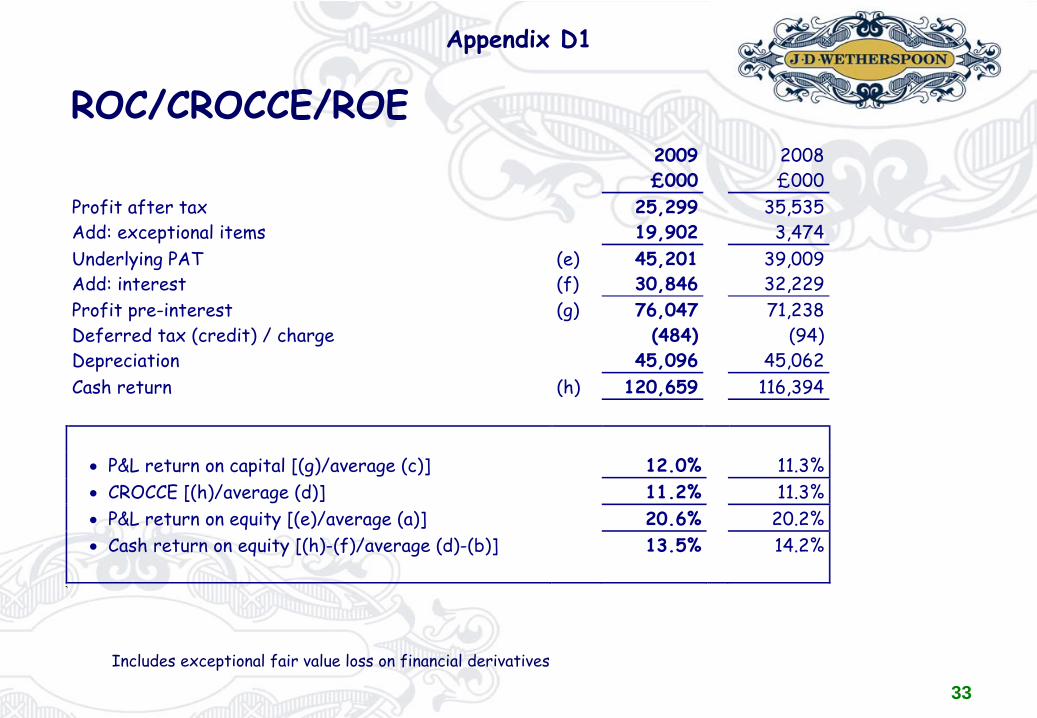
ROC/CROCCE/ROE
Appendix D1
Includes exceptional fair value loss on financial derivatives
2009 £000
2008 £000
Profit after tax 25,299 35,535 Add: exceptional items 19,902 3,474 Underlying PAT (e) 45,201 39,009 Add: interest (f) 30,846 32,229 Profit pre-interest (g) 76,047 71,238 Deferred tax (credit) / charge (484) (94) Depreciation 45,096 45,062 Cash return (h) 120,659 116,394
• P&L return on capital [(g)/average (c)] 12.0% 11.3% • CROCCE [(h)/average (d)] 11.2% 11.3% • P&L return on equity [(e)/average (a)] 20.6% 20.2% • Cash return on equity [(h)-(f)/average (d)-(b)]
13.5% 14.2%
`
34
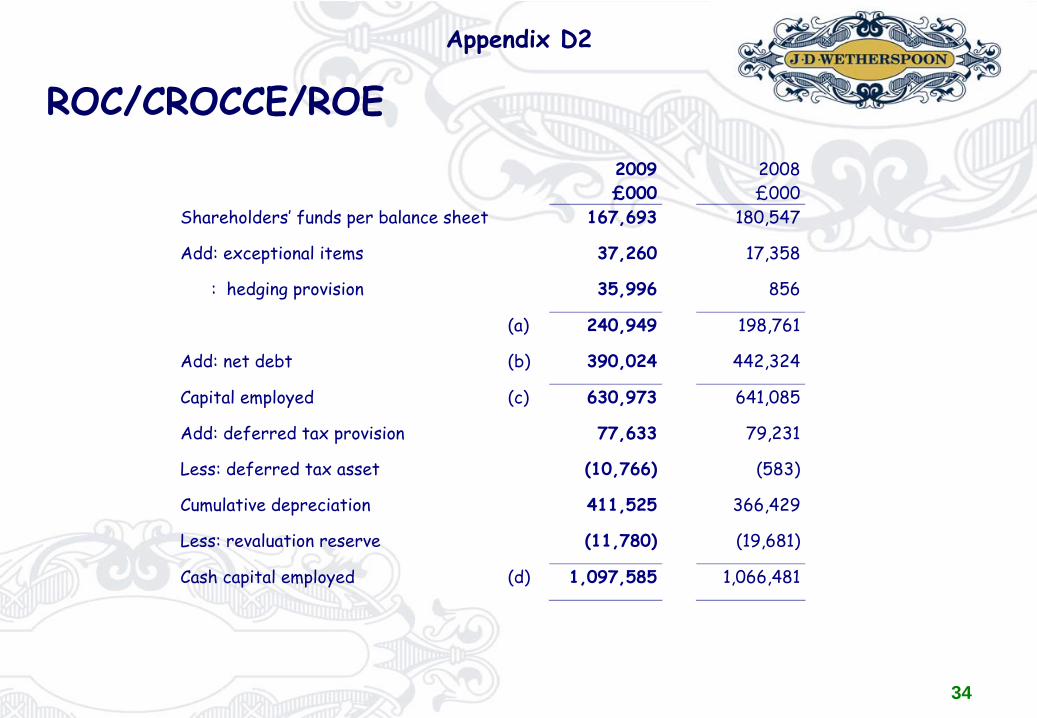
ROC/CROCCE/ROE 2009
£000 2008
£000 Shareholders’ funds per balance sheet 167,693 180,547
Add: exceptional items 37,260 17,358
: hedging provision 35,996 856
(a) 240,949 198,761
Add: net debt (b) 390,024 442,324
Capital employed (c) 630,973 641,085
Add: deferred tax provision 77,633 79,231
Less: deferred tax asset (10,766) (583)
Cumulative depreciation 411,525 366,429
Less: revaluation reserve (11,780) (19,681)
Cash capital employed (d) 1,097,585 1,066,481
Appendix D2


![Link Farmer[countryside] to Customer[downtown]. Downtown Valley F F F F F F F F](https://img.pdfslide.us/doc/110x75/56649f385503460f94c55132/link-farmercountryside-to-customerdowntown-downtown-valley-f-f-f-f-f-f.jpg)