Embed Size (px)
Citation preview
http://www.iaeme.com/IJMET/index.asp 572 [email protected]
International Journal of Mechanical Engineering and Technology (IJMET)
Volume 9, Issue 1, January 2018, pp. 572–586, Article ID: IJMET_09_01_062
Available online at http://www.iaeme.com/IJMET/issues.asp?JType=IJMET&VType=9&IType=1
ISSN Print: 0976-6340 and ISSN Online: 0976-6359
© IAEME Publication Scopus Indexed
JAPMRMT: JAVA APPLICATION
PERFORMANCE MONITORING AND
RESOURCE MGMT TOOLKIT
Shashank Kumar Mishra, Manjula R
Computer Science Department VIT University,
Vellore, Tamil Nadu, India
ABSTRACT
This paper describes “Java Application Performance Monitoring and Resource
Management Toolkit” (JAPMRMT), which is developed for monitoring the application
as well as taking corrective action to reduce the human intervention and make sure
the environment to be healthy and functional always.
The limitation of the existing Application Monitoring (APM) tools follow reactive
approach that provides information about the impacted component/system but doesn’t
have the capability to take corrective measures. On the other hand, JAPMRMT
monitors the application-performance parameters and OS components, where it
observes the behavior and take proactive-action when any of the strange pattern get
acknowledge.
JAPMRMT monitors the application and OS components through event traces,
where each event symbolizes the occurrence of any issue in the environment for eg.
Application-performance downgrade/high response-time/high volume of load or high
resource-utilization etc.
JAPMRMT is an open toolkit, its event trace API can be used to analyze the
availability/performance-matrix of application and OS components. Tool-Overhead
w.r.t OS resource utilization is also reduced by categorizing the applications in
groups i.e. Platinum (most critical), gold (core, business hours) and silver (less risky),
where each group has different monitoring-mechanism and time-window.
The primary purpose of JAPMRMT is to explore the new dimension of
administrative-approach of APM monitoring-tools to make it more powerful and
reliable in order to recognize as well as rectify the problem simultaneously.
Key words: JAPMRMT, JAVA, Resource Mgmt Toolkit, APM
Cite this Article: Shashank Kumar Mishra, Manjula R, JAPMRMT: Java Application
Performance Monitoring and Resource Mgmt Toolkit, International Journal of
Mechanical Engineering and Technology 9(1), 2018, pp. 572–586.
http://www.iaeme.com/IJMET/issues.asp?JType=IJMET&VType=9&IType=1
JAPMRMT: Java Application Performance Monitoring and Resource Mgmt Toolkit
http://www.iaeme.com/IJMET/index.asp 573 [email protected]
1. INTRODUCTION
Application Performance Monitoring (APM) tools changed a lot over a period of time in order
to monitor and provide accurate-data/ reports for distributed/cloud platform but scope of
improvements never end. It‟s a challenging area, where tools should be more flexible to adopt
rapid changing technologies.
Many customized reports can be generated through APM-tool like OS-Resource
Utilization/ Application thread Pool Report, Costly-query report from DB etc. as per the
business requirement.Moreover,it gives the flexibility to create the customized-dashboard and
alert-utility.
APM tools are very robust and accurate on monitoring perspective but a severe-problem
may arise when the application having zero-tolerance regarding downtime becomes
unavailable due to some irregularity or defect.
Is there any methodology to avoid or get buffer time before issue occurred?
For example, CPU utilization for platinum/gold category application-server goes beyond
critical limit and all the JVM‟s running in that application-server experience the “CPU
starvation” or “Thread scheduling got delayed” . Due to this end customer experience the
slowness or request-timeout which may lead JVM crash situation if it is not fixed ASAP. In
this situation, tools will generate the critical alert and notify an administrator to take
appropriate action but cannot prevent the outage as time consumed by APM tool and
administrator reaction.
In the scenarios mentioned above, JAPMRMT tool would be useful as it uses four phase
approach starting from identify the issue where tool pick the critical event trace, then analyze
the problem, refers to current utilization vs allocation and trigger the additional vCPU request
to global zone, later implementation and verification phase, On-fly global zone assign the
requested vCPU to local zone, and monitor the situation of application server to make sure it
would be better and utilization goes down. In final step notify the administrator to find out the
reason for same.
JAPMRMT tool is having capabilities to filter the problematic event traces, interpret them
and take action against them based on defined rules and historical action pattern; in such a
way it reduced the application availability risk by 6% and capability to capture the logs during
the problematic time window by 9%. In the toolkit, customize rule creation option is also
available , through that thread and core dump can be generated based on rule for example,
generate the core and thread dump if application thread pool got stuck and more than 30% of
threads will be in hung state.
There are many ways to verify the performance, such as load/stress testing of application
components or application response time during peak hours. In this paper, we are assuming
that load/stress testing of implementation components already done. Here we are
concentrating on the performance of deployed application based on response time.
2. LITERATURE SURVEY
This section analyzes the research relating to enhancement of open source APM tool. The
implemented tool in the study is JAPMRMT. The study examines the various open sources
APM monitoring tool available for application performance and availability.
Shashank Kumar Mishra, Manjula R
http://www.iaeme.com/IJMET/index.asp 574 [email protected]
According to the report by (Tom, 2017), the following includes available tools for APM
monitoring. Nagios is one good example from the story. It is fast, trustworthy and extremely
customizable. Nagios is used worldwide to monitor the complex infrastructure and very
flexible to modify based on infra setup, but it‟s hard to implement, non-user friendly GUI,
Lack of automatic device discovery. The second is Icinga. Which is a public open source
monitoring system, it is used to verify the hosts and availability of the services, it is similar to
Nagios, but it has some better functionality as compare to Nagios like, more rapid
development cycle, but it also has configuration and runtime limitations.
The third APM tool from the report is Observium is a Linux-based, command-line driven
product with a web-based observing GUI. It collects the data from different devices using
SNMP and displays those data in graphical pattern using web interface. It is flexible enough
to integrate with third-party applications and the ability to write your custom application
modules to gather the data and report from use.it defines the full range of monitoring entities,
it generates the alert or triggers the alarm based on it. It is having the excellent user interface
with new skins and useful reporting mechanism but another hand; it is not having direct
export or reporting capabilities. (Dowling & Ben, 2009).
Stage monitor is also APM monitoring tool java based open source monitoring solution; it
is built to support during development, quality assurance, and production. A single instance of
surveillance agent can monitor all your applications, instances and hosts. It is extendable, so
the user can write an own plugin, track own metrics and create customize dashboard. It
supports the cluster monitoring also, but it has limitation to not providing the suggestions
based on historical data, unable to capture traces and dump during issue arisen.
Sensu also includes APM monitoring tool which is programmed with Ruby which uses
RabbitMQ. It is the one of the best cloud monitoring solution. RabbitMQ is a central server
which monitors the incoming and out coming flow request. Carbon takes the data from
RabbitMQ and puts it into the graph. Sensu is very simple to use and easy to scalable for
cloud infrastructure, but the main drawback is difficulty to implement and alerting is not as
advanced as it is in another tool like DataDog or Scout.
3. OVERVIEW AND MAIN FEATURES
Most of the available monitoring tools are either doing the event or time-driven based
measuring, but this tool is the combination of both. This tool is working as a time-driven tool
for gold and silver applications, where it monitors the utilization of resources and response
time along with notifying the administrator if any abnormal behavior will be observed during
the production hours.
Event based monitoring tools applies mostly on platinum application, where it monitors
implementation in full time. The administrator is notified if any service goes down and also
when the following happens: hardware consumptions goes above the threshold value, Java
application related issues occurred like thread hung, CPU/Memory starvation and crashing of
JVM. Also adding and subtraction of the hardware resources on-fly if is required.
JAPMRMT: Java Application Performance Monitoring and Resource Mgmt Toolkit
http://www.iaeme.com/IJMET/index.asp 575 [email protected]
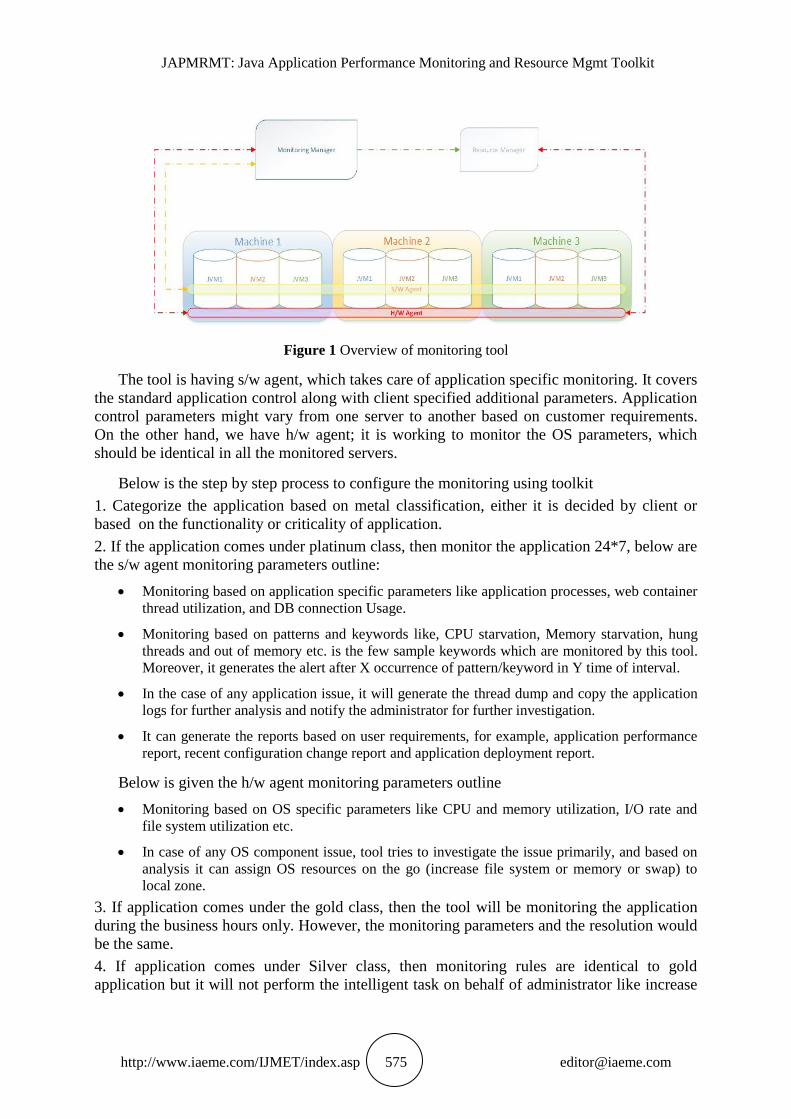
Figure 1 Overview of monitoring tool
The tool is having s/w agent, which takes care of application specific monitoring. It covers
the standard application control along with client specified additional parameters. Application
control parameters might vary from one server to another based on customer requirements.
On the other hand, we have h/w agent; it is working to monitor the OS parameters, which
should be identical in all the monitored servers.
Below is the step by step process to configure the monitoring using toolkit
1. Categorize the application based on metal classification, either it is decided by client or
based on the functionality or criticality of application.
2. If the application comes under platinum class, then monitor the application 24*7, below are
the s/w agent monitoring parameters outline:
Monitoring based on application specific parameters like application processes, web container
thread utilization, and DB connection Usage.
Monitoring based on patterns and keywords like, CPU starvation, Memory starvation, hung
threads and out of memory etc. is the few sample keywords which are monitored by this tool.
Moreover, it generates the alert after X occurrence of pattern/keyword in Y time of interval.
In the case of any application issue, it will generate the thread dump and copy the application
logs for further analysis and notify the administrator for further investigation.
It can generate the reports based on user requirements, for example, application performance
report, recent configuration change report and application deployment report.
Below is given the h/w agent monitoring parameters outline
Monitoring based on OS specific parameters like CPU and memory utilization, I/O rate and
file system utilization etc.
In case of any OS component issue, tool tries to investigate the issue primarily, and based on
analysis it can assign OS resources on the go (increase file system or memory or swap) to
local zone.
3. If application comes under the gold class, then the tool will be monitoring the application
during the business hours only. However, the monitoring parameters and the resolution would
be the same.
4. If application comes under Silver class, then monitoring rules are identical to gold
application but it will not perform the intelligent task on behalf of administrator like increase
Shashank Kumar Mishra, Manjula R
http://www.iaeme.com/IJMET/index.asp 576 [email protected]
the OS resources on-fly or generate the dumps and collect the logs during problematic time
interval.
So, this tool is the combination of both event and time driven monitoring. It is more than a
monitoring tool which can perform the basic middleware administrative task. It is very simple
to implement and it is flexible enough to modify as per client requirements.
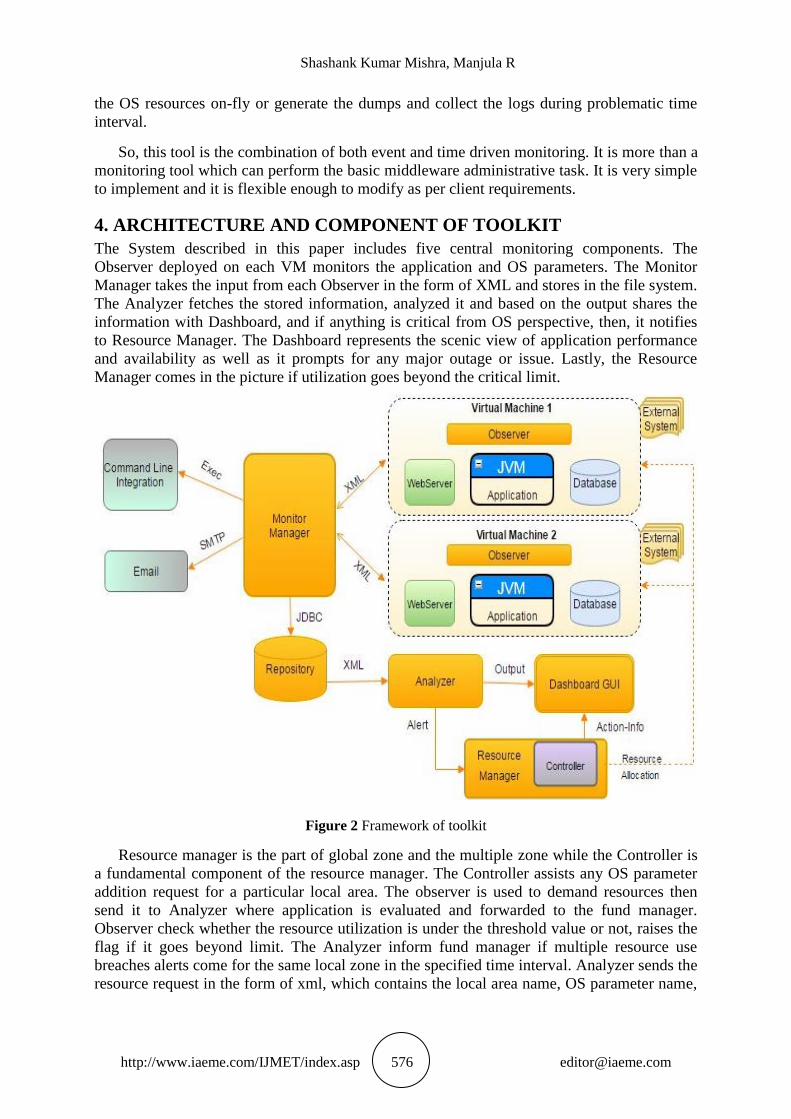
4. ARCHITECTURE AND COMPONENT OF TOOLKIT
The System described in this paper includes five central monitoring components. The
Observer deployed on each VM monitors the application and OS parameters. The Monitor
Manager takes the input from each Observer in the form of XML and stores in the file system.
The Analyzer fetches the stored information, analyzed it and based on the output shares the
information with Dashboard, and if anything is critical from OS perspective, then, it notifies
to Resource Manager. The Dashboard represents the scenic view of application performance
and availability as well as it prompts for any major outage or issue. Lastly, the Resource
Manager comes in the picture if utilization goes beyond the critical limit.
Figure 2 Framework of toolkit
Resource manager is the part of global zone and the multiple zone while the Controller is
a fundamental component of the resource manager. The Controller assists any OS parameter
addition request for a particular local area. The observer is used to demand resources then
send it to Analyzer where application is evaluated and forwarded to the fund manager.
Observer check whether the resource utilization is under the threshold value or not, raises the
flag if it goes beyond limit. The Analyzer inform fund manager if multiple resource use
breaches alerts come for the same local zone in the specified time interval. Analyzer sends the
resource request in the form of xml, which contains the local area name, OS parameter name,
JAPMRMT: Java Application Performance Monitoring and Resource Mgmt Toolkit
http://www.iaeme.com/IJMET/index.asp 577 [email protected]
Current Utilization, etc. The controller assigns the resources as per request to make sure the
availability of the system is 24*7.
In the tool, administrator can monitor the application availability, utilization of resources
and fetch the multiple reports using command line utility. It is easy to design, more secure and
fast to access the information, apart from fetching the information, tool notify the alerts to
administrator using mail utility.
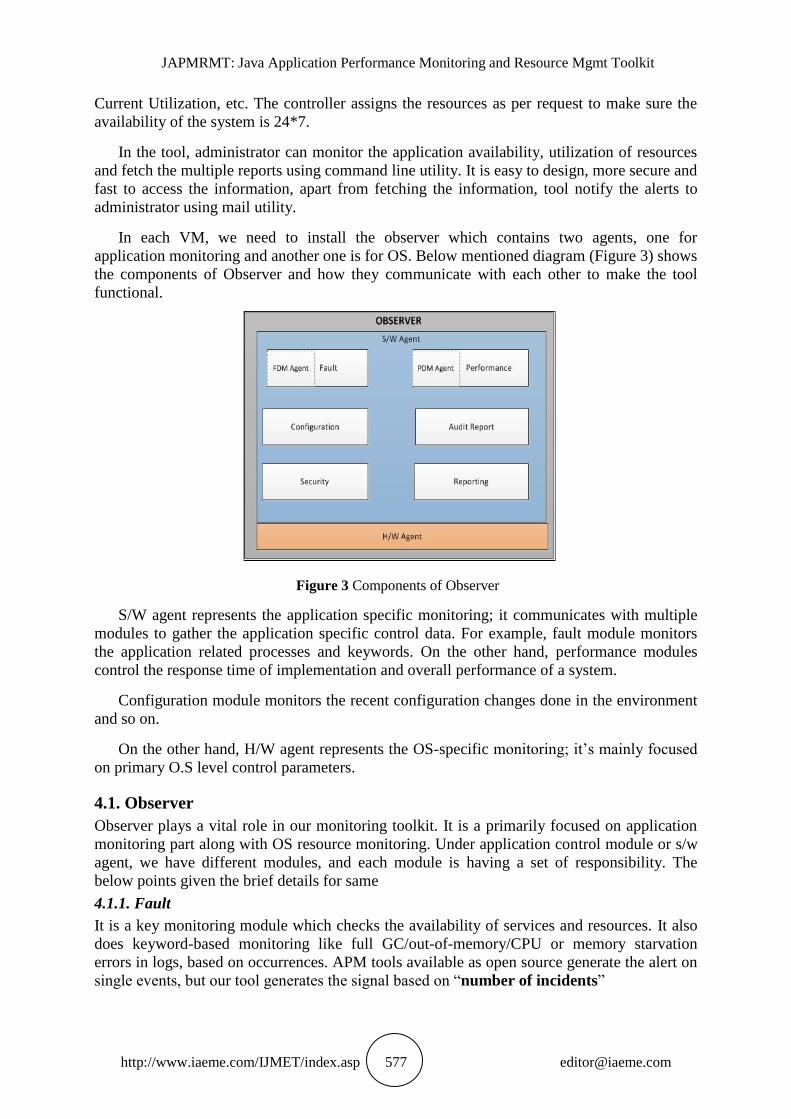
In each VM, we need to install the observer which contains two agents, one for
application monitoring and another one is for OS. Below mentioned diagram (Figure 3) shows
the components of Observer and how they communicate with each other to make the tool
functional.
Figure 3 Components of Observer
S/W agent represents the application specific monitoring; it communicates with multiple
modules to gather the application specific control data. For example, fault module monitors
the application related processes and keywords. On the other hand, performance modules
control the response time of implementation and overall performance of a system.
Configuration module monitors the recent configuration changes done in the environment
and so on.
On the other hand, H/W agent represents the OS-specific monitoring; it‟s mainly focused
on primary O.S level control parameters.
4.1. Observer
Observer plays a vital role in our monitoring toolkit. It is a primarily focused on application
monitoring part along with OS resource monitoring. Under application control module or s/w
agent, we have different modules, and each module is having a set of responsibility. The
below points given the brief details for same
4.1.1. Fault
It is a key monitoring module which checks the availability of services and resources. It also
does keyword-based monitoring like full GC/out-of-memory/CPU or memory starvation
errors in logs, based on occurrences. APM tools available as open source generate the alert on
single events, but our tool generates the signal based on “number of incidents”
Shashank Kumar Mishra, Manjula R
http://www.iaeme.com/IJMET/index.asp 578 [email protected]
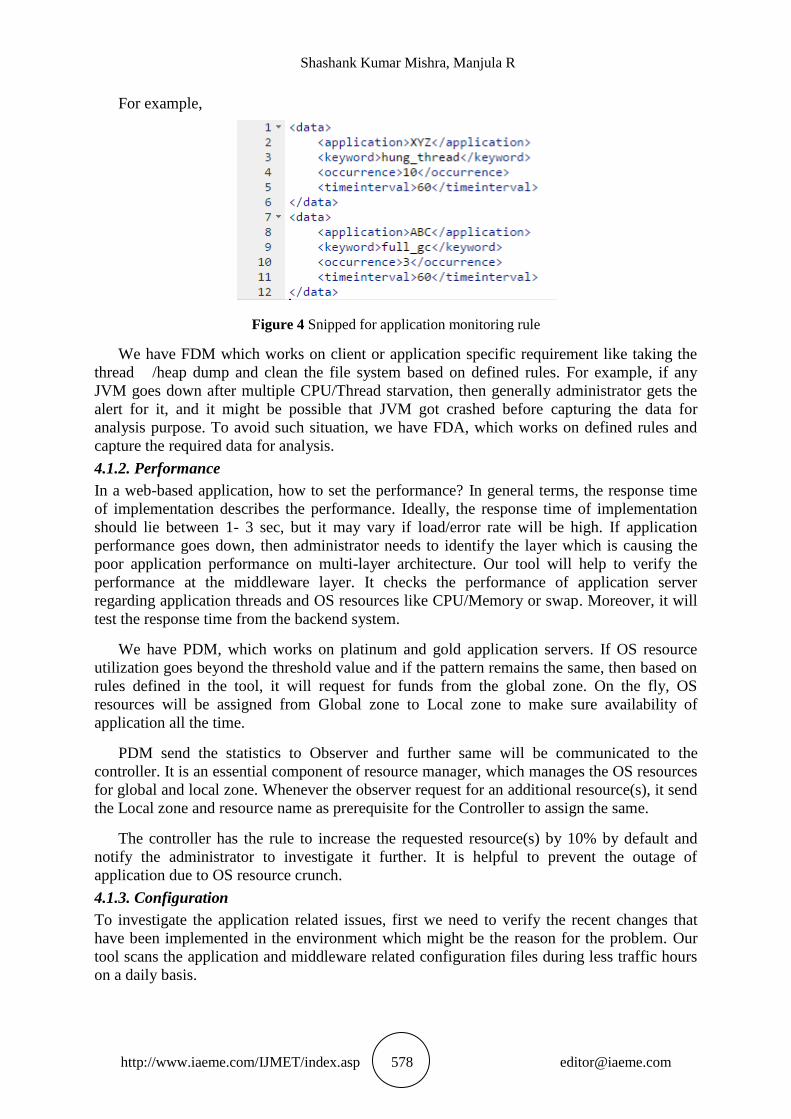
For example,
Figure 4 Snipped for application monitoring rule
We have FDM which works on client or application specific requirement like taking the
thread /heap dump and clean the file system based on defined rules. For example, if any
JVM goes down after multiple CPU/Thread starvation, then generally administrator gets the
alert for it, and it might be possible that JVM got crashed before capturing the data for
analysis purpose. To avoid such situation, we have FDA, which works on defined rules and
capture the required data for analysis.
4.1.2. Performance
In a web-based application, how to set the performance? In general terms, the response time
of implementation describes the performance. Ideally, the response time of implementation
should lie between 1- 3 sec, but it may vary if load/error rate will be high. If application
performance goes down, then administrator needs to identify the layer which is causing the
poor application performance on multi-layer architecture. Our tool will help to verify the
performance at the middleware layer. It checks the performance of application server
regarding application threads and OS resources like CPU/Memory or swap. Moreover, it will
test the response time from the backend system.
We have PDM, which works on platinum and gold application servers. If OS resource
utilization goes beyond the threshold value and if the pattern remains the same, then based on
rules defined in the tool, it will request for funds from the global zone. On the fly, OS
resources will be assigned from Global zone to Local zone to make sure availability of
application all the time.
PDM send the statistics to Observer and further same will be communicated to the
controller. It is an essential component of resource manager, which manages the OS resources
for global and local zone. Whenever the observer request for an additional resource(s), it send
the Local zone and resource name as prerequisite for the Controller to assign the same.
The controller has the rule to increase the requested resource(s) by 10% by default and
notify the administrator to investigate it further. It is helpful to prevent the outage of
application due to OS resource crunch.
4.1.3. Configuration
To investigate the application related issues, first we need to verify the recent changes that
have been implemented in the environment which might be the reason for the problem. Our
tool scans the application and middleware related configuration files during less traffic hours
on a daily basis.
JAPMRMT: Java Application Performance Monitoring and Resource Mgmt Toolkit
http://www.iaeme.com/IJMET/index.asp 579 [email protected]
Another challenge is consistency, how to ensure the changes that have been replicated to
all the nodes of application in distributed environment. There is a possibility that change is
done on one of the nodes and might be failed on other nodes due to h/w or network
unavailability issue. This might lead to the intermittent application related issues.
Through this module, we are achieving two things, first to fetch the recent change report,
that has been performed in the environment and another to make sure that changes have been
done on all the nodes.
4.1.4. Climate Audit Report
Available open source APM tools will not provide the report for review purpose. In any
project, it is critical to maintaining the inventory report as per current infrastructure. In the
current IT world, it is necessary to sustain the latest inventory report which is required to
calculate the support cost/license value. To a great distributed environment, the Infrastructure
changes are frequent, so it is tough to maintain it manually. Our tool will update the inventory
report on weekly basis. Additionally, it will upgrade the OS resources information, server
wise. Apart from application related information, the tool contains the backend system
information and basic network related stuff like VLAN details.
All this information is helpful, while performing disaster recovery (DR) or any
maintenance activity related to application or network.
For example, if network team need to perform any maintenance activity then application
support person should easily find out the impacted applications. It will help to calculate the
risk factor.
Another use of these reports is to calculate the cost of support. Most of the vendors are
having the contract based on some applications or numbers of VM´s are in support.
4.1.5. Security
Before the license expires it is critical to get alert for raising request for a new certificate.
Our tool will help us in achieving this goal by proactively monitoring the license
expiration dates and provide us a weekly report for the same.
4.1.6. Reporting
In this module, the tool generates various reports based on custom requirements. This module
works in conjunction with all the modules as mentioned earlier, and whenever any request got
initiated, based on input, the module will fetch the information from database.
Reports are mainly split into two categories:
a) Daily news: In this module, reports will be carried on a regular basis and send to the
administrator for verification. For example, health checks report or performance report.
b) Ad hoc reporting: In this module, reports get generated based on custom requirement like
particular date range, monitoring module etc. For example, needs to verify the changes
performed in last month.
4.1.7. H/W Agent
It is common for all categories of applications. It checks the OS resource utilization and
communicates to monitor/resource manager based on the output. If resource utilization is
continuously beyond the threshold value, then our tool will trigger the alarm which a resource
manager will review, based on that it will increase the OS resources on-fly.
Shashank Kumar Mishra, Manjula R
http://www.iaeme.com/IJMET/index.asp 580 [email protected]
Ideally, h/w agent monitors the CPU/Memory/file system utilization, disk I/O, system
load average and its usage.
Our tool is very useful to identify the processes consuming more h/w resources and based
on report; it would be easy to determine the process whether it is application owned or OS
process.
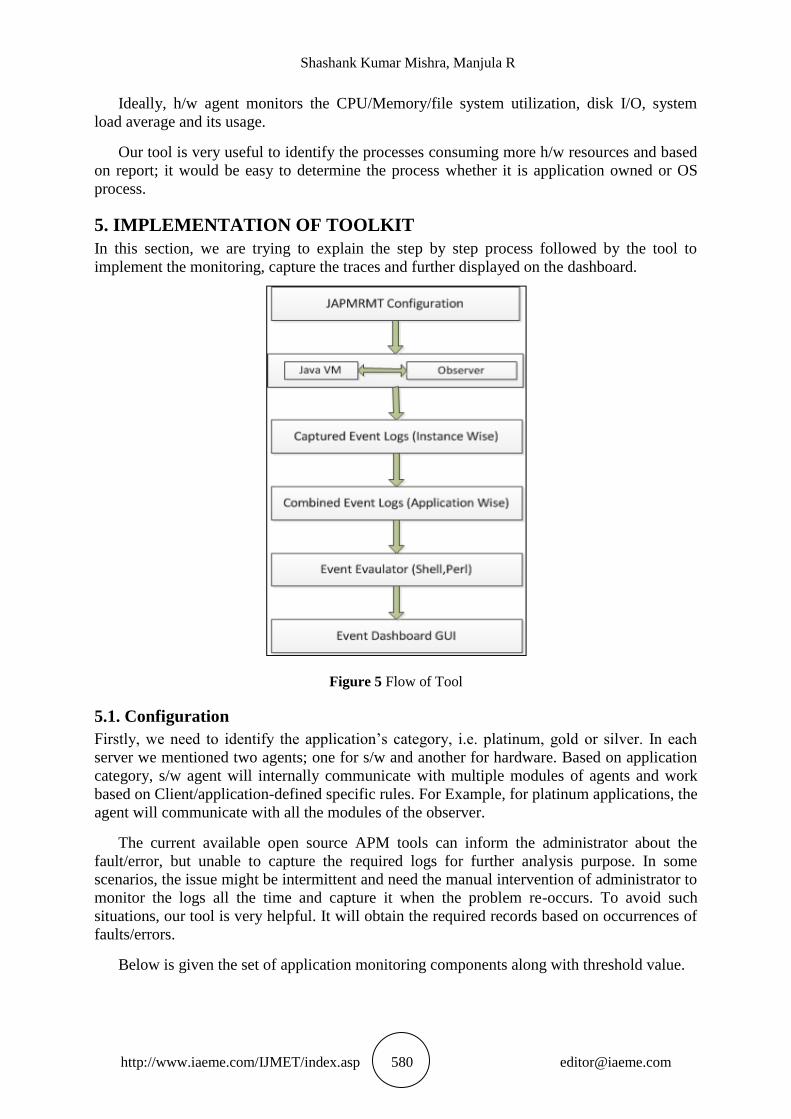
5. IMPLEMENTATION OF TOOLKIT
In this section, we are trying to explain the step by step process followed by the tool to
implement the monitoring, capture the traces and further displayed on the dashboard.
Figure 5 Flow of Tool
5.1. Configuration
Firstly, we need to identify the application‟s category, i.e. platinum, gold or silver. In each
server we mentioned two agents; one for s/w and another for hardware. Based on application
category, s/w agent will internally communicate with multiple modules of agents and work
based on Client/application-defined specific rules. For Example, for platinum applications, the
agent will communicate with all the modules of the observer.
The current available open source APM tools can inform the administrator about the
fault/error, but unable to capture the required logs for further analysis purpose. In some
scenarios, the issue might be intermittent and need the manual intervention of administrator to
monitor the logs all the time and capture it when the problem re-occurs. To avoid such
situations, our tool is very helpful. It will obtain the required records based on occurrences of
faults/errors.
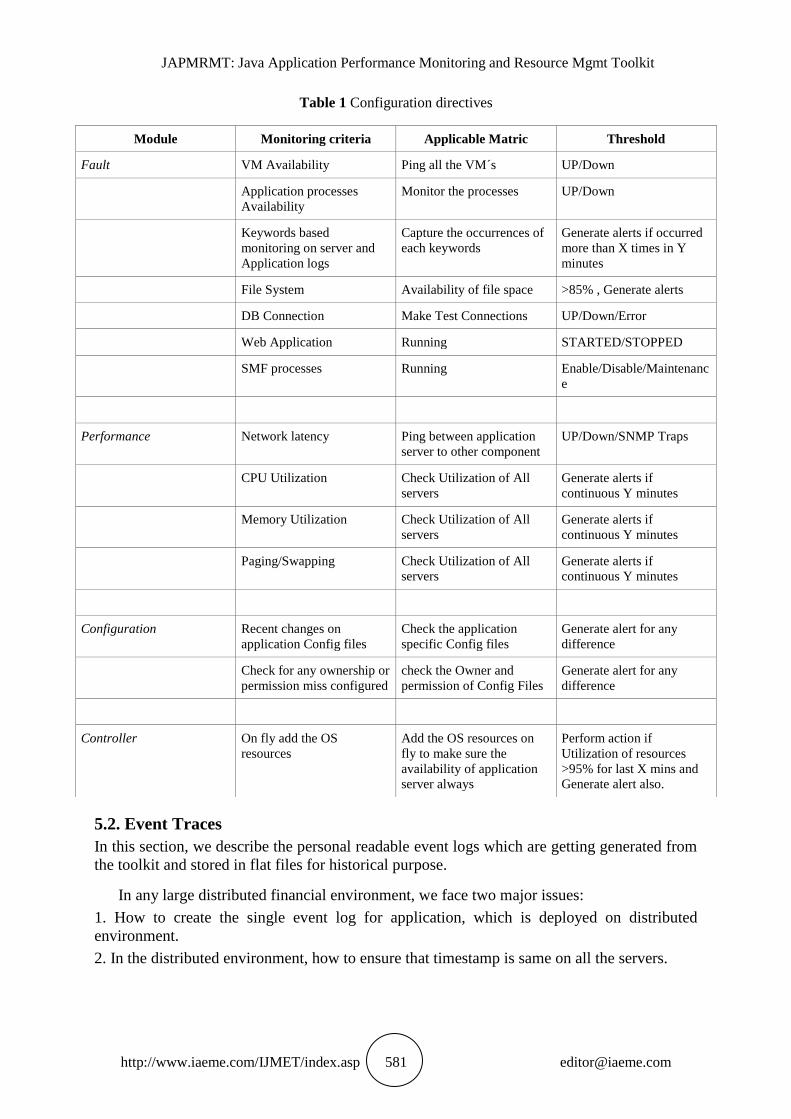
Below is given the set of application monitoring components along with threshold value.
JAPMRMT: Java Application Performance Monitoring and Resource Mgmt Toolkit
http://www.iaeme.com/IJMET/index.asp 581 [email protected]
Table 1 Configuration directives
5.2. Event Traces
In this section, we describe the personal readable event logs which are getting generated from
the toolkit and stored in flat files for historical purpose.
In any large distributed financial environment, we face two major issues:
1. How to create the single event log for application, which is deployed on distributed
environment.
2. In the distributed environment, how to ensure that timestamp is same on all the servers.
Module Monitoring criteria Applicable Matric Threshold
Fault VM Availability Ping all the VM´s UP/Down
Application processes
Availability
Monitor the processes UP/Down
Keywords based
monitoring on server and
Application logs
Capture the occurrences of
each keywords
Generate alerts if occurred
more than X times in Y
minutes
File System Availability of file space >85% , Generate alerts
DB Connection Make Test Connections UP/Down/Error
Web Application Running STARTED/STOPPED
SMF processes Running Enable/Disable/Maintenanc
e
Performance Network latency Ping between application
server to other component
UP/Down/SNMP Traps
CPU Utilization Check Utilization of All
servers
Generate alerts if
continuous Y minutes
Memory Utilization Check Utilization of All
servers
Generate alerts if
continuous Y minutes
Paging/Swapping Check Utilization of All
servers
Generate alerts if
continuous Y minutes
Configuration Recent changes on
application Config files
Check the application
specific Config files
Generate alert for any
difference
Check for any ownership or
permission miss configured
check the Owner and
permission of Config Files
Generate alert for any
difference
Controller On fly add the OS
resources
Add the OS resources on
fly to make sure the
availability of application
server always
Perform action if
Utilization of resources
>95% for last X mins and
Generate alert also.
Shashank Kumar Mishra, Manjula R
http://www.iaeme.com/IJMET/index.asp 582 [email protected]
In our toolkit, all the monitoring data will be updated in the XML file with a proper time
stamp, and we have the separate file system to store the control data date wise. We have a
different type of records to store the data based on utilization.
Below is an example for data categorization based on the memory utilization
• H/W_<Server Name>_UtilizationReport.xml: All the data.
• H/W_<Server Name>_EventUtilizationReport.xml: Data between 85% and 95%
• H/W_<Server Name>_ControllerReport.xml: Data above 95%
So that if continuous usage is beyond 95%, then controller takes action to prevent any
outage.
5.3. Combined Event Traces
After getting the log instance wise, need to combine them application wise in distributed
environment. To evaluate the application performance, we are collecting the records from
different cases and make the master file in XML for each application. This XML contains the
event information along with performance data.
The XML has two sections, one for overall system information and another one that gives
information instance wise, which is very useful. For example, In Distributed Environment if
any one node is faulty and impacting the overall application performance, then this tool will
analyze the performance parameters, instance wise, and try to find out the failed node.
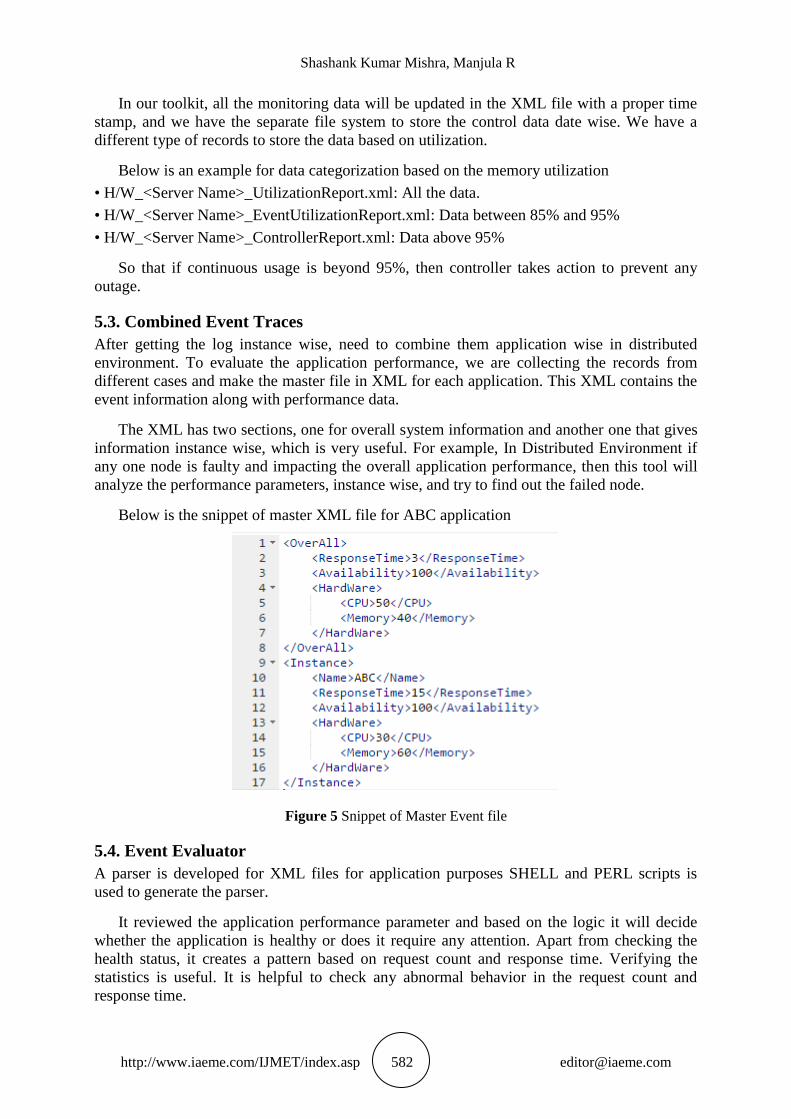
Below is the snippet of master XML file for ABC application
Figure 5 Snippet of Master Event file
5.4. Event Evaluator
A parser is developed for XML files for application purposes SHELL and PERL scripts is
used to generate the parser.
It reviewed the application performance parameter and based on the logic it will decide
whether the application is healthy or does it require any attention. Apart from checking the
health status, it creates a pattern based on request count and response time. Verifying the
statistics is useful. It is helpful to check any abnormal behavior in the request count and
response time.
JAPMRMT: Java Application Performance Monitoring and Resource Mgmt Toolkit
http://www.iaeme.com/IJMET/index.asp 583 [email protected]
Based on historical data, it will create the pattern where it shows the days when some
application load is high on the system. Moreover, it will highlight the days when we need to
put extra precaution based on previous years‟ experience. For example, during the end of the
financial year.
This module is very powerful as all the logic, and pattern identifier works within this and
gives suggestions and application health status application wise.
5.5. Dashboard
The panel takes the data from event evaluator and makes data logs easier for IT staff; it
displays the one liner output to depict the health of the application. To derive the health of an
application, the tool has matrix which consists of both application and OS components. For
different parts, we have the separate rule to calculate the performance.
In the main page itself, it gives the performance report for platinum and gold applications,
but a client can change dashboard data based on requirement. On the other hand, the tool
provides the suggestions /abnormal behavior alert which will attract the administrator‟s
attention.
6. EXAMPLE: MONITORING THROUGH JAPMRMT
In this section, we briefly illustrate how the tool has been used to study performance behavior
of Java based web application. To demonstrate the device‟s functionality, we have taken 5
VM‟s, where we installed the Middleware product along with DB. Results presented are
obtained from experiments in a clustered environment of JBoss to achieve the high
availability. To make the 3 tier architecture it uses the Apache Http Server as a web server
and MySQL as a backend database. On OS parameter perspective, we have taken 2 CPU
cores for each local zone, 2 GB file system dedicated to storing the monitoring data
temporarily along with 4 GB physical memory and 8 GB swap for each local region.
Table 2 Resource Matrix per VM
To verify the monitoring and resource allocation functionality of the tool, we have created
multiple scripts. With the help of shell and Perl scripting language, Multiuser session script is
set up to put more load on the system and verify the performance and bottleneck.
To demonstrate the functionality of Controller, we have simulated the bad programming
or scripting concept, wherein we have created some scripts which will utilize more OS
resources.
Below are the given the statistics of VM resources utilization, when all the scripts
triggered simultaneously.
Resource Zone-wise allocation
CPU 2 Cores
Memory 4 GB
Swap 8 GB
File system 2 GB
Shashank Kumar Mishra, Manjula R
http://www.iaeme.com/IJMET/index.asp 584 [email protected]
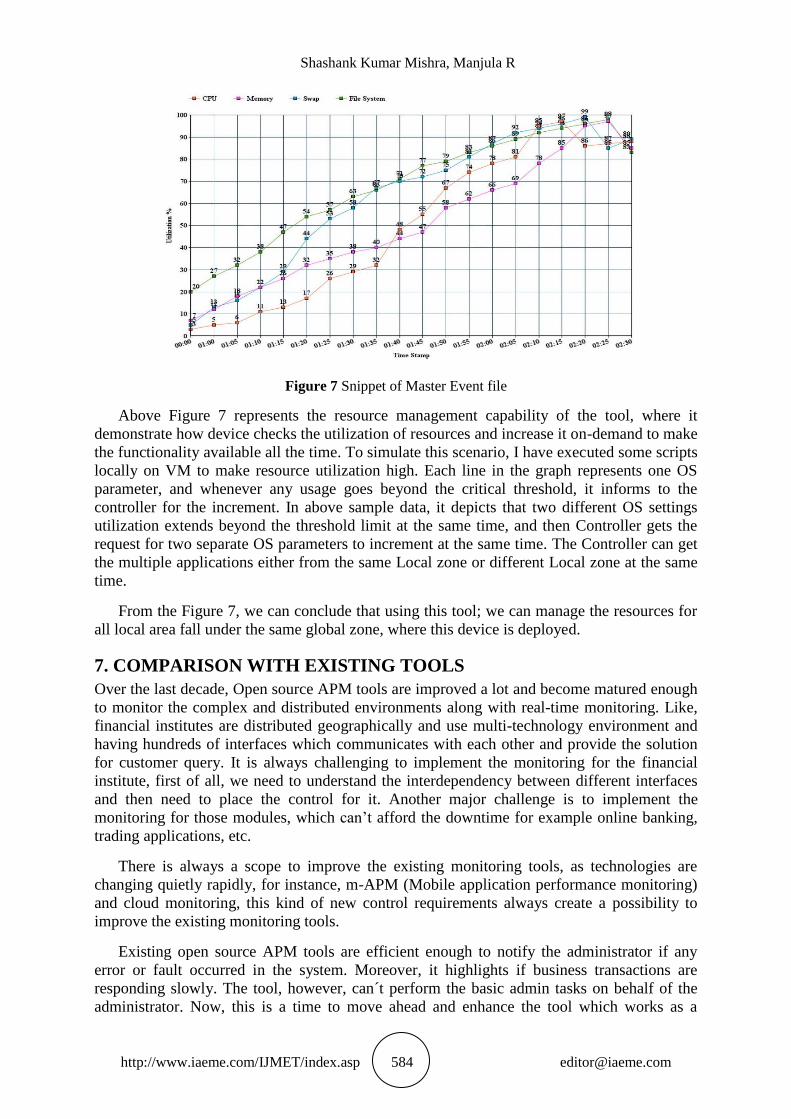
Figure 7 Snippet of Master Event file
Above Figure 7 represents the resource management capability of the tool, where it
demonstrate how device checks the utilization of resources and increase it on-demand to make
the functionality available all the time. To simulate this scenario, I have executed some scripts
locally on VM to make resource utilization high. Each line in the graph represents one OS
parameter, and whenever any usage goes beyond the critical threshold, it informs to the
controller for the increment. In above sample data, it depicts that two different OS settings
utilization extends beyond the threshold limit at the same time, and then Controller gets the
request for two separate OS parameters to increment at the same time. The Controller can get
the multiple applications either from the same Local zone or different Local zone at the same
time.
From the Figure 7, we can conclude that using this tool; we can manage the resources for
all local area fall under the same global zone, where this device is deployed.
7. COMPARISON WITH EXISTING TOOLS
Over the last decade, Open source APM tools are improved a lot and become matured enough
to monitor the complex and distributed environments along with real-time monitoring. Like,
financial institutes are distributed geographically and use multi-technology environment and
having hundreds of interfaces which communicates with each other and provide the solution
for customer query. It is always challenging to implement the monitoring for the financial
institute, first of all, we need to understand the interdependency between different interfaces
and then need to place the control for it. Another major challenge is to implement the
monitoring for those modules, which can‟t afford the downtime for example online banking,
trading applications, etc.
There is always a scope to improve the existing monitoring tools, as technologies are
changing quietly rapidly, for instance, m-APM (Mobile application performance monitoring)
and cloud monitoring, this kind of new control requirements always create a possibility to
improve the existing monitoring tools.
Existing open source APM tools are efficient enough to notify the administrator if any
error or fault occurred in the system. Moreover, it highlights if business transactions are
responding slowly. The tool, however, can´t perform the basic admin tasks on behalf of the
administrator. Now, this is a time to move ahead and enhance the tool which works as a
JAPMRMT: Java Application Performance Monitoring and Resource Mgmt Toolkit
http://www.iaeme.com/IJMET/index.asp 585 [email protected]
combination of observer and executor which means, apart from monitoring it will perform
basic administrator tasks.
In the current scenario, the available APM tools do not have the functionality to generate
the audit report. Our tool has this new feature to maintain the server list along with hardware
resource information and application instances per server. By this function, the device will
eliminate the human error and the manual efforts for maintaining these dynamic reports as
and when required.
8. CONCLUSIONS
Open source APM tools are important research area where scope for improvements are
always possible, as software technologies are changing very fast and there is a parallel need to
enhance the monitoring tools, as well as, to provide more comprehensive and robust control
solution.
Now, it‟s the time to create the fusion of monitor, evaluator, and executor to address the
application related concerns in more structured manner. To achieve the evaluator and executor
slice, we have implemented some new components to make the same, i.e. audit report,
certificate renewal report and configuration change report, etc.
It is the flinch to mark the application monitoring tools more controlling and intelligent to
start restorative the use issues by own.
Making things better and more users friendly is of great importance; our toolkit is
developed on Linux (OS) and having S/W and H/W limitations. Also, the tool didn‟t have a
mobile interface and the cloud solution which we take care in future releases. I will try to
make the machine intact with the new technologies so that the tool will be at par.
REFERENCES
[1] ComLab Website (2006) „Tools for modeling the user-traffic‟ [Online], Available:
[2] http://www.comlab.uni-rostock.de/research/tools.html [Accessed August 2006]
[3] Gaglio, S., Gatani, L., Lo Re, G. and Urso, A. (2006) „A Logical Architecture for Active.
[4] Network management‟ Journal of Network and Systems Management, vol. 14, No. 1,
pp127-146.
[5] Marcel Harkema, Dick Quartel, Rob van der Mei and Bart Gijsen (2003) „JPMT: A Java
Performance Monitoring Tool‟[Online],
Available:www.researchgate.net/publication/228794149.
[6] Liska, A. (2003) The Practice of Network Security: Deployment Strategies for Production.
[7] Environments, Prentice Hall, New Jersey, ISBN: 0-13-046223-3.
[8] V.C.Asiwe and P.S.Dowland(2007) „Implementing Network Monitoring Tools‟
[9] Tom Demers (2014) „Application Performance Management Tools‟[Online], Available:
[10] https://blog.profitbricks.com/application-performance-management-tools/
[11] Object Management Group, The Common Object Request Broker: Architecture and
Specification, revision 2.5, OMG document formal/2001-09-01, 2001.
[12] 8). R, Jain, The Art of Computer Systems Performance Analysis: Techniques for
Experimental Design, Measurement, Simulation, and Modeling, John Wiley & Sons,
1991.
Shashank Kumar Mishra, Manjula R
http://www.iaeme.com/IJMET/index.asp 586 [email protected]
[13] G. Kiczales, E. Hilsdale, J. Hugunin, M. Kersten, J. Palm, W.G. Griswold, An Overview
of
[14] AspectJ, 15th European Conference on Object-Oriented Programming (ECOOP), 2001.
[15] G. Kiczales, J. Lamping, A. Mendhekar, C. Maeda, C. V. Lopes, J. Loingtier, J. Irwin,
[16] Aspect-Oriented Programming, 11th European Conference on Object-Oriented
Programming
[17] (ECOOP), 1997.
[18] http://sandhill.com/article
[19] http://www.nagios.com
[20] http://shalb.com/en/spae/spae_features/
[21] http://www.infoworld.com/article/2683857/network-monitoring/article.html#slide3
[22] https://en.wikipedia.org/wiki/Icinga
[23] http://www.observium.org/
[24] https://vaadin.com/blog/-/blogs/monitoring-your-vaadin-apps-with-stagemonitor
[25] https://sensuapp.org/
[26] http://rancher.com/comparing-monitoring-options-for-docker-deployments/


![Continuous Performance Monitoring of a Distributed Application [CON4730]](https://img.pdfslide.us/doc/110x75/5563a77bd8b42a2d538b5787/continuous-performance-monitoring-of-a-distributed-application-con4730.jpg)