Embed Size (px)
Citation preview
Proceedings World Geothermal Congress 2005 Antalya, Turkey, 24-29 April 2005
1
Application of Database in Monitoring the Performance of Geothermal Steam Fields and Power Plants in the Philippines
Ariel D. Fronda
Geothermal and Coal Resources Development Division, Energy Resource Development Bureau
Department of Energy, Energy Center, Merritt Road, Fort Bonifacio, Taguig, Metro Manila, Philippines
Keywords: database, geothermal steam field, and power plant
ABSTRACT
Data is vital for the efficient development and management of geothermal resources. The Philippines with an installed capacity of 1,930.89 MWe and still with a great potential for geothermal exploration and development will generate an increasing volume of data. A computerized geothermal database was designed and developed for the storage, retrieval and manipulation of the collected data. The database will be used and applied by the Philippine Department of Energy (DOE) in monitoring the performance of geothermal steam fields and power plants to avoid over exploitation and assure sustainable geothermal resource management.
Well information, reservoir monitoring parameters, drilling information and power plant generation are the essential data considered for the database development using the Oracle Relational Database Management System (RDBMS). Oracle Developer tools and other related computer software were also utilized to provide the fast, simple and easy data input, editing, viewing, reporting and graphing.
1. INTRODUCTION
The Philippine Department of Energy (DOE) is a government agency mandated among others, to administer the programs for exploration, development, transportation, marketing and appropriate management of energy resources in all forms, which includes geothermal energy. It regulates and exercises full supervision and control over all government and private energy-related projects to ensure proper exploitation, utilization and sustainable development of the country’s indigenous resources.
The Geothermal and Coal Resources Development Division (GCRDD), which is under the Energy Resource Development Bureau of DOE, is mandated among others, to oversee, monitor and regulate geothermal operations undertaken by both private and government entities to ensure strict compliance to the policies and standards of the government (Requejo, 1996; Salvania, 1995).
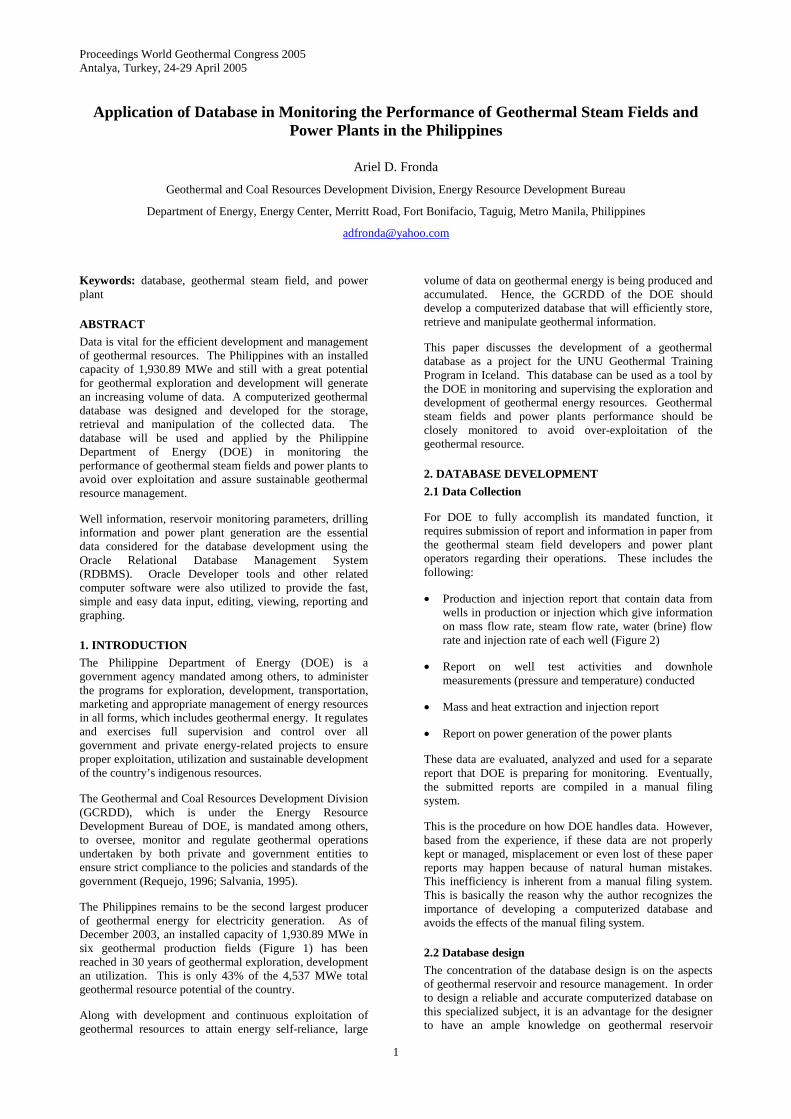
The Philippines remains to be the second largest producer of geothermal energy for electricity generation. As of December 2003, an installed capacity of 1,930.89 MWe in six geothermal production fields (Figure 1) has been reached in 30 years of geothermal exploration, development an utilization. This is only 43% of the 4,537 MWe total geothermal resource potential of the country.
Along with development and continuous exploitation of geothermal resources to attain energy self-reliance, large
volume of data on geothermal energy is being produced and accumulated. Hence, the GCRDD of the DOE should develop a computerized database that will efficiently store, retrieve and manipulate geothermal information.
This paper discusses the development of a geothermal database as a project for the UNU Geothermal Training Program in Iceland. This database can be used as a tool by the DOE in monitoring and supervising the exploration and development of geothermal energy resources. Geothermal steam fields and power plants performance should be closely monitored to avoid over-exploitation of the geothermal resource.
2. DATABASE DEVELOPMENT
2.1 Data Collection
For DOE to fully accomplish its mandated function, it requires submission of report and information in paper from the geothermal steam field developers and power plant operators regarding their operations. These includes the following:
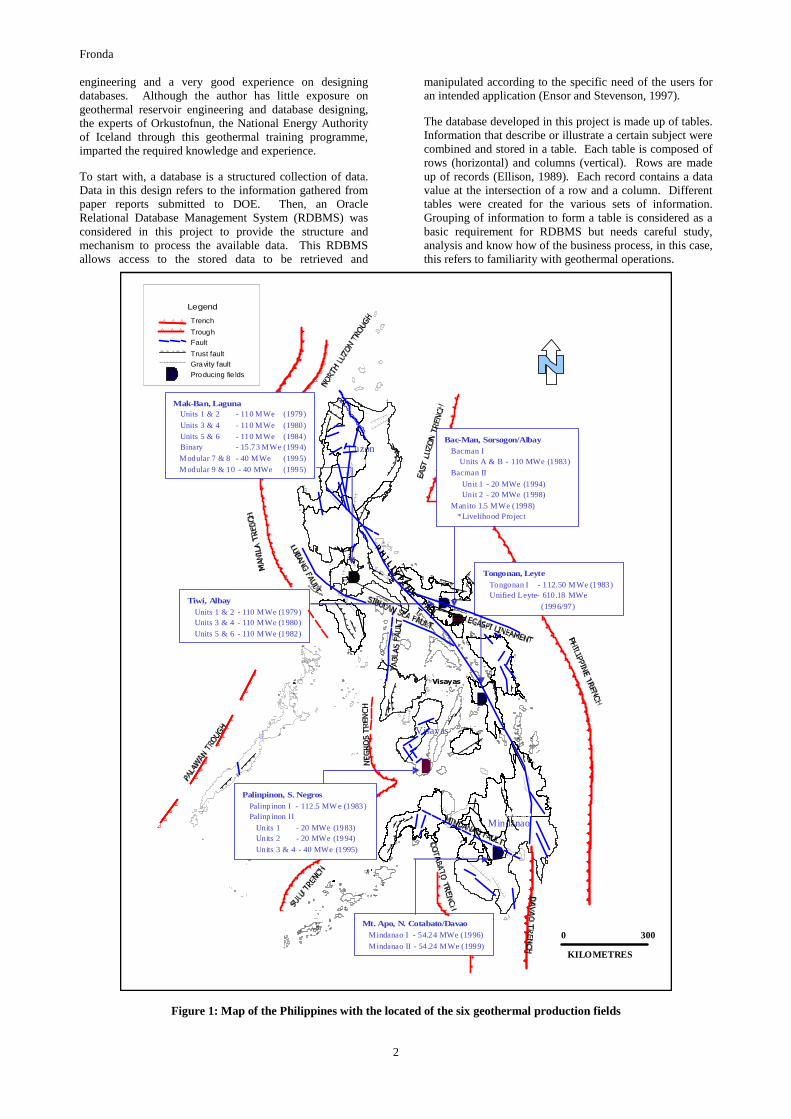
• Production and injection report that contain data from wells in production or injection which give information on mass flow rate, steam flow rate, water (brine) flow rate and injection rate of each well (Figure 2)
• Report on well test activities and downhole measurements (pressure and temperature) conducted
• Mass and heat extraction and injection report
• Report on power generation of the power plants
These data are evaluated, analyzed and used for a separate report that DOE is preparing for monitoring. Eventually, the submitted reports are compiled in a manual filing system.
This is the procedure on how DOE handles data. However, based from the experience, if these data are not properly kept or managed, misplacement or even lost of these paper reports may happen because of natural human mistakes. This inefficiency is inherent from a manual filing system. This is basically the reason why the author recognizes the importance of developing a computerized database and avoids the effects of the manual filing system.
2.2 Database design
The concentration of the database design is on the aspects of geothermal reservoir and resource management. In order to design a reliable and accurate computerized database on this specialized subject, it is an advantage for the designer to have an ample knowledge on geothermal reservoir
Fronda
2
engineering and a very good experience on designing databases. Although the author has little exposure on geothermal reservoir engineering and database designing, the experts of Orkustofnun, the National Energy Authority of Iceland through this geothermal training programme, imparted the required knowledge and experience.
To start with, a database is a structured collection of data. Data in this design refers to the information gathered from paper reports submitted to DOE. Then, an Oracle Relational Database Management System (RDBMS) was considered in this project to provide the structure and mechanism to process the available data. This RDBMS allows access to the stored data to be retrieved and
manipulated according to the specific need of the users for an intended application (Ensor and Stevenson, 1997).
The database developed in this project is made up of tables. Information that describe or illustrate a certain subject were combined and stored in a table. Each table is composed of rows (horizontal) and columns (vertical). Rows are made up of records (Ellison, 1989). Each record contains a data value at the intersection of a row and a column. Different tables were created for the various sets of information. Grouping of information to form a table is considered as a basic requirement for RDBMS but needs careful study, analysis and know how of the business process, in this case, this refers to familiarity with geothermal operations.
Luzon
Visayas
Mindanao
Mak-Ban, LagunaUnits 1 & 2 - 110 MWe (1979)
Units 3 & 4 - 110 MWe (1980)
Units 5 & 6 - 110 MWe (1984)Binary - 15.73 MWe (1994)
Modular 7 & 8 - 40 MWe (1995)
Modular 9 & 10 - 40 MWe (1995)
Tiwi, AlbayUnits 1 & 2 - 110 MWe (1979)Units 3 & 4 - 110 MWe (1980)
Units 5 & 6 - 110 MWe (1982)
Bac-Man, Sorsogon/AlbayBacman I
Units A & B - 110 MWe (1983)
Bacman II
Unit 1 - 20 MWe (1994)Unit 2 - 20 MWe (1998)
Manito 1.5 MWe (1998)*Livelihood Project
Tongonan, LeyteTongonan I - 112.50 MWe (1983)Unified Leyte- 610 .18 MWe
(1996/97)
Palinpinon, S. NegrosPalinp inon I - 112.5 MW e (1983)Palinp inon II
Units 1 - 20 MWe (1983)Units 2 - 20 MWe (1994)
Units 3 & 4 - 40 MWe (1995)
Mt. Apo, N. Cotabato/DavaoMindanao I - 54.24 MWe (1996)
Mindanao II - 54.24 MWe (1999)
Luzon
Visayas
Mindanao
Legend
Trench
TroughFault
Trust faultGravity fault
Producing fie lds
0 300
KILOMETRES
Figure 1: Map of the Philippines with the located of the six geothermal production fields
Fronda
3
Figure 2: Production and injection report
2.2.1 Data modelling
Analyzing DOE’s requirements in performing its functions was the first thing that was done in the database design. From this, grouping of information that formed the tables were identified. Below is the brief description of the tables that were created:
Well table describes the characteristics of each geothermal well. It contains information about the type of the well drilled in a specific location of a geothermal steam field.
Field table gives information about a producing geothermal steam field in the Philippines. It indicates the location, coverage area of the steam field, field’s installed capacity and the date when the service contract was awarded for the development of the field.
Company table gives information about the company that that manages the development of a steam field or the operation of a power plant.
Prod_Inj table stores data that are being monitored by DOE. These are the wellhead pressure, enthalpy, steam flow rate, water flow rate, mass flow rate, injection rate, heat extraction and heat injection of production and injection wells.
Log table describes the log conducted to a well. Hence, the type of log and the tool used in the log are the information in this table.
Tdata table stores the values obtained from the log according to the date and time that the log was performed.
Ddata table stores the values gathered from the log according to the measured depths that a log was performed.
Drilling table provides information about a drilling activity and the drilling rig used. It has the dates when drilling was started and ended as well as the starting and ending depth.
Drillact table stores the information about the status of a drilling activity such as drilling of a new well or work-over on a well in a certain period and the drilling rig used. This will be used for monitoring the progress of a drilling activity according to the schedule of the well’s drilling programme.
Comptest test refers to the result of a completion test conducted to a well after drilling. These are important data used in reservoir modelling. Injectivity index, maximum wellhead pressure, permeability-thickness and the measured depth of circulation losses are the available information.
Casing table holds the description of the casing installed in a well. The type of casing, cement, type of pipe with its diameter, connection and the length of casing are the information in this table. Rig table gives the specifications of the rigs used to drill wells. Powerplant table gives the names of the geothermal power plants in the Philippines with the installed capacity and their corresponding turbine-generator unit capacity. Plantspecs table provides the information about the technical specifications of the facilities of the power plant such as the turbine, generator, condenser, cooling tower and pumps.
Fronda
4
Generation table keeps and stores the electricity generation data of the each power plant. This table is used for the geothermal sector reports of DOE that is open for public information.
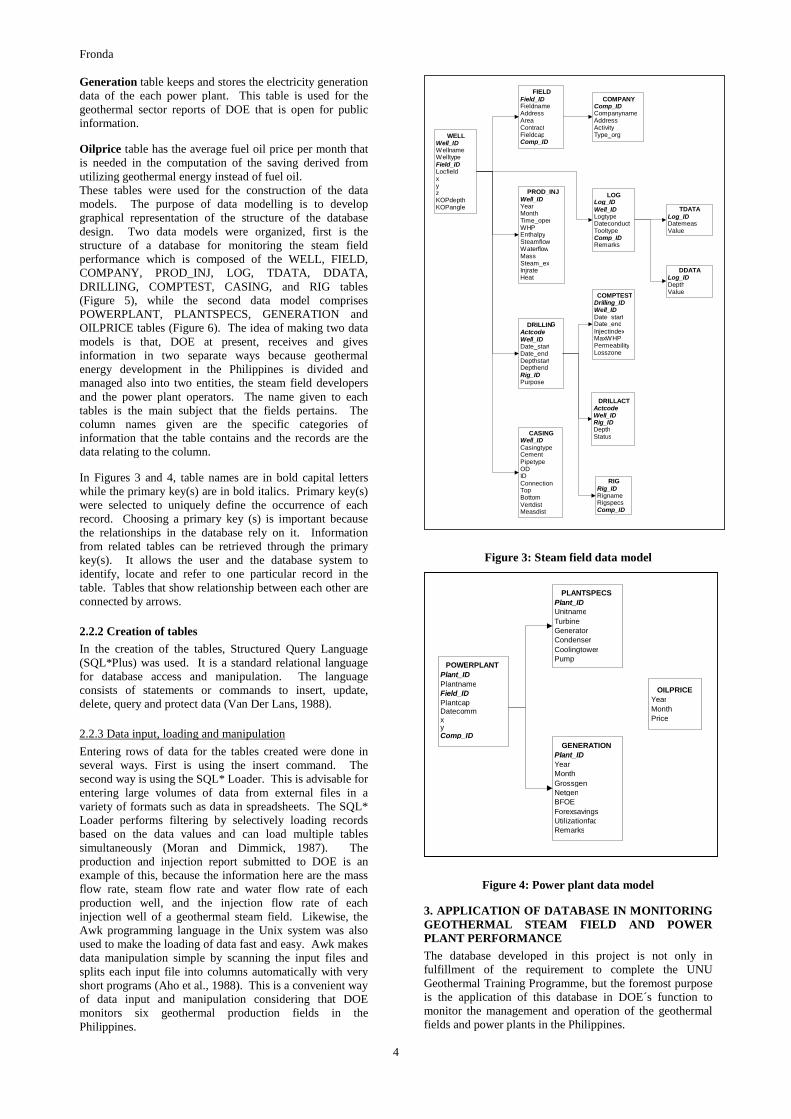
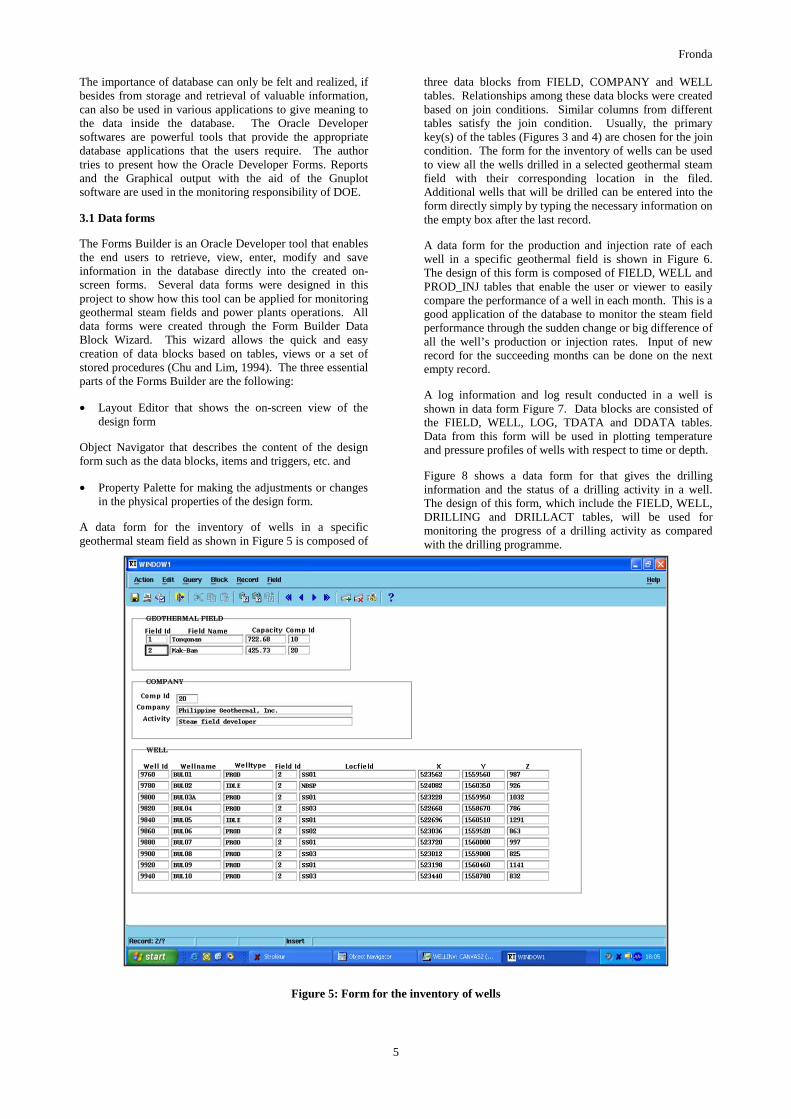
Oilprice table has the average fuel oil price per month that is needed in the computation of the saving derived from utilizing geothermal energy instead of fuel oil. These tables were used for the construction of the data models. The purpose of data modelling is to develop graphical representation of the structure of the database design. Two data models were organized, first is the structure of a database for monitoring the steam field performance which is composed of the WELL, FIELD, COMPANY, PROD_INJ, LOG, TDATA, DDATA, DRILLING, COMPTEST, CASING, and RIG tables (Figure 5), while the second data model comprises POWERPLANT, PLANTSPECS, GENERATION and OILPRICE tables (Figure 6). The idea of making two data models is that, DOE at present, receives and gives information in two separate ways because geothermal energy development in the Philippines is divided and managed also into two entities, the steam field developers and the power plant operators. The name given to each tables is the main subject that the fields pertains. The column names given are the specific categories of information that the table contains and the records are the data relating to the column.
In Figures 3 and 4, table names are in bold capital letters while the primary key(s) are in bold italics. Primary key(s) were selected to uniquely define the occurrence of each record. Choosing a primary key (s) is important because the relationships in the database rely on it. Information from related tables can be retrieved through the primary key(s). It allows the user and the database system to identify, locate and refer to one particular record in the table. Tables that show relationship between each other are connected by arrows.
2.2.2 Creation of tables
In the creation of the tables, Structured Query Language (SQL*Plus) was used. It is a standard relational language for database access and manipulation. The language consists of statements or commands to insert, update, delete, query and protect data (Van Der Lans, 1988).
2.2.3 Data input, loading and manipulation
Entering rows of data for the tables created were done in several ways. First is using the insert command. The second way is using the SQL* Loader. This is advisable for entering large volumes of data from external files in a variety of formats such as data in spreadsheets. The SQL* Loader performs filtering by selectively loading records based on the data values and can load multiple tables simultaneously (Moran and Dimmick, 1987). The production and injection report submitted to DOE is an example of this, because the information here are the mass flow rate, steam flow rate and water flow rate of each production well, and the injection flow rate of each injection well of a geothermal steam field. Likewise, the Awk programming language in the Unix system was also used to make the loading of data fast and easy. Awk makes data manipulation simple by scanning the input files and splits each input file into columns automatically with very short programs (Aho et al., 1988). This is a convenient way of data input and manipulation considering that DOE monitors six geothermal production fields in the Philippines.
WELL Well_ID Wellname WelltypeField_ID Locfield x y z KOPdepth KOPangle
FIELDField_ID FieldnameAddressAreaContractFieldcapComp_ID
PROD_INJWell_ID Year MonthTime_operWHPEnthalpySteamflowWaterflowMassSteam_exInjrateHeat
DRILLINGActcode Well_ID Date_startDate_endDepthstartDepthendRig_ID Purpose
LOG Log_IDWell_ID LogtypeDateconductTooltype Comp_IDRemarks
CASING Well_ID CasingtypeCementPipetypeOD ID ConnectionTop BottomVertdistMeasdist
COMPTESTDrilling_ID Well_ID Date_startDate_endInjectindexMaxWHPPermeabilityLosszone
COMPANYComp_IDCompanynameAddressActivityType_org
RIGRig_ID RignameRigspecsComp_ID
TDATA Log_IDDatemeasValue
DDATA Log_IDDepthValue
DRILLACT Actcode Well_ID Rig_ID DepthStatus
Figure 3: Steam field data model
POWERPLANT Plant_ID PlantnameField_ID PlantcapDatecommx yComp_ID
PLANTSPECSPlant_ID UnitnameTurbineGeneratorCondenserCoolingtowerPump
GENERATION Plant_ID Year MonthGrossgenNetgenBFOEForexsavings UtilizationfacRemarks
OILPRICEYearMonthPrice
Figure 4: Power plant data model
3. APPLICATION OF DATABASE IN MONITORING GEOTHERMAL STEAM FIELD AND POWER PLANT PERFORMANCE
The database developed in this project is not only in fulfillment of the requirement to complete the UNU Geothermal Training Programme, but the foremost purpose is the application of this database in DOE´s function to monitor the management and operation of the geothermal fields and power plants in the Philippines.
Fronda
5
The importance of database can only be felt and realized, if besides from storage and retrieval of valuable information, can also be used in various applications to give meaning to the data inside the database. The Oracle Developer softwares are powerful tools that provide the appropriate database applications that the users require. The author tries to present how the Oracle Developer Forms. Reports and the Graphical output with the aid of the Gnuplot software are used in the monitoring responsibility of DOE.
3.1 Data forms
The Forms Builder is an Oracle Developer tool that enables the end users to retrieve, view, enter, modify and save information in the database directly into the created on-screen forms. Several data forms were designed in this project to show how this tool can be applied for monitoring geothermal steam fields and power plants operations. All data forms were created through the Form Builder Data Block Wizard. This wizard allows the quick and easy creation of data blocks based on tables, views or a set of stored procedures (Chu and Lim, 1994). The three essential parts of the Forms Builder are the following:
• Layout Editor that shows the on-screen view of the design form
Object Navigator that describes the content of the design form such as the data blocks, items and triggers, etc. and
• Property Palette for making the adjustments or changes in the physical properties of the design form.
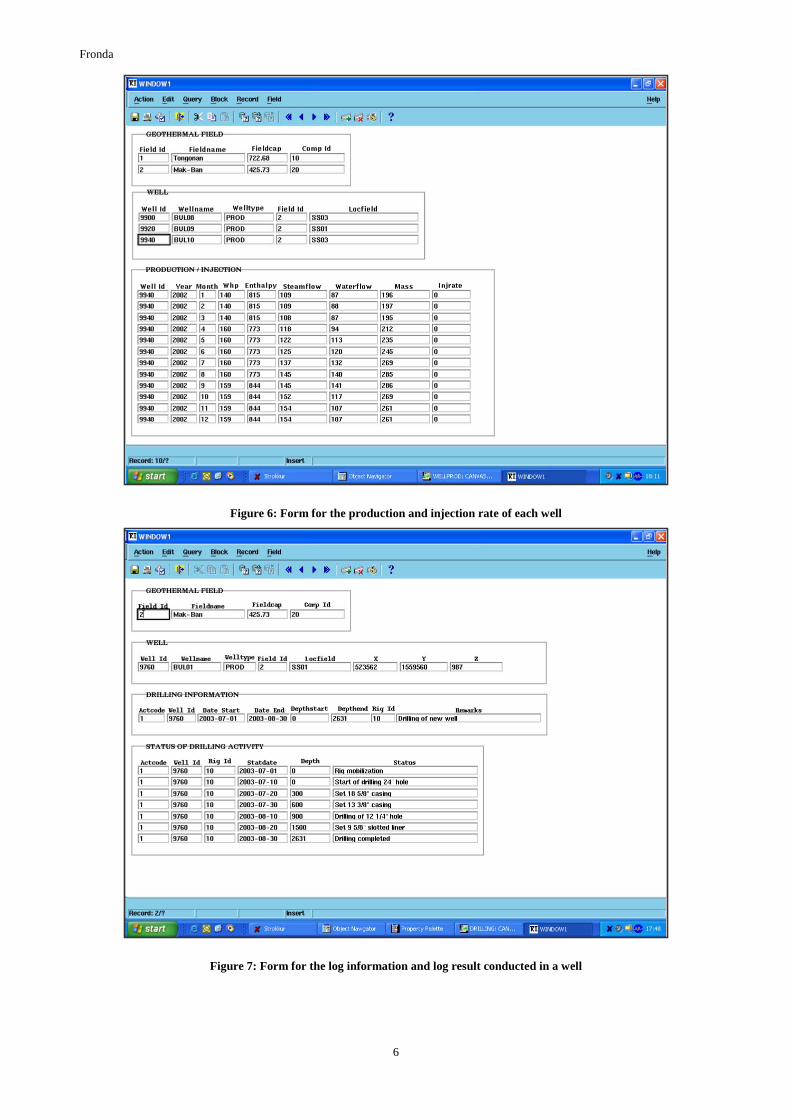
A data form for the inventory of wells in a specific geothermal steam field as shown in Figure 5 is composed of
three data blocks from FIELD, COMPANY and WELL tables. Relationships among these data blocks were created based on join conditions. Similar columns from different tables satisfy the join condition. Usually, the primary key(s) of the tables (Figures 3 and 4) are chosen for the join condition. The form for the inventory of wells can be used to view all the wells drilled in a selected geothermal steam field with their corresponding location in the filed. Additional wells that will be drilled can be entered into the form directly simply by typing the necessary information on the empty box after the last record.
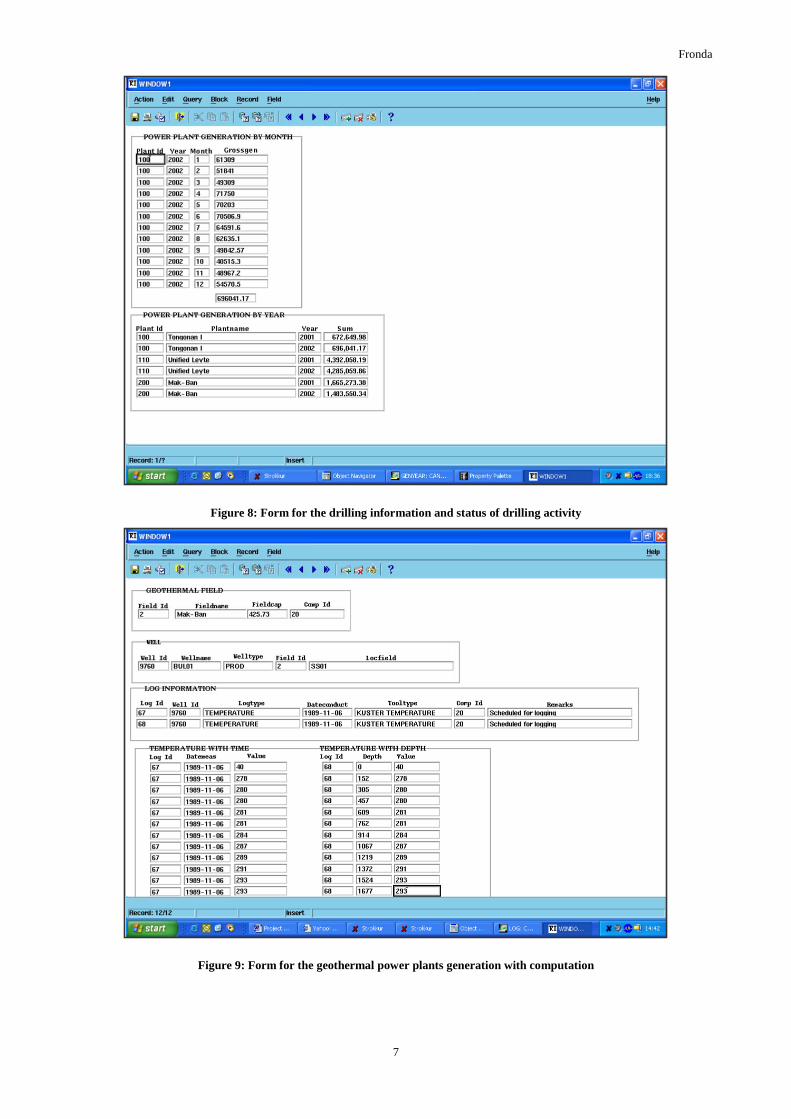
A data form for the production and injection rate of each well in a specific geothermal field is shown in Figure 6. The design of this form is composed of FIELD, WELL and PROD_INJ tables that enable the user or viewer to easily compare the performance of a well in each month. This is a good application of the database to monitor the steam field performance through the sudden change or big difference of all the well’s production or injection rates. Input of new record for the succeeding months can be done on the next empty record.
A log information and log result conducted in a well is shown in data form Figure 7. Data blocks are consisted of the FIELD, WELL, LOG, TDATA and DDATA tables. Data from this form will be used in plotting temperature and pressure profiles of wells with respect to time or depth.
Figure 8 shows a data form for that gives the drilling information and the status of a drilling activity in a well. The design of this form, which include the FIELD, WELL, DRILLING and DRILLACT tables, will be used for monitoring the progress of a drilling activity as compared with the drilling programme.
Figure 5: Form for the inventory of wells
Fronda
6
Figure 6: Form for the production and injection rate of each well
Figure 7: Form for the log information and log result conducted in a well
Fronda
7
Figure 8: Form for the drilling information and status of drilling activity
Figure 9: Form for the geothermal power plants generation with computation
Fronda
8
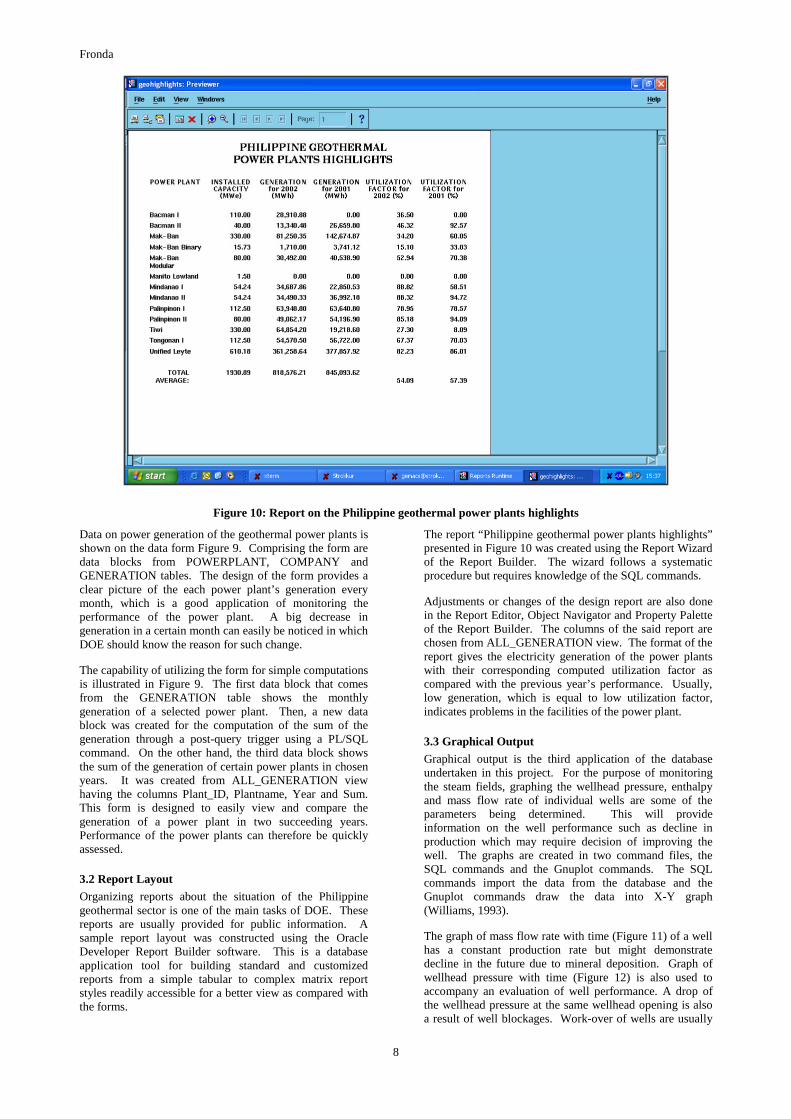
Figure 10: Report on the Philippine geothermal power plants highlights
Data on power generation of the geothermal power plants is shown on the data form Figure 9. Comprising the form are data blocks from POWERPLANT, COMPANY and GENERATION tables. The design of the form provides a clear picture of the each power plant’s generation every month, which is a good application of monitoring the performance of the power plant. A big decrease in generation in a certain month can easily be noticed in which DOE should know the reason for such change.
The capability of utilizing the form for simple computations is illustrated in Figure 9. The first data block that comes from the GENERATION table shows the monthly generation of a selected power plant. Then, a new data block was created for the computation of the sum of the generation through a post-query trigger using a PL/SQL command. On the other hand, the third data block shows the sum of the generation of certain power plants in chosen years. It was created from ALL_GENERATION view having the columns Plant_ID, Plantname, Year and Sum. This form is designed to easily view and compare the generation of a power plant in two succeeding years. Performance of the power plants can therefore be quickly assessed.
3.2 Report Layout
Organizing reports about the situation of the Philippine geothermal sector is one of the main tasks of DOE. These reports are usually provided for public information. A sample report layout was constructed using the Oracle Developer Report Builder software. This is a database application tool for building standard and customized reports from a simple tabular to complex matrix report styles readily accessible for a better view as compared with the forms.
The report “Philippine geothermal power plants highlights” presented in Figure 10 was created using the Report Wizard of the Report Builder. The wizard follows a systematic procedure but requires knowledge of the SQL commands.
Adjustments or changes of the design report are also done in the Report Editor, Object Navigator and Property Palette of the Report Builder. The columns of the said report are chosen from ALL_GENERATION view. The format of the report gives the electricity generation of the power plants with their corresponding computed utilization factor as compared with the previous year’s performance. Usually, low generation, which is equal to low utilization factor, indicates problems in the facilities of the power plant.
3.3 Graphical Output
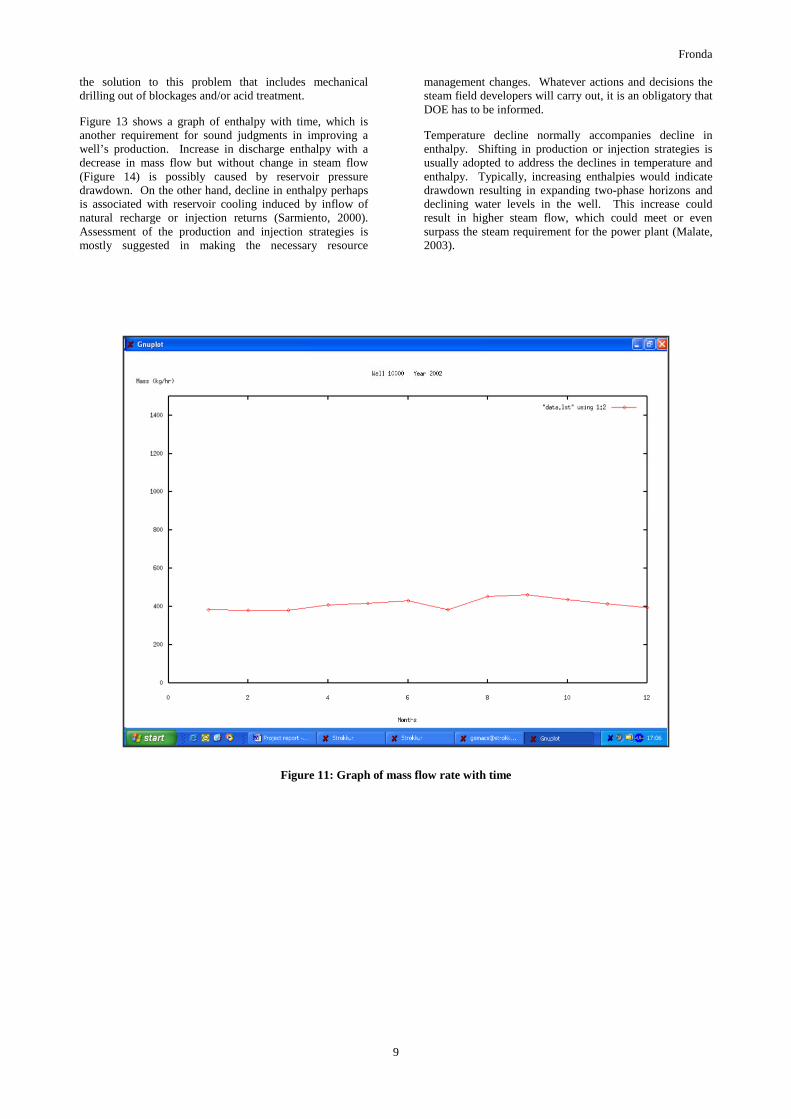
Graphical output is the third application of the database undertaken in this project. For the purpose of monitoring the steam fields, graphing the wellhead pressure, enthalpy and mass flow rate of individual wells are some of the parameters being determined. This will provide information on the well performance such as decline in production which may require decision of improving the well. The graphs are created in two command files, the SQL commands and the Gnuplot commands. The SQL commands import the data from the database and the Gnuplot commands draw the data into X-Y graph (Williams, 1993).
The graph of mass flow rate with time (Figure 11) of a well has a constant production rate but might demonstrate decline in the future due to mineral deposition. Graph of wellhead pressure with time (Figure 12) is also used to accompany an evaluation of well performance. A drop of the wellhead pressure at the same wellhead opening is also a result of well blockages. Work-over of wells are usually
Fronda
9
the solution to this problem that includes mechanical drilling out of blockages and/or acid treatment.
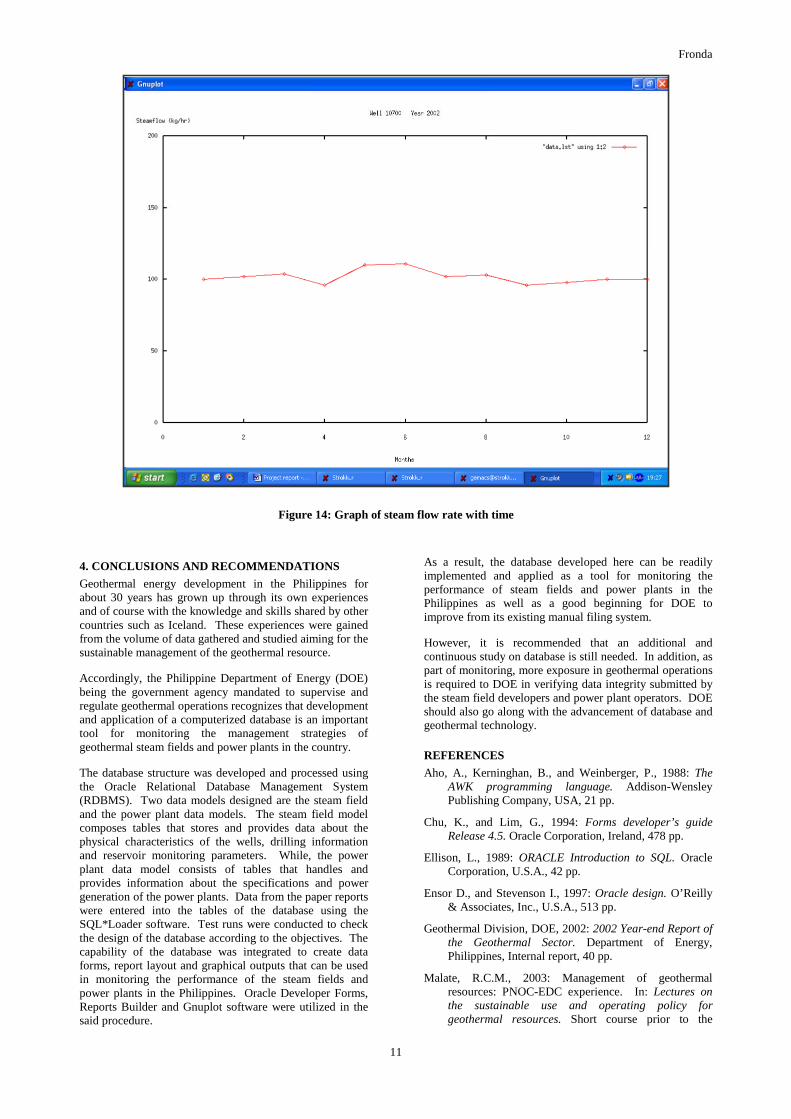
Figure 13 shows a graph of enthalpy with time, which is another requirement for sound judgments in improving a well’s production. Increase in discharge enthalpy with a decrease in mass flow but without change in steam flow (Figure 14) is possibly caused by reservoir pressure drawdown. On the other hand, decline in enthalpy perhaps is associated with reservoir cooling induced by inflow of natural recharge or injection returns (Sarmiento, 2000). Assessment of the production and injection strategies is mostly suggested in making the necessary resource
management changes. Whatever actions and decisions the steam field developers will carry out, it is an obligatory that DOE has to be informed.
Temperature decline normally accompanies decline in enthalpy. Shifting in production or injection strategies is usually adopted to address the declines in temperature and enthalpy. Typically, increasing enthalpies would indicate drawdown resulting in expanding two-phase horizons and declining water levels in the well. This increase could result in higher steam flow, which could meet or even surpass the steam requirement for the power plant (Malate, 2003).
Figure 11: Graph of mass flow rate with time

Fronda
10
Figure 12: Graph of wellhead pressure with time
Figure 13: Graph of enthalpy with time
Fronda
11
Figure 14: Graph of steam flow rate with time
4. CONCLUSIONS AND RECOMMENDATIONS
Geothermal energy development in the Philippines for about 30 years has grown up through its own experiences and of course with the knowledge and skills shared by other countries such as Iceland. These experiences were gained from the volume of data gathered and studied aiming for the sustainable management of the geothermal resource.
Accordingly, the Philippine Department of Energy (DOE) being the government agency mandated to supervise and regulate geothermal operations recognizes that development and application of a computerized database is an important tool for monitoring the management strategies of geothermal steam fields and power plants in the country.
The database structure was developed and processed using the Oracle Relational Database Management System (RDBMS). Two data models designed are the steam field and the power plant data models. The steam field model composes tables that stores and provides data about the physical characteristics of the wells, drilling information and reservoir monitoring parameters. While, the power plant data model consists of tables that handles and provides information about the specifications and power generation of the power plants. Data from the paper reports were entered into the tables of the database using the SQL*Loader software. Test runs were conducted to check the design of the database according to the objectives. The capability of the database was integrated to create data forms, report layout and graphical outputs that can be used in monitoring the performance of the steam fields and power plants in the Philippines. Oracle Developer Forms, Reports Builder and Gnuplot software were utilized in the said procedure.
As a result, the database developed here can be readily implemented and applied as a tool for monitoring the performance of steam fields and power plants in the Philippines as well as a good beginning for DOE to improve from its existing manual filing system.
However, it is recommended that an additional and continuous study on database is still needed. In addition, as part of monitoring, more exposure in geothermal operations is required to DOE in verifying data integrity submitted by the steam field developers and power plant operators. DOE should also go along with the advancement of database and geothermal technology.
REFERENCES
Aho, A., Kerninghan, B., and Weinberger, P., 1988: The AWK programming language. Addison-Wensley Publishing Company, USA, 21 pp.
Chu, K., and Lim, G., 1994: Forms developer’s guide Release 4.5. Oracle Corporation, Ireland, 478 pp.
Ellison, L., 1989: ORACLE Introduction to SQL. Oracle Corporation, U.S.A., 42 pp.
Ensor D., and Stevenson I., 1997: Oracle design. O’Reilly & Associates, Inc., U.S.A., 513 pp.
Geothermal Division, DOE, 2002: 2002 Year-end Report of the Geothermal Sector. Department of Energy, Philippines, Internal report, 40 pp.
Malate, R.C.M., 2003: Management of geothermal resources: PNOC-EDC experience. In: Lectures on the sustainable use and operating policy for geothermal resources. Short course prior to the

Fronda
12
International Geothermal Conference, IGC 2003. UNU G.T.P:, Iceland, 153-183.
Moran, R., and Dimmick S., 1987: SQL*Loader users’s guide. Oracle Corporation, Belmont, California, U.S.A., 78 pp.
Requejo, R.A., 1996: Monitoring of production decline and pressure drawdown in geothermal reservoirs using decline curves analysis method. Report 14 in: Geothermal Training in Iceland 1995. UNU G.T.P., Iceland, 311-340.
Salvania, N., 1995: Development of a geothermal database and resource assessment of Mt. Natib geothermal prospect, Philippines. Report 10 in: Geothermal
Training in Iceland 1995. UNU G.T.P., Iceland , 241-268.
Sarmiento, Z.F., 2000: Physical monitoring II: High enthalpy geothermal systems. In: Long-term monitoring of high- and low-enthalpy fields under exploitation. World Geothermal Congress 2000, pre-congress short courses, Kokonoe, Japan, May, 23-56.
Van Der Lans, R.F., 1988: Introduction to SQL. Addison-Wesley Publishing Company, England, 348 pp.
Williams T., and Kelley C., 1993: Gnuplot reference manual. 70 pp.