Embed Size (px)
Citation preview
Q1. How much energy can be self-supplied by domestic resources in Japan?
Q2. What resources does Japan depend on?
Q3. What countries does Japan import resources from?
Q4. How are electric power costs changing?
Q5. How much greenhouse gas is emitted in Japan?
Q6. Are there advancements in research and development of domestic resources?
Q7. Will hydrogen energy become popular in the future?
Q8. Why are energy necessary?
Q9. How far have efforts for energy savings in Japan progressed?
Q10. Why does renewable energy need to be introduced?
Q11. Is renewable energy progressed in Japan?
Q12. What kind of efforts are being made for expanding the introduction of renewable energy?
Q13. Can we provide energy only by renewable energy?
Q14. Is there progress in the decommissioning and contaminated water management at Fukushima Daiichi Nuclear Power Plant?
Q15. Is there progress in the Fukushima Reconstruction?
Q16. Is nuclear power generation necessary?
Q17. How is radioactive waste produced by the operation of nuclear power plants disposed?
Q18. Is the safety of nuclear power plants secured?
Q19. What are the basic policies of energy policies like?
Q20. What will be the composition of power sources?
JAPAN'S ENERGY 20 Questions to understand the current energy situation
INDEX
Ministry of Economy, Trade and IndustryAgency for Natural Resources and Energy
JAPAN'SENERGY20 Questions to understandthe current energy situation
2016 EDITION
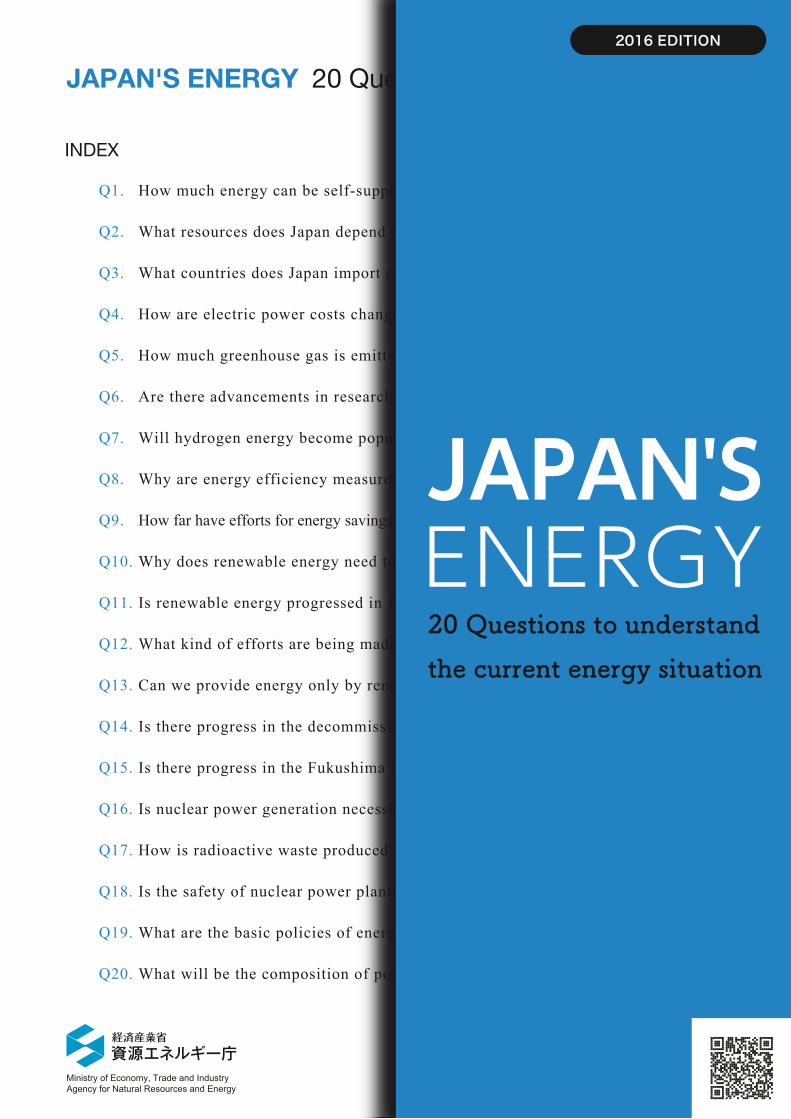
Since the Great East Japan Earthquake in 2011,
Japan has been facing issues such as
① a decline in the energy self-sufficiency ratio
② an increase in electric power costs
③ an increase in the amount of CO2 emissions.
In order to overcome these issues, first, it is
important that every single citizen knows and
understands the current situation in Japan, and
thinks about energy.
292.0%
682.9%
167.9%
90.8%
60.3%
56.5%
39.1%
30.6%
18.3%
6.0%
4.0%Luxembourg34th
Japan33rd
South Korea31st
Spain26th
25.0%Italy29th
Germany21st
France15th
UK14th
USA7th
Canada3rd
Australia2nd
Norway1st
Decline in the Energy Self-Sufficiency Ratio
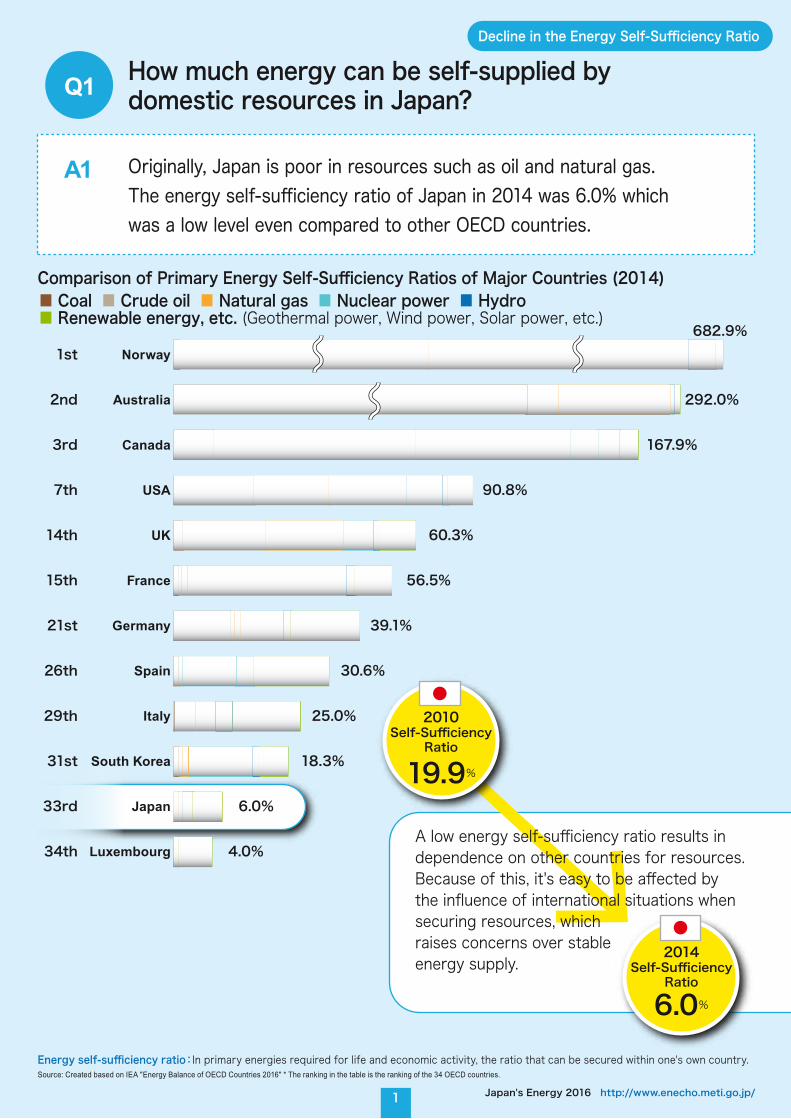
Originally, Japan is poor in resources such as oil and natural gas.The energy self-sufficiency ratio of Japan in 2014 was 6.0% which was a low level even compared to other OECD countries.
How much energy can be self-supplied by domestic resources in Japan? Q1
A1
Comparison of Primary Energy Self-Sufficiency Ratios of Major Countries (2014)
1 Japan's Energy 2016 http://www.enecho.meti.go.jp/
■ Coal ■ Crude oil ■ Natural gas ■ Nuclear power ■ Hydro ■ Renewable energy, etc. (Geothermal power, Wind power, Solar power, etc.)
Energy self-sufficiency ratio:In primary energies required for life and economic activity, the ratio that can be secured within one's own country.Source: Created based on IEA "Energy Balance of OECD Countries 2016" * The ranking in the table is the ranking of the 34 OECD countries.
2014Self-Sufficiency
Ratio
6.0%
A low energy self-sufficiency ratio results in dependence on other countries for resources. Because of this, it's easy to be affected by the influence of international situations when securing resources, which raises concerns over stable energy supply.
2010Self-Sufficiency
Ratio
19.9%
2Japan's Energy 2016 http://www.enecho.meti.go.jp/
2010before the earthquake
CoPS
62%
Oil, etc.6.6%
Coal 25.0%
LNG 29.3%
Nuclearpower28.6%
Nuclearpower 2.6%
Hydroelectricpower8.5%
Hydroelectricpower8.5%Hydroelectric
power17.2%
Hydroelectricpower17.2%
Dependency on fossil fuels from foreign countries
Domestic coal:Imported coal
=2:98
2014CoPS
Oil, etc.10.6%
Coal 31.0%
LNG46.2%
Hydroelectricpower9%
Hydroelectricpower9%
Renewable energy, etc.3.2%
Renewable energy, etc.1.1%Renewable
energy, etc. 0.03%
Almost only imported coal
1973The 1st oil shock
CoPS
76%
Oil, etc.71.4%
LNG 2.4%Other gases 1.8%
Othergases0.9%
Coal 4.7% (only domestic coal)
Dependency on fossil fuels from foreign countries* Based on the composition of power sources
88%Dependency on fossil fuels from foreign countries
FY FY
FY
Source: Trade statistics
Decline in the Energy Self-Sufficiency Ratio
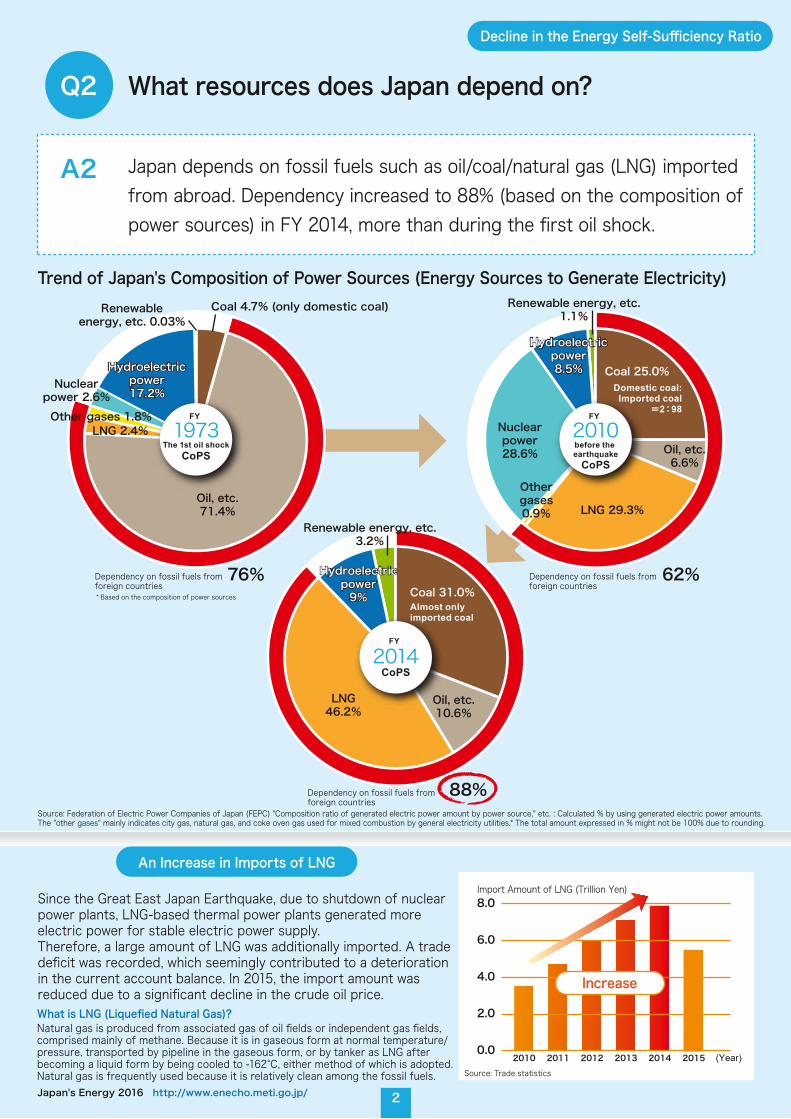
Source: Federation of Electric Power Companies of Japan (FEPC) "Composition ratio of generated electric power amount by power source," etc. : Calculated % by using generated electric power amounts. The "other gases" mainly indicates city gas, natural gas, and coke oven gas used for mixed combustion by general electricity utilities.* The total amount expressed in % might not be 100% due to rounding.
Since the Great East Japan Earthquake, due to shutdown of nuclear power plants, LNG-based thermal power plants generated more electric power for stable electric power supply.Therefore, a large amount of LNG was additionally imported. A trade deficit was recorded, which seemingly contributed to a deterioration in the current account balance. In 2015, the import amount was reduced due to a significant decline in the crude oil price.
An Increase in Imports of LNG
(Year)2010 2011 2012 2013 2014 20150.0
2.0
4.0
6.0
8.0Import Amount of LNG (Trillion Yen)
Increase
Natural gas is produced from associated gas of oil fields or independent gas fields, comprised mainly of methane. Because it is in gaseous form at normal temperature/pressure, transported by pipeline in the gaseous form, or by tanker as LNG after becoming a liquid form by being cooled to -162°C, either method of which is adopted.Natural gas is frequently used because it is relatively clean among the fossil fuels.
What is LNG (Liquefied Natural Gas)?
Trend of Japan's Composition of Power Sources (Energy Sources to Generate Electricity)
Japan depends on fossil fuels such as oil/coal/natural gas (LNG) imported from abroad. Dependency increased to 88% (based on the composition of power sources) in FY 2014, more than during the first oil shock.
What resources does Japan depend on?Q2
A2
3 Japan's Energy 2016 http://www.enecho.meti.go.jp/
Saudi Arabia33%
UAE25%
Russia9%
Qatar8%
Kuwait8%
Iran5%
Indonesia 2%Iraq 2%
Mexico 1%Ecuador 1%
Others6%
Australia22%
Malaysia18%
Qatar17%
Indonesia7%
UAE6%
Nigeria5%
Brunei5%
Papua New Guinea 5%Oman 3% Others
3%
Russia9%
Australia65.1%
Indonesia17.3%
Others0.7%
Russia8.7%
Canada4.2% USA
3.2%
China0.9%
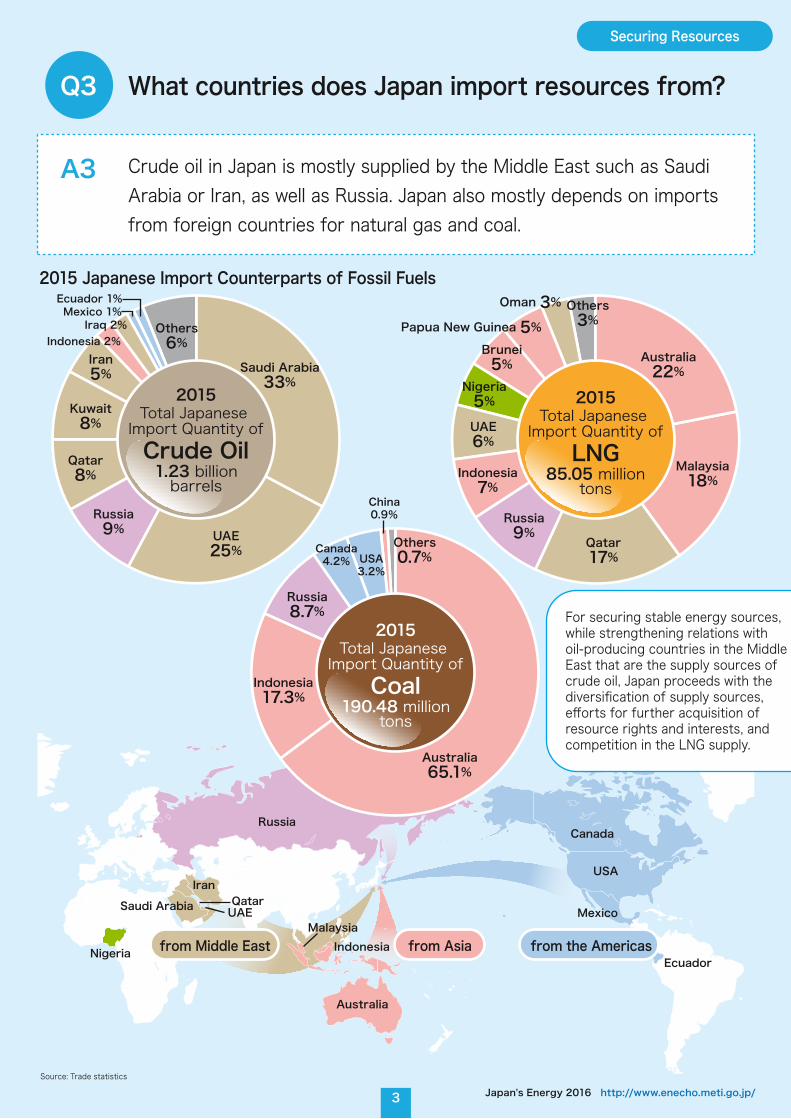
2015 Japanese Import Counterparts of Fossil Fuels
Crude oil in Japan is mostly supplied by the Middle East such as Saudi Arabia or Iran, as well as Russia. Japan also mostly depends on imports from foreign countries for natural gas and coal.
What countries does Japan import resources from?Q3
A3
Securing Resources
2015Total Japanese Import Quantity ofCrude Oil1.23 billionbarrels
UAEQatar
Australia
IndonesiaMalaysia
Saudi Arabia
Russia
USA
Canada
Mexico
Ecuador
Iran
Nigeria
2015Total Japanese Import Quantity of
LNG85.05 million
tons
2015Total Japanese Import Quantity of
Coal190.48 million
tons
Source: Trade statistics
from Middle East from Asia from the Americas
For securing stable energy sources, while strengthening relations with oil-producing countries in the Middle East that are the supply sources of crude oil, Japan proceeds with the diversification of supply sources, efforts for further acquisition of resource rights and interests, and competition in the LNG supply.
12
14
16
18
20
22
24
26
2010 2011 2012 2013 2014 2015 (FY)
Homes
Industries
20.4 21.3
22.3
24.3
25.5
24.2
13.6
14.6 15.7
17.5
18.9
17.6
(Yen/kWh)
aprx. 25%
aprx. 39%
0Jan.1984
Jan.1990
Jan.2000
Jan.2010
Jan.2016
20
40
60
80
100
120
140
160International crude oil price WTI (dollar/barrel)
4Japan's Energy 2016 http://www.enecho.meti.go.jp/
How are electric power costs changing?Q4
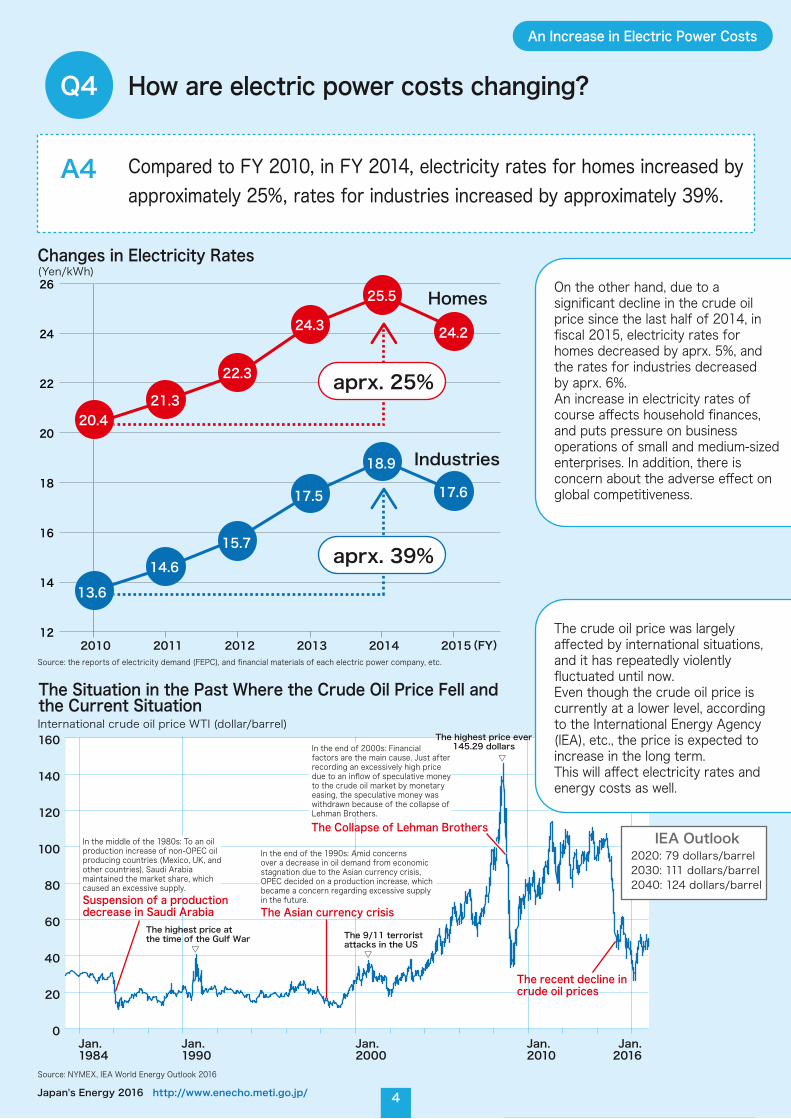
Compared to FY 2010, in FY 2014, electricity rates for homes increased by approximately 25%, rates for industries increased by approximately 39%.
A4
An Increase in Electric Power Costs
The crude oil price was largely affected by international situations, and it has repeatedly violently fluctuated until now.Even though the crude oil price is currently at a lower level, according to the International Energy Agency (IEA), etc., the price is expected to increase in the long term.This will affect electricity rates and energy costs as well.
2020: 79 dollars/barrel2030: 111 dollars/barrel2040: 124 dollars/barrel
IEA Outlook
The Situation in the Past Where the Crude Oil Price Fell and the Current Situation
In the end of the 1990s: Amid concerns over a decrease in oil demand from economic stagnation due to the Asian currency crisis, OPEC decided on a production increase, which became a concern regarding excessive supply in the future.
In the end of 2000s: Financial factors are the main cause. Just after recording an excessively high price due to an inflow of speculative money to the crude oil market by monetary easing, the speculative money was withdrawn because of the collapse of Lehman Brothers.
In the middle of the 1980s: To an oil production increase of non-OPEC oil producing countries (Mexico, UK, and other countries), Saudi Arabia maintained the market share, which caused an excessive supply.
The Asian currency crisis
The Collapse of Lehman Brothers
The recent decline in crude oil prices
Suspension of a production decrease in Saudi Arabia
Changes in Electricity Rates
Source: the reports of electricity demand (FEPC), and financial materials of each electric power company, etc.
Source: NYMEX, IEA World Energy Outlook 2016
On the other hand, due to a significant decline in the crude oil price since the last half of 2014, in fiscal 2015, electricity rates for homes decreased by aprx. 5%, and the rates for industries decreased by aprx. 6%.An increase in electricity rates of course affects household finances, and puts pressure on business operations of small and medium-sized enterprises. In addition, there is concern about the adverse effect on global competitiveness.
The highest price at the time of the Gulf War The 9/11 terrorist
attacks in the US
The highest price ever145.29 dollars
5 Japan's Energy 2016 http://www.enecho.meti.go.jp/
87%CO₂ emissions of the energy sources
83 milliontons
1,364(million t-CO₂)
(million t-CO₂)
FY 2014
1,304FY 2010
Source: Comprehensive energy statistics, environmental action plans (FEPC), and calculation results of the amount of greenhouse gas emissions in Japan (Ministry of the Environment).
FY 2014FY 2010
457374
733765
The amount of electric power
Other than the amount of electric power
The amount of greenhouse gas emissions of the energy sources other than CO₂
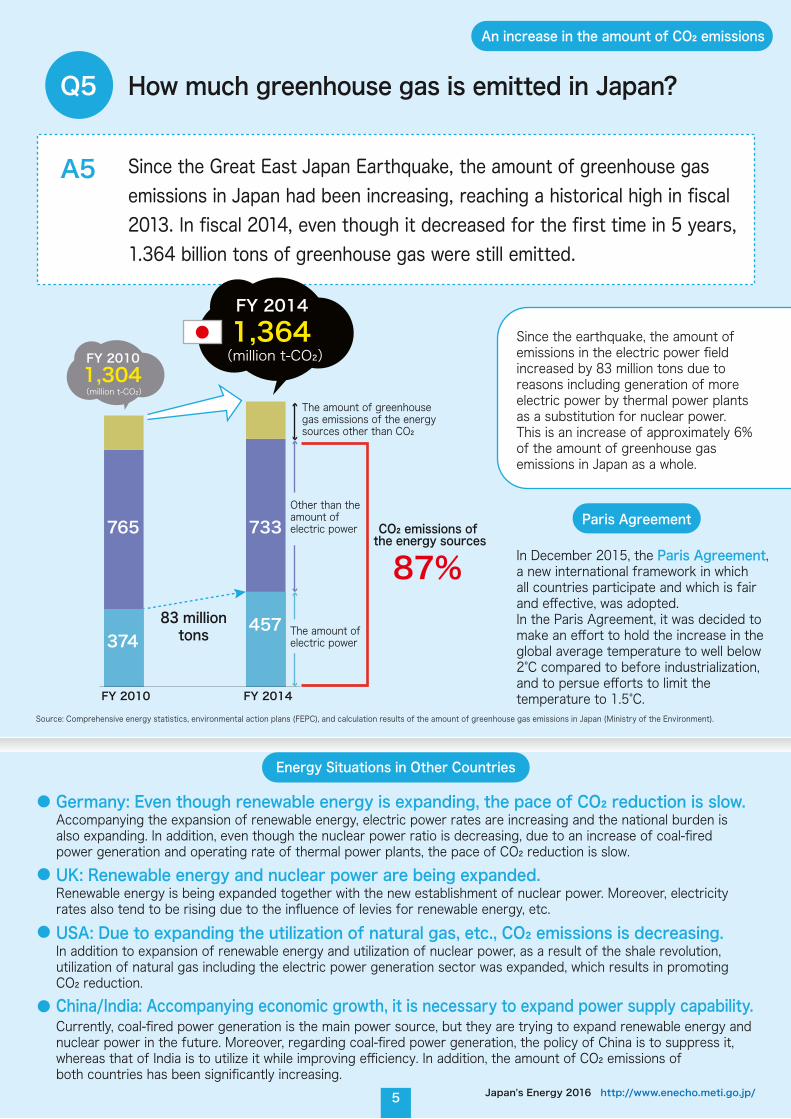
Since the Great East Japan Earthquake, the amount of greenhouse gas emissions in Japan had been increasing, reaching a historical high in fiscal 2013. In fiscal 2014, even though it decreased for the first time in 5 years, 1.364 billion tons of greenhouse gas were still emitted.
How much greenhouse gas is emitted in Japan?Q5
A5
An increase in the amount of CO₂ emissions
In December 2015, the Paris Agreement, a new international framework in which all countries participate and which is fair and effective, was adopted.In the Paris Agreement, it was decided to make an effort to hold the increase in the global average temperature to well below 2°C compared to before industrialization, and to persue efforts to limit the temperature to 1.5°C.
Paris Agreement
Energy Situations in Other Countries
Accompanying the expansion of renewable energy, electric power rates are increasing and the national burden is also expanding. In addition, even though the nuclear power ratio is decreasing, due to an increase of coal-fired power generation and operating rate of thermal power plants, the pace of CO₂ reduction is slow.
Germany: Even though renewable energy is expanding, the pace of CO₂ reduction is slow.
UK: Renewable energy and nuclear power are being expanded.Renewable energy is being expanded together with the new establishment of nuclear power. Moreover, electricity rates also tend to be rising due to the influence of levies for renewable energy, etc.USA: Due to expanding the utilization of natural gas, etc., CO₂ emissions is decreasing.In addition to expansion of renewable energy and utilization of nuclear power, as a result of the shale revolution, utilization of natural gas including the electric power generation sector was expanded, which results in promoting CO₂ reduction.China/India: Accompanying economic growth, it is necessary to expand power supply capability.Currently, coal-fired power generation is the main power source, but they are trying to expand renewable energy and nuclear power in the future. Moreover, regarding coal-fired power generation, the policy of China is to suppress it, whereas that of India is to utilize it while improving efficiency. In addition, the amount of CO₂ emissions of both countries has been significantly increasing.
Since the earthquake, the amount of emissions in the electric power field increased by 83 million tons due to reasons including generation of more electric power by thermal power plants as a substitution for nuclear power. This is an increase of approximately 6% of the amount of greenhouse gas emissions in Japan as a whole.
6Japan's Energy 2016 http://www.enecho.meti.go.jp/
Minamitori Island
Okinotori IslandYonaguni Island
Okinawa
OgasawaraIslands
Oki Islands
Hydrogen jet aircraft
Portable FC
FC railroad vehicleFC Bus
Hydrogen power generation/FC for business and indutry
Residential fuel cell(ENE-FARM)
Fuel cell vehicle(FCV)
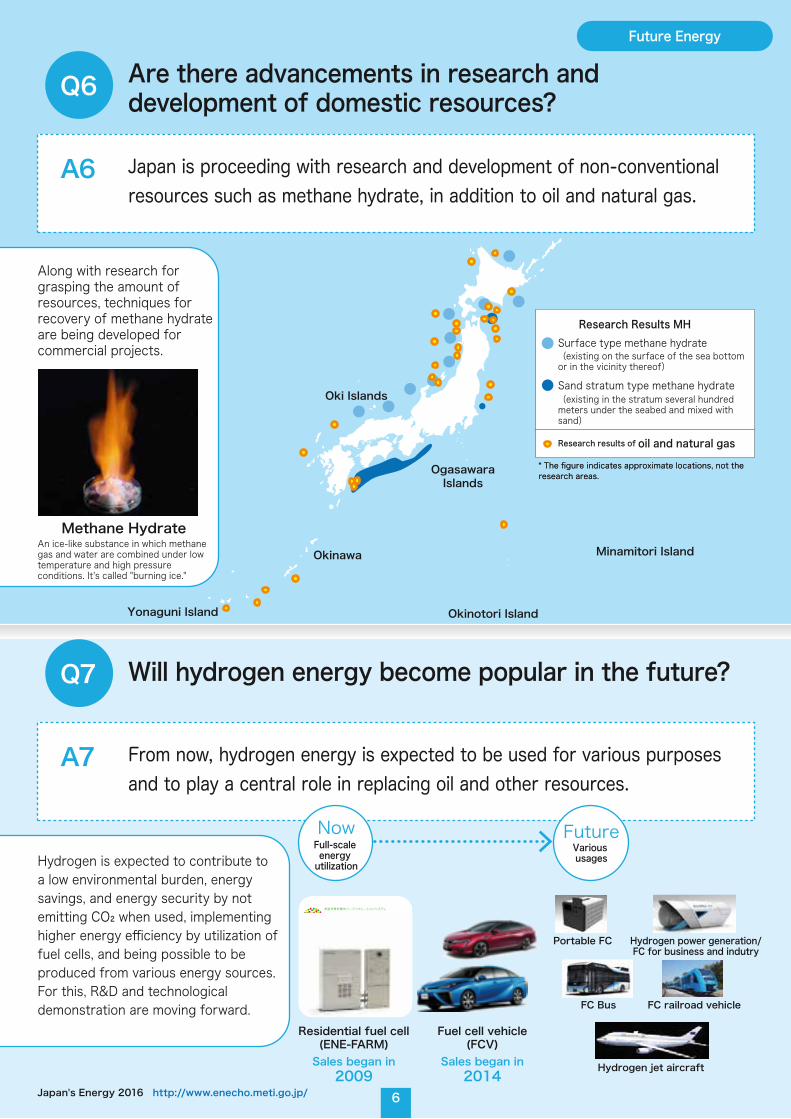
Sales began in2009
Sales began in2014
FutureVarious usages
NowFull-scale energy utilization
Surface type methane hydrate
Sand stratum type methane hydrate
Research Results MH
Research results of oil and natural gas
(existing on the surface of the sea bottom or in the vicinity thereof)
(existing in the stratum several hundred meters under the seabed and mixed with sand)
* The figure indicates approximate locations, not the research areas.* The figure indicates approximate locations, not the research areas.
From now, hydrogen energy is expected to be used for various purposesand to play a central role in replacing oil and other resources.
Will hydrogen energy become popular in the future?Q7
A7
Japan is proceeding with research and development of non-conventional resources such as methane hydrate, in addition to oil and natural gas.
Are there advancements in research and development of domestic resources?Q6
A6
Future Energy
Along with research for grasping the amount of resources, techniques for recovery of methane hydrate are being developed forcommercial projects.
Hydrogen is expected to contribute to a low environmental burden, energy savings, and energy security by not emitting CO₂ when used, implementing higher energy efficiency by utilization of fuel cells, and being possible to be produced from various energy sources.For this, R&D and technological demonstration are moving forward.
Methane HydrateAn ice-like substance in which methane gas and water are combined under low temperature and high pressure conditions. It's called "burning ice."
7 Japan's Energy 2016 http://www.enecho.meti.go.jp/
FY 2014FY 1973
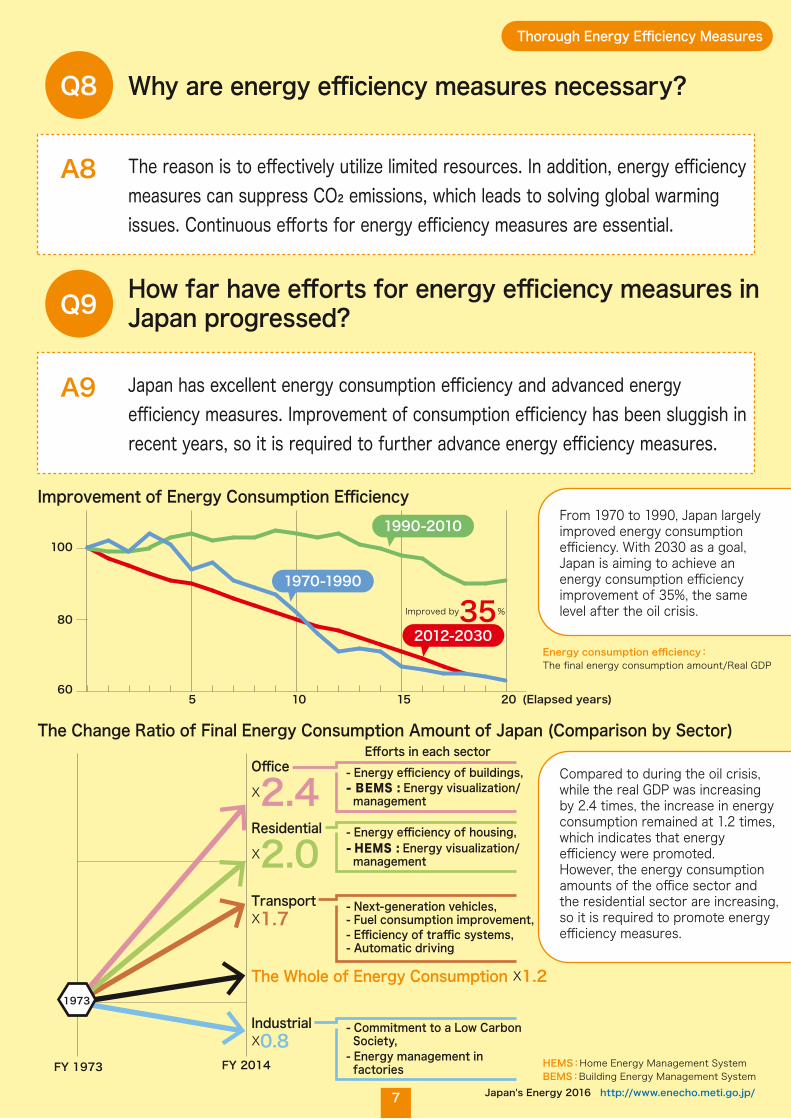
The Whole of Energy Consumption X1.2
IndustrialX0.8
TransportX1.7
ResidentialX2.0
OfficeX2.4
1973
- Commitment to a Low Carbon Society,
- Efficiency of traffic systems,- Automatic driving
- Energy efficiency of buildings,
- Energy efficiency of housing,
- BEMS : Energy visualization/ management
- HEMS : Energy visualization/ management
- Energy management in factories
Efforts in each sector
(Elapsed years)60
80
100
5 10 15 20
1990-2010
1970-1990
Improved by35%
2012-2030
- Next-generation vehicles,- Fuel consumption improvement,
Compared to during the oil crisis, while the real GDP was increasing by 2.4 times, the increase in energy consumption remained at 1.2 times, which indicates that energy efficiency were promoted.However, the energy consumption amounts of the office sector and the residential sector are increasing, so it is required to promote energy efficiency measures.
The Change Ratio of Final Energy Consumption Amount of Japan (Comparison by Sector)
The reason is to effectively utilize limited resources. In addition, energy efficiency measures can suppress CO₂ emissions, which leads to solving global warming issues. Continuous efforts for energy efficiency measures are essential.
Why are energy efficiency measures necessary?Q8
A8
Japan has excellent energy consumption efficiency and advanced energy efficiency measures. Improvement of consumption efficiency has been sluggish in recent years, so it is required to further advance energy efficiency measures.
How far have efforts for energy efficiency measures in Japan progressed?
A9
HEMS:Home Energy Management SystemBEMS:Building Energy Management System
Energy consumption efficiency:The final energy consumption amount/Real GDP
Q9
Thorough Energy Efficiency Measures
Improvement of Energy Consumption EfficiencyFrom 1970 to 1990, Japan largely improved energy consumption efficiency. With 2030 as a goal, Japan is aiming to achieve an energy consumption efficiency improvement of 35%, the same level after the oil crisis.
8Japan's Energy 2016 http://www.enecho.meti.go.jp/
Nuclearpower19.3
Nuclearpower21.0
Nuclearpower20.7
Nuclearpower77.7
Natural gas3.5
Nuclearpower14.2
Nuclearpower 0
Natural gas32.0
Natural gas29.8
Natural gas18.5
Natural gas9.4
Natural gas46.2
Oil, others 0.9
Oil, others 0.9
Oil, others 0.5
Oil, others 0.3Coal2.2
Hydroelectric9.7
Renewableenergy 6.5
Coal34.3
Hydroelectric5.9
Renewableenergy 7.5
Coal22.9
Hydroelectric1.9
Renewableenergy23.9
Oil, others5.5
Coal19.7
Renewableenergy25.6
Hydroelectric10.1
Coal43.7
Hydroelectric2.9
Renewableenergy28.9
Oil, others10.6
Coal31.0
Hydroelectric9.0
Renewableenergy 3.2
France Germany
100%
80%
60%
40%
20%
0%SpainUKUSA Japan
Comparison of the Renewable Energy Ratio in the Generated Electric Power Amount
12.2%
RenewableEnergy Ratioof Japan(2014)
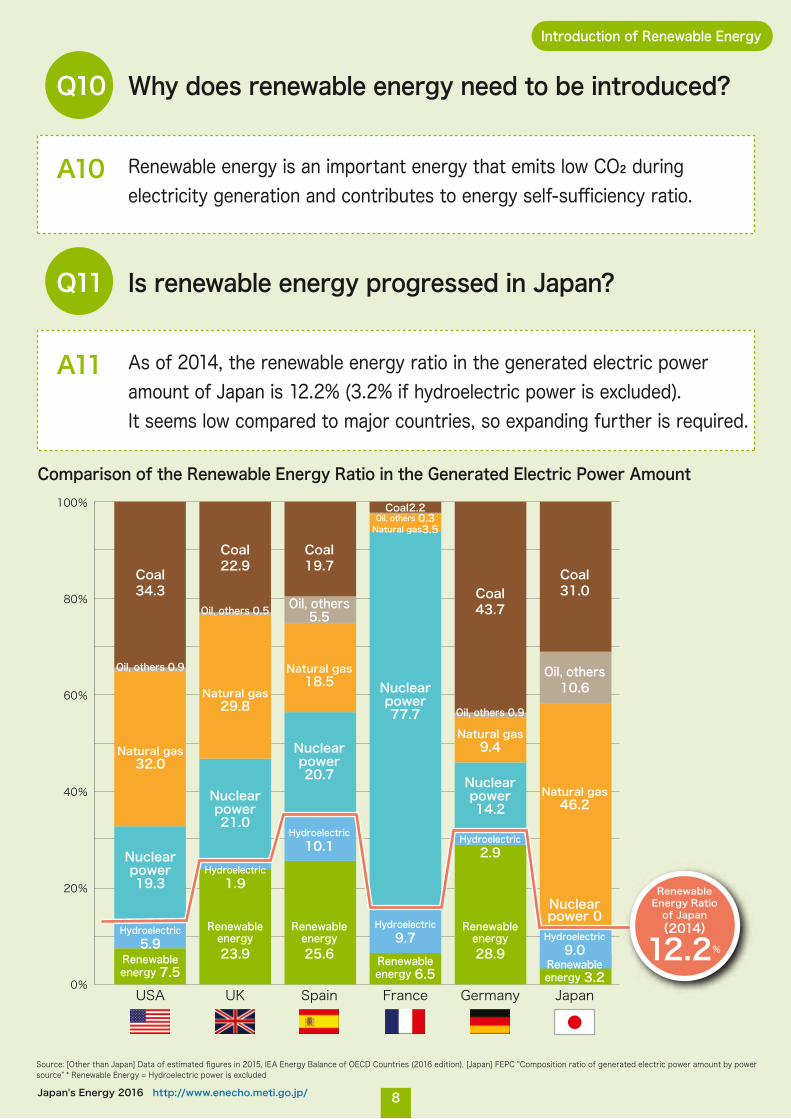
Renewable energy is an important energy that emits low CO₂ duringelectricity generation and contributes to energy self-sufficiency ratio.
Why does renewable energy need to be introduced?
A10
Introduction of Renewable Energy
As of 2014, the renewable energy ratio in the generated electric power amount of Japan is 12.2% (3.2% if hydroelectric power is excluded).It seems low compared to major countries, so expanding further is required.
Is renewable energy progressed in Japan?
Q10
Q11
A11
Source: [Other than Japan] Data of estimated figures in 2015, IEA Energy Balance of OECD Countries (2016 edition), [Japan] FEPC "Composition ratio of generated electric power amount by power source” * Renewable Energy = Hydroelectric power is excluded
9 Japan's Energy 2016 http://www.enecho.meti.go.jp/
(FY)
(10,000kW)
1000
2000
3000
4000
2003 2009 2012 20142013
FY 2012
aprx. ¥250B
FY 2014 FY 2016
aprx. ¥1.8T
aprx. ¥650B
Levy unit¥0.22(monthly)
¥62/m aprx. ¥900B
Levy unit¥0.75(monthly)
¥225/m
aprx. ¥2.3T
Levy unit¥2.25(monthly)
¥675/m
Levy
FIT costs
aprx.130B¥
風力発電(発電量変動)
■Solar ■Wind ■Biomass ■Geothermal ■Small and medium scale hydroelectric Power
Averageannual growth
5%
Averageannual growth
9%
Averageannual growth
33%
Base load power sources (hydroelectric power, nuclear power, geothermal power, coal-fired power, etc.)
(LNG/Oil, etc.)
Morning Day Night
Output adjustment by thermal power generation
SuppressionSuppression
Increasedgeneration
Increasedgeneration
Electricity demand
SolarSupply
(aprx. $0.8)
(aprx. $2.1)
(aprx. $6.1)
(aprx. $20.9B)
(aprx. $8.4B)
(aprx. $3.1B)
per kWh
per kWh
per kWh
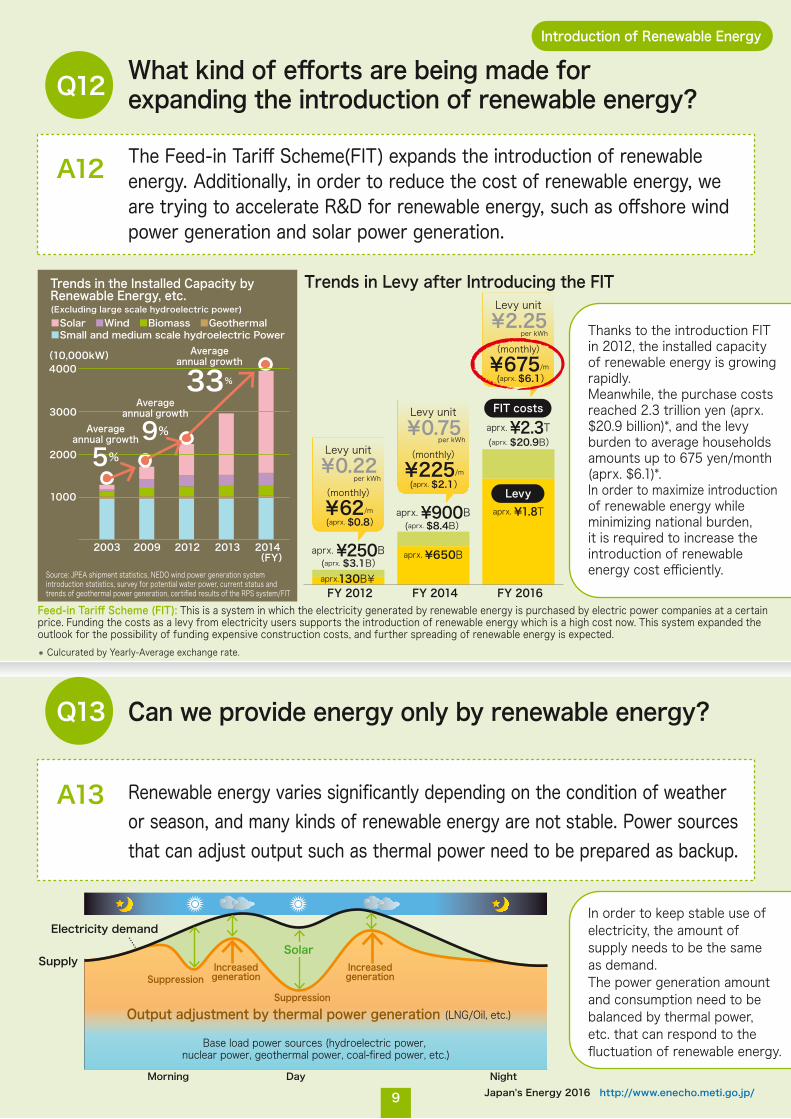
Feed-in Tariff Scheme (FIT): This is a system in which the electricity generated by renewable energy is purchased by electric power companies at a certain price. Funding the costs as a levy from electricity users supports the introduction of renewable energy which is a high cost now. This system expanded the outlook for the possibility of funding expensive construction costs, and further spreading of renewable energy is expected.
Renewable energy varies significantly depending on the condition of weather or season, and many kinds of renewable energy are not stable. Power sources that can adjust output such as thermal power need to be prepared as backup.
The Feed-in Tariff Scheme(FIT) expands the introduction of renewable energy. Additionally, in order to reduce the cost of renewable energy, we are trying to accelerate R&D for renewable energy, such as offshore wind power generation and solar power generation.
A12
Can we provide energy only by renewable energy?Q13
What kind of efforts are being made for expanding the introduction of renewable energy?Q12
A13
Introduction of Renewable Energy
Source: JPEA shipment statistics, NEDO wind power generation system introduction statistics, survey for potential water power, current status and trends of geothermal power generation, certified results of the RPS system/FIT
Trends in the Installed Capacity by Renewable Energy, etc.(Excluding large scale hydroelectric power)
Thanks to the introduction FIT in 2012, the installed capacity of renewable energy is growing rapidly.Meanwhile, the purchase costs reached 2.3 trillion yen (aprx.$20.9 billion)*, and the levy burden to average households amounts up to 675 yen/month (aprx. $6.1)*. In order to maximize introduction of renewable energy while minimizing national burden, it is required to increase the introduction of renewable energy cost efficiently.
In order to keep stable use of electricity, the amount of supply needs to be the same as demand.The power generation amount and consumption need to be balanced by thermal power, etc. that can respond to the fluctuation of renewable energy.
Trends in Levy after Introducing the FIT
* Culcurated by Yearly-Average exchange rate.
10Japan's Energy 2016 http://www.enecho.meti.go.jp/
Frozen soil walls
Sea-side impermeable wall
Ocean
Prevent underground water from flowing into buildings.
SubdrainPrevent underground water
from flowing into buildings and flowing out into the ocean.
Prevent contaminated underground water from flowing out into the ocean.
Groundwater bypassPrevent underground water from flowing into buildings.
Reactor buildings
Ground water
Radioactive material concentration in surrounding ocean areas of the Fukushima Daiichi Nuclear Power Plant
Change in radiation doses in surrounding municipalities
Improvement in the Radioactive Material Concentration and Radiation Doses
May 2011 March 2016(5 years after the accident)
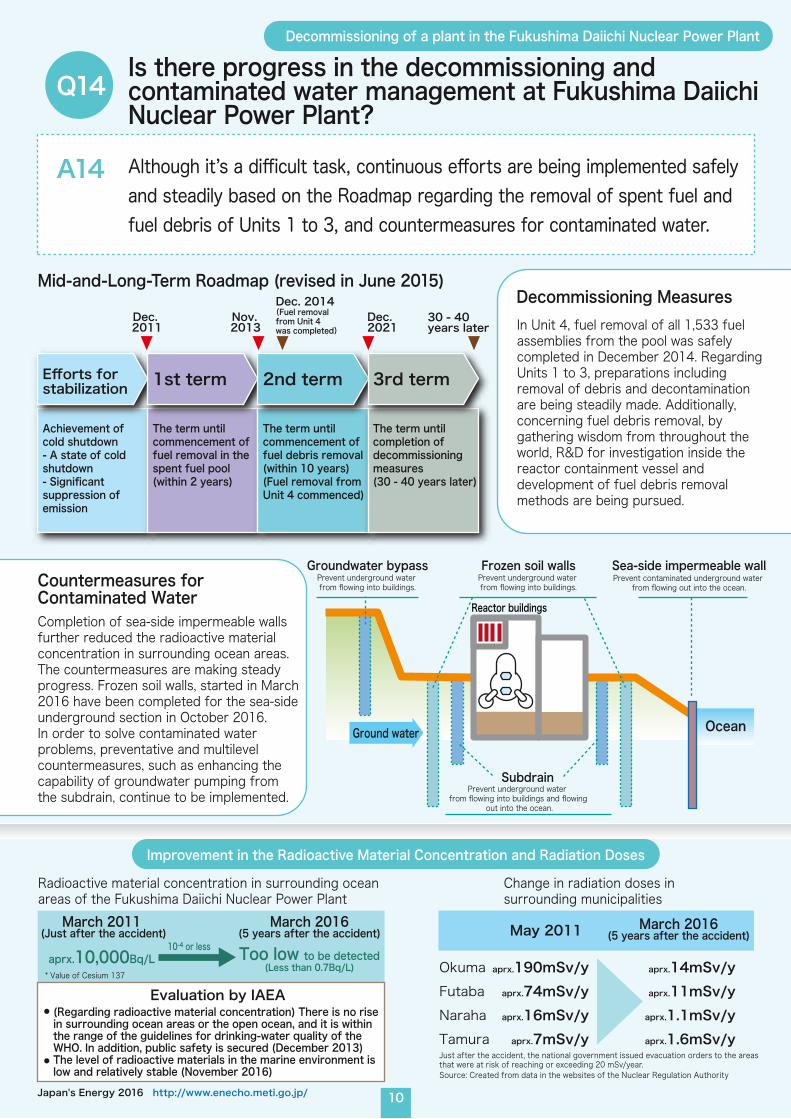
March 2011 (Just after the accident)aprx.10,000Bq/L Too low to be detected
(Less than 0.7Bq/L)
March 2016(5 years after the accident)
Evaluation by IAEA
aprx.190mSv/yaprx.74mSv/yaprx.16mSv/yaprx.7mSv/y
aprx.14mSv/yaprx.11mSv/yaprx.1.1mSv/yaprx.1.6mSv/y
OkumaFutabaNaraha Tamura
Source: Created from data in the websites of the Nuclear Regulation Authority
Just after the accident, the national government issued evacuation orders to the areas that were at risk of reaching or exceeding 20 mSv/year.
Although it’s a difficult task, continuous efforts are being implemented safely and steadily based on the Roadmap regarding the removal of spent fuel andfuel debris of Units 1 to 3, and countermeasures for contaminated water.
Is there progress in the decommissioning and contaminated water management at Fukushima Daiichi Nuclear Power Plant?
Q14
A14
Decommissioning of a plant in the Fukushima Daiichi Nuclear Power Plant
Mid-and-Long-Term Roadmap (revised in June 2015)Decommissioning Measures
Completion of sea-side impermeable walls further reduced the radioactive material concentration in surrounding ocean areas. The countermeasures are making steady progress. Frozen soil walls, started in March 2016 have been completed for the sea-sideunderground section in October 2016.In order to solve contaminated water problems, preventative and multilevel countermeasures, such as enhancing the capability of groundwater pumping from the subdrain, continue to be implemented.
In Unit 4, fuel removal of all 1,533 fuel assemblies from the pool was safely completed in December 2014. Regarding Units 1 to 3, preparations including removal of debris and decontamination are being steadily made. Additionally, concerning fuel debris removal, by gathering wisdom from throughout the world, R&D for investigation inside the reactor containment vessel and development of fuel debris removal methods are being pursued.
Countermeasures for Contaminated Water
Efforts for stabilization
Achievement of cold shutdown- A state of cold shutdown- Significant suppression of emission
1st term 2nd term 3rd term
The term until completion of decommissioning measures(30 - 40 years later)
Dec. 2011
Nov. 2013
Dec. 2021
Dec. 2014(Fuel removal from Unit 4 was completed)
30 - 40 years later
* Value of Cesium 137
(Regarding radioactive material concentration) There is no rise in surrounding ocean areas or the open ocean, and it is within the range of the guidelines for drinking-water quality of the WHO. In addition, public safety is secured (December 2013)The level of radioactive materials in the marine environment is low and relatively stable (November 2016)
The term until commencement of fuel debris removal (within 10 years)(Fuel removal from Unit 4 commenced)
The term until commencement of fuel removal in the spent fuel pool (within 2 years)
10-4 or less
11 Japan's Energy 2016 http://www.enecho.meti.go.jp/
International Joint Research Center for Nuclear Decommissioning International Joint research building (Tomioka Town)
Fukushima Daiichi Nuclear Power Plant
Fukushima Daini Nuclear Power Plant
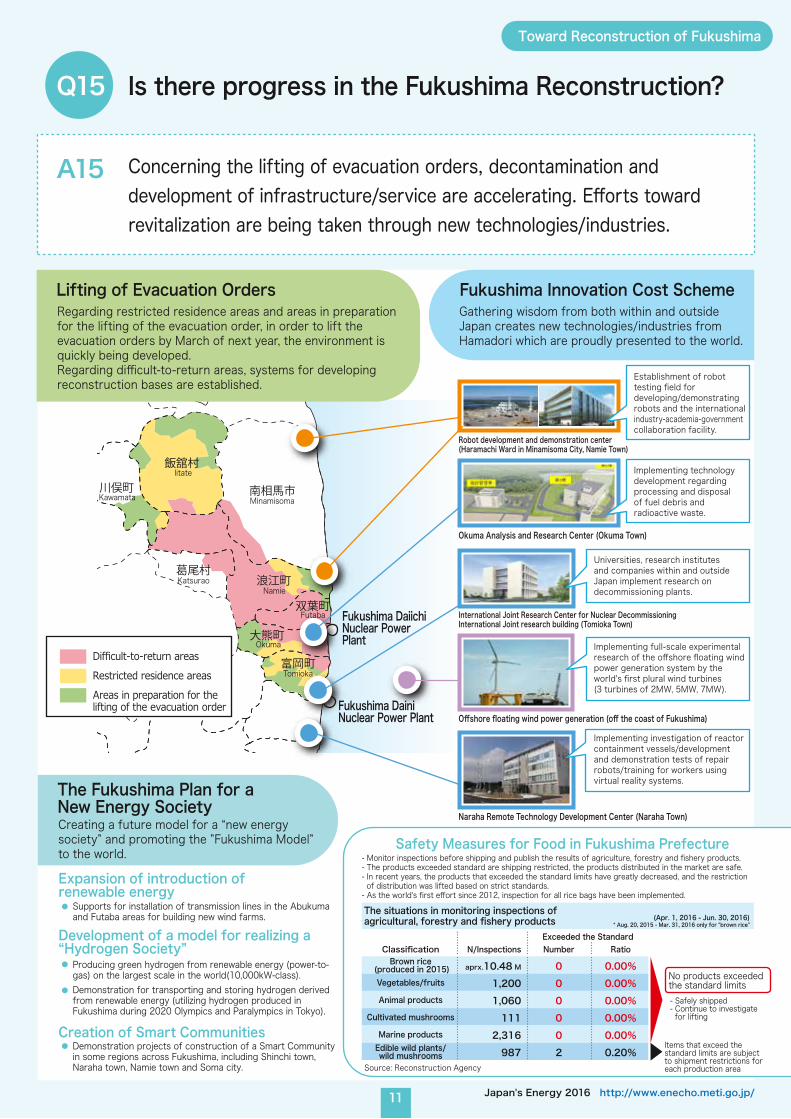
Concerning the lifting of evacuation orders, decontamination and development of infrastructure/service are accelerating. Efforts toward revitalization are being taken through new technologies/industries.
Is there progress in the Fukushima Reconstruction?Q15
A15
Toward Reconstruction of Fukushima
Lifting of Evacuation OrdersRegarding restricted residence areas and areas in preparation for the lifting of the evacuation order, in order to lift the evacuation orders by March of next year, the environment is quickly being developed. Regarding difficult-to-return areas, systems for developing reconstruction bases are established.
Fukushima Innovation Cost SchemeGathering wisdom from both within and outside Japan creates new technologies/industries from Hamadori which are proudly presented to the world.
The Fukushima Plan for a New Energy SocietyCreating a future model for a “new energy society” and promoting the ”Fukushima Model” to the world.
Okuma Analysis and Research Center (Okuma Town)
Robot development and demonstration center(Haramachi Ward in Minamisoma City, Namie Town)
Offshore floating wind power generation (off the coast of Fukushima)
Expansion of introduction of renewable energySupports for installation of transmission lines in the Abukuma and Futaba areas for building new wind farms.
Creation of Smart CommunitiesDemonstration projects of construction of a Smart Community in some regions across Fukushima, including Shinchi town, Naraha town, Namie town and Soma city.
Development of a model for realizing a “Hydrogen Society”Producing green hydrogen from renewable energy (power-to-gas) on the largest scale in the world(10,000kW-class).Demonstration for transporting and storing hydrogen derived from renewable energy (utilizing hydrogen produced in Fukushima during 2020 Olympics and Paralympics in Tokyo).
Difficult-to-return areasRestricted residence areasAreas in preparation for the lifting of the evacuation order
Naraha Remote Technology Development Center (Naraha Town)
Universities, research institutes and companies within and outside Japan implement research on decommissioning plants.
Implementing investigation of reactor containment vessels/development and demonstration tests of repair robots/training for workers using virtual reality systems.
Implementing full-scale experimental research of the offshore floating wind power generation system by the world's first plural wind turbines (3 turbines of 2MW, 5MW, 7MW).
Establishment of robot testing field for developing/demonstrating robots and the international industry-academia-government collaboration facility.
Implementing technology development regarding processing and disposal of fuel debris and radioactive waste.
Safety Measures for Food in Fukushima Prefecture
Source: Reconstruction Agency
ClassificationBrown rice
(produced in 2015)Vegetables/fruits
Animal products
Cultivated mushrooms
Marine productsEdible wild plants/wild mushrooms
N/Inspections
aprx.10.48 M
1,2001,060111
2,316987
Number
000002
Ratio
0.00%0.00%0.00%0.00%0.00%0.20%
Items that exceed the standard limits are subject to shipment restrictions for each production area
- Safely shipped- Continue to investigate for lifting
The situations in monitoring inspections of agricultural, forestry and fishery products (Apr. 1, 2016 - Jun. 30, 2016)
* Aug. 20, 2015 - Mar. 31, 2016 only for "brown rice"
●
●
●
●
No products exceeded the standard limits
Okuma
Tomioka
Futaba
Namie Katsurao
Minamisoma
Iitate
Kawamata
Exceeded the Standard
- Monitor inspections before shipping and publish the results of agriculture, forestry and fishery products.- The products exceeded standard are shipping restricted, the products distributed in the market are safe.- In recent years, the products that exceeded the standard limits have greatly decreased, and the restriction of distribution was lifted based on strict standards.- As the world's first effort since 2012, inspection for all rice bags have been implemented.
12Japan's Energy 2016 http://www.enecho.meti.go.jp/
Fukushima(TEPCO) Fukushima Daini
Aomori (Electric Power Development Co., Ltd.) Ooma
Hokkaido(Hokkaido EPC) Tomari
Aomori (Tohoku EPC) Higashidori
Miyagi(Tohoku EPC) OnagawaFukushima(TEPCO) Fukushima Daiichi
(TEPCO) Higashidori
Niigata(TEPCO) Kashiwazalo-KariwaIshikawa(Hokuriku EPC) Shika
(JAPC) Tsuruga
(KEPCO) Mihama
(KEPCO) Ooi
(KEPCO) Takahama
Shizuoka(Chubu EPC) Hamaoka
IbarakiJAPC Tokai/Tokai No.2 Power Station
Ehime(Shikoku EPC) Ikata
Shimane(Chugoku EPC) Shimane
Saga(Kyushu EPC) Genkai
Kagoshima(Kyushu EPC) Sendai
Fukui
Final disposal (stratum disposal)
Nuclearpowerplant
Reprocessing
Solidified glass mass
Aboveground facility
Reprocessing plant
Recycling as fuel
Spent fuel
* Turning waste water into solidified glass mass
Underground facility
300m
Radioactive materials are confined in the mesh structure of glass
Separating/extracting uranium/plutonium
❶❷❸●
❶❶
❶❷❸
❶❷❸❹❺❻
❶❷❸❹❺❶❷❸
❶❷❸❹❺❻❼
❶❷
❶❷
❶❷❸
❶❷❸❹
❶❷❸❹
❶❷❸❹
❶❷
❶❷❸❶❷❸❹
●●
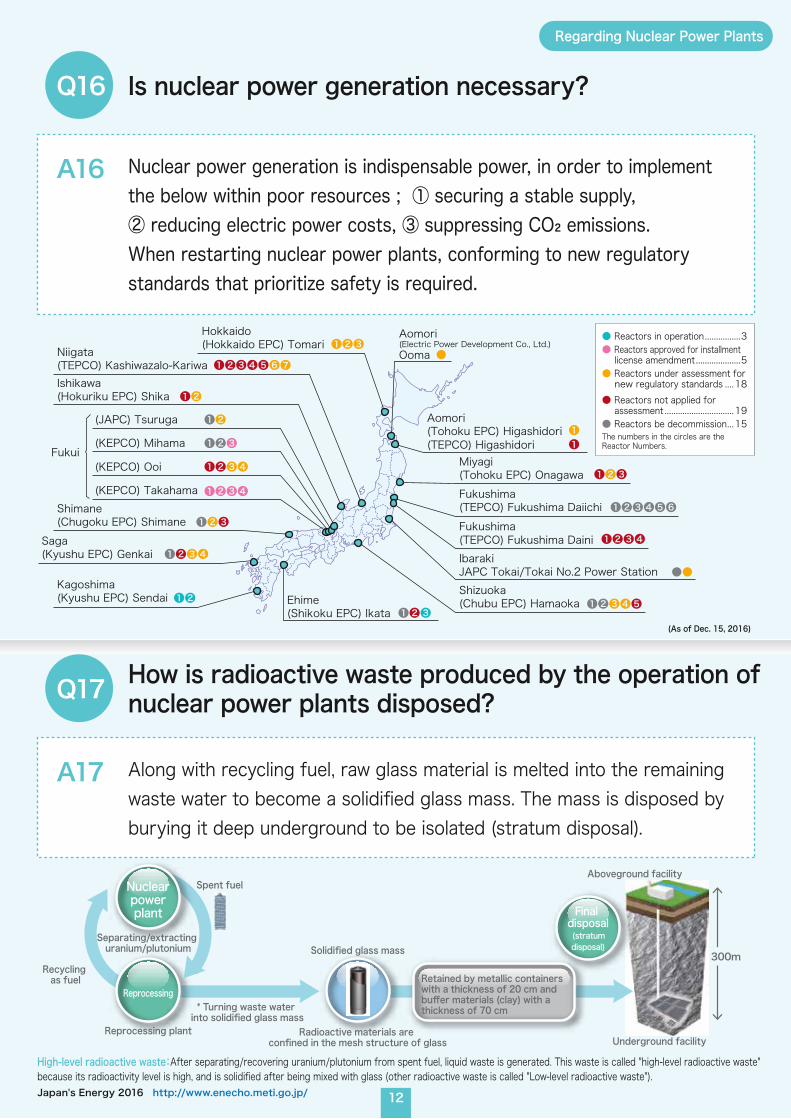
● Reactors in operation................3● Reactors approved for installment license amendment ....................5● Reactors under assessment for new regulatory standards ....18● Reactors not applied for assessment ...............................19● Reactors be decommission...15The numbers in the circles are the Reactor Numbers.
Retained by metallic containers with a thickness of 20 cm and buffer materials (clay) with a thickness of 70 cm
Nuclear power generation is indispensable power, in order to implement the below within poor resources ; ① securing a stable supply, ② reducing electric power costs, ③ suppressing CO₂ emissions.When restarting nuclear power plants, conforming to new regulatory standards that prioritize safety is required.
Is nuclear power generation necessary?Q16
A16
High-level radioactive waste:After separating/recovering uranium/plutonium from spent fuel, liquid waste is generated. This waste is called "high-level radioactive waste" because its radioactivity level is high, and is solidified after being mixed with glass (other radioactive waste is called "Low-level radioactive waste").
Along with recycling fuel, raw glass material is melted into the remaining waste water to become a solidified glass mass. The mass is disposed by burying it deep underground to be isolated (stratum disposal).
How is radioactive waste produced by the operation of nuclear power plants disposed?Q17
A17
Regarding Nuclear Power Plants
(As of Dec. 15, 2016)
13 Japan's Energy 2016 http://www.enecho.meti.go.jp/
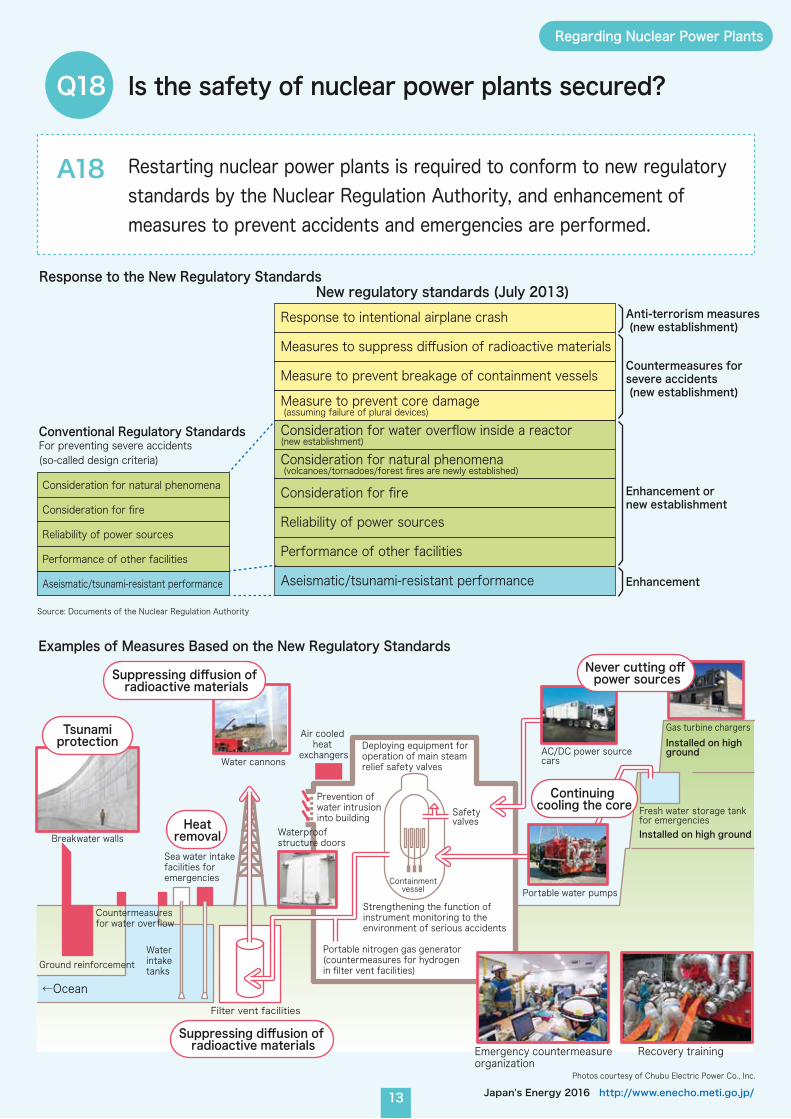
Response to intentional airplane crash
Measures to suppress diffusion of radioactive materials
Measure to prevent breakage of containment vesselsMeasure to prevent core damage (assuming failure of plural devices)
Consideration for water overflow inside a reactor(new establishment)
Consideration for natural phenomena (volcanoes/tornadoes/forest fires are newly established)
Consideration for fire
Reliability of power sources
Performance of other facilities
Aseismatic/tsunami-resistant performance
Consideration for natural phenomena
Consideration for fire
Reliability of power sources
Performance of other facilities
Aseismatic/tsunami-resistant performance
Anti-terrorism measures (new establishment)
Countermeasures for severe accidents (new establishment)
Enhancement or new establishment
Enhancement
Conventional Regulatory Standards For preventing severe accidents(so-called design criteria)
New regulatory standards (July 2013)
Examples of Measures Based on the New Regulatory Standards
Response to the New Regulatory Standards
Sea water intake facilities for emergencies
Waterproof structure doors
Prevention of water intrusion into building
Containmentvessel
Safetyvalves
Deploying equipment for operation of main steam relief safety valves
Strengthening the function of instrument monitoring to the environment of serious accidents
Portable nitrogen gas generator(countermeasures for hydrogen in filter vent facilities)
Water cannons
←Ocean
Installed on high ground
Installed on high ground
Emergency countermeasure organization
Recovery training
AC/DC power source cars
Gas turbine chargers
Fresh water storage tank for emergencies
Portable water pumps
Filter vent facilities
Air cooled heat
exchangers
Countermeasures for water overflow
Ground reinforcement
Heatremoval
Suppressing diffusion of radioactive materials
Continuing cooling the core
Never cutting off power sources
Tsunami protection
Breakwater walls
Suppressing diffusion of radioactive materials
Water intake tanks
Restarting nuclear power plants is required to conform to new regulatory standards by the Nuclear Regulation Authority, and enhancement of measures to prevent accidents and emergencies are performed.
Is the safety of nuclear power plants secured?Q18
A18
Source: Documents of the Nuclear Regulation Authority
Regarding Nuclear Power Plants
Photos courtesy of Chubu Electric Power Co., Inc.
SelfSufficiency
Electricity Demand Composition of Power Sources
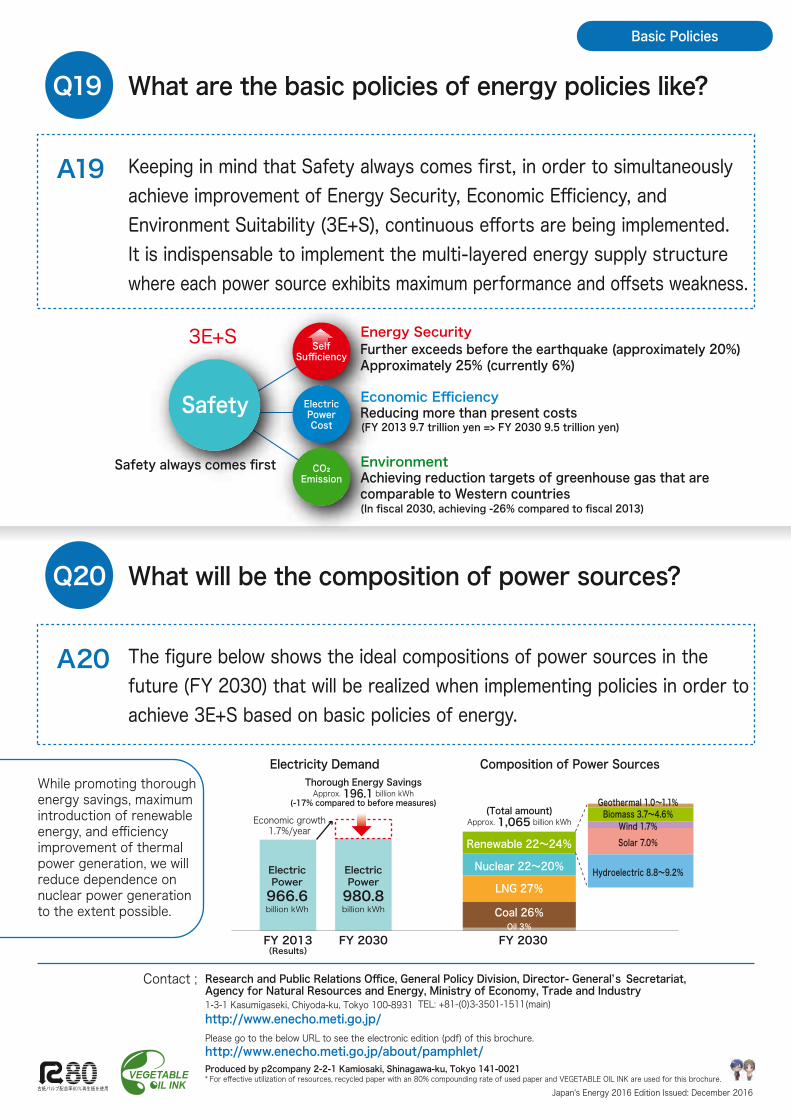
ElectricPower966.6billion kWh
ElectricPower980.8billion kWh
FY 2030 FY 2030
(Total amount)Approx. 1,065 billion kWh
Renewable 22~24%
Nuclear 22~20%
LNG 27%
Coal 26%Oil 3%
FY 2013(Results)
Further exceeds before the earthquake (approximately 20%)Approximately 25% (currently 6%)
Reducing more than present costs
Achieving reduction targets of greenhouse gas that are comparable to Western countries(In fiscal 2030, achieving -26% compared to fiscal 2013)
Safety always comes first
(FY 2013 9.7 trillion yen => FY 2030 9.5 trillion yen)Safety
Energy Security
Economic Efficiency
Environment
ElectricPowerCost
CO₂Emission
Geothermal 1.0~1.1%Biomass 3.7~4.6%
Wind 1.7%Solar 7.0%
Hydroelectric 8.8~9.2%
Economic growth1.7%/year
Thorough Energy SavingsApprox. 196.1 billion kWh
(-17% compared to before measures)
Q1. How much energy can be self-supplied by domestic resources in Japan?
Q2. What resources does Japan depend on?
Q3. What countries does Japan import resources from?
Q4. How are electric power costs changing?
Q5. How much greenhouse gas is emitted in Japan?
Q6. Are there advancements in research and development of domestic resources?
Q7. Will hydrogen energy become popular in the future?
Q8. Why are energy necessary?
Q9. How far have efforts for energy savings in Japan progressed?
Q10. Why does renewable energy need to be introduced?
Q11. Is renewable energy progressed in Japan?
Q12. What kind of efforts are being made for expanding the introduction of renewable energy?
Q13. Can we provide energy only by renewable energy?
Q14. Is there progress in the decommissioning and contaminated water management at Fukushima Daiichi Nuclear Power Plant?
Q15. Is there progress in the Fukushima Reconstruction?
Q16. Is nuclear power generation necessary?
Q17. How is radioactive waste produced by the operation of nuclear power plants disposed?
Q18. Is the safety of nuclear power plants secured?
Q19. What are the basic policies of energy policies like?
Q20. What will be the composition of power sources?
JAPAN'S ENERGY 20 Questions to understand the current energy situation
INDEX
Ministry of Economy, Trade and IndustryAgency for Natural Resources and Energy
JAPAN'SENERGY20 Questions to understandthe current energy situation
2016 EDITION
Contact ;
Japan's Energy 2016 Edition Issued: December 2016* For effective utilization of resources, recycled paper with an 80% compounding rate of used paper and VEGETABLE OIL INK are used for this brochure.Produced by p2company 2-2-1 Kamiosaki, Shinagawa-ku, Tokyo 141-0021
The figure below shows the ideal compositions of power sources in the future (FY 2030) that will be realized when implementing policies in order to achieve 3E+S based on basic policies of energy.
What will be the composition of power sources?Q20
A20
Keeping in mind that Safety always comes first, in order to simultaneouslyachieve improvement of Energy Security, Economic Efficiency, and Environment Suitability (3E+S), continuous efforts are being implemented. It is indispensable to implement the multi-layered energy supply structure where each power source exhibits maximum performance and offsets weakness.
What are the basic policies of energy policies like?Q19
A19
Basic Policies
Research and Public Relations Office, General Policy Division, Director- General’s Secretariat, Agency for Natural Resources and Energy, Ministry of Economy, Trade and Industry
TEL: +81-(0)3-3501-1511(main)http://www.enecho.meti.go.jp/1-3-1 Kasumigaseki, Chiyoda-ku, Tokyo 100-8931
Please go to the below URL to see the electronic edition (pdf) of this brochure.http://www.enecho.meti.go.jp/about/pamphlet/
While promoting thorough energy savings, maximum introduction of renewable energy, and efficiency improvement of thermal power generation, we will reduce dependence on nuclear power generation to the extent possible.
3E+S


![[01]UNCOPUOS SentinelAsia Final · Sep. 1993 Tokyo, Japan Tokyo, Japan Tokyo, Japan Tokyo, Japan Ulanbator, Mongolia Tsukuba, Japan Tokyo, Japan Kuala Lumpur, Malaysia Daejeon, Korea](https://img.pdfslide.us/doc/110x75/600d276b3d3e78250500e5e2/01uncopuos-sentinelasia-final-sep-1993-tokyo-japan-tokyo-japan-tokyo-japan.jpg)