Embed Size (px)
Citation preview

Master of Science Thesis KTH School of Industrial Engineering and Management
Energy Technology EGI-2014-036MSC EKV1024 Division of Heat & Power SE-100 44 STOCKHOLM
Territorial greenhouse gases inventory, analysis
and reduction plan design
Analysis of greenhouse gas emissions from a predefined territory (Territoire de la Côte Ouest)
on the island of Réunion
Gislain Uhl

Master of Science Thesis EGI-2014-036MSC EKV1024
Territorial greenhouse gases inventory, analysis and reduction plan design
Gislain Uhl
Approved
2014-06-03
Examiner
Miroslav Petrov - KTH/ITM/EGI
Supervisor
Miroslav Petrov Commissioner
ECO2 Initiative, Paris
Contact person
Abstract This report presents a summary of the work done by the author for the Eco2 Initiative, a French energy consulting company, during the development of an official document (PCET) concerning the climate and energy policy on the island of La Réunion - a French island off the Madagascar coast in the Indian Ocean.
Firstly, the thesis examines some background details including a short description of the PCET contents and goals, and describes the studied regional territory occupying the western quarter of La Réunion. The PCET aims at reducing both the greenhouse gas (GHG) emissions on the territory and the territory's vulnerability to climate change in the future. The report treats only the GHG inventory and the beginning of an action plan design for the reduction of GHG emissions from all possible local sources.
Secondly, the methodology is discussed. The chosen method for the inventory is Bilan Carbone® which accounts for all Kyoto protocol gases the territory is responsible for or depends on, during one year. The emissions are split into ten categories: energy industry, industrial processes, residential, tertiary, agriculture and fishing, freight, people transportation, roads and construction, waste management, and import and local goods production.
Finally, the results of the inventory are displayed for each of the ten categories. The design process of the action plan is then described and an account example of selecting and adding an action is given. The current state of the PCET is also displayed, warning the reader that the analysis can further be extended and more actions can be added until a final feasible version is reached for any specific territory.
As a conclusion, the main results are summarized, the directions for the next steps in the particularly studied region are pointed out, and a critical point of view is adopted for the wider implementation of the devised action plan and its influence on the decision making process for future energy policies.
Contents
Contents iii
List of Figures v
List of Tables vi
Glossary vii
1 Introduction 1
2 Background 32.1 PCET . . . . . . . . . . . . . . . . . . . . . . . . . . . . . . . . . . . 3
2.2 About the quantification method used . . . . . . . . . . . . . . . . . 4
2.3 The territory . . . . . . . . . . . . . . . . . . . . . . . . . . . . . . . 4
3 Methodology 63.1 Scope definition . . . . . . . . . . . . . . . . . . . . . . . . . . . . . . 6
3.1.1 The time period . . . . . . . . . . . . . . . . . . . . . . . . . 6
3.1.2 The geographical boundaries . . . . . . . . . . . . . . . . . . 6
3.1.3 The gases . . . . . . . . . . . . . . . . . . . . . . . . . . . . . 6
3.1.4 The emission sources . . . . . . . . . . . . . . . . . . . . . . . 7
3.2 Data collection . . . . . . . . . . . . . . . . . . . . . . . . . . . . . . 11
3.3 Emission factors . . . . . . . . . . . . . . . . . . . . . . . . . . . . . 11
3.4 Avoided emissions . . . . . . . . . . . . . . . . . . . . . . . . . . . . 11
3.5 Emissions computation example . . . . . . . . . . . . . . . . . . . . . 12
3.5.1 Emission factor computation example . . . . . . . . . . . . . 12
3.5.2 Avoided emissions computation example . . . . . . . . . . . . 14
4 Quantification of TCO’s GHG emissions 164.1 Energy industry . . . . . . . . . . . . . . . . . . . . . . . . . . . . . . 16
4.2 Industrial processes . . . . . . . . . . . . . . . . . . . . . . . . . . . . 18
4.3 Tertiary . . . . . . . . . . . . . . . . . . . . . . . . . . . . . . . . . . 19
4.4 Residential . . . . . . . . . . . . . . . . . . . . . . . . . . . . . . . . 20
4.5 Agriculture and fishing . . . . . . . . . . . . . . . . . . . . . . . . . . 21
iii

Contents
4.6 People transportation . . . . . . . . . . . . . . . . . . . . . . . . . . 254.6.1 Road travel . . . . . . . . . . . . . . . . . . . . . . . . . . . . 254.6.2 Air travel . . . . . . . . . . . . . . . . . . . . . . . . . . . . . 274.6.3 Sea travel . . . . . . . . . . . . . . . . . . . . . . . . . . . . . 27
4.7 Freight . . . . . . . . . . . . . . . . . . . . . . . . . . . . . . . . . . . 284.7.1 Road transport . . . . . . . . . . . . . . . . . . . . . . . . . . 284.7.2 Air transport . . . . . . . . . . . . . . . . . . . . . . . . . . . 294.7.3 Sea transport . . . . . . . . . . . . . . . . . . . . . . . . . . . 29
4.8 Roads and constructions . . . . . . . . . . . . . . . . . . . . . . . . . 304.9 Waste Management . . . . . . . . . . . . . . . . . . . . . . . . . . . . 314.10 Imports and local goods production . . . . . . . . . . . . . . . . . . 32
4.10.1 Food self-sufficiency . . . . . . . . . . . . . . . . . . . . . . . 334.11 Emission quantification conclusion . . . . . . . . . . . . . . . . . . . 34
5 Emissions reduction plan 375.1 Targets . . . . . . . . . . . . . . . . . . . . . . . . . . . . . . . . . . 375.2 Scenario . . . . . . . . . . . . . . . . . . . . . . . . . . . . . . . . . . 385.3 Actions and costs . . . . . . . . . . . . . . . . . . . . . . . . . . . . . 385.4 Example . . . . . . . . . . . . . . . . . . . . . . . . . . . . . . . . . . 38
5.4.1 Setting a target . . . . . . . . . . . . . . . . . . . . . . . . . . 385.4.2 Ongoing trend . . . . . . . . . . . . . . . . . . . . . . . . . . 385.4.3 Implementation . . . . . . . . . . . . . . . . . . . . . . . . . . 395.4.4 Emissions reduction . . . . . . . . . . . . . . . . . . . . . . . 39
5.5 Emissions reduction plan conclusion . . . . . . . . . . . . . . . . . . 40
6 Conclusion and future work 42
Bibliography 44
iv

List of Figures
1.1 Reunion island in the world . . . . . . . . . . . . . . . . . . . . . . . . . 2
2.1 TCO territory . . . . . . . . . . . . . . . . . . . . . . . . . . . . . . . . 52.2 TCO population distribution . . . . . . . . . . . . . . . . . . . . . . . . 5
4.1 Energy industry GHG emissions . . . . . . . . . . . . . . . . . . . . . . 174.2 Industrial processes GHG emissions . . . . . . . . . . . . . . . . . . . . 184.3 Tertiary GHG emissions . . . . . . . . . . . . . . . . . . . . . . . . . . . 194.4 Shops equipment average electrical consumption . . . . . . . . . . . . . 204.5 Residential GHG emissions . . . . . . . . . . . . . . . . . . . . . . . . . 204.6 Household equipment average electrical consumption . . . . . . . . . . . 214.7 Agriculture and fishing GHG emissions . . . . . . . . . . . . . . . . . . 224.8 Agriculture distribution on TCO . . . . . . . . . . . . . . . . . . . . . . 234.9 GHG emissions by cultures . . . . . . . . . . . . . . . . . . . . . . . . . 244.10 GHG emissions by livestock . . . . . . . . . . . . . . . . . . . . . . . . . 244.11 People transportation GHG emissions . . . . . . . . . . . . . . . . . . . 254.12 Distribution of TCO vehicle power . . . . . . . . . . . . . . . . . . . . . 264.13 TCO vehicle consumption in toe . . . . . . . . . . . . . . . . . . . . . . 264.14 Reunion passengers Destinations and Origins . . . . . . . . . . . . . . . 274.15 Freight GHG emissions . . . . . . . . . . . . . . . . . . . . . . . . . . . 284.16 TCO freight vehicle distribution . . . . . . . . . . . . . . . . . . . . . . 294.17 Roads and construction GHG emissions . . . . . . . . . . . . . . . . . . 304.18 Waste management GHG emissions . . . . . . . . . . . . . . . . . . . . 314.19 TCO import GHG emissions . . . . . . . . . . . . . . . . . . . . . . . . 324.20 TCO local goods production GHG emissions . . . . . . . . . . . . . . . 324.21 Reunion imports . . . . . . . . . . . . . . . . . . . . . . . . . . . . . . . 334.22 Reunion food self-sufficiency on daily products . . . . . . . . . . . . . . 334.23 Total GHG emissions by districts . . . . . . . . . . . . . . . . . . . . . . 354.24 TCO Total GHG Emissions . . . . . . . . . . . . . . . . . . . . . . . . . 36
5.1 The action sectoral contribution to PCET . . . . . . . . . . . . . . . . . 405.2 TCO PCET scenario current state . . . . . . . . . . . . . . . . . . . . . 405.3 Sectoral view of TCO PCET scenario . . . . . . . . . . . . . . . . . . . 41
v

List of Tables
3.1 Kyoto protocol gases included in TCO PCET scope . . . . . . . . . . . 73.2 Emissions sources taken into account in TCO PCET . . . . . . . . . . . 10
4.1 Energy industry key figures . . . . . . . . . . . . . . . . . . . . . . . . . 174.2 Industrial processes key figures . . . . . . . . . . . . . . . . . . . . . . . 184.3 Tertiary key figures . . . . . . . . . . . . . . . . . . . . . . . . . . . . . . 194.4 Residential key figures . . . . . . . . . . . . . . . . . . . . . . . . . . . . 214.5 Agriculture and fishing key figures . . . . . . . . . . . . . . . . . . . . . 224.6 People transportation key figures . . . . . . . . . . . . . . . . . . . . . . 254.7 Freight key figures . . . . . . . . . . . . . . . . . . . . . . . . . . . . . . 284.8 Roads and construction key figures . . . . . . . . . . . . . . . . . . . . . 304.9 Waste management key figures . . . . . . . . . . . . . . . . . . . . . . . 314.10 Import and local goods production key figures . . . . . . . . . . . . . . 32
vi

Glossary
– ADEME (Agence de l’Environnement et de la Maîtrise de l’Éner-gie) : ADEME is the French abbreviation for Environment and Energy Mana-gement Agency. It is a national industrial and commercial public institutionacting under the supervision of the French ministries of Research, Ecologyand Energy.
– CO2b (Carbon Dioxide Biogenic) : A part of the CO2 of organic origin.See section 3.1.3 for more information.
– CO2e (Carbon Dioxide Equivalent) : CO2e is a measure of how much glo-bal warming a quantity of several types of gas may cause. The CO2e quantityis obtain by multiplying the different gas types masses and the correspondingGWP.
– GHG (Greenhouse Gas) :Greenhouse gases are those gaseous constituentsof the atmosphere, both natural and anthropogenic, that absorb and emitradiation at specific wavelengths within the spectrum of terrestrial radiationemitted by the Earth’s surface, the atmosphere itself, and by clouds. Thisproperty causes the greenhouse effect. Water poaur (H2O), carbon dioxide(CO2), nitrous oxide (N2O), methane (CH4) and ozone (O3) are the primarygreenhouse gases in the Earth’s atmosphere. Moreover, there are a number ofentirely human-made greenhouse gases in the atmosphere, such as the halocar-bons and other chlorine- and bromine-containing substances, dealt with underthe Montreal Protocol. Beside CO2, N2O and CH4, the Kyoto Protocol dealswith the greenhouse gases sulfulphur hexafluoride (SF6), hydrofluorocarbons(HFCs) and perfluorocarbons (PFCs).Definition given by the IPCC [14]
– GWP (Global Warming Potential) : An index, based on radiative pro-perties of greenhouse gases , measuring the radiative forcing following a pulseemission of a unit mass of a given greenhouse gas in the present- day atmos-
vii

List of Tables
phere integrated over a chosen time horizon, relative to that of carbon dioxide. The GWP represents the combined effect of the differing times these gasesremain in the atmosphere and their relative effectiveness in causing radiativeforcing. The Kyoto Protocol is based on GWPs from pulse emissions over a100-year time frame.Definition given by the IPCC [14]
– toe (Ton Oil Equivalent) : The ton of oil equivalent is defined by IEA/OECDto be equal to 41868 GJ.
– PCET (Plan Climat Energie Territoire) : Literally Climate and EnergyTerritory Plan, it is a sustainable development project for a territory. Moreinformation can be found in section 2.1.
– TCO (Territoire de la Côte Ouest) : TCO is the name given to the ter-ritory considered. More information can be found in section 2.3.
viii

Acknowledgment
First, I would like to thank Prof. Petrov and Prof. Fransson who accepted toread through my work. I hope I’ll succeed in keeping their interest to the end ofthis paper.
I also want to express my gratitude to everyone in the ECO2 Initiative team.Rémi M. and Shafik for letting me work on this project, for their guidance andtheir constant availability. Guillaume G. for the assistance he gave me and for hispatience. Rémi E. for his enthusiasm and for all the tips he taught me. My sincerethanks also goes to Clémence and Laura, for being such nice co-workers.
ix

Chapter 1
Introduction
This document presents a work realized by the French energy consulting com-pany ECO2 Initiative. The company is building a French official document- a PCET(Climate and Energy Territory Plan)- and the present study consists in the construc-tion of a part of it. The final document purpose is to be used by decision makersto build the energy policy over the concerned territory. The study only focuses onthe Greenhouse Gases (GHG) emissions reduction over that territory and is dividedinto two parts. The first part goal is to account for all the emissions occurring on theterritory under a predefined scope. The second part treats of reduction action plan.A model will be designed showing the actions impact on future emissions comparedwith an ongoing trend scenario. Finally, some actions will be designed and addedto the model.
The studied territory is Territoire de la Côte Ouest (TCO), the west part ofReunion, a French island off Madagascar coast as shows figure 1.1. There are 841000 people living on the island. Reunion hosts one of the world’s most active vol-canoes : Piton de la Fournaise which regularly increases the total island area andis responsible for its conical shape. The island has a tropical climate and is regu-larly endangered by cyclones which results on Reunion resident being committedwith climate issues. Beyond communication, the island policy makers have stronginterests in GHG emissions and climate change consequences :
1

1. Introduction
(a) Reunion off Madagascar coast (b) Reunion island
Figure 1.1 – Reunion island in the world
First, despite the recent significant development of solar energy, 88% of theisland energy is imported as oil, gas or coal. The territory has a strong dependencyon fossil fuels. Due to the population growth, electricity needs and total vehicle fleetincreased, which, with the actual electricity mix, threatens Reunion economy in themedium-term. Reducing TCO GHG emission implies reducing also its fossil fuelsconsumption and therefore reduces the economic impact of a fossil fuels prices raise.Between 2010 and 2011, import fuel cost increased by 31% (137 M€) whereas theimported volumes only increased by 3%. [6]
Moreover, Reunion island is quite vulnerable to the climate change. Recent stu-dies announced a temperature raise between 1.4°C and 3,7°C and an increase insea level between 40cm and 60cm and more extreme weather events before the endof the century [7]. A good knowledge of climate change impacts and an efficientadaptation could mitigate the increasingly larger climate change consequences thatthe island is going to face in the future.
Those two reasons strongly motivated TCO municipality and several territorystakeholders into having this work done properly as it will play a leading role in theterritory energy policy for the next decades.
2

Chapter 2
Background
2.1 PCET
The French acronym PCET stands for Energy and Climate Territorial Plan. APCET is a sustainable development project whose main purpose is to fight againstclimate change [2]. This project is mandatory for any French local authority thatexceed 50000 citizens (ie. region, department, cities association or city). It is a strongposition for a territory as it involve all activities within its geographical boundaries.The PCET also has an influence over all the policies of that authority. A PCETaims at :
– limiting the territory impact on climate by reducing GHG emissions ;– reducing the vulnerability of the territory as it is now established that the
impacts of climate change can not be fully avoided.A PCET is characterized by targets in reducing GHG emissions and in adaptingthe territory within time constraints.
– 2020 : the 3 × 20% of the European Union (20% reduction in GHG emissions, 20% improvement in energy efficiency, a 20% share of renewable in finalenergy consumption)
– 2050 : factor 4 (divide by 4 GHG emissions using 1990 as a reference)A PCET consists in 4 steps :
– Prefiguring. During this step, elected representatives become familiar withthe subject, build the specifications, chose the company that will perform thePCET...
– Quantify and mobilize. This includes :– Quantification of all GHG emissions– A study of climate change vulnerability on the territory– Sensitization actions and players formation– Immediate beginning of reduction actions if possible
– Build the PCET. It consists in setting targets and propose an annual actionplan.
– Implement the PCET. This phase is the operational implementation of the
3

2. Background
decisions taken in the previous phase.What is treated here is the quantification of all GHG emissions, and the begin-
ning of a reduction plan proposal.
2.2 About the quantification method used
Several methods have been developed with the aim at accounting, quantifyingand managing GHG emissions. The most popular and widely used is the GHG-P(GreenHouse Gas Protocol), result of a partnership between the World ResourcesInstitute and the World Business Council for Sustainable Development. Neverthelessother methods allow governments and businesses to do the same with only fewdifferences. The method used here is one of those, it is called Bilan Carbone® wasoriginally developed by the French state agency ADEME (Environment and EnergyManagement Agency). This method is not internationally spread, but is widely usedamong the French territory (really few French companies actually use GHG-P). Thereason for this is that the Bilan Carbone® was presented as an operational tool whena French law compelled a lot of businesses and local authorities to account for theircarbon emissions. The two main differences between those methods deal with thescopes :
– The Bilan Carbone® is designed to have a scope that concerns a site (geogra-phical) whereas the GHG-P is more dedicated to larger organization.
– GHG-P relies on a responsibility approach (with respect to environmentalimpacts) and therefore classifies emissions into 3 scopes (direct emissions, in-direct emissions due to direct energy consumptions and indirect emissions),while Bilan Carbone® relies on a vulnerability approach (with respect to fu-ture changes in economic parameters as fossil fuels prices or GHG emissionspenalties).
It can also be noted some operational differences. The GHG-P provides specifictools for each emission sources but the Bilan Carbone® provides one tool valid forevery emissions sources in the scope. The GHG Protocol systematically includesdata quality checks and advocates external verification whereas the Bilan Carbone®
rather directs its users to uncertainty computation.Finally, the method used was maybe easier to implement due to the geographical
aspect of the studied object (the TCO is a territory). The exact Bilan Carbone®
method part used is the "region module".
2.3 The territory
The exact studied territory is located in the west of Reunion. TCO stretchesover 54000 ha (cf. figure2.1b) and divides into five different administrative districts,La Possession, Le Port, Saint-Paul, Trois-Bassins and Saint-Leu (cf. figure 2.1a).About 210000 people live in TCO, distributed among those 5 districts, and as it
4

2.3. The territory
can be seen on figure2.2, population centers are located on the seaboard and inmid-slope zone.
(a) TCO divided into its 5 districts
(b) TCO in Reunion
Figure 2.1 – TCO territory
0
10 000
20 000
30 000
40 000
50 000
60 000
70 000
80 000
90 000
100 000
La
Possession
Le Port Saint Paul Trois
Bassins
Saint Leu
Hab
itan
ts
Highhill
Mid-slope
Seaboard
Figure 2.2 – TCO population distribution
5

Chapter 3
Methodology
Here are described the different steps leading to a GHG emissions quantification :the scope definition, data collection, emissions and avoided emissions calculation.As explained in the background, the method used is Bilan Carbone® region module,and the complete methodology can be found in the bibliography [8].
3.1 Scope definition
This section summarizes the scope used in TCO specific case, it therefore containsadaptations from the generic method.
The scope recommended by Bilan Carbone® can be defined in 4 points : the timeperiod, the geographic zone, the considered gas species and the different emissionsources.
3.1.1 The time period
All the computation were performed on a yearly basis. An effort was made touse as recent data sources as possible and a major part of the information is datingfrom 2012 nevertheless, some information from 2011 was also used.
3.1.2 The geographical boundaries
The emissions from all activities performed inside the territory defined in section2.3 are taken into account. Moreover, all the emissions of which this territory isdependent are also considered as detailed in section 3.1.4.
3.1.3 The gases
The gases taken into account are the ones directly emitted as shown in table 3.1,maily gases targeted in the Kyoto protocol. This excludes those that appear in the
6

3.1. Scope definition
Gas Molecular Formula Global Warming PotentialCarbon dioxide from fossil origin (CO2) GWP = 1 by definitionMethane (CH4) GWP = 25Nitrous oxide (N2O) GWP = 310Hydro-fluorocarbons (CnHmFp) GWP = from 140 to 11700Perfluorocarbons (CnF2n+2) GWP = from 6500 to 9200Sulfur hexafluoride (SF6) GWP = 23900
Table 3.1 – Kyoto protocol gases included in TCO PCET scope
atmosphere as a result of chemical or photochemical reactions through pre-emissionsas ozone (O3) in particular.
A particular case is the CO2 of organic origin. Two cases :– It is part of a global ecosystem change that does not contribute to increasing
atmospheric CO2 concentration because the emissions can be regarded as astationary CO2 cycle over a sufficiently long period (order of magnitude of100 years). This CO2 is not taken into account. A typical example can be asustainably managed forest.
– The rest is taken into account as biomass carbon dioxide, (CO2b). An exampleis deforestation.
3.1.4 The emission sources
Table 3.2 presents the different emission sources used in the quantification. Allthose emission sources were intentionally chosen independent so that their sumproduce the total GHG emissions without any overlapping. Nevertheless, the sourceenergy industry must be removed from the sum as the energy production emissionsare also distributed among tertiary, residential, and industrial processes. The sourcewas kept because as a part of the energy is injected to the grid and used elsewhere,TCO is also responsible for emissions issued from that part, occurring outside itsterritory.
7

3.
Met
ho
do
lo
gy
Sources Emissions taken into accountEnergy industry Emissions generated by the industry whose business is producing electrical or thermal power.
In practice, it is basically the emissions arising from the combustion of hydrocarbons (liquid orsolid) used in that way.
Industrial Processes The use of fossil fuels for industrial processes located in the territory,Emissions generated by purchases of electricity and steam - produced outside the territory - bythe industries in question,Emissions not related to energy use (other chemical reactions, leaks, etc.).
TertiaryHeating for tertiary buildings (commercial activities of any kind, offices, and all buildings be-longing to the territory administration),Domestic hot water for same building,Purchased steam, to avoid double counting with the first section, it will be limited steam gene-rated outside the territory,Electricity consumed by tertiary buildings,Leaking air conditioning systems of these buildings.
Residential The sources considered are exactly the same as the tertiary one’s.Agriculture and fi-shing
Fuel and electricity consumption (agriculture including greenhouses, and fishing),
Emissions related to livestock (methane and nitrous oxide) as enteric digestion, treatment ofwaste, or spreading,Emissions related to fertilizer (nitrous oxide),Manufacturing inputs (fertilizer, animal feed, ...),Mechanical equipment manufacture (tractors, etc.).
FreightAll freight traffic taking place on the territory or related with it, regardless of the mode (road,air, rail, sea) :
8

3.1.Scop
edefi
nition
Emissions from internal transport, that is to say with a departure and an arrival point that liewithin the territory,Emissions from transit transport, that is to say, with a departure point and an arrival point thatboth are outside the territory (for road traffic only),Emissions from exiting freight, that is to say with a departure point located in the territory andan arrival point which is located outside,Emissions from entering freight, that is to say with a departure point located outside the territoryand an arrival point which lies inside,As for businesses, the emission factors reflect the vehicle capacity, its filling rate, and any criteriawith a strong influence on the ton.km transported.
People transporta-tion
Road transit, with a departure point and an arrival point lying on the territory ;
Traffic linked to residents, wherever they go, and whatever the chosen mode (road, rail, air...)Traffic related to visitors, whatever the reason (tourism, business, family visits...) and regardlessof the selected mean of transport.This can nevertheless lead to a methodological problem for the movement of visitors. Indeed, if atourist comes to Reunion by plane to visit several destinations, it can be considered questionableto allocate to the territory all the emissions from the initial flight. In that case, it can belegitimate to allocate emissions of its flight to the various destinations that will register hispresence.
Roads and construc-tions
Emissions related to real estate
Emissions related to roadsNo amortizations here as the method considers the annual flow of new construction in the area.
Waste managementEmissions related to the treatment of waste - solid or liquid - which is directly produced by theterritory.
9

3.
Met
ho
do
lo
gy
Table 3.2 – Emissions sources taken into account in TCO PCET
Imports and localgoods production
Emissions linked to the manufacture of some goods on the territory,
Emissions generated by the production of any imported product.Due to the mix between imported products and local production from the industry in theavailable data, a common source was created.
10

3.2. Data collection
3.2 Data collection
A lot of territory data was used to build the emission quantification. Thosedata were collected by Eco2 Initiative from different sources. First some data wasdirectly provided by TCO or its stakeholders, this is the most reliable source thatcould be found as the data comes from the territory. When this kind of data wereunavailable, statistical data was used. A noteworthy reference for French statistics isthe National Statistic Institute [13]. National statistics are still quite reliable as newstudies are regularly conducted. Finally, when none of those 2 sources was available,hypothesis was made. Those hypothesis were decided in collaboration with TCO butconstitute the most uncertain data used here.
3.3 Emission factors
An emission factor is a quantity by which data must be multiplied to givean emission quantity. Typical units for emission factors are kgCO2e/(ton.km),kgCO2/(vehicle.km), or kgCO2/(person.km). Emission factors are dependent onmany different things as energy used or processes involved, and a special attentionwas given in their choice.
Let’s give two examples : A vehicle having 0-5hp will have an emission factorof 0,233 kgCO2/km whereas a vehicle having 6-10hp will emit 0,272 kgCO2/km.A train (TGV) running on French electricity will have an emission factor of 0,004kgCO2/(people.km) whereas a train running on German electricity will emit 0,067kgCO2/(people.km).
Many emissions factors are available in databases, nevertheless it can happenthat one need to be computed. A computation example is given in section 3.5. Alarge database [4] has been developed by ADEME, French acronym for (Environ-ment and Energy Management Agency), along with a guide [5] detailing computa-tion methodology. Those emission factors were widely used in this study.
3.4 Avoided emissions
In some cases, entities whose carbon footprint is measured distinguish themselvesby reduction actions that have an impact outside their own scope. As those actionshave no influence on the entity’s emissions but still present a huge benefit for theenvironment, the method allows the user to account for this benefit in a separatedcategory called avoided emissions. Those avoided emissions are defined negative,and can’t be added to classic emissions. The process to compute avoided emissionsmust be applied carefully as it involve the operator judgment. Indeed, a referencescenario has to be chosen, which represent what would have the most probablyoccur without the action, that is to say which is the conventional way to treatthe action’s target. The avoided emissions are the difference between the action’s
11

3. Methodology
emissions (the reduction action process emissions and the emissions left) and thereference scenario. As for emission factors, an example follows in section 3.5.
3.5 Emissions computation example
Here is an example of an emission factor computed under the carbon reportingof a company. Even though this work is not part from the present study, it uses theexact same process than what was done in the TCO GHG emissions quantificationand it has the advantage to combine several things into one. It deals with the GHGemissions of burying a ton of non hazardous waste (a mixture of household wasteand industrial waste) in a pit in order to methanize it, using the following process :
1. A pit is dug and prepared to receive waste.
2. Waste is shipped to the pit, buried and covered.
3. The waste decomposes and methane is harnessed, some CO2 is stocked in theground through chemical reactions, fugitive emissions also occur.
4. The tapped methane is either processed to different incinerators and burnedor sold. If burned, it is either for heat generation, for co-generation or withoutany valorization.
The computation was divided into two parts.
1. The emission factor was computed. It only concerns the gas issued from a tonof waste once it is stored in the pit. That is to say that the waste collection,the shipping, and the pit construction and the maintenance were not treated.Although the whole process usually lasts several decades, the methodologicalrules commits the company to impute all the emissions to the year of theburying in their reporting. The emissions computed therefore concern thecomplete methanization process. The uncertainty computation was not tackledhere, but those kind of computation generally leads to uncertainty between10% and 20%.
2. Avoided emissions were then calculated. Unlike the previous emissions, theavoided emissions are computed from the actual energy production that variesfrom a year to another, hence they have to be allocated to the carbon reportevery year.
3.5.1 Emission factor computation example
So in that particular case, the waste were for 26,2% issued from households andfor 73,8% from industry.
On the one hand the gas is harnessed and burned. Through measurements andextrapolations the company determined the whole methane quantity contained inthe gas tapped from that ton. That methane had been divided into several uses :
mCH4electricity = 21, 6 kg
12

3.5. Emissions computation example
mCH4heat = 0, 192 kg
mCH4without valorization = 1, 19 kg
mCH4sold = 4, 55 kg
mCH4= mCH4electricity + mCH4heat + mCH4without valorization + mCH4sold = 27, 6 kg
The mass composition of that gas was also known, around a third of carbon dioxide,a third of methane and mainly nitrogen for the rest. A few N2O is also present,but not enough to make a difference, especially at this level of uncertainty. It wasneglected.
CH4 = 32, 4%
CO2 = 32, 0%
Through the combustion reaction, a mole of methane gives a mole of carbon dioxide,the mass of carbon dioxide issued from the combustion was computed as follows :
mCO2combustion = mCH4×
MCH4
MCO2
= 75, 8 kgCO2b
The carbon dioxide that was already in the gas was also computed :
mCO2already in gas = mCH4×
32, 0
32, 4= 27, 2 kg
Finally it gave :
mCO2from tapped gas = mCO2combustion + mCO2already in gas = 103 kgCO2b
On the other hand, a part of the gas somehow had made it through the cover andhad directly vaporize into the atmosphere. Once again thanks to measurementsand extrapolations, the methane quantity was obtained. In order to convert thoseemission in CO2 equivalent, its Global Warming Potential was used :
1 kgCH4 = 25 kgCO2e
mfugitiveCH4= 2, 16 kg = 54 kgCO2e
An hypothesis to calculate the carbon dioxide fugitive quantity had to be made : itwas assumed that the gas had the same composition than the tapped one. It gave :
mfugitiveCO2= mfugitiveCH4
×
32, 0
32, 4= 2, 13 kg
So :mfugitiveGHG = mfugitiveCH4
+ mfugitiveCO2= 57, 6 kgCO2e
And finally :
EFton of waste = mfugitiveGHG + mCO2from tapped gas = 161 kgCO2e/ton of waste
13

3. Methodology
3.5.2 Avoided emissions computation example
As both the electricity and the heat produced are sold (the electricity is injectedin the grid and the heat is used by another company for straw drying) the companyis helping other entities to reduce their carbon footprint and can therefore claimavoided emissions. If the energy from the valorization process would have been usedinternally the company would just reduce its own carbon reporting and there wouldbe no avoided emissions. The chosen reference scenario was simple, CH4 would beentirely burned without any valorization (it still makes sense to burn it since CH4
has a higher GWP than CO2). That is to say that exactly the same CO2 quantitywould be emitted (no avoided emissions here), but primary energy sources wouldhave to replace the current production. The avoided emissions was computed asfollows :
First, the energy that had been generated this year through the methane valo-rization of a ton a waste and used outside the company was measured.
Eelec = 82, 6 kWh
Eheat = 50, 2 kWh
For the electricity, it was assumed that without methanization, electricity fromthe grid would have been used. The emission factor of a kWh from the French gridis known :
EFkW h from the grid = 0, 0722 kgCO2e/kWh
The avoided emissions through electrical valorization were therefore :
AEelec = −Eelec × EFkW h from the grid = −5, 96 kgCO2e avoided
For the heat, it was assumed that a 85% efficiency LPG boiler would have beenused. The emission factor of a kWh of LPG from the lower heating value is known,but the French law allows companies to use the higher heating value, which thecompanies of course always prefer :
EFLP GLHV= 0, 233 kgCO2e/kWh
LPGHHV
LPGLHV
= 1, 09
EFLP GHHV= EFLP GLHV
×
LPGHHV
LPGLHV
= 0, 254 kgCO2e/kWh
The avoided emissions through heat valorization were then :
ηboiler = 85%
AEheat = −
Eheat × EFLP GHHV
ηboiler
= −15, 3 kgCO2e avoided
14

3.5. Emissions computation example
And finally it gave :
AE = AEelec + AEheat = −21, 3 kgCO2e avoided/ton of waste
As a conclusion, it has been shown in this example that for that company theCO2 cost of burying a ton of waste was 161kg CO2, and that this year the avoidedemissions were -21,3 kg CO2 per ton of waste.
15

Chapter 4
Quantification of TCO’s GHG emissions
The following sections are presenting synthetically the results obtained in thePCET emission quantifying [11]. Total emissions are divided as explained in thescope definition (cf section 3.1). For each emission source, the key figures are men-tioned.
4.1 Energy industry
The energy production is responsible for a large part of the territory’s emissions,mostly because of a power plant in Le Port. That plant produces 645750 MWh/yrwhich represents 25% of the island electricity. That plant increases the electricitycarbon footprint of the island, which is already 10 times France’s one. However,renewable energy is developing quickly and already 30% of the island electricityis issued from renewable sources. Reunion has a large renewable energy potentialas solar intensity is about 1800 kWh/m2/yr. Around 30000 photovoltaic installa-tions were set up in 2011 and TCO counts around 49500 m2 solar water heatinginstallations.
16

4.1. Energy industry
GHG Emissions0
100
200
300
400
500
600
ktC
O2e
Oil/GasoilRenewably produced electricity
Figure 4.1 – Energy industry GHG emissions
GHG Emissions
516888 tCO2e
Avoided Emissions
Photovoltaic -10450 tCO2eSolar water heating -8950 tCO2e
Key figures
Photovoltaic 29280 kWpSolar water heating 49400 m2 of installationsLe Port’s plant 645750 MWh/yr
25% of the island electricity
Table 4.1 – Energy industry key figures
The avoided emissions reference scenarios are an oil running plant as Le Portone for the electricity and a gas running boiler for water heating.
The energy production GHG emissions are mainly due to fossil fuel combustionin the fuel-powered plants. Renewable energy production has a low carbon footprintbecause only emissions due to installations manufacturing are taken into account.Those emissions are divided and allocated to every kWh that the installation willproduce in its lifetime. This division makes renewable energy have a small impacton the territory’s emissions.
17

4. Quantification of TCO’s GHG emissions
GHG Emissions
244879 tCO2e11% of total emissions
Key figures
The territory counts 2510 industrial companiesThis sector consumes 195 GWh/yr of electricityThis sector consumes 163 GWh/yr of oil equivalent
Table 4.2 – Industrial processes key figures
4.2 Industrial processes
As the most represented sector in Reunion industries is goods transformation,energy needs are very focused on electricity (low direct fossil fuels consumption) :60% of industrial processes energy consumption are issued from electricity. Thecarbon footprint of this energy type is really high in Reunion, therefore, electricityrepresents 80% of this sector’s emissions. It was determined that no gas is currentlyconsumed by Reunion industry. Some more studies are needed to improve energyconsumption knowledge in this field (specificity of each company, seasonality, . . . ),moreover TCO has no precise policy over the industry energy management.
GHG Emissions0
50
100
150
200
250
300
ktC
O2e
ElectricityOilGas
Figure 4.2 – Industrial processes GHG emissions
18

4.3. Tertiary
GHG Emissions
155432 tCO2e7% of total emissions
Key figures
The territory counts 10164 services companiesThis sector consumes 203 GWh/yr of electricityThis sector consumes 43 GWh/yr of gasThis sector consumes 3 GWh/yr of oil
Table 4.3 – Tertiary key figures
4.3 Tertiary
Here again, the typology of the TCO’s tertiary activities results in an energyconsumption that is heavily related to electricity.
GHG Emissions0
50
100
150
200
ktC
O2e
Tertiary emissions
ElectricityOilGas
Figure 4.3 – Tertiary GHG emissions
Finally, 80% of this sector’s energy consumptions are of electrical origin whichresults of 90% of the sector emissions being issued from electricity.
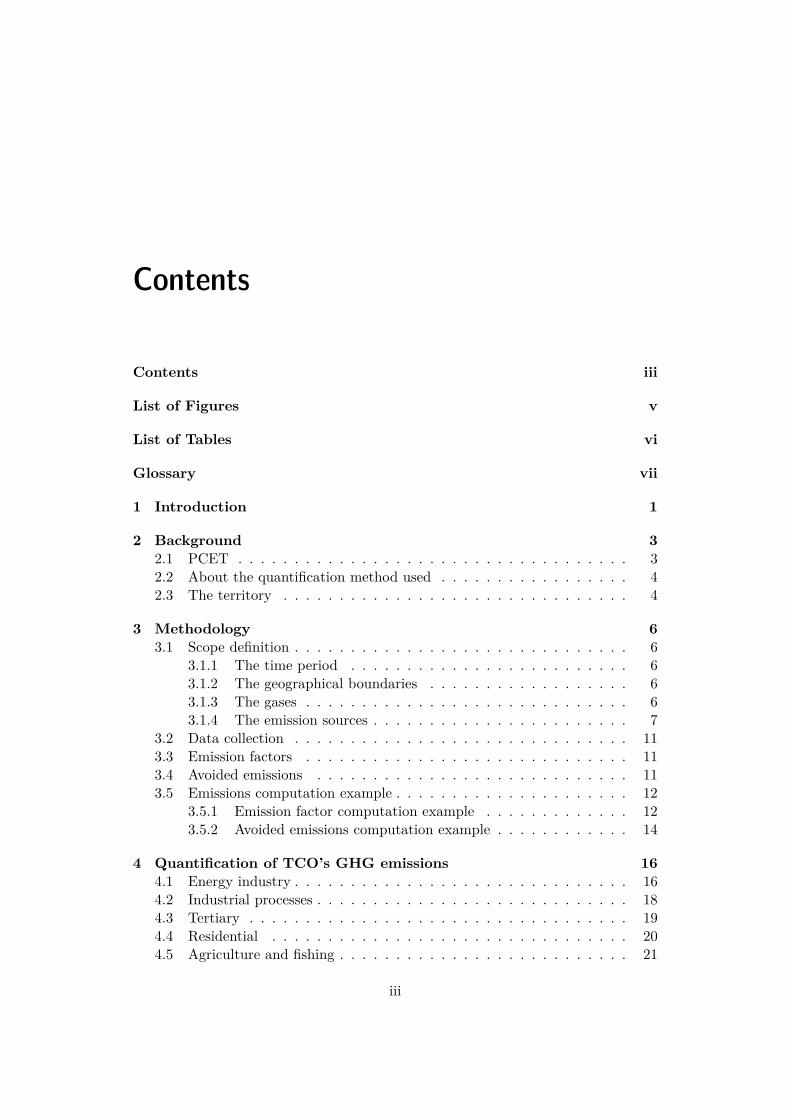
Based on a survey on more than 500 shops in Reunion, an energy consumptionestimation for different equipment types has been made. Two equipment types areconsuming more energy than the others, which makes those two categories goodreduction targets.
19
4. Quantification of TCO’s GHG emissions
72 kWh/yr
2696 kWh/yr
9252 kWh/yr
6869 kWh/yr
444 kWh/yr
Domestic
appliances
Multimedia
devices
Lighting Air conditionning Misc
Figure 4.4 – Shops equipment average electrical consumption
4.4 Residential
With the multiplication of electrical and electronic equipment, household energyconsumption grew since the 80s (at this time, Reunion was autonomous in its elec-tricity production). This growth in consumption results in a significant proportionof the territory’s emissions issued from the residential sector.
GHG Emissions0
50
100
150
200
250
300
ktC
O2e
ElectricityOilGas
Figure 4.5 – Residential GHG emissions
70% of the residential sector energy consumptions are of electrical origin whichresults of 84% of the sector emissions being issued from electricity as it can be seen
20

4.5. Agriculture and fishing
GHG Emissions
244296 tCO2e11% of total emissions
Key figures
The territory counts 220000 residentThe territory counts 67143 householdsThis sector consumes 298 GWh/yr of electricityThis sector consumes 60 GWh/yr of oilThis sector consumes 70 GWh/yr of gas
Table 4.4 – Residential key figures
on figure 4.5. Therefore, a study on Reunion households electricity consumptionswas made.
956 kWh/yr
764 kWh/yr
601 kWh/yr
225 kWh/yr
688 kWh/yr
197 kWh/yr101 kWh/yr
Large
household
appliances
Cooking and
other
equipment
Multimedia
equipement
Lighting Hot Water Heating and
air
conditioning
Misc
Figure 4.6 – Household equipment average electrical consumption
This study illustrates that domestic appliances (refrigerator, washing machine,dryer,...)are the most consuming type in Reunion, followed by cooking appliances(oven, stove,...).
4.5 Agriculture and fishing
Livestock farming, larger in terms of surfaces used in the territory, appears asthe main GHG source of the agriculture sector. Emissions related to the culturesare both issued from inputs and the use of fossil energy by agricultural machinery.
21

4. Quantification of TCO’s GHG emissions
GHG Emissions
48151 tCO2e2% of total emissions
Key figures
The territory counts 1884 cultivation farms8172 ha cultivated
47 feed cultivation43 sugar cane
Cultivation activity emits 9775 tCO2e
The territory counts 815 livestock farms58% poultry30% cattle12% pigs
Livestock activity emits 9775 tCO2e
Fishing turnover is 35 M€Fishing activity emits 1051 tCO2e
Table 4.5 – Agriculture and fishing key figures
GHG Emissions0
10
20
30
40
50
60
ktC
O2e
LivestockCultivation
Fishing
Figure 4.7 – Agriculture and fishing GHG emissions
The map on figure 4.8 is representing the agriculture distribution in the terri-tory [9]. With respectively 47 and 37% of cultivated area, towns of Saint-Paul andSaint-Leu are the two main actors of the cultivation activity on the territory. Su-gar cane cultivation logically represents a significant part of the agricultural areas(44%). With about 500 000 chicken raised yearly, the poultry is the main livestockactivity on the territory (43% of total livestock activity).
22

4.5. Agriculture and fishing
Figure 4.8 – Agriculture distribution on TCO
23

4. Quantification of TCO’s GHG emissions
Edible corn
0,8%
Meadow
25,9%
Feed corn
0,1%
Potato
0,3%
Vine
0,2%
Sugar cane
72,8%
Figure 4.9 – GHG emissions by cultures
Dairy cow
6%
Suckler cow
37%
Billy goat
3%Calve
5%
Goat
6%
Ewe
0,2%
Industrial chicken
35%
Sow
4%
Pig
4%
Figure 4.10 – GHG emissions by livestock
Small-scale fisheries (performed in a period of less than 24 hours) is the mostimportant in Reunion’s marine activity in terms of fleet and employment. Thisactivity supplies the local market. Offshore fishing is directly related to the situationof Reunion in the heart of fishing areas of tuna and swordfish. Reunion also providesa close port for ships engaged in fishing for toothfish and spiny lobster in the FrenchSouthern and Antarctic Lands.
24

4.6. People transportation
GHG Emissions
557818 tCO2e25% of total emissions
Key figures
The road sector represents 63 ktoeThe territory counts 83 314 personal vehiclesThose vehicles traveled 4 604 000 000 km in 2011The territory counts 351 busesThose buses traveled 12 574 822 km in 2011transporting 15 051 673 people
The air sector used 188 ktoe in 2012Air transportation carried 2 095 155 people in 2012Air transport is responsible for 66% of transportation emissions
Table 4.6 – People transportation key figures
4.6 People transportation
GHG Emissions0
100
200
300
400
500
600
ktC
O2e
Personal road transportPublic transportation
Entering flightsLeaving flights
Figure 4.11 – People transportation GHG emissions
4.6.1 Road travel
The total fuel consumption was 104 ktoe on the territory in 2012. This figurecan be divided into two categories, people travel and commodity transport. Peopletravel is responsible for 60% of total emissions occurring on the roads. The perso-nal vehicles fleet is composed of 50,7% gasoline running vehicle, and 49,2% diesel
25

4. Quantification of TCO’s GHG emissions
running vehicle. The vehicle power is distributed as figure 4.12 shows.
1 to 6 hp
77%
7 to 11 hp
21%
12 hp and more
2%
Figure 4.12 – Distribution of TCO vehicle power
Buses of three kinds also run on the territory :– School buses, which traveled around 3 Mkm. The carbon footprint of a regular
passenger for an average tripe is 0,44 kgCO2/passenger– Kar’Ouest, which is a public bus system belonging to TCO. Those buses
traveled around 7.5 Mkm. As the frequentation rate is less predictable, thefootprint of an average passenger trip increases : 1,3 kgCO2/passenger
– Car Jaune, which is also a public bus system but belongs to the region. Thosebuses transported 2M people in and out TCO, and traveled 2,1 Mkm with acarbon footprint of 1,73 kgCO2/passenger.
The distribution of fuel consumption (diesel being converted in oil equivalent)is as shown in figure 4.13.
g
1 to 6 hp
73%
7 to 11 hp
20%
12 hp and more
2%
Kar'ouest
2%School buses
2%
Car jaune
1%
Figure 4.13 – TCO vehicle consumption in toe
26

4.6. People transportation
4.6.2 Air travel
Total air fuel consumption represents 188 ktoe in Reunion. As mentioned inthe scope definition (cf section 3.1), a part the island air transport have to beimputed to TCO even if the airport isn’t actually on the territory. Around 2Mpeople traveled by air in 2012, and TCO is considered responsible for 25,4% ofthem. The origin/destination was distributed as in figure 4.14
Mainland France
5�%
Mauritius
22%
Madagascar
8%
Mayotte
7%
Thailand
1%
Oceania
1%
Others
3%
Figure 4.14 – Reunion passengers Destinations and Origins
It can be noticed that only a weak majority of the travel is performed betweenFrance and Reunion (58%). Though, those trips represent 91% of the air travel totalemissions due to the distance traveled.
4.6.3 Sea travel
As the island is quite far from any coast, boats come mainly for freight purposesand the few passengers traveling by boat are neglected.
27
4. Quantification of TCO’s GHG emissions
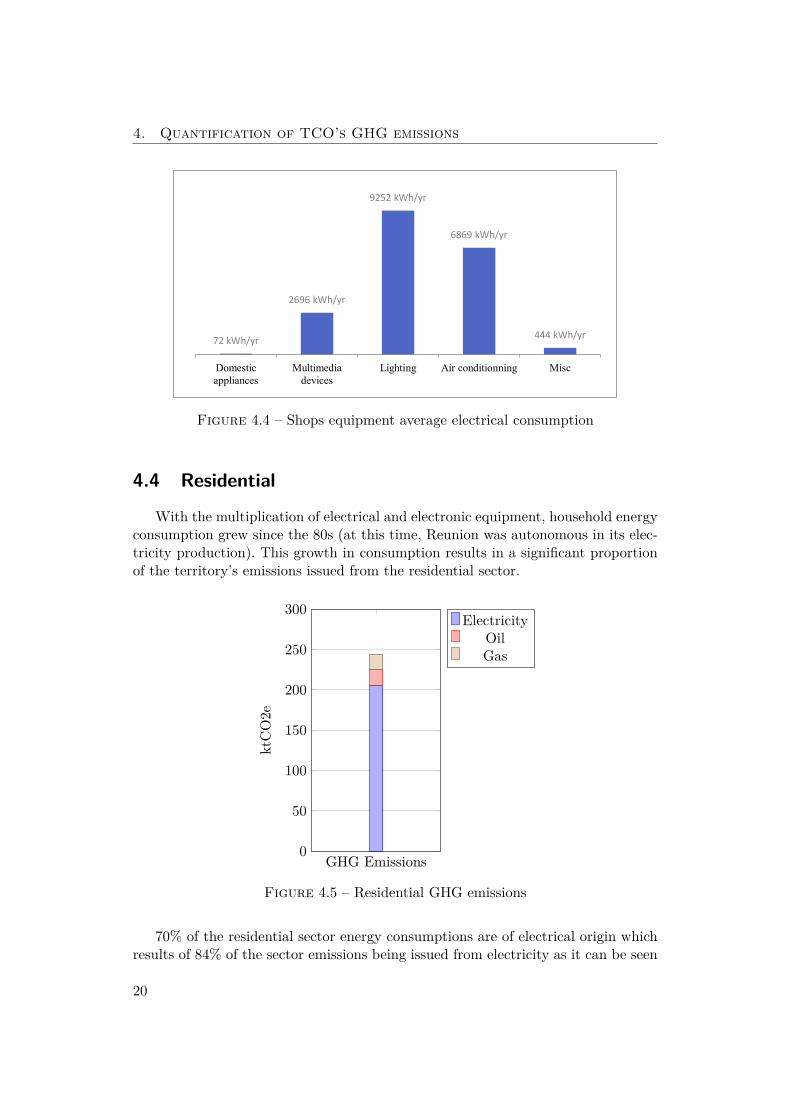
GHG Emissions
355 028 tCO2e16% of total emissions
Key figures
The road sector represents 42 ktoeThe territory counts 130 683 freight vehicles
The air sector used 188 ktoe in 2012Air freight carried 31 593 tons in 2012
The maritime sector is responsible for 43% of freight emissionsMaritime freight carried 4 147 220 tons in 2012
Table 4.7 – Freight key figures
4.7 Freight
GHG Emissions0
100
200
300
400
ktC
O2e
TrucksCommercial vehiclesEntering air freightLeaving air freight
Entering maritime freightLeaving maritime freight
Figure 4.15 – Freight GHG emissions
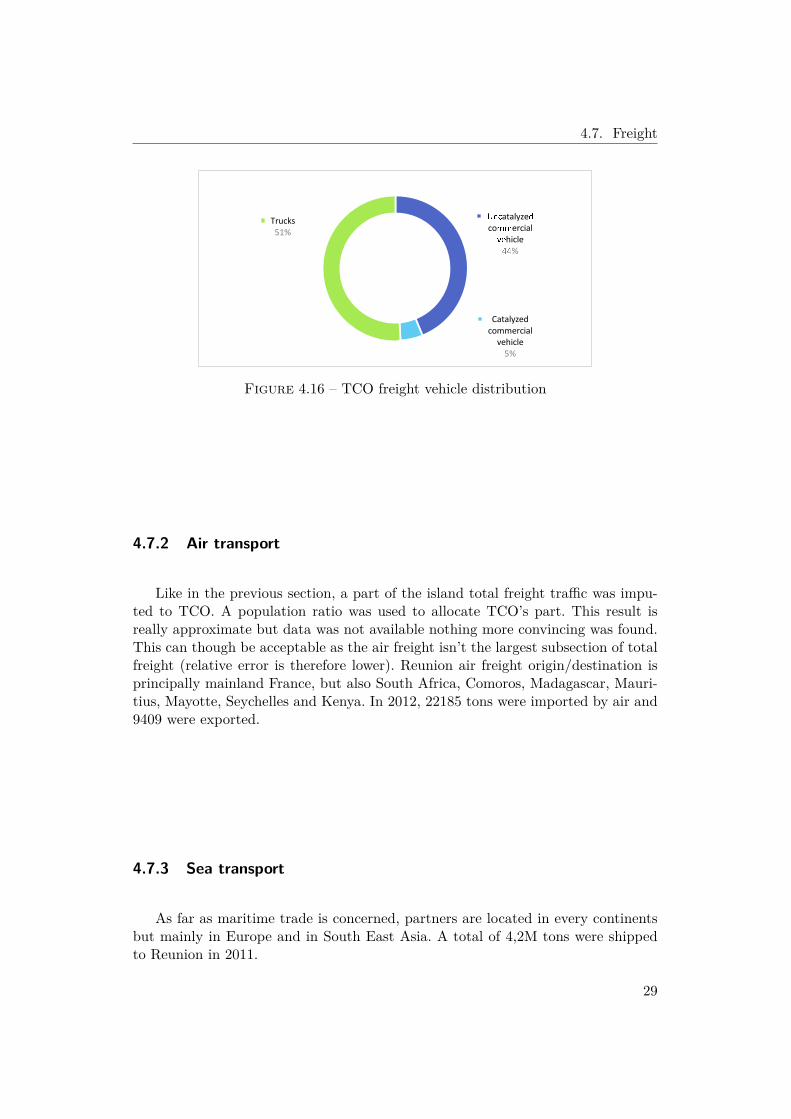
4.7.1 Road transport
Freight represents 40% of the emissions issued from the 104,25 ktoe of fuelconsumed on roads in 2012. The freight vehicle fleet is as in figure 4.16.
28
4.7. Freight
U��atalyzed
commercial
v�hicle
44%
Catalyzed
commercial
vehicle
5%
Trucks
51%
Figure 4.16 – TCO freight vehicle distribution
4.7.2 Air transport
Like in the previous section, a part of the island total freight traffic was impu-ted to TCO. A population ratio was used to allocate TCO’s part. This result isreally approximate but data was not available nothing more convincing was found.This can though be acceptable as the air freight isn’t the largest subsection of totalfreight (relative error is therefore lower). Reunion air freight origin/destination isprincipally mainland France, but also South Africa, Comoros, Madagascar, Mauri-tius, Mayotte, Seychelles and Kenya. In 2012, 22185 tons were imported by air and9409 were exported.
4.7.3 Sea transport
As far as maritime trade is concerned, partners are located in every continentsbut mainly in Europe and in South East Asia. A total of 4,2M tons were shippedto Reunion in 2011.
29
4. Quantification of TCO’s GHG emissions
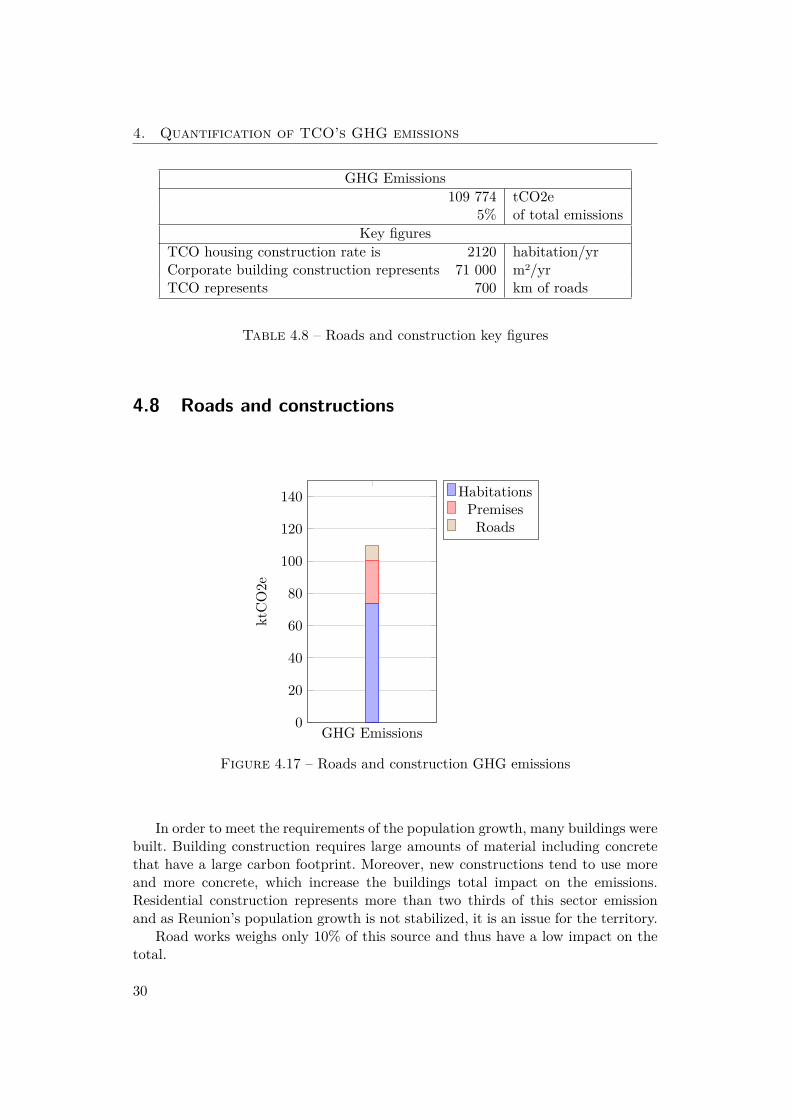
GHG Emissions
109 774 tCO2e5% of total emissions
Key figures
TCO housing construction rate is 2120 habitation/yrCorporate building construction represents 71 000 m2/yrTCO represents 700 km of roads
Table 4.8 – Roads and construction key figures
4.8 Roads and constructions
GHG Emissions0
20
40
60
80
100
120
140
ktC
O2e
HabitationsPremises
Roads
Figure 4.17 – Roads and construction GHG emissions
In order to meet the requirements of the population growth, many buildings werebuilt. Building construction requires large amounts of material including concretethat have a large carbon footprint. Moreover, new constructions tend to use moreand more concrete, which increase the buildings total impact on the emissions.Residential construction represents more than two thirds of this sector emissionand as Reunion’s population growth is not stabilized, it is an issue for the territory.
Road works weighs only 10% of this source and thus have a low impact on thetotal.
30

4.9. Waste Management
GHG Emissions
31 274 tCO2e1% of total emissions
Avoided Emissions
-22 000 tCO2e avoided
Key figures
TCO household waste 57 619 tons in 2011TCO green waste 35 437 tons in 2011TCO sorted waste 7 272 tons in 2011TCO bulky waste 7 354 tons in 2011
Table 4.9 – Waste management key figures
4.9 Waste Management
A previous study [10] made by ECO2 initiative determined the carbon footprintof a typical ton of waste on the TCO and the avoided emissions resulting from thevalorization process. It is really similar than the example given in 3.5 except thatsome of the waste is directly burned.
GHG Emissions0
10
20
30
40
50
60
ktC
O2e
Waste end-of-lifeFixed assets
Figure 4.18 – Waste management GHG emissions
31

4. Quantification of TCO’s GHG emissions
GHG Emissions
483 109 tCO2e22% of total emissions
Key figures
TCO household waste 57 619 tons in 2011TCO green waste 35 437 tons in 2011TCO sorted waste 7 272 tons in 2011TCO bulky waste 7 354 tons in 2011
Table 4.10 – Import and local goods production key figures
4.10 Imports and local goods production
126 971
9� 161
�3 ��7
�7 913
�� ��7
�� �16
� �7�
�� 772
�1 77�
�3 16�
� �1�
17 ��1
Electrical equipment, electronic and computers
Means of transport
Foodstuffs, drinks and tobacco
Pharmaceutical industry products
Metallurgy and metal products
Other products issued from manufacturing industry
Textiles, leather and footwear
Rubber and plastic products
Chemical industry products
Wood, paper and printing stuff
Agriculture, forestry and fishing
Others
Import GHG emissions (in tCO2e)
Figure 4.19 – TCO import GHG emissions
151
24 540
8� �0
� 151
Food industry
Consumer goods
Intermediate goods
Equipment goods
Local goods production (in tCO2e)
Figure 4.20 – TCO local goods production GHG emissions
The evaluation of the import footprint is based on the trade balance of theisland of Reunion. The import details are known, and are distributed among severalcategories as shown in figure 4.21.
32

4.10. Imports and local goods production
Fuels
10%
Consumer goods
20%
Intermediate
goods
21%
Equipment goods
21%
Agricultural and
food products
17%
Automotive
industry
11%
Figure 4.21 – Reunion imports
From those figures, emissions from the production can be approximated withstandard emission factors. Nevertheless, this method leads to a high uncertainty rate(around 30%). With the same method, local goods production can be approximatedwith the same uncertainty. Local production and exportation grew in Reunion onthe past decade, and local needs also increased at the same time. As a result, self-sufficiency in goods remained constant in Reunion during the past decade.
4.10.1 Food self-sufficiency
Reunion sensitivity to imports is increased by its insularity, particularly in thefood sector. Local agricultural production covers only a low share of most consumedproducts in the territory.
0% 20% 40% 60% 80% 100%
Pigmeat
Beef
Poultry
Rice and cereals
Misc
Milk
Vegetables
Fish and shellfich
Drinks and alcohols
Fruits
Local Production Import
Figure 4.22 – Reunion food self-sufficiency on daily products
33

4. Quantification of TCO’s GHG emissions
The average local production rate is about 30%. It reaches almost 60% for theproduction of fruits and vegetables. A west coast irrigation project actually reba-lances water resources between the windward side and the leeward coast, and thusallows sugar cane production development but also crops (flowers, fruits, vegetablesand fodder) intended to replace imports.
4.11 Emission quantification conclusion
Adding all the different emission sources except energy industry produces theterritory carbon footprint (why energy is remove is explained in the scope, section3.1). Total uncertainty for that sum is 26% which may seem a lot, but that totalis actually quite accurate compared to similar studies. As it can be observed onfigure 4.24, the highest emissions sources are the importation, people transporta-tion and freight. This is quite logical for Reunion which is at the same time reallyconnected but really far from France mainland. Plane carbon footprint is high andTCO has no control over it, the airport being outside its territory. Figure 4.24 alsopresents another reading, removing the emissions not actually occurring on the ter-ritory, residential and tertiary appear among the main emissions sources. Thosesector’s emissions (along with industry’s) are issued from energy, and more parti-cularly electricity. The energy industry currently emits 517 ktCO2e which is almosta quarter of all the other emissions (2.23 MtCO2e). An island like Reunion offerslots of renewable way to produce energy, and therefore to reduce its total carbonfootprint. Actions in that way have of course already begun, but the PCET actionplan will have to pursue the energy transition. Figure 4.23 shows the distributionof the emissions over the districts and was therefore used to focus reduction ac-tions on the sources. Another interesting ratio is that TCO emits an average of11,6 tCO2/person whereas mainland France only generates 7,4tCO2/person whichhighlights the need for reduction actions.
34

4.11. Emission quantification conclusion
Figure 4.23 – Total GHG emissions by districts
35

4. Quantification of TCO’s GHG emissions
-
2�� ���
��� ���
��� ���
��� ���
� ��� ���
� ��� ���
tCO
2e
Imports and local goods
production Waste management
Construction and roads
People transportation
Freight
Agriculture and fishing
Residential
Tertiary
Industrial processes
Figure 4.24 – TCO Total GHG Emissions
36

Chapter 5
Emissions reduction plan
The other PCET part this work focused on is the actual emissions reduction.Once the quantification made and the highest emissions sources identified, settingup a realistic emissions reduction plan becomes possible.
1. Reduction targets were set according to the different guiding documents
2. For each emission source, a scenario taking into account not only the emissionsongoing trends but also reduction actions was built
3. Actions were kept on being added to the scenario until the target was reached,their financial cost being estimated aside
Those 3 steps will be substantially described in this chapter and an example will begiven. This work was stopped while action choices were still in progress so the givencurrent reduction plan status will be subject to future changes. Moreover, it shouldbe kept in mind that ECO2Initiative doesn’t have the final word on the reductionactions choices(cf 2.1).
5.1 Targets
Setting a target is a risky operation because on the one hand one would wantit to be as high as possible, but on the other hand one need to be cautious withthe feasibility and costs of reaching it as failing would discredit the territory energypolicy. Targets were set under the influence of several official documents :
– The European Council climate and energy package [1]– The French state ministries and the French PCET recommendations [2]– The Reunion region document SRCAE [15] (regional guiding document on
climate, air and energy).A loop was made when realizing when realizing in step 3 that a target was clearlyout of budget, or not challenging enough.
37

5. Emissions reduction plan
5.2 Scenario
For each emission source described in the scope (cf section 3.1.4), a lot of fo-resight studies were used and most of the datasources used were statistical [13].For instance, a study that was used multiple times is the districts demographicgrowth [12]. Not all scenarios are described here as it would be tedious and off-topicbut the example in section 5.4 includes one.
5.3 Actions and costs
Action drafts were created during brainstorming sessions between TCO repre-sentatives, territory main stakeholders and ECO2 Initiative. Those actions weredefined more precisely by ECO2 Initiative expertise, and their reduction potentialand cost were evaluated. Special care was dedicated to interaction between thoseactions : double counting was avoided when 2 actions were targeting the same emis-sion source, costs were mutualized and influence from other reduction actions (forinstance French government’s) was subtracted.
5.4 Example
5.4.1 Setting a target
The goal of the chosen action is improving the photovoltaic electricity share.As shown in the energy industry section (cf. 4.1), photovoltaic power currentlyrepresent P2012 = 29.3MWp in TCO. Photovoltaic production ratio is around1080MWh/(MWc.yr) with standard polycrystalline panels statistics show (around12% efficiency). Energy production is therefore :
E2012 = P2012 × 1080 = 31.6GWh/yr
As shown in sections 4.2, 4.3, and 4.4, TCO electricity consumption in 2012 is :
C2012 = C2012industry + C2012tertiary + C2012residential = 696GWh
That is to say that photovoltaic electricity supply 4.54% of total demand. Studyingthe documentation and especially SRCAE [15] lead to assume that a good targetwould be 7% of photovoltaic in 2030.
5.4.2 Ongoing trend
An industry market tendency scenario in Reunion consists in assuming 4.3%growing of the activity on a yearly basis [13]. On the contrary, industrial processesenergy efficiency improved on the past decade and we can consider that this tendencywill go on, making the electricity consumption decrease by 1.5% on a yearly basis
38

5.4. Example
[3]. Residential and tertiary activities are directly linked to the population growth,which is 1.3%/yr. Therefore, the tendency scenario for electrical consumption is :
C2030 = C2012industry × (1 + 0.043 − 0, 015)18 + C2012tertiary × (1 + 0.013)18
+C2012residential × (1 + 0.013)18 = 953GWh
The hypothesis that photovoltaic production ratio will be the same in 2030 was alsomade. It is a really poor hypothesis as photovoltaic efficiency is likely to be improvedbut it doesn’t really matter as it would just increase photovoltaic production.
5.4.3 Implementation
The power from photovoltaic in 2030 would be :
E2030 = C2030 × 0.08 = 66.7GWh
P2030 =E2030
1080= 61.7MWp
Photovoltaic power has to be doubled on the territory to achieve the target. Ta-king a space ratio of 130 Wp/m2 leads to the construction of 250000 m2 of solarpanels. As mentioned in section 4.8, around 2120 habitation/year are constructed inTCO, corresponding to a 42000 m2/year roof surface. Thus, 33% of new habitationsshould be covered to directly achieve the goal, which may seem oversized. Never-theless, there is lots of reasons to be optimistic about this action, beginning by themunicipality buildings that are still not covered. Moreover, the French electricityoperator EDF is compelled by law to buy the electricity injected on the grid, andFrench government support photovoltaic installation projects by according zero in-terest loans. This, added to a TCO subsidy, could give enough incentives to involveas many persons as needed. The amount that action would cost to TCO is still tobe computed as the subsidy is not defined yet. First photovoltaic panels began tobe implemented in TCO around 1995 and doubling the production in the next 18years appears like a feasible target.
5.4.4 Emissions reduction
Total emissions reduction would be 32.6 ktCO2e as shown in the action sectoralcontribution (cf. Figure 5.1). This reduction takes into account the solar panel pro-duction emission factor (0.055kgCO2/kWh) and the Reunion grid emission factor(0.780kgCO2/kWh).
39

5. Emissions reduction plan
���
�12
�10
�� ���
��
��
��
�
O��
/ G
aso
il
Ele
ctri
city
Ga
s
Oil
/ G
aso
il
TC
O e
lect
rici
ty
Co
mm
erc
ial
ele
ctri
city
Re
ma
inin
g e
lect
rici
ty
Ga
s
Oil
/ G
aso
il
Ele
ctri
city
Cu
ltiv
ati
on
Live
sto
ck
Fis
hin
g
Air
Ma
riti
me
Ro
ad
Aé
rie
n
Pe
rso
na
l V
eh
icle
s
Pu
bli
c tr
an
spo
rt
Ro
ad
s
Pre
mis
es
Ha
bit
ati
on
Wa
ste
Ma
na
ge
me
nt
Imp
ort
an
loca
l g
oo
ds
pro
du
ctio
n
Fo
od
Industrial
Processes
Tertiary Residential Agriculture and
fishing
Freight People
transportation
Roads and
construction
Increasing photovoltaic share to 7% in electricity mix
Figure 5.1 – The action sectoral contribution to PCET
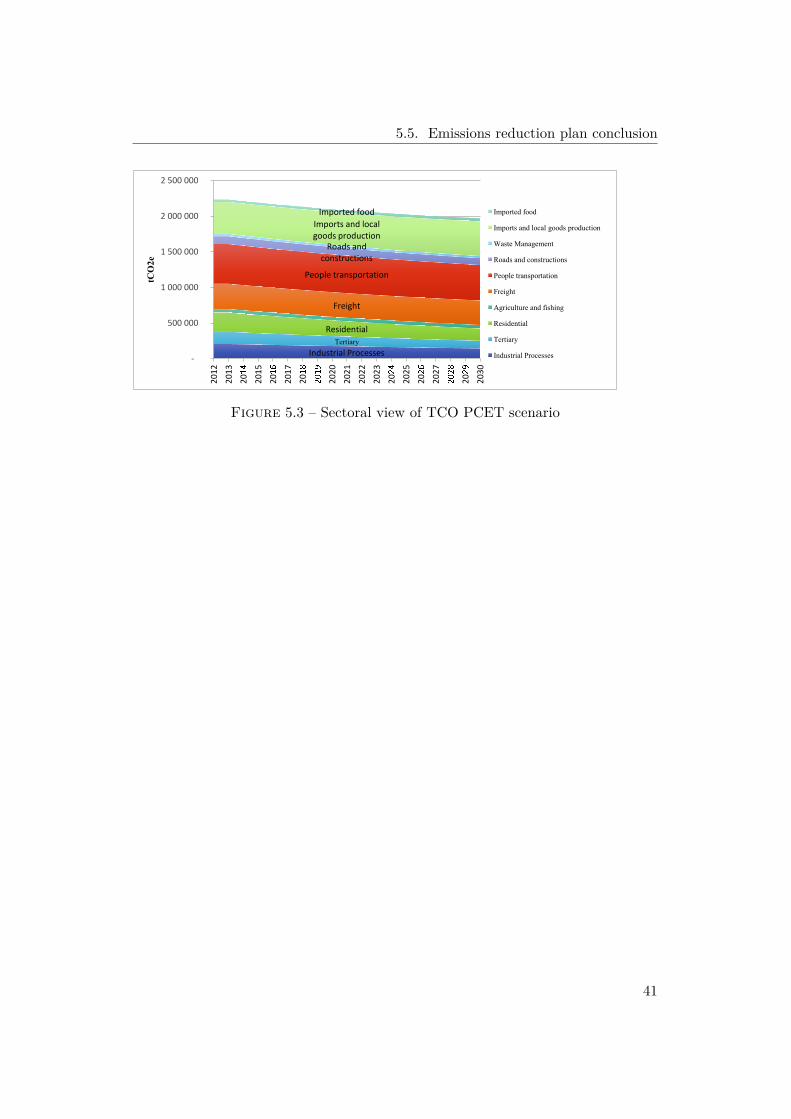
5.5 Emissions reduction plan conclusion
The PCET current state is on figure 5.2, including two sets of actions, and asegmentation into the different sources was made on figure 5.3. It can be seen thanthe "-20%" emissions is far from being achieved, even in 2013. TCO’s exceptionalpopulation growing rate is making the emissions complicated to decrease. Never-theless, a reason to be optimistic is that some actions are not implemented on thismodel yet and that further actions are to be created.
-
500 000
1 000 000
1 500 000
2 000 000
2 500 000
3 000 000
tCO2e
!"#!$"# %RE"& %CO '()% %C! PCE% * %CO PCE% (
Figure 5.2 – TCO PCET scenario current state
40
5.5. Emissions reduction plan conclusion
Industrial Processes
Tertiary
Residential
Freight
People transportation
Roads and
constructions
Imports and local
goods production
Imported food
-
500 000
1 000 000
1 500 000
2 000 000
2 500 000
20
12
20
13
20
+,
20
15
20
+.
20
17
20
+/
:;<=
20
20
20
21
20
22
20
23
20
>,
20
25
20
>.
20
27
:;:?
20
>@
20
30
tCO2e
Imported food
Imports and local goods production
Waste Management
Roads and constructions
People transportation
Freight
Agriculture and fishing
Residential
Tertiary
Industrial Processes
Figure 5.3 – Sectoral view of TCO PCET scenario
41

Chapter 6
Conclusion and future work
A proper scope was defined and total TCO GHG emissions were computedwithin a satisfying uncertainty. Details about how the different emission sourcesare distributed among the districts were given and the emissions analysis went intodepth where the needs for action was sensed. A reduction action plan proposalmethodology was set up along with reduction targets, and actions were studied.Those actions impact on the global emissions were highlighted, giving a possibleemissions evolution scenario for the territory.
The Bilan Carbone® methodology has already proven to be an efficient andpractical emissions quantification method. All the effort made in a proper scopedefinition resulted in a easier quantification. Nevertheless, data collection is par-tially incomplete and the 26% uncertainty on the total emissions (which is a gooduncertainty for carbon emissions but still poor for a scientific result) could be re-duced by replacing some hypothesis with figures.
The reduction plan model is really less stable as it is based in a predictionof both how the emission sources will evolve and how efficient the action will be.Those 2 predictions contain parameters that one does not have control over. Thefirst prediction concerns the future evolution of different markets or different peoplebehavior. Such evolutions depend on a large number of parameters and moreoverare dependent from each other. Even if those studies are still possible to perform,doing it properly would have an oversized cost and would be too time consuming.That problem is currently not treated, actions are still engaged where a simplemarket regulation would have be sufficient. The second prediction is about the actionefficiency prediction. In fact, an action rarely gives predicted results. That issue isgoing to be tackled by the upcoming release of an ADEME guide to quantify anaction impact (the GHG Protocol already does it but really vaguely). Actions wouldthen be part of a continuous improvement process and will be adapted, accentuatedor stopped as a consequence to their results. The reason such a guide still doesn’texist is that PCET’s first deadline was 2012 so first actions began in 2013.
Finally, another inherent PCET weakness is that, even if the company in chargeof the PCET is chosen by a public call for tenders and is therefore unrelated to
42

the local authority, newly elected authority may be tempted to give less credit toall that had been begun by the previous one. A good PCET requires full com-mitment of local authority representative for environment. New local election wasperformed on March 2014 and power changed side, which could be a obstacle toPCET implementation.
43
Bibliography
[1] Presidency conclusions - Brussels, 11 and 12 December 2008, 2009.
[2] ADEME. Qu’est ce qu’un pcet ? (what is a pcet ?). http://www.pcet-ademe.
fr/a-savoir/quest-ce-quun-pcet, 2012.
[3] ADEME. Climate air and energy key figures. http://multimedia.ademe.fr/
catalogues/chiffres-cles-climat-air-energie-2013/data/catalogue.
pdf, 2013.
[4] ADEME. Base carbone. http://www.basecarbone.fr/en/, 2014.
[5] ADEME. Emission factor guide. http://www.associationbilancarbone.
fr/download-file/529/field_fichier/524, 2014.
[6] ARER. Bilan énergetique, île de la réunion. http://www.arer.org/IMG/pdf/
BER_Technique_2012.pdf, 2011.
[7] BRGM. Etude préliminaire de l’impact du changement climatique sur lesrisques naturels à la réunion, 2011.
[8] Association Bilan Carbone. Bilan carbone: Companies – local authorities– regions. http://www.associationbilancarbone.fr/download-file/486/
field_fichier/480, 2010.
[9] DAAF. Directorate for food, agriculture and forestry in reunion. http://www.
daf974.agriculture.gouv.fr/, 2010.
[10] ECO2 Initiative. Bilan carbone patrimoine et service du tco. http://www.
tco.re/BIB/43_/1868.pdf, 2013.
[11] ECO2 Initiative. Pcet du tco. 2014.
[12] INSEE. Saint-paul (97415) population structure and evolution.http://www.statistiques-locales.insee.fr/FICHES/DL/DEP/97/COM/
DL_COM97415.pdf, 2012.
[13] INSEE. National institute of statistics and economic studies. http://insee.
fr/en/default.asp, 2014.
[14] IPCC. Climate change 2013, the physical science basis. https://www.ipcc.
ch/report/ar5/wg1/, 2013.
44

Bibliography
[15] La Reunion region authority. Schema régional climat air energie de laréunion. http://www.reunion.developpement-durable.gouv.fr/IMG/pdf/
schema_regional_climat_ai_energie_974_cle2c5f8e.pdf, 2013.
45