Embed Size (px)
Citation preview
Page 1 of 69
Japan radio Test Report
Report No.: AGC00688210601TE03
PRODUCT DESIGNATION : 2.4G Wireless Mouse
BRAND NAME : SANWA SUPPLY
MODEL NAME : MA-WBL161, MA-KSW3BK, MA-WBL41BKN, MA-WBL41RN, MA-WBL41WN, 400-MA097, MA-WBL113, 400-MA126BK, MA-KW1
APPLICANT : Sanwa Supply Inc.
DATE OF ISSUE : Jun. 11, 2021
STANDARD(S) : Article 2 Paragraph 1 Item 19 of the Certification, Article 49.20 of Ordinance Regulating Radio Equipment MIC Notice No.88 Appendix No.43
REPORT VERSION : V1.0
Attestation of Global Compliance (Shenzhen) Co., Ltd
Report No.: AGC00688210601TE03 Page 2 of 69
REPORT REVISE RECORD
Report Version Revise Time Issued Date Valid Version Notes
V1.0 / Jun. 11, 2021 Valid Initial release
Report No.: AGC00688210601TE03 Page 3 of 69
TABLE OF CONTENTS
1. VERIFICATION OF CONFORMITY .................................................................................................................. 4
2. GENERAL INFORMATION .............................................................................................................................. 5
2.1. DESCRIPTION OF EUT ............................................................................................................................. 5
2.3. DESCRIPTION OF TEST MODES ............................................................................................................. 7
2.4. TEST ITEMS AND THE RESULTS ............................................................................................................. 8
2.5. ENVIRONMENTAL CONDITIONS ............................................................................................................. 8
2.6. MEASUREMENT UNCERTAINTY ............................................................................................................. 8
3. IDENTIFICATION OF THE RESPONSIBLE TESTING LOCATION ................................................................ 9
4. TEST EQUIPMENTS LIST ............................................................................................................................... 9
5. TEST RESULTS .............................................................................................................................................. 10
5.1. FREQUENCY ERROR MEASUREMENT ................................................................................................ 10
5.2. OCCUPIED BANDWIDTH AND SPREAD-SPECTRUM BANDWIDTH MEASUREMENT ...................... 16
5.3. UNWANTED EMISSION INTENSITY MEASUREMENT ......................................................................... 22
5.4. ANTENNA POWER ERROR MEASUREMENT ....................................................................................... 47
5.5. LIMITATION OF COLLATERAL EMISSION OF RECEIVER MEASUREMENT ....................................... 49
5.6. TRANSMISSION ANTENNA GAIN (EIRP ANTENNA POWER) MEASUREMENT ................................. 54
5.7. TRANSMISSION RADIATION ANGLE WIDTH (3DB BEAMWIDTH) MEASUREMENT ......................... 56
5.8. RADIO INTERFERENCE PREVENTION CAPABILITY MEASUREMENT .............................................. 58
5.9 CONSTRUCTION PROTECTION CONFIRMATION METHOD ............................................................... 60
APPENDIX A: PHOTOGRAPHS OF TEST SETUP .......................................................................................... 61
APPENDIX B: PHOTOGRAPHS OF EUT ......................................................................................................... 62
Report No.: AGC00688210601TE03 Page 4 of 69
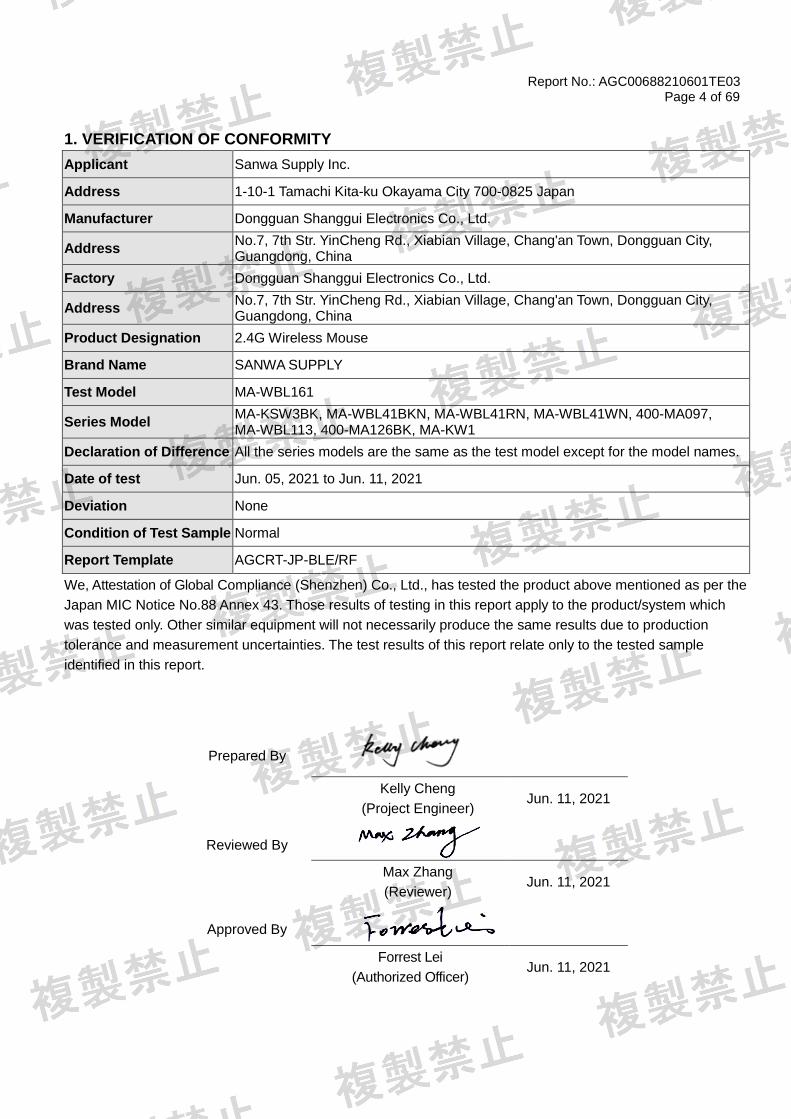
1. VERIFICATION OF CONFORMITY
Applicant Sanwa Supply Inc.
Address 1-10-1 Tamachi Kita-ku Okayama City 700-0825 Japan
Manufacturer Dongguan Shanggui Electronics Co., Ltd.
Address No.7, 7th Str. YinCheng Rd., Xiabian Village, Chang'an Town, Dongguan City, Guangdong, China
Factory Dongguan Shanggui Electronics Co., Ltd.
Address No.7, 7th Str. YinCheng Rd., Xiabian Village, Chang'an Town, Dongguan City, Guangdong, China
Product Designation 2.4G Wireless Mouse
Brand Name SANWA SUPPLY
Test Model MA-WBL161
Series Model MA-KSW3BK, MA-WBL41BKN, MA-WBL41RN, MA-WBL41WN, 400-MA097, MA-WBL113, 400-MA126BK, MA-KW1
Declaration of Difference All the series models are the same as the test model except for the model names.
Date of test Jun. 05, 2021 to Jun. 11, 2021
Deviation None
Condition of Test Sample Normal
Report Template AGCRT-JP-BLE/RF
We, Attestation of Global Compliance (Shenzhen) Co., Ltd., has tested the product above mentioned as per the
Japan MIC Notice No.88 Annex 43. Those results of testing in this report apply to the product/system which
was tested only. Other similar equipment will not necessarily produce the same results due to production
tolerance and measurement uncertainties. The test results of this report relate only to the tested sample
identified in this report.
Prepared By
Kelly Cheng
(Project Engineer) Jun. 11, 2021
Reviewed By
Max Zhang
(Reviewer) Jun. 11, 2021
Approved By
Forrest Lei
(Authorized Officer) Jun. 11, 2021
Report No.: AGC00688210601TE03 Page 5 of 69
2. GENERAL INFORMATION
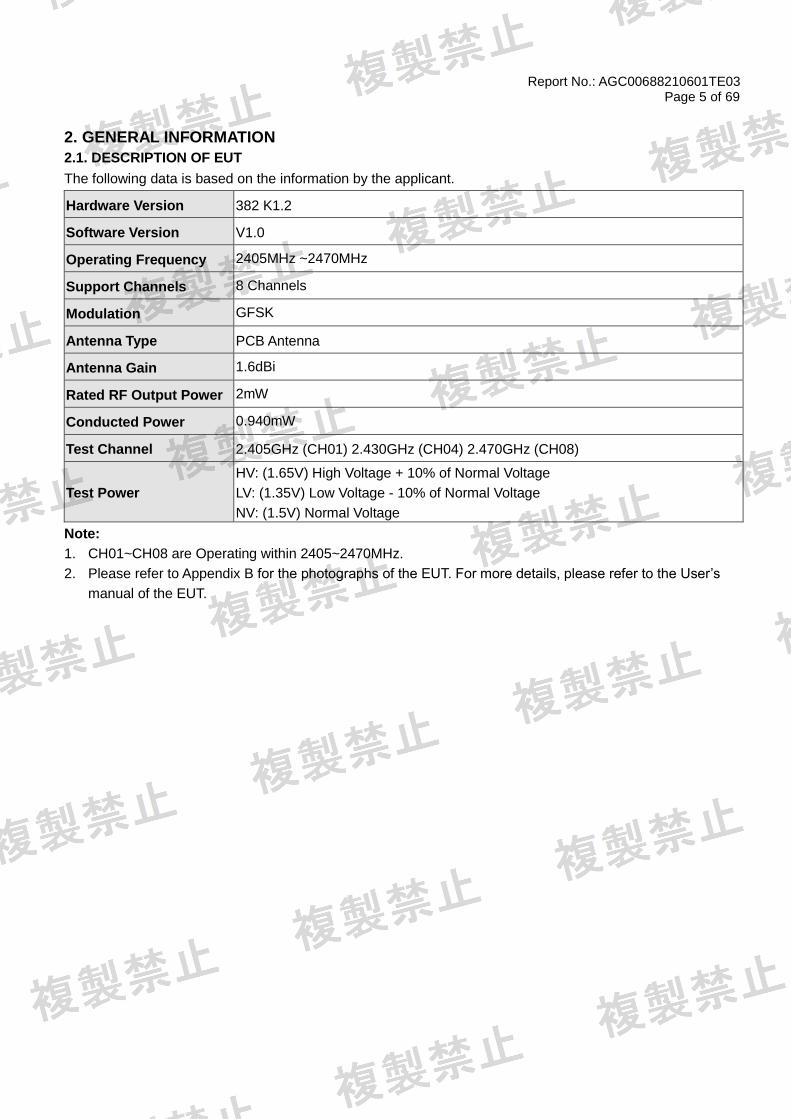
2.1. DESCRIPTION OF EUT
The following data is based on the information by the applicant.
Hardware Version 382 K1.2
Software Version V1.0
Operating Frequency 2405MHz ~2470MHz
Support Channels 8 Channels
Modulation GFSK
Antenna Type PCB Antenna
Antenna Gain 1.6dBi
Rated RF Output Power 2mW
Conducted Power 0.940mW
Test Channel 2.405GHz (CH01) 2.430GHz (CH04) 2.470GHz (CH08)
Test Power
HV: (1.65V) High Voltage + 10% of Normal Voltage
LV: (1.35V) Low Voltage - 10% of Normal Voltage
NV: (1.5V) Normal Voltage
Note:
1. CH01~CH08 are Operating within 2405~2470MHz.
2. Please refer to Appendix B for the photographs of the EUT. For more details, please refer to the User’s
manual of the EUT.
Report No.: AGC00688210601TE03 Page 6 of 69
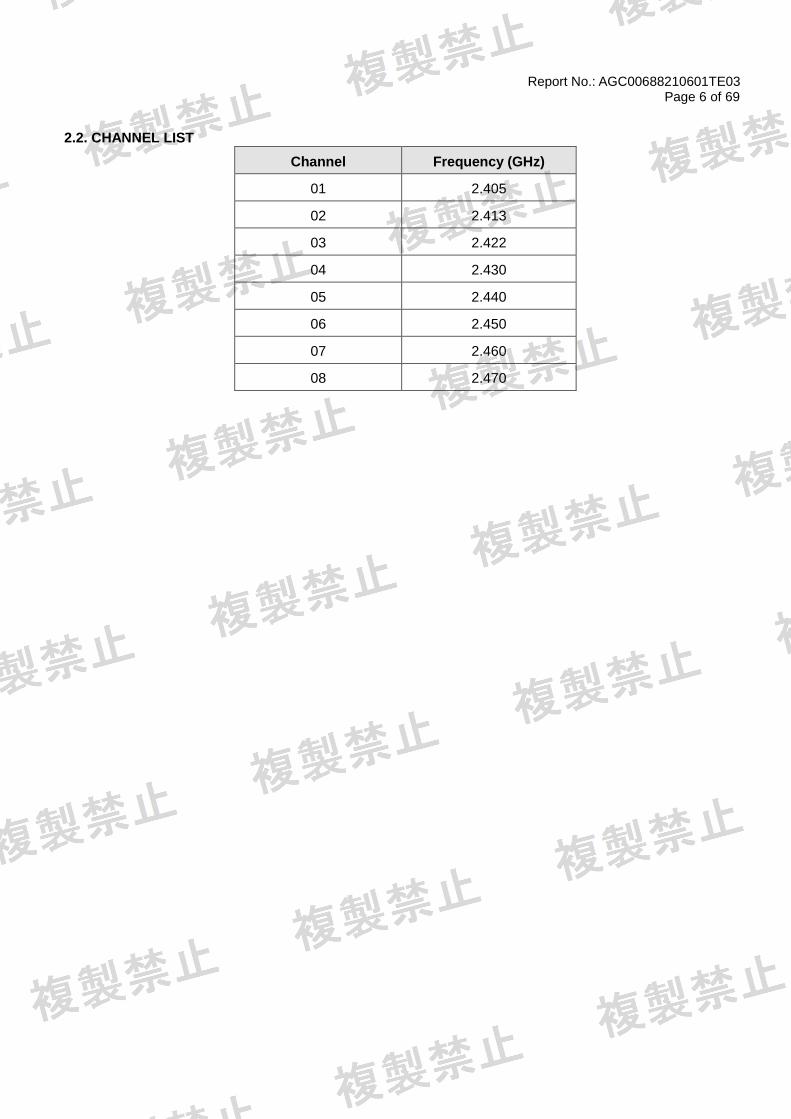
2.2. CHANNEL LIST
Channel Frequency (GHz)
01 2.405
02 2.413
03 2.422
04 2.430
05 2.440
06 2.450
07 2.460
08 2.470
Report No.: AGC00688210601TE03 Page 7 of 69
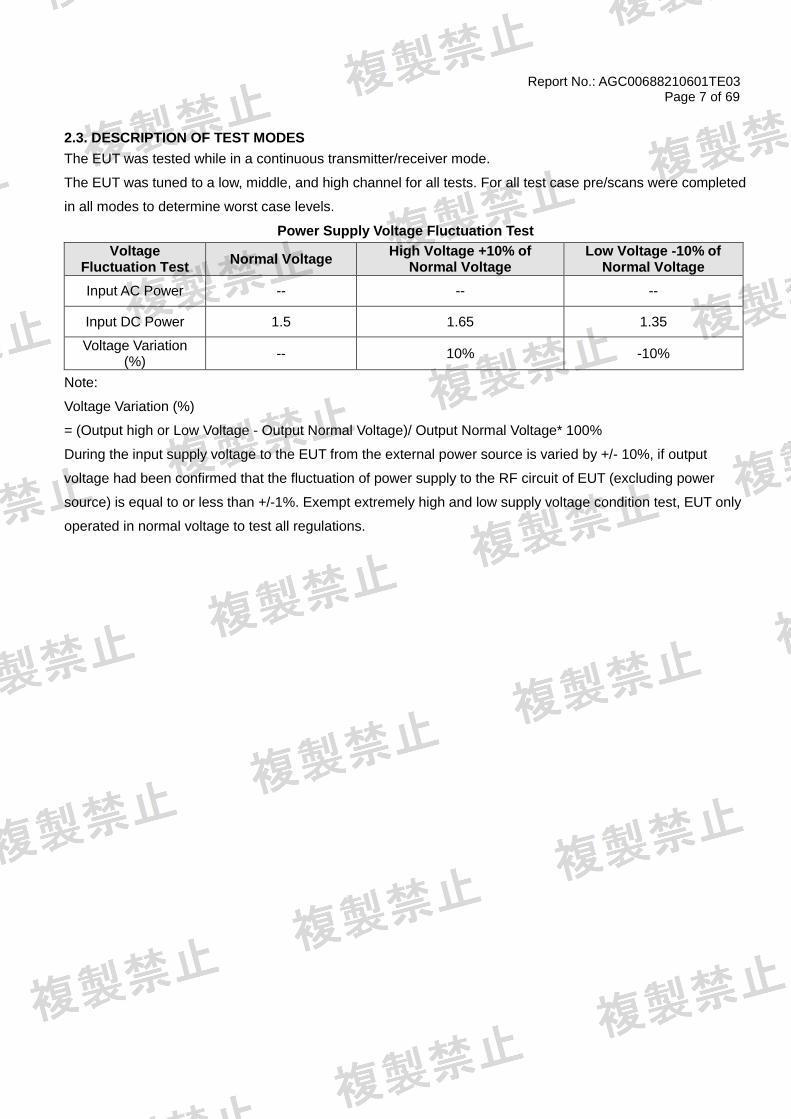
2.3. DESCRIPTION OF TEST MODES
The EUT was tested while in a continuous transmitter/receiver mode.
The EUT was tuned to a low, middle, and high channel for all tests. For all test case pre/scans were completed
in all modes to determine worst case levels.
Power Supply Voltage Fluctuation Test
Voltage Fluctuation Test
Normal Voltage High Voltage +10% of
Normal Voltage Low Voltage -10% of
Normal Voltage
Input AC Power -- -- --
Input DC Power 1.5 1.65 1.35
Voltage Variation (%)
-- 10% -10%
Note:
Voltage Variation (%)
= (Output high or Low Voltage - Output Normal Voltage)/ Output Normal Voltage* 100%
During the input supply voltage to the EUT from the external power source is varied by +/- 10%, if output
voltage had been confirmed that the fluctuation of power supply to the RF circuit of EUT (excluding power
source) is equal to or less than +/-1%. Exempt extremely high and low supply voltage condition test, EUT only
operated in normal voltage to test all regulations.

Report No.: AGC00688210601TE03 Page 8 of 69
2.4. TEST ITEMS AND THE RESULTS
Ordinance Regulating Radio
Equipment Description of Test Result
Article 5 Frequency Error Complies
Article 6 Occupied Bandwidth (99%) and Spread-spectrum
Bandwidth (90%) Complies
Article 7 Unwanted Emission Intensity Complies
Article 49.20 & Article 14 Antenna Power Error Complies
Article 24 Limitation of Collateral Emission of Receiver Complies
Article 49.20 Transmission Antenna Gain (EIRP Antenna Power) Not applicable
Article 49.20 Transmission Radiation Angle Width (3dB Bandwidth) Not applicable
Article 9.4 Radio Interference Prevention Capability Complies
Article 49.20 Construction Protection Confirmation Complies
2.5. ENVIRONMENTAL CONDITIONS
During the measurement the environmental conditions were within the listed ranges:
- Temperature: 5-35ºC
- Relative Humidity: 45-85 %
- Atmospheric pressure: 86-106 kPa
2.6. MEASUREMENT UNCERTAINTY
The reported uncertainty of measurement y ±U, where expended uncertainty U is based on a standard
uncertainty multiplied by a coverage factor of k=2, providing a level of confidence of approximately 95%.
Item Measurement Uncertainty
Uncertainty of Radio Frequency Uc=±1 x 10⁻⁷
Uncertainty of total RF power, conducted Uc = ±0.8 dB
Uncertainty of RF power density, conducted Uc = ±2.6 dB
Uncertainty of spurious emissions, conducted Uc = ±2.7 dB
Uncertainty of Occupied Channel Bandwidth Uc = ±2 %
Report No.: AGC00688210601TE03 Page 9 of 69
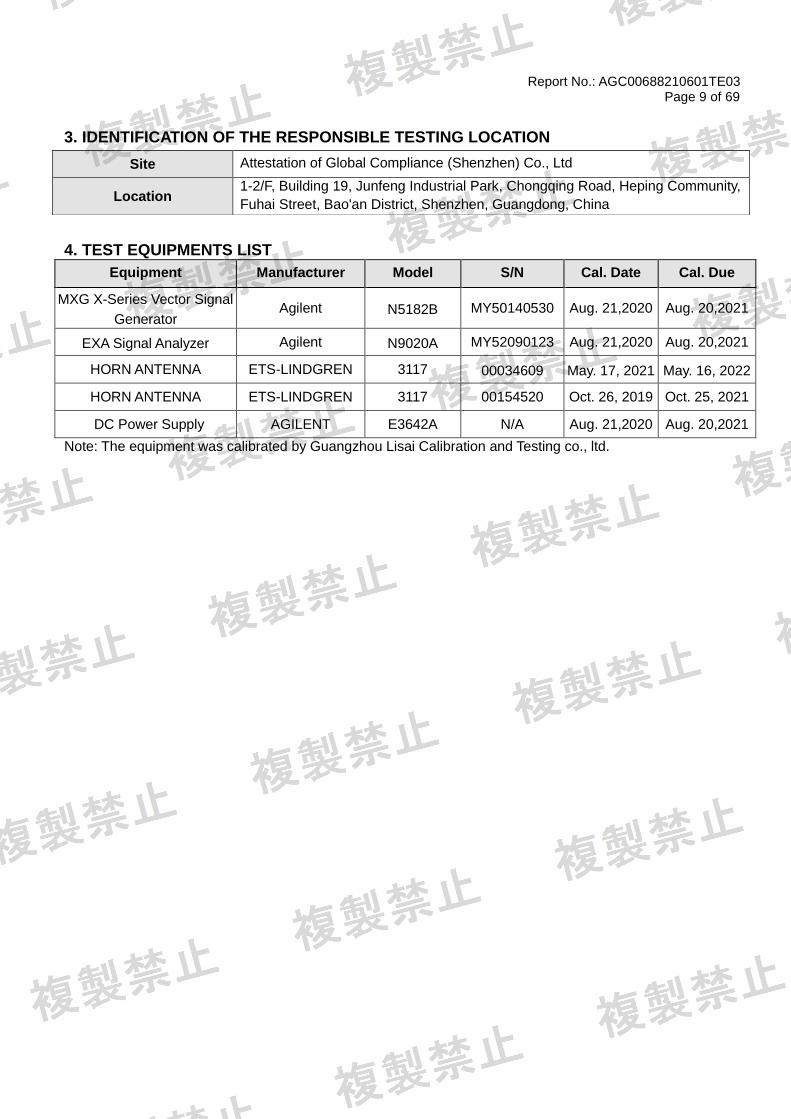
3. IDENTIFICATION OF THE RESPONSIBLE TESTING LOCATION
4. TEST EQUIPMENTS LIST
Equipment Manufacturer Model S/N Cal. Date Cal. Due
MXG X-Series Vector Signal
Generator Agilent N5182B MY50140530 Aug. 21,2020 Aug. 20,2021
EXA Signal Analyzer Agilent N9020A MY52090123 Aug. 21,2020 Aug. 20,2021
HORN ANTENNA ETS-LINDGREN 3117 00034609 May. 17, 2021 May. 16, 2022
HORN ANTENNA ETS-LINDGREN 3117 00154520 Oct. 26, 2019 Oct. 25, 2021
DC Power Supply AGILENT E3642A N/A Aug. 21,2020 Aug. 20,2021
Note: The equipment was calibrated by Guangzhou Lisai Calibration and Testing co., ltd.
Site Attestation of Global Compliance (Shenzhen) Co., Ltd
Location 1-2/F, Building 19, Junfeng Industrial Park, Chongqing Road, Heping Community,
Fuhai Street, Bao'an District, Shenzhen, Guangdong, China
Report No.: AGC00688210601TE03 Page 10 of 69
5. TEST RESULTS
5.1. FREQUENCY ERROR MEASUREMENT
5.1.1. LIMIT
Item Limits
Frequency Tolerance (2400~2483.5MHz) -50ppm≦Frequency Error≦50ppm
5.1.2. TEST PROCEDURES
1. Frequency accuracy of SA shall be less than 10% of limits tolerance (5ppm)
2. Setting of SA is following as: RB: 10kHz / VB: 10kHz / SPAN: 0.5MHz
3. Center Frequency: The center frequency of testing for EUT
4. Sweep time: Auto
5. Sweep mode: Continuous sweep
6. Detect mode: Positive peak
7. EUT have transmitted absence of modulation signal and fixed channelize. if is using the
mark cursor to mark the peak frequency value, fc is declaring of channel frequency.
Then the frequency error formula is (fc-f)/fc×106ppm and the limit is less than ±50ppm
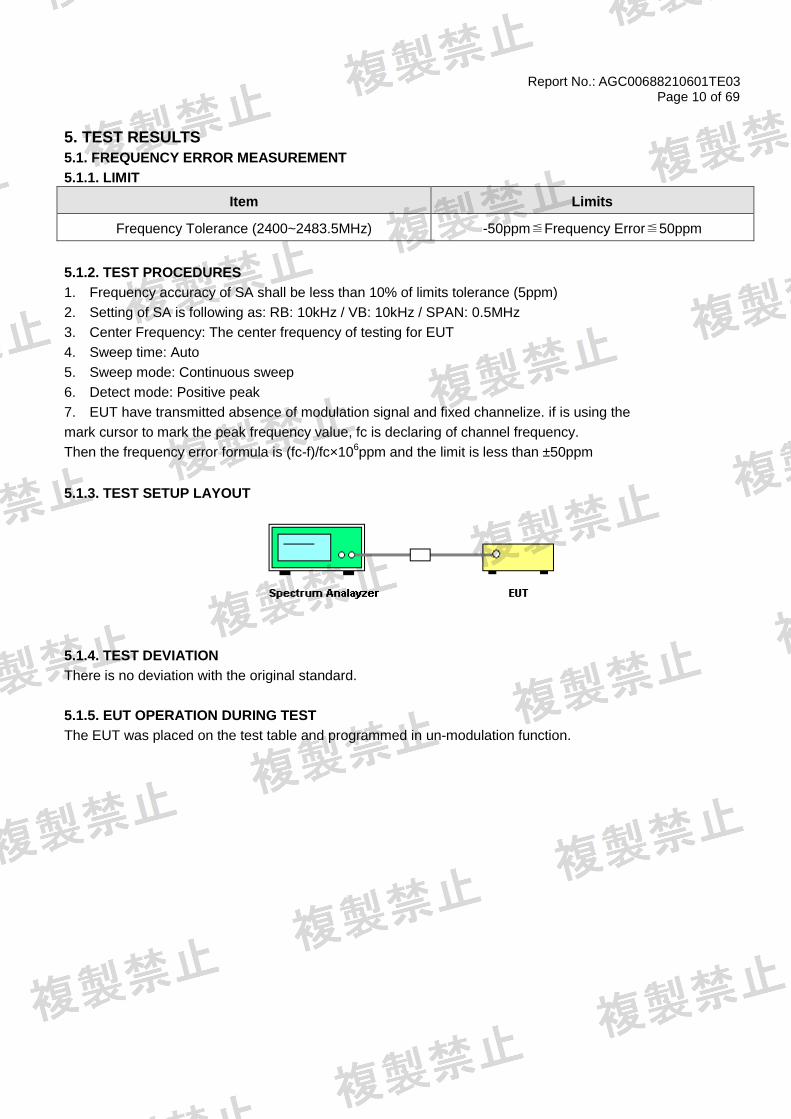
5.1.3. TEST SETUP LAYOUT
5.1.4. TEST DEVIATION
There is no deviation with the original standard.
5.1.5. EUT OPERATION DURING TEST
The EUT was placed on the test table and programmed in un-modulation function.

Report No.: AGC00688210601TE03 Page 11 of 69
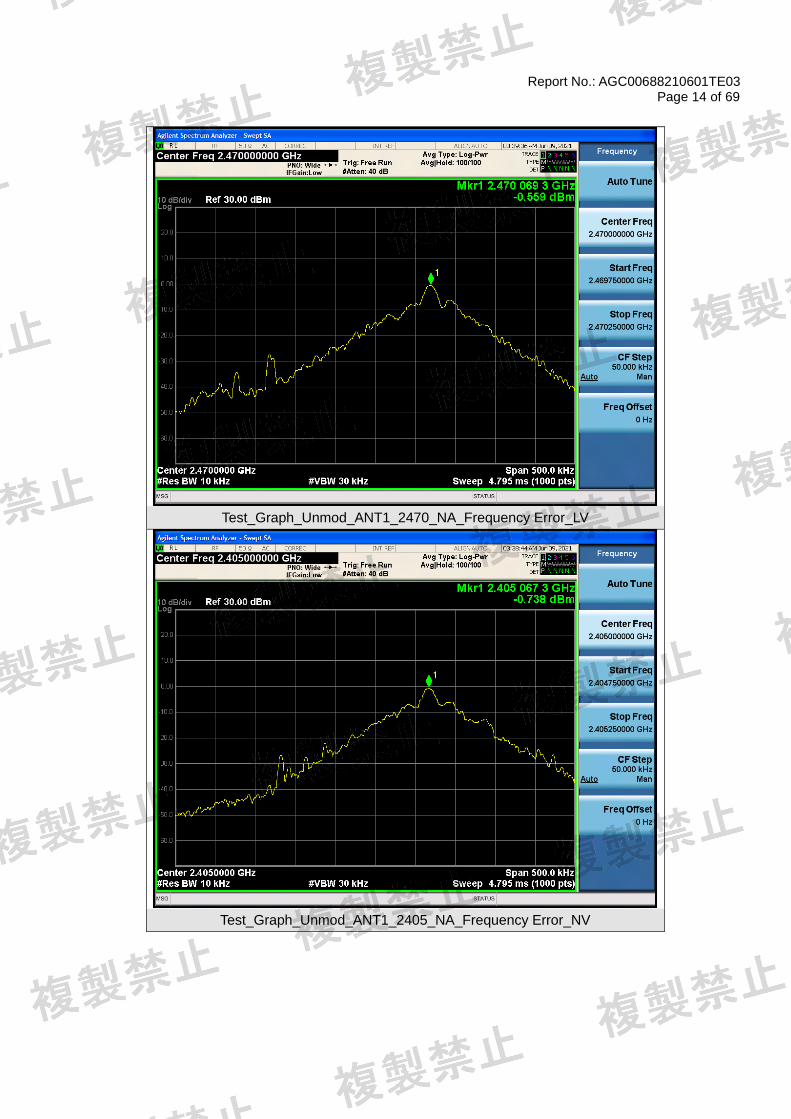
5.1.6. RESULTS OF FREQUENCY ERROR
Test Data of Frequency Error
Test
Mode
Test
Frequency
(MHz)
Measure Frequency (MHz) Frequency Error (ppm) Limit
(ppm) P/F
NV LV HV NV LV HV
Un
mod
2405 2405.0673 2405.0683 2405.0673 27.99 28.41 27.99 ±50 Pass
2430 2430.0683 2430.0673 2430.0683 28.11 27.70 28.11 ±50 Pass
2470 2470.0688 2470.0693 2470.0693 27.86 28.06 28.06 ±50 Pass
Test Graphs of Frequency Error
Test_Graph_Unmod_ANT1_2405_NA_Frequency Error_HV

Report No.: AGC00688210601TE03 Page 12 of 69
Test_Graph_Unmod_ANT1_2430_NA_Frequency Error_HV
Test_Graph_Unmod_ANT1_2470_NA_Frequency Error_HV

Report No.: AGC00688210601TE03 Page 13 of 69
Test_Graph_Unmod_ANT1_2405_NA_Frequency Error_LV
Test_Graph_Unmod_ANT1_2430_NA_Frequency Error_LV
Report No.: AGC00688210601TE03 Page 14 of 69
Test_Graph_Unmod_ANT1_2470_NA_Frequency Error_LV
Test_Graph_Unmod_ANT1_2405_NA_Frequency Error_NV

Report No.: AGC00688210601TE03 Page 15 of 69
Test_Graph_Unmod_ANT1_2430_NA_Frequency Error_NV
Test_Graph_Unmod_ANT1_2470_NA_Frequency Error_NV
Report No.: AGC00688210601TE03 Page 16 of 69
5.2. OCCUPIED BANDWIDTH AND SPREAD-SPECTRUM BANDWIDTH MEASUREMENT
5.2.1. LIMIT
Item Limits
Occupied Band Width
FH<83.5MHz;
26MHz≦OFDM 40M system≦40MHz;
OFDM 20M system, DS, Others≦26MHz
Spreading Bandwidth ≧500 kHz (FH, DS)
5.2.2. TEST PROCEDURES
1. Setting of SA is following as: RB: 30kHz / VB: 30kHz / SPAN: 3MHz / AT: 20dB Ref:
10dBm / Sweep time: Auto / Sweep Mode: Continuous sweep / Detect mode: Positive
peak / Trace mode: Max hold
2. EUT have transmitted the maximum modulation signal and fixed channelize.
SA set to 99% of occupied bandwidth to measure occupied bandwidth.
The limit is less than 26MHz.
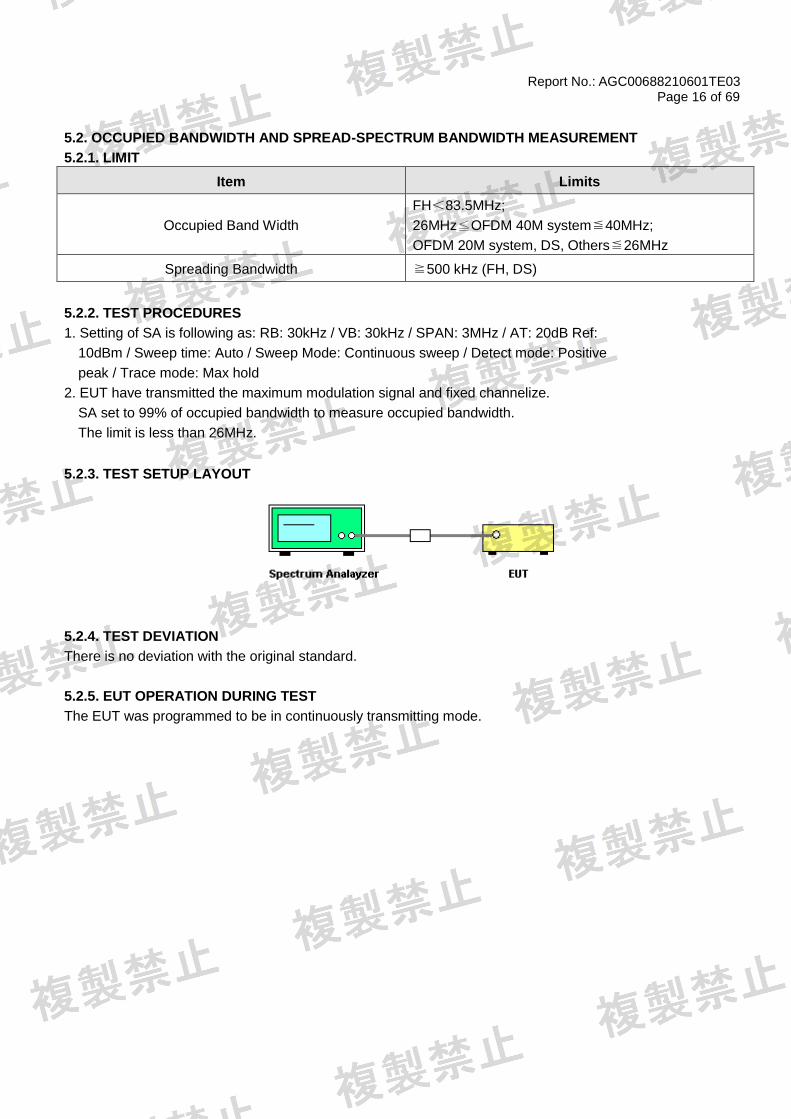
5.2.3. TEST SETUP LAYOUT
5.2.4. TEST DEVIATION
There is no deviation with the original standard.
5.2.5. EUT OPERATION DURING TEST
The EUT was programmed to be in continuously transmitting mode.
Report No.: AGC00688210601TE03 Page 17 of 69
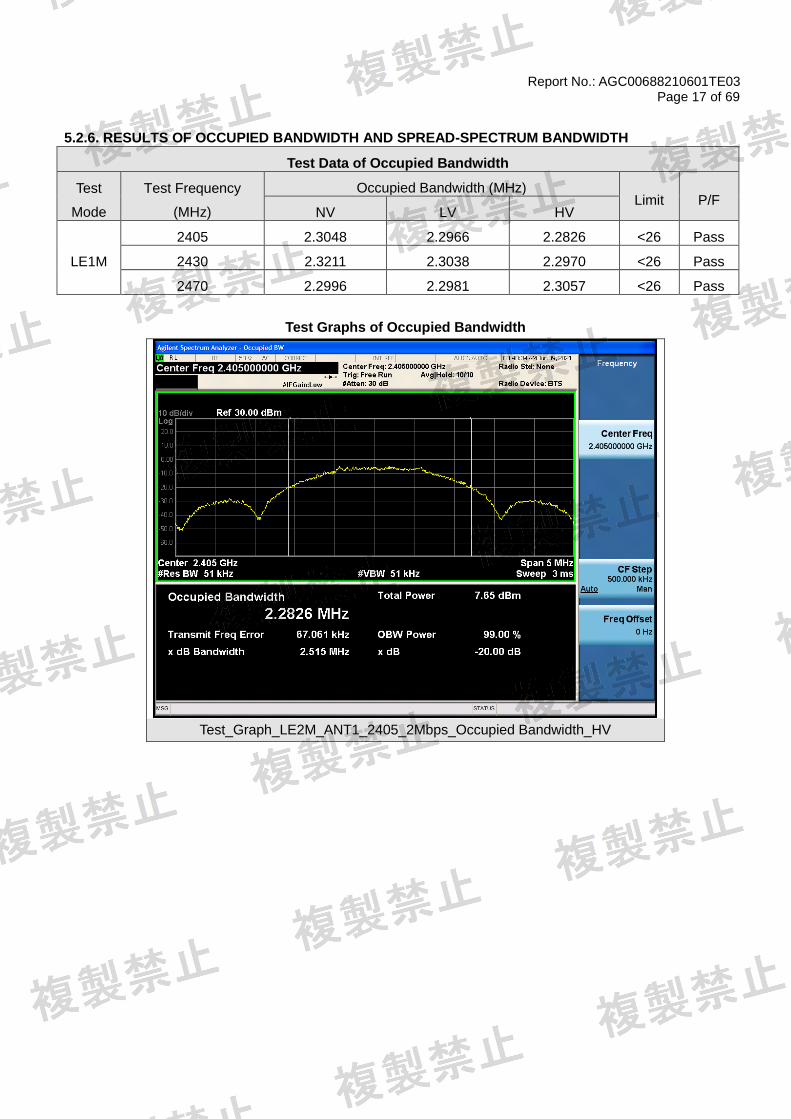
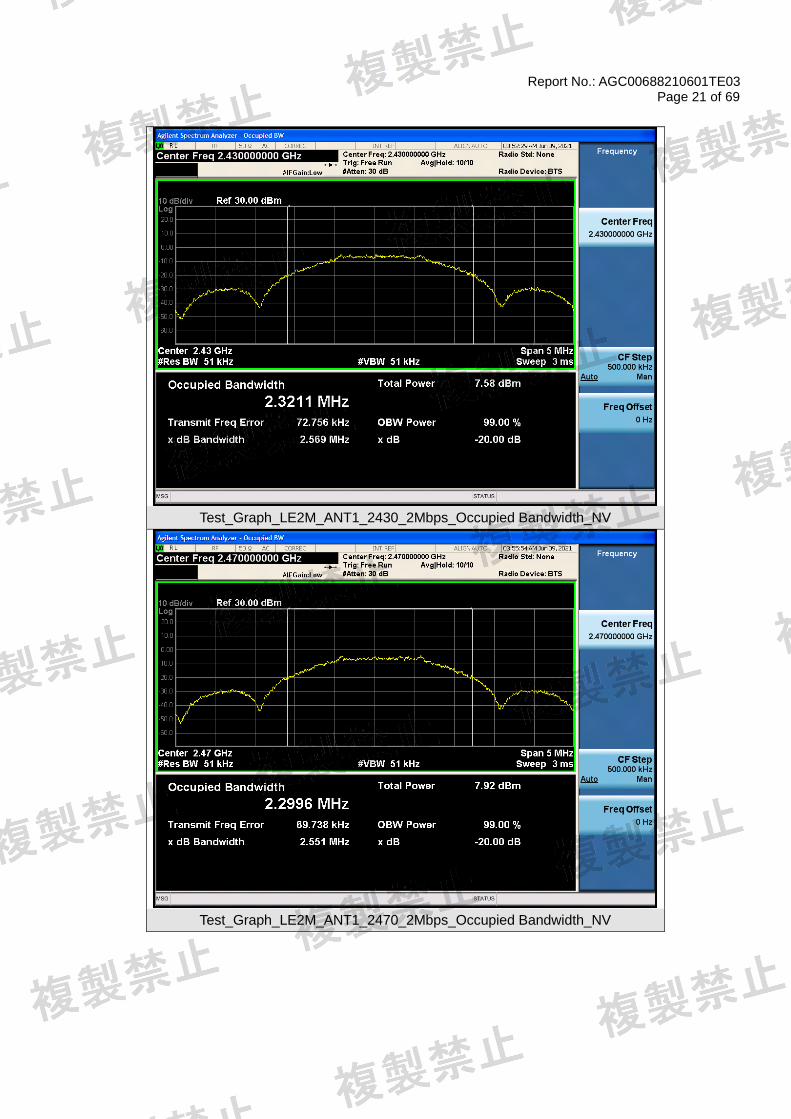
5.2.6. RESULTS OF OCCUPIED BANDWIDTH AND SPREAD-SPECTRUM BANDWIDTH
Test Data of Occupied Bandwidth
Test
Mode
Test Frequency
(MHz)
Occupied Bandwidth (MHz) Limit P/F
NV LV HV
LE1M
2405 2.3048 2.2966 2.2826 <26 Pass
2430 2.3211 2.3038 2.2970 <26 Pass
2470 2.2996 2.2981 2.3057 <26 Pass
Test Graphs of Occupied Bandwidth
Test_Graph_LE2M_ANT1_2405_2Mbps_Occupied Bandwidth_HV
Report No.: AGC00688210601TE03 Page 18 of 69
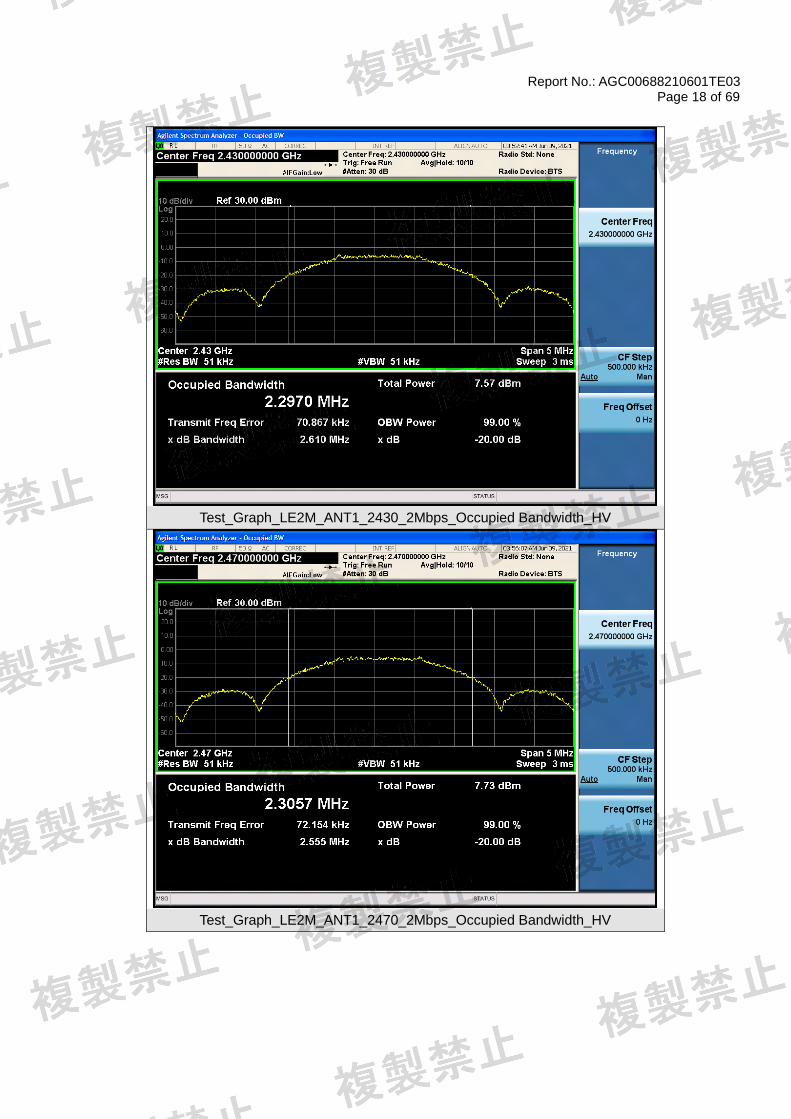
Test_Graph_LE2M_ANT1_2430_2Mbps_Occupied Bandwidth_HV
Test_Graph_LE2M_ANT1_2470_2Mbps_Occupied Bandwidth_HV

Report No.: AGC00688210601TE03 Page 19 of 69
Test_Graph_LE2M_ANT1_2405_2Mbps_Occupied Bandwidth_LV
Test_Graph_LE2M_ANT1_2430_2Mbps_Occupied Bandwidth_LV

Report No.: AGC00688210601TE03 Page 20 of 69
Test_Graph_LE2M_ANT1_2470_2Mbps_Occupied Bandwidth_LV
Test_Graph_LE2M_ANT1_2405_2Mbps_Occupied Bandwidth_NV
Report No.: AGC00688210601TE03 Page 21 of 69
Test_Graph_LE2M_ANT1_2430_2Mbps_Occupied Bandwidth_NV
Test_Graph_LE2M_ANT1_2470_2Mbps_Occupied Bandwidth_NV
Report No.: AGC00688210601TE03 Page 22 of 69
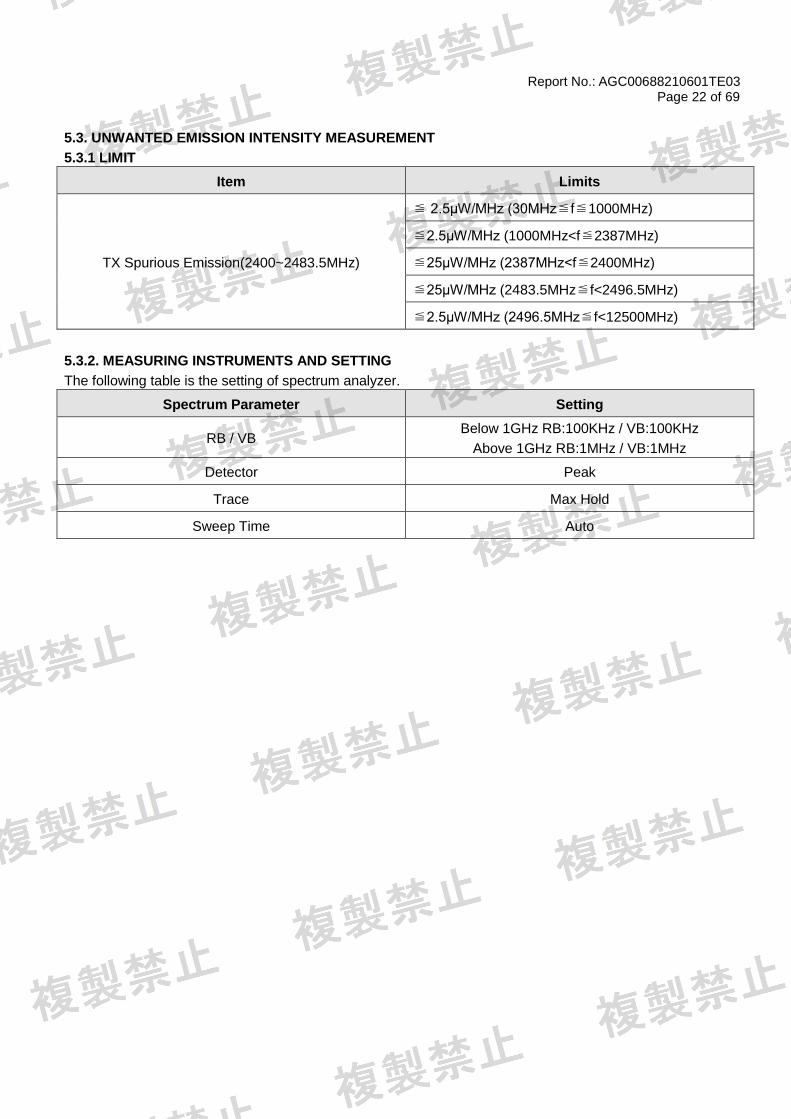
5.3. UNWANTED EMISSION INTENSITY MEASUREMENT
5.3.1 LIMIT
Item Limits
TX Spurious Emission(2400~2483.5MHz)
≦ 2.5μW/MHz (30MHz≦f≦1000MHz)
≦2.5μW/MHz (1000MHz<f≦2387MHz)
≦25μW/MHz (2387MHz<f≦2400MHz)
≦25μW/MHz (2483.5MHz≦f<2496.5MHz)
≦2.5μW/MHz (2496.5MHz≦f<12500MHz)
5.3.2. MEASURING INSTRUMENTS AND SETTING
The following table is the setting of spectrum analyzer.
Spectrum Parameter Setting
RB / VB Below 1GHz RB:100KHz / VB:100KHz
Above 1GHz RB:1MHz / VB:1MHz
Detector Peak
Trace Max Hold
Sweep Time Auto
Report No.: AGC00688210601TE03 Page 23 of 69
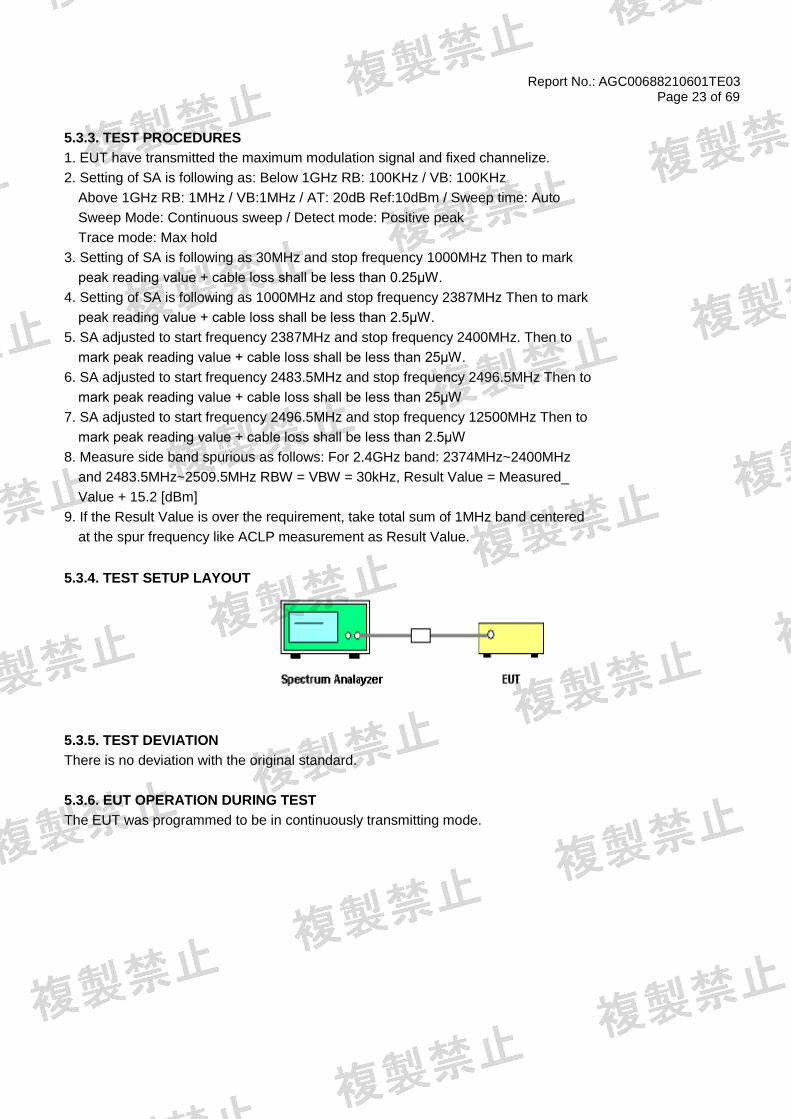
5.3.3. TEST PROCEDURES
1. EUT have transmitted the maximum modulation signal and fixed channelize.
2. Setting of SA is following as: Below 1GHz RB: 100KHz / VB: 100KHz
Above 1GHz RB: 1MHz / VB:1MHz / AT: 20dB Ref:10dBm / Sweep time: Auto
Sweep Mode: Continuous sweep / Detect mode: Positive peak
Trace mode: Max hold
3. Setting of SA is following as 30MHz and stop frequency 1000MHz Then to mark
peak reading value + cable loss shall be less than 0.25μW.
4. Setting of SA is following as 1000MHz and stop frequency 2387MHz Then to mark
peak reading value + cable loss shall be less than 2.5μW.
5. SA adjusted to start frequency 2387MHz and stop frequency 2400MHz. Then to
mark peak reading value + cable loss shall be less than 25μW.
6. SA adjusted to start frequency 2483.5MHz and stop frequency 2496.5MHz Then to
mark peak reading value + cable loss shall be less than 25μW
7. SA adjusted to start frequency 2496.5MHz and stop frequency 12500MHz Then to
mark peak reading value + cable loss shall be less than 2.5μW
8. Measure side band spurious as follows: For 2.4GHz band: 2374MHz~2400MHz
and 2483.5MHz~2509.5MHz RBW = VBW = 30kHz, Result Value = Measured_
Value + 15.2 [dBm]
9. If the Result Value is over the requirement, take total sum of 1MHz band centered
at the spur frequency like ACLP measurement as Result Value.
5.3.4. TEST SETUP LAYOUT
5.3.5. TEST DEVIATION
There is no deviation with the original standard.
5.3.6. EUT OPERATION DURING TEST
The EUT was programmed to be in continuously transmitting mode.

Report No.: AGC00688210601TE03 Page 24 of 69
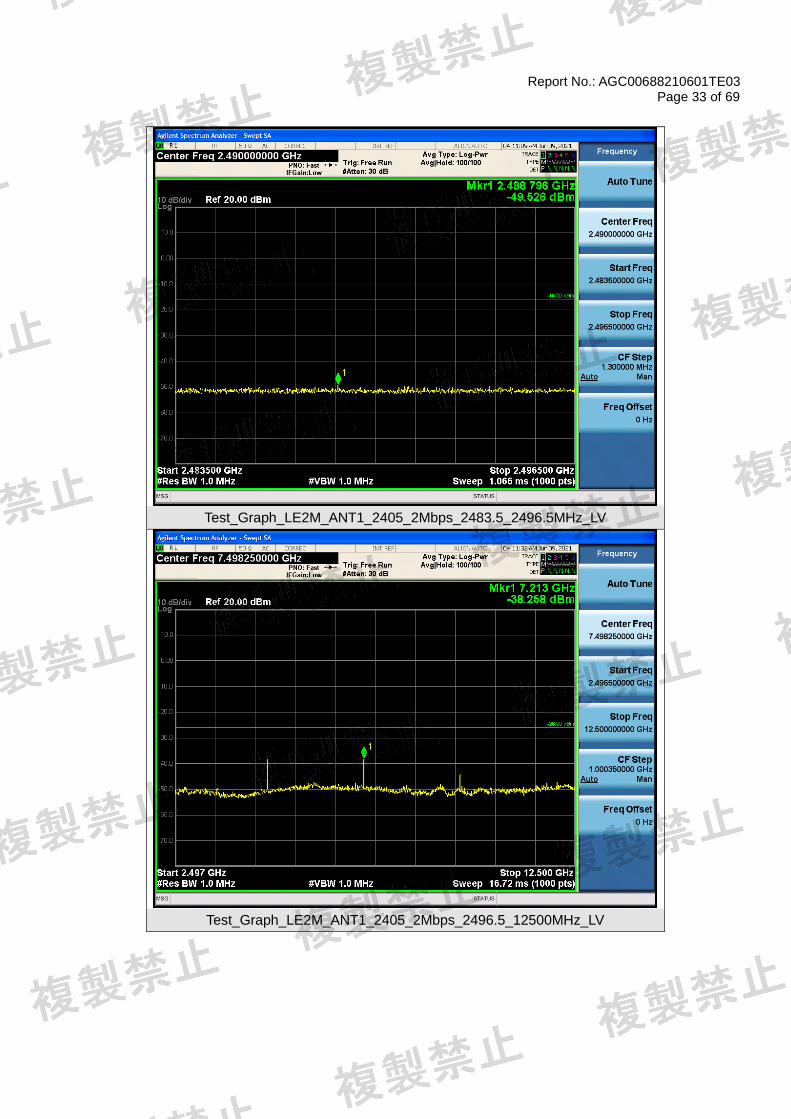
5.3.7. TEST RESULT OF UNWANTED EMISSION INTENSITY
Test Graphs of Transmitter Spurious
Test_Graph_LE2M_ANT1_2405_2Mbps_30_1000MHz_HV
Test_Graph_LE2M_ANT1_2405_2Mbps_1000_2387MHz_HV

Report No.: AGC00688210601TE03 Page 25 of 69
Test_Graph_LE2M_ANT1_2405_2Mbps_2387_2400MHz_HV
Test_Graph_LE2M_ANT1_2405_2Mbps_2483.5_2496.5MHz_HV

Report No.: AGC00688210601TE03 Page 26 of 69
Test_Graph_LE2M_ANT1_2405_2Mbps_2496.5_12500MHz_HV
Test_Graph_LE2M_ANT1_2430_2Mbps_30_1000MHz_HV

Report No.: AGC00688210601TE03 Page 27 of 69
Test_Graph_LE2M_ANT1_2430_2Mbps_1000_2387MHz_HV
Test_Graph_LE2M_ANT1_2430_2Mbps_2387_2400MHz_HV

Report No.: AGC00688210601TE03 Page 28 of 69
Test_Graph_LE2M_ANT1_2430_2Mbps_2483.5_2496.5MHz_HV
Test_Graph_LE2M_ANT1_2430_2Mbps_2496.5_12500MHz_HV

Report No.: AGC00688210601TE03 Page 29 of 69
Test_Graph_LE2M_ANT1_2470_2Mbps_30_1000MHz_HV
Test_Graph_LE2M_ANT1_2470_2Mbps_1000_2387MHz_HV
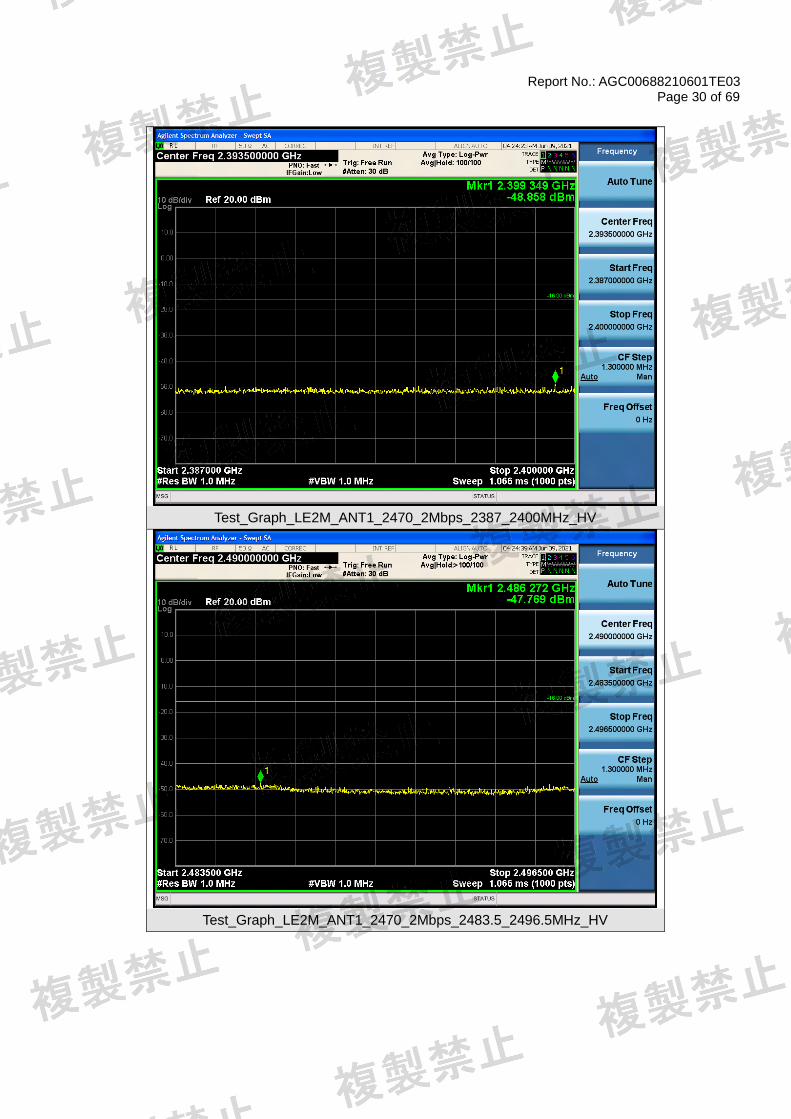
Report No.: AGC00688210601TE03 Page 30 of 69
Test_Graph_LE2M_ANT1_2470_2Mbps_2387_2400MHz_HV
Test_Graph_LE2M_ANT1_2470_2Mbps_2483.5_2496.5MHz_HV

Report No.: AGC00688210601TE03 Page 31 of 69
Test_Graph_LE2M_ANT1_2470_2Mbps_2496.5_12500MHz_HV
Test_Graph_LE2M_ANT1_2405_2Mbps_30_1000MHz_LV

Report No.: AGC00688210601TE03 Page 32 of 69
Test_Graph_LE2M_ANT1_2405_2Mbps_1000_2387MHz_LV
Test_Graph_LE2M_ANT1_2405_2Mbps_2387_2400MHz_LV
Report No.: AGC00688210601TE03 Page 33 of 69
Test_Graph_LE2M_ANT1_2405_2Mbps_2483.5_2496.5MHz_LV
Test_Graph_LE2M_ANT1_2405_2Mbps_2496.5_12500MHz_LV

Report No.: AGC00688210601TE03 Page 34 of 69
Test_Graph_LE2M_ANT1_2430_2Mbps_30_1000MHz_LV
Test_Graph_LE2M_ANT1_2430_2Mbps_1000_2387MHz_LV

Report No.: AGC00688210601TE03 Page 35 of 69
Test_Graph_LE2M_ANT1_2430_2Mbps_2387_2400MHz_LV
Test_Graph_LE2M_ANT1_2430_2Mbps_2483.5_2496.5MHz_LV

Report No.: AGC00688210601TE03 Page 36 of 69
Test_Graph_LE2M_ANT1_2430_2Mbps_2496.5_12500MHz_LV
Test_Graph_LE2M_ANT1_2470_2Mbps_30_1000MHz_LV

Report No.: AGC00688210601TE03 Page 37 of 69
Test_Graph_LE2M_ANT1_2470_2Mbps_1000_2387MHz_LV
Test_Graph_LE2M_ANT1_2470_2Mbps_2387_2400MHz_LV

Report No.: AGC00688210601TE03 Page 38 of 69
Test_Graph_LE2M_ANT1_2470_2Mbps_2483.5_2496.5MHz_LV
Test_Graph_LE2M_ANT1_2470_2Mbps_2496.5_12500MHz_LV

Report No.: AGC00688210601TE03 Page 39 of 69
Test_Graph_LE2M_ANT1_2405_2Mbps_30_1000MHz_NV
Test_Graph_LE2M_ANT1_2405_2Mbps_1000_2387MHz_NV

Report No.: AGC00688210601TE03 Page 40 of 69
Test_Graph_LE2M_ANT1_2405_2Mbps_2387_2400MHz_NV
Test_Graph_LE2M_ANT1_2405_2Mbps_2483.5_2496.5MHz_NV

Report No.: AGC00688210601TE03 Page 41 of 69
Test_Graph_LE2M_ANT1_2405_2Mbps_2496.5_12500MHz_NV
Test_Graph_LE2M_ANT1_2430_2Mbps_30_1000MHz_NV
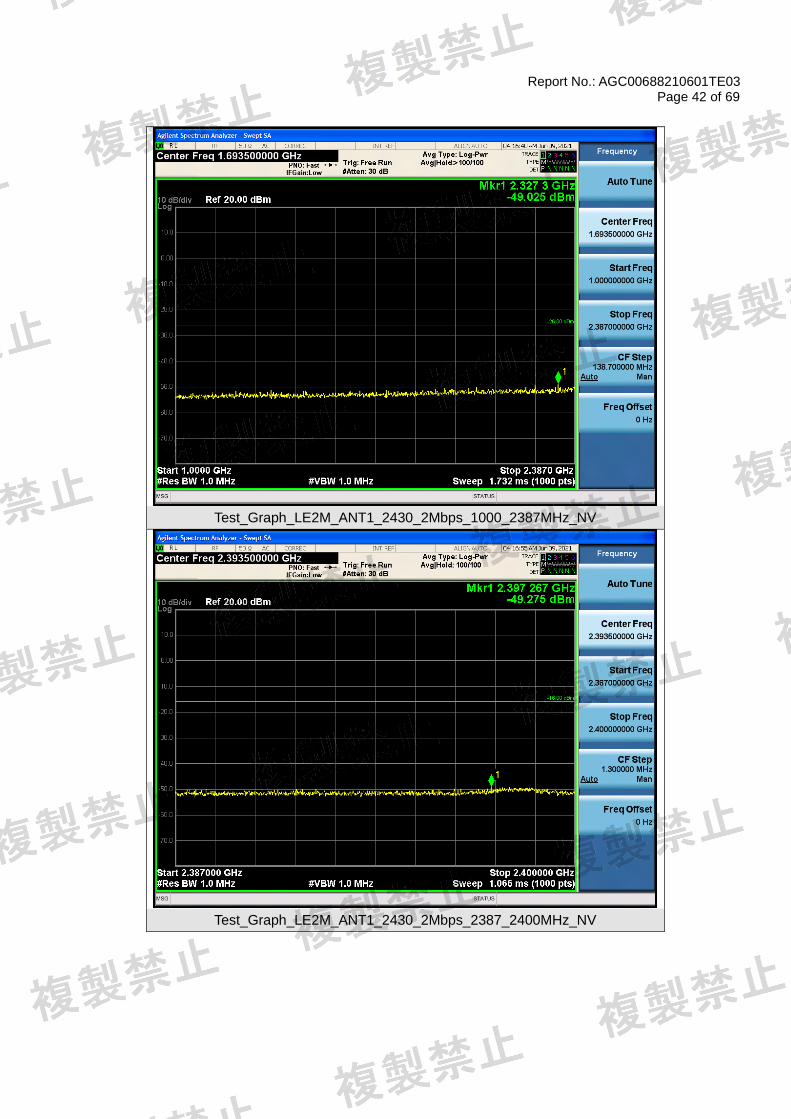
Report No.: AGC00688210601TE03 Page 42 of 69
Test_Graph_LE2M_ANT1_2430_2Mbps_1000_2387MHz_NV
Test_Graph_LE2M_ANT1_2430_2Mbps_2387_2400MHz_NV
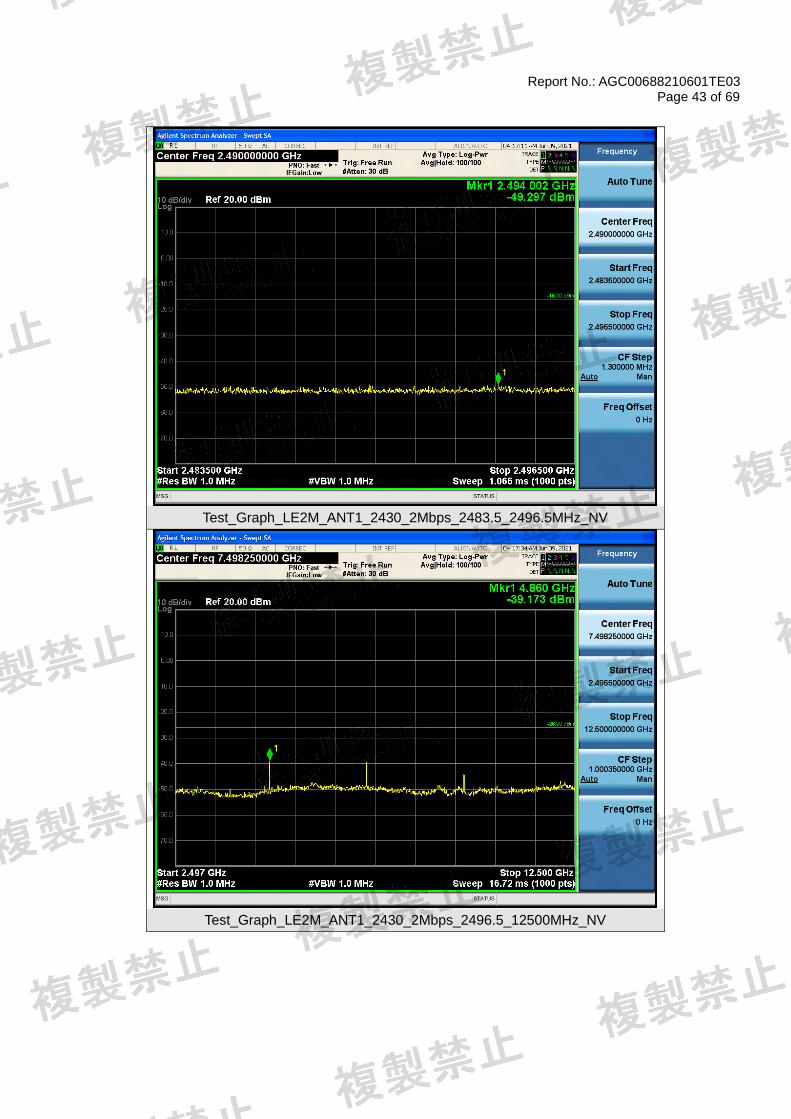
Report No.: AGC00688210601TE03 Page 43 of 69
Test_Graph_LE2M_ANT1_2430_2Mbps_2483.5_2496.5MHz_NV
Test_Graph_LE2M_ANT1_2430_2Mbps_2496.5_12500MHz_NV
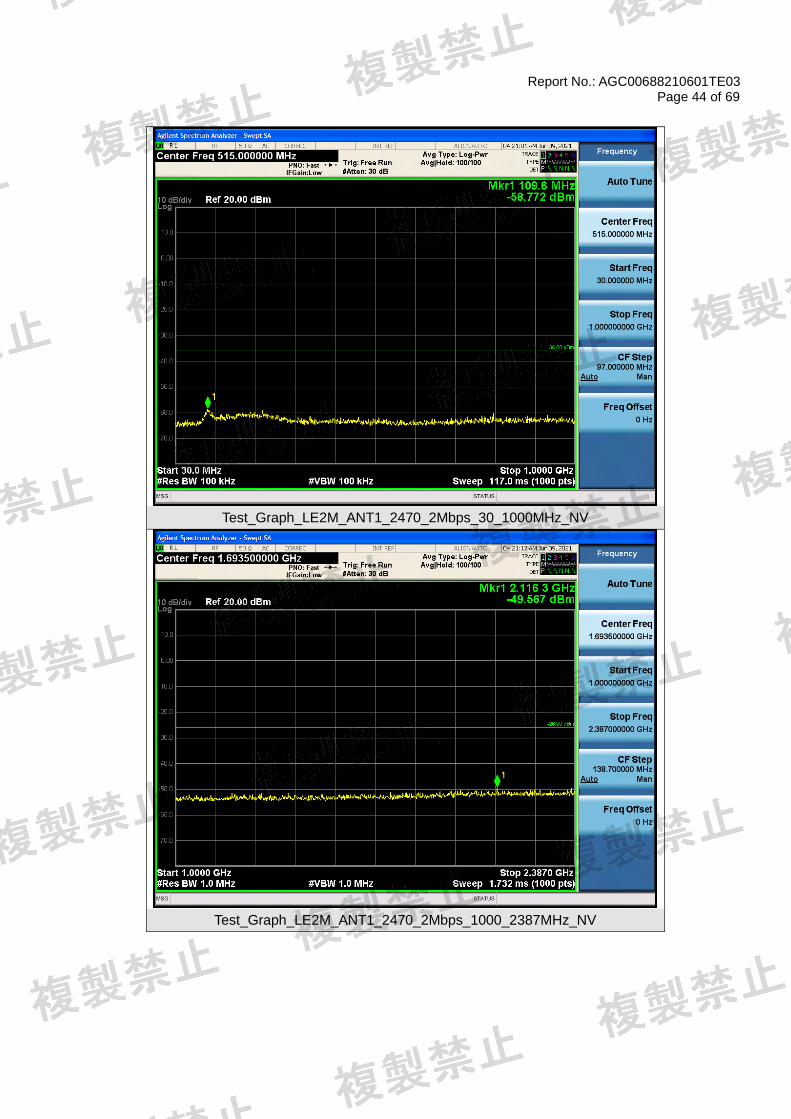
Report No.: AGC00688210601TE03 Page 44 of 69
Test_Graph_LE2M_ANT1_2470_2Mbps_30_1000MHz_NV
Test_Graph_LE2M_ANT1_2470_2Mbps_1000_2387MHz_NV
Report No.: AGC00688210601TE03 Page 45 of 69
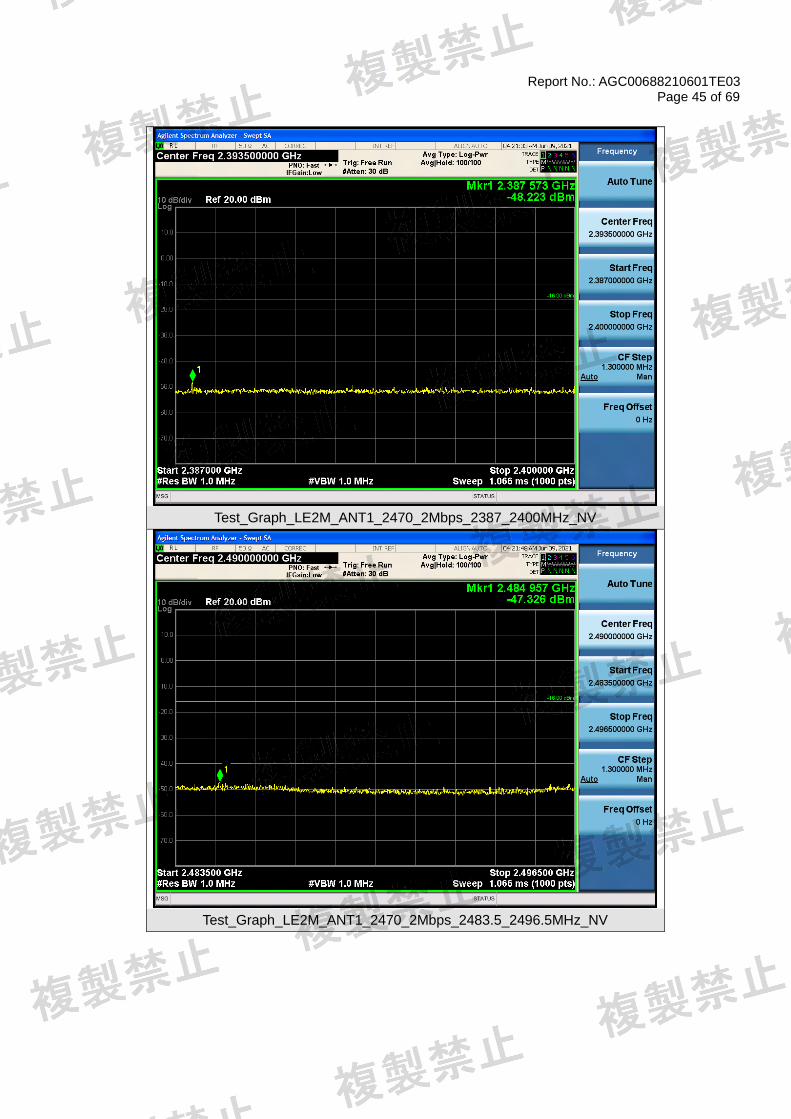
Test_Graph_LE2M_ANT1_2470_2Mbps_2387_2400MHz_NV
Test_Graph_LE2M_ANT1_2470_2Mbps_2483.5_2496.5MHz_NV
Report No.: AGC00688210601TE03 Page 46 of 69
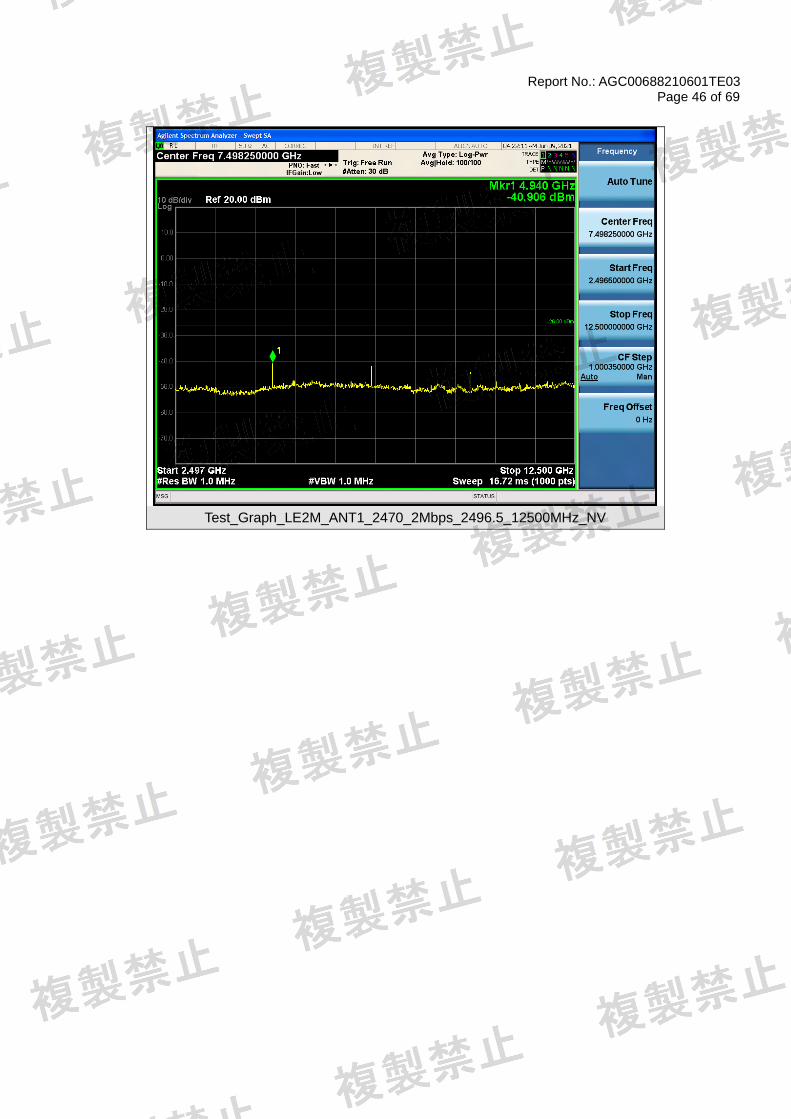
Test_Graph_LE2M_ANT1_2470_2Mbps_2496.5_12500MHz_NV

Report No.: AGC00688210601TE03 Page 47 of 69
5.4. ANTENNA POWER ERROR MEASUREMENT
5.4.1. LIMIT
Item Limits
Antenna Power
Density
≦3mW/MHz (FH system from 2400 to 2483.5MHz)
≦10mW/MHz (FH system from 2400 to 2427MHz and from
2470.75 to 2483.5MHz, OFDM, DS 20MHz system)
≦10mW (Others)
≦5mW for OFDM (40 MHz system)
Antenna Power Error +20%, -80% (Base on manufacturer declare antenna power
density)
5.4.2. MEASURING INSTRUMENTS AND SETTING
The following table is the setting of spectrum analyzer.
Spectrum Parameter Setting
RB / VB 1 MHz
Detector Peak
Trace Max Hold
Sweep Time Auto
5.4.3. TEST PROCEDURES
1. EUT have transmitted continuous maximum power of hopping mode (For FHSS Device). then connected to
the spectrum analyzer
2. Adjust the spectrum analyzer to have the center frequency the same with the
measured carrier. RBW=VBW=1MHz, detector mode is positive peak.
3. Antenna Power Error is definition that actual measure antenna power tolerance
between + 20% to - 80% power range that base on manufacturer declare the
conducted power density.
5.4.4. TEST SETUP LAYOUT
5.4.5. EST DEVIATION
There is no deviation with the original standard.
5.4.6. EUT OPERATION DURING TEST
The EUT was programmed to be in continuously transmitting mode.
Report No.: AGC00688210601TE03 Page 48 of 69
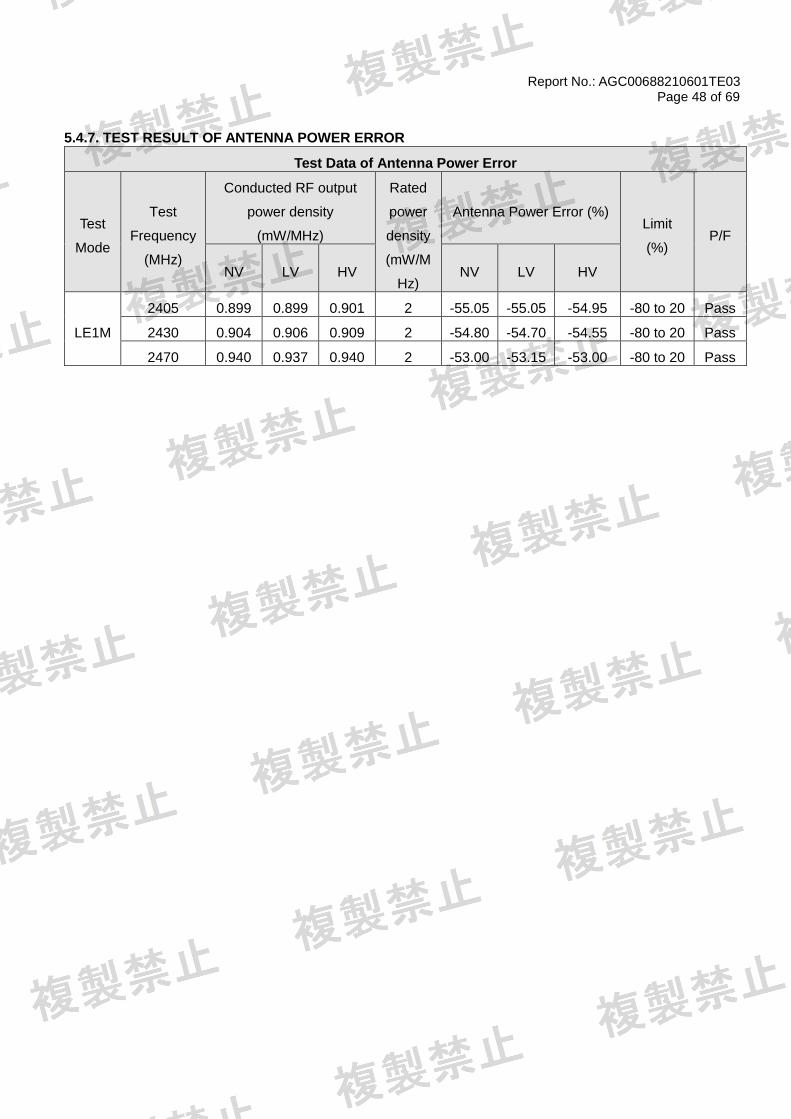
5.4.7. TEST RESULT OF ANTENNA POWER ERROR
Test Data of Antenna Power Error
Test
Mode
Test
Frequency
(MHz)
Conducted RF output
power density
(mW/MHz)
Rated
power
density
(mW/M
Hz)
Antenna Power Error (%) Limit
(%) P/F
NV LV HV NV LV HV
LE1M
2405 0.899 0.899 0.901 2 -55.05 -55.05 -54.95 -80 to 20 Pass
2430 0.904 0.906 0.909 2 -54.80 -54.70 -54.55 -80 to 20 Pass
2470 0.940 0.937 0.940 2 -53.00 -53.15 -53.00 -80 to 20 Pass
Report No.: AGC00688210601TE03 Page 49 of 69
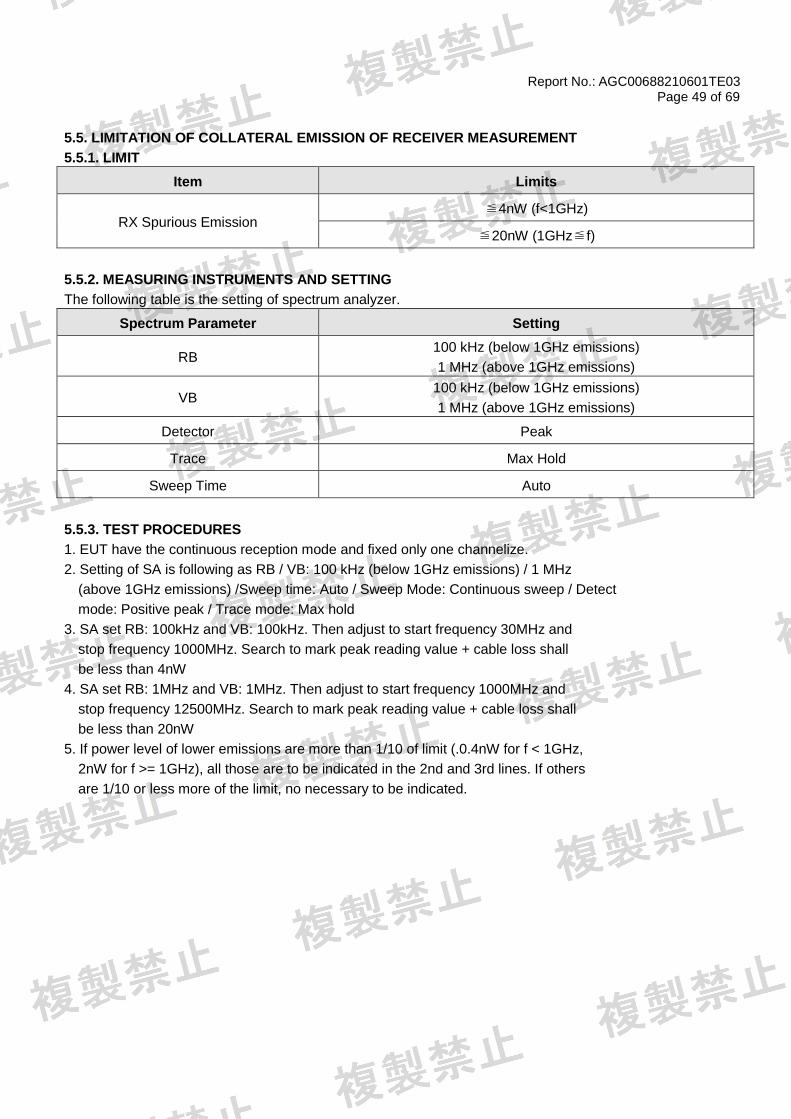
5.5. LIMITATION OF COLLATERAL EMISSION OF RECEIVER MEASUREMENT
5.5.1. LIMIT
Item Limits
RX Spurious Emission ≦4nW (f<1GHz)
≦20nW (1GHz≦f)
5.5.2. MEASURING INSTRUMENTS AND SETTING
The following table is the setting of spectrum analyzer.
Spectrum Parameter Setting
RB 100 kHz (below 1GHz emissions)
1 MHz (above 1GHz emissions)
VB 100 kHz (below 1GHz emissions)
1 MHz (above 1GHz emissions)
Detector Peak
Trace Max Hold
Sweep Time Auto
5.5.3. TEST PROCEDURES
1. EUT have the continuous reception mode and fixed only one channelize.
2. Setting of SA is following as RB / VB: 100 kHz (below 1GHz emissions) / 1 MHz
(above 1GHz emissions) /Sweep time: Auto / Sweep Mode: Continuous sweep / Detect
mode: Positive peak / Trace mode: Max hold
3. SA set RB: 100kHz and VB: 100kHz. Then adjust to start frequency 30MHz and
stop frequency 1000MHz. Search to mark peak reading value + cable loss shall
be less than 4nW
4. SA set RB: 1MHz and VB: 1MHz. Then adjust to start frequency 1000MHz and
stop frequency 12500MHz. Search to mark peak reading value + cable loss shall
be less than 20nW
5. If power level of lower emissions are more than 1/10 of limit (.0.4nW for f < 1GHz,
2nW for f >= 1GHz), all those are to be indicated in the 2nd and 3rd lines. If others
are 1/10 or less more of the limit, no necessary to be indicated.
Report No.: AGC00688210601TE03 Page 50 of 69
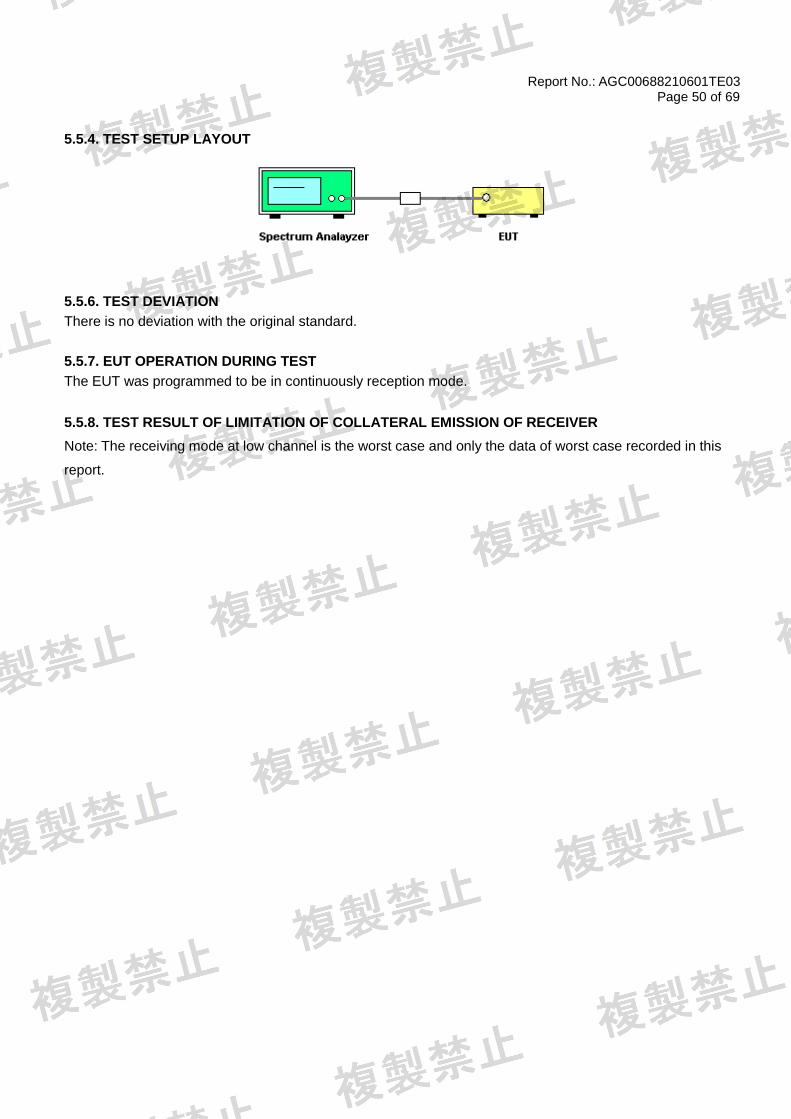
5.5.4. TEST SETUP LAYOUT
5.5.6. TEST DEVIATION
There is no deviation with the original standard.
5.5.7. EUT OPERATION DURING TEST
The EUT was programmed to be in continuously reception mode.
5.5.8. TEST RESULT OF LIMITATION OF COLLATERAL EMISSION OF RECEIVER
Note: The receiving mode at low channel is the worst case and only the data of worst case recorded in this
report.

Report No.: AGC00688210601TE03 Page 51 of 69
Test Graphs of Receiver Spurious
Test_Graph_RX_ANT1_2405_1Mbps_30_1000MHz_HV
Test_Graph_RX_ANT1_2405_1Mbps_1000_12500MHz_HV
Report No.: AGC00688210601TE03 Page 52 of 69
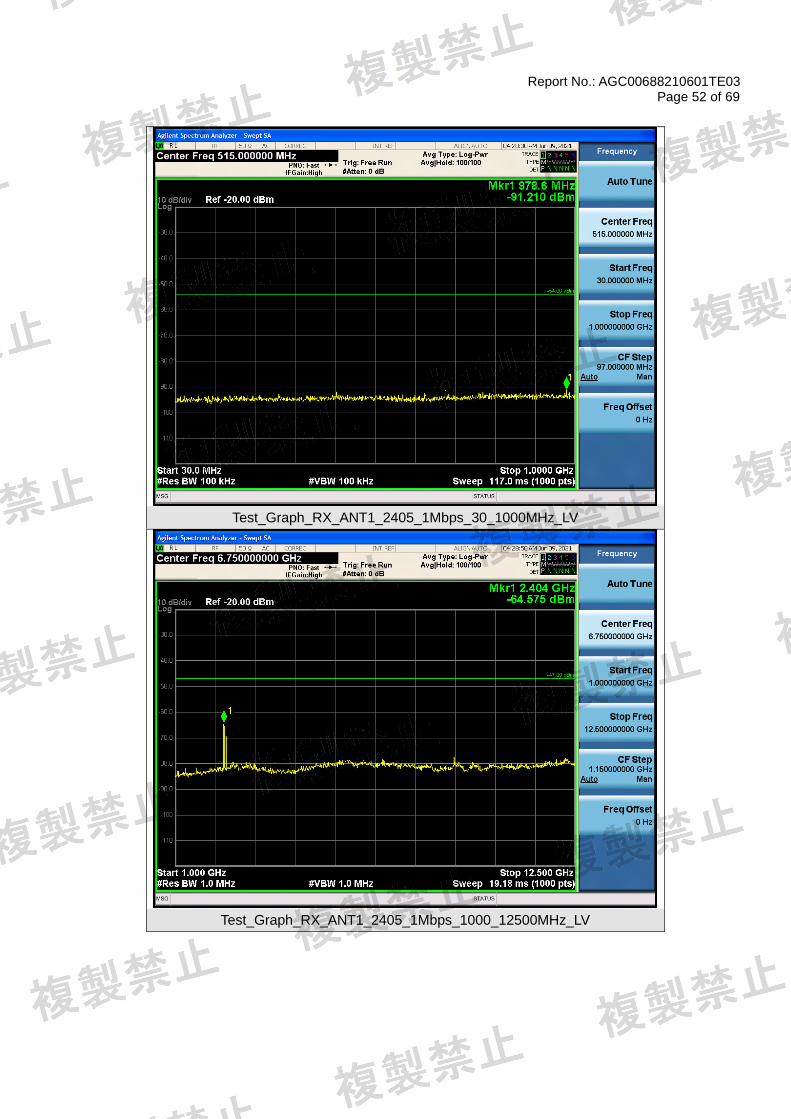
Test_Graph_RX_ANT1_2405_1Mbps_30_1000MHz_LV
Test_Graph_RX_ANT1_2405_1Mbps_1000_12500MHz_LV

Report No.: AGC00688210601TE03 Page 53 of 69
Test_Graph_RX_ANT1_2405_1Mbps_30_1000MHz_NV
Test_Graph_RX_ANT1_2405_1Mbps_1000_12500MHz_NV
Report No.: AGC00688210601TE03 Page 54 of 69
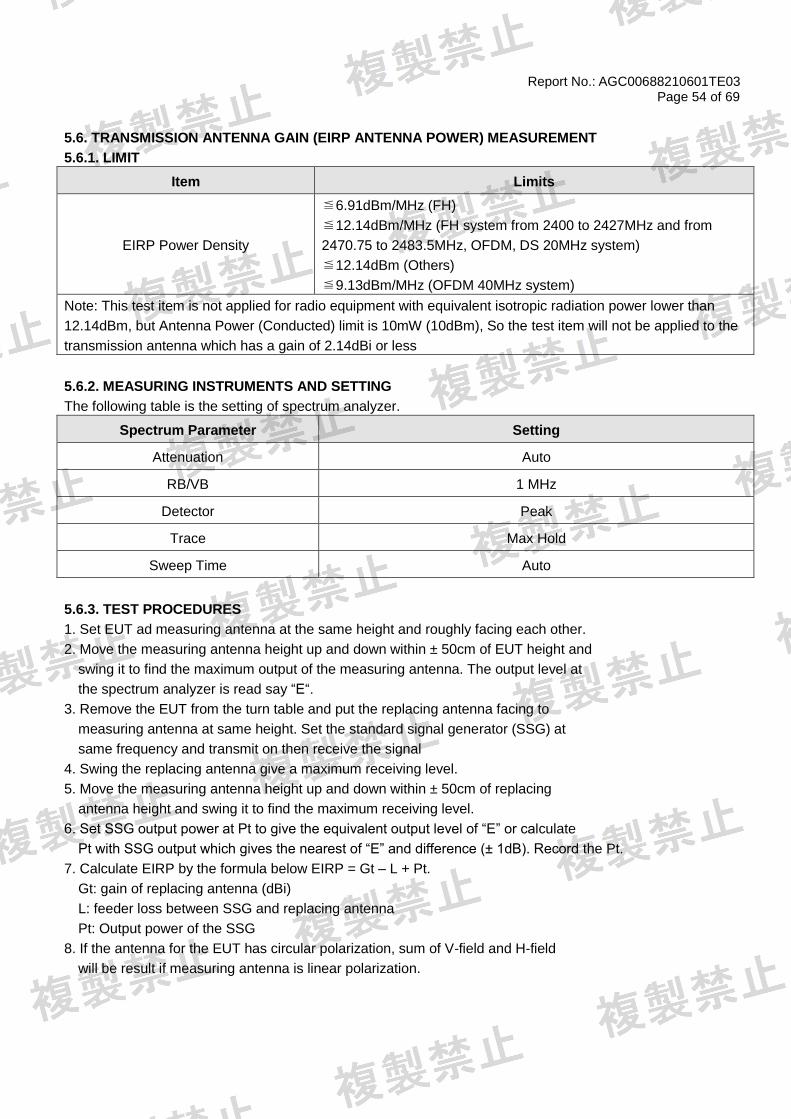
5.6. TRANSMISSION ANTENNA GAIN (EIRP ANTENNA POWER) MEASUREMENT
5.6.1. LIMIT
Item Limits
EIRP Power Density
≦6.91dBm/MHz (FH)
≦12.14dBm/MHz (FH system from 2400 to 2427MHz and from
2470.75 to 2483.5MHz, OFDM, DS 20MHz system)
≦12.14dBm (Others)
≦9.13dBm/MHz (OFDM 40MHz system)
Note: This test item is not applied for radio equipment with equivalent isotropic radiation power lower than
12.14dBm, but Antenna Power (Conducted) limit is 10mW (10dBm), So the test item will not be applied to the
transmission antenna which has a gain of 2.14dBi or less
5.6.2. MEASURING INSTRUMENTS AND SETTING
The following table is the setting of spectrum analyzer.
Spectrum Parameter Setting
Attenuation Auto
RB/VB 1 MHz
Detector Peak
Trace Max Hold
Sweep Time Auto
5.6.3. TEST PROCEDURES
1. Set EUT ad measuring antenna at the same height and roughly facing each other.
2. Move the measuring antenna height up and down within ± 50cm of EUT height and
swing it to find the maximum output of the measuring antenna. The output level at
the spectrum analyzer is read say “E“.
3. Remove the EUT from the turn table and put the replacing antenna facing to
measuring antenna at same height. Set the standard signal generator (SSG) at
same frequency and transmit on then receive the signal
4. Swing the replacing antenna give a maximum receiving level.
5. Move the measuring antenna height up and down within ± 50cm of replacing
antenna height and swing it to find the maximum receiving level.
6. Set SSG output power at Pt to give the equivalent output level of “E” or calculate
Pt with SSG output which gives the nearest of “E” and difference (± 1dB). Record the Pt.
7. Calculate EIRP by the formula below EIRP = Gt – L + Pt.
Gt: gain of replacing antenna (dBi)
L: feeder loss between SSG and replacing antenna
Pt: Output power of the SSG
8. If the antenna for the EUT has circular polarization, sum of V-field and H-field
will be result if measuring antenna is linear polarization.

Report No.: AGC00688210601TE03 Page 55 of 69
5.6.4. TEST SETUP LAYOUT
For EUT radiation measurement
For standard antenna measurement
5.6.5. TEST DEVIATION
There is no deviation with the original standard.
5.6.6. EUT OPERATION DURING TEST
The EUT was programmed to be in continuously transmitting mode.
5.6.7. RESULTS OF TRANSMISSION ANTENNA GAIN
Note: This test item will not be applied to the transmission antenna which has a gain of 2.14dBi or less.
Report No.: AGC00688210601TE03 Page 56 of 69
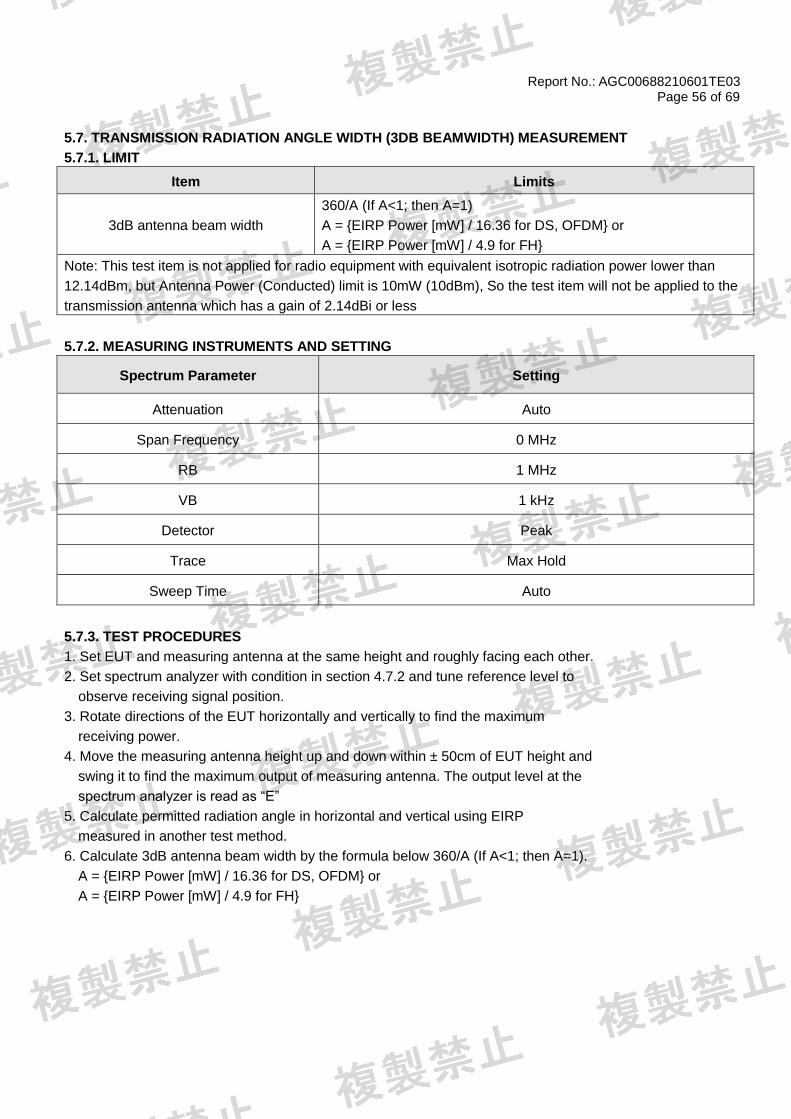
5.7. TRANSMISSION RADIATION ANGLE WIDTH (3DB BEAMWIDTH) MEASUREMENT
5.7.1. LIMIT
Item Limits
3dB antenna beam width
360/A (If A<1; then A=1)
A = {EIRP Power [mW] / 16.36 for DS, OFDM} or
A = {EIRP Power [mW] / 4.9 for FH}
Note: This test item is not applied for radio equipment with equivalent isotropic radiation power lower than
12.14dBm, but Antenna Power (Conducted) limit is 10mW (10dBm), So the test item will not be applied to the
transmission antenna which has a gain of 2.14dBi or less
5.7.2. MEASURING INSTRUMENTS AND SETTING
Spectrum Parameter Setting
Attenuation Auto
Span Frequency 0 MHz
RB 1 MHz
VB 1 kHz
Detector Peak
Trace Max Hold
Sweep Time Auto
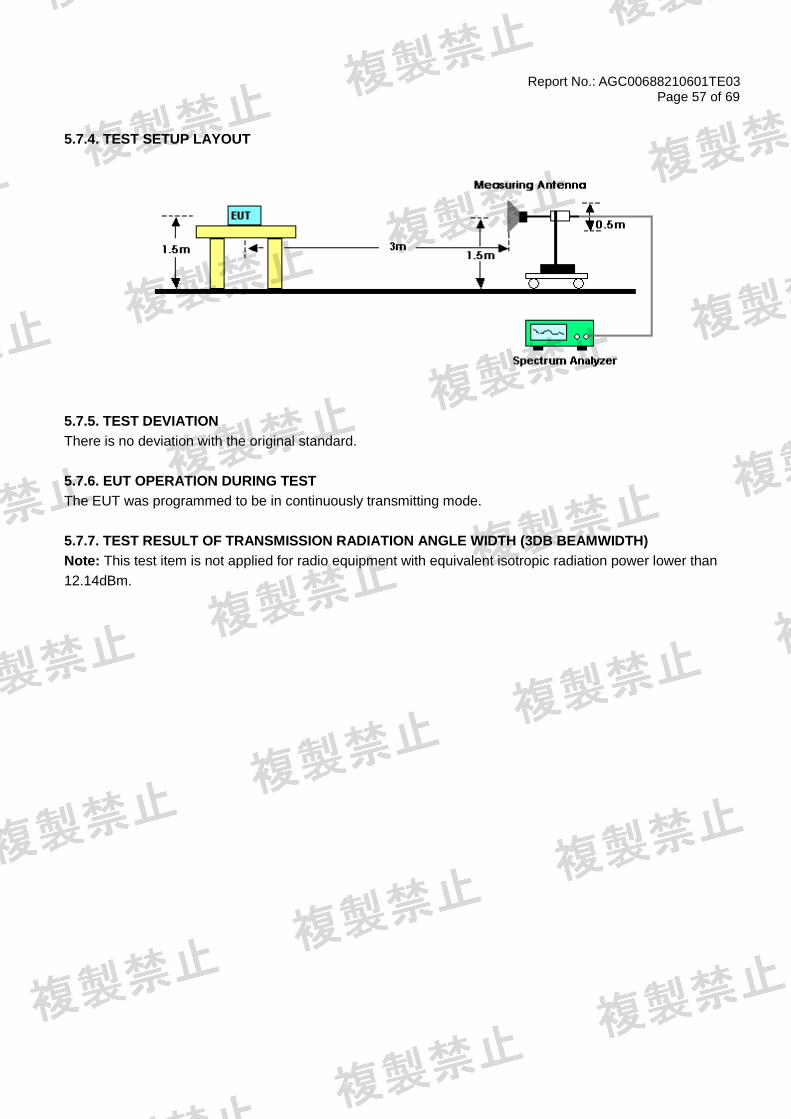
5.7.3. TEST PROCEDURES
1. Set EUT and measuring antenna at the same height and roughly facing each other.
2. Set spectrum analyzer with condition in section 4.7.2 and tune reference level to
observe receiving signal position.
3. Rotate directions of the EUT horizontally and vertically to find the maximum
receiving power.
4. Move the measuring antenna height up and down within ± 50cm of EUT height and
swing it to find the maximum output of measuring antenna. The output level at the
spectrum analyzer is read as “E”
5. Calculate permitted radiation angle in horizontal and vertical using EIRP
measured in another test method.
6. Calculate 3dB antenna beam width by the formula below 360/A (If A<1; then A=1).
A = {EIRP Power [mW] / 16.36 for DS, OFDM} or
A = {EIRP Power [mW] / 4.9 for FH}
Report No.: AGC00688210601TE03 Page 57 of 69
5.7.4. TEST SETUP LAYOUT
5.7.5. TEST DEVIATION
There is no deviation with the original standard.
5.7.6. EUT OPERATION DURING TEST
The EUT was programmed to be in continuously transmitting mode.
5.7.7. TEST RESULT OF TRANSMISSION RADIATION ANGLE WIDTH (3DB BEAMWIDTH)
Note: This test item is not applied for radio equipment with equivalent isotropic radiation power lower than
12.14dBm.
Report No.: AGC00688210601TE03 Page 58 of 69
5.8. RADIO INTERFERENCE PREVENTION CAPABILITY MEASUREMENT
5.8.1. LIMIT
Item Limits
Identification code ≧48 bits
5.8.2. MEASURING ID CODE SOFTWARE
Item Limits
MAC IP List MAC Scan
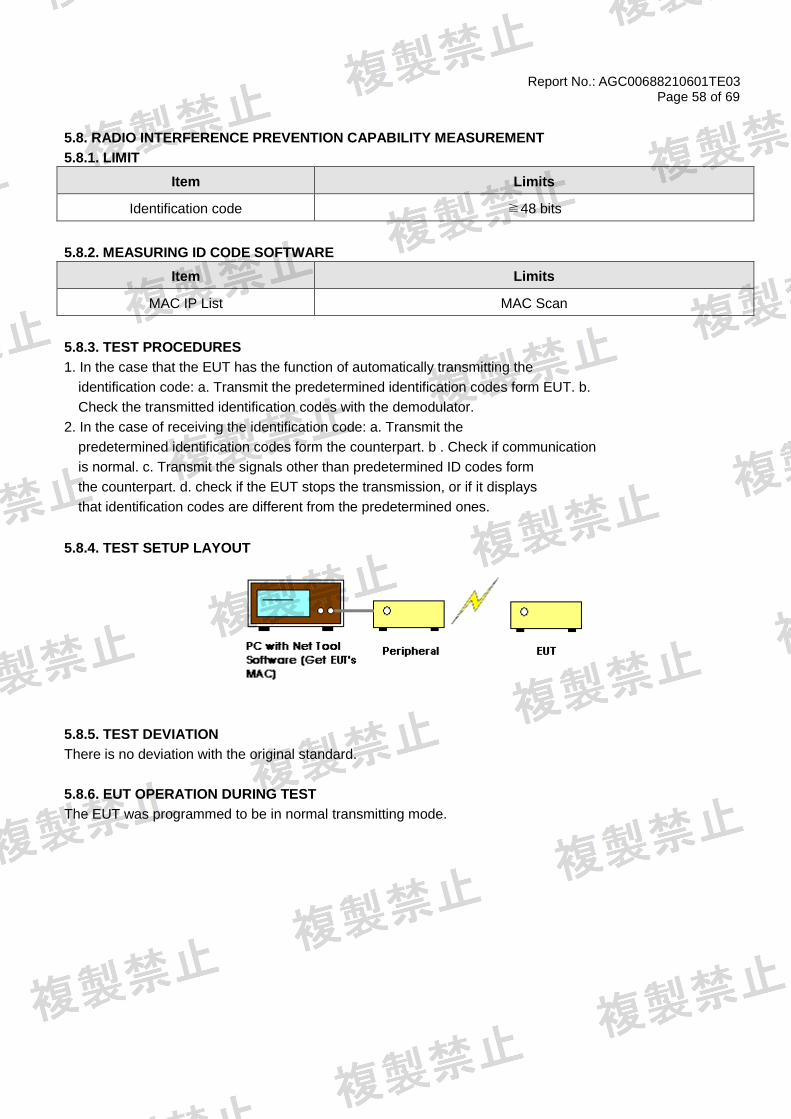
5.8.3. TEST PROCEDURES
1. In the case that the EUT has the function of automatically transmitting the
identification code: a. Transmit the predetermined identification codes form EUT. b.
Check the transmitted identification codes with the demodulator.
2. In the case of receiving the identification code: a. Transmit the
predetermined identification codes form the counterpart. b . Check if communication
is normal. c. Transmit the signals other than predetermined ID codes form
the counterpart. d. check if the EUT stops the transmission, or if it displays
that identification codes are different from the predetermined ones.
5.8.4. TEST SETUP LAYOUT
5.8.5. TEST DEVIATION
There is no deviation with the original standard.
5.8.6. EUT OPERATION DURING TEST
The EUT was programmed to be in normal transmitting mode.

Report No.: AGC00688210601TE03 Page 59 of 69
5.8.7. TEST RESULT OF RADIO INTERFERENCE PREVENTION CAPABILITY
Test result of radio interference prevention capability
Item MAC address Test result
Identification code VID:2841 PID:8637 Good
Report No.: AGC00688210601TE03 Page 60 of 69
5.9 CONSTRUCTION PROTECTION CONFIRMATION METHOD
5.9.1. LIMIT
The high-frequency section and modulation section of the radio equipment except for
the antenna system shall not be capable of being opened easily.
5.9.2. CONFIRMATION METHOD
The RF and modulation portions are protected against illegal modification as following method:
Protected Method Description
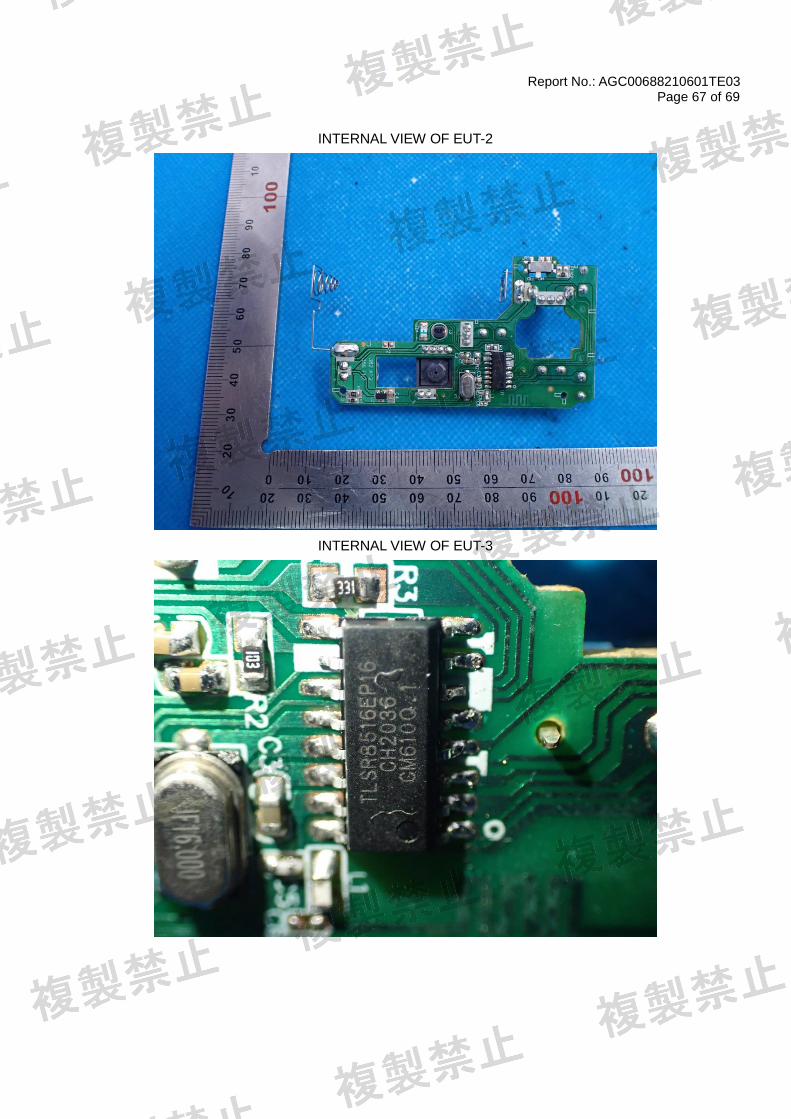
Module Package Module Package of RF (TLSR8516) and Modulation (TX:16 MHz) portions is SMT type.
Enclosure The enclosure is sealed by ultrasonic welding and it cannot be opened
easily. Otherwise, the device will be damaged.
User Manual we will add some warning statements on the user manual to against
illegal modification.
Report No.: AGC00688210601TE03 Page 61 of 69
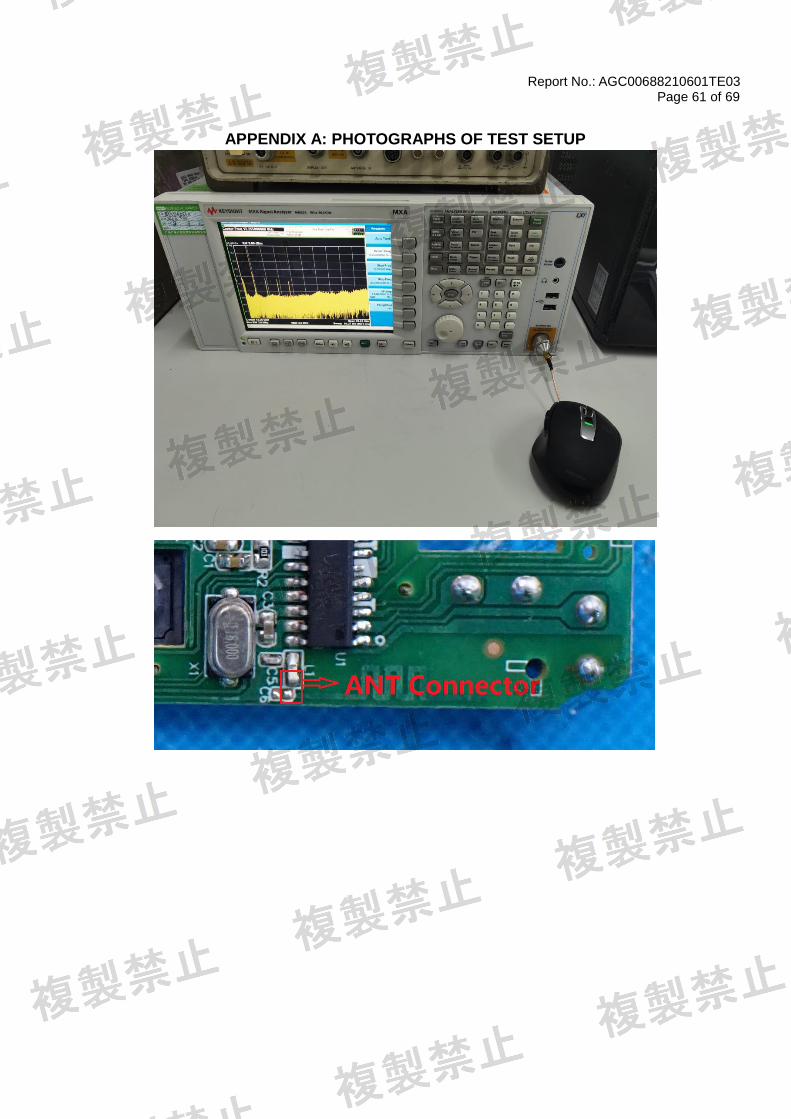
APPENDIX A: PHOTOGRAPHS OF TEST SETUP

Report No.: AGC00688210601TE03 Page 62 of 69
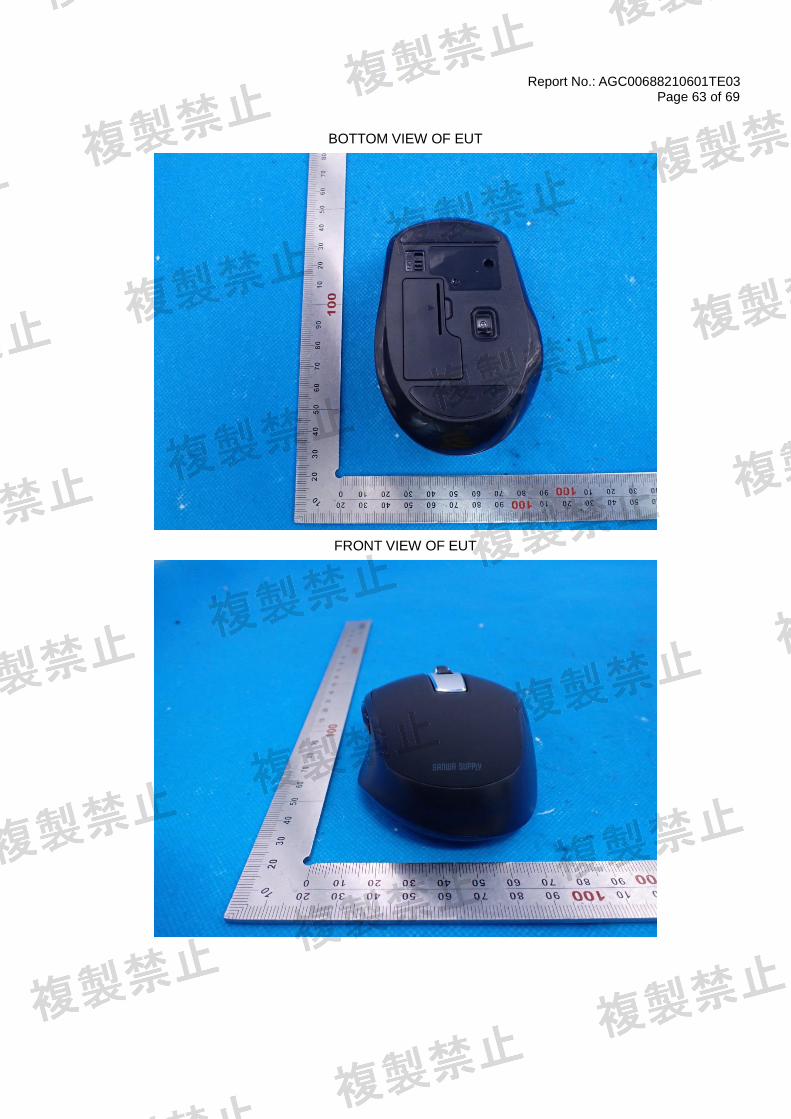
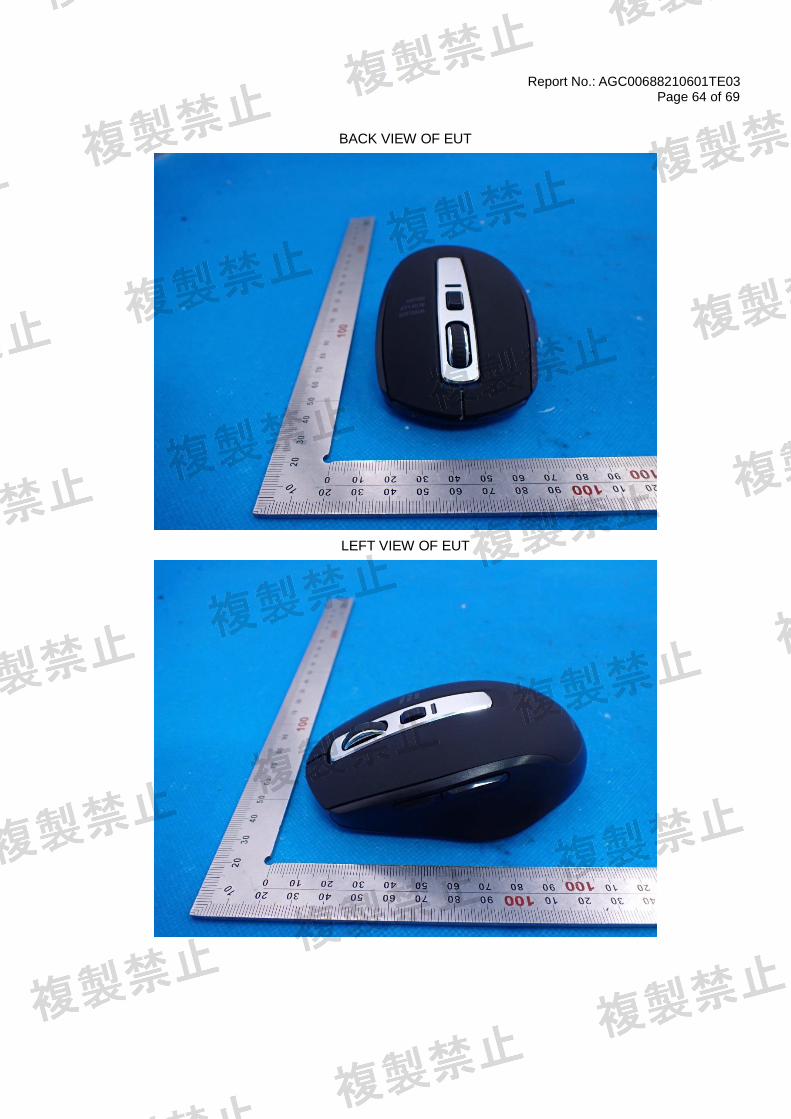
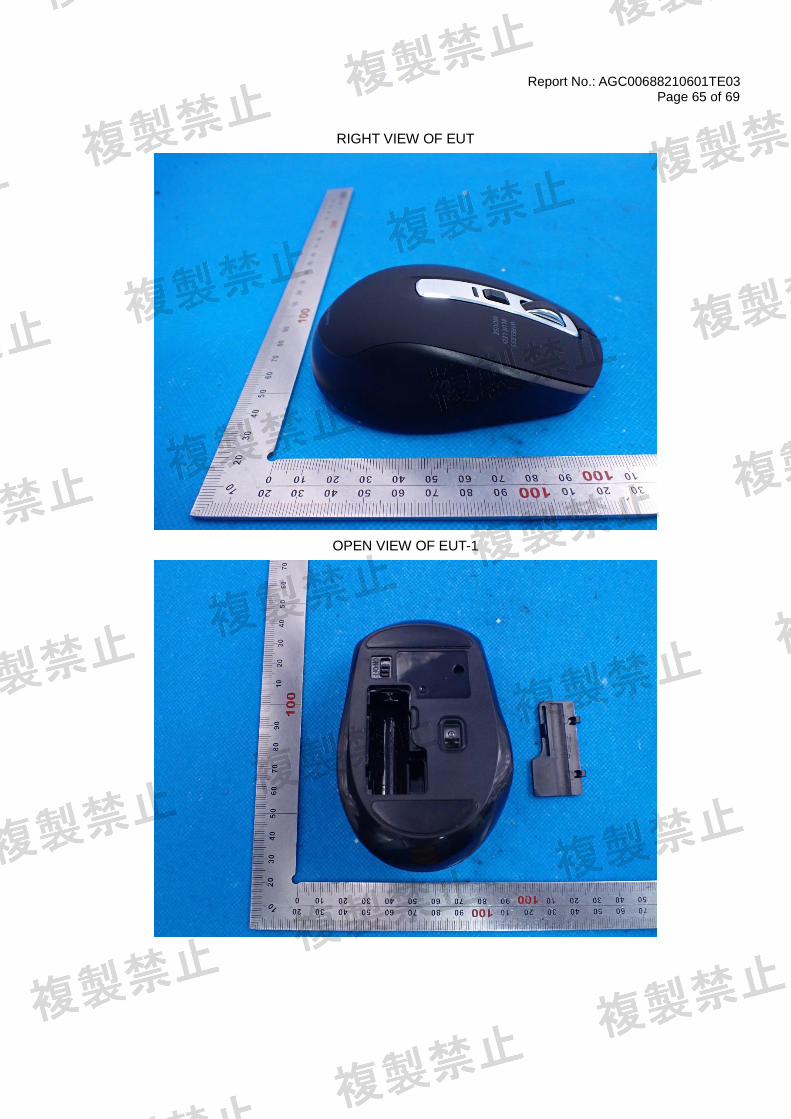
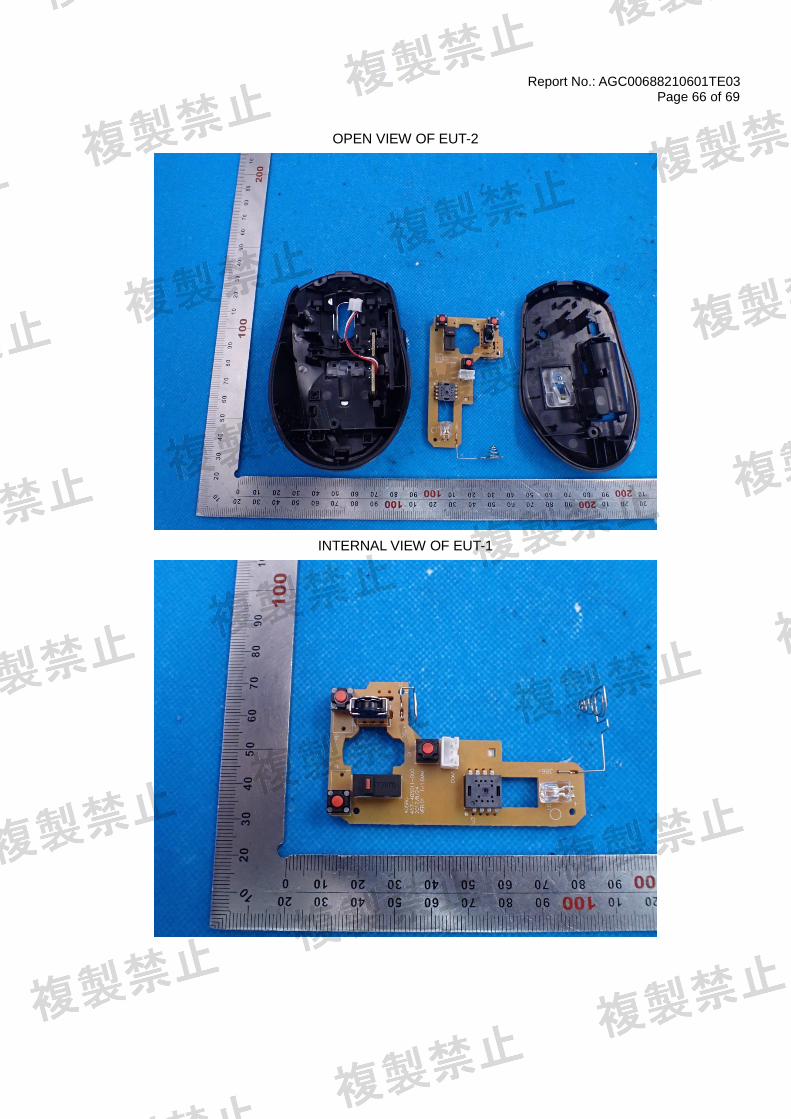
APPENDIX B: PHOTOGRAPHS OF EUT
WHOLE VIEW OF EUT
TOP VIEW OF EUT
Report No.: AGC00688210601TE03 Page 63 of 69
BOTTOM VIEW OF EUT
FRONT VIEW OF EUT
Report No.: AGC00688210601TE03 Page 64 of 69
BACK VIEW OF EUT
LEFT VIEW OF EUT
Report No.: AGC00688210601TE03 Page 65 of 69
RIGHT VIEW OF EUT
OPEN VIEW OF EUT-1
Report No.: AGC00688210601TE03 Page 66 of 69
OPEN VIEW OF EUT-2
INTERNAL VIEW OF EUT-1
Report No.: AGC00688210601TE03 Page 67 of 69
INTERNAL VIEW OF EUT-2
INTERNAL VIEW OF EUT-3
Report No.: AGC00688210601TE03 Page 68 of 69
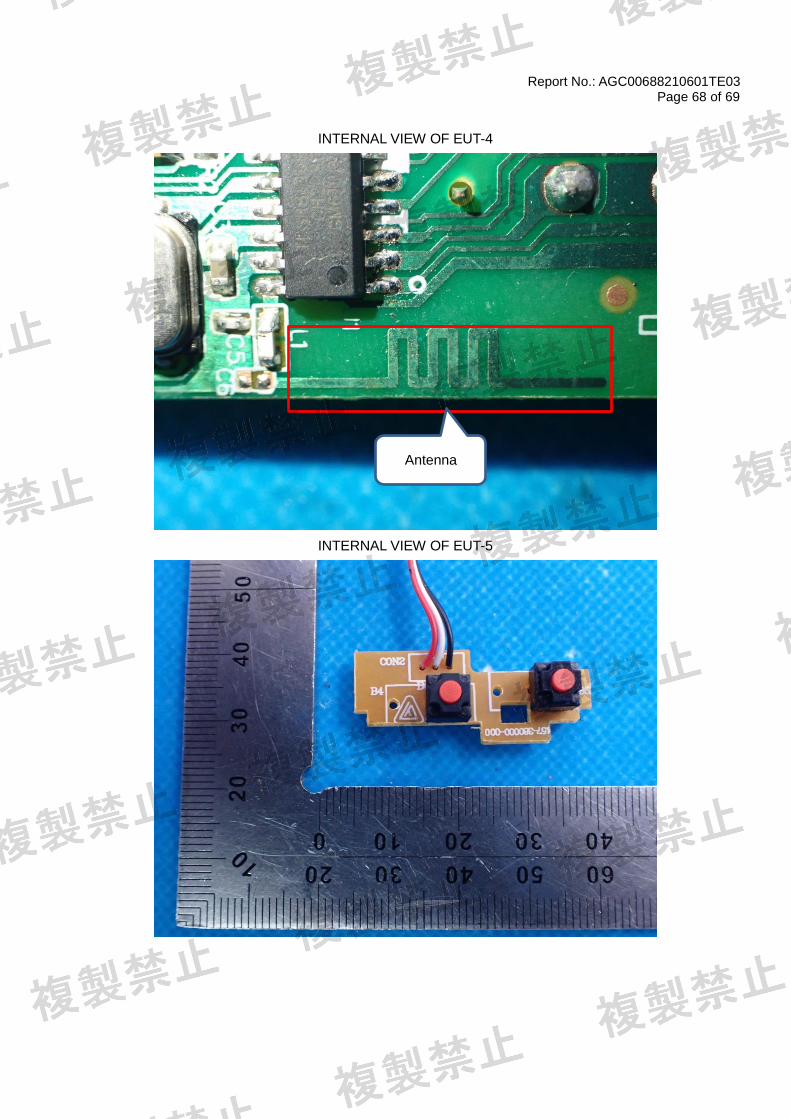
INTERNAL VIEW OF EUT-4
INTERNAL VIEW OF EUT-5
Antenna
Report No.: AGC00688210601TE03 Page 69 of 69
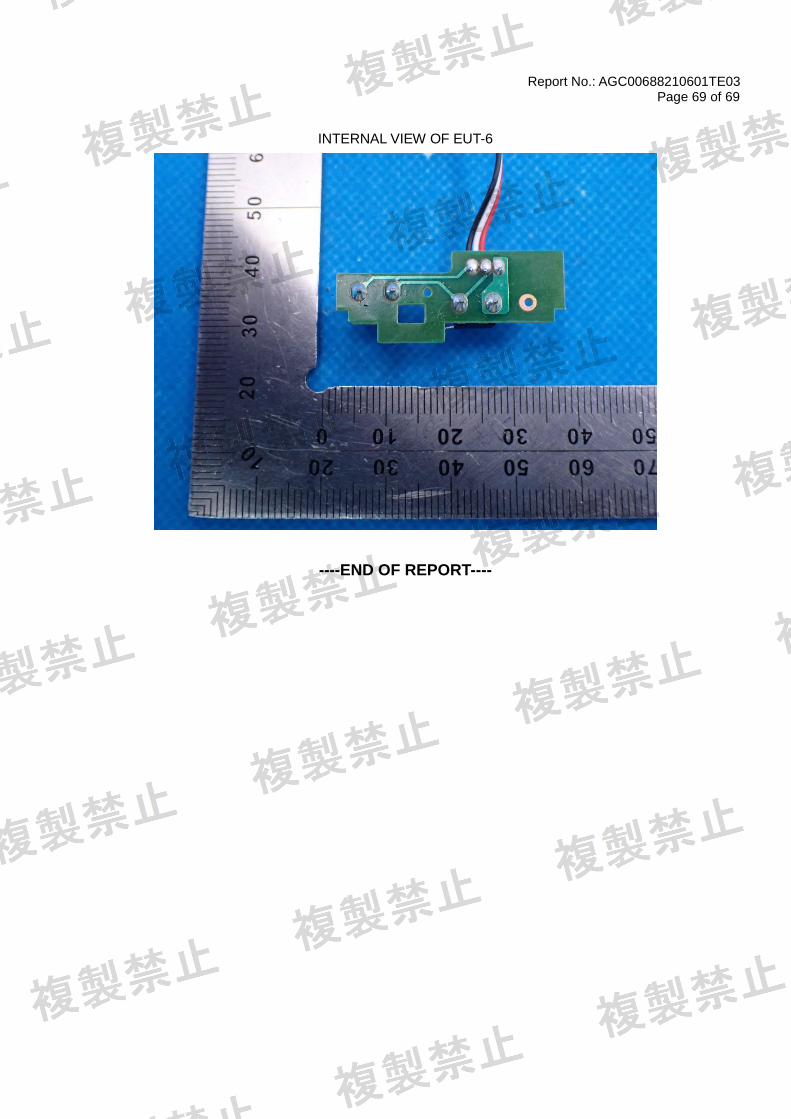
INTERNAL VIEW OF EUT-6
----END OF REPORT----