Embed Size (px)
Citation preview

J A N U A R Y 2 0 1 8
BUSINESS AVIATION 2017 REVIEW

It will also include TRAQPak’s prestigious quarterly forecast.
1
This review will look at flight activity for the overall industry, the individual industry
segments & aircraft categories, and it will review top operators & other key metrics.
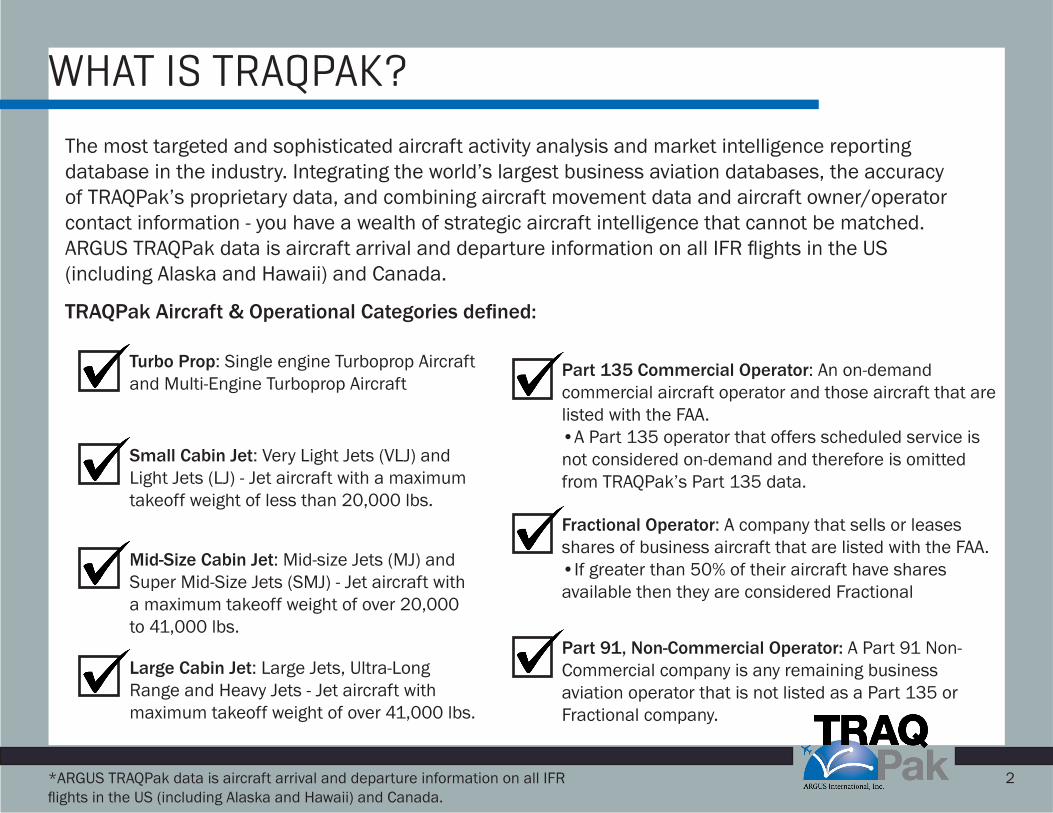
The most targeted and sophisticated aircraft activity analysis and market intelligence reporting database in the industry. Integrating the world’s largest business aviation databases, the accuracy of TRAQPak’s proprietary data, and combining aircraft movement data and aircraft owner/operator contact information - you have a wealth of strategic aircraft intelligence that cannot be matched. ARGUS TRAQPak data is aircraft arrival and departure information on all IFR flights in the US (including Alaska and Hawaii) and Canada.
TRAQPak Aircraft & Operational Categories defined:
2*ARGUS TRAQPak data is aircraft arrival and departure information on all IFRflights in the US (including Alaska and Hawaii) and Canada.
WHAT IS TRAQPAK?
Part 135 Commercial Operator: An on-demand commercial aircraft operator and those aircraft that are listed with the FAA.•A Part 135 operator that offers scheduled service isnot considered on-demand and therefore is omittedfrom TRAQPak’s Part 135 data.
Fractional Operator: A company that sells or leases shares of business aircraft that are listed with the FAA.•If greater than 50% of their aircraft have sharesavailable then they are considered Fractional
Part 91, Non-Commercial Operator: A Part 91 Non-Commercial company is any remaining business aviation operator that is not listed as a Part 135 or Fractional company.
Turbo Prop: Single engine Turboprop Aircraft and Multi-Engine Turboprop Aircraft
Small Cabin Jet: Very Light Jets (VLJ) and Light Jets (LJ) - Jet aircraft with a maximum takeoff weight of less than 20,000 lbs.
Mid-Size Cabin Jet: Mid-size Jets (MJ) and Super Mid-Size Jets (SMJ) - Jet aircraft with a maximum takeoff weight of over 20,000 to 41,000 lbs.
Large Cabin Jet: Large Jets, Ultra-Long Range and Heavy Jets - Jet aircraft with maximum takeoff weight of over 41,000 lbs.
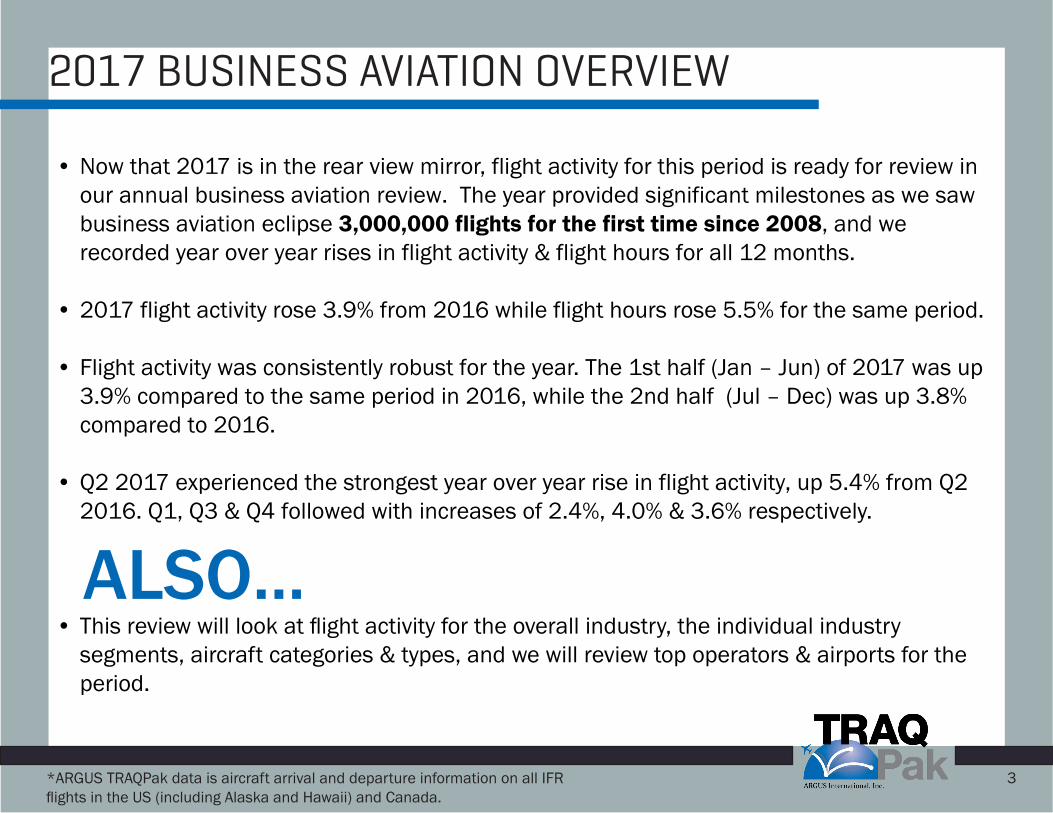
• Now that 2017 is in the rear view mirror, flight activity for this period is ready for review inour annual business aviation review. The year provided significant milestones as we sawbusiness aviation eclipse 3,000,000 flights for the first time since 2008, and werecorded year over year rises in flight activity & flight hours for all 12 months.
• 2017 flight activity rose 3.9% from 2016 while flight hours rose 5.5% for the same period.
• Flight activity was consistently robust for the year. The 1st half (Jan – Jun) of 2017 was up3.9% compared to the same period in 2016, while the 2nd half (Jul – Dec) was up 3.8%compared to 2016.
• Q2 2017 experienced the strongest year over year rise in flight activity, up 5.4% from Q22016. Q1, Q3 & Q4 followed with increases of 2.4%, 4.0% & 3.6% respectively.
• This review will look at flight activity for the overall industry, the individual industrysegments, aircraft categories & types, and we will review top operators & airports for theperiod.
ALSO...
3*ARGUS TRAQPak data is aircraft arrival and departure information on all IFRflights in the US (including Alaska and Hawaii) and Canada.
2017 BUSINESS AVIATION OVERVIEW
*ARGUS TRAQPak data is aircraft arrival and departure information on all IFRflights in the US (including Alaska and Hawaii) and Canada.
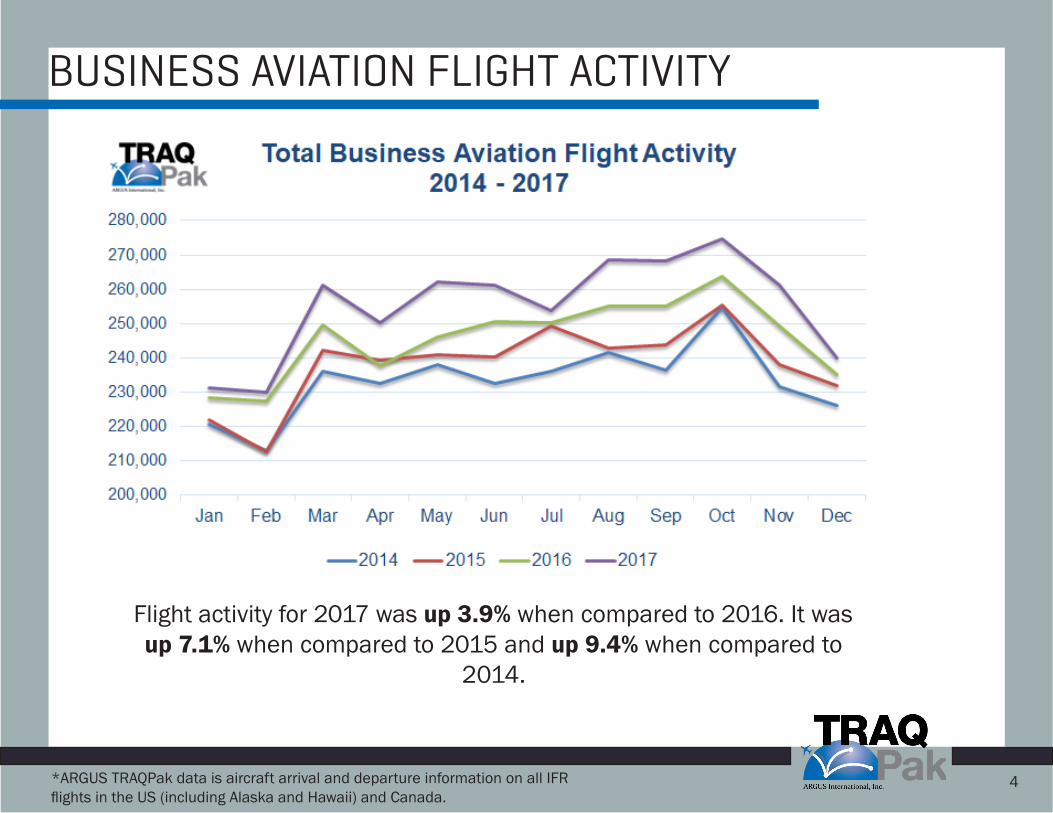
Flight activity for 2017 was up 3.9% when compared to 2016. It was up 7.1% when compared to 2015 and up 9.4% when compared to
2014.
4
BUSINESS AVIATION FLIGHT ACTIVITY

*ARGUS TRAQPak data is aircraft arrival and departure information on all IFRflights in the US (including Alaska and Hawaii) and Canada.
5
FLIGHT ACTIVITY BY INDUSTRY SEGMENT
*Note- for purposes of this report, FAR Part 135 flight data represents all flight activity of aircraft on a Part 135 chartercertificate regardless of individual flight mission (excluding cargo, scheduled Part 135, and fractional operators)

*ARGUS TRAQPak data is aircraft arrival and departure information on all IFRflights in the US (including Alaska and Hawaii) and Canada.
6
PART 91 FLIGHT ACTIVITY COMPARISON

7*ARGUS TRAQPak data is aircraft arrival and departure information on all IFRflights in the US (including Alaska and Hawaii) and Canada.
PART 91 INDUSTRY TRENDS IN 2017
PART 91flights and flight hours grew 0.1%
& 1.6% respectively in the past 12 months, when compared to 2016.
LARGE CABINPart 91 flight hours increased 4.3% in 2017. Mid-size & small cabin Part 91 flight hours grew at a rate of 1.8% &
0.7% during the year.
TURBOPROPflight hours saw a slight increase
0.3% during 2017.
PART 91operators flew 2,270,778 hours over
the last 12 months; that represents an increase of 35,799 hours over 2016.

8*ARGUS TRAQPak data is aircraft arrival and departure information on all IFRflights in the US (including Alaska and Hawaii) and Canada.
PART 135 FLIGHT ACTIVITY COMPARISON
*Note- for purposes of this report, FAR Part 135 flight data represents all flight activity of aircraft on a Part 135 chartercertificate regardless of individual flight mission (excluding cargo, scheduled Part 135, and fractional operators)

9*ARGUS TRAQPak data is aircraft arrival and departure information on all IFRflights in the US (including Alaska and Hawaii) and Canada.
PART 135 INDUSTRY TRENDS IN 2017
PART 135on-demand charter flights & flight hours grew 9.2% & 11.4% respectively in the
past 12 months, when compared to 2016.
LARGE CABINPart 135 flight hours grew 17.3% in 2017. Mid-size Part 135 flight hours
grew at a rate of 13.8% during the year, and small cabin aircraft grew 5.8%.
TURBOPROPflight hours increased 9.0% during
2017.
PART 135operators flew 1,574,554 hours over
the last 12 months; that represents an increase of 160,684 hours over 2016.
*Note- for purposes of this report, FAR Part 135 flight data represents all flight activity of aircraft on a Part 135 chartercertificate regardless of individual flight mission (excluding cargo, scheduled Part 135, and fractional operators)
10*ARGUS TRAQPak data is aircraft arrival and departure information on all IFRflights in the US (including Alaska and Hawaii) and Canada.
FRACTIONAL FLIGHT ACTIVITY COMPARISON

11*ARGUS TRAQPak data is aircraft arrival and departure information on all IFRflights in the US (including Alaska and Hawaii) and Canada.
FRACTIONAL INDUSTRY TRENDS IN 2017
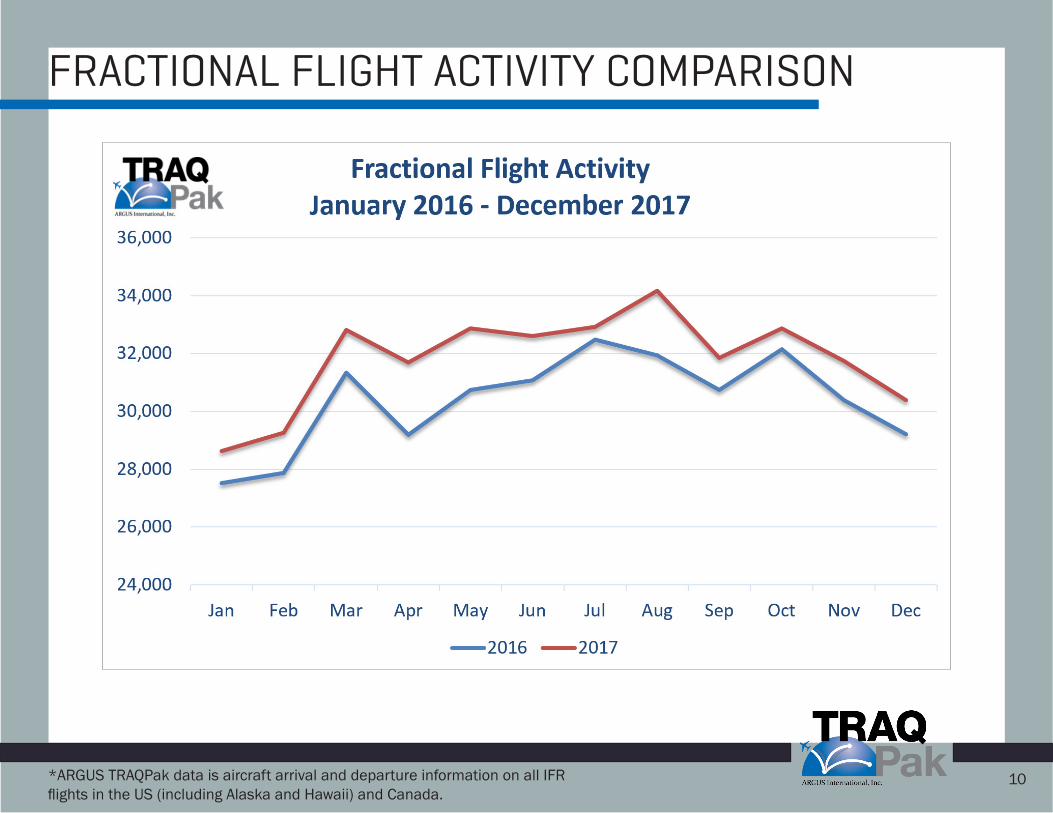
FRACTIONALflights & flight hours grew 4.7% & 6.7%
respectively in the past 12 months, when compared to 2016.
LARGE CABINfractional flight hours saw an increase of 7.0% in 2017. Mid-size flight hours
increased 5.7% while small cabin flight hours increased 8.9% during the year.
TURBOPROPflight hours increased 6.8% during
2017.
FRACTIONALoperators flew 570,131 hours over the
last 12 months; that represents an increase of 35,647 hours over 2016.

12*ARGUS TRAQPak data is aircraft arrival and departure information on all IFRflights in the US (including Alaska and Hawaii) and Canada.
FLIGHT HOURS BY AIRCRAFT CATEGORY

TURBOPROP FLIGHT ACTIVITY COMPARISON
*ARGUS TRAQPak data is aircraft arrival and departure information on all IFRflights in the US (including Alaska and Hawaii) and Canada.
13
2017 turboprop flight activity saw an increase of 2.6% from 2016. Q2 2017 was the strongest period for turboprop flight activity, up 4.1% from Q2 2016.

14*ARGUS TRAQPak data is aircraft arrival and departure information on all IFRflights in the US (including Alaska and Hawaii) and Canada.
SMALL CABIN FLIGHT ACTIVITY COMPARISON
2017 small cabin flight activity was up 2.1% from 2016. Q3 2017 was the best quarter for small cabin, up 3.0% from the respective quarter in 2016

15*ARGUS TRAQPak data is aircraft arrival and departure information on all IFRflights in the US (including Alaska and Hawaii) and Canada.
MID-SIZE CABIN FLIGHT ACTIVITY COMPARISON
2017 mid-size cabin flight activity increased 5.4% from 2016. Q2 2017 was the best performing quarter for mid-size aircraft, up 7.7% from Q2 2016.

16*ARGUS TRAQPak data is aircraft arrival and departure information on all IFRflights in the US (including Alaska and Hawaii) and Canada.
LARGE CABIN FLIGHT ACTIVITY COMPARISON
Large cabin flight activity saw another year of significant increases in 2017, up 6.8% from 2016. Q2 2017 was the best performing quarter for large cabin
aircraft, up 8.0% from Q2 2016.

17*ARGUS TRAQPak data is aircraft arrival and departure information on all IFRflights in the US (including Alaska and Hawaii) and Canada.
TOP US PART 135 OPERATORS IN 2017
*Note- 2017 Fleet Size based on DO85 dated January 2, 2018*Note- 2016 Fleet Size based on DO85 dated January 4, 2017
*Note- Excludes Medical Flights*Note- Landmark Aviation includes TWC Aviation & Sterling Aviation
*Note- for purposes of this report, FAR Part 135 flight data represents all flight activity of aircraft on a Part 135 chartercertificate regardless of individual flight mission (excluding cargo, scheduled Part 135, and fractional operators)

18*ARGUS TRAQPak data is aircraft arrival and departure information on all IFRflights in the US (including Alaska and Hawaii) and Canada.
TOP FRACTIONAL OPERATORS IN 2017
19*ARGUS TRAQPak data is aircraft arrival and departure information on all IFRflights in the US (including Alaska and Hawaii) and Canada.
TOP 25 US AIRPORTS IN 2017
*Note- New York- KTEB, KMMU, KHPN, KLGA, KJFK,KEWR, KCDW, KFRG
*Note- South Florida- KFLL, KFXE, KBCT, KMIA, KPBI,KPMP, KOPF, KHWO, KTMB
*Note- Los Angeles- KVNY, KLAX, KSNA, KLGB, KHHR,KSMO, KBUR, KFUL, KTOA
*Note- Dallas- KDAL, KDFW, KADS, KGKY, KFTW, KAFW,KRBD
*Note- Chicago- KPWK, KUGN, KDPA, KMDW, KORD,KGYY
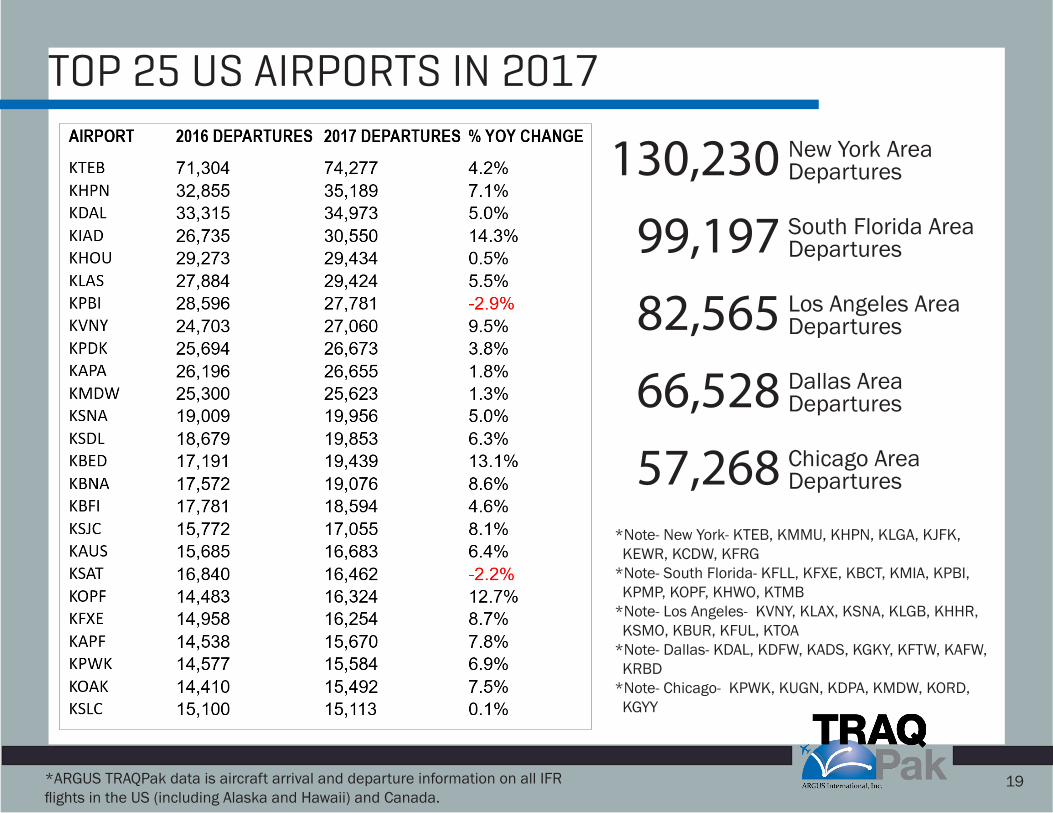
130,230 New York AreaDepartures
99,197 South Florida AreaDepartures
57,268 Chicago AreaDepartures
66,528 Dallas AreaDepartures
82,565 Los Angeles AreaDepartures

20*ARGUS TRAQPak data is aircraft arrival and departure information on all IFRflights in the US (including Alaska and Hawaii) and Canada.
DEPARTURES BY FAA REGION 1/1/2017 – 12/31/2017
Every region recorded a gain in 2017 with the Northeast region recording the largest year over year growth, up 6.2% from 2016. The Central & Great Lakes regions were the only regions to post growth of
less than 1.0%, up 0.3% & 0.4% respectively.

21*ARGUS TRAQPak data is aircraft arrival and departure information on all IFRflights in the US (including Alaska and Hawaii) and Canada.
DEPARTURES BY STATE 1/1/2017 – 12/31/2017
The District of Columbia recorded the largest year over year growth, up 15.6%, while Hawaii, 1 of 13 states to report a year over year decline,
posted the largest yearly decline, down 9.6%.

22*ARGUS TRAQPak data is aircraft arrival and departure information on all IFRflights in the US (including Alaska and Hawaii) and Canada.
DEPARTURES BY PROVINCES & TERRITORIES 1/1/2017 – 12/31/2017
The Yukon Territory saw the largest jump in yearly flight activity, up 50.4% from 2016.
Alberta saw the largest yearly decline, down 12.9%.

23*ARGUS TRAQPak data is aircraft arrival and departure information on all IFRflights in the US (including Alaska and Hawaii) and Canada.
2017 DAILY FLIGHT ACTIVITY ANALYSIS
7 of the Top 10 days were Thursdays. The other 3 were Fridays. In 2016 we saw 24 calendar days with
10,000 or more flights, while 2017 saw that metric increase to 37
days.
Thursday continues to be the busiest day of the week for Business Aviation. All 5 days of the week averaged at least 8,000 flights per day. Sunday, Monday &
Tuesday each recorded a slight decline in average
flight activity compared to 2016.
With the exception of January 28th every
day on the bottom 10 was either a major
holiday or part of the days leading up to a
major holiday.
8 months saw an average of 8,000 or more flights per day.
That is up from 7 months in 2016.

24*ARGUS TRAQPak data is aircraft arrival and departure information on all IFRflights in the US (including Alaska and Hawaii) and Canada.
TOP AIRCRAFT TYPES BY FLIGHTS IN 2017
*Note- Chart lists the top aircraft type, in terms of flights, in each TRAQPak aircraft category.*Note- King Air 200 represents all variants of the King Air 200

*ARGUS TRAQPak data is aircraft arrival and departure information on all IFRflights in the US (including Alaska and Hawaii) and Canada.
25
2017 FLIGHT ACTIVITY SUMMARY
• 2017 provided Business Aviation with the best year it has seen since 2008. Growth continued in every major aircraft & operational category and we saw yearly gains during 12 months of 2017.
• 2017 flight activity was up 3.9% and flight hours were up 5.5% when compared to 2016. That now represents 4 straights years of consistent growth in business aviation (2014 – 2017).
• The Fractional industry, which had struggled to gain traction in previous years, posted yearly gains for all 12 months in 2017. April turned out to be the best month for the segment after it recorded a yearly gain of 8.5% from April 2016.
• The Part 135 industry continues to lead Business Aviation’s overall industry growth by providing its own unprecedented growth. The segment saw yearly gains during all 12 months in 2017, and recorded double digit gains during 5 of the months.
*Note- for purposes of this report, FAR Part 135 flight data represents all flight activity of aircraft on a Part 135 chartercertificate regardless of individual flight mission (excluding cargo, scheduled Part 135, and fractional operators)

*ARGUS TRAQPak data is aircraft arrival and departure information on all IFRflights in the US (including Alaska and Hawaii) and Canada.
26
2017 INDUSTRY TRENDS
• While we continued to see unprecedented gains in the Part 135 market, with strong growth in the large cabin market, consistent growth in the Fractional segment and we crossed the 3,000,000 flights mark. 2017 turned out to be a transition year for Business Aviation. We continued to see the largest segment in the industry, Part 91, stagnant for the year with flight activity growth of 0.1% and negative growth in its turboprop and small cabin markets. The Part 91 segment leaves us with questions heading into 2018, will this sector be able to increase growth of 0.1% or will it slip further over the next 12 months?
• In 2015 we saw 6 states record a year over year drop in flight activity. 2016 saw10 states record a year over year decline and in 2017 saw 13 states drop from the previous year. The previous falls had been attributed to the drop in oil prices, as most of the states affected were top oil producing states. While we still saw some of that in 2017, mainly New Mexico, North Dakota and the Canadian Province of Alberta, we also saw drops in other states all across the map. Hawaii saw the biggest year over year decline, down 9.6% while Wisconsin saw the smallest year over year decrease, down 0.3%. We also saw declines in Minnesota, Utah and Delaware among others.
*Note- for purposes of this report, FAR Part 135 flight data represents all flight activity of aircraft on a Part 135 chartercertificate regardless of individual flight mission (excluding cargo, scheduled Part 135, and fractional operators)

*ARGUS TRAQPak data is aircraft arrival and departure information on all IFRflights in the US (including Alaska and Hawaii) and Canada.
27
2017 INDUSTRY TRENDS CONTINUED
• 2017 produced year over year rises for all 12 months on the calendar. The top of the market produced the largest growth for the aircraft categories, but the bottom of the market also had some bright spots.
• Part 91 flight activity finished 2017 up 0.1% from 2016 with 7 of the 12 months producing year over year increases. January, February, April, July & December each posted a year over year decrease in activity.
• Part 135 flight activity grew at an almost astounding rate with 12 out of the 12 months posting a year over year increase in 2017. The segment finished the year up 9.2% from 2016.
• The Fractional industry further rebounded from the sluggish years of consolidation in 2017. The segment saw yearly gains in all 12 months to post an increase of 4.7%in 2017. The strongest individual segment growth occurred in the small cabin market which posted 7.1% growth over 2016.
*Note- for purposes of this report, FAR Part 135 flight data represents all flight activity of aircraft on a Part 135 chartercertificate regardless of individual flight mission (excluding cargo, scheduled Part 135, and fractional operators)

*ARGUS TRAQPak data is aircraft arrival and departure information on all IFRflights in the US (including Alaska and Hawaii) and Canada.
28
2017 INDUSTRY TRENDS CONTINUED
• 2017 produced solid flight activity gains across all aircraft segments. The top of the market still saw the strongest growth, but every segment was up at least 2.0% from 2016.
• 2017 turboprop flight activity was up 2.6% from 2016 which was down from the 3.5%rise recorded in 2016 & 2015. Most the decline for the segment can be attributed to the decline in Part 91 turboprop flying.
• All jet categories recorded gains in 2017 with large cabin aircraft leading the way, again, up an impressive 6.8%, which is on top of the 6.0% growth recorded by the segment in 2016. Mid-Size cabin grew 5.4% during 2017, while small cabin aircraft grew 2.1% from the previous year.

29*ARGUS TRAQPak data is aircraft arrival and departure information on all IFRflights in the US (including Alaska and Hawaii) and Canada.
2018 FLIGHT ACTIVITY FORECAST
• Following a record 2017, TRAQPak analysts estimate that the positive trend willcontinue at least through Q1 2018.
• TRAQPak analysts estimate that flight activity in January, February & March 2018will rise 3.6% over the same period in 2017.
• Analysts predict that total year over year flight activity will rise during each monthin Q1 2018 with March expected to produce the largest year over year rise, up4.0%.
• Analysts predict Part 135 charter flight activity will rise 8.1% in Q1 2018.Fractional activity is predicted to rise 2.4% during the same period, while Part 91flight activity is predicted to be mostly flat, up 0.7% during the period.
*Note- for purposes of this report, FAR Part 135 flight data represents all flight activity of aircraft on a Part 135 chartercertificate regardless of individual flight mission (excluding cargo, scheduled Part 135, and fractional operators)

Did you find this data interesting?
1.513.852.5110
Contact us today to find out how you can gain access to TRAQPak’s
business aviation data and industry market intelligence.