Embed Size (px)
Citation preview

January 2013 M&A & Investment Summary
Expertise Commitment ResultsExpertise. Commitment. Results.

TABLE OF CONTENTS
Overview of Monthly M&A and Investment Activity 3
Monthly M&A and Investment Activity by Industry Segment 9
Additional Monthly M&A and Investment Activity Data 39
About Petsky Prunier 52
2M&A & INVESTMENT SUMMARY JANUARY 2013

M&A AND INVESTMENT SUMMARY FOR ALL SEGMENTS
A t t l f 412 d l d i J 2013 f hi h 222 t d $8 5 billi i l
Transaction Distribution• A total of 412 deals were announced in January 2013, of which 222 reported $8.5 billion in value
• Digital Media/Commerce was the most active segment with 70 transactions, of which 48 reported $435 million in value
• Information & Business Services was the highest value segment with 64 transactions, of which 22 reported $3.4 billion in value
• Strategic buyers announced 182 deals (44% of total volume), of which 35 reported $2.2 billion in value
• VC/Growth Capital investors announced 201 deals, of which 169 reported $4.0 billion in value
• Buyout investors announced 26 deals, of which 10 reported $3.7 billion in value
# % $MM % # $MM # $MM # $MM
Digital Media/Commerce 70 17% 435.2 5% 28 102.3 1 - 41 332.9
Marketing Technology 67 16% 1 199 7 14% 25 39 1 4 807 9 38 352 7
JANUARY 2013
BUYER/INVESTOR BREAKDOWN
Transactions Reported Value Strategic Buyout Venture/Growth Capital
Marketing Technology 67 16% 1,199.7 14% 25 39.1 4 807.9 38 352.7
Information & Business Services 64 16% 3,448.6 41% 35 431.5 8 2,640.0 21 377.0
Software 64 16% 955.1 11% 21 336.1 5 115.1 38 504.0
Traditional Media 49 12% 1,248.3 15% 27 502.1 2 42.2 17 882.3
Technology 31 8% 435.1 5% 7 156.0 2 - 22 279.1
Digital Advertising 24 6% 215.9 3% 8 10.0 2 45.0 14 160.9
Agency/Consulting 16 4% 0 4 0% 14 0 4 1 1 Agency/Consulting 16 4% 0.4 0% 14 0.4 1 - 1 -
Communications 16 4% 549.0 6% 8 530.0 0 - 8 19.0
Marketing Services 11 3% 6.5 0% 9 6.5 1 - 1 -
Total 412 100% 8,493.8 100% 182 2,114.1 26 3,650.1 201 2,907.8
3M&A & INVESTMENT SUMMARY JANUARY 2013

M&A AND INVESTMENT SUMMARY FOR ALL SEGMENTSTransaction Distribution
O th th b i t d t ti l i d 63 t• On a month-over-month basis, reported transaction volume increased 63 percent
• Versus a year ago, reported deal volume and value increased 21 percent and 81 percent, from January 2012
• The largest transaction was CVC Capital Partners’ $1.5 billion buyout of Italy-based Cerved Group, a credit data and business intelligence company. The next-largest transactions included:
› TPG Capital’s buyout of Eze Castle Integration which provides technology consulting solutions to investment › TPG Capital s buyout of Eze Castle Integration, which provides technology consulting solutions to investment management firms, which was valued between $900 million and $1 billion
› Tiger Global Management’s $800 million acquisition of a 55 percent stake in SurveyMonkey, at an enterprise value of $1.4 billion, which provides an online survey tool that enables its users to create professional online surveys
M&A and Investment Volume For All Segments - Last 13 Months ($BN)All transactions; Value based on reported values only
$9 6
$22.4
$11.7 $15.3
$12.8
$19.1 $15.9
$9 8 $9 8 7
5 15.0
20.0
25.0 Deals valued over $1BN
$4.7
$9.6 $8.5 $
$7.1 $9.5 $9.8 $9.8
2 3 2 3
5 5
2 2 3 2 1
-
5.0
10.0
Jan-12 Feb-12 Mar-12 Apr-12 May-12 Jun-12 Jul-12 Aug-12 Sep-12 Oct-12 Nov-12 Dec-12 Jan-13
390377 381 377332340 252376 402 401 305 411342
4M&A & INVESTMENT SUMMARY JANUARY 2013
Deals valued over $1BN

($ in Millions)
SELECTED TRANSACTIONS WITH VALUATION INFORMATION DISCLOSED
Target Subsegment Buyer/Investor Ent. Value Rev EBITDA EV/REV EV/EBITDA
Digital Media/Commerce
Magaseek eCommerce NTT Docomo, Inc. $12.0 $105.6 $2.4 0.1x 5.0x
Marketing Technology
SurveyMonkey, Inc. Market Research Software Tiger Global Management, LLC 1,350.0 113.0 61.0 11.9x 22.1x
ANGOSS Software Corporation Analytics & Reporting Peterson Partners LP 7.9 6.7 (0.6) 1.2x NM
Communications
Telanetix Communications Software The Flexitallic Group 55.0 31.2 3.9 1.8x 14.1x
Software
Epocrates, Inc. Healthcare Software athenahealth, Inc. 213.1 110.1 (2.5) 1.9x NM
BioClinica, Inc. Healthcare Software JLL Partners 104.5 75.2 10.5 1.4x 10.0x
Information & Business Services
Cerved Group Spa Credit/Risk Management Information CVC Capital Partners Ltd. 1,490.0 385.0 - 3.9x NA
Practical Law Company Legal Information Thomson Reuters 405.0 54.3 - 7.5x NA
Globant IT Consulting/Systems Integration WPP Group 350.0 56.9 - 6.2x NA
Work Service Group Staffing PineBridge Investments LLC 173.0 228.3 12.6 0.8x 13.7x
5M&A & INVESTMENT SUMMARY JANUARY 2013

SECURITIES IN REGISTRATION ($ in Millions)
Aggregate Date Company Name Segment Offering Value Rev EBITDA
LTMDate Company Name Segment Offering Value Rev EBITDA
Jan-13 Channel Nine Entertainment Limited Traditional Media $2.2 NA NA
Jan-13 Xoom Corporation Technology 50.0 73.4 (3.3)
Jun-12 goldenTech SA Software 5.2 NA NA
Jun-12 Shanghai Amarsoft Information Technology Co. Ltd Software NA NA NA Jun 12 Shanghai Amarsoft Information Technology Co. Ltd Software NA NA NA
Apr-12 BlackStratus, Inc. Software 20.0 9.2 (0.6)
Apr-12 NSFOCUS Information Technology Co., Ltd. Communications NA NA NA
Apr-12 Shenzhen Tinno Mobile Technology Corp. Communications 451.0 NA NA
Mar-12 Exponential Interactive, Inc. Digital Advertising 75.0 169.1 22.0
Mar-12 Professional Diversity Network LLC Digital Media/Commerce 17.5 5.7 2.9
Mar-12 Reval Holdings, Inc. Software 75.0 47.0 (12.1)
6M&A & INVESTMENT SUMMARY JANUARY 2013

LTM IPO PERFORMANCEInitial Offering Final Price Stock Price at Close Stock Price on % Change from
Date Ticker Company Name Country Price Range Per Share on 1st Trading Day Jan 31, 2013 1st Trading Day
Nov-12 3666 Tecnos Japan Incorporated Japan $16.77-$18.72 $18.72 27.66, up 48% $36.74 32.8%
Nov-12 YY YY, Inc. China 10.50-12.50 10.50 11.31, up 8% 13.83 22.3%
Oct-12 RKUS Ruckus Wireless, Inc. United States 13.00-15.00 15.00 12.25, down 18% 23.56 92.3%
Oct-12 FLTX Fleetmatics Group Limited United States 15.00-17.00 27.00 22.30, up 31% 25.07 12.4%
Oct-12 RLGY Realogy Holdings Corp. United States 23.00-27.00 27.00 34.20, up 27% 44.77 30.9%
Oct-12 SSTK Shutterstock, Inc. United States 13.00-15.00 17.00 21.66, up 27% 25.23 16.5%
Oct-12 WDAY Workday, Inc. United States 24.00-26.00 28.00 48.69, 74% 53.42 9.1%
Sep-12 TRLA Trulia, Inc. United States 14.00-16.00 17.00 24.00, up 41.8% 26.29 9.5%
Aug-12 ELOQ Eloqua, Inc. United States 10.00-11.50 11.50 12.89, up 12% 23.49 82.2%
Aug-12 PFMT Performant Financial Corporation United States 12.00-14.00 9.00 10.60, down 18% 12.70 19.8%
Jul-12 EOPN E2open, Inc. United States 15.00-17.00 15.00 13.50, down 10% 17.85 32.2%
Jul-12 KYAK Kayak Software United States 22.00-25.00 26.00 33.18, up 28% 40.37 21.7%
Jul-12 PANW Palo Alto Networks United States 38.00-40.00 42.00 53.13, up 27% 55.36 4.2%
Jun-12 NOW ServiceNow United States 15.00-17.00 18.00 24.77, up 38% 27.72 11.9%
Jun-12 DB:VWA Vange Software Group AG Switzerland 33.05-39.41 33.05 32.69, down 1% 13.03 (60.1%)
May-12 ADNC Audience, Inc. United States 14.00-16.00 17.00 19.10, up 12.4% 12.22 (36.0%)
May-12 FB Facebook United States 36.00-38.00 38.00 38.23, flat 30.98 (19.0%)
May-12 WAGE WageWorks, Inc. United States 10.00-12.00 9.00 12.60, up 40% 19.96 58.4%y g p
Apr-12 A149940 Modacom Co., Ltd. South Korea 6.24-7.58 6.24 6.76, up 8% 6.29 (7.0%)
Apr-12 300353 Kyland Technology Co., Ltd. China No Range 3.29 3.49, up 6% 4.56 30.8%
Apr-12 AQ Acquity Group Hong Kong 6.00-8.00 6.00 5.77, down 4% 6.92 19.9%
Apr-12 GWAY Greenway Medical Technologies United States 11.00-13.00 10.00 13.29, up 33% 14.90 12.1%
Apr-12 BLOX Infloblox United States 12.00-14.00 16.00 21.30, up 33% 18.85 (11.5%)
Apr-12 PFPT Proofpoint, Inc. United States 10.00-12.00 13.00 14.10, up 8% 13.15 (6.7%)Apr 12 PFPT Proofpoint, Inc. United States 10.00 12.00 13.00 14.10, up 8% 13.15 (6.7%)
Apr-12 SPLK Splunk, Inc. United States 11.00-13.00 17.00 35.48, up 109% 32.96 (7.1%)
Mar-12 MACK CafePress, Inc. United States 16.00-18.00 19.00 19.03, up 0.2% 6.07 (68.1%)
Mar-12 DWRE Demandware, Inc. United States 12.50-14.50 16.00 24.33, up 52% 31.79 30.7%
Mar-12 ENVI Envivio, Inc. United States 10.00-12.00 9.00 8.49, down 5.7% 1.65 (80.6%)
Mar-12 ET ExactTarget, Inc. United States 15.00-17.00 19.00 25.11, up 32% 21.99 (12.4%)
Mar-12 MM Millennial Media Inc United States 11 00-13 00 13 00 25 00 up 92% 11 54 (53 8%)
7M&A & INVESTMENT SUMMARY JANUARY 2013
Mar-12 MM Millennial Media, Inc. United States 11.00-13.00 13.00 25.00, up 92% 11.54 (53.8%)
Mar-12 SYNC Synacor, Inc. United States 5.00-6.00 5.00 5.14, up 3% 5.79 12.6%

LTM IPO PERFORMANCEInitial Offering Final Price Stock Price at Close Stock Price on % Change from
Date Ticker Company Name Country Price Range Per Share on 1st Trading Day Jan 31, 2013 1st Trading Day
Mar-12 VIPS VIPshop China 8.50-10.50 6.50 5.50, down 15% 18.57 237.6%
Mar-12 VCRA Vocera Communications United States 12.00-14.00 16.00 22.40, up 40% 26.26 17.2%
Mar-12 YELP Yelp!, Inc. United States 12.00-14.00 15.00 24.58, up 64% 21.24 (13.6%)
Mar-12 A153460 Nable Communications, Inc. South Korea 6.54-7.85 7.85 7.66, down 2% 14.16 84.9%
Feb-12 AVG AVG Technologies Netherlands 16.00-18.00 16.00 13.09, down 16% 13.70 4.7%
Feb-12 BV BazaarVoice, Inc. United States 8.00-12.00 12.00 16.51, up 31% 7.73 (53.2%)
Feb-12 BCOV Brightcove, Inc. United States 10.00-12.00 11.00 15.15, up 36% 8.42 (44.4%)
Feb-12 EPAM EPAM Systems, Inc. United States 16.00-18.00 12.00 14.00, up 17% 20.72 72.7%
8M&A & INVESTMENT SUMMARY JANUARY 2013

DIGITAL MEDIA/COMMERCETransactions by Subsegment and Buyer Type
• eCommerce was the most active subsegment with 20 transactions announced, while Social Media/Apps was the highest value subsegment with $118 million in reported value
• Select acquisitions› 2UP Gaming’s $40 million purchase of DBG Poker Group, a U.K.-based provider of online gaming software
and hardware technology› Backstage’s $15 million acquisition of Sonicbids, which operates an online community for musicians and
music promoters• Select investments
› BlackRock’s offer to purchase $80 million of Twitter stock, at a valuation of more than $9 billion› The $30 million investment in Room 77 a company that operates a search engine for funding the low prices › The $30 million investment in Room 77, a company that operates a search engine for funding the low prices
on hotel rooms, from Expedia, Sutter Hill Ventures, General Catalyst Partners, Felicis Ventures, Concur Technologies, and individuals
› The $25 million investment in Streetline, which provides a mobile app that helps drivers find empty parking spaces, in a round led by True Ventures
# % $MM % # $MM # $MM # $MM
eCommerce 20 29% 91.7 21% 6 10.6 1 - 13 81.2
Mobile Content/Apps 13 19% 61.8 14% 5 22.5 0 - 8 39.3
Social Media/Apps 10 14% 118.3 27% 6 19.7 0 - 4 98.6
BUYER/INVESTOR BREAKDOWN
Transactions Reported Value Strategic Buyout Venture/Growth Capital
DIGITAL MEDIA/COMMERCE TRANSACTIONS BY SEGMENT
Gaming 9 13% 65.9 15% 5 47.1 0 - 4 18.8
Niche Content 4 6% 22.8 5% 2 2.5 0 - 2 20.3
Local Search 4 6% 17.5 4% 1 - 0 - 3 17.5
Classifieds/Auctions/P-to-P 3 4% 7.0 2% 1 - 0 - 2 7.0
Vertical Search 3 4% 16.7 4% 0 - 0 - 3 16.7
Digital Promotion/Coupon 2 3% 0.0 0% 2 - 0 - 0 -
9M&A & INVESTMENT SUMMARY JANUARY 2013
Other* 2 3% 34 8% 0 0.0 0 0.0 2 33.6
Total 70 100% 435 100% 28 102 1 0 41 333
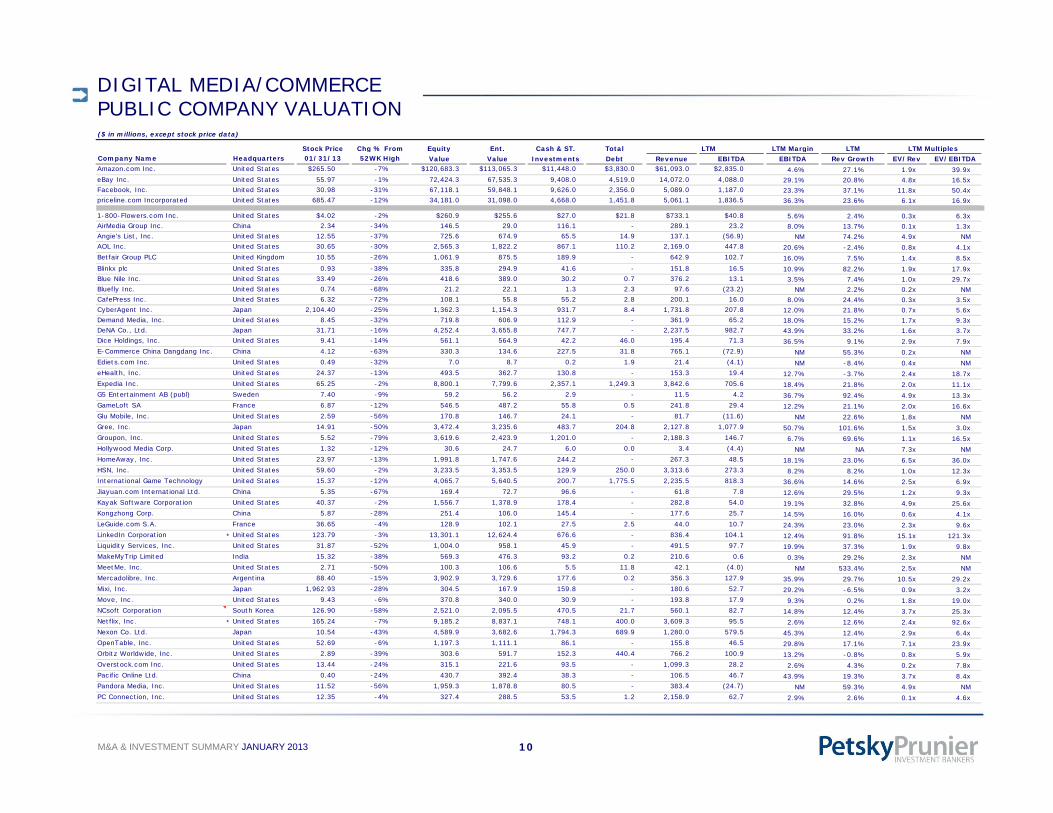
DIGITAL MEDIA/COMMERCE PUBLIC COMPANY VALUATION
Stock Price Chg % From Equity Ent. Cash & ST. Total LTM LTM Margin LTM LTM Multiples
($ in millions, except stock price data)
Stock Price Chg % From Equity Ent. Cash & ST. Total LTM LTM Margin LTM LTM Multiples Company Name Headquarters 01/31/13 52WK High Value Value Investments Debt Revenue EBITDA EBITDA Rev Growth EV/Rev EV/EBITDAAmazon.com Inc. United States $265.50 -7% $120,683.3 $113,065.3 $11,448.0 $3,830.0 $61,093.0 $2,835.0 4.6% 27.1% 1.9x 39.9xeBay Inc. United States 55.97 -1% 72,424.3 67,535.3 9,408.0 4,519.0 14,072.0 4,088.0 29.1% 20.8% 4.8x 16.5xFacebook, Inc. United States 30.98 -31% 67,118.1 59,848.1 9,626.0 2,356.0 5,089.0 1,187.0 23.3% 37.1% 11.8x 50.4xpriceline.com Incorporated United States 685.47 -12% 34,181.0 31,098.0 4,668.0 1,451.8 5,061.1 1,836.5 36.3% 23.6% 6.1x 16.9x
1-800-Flowers.com Inc. United States $4.02 -2% $260.9 $255.6 $27.0 $21.8 $733.1 $40.8 5.6% 2.4% 0.3x 6.3xAirMedia Group Inc. China 2.34 -34% 146.5 29.0 116.1 - 289.1 23.2 8.0% 13.7% 0.1x 1.3xAngie's List, Inc. United States 12.55 -37% 725.6 674.9 65.5 14.9 137.1 (56.9) NM 74.2% 4.9x NM AOL Inc. United States 30.65 -30% 2,565.3 1,822.2 867.1 110.2 2,169.0 447.8 20.6% -2.4% 0.8x 4.1xBetfair Group PLC United Kingdom 10.55 -26% 1,061.9 875.5 189.9 - 642.9 102.7 16.0% 7.5% 1.4x 8.5xBlinkx plc United States 0.93 -38% 335.8 294.9 41.6 - 151.8 16.5 10.9% 82.2% 1.9x 17.9xBlue Nile Inc. United States 33.49 -26% 418.6 389.0 30.2 0.7 376.2 13.1 3.5% 7.4% 1.0x 29.7xBluefly Inc. United States 0.74 -68% 21.2 22.1 1.3 2.3 97.6 (23.2) NM 2.2% 0.2x NM CafePress Inc. United States 6.32 -72% 108.1 55.8 55.2 2.8 200.1 16.0 8.0% 24.4% 0.3x 3.5xCyberAgent Inc. Japan 2,104.40 -25% 1,362.3 1,154.3 931.7 8.4 1,731.8 207.8 12.0% 21.8% 0.7x 5.6xDemand Media, Inc. United States 8.45 -32% 719.8 606.9 112.9 - 361.9 65.2 18.0% 15.2% 1.7x 9.3xDeNA Co., Ltd. Japan 31.71 -16% 4,252.4 3,655.8 747.7 - 2,237.5 982.7 43.9% 33.2% 1.6x 3.7xDice Holdings, Inc. United States 9.41 -14% 561.1 564.9 42.2 46.0 195.4 71.3 36.5% 9.1% 2.9x 7.9xE-Commerce China Dangdang Inc. China 4.12 -63% 330.3 134.6 227.5 31.8 765.1 (72.9) NM 55.3% 0.2x NM Ediets.com Inc. United States 0.49 -32% 7.0 8.7 0.2 1.9 21.4 (4.1) NM -8.4% 0.4x NM eHealth, Inc. United States 24.37 -13% 493.5 362.7 130.8 - 153.3 19.4 12.7% -3.7% 2.4x 18.7xExpedia Inc. United States 65.25 -2% 8,800.1 7,799.6 2,357.1 1,249.3 3,842.6 705.6 18.4% 21.8% 2.0x 11.1xG5 Entertainment AB (publ) Sweden 7.40 -9% 59.2 56.2 2.9 - 11.5 4.2 36.7% 92.4% 4.9x 13.3xGameLoft SA France 6.87 -12% 546.5 487.2 55.8 0.5 241.8 29.4 12.2% 21.1% 2.0x 16.6xGlu Mobile, Inc. United States 2.59 -56% 170.8 146.7 24.1 - 81.7 (11.6) NM 22.6% 1.8x NM Gree, Inc. Japan 14.91 -50% 3,472.4 3,235.6 483.7 204.8 2,127.8 1,077.9 50.7% 101.6% 1.5x 3.0xGroupon, Inc. United States 5.52 -79% 3,619.6 2,423.9 1,201.0 - 2,188.3 146.7 6.7% 69.6% 1.1x 16.5xHollywood Media Corp. United States 1.32 -12% 30.6 24.7 6.0 0.0 3.4 (4.4) NM NA 7.3x NM HomeAway Inc United States 23 97 13% 1 991 8 1 747 6 244 2 267 3 48 5 18 1% 23 0% 6 5 36 0HomeAway, Inc. United States 23.97 -13% 1,991.8 1,747.6 244.2 - 267.3 48.5 18.1% 23.0% 6.5x 36.0xHSN, Inc. United States 59.60 -2% 3,233.5 3,353.5 129.9 250.0 3,313.6 273.3 8.2% 8.2% 1.0x 12.3xInternational Game Technology United States 15.37 -12% 4,065.7 5,640.5 200.7 1,775.5 2,235.5 818.3 36.6% 14.6% 2.5x 6.9xJiayuan.com International Ltd. China 5.35 -67% 169.4 72.7 96.6 - 61.8 7.8 12.6% 29.5% 1.2x 9.3xKayak Software Corporation United States 40.37 -2% 1,556.7 1,378.9 178.4 - 282.8 54.0 19.1% 32.8% 4.9x 25.6xKongzhong Corp. China 5.87 -28% 251.4 106.0 145.4 - 177.6 25.7 14.5% 16.0% 0.6x 4.1xLeGuide.com S.A. France 36.65 -4% 128.9 102.1 27.5 2.5 44.0 10.7 24.3% 23.0% 2.3x 9.6xLinkedIn Corporation * United States 123.79 -3% 13,301.1 12,624.4 676.6 - 836.4 104.1 12.4% 91.8% 15.1x 121.3xLiquidity Services, Inc. United States 31.87 -52% 1,004.0 958.1 45.9 - 491.5 97.7 19.9% 37.3% 1.9x 9.8xMakeMyTrip Limited India 15.32 -38% 569.3 476.3 93.2 0.2 210.6 0.6 0.3% 29.2% 2.3x NM MeetMe, Inc. United States 2.71 -50% 100.3 106.6 5.5 11.8 42.1 (4.0) NM 533.4% 2.5x NM Mercadolibre, Inc. Argentina 88.40 -15% 3,902.9 3,729.6 177.6 0.2 356.3 127.9 35.9% 29.7% 10.5x 29.2xMixi, Inc. Japan 1,962.93 -28% 304.5 167.9 159.8 - 180.6 52.7 29.2% -6.5% 0.9x 3.2xMove, Inc. United States 9.43 -6% 370.8 340.0 30.9 - 193.8 17.9 9.3% 0.2% 1.8x 19.0xNCsoft Corporation South Korea 126.90 -58% 2,521.0 2,095.5 470.5 21.7 560.1 82.7 14.8% 12.4% 3.7x 25.3xNetflix, Inc. * United States 165.24 -7% 9,185.2 8,837.1 748.1 400.0 3,609.3 95.5 2.6% 12.6% 2.4x 92.6xNexon Co. Ltd. Japan 10.54 -43% 4,589.9 3,682.6 1,794.3 689.9 1,280.0 579.5 45.3% 12.4% 2.9x 6.4xOpenTable, Inc. United States 52.69 -6% 1,197.3 1,111.1 86.1 - 155.8 46.5 29.8% 17.1% 7.1x 23.9xOrbitz Worldwide, Inc. United States 2.89 -39% 303.6 591.7 152.3 440.4 766.2 100.9 13.2% -0.8% 0.8x 5.9xOverstock com Inc United States 13 44 24% 315 1 221 6 93 5 1 099 3 28 2 2 6% 4 3% 0 2 7 8
10M&A & INVESTMENT SUMMARY JANUARY 2013
Overstock.com Inc. United States 13.44 -24% 315.1 221.6 93.5 - 1,099.3 28.2 2.6% 4.3% 0.2x 7.8xPacific Online Ltd. China 0.40 -24% 430.7 392.4 38.3 - 106.5 46.7 43.9% 19.3% 3.7x 8.4xPandora Media, Inc. United States 11.52 -56% 1,959.3 1,878.8 80.5 - 383.4 (24.7) NM 59.3% 4.9x NM PC Connection, Inc. United States 12.35 -4% 327.4 288.5 53.5 1.2 2,158.9 62.7 2.9% 2.6% 0.1x 4.6x
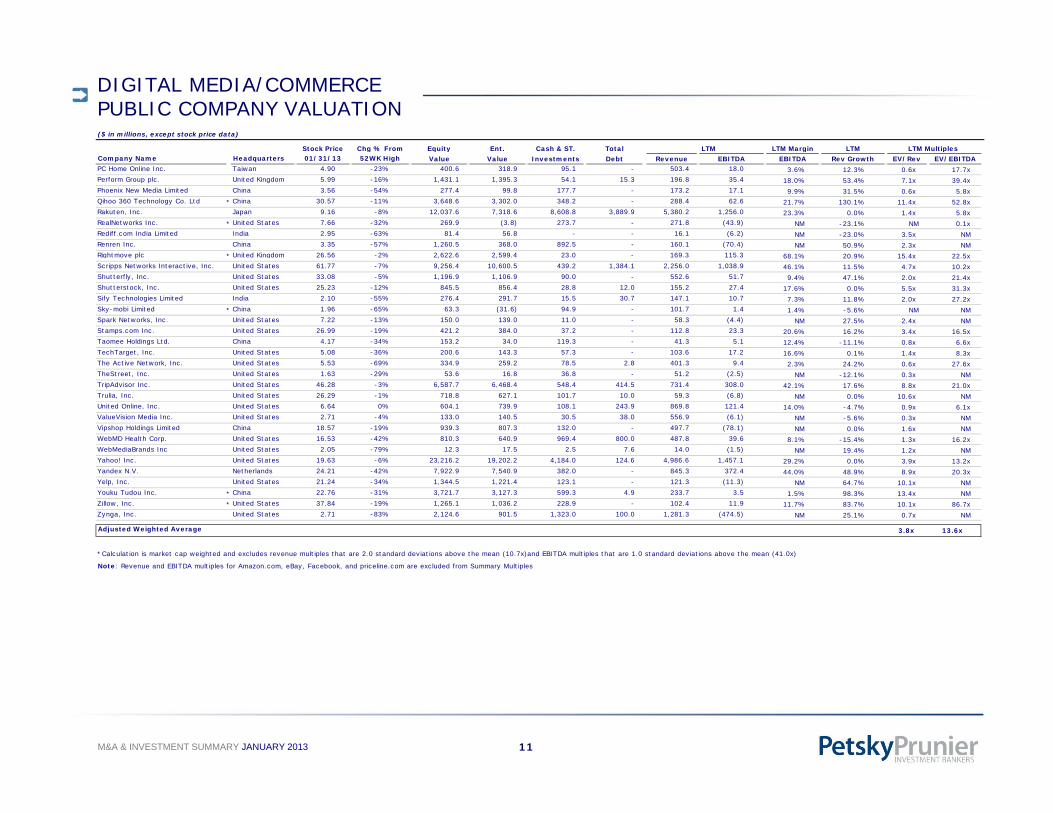
DIGITAL MEDIA/COMMERCE PUBLIC COMPANY VALUATION
Stock Price Chg % From Equity Ent. Cash & ST. Total LTM LTM Margin LTM LTM Multiples
($ in millions, except stock price data)
Stock Price Chg % From Equity Ent. Cash & ST. Total LTM LTM Margin LTM LTM Multiples Company Name Headquarters 01/31/13 52WK High Value Value Investments Debt Revenue EBITDA EBITDA Rev Growth EV/Rev EV/EBITDAPC Home Online Inc. Taiwan 4.90 -23% 400.6 318.9 95.1 - 503.4 18.0 3.6% 12.3% 0.6x 17.7xPerform Group plc. United Kingdom 5.99 -16% 1,431.1 1,395.3 54.1 15.3 196.8 35.4 18.0% 53.4% 7.1x 39.4xPhoenix New Media Limited China 3.56 -54% 277.4 99.8 177.7 - 173.2 17.1 9.9% 31.5% 0.6x 5.8xQihoo 360 Technology Co. Ltd * China 30.57 -11% 3,648.6 3,302.0 348.2 - 288.4 62.6 21.7% 130.1% 11.4x 52.8xRakuten, Inc. Japan 9.16 -8% 12,037.6 7,318.6 8,608.8 3,889.9 5,380.2 1,256.0 23.3% 0.0% 1.4x 5.8xRealNetworks Inc. * United States 7.66 -32% 269.9 (3.8) 273.7 - 271.8 (43.9) NM -23.1% NM 0.1xRediff.com India Limited India 2.95 -63% 81.4 56.8 - - 16.1 (6.2) NM -23.0% 3.5x NM Renren Inc. China 3.35 -57% 1,260.5 368.0 892.5 - 160.1 (70.4) NM 50.9% 2.3x NM Ri ht l U it d Ki d 26 56 2% 2 622 6 2 599 4 23 0 169 3 115 3 Rightmove plc * United Kingdom 26.56 -2% 2,622.6 2,599.4 23.0 - 169.3 115.3 68.1% 20.9% 15.4x 22.5xScripps Networks Interactive, Inc. United States 61.77 -7% 9,256.4 10,600.5 439.2 1,384.1 2,256.0 1,038.9 46.1% 11.5% 4.7x 10.2xShutterfly, Inc. United States 33.08 -5% 1,196.9 1,106.9 90.0 - 552.6 51.7 9.4% 47.1% 2.0x 21.4xShutterstock, Inc. United States 25.23 -12% 845.5 856.4 28.8 12.0 155.2 27.4 17.6% 0.0% 5.5x 31.3xSify Technologies Limited India 2.10 -55% 276.4 291.7 15.5 30.7 147.1 10.7 7.3% 11.8% 2.0x 27.2xSky-mobi Limited * China 1.96 -65% 63.3 (31.6) 94.9 - 101.7 1.4 1.4% -5.6% NM NM Spark Networks, Inc. United States 7.22 -13% 150.0 139.0 11.0 - 58.3 (4.4) NM 27.5% 2.4x NM Stamps.com Inc. United States 26.99 -19% 421.2 384.0 37.2 - 112.8 23.3 20.6% 16.2% 3.4x 16.5xTaomee Holdings Ltd. China 4.17 -34% 153.2 34.0 119.3 - 41.3 5.1 12.4% -11.1% 0.8x 6.6xTechTarget, Inc. United States 5.08 -36% 200.6 143.3 57.3 - 103.6 17.2 16.6% 0.1% 1.4x 8.3xg , 16.6% 0.1% 1.4x 8.3xThe Active Network, Inc. United States 5.53 -69% 334.9 259.2 78.5 2.8 401.3 9.4 2.3% 24.2% 0.6x 27.6xTheStreet, Inc. United States 1.63 -29% 53.6 16.8 36.8 - 51.2 (2.5) NM -12.1% 0.3x NM TripAdvisor Inc. United States 46.28 -3% 6,587.7 6,468.4 548.4 414.5 731.4 308.0 42.1% 17.6% 8.8x 21.0xTrulia, Inc. United States 26.29 -1% 718.8 627.1 101.7 10.0 59.3 (6.8) NM 0.0% 10.6x NM United Online, Inc. United States 6.64 0% 604.1 739.9 108.1 243.9 869.8 121.4 14.0% -4.7% 0.9x 6.1xValueVision Media Inc. United States 2.71 -4% 133.0 140.5 30.5 38.0 556.9 (6.1) NM -5.6% 0.3x NM Vipshop Holdings Limited China 18.57 -19% 939.3 807.3 132.0 - 497.7 (78.1) NM 0.0% 1.6x NM WebMD Health Corp. United States 16.53 -42% 810.3 640.9 969.4 800.0 487.8 39.6 8.1% -15.4% 1.3x 16.2xWebMediaBrands Inc United States 2.05 -79% 12.3 17.5 2.5 7.6 14.0 (1.5) NM 19.4% 1.2x NM Y h ! I U it d St t 19 63 6% 23 216 2 19 202 2 4 184 0 124 6 4 986 6 1 457 1 Yahoo! Inc. United States 19.63 -6% 23,216.2 19,202.2 4,184.0 124.6 4,986.6 1,457.1 29.2% 0.0% 3.9x 13.2xYandex N.V. Netherlands 24.21 -42% 7,922.9 7,540.9 382.0 - 845.3 372.4 44.0% 48.9% 8.9x 20.3xYelp, Inc. United States 21.24 -34% 1,344.5 1,221.4 123.1 - 121.3 (11.3) NM 64.7% 10.1x NM Youku Tudou Inc. * China 22.76 -31% 3,721.7 3,127.3 599.3 4.9 233.7 3.5 1.5% 98.3% 13.4x NM Zillow, Inc. * United States 37.84 -19% 1,265.1 1,036.2 228.9 - 102.4 11.9 11.7% 83.7% 10.1x 86.7xZynga, Inc. United States 2.71 -83% 2,124.6 901.5 1,323.0 100.0 1,281.3 (474.5) NM 25.1% 0.7x NM
Adjusted Weighted Average 3.8x 13.6x
*Calculation is market cap weighted and excludes revenue multiples that are 2.0 standard deviations above the mean (10.7x)and EBITDA multiples that are 1.0 standard deviations above the mean (41.0x)
Note: Revenue and EBITDA multiples for Amazon.com, eBay, Facebook, and priceline.com are excluded from Summary Multiples
11M&A & INVESTMENT SUMMARY JANUARY 2013

Transactions by Subsegment and Buyer TypeDIGITAL ADVERTISING
• The were 24 transactions announced in the Digital Advertising segment, up from 15 in the previous month, while reported value increased by 127 percent to $216 million. Online Lead Generation was the most active subsegment with 12 transactions announced
• Select acquisitions› Matomy Media Group’s $10 million acquisition of MediaWhiz, a full-service integrated digital media agency
ff i ffili t k ti h i l di di l d ti i il d d t i iti ioffering affiliate marketing, search, social media, display advertising, email, and data acquisition services› Connecture’s acquisition of DRX, which offers platforms where consumers can shop and enroll in private
Medicare plans online› ePrize’s acquisition of Mozes, a mobile engagement services company that provides social and location-based
experiences to live audiences at concerts and sporting events as well as through television broadcasts• Select investments
› The $35 million investment in Houzz, which operates an online community for home-renovation professionals and their customers, led by new investors GGV Capital and New Enterprise Associates
› The $30 million investment in Pinterest, which provides an online service that enables users to organize and share various things on the Web, from SV Angel
# % $MM % # $MM # $MM # $MM
Online Lead Generation 12 50% 117.9 55% 3 10.0 2 45.0 7 62.9
Ad Networks/Exchanges 5 21% 51.0 24% 1 - 0 - 4 51.0
DIGITAL ADVERTISING TRANSACTIONS BY SEGMENT BUYER/INVESTOR BREAKDOWN
Transactions Reported Value Strategic Buyout Venture/Growth Capital
Ad Networks/Exchanges 5 21% 51.0 24% 1 0 4 51.0
Affiliate/CPA Network 3 13% 41.0 19% 1 - 0 - 2 41.0
Digital Video 2 8% 6.0 3% 1 - 0 - 1 6.0
Mobile Marketing 2 8% 0.0 0% 2 - 0 - 0 -
Total 24 100% 216 100% 8 10 2 45 14 161
12M&A & INVESTMENT SUMMARY JANUARY 2013

DIGITAL ADVERTISING PUBLIC COMPANY VALUATION
Stock Price Chg % From Equity Ent Cash & ST Total LTM LTM Margin LTM LTM Multiples
($ in millions, except stock price data)
Stock Price Chg % From Equity Ent. Cash & ST. Total LTM LTM Margin LTM LTM Multiples Company Name Headquarters 01/31/13 52WK High Value Value Investments Debt Revenue EBITDA EBITDA Rev Growth EV/Rev EV/EBITDAGoogle Inc. United States $755.69 -2% $249,123.2 $208,245.2 $48,088.0 $7,210.0 $50,175.0 $16,278.0 32.4% 32.4% 4.2x 12.8x
Bankrate, Inc. United States $12.37 -52% $1,237.6 $1,360.3 $71.1 193.9 $477.7 $134.3 28.1% 23.2% 2.8x 10.1xBlucora, Inc. United States 14.86 -20% 605.5 529.3 150.4 74.3 376.1 73.0 19.4% 77.5% 1.4x 7.3xConstant Contact, Inc. United States 15.06 -53% 460.0 366.5 93.5 - 252.2 23.2 9.2% 17.6% 1.5x 15.8xeHealth, Inc. United States 24.37 -13% 493.5 362.7 130.8 - 153.3 19.4 12.7% -3.7% 2.4x 18.7xExactTarget, Inc. * United States 21.99 -26% 1,497.1 1,285.1 212.0 - 267.5 7.4 2.8% 43.1% 4.8x 174.1xHi-Media S.A. France 2.76 -43% 122.2 145.7 30.5 51.3 270.3 23.2 8.6% -7.7% 0.5x 6.3xIAC/InterActiveCorp United States 41 25 -26% 3 648 8 3 215 1 640 7 95 8 2 632 6 371 2 14 1% 37 6% 1 2x 8 7xIAC/InterActiveCorp United States 41.25 26% 3,648.8 3,215.1 640.7 95.8 2,632.6 371.2 14.1% 37.6% 1.2x 8.7xMillennial Media Inc. United States 11.54 -59% 904.0 781.6 122.4 - 154.3 (5.6) NM 75.6% 5.1x NM Motricity, Inc. United States 0.43 -77% 19.6 22.6 19.0 22.0 114.8 (5.8) NM 3.6% 0.2x NM OPT, Inc. Japan 8.54 -1% 251.5 108.9 171.1 6.0 912.3 23.5 2.6% 26.7% 0.1x 4.6xPacific Online Ltd. China 0.40 -24% 430.7 392.4 38.3 - 106.5 46.7 43.9% 19.3% 3.7x 8.4xQuinStreet, Inc. United States 5.64 -53% 241.2 233.1 107.8 99.7 329.1 42.7 13.0% -16.4% 0.7x 5.5xReachLocal, Inc. United States 13.12 -8% 374.1 278.4 95.7 - 434.9 7.9 1.8% 22.2% 0.6x 35.4xResponsys, Inc. United States 7.63 -41% 372.2 272.7 100.9 1.3 155.4 18.8 12.1% 21.1% 1.8x 14.5xSepteni Holdings Co., Ltd. Japan 827.94 -7% 104.2 65.7 65.9 11.2 531.0 23.3 4.4% 19.4% 0.1x 2.8xThe Active Network, Inc. United States 5.53 -69% 334.9 259.2 78.5 2.8 401.3 9.4 2.3% 24.2% 0.6x 27.6xTradeDoubler AB Sweden 2.11 -62% 89.9 62.7 26.3 - 371.2 7.6 2.0% 5.2% 0.2x 8.2xTree.Com, Inc. United States 17.48 -5% 198.7 108.9 89.8 - 64.2 (9.5) NM 14.9% 1.7x NM ValueClick, Inc. United States 20.47 -6% 1,540.1 1,594.9 120.2 175.0 668.1 191.0 28.6% 38.6% 2.4x 8.3xVelti Plc Ireland 3.72 -75% 241.8 227.8 29.5 15.5 260.0 30.3 11.6% 62.9% 0.9x 7.5xWeb.com Group, Inc. United States 16.20 -18% 763.5 1,434.2 11.5 682.2 369.8 33.8 9.2% 126.5% 3.9x 42.4xYahoo! Inc. United States 19.63 -6% 23,216.2 19,202.2 4,184.0 124.6 4,986.6 1,457.1 29.2% 0.0% 3.9x 13.2xYandex N.V. * Netherlands 24.21 -42% 7,922.9 7,540.9 382.0 - 845.3 372.4 44.0% 48.9% 8.9x 20.3x
3.3x 14.5xAdjusted Weighted Average
*Calculation is market cap weighted and excludes revenue multiples that are 2.0 standard deviations above the mean (6.4x)and EBITDA multiples that are 1.0 standard deviations above the mean (59 3 ) Note: Revenue and EBITDA multiples for Google is excluded from Summary Multiples
13M&A & INVESTMENT SUMMARY JANUARY 2013

MARKETING TECHNOLOGYTransactions by Subsegment and Buyer Type
• Analytics/Reporting and Social Technology were the most active subsegments with nine and eight transactions announced, respectively, while CRM was the highest value subsegment with $88 million in reported value
• Select acquisitions› Tiger Global Management’s $800 million investment of online survey tools provider SurveyMonkey, at an
enterprise value of $1.4 billion• Select investments
› The $75 million investment in AppNexus, a company that runs a real-time bidding platform for ad networks, led by Technology Crossover Ventures
› The $54 million investment in Infusionsoft, a provider of customer relationship management solutions for small businesses, led by Goldman Sachs, at a valuation of over $200 million
# % $MM % # $MM # $MM # $MM
Analytics & Reporting 9 13% 31.1 3% 4 - 1 7.9 4 23.3
Social Technology 8 12% 48.9 4% 2 - 0 - 6 48.9
Content Management 6 9% 15 5 1% 2 0 4 15 5
MARKETING TECHNOLOGY TRANSACTIONS BY SEGMENT BUYER/INVESTOR BREAKDOWN
Transactions Reported Value Strategic Buyout Venture/Growth Capital
Content Management 6 9% 15.5 1% 2 - 0 - 4 15.5
CRM 6 9% 88.4 7% 3 26.7 0 - 3 61.7
MRM/Workflow Management 5 7% 5.8 0% 1 - 1 - 3 5.8
Search & Discovery 4 6% 0.7 0% 3 - 0 - 1 0.7
Ad Serving 3 4% 27.0 2% 0 - 0 - 3 27.0
BI Tools 3 4% 0.8 0% 1 - 1 - 1 0.8
Commerce Management 3 4% - 0% 2 - 0 - 1 -
Media Management System 3 4% 5.6 0% 1 - 0 - 2 5.6
Online Targeting/Optimization 3 4% 81.3 7% 0 - 0 - 3 81.3
Teleservices/eServices 3 4% 20.5 2% 1 - 0 - 2 20.5
Segmentation/Data Mining 2 3% 12.4 1% 2 12.4 0 - 0 -
Other* 9 13% 861.7 72% 3 - 1 800.0 5 61.7
14M&A & INVESTMENT SUMMARY JANUARY 2013
Total 67 100% 1,200 100% 25 39 4 808 38 353*Other includes Content Delivery Network, Market Research Software, Mobile Technology, Product/Price Software, SEM/SEO Tools, SFA/Lead Management, Website Creation/Hosting

MARKETING TECHNOLOGY PUBLIC COMPANY VALUATION
Stock Price Chg % From Equity Ent. Cash & ST. Total LTM LTM Margin LTM LTM Multiples
($ in millions, except stock price data)
Stock Price Chg % From Equity Ent. Cash & ST. Total LTM LTM Margin LTM LTM Multiples Company Name Headquarters 01/31/13 52WK High Value Value Investments Debt Revenue EBITDA EBITDA Rev Growth EV/Rev EV/EBITDAAdobe Systems Inc. United States $37.83 -2% $18,869.3 $16,839.1 $3,538.4 $1,508.2 $4,403.7 $1,472.1 33.4% 4.4% 3.8x 11.4xMicrosoft Corporation United States 27.45 -17% 229,927.9 176,047.9 68,098.0 14,218.0 72,930.0 28,867.0 39.6% 1.2% 2.4x 6.1xOracle Corporation United States 35.51 -1% 168,114.9 154,603.9 33,695.0 19,757.0 37,230.0 17,300.0 46.5% 1.4% 4.2x 8.9xsalesforce.com, inc United States 172.13 -4% 25,193.1 25,166.1 605.6 578.5 2,847.4 88.7 3.1% 36.1% 8.8x 283.7xSAP AG Germany 81.74 -4% 97,473.6 101,040.3 3,466.3 6,918.1 21,388.4 6,506.7 30.4% 14.0% 4.7x 15.5x
Actuate Corporation United States $5.63 -23% $275.7 $201.1 $74.6 - $138.6 $27.3 19.7% 5.0% 1.5x 7.4xAkamai Technologies, Inc. United States 40.71 -4% 7,224.7 6,759.5 465.2 - 1,319.8 528.1 40.0% 17.9% 5.1x 12.8xBazaarvoice, Inc. United States 7.73 -63% 552.3 410.8 141.5 - 133.3 (23.8) NM 59.3% 3.1x NM Bitauto Holdings Limited China 9 93 3% 409 0 328 4 80 5 147 9 20 2 13 6% 54 7% 2 2x 16 3xBitauto Holdings Limited China 9.93 -3% 409.0 328.4 80.5 - 147.9 20.2 13.6% 54.7% 2.2x 16.3xBlackbaud Inc. United States 24.92 -27% 1,125.7 1,346.6 25.6 246.4 422.4 61.1 14.5% 16.6% 3.2x 22.0xBrightcove, Inc. United States 8.42 -67% 234.2 209.0 26.7 - 82.2 (9.7) NM 43.2% 2.5x NM ChinaCache International Holdings Ltd. China 3.80 -55% 87.1 43.5 43.6 - 122.2 14.2 11.6% 38.6% 0.4x 3.1xConstant Contact, Inc. United States 15.06 -53% 460.0 366.5 88.2 - 252.2 23.2 9.2% 17.6% 1.5x 15.8xDemandware, Inc. * United States 31.79 -7% 944.7 842.1 108.9 6.3 71.8 (4.3) NM 42.3% 11.7x NM Digital Generation, Inc. United States 10.01 -36% 277.0 663.3 68.6 455.0 391.3 112.1 28.7% 34.4% 1.7x 5.9xDigital River Inc. United States 14.52 -24% 515.9 194.7 675.0 353.8 396.9 52.4 13.2% 3.4% 0.5x 3.7xEloqua, Inc. United States 23.49 -5% 835.1 749.6 85.5 - 90.1 0.1 0.1% 39.1% 8.3x NM ExactTarget, Inc. * United States 21.99 -26% 1,497.1 1,285.1 212.0 - 267.5 7.4 2.8% 43.1% 4.8x 174.1xInformatica Corporation United States 37.01 -32% 3,993.6 3,460.5 535.6 - 811.6 180.3 22 2% 3 5% 4 3x 19 2xInformatica Corporation United States 37.01 32% 3,993.6 3,460.5 535.6 811.6 180.3 22.2% 3.5% 4.3x 19.2xInnerWorkings Inc. United States 13.91 -8% 694.7 759.2 9.5 74.0 764.9 34.1 4.5% 29.9% 1.0x 22.3xInteractive Intelligence Group Inc. United States 40.22 -2% 777.5 717.9 59.5 - 224.5 14.1 6.3% 10.9% 3.2x 50.9xJive Software, Inc. United States 15.33 -46% 985.9 855.8 141.5 11.4 103.7 (36.1) NM 49.3% 8.3x NM Keynote Systems Inc. United States 15.60 -24% 285.0 233.8 51.2 - 125.2 17.2 13.8% 12.5% 1.9x 13.6xLivePerson Inc. United States 13.37 -32% 747.0 643.7 103.3 - 151.4 21.3 14.1% 19.7% 4.3x 30.2xMercadolibre, Inc. * Argentina 88.40 -15% 3,902.9 3,729.6 177.6 0.2 356.3 127.9 35.9% 29.7% 10.5x 29.2xMicroStrategy Inc. United States 100.27 -37% 1,131.5 907.1 224.4 - 594.6 54.7 9.2% 5.8% 1.5x 16.6xNQ Mobile Inc. China 6.79 -47% 298.3 177.8 126.2 0.7 74.6 4.4 5.9% 118.6% 2.4x 40.4xOpenText Corporation Canada 58.35 -7% 3,417.6 3,631.7 367.3 581.4 1,276.3 372.0 29.1% 10.2% 2.8x 9.8xPROS Holdings, Inc. United States 22.06 -2% 605.7 533.0 72.6 - 111.3 10.5 9.4% 22.9% 4.8x 50.7xPTC Inc. United States 23.18 -20% 2,769.6 2,889.3 248.4 368.1 1,257.2 225.0 17.9% 3.2% 2.3x 12.8xQlik Technologies, Inc. * United States 22.21 -34% 1,907.8 1,714.8 193.1 0.0 359.1 17.5 4.9% 22.2% 4.8x 98.1xResponsys, Inc. United States 7.63 -41% 372.2 272.7 100.9 1.3 155.4 18.8 12.1% 21.1% 1.8x 14.5xRovi Corporation United States 17.29 -54% 1,854.9 2,515.8 821.2 1,482.1 680.1 213.0 31.3% 4.0% 3.7x 11.8xSage Group plc United Kingdom 5.11 -2% 5,492.1 5,722.7 99.3 337.3 2,160.7 639.4 29.6% 0.5% 2.6x 8.9xSDL plc United Kingdom 8.31 -31% 666.8 675.5 26.2 34.8 393.8 70.5 17.9% 13.9% 1.7x 9.6xSky-mobi Limited * China 1.96 -65% 63.3 (31.6) 94.9 - 101.7 1.4 1.4% -5.6% NM NM Solera Holdings Inc. United States 54.81 -3% 3,771.8 4,478.8 542.9 1,150.1 787.2 336.0 42.7% 8.7% 5.7x 13.3xSoundBite Communications, Inc. United States 2.96 -11% 48.5 24.4 24.1 - 46.2 0.6 1.3% 16.0% 0.5x 39.2xSplunk Inc * United States 32 96 -17% 3 250 4 2 977 0 273 3 - 176 9 (12 7) NM 76 0% 16 8x NM Splunk, Inc. United States 32.96 17% 3,250.4 2,977.0 273.3 176.9 (12.7) NM 76.0% 16.8x NM Synacor, Inc. United States 5.79 -68% 157.0 122.7 38.7 4.4 118.7 9.0 7.6% 47.9% 1.0x 13.6xTeradata Corporation United States 66.66 -18% 11,272.2 10,641.2 909.0 278.0 2,598.0 647.0 24.9% 16.1% 4.1x 16.4xThe Active Network, Inc. United States 5.53 -69% 334.9 259.2 78.5 2.8 401.3 9.4 2.3% 24.2% 0.6x 27.6xTIBCO Software Inc. United States 23.44 -32% 3,817.1 3,615.5 761.7 560.2 1,024.6 214.3 20.9% 11.3% 3.5x 16.9xVerint Systems Inc. United States 33.80 -4% 1,355.5 2,048.1 192.0 592.6 822.6 147.1 17.9% 8.6% 2.5x 13.9xVocus Inc. * United States 17.54 -29% 363.1 411.7 30.6 1.6 154.2 1.7 1.1% 39.7% 2.7x 237.8xWeborama France 20.37 -40% 71.1 63.6 13.5 6.5 33.8 6.0 17.8% 35.7% 1.9x 10.6x
3.8x 16.4xAdjusted Weighted Average
15M&A & INVESTMENT SUMMARY JANUARY 2013
Note: Revenue and EBITDA multiples for Adobe Systems, Oracle, Microsoft, salesforce.com, and SAP are excluded from Summary Multiples
*Calculation is market cap weighted and excludes revenue multiples that are 2.0 standard deviations above the mean (10.4x)and EBITDA multiples that are 1.0 standard deviations above the mean (80.4x)

AGENCY/CONSULTINGTransactions by Subsegment and Buyer Type
• There were 16 transactions announced in the Agency/Consulting segment in January, of which nine were announced in the Digital Agency segment
• Select acquisitions› WPP’s acquisition of three advertising agencies in Colombia, REP/Grey, REP/G2, and Massive, a group that
expects collective revenue of $110 million, along with its purchase of Salmon Group, a $55 million systems i t t th t id di it l lti d i d li d t i t t il h l l d integrator that provides digital consulting, design, delivery, and support services to retail, wholesale, and manufacturing brands
› Griffin York & Krause’s acquisition of Antler Agency, a social and interactive brand experiences company› Advance Publications’ acquisition of POP, a digital agency that crafts interactive experiences for the Web,
mobile devices, and emerging digital platforms
# % $MM % # $MM # $MM # $MM
Digital Agency 9 56% 0.4 100% 9 0.4 0 - 0 -
Marketing Consulting 1 6% - 0% 1 - 0 - 0 -
AGENCY/CONSULTING TRANSACTIONS BY SEGMENT BUYER/INVESTOR BREAKDOWN
Transactions Reported Value Strategic Buyout Venture/Growth Capital
Public Relations 2 13% - 0% 2 - 0 - 0 -
DM Agency 1 6% - 0% 0 - 1 - 0 -
General Agency 1 6% - 0% 1 - 0 - 0 -
Healthcare Agency 1 6% - 0% 0 - 0 - 1 -
Social Agency 1 6% - 0% 1 - 0 - 0 -
Total 16 100% 0 100% 14 0 1 0 1 0Total 16 100% 0 100% 14 0 1 0 1 0
16M&A & INVESTMENT SUMMARY JANUARY 2013

AGENCY/CONSULTINGPUBLIC COMPANY VALUATION
Stock Price Chg % From Equity Ent LTM LTM Margin LTM LTM Multiples
($ in millions, except stock price data)
Stock Price Chg % From Equity Ent. LTM LTM Margin LTM LTM Multiples Company Name Headquarters 01/31/13 52WK High Value Value Revenue EBITDA EBITDA Rev Growth EV/Rev EV/EBITDAAcquity Group Limited Hong Kong $6.92 -37% $162.7 $132.0 $137.9 $27.2 19.7% 0.0% 1.0x 4.8xAegis Group plc * United Kingdom 3.72 -1% 4,280.6 4,775.6 1,902.1 330.8 17.4% 18.9% 2.5x 14.4xCello Group Plc United Kingdom 0.70 -6% 57.2 78.9 212.2 12.5 5.9% 8.1% 0.4x 6.3xCharm Communications Inc. China 4.85 -58% 188.8 79.7 198.7 17.7 8.9% -22.5% 0.4x 4.5xChime Communications plc United Kingdom 3.77 -7% 302.6 269.8 563.5 42.7 7.6% 20.4% 0.5x 6.3xDentsu Inc. Japan 28.02 -4% 6,980.8 6,720.3 25,044.9 970.7 3.9% 6.7% 0.3x 6.9xEnero Group Limited Australia 0.35 -64% 29.9 9.9 343.1 4.7 1.4% -16.0% 0.0x 2.1xHavas France 6.55 -1% 2,504.4 3,172.7 2,166.4 333.8 15.4% 7.2% 1.5x 9.5xHuntsworth plc United Kingdom 0.66 -25% 167.2 277.6 276.6 44.4 16.1% 1.0% 1.0x 6.3xM&C Saatchi plc United Kingdom 3.17 -1% 200.9 182.5 257.3 29.5 11.5% 18.2% 0.7x 6.2xMDC Partners Inc. * Canada 12.81 -16% 398.2 966.4 1,034.2 62.0 6.0% 16.1% 0.9x 15.6xNext Fifteen Communications Group plc United Kingdom 1.59 -9% 95.1 102.6 143.6 17.9 12.5% 6.4% 0.7x 5.7xOmnicom Group Inc. United States 54.28 -1% 14,339.7 17,513.8 14,127.7 2,132.5 15.1% 3.8% 1.2x 8.2xPublicis Groupe SA France 65.54 -2% 12,897.3 14,193.0 7,860.8 1,431.2 18.2% 11.1% 1.8x 9.9xSapient Corp. United States 12.11 -13% 1,670.5 1,464.4 1,090.0 140.0 12.8% 11.0% 1.3x 10.5xThe Interpublic Group of Companies, Inc. United States 12.11 -1% 5,224.1 6,175.7 6,965.5 809.0 11.6% 0.3% 0.9x 7.6xWPP plc Ireland 15.71 -1% 19,879.1 24,787.7 16,124.9 2,503.2 15.5% 7.1% 1.5x 9.9x
1.3x 8.9x
*Calculation is market cap weighted and excludes revenue multiples that are 2.0 standard deviations above the mean (2.2x)and EBITDA multiples that are 1.0 standard deviations above the mean (11.4x)
Adjusted Weighted Average
17M&A & INVESTMENT SUMMARY JANUARY 2013

MARKETING SERVICESTransactions by Subsegment and Buyer Type
• There were eleven transaction in the Marketing Services segment in January, up from seven announced in the previous month. Printing Services was the most active subsegment with four acquisitions announced
• Select acquisitions› The Riverside Company’s acquisition of GiveAnything.com (dba CorporateRewards), a provider of business
recognition and wellness programs› Franchise Foundry’s acquisition of FranchisEssentials, a company offering franchise management, marketing,
and development services› GT Graphics’ acquisition of Zip Prints, a company offering full color printing of business cards, postcards,
letterheads, stationery envelopes and more
# % $MM % # $MM # $MM # $MM
Printing Services 4 36% - 0% 4 - 0 - 0 -
Database/Analytics 2 18% 6.5 100% 2 6.5 0 - 0 -
MARKETING SERVICES TRANSACTIONS BY SEGMENT BUYER/INVESTOR BREAKDOWN
Transactions Reported Value Strategic Buyout Venture/Growth Capital
Retail Services 2 18% - 0% 2 - 0 - 0 -
Ad Specialty/Premiums 1 9% - 0% 1 - 0 - 0 -
Logistics 1 9% - 0% 0 - 0 - 1 -
Loyalty/Retention 1 9% - 0% 0 - 1 - 0 -
Total 11 100% 7 100% 9 7 1 0 1 0
18M&A & INVESTMENT SUMMARY JANUARY 2013

MARKETING SERVICES PUBLIC COMPANY VALUATION
Stock Price Chg % From Equity Ent Cash & ST Total LTM LTM Margin LTM LTM Multiples
($ in millions, except stock price data)
Stock Price Chg % From Equity Ent. Cash & ST. Total LTM LTM Margin LTM LTM Multiples Company Name Headquarters 01/31/13 52WK High Value Value Investments Debt Revenue EBITDA EBITDA Rev Growth EV/Rev EV/EBITDAAcxiom Corporation United States $17.73 -7% $1,322.0 $1,396.1 $186.2 $260.6 $1,109.5 $223.4 20.1% -1.9% 1.3x 6.3xAimia Inc. Canada 16.03 -4% 2,762.7 2,966.1 386.9 604.0 2,163.8 284.6 13.2% -1.9% 1.4x 10.4xAlliance Data Systems * United States 157.60 -1% 7,857.3 12,664.1 893.4 5,700.2 3,641.4 1,141.2 31.3% 14.8% 3.5x 11.1xAMREP Corporation United States 9.96 -37% 59.7 70.4 15.1 25.7 81.4 1.6 2.0% -10.3% 0.9x 43.8xCenveo Inc. United States 2.50 -52% 159.4 1,365.9 10.3 1,216.9 1,832.2 208.2 11.4% 3.1% 0.7x 6.6xConsolidated Graphics, United States 36.63 -34% 352.1 511.1 8.2 167.2 1,036.4 100.1 9.7% -3.0% 0.5x 5.1xConvergys Corporation United States 17.02 -3% 1,857.6 1,188.8 729.4 60.6 2,325.5 293.1 12.6% 15.9% 0.5x 4.1xCSG Systems International United States 18.83 -19% 596.8 704.7 184.8 292.6 746.4 162.7 21.8% 6.4% 0.9x 4.3xData Group Inc Canada 2.13 -64% 50.0 152.1 - 103.5 344.4 28.0 8.1% 3.7% 0.4x 5.4xDST Systems Inc. United States 66.94 -1% 3,019.0 3,689.4 431.1 1,101.5 2,576.6 302.9 11.8% 7.9% 1.4x 12.2xElanders AB Sweden 3.52 -11% 80.0 188.3 25.8 131.5 295.5 32.2 10.9% 4.6% 0.6x 5.9xFair Isaac Corporation * United States 45.07 -6% 1,599.7 2,012.9 90.8 504.0 696.1 191.7 27.5% 9.8% 2.9x 10.5xHarte-Hanks Inc. United States 8.19 -19% 514.1 591.6 35.8 113.3 767.7 88.9 11.6% -9.8% 0.8x 6.7xInnerWorkings Inc. United States 13.91 -8% 694.7 759.2 9.5 74.0 764.9 34.1 4.5% 29.9% 1.0x 22.3xInnotrac Corp. United States 3.21 -11% 42.2 43.4 1.7 2.8 98.4 6.1 6.2% 19.5% 0.4x 7.1xInsignia Systems Inc. United States 2.16 -7% 29.4 9.6 19.8 - 19.0 (3.5) NM -6.3% 0.5x NM Points International Ltd. * Canada 11.80 -12% 179.0 145.4 34.1 - 131.6 5.1 3.9% 12.5% 1.1x 28.5xQuad/Graphics Inc United States 21 70 -3% 1 024 6 2 354 8 18 6 1 348 2 4 179 1 578 2 13 8% -4 3% 0 6x 4 1xQuad/Graphics, Inc. United States 21.70 3% 1,024.6 2,354.8 18.6 1,348.2 4,179.1 578.2 13.8% 4.3% 0.6x 4.1xR.R. Donnelley & Sons United States 9.20 -36% 1,658.8 5,071.2 392.9 3,786.4 10,283.1 1,257.0 12.2% -3.0% 0.5x 4.0xStarTek, Inc. * United States 4.31 -2% 65.4 56.2 9.2 - 194.1 1.1 0.6% -16.7% 0.3x 52.1xSykes Enterprises, United States 16.10 -12% 689.2 610.7 176.6 98.0 1,099.7 104.4 9.5% -5.6% 0.6x 5.9xTeleperformance France 39.88 -7% 2,209.6 2,182.6 200.9 169.4 2,777.9 360.2 13.0% 2.6% 0.8x 6.1xTeleTech Holdings Inc. United States 18.70 0% 1,004.5 939.3 170.4 91.1 1,168.3 139.5 11.9% 0.8% 0.8x 6.7xTranscontinental Inc. Canada 11.61 -13% 905.7 1,474.8 16.8 487.3 2,110.7 360.2 17.1% 6.2% 0.7x 4.1xValassis Communications United States 28.06 -3% 1,100.6 1,608.0 90.3 597.8 2,178.0 287.7 13.2% -4.1% 0.7x 5.6xViad Corp United States 27.92 -1% 565.6 452.6 124.2 2.3 1,025.2 63.9 6.2% 8.8% 0.4x 7.1xVistaprint N.V. Netherlands 35.85 -17% 1,228.4 1,394.2 64.7 230.5 1,107.8 106.1 9.6% 19.8% 1.3x 13.1x
0.8x 7.3xAdjusted Weighted Average
*Calculation is market cap weighted and excludes revenue multiples that are 2.0 standard deviations above the mean (1.9x)and EBITDA multiples that are 1.0 standard deviations above the mean (21.5x)
19M&A & INVESTMENT SUMMARY JANUARY 2013
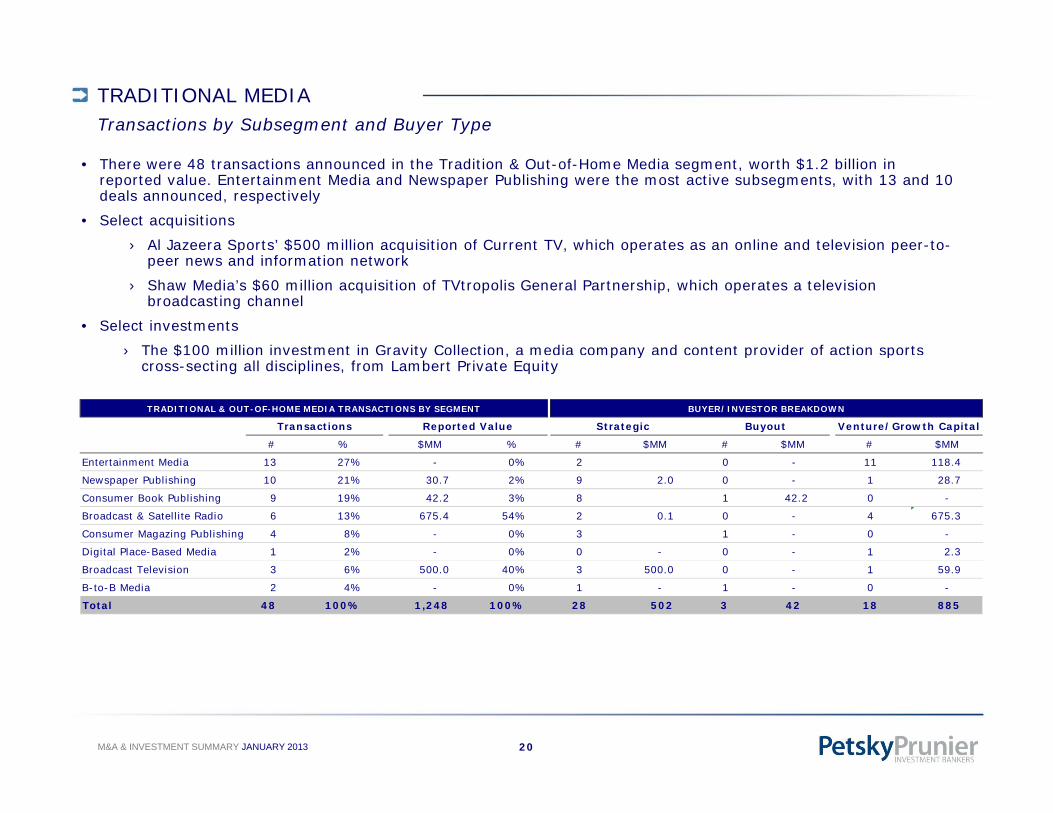
TRADITIONAL MEDIATransactions by Subsegment and Buyer Type
• There were 48 transactions announced in the Tradition & Out-of-Home Media segment, worth $1.2 billion in reported value. Entertainment Media and Newspaper Publishing were the most active subsegments, with 13 and 10 deals announced, respectively
• Select acquisitions› Al Jazeera Sports’ $500 million acquisition of Current TV, which operates as an online and television peer-to-
peer news and information network› Shaw Media’s $60 million acquisition of TVtropolis General Partnership, which operates a television
broadcasting channel• Select investments
› The $100 million investment in Gravity Collection, a media company and content provider of action sports $ y , p y p pcross-secting all disciplines, from Lambert Private Equity
# % $MM % # $MM # $MM # $MM
d
TRADITIONAL & OUT-OF-HOME MEDIA TRANSACTIONS BY SEGMENT BUYER/INVESTOR BREAKDOWN
Transactions Reported Value Strategic Buyout Venture/Growth Capital
Entertainment Media 13 27% - 0% 2 0 - 11 118.4
Newspaper Publishing 10 21% 30.7 2% 9 2.0 0 - 1 28.7
Consumer Book Publishing 9 19% 42.2 3% 8 1 42.2 0 -
Broadcast & Satellite Radio 6 13% 675.4 54% 2 0.1 0 - 4 675.3
Consumer Magazing Publishing 4 8% - 0% 3 1 - 0 -
Digital Place-Based Media 1 2% - 0% 0 - 0 - 1 2.3
Broadcast Television 3 6% 500.0 40% 3 500.0 0 - 1 59.9
B-to-B Media 2 4% - 0% 1 - 1 - 0 -
Total 48 100% 1,248 100% 28 502 3 42 18 885
20M&A & INVESTMENT SUMMARY JANUARY 2013
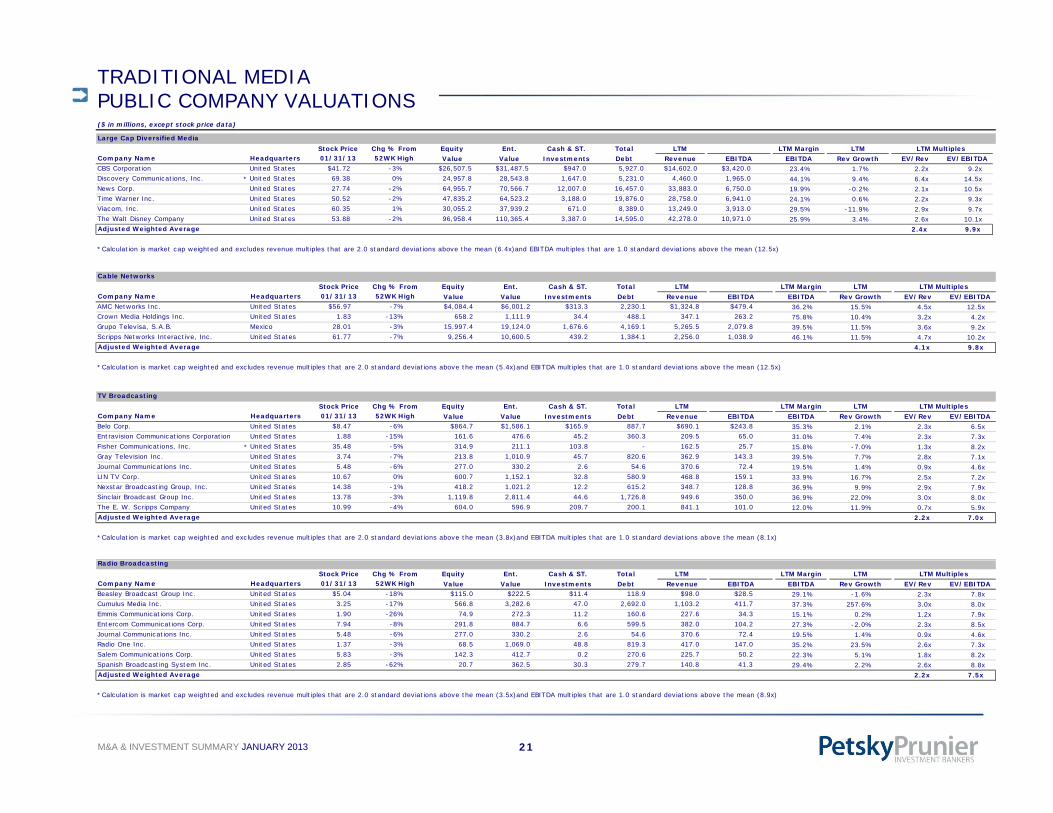
TRADITIONAL MEDIA PUBLIC COMPANY VALUATIONSLarge Cap Diversified Media
Stock Price Chg % From Equity Ent. Cash & ST. Total LTM LTM Margin LTM LTM Multiples
($ in millions, except stock price data)
Stock Price Chg % From Equity Ent. Cash & ST. Total LTM LTM Margin LTM LTM Multiples Company Name Headquarters 01/31/13 52WK High Value Value Investments Debt Revenue EBITDA EBITDA Rev Growth EV/Rev EV/EBITDACBS Corporation United States $41.72 -3% $26,507.5 $31,487.5 $947.0 5,927.0 $14,602.0 $3,420.0 23.4% 1.7% 2.2x 9.2xDiscovery Communications, Inc. * United States 69.38 0% 24,957.8 28,543.8 1,647.0 5,231.0 4,460.0 1,965.0 44.1% 9.4% 6.4x 14.5xNews Corp. United States 27.74 -2% 64,955.7 70,566.7 12,007.0 16,457.0 33,883.0 6,750.0 19.9% -0.2% 2.1x 10.5xTime Warner Inc. United States 50.52 -2% 47,835.2 64,523.2 3,188.0 19,876.0 28,758.0 6,941.0 24.1% 0.6% 2.2x 9.3xViacom, Inc. United States 60.35 1% 30,055.2 37,939.2 671.0 8,389.0 13,249.0 3,913.0 29.5% -11.9% 2.9x 9.7xThe Walt Disney Company United States 53.88 -2% 96,958.4 110,365.4 3,387.0 14,595.0 42,278.0 10,971.0 25.9% 3.4% 2.6x 10.1x
2.4x 9.9xAdjusted Weighted Average
*Calculation is market cap weighted and excludes revenue multiples that are 2.0 standard deviations above the mean (6.4x)and EBITDA multiples that are 1.0 standard deviations above the mean (12.5x)
Cable NetworksStock Price Chg % From Equity Ent. Cash & ST. Total LTM LTM Margin LTM LTM Multiples
Company Name Headquarters 01/31/13 52WK High Value Value Investments Debt Revenue EBITDA EBITDA Rev Growth EV/Rev EV/EBITDAAMC Networks Inc. United States $56.97 -7% $4,084.4 $6,001.2 $313.3 2,230.1 $1,324.8 $479.4 36.2% 15.5% 4.5x 12.5xCrown Media Holdings Inc. United States 1.83 -13% 658.2 1,111.9 34.4 488.1 347.1 263.2 75.8% 10.4% 3.2x 4.2xGrupo Televisa, S.A.B. Mexico 28.01 -3% 15,997.4 19,124.0 1,676.6 4,169.1 5,265.5 2,079.8 39.5% 11.5% 3.6x 9.2xScripps Networks Interactive, Inc. United States 61.77 -7% 9,256.4 10,600.5 439.2 1,384.1 2,256.0 1,038.9 46.1% 11.5% 4.7x 10.2x
4.1x 9.8xAdjusted Weighted Average
*Calculation is market cap weighted and excludes revenue multiples that are 2.0 standard deviations above the mean (5.4x)and EBITDA multiples that are 1.0 standard deviations above the mean (12.5x)
TV BroadcastingStock Price Chg % From Equity Ent. Cash & ST. Total LTM LTM Margin LTM LTM Multiples
Company Name Headquarters 01/31/13 52WK High Value Value Investments Debt Revenue EBITDA EBITDA Rev Growth EV/Rev EV/EBITDABelo Corp. United States $8.47 -6% $864.7 $1,586.1 $165.9 887.7 $690.1 $243.8 35.3% 2.1% 2.3x 6.5xEntravision Communications Corporation United States 1.88 -15% 161.6 476.6 45.2 360.3 209.5 65.0 31.0% 7.4% 2.3x 7.3xFisher Communications, Inc. * United States 35.48 -5% 314.9 211.1 103.8 - 162.5 25.7 15.8% -7.0% 1.3x 8.2xGray Television Inc. United States 3.74 -7% 213.8 1,010.9 45.7 820.6 362.9 143.3 39 5% 7 7% 2 8x 7 1xGray Television Inc. United States 3.74 7% 213.8 1,010.9 45.7 820.6 362.9 143.3 39.5% 7.7% 2.8x 7.1xJournal Communications Inc. United States 5.48 -6% 277.0 330.2 2.6 54.6 370.6 72.4 19.5% 1.4% 0.9x 4.6xLIN TV Corp. United States 10.67 0% 600.7 1,152.1 32.8 580.9 468.8 159.1 33.9% 16.7% 2.5x 7.2xNexstar Broadcasting Group, Inc. United States 14.38 -1% 418.2 1,021.2 12.2 615.2 348.7 128.8 36.9% 9.9% 2.9x 7.9xSinclair Broadcast Group Inc. United States 13.78 -3% 1,119.8 2,811.4 44.6 1,726.8 949.6 350.0 36.9% 22.0% 3.0x 8.0xThe E. W. Scripps Company United States 10.99 -4% 604.0 596.9 209.7 200.1 841.1 101.0 12.0% 11.9% 0.7x 5.9x
2.2x 7.0xAdjusted Weighted Average
*Calculation is market cap weighted and excludes revenue multiples that are 2.0 standard deviations above the mean (3.8x)and EBITDA multiples that are 1.0 standard deviations above the mean (8.1x)
Radio BroadcastingStock Price Chg % From Equity Ent. Cash & ST. Total LTM LTM Margin LTM LTM Multiples
Company Name Headquarters 01/31/13 52WK High Value Value Investments Debt Revenue EBITDA EBITDA Rev Growth EV/Rev EV/EBITDABeasley Broadcast Group Inc. United States $5.04 -18% $115.0 $222.5 $11.4 118.9 $98.0 $28.5 29.1% -1.6% 2.3x 7.8xCumulus Media Inc. United States 3.25 -17% 566.8 3,282.6 47.0 2,692.0 1,103.2 411.7 37.3% 257.6% 3.0x 8.0xEmmis Communications Corp. United States 1.90 -26% 74.9 272.3 11.2 160.6 227.6 34.3 15.1% 0.2% 1.2x 7.9xEntercom Communications Corp. United States 7.94 -8% 291.8 884.7 6.6 599.5 382.0 104.2 27.3% -2.0% 2.3x 8.5xJournal Communications Inc. United States 5.48 -6% 277.0 330.2 2.6 54.6 370.6 72.4 19.5% 1.4% 0.9x 4.6xRadio One Inc. United States 1.37 -3% 68.5 1,069.0 48.8 819.3 417.0 147.0 35.2% 23.5% 2.6x 7.3xSalem Communications Corp. United States 5.83 -3% 142.3 412.7 0.2 270.6 225.7 50.2 22.3% 5.1% 1.8x 8.2xSpanish B oad asting S stem In United States 2 85 62% 20 7 362 5 30 3 279 7 140 8 41 3 29 4% 2 2% 2 6 8 8
21M&A & INVESTMENT SUMMARY JANUARY 2013
Spanish Broadcasting System Inc. United States 2.85 -62% 20.7 362.5 30.3 279.7 140.8 41.3 29.4% 2.2% 2.6x 8.8x2.2x 7.5xAdjusted Weighted Average
*Calculation is market cap weighted and excludes revenue multiples that are 2.0 standard deviations above the mean (3.5x)and EBITDA multiples that are 1.0 standard deviations above the mean (8.9x)
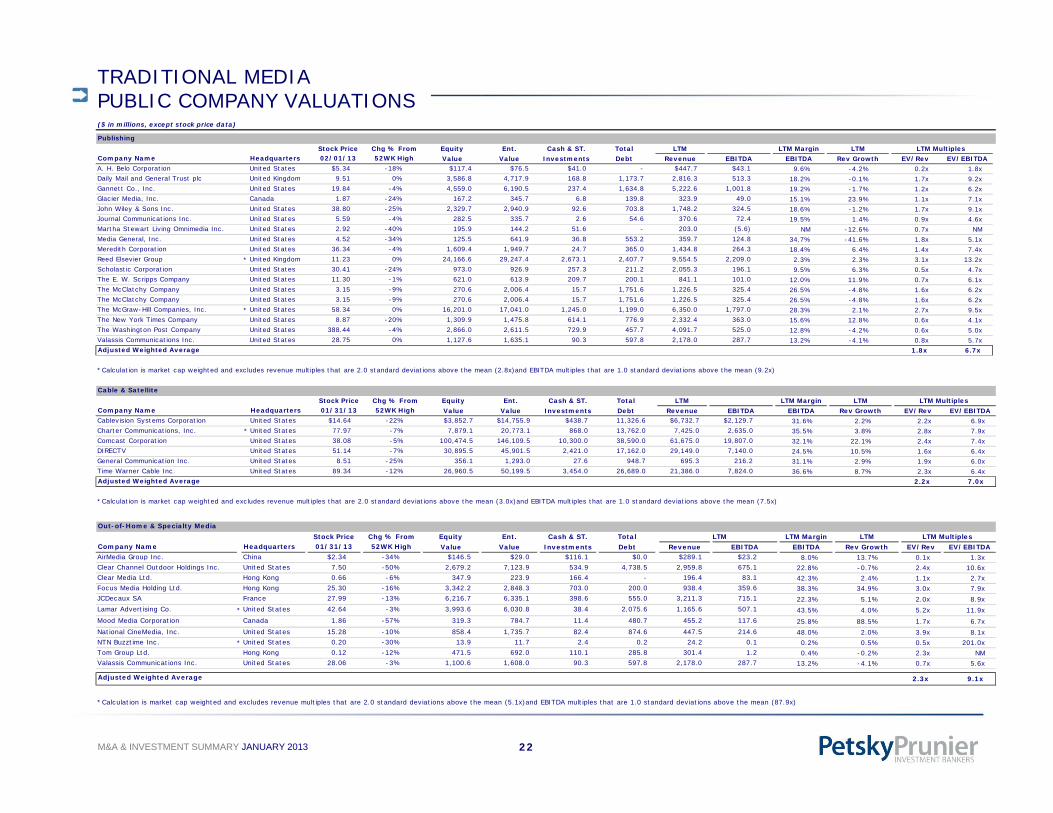
TRADITIONAL MEDIA PUBLIC COMPANY VALUATIONSPublishing
Stock Price Chg % From Equity Ent. Cash & ST. Total LTM LTM Margin LTM LTM Multiples
($ in millions, except stock price data)
Stock Price Chg % From Equity Ent. Cash & ST. Total LTM LTM Margin LTM LTM Multiples Company Name Headquarters 02/01/13 52WK High Value Value Investments Debt Revenue EBITDA EBITDA Rev Growth EV/Rev EV/EBITDAA. H. Belo Corporation United States $5.34 -18% $117.4 $76.5 $41.0 - $447.7 $43.1 9.6% -4.2% 0.2x 1.8xDaily Mail and General Trust plc United Kingdom 9.51 0% 3,586.8 4,717.9 168.8 1,173.7 2,816.3 513.3 18.2% -0.1% 1.7x 9.2xGannett Co., Inc. United States 19.84 -4% 4,559.0 6,190.5 237.4 1,634.8 5,222.6 1,001.8 19.2% -1.7% 1.2x 6.2xGlacier Media, Inc. Canada 1.87 -24% 167.2 345.7 6.8 139.8 323.9 49.0 15.1% 23.9% 1.1x 7.1xJohn Wiley & Sons Inc. United States 38.80 -25% 2,329.7 2,940.9 92.6 703.8 1,748.2 324.5 18.6% -1.2% 1.7x 9.1xJournal Communications Inc. United States 5.59 -4% 282.5 335.7 2.6 54.6 370.6 72.4 19.5% 1.4% 0.9x 4.6xMartha Stewart Living Omnimedia Inc. United States 2.92 -40% 195.9 144.2 51.6 - 203.0 (5.6) NM -12.6% 0.7x NM Media General, Inc. United States 4.52 -34% 125.5 641.9 36.8 553.2 359.7 124.8 34.7% -41.6% 1.8x 5.1xMeredith Corporation United States 36.34 -4% 1,609.4 1,949.7 24.7 365.0 1,434.8 264.3 18.4% 6.4% 1.4x 7.4xReed Elsevier Group * United Kingdom 11.23 0% 24,166.6 29,247.4 2,673.1 2,407.7 9,554.5 2,209.0 2.3% 2.3% 3.1x 13.2xScholastic Corporation United States 30.41 -24% 973.0 926.9 257.3 211.2 2,055.3 196.1 9.5% 6.3% 0.5x 4.7xThe E. W. Scripps Company United States 11.30 -1% 621.0 613.9 209.7 200.1 841.1 101.0 12.0% 11.9% 0.7x 6.1xThe McClatchy Company United States 3.15 -9% 270.6 2,006.4 15.7 1,751.6 1,226.5 325.4 26.5% -4.8% 1.6x 6.2xThe McClatchy Company United States 3.15 -9% 270.6 2,006.4 15.7 1,751.6 1,226.5 325.4 26.5% -4.8% 1.6x 6.2xThe McGraw-Hill Companies, Inc. * United States 58.34 0% 16,201.0 17,041.0 1,245.0 1,199.0 6,350.0 1,797.0 28.3% 2.1% 2.7x 9.5xThe New York Times Company United States 8.87 -20% 1,309.9 1,475.8 614.1 776.9 2,332.4 363.0 15.6% 12.8% 0.6x 4.1xThe Washington Post Company United States 388.44 -4% 2,866.0 2,611.5 729.9 457.7 4,091.7 525.0 12.8% -4.2% 0.6x 5.0xValassis Communications Inc. United States 28.75 0% 1,127.6 1,635.1 90.3 597.8 2,178.0 287.7 13.2% -4.1% 0.8x 5.7x
1.8x 6.7xAdjusted Weighted Average
Cable & SatelliteStock Price Chg % From Equity Ent. Cash & ST. Total LTM LTM Margin LTM LTM Multiples
Company Name Headquarters 01/31/13 52WK High Value Value Investments Debt Revenue EBITDA EBITDA Rev Growth EV/Rev EV/EBITDACablevision Systems Corporation United States $14.64 -22% $3,852.7 $14,755.9 $438.7 11,326.6 $6,732.7 $2,129.7 31.6% 2.2% 2.2x 6.9xCharter Communications, Inc. * United States 77.97 -7% 7,879.1 20,773.1 868.0 13,762.0 7,425.0 2,635.0 35.5% 3.8% 2.8x 7.9xComcast Corporation United States 38.08 -5% 100,474.5 146,109.5 10,300.0 38,590.0 61,675.0 19,807.0 32.1% 22.1% 2.4x 7.4xDIRECTV United States 51.14 -7% 30,895.5 45,901.5 2,421.0 17,162.0 29,149.0 7,140.0 24.5% 10.5% 1.6x 6.4x
*Calculation is market cap weighted and excludes revenue multiples that are 2.0 standard deviations above the mean (2.8x)and EBITDA multiples that are 1.0 standard deviations above the mean (9.2x)
General Communication Inc. United States 8.51 -25% 356.1 1,293.0 27.6 948.7 695.3 216.2 31.1% 2.9% 1.9x 6.0xTime Warner Cable Inc. United States 89.34 -12% 26,960.5 50,199.5 3,454.0 26,689.0 21,386.0 7,824.0 36.6% 8.7% 2.3x 6.4x
2.2x 7.0xAdjusted Weighted Average
*Calculation is market cap weighted and excludes revenue multiples that are 2.0 standard deviations above the mean (3.0x)and EBITDA multiples that are 1.0 standard deviations above the mean (7.5x)
Out-of-Home & Specialty MediaStock Price Chg % From Equity Ent. Cash & ST. Total LTM LTM Margin LTM LTM Multiples
Company Name Headquarters 01/31/13 52WK High Value Value Investments Debt Revenue EBITDA EBITDA Rev Growth EV/Rev EV/EBITDAAirMedia Group Inc. China $2.34 -34% $146.5 $29.0 $116.1 $0.0 $289.1 $23.2 8.0% 13.7% 0.1x 1.3xClear Channel Outdoor Holdings Inc. United States 7.50 -50% 2,679.2 7,123.9 534.9 4,738.5 2,959.8 675.1 22.8% -0.7% 2.4x 10.6xClear Media Ltd. Hong Kong 0.66 -6% 347.9 223.9 166.4 - 196.4 83.1 42.3% 2.4% 1.1x 2.7xFocus Media Holding Ltd. Hong Kong 25.30 -16% 3,342.2 2,848.3 703.0 200.0 938.4 359.6 38.3% 34.9% 3.0x 7.9xJCDecaux SA France 27.99 -13% 6,216.7 6,335.1 398.6 555.0 3,211.3 715.1 22.3% 5.1% 2.0x 8.9xLamar Advertising Co. * United States 42.64 -3% 3,993.6 6,030.8 38.4 2,075.6 1,165.6 507.1 43.5% 4.0% 5.2x 11.9xMood Media Corporation Canada 1.86 -57% 319.3 784.7 11.4 480.7 455.2 117.6 25.8% 88.5% 1.7x 6.7xNational CineMedia, Inc. United States 15.28 -10% 858.4 1,735.7 82.4 874.6 447.5 214.6 48.0% 2.0% 3.9x 8.1xNTN Buzztime Inc. * United States 0.20 -30% 13.9 11.7 2.4 0.2 24.2 0.1 0.2% 0.5% 0.5x 201.0xTom Group Ltd. Hong Kong 0.12 -12% 471.5 692.0 110.1 285.8 301.4 1.2 0.4% -0.2% 2.3x NM Valassis Communications Inc United States 28 06 -3% 1 100 6 1 608 0 90 3 597 8 2 178 0 287 7 13 2% 4 1% 0 7x 5 6x
22M&A & INVESTMENT SUMMARY JANUARY 2013
Valassis Communications Inc. United States 28.06 -3% 1,100.6 1,608.0 90.3 597.8 2,178.0 287.7 13.2% -4.1% 0.7x 5.6x
2.3x 9.1x
*Calculation is market cap weighted and excludes revenue multiples that are 2.0 standard deviations above the mean (5.1x)and EBITDA multiples that are 1.0 standard deviations above the mean (87.9x)
Adjusted Weighted Average

TECHNOLOGYTransactions by Subsegment and Buyer Type
• Financial Technology was the most active and highest value subsegment with 10 deals announced worth $182 million in reported value
• Select acquisitions› RealTick’s acquisition of Eze Castle Software, which provides technology solutions to the investment
management firms, and RealTick, in a deal valued between $900 million and $1 billion › Fidelity National Information Services’ acquisition of the remaining 78 percent stake in mFoundry, a provider
of mobile banking and payment solutions for financial institutions and retailers, for $120 million. The deal gives mFoundry an enterprise value of $154 million
• Select investments› The $40 million investment in Virident Systems, a provider of flash-based storage-class memory systems,
from Ireland-based Seagate Technology, which markets and sells hard disk drives for enterprise storage› The $30 million investment in Puppet Labs, a developer of software for deploying and managing IT resources
in virtual and cloud data centers, from VMware› The $30 million investment in DataGravity, a developer of big data management software that helps
organizations turn their data into useful information, led by Andreessen Horowitz
# % $MM % # $MM # $MM # $MM
Financial 10 32% 182.0 42% 2 120.0 2 - 6 62.0
Cloud Storage 7 23% 67.9 16% 2 25.0 0 - 5 42.9
TECHNOLOGY TRANSACTIONS BY SEGMENT BUYER/INVESTOR BREAKDOWN
Transactions Reported Value Strategic Buyout Venture/Growth Capital
Big Data 4 13% 80.3 18% 0 - 0 - 4 80.3
Data Center 4 13% 50.3 12% 1 - 0 - 3 50.3
Cloud Computing 3 10% 40.9 9% 0 - 0 - 3 40.9
Home Automation 2 6% 2.8 1% 1 - 0 - 1 2.8
Virtualization 1 3% 11.0 3% 1 11.0 0 - 0 -
Total 31 100% 435 100% 7 156 2 0 22 279
23M&A & INVESTMENT SUMMARY JANUARY 2013
Total 31 100% 435 100% 7 156 2 0 22 279

TECHNOLOGY PUBLIC COMPANY VALUATION($ in millions, except stock price data)
Stock Price Chg % From Equity Ent. Cash & ST. Total LTM LTM Margin LTM LTM Multiples S oc ce C g % o qu y Cas & S o a a g u p esCompany Name Headquarters 01/31/13 52WK High Value Value Investments Debt Revenue EBITDA EBITDA Rev Growth EV/Rev EV/EBITDA3M Company United States $100.55 -1% $69,087.1 $70,557.1 $4,531.0 $6,001.0 $29,904.0 $7,757.7 25.9% 1.0% 2.4x 9.1xADATA Technology Co., Ltd. Taiwan 1.21 -24% 254.6 366.4 79.4 192.2 1,006.0 30.3 3.0% -3.5% 0.4x 12.1xAdvanced Micro Devices, Inc. United States 2.60 -69% 1,851.1 2,891.1 1,002.0 2,042.0 5,422.0 285.0 5.3% -17.4% 0.5x 10.1xAkamai Technologies, Inc. United States 40.71 -4% 7,224.7 6,759.5 465.2 - 1,319.8 528.1 40.0% 17.9% 5.1x 12.8xAVG Technologies N.V. Netherlands 13.70 -16% 740.0 806.2 86.7 152.9 335.1 98.7 29.4% 31.1% 2.4x 8.2xBrightcove, Inc. * United States 8.42 -67% 234.2 209.0 26.7 - 82.2 (9.7) NM 43.2% 2.5x NM CA Technologies United States 24.82 -11% 11,316.0 10,197.0 2,560.0 1,441.0 4,680.0 1,690.0 36.1% -1.6% 2.2x 6.0xCarbonite, Inc. * United States 9.62 -18% 246.8 180.5 66.3 - 77.7 (11.6) NM 42.0% 2.3x NM Check Point Software Technologies Ltd. Israel 50.00 -23% 10,240.0 8,736.7 1,503.3 - 1,342.7 761.4 56.7% 7.7% 6.5x 11.5xCitrix Systems, Inc. United States 73.16 -17% 13,660.1 12,731.5 928.6 - 2,586.1 605.7 23.4% 17.2% 4.9x 21.0xCommVault Systems, Inc. * United States 76.73 -3% 3,489.7 3,092.4 397.2 - 471.6 77.6 16.5% 23.4% 6.6x 39.8xCray Inc. United States 18.57 -2% 687.9 428.9 258.9 - 323.8 38.3 11.8% -11.0% 1.3x 11.2xCrossroads Systems, Inc. * United States 2.22 -65% 26.3 23.9 6.9 4.6 14.0 (9.6) NM -6.6% 1.7x NM Datalink Corporation United States 8.79 -20% 162.8 133.6 29.2 - 458.6 21.8 4.8% 28.7% 0.3x 6.1xDell Inc. United States 13.24 -28% 23,001.5 20,794.5 11,272.0 9,044.0 58,657.0 4,441.0 7.6% -5.0% 0.4x 4.7xDot Hill Systems Corp. * United States 1.16 -30% 67.7 29.0 40.5 1.8 199.2 (12.5) NM -7.0% 0.1x NM Elecom Co., Ltd. Japan 16.31 -35% 328.2 254.6 110.4 23.8 819.8 94.1 11.5% 10.4% 0.3x 2.7xEMC Corporation United States 24.61 -18% 51,852.3 48,561.9 6,167.1 1,710.1 21,713.9 5,602.2 25.8% 8.5% 2.2x 8.7xePlus inc. United States 46.59 -2% 376.4 449.6 45.9 119.1 947.8 71.0 7.5% 39.6% 0.5x 6.3xEquinix, Inc. * United States 215.43 -5% 10,357.0 12,987.2 404.5 2,956.5 1,848.4 784.1 42.4% 23.8% 7.0x 16.6xF-Secure Oyj Finland 2.42 -14% 375.7 338.9 34.8 - 201.5 36.9 18.3% 11.7% 1.7x 9.2xFusion-io, Inc. * United States 17.48 -48% 1,674.0 1,305.4 368.5 - 439.5 24.3 5.5% 47.8% 3.0x 53.8xGemalto NV Netherlands 89.07 -14% 7,457.1 7,061.4 395.3 20.6 2,671.5 375.0 14.0% 4.4% 2.6x 18.8xGoogle Inc. United States 755.69 -2% 249,123.2 208,245.2 48,088.0 7,210.0 50,175.0 15,722.0 31.3% 32.4% 4.2x 13.2xGraphOn Corp. * United States 0.34 -15% 29.4 24.5 4.9 - 6.7 (3.4) NM 1.9% 3.7x NM Green Dot Corporation United States 13.40 -59% 480.7 122.6 237.0 49.1 554.5 90.3 16.3% 14.4% 0.2x 1.4xImperva Inc. * United States 34.30 -19% 824.8 722.1 101.7 - 95.7 (6.0) NM 33.0% 7.5x NM Infosys Ltd. India 52.37 -7% 29,922.1 25,719.0 4,079.0 - 7,231.0 2,182.0 30.2% 5.9% 3.6x 11.8xInfosystems S.A. Poland 1.43 -22% 5.9 5.5 0.6 0.3 2.1 0.8 38.8% 40.7% 2.7x 6.9xy
Integrated Electrical Services, Inc. United States 4.37 -29% 65.9 57.6 18.7 10.5 456.1 2.5 0.5% 12.3% 0.1x 23.2xIntel Corporation United States 21.04 -28% 104,421.5 99,707.5 18,162.0 13,448.0 53,341.0 21,994.0 41.2% -1.2% 1.9x 4.5xInternap Network Services Corp. United States 7.91 -2% 422.7 533.9 26.4 137.6 266.6 44.1 16.5% 10.3% 2.0x 12.1xInternational Business Machines Corporation United States 203.07 -4% 229,455.3 251,719.3 11,129.0 33,269.0 104,507.0 26,217.0 25.1% -2.3% 2.4x 9.6xInterxion Holding NV Netherlands 22.99 -8% 1,562.2 1,822.5 70.8 331.2 345.0 141.8 41.1% 14.1% 5.3x 12.9xJ-Stream Inc. Japan 443.03 -14% 60.7 43.1 22.6 - 68.6 7.0 10.2% 1.4% 0.6x 6.1xJuniper Networks, Inc. United States 22.38 -11% 11,538.6 9,688.5 2,849.3 999.2 4,365.4 543.9 12.5% -1.9% 2.2x 17.8xKeynote Systems Inc. United States 15.60 -24% 285.0 233.8 51.2 - 125.2 17.2 13.8% 12.5% 1.9x 13.6xLimelight Networks, Inc. * United States 2.36 -45% 234.0 106.5 130.0 2.6 179.7 (1.3) NM 6.8% 0.6x NM LogMeIn, Inc. United States 22.70 -47% 563.1 357.8 205.2 - 134.2 14.6 10.9% 13.7% 2.7x 24.5xLSI Corporation United States 7.04 -23% 3,896.0 3,220.0 676.0 - 2,506.1 610.0 24.3% 22.6% 1.3x 5.3xMelbourne IT Ltd. Australia 2.09 0% 172.0 194.0 17.0 38.6 186.3 27.2 14.6% 1.5% 1.0x 7.1xMicron Technology Inc. United States 7.56 -17% 7,724.7 9,605.7 2,271.0 3,435.0 7,978.0 1,393.0 17.5% -7.5% 1.2x 6.9xMicrosoft Corporation United States 27.45 -17% 229,927.9 176,047.9 68,098.0 14,218.0 72,930.0 28,867.0 39.6% 1.2% 2.4x 6.1xMIPS Technologies, Inc. * United States 7.86 -1% 426.0 294.7 131.3 - 82.2 9.3 11.4% 17.2% 3.6x 31.5xNEC Corporation Japan 2.45 -9% 6,354.3 12,814.5 2,646.1 8,678.7 39,047.9 2,506.2 6.4% -1.6% 0.3x 5.1xNetApp, Inc. United States 36.00 -23% 12,898.2 8,556.6 5,571.0 1,229.4 6,253.8 815.0 13.0% 10.0% 1.4x 10.5xOracle Corporation United States 35.51 -1% 168,114.9 154,603.9 33,695.0 19,757.0 37,230.0 17,300.0 46.5% 1.4% 4.2x 8.9xProAct IT Group AB Sweden 15.76 -35% 146.7 182.9 4.4 37.9 367.9 23.1 6.3% 20.4% 0.5x 7.9xQUALCOMM Incorporated United States 66.02 -4% 113,430.9 100,175.9 13,275.0 - 20,458.0 7,226.0 35.3% 25.6% 4.9x 13.9x
24M&A & INVESTMENT SUMMARY JANUARY 2013
Q p , , , , , 35.3% 25.6% 4.9x 13.9xQualys, Inc. * United States 13.10 -20% 411.5 452.2 25.8 2.6 87.4 8.3 9.5% 0.0% 5.2x 54.4xQuantum Corporation * United States 1.36 -53% 327.4 481.1 51.3 205.0 607.9 0.3 0.1% -7.5% 0.8x NM Rackspace Hosting, Inc. * United States 75.35 -7% 10,319.0 10,211.5 257.7 150.1 1,239.6 372.5 30.0% 29.6% 8.2x 27.4xRed Hat, Inc. * United States 55.56 -11% 10,733.9 9,847.5 886.3 - 1,277.9 263.8 20.6% 18.2% 7.7x 37.3x

TECHNOLOGY PUBLIC COMPANY VALUATION($ in millions, except stock price data)
Stock Price Chg % From Equity Ent. Cash & ST. Total LTM LTM Margin LTM LTM Multiples S oc ce C g % o qu y Cas & S o a a g u p esCompany Name Headquarters 01/31/13 52WK High Value Value Investments Debt Revenue EBITDA EBITDA Rev Growth EV/Rev EV/EBITDASanDisk Corp. United States 49.99 -3% 12,087.0 10,903.8 2,875.5 1,696.6 5,052.5 1,030.8 20.4% -10.8% 2.2x 10.6xSAP AG Germany 81.74 -4% 97,473.6 101,040.3 3,466.3 6,918.1 21,388.4 6,506.7 30.4% 14.0% 4.7x 15.5xSeagate Technology Public Limited Company Ireland 33.98 -10% 12,194.1 13,154.1 1,872.0 2,818.0 16,332.0 4,341.0 26.6% 41.3% 0.8x 3.0xSilicon Graphics International Corp. * United States 14.54 -3% 481.7 357.6 124.1 - 743.0 (6.4) NM 4.2% 0.5x NM SK Hynix, Inc. South Korea 22.44 -21% 15,574.9 20,105.0 1,610.6 6,037.1 8,981.2 2,328.8 25.9% -5.6% 2.2x 8.6xSony Corporation Japan 14.94 -26% 15,098.7 20,676.0 15,704.5 16,389.0 83,695.5 3,426.4 4.1% -4.9% 0.2x 6.0xSymantec Corporation United States 21.77 -2% 15,003.6 13,827.6 4,252.0 3,076.0 6,839.0 1,839.0 26.9% 1.7% 2.0x 7.5xTechno Mathematical Co. Ltd. Japan 1,380.63 -7% 35.5 5.6 35.0 - 10.6 0.7 6.9% 7.8% 0.5x 7.7xTeradata Corporation United States 66.66 -18% 11,272.2 10,641.2 909.0 278.0 2,598.0 647.0 24.9% 16.1% 4.1x 16.4xp , , , 24.9% 16.1% 4.1x 16.4xTrend Micro Inc. Japan 29.29 -2% 3,853.4 2,634.6 1,427.1 - 1,201.6 391.2 32.6% -3.1% 2.2x 6.7xUnisys Corporation United States 22.21 -3% 976.7 531.4 655.6 210.3 3,706.4 373.9 10.1% -3.8% 0.1x 1.4xVeriSign, Inc. United States 43.41 -13% 6,658.7 5,799.9 1,556.4 697.6 873.6 511.4 58.5% 13.2% 6.6x 11.3xVMware, Inc. United States 76.48 -36% 32,786.1 28,605.2 4,630.8 450.0 4,605.0 1,230.7 26.7% 22.2% 6.2x 23.2xWestern Digital Corporation United States 47.00 -5% 11,449.3 9,761.3 3,816.0 2,128.0 15,648.0 3,792.0 24.2% 67.5% 0.6x 2.6x
3.2x 10.2x
*Calculation is market cap weighted and excludes revenue multiples that are 2.0 standard deviations above the mean (7.0x)and EBITDA multiples that are 1.0 standard deviations above the mean (24.5x)
Adjusted Weighted Average
25M&A & INVESTMENT SUMMARY JANUARY 2013

SOFTWARETransactions by Subsegment and Buyer Type
• Healthcare Software was again the most active and highest value subsegment with 16 transactions worth $440 million in reported value
• Select acquisitions› Athenahealth’s $292 million acquisition of Epocrates, a provider of subscriptions for mobile drug reference
tools and electronic health records to healthcare professionals, and interactive services to the healthcare i d t Th d l i E t t i l f $213 1 illiindustry. The deal gives Epocrates an enterprise value of $213.1 million
› JLL Partners’ acquisition of BioClinica, which provides integrated clinical research technology solutions to pharmaceutical, biotechnology, and medical device companies, at an enterprise value of $104.5 million
› CoreLogic’s $78 million acquisition of CDS Business Mapping, which creates and implements mapping solutions using geographic information systems technology
• Select investments› The $150 million investment in SevOne, a provider of IT infrastructure management solutions, led by Bain
Capital Ventures
SOFTWARE TRANSACTIONS BY SEGMENT BUYER/INVESTOR BREAKDOWN
Transactions Reported Value Strategic Buyout Venture/Growth Capital
# % $MM % # $MM # $MM # $MM
Healthcare 16 25% 440.2 46% 6 258.1 1 104.5 9 77.6
Security 10 16% 96.0 10% 1 - 1 - 8 96.0
ERP 8 13% 0.0 0% 6 - 1 - 1 -
HR 6 10% 21.7 2% 2 - 0 - 4 21.7
I f t t 5 8% 162 3 17% 2 0 3 162 3
Transactions Reported Value Strategic Buyout Venture/Growth Capital
Infrastructure 5 8% 162.3 17% 2 - 0 - 3 162.3
Application Management 4 6% 71.0 7% 1 - 0 - 3 71.0
Engineering 3 5% 1.0 0% 1 - 0 - 2 1.0
Collaboration 2 3% 11.5 1% 0 - 0 - 2 11.5
Data Management 2 3% 44.6 5% 0 - 1 10.6 1 34.0
Other* 7 11% 106.9 11% 2 78.0 0 - 5 28.9
26M&A & INVESTMENT SUMMARY JANUARY 2013
Total 63 100% 955 100% 21 336 4 115 38 504
*Other includes Financial, Geo-Demo, Legal, and Software Development Tools

SOFTWARE PUBLIC COMPANY VALUATIONS($ in millions, except stock price data)
Financial & Credit/Risk Management SoftwareStock Price Chg % From Equity Ent. Cash & ST. Total LTM LTM Margin LTM LTM Multiples
Company Name Headquarters 01/31/13 52WK High Value Value Investments Debt Revenue EBITDA EBITDA Rev Growth EV/Rev EV/EBITDAAdvent Software, Inc. United States 24.65 -13% 1,237.3 1,138.9 144.7 46.3 353.1 70.1 19.9% 11.9% 3.2x 16.2xEbix Inc. United States 16.34 -39% 622.0 674.6 31.0 83.6 189.4 78.0 41.2% 18.4% 3.6x 8.6xEPIQ Systems, Inc. United States 12.34 -10% 443.0 672.7 3.3 233.0 325.1 75.2 23.1% 28.5% 2.1x 8.9xFidessa group plc United Kingdom 24.39 -13% 901.4 821.1 79.5 - 443.1 90.6 20.4% 4.3% 1.9x 9.1xGuidewire Software, Inc. * United States 33.12 -13% 1,835.0 1,649.5 185.5 - 243.0 18.7 7.7% 27.8% 6.8x 88.0xInnovation Group plc United Kingdom 0.39 -3% 378.2 340.6 72.0 30.0 312.3 35.9 11.5% 10.2% 1.1x 9.5xManagement Consulting Group PLC United Kingdom 0.41 -35% 202.2 258.9 19.4 75.4 460.8 40.1 8.7% -0.3% 0.6x 6.5xPerformant Financial Corporation United States 12.70 -4% 576.5 694.8 32.2 150.5 196.7 65.2 33.1% 0.0% 3.5x 10.7x
/ g
SS&C Technologies Holdings, Inc. United States 22.63 -16% 1,784.5 2,775.0 80.3 1,070.8 475.8 179.6 37.8% 31.7% 5.8x 15.5xTemenos Group AG Switzerland 20.44 -8% 1,408.7 1,591.0 72.6 248.9 443.0 47.0 10.6% -10.7% 3.6x 33.9x
Adjusted Weighted Average 4.2x 16.4x
Healthcare SoftwareStock Price Chg % From Equity Ent. Cash & ST. Total LTM LTM Margin LTM LTM Multiples
Company Name Headquarters 01/31/13 52WK High Value Value Investments Debt Revenue EBITDA EBITDA Rev Growth EV/Rev EV/EBITDA
*Calculation is market cap weighted and excludes revenue multiples that are 2.0 standard deviations above the mean (7.1x)and EBITDA multiples that are 1.0 standard deviations above the mean (45.6x)
Company Name Headquarters 01/31/13 52WK High Value Value Investments Debt Revenue EBITDA EBITDA Rev Growth EV/Rev EV/EBITDAAccelrys Inc. United States 9.42 -5% 524.1 383.2 140.9 - 158.1 14.9 9.4% 16.3% 2.4x 25.8xAllscripts Healthcare Solutions, Inc. United States 11.08 -49% 1,899.8 2,267.8 93.7 461.7 1,483.6 227.2 15.3% 9.0% 1.5x 10.0xAthenahealth, Inc. * United States 86.47 -11% 3,136.4 2,956.2 180.2 - 398.5 50.0 12.5% 32.4% 7.4x 59.2xCegedim SA France 29.15 -28% 407.1 1,060.1 72.7 681.5 1,151.6 181.8 15.8% -5.3% 0.9x 5.8xCerner Corporation United States 82.55 -7% 14,162.6 13,320.4 1,039.0 196.7 2,517.7 687.4 27.3% 23.1% 5.3x 19.4xComputer Programs & Systems Inc. United States 52.61 -18% 582.8 563.2 19.6 - 183.3 44.4 24.2% 5.7% 3.1x 12.7xCraneware plc United Kingdom 6.18 -19% 166.8 137.7 28.8 - 41.1 11.3 27.6% 7.7% 3.4x 12.1xEpocrates, Inc. United States 11.68 -2% 290.9 211.7 79.1 - 110.1 (2.5) NM -3.4% 1.9x NM Greenway Medical Technologies, Inc. * United States 14.90 -24% 440.5 405.9 34.6 - 131.1 7.7 5.8% 32.5% 3.1x 53.0xMcKesson Corporation United States 105.23 -2% 24,506.9 26,259.9 2,726.0 4,479.0 123,534.0 2,967.0 2.4% 3.0% 0.2x 8.9xMcKesson Corporation United States 105.23 2% 24,506.9 26,259.9 2,726.0 4,479.0 123,534.0 2,967.0 2.4% 3.0% 0.2x 8.9xMedAssets, Inc. United States 19.55 -2% 1,154.5 2,062.5 8.2 916.2 633.1 193.5 30.6% 19.8% 3.3x 10.7xMerge Healthcare Incorporated United States 2.69 -61% 250.5 457.0 44.0 250.0 248.3 45.7 18.4% 15.8% 1.8x 10.0xQuality Systems Inc. United States 18.24 -59% 1,085.9 979.2 106.7 - 457.9 108.5 23.7% 9.6% 2.1x 9.0xStreamline Health Solutions, Inc. United States 5.43 -18% 68.6 79.0 10.5 17.9 21.5 2.7 12.6% 23.0% 3.7x 29.0x
Adjusted Weighted Average 2.1x 12.5x
*Calculation is market cap weighted and excludes revenue multiples that are 2.0 standard deviations above the mean (6.8x)and EBITDA multiples that are 1.0 standard deviations above the mean (45.4x)
27M&A & INVESTMENT SUMMARY JANUARY 2013

SOFTWARE PUBLIC COMPANY VALUATIONS($ in millions, except stock price data)
HR SoftwareStock Price Chg % From Equity Ent. Cash & ST. Total LTM LTM Margin LTM LTM Multiples
Company Name Headquarters 01/31/13 52WK High Value Value Investments Debt Revenue EBITDA EBITDA Rev Growth EV/Rev EV/EBITDA51job Inc. China 54.00 -16% 1,556.9 1,184.6 372.3 - 225.7 80.4 35.6% 15.1% 5.2x 14.7xConcur Technologies, Inc. United States 66.90 -12% 3,687.3 3,457.7 484.6 254.8 462.2 44.8 9.7% 25.1% 7.5x 77.1xCornerstone OnDemand, Inc. United States 32.68 0% 1,649.8 1,589.6 64.5 4.4 103.9 (25.0) NM 68.1% 15.3x NM Dice Holdings, Inc. United States 9.41 -14% 561.1 564.9 42.2 46.0 195.4 71.3 36.5% 9.1% 2.9x 7.9xLinkedIn Corporation * United States 123.79 -3% 13,301.1 12,624.4 676.6 - 836.4 104.1 12.4% 91.8% 15.1x 121.3xMonster Worldwide, Inc. United States 5.80 -44% 679.2 700.0 175.1 195.9 960.8 122.3 12.7% -5.5% 0.7x 5.7xSaba Software, Inc. United States 9.26 -29% 275.8 261.6 15.0 0.9 121.3 (9.8) NM 7.7% 2.2x NM The Ultimate Software Group, Inc. United States 101.54 -5% 2,772.2 2,701.2 81.9 10.9 312.8 36.1 11.5% 21.8% 8.6x 74.9xWorkday, Inc. * United States 53.42 -7% 8,867.7 8,097.4 797.4 27.0 235.3 (84.0) NM 0.0% 34.4x NM
Adjusted Weighted Average 11.8x 56.5x
Other SoftwareStock Price Chg % From Equity Ent. Cash & ST. Total LTM LTM Margin LTM LTM Multiples
Company Name Headquarters 01/31/13 52WK High Value Value Investments Debt Revenue EBITDA EBITDA Rev Growth EV/Rev EV/EBITDAAllocate Software plc. United Kingdom 1.27 -11% 81.5 74.6 12.8 6.2 56.3 8.0 14 2% 21 7% 1 3x 9 3x
*Calculation is market cap weighted and excludes revenue multiples that are 2.0 standard deviations above the mean (14.1x)and EBITDA multiples that are 1.0 standard deviations above the mean (75.2x)
Allocate Software plc. United Kingdom 1.27 11% 81.5 74.6 12.8 6.2 56.3 8.0 14.2% 21.7% 1.3x 9.3xAnsys, Inc. United States 73.60 -1% 6,818.1 6,342.5 555.3 79.7 775.5 368.5 47.5% 17.5% 8.2x 17.2xAveva Group plc United Kingdom 34.25 -4% 2,328.5 2,064.8 268.3 - 335.9 99.7 29.7% 15.3% 6.1x 20.7xAVG Technologies N.V. Netherlands 13.70 -16% 740.0 806.2 86.7 152.9 335.1 98.7 29.4% 31.1% 2.4x 8.2xCheck Point Software Technologies Ltd. Israel 50.00 -23% 10,240.0 8,736.7 1,503.3 - 1,342.7 761.4 56.7% 7.7% 6.5x 11.5xCommVault Systems, Inc. United States 76.73 -3% 3,489.7 3,092.4 397.2 - 471.6 77.6 16.5% 23.4% 6.6x 39.8xDaegis Inc. United States 1.25 -36% 18.4 32.9 4.0 18.6 40.9 3.0 7.4% -12.7% 0.8x 10.9xDassault Systemes SA France 111.21 -7% 13,755.9 12,180.2 1,878.4 368.2 2,538.9 790.1 31.1% 14.0% 4.8x 15.4xE2open, Inc. * United States 17.85 -11% 447.4 415.0 33.5 1.1 74.4 4.4 5.9% 22.2% 5.6x 94.4xFortinet Inc. United States 23.59 -18% 3,773.0 3,359.3 413.7 - 533.6 112.0 21.0% 23.1% 6.3x 30.0xGuidance Software, Inc. United States 12.75 -3% 320.3 291.0 30.0 0.7 123.1 7.4 6.0% 22.3% 2.4x 39.1xInformatica Corporation United States 37.01 -32% 3,993.6 3,460.5 535.6 - 811.6 180.3 22.2% 3.5% 4.3x 19.2xRealPage, Inc. * United States 23.34 -19% 1,760.6 1,749.4 36.2 25.0 307.6 34.1 11.1% 27.7% 5.7x 51.2xSage Group plc United Kingdom 5.11 -2% 5,492.1 5,722.7 99.3 337.3 2,160.7 639.4 29.6% 0.5% 2.6x 8.9xServiceNow, Inc. * United States 27.72 -34% 3,465.6 3,209.1 256.5 - 226.4 (28.7) NM 0.0% 14.2x NM Sourcefire, Inc. * United States 42.60 -29% 1,281.8 1,113.8 168.0 - 208.9 19.5 9.3% 38.9% 5.3x 57.1xSymantec Corporation United States 21.77 -2% 15,003.6 13,827.6 4,252.0 3,076.0 6,839.0 1,839.0 26.9% 1.7% 2.0x 7.5xTrend Micro Inc. Japan 29.29 -2% 3,853.4 2,634.6 1,427.1 - 1,201.6 391.2 32.6% -3.1% 2.2x 6.7xTyler Technologies, Inc. United States 54.05 -1% 1,651.7 1,679.6 0.1 28.0 350.0 67.9 19.4% 16.8% 4.8x 24.7xWebsense, Inc. United States 14.63 -34% 534.0 537.4 64.6 68.0 361.5 61.9 17.1% -0.7% 1.5x 8.7x
dj d i h dAdjusted Weighted Average 4.6x 14.9x
*Calculation is market cap weighted and excludes revenue multiples that are 2.0 standard deviations above the mean (8.6x)and EBITDA multiples that are 1.0 standard deviations above the mean (50.2x)
28M&A & INVESTMENT SUMMARY JANUARY 2013

COMMUNICATIONSTransactions by Subsegment and Buyer Type
• There were 16 transaction in the Communications segment in January. The most active and highest value subsegment was Enterprise Mobility, with seven deals announced
• Select acquisitions› Cisco Systems’ $475 million acquisition of Israel-based mobile networking startup Intucell, which provides
self-optimizing network solutions to mobile operators› The Flexitallic Group’s $55 million acquisition of Telanetix, a provider of cloud-based communications
software solutions› Danaher ‘s acquisition of Navman Wireless, a provider of GPS solutions for fleets and heavy equipment
operators• Select investments
› The $6 million investment in Zoom Video Communications, a company offering a cloud-based video collaboration service
# % $MM % # $MM # $MM # $MM
COMMUNICATIONS TRANSACTIONS BY SEGMENT BUYER/INVESTOR BREAKDOWN
Transactions Reported Value Strategic Buyout Venture/Growth Capital
# % $MM % # $MM # $MM # $MM
Enterprise Mobility 7 44% 7.7 1% 2 - 0 - 5 7.7
Communications Software 4 25% 60.3 11% 3 55.0 0 - 1 5.3
Networking Equipment 4 25% 475.0 87% 3 475.0 0 - 1 -
Video Communications Software 1 6% 6.0 1% 0 - 0 - 1 6.0
Total 16 100% 549 100% 8 530 0 0 8 19
29M&A & INVESTMENT SUMMARY JANUARY 2013

COMMUNICATIONS PUBLIC COMPANY VALUATION($ in millions, except stock
Stock Price Chg % From Equity Ent. Cash & ST. Total LTM LTM Margin LTM LTM Multiples Stock Price Chg % From Equity Ent. Cash & ST. Total LTM LTM Margin LTM LTM Multiples Company Name Headquarters 01/31/13 52WK High Value Value Investments Debt Revenue EBITDA EBITDA Rev Growth EV/Rev EV/EBITDAAastra Technologies Ltd. Canada $18.00 -18% $207.6 $109.0 $100.4 0.3 $640.7 $46.0 7.2% -10.9% 0.2x 2.4xAcme Packet, Inc. * United States 24.17 -33% 1,630.2 1,266.7 363.5 - 286.7 28.4 9.9% -2.7% 4.4x 44.6xADTRAN Inc. United States 20.20 -48% 1,266.0 1,083.0 228.9 46.0 620.6 70.2 11.3% -13.5% 1.7x 15.4xAdvanced Media, Inc. Japan 677.71 -13% 103.4 74.2 34.2 - 15.5 (2.7) NM -20.1% 4.8x NM Alcatel-Lucent, S.A. France 1.67 -37% 3,798.9 5,019.9 6,042.5 6,136.3 18,622.0 900.3 4.8% -7.6% 0.3x 5.6xAllot Communications Ltd. Israel 13.79 -53% 436.5 292.4 144.1 - 100.4 15.6 15.5% 39.6% 2.9x 18.8xAmbient Corporation United States 2.80 -71% 46.7 31.4 15.3 - 50.6 (3.0) NM -5.9% 0.6x NM Anaren, Inc. United States 19.57 -6% 258.5 231.4 35.1 8.0 150.0 23.9 16.0% -9.5% 1.5x 9.7xAruba Networks Inc * United States 23 04 8% 2 591 4 2 213 9 377 5 541 9 33 9 6 3% 25 2% 4 1 65 3Aruba Networks, Inc. * United States 23.04 -8% 2,591.4 2,213.9 377.5 - 541.9 33.9 6.3% 25.2% 4.1x 65.3xAudioCodes Ltd. Israel 3.68 -9% 139.5 129.3 33.5 23.3 127.5 (0.9) NM -18.2% 1.0x NM Aviat Networks, Inc. United States 3.75 -4% 229.7 145.7 94.8 10.8 471.6 13.2 2.8% 4.2% 0.3x 11.0xAxesstel Inc. United States 1.65 -15% 39.8 50.1 1.6 11.9 60.8 5.4 8.9% 29.6% 0.8x 9.2xBlackline GPS Corp. * Canada 1.45 -6% 25.5 19.0 6.5 0.1 2.6 (3.0) NM 37.1% 7.2x NM Blonder Tongue Laboratories United States 1.38 -19% 8.6 16.4 0.2 8.0 29.4 (0.4) NM 6.0% 0.6x NM BroadSoft, Inc. United States 33.97 -25% 945.6 854.2 177.6 86.2 159.6 31.0 19.4% 19.7% 5.4x 27.5xBrocade Communications United States 5.72 -11% 2,609.3 2,497.3 713.2 601.2 2,237.8 469.9 21.0% 4.2% 1.1x 5.3xCalAmp Corp. United States 8.56 -12% 243.7 235.5 13.6 5.3 169.8 16.7 9.8% 30.6% 1.4x 14.1xCalix Inc. United States 8.14 -33% 394.1 336.7 57.4 - 330.4 (0.4) NM -4.2% 1.0x NM CIENA Corp. * United States 15.66 -15% 1,575.6 2,325.1 692.5 1,442.0 1,833.9 61.6 3.4% 5.3% 1.3x 37.7xCisco Systems, Inc. United States 20.57 -3% 109,211.2 80,553.2 45,000.0 16,327.0 46,681.0 13,233.0 28.3% 6.8% 1.7x 6.1xClearfield, Inc. United States 5.26 -14% 67.6 51.5 16.1 - 38.6 4.6 11.9% 3.9% 1.3x 11.2xClearOne, Inc. United States 6.95 -2% 63.9 49.6 14.3 - 45.3 7.1 15.5% -3.0% 1.1x 7.0xCOM DEV International Ltd. Canada 3.23 -6% 246.5 248.3 25.8 20.3 208.4 29.8 14.3% 2.2% 1.2x 8.3xCommunications Systems Inc. United States 11.14 -28% 94.4 66.8 29.3 1.7 103.8 5.0 4.8% -30.1% 0.6x 13.4xComverse Technology Inc. United States 4.36 -37% 956.4 1,443.7 237.0 592.6 1,634.3 158.0 9.7% 63.2% 0.9x 9.1xCorning Inc. United States 12.00 -18% 17,734.1 15,095.1 6,144.0 3,458.0 8,012.0 2,465.0 30.8% 1.5% 1.9x 6.1xCTX Virtual Technologies, Inc. United States 1.01 -47% 8.1 8.0 0.1 - 40.0 (0.5) NM 16.6% 0.2x NM DDS Wireless International Inc Canada 1 77 -31% 24 5 18 0 6 6 - 41 8 3 5 8 3% -11 5% 0 4x 5 2xDDS Wireless International Inc. Canada 1.77 31% 24.5 18.0 6.6 41.8 3.5 8.3% -11.5% 0.4x 5.2xDialogic, Inc. United States 2.31 -71% 33.3 105.6 2.7 74.9 172.1 (9.3) NM -15.5% 0.6x NM Digi International Inc. United States 9.80 -22% 257.9 156.4 101.5 - 190.9 20.5 10.7% -5.7% 0.8x 7.6xDragonWave Inc. Canada 2.08 -58% 79.1 62.0 36.4 19.1 104.7 (47.8) NM 102.9% 0.6x NM EchoStar Corp. United States 36.38 -2% 3,178.8 4,128.5 1,556.7 2,497.3 3,169.7 603.3 19.0% 29.9% 1.3x 6.8xEmulex Corporation United States 7.64 -32% 684.9 473.7 186.4 - 496.1 78.7 15.9% 2.8% 1.0x 6.0xEricsson Sweden 11.63 -4% 37,365.8 30,064.5 11,780.8 4,402.7 34,982.1 4,926.5 14.1% 0.4% 0.9x 6.1xExtreme Networks Inc. United States 3.69 -17% 345.9 220.9 125.0 - 312.7 17.8 5.7% -4.4% 0.7x 12.4xF5 Networks, Inc. United States 104.88 -25% 8,241.1 7,723.3 517.7 - 1,420.3 474.8 33.4% 17.8% 5.4x 16.3xFinisar Corp. United States 15.50 -34% 1,439.2 1,225.2 262.4 40.0 935.4 73.8 7.9% -3.5% 1.3x 16.6xFl t ti G Li it d * I l d 25 07 9% 867 0 1 022 3 9 0 33 0 117 5 19 8 Fleetmatics Group Limited * Ireland 25.07 -9% 867.0 1,022.3 9.0 33.0 117.5 19.8 16.9% 0.0% 8.7x 51.5xFranklin Wireless Corp. United States 1.77 -29% 18.3 6.2 12.9 0.1 34.3 1.2 3.4% 3.6% 0.2x 5.2xHarmonic Inc. United States 5.23 -22% 605.5 404.4 201.2 - 530.5 35.1 6.6% -3.4% 0.8x 11.5xHarris Corporation United States 46.20 -12% 5,213.7 6,818.8 328.1 1,929.9 5,217.2 1,126.4 21.6% -2.6% 1.3x 6.1xHuawei Technology Co., Ltd. China 1.54 -32% 216.3 138.1 77.7 - 69.2 7.3 10.5% -14.1% 2.0x 18.9xInfoblox Inc. United States 18.85 -22% 891.1 723.0 168.2 - 179.4 (1.9) NM 25.4% 4.0x NM Interactive Intelligence Group * United States 40.22 -2% 777.5 717.9 59.5 - 224.5 14.1 6.3% 10.9% 3.2x 50.9xJDS Uniphase Corporation United States 14.51 -4% 3,393.4 2,889.1 709.9 205.6 1,707.3 178.3 10.4% -2.7% 1.7x 16.2xJuniper Networks, Inc. United States 22.38 -11% 11,538.6 9,688.5 2,849.3 999.2 4,365.4 543.9 12.5% -1.9% 2.2x 17.8xKVH Industries Inc. United States 14.56 -2% 216.4 194.7 32.9 11.2 129.5 8.2 6.3% 20.3% 1.5x 23.8x
30M&A & INVESTMENT SUMMARY JANUARY 2013
Meru Networks, Inc. United States 3.18 -41% 57.8 44.6 22.9 9.7 97.5 (25.4) NM 7.8% 0.5x NM Mitel Networks Corporation Canada 3.63 -29% 194.8 421.1 87.4 313.7 592.1 79.8 13.5% -1.3% 0.7x 5.3xMotorola Solutions, Inc. United States 58.39 -2% 16,378.4 14,663.4 3,603.0 1,863.0 8,698.0 1,489.0 17.1% 6.0% 1.7x 9.8xNetgear Inc. United States 35.11 -19% 1,343.8 981.3 362.4 - 1,270.6 148.2 11.7% 12.4% 0.8x 6.6x

COMMUNICATIONS PUBLIC COMPANY VALUATION($ in millions, except stock
Stock Price Chg % From Equity Ent. Cash & ST. Total LTM LTM Margin LTM LTM Multiples Stock Price Chg % From Equity Ent. Cash & ST. Total LTM LTM Margin LTM LTM Multiples Company Name Headquarters 01/31/13 52WK High Value Value Investments Debt Revenue EBITDA EBITDA Rev Growth EV/Rev EV/EBITDANokia Corporation Finland 3.91 -34% 14,526.4 9,856.8 13,676.6 7,316.2 39,786.4 (1,431.9) NM -21.9% 0.2x NM Nuance Communications, Inc. United States 24.05 -23% 7,541.5 8,532.3 1,129.8 2,115.9 1,651.5 380.0 23.0% 25.2% 5.2x 22.5xNumerex Corp. * United States 12.41 -10% 222.4 220.5 6.8 4.8 63.7 5.1 8.0% 9.6% 3.5x 43.3xOptical Cable Corp. United States 4.16 -19% 26.2 34.1 0.6 9.1 83.5 6.6 7.9% 13.9% 0.4x 5.2xPalo Alto Networks, Inc. * United States 55.36 -24% 3,789.4 3,467.8 321.6 - 284.0 0.9 0.3% 86.7% 12.2x NM PCTEL, Inc. United States 7.42 -5% 130.4 82.6 47.8 0.0 83.0 4.9 5.9% 10.1% 1.0x 17.0xPHAZAR CORP United States 1.75 -38% 4.2 3.4 0.8 - 6.4 (1.4) NM -12.8% 0.5x NM Plantronics, Inc. United States 41.12 -3% 1,714.6 1,405.7 328.9 20.0 735.6 147.5 20.1% 3.8% 1.9x 9.5xPol com Inc United States 11 03 51% 1 935 0 1 260 8 674 3 1 392 6 125 3 9 0% 6 9% 0 9 10 1Polycom, Inc. United States 11.03 -51% 1,935.0 1,260.8 674.3 - 1,392.6 125.3 9.0% -6.9% 0.9x 10.1xProcera Networks, Inc. United States 16.83 -35% 326.0 193.0 133.0 - 58.7 6.6 11.3% 61.7% 3.3x 29.2xQUALCOMM Incorporated United States 66.02 -4% 113,430.9 100,175.9 13,275.0 31.0 20,458.0 7,226.0 35.3% 25.6% 4.9x 13.9xRadiSys Corporation United States 3.90 -52% 110.5 113.6 31.8 34.9 296.3 10.7 3.6% -6.9% 0.4x 10.6xRadware Ltd. Israel 36.37 -11% 801.7 713.5 88.2 - 189.2 41.2 21.8% 13.3% 3.8x 17.3xRELM Wireless Corp. United States 1.66 -21% 22.5 16.3 6.2 0.0 27.6 3.0 10.9% 16.1% 0.6x 5.4xBlackBerry Canada 12.92 -30% 6,653.3 3,939.7 2,731.0 - 12,589.0 1,554.0 12.3% -36.4% 0.3x 2.5xRiverbed Technology, Inc. United States 19.40 -34% 3,112.3 2,579.2 533.1 - 802.3 131.9 16.4% 16.4% 3.2x 19.6xSandvine Corporation Canada 1.78 -11% 246.6 183.2 70.0 6.2 87.9 (0.6) NM -2.7% 2.1x NM ShoreTel, Inc. United States 4.29 -29% 250.5 218.4 52.1 20.0 284.4 (12.6) NM 29.3% 0.8x NM Sierra Wireless Inc. Canada 11.36 -2% 347.6 288.9 59.5 - 627.5 40.0 6.4% 4.9% 0.5x 7.2xSolera Holdings Inc. United States 54.81 -3% 3,771.8 4,478.8 542.9 1,150.1 787.2 336.0 42.7% 8.7% 5.7x 13.3xSonus Networks, Inc. United States 2.27 -27% 637.3 368.6 279.2 10.5 253.3 (7.7) NM -5.6% 1.5x NM Sycamore Networks Inc. United States 2.30 -89% 66.4 (79.1) 145.5 - 54.0 (13.5) NM 3.1% NM 5.8xSymmetricom Inc. United States 5.39 -24% 220.4 149.6 70.8 - 228.6 13.3 5.8% 0.9% 0.7x 11.3xTeleCommunication Systems United States 2.26 -27% 131.3 247.4 51.5 167.6 487.4 38.6 7.9% 14.6% 0.5x 6.4xTelcoware Co Ltd South Korea 9.17 -13% 64.6 12.0 - - 51.6 6.9 13.4% 0.0% 0.2x 1.7xTellabs Inc. United States 2.28 -46% 838.0 (103.8) 799.5 195.1 1,052.6 12.3 1.2% -18.1% NM NM TESSCO Technologies Inc. United States 22.35 -16% 179.6 179.8 2.6 2.8 788.9 33.5 4.2% 17.9% 0.2x 5.4xTransmode Holding AB Sweden 12 18 11% 338 6 288 5 48 5 153 0 27 4 17 9% 15 5% 1 9 10 5Transmode Holding AB Sweden 12.18 -11% 338.6 288.5 48.5 - 153.0 27.4 17.9% 15.5% 1.9x 10.5xUbiquitous Corporation * Japan 910.19 -12% 77.6 64.9 14.9 - 11.6 1.1 9.1% -26.2% 5.6x 61.6xVecima Networks Inc. Canada 4.65 -15% 103.8 82.2 26.1 4.2 102.2 9.4 9.2% 28.7% 0.8x 8.8xVerint Systems Inc. United States 33.80 -4% 1,355.5 2,048.1 192.0 592.6 822.6 147.1 17.9% 8.6% 2.5x 13.9xViaSat Inc. United States 38.41 -23% 1,690.6 2,108.1 136.1 549.4 970.1 116.6 12.0% 16.8% 2.2x 18.1xVonage Holdings Corporation United States 2.61 -17% 576.4 567.4 74.7 65.7 851.1 127.7 15.0% -2.4% 0.7x 4.4xWestell Technologies, Inc. United States 1.83 -27% 110.1 (9.4) 119.6 - 46.2 (6.0) NM -61.6% NM 1.6xZTE Corp. * China 1.75 -40% 6,119.5 9,636.4 2,413.8 5,634.8 14,179.0 119.0 0.8% 9.1% 0.7x 81.0x
2.7x 10.3xAdjusted Weighted Average
*Calculation is market cap weighted and excludes revenue multiples that are 2.0 standard deviations above the mean (6.2x)and EBITDA multiples that are 1.0 standard deviations above the mean (32.0x)
31M&A & INVESTMENT SUMMARY JANUARY 2013

INFORMATION & BUSINESS SERVICESTransactions by Subsegment and Buyer Type
• Financial Information and Marketing Research were the most active Information subsegments with eight deals announced each, while IT Consulting/Systems Integration was the most active Business Services subsegment with 12 deals announced
• Select acquisitions› CVC Capital Partners’ $1.5 billion acquisition of Cerved, an Italy-based credit data and business intelligence
company› Thomson Reuters’ acquisition of U.K.-based legal services company Practical Law Group, which provides legal
know-how , transactional analysis, and market intelligence services for lawyers, for between $325 million and $490 million
› Investcorp’s $200 million acquisition of FishNet Consulting, a provider of enterprise information security solutions and consultingsolutions and consulting
• Select investments› The $103 million investment in Lynda.com, a provider of online computer skills training for consumers,
businesses, and schools, from Accel Partners, Spectrum Equity, and Meritech Capital PartnersINFORMATION & BUSINESS SERVICES TRANSACTIONS BY SEGMENT BUYER/INVESTOR BREAKDOWN
Transactions Reported Value Strategic Buyout Venture/Growth Capital
# % $MM % # $MM # $MM # $MM
IT Consulting/Systems Integration 14 22% 1,230.0 36% 7 - 4 1,150.0 3 80.0
Financial Information 8 13% 81.7 2% 3 23.5 0 - 5 58.2
Market Research 8 13% 14.5 0% 5 - 1 - 2 14.5
Healthcare Information 6 9% 20.0 1% 5 - 0 - 1 20.0
Corporate Training 5 8% 130.5 4% 1 - 2 - 2 130.5
Transactions Reported Value Strategic Buyout Venture/Growth Capital
Engineering/Scientific/Tech Information 4 6% 37.0 1% 2 - 0 - 2 37.0
Staffing 4 6% 36.6 1% 2 2.0 0 - 2 34.6
BPO 2 3% 2.3 0% 1 - 0 - 1 2.3
Contact Center 2 3% - 0% 1 - 0 - 1 -
Geo-Demographic Information 2 3% - 0% 1 - 0 - 1 -
Healthcare Consulting 2 3% 1.0 0% 2 1.0 0 - 0 -
32M&A & INVESTMENT SUMMARY JANUARY 2013
Other* 7 11% 1,895.0 55% 5 405.0 1 1,490.0 1 -
Total 64 100% 3,449 100% 35 432 8 2,640 21 377
*Other includes Credit/Risk Consulting, Credit/Risk Information, Financial Consulting, HR Consulting, Legal Information, and Management Consulting

INFORMATION PUBLIC COMPANY VALUATIONS($ in millions, except stock price data)
Financial & Credit/Risk Management InformationStock Price Chg % From Equity Ent. Cash & ST. Total LTM LTM Margin LTM LTM Multiples
Company Name Headquarters 01/31/13 52WK High Value Value Investments Debt Revenue EBITDA EBITDA Rev Growth EV/Rev EV/EBITDABroadridge Financial Solutions, Inc. United States 23.57 -5% 2,880.8 3,193.4 211.8 524.4 2,322.9 343.3 14.8% 4.5% 1.4x 9.3xComputershare Limited Australia 10.92 0% 6,068.7 7,415.8 445.8 1,754.8 1,815.6 354.9 19.5% 12.6% 4.1x 20.9xCoreLogic, Inc. United States 26.24 -11% 2,557.7 3,185.1 176.6 801.9 1,502.6 295.1 19.6% 14.8% 2.1x 10.8xCoStar Group Inc. * United States 93.78 -2% 2,650.2 2,690.6 130.3 170.6 316.0 62.6 19.8% 29.6% 8.5x 43.0xDST Systems Inc. United States 66.94 -1% 3,019.0 3,689.4 431.1 1,101.5 2,576.6 302.9 11.8% 7.9% 1.4x 12.2xDun & Bradstreet Corp. United States 81.54 -6% 3,633.8 4,524.8 137.0 1,024.1 1,698.6 527.4 31.0% -2.5% 2.7x 8.6xEnvestnet, Inc. * United States 13.91 -1% 449.8 428.7 21.1 - 143.4 15.4 10.8% 19.3% 3.0x 27.8xEquifax Inc. United States 58.70 -1% 7,020.4 7,745.9 267.2 968.3 2,112.1 683.4 32.4% 9.3% 3.7x 11.3x
/ g
Experian plc Ireland 17.13 -1% 16,910.6 19,124.4 627.0 2,740.0 4,621.0 1,533.0 33.2% 14.4% 4.1x 12.5xFactSet Research Systems Inc. United States 92.52 -15% 4,088.4 3,863.1 225.2 - 820.4 311.6 38.0% 9.4% 4.7x 12.4xFair Isaac Corporation United States 45.07 -6% 1,599.7 2,012.9 90.8 504.0 696.1 191.7 27.5% 9.8% 2.9x 10.5xFidelity National Information Services, Inc. United States 37.11 -2% 10,880.6 14,992.9 576.6 4,543.8 5,888.9 1,717.6 29.2% 5.9% 2.5x 8.7xFinancial Engines, Inc. * United States 33.26 -1% 1,574.2 1,407.8 166.4 - 175.3 30.7 17.5% 28.6% 8.0x 45.9xLender Processing Services, Inc. United States 24.04 -22% 2,039.8 2,965.7 160.7 1,086.6 2,085.7 274.1 13.1% -2.7% 1.4x 10.8xMoody's Corp. United States 54.82 0% 12,219.4 12,465.4 1,541.2 1,707.5 2,543.2 1,087.6 42.8% 11.6% 4.9x 11.5xMorningstar Inc. United States 67.69 0% 3,190.3 2,850.3 341.6 - 646.3 188.4 29.1% 3.6% 4.4x 15.1xMSCI Inc. United States 33.74 -12% 4,119.5 4,550.6 434.3 865.5 929.2 415.7 44.7% 0.0% 4.9x 10.9xReis, Inc. United States 14.61 -1% 156.4 141.4 15.0 - 29.6 5.8 19.4% 12.4% 4.8x 24.6xSEI I t t C U it d St t 26 96 2% 4 661 4 4 228 3 452 2 992 5 234 7 23 % 6 8% 3 8 0SEI Investments Co. United States 26.96 2% 4,661.4 4,228.3 452.2 - 992.5 234.7 23.7% 6.8% 4.3x 18.0xThe Dolan Company United States 3.51 -68% 106.4 281.6 15.6 192.0 275.8 42.5 15.4% 0.9% 1.0x 6.6xThe McGraw-Hill Companies, Inc. United States 57.52 -1% 15,973.3 16,813.3 1,245.0 1,199.0 6,350.0 1,797.0 28.3% 2.1% 2.6x 9.4xThomson Reuters Corporation United States 30.56 -2% 25,255.0 31,917.3 850.0 7,270.0 13,456.0 3,013.0 22.4% -1.7% 2.4x 10.6xVerisk Analytics, Inc. United States 55.16 -1% 9,200.6 10,665.4 102.7 1,567.5 1,470.2 657.4 44.7% 15.5% 7.3x 16.2x
Adjusted Weighted Average 3.6x 11.9x
*Calculation is market cap weighted and excludes revenue multiples that are 2.0 standard deviations above the mean (7.9x)and EBITDA multiples that are 1.0 standard deviations above the mean (26.4x)
Healthcare InformationStock Price Chg % From Equity Ent. Cash & ST. Total LTM LTM Margin LTM LTM Multiples
Company Name Headquarters 01/31/13 52WK High Value Value Investments Debt Revenue EBITDA EBITDA Rev Growth EV/Rev EV/EBITDANational Research Corp. United States 53.78 -8% 368.6 366.9 15.0 13.3 83.5 27.1 32.5% 15.2% 4.4x 13.5xThe Advisory Board Company United States 54.24 -1% 1,889.2 1,793.9 95.2 - 413.8 66.4 16.0% 30.5% 4.3x 27.0x
Adjusted Weighted Average 4.3x 24.8x
*Calculation is market cap weighted and excludes revenue multiples that are 2.0 standard deviations above the mean (8.5x)and EBITDA multiples that are 1.0 standard deviations above the mean (30.6x)
33M&A & INVESTMENT SUMMARY JANUARY 2013

INFORMATION PUBLIC COMPANY VALUATIONS($ in millions, except stock price data)
Marketing InformationgStock Price Chg % From Equity Ent. Cash & ST. Total LTM LTM Margin LTM LTM Multiples
Company Name Headquarters 01/31/13 52WK High Value Value Investments Debt Revenue EBITDA EBITDA Rev Growth EV/Rev EV/EBITDAAcxiom Corporation United States 17.73 -7% 1,322.0 1,396.1 186.2 260.6 1,109.5 223.3 20.1% -1.9% 1.3x 6.3xAlliance Data Systems Corporation United States 157.60 -1% 7,857.3 16,178.1 893.4 9,214.2 3,641.4 1,141.2 31.3% 14.8% 4.4x 14.2xArbitron Inc. United States 46.90 -1% 1,248.7 1,211.6 37.1 - 445.3 123.2 27.7% 7.6% 2.7x 9.8xBrainjuicer Group Plc United Kingdom 3.22 -45% 40.4 36.6 3.8 - 34.5 4.8 14.0% 20.6% 1.1x 7.6xCello Group Plc United Kingdom 0.70 -6% 57.2 78.9 1.9 23.4 212.2 12.5 5.9% 8.1% 0.4x 6.3xCision AB Sweden 8.80 -11% 130.7 190.7 6.9 65.0 151.4 26.3 17.4% 1.1% 1.3x 7.2xcomScore, Inc. * United States 14.73 -38% 524.8 482.9 59.1 17.2 249.4 22.5 9.0% 12.9% 1.9x 21.5xCross Marketing Inc. Japan 29.63 -6% 90.3 82.7 11.0 1.9 67.7 8.2 12.1% 28.7% 1.2x 10.1xEbiquity plc United Kingdom 1.54 -2% 85.5 109.6 7.0 30.7 95.7 15.1 15.8% 24.6% 1.1x 7.2xGfK SE Germany 57.90 -1% 2,113.6 2,722.4 87.9 608.6 1,890.7 253.5 13.4% 8.2% 1.4x 10.7xHarris Interactive Inc. United States 1.24 -23% 71.6 65.9 10.6 4.9 142.7 10.5 7.4% -11.6% 0.5x 6.3xHarte-Hanks Inc. United States 8.19 -19% 514.1 591.6 35.8 113.3 767.7 88.9 11.6% -9.8% 0.8x 6.7xInnerWorkings Inc. * United States 13.91 -8% 694.7 759.2 9.5 74.0 764.9 34.1 4.5% 29.9% 1.0x 22.3xINTAGE Inc. Japan 23.83 -2% 239.6 232.4 65.1 56.4 490.5 62.0 12.6% 5.8% 0.5x 3.7xIpsos SA France 39.86 -3% 1,806.1 2,759.4 96.2 968.6 2,081.1 232.4 11.2% 40.3% 1.3x 11.9xKeynote Systems Inc. United States 15.60 -24% 285.0 233.8 51.2 - 125.2 17.2 13.8% 12.5% 1.9x 13.6xMacromill, Inc. Japan 11.24 -8% 313.2 289.7 97.6 67.0 192.6 48.9 25.4% 19.4% 1.5x 5.9xNeuStar, Inc. United States 45.14 -2% 2,992.4 3,312.4 269.2 589.1 791.4 337.3 42.6% 35.7% 4.2x 9.8xNielsen Holdings N V Netherlands 32 51 1% 11 774 2 18 160 2 325 0 6 706 0 5 569 0 1 380 0 24 8% 1 6% 3 3 13 2Nielsen Holdings N.V. Netherlands 32.51 -1% 11,774.2 18,160.2 325.0 6,706.0 5,569.0 1,380.0 24.8% 1.6% 3.3x 13.2xOnvia Inc. United States 3.60 -16% 30.7 18.4 12.4 0.1 22.0 (0.4) NM -8.6% 0.8x NM Solera Holdings Inc. United States 54.81 -3% 3,771.8 4,478.8 542.9 1,150.1 787.2 336.0 42.7% 8.7% 5.7x 13.3xYouGov PLC United Kingdom 1.18 -9% 112.5 101.2 11.7 0.5 91.2 7.9 8.6% 3.6% 1.1x 12.9x
Adjusted Weighted Average 3.1x 12.2x
Other Information
*Calculation is market cap weighted and excludes revenue multiples that are 2.0 standard deviations above the mean (5.9x)and EBITDA multiples that are 1.0 standard deviations above the mean (20.9x)
Stock Price Chg % From Equity Ent. Cash & ST. Total LTM LTM Margin LTM LTM Multiples Company Name Headquarters 01/31/13 52WK High Value Value Investments Debt Revenue EBITDA EBITDA Rev Growth EV/Rev EV/EBITDACorporate Executive Board Co. United States 50.11 -8% 1,681.8 2,174.2 58.2 550.6 560.9 141.1 25.2% 21.1% 3.9x 15.4xForrester Research Inc. United States 28.27 -22% 630.3 401.6 228.7 - 292.5 50.2 17.2% 6.0% 1.4x 8.0xGartner Inc. United States 51.51 -4% 4,824.2 4,779.8 255.4 211.0 1,568.8 258.4 16.5% 10.2% 3.0x 18.5xIHS Inc. United States 102.90 -13% 6,752.1 7,471.7 345.0 1,064.6 1,529.9 346.5 22.6% 15.4% 4.9x 21.6xInforma plc Switzerland 7.59 -2% 4,563.6 5,906.6 83.3 1,412.4 1,976.5 561.4 28.4% 1.8% 3.0x 10.5xNIC Inc. United States 16.30 -6% 1,053.4 980.4 73.0 - 199.0 50.1 25.2% 12.6% 4.9x 19.6xProofpoint, Inc. United States 13.15 -26% 419.3 343.1 80.7 4.4 100.3 (12.2) NM 30.0% 3.4x NM Reed Elsevier plc United Kingdom 10.89 -1% 24,088.9 29,169.6 2,673.1 2,407.7 9,635.3 2,209.0 22.9% 2.3% 3.0x 13.2xSPS Commerce Inc * United States 38 91 -6% 571 3 501 6 69 7 - 70 5 6 0 8 5% 30 4% 7 1x 84 0xSPS Commerce, Inc. * United States 38.91 -6% 571.3 501.6 69.7 - 70.5 6.0 8.5% 30.4% 7.1x 84.0xWolters Kluwer NV Netherlands 20.28 -7% 6,003.1 9,118.9 380.3 3,263.0 4,403.9 1,092.7 24.8% 4.6% 2.1x 8.3x
Adjusted Weighted Average 3.2x 14.2x
*Calculation is market cap weighted and excludes revenue multiples that are 2.0 standard deviations above the mean (7.8x)and EBITDA multiples that are 1.0 standard deviations above the mean (32.5x)
34M&A & INVESTMENT SUMMARY JANUARY 2013

BUSINESS SERVICESPUBLIC COMPANY VALUATIONS($ in millions, except stock price data)
ConsultinggStock Price Chg % From Equity Ent. Cash & ST. Total LTM LTM Margin LTM LTM Multiples
Company Name Headquarters 02/01/13 52WK High Value Value Investments Debt Revenue EBITDA EBITDA Rev Growth EV/Rev EV/EBITDACRA International Inc. United States 19.00 -32% 192.3 152.5 42.3 1.7 277.8 27.0 9.7% 0.0% 0.5x 5.6xFTI Consulting, Inc. United States 32.20 -27% 1,295.2 1,886.1 126.9 717.8 1,568.2 254.0 16.2% 2.3% 1.2x 7.4xInformation Services Group, Inc. United States 1.14 -23% 41.2 91.1 15.0 64.8 187.8 18.5 9.9% 9.6% 0.5x 4.9xNavigant Consulting Inc. United States 11.50 -21% 588.3 743.1 1.2 156.1 720.0 103.3 14.4% 4.9% 1.0x 7.2xICF International Inc. United States 23.07 -19% 450.6 559.5 6.1 115.0 919.1 88.6 9.6% 12.1% 0.6x 6.3xHuron Consulting Group Inc. United States 33.98 -15% 701.7 922.1 3.2 223.5 608.2 105.8 17.4% 10.6% 1.5x 8.7xThe Hackett Group, Inc. United States 4.46 -32% 136.0 149.4 14.5 28.0 207.7 20.0 9.6% 6.7% 0.7x 7.5xTowers Watson & Co. United States 61.65 -10% 4,596.4 4,782.3 428.2 589.4 3,441.6 658.9 19.1% 3.7% 1.4x 7.3x
Adjusted Weighted Average 1.3x 7.2x
HR ServicesStock Price Chg % From Equity Ent. Cash & ST. Total LTM LTM Margin LTM LTM Multiples
Company Name Headquarters 02/01/13 52WK High Value Value Investments Debt Revenue EBITDA EBITDA Rev Growth EV/Rev EV/EBITDAAutomatic Data Processing, Inc. United States 60.65 0% 29,444.0 28,749.9 1,153.1 459.0 10,806.9 2,364.0 21.9% 7.6% 2.7x 12.2xDice Holdings, Inc. United States 9.57 -13% 570.7 574.5 42.2 46.0 195.4 71.3 36.5% 9.1% 2.9x 8.1x
*Calculation is market cap weighted and excludes revenue multiples that are 2.0 standard deviations above the mean (5.1x)and EBITDA multiples that are 1.0 standard deviations above the mean (17.4x)
LinkedIn Corporation * United States 123.82 -3% 13,304.3 12,627.6 676.6 - 836.4 104.1 12.4% 91.8% 15.1x 121.3xMonster Worldwide, Inc. United States 5.79 -44% 678.0 698.9 175.1 195.9 960.8 122.3 12.7% -5.5% 0.7x 5.7xBarrett Business Services Inc. United States 40.23 -4% 282.1 244.3 37.8 - 373.7 9.2 2.5% 23.0% 0.7x 26.5xCapita PLC United Kingdom 12.45 -2% 8,114.2 10,529.6 305.7 2,712.7 4,921.3 871.5 17.7% 12.7% 2.1x 12.1xInsperity, Inc. United States 34.07 0% 874.3 620.4 253.9 - 2,121.5 85.5 4.0% 10.7% 0.3x 7.3xMarsh & McLennan Companies, Inc. United States 35.88 -1% 19,532.6 20,471.6 2,050.0 2,919.0 11,830.0 2,150.0 18.2% 3.7% 1.7x 9.5xPaychex, Inc. United States 32.86 -5% 11,951.7 11,650.5 301.2 - 2,268.6 972.1 42.9% 4.9% 5.1x 12.0xTowers Watson & Co. United States 61.65 -10% 4,596.4 4,782.3 428.2 589.4 3,441.6 658.9 19.1% 3.7% 1.4x 7.3xWageWorks, Inc. United States 20.20 0% 569.1 374.7 238.9 44.5 164.6 24.1 14.6% 26.3% 2.3x 15.6x
Adjusted Weighted Average 2.6x 11.1xAdjusted Weighted Average 2.6x 11.1x
*Calculation is market cap weighted and excludes revenue multiples that are 2.0 standard deviations above the mean (7.3x)and EBITDA multiples that are 1.0 standard deviations above the mean (32.0x)
35M&A & INVESTMENT SUMMARY JANUARY 2013

BUSINESS SERVICES PUBLIC COMPANY VALUATIONS($ in millions, except stock price data)
Staffing & Recruiting Servicesg gStock Price Chg % From Equity Ent. Cash & ST. Total LTM LTM Margin LTM LTM Multiples
Company Name Headquarters 01/31/13 52WK High Value Value Investments Debt Revenue EBITDA EBITDA Rev Growth EV/Rev EV/EBITDAAdecco S.A. Switzerland 57.46 -2% 10,850.7 12,316.6 1,166.1 2,580.1 26,588.3 1,173.8 4.4% 1.8% 0.5x 10.5xAMN Healthcare Services Inc. United States 12.15 -4% 539.3 731.6 3.8 173.5 928.2 63.8 6.9% 7.1% 0.8x 11.5xBrunel International NV Netherlands 53.57 -3% 1,294.6 1,205.3 83.7 - 1,431.2 99.6 7.0% 35.9% 0.8x 12.1xCDI Corp. United States 17.02 -9% 329.2 317.9 17.1 5.1 1,102.4 42.0 3.8% 6.0% 0.3x 7.6xCross Country Healthcare, Inc. United States 5.65 -16% 174.6 201.6 7.5 34.5 506.8 10.3 2.0% 2.8% 0.4x 19.6xCTPartners Executive Search Inc. United States 4.40 -38% 30.7 21.5 14.9 5.6 125.3 (2.3) NM 3.1% 0.2x NM Groupe CRIT SA France 20.71 -14% 230.0 274.1 95.8 120.3 1,938.3 67.6 3.5% 7.3% 0.1x 4.1xHarvey Nash Group plc United Kingdom 1.05 -6% 77.3 99.9 15.4 37.5 897.1 18.6 2.1% 19.9% 0.1x 5.4xHays plc United Kingdom 1.41 -5% 1,973.1 2,183.8 60.7 269.2 5,732.3 218.3 3.8% 12.2% 0.4x 10.0xHealthcare Locums Plc * United Kingdom 0.01 -87% 7.4 59.1 15.1 66.2 331.6 1.9 0.6% 7.4% 0.2x 31.4xHeidrick & Struggles International Inc. United States 15.81 -34% 284.1 157.0 127.1 - 467.1 43.9 9.4% -11.5% 0.3x 3.6xHudson Global, Inc United States 4.81 -20% 153.8 119.8 34.9 0.9 816.0 9.6 1.2% -12.3% 0.1x 12.4xImpellam Group PLC United Kingdom 5.31 -9% 235.5 256.0 31.4 51.6 1,839.7 61.3 3.3% 4.9% 0.1x 4.2xKelly Services, Inc. United States 15.94 -9% 592.0 579.8 76.3 64.1 5,450.5 97.7 1.8% -1.8% 0.1x 5.9xKforce Inc. United States 13.76 -11% 494.8 490.5 5.4 1.2 1,178.2 34.5 2.9% 17.4% 0.4x 14.2xKorn/Ferry International United States 17.18 -1% 834.9 611.8 223.2 - 767.0 84.8 11.1% -2.9% 0.8x 7.2xManpower Inc. United States 51.50 -1% 4,040.5 4,162.5 648.1 770.1 20,678.0 512.2 2.5% -6.0% 0.2x 8.1xMichael Page International plc United Kingdom 6.45 -19% 1,961.8 1,910.5 90.1 39.3 1,599.3 137.3 8.6% 8.4% 1.2x 13.9xOn Assignment Inc United States 24 45 1% 1 284 1 1 709 9 13 9 439 6 999 8 102 7 10 3% 79 6% 1 7x 16 7xOn Assignment Inc. United States 24.45 -1% 1,284.1 1,709.9 13.9 439.6 999.8 102.7 10.3% 79.6% 1.7x 16.7xProffice AB (Publ) Sweden 3.47 -25% 237.1 270.7 14.0 46.1 754.3 29.6 3.9% 7.3% 0.4x 9.1xRandstad Holding NV Netherlands 41.48 0% 7,137.7 9,090.1 254.9 2,100.9 22,127.8 703.4 3.2% 9.5% 0.4x 12.9xResources Connection Inc. United States 12.21 -16% 500.7 386.7 113.9 - 566.9 50.9 9.0% 0.1% 0.7x 7.6xRobert Half International Inc. United States 35.24 -1% 4,959.6 4,671.8 289.4 1.6 4,111.2 391.7 9.5% 8.8% 1.1x 11.9xRobert Walters plc United Kingdom 3.39 -19% 260.0 253.5 35.9 28.8 880.7 23.4 2.7% 17.7% 0.3x 10.8xSThree Plc. United Kingdom 5.30 -6% 626.9 582.1 45.3 - 925.6 51.2 5.5% 6.5% 0.6x 11.4xSynergie SA France 11.63 -9% 278.7 318.1 29.7 64.9 1,858.8 60.7 3.3% 6.8% 0.2x 5.2xTrueBlue, Inc. United States 17.19 -6% 665.8 546.4 119.3 - 1,395.1 71.8 5.1% 9.2% 0.4x 7.6xUSG People NV Netherlands 8.53 -28% 679.6 1,060.7 52.4 412.1 3,810.2 148.8 3.9% -9.7% 0.3x 7.1x
Adjusted Weighted Average 0.6x 10.8x
*Calculation is market cap weighted and excludes revenue multiples that are 2.0 standard deviations above the mean (4.7x)and EBITDA multiples that are 1.0 standard deviations above the mean (20.7x)
36M&A & INVESTMENT SUMMARY JANUARY 2013

BUSINESS SERVICES PUBLIC COMPANY VALUATIONS($ in millions, except stock price data)
IT Consulting/Systems Integrationg/ y gStock Price Chg % From Equity Ent. Cash & ST. Total LTM LTM Margin LTM LTM Multiples
Company Name Headquarters 01/31/13 52WK High Value Value Investments Debt Revenue EBITDA EBITDA Rev Growth EV/Rev EV/EBITDAA.L.D. Advanced Logistics Developments Ltd. * Israel 0.16 -43% 3.7 4.1 - - 14.3 0.1 0.9% -5.2% 0.3x 32.2xAccenture plc Ireland 71.89 -1% 46,321.2 41,127.3 5,681.2 0.0 28,007.8 4,266.1 15.2% 5.5% 1.5x 9.6xAmdocs Limited Channel Islands 35.69 -2% 5,801.2 4,839.8 961.3 - 3,266.3 604.4 18.5% 1.8% 1.5x 8.0xBechtle AG Germany 45.16 -7% 948.4 961.9 69.2 82.0 2,657.1 125.5 4.7% 4.7% 0.4x 7.7xBooz Allen Hamilton Holding Corporation United States 13.86 -28% 1,881.8 3,290.6 317.6 1,726.4 5,753.4 520.0 9.0% -1.0% 0.6x 6.3xBroadridge Financial Solutions, Inc. United States 23.57 -5% 2,880.8 3,193.4 211.8 524.4 2,322.9 343.3 14.8% 4.5% 1.4x 9.3xBusiness & Decision SA France 5.26 -40% 41.4 82.6 7.3 44.9 304.0 16.5 5.4% -2.0% 0.3x 5.0xCap Gemini S.A. France 48.22 -4% 7,410.1 7,520.1 1,660.6 1,713.9 12,787.0 1,158.6 9.1% 9.1% 0.6x 6.5xCGI Group, Inc. Canada 26.77 -1% 8,219.9 11,200.3 162.1 3,151.5 6,293.7 878.0 14.0% 47.2% 1.8x 12.8xCognizant Technology Solutions Corporation United States 78.18 -2% 23,469.0 20,837.2 2,631.7 - 7,062.0 1,463.1 20.7% 22.4% 3.0x 14.2xComputer Sciences Corporation United States 41.80 -2% 6,494.4 8,047.4 1,856.0 3,387.0 15,689.0 1,572.0 10.0% -3.1% 0.5x 5.1xCSG Systems International Inc. United States 18.83 -19% 596.8 704.7 184.8 292.6 746.4 162.7 21.8% 6.4% 0.9x 4.3xDynamics Research Corporation United States 6.86 -43% 70.9 167.5 9.5 106.1 331.7 35.2 10.6% 9.1% 0.5x 4.8xInformation Services Group, Inc. United States 1.14 -24% 41.0 90.9 15.0 64.8 187.8 18.5 9.9% 9.6% 0.5x 4.9xInfosys Ltd. India 52.37 -7% 29,922.1 25,719.0 4,079.0 - 7,231.0 2,182.0 30.2% 5.9% 3.6x 11.8xIsoftstone Holdings Limited China 5.24 -53% 292.2 259.9 72.5 38.0 362.8 37.6 10.4% 39.9% 0.7x 6.9xITS Group France 6.07 -26% 35.1 51.0 5.8 19.5 119.0 10.4 8.8% 6.1% 0.4x 4.9xNCI, Inc. United States 5.26 -34% 68.5 86.4 3.1 21.0 393.6 17.9 4.5% -36.0% 0.2x 4.8xOsiatis SA France 7 99 11% 122 2 127 3 36 2 40 7 366 1 31 0 8 5% 10 8% 0 3 4 1Osiatis SA France 7.99 -11% 122.2 127.3 36.2 40.7 366.1 31.0 8.5% 10.8% 0.3x 4.1xWipro Ltd. India 7.72 -9% 18,900.3 16,977.2 3,036.2 1,148.7 7,608.2 1,484.2 19.5% 17.5% 2.2x 11.4x
Adjusted Weighted Average 1.5x 10.6x
Business Process OutsourcingStock Price Chg % From Equity Ent. Cash & ST. Total LTM LTM Margin LTM LTM Multiples
Company Name Headquarters 01/31/13 52WK High Value Value Investments Debt Revenue EBITDA EBITDA Rev Growth EV/Rev EV/EBITDA
*Calculation is market cap weighted and excludes revenue multiples that are 2.0 standard deviations above the mean (5.2x)and EBITDA multiples that are 1.0 standard deviations above the mean (19.1x)
Communisis plc United Kingdom 0.72 -12% 100.2 143.9 15.8 59.0 349.8 28.3 8.1% 15.7% 0.4x 5.1xContax Participacoes S.A. Brazil 13.57 -4% 872.8 1,243.1 186.5 544.8 1,709.7 199.9 11.7% 22.2% 0.7x 6.2xEniro AB Sweden 2.28 -15% 228.4 679.3 40.6 476.7 623.7 143.1 22.9% -11.0% 1.1x 4.7xExlservice Holdings, Inc. United States 29.66 -1% 953.5 833.0 125.4 4.9 427.9 81.1 19.0% 30.4% 1.9x 10.3xFirstsource Solutions Limited India 0.20 -29% 133.3 153.3 146.6 166.5 495.3 43.5 8.8% 25.1% 0.3x 3.5xGenpact Ltd. Bermuda 16.75 -14% 3,761.8 4,118.1 394.5 747.5 1,837.0 325.2 17.7% 22.5% 2.2x 12.7xMAXIMUS, Inc. United States 68.57 -3% 2,337.3 2,149.7 189.3 1.7 1,050.1 152.1 14.5% 13.0% 2.0x 14.1xSalmat Ltd. Australia 2.46 -15% 389.2 645.2 38.3 289.5 843.3 102.8 12.2% -4.6% 0.8x 6.3xSerco Group plc United Kingdom 8.79 -8% 4,308.9 5,326.0 343.2 1,349.7 7,438.3 574.7 7.7% 7.0% 0.7x 9.3xTrans Cosmos, Inc. Japan 12.42 -9% 511.2 340.5 426.3 179.2 2,089.0 117.2 5.6% 4.1% 0.2x 2.9xTranscom WorldWide SA Luxembourg 0 12 -2% 141 9 184 5 56 3 97 5 752 2 51 8 6 9% 4 6% 0 2x 3 6xTranscom WorldWide SA Luxembourg 0.12 -2% 141.9 184.5 56.3 97.5 752.2 51.8 6.9% 4.6% 0.2x 3.6xXchanging PLC United Kingdom 1.93 -5% 463.7 398.6 150.6 53.8 1,022.5 110.4 10.8% -3.7% 0.4x 3.6x
Adjusted Weighted Average 1.4x 7.8x
*Calculation is market cap weighted and excludes revenue multiples that are 2.0 standard deviations above the mean (5.0x)and EBITDA multiples that are 1.0 standard deviations above the mean (17.2x)
37M&A & INVESTMENT SUMMARY JANUARY 2013

JANUARY SUMMARY TRADING VALUATION INFORMATION
Segment Name MEAN MEDIAN W AVG ADJ W AVG*Revenue Multiples
Segment Name MEAN MEDIAN W. AVG ADJ. W. AVG*Digital Media/Commerce 3.4x 2.0x 5.2x 3.8xDigital Advertising 2.1x 1.5x 4.3x 3.3xMarketing Technology 3.7x 2.7x 4.9x 3.8xAgency/Consulting 1.0x 0.9x 1.4x 1.3xMarketing Services 0.8x 0.7x 1.0x 0.8xTraditional & OOH Media 2.2x 2.2x 2.6x 2.4xTechnology 2.6x 2.2x 3.3x 3.2xSoftware 4.8x 3.4x 6.7x 5.2xCommunications 1.9x 1.1x 2.7x 2.7xInformation 3.0x 2.7x 3.6x 2.3xBusiness Services 1 1 0 6 2 6 1 8Business Services 1.1x 0.6x 2.6x 1.8x
Segment Name MEAN MEDIAN W. AVG ADJ. W. AVG*Digital Media/Commerce 18.9x 11.7x 26.8x 13.6xDigital Advertising 22.0x 9.4x 19.4x 14.5x
EBITDA Multiples
Marketing Technology 32.0x 16.1x 21.6x 16.4xAgency/Consulting 7.9x 6.9x 9.3x 8.9xMarketing Services 10.3x 6.3x 8.2x 7.3xTraditional & OOH Media 11.1x 7.7x 9.2x 9.2xTechnology 13.5x 9.9x 10.6x 10.2xSoftware 26 1 13 7 26 3 14 7
As of close of business on 01/31/13
Software 26.1x 13.7x 26.3x 14.7xCommunications 16.0x 10.6x 11.5x 10.3xInformation 15.0x 11.5x 13.4x 13.4xBusiness Services 10.8x 7.6x 15.6x 10.7x
38M&A & INVESTMENT SUMMARY JANUARY 2013
*Calculation is market cap weighted and excludes revenue multiples that are 3 standard deviations above the mean and EBITDA multiples that are 2 standard deviations above the mean

PPLLC INDICES – LTM as of 1/31/13Index Performance
• S&P 500 – 13.1%
Index Performance
• S&P 500 – 13.1%
Digital Media/Commerce Agency/Consulting130130
S&P 500 13.1%
• Digital Media/ Commerce – 16.8%
S&P 500 13.1%
• Agency/Consulting – 17.9%
90
100
110
120
Ind
ex P
erfo
rman
ce (
%)
80
90
100
110
120
Ind
ex P
erfo
rman
ce (
%)
Index Performance
• S&P 500 – 13.1%
Index Performance
• S&P 500 – 13.1%
Digital Advertising Marketing Services130
%)
80
Feb-12 Apr-12 Jun-12 Aug-12 Oct-12 Dec-12
S&P 500 Agency/Consulting
70
Feb-12 Apr-12 Jun-12 Aug-12 Oct-12 Dec-12
S&P 500 Digital Media/Commerce
130
%)
• Digital Advertising – 25.8% • Marketing Services – 21.2%
90
100
110
120
Ind
ex P
erfo
rman
ce (
%
90
100
110
120
Ind
ex P
erfo
rman
ce (
%
Index Performance
• S&P 500 – 13.1%
Index Performance
• S&P 500 – 13.1%
Marketing Technology Traditional & OOH Media
80
Feb-12 Apr-12 Jun-12 Aug-12 Oct-12 Dec-12
S&P 500 Digital Advertising
130
140
%)
80
Feb-12 Apr-12 Jun-12 Aug-12 Oct-12 Dec-12
S&P 500 Marketing Services
120
130
%)
• Marketing Technology – 8.3%
• OOH & Specialty Media – 17.0%
90
100
110
120
Ind
ex P
erfo
rman
ce (
%
80
90
100
110
Ind
ex P
erfo
rman
ce (
%
39M&A & INVESTMENT SUMMARY JANUARY 2013
80
Feb-12 Apr-12 Jun-12 Aug-12 Oct-12 Dec-12
S&P 500 Marketing Technology
70
Feb-12 Apr-12 Jun-12 Aug-12 Oct-12 Dec-12
S&P 500 Traditional & OOH Media

PPLLC INDICES – LTM as of 1/31/13Index Performance
• S&P 500 – 13.1%
Index Performance
• S&P 500 – 13.1%
Software Communications130130
S&P 500 13.1%
• Software – 14.9%
S&P 500 13.1%
• Communications – 2.0%
80
90
100
110
120
Ind
ex P
erfo
rman
ce (
%)
100
110
120
Ind
ex P
erfo
rman
ce (
%)
Index Performance
• S&P 500 – 13.1%Index Performance
S&P 500 13 1%
TechnologyInformation & Business Services
130
)
70
Feb-12 Apr-12 Jun-12 Aug-12 Oct-12 Dec-12
S&P 500 Communications
130
90
Feb-12 Apr-12 Jun-12 Aug-12 Oct-12 Dec-12
S&P 500 Software
• Technology – 6.3%• S&P 500 – 13.1%
• Information – 23.0%
• Business Services – 11.0%
90
100
110
120
Ind
ex P
erfo
rman
ce (
%)
90
100
110
120
Ind
ex P
erfo
rman
ce (
%)
80
Feb-12 Apr-12 Jun-12 Aug-12 Oct-12 Dec-12
S&P 500 Technology
80
Feb-12 Apr-12 Jun-12 Aug-12 Oct-12 Dec-12
S&P 500 Information Business Services
40M&A & INVESTMENT SUMMARY JANUARY 2013

ALL SEGMENTSStrategic Transactions ($ in Millions)
Reported
Target Buyer/Investor
Reported Transaction
Value StrategicValues Disclosed
Intucell Cisco Systems, Inc. $475.0Practical Law Company Thomson Reuters 405.0Epocrates Inc athenahealth Inc 213 1Epocrates, Inc. athenahealth, Inc. 213.1FishNet Security, Inc. Investcorp Bank B.S.C. 200.0mFoundry, Inc. Fidelity National Information Services, Inc. 120.0CDS Business Mapping CoreLogic, Inc. 78.0Telanetix The Flexitallic Group, Inc. 55.0Acuo Technologies Lexmark International, Inc. 45.0DBG Poker Group 2UP Gaming PLC 40.1Interactif Visuel Systeme Essilor International SA 26.7ThisLife LLC Shutterfly, Inc. 25.0Investor Force Holdings MSCI, Inc. 23.5Sonicbids Corporation Backstage 15.0Pushpins, Inc. Performance Marketing Brands, Inc. (fka Ebates) 12.5Foodspotting, Inc. OpenTable.com, Inc. 10.0MediaWhiz, Inc. Matomy Media Group 10.0Magaseek NTT Docomo, Inc. 9.0EnterCrews Mobcast Services 7.0Pacific Micromarketing Experian plc 6.5Kunu Xing AG 4 7Kunu Xing AG 4.7DOBP iCarAsia 2.1Merlin Elite M&C Saatchi plc 2.0Mash Health Limited Cello Group 1.0YELLOW7 Interactive QED Connect, Inc. 0.3Rare Method eMedia Networks International 0.1
StrategicUndisclosedUndisclosed
10Best USA Today Travel Media Group - 12snap plan.net Gruppe fur digitale Kommunikation - 1stHomeExchange Love Home Swap - 401! Creative Weidenhammer Systems Corporation - 7city Learning The Fitch Group - Active Life Apps Daxko, Inc. - Advertising Decision Solutions MediaMath, Inc. -
41M&A & INVESTMENT SUMMARY JANUARY 2013
g ,Alerting Solutions AtHoc, Inc. - ALK Technologies Trimble Navigation Limited -

ALL SEGMENTSStrategic Transactions ($ in Millions)
Reported
Target Buyer/Investor
Reported Transaction
Value StrategicUndisclosed
ALTA Systems ManTech International Corporation - Antler Agency Griffin York & Krause - Arkeia Software Western Digital Corporation - ASAP, Inc. Grossman Marketing Group - Aureus Sciences Elsevier, Inc. - Australian Local Search Sensis Agency - Authentic Response, Inc. reInvention - Barr Systems, Enterprise Output Management Business Notable Solutions, Inc. - Bayshore Technologies Vology, Inc. - Best Practice Systems BillTrust - Blocksworld Linden Research Inc Blocksworld Linden Research, Inc. - Capstrat, Inc. Ketchum, Inc. - CareAnyware Brightree LLC - Clayton Printing SurfKY News Group, Inc. - Cognitive Security Cisco Systems, Inc. - Commodity Update Farm Journal Media - Crashlytics Twitter, Inc. - Crowd Science YuMe Networks - CSO Computer Software Organisation comebis GmbH - Dartware, LLC Help/Systems, Inc. - Dealfind.com, Inc. TeamBuy.ca - Defran Systems Netsmart Technologies, Inc. - Direct Impressions, Inc. Colortree Group, Inc. - DiscoverText Vision Critical - DRX Connecture, Inc. - Eb k Lib P Q t U K H ldi Li it d Ebook Library ProQuest U.K. Holdings Limited - Energy Publishing, Inc. IHS, Inc. - Exploding Barrel Games Kabam, Inc. - FabKids JustFab - Farrell Kramer Communications MBS Value Partners - FIZ Chemie Berlin Wiley-VCH Verlag GmbH & Co. KGaA - Forrst ZURB, Inc. - franchisEssentials Franchise Foundry -
42M&A & INVESTMENT SUMMARY JANUARY 2013
franchisEssentials Franchise Foundry FulCircle, Inc. AMREP Corporation - Giftango InComm -
ALL SEGMENTSStrategic Transactions ($ in Millions)
Reported
Target Buyer/Investor
Reported Transaction
Value StrategicUndisclosed
Glassmap Groupon, Inc. - GridIron Systems Violin Memory, Inc. - HealthLink Minnesota Management Group 7 Medical Systems, LLC - HR Services Paychex, Inc. - Humedica, Inc. OptumHealth - id8 Group R2 Studios Microsoft Corporation - iMarketing LTD Mercury Media - Innovadex Underwriters Laboratories, Inc. - Innovadex Underwriters Laboratories, Inc. - Innoveer Solutions Cloud Sherpas - iThink SapientNitro iThink SapientNitro - IVONA Software Amazon.com, Inc. - Knovel Corporation Elsevier, Inc. - Knowledge Mosaic LexisNexis Group - KVS Information Systems Springbrook Software, Inc. - LawPivot Rocket Lawyer Incorporated - LexisNexis Group, Screening Business First Advantage - Listech Hexagon AB - gLoopFuse Nearstream, Inc. - Magnon Group TBWA Worldwide, Inc. - MailCounter Unlock the Inbox - MakeGood Software Quantcast Corporation - Mamasource Totsy - Marketing Research Services, Inc. Orc International - McMurry/TMG, LLC The Wicks Group of Companies, L.L.C. - M t E i i T S ft I Mentor Engineering Trapeze Software, Inc. - Metrostudy Hanley-Wood, Inc. - Miami National Antiques Show & Sale U.S. Antique Shows - MilesTek L-com, Inc. - Mixel Etsy, Inc. - MobilGiganten Dialect AB - Monitor Company Group, LP Deloitte Development LLC - Morehead Associaties Press Ganey Associates, Inc. -
43M&A & INVESTMENT SUMMARY JANUARY 2013
Morehead Associaties Press Ganey Associates, Inc. Mozes, Inc. ePrize LLC - Mphasize SapientNitro - Munics Information Systems Robocom Systems International -

ALL SEGMENTSStrategic Transactions ($ in Millions)
Reported
Target Buyer/Investor
Reported Transaction
Value StrategicUndisclosed
Name.com LLC Demand Media, Inc. - National Healthcare Exchange Services Adreima, Inc. - Navigis, Inc. Cloud Sherpas - Navman Wireless Danaher Corp. - Neuralitic, Inc. Guavus, Inc. - NovaQuest Persistent Systems Ltd. - Okam Limited WPP Group - Opportunity Max Maritz, Inc. - Overlay Media Limited InMobi - PageLever Unified Media - Parents in a Pinch Care com Inc Parents in a Pinch Care.com, Inc. - Payvment, Inc. Intuit, Inc. - PEMSoft EBSCO Publishing, Inc. - Personally Yours Staffing Corporate Resource Services, Inc. - Pictometry International EagleView Technologies, Inc. - Pipewave ZEFR - Platinnetz Feierabend - POP, Inc. Advance Publications, Inc. (Conde Nast) - , , ( )Pro Bike Kit The Hut Group - RedMas Adsmovil - Reed Group Ltd The Guardian Life Insurance Company of America - REP/Grey, REP/G2, and Massive WPP Group - Reputation 24/7 Reputation.com, Inc. - Research Dataware WIRB-Copernicus Group - ReStockIt.com Acme Paper & Supply Co., Inc. - R t il A h N t it I Retail Anywhere Netsuite, Inc. - Retail Marketing Services East BDS Marketing - Salesworks Systems, Inc. Rand Group, LLC - Simperium Automattic - Soul and Vibe Entertainment, Inc. Soul and Vibe Interactive, Inc. - Technology Associates International Vistronix, Inc. - Technology Solutions Group, Inc. TeleTech Holdings, Inc. - Thacher Associates K2 Intelligence, LLC -
44M&A & INVESTMENT SUMMARY JANUARY 2013
Thacher Associates K2 Intelligence, LLC The Pinnacle Group of Indiana Advanced Imaging Solutions, Inc. - The Salter Group FTI Consulting, Inc. - The Whitley Printing Company (Unnamed) -

ALL SEGMENTSStrategic Transactions ($ in Millions)
Reported
Target Buyer/Investor
Reported Transaction
Value StrategicUndisclosed
Ticket-Web SAP AG - TradeCard GT Nexus, Inc. - TransmissionHub and GenerationHub PennWell Corporation - TSSLink Avnet Technology Solutions - Umeqo Readyforce, Inc. - Utopy, Inc. Genesys Telecommunications Laboratories, Inc. - VARcompliance Netformx, Inc. - Vineyard Networks Procera Networks, Inc. - Votizen Causes - WAM Systems Triple Point Technology, Inc. - Yankee Group Research The 451 Group Yankee Group Research The 451 Group - Zip Prints GT Graphics Company -
45M&A & INVESTMENT SUMMARY JANUARY 2013

ALL SEGMENTSVenture/Growth Capital Transactions ($ in Millions)
Target Buyer/Investor
Reported Transaction
Value Buyout DealsValues Disclosed
Cerved Group Spa CVC Capital Partners Ltd. $1,490.0Eze Castle Integration TPG Capital 950.0 SurveyMonkey, Inc. Tiger Global Management, LLC 800.0 BioClinica Inc JLL Partners 104 5BioClinica, Inc. JLL Partners 104.5Assetic Pty Ltd. M. H. Carnegie & Co. 10.6ANGOSS Software Corporation Peterson Partners LP 7.9TechForLess, Inc. Encore Holdings, LLC 1.6
Buyout DealsUndisclosed
Alchemy Systems, LP The Riverside Company - BrandAlley UK Limited Management Buyout - Direct Marketing Solutions, Inc. Caymus Capital Group, LLC - g , y p p,FishNet Security, Inc. Investcorp Bank B.S.C. - FocusVision Worldwide, Inc. Thompson Street Capital Partners, LLC - GetWellNetwork, Inc. Welsh, Carson, Anderson & Stowe - GiveAnything.com LLC The Riverside Company - irth Solutions, Inc. (Unnamed Fund Contibuters) - Lanyon, Inc. Vista Equity Partners - MG LLC Trivergance, LLC - MicroEdge, Inc. Bregal Sagemount - Miller Heiman Inc Providence Equity Partners Inc Miller Heiman, Inc. Providence Equity Partners, Inc. - PlattForm Advertising Sterling Partners - Reed Business Information Australia Catalyst Investment Managers Pty Ltd - Spartan College of Aeronautics and Technology Sterling Partners - TractManager, Inc. Arsenal Capital Partners, Inc. - Tresys Technology LLC Behrman Capital - Vivonet, Inc. Marlin Equity Partners -
VC/Growth CapitalValues Disclosed
SevOne, Inc. Bain Capital, LLC $150.0Lynda.com, Inc. Accel Partners 103.0Twitter, Inc. BlackRock, Inc. 80.0AppNexus, Inc. Technology Crossover Ventures 75.0Globant WPP Group 70.0Infusionsoft The Goldman Sachs Group, Inc. 54.0SR Labs LLC Insight Venture Partners 53.0AppDynamics Institutional Venture Partners 50.0FireEye Inc Goldman Sachs Private Investment Area 50 0
46M&A & INVESTMENT SUMMARY JANUARY 2013
FireEye, Inc. Goldman Sachs Private Investment Area 50.0Virident Systems, Inc. Seagate Technologies, Inc. 40.0Traiana, Inc. Barclays Capital 36.0PICS Auditing Norwest Venture Partners 35.0

ALL SEGMENTSVenture/Growth Capital Transactions ($ in Millions)
Target Buyer/Investor
Reported Transaction
Value VC/Growth CapitalValues Disclosed
Houzz, Inc. GGV Capital $35.0Sales Team Automation, LLC U.S. Venture Partners 35.0Work Service Group PineBridge Investments LLC 34.6Attivio Inc General Electric Pension Trust 34 0Attivio, Inc. General Electric Pension Trust 34.0Health Catalyst, LLC Norwest Venture Partners 33.0Janrain, Inc. Millennium Technology Value Partners 32.9Room 77 Expedia, Inc. 30.3Pinterest SV Angel, LLC 30.0DataGravity Andreessen Horowitz 30.0Guavus, Inc. Investor Growth Capital, Inc. 30.0Puppet Labs VMware, Inc. 30.0Pluralsight LLC Insight Venture Partners 27.5g gStreetline, Inc. True Ventures 25.0OpenX Software Ltd. Samsung Venture Investment Corporation 22.5Optimal Blue Serent Capital, L.P. 22.4Kareo, Inc. Stripes Group 20.5iPinYou Information Technologies Co., Ltd China Broadband Capital 20.0Axcient, Inc. Scale Venture Partners 20.0Lazada Tengelmann Warenhandelsgesellschaft KG 20.0Prosper Marketplace, Inc. Sequoia Capital 20.0Recondo Technology Bregal Sagemount 20 0Recondo Technology Bregal Sagemount 20.0PatientSafe Solutions Merck Global Health Innovation LLC 20.0Shape Security, Inc. Kleiner Perkins Caufield & Byers 20.0NewVoiceMedia Ltd. Highland Capital Partners 20.0BuzzFeed, Inc. RRE Investors 19.3Chartboost Sequoia Capital 19.0Keek, Inc. AGF Investments Inc. 18.0Host Analytics, Inc. Advanced Technology Ventures 17.0Panaya Ltd. Battery Ventures 16.0y yTongal, Inc. Insight Venture Partners 15.0GetYourGuide, Inc. Highland Capital Partners 14.0ChaCha Search, Inc. VantagePoint Capital Partners 14.0Radius Intelligence, Inc. American Express Company 12.4ScaleArc, Inc. Accel Partners 12.342 Floors, Inc. New Enterprise Associates 12.3WatchDox, Inc. Millennium Technology Value Partners 12.0Linkwell Health WellPoint, Inc. 11.0FanDuel Inc Comcast Ventures 11 0
47M&A & INVESTMENT SUMMARY JANUARY 2013
FanDuel, Inc. Comcast Ventures 11.0Parallels IP Holdings GmbH Cisco Systems, Inc. 11.0PagerDuty, Inc. Andreessen Horowitz 10.7Ayasdi, Inc. Khosla Ventures 10.3

ALL SEGMENTSVenture/Growth Capital Transactions ($ in Millions)
Target Buyer/Investor
Reported Transaction
Value VC/Growth CapitalValues Disclosed
Convercent Azure Capital Partners $10.2Zettaset HighBAR Ventures 10.0ConnectSolutions LLC Frontier Capital, LLC 10.0Snip it Yahoo! Inc 10 0Snip.it Yahoo!, Inc. 10.0Tradeshift Intuit, Inc. 10.0Mirantis, Inc. Intel Capital 10.0OpinionLab, Inc. SSM Partners 9.5Intigua, Inc. Bessemer Venture Partners 8.6Simply Measured, Inc. Bessemer Venture Partners 8.0Adometry, Inc. Austin Ventures 8.0Flatiron Health, Inc. Google Ventures 8.0Pontiflex, Inc. Talus Holdings 7.7, g360Incentives.com OMERS Ventures 7.7Optim.al, Inc. DoubleRock Venture Capital 7.0Healthsense Merck Global Health Innovation LLC 7.0Gokuai Technology Gobi Partners 6.4LiquidSpace GPT Group 6.0Connected Data, Inc. FLOODGATE Fund LP 6.0SnagFilms, Inc. New Enterprise Associates 6.0vArmour Networks, Inc. Highland Capital Partners 6.0Zoom Video Communications Inc QUALCOMM Ventures 6 0Zoom Video Communications, Inc. QUALCOMM Ventures 6.0Telcentris, Inc. SBD Global Fund 5.3Altitude Digital Partners Mercato Partners 5.0BetterCloud Flybridge Capital Partners 5.0Abe's Market, Co. Carmel Ventures 5.0OLO RRE Investors 5.0Independa, Inc. LG Electronics, Inc. 5.0PureCars.com Gemini Investors 5.0Convertro, Inc. Bessemer Venture Partners 5.0,Telligent Systems, Inc. NXT Capital, Inc. 5.0Moontoast, LLC The Martin Companies 5.0Musicmetric Limited Imperial Innovations 4.8Cellrox Ltd. Runa Capital 4.7Iconixx Software Ballast Point Ventures 4.5Levels Beyond, Inc. TVC Capital 4.5DB Networks, Inc. Khosla Ventures 4.5Blue Box Founder Collective 4.3Celtra Technologies Inc SoftBank Capital 4 0
48M&A & INVESTMENT SUMMARY JANUARY 2013
Celtra Technologies, Inc. SoftBank Capital 4.0authorGEN Technologies Kaizen Management Advisors Pvt. Ltd 4.0Kwarter, Inc. T-Venture Holding GmbH 4.0Montage Talent, Inc. Baird Venture Partners 4.0

ALL SEGMENTSVenture/Growth Capital Transactions ($ in Millions)
Target Buyer/Investor
Reported Transaction
Value VC/Growth CapitalValues Disclosed
TakeLessons Triangle Peak Partners, LP $4.0Front Flip, LLC (Private Investors) 3.8Kitsy Lane, Inc. Data Point Capital 3.5Refinery29 (Unnamed Fund Contibuters) 3 5Refinery29 (Unnamed Fund Contibuters) 3.5Iwoca Beyond Digital 3.3Iconicfuture GmbH CREATHOR VENTURE Management GmbH 3.3Rentify Ltd. Balderton Capital 3.2Symform, Inc. Second Century Ventures, LLC 3.0ChowNow, Inc. GRP Partners 3.0DAPU.com (Angel Investors) 3.0Syapse, Inc. The Social+Capital Partnership 3.0True Office Contour Venture Partners 3.0Bloodhound Technologies The Founders Fund, LLC 3.0Coach Alba VitalSmarts, LC 3.0Curalate New Enterprise Associates 3.0ipDatatel, LLC Genesis Park LP 2.8Remitly, Inc. Trilogy Partnership 2.6SimilarGroup Ltd. (Private Investors) 2.5Digit Game Studios Ltd. Delta Partners 2.5MobileSpan, Inc. True Ventures 2.3BuyBox Iris Capital 2 3BuyBox Iris Capital 2.3MobileSpan, Inc. True Ventures 2.3MediGain, Inc. (Unnamed Fund Contibuters) 2.3MediaSilo, Inc. Schooner Capital LLC 2.3Access Sports Media Columbia Capital Corporation 2.3Continuity Control Connecticut Innovations, Inc. 2.2Urjanet, Inc. Correlation Ventures 2.0Zirtual, Inc. Mayfield Fund 2.0Toopher, Inc. Stonehenge Capital Company, LLC 2.0p , g p p y,UpCity, LLC FireStarter Fund 2.0Fanplayr, Inc. Denali Capital Managers Pty Ltd 2.0GetHired.com (Private Investors) 1.8Distil, Inc. ff Venture Capital 1.8Tomfoolery, Inc. Morado Venture Partners 1.7Bostech Corporation (Unnamed Fund Contibuters) 1.6Gobbler (Private Investors) 1.5Vobi.com TrailBlazer Capital 1.5Snipi Inc Robin Hood Ventures 1 5
49M&A & INVESTMENT SUMMARY JANUARY 2013
Snipi, Inc. Robin Hood Ventures 1.5BlueKite PeopleFund 1.5StartDate Labs, Inc. Baird Venture Partners 1.5FlexMinder, Inc. WRF Capital 1.4
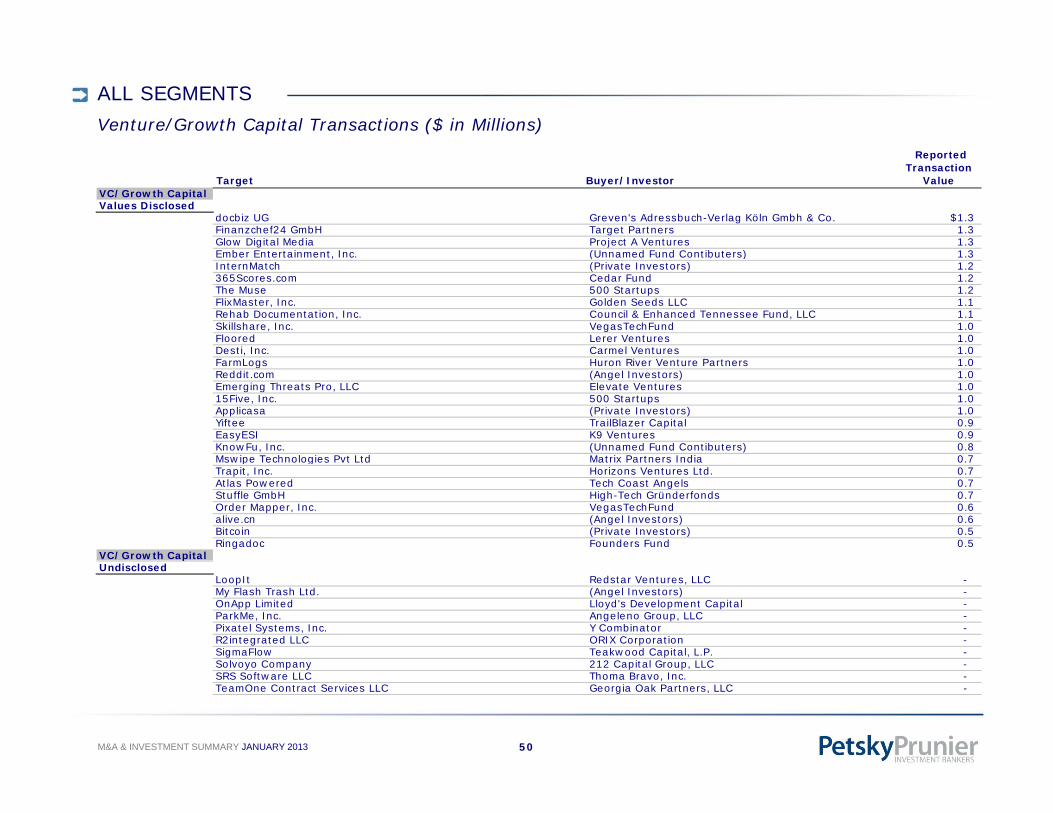
ALL SEGMENTSVenture/Growth Capital Transactions ($ in Millions)
Target Buyer/Investor
Reported Transaction
Value VC/Growth CapitalValues Disclosed
docbiz UG Greven's Adressbuch-Verlag Köln Gmbh & Co. $1.3Finanzchef24 GmbH Target Partners 1.3Glow Digital Media Project A Ventures 1.3Ember Entertainment Inc (Unnamed Fund Contibuters) 1 3Ember Entertainment, Inc. (Unnamed Fund Contibuters) 1.3InternMatch (Private Investors) 1.2365Scores.com Cedar Fund 1.2The Muse 500 Startups 1.2FlixMaster, Inc. Golden Seeds LLC 1.1Rehab Documentation, Inc. Council & Enhanced Tennessee Fund, LLC 1.1Skillshare, Inc. VegasTechFund 1.0Floored Lerer Ventures 1.0Desti, Inc. Carmel Ventures 1.0,FarmLogs Huron River Venture Partners 1.0Reddit.com (Angel Investors) 1.0Emerging Threats Pro, LLC Elevate Ventures 1.015Five, Inc. 500 Startups 1.0Applicasa (Private Investors) 1.0Yiftee TrailBlazer Capital 0.9EasyESI K9 Ventures 0.9KnowFu, Inc. (Unnamed Fund Contibuters) 0.8Mswipe Technologies Pvt Ltd Matrix Partners India 0 7Mswipe Technologies Pvt Ltd Matrix Partners India 0.7Trapit, Inc. Horizons Ventures Ltd. 0.7Atlas Powered Tech Coast Angels 0.7Stuffle GmbH High-Tech Gründerfonds 0.7Order Mapper, Inc. VegasTechFund 0.6alive.cn (Angel Investors) 0.6Bitcoin (Private Investors) 0.5Ringadoc Founders Fund 0.5
VC/Growth Capital/ pUndisclosed
LoopIt Redstar Ventures, LLC - My Flash Trash Ltd. (Angel Investors) - OnApp Limited Lloyd's Development Capital - ParkMe, Inc. Angeleno Group, LLC - Pixatel Systems, Inc. Y Combinator - R2integrated LLC ORIX Corporation - SigmaFlow Teakwood Capital, L.P. - Solvoyo Company 212 Capital Group LLC
50M&A & INVESTMENT SUMMARY JANUARY 2013
Solvoyo Company 212 Capital Group, LLC - SRS Software LLC Thoma Bravo, Inc. - TeamOne Contract Services LLC Georgia Oak Partners, LLC -

ALL SEGMENTSVenture/Growth Capital Transactions ($ in Millions)
Target Buyer/Investor
Reported Transaction
Value VC/Growth CapitalUndisclosed
Tempo Cagri Hizmetleri Mitsui & Company, Ltd. - Thomsons Online Benefits ABRY Partners, LLC - Topspin Media, Inc. Beats Electronics, LLC - Wercker Shamrock Ventures Wercker Shamrock Ventures - Zonoff, Inc. Valhalla Partners, L.P. -
51M&A & INVESTMENT SUMMARY JANUARY 2013

Petsky Prunier: Maximizing Shareholder Value• Founded in 1999
• Focused on the technology, marketing, media, eCommerce, and healthcare industries
• Over 35 focused professionals
› Unique combination of investment banking and consulting expertise
• New York, Palo Alto, Las Vegas, Chicago, Tampa
• Sell-side and private placement close rate is unmatched at our level of deal volume
• Deep relationships across a broad spectrum of venture capital and private equity groups, lenders and strategic buyers
• Together with strategic consulting firm Winterberry Group, one of the largest industry-specific advisors providing strategic and transactional services
STRATEGIC CONSULTINGINVESTMENT BANKING
p g g
• International reach through our partnership with Altium. Founded more than 20 years ago and privately owned, Altium operates from ten offices across Europe
• Securities transactions processed through Petsky Prunier Securities LLC, a licensed broker-dealer
STRATEGIC CONSULTINGINVESTMENT BANKING
• Sell-Side Representation• Capital Raising and Private
Placements• Corporate Divestitures
• Strategic Development and Competitive Analysis
• M&A Transaction Due Diligence Support and Valuation Analysis
• Technology• Media• Marketing
CCorporate Divestitures• M&A Advisory• Fairness Opinions
• Acquisition Strategy/Target Identification• Publishing and Thought Leadership
• eCommerce• Healthcare
52M&A & INVESTMENT SUMMARY JANUARY 2013
Petsky Prunier was Ranked #1 by Bloomberg in 2011-2012 for Mid-Market Internet & Advertising Transactions*
Rank Advisor Deal Count
1 Petsky Prunier LLC 30
2 Nomura Holdings Inc 24
3 GCA Savvian Group Corp 23
4 Goldman Sachs & Co 20
5 Morgan Stanley 19
6 Jordan Edmiston Group 186 Jordan Edmiston Group 18
7 Jefferies Group Inc. 16
8 China Renaissance Partners 15
8 Sumitomo Mitsui Financial 15
10 JP M 1410 JP Morgan 14
10 RBC Capital Markets 14
* Based on number of deals announced in 2011-2012 valued at $500 million or less
More than 50 transactions closed since 2010:
• Ranging from strategic sales and divestitures to private equity recaps to growth, mezzanine, and alternative financings
A b d i f i d i i l di di i l d i i d k i C d di i l
53M&A & INVESTMENT SUMMARY JANUARY 2013
• Across a broad universe of industries, including digital advertising and marketing, eCommerce and digital media, technology and software, information services, and healthcare

REPRESENTATIVE RECENT TRANSACTIONS
a leading provider of a dynamic display media and a leading provider of digital l ti b h i l d ti i h ld
has sold a leading digital advertising monetization and shopper marketing
has sold its
Sports Marketing Print Division
to
has received a mezzanine debt investment from
transportation-based digitalmedia networks
has been acquired by
retargeting company
(JASDAQ:4755 )
has been sold to
a leading provider of digital production services to brands and agencies
(NSYE: ACN)
has been acquired by
a real-time behavioral advertising company
(NSYE: AOL)
has been sold to
a leading provider of in-store and shopper marketing signage to major North American retailers
has sold
provider of online travel guides for top destinations around the world
to
(NYSE: GCI )
specializing in retail, digital, shopper marketing and consumer
services to
along with digital subsidiary
has been sold to
partner for e-commerce retailers
with financing from
a portfolio company of
a leading provider of taxi-based outdoor media
has been sold to
(NYSE: PAY)
has been sold to
the top independentdirect-to-consumer marketer of
dental savings plans
has sold
and
a leading provider of services for domain name registration,
acquisition, brokerage and salesto
has been sold to
a global digital marketing agency
a unit of
a leading data management and audience optimization platform
(DMP) company
a leading digital direct marketing company utilizing a proprietary database to provide customer
acquisition solutions for major brands
has received an equity investment from
with debt financing from
a leader in technology and global in-app advertising for Facebook,
Apple (iOS), and Android developers
has received $66M investmentfrom
has been sold to
a leader in global healthcare primary market research and
influence network mapping
a portfolio company of
a provider of a cloud-based integration platform for the digital
marketing industry
has received $15M financing led by
a leader in multichannel retail, ecommerce and loyalty marketing
serviceshas been sold to
has sold
a premier provider of affinity programs for universities and colleges
to
a leading advertising technology company
has been sold to
(Xetra: DPW.DE)
has been sold to
(TSX: PTO)
to
a portfolio company of
Vestar Capital Partners has sold
a leading market services and BPO company
has sold
to
has sold
a leading online lead generation business
to
(Nasdaq: TREE)
(NasdaqGS: LEDR)
has acquired
a pioneer in measuring the impact of promotion on
physician prescribing behavior
has sold
A leading urban and multicultural agency
to
a subsidiary of
(NYSE: IPG)
has sold
to
a leading provider of integrated data, technology and analytics
solutions
and
a portfolio company of
Parthenon Capital Partners
has merged with
has been sold to
a portfolio company of
KRG Capital Partners
one of North America’s largest mobile marketing and gateway
solution providers
has been sold to
(Nasdaq:GSIC)
has received a majority investment from
a leading online video advertising network
has received a growth capital investment from
a provider of multichannel marketing software services
has been sold to
(Nasdaq: RRD)
a digital communications agency with a proprietary software
platform serving biopharmaceutical companies
has been sold to has acquired
a division of
has been acquired by
a premier provider of benchmark-based advisory services to the
pharmaceutical and biotech industry
G Cap a a e s
a leading online community forautomotive enthusiastsand social networkingtechnology platform
to
has sold
New Digital Group
has sold the assets of
to
a global marketing services company
has been acquired by
in a combination that creates
(NASDAQ: TREE)has acquired certain assets of
an interactive direct marketing company specializing in
lead generation for the for-profit,t d d ti k t
a portfolio company of
has divested one of its
a leading direct response television media company
has received a majorinvestment from
has sold
MIVA Media
a leading pay-per-click contextual online advertising
network
has been sold to
a leading performance-basedadvertising network
has been sold to
54M&A & INVESTMENT SUMMARY JANUARY 2013
the world’s leading loyaltymanagement provider
post-secondary education market has divested one of itsmarketing services divisions to


![September 2016 MA and Investment Summary [Read-Only]petskyprunier.com/_petskyprunier.com/dynamic/user... · 3| M&A and Investment Summary September 2016 M&A and Investment Summary](https://img.pdfslide.us/doc/110x75/5f8f4ecfd3e916639f1ca814/september-2016-ma-and-investment-summary-read-only-3-ma-and-investment-summary.jpg)