Embed Size (px)
Citation preview

Jan-Olov Sundqvist 1
Case Studies on Waste Management in Sweden
Jan-Olov Sundqvist
IVL Swedish Environmental Research Institute, Stockholm
E-mail: [email protected]

Jan-Olov Sundqvist 2
This presentation
1. General overview of Swedish case studies and their results
2. Deeper presentation of one of the studies: ORWARE

Jan-Olov Sundqvist 3
Part 1. Case studies in Sweden
Three research groups:• ORWARE: cooperation between
– IVL Swedish Environmental Research Institute
– Royal Institute of Technology
– Swedish Institute of Agricultural and Environmental Engineering
• fms (Environmental Strategies Research Group)• Chalmers University of Technology (MIMES/Waste,
Natwaste)
In a special co-operation project we penetrated our studies, to find general conclusions and to analyse differences.Totally 8 case studies were analysed

Jan-Olov Sundqvist 4
The studies have some different scopes
• environment and/or economy
• societal perspective (“from the cradle to the grave”) or actors perspective (e.g. municipality or waste company)

Jan-Olov Sundqvist 5
Different scopes
Environ-ment
Economy (financial)
Societal perspective Actor’s perspective
fms
NatWaste MIMES/Waste
ORWARE

Jan-Olov Sundqvist 6
Some assumptions in all studies
• Time perspective: best choices to build up a waste system now for the next 10 - 15 years
• Best available technology• Incineration: high energy recovery - district heating• Material recycling: the same virgin material is
recycled• Landfilling: gas recovery with heat and/or electricity
production. Only emissions during the closest 100 years are shown

Jan-Olov Sundqvist 7
…more assumptions
• Anaerobic digestion: gas for bus fuel alternatively production of heat and electricity. The digestate is used on arable land and substitutes chemical fertiliser.
• Composting: compost is used on arable land and substitutes chemical fertiliser.

Jan-Olov Sundqvist 8
General conclusions
1. Landfilling should be avoided for wastes that can be recycled, incinerated (with energy recovery), anaerobic digested or composted.
This is motivated from both environmental and economic reasons.

Jan-Olov Sundqvist 9
2. Anaerobic digestion and incineration is difficult to compare (~”equal”) - both have environmental advantages and disadvantages. The financial costs for anaerobic digestion is higher than for incineration.
3. Composting has no environmental or economic advantages compared to incineration or anaerobic
digestion.

Jan-Olov Sundqvist 10
4. Material recycling is generally preferable to incineration from an environmental point of view. The result can be varying for different materials.
Non-renewable materials such as plastic and metals are especially favourable to recycle.
For renewable materials, e.g. paper and cardboard, the differences between material recycling and incineration are smaller than for non-renewable materials such as plastics and metals.

Jan-Olov Sundqvist 11
5. Transports of waste is of very low importance energetically and environmentally. Private transports of waste, from home to the collection site can play a role.

Jan-Olov Sundqvist 12
6. The landfill can in some cases work as a carbon sink, which can affect the results for renewable and slowly degradable materials such as paper.
In a short time perspective landfilling also can have some advantages for some materials since the emissions are postponed to the future.

Jan-Olov Sundqvist 13
7. Phosphorus is a non-renewable resource. The domestic waste, however, plays a very minor role for the total phosphorus balance.
In Sweden
1000 tons P in domestic waste, about 100 ton is recycled
6000 tons P in sewage sludge, about 2000 tons are recycled
20 000 tons in manure, almost all is recycled
20 000 tons chemical fertiliser are used

Jan-Olov Sundqvist 14
Part 2. Results from ORWARE
Jan-Olov Sundqvist 15
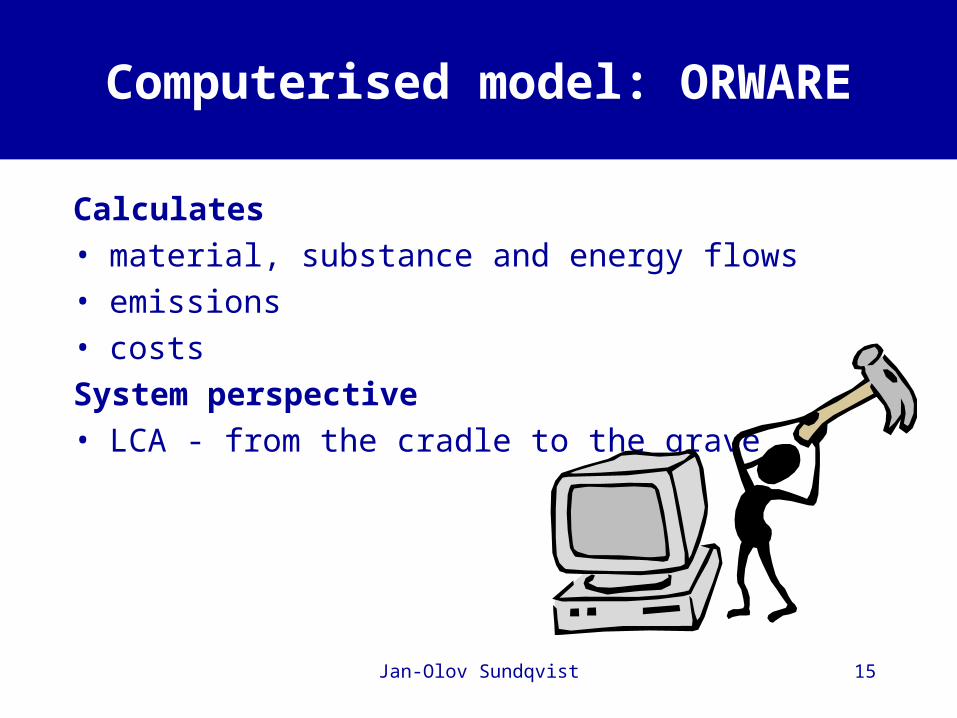
Computerised model: ORWARE
Calculates • material, substance and energy flows• emissions• costs
System perspective• LCA - from the cradle to the grave

Jan-Olov Sundqvist 16
Waste core system in ORWARE
Landfilling
Wastesource 1
Wastesource 2
Wastesource 3
Wastesource 4
Wastesource n
Transport Transport Transport Transport Transport
Materialsrecovery
Thermalgasification Incineration
Anaerobicdigestion Composting
Sewagetreatment
Transport Transport Transport Transport Transport Transport
Biogasusage
Organic fertiliserusage
Materials
Energy
Costs
Products
Emissions
Energy

Jan-Olov Sundqvist 17
Not only the waste system…..
• The waste system can produce: district heating, bus fuel (biogas), electricity, plastic, cardboard, fertiliser
• How shall the spared resources be handled?? In all scenarios the same products are produced,
either by the waste system or the compensatory system (external system)
Waste system Compensatory system
Product

Jan-Olov Sundqvist 18
Total system
Waste sources
Waste managementsystem
Emissions
Energy Fertiliser Material
Material
Energy
Energy Fertiliser Material
Costs
Compensatory system
Alternativeenergy raw
material
Alternativefertiliser raw
material
Alternativematerial raw
material
Alternativeproductionof material
Alternativeproductionof energy
AlternativeproductionofN-,P- fertiliser
System boundary

Jan-Olov Sundqvist 19
All scenarios produce the same amount of products and services:
• Waste from 186 000 people• District heating 762 TJ• Electricity 48 TJ• Bus fuel for: 4 100 000 km• Chemical fertiliser, P 15 ton• Chemical fertiliser, N 77 tons• Cardboard pulp 2 030 ton• Plastic granules 896 ton

Jan-Olov Sundqvist 20
Upstream and downstrean processes
Examples pre-process:• emissions and energy consumption from extraction of
crude oil
Examples: post-process• landfilling of ash from coal combustion for electricity
production
”cradle”pre-process
Core processwaste system or
compensatory system
”grave”post-process

Jan-Olov Sundqvist 21
Questions of issue
• How shall different materials in the waste be treated to make the energy utilisation (or material utilisation or plant nutrient utilisation) of waste as effective as possible with respect to environment and economy

Jan-Olov Sundqvist 22
Scenarios
1. All waste is incinerated
2. All waste is landfilled
3. Degradable waste is anaerobically digested. Biogas is used for bus fuel. Other waste is incinerated
4. Degradable waste is anaerobically digested. Biogas is used for electricity/heat. Other waste is incinerated
5. Degradable waste is composted. Other waste is incinerated
6. Cardboard is recycled. The other waste is incinerated
7. Plastic (PE-plastic) is recycled. The other waste is incinerated.

Jan-Olov Sundqvist 23
Some assumptions
• Alternative district heating is produced by biofuel (wood chips) in the compensatory system.
• Electricity is produced from nature gas (marginal electricity).

Jan-Olov Sundqvist 24
Global warming
0
50
100
150
200
250
300
350
400
Inci
nerat
ion
Landfil
l
Anaero
bic d
iges
tion, b
us
Anaero
bic d
iges
tion, h
eat/e
lect
ricity
Compost
ing+F
b
Plast
ic re
cycl
ing
Cardboar
d recy
clin
g
kg CO2-equivalents/person,year
Electricity
Virgin cardboard
Virgin plastic
Chemical fertiliser n,P
External vehicle fuel
External heat
Waste system

Jan-Olov Sundqvist 25
Energy
0
1 000
2 000
3 000
4 000
5 000
6 000
Inci
nerat
ion
Landfil
l
Anaero
bic d
iges
tion, b
us
Anaero
bic d
iges
tion, h
eat/e
lect
ricity
Compost
ing
Plast
ic re
cycl
ing
Cardboar
d recy
clin
g
MJ/person, year
Households Transports
Electricity
Virgin cardboard
Virgin plastic
Chemical fertilser N,P
External vehicle fuel
External heat
Waste system

Jan-Olov Sundqvist 26
And a lot more diagrams….
0
200
400
600
800
1 000
1 200
1 400
Inci
nerat
ion
Landfil
l
Anaero
bic d
iges
tion, b
us
Anaero
bic d
iges
tion, h
eat/e
lect
ricity
Compost
ing+F
b
Plast
ic re
cycl
ing
Cardboar
d recy
clin
g
g SO2-equivalents/person, year
Electricity
Virgin cardboard
Virgin plastic
Chemical fertiliser n,P
External vehicle fuel
External heat
Waste system
0
2 000
4 000
6 000
8 000
10 000
12 000
14 000
16 000
Inci
nerat
ion
Landfil
l
Anaero
bic d
iges
tion, b
us
Anaero
bic d
iges
tion, h
eat/e
lect
ricity
Compost
ing+F
b
Plast
ic re
cycl
ing
Cardboar
d recy
clin
g
g O2-equivalents/person, year Elektricitet
Virgin cardboard
Virgin plastic
Chemical fertiliserN,P
External vehicle fuel
External heat
Waste system
0
50
100
150
200
250
Inci
nerat
ion
Landfil
l
Anaero
bic d
iges
tion, b
us
Anaero
bic d
iges
tion, h
eat/e
lect
ricity
Compost
ing+F
b
Plast
ic re
cycl
ing
Cardboar
d recy
clin
g
g ethene-equivalents/person, year
Electricity
Virgin cardboard
Virgin plastic
Chemical fertiliserN,P
External vehicle fuel
External heat
Waste system
0
50
100
150
200
250
300
350
400
450
Inci
nerat
ion
Landfil
l
Anaero
bic d
iges
tion, b
us
Anaero
bic d
iges
tion, h
eat/e
lect
ricity
Compost
ing+F
b
Plast
ic re
cycl
ing
Cardboar
d recy
clin
g
g N-NOx
/person, yearElectricity
Virgin cardboard
Virgin plastic
Chemical fertiliserN,P
External vehicle fuel
External heat
Waste system

Jan-Olov Sundqvist 27
Life Cycle Costs LCC
• All costs from the cradle to the grave• Both waste system and external system• Included pre-processes and post-processes• Same system boundaries as the LCA part• Shows the costs for the society to produce the
functional units

Jan-Olov Sundqvist 28
Financial Life Cycle Costs
Financial Life Cycle Costs, total system
0
100
200
300
400
500
600
700
Inci
nerat
ion
Landfil
l
Anaero
bic d
iges
tion,
bus
Anaero
bic d
iges
tion,
hea
t/e...
Compos
ting
Plast
ic re
cycl
ing
Cardbo
ard re
cycl
ing
SEK/person, year
Virgin plastic
Virgin cardboard
Chemical fertiliser N
Chemical fertilser P
Vehicle fuel
Electricity
Heat
Waste system
1 SEK 1 € 1 US$

Jan-Olov Sundqvist 29
• Welfare economy = Life Cycle Costs + Environmental costs
• Environmental costs by three different methods– ORWARE– ECOTAX– EPS 2000

Jan-Olov Sundqvist 30
Welfare (societal) costs - ORWARE
Welfare economy (ORWARE)
0
100
200
300
400
500
600
700
800
Incin
eratio
n
Landfill
An, dig
- bus fu
el
An. dig
.- heat/e
l.
Compostin
g
Plastic re
cycling
Cardboard
recyclin
g
SEK/person,year
Environmental valuation
External system
Waste system
1 SEK 1 € 1 US$

Jan-Olov Sundqvist 31
Welfare (societal) costs - EPS
Welfare economy (EPS)
0
200
400
600
800
1 000
1 200
1 400
Inci
nerat
ion
Landfil
l
An, dig
- bus
fuel
An. dig
.- hea
t/el.
Compost
ing
Plast
ic re
cycl
ing
Cardboar
d recy
clin
g
SEK/person, year
Emissions
Energy resources
External system
Waste system
1 SEK 1 € 1 US$

Jan-Olov Sundqvist 32
Welfare (societal) costs - Ecotax
Welfare economy (Ecotax)
0
200
400
600
800
1 000
1 200
1 400
1 600
1 800
Inci
nerat
ion
Landfil
l
An, dig
- bus
fuel
An. dig
.- hea
t/el.
Compost
ing
Plast
ic re
cycl
ing
Cardboar
d recy
clin
g
SEK/person, year
Emissions
Energy resources
External system
Waste system
1 SEK 1 € 1 US$

Jan-Olov Sundqvist 33
0
100
200
300
400
500
600
700
800
Inci
nerat
ion
Landfil
l
An, dig
- bus
fuel
An. dig
.- hea
t/el.
Compost
ing
Plast
ic re
cycl
ing
Cardboar
d recy
clin
g
SEK/person, year
Time spent by householdsEnvironmental valuationExternal systemWaste system
1 SEK 1 € 1 US$
If people’s time is valued to ~7 €/h

Jan-Olov Sundqvist 34
Thank You