Embed Size (px)
Citation preview
INTERNAL MODELS WITHIN NON-LIFE INSURANCEOlov Dahlberg & Johan Bergström
AGENDA
Who are we?
Introduction
Modelling one risk at a time
Modelling through a cash flow approach
Excel Example
WHO ARE WE?
… and the short story about Trygg-Hansa
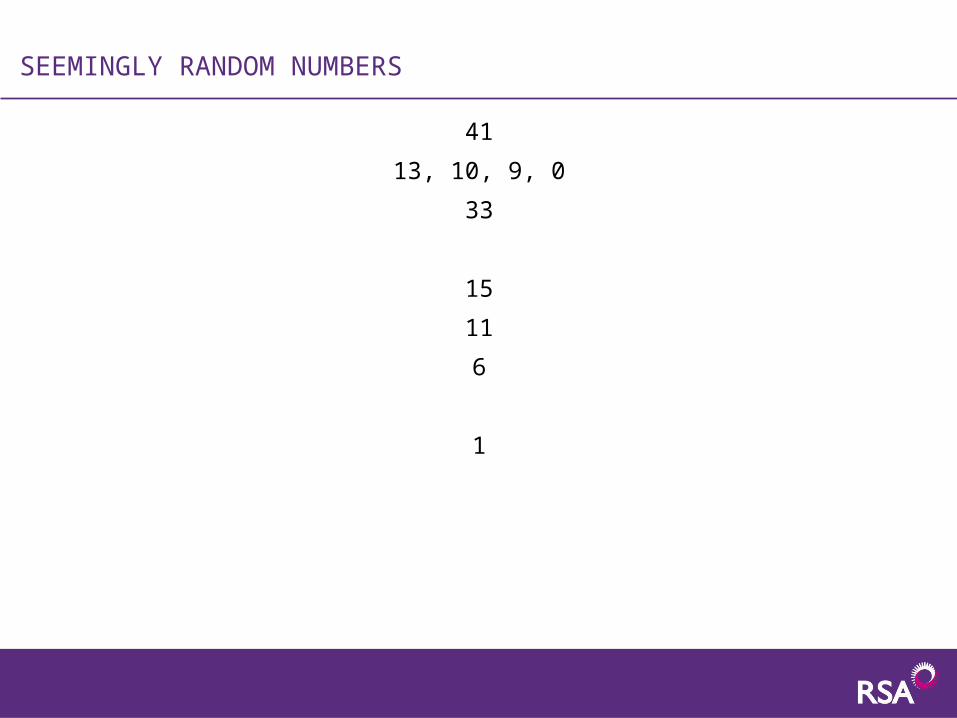
SEEMINGLY RANDOM NUMBERS
41
13, 10, 9, 0
33
15
11
6
1
INTRODUCTION
5
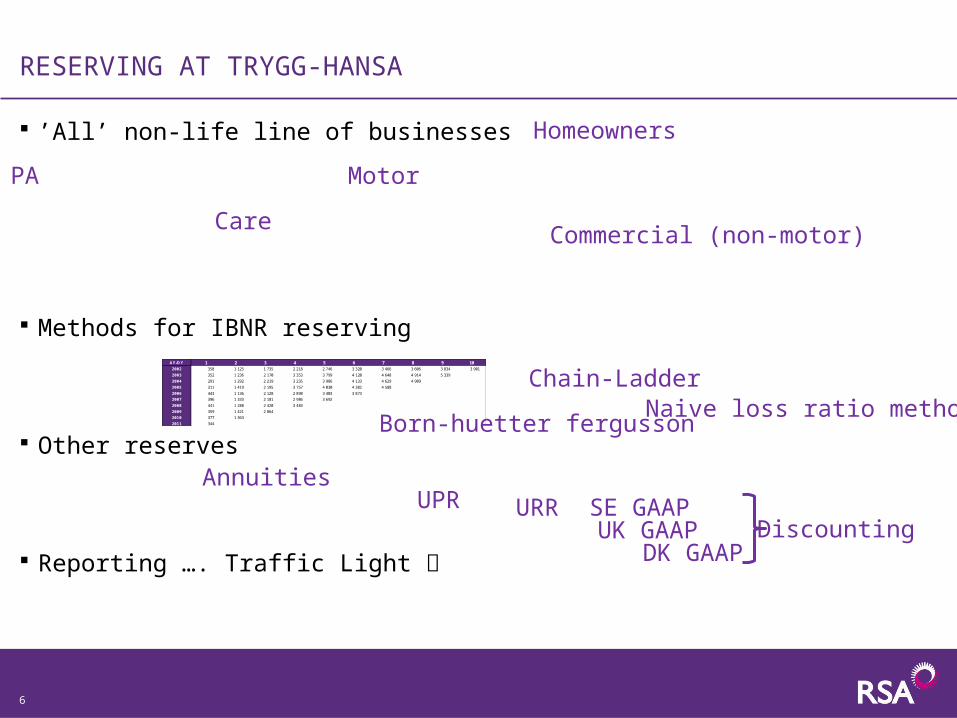
RESERVING AT TRYGG-HANSA
’All’ non-life line of businesses
Methods for IBNR reserving
Other reserves
Reporting …. Traffic Light
PA Motor
Homeowners
Commercial (non-motor)Care
Chain-LadderAY/DY 1 2 3 4 5 6 7 8 9 10
2002 358 1 125 1 735 2 218 2 746 3 320 3 466 3 606 3 834 3 901
2003 352 1 236 2 170 3 353 3 799 4 120 4 648 4 914 5 339
2004 291 1 292 2 219 3 235 3 986 4 133 4 629 4 909
2005 311 1 419 2 195 3 757 4 030 4 382 4 588
2006 443 1 136 2 128 2 898 3 403 3 873
2007 396 1 333 2 181 2 986 3 692
2008 441 1 288 2 420 3 483
2009 359 1 421 2 864
2010 377 1 363
2011 344 Born-huetter fergussonNaive loss ratio method
AnnuitiesUPR URR
UK GAAPSE GAAP
DK GAAPDiscounting
6
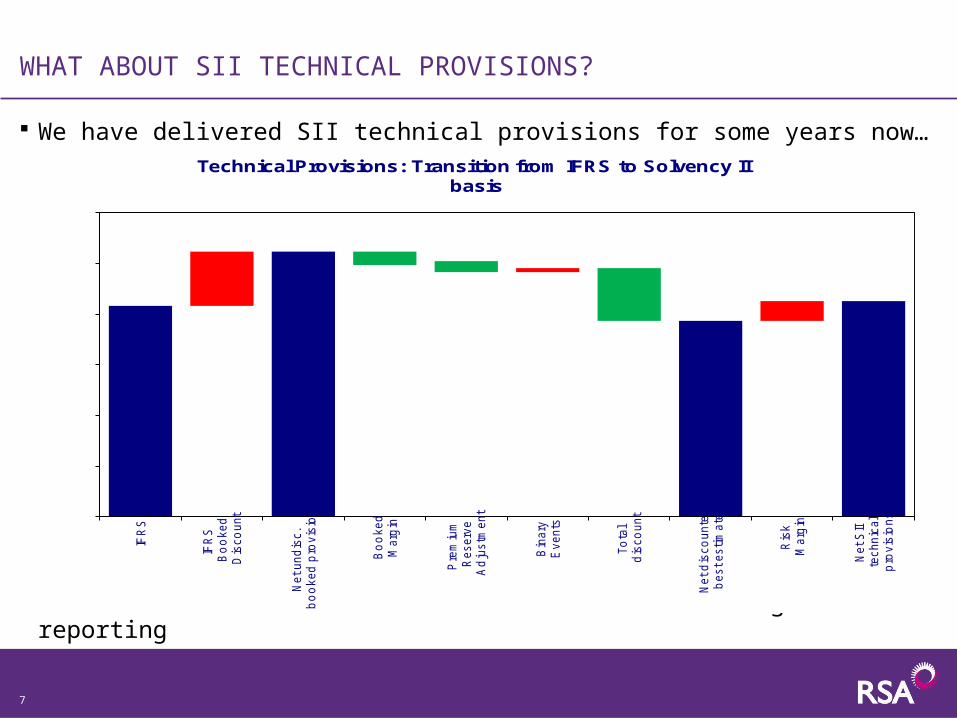
WHAT ABOUT SII TECHNICAL PROVISIONS?
We have delivered SII technical provisions for some years now…
…. several of above features are used in Traffic Light reporting
7
0
5 000
10 000
15 000
20 000
25 000
30 000
IFR
S
IFR
S
Bo
oked
Dis
co
unt
Net und
isc.
bo
oked
pro
vis
ions
Bo
oked
Marg
in
Pre
miu
m
Reserv
e
Ad
justm
ent
Bin
ary
Events
To
tal
dis
co
unt
Net d
isco
unte
d
best estim
ate
Ris
k
Marg
in
Net S
II
technic
al
pro
vis
ions
Technical Provisions: Transition from IFRS to Solvency IIbasis
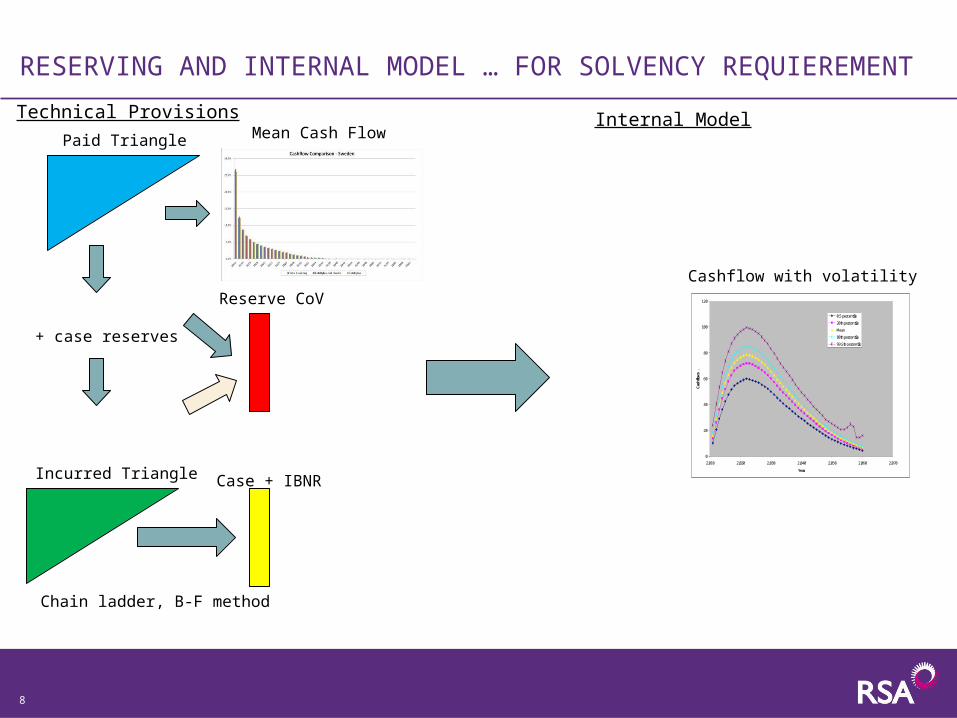
RESERVING AND INTERNAL MODEL … FOR SOLVENCY REQUIEREMENT
Technical Provisions
Paid Triangle
+ case reserves
Incurred Triangle
Mean Cash Flow
Chain ladder, B-F method
Case + IBNR
Reserve CoV
Internal Model
0
20
40
60
80
100
120
2,010 2,020 2,030 2,040 2,050 2,060 2,070
Year
Cas
hflo
ws
.
0.5 percentile
20th percentile
Mean
80th percentile
99.5th percentile
Cashflow with volatility
8
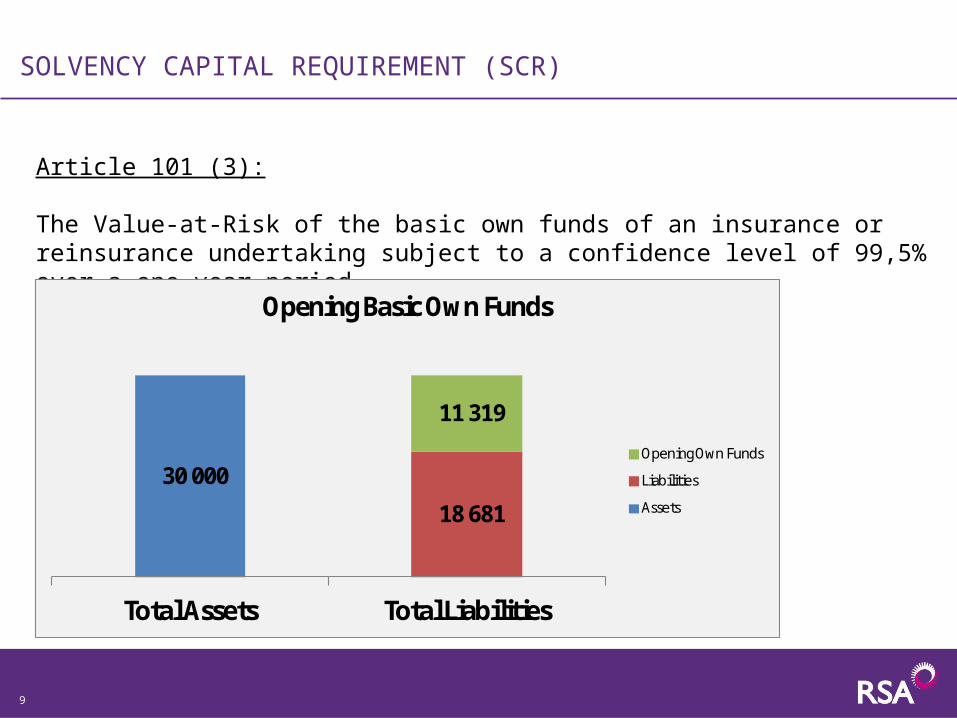
SOLVENCY CAPITAL REQUIREMENT (SCR)
Article 101 (3):
The Value-at-Risk of the basic own funds of an insurance or reinsurance undertaking subject to a confidence level of 99,5% over a one-year period.
30 000
18 681
11 319
Total Assets Total Liabilities
Opening Basic Own Funds
Opening Own Funds
Liabilities
Assets
9
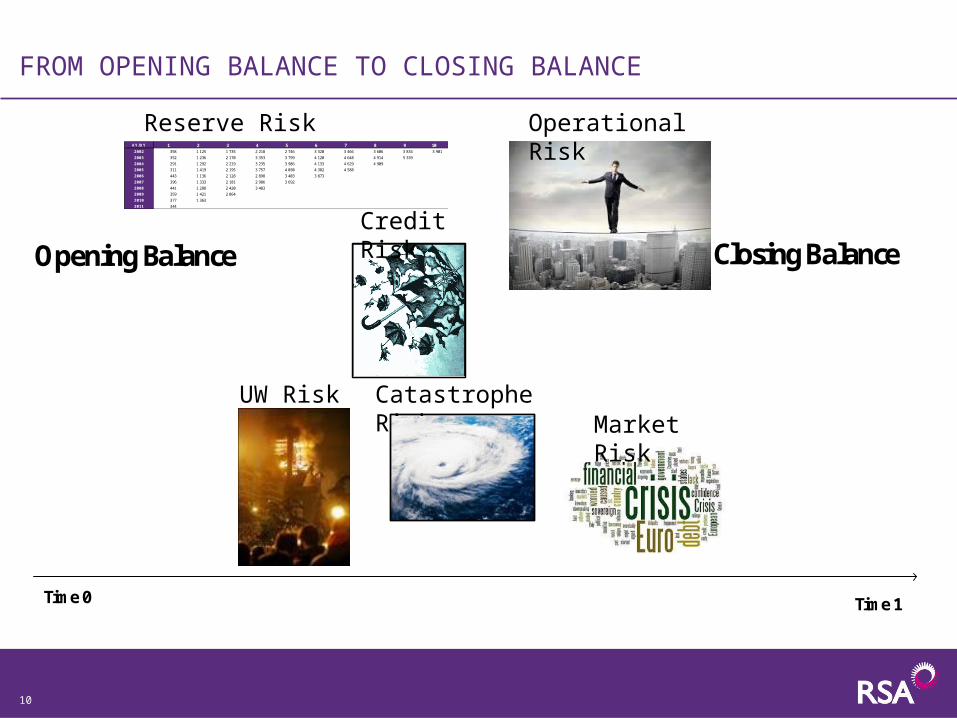
Time 0 Time 1
Opening Balance Closing Balance
FROM OPENING BALANCE TO CLOSING BALANCE
AY/DY 1 2 3 4 5 6 7 8 9 10
2002 358 1 125 1 735 2 218 2 746 3 320 3 466 3 606 3 834 3 901
2003 352 1 236 2 170 3 353 3 799 4 120 4 648 4 914 5 339
2004 291 1 292 2 219 3 235 3 986 4 133 4 629 4 909
2005 311 1 419 2 195 3 757 4 030 4 382 4 588
2006 443 1 136 2 128 2 898 3 403 3 873
2007 396 1 333 2 181 2 986 3 692
2008 441 1 288 2 420 3 483
2009 359 1 421 2 864
2010 377 1 363
2011 344
Reserve Risk
Catastrophe Risk
Credit Risk
Market Risk
Operational Risk
UW Risk
10
FROM OPENING BALANCE TO CLOSING BALANCE
Time 0 Time 1
11
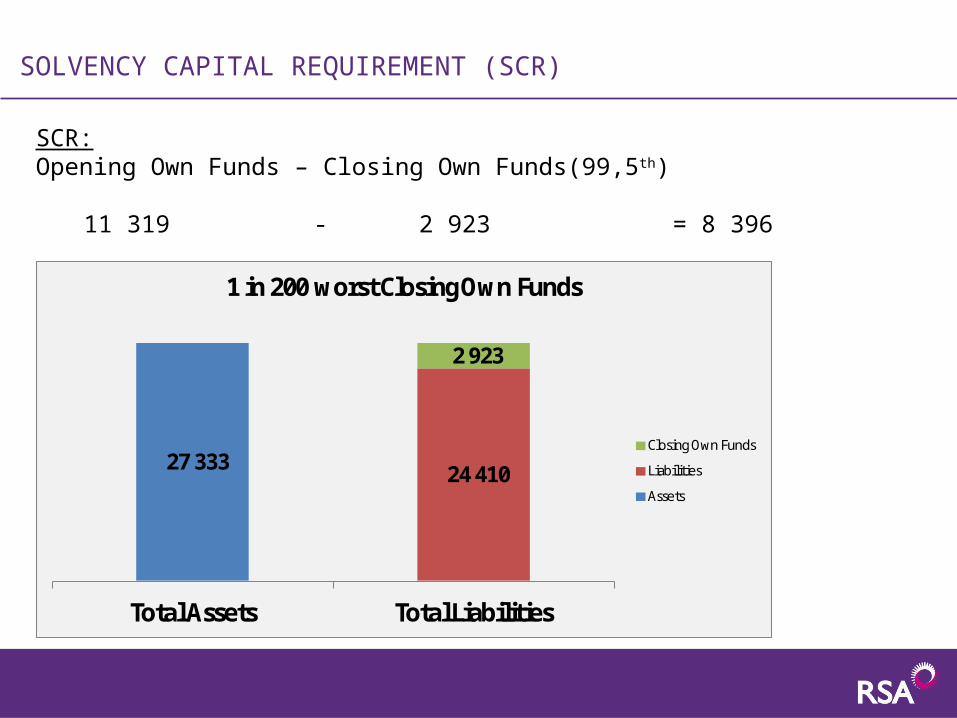
SOLVENCY CAPITAL REQUIREMENT (SCR)
27 333 24 410
2 923
Total Assets Total Liabilities
1 in 200 worst Closing Own Funds
Closing Own Funds
Liabilities
Assets
SCR:Opening Own Funds – Closing Own Funds(99,5th)
11 319 - 2 923 = 8 396
ONE RISK AT A TIME APPROACH
13
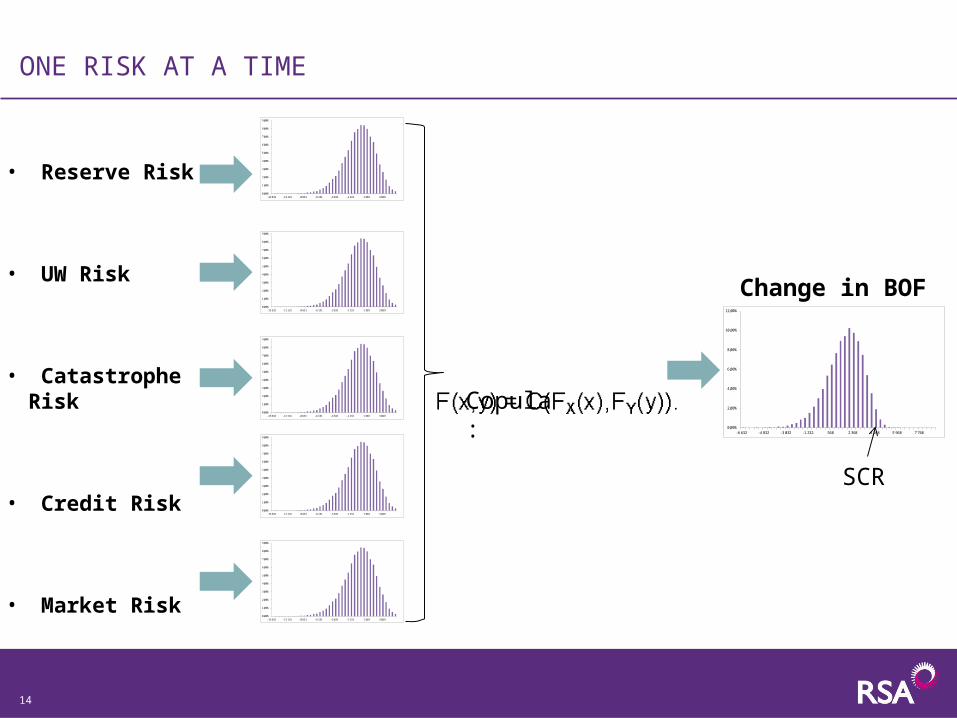
ONE RISK AT A TIME
• Reserve Risk
• UW Risk
• Catastrophe Risk
• Credit Risk
• Market Risk
Copula:
0,00%
1,00%
2,00%
3,00%
4,00%
5,00%
6,00%
7,00%
8,00%
9,00%
- 13 631 - 11 131 - 8 631 - 6 131 - 3 631 - 1 131 1 369 3 869
0,00%
1,00%
2,00%
3,00%
4,00%
5,00%
6,00%
7,00%
8,00%
9,00%
- 13 631 - 11 131 - 8 631 - 6 131 - 3 631 - 1 131 1 369 3 869
0,00%
1,00%
2,00%
3,00%
4,00%
5,00%
6,00%
7,00%
8,00%
9,00%
- 13 631 - 11 131 - 8 631 - 6 131 - 3 631 - 1 131 1 369 3 869
0,00%
1,00%
2,00%
3,00%
4,00%
5,00%
6,00%
7,00%
8,00%
9,00%
- 13 631 - 11 131 - 8 631 - 6 131 - 3 631 - 1 131 1 369 3 869
0,00%
1,00%
2,00%
3,00%
4,00%
5,00%
6,00%
7,00%
8,00%
9,00%
- 13 631 - 11 131 - 8 631 - 6 131 - 3 631 - 1 131 1 369 3 869
0,00%
2,00%
4,00%
6,00%
8,00%
10,00%
12,00%
- 6 632 - 4 832 - 3 032 - 1 232 568 2 368 4 168 5 968 7 768
Change in BOF
14
SCR
CASH FLOW APPROACH
15
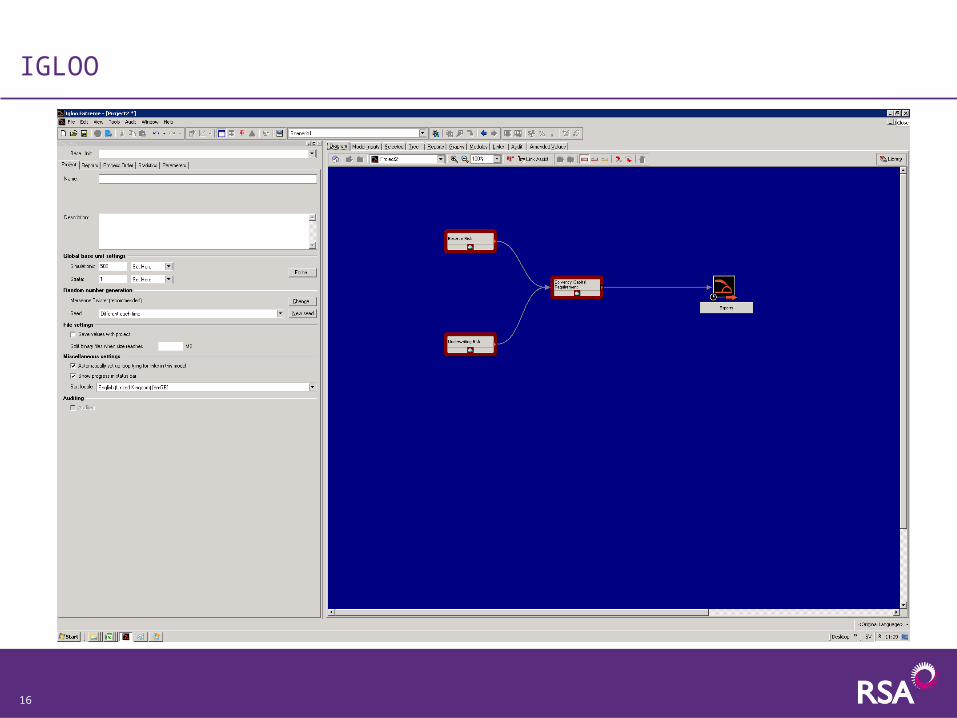
IGLOO
16
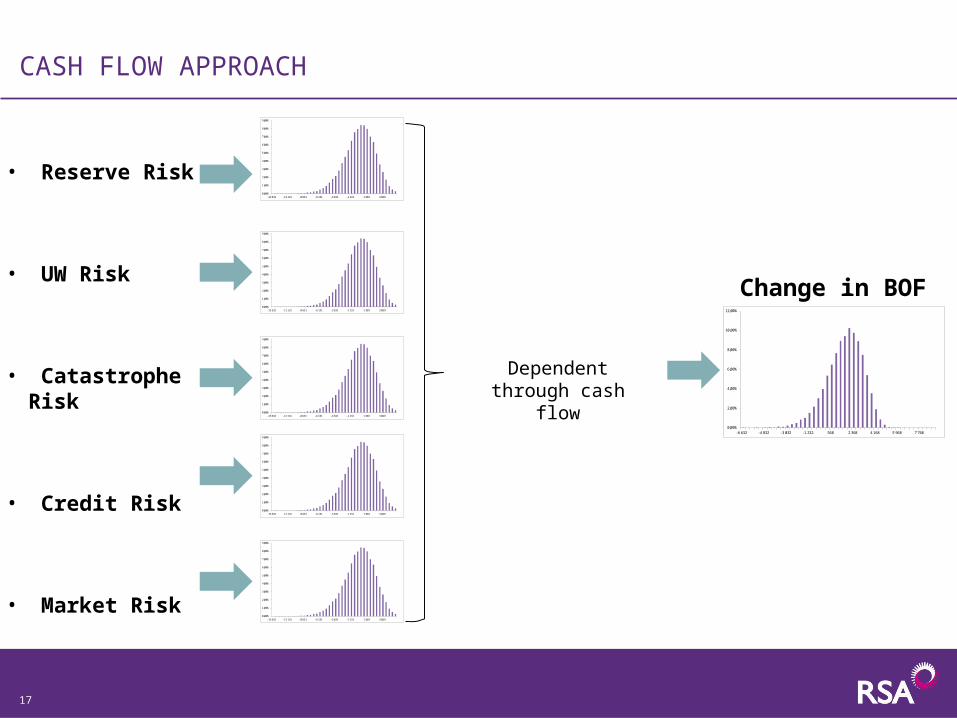
CASH FLOW APPROACH
• Reserve Risk
• UW Risk
• Catastrophe Risk
• Credit Risk
• Market Risk
Dependent through cash flow
0,00%
1,00%
2,00%
3,00%
4,00%
5,00%
6,00%
7,00%
8,00%
9,00%
- 13 631 - 11 131 - 8 631 - 6 131 - 3 631 - 1 131 1 369 3 869
0,00%
1,00%
2,00%
3,00%
4,00%
5,00%
6,00%
7,00%
8,00%
9,00%
- 13 631 - 11 131 - 8 631 - 6 131 - 3 631 - 1 131 1 369 3 869
0,00%
1,00%
2,00%
3,00%
4,00%
5,00%
6,00%
7,00%
8,00%
9,00%
- 13 631 - 11 131 - 8 631 - 6 131 - 3 631 - 1 131 1 369 3 869
0,00%
1,00%
2,00%
3,00%
4,00%
5,00%
6,00%
7,00%
8,00%
9,00%
- 13 631 - 11 131 - 8 631 - 6 131 - 3 631 - 1 131 1 369 3 869
0,00%
1,00%
2,00%
3,00%
4,00%
5,00%
6,00%
7,00%
8,00%
9,00%
- 13 631 - 11 131 - 8 631 - 6 131 - 3 631 - 1 131 1 369 3 869
0,00%
2,00%
4,00%
6,00%
8,00%
10,00%
12,00%
- 6 632 - 4 832 - 3 032 - 1 232 568 2 368 4 168 5 968 7 768
Change in BOF
17
QUESTIONS?