Embed Size (px)
Citation preview

1
www.teekay.com
T E E K A Y C O R P O R A T I O N
Corporate Presentation
January 2008
2
2 www.teekay.com
Forward Looking StatementsThis presentation contains forward-looking statements (as defined in Section 21E of the Securities Exchange Act of 1934, as amended) which reflect management’s current views with respect to certain future events and performance, including statements regarding: the Company’s future growth prospects; tanker market fundamentals, including the balance of supply and demand in the tanker market, and spot tanker charter rates; the Company’s future capital expenditure commitments and the financing requirements for such commitments; the cash flow to be received from the Company’s L.P. and G.P. ownership; the Company’s valuation; the expected growth of the LNG and Offshore markets; and the timing of newbuilding deliveries and the commencement of charter contracts. The following factors are among those that could cause actual results to differ materially from the forward-looking statements, which involve risks and uncertainties, and that should be considered in evaluating any such statement: changes in production of or demand for oil, petroleum products and LNG, either generally or in particular regions; greater or less than anticipated levels of tanker newbuilding orders or greater or less than anticipated rates of tanker scrapping; changes in trading patterns significantly affecting overall vessel tonnage requirements; changes in applicable industry laws and regulations and the timing of implementation of new laws and regulations; changes in the typical seasonal variations in tanker charter rates; changes in the offshore production of oil or demand for shuttle tankers; the potential for early termination of long-term contracts and inability of the Company to renew or replace long-term contracts; shipyard production delays; the Company’s future capital expenditure requirements; the Company’s, Teekay LNG’s, Teekay Offshore’s, and Teekay Tanker’spotential inability to raise financing to purchase additional vessels; and other factors discussed in Teekay’s filings from time to time with the SEC, including its Report on Form 20-F for the fiscal year ended December 31, 2006. The Company expressly disclaims any obligation or undertaking to release publicly any updates or revisions to any forward-looking statements contained herein to reflect any change in the Company’s expectations with respect thereto or any change in events, conditions or circumstances on which any such statement is based.
3
3 www.teekay.com
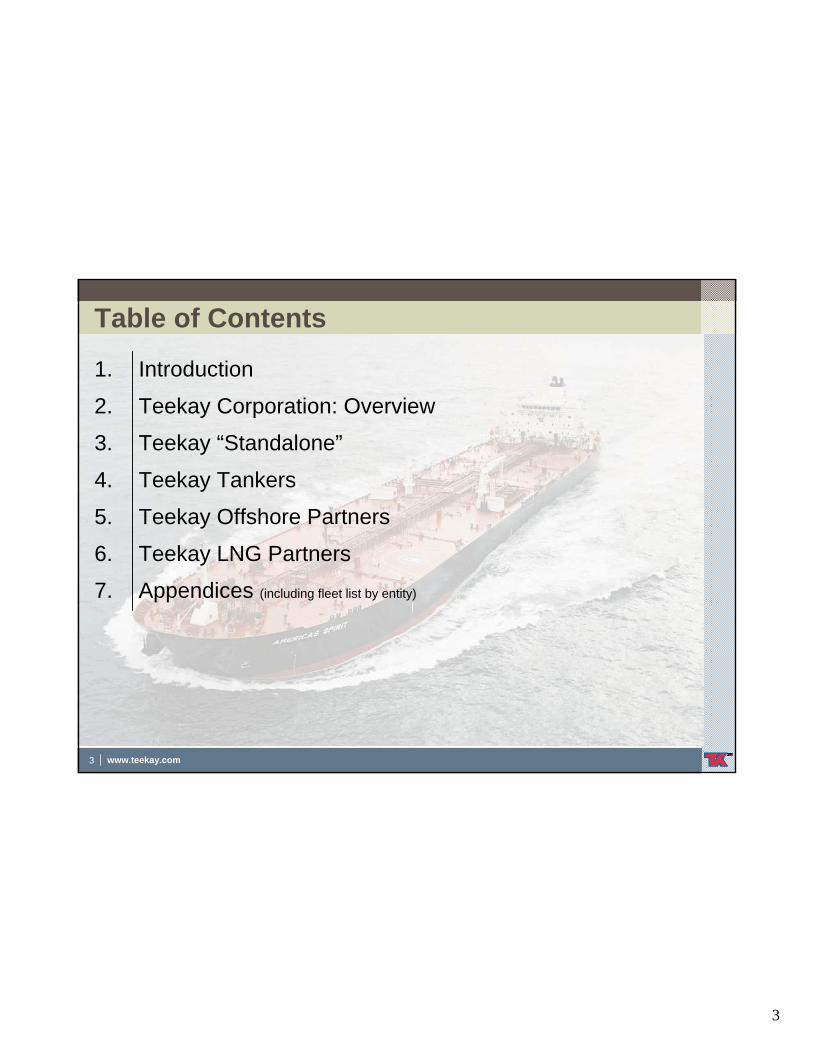
Table of Contents
Teekay Tankers 4.
Teekay “Standalone”3.
Appendices (including fleet list by entity)
Teekay LNG Partners
Teekay Offshore Partners
Teekay Corporation: Overview
Introduction
7.
6.
5.
2.
1.
4
4 www.teekay.com
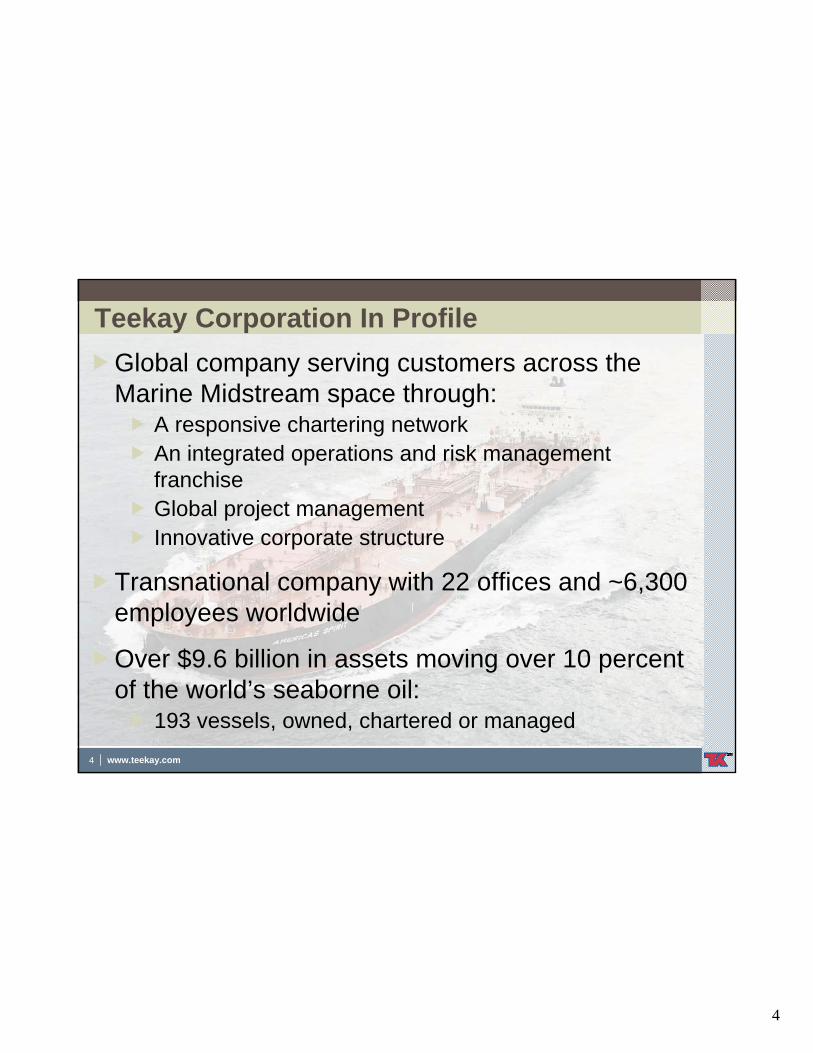
Teekay Corporation In ProfileGlobal company serving customers across the Marine Midstream space through:
A responsive chartering networkAn integrated operations and risk management franchiseGlobal project management Innovative corporate structure
Transnational company with 22 offices and ~6,300 employees worldwide
Over $9.6 billion in assets moving over 10 percent of the world’s seaborne oil:
193 vessels, owned, chartered or managed
5
5 www.teekay.com
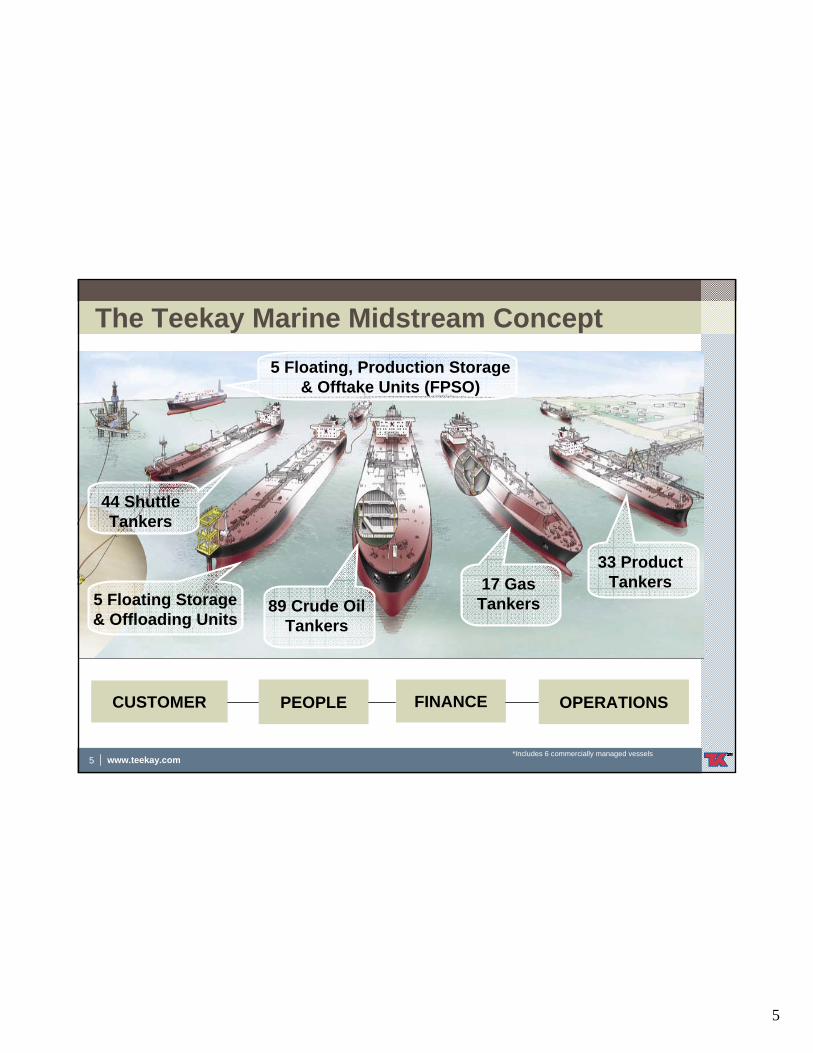
44 Shuttle Tankers
5 Floating Storage & Offloading Units
89 Crude Oil Tankers
17 Gas Tankers
33 Product Tankers
The Teekay Marine Midstream Concept5 Floating, Production Storage
& Offtake Units (FPSO)
OPERATIONSFINANCEPEOPLECUSTOMER
*Includes 6 commercially managed vessels
6
6 www.teekay.com
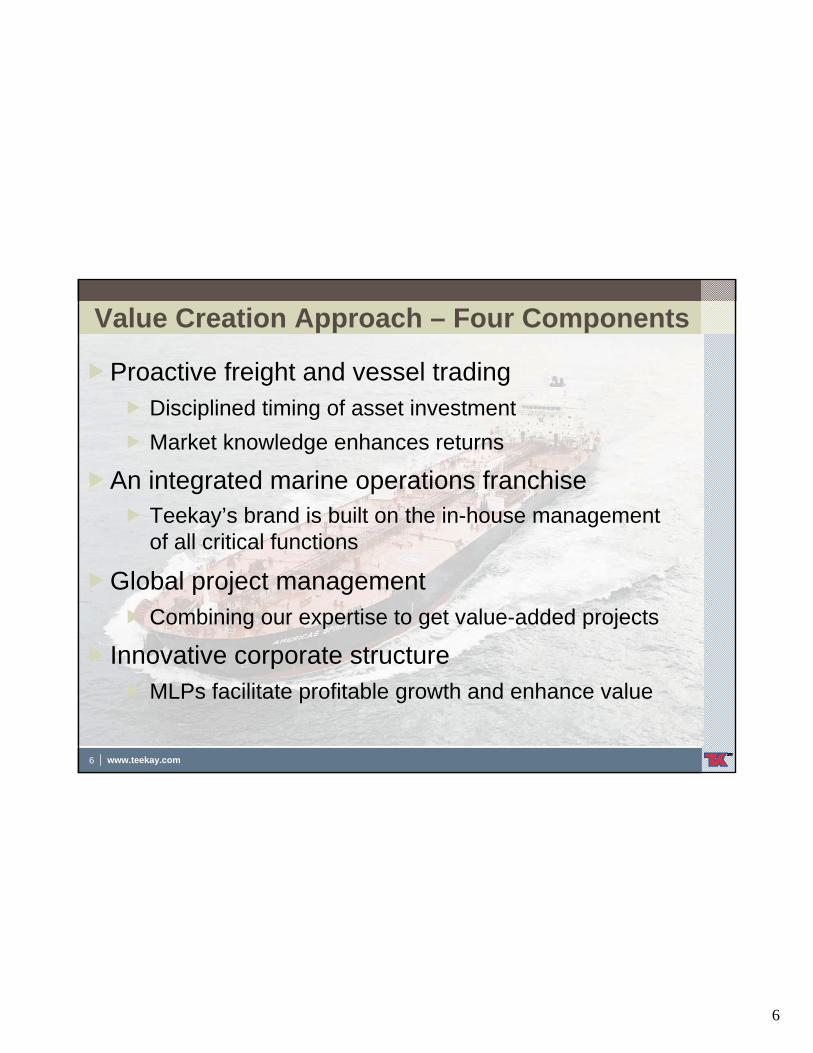
Value Creation Approach – Four Components
Proactive freight and vessel tradingDisciplined timing of asset investmentMarket knowledge enhances returns
An integrated marine operations franchiseTeekay’s brand is built on the in-house management of all critical functions
Global project management Combining our expertise to get value-added projects
Innovative corporate structureMLPs facilitate profitable growth and enhance value
7
7 www.teekay.com
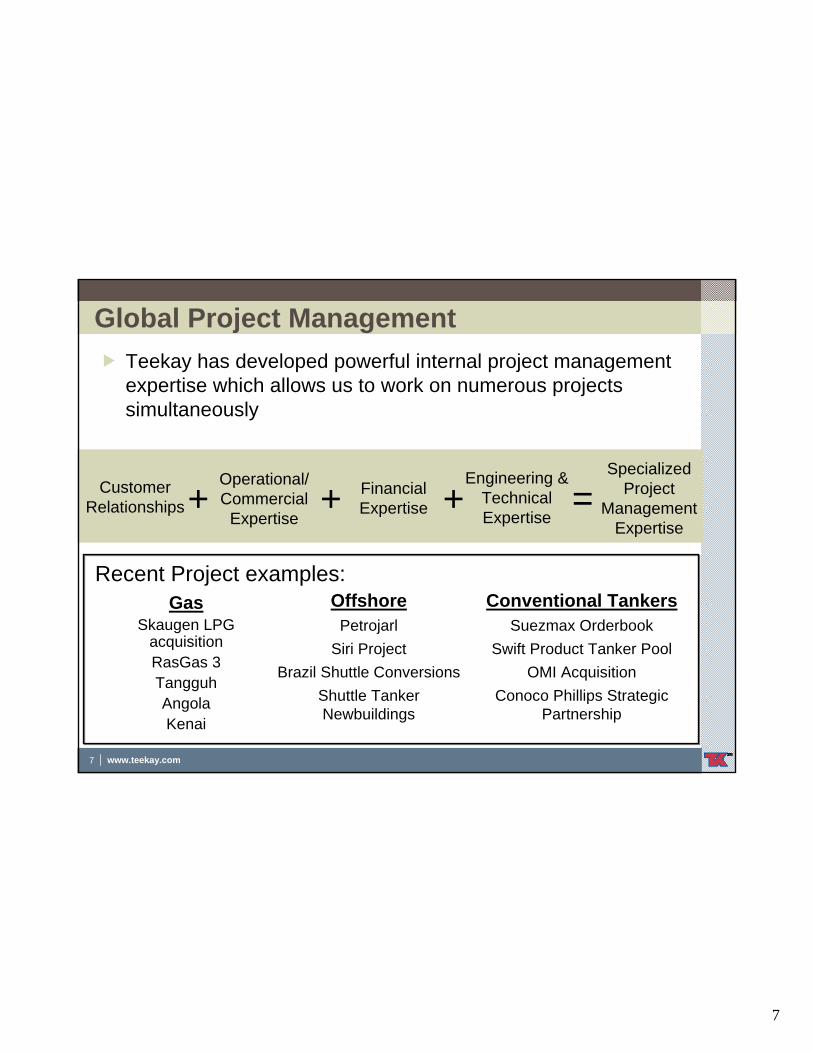
Global Project Management
=Operational/Commercial
Expertise
Financial Expertise
Engineering & Technical Expertise
+ +Specialized
Project Management
Expertise
Customer Relationships +
Teekay has developed powerful internal project management expertise which allows us to work on numerous projects simultaneously
GasSkaugen LPG
acquisitionRasGas 3TangguhAngolaKenai
OffshorePetrojarl
Siri ProjectBrazil Shuttle Conversions
Shuttle Tanker Newbuildings
Conventional TankersSuezmax Orderbook
Swift Product Tanker PoolOMI Acquisition
Conoco Phillips Strategic Partnership
Recent Project examples:
8
8 www.teekay.com
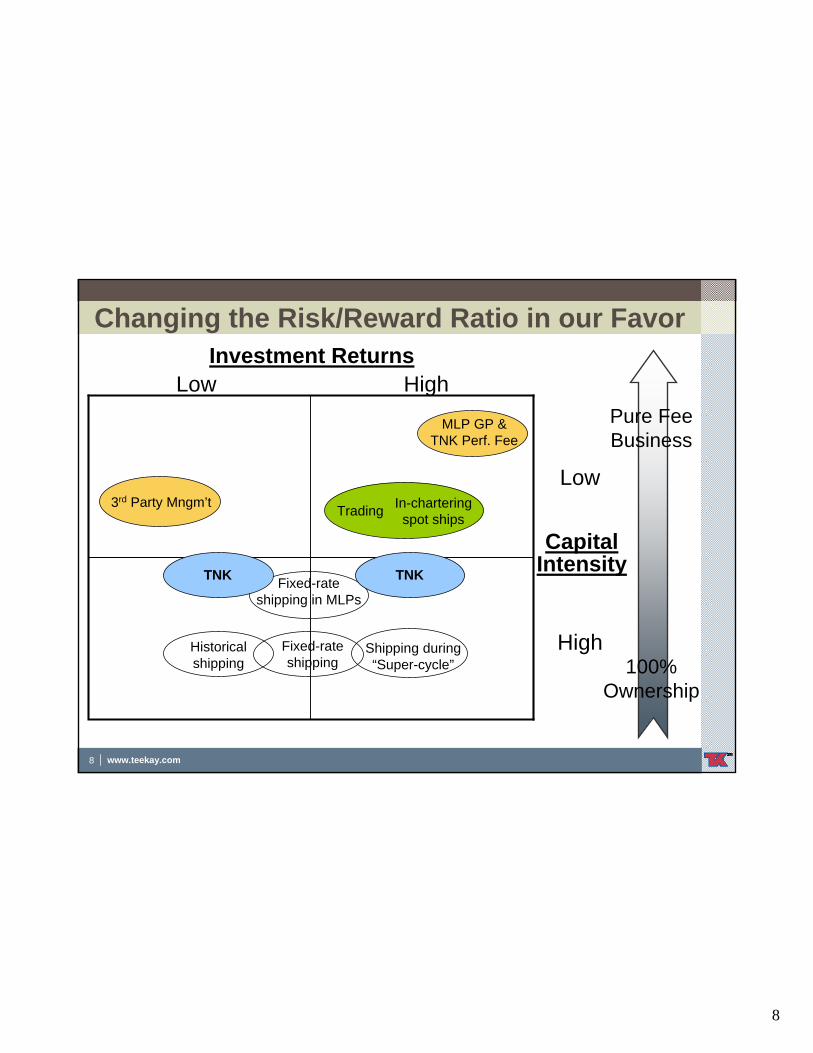
Changing the Risk/Reward Ratio in our Favor
Low High
Capital Intensity
Low
HighHistorical shipping
Shipping during “Super-cycle”
Fixed-rate shipping 100%
Ownership
Pure Fee Business
MLP GP & TNK Perf. Fee
3rd Party Mngm’t Trading In-chartering spot ships
Fixed-rate shipping in MLPs
Investment Returns
TNKTNK
9
9 www.teekay.com
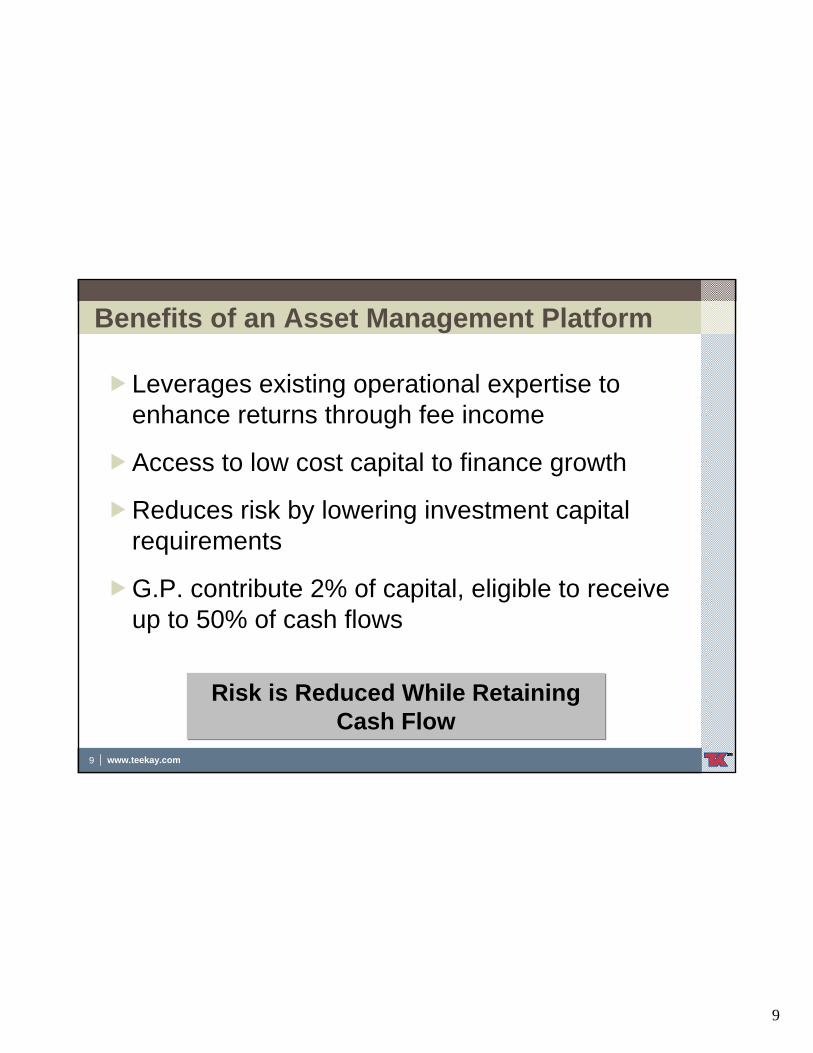
Benefits of an Asset Management Platform
Leverages existing operational expertise to enhance returns through fee income
Access to low cost capital to finance growth
Reduces risk by lowering investment capital requirements
G.P. contribute 2% of capital, eligible to receive up to 50% of cash flows
Risk is Reduced While Retaining Cash Flow
Risk is Reduced While Retaining Cash Flow
10
10 www.teekay.com
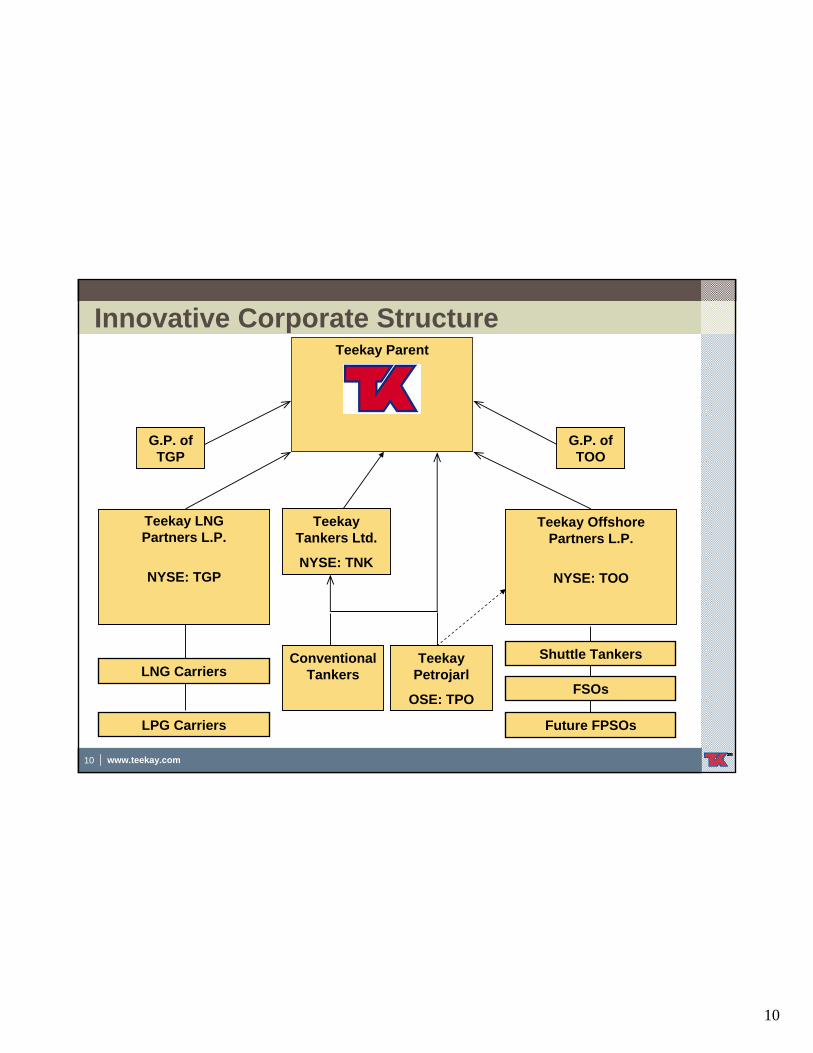
Innovative Corporate Structure
Teekay LNG Partners L.P.
NYSE: TGP
Teekay Parent
Conventional Tankers
G.P. of TGP
G.P. of TOO
LNG CarriersShuttle Tankers
FSOs
Future FPSOsLPG Carriers
Teekay Offshore Partners L.P.
NYSE: TOO
Teekay Petrojarl
OSE: TPO
Teekay Tankers Ltd.
NYSE: TNK
11
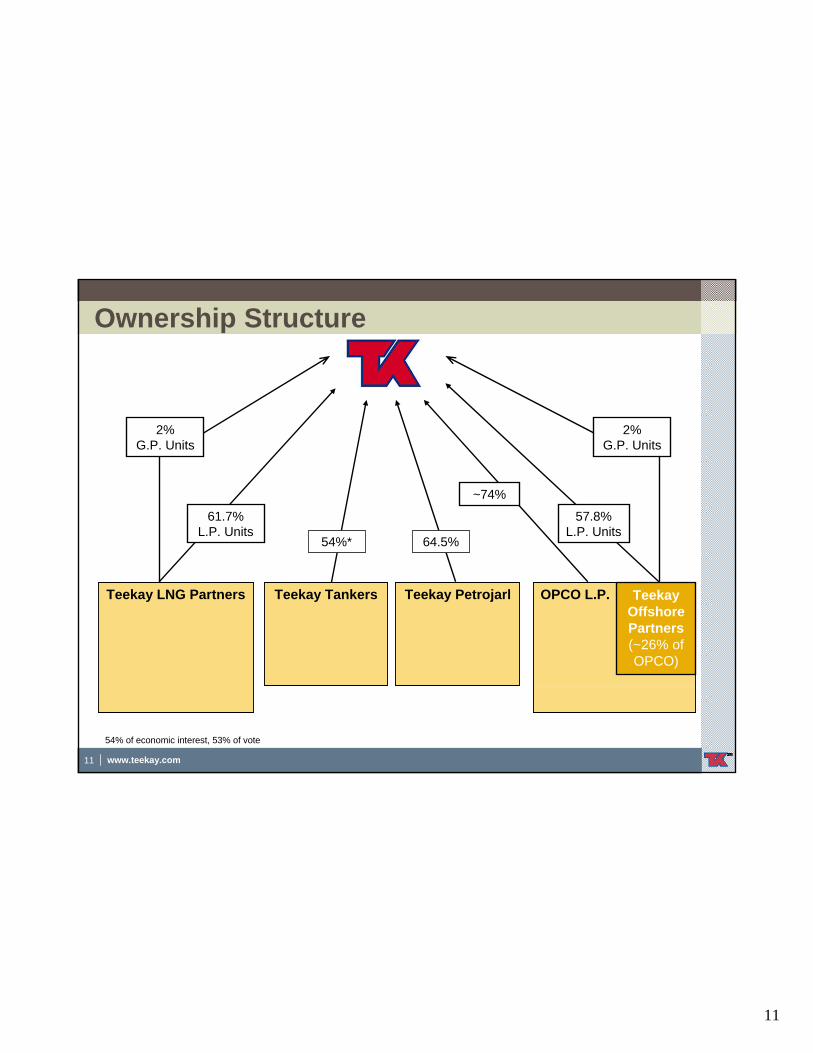
11 www.teekay.com
Ownership Structure
Teekay LNG Partners Teekay Petrojarl OPCO L.P.
2% G.P. Units
2% G.P. Units
Teekay Offshore Partners(~26% of OPCO)
Teekay Tankers
54%* 64.5%
54% of economic interest, 53% of vote
57.8% L.P. Units
61.7% L.P. Units
~74%
12
12 www.teekay.com
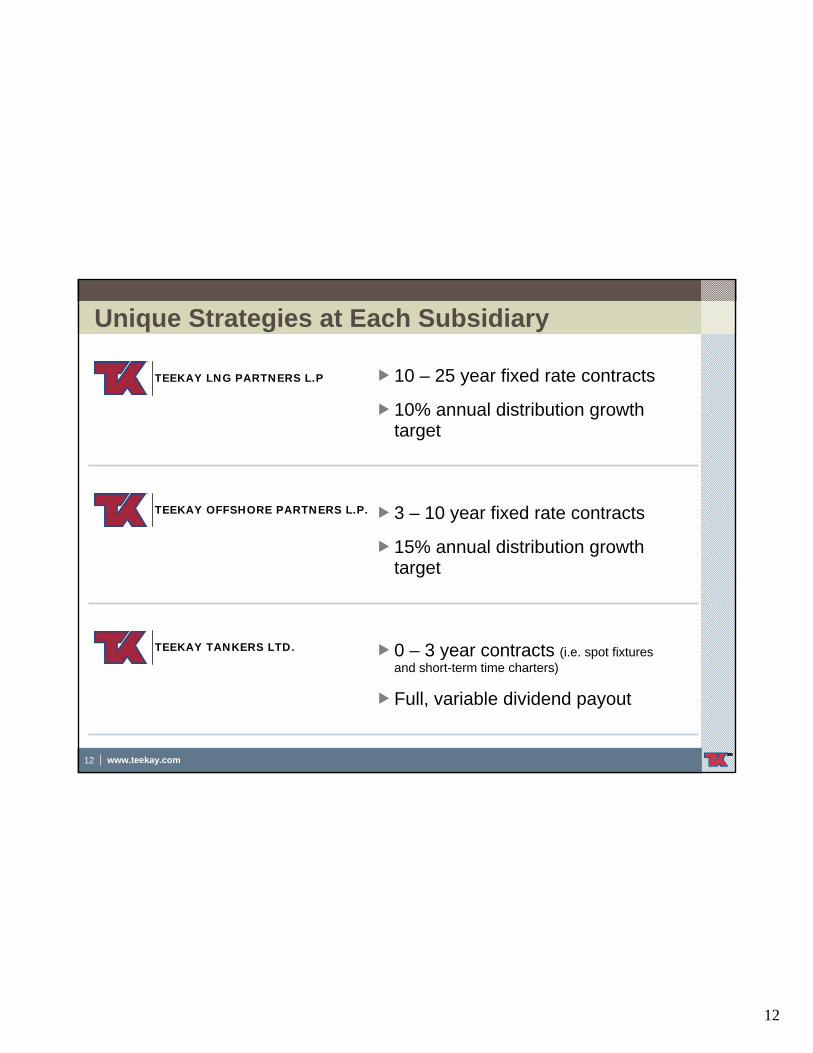
Unique Strategies at Each Subsidiary
10 – 25 year fixed rate contracts
10% annual distribution growth target
TEEKAY LNG PARTNERS L.P
TEEKAY TANKERS LTD.
TEEKAY OFFSHORE PARTNERS L.P. 3 – 10 year fixed rate contracts
15% annual distribution growth target
0 – 3 year contracts (i.e. spot fixtures and short-term time charters)
Full, variable dividend payout
13
13 www.teekay.com
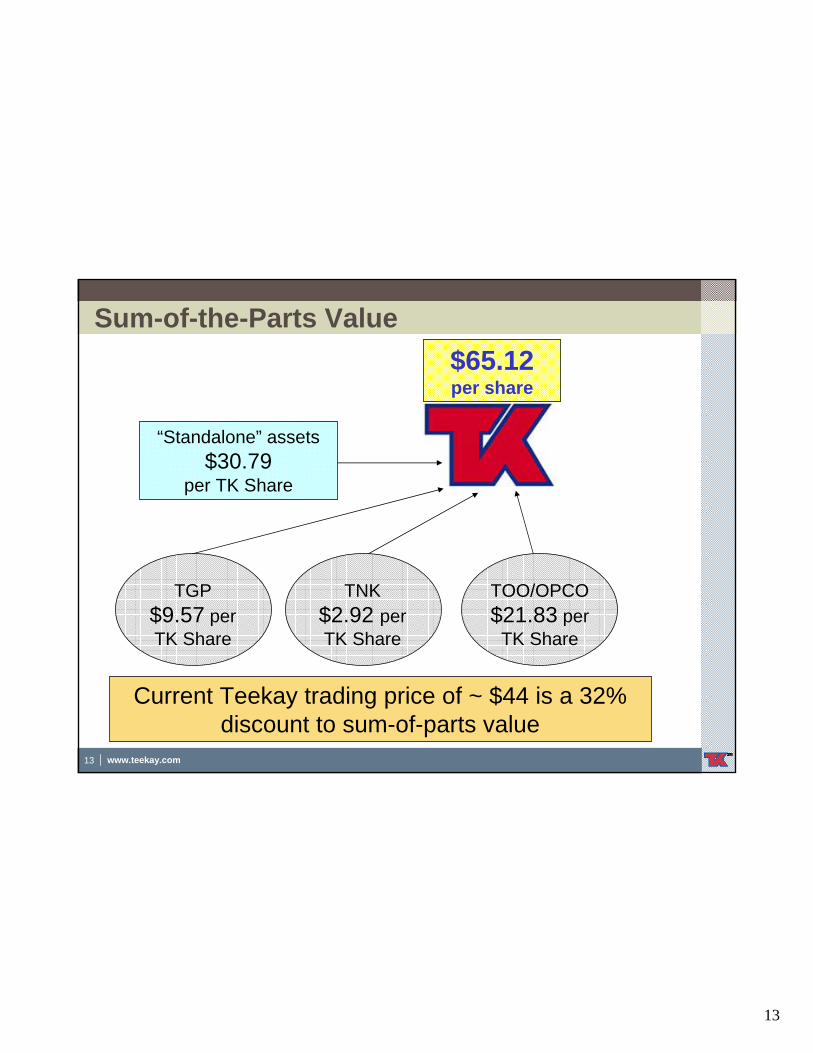
Sum-of-the-Parts Value
TGP$9.57 per TK Share
TNK$2.92 perTK Share
TOO/OPCO$21.83 per
TK Share
“Standalone” assets $30.79
per TK Share
$65.12per share
Current Teekay trading price of ~ $44 is a 32% discount to sum-of-parts value
14
14 www.teekay.com
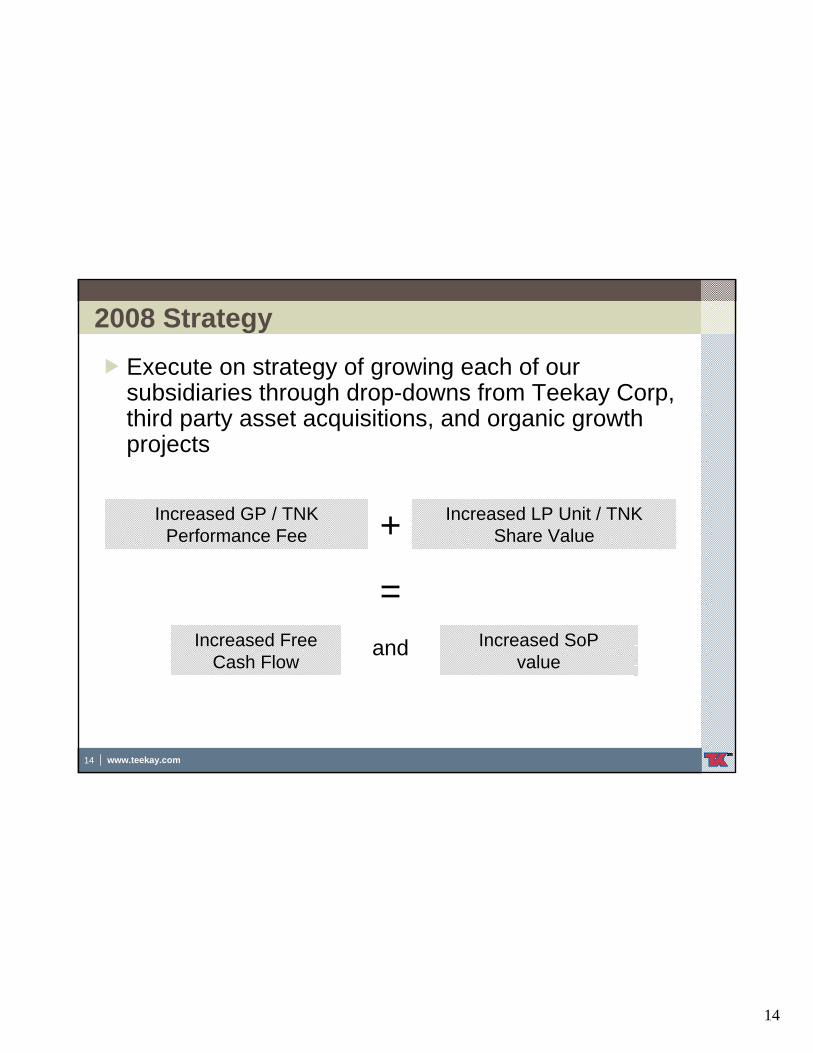
2008 Strategy Execute on strategy of growing each of our subsidiaries through drop-downs from Teekay Corp, third party asset acquisitions, and organic growth projects
Increased SoPvalue
Increased GP / TNK Performance Fee
Increased Free Cash Flow
+
=
Increased LP Unit / TNK Share Value
and
15
15 www.teekay.com
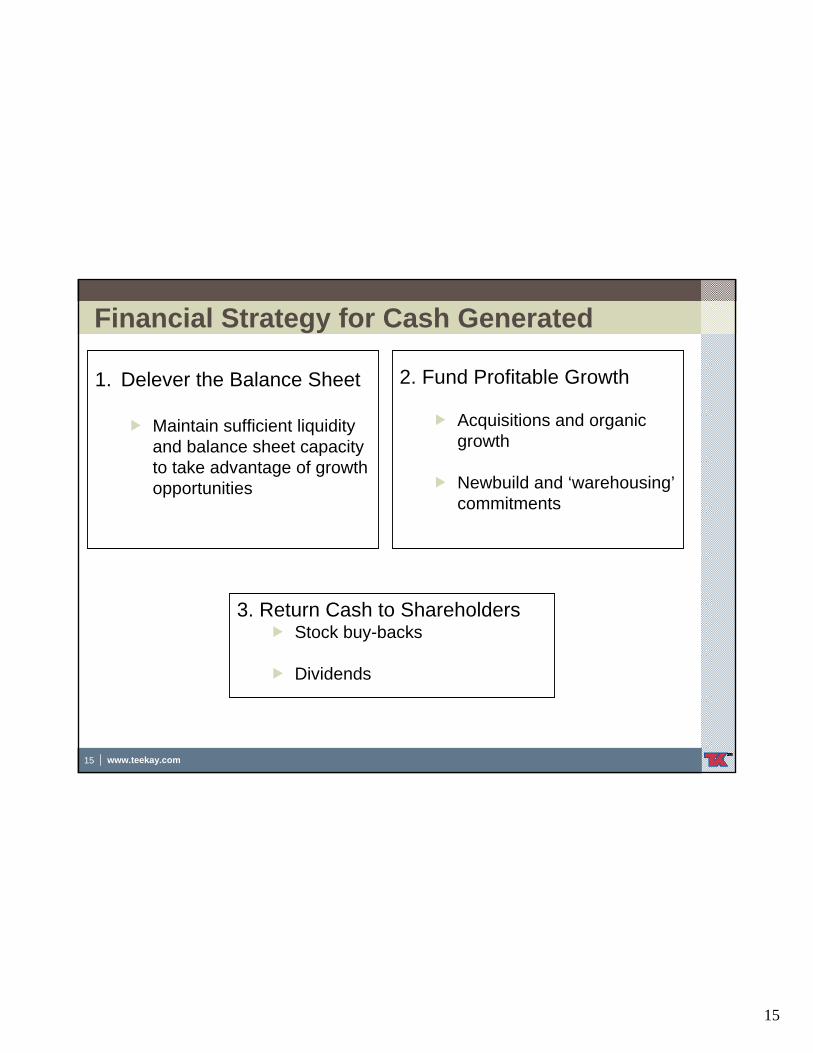
Financial Strategy for Cash Generated
1. Delever the Balance Sheet
Maintain sufficient liquidity and balance sheet capacity to take advantage of growth opportunities
2. Fund Profitable Growth
Acquisitions and organic growth
Newbuild and ‘warehousing’commitments
3. Return Cash to ShareholdersStock buy-backs
Dividends
16
16 www.teekay.com
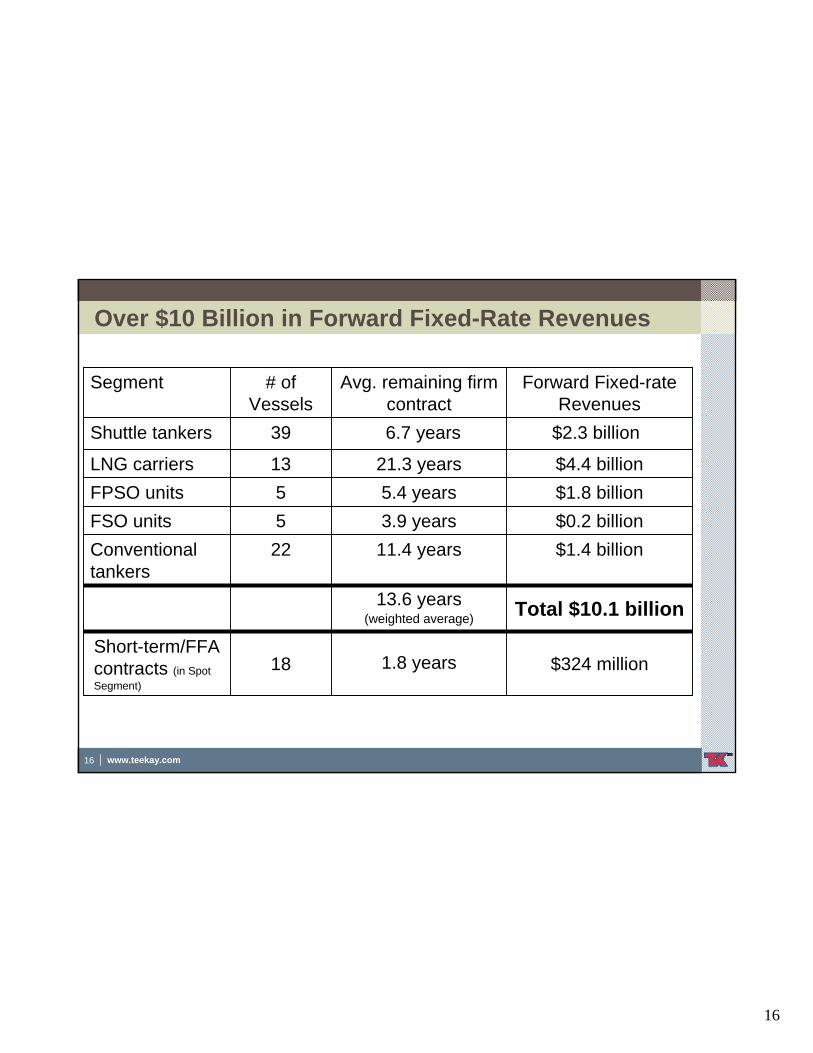
Over $10 Billion in Forward Fixed-Rate Revenues
$324 million1.8 years18Short-term/FFA contracts (in Spot Segment)
$1.8 billion5.4 years5FPSO units
Total $10.1 billion13.6 years (weighted average)
$1.4 billion11.4 years22Conventional tankers
$0.2 billion3.9 years5FSO units
$4.4 billion21.3 years13LNG carriers
$2.3 billion6.7 years 39Shuttle tankers
Forward Fixed-rate Revenues
Avg. remaining firm contract
# of Vessels
Segment
17
17 www.teekay.com
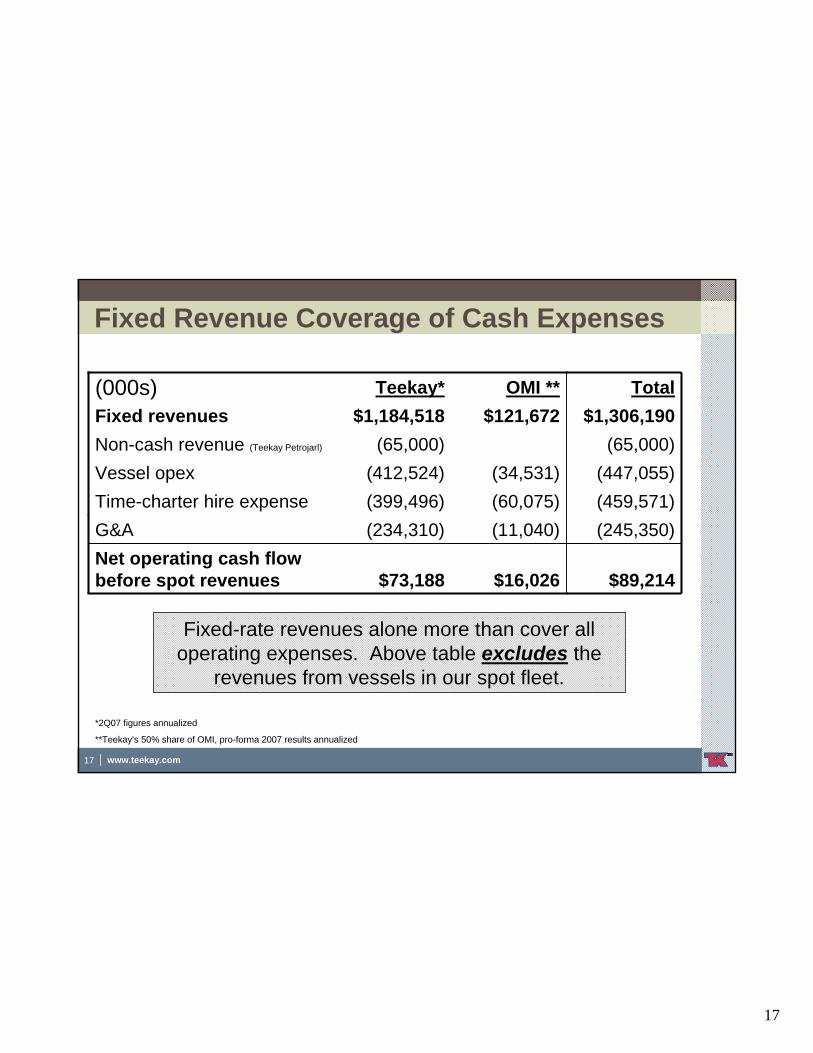
Fixed Revenue Coverage of Cash Expenses
$16,026
(11,040)(60,075)(34,531)
$121,672OMI **
$89,214
(245,350)(459,571)(447,055)
(65,000)$1,306,190
Total
(65,000)Non-cash revenue (Teekay Petrojarl)
$73,188Net operating cash flow before spot revenues
(234,310)(399,496)(412,524)
$1,184,518Teekay*
Vessel opex
G&ATime-charter hire expense
Fixed revenues
*2Q07 figures annualized
**Teekay’s 50% share of OMI, pro-forma 2007 results annualized
(000s)
Fixed-rate revenues alone more than cover all operating expenses. Above table excludes the
revenues from vessels in our spot fleet.
18
www.teekay.com
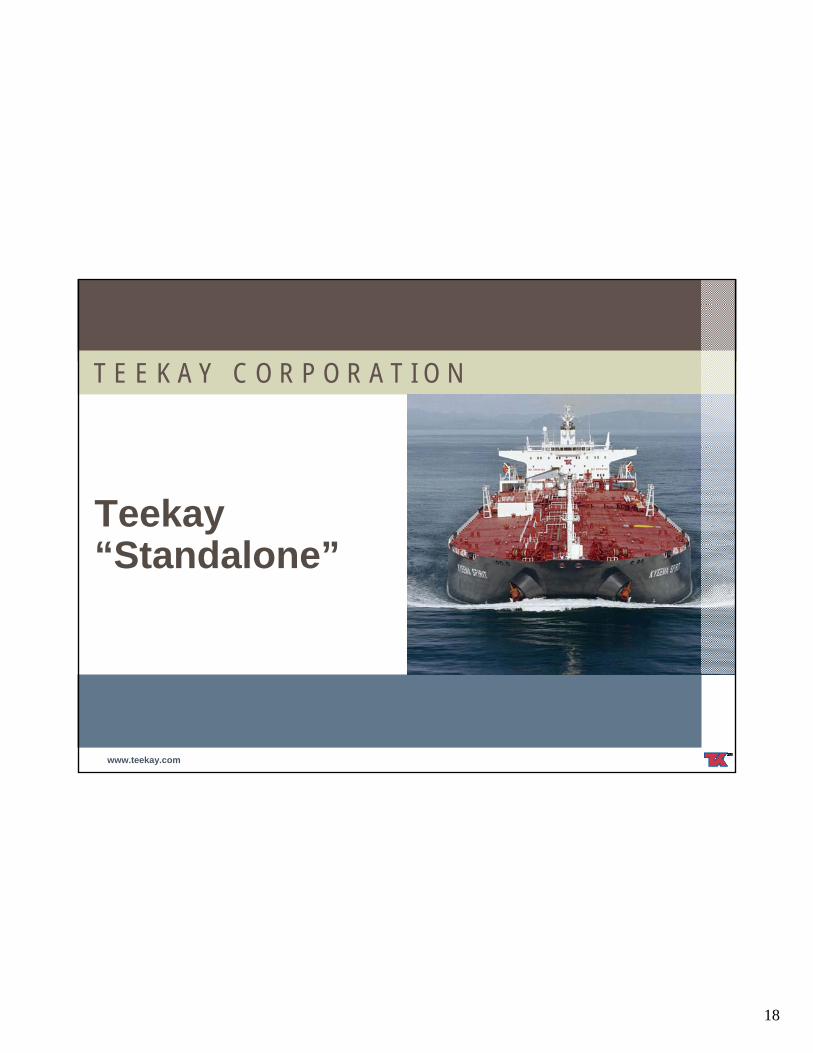
T E E K A Y C O R P O R A T I O N
Teekay “Standalone”
19
19 www.teekay.com
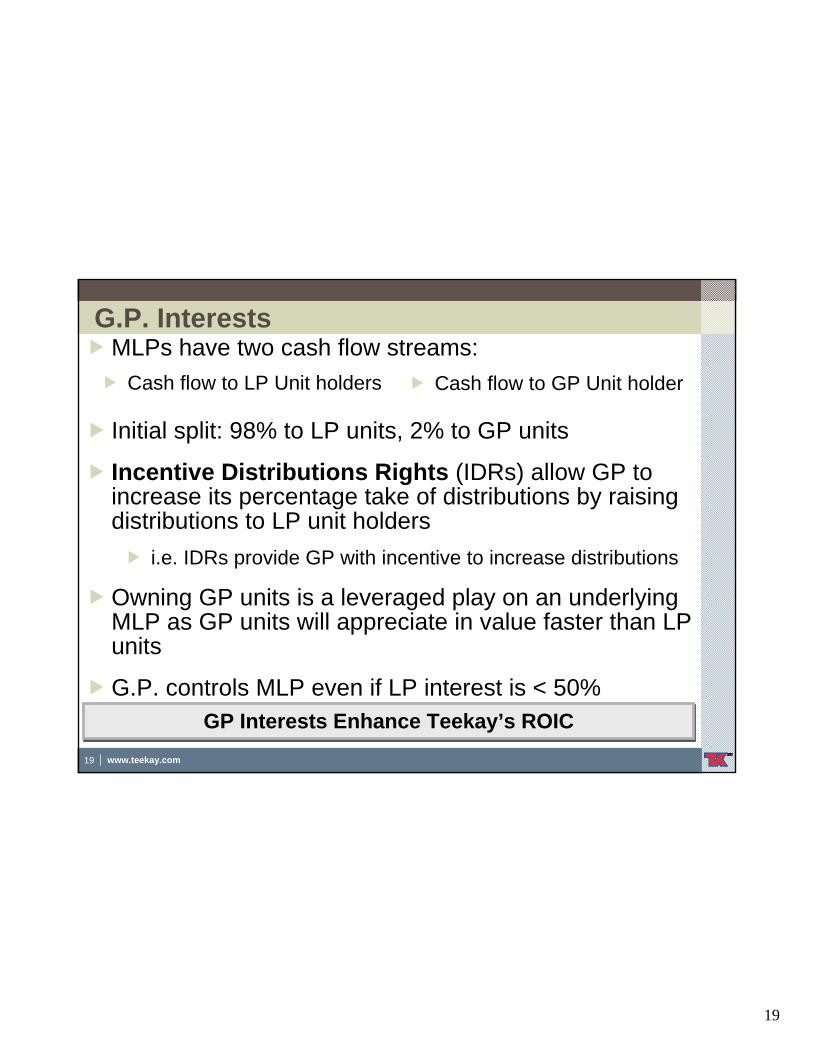
G.P. InterestsMLPs have two cash flow streams:
Initial split: 98% to LP units, 2% to GP units
Incentive Distributions Rights (IDRs) allow GP to increase its percentage take of distributions by raising distributions to LP unit holders
i.e. IDRs provide GP with incentive to increase distributions
Owning GP units is a leveraged play on an underlying MLP as GP units will appreciate in value faster than LP units
G.P. controls MLP even if LP interest is < 50%GP Interests Enhance Teekay’s ROICGP Interests Enhance Teekay’s ROIC
Cash flow to GP Unit holderCash flow to LP Unit holders
20
20 www.teekay.com
TNK Performance Fee
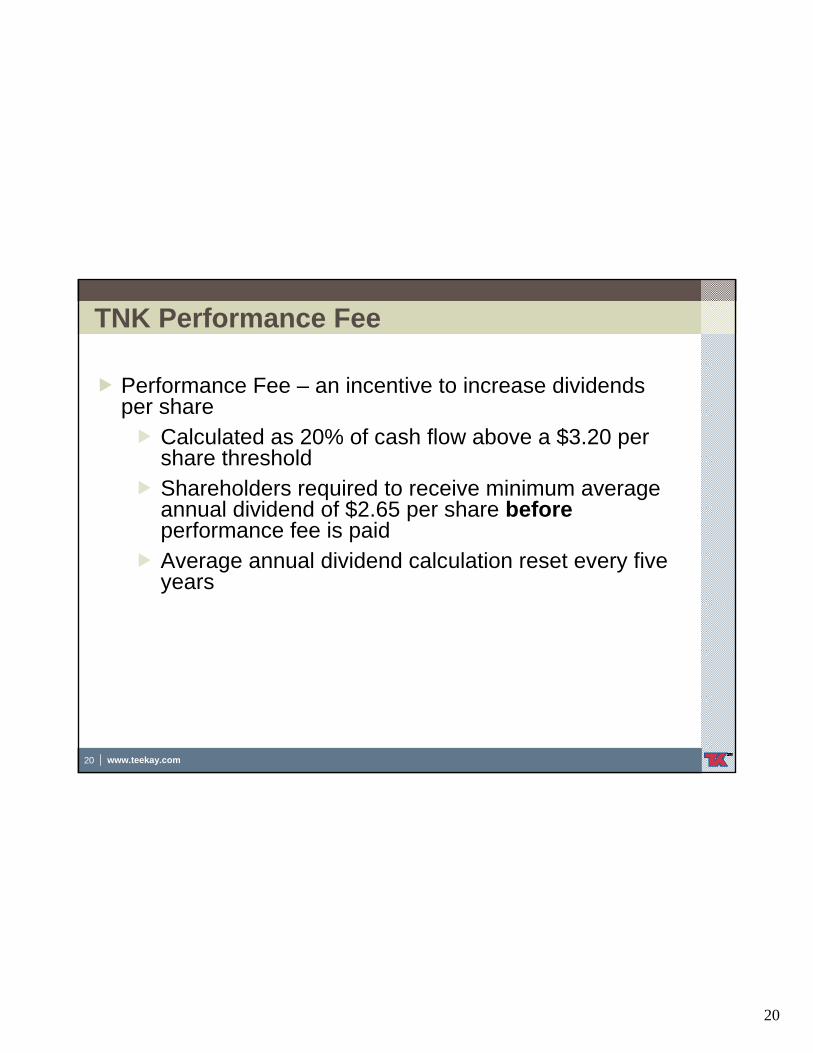
Performance Fee – an incentive to increase dividends per share
Calculated as 20% of cash flow above a $3.20 per share thresholdShareholders required to receive minimum average annual dividend of $2.65 per share beforeperformance fee is paidAverage annual dividend calculation reset every five years
21
21 www.teekay.com
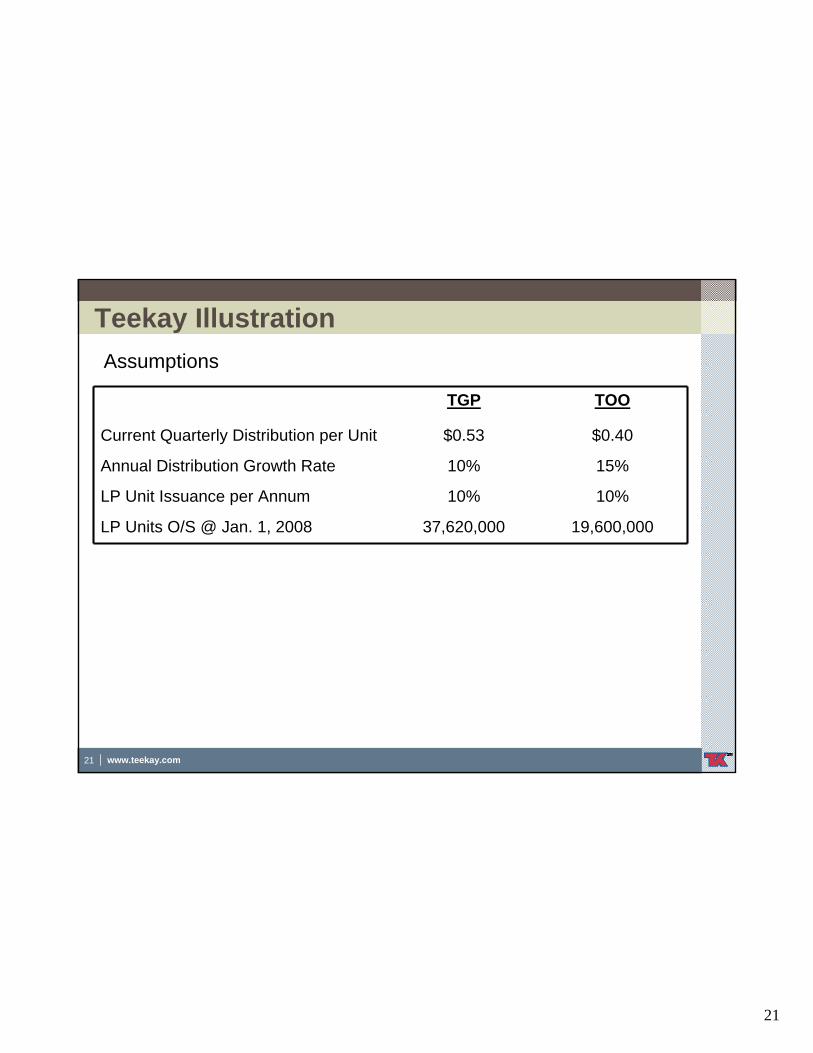
Teekay Illustration
19,600,00037,620,000LP Units O/S @ Jan. 1, 2008
10%10%LP Unit Issuance per Annum
15%10%Annual Distribution Growth Rate
$0.40$0.53Current Quarterly Distribution per Unit
TOOTGP
Assumptions
22
22 www.teekay.com
$$10$20$30$40$50$60$70$80$90
$100
2008 2009 2010 2011 2012
(mill
ions
)
TGP G.P. Distribution TOO G.P. Distribution
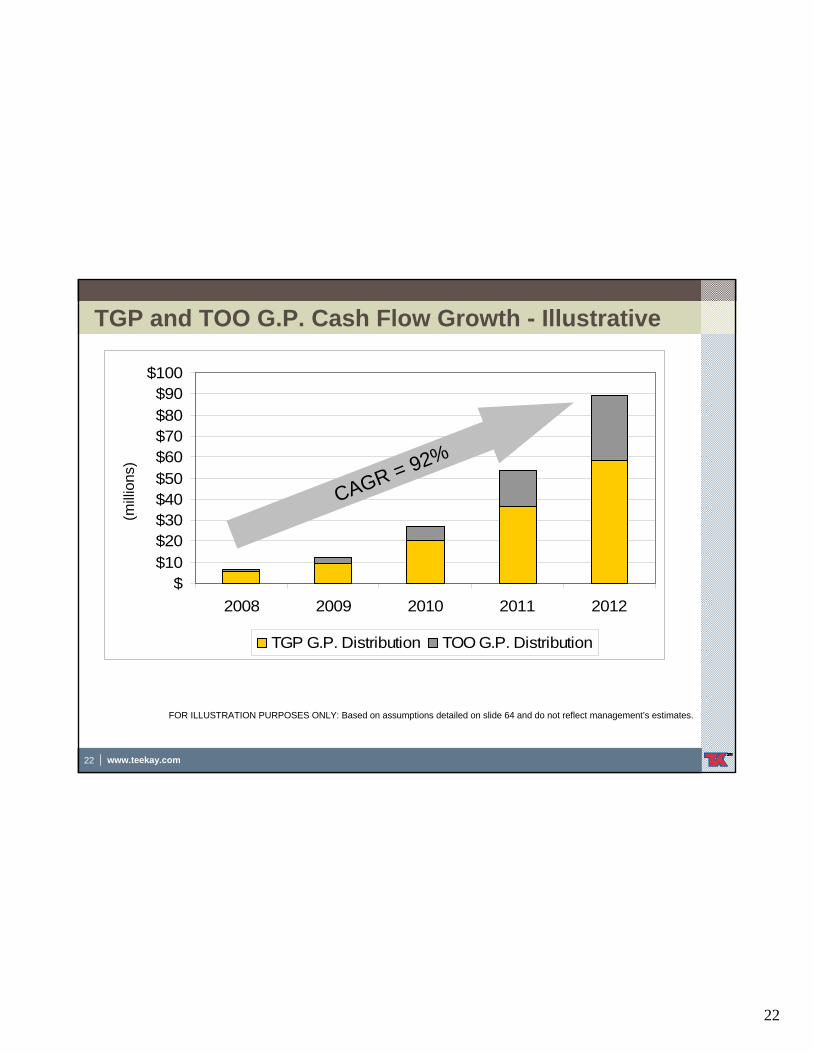
TGP and TOO G.P. Cash Flow Growth - Illustrative
FOR ILLUSTRATION PURPOSES ONLY: Based on assumptions detailed on slide 64 and do not reflect management’s estimates.
(milli
ons)
CAGR = 92%
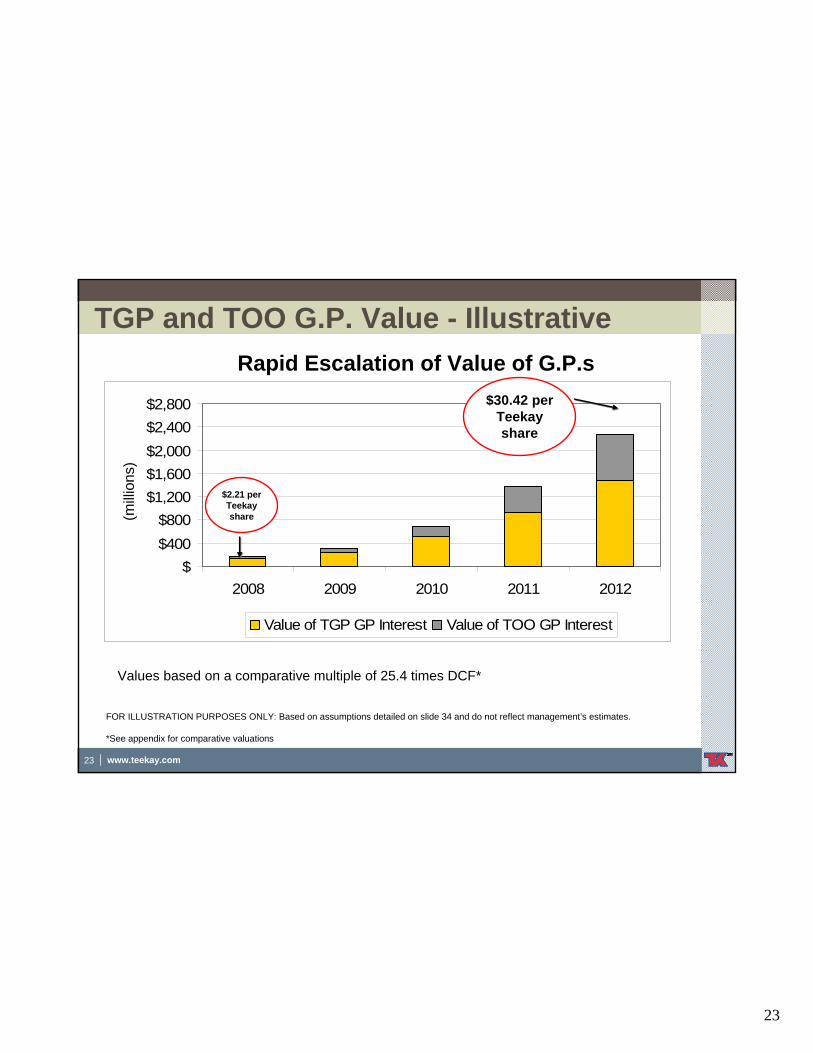
23
23 www.teekay.com
$$400$800
$1,200$1,600$2,000$2,400$2,800
2008 2009 2010 2011 2012
(Mill
ions
)
Value of TGP GP Interest Value of TOO GP Interest
TGP and TOO G.P. Value - IllustrativeRapid Escalation of Value of G.P.s
FOR ILLUSTRATION PURPOSES ONLY: Based on assumptions detailed on slide 34 and do not reflect management’s estimates.
Values based on a comparative multiple of 25.4 times DCF*
$30.42 per Teekay share
$2.21 per Teekay share(m
illion
s)(m
illion
s)
*See appendix for comparative valuations
24
24 www.teekay.com
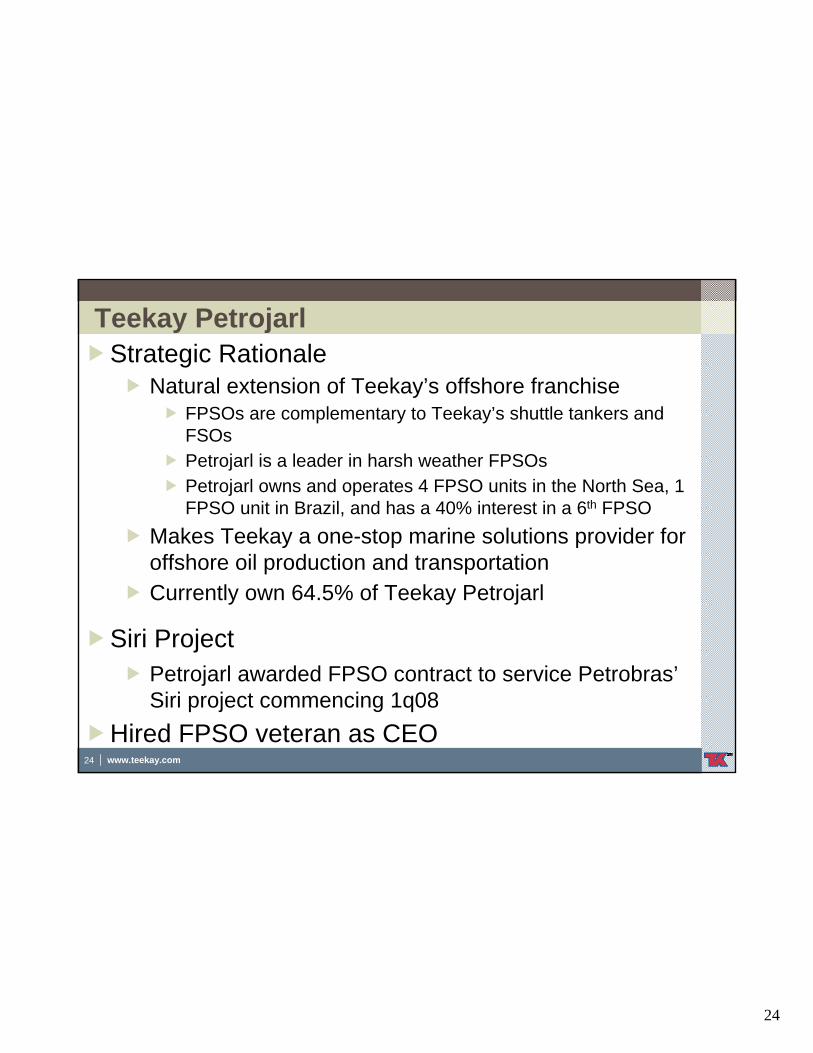
Teekay PetrojarlStrategic Rationale
Natural extension of Teekay’s offshore franchiseFPSOs are complementary to Teekay’s shuttle tankers and FSOsPetrojarl is a leader in harsh weather FPSOsPetrojarl owns and operates 4 FPSO units in the North Sea, 1 FPSO unit in Brazil, and has a 40% interest in a 6th FPSO
Makes Teekay a one-stop marine solutions provider for offshore oil production and transportationCurrently own 64.5% of Teekay Petrojarl
Siri ProjectPetrojarl awarded FPSO contract to service Petrobras’Siri project commencing 1q08
Hired FPSO veteran as CEO
25
25 www.teekay.com
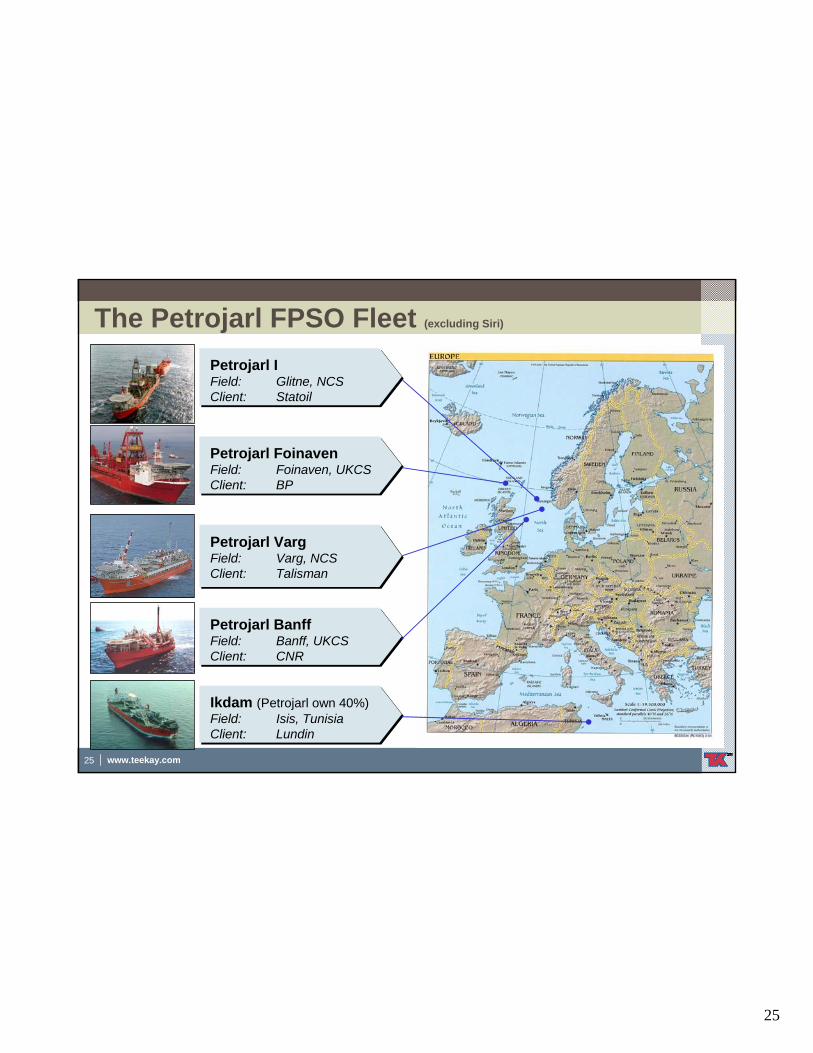
The Petrojarl FPSO Fleet (excluding Siri)
Petrojarl IField: Glitne, NCSClient: Statoil
Petrojarl BanffField: Banff, UKCSClient: CNR
Petrojarl FoinavenField: Foinaven, UKCSClient: BP
Petrojarl VargField: Varg, NCSClient: Talisman
Ikdam (Petrojarl own 40%)Field: Isis, TunisiaClient: Lundin
26
26 www.teekay.com
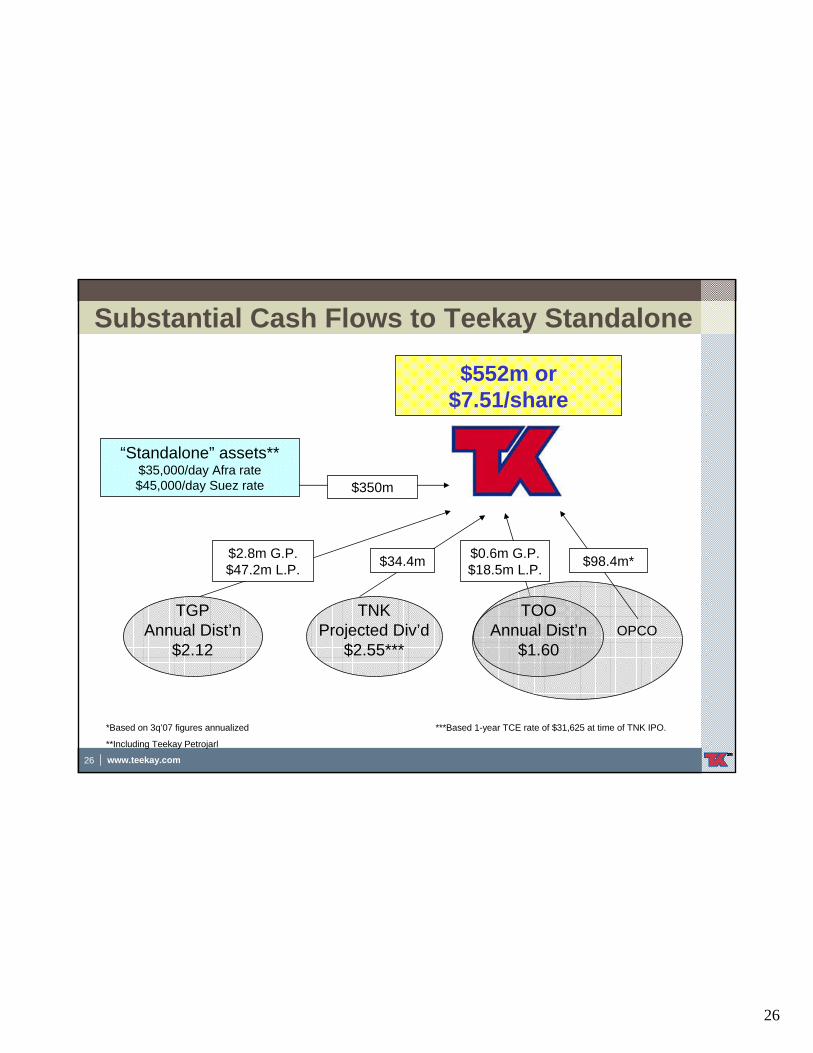
Substantial Cash Flows to Teekay Standalone
TGPAnnual Dist’n
$2.12
TNKProjected Div’d
$2.55***
“Standalone” assets**$35,000/day Afra rate$45,000/day Suez rate
$552m or $7.51/share
$34.4m
OPCO
$2.8m G.P. $47.2m L.P.
$0.6m G.P. $18.5m L.P. $98.4m*
*Based on 3q’07 figures annualized ***Based 1-year TCE rate of $31,625 at time of TNK IPO.
**Including Teekay Petrojarl
$350m
TOOAnnual Dist’n
$1.60
27
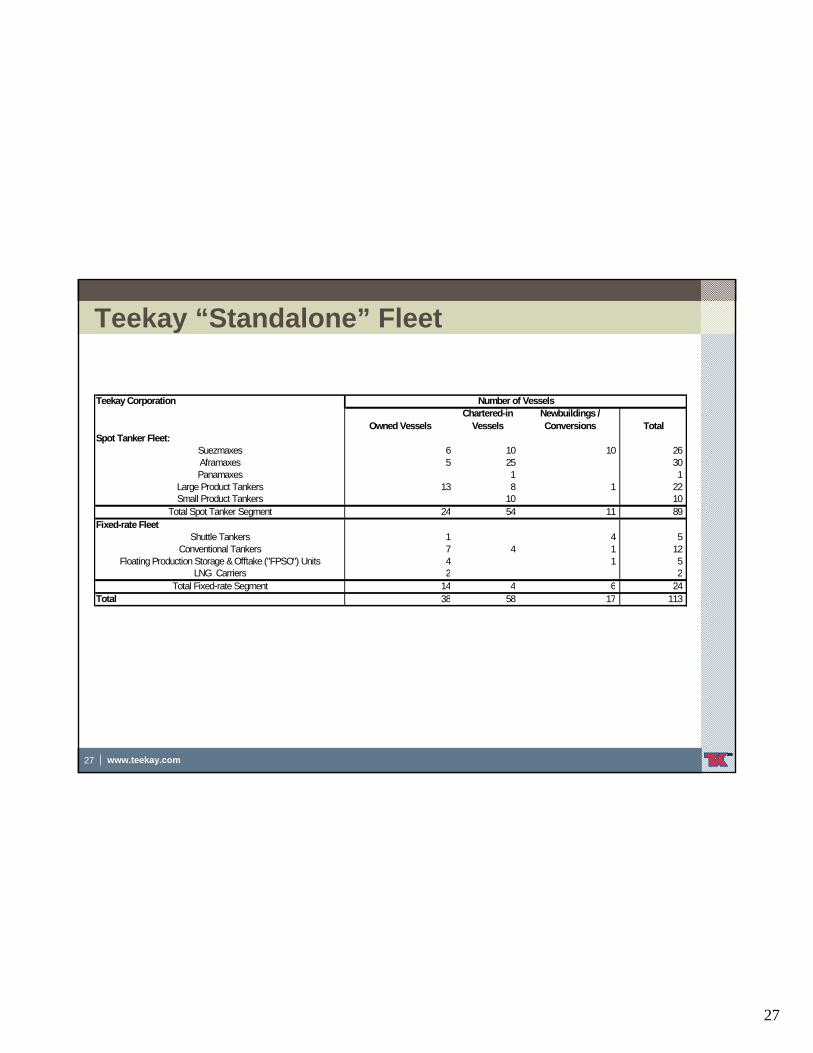
27 www.teekay.com
Teekay “Standalone” Fleet
Teekay Corporation
Owned VesselsChartered-in
VesselsNewbuildings / Conversions Total
Spot Tanker Fleet:Suezmaxes 6 10 10 26 Aframaxes 5 25 30 Panamaxes 1 1
Large Product Tankers 13 8 1 22 Small Product Tankers 10 10
Total Spot Tanker Segment 24 54 11 89 Fixed-rate Fleet
Shuttle Tankers 1 4 5 Conventional Tankers 7 4 1 12
Floating Production Storage & Offtake ("FPSO") Units 4 1 5 LNG Carriers 2 2
Total Fixed-rate Segment 14 4 6 24 Total 38 58 17 113
Number of Vessels
28
www.teekay.com
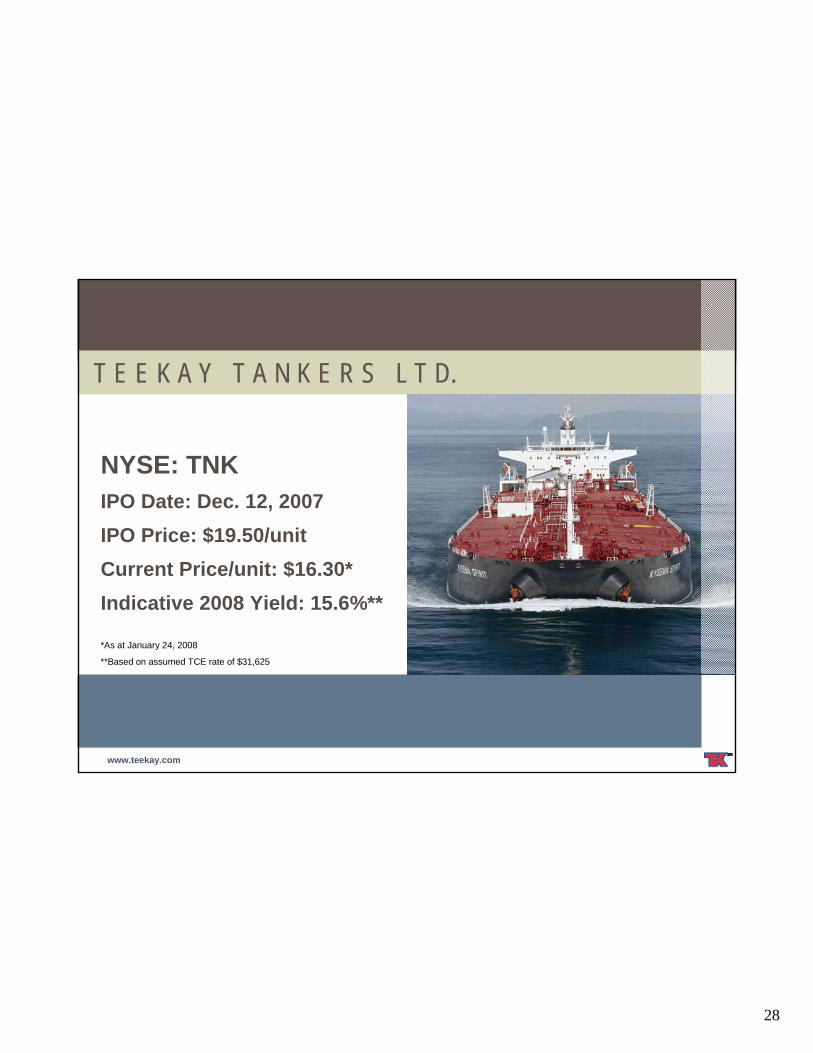
T E E K A Y T A N K E R S L T D.
NYSE: TNKIPO Date: Dec. 12, 2007IPO Price: $19.50/unitCurrent Price/unit: $16.30*Indicative 2008 Yield: 15.6%**
*As at January 24, 2008
**Based on assumed TCE rate of $31,625
29
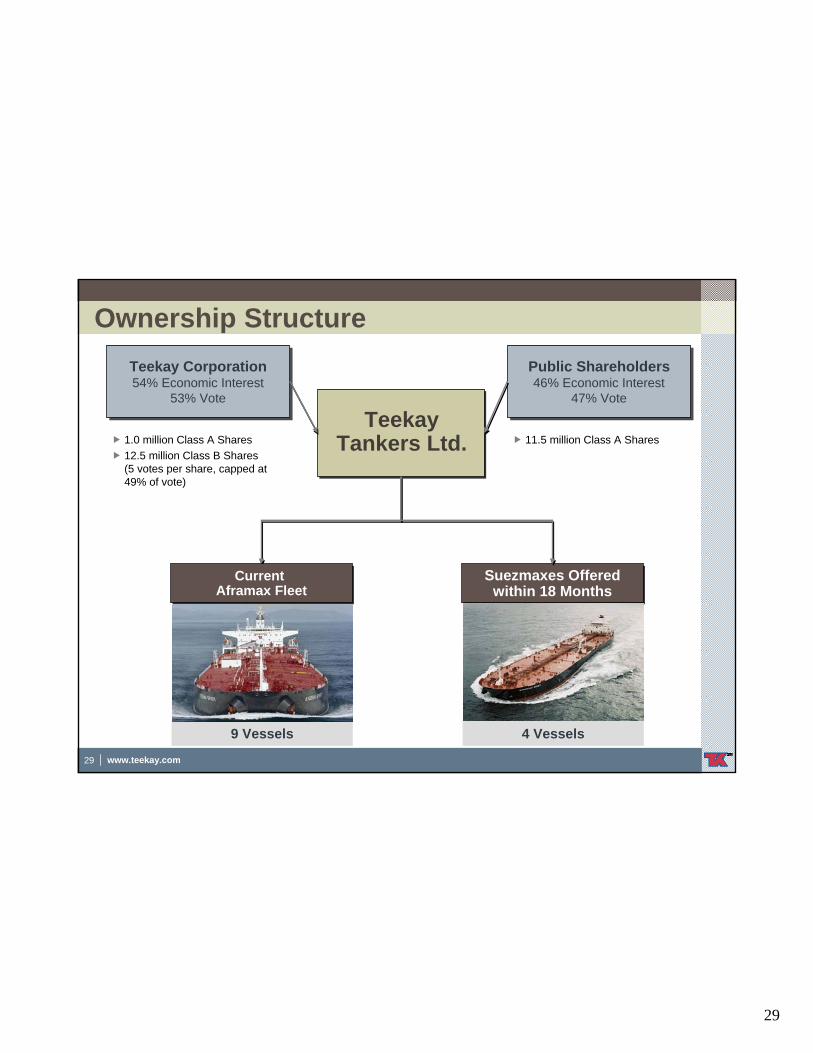
29 www.teekay.com
Suezmaxes Offered within 18 Months
Suezmaxes Offered within 18 Months
Teekay Tankers Ltd.
Ownership Structure
4 Vessels
Current Aframax Fleet
Current Aframax Fleet
Teekay Corporation54% Economic Interest
53% Vote
Teekay Corporation54% Economic Interest
53% Vote
Public Shareholders46% Economic Interest
47% Vote
Public Shareholders46% Economic Interest
47% Vote
1.0 million Class A Shares12.5 million Class B Shares(5 votes per share, capped at 49% of vote)
11.5 million Class A Shares
9 Vessels
30
30 www.teekay.com
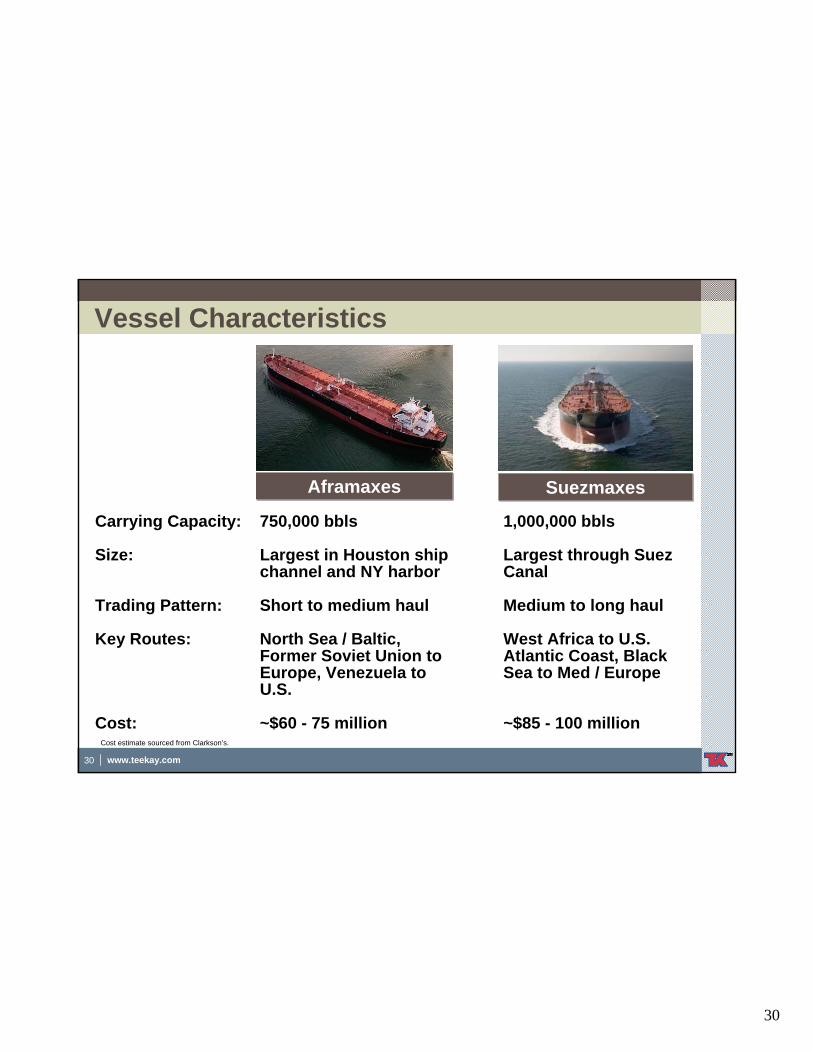
Vessel Characteristics
SuezmaxesSuezmaxesAframaxesAframaxes
Carrying Capacity: 750,000 bbls 1,000,000 bbls
Size: Largest in Houston ship Largest through Suezchannel and NY harbor Canal
Trading Pattern: Short to medium haul Medium to long haul
Key Routes: North Sea / Baltic, West Africa to U.S. Former Soviet Union to Atlantic Coast, Black Europe, Venezuela to Sea to Med / Europe U.S.
Cost: ~$60 - 75 million ~$85 - 100 millionCost estimate sourced from Clarkson’s.
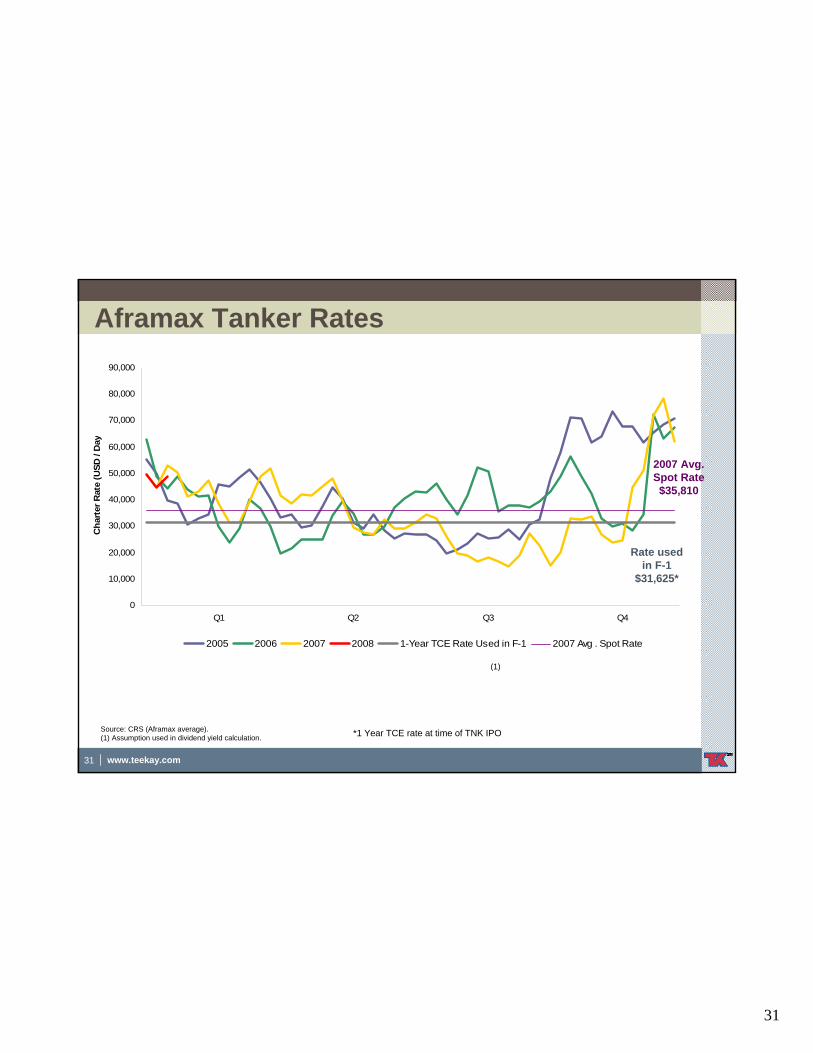
31
31 www.teekay.com
0
10,000
20,000
30,000
40,000
50,000
60,000
70,000
80,000
90,000
Q1 Q2 Q3 Q4
Cha
rter
Rat
e (U
SD /
Day
2005 2006 2007 2008 1-Year TCE Rate Used in F-1 2007 Avg . Spot Rate
Aframax Tanker Rates
Source: CRS (Aframax average).(1) Assumption used in dividend yield calculation.
(1)
Rate used in F-1
$31,625*
2007 Avg. Spot Rate $35,810
*1 Year TCE rate at time of TNK IPO
32
32 www.teekay.com
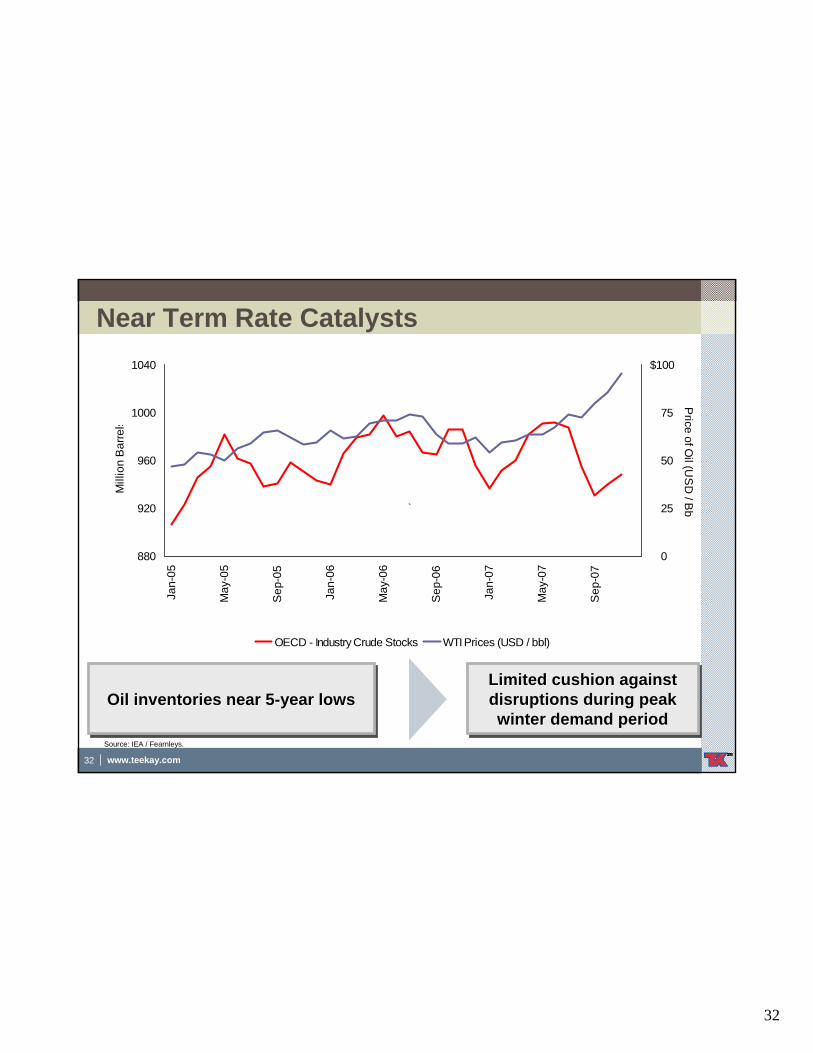
Near Term Rate Catalysts
880
920
960
1000
1040
Jan-
05
May
-05
Sep
-05
Jan-
06
May
-06
Sep
-06
Jan-
07
May
-07
Sep
-07
Mill
ion
Bar
rel s
0
25
50
75
$100
Price of O
il (US
D / B
b
OECD - Industry Crude Stocks WTI Prices (USD / bbl)
`
Source: IEA / Fearnleys.
Oil inventories near 5-year lowsOil inventories near 5Oil inventories near 5--year lowsyear lowsLimited cushion against disruptions during peak winter demand period
Limited cushion against Limited cushion against disruptions during peak disruptions during peak winter demand periodwinter demand period
33
33 www.teekay.com
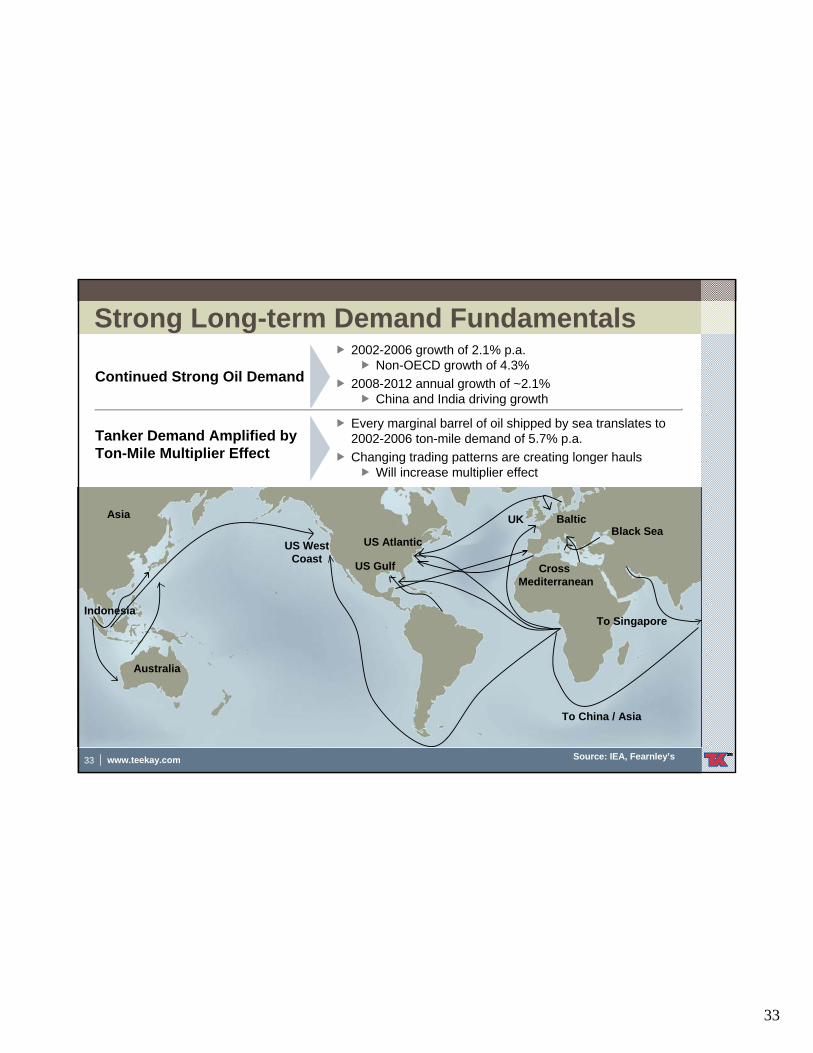
Strong Long-term Demand Fundamentals
Continued Strong Oil Demand
2002-2006 growth of 2.1% p.a.Non-OECD growth of 4.3%
2008-2012 annual growth of ~2.1%China and India driving growth
Every marginal barrel of oil shipped by sea translates to 2002-2006 ton-mile demand of 5.7% p.a.Changing trading patterns are creating longer hauls
Will increase multiplier effect
Tanker Demand Amplified by Ton-Mile Multiplier Effect
US Gulf Cross Mediterranean
BalticUKBlack Sea
Australia
US AtlanticUS West Coast
To SingaporeIndonesia
Asia
To China / Asia
Source: IEA, Fearnley’s
34
34 www.teekay.com
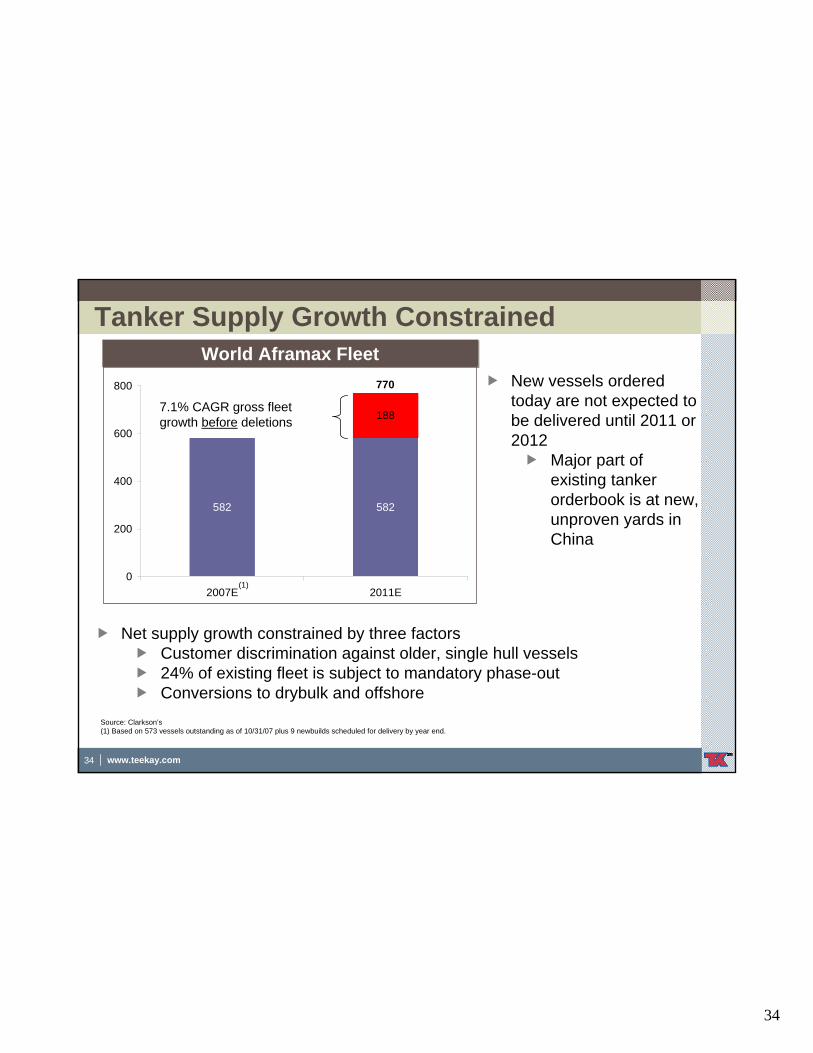
582 582
188
0
200
400
600
800
2007E 2011E
770
Tanker Supply Growth Constrained
Net supply growth constrained by three factorsCustomer discrimination against older, single hull vessels24% of existing fleet is subject to mandatory phase-outConversions to drybulk and offshore
7.1% CAGR gross fleet growth before deletions
World Aframax FleetWorld Aframax Fleet
(1)
Source: Clarkson’s(1) Based on 573 vessels outstanding as of 10/31/07 plus 9 newbuilds scheduled for delivery by year end.
New vessels ordered today are not expected to be delivered until 2011 or 2012
Major part of existing tanker orderbook is at new, unproven yards in China
35
35 www.teekay.com
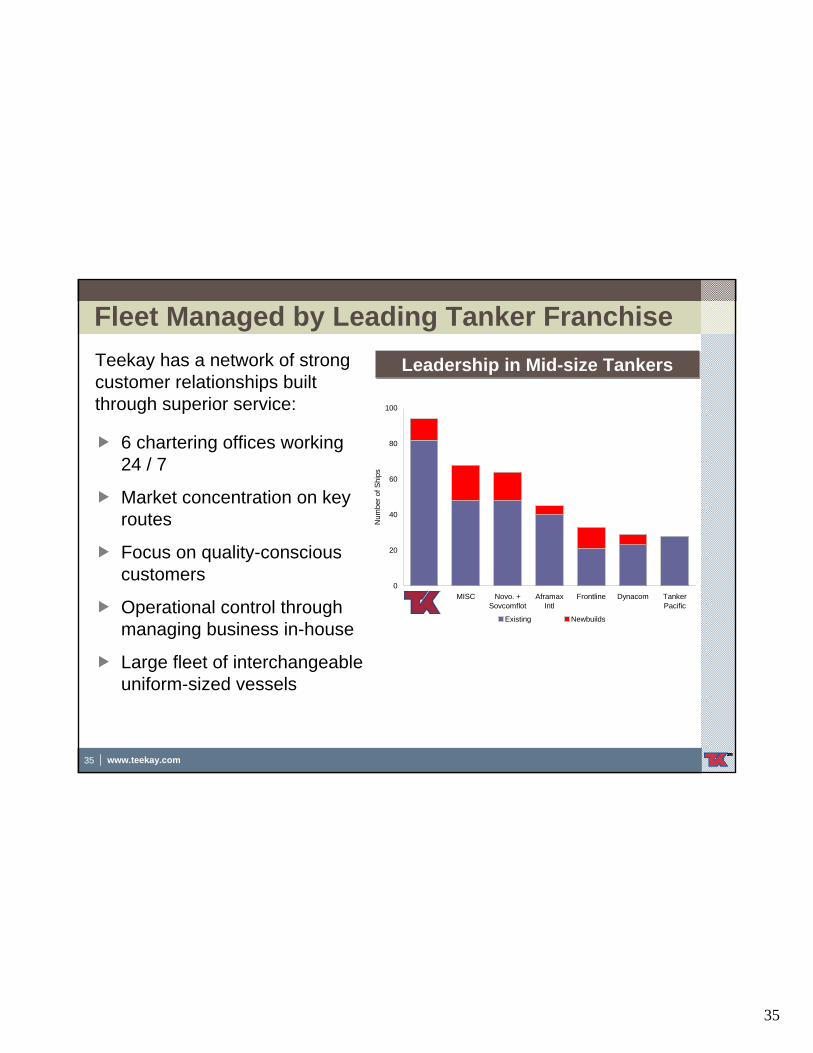
Fleet Managed by Leading Tanker Franchise
6 chartering offices working 24 / 7
Market concentration on key routes
Focus on quality-conscious customers
Operational control through managing business in-house
Large fleet of interchangeable uniform-sized vessels
0
20
40
60
80
100
Teekay MISC Novo. +Sovcomflot
AframaxIntl
Frontline Dynacom TankerPacific
Num
ber o
f Shi
ps
Existing Newbuilds
Leadership in Mid-size TankersLeadership in Mid-size TankersTeekay has a network of strongcustomer relationships built through superior service:
36
36 www.teekay.com
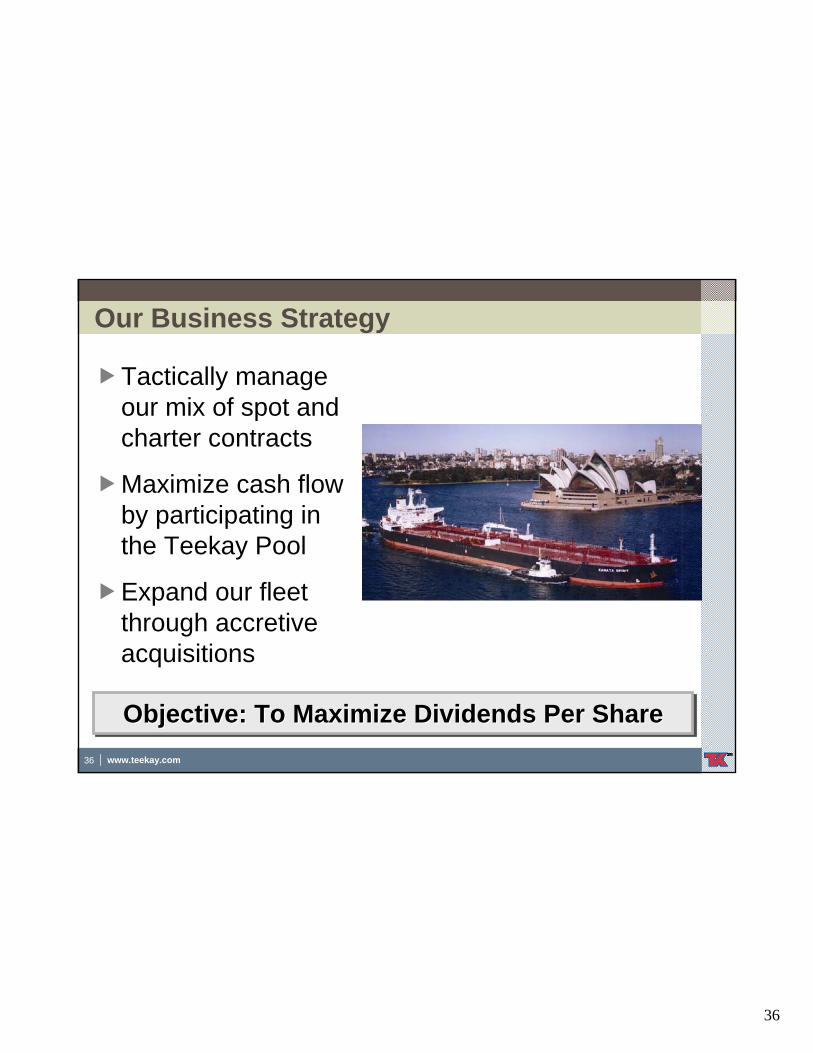
Our Business Strategy
Tactically manage our mix of spot and charter contracts
Maximize cash flow by participating in the Teekay Pool
Expand our fleet through accretive acquisitions
Objective: To Maximize Dividends Per ShareObjective: To Maximize Dividends Per ShareObjective: To Maximize Dividends Per Share
37
37 www.teekay.com
0
10,000
20,000
30,000
40,000
50,000
60,000
70,000
80,000
$90,000
Q1-
02
Q3-
02
Q1-
03
Q3-
03
Q1-
04
Q3-
04
Q1-
05
Q3-
05
Q1-
06
Q3-
06
Q1-
07
Q3-
07
Cha
rter R
ate
(US
D /
day
Aframax Spot TCEs One-Year TC Rates
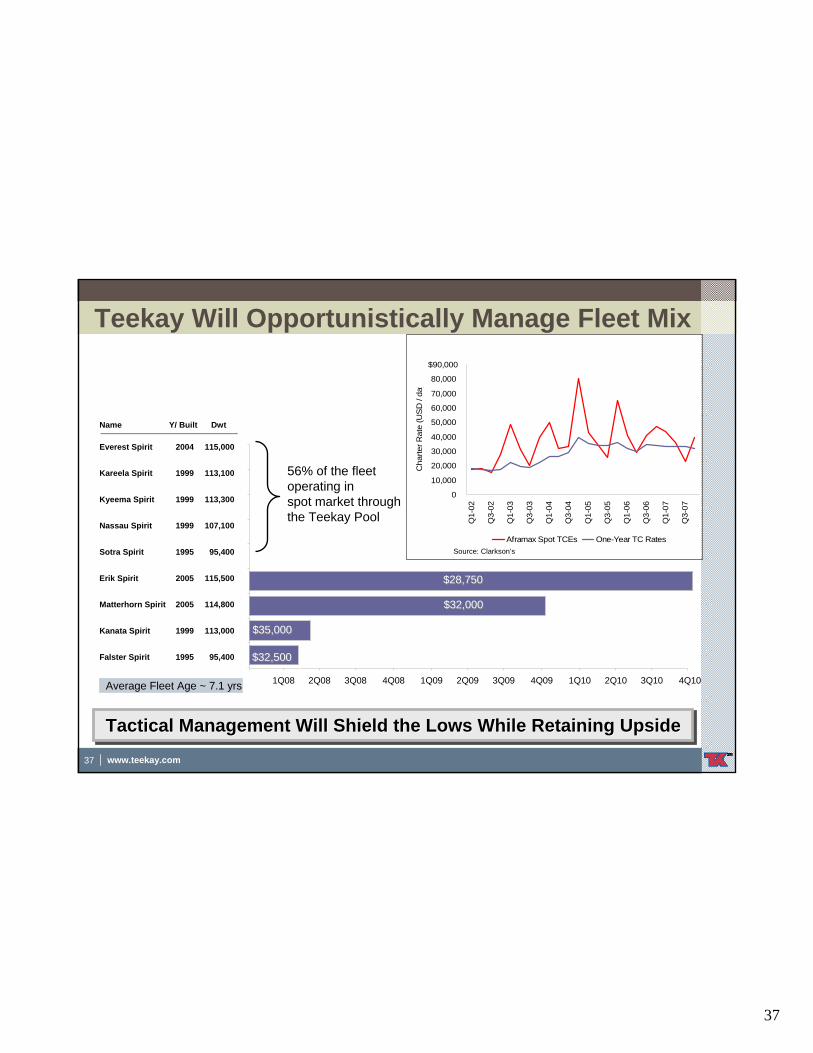
Teekay Will Opportunistically Manage Fleet Mix
$28,750$28,750
$32,000$32,000
$35,000$35,000
$32,500$32,500
56% of the fleet operating in spot market through the Teekay Pool
1Q08 2Q08 3Q08 4Q08 1Q09 2Q09 3Q09 4Q09 1Q10 2Q10 3Q10 4Q10
Falster Spirit 1995
Kanata Spirit 1999
Matterhorn Spirit 2005
Erik Spirit 2005
Sotra Spirit 1995
Nassau Spirit 1999
Kyeema Spirit 1999
Kareela Spirit 1999
Everest Spirit 2004
95,400
113,000
114,800
115,500
95,400
107,100
113,300
113,100
115,000
Name Y/ Built Dwt
Average Fleet Age ~ 7.1 yrs
Tactical Management Will Shield the Lows While Retaining UpsideTactical Management Will Shield the Lows While Retaining UpsideTactical Management Will Shield the Lows While Retaining Upside
Source: Clarkson’s
38
38 www.teekay.com
$0.00
$0.75
$1.50
$2.25
$3.00
$3.75
$4.50
$0 $5,000 $10,000 $15,000 $20,000 $25,000 $30,000 $35,000 $40,000 $45,000
Spot Rate ($ per day)
Div
iden
d Pe
r Sha
re
All Spot Spot + Fixed
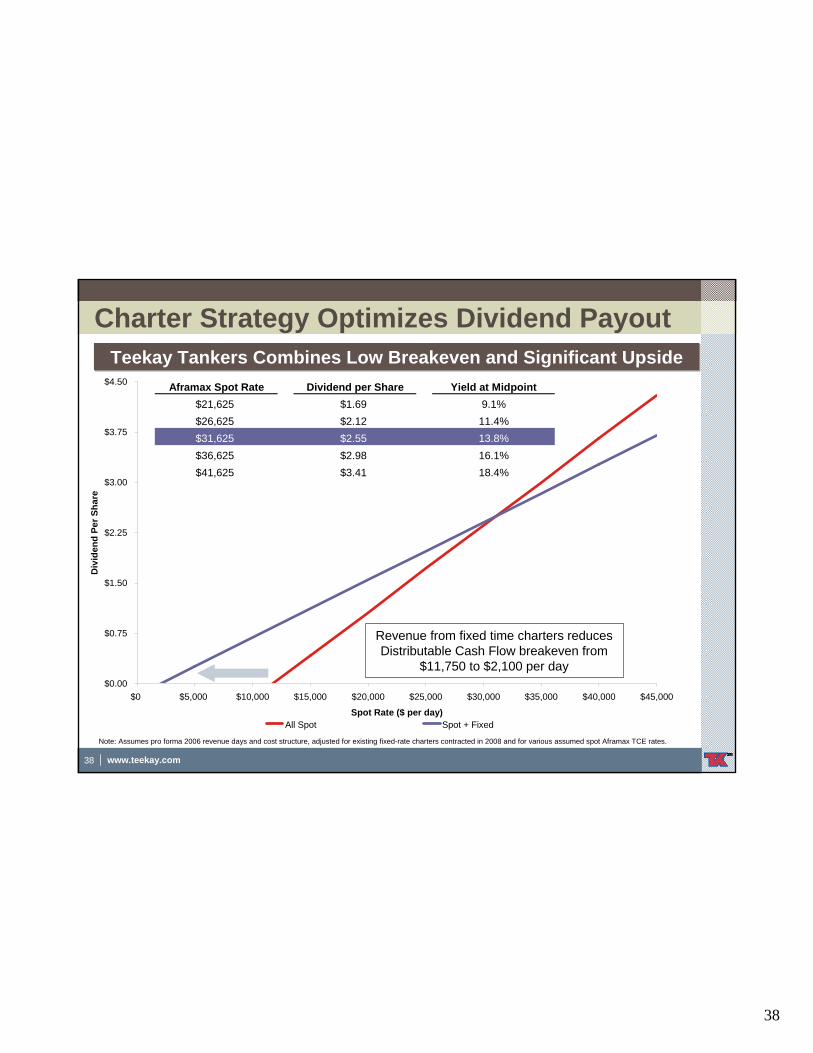
Charter Strategy Optimizes Dividend Payout
Revenue from fixed time charters reduces Distributable Cash Flow breakeven from
$11,750 to $2,100 per day
Aframax Spot Rate Dividend per Share Yield at Midpoint$21,625 $1.69 9.1%$26,625 $2.12 11.4%$31,625 $2.55 13.8%$36,625 $2.98 16.1%$41,625 $3.41 18.4%
Teekay Tankers Combines Low Breakeven and Significant UpsideTeekay Tankers Combines Low Breakeven and Significant Upside
Note: Assumes pro forma 2006 revenue days and cost structure, adjusted for existing fixed-rate charters contracted in 2008 and for various assumed spot Aframax TCE rates.
39
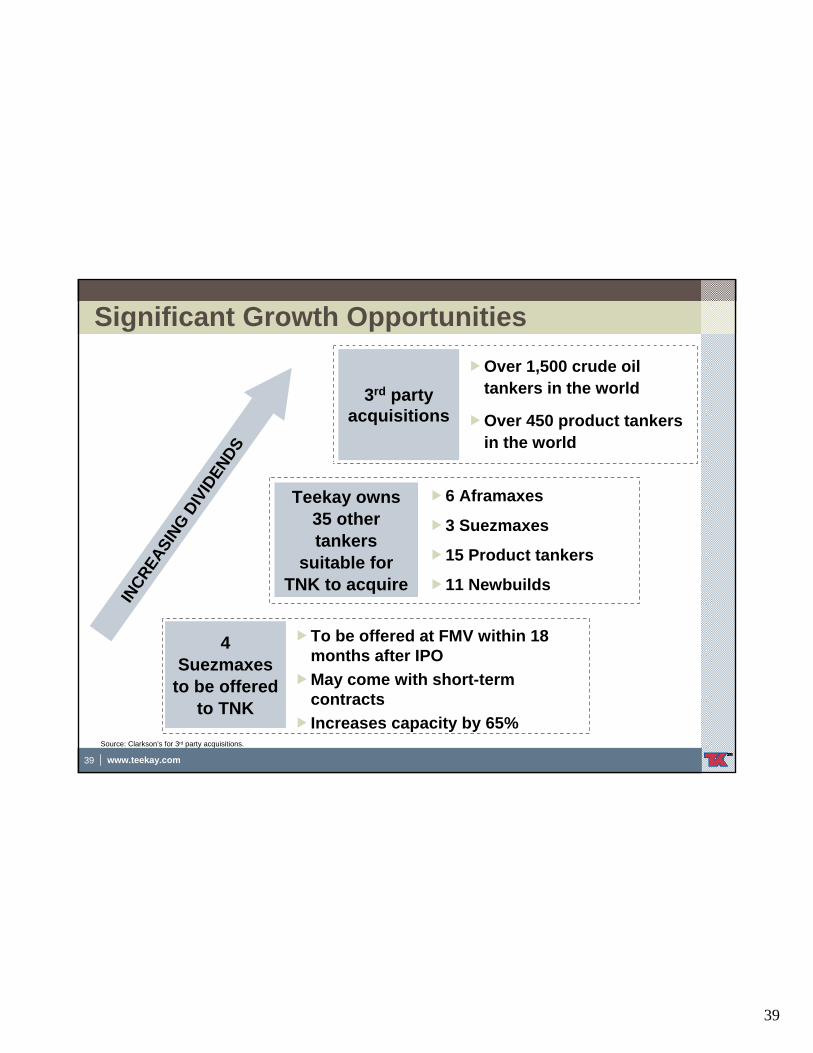
39 www.teekay.com
Significant Growth Opportunities
3rd party acquisitions
Over 1,500 crude oil tankers in the world
Over 450 product tankers in the world
Teekay owns 35 other tankers
suitable for TNK to acquire
6 Aframaxes
3 Suezmaxes
15 Product tankers
11 Newbuilds
To be offered at FMV within 18 months after IPOMay come with short-term contractsIncreases capacity by 65%
INCREA
SING D
IVID
ENDS
4 Suezmaxes
to be offered to TNK
Source: Clarkson’s for 3rd party acquisitions.
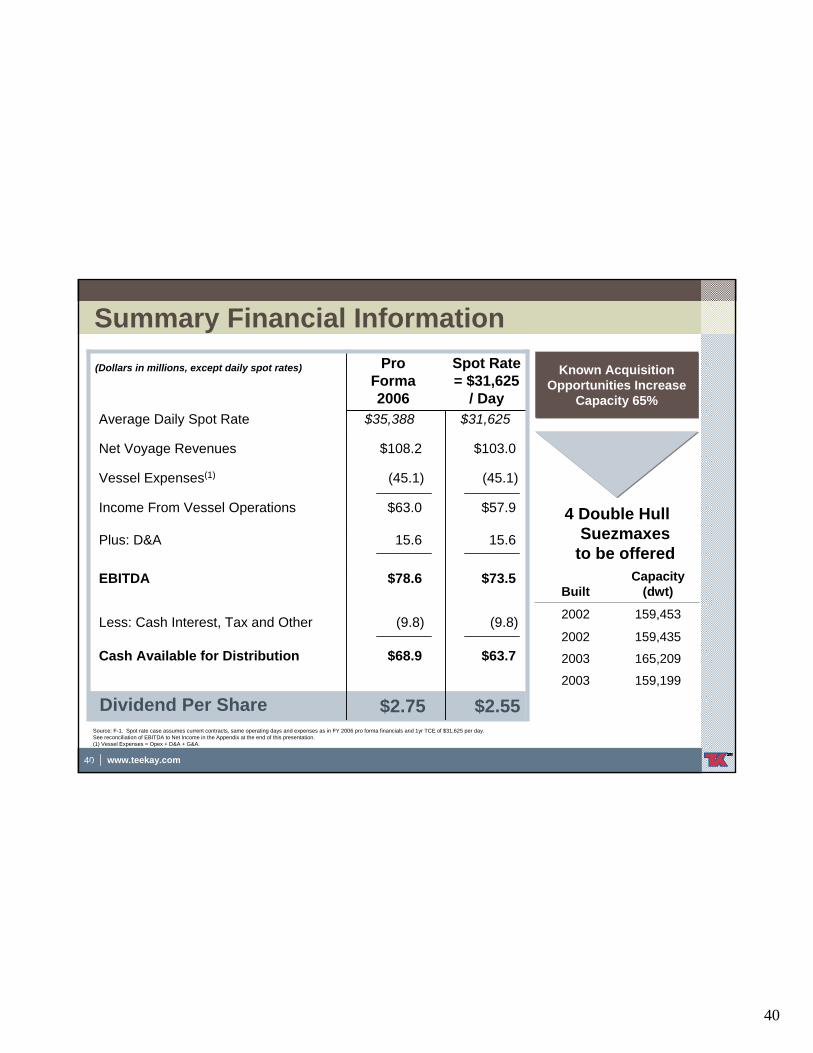
40
40 www.teekay.com
$31,625$35,388Average Daily Spot Rate
$73.5$78.6EBITDA
(9.8)(9.8)Less: Cash Interest, Tax and Other
$2.55$2.75Dividend Per Share
15.615.6Plus: D&A
$63.7$68.9Cash Available for Distribution
$57.9$63.0Income From Vessel Operations
$103.0$108.2Net Voyage Revenues
(45.1)(45.1)Vessel Expenses(1)
Summary Financial Information
4 Double Hull Suezmaxes
to be offered
(Dollars in millions, except daily spot rates) Known Acquisition Opportunities Increase
Capacity 65%
Known Acquisition Opportunities Increase
Capacity 65%
Source: F-1. Spot rate case assumes current contracts, same operating days and expenses as in FY 2006 pro forma financials and 1yr TCE of $31,625 per day.See reconciliation of EBITDA to Net Income in the Appendix at the end of this presentation.(1) Vessel Expenses = Opex + D&A + G&A.
17
Pro Forma 2006
Spot Rate = $31,625
/ Day
2003
2003
2002
2002
Built
159,199
165,209
159,435
159,453
Capacity (dwt)
41
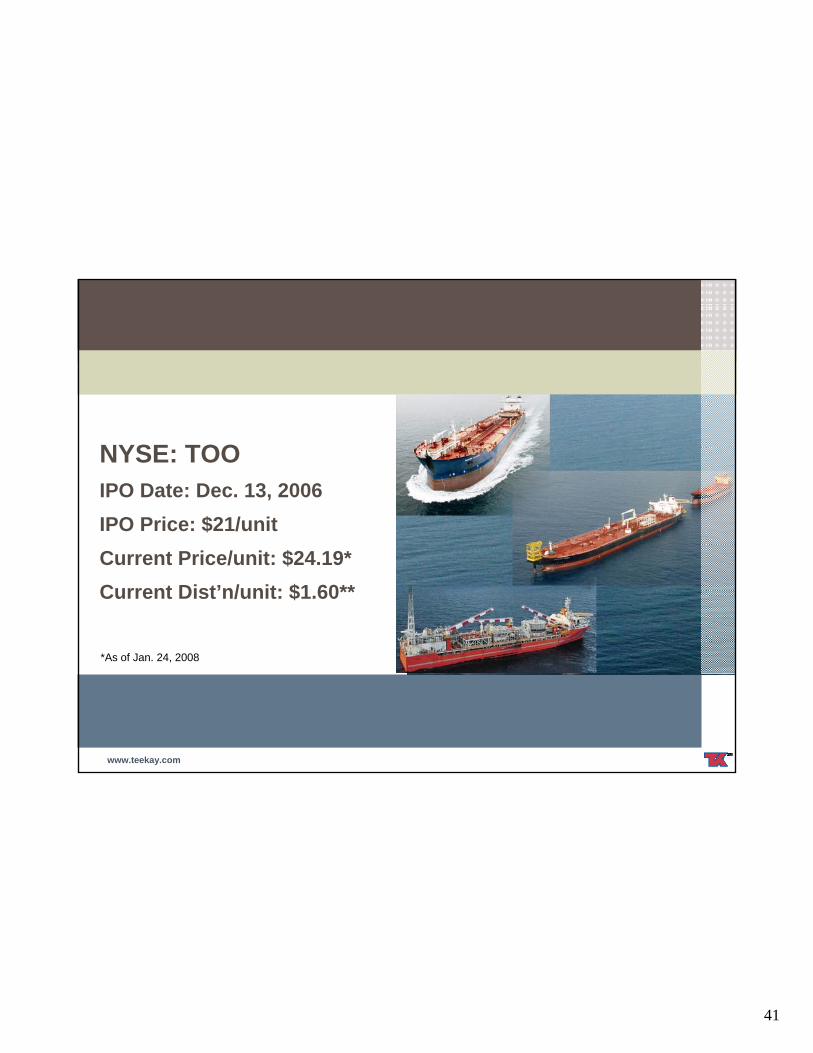
www.teekay.com
NYSE: TOOIPO Date: Dec. 13, 2006IPO Price: $21/unitCurrent Price/unit: $24.19*Current Dist’n/unit: $1.60**
*As of Jan. 24, 2008
42
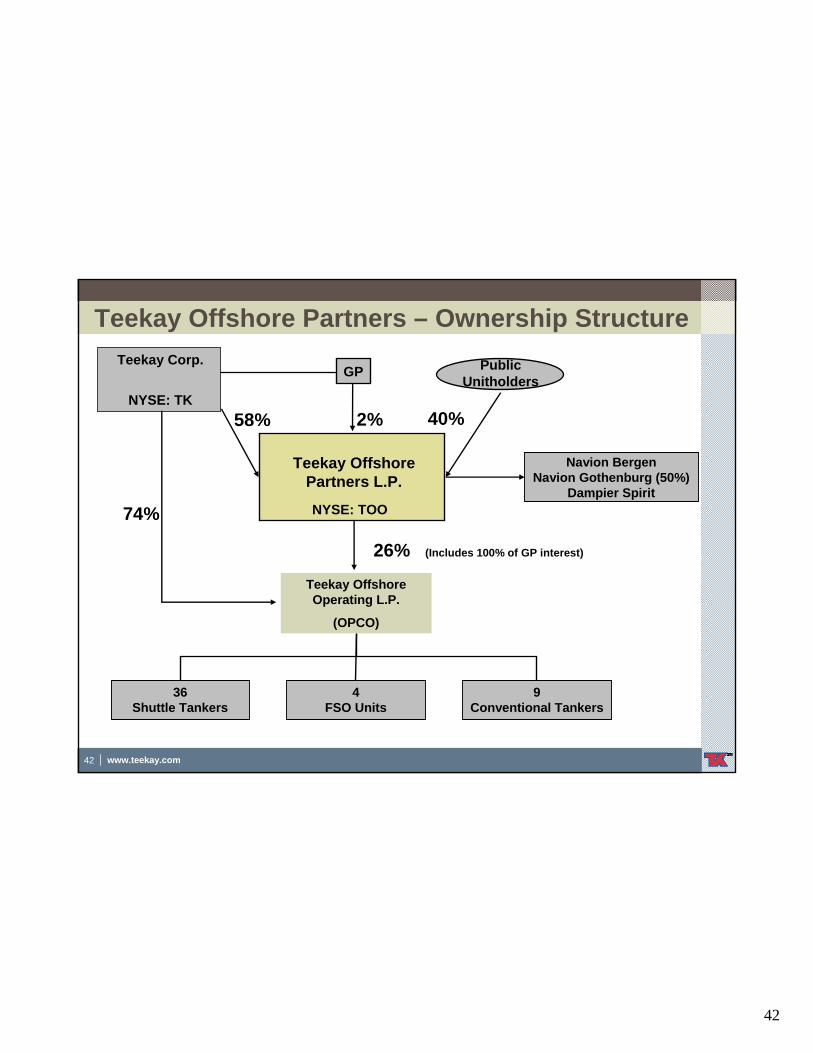
42 www.teekay.com
NYSE: TK
Teekay Offshore Partners – Ownership StructurePublic
Unitholders
2% 40%
26% (Includes 100% of GP interest)
74%
36 Shuttle Tankers
4FSO Units
9Conventional Tankers
GP
Teekay Offshore Partners L.P.
Teekay Corp.
NYSE: TOO
Teekay Offshore Operating L.P.
(OPCO)
58%
Navion BergenNavion Gothenburg (50%)
Dampier Spirit
43
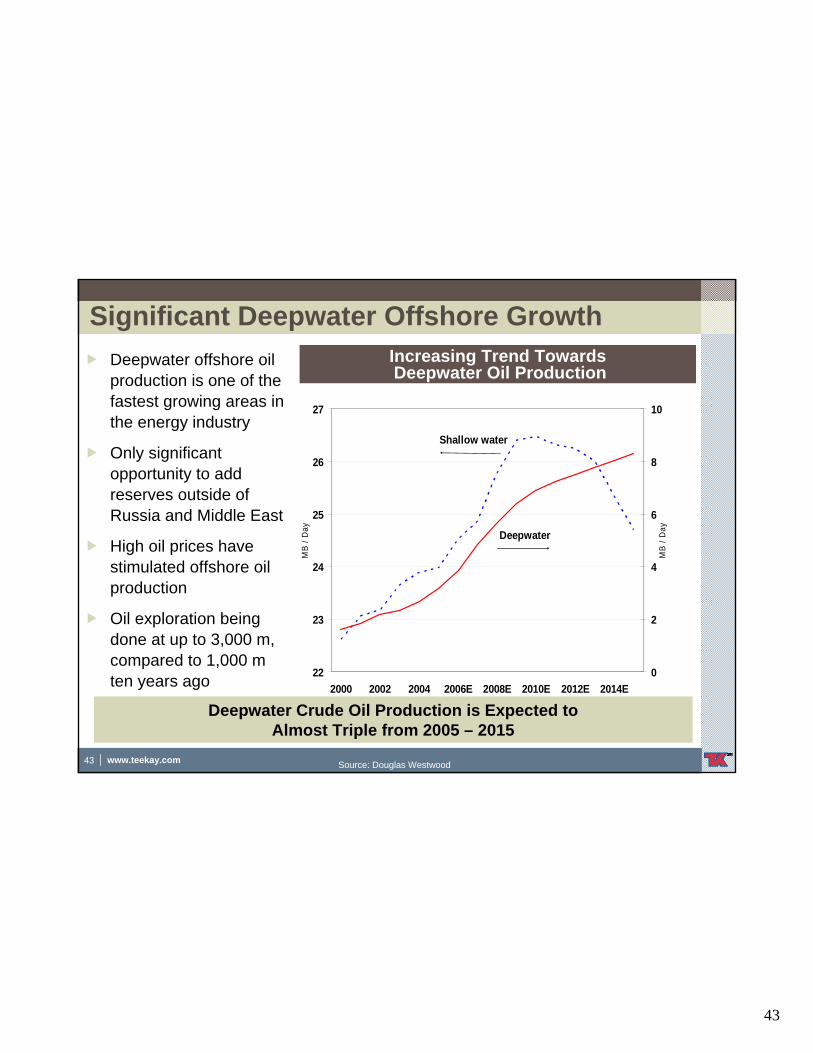
43 www.teekay.com
22
23
24
25
26
27
2000 2002 2004 2006E 2008E 2010E 2012E 2014E
MB
/ Day
0
2
4
6
8
10
MB
/ Day
Shallow water
Deepwater
Increasing Trend TowardsDeepwater Oil Production
Significant Deepwater Offshore GrowthDeepwater offshore oil production is one of the fastest growing areas in the energy industry
Only significant opportunity to add reserves outside of Russia and Middle East
High oil prices have stimulated offshore oil production
Oil exploration being done at up to 3,000 m, compared to 1,000 m ten years ago
Deepwater Crude Oil Production is Expected to Almost Triple from 2005 – 2015
Source: Douglas Westwood.
Source: Douglas Westwood
44
44 www.teekay.com
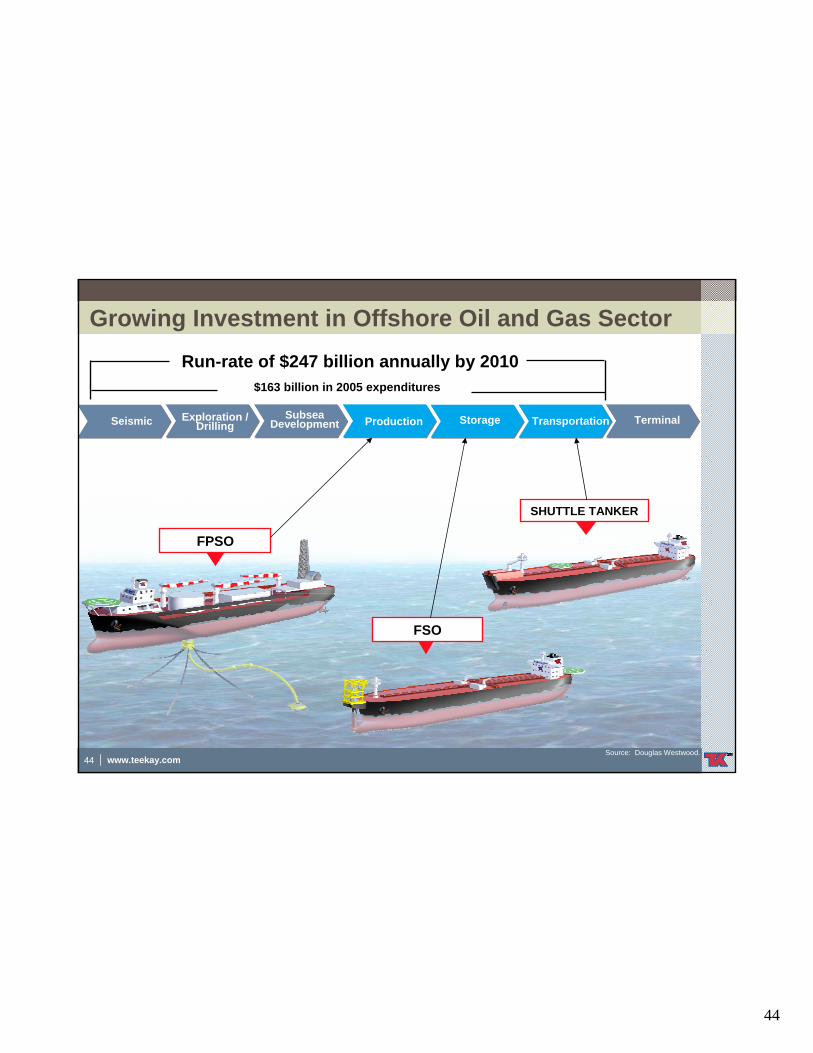
Growing Investment in Offshore Oil and Gas Sector
FPSO
FSO
SHUTTLE TANKER
$163 billion in 2005 expenditures
Run-rate of $247 billion annually by 2010
TerminalExploration / DrillingSeismic Subsea
Development TransportationStorageProduction
Source: Douglas Westwood.
45
45 www.teekay.com
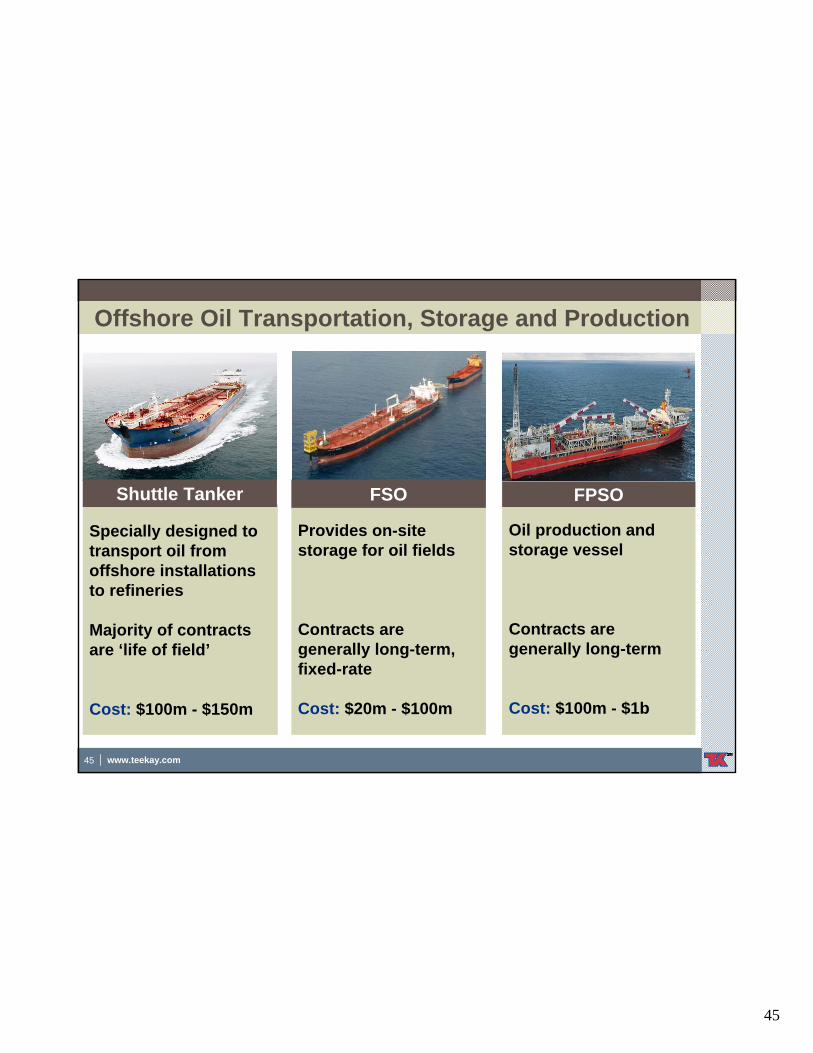
Offshore Oil Transportation, Storage and Production
Oil production and storage vessel
Contracts are generally long-term
Cost: $100m - $1b
FPSO
Provides on-site storage for oil fields
Contracts are generally long-term, fixed-rate
Cost: $20m - $100m
FSO
Specially designed to transport oil from offshore installations to refineries
Majority of contracts are ‘life of field’
Cost: $100m - $150m
Shuttle Tanker
46
46 www.teekay.com
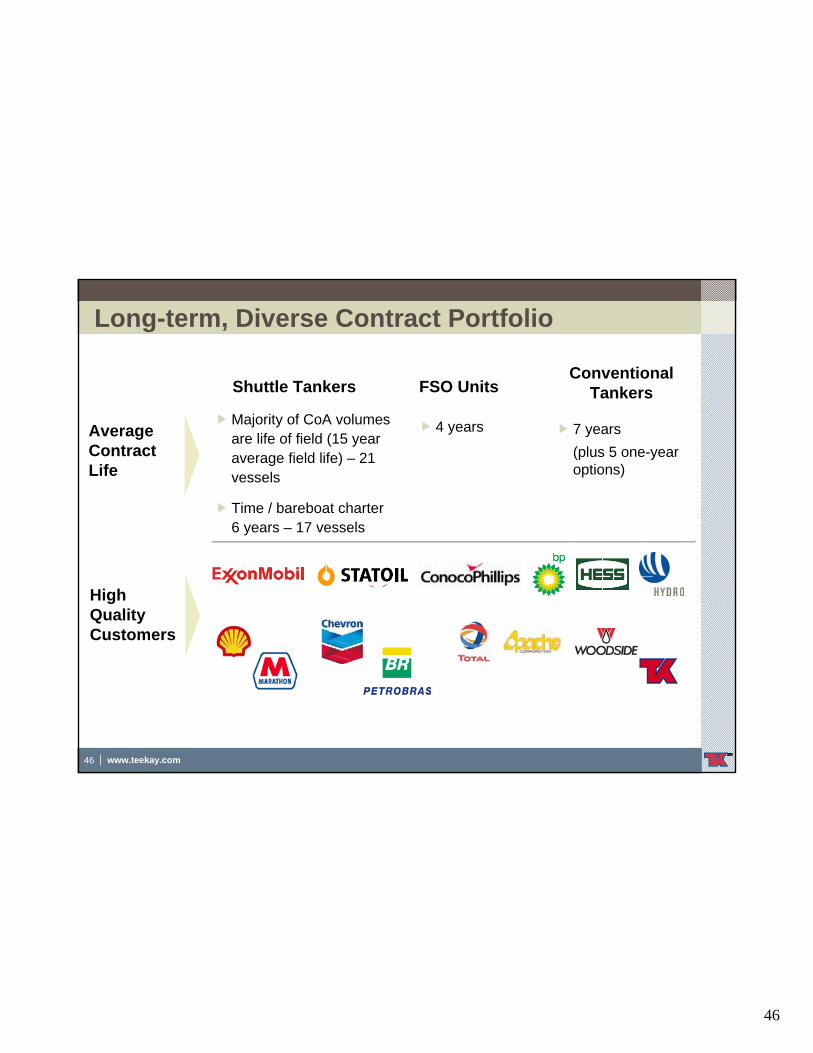
Long-term, Diverse Contract Portfolio
Majority of CoA volumes are life of field (15 year average field life) – 21 vessels
Time / bareboat charter 6 years – 17 vessels
4 years 7 years (plus 5 one-year options)
AverageContractLife
HighQualityCustomers
Shuttle Tankers FSO UnitsConventional
Tankers
47
www.teekay.com
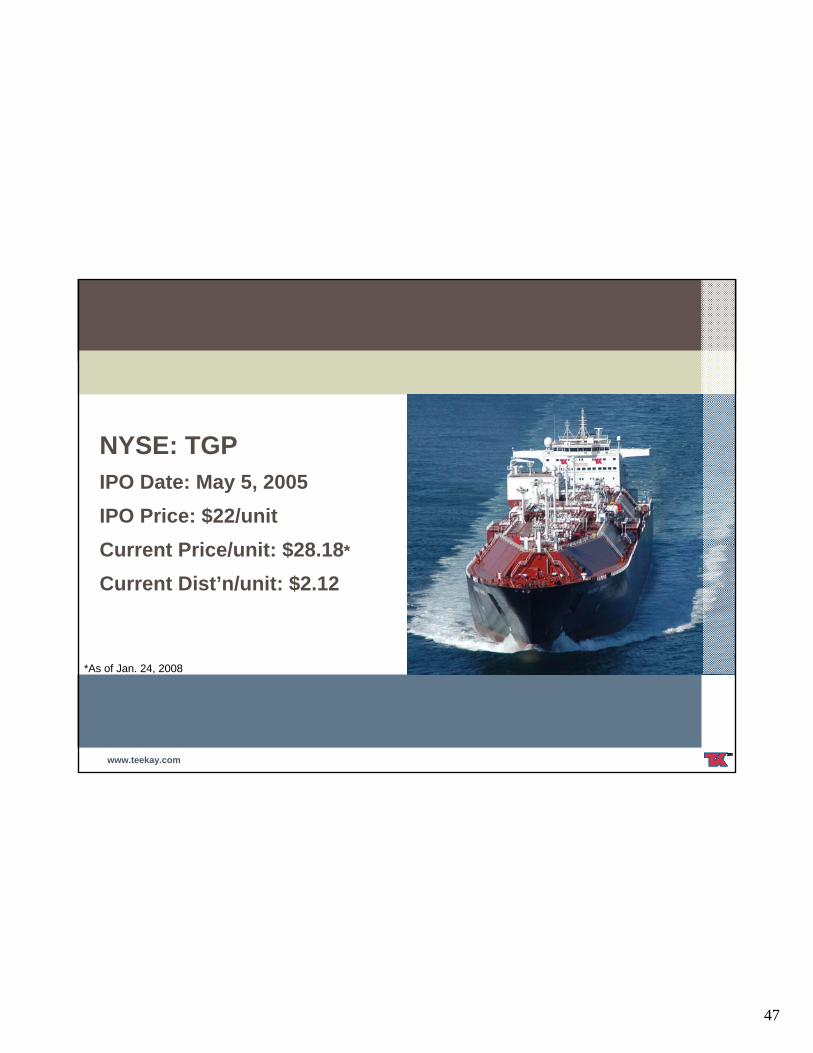
*As of Jan. 24, 2008
NYSE: TGPIPO Date: May 5, 2005IPO Price: $22/unitCurrent Price/unit: $28.18*
Current Dist’n/unit: $2.12
48
48 www.teekay.com
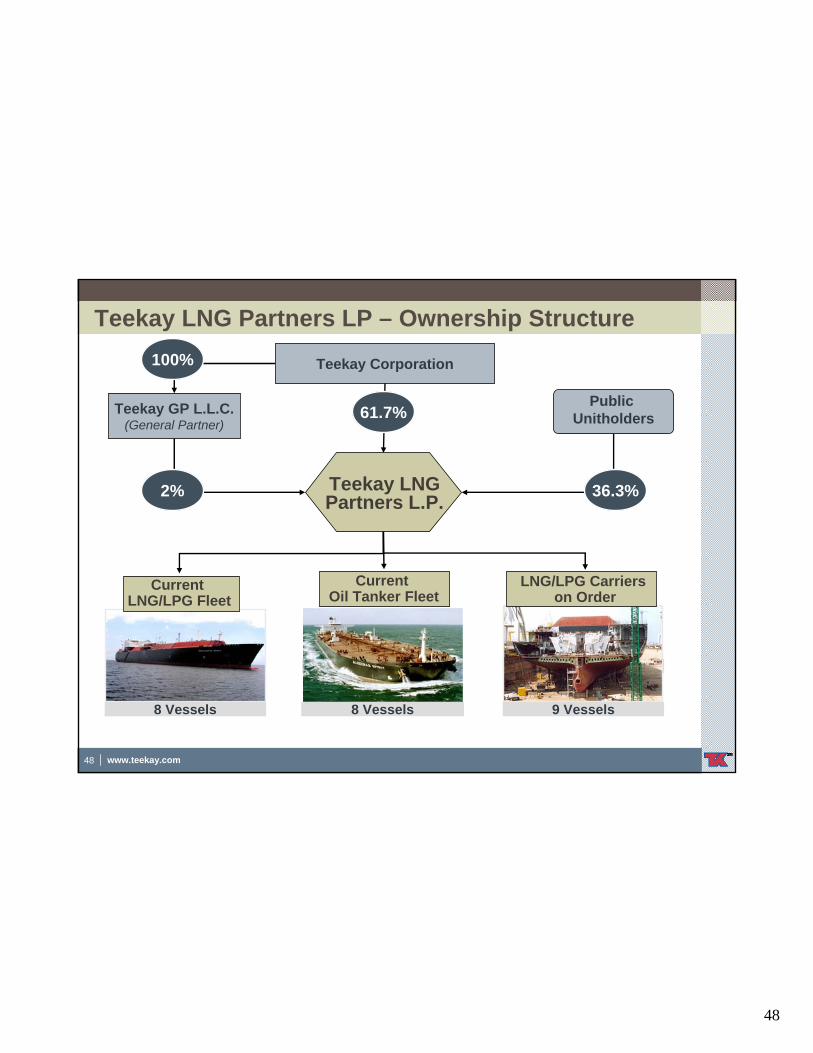
Teekay LNG Partners LP – Ownership Structure
Teekay Corporation
Teekay GP L.L.C.(General Partner)
Public Unitholders61.7%
36.3%
100%
2% Teekay LNG Partners L.P.
9 Vessels 8 Vessels
8 Vessels
Current LNG/LPG Fleet
8 Vessels
Current Oil Tanker Fleet
9 Vessels
LNG/LPG Carriers on Order
49
49 www.teekay.com
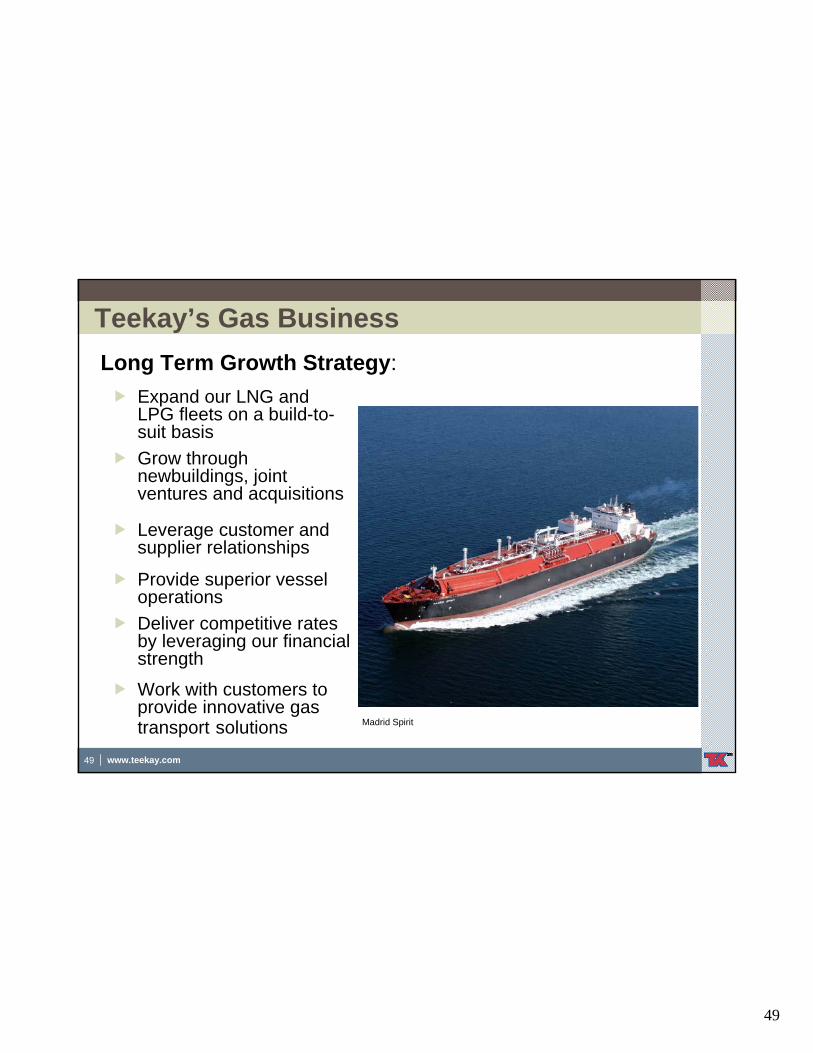
Teekay’s Gas BusinessLong Term Growth Strategy:
Expand our LNG and LPG fleets on a build-to-suit basisGrow through newbuildings, joint ventures and acquisitions
Leverage customer and supplier relationships
Provide superior vessel operationsDeliver competitive rates by leveraging our financial strength
Work with customers to provide innovative gas transport solutions Madrid Spirit
50
50 www.teekay.com
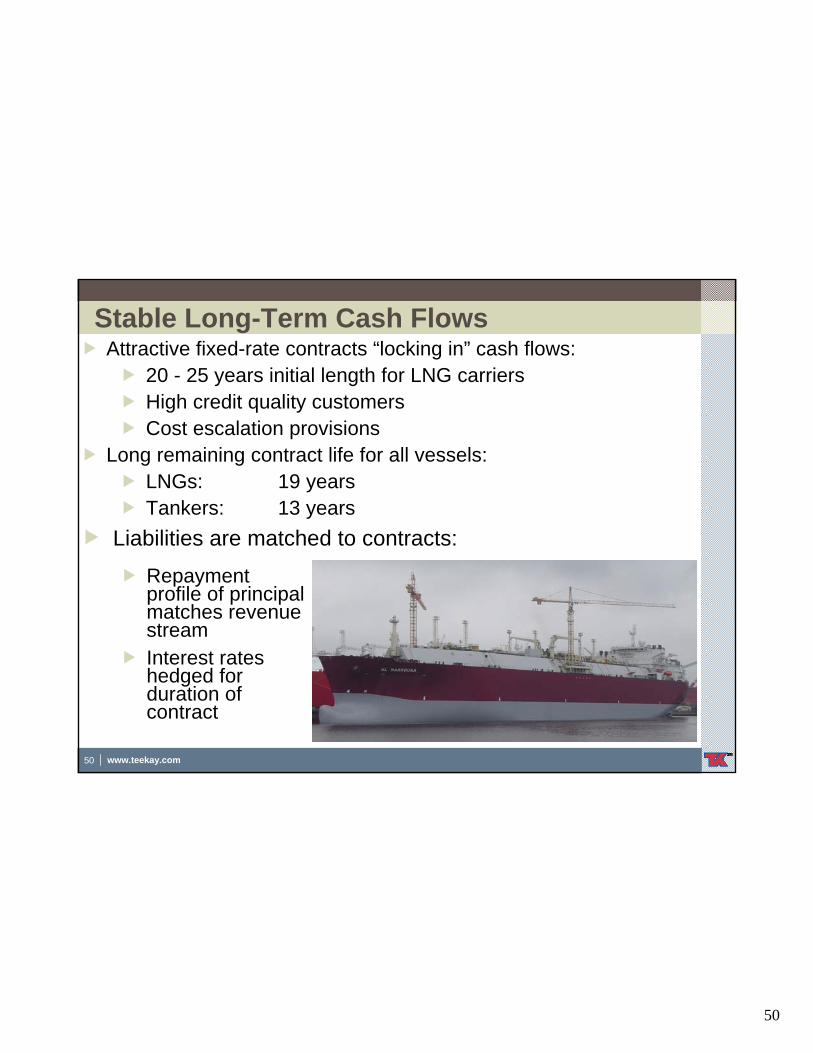
Stable Long-Term Cash FlowsAttractive fixed-rate contracts “locking in” cash flows:
20 - 25 years initial length for LNG carriersHigh credit quality customers Cost escalation provisions
Long remaining contract life for all vessels:LNGs: 19 yearsTankers: 13 years
Liabilities are matched to contracts:
Repayment profile of principal matches revenue streamInterest rates hedged for duration of contract
51
51 www.teekay.com
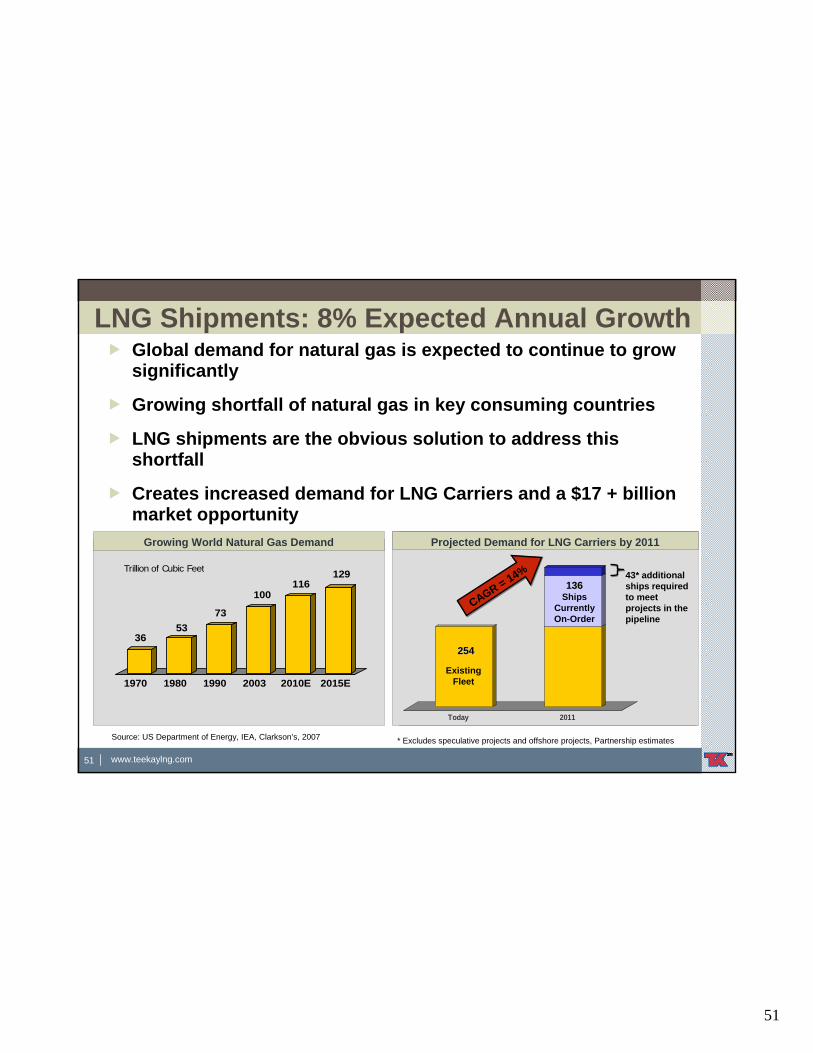
LNG Shipments: 8% Expected Annual Growth Global demand for natural gas is expected to continue to grow significantly
Growing shortfall of natural gas in key consuming countries
LNG shipments are the obvious solution to address this shortfall
Creates increased demand for LNG Carriers and a $17 + billion market opportunity
Source: US Department of Energy, IEA, Clarkson’s, 2007
Growing World Natural Gas Demand U.S. Natural Gas Production / Demand Balance
3653
73
100116
129
1970 1980 1990 2003 2010E 2015E
Trillion of Cubic Feet
2218
2319
2620
27
21
27
21
2005 2010E 2015E 2020E 2025E
U.S. Natural Gas DemandU.S. Natural Gas Production
Trillion of Cubic Feet
Today 2011
Projected Demand for LNG Carriers by 2011
Existing Fleet
136136Ships
Currently On-Order
43* additional ships required to meet projects in the pipeline
254254
CAGR = 14%
* Excludes speculative projects and offshore projects, Partnership estimates
www.teekaylng.com
52
52 www.teekay.com
INITIAL FLEET
(4 LNG Carriers)(5 Suezmax
Vessels)
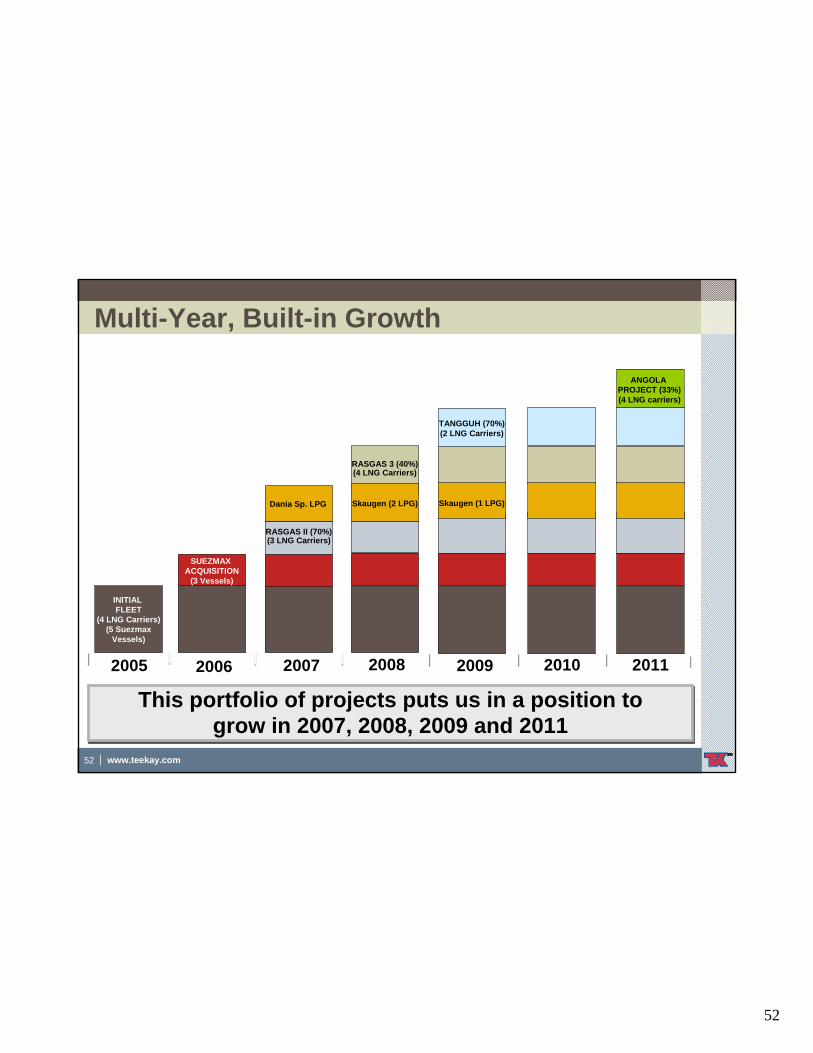
Multi-Year, Built-in Growth
2006 2007 2008 20092005
RASGAS II (70%)(3 LNG Carriers)
TANGGUH (70%)(2 LNG Carriers)
RASGAS 3 (40%)(4 LNG Carriers)
This portfolio of projects puts us in a position to grow in 2007, 2008, 2009 and 2011
This portfolio of projects puts us in a position to grow in 2007, 2008, 2009 and 2011
SUEZMAX ACQUISITION
(3 Vessels)
Dania Sp. LPG Skaugen (2 LPG) Skaugen (1 LPG)
2010 2011
ANGOLA PROJECT (33%)(4 LNG carriers)
53
www.teekay.com
Appendix
54
54 www.teekay.com
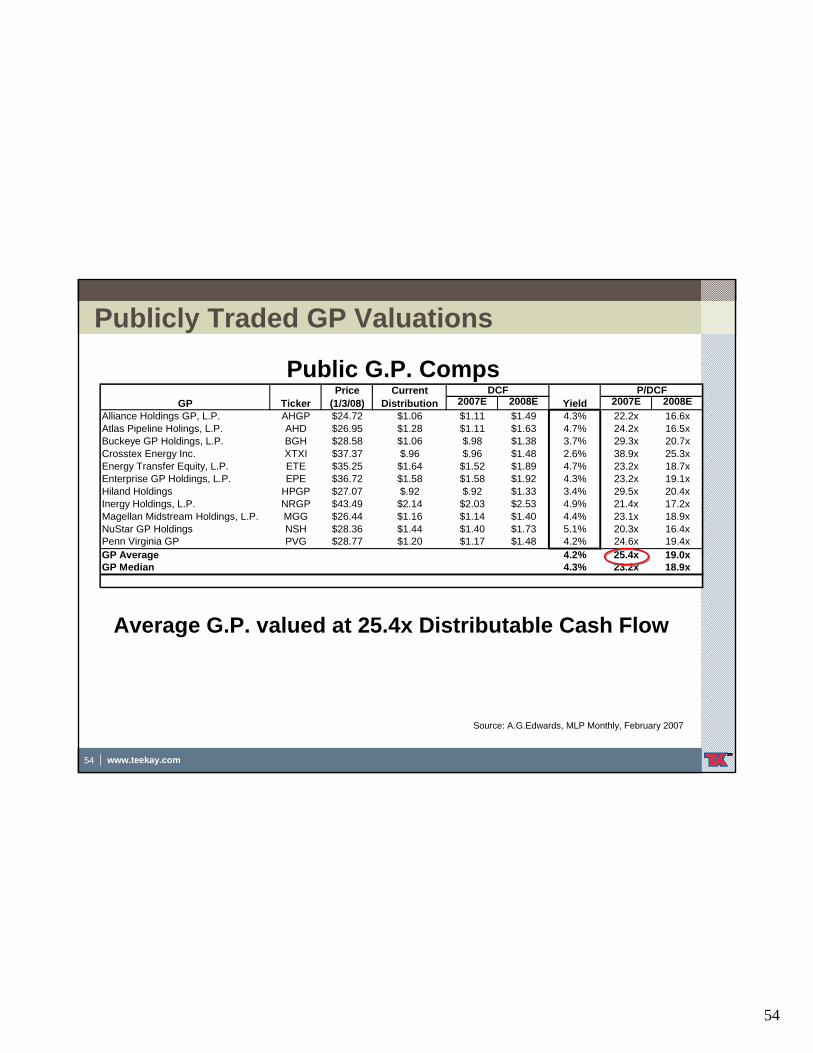
2007E 2008E 2007E 2008EAlliance Holdings GP, L.P. AHGP $24.72 $1.06 $1.11 $1.49 4.3% 22.2x 16.6xAtlas Pipeline Holings, L.P. AHD $26.95 $1.28 $1.11 $1.63 4.7% 24.2x 16.5xBuckeye GP Holdings, L.P. BGH $28.58 $1.06 $.98 $1.38 3.7% 29.3x 20.7xCrosstex Energy Inc. XTXI $37.37 $.96 $.96 $1.48 2.6% 38.9x 25.3xEnergy Transfer Equity, L.P. ETE $35.25 $1.64 $1.52 $1.89 4.7% 23.2x 18.7xEnterprise GP Holdings, L.P. EPE $36.72 $1.58 $1.58 $1.92 4.3% 23.2x 19.1xHiland Holdings HPGP $27.07 $.92 $.92 $1.33 3.4% 29.5x 20.4xInergy Holdings, L.P. NRGP $43.49 $2.14 $2.03 $2.53 4.9% 21.4x 17.2xMagellan Midstream Holdings, L.P. MGG $26.44 $1.16 $1.14 $1.40 4.4% 23.1x 18.9xNuStar GP Holdings NSH $28.36 $1.44 $1.40 $1.73 5.1% 20.3x 16.4xPenn Virginia GP PVG $28.77 $1.20 $1.17 $1.48 4.2% 24.6x 19.4xGP Average 4.2% 25.4x 19.0xGP Median 4.3% 23.2x 18.9x
TickerGPDCF P/DCF
YieldCurrent
DistributionPrice
(1/3/08)
Publicly Traded GP Valuations
Public G.P. Comps
Average G.P. valued at 25.4x Distributable Cash Flow
Source: A.G.Edwards, MLP Monthly, February 2007
55
55 www.teekay.com
Spot Rate = $31,625 / DayPF 2006
$78.60.0
1.38.7
15.6
$53.1
$73.5EBITDA*
15.6Depreciation and amortization8.7Interest expense1.3Income tax expense
Less:0.0 Interest income
Add:$47.9Net income
EBITDA Reconciliation
EBITDA for Year Ending December 31, 2006EBITDA for Year Ending December 31, 2006
(Dollars in millions)
Source: F-1. Spot rate case assumes current contracts, same operating days and expenses as in FY 2006 pro forma financials and 1yr TCE of $31,625 per day.
*Earnings before interest, taxes, depreciation and amortization.
56
56 www.teekay.com
Newbuilding/Conversion Deliveries
1Q08 2Q08 3Q08 4Q08 2008Offshore Segment 1 1Fixed-Rate Tanker Segment 1 1 2Liquefied Gas Segment 4 2 6Spot Segment 2 2 4Total 2 5 2 4 13
1Q09 2Q09 3Q09 4Q09 2009Offshore SegmentFixed-Rate Tanker SegmentLiquefied Gas Segment 1 1 2Spot Segment 2 1 3 6Total 3 2 3 8
1Q10 2Q10 3Q10 4Q10 2010Offshore Segment 2 2Fixed-Rate Tanker SegmentLiquefied Gas SegmentSpot SegmentTotal 2 2
57
57 www.teekay.com
CapexCapex by Segment
$1,219$163$231$209$616Total
498--132366Spot Tanker Segment
245--54191Liquefied Gas Segment
59---59Fixed-Rate Tanker Segment
$417$163$231$23-Offshore Segment
Total2011201020092008(in millions)
Company’s remaining capital commitments relating to its portion of newbuildings (including the two recently announced shuttle tanker newbuildings) and conversions
58
58 www.teekay.com
Sum of Parts SupportBalance sheet amounts as of Sept 30, 2007, except TNK which is based on F1Share prices effective: 25-Jan-08
TOO TGPL.P. units outstanding 19.6 L.P. units outstanding 37.3 Price per unit 24.19$ Price per unit 28.3$ Market Capitalization 474.1 Market Capitalization 1,054.8 Teekay's L.P. ownership of TOO 59% Teekay's L.P. ownership of TGP 61.7%TOO Equity Value 279.4 TGP Equity Value 650.8
OPCO G.P. Cash Flow (dist'n of $2.12 p.a.) 2.7 TOO Ent. Value/EBITDA trading multiple 11.4x G.P. Comp Multiple of DCF 25.4 Implied OPCO Ent. Value (based on above) 3,176.4 Est. value of G.P. interest 69.8Less: Net Debt 1,352.8 OPCO Equity Value 1,823.6 Diluted shares o/s at Sept. 30, 2007 75.3 Teekay's Equity Value in OPCO (74%) 1,349.4
Equity Value per Teekay share 9.57
Total TOO/OPCO Equity Value 1,628.8
G.P. Cash Flow (dist'n of $1.60 p.a.) 0.6 G.P. Comp Multiple of DCF 25.4 Est. value of G.P. interest 15.1
Diluted shares o/s at Sept. 30, 2007 75.3
Equity Value per Teekay share 21.83
Teekay LNG PartnersTeekay Offshore Partners and OPCOin (millions)
TNKShares outstanding 25.0
16.3 Market Capitalization 407.5 Teekay's economic interest in TNK 54%TNK Equity Value 220.1
Diluted shares o/s at Sept. 30, 2007 75.3
Equity Value per Teekay share 2.92
Teekay Tankers
Price per share
1,891.6 (per Clarkson's)
1,123.9 less: Net Debt (Teekay Standalone) 1,693.5
Equity Value of owned fleet 1,322.0
Less: TPO Minority Equity 304.8
Equity Value of Owned Fleet+ TPO 1,017.2
Other ItemsEquity value of in-chartered fleet 130.4 (Management est.)
'In-the-money' amount of N/Bs 298.0 N/B Installments paid to-date 552.5 Ras Gas III Installments to-date 320.5
(not consolidated)Subtotal Other Items 1,301.4
Total Teekay Standalone Equity Value 2,318.6
Diluted shares o/s at Sept. 30, 2007 75.3
Equity Value per Teekay share 30.79
FMV of owned 'on-the-water' fleet
Teekay Petrojarl (TPO) Ent. Value
Teekay Standalone
59
59 www.teekay.com
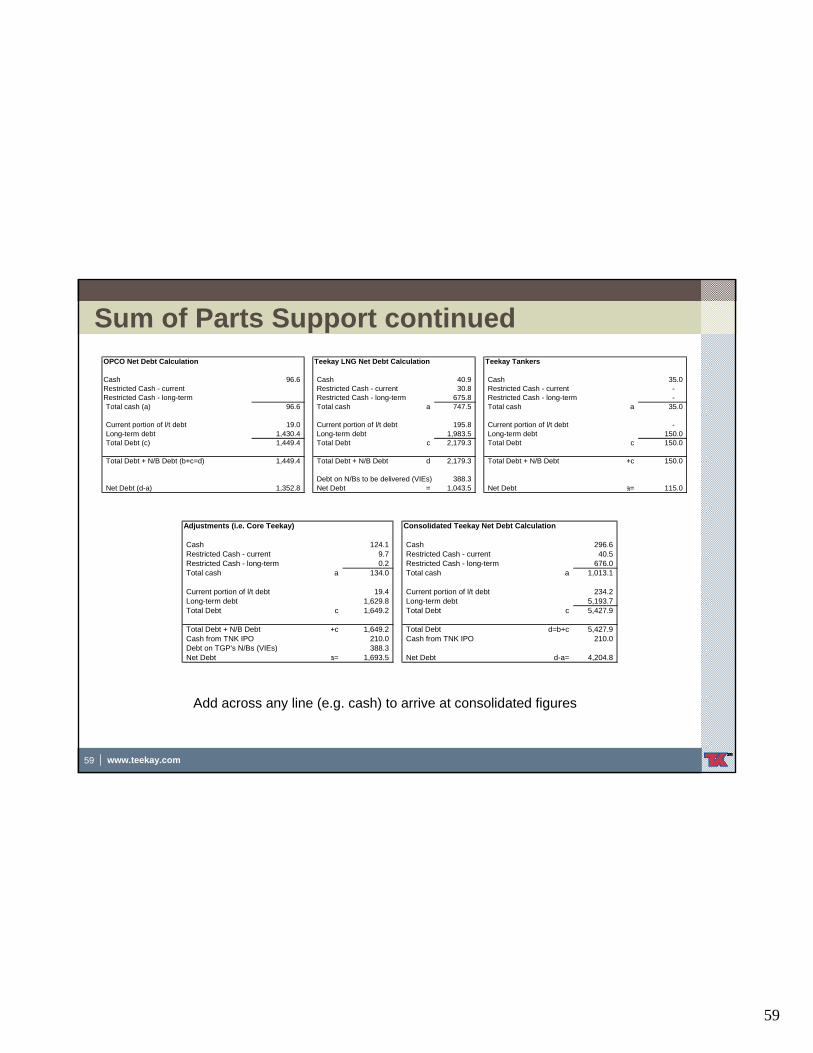
Sum of Parts Support continued
Add across any line (e.g. cash) to arrive at consolidated figures
OPCO Net Debt Calculation Teekay LNG Net Debt Calculation Teekay Tankers
Cash 96.6 Cash 40.9 Cash 35.0 Restricted Cash - current Restricted Cash - current 30.8 Restricted Cash - current - Restricted Cash - long-term Restricted Cash - long-term 675.8 Restricted Cash - long-term - Total cash (a) 96.6 Total cash a 747.5 Total cash a 35.0
Current portion of l/t debt 19.0 Current portion of l/t debt 195.8 Current portion of l/t debt - Long-term debt 1,430.4 Long-term debt 1,983.5 Long-term debt 150.0 Total Debt (c) 1,449.4 Total Debt c 2,179.3 Total Debt c 150.0
Total Debt + N/B Debt (b+c=d) 1,449.4 Total Debt + N/B Debt d 2,179.3 Total Debt + N/B Debt +c 150.0
Debt on N/Bs to be delivered (VIEs) 388.3 Net Debt (d-a) 1,352.8 Net Debt = 1,043.5 Net Debt a= 115.0
Adjustments (i.e. Core Teekay) Consolidated Teekay Net Debt Calculation
Cash 124.1 Cash 296.6 Restricted Cash - current 9.7 Restricted Cash - current 40.5 Restricted Cash - long-term 0.2 Restricted Cash - long-term 676.0 Total cash a 134.0 Total cash a 1,013.1
Current portion of l/t debt 19.4 Current portion of l/t debt 234.2 Long-term debt 1,629.8 Long-term debt 5,193.7 Total Debt c 1,649.2 Total Debt c 5,427.9
Total Debt + N/B Debt +c 1,649.2 Total Debt d=b+c 5,427.9 Cash from TNK IPO 210.0 Cash from TNK IPO 210.0 Debt on TGP's N/Bs (VIEs) 388.3 Net Debt a= 1,693.5 Net Debt d-a= 4,204.8
60
60 www.teekay.com
Fleet SummariesTeekay Offshore Partners Fleet List
Owned VesselsChartered-in
Vessels Newbuildings on Order TotalShuttle Tanker Segment 26 12 - 38
Conventional Tanker Segment 9 - - 9 Floating Storage & Offtake ("FSO") Vessels 5 - - 5
Total 40 12 - 52
Number of Vessels
Teekay LNG Partners Fleet ListDelivered Vessels Newbuildings Total
LNG Segment 7 6 13 LPG Segment 1 3 4
Suezmax Segment 8 - 8 Total 16 9 25
Number of Vessels
Teekay Tankers Fleet ListDelivered Vessels Newbuildings Total
Aframax Segment 9 - 9 Total 9 - 9
Number of Vessels
Teekay Corporation
Owned VesselsChartered-in
VesselsNewbuildings / Conversions Total
Spot Tanker Fleet:Suezmaxes 6 10 10 26 Aframaxes 5 25 30 Panamaxes 1 1
Large Product Tankers 13 8 1 22 Small Product Tankers 10 10
Total Spot Tanker Segment 24 54 11 89 Fixed-rate Fleet
Shuttle Tankers 1 4 5 Conventional Tankers 7 4 1 12
Floating Production Storage & Offtake ("FPSO") Units 4 1 5 LNG Carriers 2 2
Total Fixed-rate Segment 14 4 6 24 Total 38 58 17 113
Number of Vessels
61
61 www.teekay.com
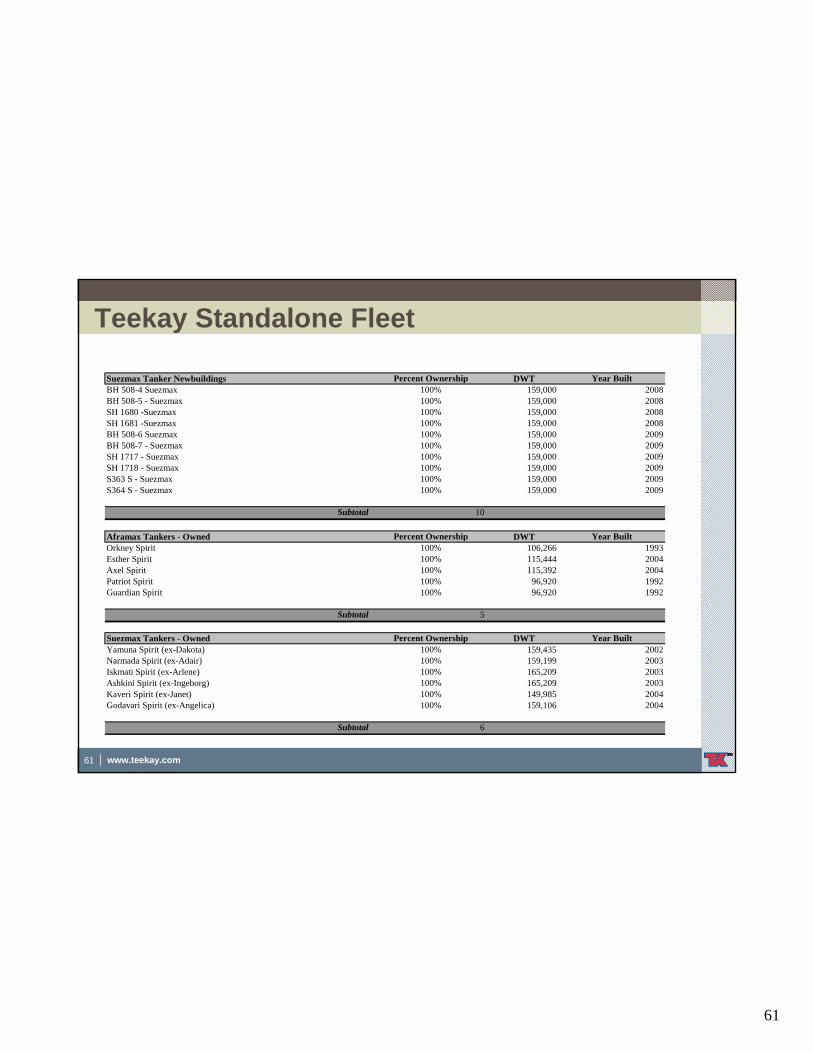
Teekay Standalone Fleet
Suezmax Tanker Newbuildings Percent Ownership DWT Year BuiltBH 508-4 Suezmax 100% 159,000 2008BH 508-5 - Suezmax 100% 159,000 2008SH 1680 -Suezmax 100% 159,000 2008SH 1681 -Suezmax 100% 159,000 2008BH 508-6 Suezmax 100% 159,000 2009BH 508-7 - Suezmax 100% 159,000 2009SH 1717 - Suezmax 100% 159,000 2009SH 1718 - Suezmax 100% 159,000 2009S363 S - Suezmax 100% 159,000 2009S364 S - Suezmax 100% 159,000 2009
Subtotal 10
Aframax Tankers - Owned Percent Ownership DWT Year BuiltOrkney Spirit 100% 106,266 1993Esther Spirit 100% 115,444 2004Axel Spirit 100% 115,392 2004Patriot Spirit 100% 96,920 1992Guardian Spirit 100% 96,920 1992
Subtotal 5
Suezmax Tankers - Owned Percent Ownership DWT Year BuiltYamuna Spirit (ex-Dakota) 100% 159,435 2002Narmada Spirit (ex-Adair) 100% 159,199 2003Iskmati Spirit (ex-Arlene) 100% 165,209 2003Ashkini Spirit (ex-Ingeborg) 100% 165,209 2003Kaveri Spirit (ex-Janet) 100% 149,985 2004Godavari Spirit (ex-Angelica) 100% 159,106 2004
Subtotal 6
62
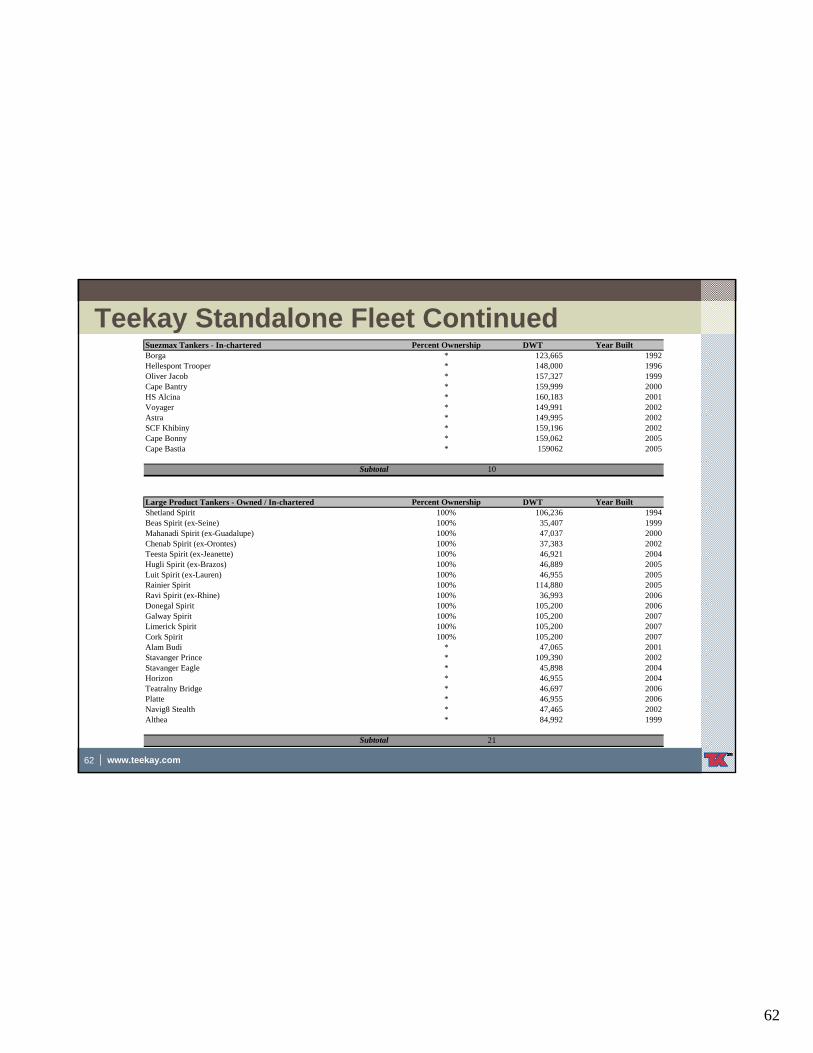
62 www.teekay.com
Teekay Standalone Fleet ContinuedSuezmax Tankers - In-chartered Percent Ownership DWT Year BuiltBorga * 123,665 1992Hellespont Trooper * 148,000 1996Oliver Jacob * 157,327 1999Cape Bantry * 159,999 2000HS Alcina * 160,183 2001Voyager * 149,991 2002Astra * 149,995 2002SCF Khibiny * 159,196 2002Cape Bonny * 159,062 2005Cape Bastia * 159062 2005
Subtotal 10
Large Product Tankers - Owned / In-chartered Percent Ownership DWT Year BuiltShetland Spirit 100% 106,236 1994Beas Spirit (ex-Seine) 100% 35,407 1999Mahanadi Spirit (ex-Guadalupe) 100% 47,037 2000Chenab Spirit (ex-Orontes) 100% 37,383 2002Teesta Spirit (ex-Jeanette) 100% 46,921 2004Hugli Spirit (ex-Brazos) 100% 46,889 2005Luit Spirit (ex-Lauren) 100% 46,955 2005Rainier Spirit 100% 114,880 2005Ravi Spirit (ex-Rhine) 100% 36,993 2006Donegal Spirit 100% 105,200 2006Galway Spirit 100% 105,200 2007Limerick Spirit 100% 105,200 2007Cork Spirit 100% 105,200 2007Alam Budi * 47,065 2001Stavanger Prince * 109,390 2002Stavanger Eagle * 45,898 2004Horizon * 46,955 2004Teatralny Bridge * 46,697 2006Platte * 46,955 2006Navig8 Stealth * 47,465 2002Althea * 84,992 1999
Subtotal 21
63
63 www.teekay.com
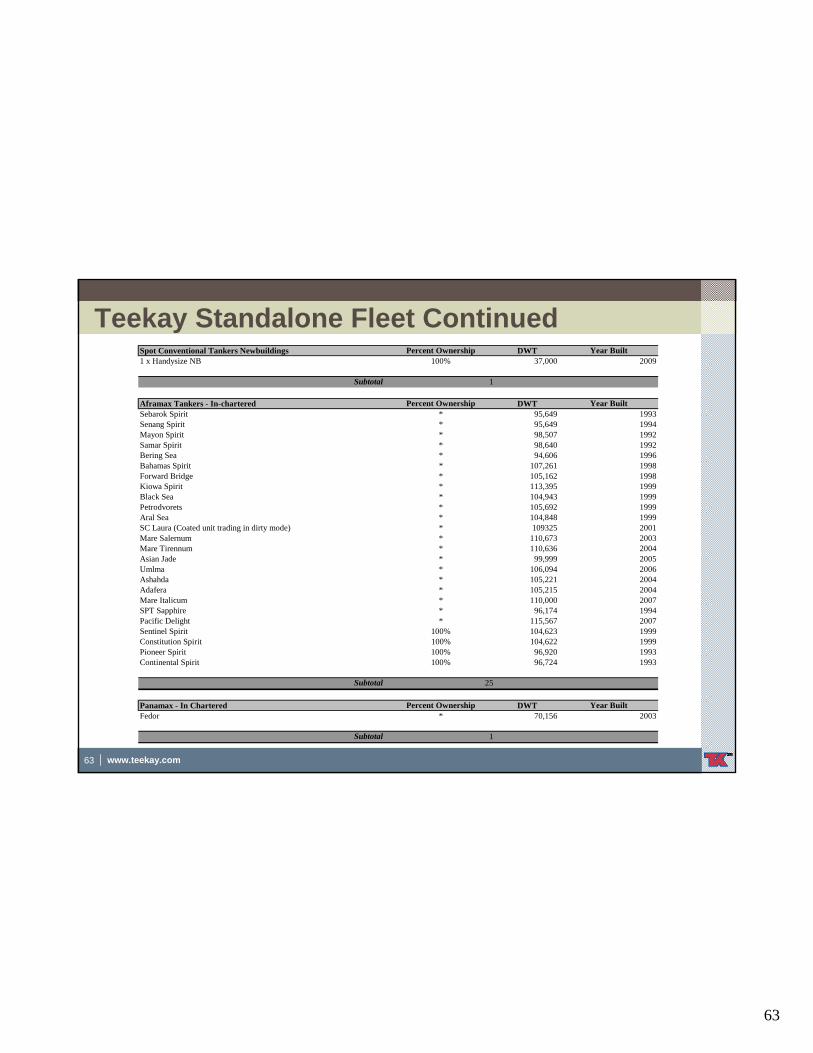
Teekay Standalone Fleet ContinuedSpot Conventional Tankers Newbuildings Percent Ownership DWT Year Built1 x Handysize NB 100% 37,000 2009
Subtotal 1
Aframax Tankers - In-chartered Percent Ownership DWT Year BuiltSebarok Spirit * 95,649 1993Senang Spirit * 95,649 1994Mayon Spirit * 98,507 1992Samar Spirit * 98,640 1992Bering Sea * 94,606 1996Bahamas Spirit * 107,261 1998Forward Bridge * 105,162 1998Kiowa Spirit * 113,395 1999Black Sea * 104,943 1999Petrodvorets * 105,692 1999Aral Sea * 104,848 1999SC Laura (Coated unit trading in dirty mode) * 109325 2001Mare Salernum * 110,673 2003Mare Tirennum * 110,636 2004Asian Jade * 99,999 2005Umlma * 106,094 2006Ashahda * 105,221 2004Adafera * 105,215 2004Mare Italicum * 110,000 2007SPT Sapphire * 96,174 1994Pacific Delight * 115,567 2007Sentinel Spirit 100% 104,623 1999Constitution Spirit 100% 104,622 1999Pioneer Spirit 100% 96,920 1993Continental Spirit 100% 96,724 1993
Subtotal 25
Panamax - In Chartered Percent Ownership DWT Year BuiltFedor * 70,156 2003
Subtotal 1
64
64 www.teekay.com
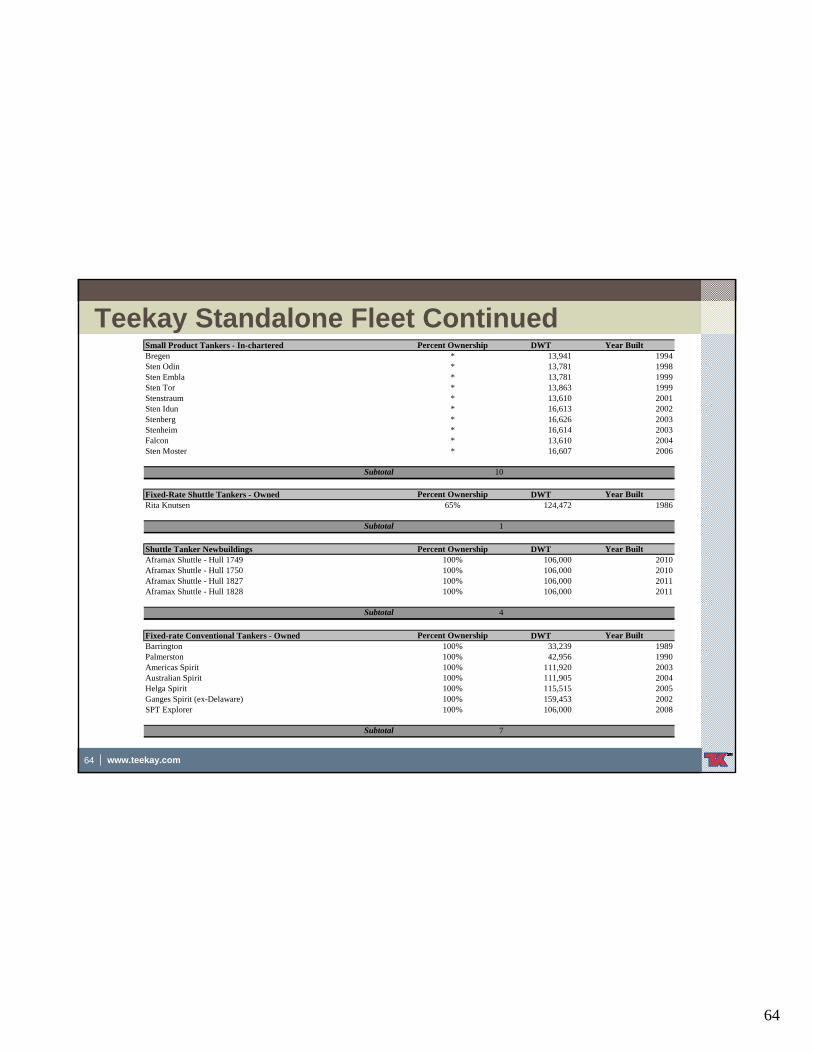
Teekay Standalone Fleet ContinuedSmall Product Tankers - In-chartered Percent Ownership DWT Year BuiltBregen * 13,941 1994Sten Odin * 13,781 1998Sten Embla * 13,781 1999Sten Tor * 13,863 1999Stenstraum * 13,610 2001Sten Idun * 16,613 2002Stenberg * 16,626 2003Stenheim * 16,614 2003Falcon * 13,610 2004Sten Moster * 16,607 2006
Subtotal 10
Fixed-Rate Shuttle Tankers - Owned Percent Ownership DWT Year BuiltRita Knutsen 65% 124,472 1986
Subtotal 1
Shuttle Tanker Newbuildings Percent Ownership DWT Year BuiltAframax Shuttle - Hull 1749 100% 106,000 2010Aframax Shuttle - Hull 1750 100% 106,000 2010Aframax Shuttle - Hull 1827 100% 106,000 2011Aframax Shuttle - Hull 1828 100% 106,000 2011
Subtotal 4
Fixed-rate Conventional Tankers - Owned Percent Ownership DWT Year BuiltBarrington 100% 33,239 1989Palmerston 100% 42,956 1990Americas Spirit 100% 111,920 2003Australian Spirit 100% 111,905 2004Helga Spirit 100% 115,515 2005Ganges Spirit (ex-Delaware) 100% 159,453 2002SPT Explorer 100% 106,000 2008
Subtotal 7
65
65 www.teekay.com
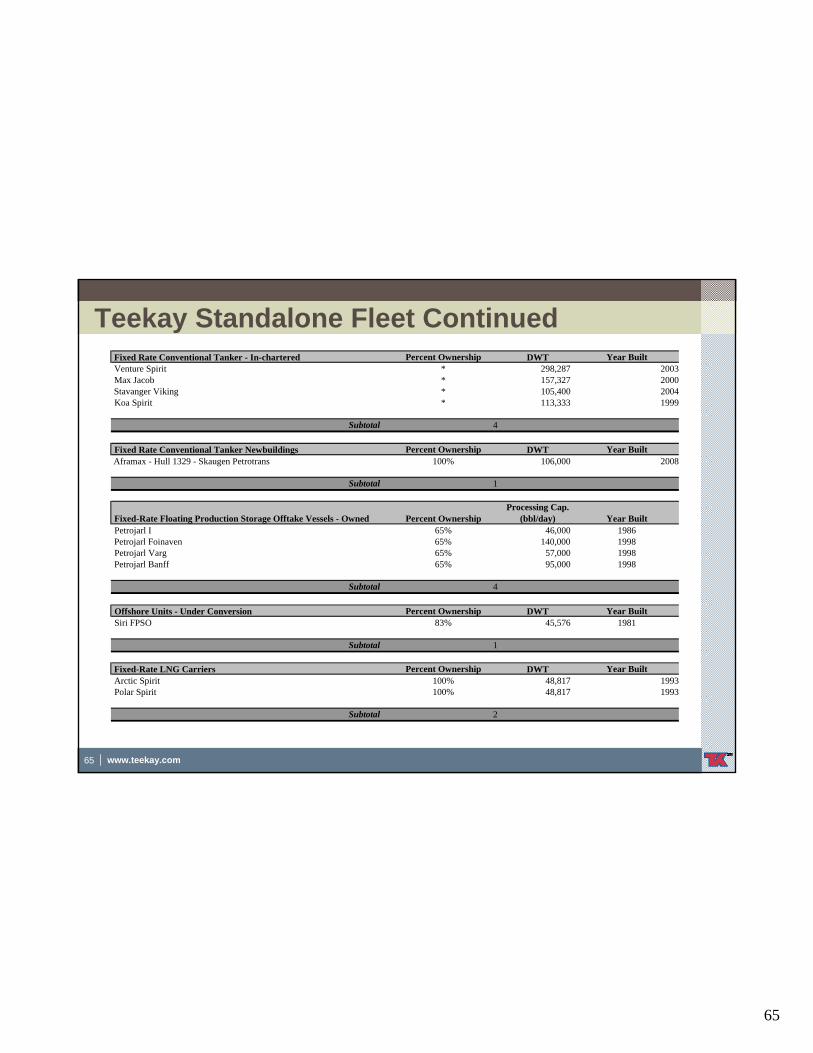
Teekay Standalone Fleet ContinuedFixed Rate Conventional Tanker - In-chartered Percent Ownership DWT Year BuiltVenture Spirit * 298,287 2003Max Jacob * 157,327 2000Stavanger Viking * 105,400 2004Koa Spirit * 113,333 1999
Subtotal 4
Fixed Rate Conventional Tanker Newbuildings Percent Ownership DWT Year BuiltAframax - Hull 1329 - Skaugen Petrotrans 100% 106,000 2008
Subtotal 1
Fixed-Rate Floating Production Storage Offtake Vessels - Owned Percent OwnershipProcessing Cap.
(bbl/day) Year BuiltPetrojarl I 65% 46,000 1986Petrojarl Foinaven 65% 140,000 1998Petrojarl Varg 65% 57,000 1998Petrojarl Banff 65% 95,000 1998
Subtotal 4
Offshore Units - Under Conversion Percent Ownership DWT Year BuiltSiri FPSO 83% 45,576 1981
Subtotal 1
Fixed-Rate LNG Carriers Percent Ownership DWT Year BuiltArctic Spirit 100% 48,817 1993Polar Spirit 100% 48,817 1993
Subtotal 2
66
66 www.teekay.com
TOO Fleet
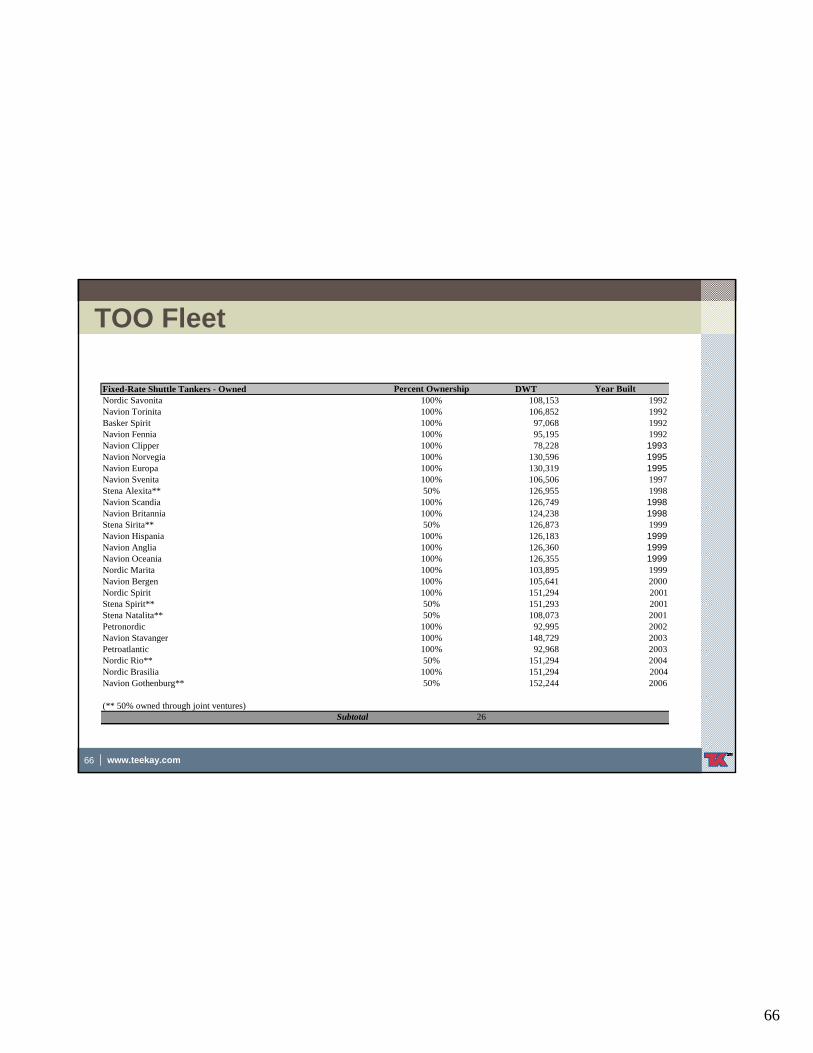
Fixed-Rate Shuttle Tankers - Owned Percent Ownership DWT Year BuiltNordic Savonita 100% 108,153 1992Navion Torinita 100% 106,852 1992Basker Spirit 100% 97,068 1992Navion Fennia 100% 95,195 1992Navion Clipper 100% 78,228 1993Navion Norvegia 100% 130,596 1995Navion Europa 100% 130,319 1995Navion Svenita 100% 106,506 1997Stena Alexita** 50% 126,955 1998Navion Scandia 100% 126,749 1998Navion Britannia 100% 124,238 1998Stena Sirita** 50% 126,873 1999Navion Hispania 100% 126,183 1999Navion Anglia 100% 126,360 1999Navion Oceania 100% 126,355 1999Nordic Marita 100% 103,895 1999Navion Bergen 100% 105,641 2000Nordic Spirit 100% 151,294 2001Stena Spirit** 50% 151,293 2001Stena Natalita** 50% 108,073 2001Petronordic 100% 92,995 2002Navion Stavanger 100% 148,729 2003Petroatlantic 100% 92,968 2003Nordic Rio** 50% 151,294 2004Nordic Brasilia 100% 151,294 2004Navion Gothenburg** 50% 152,244 2006
(** 50% owned through joint ventures)Subtotal 26
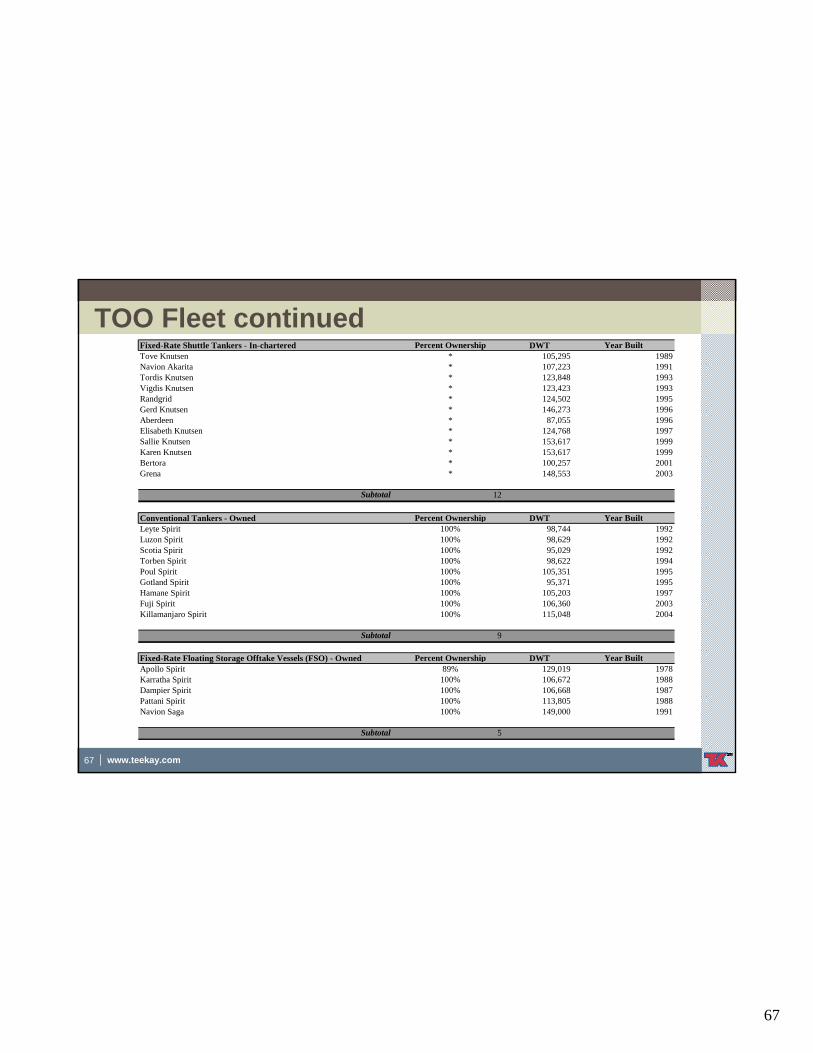
67
67 www.teekay.com
TOO Fleet continuedFixed-Rate Shuttle Tankers - In-chartered Percent Ownership DWT Year BuiltTove Knutsen * 105,295 1989Navion Akarita * 107,223 1991Tordis Knutsen * 123,848 1993Vigdis Knutsen * 123,423 1993Randgrid * 124,502 1995Gerd Knutsen * 146,273 1996Aberdeen * 87,055 1996Elisabeth Knutsen * 124,768 1997Sallie Knutsen * 153,617 1999Karen Knutsen * 153,617 1999Bertora * 100,257 2001Grena * 148,553 2003
Subtotal 12
Conventional Tankers - Owned Percent Ownership DWT Year BuiltLeyte Spirit 100% 98,744 1992Luzon Spirit 100% 98,629 1992Scotia Spirit 100% 95,029 1992Torben Spirit 100% 98,622 1994Poul Spirit 100% 105,351 1995Gotland Spirit 100% 95,371 1995Hamane Spirit 100% 105,203 1997Fuji Spirit 100% 106,360 2003Killamanjaro Spirit 100% 115,048 2004
Subtotal 9
Fixed-Rate Floating Storage Offtake Vessels (FSO) - Owned Percent Ownership DWT Year BuiltApollo Spirit 89% 129,019 1978Karratha Spirit 100% 106,672 1988Dampier Spirit 100% 106,668 1987Pattani Spirit 100% 113,805 1988Navion Saga 100% 149,000 1991
Subtotal 5
68
68 www.teekay.com
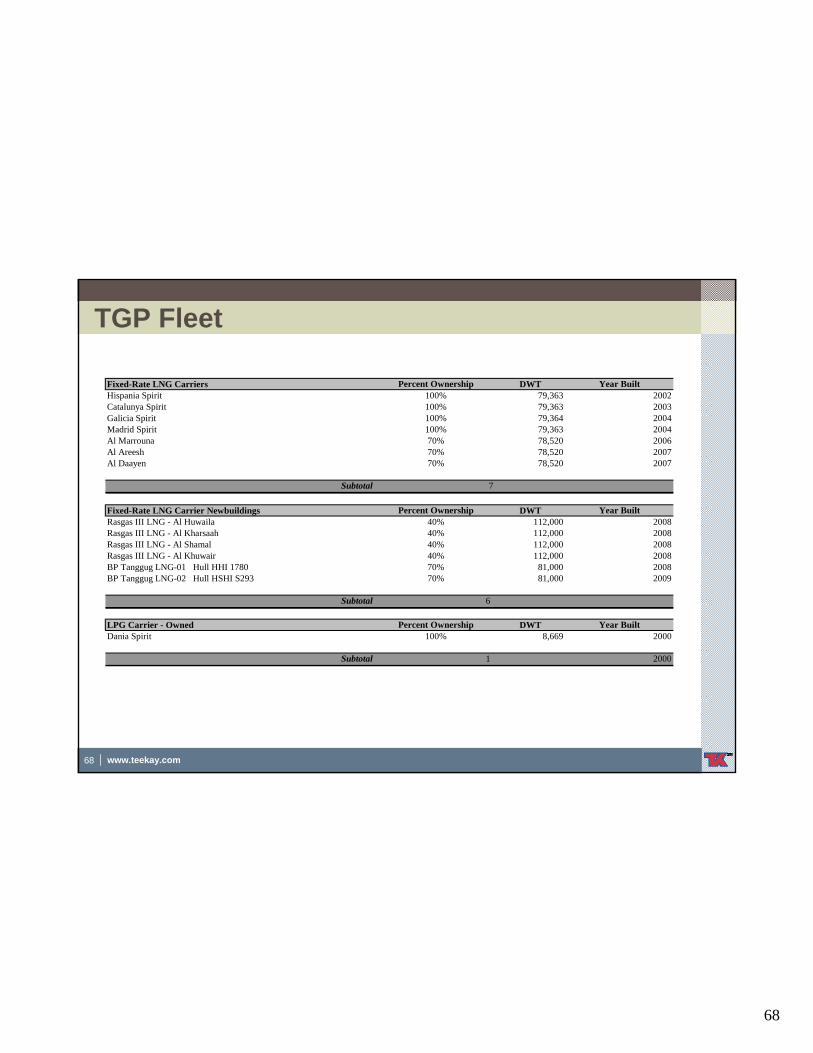
TGP Fleet
Fixed-Rate LNG Carriers Percent Ownership DWT Year BuiltHispania Spirit 100% 79,363 2002Catalunya Spirit 100% 79,363 2003Galicia Spirit 100% 79,364 2004Madrid Spirit 100% 79,363 2004Al Marrouna 70% 78,520 2006Al Areesh 70% 78,520 2007Al Daayen 70% 78,520 2007
Subtotal 7
Fixed-Rate LNG Carrier Newbuildings Percent Ownership DWT Year BuiltRasgas III LNG - Al Huwaila 40% 112,000 2008Rasgas III LNG - Al Kharsaah 40% 112,000 2008Rasgas III LNG - Al Shamal 40% 112,000 2008Rasgas III LNG - Al Khuwair 40% 112,000 2008BP Tanggug LNG-01 Hull HHI 1780 70% 81,000 2008BP Tanggug LNG-02 Hull HSHI S293 70% 81,000 2009
Subtotal 6
LPG Carrier - Owned Percent Ownership DWT Year BuiltDania Spirit 100% 8,669 2000
Subtotal 1 2000
69
69 www.teekay.com
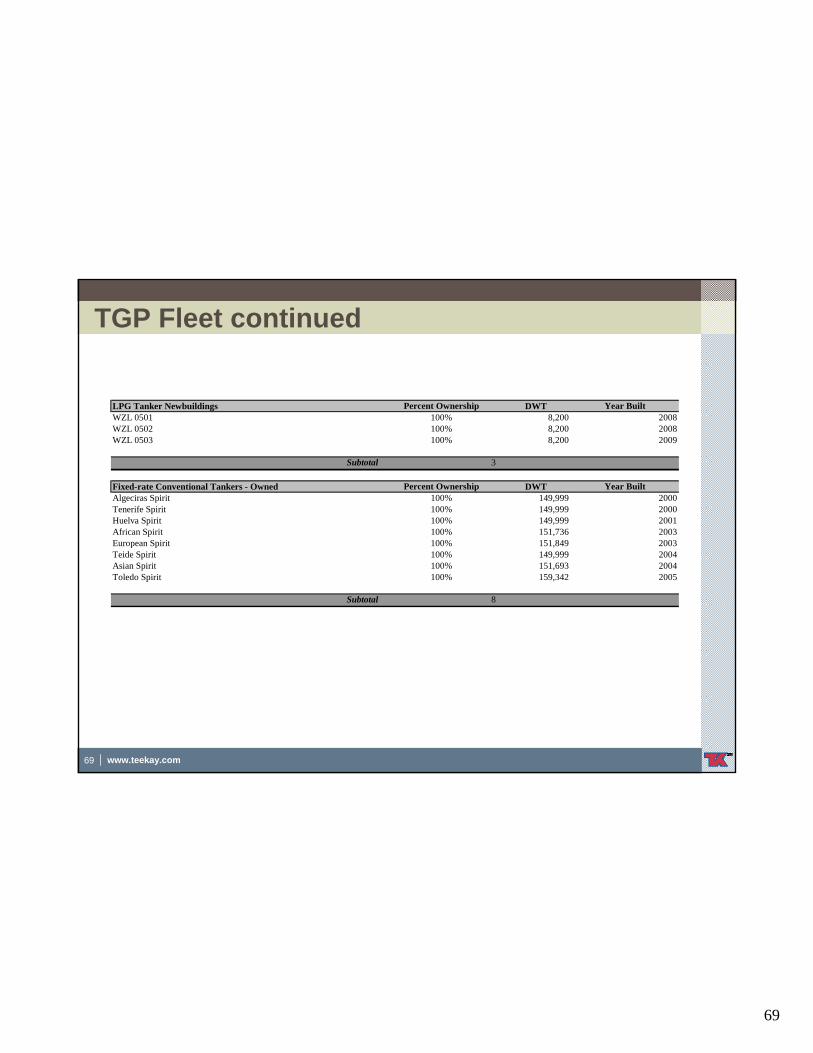
TGP Fleet continued
LPG Tanker Newbuildings Percent Ownership DWT Year BuiltWZL 0501 100% 8,200 2008WZL 0502 100% 8,200 2008WZL 0503 100% 8,200 2009
Subtotal 3
Fixed-rate Conventional Tankers - Owned Percent Ownership DWT Year BuiltAlgeciras Spirit 100% 149,999 2000Tenerife Spirit 100% 149,999 2000Huelva Spirit 100% 149,999 2001African Spirit 100% 151,736 2003European Spirit 100% 151,849 2003Teide Spirit 100% 149,999 2004Asian Spirit 100% 151,693 2004Toledo Spirit 100% 159,342 2005
Subtotal 8
70
70 www.teekay.com
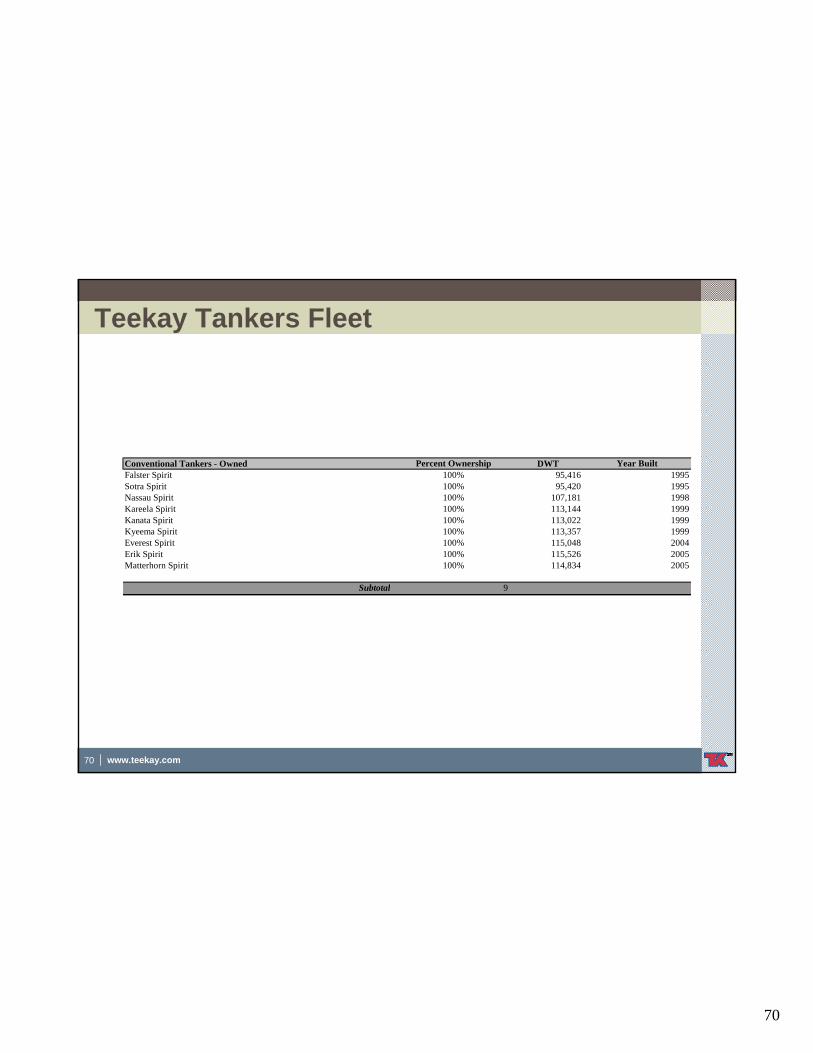
Teekay Tankers Fleet
Conventional Tankers - Owned Percent Ownership DWT Year BuiltFalster Spirit 100% 95,416 1995Sotra Spirit 100% 95,420 1995Nassau Spirit 100% 107,181 1998Kareela Spirit 100% 113,144 1999Kanata Spirit 100% 113,022 1999Kyeema Spirit 100% 113,357 1999Everest Spirit 100% 115,048 2004Erik Spirit 100% 115,526 2005Matterhorn Spirit 100% 114,834 2005
Subtotal 9


![arXiv:1109.0816v4 [math.AP] 2 Jan 2012arxiv.org/pdf/1109.0816.pdfarXiv:1109.0816v4 [math.AP] 2 Jan 2012 Lp-MAXIMAL REGULARITY OF NONLOCAL PARABOLIC EQUATION AND APPLICATIONS∗ XICHENG](https://img.pdfslide.us/doc/110x75/5f3f648dfc08093e7c56f68b/arxiv11090816v4-mathap-2-jan-arxiv11090816v4-mathap-2-jan-2012-lp-maximal.jpg)