Embed Size (px)
Citation preview

J&T FINANCE GROUP SE
Annual report, financial statements
and auditor’s report
for the year 2017
ANNUAL REPORT 2017
CONTENT
BOARD OF DIRECTORS’ REPORT
AUDITOR’S REPORT ON CONSOLIDATED FINANCIAL STATEMENTS, CONSOLIDATED
FINANCIAL STATEMENTS AND NOTES TO CONSOLIDATED FINANCIAL STATEMENTS
FOR THE YEAR 2017
AUDITOR’S REPORT ON INDIVIDUAL FINANCIAL STATEMENTS, FINANCIAL
STATEMENTS AND NOTES TO FINANCIAL STATEMENTS FOR THE YEAR 2017
TEXT PART OF THE ANNUAL REPORT
REPORT ON RELATIONS
REPORT OF THE BOARD OF DIRECTORS OF J&T FINANCE GROUP SE ON BUSINESS
ACTIVITIES OF THE COMPANY AND THE BALANCE OF ITS ASSETS FOR THE YEAR
2017
Board of Directors’ Report
Message from the Board of Directors
Year 2017 turned out to be the most successful year for J&T FINANCE GROUP SE (“JTFG”, “the Group”) in
its history as far as net profit is concerned and JTFG is proud to present the historically highest achieved
profit of EUR 137.5 million. The Group was able to seize the opportunities in the challenging market
conditions, especially by taking the advantage of the steady low interest rates on the market of presence
as well as of the termination of interventions to the CZK/EUR exchange rate by the Czech National Bank
(“CNB”).
The Group was trying to keep up with current trends and closely listen to needs of our clients. In 2017,
Poštová banka introduced a new strategy of repositioning which targets on new active customers. The
repositioning includeed an introduction of new products and services and the focus on a digitalization.
New mobile application, launch of a new online bank, a new concept of family branches or an introduction
of the Useful morgage loan are just a few to be mentioned. J&T BANKA expanded its reach to small and
medium‐sized enterprise (“SME”) clients by strengthening the corporate banking teams in Prague, Brno,
Ostrava and Bratislava. J&T BANKA also extended its product portfolio with leasing services provided
through J&T Leasingová společnost. At end of the lapsed year, we established a new Czech subsidiary J&T
Mezzanine, a.s. in order to broaden our portfolio of mezzanine and equity financing.
Besides our record profit, we are proud to announce that J&T BANKA was awarded by Fincentrum as the
best private bank of the Czech Republic for 2017 and J&T Bond was awarded as the best fund of the year
by Fincentrum & Forbes. We can also proudly report, that Náš prvý realitný real estate fund managed by
Prvá penzijná správcovská společnost, which is still by far the largest retail fund in Slovakia, won the award
for best selling real estate fund in Slovakia for 2017.
Besides focusing on the Czech and Slovak market, we utilized the opportunities on other markets the
Group’s operates in as well. In Croatia, VABA d.d. banka Varaždin changed its name to J&T Banka d.d. in
order to have a stronger link with the J&T brand and transformed itself from a retail to a private bank. In
Russia, we expanded our loan porftolio through the successfull acquisition and integration of a Moscow
based AKB Khovanskiy bank. We want to continue to monitor other markets in orded to find new
opportunities for us and our clients.
In the end, we would like to express our sincere gratitude to all who have contributed to the Group’s
success, prosperity and stability – our shareholders, business partners and employees but first of all to our
clients who keep us driving to future achievements.
Financial operations report
The Group achieved a consolidated profit of EUR 137.5 million in 2017. This represents an increase by EUR
75.7 million (or 122.5%) compared to 2016. The key drivers which influenced this significant growth were
net interest income and exchange rate gains resulting from the termination of interventions to the
CZK/EUR exchange rate by the CNB and the appreciation of the Czech crown.
Net interest income grew by EUR 26.4 million to EUR 309 million compared to EUR 282.6 million in 2016.
Interest income decreased by EUR 18.6 million from EUR 423.7 million in 2016 to EUR 405.1 million in 2017
due to continuous pressure on interest rates. This was however offset by lower interest expenses which
decreased by EUR 45 million to EUR 96.1 million as a result of optimalization of the volume of deposits and
the decrease of deposit interest rates.
‐5,0 1,7
118,4 140,4
169,2 166,9
‐2,3 282,6
22,0 6,7 309,0
‐50,0
50,0
150,0
250,0
350,0
450,0
Net interestincome 2016
J&T BANKA Poštová banka JTFG SE and Other Net interestincome 2017
IN EUR M
ILLION
Net interest income 2017 vs 2016
JTFG SE and Other J&T BANKA Poštová banka
2,8 2,0
36,3 40,1
36,7 38,5
‐0,8 75,8
3,8 1,8 80,6
(10,0)
10,0
30,0
50,0
70,0
90,0
Net fee income2016
J&T BANKA Poštová banka JTFG SE and Other Net fee income2017
IN EUR M
ILLION
Net fee income 2017 vs 2016
JTFG SE and Other J&T BANKA Poštová banka
Net fee income of the Group increased by EUR 4.8 million. The growth is fully attributable to fee and
commission income (increase by EUR 6.5 million) which was partially offset by increased fee and
commission expenses (increase by EUR 1.8 million) resulting in a net fee income of EUR 80.6 million
compared to EUR 75.8 million in 2016. The key driver for the fee income was asset management income
which increased by EUR 6.2 million compared to prior year.
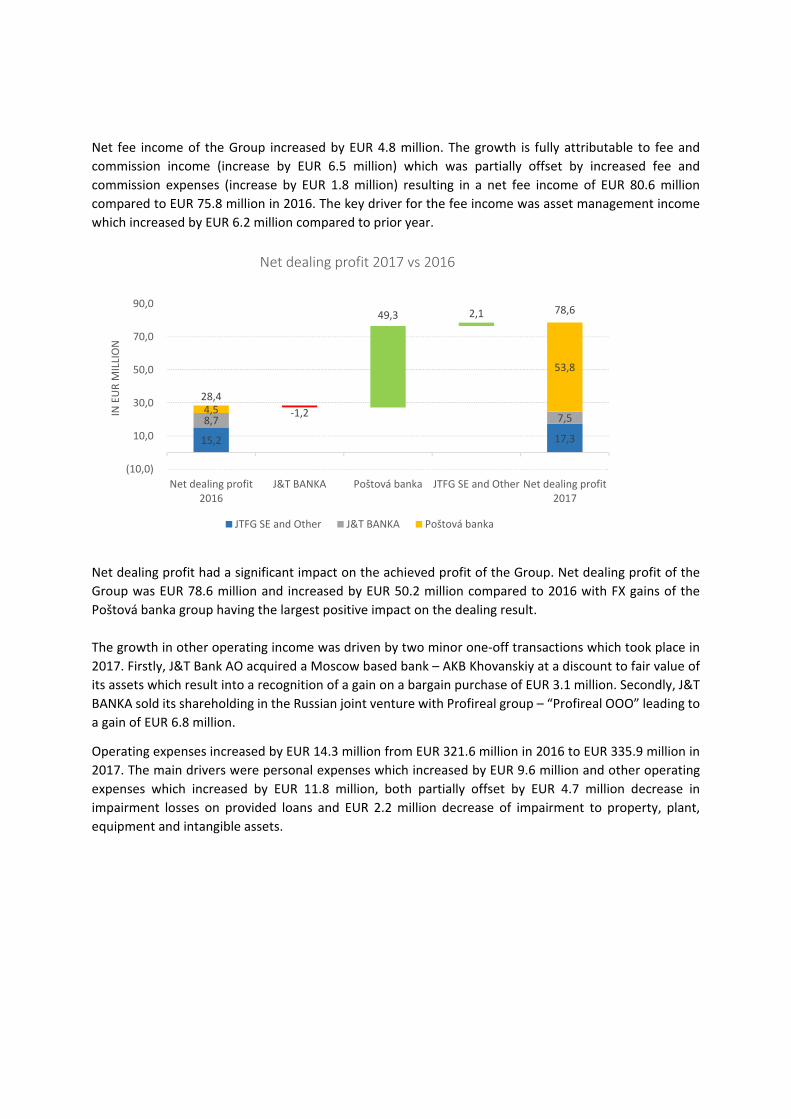
Net dealing profit had a significant impact on the achieved profit of the Group. Net dealing profit of the
Group was EUR 78.6 million and increased by EUR 50.2 million compared to 2016 with FX gains of the
Poštová banka group having the largest positive impact on the dealing result.
The growth in other operating income was driven by two minor one‐off transactions which took place in
2017. Firstly, J&T Bank AO acquired a Moscow based bank – AKB Khovanskiy at a discount to fair value of
its assets which result into a recognition of a gain on a bargain purchase of EUR 3.1 million. Secondly, J&T
BANKA sold its shareholding in the Russian joint venture with Profireal group – “Profireal OOO” leading to
a gain of EUR 6.8 million.
Operating expenses increased by EUR 14.3 million from EUR 321.6 million in 2016 to EUR 335.9 million in
2017. The main drivers were personal expenses which increased by EUR 9.6 million and other operating
expenses which increased by EUR 11.8 million, both partially offset by EUR 4.7 million decrease in
impairment losses on provided loans and EUR 2.2 million decrease of impairment to property, plant,
equipment and intangible assets.
15,2 17,3
8,7 7,5 4,5
53,8
‐1,2
28,4
49,3 2,1 78,6
(10,0)
10,0
30,0
50,0
70,0
90,0
Net dealing profit2016
J&T BANKA Poštová banka JTFG SE and Other Net dealing profit2017
IN EUR M
ILLION
Net dealing profit 2017 vs 2016
JTFG SE and Other J&T BANKA Poštová banka

The equity of the Group at the end of 2017 amounted to EUR 1,648.6 million. This represents an increase
by 160.4 million compared to 2016. The increase was driven by EUR 137.5 million of net profit, additional
other comprehensive income of EUR 18.7 million, increase in non‐controlling interest by EUR 26.4 million
and distributions of interest from unsecured subordinated certificates from other capital funds resulting
in a decrease of EUR 25.1 million. Other non‐significant transactions with impact on the Group’s equity
represent EUR 2.9 million.
98,0 53,9
3 806,5 3 555,1
3 572,4 3 578,7
‐251,4 ‐44,1
7 476,9 6,3 7 187,7
1 000,0
2 000,0
3 000,0
4 000,0
5 000,0
6 000,0
7 000,0
8 000,0
9 000,0
Loans and depositsfrom customers
2016
J&T BANKA Poštová banka JTFG SE and other Loans and depositsfrom customers
2017
IN EUR M
ILLION
Deposits and loans from customers 2017 vs 2016
JTFG SE and other J&T BANKA Poštová banka
‐ 25,1
1 488,2 137,5 18,7 2,9 26,4 1 648,6
500
700
900
1100
1300
1500
1700
1900
Total equity2016
Perpetuityinterest payout
Profit for theyear 2017
Othercomprehensive
income
Othermovements in
equity
Non‐controllinginterest
Total equity2017
IN EUR M
ILLION
Total equity development 2017 vs 2016
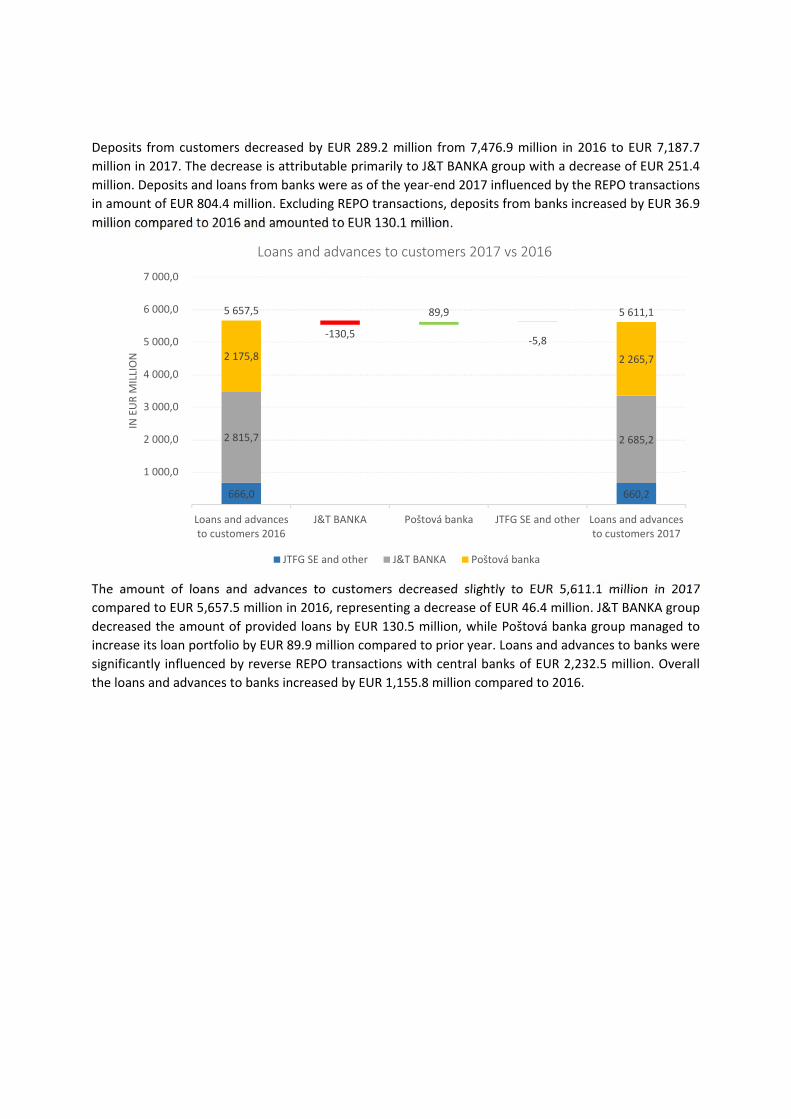
Deposits from customers decreased by EUR 289.2 million from 7,476.9 million in 2016 to EUR 7,187.7
million in 2017. The decrease is attributable primarily to J&T BANKA group with a decrease of EUR 251.4
million. Deposits and loans from banks were as of the year‐end 2017 influenced by the REPO transactions
in amount of EUR 804.4 million. Excluding REPO transactions, deposits from banks increased by EUR 36.9
million compared to 2016 and amounted to EUR 130.1 million.
The amount of loans and advances to customers decreased slightly to EUR 5,611.1 million in 2017
compared to EUR 5,657.5 million in 2016, representing a decrease of EUR 46.4 million. J&T BANKA group
decreased the amount of provided loans by EUR 130.5 million, while Poštová banka group managed to
increase its loan portfolio by EUR 89.9 million compared to prior year. Loans and advances to banks were
significantly influenced by reverse REPO transactions with central banks of EUR 2,232.5 million. Overall
the loans and advances to banks increased by EUR 1,155.8 million compared to 2016.
666,0 660,2
2 815,7 2 685,2
2 175,8 2 265,7
‐130,5 ‐5,8
5 657,5 89,9 5 611,1
1 000,0
2 000,0
3 000,0
4 000,0
5 000,0
6 000,0
7 000,0
Loans and advancesto customers 2016
J&T BANKA Poštová banka JTFG SE and other Loans and advancesto customers 2017
IN EUR M
ILLION
Loans and advances to customers 2017 vs 2016
JTFG SE and other J&T BANKA Poštová banka
Balance sheet figures of J&T Banka group were recalculated from CZK to EUR using the Czech National Bank exchange rate as at 31 December 2017 of 25.54 CZK/EUR and income statement figures were recalculated by the average rate for 2017 of 26.330 CZK/EUR.
Results and events of J&T BANKA group
J&T BANKA group achieved a consolidated profit of EUR 83.4 million, which represents an increase by EUR
47.2 million compared to prior year profit of EUR 36.2 million, with total assets of EUR 4,836.3 million. The
profit was driven by higher net interest income (EUR 19.2 million), trading income (EUR 14.5 million) and
lower impairment of loans (EUR 10.6 million). The total equity of J&T BANKA group increased by EUR 13.6
million to EUR 762.6 million (mainly as the result of the current year profit, paid out return on perpetuity
certificates and paid‐out dividend to JTFG SE) and the total capital adequacy ratio of J&T BANKA increased
from 17.75% in 2016 to 18.45% in 2017.
The increase of EUR 19.2 million in net interest income was achieved mainly by the decrease in total
volume of deposits from customers (EUR 444.4 million decrease compared to 2016) which resulted into a
lower interest expense of EUR 50 million compared to EUR 83.5 million in 2016. The positive impact was
partially offset by lower interest income (also a result of decrease in loans provided to customers by EUR
275.3 million) of EUR 191.5 million compared to EUR 205.8 million in 2016.
Net fee income slightly improved by EUR 3.8 million from EUR 39.4 million in 2016 to EUR 43.2 million in
2017. Transactions with securities and derivatives represent the majority of the net fee income and have
improved by EUR 4.4 million year on year. Most of the income is attributable to fees for new bond
emissions and promissory note programs. The bank issued seven new bond emissions in 2017 in the total
volume of EUR 624 million. The bank managed to attract EUR 256 million of new client investments into
funds managed by J&T INVESTIČNÍ SPOLEČNOST which was also caused by the decline in the interest rates
on deposits offered by J&T BANKA.
Operating expenses slightly increased (by EUR 2.9 million), but the J&T BANKA group managed to decrease
its consolidated cost‐to‐income ratio from 47.8% in 2016 to 40.8% in 2017 being below the Czech market
average. The significant increase in operating income was not followed by an increase in expenses, thus
improving the ratio.
During 2017, J&T BANKA group continued to improve the quality of its loan portfolio and managed to
decrease its risk costs related to non‐performing loans by EUR 10.6 million from EUR 39.6 million in 2016
to EUR 29 million in 2017.
Results and events of Poštová banka group
Poštová banka group managed to finish the year 2017 with a consolidated net profit of EUR 47.9 million,
just EUR 0.7 million less compared to 2016. During 2017, Poštová banka continuted to focus on retail
banking which helped to drive the total assets of Poštová banka group to EUR 4,339.8 million in 2017 from
EUR 4,261.5 million in 2016.
Similarly to J&T Banka group, Poštová banka group managed to decrease its interest expense by EUR 11.8
million. Despite this improvement, the net interest income decreased by EUR 4.4 million, as interest
income decreased by EUR 16.2 million year on year. This was mainly due to income from debt securities
which fell down compared to 2016 by EUR 8.1 million.
Poštová banka group managed to compensate the shortfall in interest income by the higher net trading
result which was driven by exchange rate gains. Most of the gains resulted from funds denominated in
Czech crowns after the termination of interventions to the CZK/EUR exchange rate.
Operating expenses increased significantly compared to 2016 by EUR 14.6 million. Most of the additional
costs relate to the general rebranding and remodeling of Poštová banka and implementation of new
technologies in the group. Main drivers were marketing costs, new premises and personnel assigned to
new product lines.
Besides trading profits, Poštová banka group further managed to decrease its risk costs due to improved
credit quality of its loan portfolio by EUR 6.9 million to EUR 43.8 million (compared to EUR 50.7 million in
2016).
2017 was also successful for PRVÁ PENZIJNÁ SPRÁVCOVSKÁ SPOLOČNOSŤ which achieved a profit of EUR
6.9 million representing an increase by EUR 1.2 million. Total assets under management in funds managed
by PPSS were 1,139.5 million. Poštová poisťovna increased its performance and achieved a historic profit
of EUR 2.5 million, up by EUR 0.5 million from 2016.

Where are we heading
We intend to continue in step by step development of individual segments and activies of the Group.
Currently, we do not plan with any significant acquisitions or disposals and we rather focus on a gradual
improvement of services offered by existing Group companies. As in the previous years, the strategy of
the Group is built around its key subsidiaries ‐ J&T BANKA,and Poštová banka.
J&T BANKA
J&T BANKA is the leading private bank on the Czech and Slovak markets. It strives to provide highest quality
services and investment opportunities for its clients. The bank has succeeded to attract more investments
into investment funds as well as through placement of new bond emissions. Total assets managed by
investment funds under J&T INVESTIČNÍ SPOLEČNOST, a. s. have grown by 43% (EUR 260 million) in 2017
and the bank placed on the market seven bond emissions in total value exceeding EUR 624 million.
The plan for 2018 is to prepare a new information system model aiming to improve an understanding of
clients’ needs and to enable structuring of clients’ portfolios accordingly. The bank will also introduce new
investment advisory services and advisory for asset and life insurance to facilitate its clients a better
understanding of the market opportunities and to provide a complex view on clients’ assets.
The bank plans to increase its reach to Central and Eastern European countries through its subsidiaries in
Croatia and Russia that provide further opportunities for the Group’s growth. In Croatia, J&T BANKA d.d.
(renamed from VABA d.d. banka Varaždin) has been transformed into a predominantly corporate bank
and expands its corporate banking portfolio mainly into tourism and leisure. In Russia, J&T BANK AO has
acquired the local Khovanskiy bank to broaden its reach and scale on the Russian market.
Poštová banka
Poštová banka continued with its transformation into a new, modern look with full implementation of a
new corporate identity including logos, branch network and communication channels. All of these changes
aim at better addressing the needs of its retail clients who demand a more flexible and dynamic
relationship with their bank. Besides its retail portfolio, Poštová banka was also active in the field of SME
clients and introduced a range of deposit and loan products for this segment together with building a new
infrastructure in order to service them.
The key focus of Poštová banka for the year 2018 lies in digitalisation, innovations, cross‐selling and
building of a strong brand which will provide a complex experience for all types of clients including retail,
Micros, SME and Corporate.
Entry of CEFC into JTFG
In March 2018, CEFC has withdrawn its applications for the capital increase in JTFG from CNB. In May 2018
Rainbow Wisdom Investment Limited, a member of the CITIC Group, took over the shareholding of CEFC
in JTFG. JTFG and CITIC Group will engage in negotiations about further and deeper cooperation between
both groups.

J&T FINANCE GROUP SE
Consolidated Financial Statements
Year ended 31 December 2017

J&T FINANCE GROUP SE
1
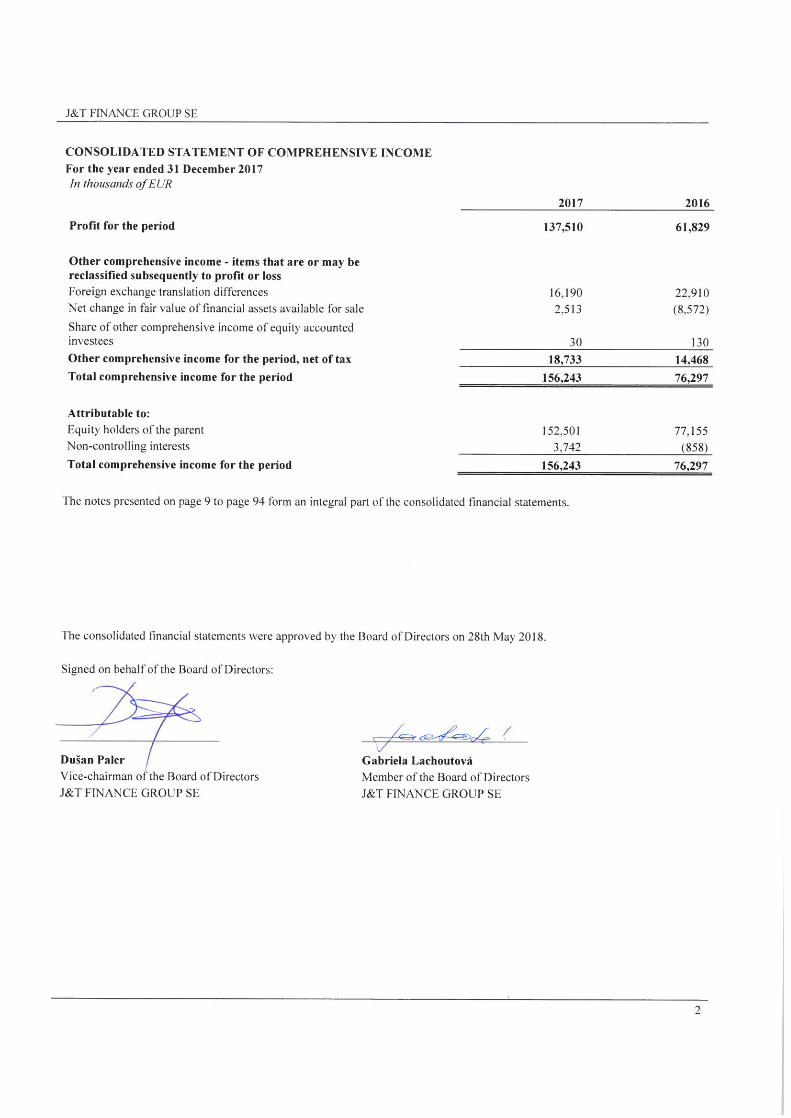
CONSOLIDATED INCOME STATEMENT
For the year ended 31 December 2017
In thousands of EUR
Note
2017 2016
Interest income 6
405,054 423,678
Interest expense 6
(96,097) (141,107)
Net interest income
308,957 282,571
Fee and commission income 7
115,437 108,908
Fee and commission expense 7
(34,822) (33,063)
Net fee and commission income
80,615 75,845
Net dealing profit 8
78,640 28,474
Total revenues
468,212 386,890
Gain on a bargain purchase 5.1 3,197 -
Other operating income 9
38,391 32,914
Total income
509,800 419,804
Personnel expenses 10
(100,572) (90,960)
Depreciation and amortisation 27, 28
(28,263) (28,363)
Goodwill impairment 27
(5) -
Impairment of property, plant and equipment and intangible assets 27, 28
(280) (2,536)
Net impairment losses on loans 22
(84,563) (89,308)
Other operating expenses 11
(122,168) (110,415)
Total expenses
(335,851) (321,582)
Profit from operations
173,949 98,222
Loss from equity accounted investees
(661) (1,844)
Profit before tax
173,288 96,378
Income tax expense 12
(35,778) (34,549)
Profit for the period
137,510 61,829
Attributable to:
Equity holders of the parent
136,170 62,701
Non-controlling interests
1,340 (872)
Profit for the period
137,510 61,829
The notes presented on page 9 to page 94 form an integral part of the consolidated financial statements.

J&T FINANCE GROUP SE
3
CONSOLIDATED STATEMENT OF FINANCIAL POSITION
As at 31 December 2017
In thousands of EUR
Note 31 December 2017 31 December 2016
ASSETS
Cash and cash balances at central banks 13 560,766 1,232,940
Financial assets for trading 14 268,763 184,717
Hedging derivatives 15 317 3
Investment securities measured at fair value through profit or loss 16 10,877 4,525
Investment securities available for sale 17 1,021,178 1,277,400
Investment securities held to maturity 18 305,388 405,372
Disposal group held for sale 19 17,078 8,145
Loans and advances to banks 20 2,396,824 906,402
Loans and advances to customers 21, 22 5,611,146 5,657,515
Trade receivables and other assets 24 176,282 179,783
Current tax assets 4,399 4,870
Investments in equity accounted investees 25 399 1,024
Investment property 26 149,194 7,656
Intangible assets 27 129,211 132,246
Property, plant and equipment 28 139,245 43,951
Deferred tax assets 35 9,213 5,477
Total assets 10,800,280 10,052,026
LIABILITIES
Trading liabilities 14 26,878 10,156
Hedging derivatives 15 3,738 5,406
Deposits and loans from banks 29 934,519 93,152
Deposits and loans from customers 30 7,187,678 7,476,864
Debt securities issued 31 543,925 596,774
Subordinated debt 32 57,967 56,402
Other liabilities 33 357,776 284,630
Current tax liability 5,099 5,934
Provisions 34 22,812 23,564
Deferred tax liabilities 35 11,268 10,909
Total liabilities 9,151,660 8,563,791
EQUITY
Share capital 574,138 574,138
Share premium 93,577 93,577
Retained earnings and other reserves 907,683 777,391
Equity attributable to equity holders of the parent 36 1,575,398 1,445,106
Non-controlling interests 37 73,222 43,129
Total equity 1,648,620 1,488,235
Total equity and liabilities 10,800,280 10,052,026
The notes presented on page 9 to page 94 form an integral part of the consolidated financial statements.

J&T FINANCE GROUP SE
4
CONSOLIDATED STATEMENT OF CHANGES IN EQUITY
For the year ended 31 December 2017
In thousands of EUR Note
Share
capital
Share
premium
Non-
distributable
reserves
Translation
reserve
Other
reserves
and funds
Retained
earnings
Equity
attributable
to equity
holders of the
parent
Non-
controlling
interests
Total
equity
Balance at 1 January 2017
574,138 93,577 23,472 (49,441) 307,961 495,399 1,445,106 43,129 1,488,235
Profit for the period
- - - - - 136,170 136,170 1,340 137,510
Other comprehensive income for the period, net of
tax - items that are or may be reclassified
subsequently to profit or loss
- - - 13,815 2,516 - 16,331 2,402 18,733
Foreign exchange translation differences
- - - 13,785 - - 13,785 2,405 16,190
Net change in fair value of financial assets
available for sale
- - - - 2,516 - 2,516 (3) 2,513
Share of other comprehensive income of equity
accounted investees - - - 30 - - 30 - 30
Total comprehensive income for the period
- - - 13,815 2,516 136,170 152,501 3,742 156,243
Distribution to shareholders
Dividends
- - - - - - - (553) (553)
Acquisition and establishment of subsidiaries with
non-controlling interests - - - (310) - - 310 7,692 8,002
Change in non-controlling interests without a change
in control 37
- - (56) 975 - 621 1,540 19,224 20,764
Total transaction with owners of the Company,
recognised directly in equity
- - (56) 1,285 - 621 1,850 26,363 28,213
Effect of disposals of subsidiaries 5.2
- - - 1,084 - - 1,084 (12) 1,072
Distributions related to other capital instruments 36
- - - - - (25,143) (25,143) - (25,143)
Transfer to legal reserve fund 36
- - 5,089 - 51 (5,140) - - -
Balance at 31 December 2017
574,138 93,577 28,505 (33,257) 310,528 601,907 1,575,398 73,222 1,648,620
See Note 36. Shareholders’ equity and Note 37. Non-controlling interests
J&T FINANCE GROUP SE
5
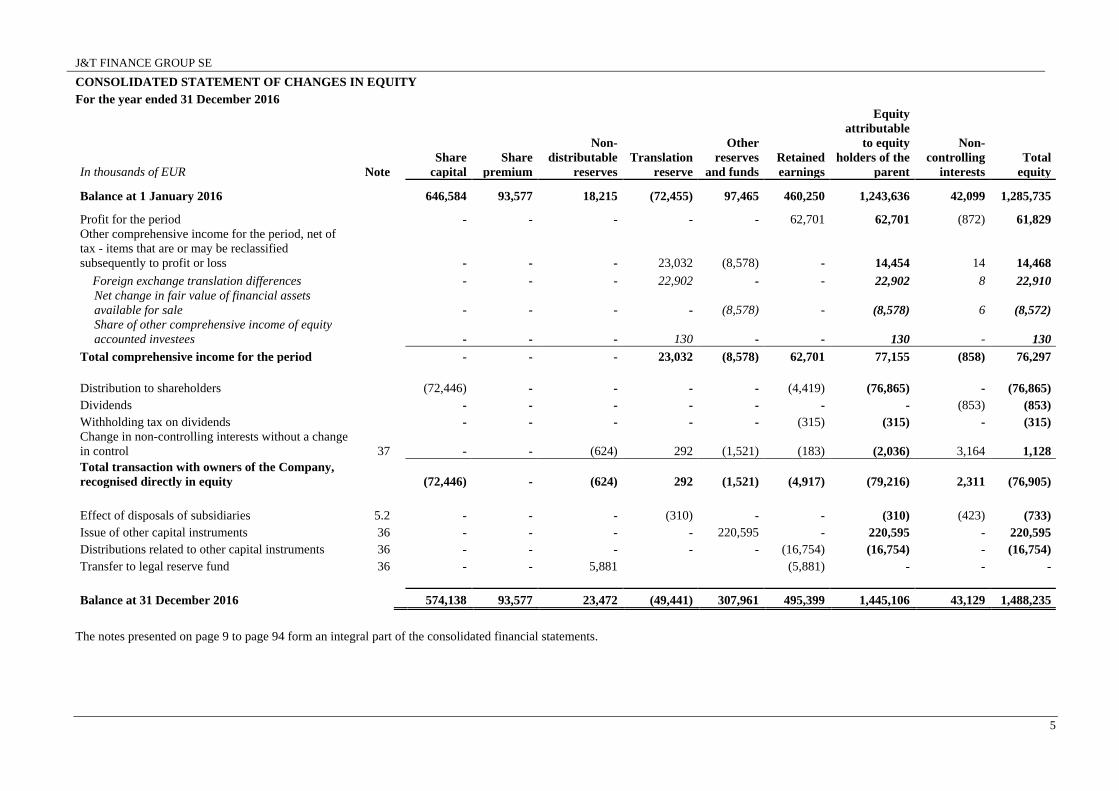
CONSOLIDATED STATEMENT OF CHANGES IN EQUITY
For the year ended 31 December 2016
In thousands of EUR Note
Share
capital
Share
premium
Non-
distributable
reserves
Translation
reserve
Other
reserves
and funds
Retained
earnings
Equity
attributable
to equity
holders of the
parent
Non-
controlling
interests
Total
equity
Balance at 1 January 2016
646,584 93,577 18,215 (72,455) 97,465 460,250 1,243,636 42,099 1,285,735
Profit for the period
- - - - - 62,701 62,701 (872) 61,829
Other comprehensive income for the period, net of
tax - items that are or may be reclassified
subsequently to profit or loss
- - - 23,032 (8,578) - 14,454 14 14,468
Foreign exchange translation differences
- - - 22,902 - - 22,902 8 22,910
Net change in fair value of financial assets
available for sale
- - - - (8,578) - (8,578) 6 (8,572)
Share of other comprehensive income of equity
accounted investees - - - 130 - - 130 - 130
Total comprehensive income for the period
- - - 23,032 (8,578) 62,701 77,155 (858) 76,297
Distribution to shareholders (72,446) - - - - (4,419) (76,865) - (76,865)
Dividends
- - - - - - - (853) (853)
Withholding tax on dividends - - - - - (315) (315) - (315)
Change in non-controlling interests without a change
in control 37
- - (624) 292 (1,521) (183) (2,036) 3,164 1,128
Total transaction with owners of the Company,
recognised directly in equity
(72,446) - (624) 292 (1,521) (4,917) (79,216) 2,311 (76,905)
Effect of disposals of subsidiaries 5.2
- - - (310) - - (310) (423) (733)
Issue of other capital instruments 36
- - - - 220,595 - 220,595 - 220,595
Distributions related to other capital instruments 36
- - - - - (16,754) (16,754) - (16,754)
Transfer to legal reserve fund 36
- - 5,881 (5,881) - - -
Balance at 31 December 2016
574,138 93,577 23,472 (49,441) 307,961 495,399 1,445,106 43,129 1,488,235
The notes presented on page 9 to page 94 form an integral part of the consolidated financial statements.

J&T FINANCE GROUP SE
Notes to the consolidated financial statements
for the year ended 31 December 2017
6
CONSOLIDATED STATEMENT OF CASH FLOWS
For the year ended 31 December 2017
In thousands of EUR
Note
2017 2016
OPERATING ACTIVITIES
Profit before tax
173,288 96,378
Adjustments for:
Depreciation and amortisation 27, 28
28,263 28,363
Impairment losses of property, plant and equipment and intangible assets 27, 28
280 2,536
(Gain) from revaluation from gold bar
- (149)
(Gain) / Loss on disposal of property, plant and equipment,intangible
assets and investment property
184 (283)
Amortisation of deferred acquisition costs for insurance and clients'
contracts
1,797 2,006
(Profit) / loss on disposal of subsidiaries and non-controlling interests 9, 11
- (477)
(Profit) on disposal of investment securities available for sale
(10,903) (26,327)
Net interest income 6
(308,957) (282,571)
Dividends income 8
(5,426) (10,965)
Increase in allowance for impairment of loans 22
84,563 89,308
Change in impairment of trade receivables and other assets 11
14,026 4,956
(Profit) / loss from equity accounted investees
661 1,844
Changes in provisions 34
(228) 12,566
(Gain) on a bargain purchase, Goodwill impairment 5.1, 27
(3,192) -
Unrealised foreign exchange (gains) / losses, net
(9,345) 15,575
Operating loss before changes in working capital
(34,989) (67,240)
(Increase) / decrease in operating assets
Change in financial assets for trading (79,454) (50,169)
Change in hedging derivative assets (308) 1,337
Change in investment securities at fair value through profit or loss (6,771) (367)
Change in loans and advances to customers and banks
16,291 (333,203)
Change in trade receivables and other assets
12,443 8,370
Increase / (decrease) in operating liabilities
Change in trading liabilities
16,038 (4,339)
Change in hedging derivative liabilities (1,677) 5,064
Change in deposits and loans from banks and customers
444,788 (778,871)
Change in other liabilities
55,131 15,746
Cash generated from (used in) operations
421,492 (1,203,672)
Interest received
386,606 398,609
Interest paid
(99,488) (141,657)
Income taxes paid
(36,569) (29,128)
Cash flows generated from (used in) operating activities
672,041 (975,848)
J&T FINANCE GROUP SE
Notes to the consolidated financial statements
for the year ended 31 December 2017
7
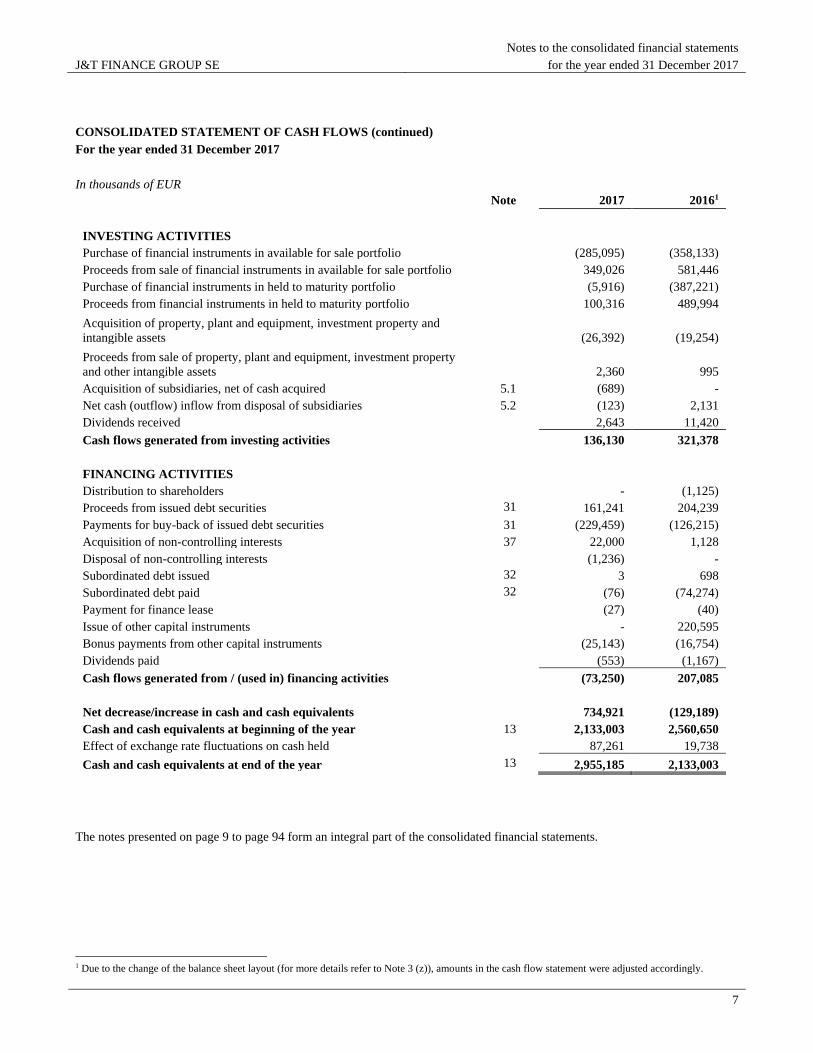
CONSOLIDATED STATEMENT OF CASH FLOWS (continued)
For the year ended 31 December 2017
In thousands of EUR
Note
2017 20161
INVESTING ACTIVITIES
Purchase of financial instruments in available for sale portfolio
(285,095) (358,133)
Proceeds from sale of financial instruments in available for sale portfolio
349,026 581,446
Purchase of financial instruments in held to maturity portfolio
(5,916) (387,221)
Proceeds from financial instruments in held to maturity portfolio
100,316 489,994
Acquisition of property, plant and equipment, investment property and
intangible assets
(26,392) (19,254)
Proceeds from sale of property, plant and equipment, investment property
and other intangible assets
2,360 995
Acquisition of subsidiaries, net of cash acquired 5.1
(689) -
Net cash (outflow) inflow from disposal of subsidiaries 5.2
(123) 2,131
Dividends received
2,643 11,420
Cash flows generated from investing activities
136,130 321,378
FINANCING ACTIVITIES
Distribution to shareholders
- (1,125)
Proceeds from issued debt securities 31
161,241 204,239
Payments for buy-back of issued debt securities 31
(229,459) (126,215)
Acquisition of non-controlling interests 37
22,000 1,128
Disposal of non-controlling interests
(1,236) -
Subordinated debt issued 32
3 698
Subordinated debt paid 32
(76) (74,274)
Payment for finance lease (27) (40)
Issue of other capital instruments
- 220,595
Bonus payments from other capital instruments
(25,143) (16,754)
Dividends paid
(553) (1,167)
Cash flows generated from / (used in) financing activities
(73,250) 207,085
Net decrease/increase in cash and cash equivalents
734,921 (129,189)
Cash and cash equivalents at beginning of the year 13
2,133,003 2,560,650
Effect of exchange rate fluctuations on cash held
87,261 19,738
Cash and cash equivalents at end of the year 13
2,955,185 2,133,003
The notes presented on page 9 to page 94 form an integral part of the consolidated financial statements.
1 Due to the change of the balance sheet layout (for more details refer to Note 3 (z)), amounts in the cash flow statement were adjusted accordingly.
J&T FINANCE GROUP SE
Notes to the consolidated financial statements
for the year ended 31 December 2017
8
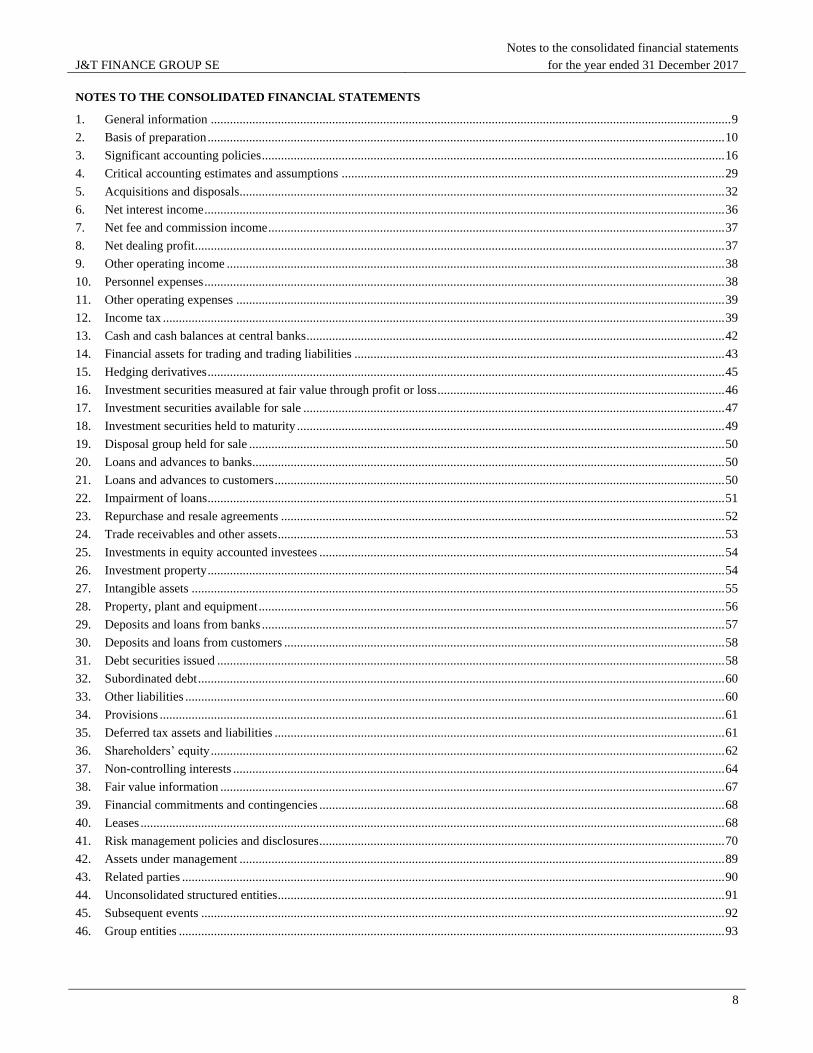
NOTES TO THE CONSOLIDATED FINANCIAL STATEMENTS
1. General information ................................................................................................................................................................... 9 2. Basis of preparation .................................................................................................................................................................. 10 3. Significant accounting policies ................................................................................................................................................. 16 4. Critical accounting estimates and assumptions ........................................................................................................................ 29 5. Acquisitions and disposals........................................................................................................................................................ 32 6. Net interest income ................................................................................................................................................................... 36 7. Net fee and commission income ............................................................................................................................................... 37 8. Net dealing profit ...................................................................................................................................................................... 37 9. Other operating income ............................................................................................................................................................ 38 10. Personnel expenses ................................................................................................................................................................... 38 11. Other operating expenses ......................................................................................................................................................... 39 12. Income tax ................................................................................................................................................................................ 39 13. Cash and cash balances at central banks ................................................................................................................................... 42 14. Financial assets for trading and trading liabilities .................................................................................................................... 43 15. Hedging derivatives .................................................................................................................................................................. 45 16. Investment securities measured at fair value through profit or loss .......................................................................................... 46 17. Investment securities available for sale .................................................................................................................................... 47 18. Investment securities held to maturity ...................................................................................................................................... 49 19. Disposal group held for sale ..................................................................................................................................................... 50 20. Loans and advances to banks .................................................................................................................................................... 50 21. Loans and advances to customers ............................................................................................................................................. 50 22. Impairment of loans .................................................................................................................................................................. 51 23. Repurchase and resale agreements ........................................................................................................................................... 52 24. Trade receivables and other assets ............................................................................................................................................ 53 25. Investments in equity accounted investees ............................................................................................................................... 54 26. Investment property .................................................................................................................................................................. 54 27. Intangible assets ....................................................................................................................................................................... 55 28. Property, plant and equipment .................................................................................................................................................. 56 29. Deposits and loans from banks ................................................................................................................................................. 57 30. Deposits and loans from customers .......................................................................................................................................... 58 31. Debt securities issued ............................................................................................................................................................... 58 32. Subordinated debt ..................................................................................................................................................................... 60 33. Other liabilities ......................................................................................................................................................................... 60 34. Provisions ................................................................................................................................................................................. 61 35. Deferred tax assets and liabilities ............................................................................................................................................. 61 36. Shareholders’ equity ................................................................................................................................................................. 62 37. Non-controlling interests .......................................................................................................................................................... 64 38. Fair value information .............................................................................................................................................................. 67 39. Financial commitments and contingencies ............................................................................................................................... 68 40. Leases ....................................................................................................................................................................................... 68 41. Risk management policies and disclosures ............................................................................................................................... 70 42. Assets under management ........................................................................................................................................................ 89 43. Related parties .......................................................................................................................................................................... 90 44. Unconsolidated structured entities ............................................................................................................................................ 91 45. Subsequent events .................................................................................................................................................................... 92 46. Group entities ........................................................................................................................................................................... 93
J&T FINANCE GROUP SE
Notes to the consolidated financial statements
for the year ended 31 December 2017
9
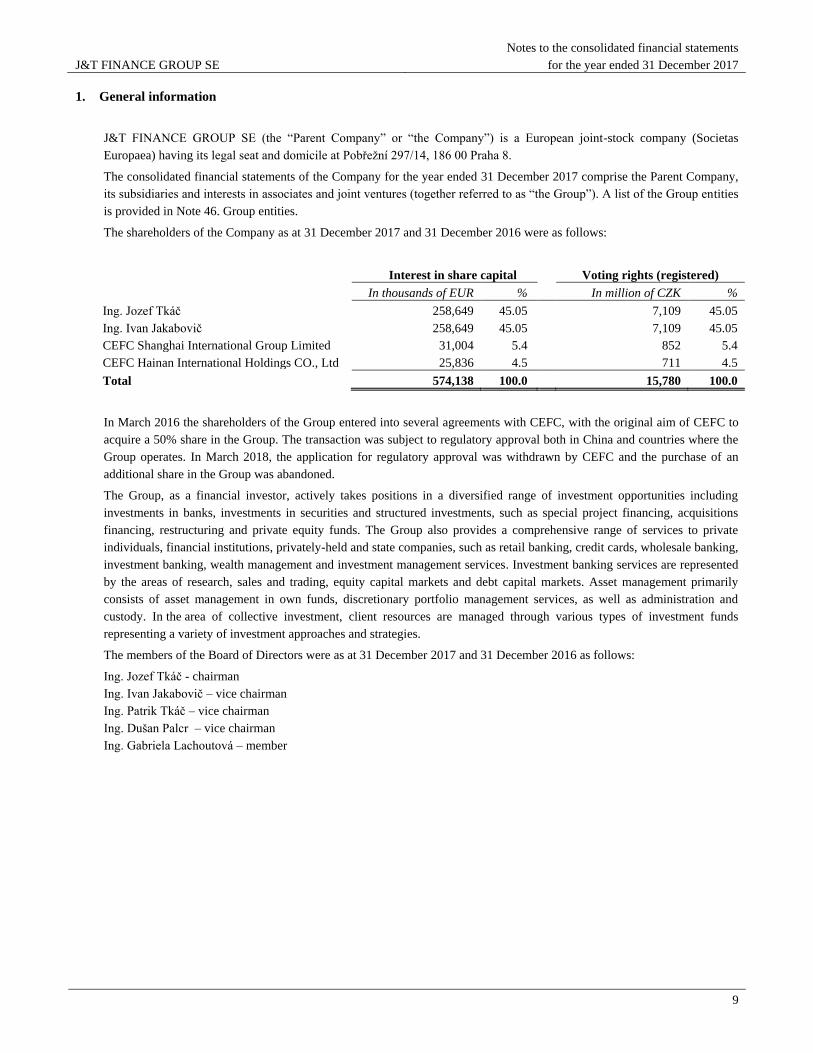
1. General information
J&T FINANCE GROUP SE (the “Parent Company” or “the Company”) is a European joint-stock company (Societas
Europaea) having its legal seat and domicile at Pobřežní 297/14, 186 00 Praha 8.
The consolidated financial statements of the Company for the year ended 31 December 2017 comprise the Parent Company,
its subsidiaries and interests in associates and joint ventures (together referred to as “the Group”). A list of the Group entities
is provided in Note 46. Group entities.
The shareholders of the Company as at 31 December 2017 and 31 December 2016 were as follows:
Interest in share capital Voting rights (registered)
In thousands of EUR % In million of CZK %
Ing. Jozef Tkáč 258,649 45.05 7,109 45.05
Ing. Ivan Jakabovič 258,649 45.05 7,109 45.05
CEFC Shanghai International Group Limited 31,004 5.4 852 5.4
CEFC Hainan International Holdings CO., Ltd 25,836 4.5 711 4.5
Total 574,138 100.0 15,780 100.0
In March 2016 the shareholders of the Group entered into several agreements with CEFC, with the original aim of CEFC to
acquire a 50% share in the Group. The transaction was subject to regulatory approval both in China and countries where the
Group operates. In March 2018, the application for regulatory approval was withdrawn by CEFC and the purchase of an
additional share in the Group was abandoned.
The Group, as a financial investor, actively takes positions in a diversified range of investment opportunities including
investments in banks, investments in securities and structured investments, such as special project financing, acquisitions
financing, restructuring and private equity funds. The Group also provides a comprehensive range of services to private
individuals, financial institutions, privately-held and state companies, such as retail banking, credit cards, wholesale banking,
investment banking, wealth management and investment management services. Investment banking services are represented
by the areas of research, sales and trading, equity capital markets and debt capital markets. Asset management primarily
consists of asset management in own funds, discretionary portfolio management services, as well as administration and
custody. In the area of collective investment, client resources are managed through various types of investment funds
representing a variety of investment approaches and strategies.
The members of the Board of Directors were as at 31 December 2017 and 31 December 2016 as follows:
Ing. Jozef Tkáč - chairman
Ing. Ivan Jakabovič – vice chairman
Ing. Patrik Tkáč – vice chairman
Ing. Dušan Palcr – vice chairman
Ing. Gabriela Lachoutová – member
J&T FINANCE GROUP SE
Notes to the consolidated financial statements
for the year ended 31 December 2017
10
2. Basis of preparation
(a) Statement of compliance
The consolidated financial statements have been prepared in accordance with International Financial Reporting Standards
(“IFRS”) issued by the International Accounting Standards Board (“IASB”), as adopted by the European Union (“EU”).
The consolidated financial statements were approved by the Board of Directors on 28th May 2018.
(b) Basis of preparation
The consolidated financial statements have been prepared under the historical cost convention, except for investment
property, derivative financial instruments, financial assets and liabilities at fair value through profit or loss and investment
securities available for sale, which are at fair value.
The consolidated financial statements are presented in Euro, rounded to the nearest thousand. The accounting policies have
been consistently applied by the Group enterprises and are consistent with those used in the previous year.
Financial statements prepared in compliance with International Financial Reporting Standards require various judgements,
assumptions, and estimates to be exercised that affect the reported amounts of assets, liabilities, income and expenses. Actual
results will likely differ from these estimates. Critical accounting estimates and judgements made by management with
a significant risk of material adjustment in the next year are discussed in Note 4. Critical accounting estimates and
assumptions.
The estimates and underlying assumptions are reviewed on an ongoing basis. Revisions to accounting estimates are
recognised in the period in which the estimate is revised, if the revision affects only that period, or in the period of revision
and future periods, if the revision affects both current and future periods.
The following standards, amendments to standards and interpretations are effective for the first time for the year
ended 31 December 2017, and have been applied in preparing the Group’s consolidated financial statements.
Amendments to IAS 12: Recognition of Deferred Tax Assets for Unrealised Losses (effective for annual periods beginning
on or after 1 January 2017). The amendments mainly clarify that unrealized losses on debt instruments measured at fair
value in the financial statements but at cost for tax purposes can give rise to deductible temporary differences.
Furthermore, the carrying amount of an asset does not limit the estimation of probable future profits.
Amendments to IAS 7: Disclosure Initiative (effective for annual periods beginning on or after 1 January 2017). These
amendments to IAS 7 Statement of Cash Flows require a disclosure of changes in liabilities arising from financing
activities, including both changes arising from cash flows and non-cash changes.
These amendments did not have any material impact on the Group’s consolidated financial statements.
Issued and effective International Financial Reporting Standards
A number of new standards, amendments to standards and interpretations were adopted by the EU for annual reports
beginning after 1 January 2018 and later:
IFRS 9:– Financial Instruments (effective for annual reports beginning on or after 1 January 2018; to be applied
retrospectively) originally issued in November 2009 introduces new requirements for the classification and measurement of
financial assets. IFRS 9 amended in October 2010 includes new requirements for the classification and measurement of
financial liabilities and for derecognition and amendments from November 2013 include new hedge accounting model. The
final version of the standard was issued in July 2014.
Classification – Financial assets
IFRS 9 contains a new classification and measurement approach for financial assets that reflects the business model in
which assets are managed and their cash flow characteristics.
IFRS 9 contains three principal classification categories for financial assets: measured at amortised cost (AC), fair value
through other comprehensive income (FVOCI) and fair value through profit or loss (FVTPL). The standard replaces the
existing IAS 39 categories of held to maturity, loans and receivables and available for sale.
J&T FINANCE GROUP SE
Notes to the consolidated financial statements
for the year ended 31 December 2017
11
The business model reflects how the Group manages the assets in order to generate cash flows. That is, whether the
Group’s objective is solely to collect the contractual cash flows from the assets or to collect both the contractual cash
flows and cash flows arising from the sale of assets. If neither of these is applicable, then the financial assets are
classified as part of the “other” business model and measured at FVTPL. Factors considered by the Group in determining
the business model for a group of assets include past experience on how the cash flows for these assets were collected,
how the asset’s performance is evaluated and reported to key management personnel, how risks are assessed and
managed and how managers are compensated.
Where the business model is to hold assets to collect contractual cash flows or to collect contractual cash flows and sell,
the Group assesses whether the financial instruments’ cash flows represent solely payments of principal and interest (the
SPPI test). In making this assessment, the Group considers whether the contractual cash flows are consistent with a basic
lending arrangement, i.e. interest includes only consideration for the time value of money, credit risk, other basic lending
risks and a profit margin that is consistent with a basic lending arrangement. Where the contractual terms introduce
exposure to risk or volatility that are inconsistent with a basic lending arrangement, the related financial asset is classified
and measured at fair value through profit and loss. Financial assets that are held for collection of contractual cash flows,
where the SPPI test criteria are met, are measured at amortized cost. Financial assets that are held both for collection of
contractual cash flows and for selling the assets, where the assets’cash flows represent solely payment of principal and
interest are measured at FVOCI.
The vast majority of the loan portfolio meets conditions of the above SPPI test and will thus be classified as AC, i.e. it
will be recognized practically unchanged from the current reporting under IAS 39.
Under IFRS 9, derivatives embedded in contracts where the host is a financial asset in the scope of the standard are never
bifurcated. Instead, the hybrid financial instrument as a whole is assessed for classification.Financial assets acquired for
trading purposes and measured at FVTPL remain classified as business model “Trading” and measured at FVTPL.
Financial assets available for sale under IAS 39 were analysed in detail and debt instruments that passed SPPI test and
also shares will be classified and measured as FVOCI under IFRS 9. Most allotment certificates will be reclassified to
business model FVTPL mandatorily as according to IFRS 9 do not meet relevant criteria for classification as FVOCI.
Impairment – Financial assets and contract assets
IFRS 9 replaces the incurred loss model in IAS 39 with a forward looking expected credit loss (ECL) model. This will
require considerable judgement as to how changes in economic factors affect ECLs, which will be determined on a
probability-weighted basis.
For the purposes of preparing the ECL model, the portfolio of financial assets is divided into segments. Within each
segment, financial assets are classified into three stages (Stage I - III) or into a group of financial assets that are impaired
as at the date of initial recognition – purchased or originated credit impaired assets (POCI). As at the date of initial
recognition, financial assets are classified either into Stage I or POCI. Subsequent reclassification into further stages is
carried out according to the definition of an increase in credit risk (Stage II) or impairment of the relevant asset (Stage
III) since its initial recognition as at the reporting date.
The new impairment model will apply to financial assets measured at amortised cost or FVOCI, except for investments in
equity instruments, and to contract assets.
Under IFRS 9, loss allowances will be measured on either of the following bases:
12-month ECLs. These are ECLs that result from possible default events within 12 months after the reporting date;
and
Lifetime ECLs. These are ECLs that result from all possible default events over the expected life of a financial
instrument.
Lifetime ECL measurement applies if the credit risk of a financial asset at the reporting date has increased significantly
since initial recognition and 12-month ECL measurement applies if it has not. An entity may determine that a financial
asset’s credit risk has not increased significantly if the asset has low credit risk at the reporting date. However, lifetime
ECL measurement always applies for trade receivables and contract assets without a significant financing component; an
entity may choose to apply this policy also for trade receivables and contract assets with a significant financing
component.

J&T FINANCE GROUP SE
Notes to the consolidated financial statements
for the year ended 31 December 2017
12
A significant increase in credit risk ("SICR") represents a significant increase in the default risk of the financial asset at
the reporting date comparing to the risk at initial recognition.
SICR is determined based on the requirements of IFRS 9. These requirements are based on the assumption that credit risk
increases significantly before the financial asset is overdue or other delay indicators (eg restructuring) are observed. The
Group shall assess at each reporting date whether the credit risk associated with the financial asset has increased
significantly or not since initial recognition.
Assessing SICRs for a financial asset from initial recognition is based on all reasonable and demonstrable information
available without incurring unreasonable costs or effort.
Classification – Financial liabilities
IFRS 9 largely retains the existing requirements in IAS 39 for the classification of financial liabilities.
However, under IAS 39 all fair value changes of liabilities designated as at FVTPL are recognised in profit or loss,
whereas under IFRS 9 these fair value changes are generally presented as follows:
the amount of change in the fair value that is attributable to changes in the credit risk of the liability is presented in
OCI; and
the remaining amount of change in the fair value is presented in profit or loss.
The Group’s preliminary assessment did not indicate any material impact if IFRS 9’s requirements regarding the
classification of financial liabilities were applied at 31 December 2017.
Hedge accounting
When an entity first applies IFRS 9, it may choose as its accounting policy to continue to apply the hedge accounting
requirements of IAS 39 instead of the requirements of IFRS 9. The Group decided to apply the hedge accounting
requirements of IAS 39.
Transition
Changes in accounting policies resulting from the adoption of IFRS 9 will generally be applied retrospectively, except as
described below. On the other hand, as further described in section 3 (z), the Group slightly changed the structure of its
financial statements as at 31 December 2017 to better correspond with the expected form of financial statements in 2018.
The Group will take advantage of the exemption allowing it not to restate comparative information for prior periods
with respect to classification and measurement (including impairment) changes. Differences in the carrying amounts
of financial assets and financial liabilities resulting from the adoption of IFRS 9 generally will be recognised in
retained earnings and reserves as at 1 January 2018.
The following assessments were made on the basis of the facts and circumstances that existed at the date of initial
application, as described in subsection “Classification” above:
o The determination of the business model within which a financial asset is held.
o The designation and revocation of previous designations of certain financial assets and financial liabilities as
measured at FVTPL. The designation of certain investments in equity instruments not held for trading as at
FVOCI.
Impact quantification
Based on the expected loss calculation models, the Group quantified the impact of the change from IAS 39 to IFRS 9 to
a total amount of EUR 69,997 thousand. The impact consists of the effect of of ECL for loans at AC in the amount of
EUR 57,307 thousand, off-balance sheet positions of EUR 9,143 thousand and debt instruments at FVOCI of EUR 3,548
thousand.
The difference in business model classification affected the classification of the allotment certificates. Those classified as
available for sale under IAS 39 were reclassified to the model FVTPL. The cumulative revaluation difference of
EUR 16,975 thousand (excluding deferred tax) was transferred to retained earnings as at 1 January 2018.
J&T FINANCE GROUP SE
Notes to the consolidated financial statements
for the year ended 31 December 2017
13
Regulatory impact
At the end of 2017, the European Parliament and the European Council issued Regulation (EU) 2017/2395 amending
Regulation (EU) 575/2013 as regard transitional arrangements for mitigating the impact of the introduction of IFRS 9 on
own funds, risk-weighted exposure and other regulatory items, integrating the CRR with Article 473 “Introduction of
IFRS 9”. As a result of applying IFRS 9 from 1 January 2018, Banks may experience a significant increase in expected
credit loss provisions, resulting in a sudden fall in the CET 1 component of regulatory capital. The new Article allows
Banks to re-introduce in their CET 1 a decreasing quota of the impact of IFRS 9 in a five year transitional period between
2018 and 2022. J&T Finance Group will calculate their expected credit loss provisions in the period between from 1
January 2018 to 31 December 2022 in accordance with Art. 473a, para. 2 of the aforementioned Regulation. During this
transitional period, part of the loss arising from the IFRS 9 first impact will be recovered in the CET 1 capital of the J&T
Finance Group and multiplied by the relevant factor for each year (0.95 - 2018, 0.85 - 2019, 0.7 - 2020, 0, 5 - year 2021;
0.25 - year 2022). At the same time, J&T Finance Group will, for a transitional period of five years, recalculate specific
credit risk adjustments by calculating the scaling factor under Article 473a 7b., leading to an increase in the risk-
weighted exposure amounts.
IFRS 15: Revenue from contracts with customers (effective for annual periods beginning on or after 1 January 2018; to be
applied retrospectively). The new standard substitutes all revenue standards including IAS 18 Revenue and IAS 11
Construction Contracts. The objective of the revenue standard is to provide a single, comprehensive revenue recognition
model for all contracts with customers to improve comparability within industries, across industries, and across capital
markets. The revenue standard contains principles that an entity will apply to determine the measurement of revenue and
the timing of recognition. The underlying principle is that an entity will recognize revenue to depict the transfer of goods or
services to customer at an amount that the entity expects to be entitled to in exchange for those goods and services. Entities
will follow a five-step approach to apply the standard:
- identify the contract(s) with the customer;
- identify the separate performance obligations in the contract;
- determine the transaction price;
- allocate the transaction price to separate performance obligations;
- recognize revenue when (or as) each performance obligation is satisfied.
Revenue from a transaction or event that does not arise from a contract with a customer is not within the scope of the
revenue standard and should continue to be accounted for in accordance with other standards.
The Group applied IFRS 15 for annual period beginning on 1 January 2018 and it did not have any material impact on the
Group.
IFRS 16: Leases (effective for annual periods beginning on or after 1 January 2019). This standard specifies how an IFRS
reporter will recognise, measure and disclose leases. The standard provides a single lessee accounting model, requiring
lessees to recognise assets and liabilities for all leases unless the lease term in 12 months or less or the underlying asset has
a low value. Lessors continue to classify leases as operating or finance, with IFRS´s approach to lessor accounting
substantially unchanged from its predecessor, IAS 17. IFRS 16 was issued in January 2016 and applies to annual reporting
periods beginning on or after 1 January 2019.
Amendments to IFRS 4: Applying IFRS 9 Financial Instruments with IFRS 4 Insurance Contracts (effective for annual
periods beginning on or after 1 January 2018).
Clarifications to IFRS 15: Revenue from Contract with Customers (effective for annual periods beginning on or after 1
January 2018) including amendments to IFRS 15.
Issued but not yet effective International Financial Reporting Standards
A number of new standards, amendments to standards and interpretations are not yet effective or not yet adopted by the EU
for the year ended 31 December 2017, and have not been applied in preparing these financial statements:
J&T FINANCE GROUP SE
Notes to the consolidated financial statements
for the year ended 31 December 2017
14
IFRS 17: Insurance contracts (effective for annual periods beginning on or after 1 January 2021, with earlier adaptation
permitted if both IFRS 15 Revenue from Contracts with Customers and IFRS 9 Financial Instruments have also been
applied; not yet endorsed in the EU) requires insurance liabilities to be measured at a current fulfillment value and provides
a more uniform measurement and presentation approach for all insurance contracts. IFRS 17 supersedes IFRS 4 Insurance
Contracts as of 1 January 2021.
Annual Improvements to IFRSs 2014-2016 (Amendments to IFRS 12 Disclosure of Interests in Other entities effective for
annual periods beginning on or after 1 January 2017, Amendments to IFRS 1 First-time Adoption of IFRSs and IAS 28
Investments in Associates and Joint Ventures effective for annual periods beginning on or after 1 January 2018; not yet
endorsed in the EU) introduce clarifications or minor amendments to these three standards. The Group expects that the
amendments will not have a material impact on the Group’s consolidated financial statements.
Amendments to IFRS 2: Classification and Measurement of Share-based Payment Transactions (effective for annual
periods beginning on or after 1 January 2018; not yet endorsed in the EU) clarify the accounting for cash-settled share-
based payment transactions that include a performance condition, the classification of share-based payment transactions
with net settlement features, and the accounting for modifications of share-based payment transactions from cash-settled to
equity-settled. The Group expects that the amendments will not have a material impact on the Group’s consolidated
financial statements.
Amendments to IAS 40: Transfers to Investment Property (effective for annual periods beginning on or after 1 January
2018; not yet endorsed in the EU) introduce minor amendments to the standard. The Group expects that the amendments
will not have a material impact on the Group’s consolidated financial statements.
IFRIC 22: Foreign Currency Transactions and Advance Consideration (effective for annual periods beginning on or after
1 January 2018; not yet endorsed in the EU) addresses foreign currency transactions or parts of transactions where:
- there is consideration that is denominated or priced in a foreign currency;
- the entity recognizes a prepayment asset or a deferred income liability in respect of that consideration, in
advance of the recognition of the related asset, expense or income; and
- the prepayment asset or deferred income liability is non-monetary.
IFRIC 23: Uncertainty over Income Tax Treatments (effective for annual periods beginning on or after 1 January 2019; not
yet endorsed in the EU) addresses the determination of taxable profit (tax loss), tax bases, unused tax losses, unused tax
credits and tax rates, when there is uncertainty over income tax treatments under IAS 12.
Amendments to IFRS 9: Prepayment Features with Negative Compensation (effective for annual periods beginning on or
after 1 January 2019; not yet endorsed in the EU) clarify how IFRS 9 classifies particular prepayable financial assets and
the accounting for financial liabilities following a modification. The Group expects that the clarifications will not have a
material impact on the Group’s consolidated financial statements.
Amendments to IAS 28: Long-term Interests in Associates and Joint Ventures (effective for annual periods beginning on or
after 1 January 2019; not yet endorsed in the EU) clarify the accounting for financial instruments to long-term interests in
an associate or joint venture that form part of the net investment in the associate or joint venture but to which the equity
method is not applied. The Group expects that the clarifications will not have a material impact on the Group’s
consolidated financial statements.
Annual Improvements to IFRS Standards 2015-2017 Cycle (effective for annual periods beginning on or after 1 January
2019; not yet endorsed in the EU) containing the amendments to the following IFRSs: IFRS 3: Business Combinations
(clarification of remeasurement of previously held intrests in a joint operation upon obtaining control of it) and IFRS 11:
Joint Arrangements (clarification of no remeasurement of previously held interests in a joint operation upon obtaining joint
control of it), IAS 12: Income Taxes (clarification that all income tax consequences of dividends should be recognized in
profit or loss, regardless of how the tax arises), and IAS 23: Borrowing Costs (clarification that if any specific borrowing
remains outstanding after the related asset is ready for its intended use or sale, that borrowing becomes part of the funds
that an entity borrows generally when calculating the capitalisation rate on general borrowings).
The Group expects that the amendments will not have a material impact on the Group’s consolidated financial statements.

J&T FINANCE GROUP SE
Notes to the consolidated financial statements
for the year ended 31 December 2017
15
Other new International Financial Reporting Standards and Interpretations not yet due
The Group has not early adopted any IFRS standards where adoption is not mandatory at the statement of financial position
date. Where transition provisions in adopted IFRS give an entity the choice of whether to apply new standards prospectively
or retrospectively, the Group elects to apply the standards prospectively from the date of transition. Management of the
Group does not expect that these other new standards will have a significant effect on the consolidated financial statements
of the Group.
J&T FINANCE GROUP SE
Notes to the consolidated financial statements
for the year ended 31 December 2017
16
3. Significant accounting policies
(a) Basis of consolidation
(i) Subsidiaries
Subsidiaries are entities controlled by the Group. The Group controls an entity when it is exposed to, or has rights to,
variable returns from its involvement with the entity and has the ability to affect those returns through its power over the
entity. The financial statements of subsidiaries are included in the consolidated financial statements from the date on which
control commences until the date on which control ceases.
(ii) Associates
Associates are those enterprises in which the Group has significant influence, but not control, over the financial and
operating policies. The consolidated financial statements include the Group’s share of the total recognised gains and losses of
associates on an equity accounted basis, from the date that significant influence commences until the date that significant
influence ceases. When the Group’s share of losses exceeds the carrying amount of the associate, the carrying amount is
reduced to nil and recognition of further losses is discontinued, except to the extent that the Group has incurred obligations in
respect of the associate.
(iii) Joint ventures
Joint ventures are arrangements in which the Group has joint control, established by contractual agreement, whereby the
Group has rights to the net assets of the arrangement, rather than rights to its assets and obligations for its liabilities. The
consolidated financial statements include the Group’s share of the total recognised gains and losses of joint ventures on an
equity accounted basis, from the date that joint control commences until the date that joint control ceases.
(iv) Consolidation scope
There are 61 companies included in the consolidation as at 31 December 2017 (2016: 39). All fully consolidated companies
prepared their annual financial statements at 31 December 2017. The companies are listed in Note 46. Group entities and this
list is based on the ownership hierarchy.
(v) Transactions eliminated on consolidation
Intra-group balances and transactions, and any unrealised gains (losses) arising from intra-group transactions, are eliminated
in preparing the consolidated financial statements. Unrealised gains arising from transactions with associates and joint
ventures are eliminated to the extent of the Group’s interest in the enterprise. Unrealised gains arising from transactions with
associates are eliminated against the investment in the associate. Unrealised losses are eliminated in the same way as
unrealised gains, but only to the extent of the recoverable amount.
(vi) Acquisition method of accounting
Acquisitions of subsidiaries are accounted for using the acquisition method. The consideration for each acquisition is
measured at the aggregate of the fair values (at the date of exchange) of assets given, liabilities incurred or assumed, and
equity instruments issued by the Group in exchange for control of the acquiree. Acquisition-related costs are recognised in
profit or loss as incurred.
The acquiree’s identifiable assets, liabilities and contingent liabilities that meet the recognition criteria under IFRS 3 are
recognised at their fair value at the acquisition date. Goodwill is measured as the excess of the sum of the consideration
transferred, the amount of any non-controlling interests in the acquiree, and the fair value of the acquirer’s previously held
equity interest in the acquiree (if any) over the net of the acquisition-date amounts of the identifiable assets acquired and the
liabilities assumed.
Any non-controlling interest in an acquiree is measured as the non-controlling interest’s proportionate share of the acquiree’s
net identifiable assets. Goodwill arising in a business combination is recognised as an asset and is not amortised but is
reviewed for impairment at least annually.
Where a business combination is achieved in stages, the Group’s previously held interests in the acquired entity are
remeasured to fair value at the acquisition date (i.e. the date the Group obtains control) and the resulting gain or loss, if any,
is recognised in profit or loss.
J&T FINANCE GROUP SE
Notes to the consolidated financial statements
for the year ended 31 December 2017
17
(vii) Loss of control
Upon the loss of control, the Group derecognises the assets and liabilities of the subsidiary, any non-controlling interests and
the other components of equity related to the subsidiary. Any surplus or deficit arising on the loss of control is recognised in
profit or loss. If the Group retains any interest in the previous subsidiary, then such interest is measured at fair value at the
date that control is lost. Subsequently it is accounted for as an equity accounted investee or as an available for sale financial
asset depending on the level of influence retained.
(viii)Tax effect of inclusion of the consolidated subsidiaries’ reserves
The consolidated financial statements do not include the tax effects that might arise from transferring the consolidated
subsidiaries’ reserves to the accounts of the Parent Company, since no distribution of profits, not taxed at the source, is
expected in the foreseeable future, and the Group considers that these reserves will be used as self-financing resources at
each consolidated subsidiary.
(ix) Unification of accounting principles
The accounting principles and procedures applied by the consolidated companies in their financial statements were unified in
the consolidation, and agree with the principles applied by the Parent Company.
(b) Foreign currency
(i) Foreign currency transactions
Items included in the financial statements of each of the Group’s entities are measured using the currency of the primary
economic environment in which the entity operates (the functional currency). The functional currency of the Group is EUR.
Transactions in foreign currencies are translated into the functional currency at the foreign exchange rate ruling at the date of
the transaction. Monetary assets and liabilities denominated in foreign currencies are translated into the functional currency
at the exchange rate valid as at the statement of financial position date.
Foreign exchange differences arising on translation are recognised in profit or loss. Non-monetary assets and liabilities
denominated in foreign currencies, which are stated at historical cost, are translated into the functional currency using the
exchange rate at the date of the transaction. Non-monetary assets and liabilities denominated in foreign currencies that are
stated at fair value are translated into the functional currency at the foreign exchange rates ruling at the dates the fair values
are determined.
(ii) Financial statements of foreign operations
The consolidated financial statements are presented in Euro, which is the Group’s presentation currency.
The assets and liabilities of foreign operations, including goodwill and fair value adjustments arising on consolidation, are
translated into Euro at foreign exchange rates ruling at the statement of financial position date. The revenues and expenses of
foreign operations are translated into Euro at the foreign exchange rates ruling at the dates of the transactions. Foreign
exchange differences arising on translation are recognised directly in other comprehensive income.
(iii) Embedded derivatives
Hybrid financial instruments are a combination of non-derivative host contracts and derivative financial instruments
(embedded derivatives). Subject to certain conditions, IAS 39 Financial Instruments: Recognition and Measurement requires
that embedded derivative components be separated from the host contracts and separately carried at fair value with changes
recorded in the income statement.
(c) Financial instruments
(i) Classification
Financial instruments for trading are those that the Group holds for trading that is, with the purpose of short-term profit
taking. These include investments, derivative contracts and liabilities from short sales of financial instruments.
Hedging derivatives are derivative assets or liabilities that meet the criteria for hedge accounting as defined in IAS 39.
Investment securities measured at fair value through profit and loss are instruments designed at FVTPL or to eliminate
economic mismatch.
J&T FINANCE GROUP SE
Notes to the consolidated financial statements
for the year ended 31 December 2017
18
Loans and advances to banks and customers are non-derivative financial assets with fixed and determinable payments, not
quoted in an active market, which are not classified as Investment securities available for sale or Investment securities held
to maturity, Financial assets for trading or Investment securities measured at fair value through profit or loss.
Investment securities held to maturity are non-derivative financial assets with fixed or determinable payments and fixed
maturity that the Group has the intent and ability to hold to maturity.
Investment securities available for sale are those non-derivative financial assets that are not designated as fair value through
profit or loss, loans and advances to banks and customers or as held to maturity.
(ii) Recognition
Financial instruments for trading, investment securities measured at fair value through profit and loss and available for sale
are recognised on the date the Group commits to purchase the assets. Regular way purchases and sales of other financial
assets including held to maturity assets are accounted for on the settlement date.
Loans and advances to banks and customers are recognised on the day they are provided by the Group.
(iii) Measurement
Financial instruments are measured upon initial recognition at fair value plus, in the case of a financial instrument not at fair
value through profit or loss, transaction costs directly attributable to the acquisition or issue of the financial instrument.
Fair value is the price that would be received to sell an asset or paid to transfer a liability in an orderly transaction between
market participants at the measurement date.
Subsequent to initial recognition, financial assets are measured at their fair value, except for loans and advances to
customers, investment securities held to maturity, and certain non-quoted equity securities classified as available for sale the
fair value of which cannot be measured reliably, which are measured at amortised cost or at cost. After initial recognition,
financial liabilities are measured at amortised cost, except for financial liabilities at fair value through profit or loss.
In measuring amortised cost, any difference between cost and redemption value is recognised in the income statement over
the period of the asset or liability on an effective interest rate basis.
(iv) Fair value measurement principles
The fair value of financial instruments is based on their quoted market price at the statement of financial position date
without any deduction for transaction costs. If a quoted market price is not available, the fair value of the instrument is
estimated by management using pricing models or discounted cash flow techniques.
Where discounted cash flow techniques are used, estimated future cash flows are based on management’s best estimates and
the discount rate is a market-related rate at the statement of financial position date for an instrument with similar terms and
conditions. Where pricing models are used, inputs are based on market-related measures at the statement of financial position
date.
The following summarizes the major methods and assumptions used in estimating the fair values of financial instruments
reflected in Note 38 Fair value information.
Loans and advances: Fair value is calculated based on discounted expected future principal and interest cash flows using the
appropriate yield curve and risk spread. Expected future cash flows are estimated considering credit risk and any indication
of impairment. The estimated fair values of loans reflect changes in credit status since the loans were made and changes in
interest rates in the case of fixed rate loans.
Deposit and loans from banks and customers: For demand deposits and deposits with no defined maturities, fair value is
taken to be the amount payable on demand at the statement of financial position date. The estimated fair value of fixed-
maturity deposits is based on discounted cash flows using appropriate yield curve.
Trade receivables and other assets/ liabilities: For receivables/ payables with a remaining life of less than one year, the
notional amount is deemed to reflect the fair value. Other receivables/ payables are discounted to determine the fair value.
Investment securities held to maturity: Fair value is based on quoted market prices traded in active markets at the statement
of financial position date. If not available, the fair value is calculated based on discounted expected future principal and
interest cash flows using the appropriate yield curve and risk spread. Expected future cash flows are estimated considering
credit risk and any indication of impairment. The estimated fair values of financial assets held to maturity reflect changes in
credit status since they were acquired and changes in interest rates in the case of fixed rate instruments.
J&T FINANCE GROUP SE
Notes to the consolidated financial statements
for the year ended 31 December 2017
19
(v) Gains and losses on subsequent measurement
Gains and losses arising from a change in fair value are recognised in the income statement for instruments held for trading
or measured at fair value through profit or loss and directly in other comprehensive income as a revaluation difference for
investment securities available for sale. The cumulative gain or loss of available for sale assets previously recognised in other
comprehensive income is reclassified to profit or loss as a reclassification adjustment when the available for sale asset is
derecognised. Interest income and expense from assets available for sale are recorded in the income statement by applying
the effective interest rate method. Refer to accounting policy (c) vii for accounting for gains and losses on subsequent
measurement of hedges.
(vi) Derecognition
A financial asset is derecognised when the Group loses control over the contractual rights that comprise that asset. This
occurs when the rights are realised, expire or are surrendered. A financial liability is derecognised when the Group’s
obligations specified in the contract expire or are discharged or cancelled.
Investment securities available for sale, financial assets for trading and investment securities measured at fair value through
profit or loss that are sold are derecognised and the corresponding receivables from the buyer for the payment are recognised
as at the date the Group commits to sell the assets.
Investment securities held to maturity and loans and advances to banks and customers are derecognised on the day they are
disposed of by the Group.
(vii) Hedge accounting
Hedging instruments that consist of derivatives associated with a currency risk are classified either as cash-flow hedges or
fair value hedges.
From the inception of the hedge, the Group maintains a formal documentation of the hedging relationship and the Group’s
risk management objective and strategy for undertaking the hedge. The Group also periodically assesses the hedging
instrument's effectiveness in offsetting the exposure to changes in the hedged item's fair value or cash flows attributable to
the hedged risk.The Group considers hedging as highly effective, if the changes in fair value relating to the hedged risk
during the period covered, compensate changes in the fair value of the hedging instrument in the range of 80% to 125%.
In case of a cash flow hedge, the portion of the gain or loss on the hedging instrument that is determined to be an effective
hedge is recognised directly in other comprehensive income and the ineffective portion of the gain or loss on the hedging
instrument is recognised in profit or loss. If the hedging instrument no longer meets the criteria for hedge accounting, expires
or is sold, terminated or exercised, or the designation is revoked, then hedge accounting is discontinued prospectively. If the
forecast transaction is no longer expected to occur, then the balance in equity is reclassified to profit or loss.
In case of a fair value hedge, the gain or loss from remeasuring the hedging instrument at fair value is recognised in profit or
loss together with the changes in the fair value of the hedged item that are attributable to the hedged risk (in the same line as
the hedged item).
The Group uses fair value hedge to cover the foreign currency exposure to changes in the fair value of investment securities
available for sale and investment in equity accounted investees over the hedging period. The Group uses currency forwards
as hedging instruments.
Furthermore, the Group uses hedging derivatives to hedge the fair value of recognized assets (bonds with fixed income
denominated in Euros). The Group entered into interest rate swaps to hedge the changes in fair value caused by changes in
interest rates.
(d) Cash and cash balances at central banks and cash equivalents
Cash and cash balances at central banks comprise cash balances on hand and and cash deposited with central banks. This
item also includes obligatory minimum reserves. The Group can freely transact with the amount of these reserves under the
assumption that average obligatory minimum reserves are maintained within the given maintenance period established by the
relevant central banks.
For the purposes of preparing the Consolidated statement of cash flows, the Group includes into Cash and cash equivalents
also other short term highly liquid investments with original maturities of three months or less, such as Loans from reverse
repurchase agreements with maturities of less than three months, Current account with banks and Loans and advances with
J&T FINANCE GROUP SE
Notes to the consolidated financial statements
for the year ended 31 December 2017
20
original maturities of three months or less (all presented in caption Loans and advances to banks in the Consolidated
statement of financial position).
(e) Loans and advances to banks and customers
Loans and advances originated by the Group are classified as originated loans and receivables. Loans and advances are
reported net of impairment allowance to reflect the estimated recoverable amounts (refer to accounting policy (h)).
The Group classifies all its receivables from clients into the following five basic categories laid down by Regulation (EU) No
575/2013 of the European Parliament and Council Regulation (CRR) of 26 June 2013 and complementary legislation in the
respective countries: receivables without obligor default divided into standard and watch receivables, and receivables with
obligor default divided into non-standard, doubtful and loss receivables. In the evaluation of individual loans, the
classification takes into account both qualitative and quantitative criteria.
The criteria mentioned include the following:
- major financial problems of the issuer or debtor;
- breach of a contract, e.g. delayed payment of interest or principal or failure to pay them;
- relief provided by the creditor to the debtor for economic or other legal reasons relating to the debtor’s financial problems,
that the creditor would not have otherwise provided;
- likelihood of bankruptcy or other financial restructuring of the debtor;
- extinction of an active market for the given financial asset for financial reasons; or
- observable facts demonstrating a measurable decline of estimated future cash flow from the portfolio of financial assets
after their initial recognition despite the existing impossibility to detect the decrease for individual financial assets in the
portfolio; and
- others.
Forbearance
The Group treats forbearance in accordance with the Technical Standard on non-performing exposures and forbearance
measures published by the European Banking Authority (EBA) and in accordance with the Public Statement of the European
Securities and Markets Authority (ESMA) on the treatment of forbearance practices in the financial statements of financial
institutions prepared in accordance with IFRS.
Forbearance is an exposure where the Group decides, due to the debtor’s financial problems, to grant a concession which in
other circumstances would not be granted. The concession may consist in the modification of the terms and conditions of the
contract or in debt refinancing. The modification of the terms and conditions may include, but is not limited to, a decrease in
interest rate, reduction of the interest or principal, change in the repayment schedule (e.g. postponement of interest payment
due date, temporary payment holiday, prolongation of the final due date of the loan, fee or accessories for the debtor,
modification or non-monitoring of covenants, interest or instalment capitalisation, partial debt write-off). Any modification
of terms and conditions or refinancing which is not a result of the debtor’s financial problems cannot be interpreted as
forbearance. Concessions may result in better interest risk management and mitigation of potential future loan losses.
Details regarding the structure and quality of the credit portfolio are given in Note 41. Risk management policies and
disclosures.
Individually assessed allowances
Based on regular reviews of the outstanding balances, specific allowances for loan losses are made for the carrying amount
of loans and advances that are identified as being impaired to reduce these loans and advances to the amounts recoverable.
The Group mainly uses the financial statements of the client and the Group’s own analysis as the basis for assessment of the
loan’s collectibility.
Allowances made, less amounts released during the reporting period, are charged to the statement of comprehensive income.
Outstanding loan exposures are written off only when there is no realistic prospect of recovery. If in a subsequent period the
amount of an allowance for loan losses decreases and the decrease can be linked objectively to an event occurring after the
allowance was booked, the allowance is reversed through the statement of comprehensive income.
J&T FINANCE GROUP SE
Notes to the consolidated financial statements
for the year ended 31 December 2017
21
Collectively assessed allowances
Allowances are assessed collectively for losses on loans that are not individually significant and for individually significant
loans and advances that have been assessed individually and found not to be impaired.
Allowances are evaluated separately on a regularly basis within each portfolio. The collective assessment is made for groups
of assets with similar risk characteristics, in order to determine whether provision should be made due to incurred loss events
for which there is objective evidence, but the effects of which are not yet evident in the individual loan assessments.
In estimating the amount of allowances necessary, management evaluates the likelihood of repayment of individual loans and
takes into account the value of collateral and the ability of the Group to realize the collateral.
(f) Sale and repurchase agreements
Where securities are sold under a commitment to repurchase at a predetermined price (repos), they remain on the statement
of financial position and a liability is recorded equal to the consideration received. Conversely, securities purchased under
a commitment to resell (reverse repos) are not recorded on the statement of financial position and the consideration paid is
recorded as a loan. The difference between the sale price and the purchase price is treated as interest and accrued evenly over
the life of the transaction. Repos and reverse repos are recognised on a settlement date basis.
(g) Offsetting
Financial assets and liabilities are offset and the net amount is reported in the statement of financial position when the Group
has a legally enforceable right to set off the recognised amounts and the transactions are intended to be settled on a net basis
or to realise the asset and settle the liability simultaneously.
(h) Impairment
The carrying amounts of the Group’s assets, other than deferred tax assets (refer to accounting policy (v)) are reviewed at
each statement of financial position date to determine whether there is objective evidence of impairment. If any such
indication exists, the asset’s recoverable amount is estimated. Goodwill and intangible assets that have an indefinite useful
life are not subject to amortisation, but are tested annually for impairment as part of the cash generating unit to which they
belong.
An impairment loss is recognised whenever the carrying amount of an asset or its cash generating unit exceeds its
recoverable amount. Impairment losses are recognised in the income statement.
The Group regularly assesses whether there is any objective evidence that a financial asset or a group of financial assets is
impaired. A financial asset or a group of financial assets is deemed to be impaired if, and only if, there is objective evidence
of impairment as a result of one or more events that have occurred after the initial recognition of the asset (an incurred loss
event) and that loss event (or events) has an impact on the estimated future cash flows of the financial asset or the group of
financial assets that can be reliably estimated.
Evidence of impairment may include: indications that the borrower or a group of borrowers is experiencing significant
financial difficulty; the probability that they will enter bankruptcy or other financial reorganisation; default or delinquency in
interest or principal payments; and where observable data indicates that there is a measurable decrease in the estimated future
cash flows, such as changes in arrears or economic conditions that correlate with defaults.
Loans and advances are presented net of impairment allowances. Allowances for impairment are determined based on the
credit standing, performance of the borrower and expected cash flow and take into account the value of any collateral or
third-party guarantee. The allowances are proportionally allocated to the total outstanding amount of the receivables, i.e.
principal, interest accrual and penalty interest, if any.
The recoverable amount of the Group's investment in held to maturity assets and receivables carried at amortised cost is
calculated as the present value of estimated future cash flows, discounted at the original effective interest rate (i.e. the
effective interest rate computed upon initial recognition of these financial assets).
The recoverable amount of other assets is the greater of their fair value less costs of diposal and value in use. In assessing
value in use, the estimated future cash flows are discounted to their present value using a pre-tax discount rate that reflects
current market assessment of the time value of money and the risks specific to the asset. For an asset that does not generate
J&T FINANCE GROUP SE
Notes to the consolidated financial statements
for the year ended 31 December 2017
22
largely independent cash inflows, the recoverable amount is determined for the cash-generating unit to which the asset
belongs.
An impairment loss in respect of a held to maturity asset or receivable carried at amortised cost is reversed if the subsequent
increase in recoverable amount can be related objectively to an event occurring after the impairment loss was recognised.
An impairment loss in respect of an investment in an equity instrument classified as available for sale is not reversed through
the income statement. If the fair value of a debt instrument classified as available for sale increases and the increase can be
related objectively to an event occurring after the impairment loss was recognised in the income statement, then the
impairment loss is reversed, with the amount of the reversal recognised in the income statement.
An impairment loss in respect of goodwill is not reversed.
In respect of other assets, an impairment loss is reversed when there is an indication that the impairment loss no longer exists
and there has been a change in the estimates used to determine the recoverable amount.
An impairment loss is reversed only to the extent that the asset's carrying amount does not exceed the carrying amount that
would have been determined, net of depreciation or amortisation, if no impairment loss had been recognised.
(i) Assets held for sale and discontinued operations
Non-current assets, or disposal groups comprising assets and liabilities, are classified as held-for-sale if it is highly probable
that they will be recovered primarily through sale rather than through continuing use.
Immediately before classification as held-for-sale, the assets, or components of a disposal group, are remeasured in
accordance with the Group´s other accounting policies. Thereafter, generally the assets, or disposal group, are measured at
the lower of their carrying amount and fair value less costs to sell. Any impairment loss on a disposal group is allocated first
to goodwill, and then to the remaining assets and liabilities on a pro rata basis, except that no loss is allocated to inventories,
financial assets, deferred tax, employee benefits, investment property, which continue to be measured in accordance with the
Group´s other accounting policies. Impairment losses on initial classification as held-for-sale and subsequent gains and
losses on remeasurement are recognized in profit or loss. Gains are not recognized in excess of any cumulative impairment
loss.
Once classified as held-for-sale, intangible assets and property, plant end equipment are no longer amortised or depreciated,
and any equity-accounted investee is no longer equity accounted.
A discontinued operation is a component of the Group´s business, the operations and cash flows of which can be clearly
distinguished from the rest of the Group and which:
represents a separate major line of business or geographical area of operations;
is part of a single co-ordinated plan to dispose of a separate major line of business or geographical area of operations;
or
is a subsidiary acquired exclusively with a view to resale.
Classification as a discontinued operation occurs on disposal or when the operation meets the criteria to be classified as held-
for-sale, if earlier.
When an operation is classified as a discontinued operation, the comparative statement of comprehensive income is re-
presented as if the operation had been discontinued from the start of the comparative year.
When an asset (or disposal group) previously classified as held for sale no longer meets the criteria for such classification,
the Group ceases to classify such asset (or disposal group) as held for sale. Thus, the entity remeasures a non-current asset
(or disposal group) at the lower of its carrying amount before the asset was classified as held for sale (adjusted for any
depreciation, amortization or revaluation that would have been recognized had the asset not been classified as held for sale)
and its recoverable amount at the date of the subsequent decision not to sell.
(j) Property, plant and equipment
(i) Owned assets
Items of property, plant and equipment are stated at cost less accumulated depreciation (see below) and impairment losses
(refer to accounting policy (h)).
J&T FINANCE GROUP SE
Notes to the consolidated financial statements
for the year ended 31 December 2017
23
Cost includes expenditures that are directly attributable to the acquisition of the asset. The cost of self-constructed assets
includes the cost of materials and direct labour, any other costs directly attributable to bringing the asset to a working
condition for its intended use, costs of dismantling and removing the items and restoring the site on which they are located,
and capitalised borrowing costs.
Property that is being constructed or developed for future use as investment property is classified as property, plant and
equipment and stated at cost until construction or development is complete, at which time it is reclassified as investment
property.
When parts of an item of property, plant and equipment have different useful lives, those components are accounted for as
separate items (major components) of property, plant and equipment.
(ii) Subsequent expenditure
Subsequent expenditure is capitalised if it is probable that the future economic benefits embodied in the part of property,
plant and equipment will flow to the Group and its cost can be measured reliably. All other expenditures including the costs
of the day-to-day servicing of property, plant and equipment are recognised in the income statement as an expense as
incurred.
(iii) Depreciation
Depreciation is charged to the income statement on a straight-line basis over the estimated useful lives of items of property,
plant and equipment. Land is not depreciated. The estimated useful lives are as follows:
Buildings 40 years
Equipment 3 - 8 years
Fixtures, fittings and others 3 - 8 years
Depreciation methods and useful lives, as well as residual values, are reassessed annually at the reporting date.
(k) Intangible assets
(i) Goodwill and intangible assets acquired in a business combination
Goodwill represents the excess of the cost of an acquisition over the fair value of the Group’s share of the net identifiable
assets of the acquired subsidiary/associate at the date of acquisition. Goodwill on acquisition of subsidiaries is included
under intangible assets. Goodwill on acquisition of associates and joint ventures is included in the carrying amount of
investments in associates. Goodwill is tested annually for impairment and carried at cost less accumulated impairment losses.
Gains and losses on the disposal of an entity include the carrying amount of goodwill relating to the entity sold. Negative
goodwill arising on an acquisition is reassessed and any excess remaining after the reassessment is recognised in the income
statement.
Intangible assets acquired in a business combination are recorded at fair value on the acquisition date if the intangible asset is
separable or arises from contractual or other legal rights. Intangible assets with an indefinite useful life are not subject to
amortisation and are recorded at cost less impairment. Intangible assets with a definite useful life are amortised over their
useful lives and are recorded at cost less accumulated amortisation and impairment.
(ii) Software and other intangible assets
Software and other intangible assets acquired by the Group are stated at cost less accumulated amortisation (see below) and
impairment losses (refer to accounting policy (h)).
The useful lives are usually finite. Those intangible assets that have an indefinite useful life are not amortised and are tested
annually for impairment. Their useful life is reviewed at each period-end to assess whether events and circumstances
continue to support an indefinite useful life.
(iii) Amortisation
J&T FINANCE GROUP SE
Notes to the consolidated financial statements
for the year ended 31 December 2017
24
Amortisation is charged to the income statement on a straight-line basis over the estimated useful lives of intangible assets
other than goodwill, from the date the asset is available for use. The estimated useful lives are as follows:
Software 4 years
Other intangible assets 2 - 9 years
Customers relationships 3 - 20 years
Tradename 13 - 14 years
(l) Investment property
Investment property is initially measured at cost and subsequently at fair value with any change therein recognized in profit
or loss.
Fair values of investment property are determined either by independent registered valuers or by management, in both cases
based on current market values in an active market for similar properties in the same location and conditions.
Valuations reflect, where appropriate, the type of tenants in occupation or responsible for meeting lease commitments, or
likely to be in occupation after letting vacant property, the general market’s perception of tenants’ creditworthiness and the
remaining economic life of the properties.
Any gain or loss on disposal of investment property (calculated as the difference between the net proceeds from disposal and
the carrying amount of the item) is recognized in profit or loss for the period in which it arises. When investment property
that was previously classified as property, plant and equipment is sold, any related amount included in the revaluation
reserve is transferred to retained earnings.
(m) Provisions
A provision is recognised in the statement of financial position when the Group has a present legal or constructive obligation
as a result of a past event, and it is probable that an outflow of economic benefits will be required to settle the obligation and
a reliable estimate of the amount can be made.
The Group recognizes a provision related to a customer loyalty programme run by J&T BANKA, a.s. The provision
decreases interest revenue when the first points are credited to the customer upon setting up a new bank account. The
provision is then further built up as further points are credited to the customer depending on the use of services offered by the
Group and other partners of the loyalty programme.
(n) Insurance contracts
A contract, under which the Group accepts significant insurance risk from another party (the policyholder) by agreeing to
compensate the policyholder if a specified uncertain future event (the insured event) adversely affects the policyholder, is
classified as an insurance contract. Insurance premium is earned from the day of the acceptance of the risks and is recognized
as revenue. For unearned premium, a provision is created. Insurance claims expenses are represented by claims for the events
that have occurred during the accounting period and adjustment of provision for the insurance claims for previous and
current accounting period.
Provision for insurance claims and benefits
The provision for outstanding claims and benefits represents an estimate of total costs for settling all claims from insured
events that have occurred up to the end of the accounting period. Outstanding insurance claims are recognised by assessing
individual events and creating provisions for claims reported but not settled (RBNS) and a provision for claims incurred but
not reported (IBNR). Such provisions are created for both life and non-life insurance.
Provision for life insurance
The provision for life insurance is an actuarial estimate of the Group’s liability from life insurance contracts. The provision is
calculated separately for each insurance contract and considering all guaranteed insurance benefits and bonuses, applying the
actuarial estimates used to calculate the insurance tariffs. Any adjustment to the provision is recognised in profit or loss in
the period in which it arises.
(o) Employee benefits
J&T FINANCE GROUP SE
Notes to the consolidated financial statements
for the year ended 31 December 2017
25
For termination employee benefits, a provision is recognised for the amount expected to be paid under long or short-term
cash bonus or profit-sharing plans if the Group has a present legal or constructive obligation to pay this amount as a result of
past service provided by the employee and the obligation can be estimated reliably. The benefit is classified as short term, if
and only if the whole benefit category will be settled within one year; otherwise, it is disclosed as long term.
Short-term employee benefit obligations are measured on an undiscounted basis and are expensed as the related service is
provided.
Amounts due to employees, such as amounts relating to accrued vacation pay or performance bonuses, are recognized as
other liabilities.
(p) Financial guarantees
Financial guarantees are contracts that require the Group to make specific payments to reimburse the holder for a loss it
incurs because a specified debtor fails to make a payment when due in accordance with the terms of the debt instrument.
Financial guarantee liabilities are recognised initially at their fair value, and the initial fair value is amortised over the life of
the financial guarantee. Financial guarantee liabilities are subsequently carried at the higher of this amortised amount and the
present value of any expected payment when a payment under the guarantee has become probable. Financial guarantees are
included within other liabilities when future payment is considered probable and included in off-balance sheet when
considered to be a possible obligation.
(q) Trading liabilities and other liabilities
Trade and other liabilities are stated at amortised cost.
(r) Interest income and expense
Interest income and expense is recognised in the income statement as it accrues. Interest income and expense includes the
amortisation of any discount or premium or other differences between the initial carrying amount of an interest bearing
instrument and its amount at maturity calculated on an effective interest rate basis. All borrowing costs (except for those that
qualify for capitalization) are recognised in the income statement.
(s) Fee and commission income and expense
Fee and commission income arises on financial services provided by the Group, including cash management services,
brokerage services, investment advice and financial planning, investment banking services, project and structured finance
transactions, and asset management services. Assets under management comprising all client assets managed or held for
investment purposes by the Group in its own name, but for the account of third parties, are not reported in its consolidated
statement of financial position (refer to Note 42. Assets under management). Commissions received from such business are
shown in fee and commission income.
Fee and commission income and expense are recognised when the corresponding services are provided or received.
(t) Dealing profits, net
Dealing profits, net include gains and losses arising from disposals and changes in the fair value of financial assets and
liabilities at fair value through profit or loss and available for sale, gains and losses from foreign exchange trading, as well
as realized and unrealized foreign exchange gains and losses.
(u) Rental income
Rental income is recognised in the income statement on a straight-line basis over the term of the lease.
(v) Income tax
Income tax on the profit for the year comprises current and deferred tax.
Current tax is the expected tax payable on the taxable income for the year, using tax rates enacted at the statement of
financial position date, and any adjustment to tax payable in respect of previous years.
J&T FINANCE GROUP SE
Notes to the consolidated financial statements
for the year ended 31 December 2017
26
Deferred tax is provided using the balance sheet liability method, providing for temporary differences between the carrying
amounts of assets and liabilities for financial reporting purposes and the amounts used for taxation purposes. The following
temporary differences are not provided for: the initial recognition of assets or liabilities, in a transaction that is not a business
combination, that affect neither accounting nor taxable profit, and differences relating to investments in subsidiaries to the
extent that it is probable that they will not reverse in the foreseeable future since the parent is able to control the reversal of
the temporary difference. No taxable temporary differences are recognised on the initial recognition of goodwill. The amount
of deferred tax provided is based on the expected manner of realisation or settlement of the carrying amount of assets and
liabilities, using tax rates enacted or substantially enacted at the statement of financial position date.
Income tax is recognised in the income statement, except to the extent that it relates to items recognised directly in other
comprehensive income, in which case it is recognised in other comprehensive income.
A deferred tax asset is recognised only to the extent that it is probable that future taxable profits will be available against
which the unused tax losses and credits can be utilised. Deferred tax assets are reduced to the extent that it is no longer
probable that the related tax benefit will be realised. Deferred income taxes are calculated using currently enacted tax rates
expected to apply when the asset is realized or the liability settled.
Deferred tax assets and liabilities are offset if there is a legally enforceable right to offset current tax liabilities and assets,
and they relate to taxes levied by the same tax authority on the same taxable entity, or on different tax entities, but they
intend to settle current tax liabilities and assets on a net basis or their tax assets and liabilities will be realised simultaneously.
(w) Operating and finance lease
(i) Group as a lessee
Leases under which the Group assumes substantially all the risks and rewards of ownership are classified as finance leases.
On initial recognition, the leased asset is measured at an amount equal to the lower of its fair value and the present value of
the minimum lease payments. Subsequent to initial recognition, the asset is accounted for in accordance with the accounting
policy applicable to that asset. Minimum lease payments for finance leases are apportioned between the finance charge and
the reduction of the outstanding liability. The finance charge is allocated to each period during the lease term so as to
produce a constant periodic rate of interest on the remaining balance of the liability.
Payments made under operating leases are recognised in the income statement on a straight-line basis over the term of the
lease. Operating leases with an option to terminate the contract earlier than at the end of the agreed period are considered as
non-cancellable for the time of the contracted notice period.
On the other hand, in case of operating leasing, the assets are not recognized on the Group’s statement of financial position.
(ii) Group as a lessor
Leases under which the Group transfers substantially all the risks and rewards of ownership are classified as finance leases.
A finance lease receivable is recognized over the leasing period in an amount equal to the net investment in the lease and
presented within loans and advances to customers in the consolidated statement of financial position. Net investment in the
lease is calculated as the present value of the minimum lease payments and any unguaranteed residual value, discounted at
the interest rate implicit in the lease.
Finance income recognition is based on a pattern reflecting a constant periodic rate of return on the Group’s net investment
in the finance lease.
Gains and losses on disposal of assets owned by the Group that were previously subject to finance lease agreements are
presented net in Other opering income or expense.
(x) Revenue from goods sold and services rendered
Revenue from the sale of goods is recognised in the income statement when the significant risks and rewards of ownership
have been transferred to the buyer. Revenue from services rendered is recognised in the income statement in proportion to
the stage of completion of the transaction at the statement of financial position date. The stage of completion is assessed by
reference to surveys of work performed. No revenue is recognised if there are significant uncertainties regarding the recovery
of the consideration due, associated costs or the possible return of goods.
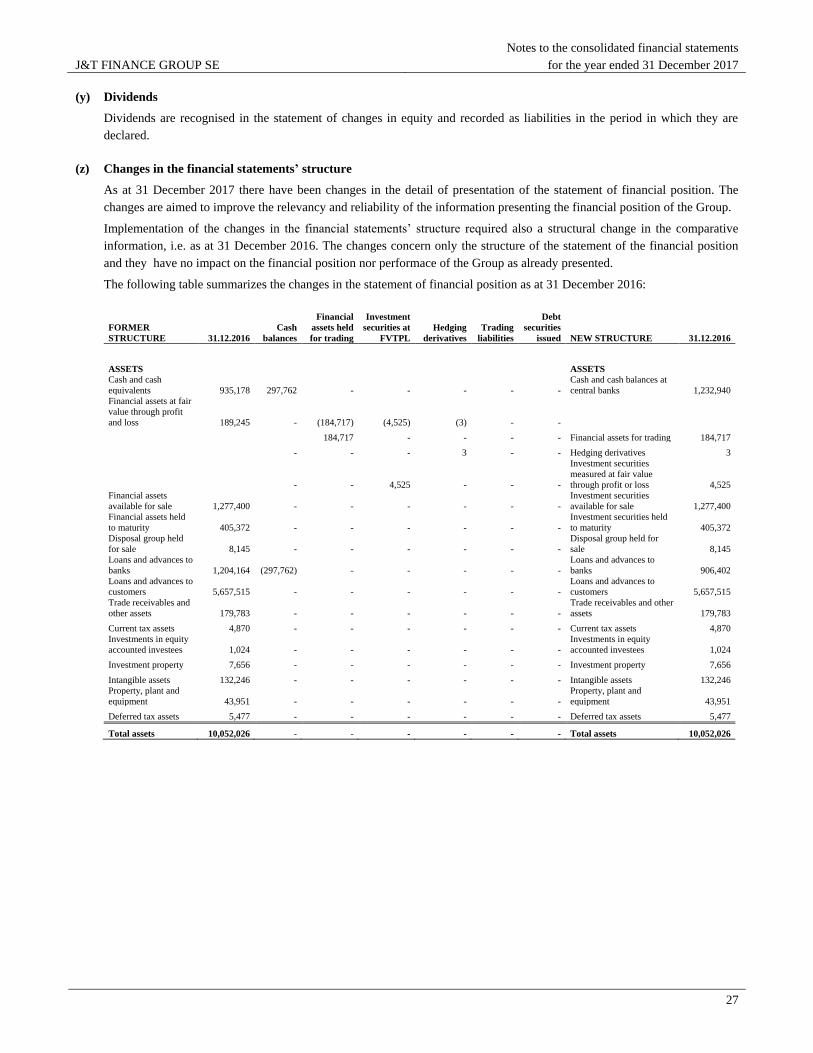
J&T FINANCE GROUP SE
Notes to the consolidated financial statements
for the year ended 31 December 2017
27
(y) Dividends
Dividends are recognised in the statement of changes in equity and recorded as liabilities in the period in which they are
declared.
(z) Changes in the financial statements’ structure
As at 31 December 2017 there have been changes in the detail of presentation of the statement of financial position. The
changes are aimed to improve the relevancy and reliability of the information presenting the financial position of the Group.
Implementation of the changes in the financial statements’ structure required also a structural change in the comparative
information, i.e. as at 31 December 2016. The changes concern only the structure of the statement of the financial position
and they have no impact on the financial position nor performace of the Group as already presented.
The following table summarizes the changes in the statement of financial position as at 31 December 2016:
FORMER
STRUCTURE 31.12.2016
Cash
balances
Financial
assets held
for trading
Investment
securities at
FVTPL
Hedging
derivatives
Trading
liabilities
Debt
securities
issued NEW STRUCTURE 31.12.2016
ASSETS
ASSETS
Cash and cash
equivalents 935,178 297,762 - - - - -
Cash and cash balances at
central banks 1,232,940
Financial assets at fair
value through profit
and loss 189,245 - (184,717) (4,525) (3) - -
184,717 - - - - Financial assets for trading 184,717
- - - 3 - - Hedging derivatives 3
- - 4,525 - - -
Investment securities
measured at fair value
through profit or loss 4,525
Financial assets
available for sale 1,277,400 - - - - - -
Investment securities
available for sale 1,277,400
Financial assets held
to maturity 405,372 - - - - - -
Investment securities held
to maturity 405,372
Disposal group held
for sale 8,145 - - - - - -
Disposal group held for
sale 8,145
Loans and advances to
banks 1,204,164 (297,762) - - - - -
Loans and advances to
banks 906,402
Loans and advances to
customers 5,657,515 - - - - - -
Loans and advances to
customers 5,657,515
Trade receivables and
other assets 179,783 - - - - - -
Trade receivables and other
assets 179,783
Current tax assets 4,870 - - - - - - Current tax assets 4,870
Investments in equity
accounted investees 1,024 - - - - - -
Investments in equity
accounted investees 1,024
Investment property 7,656 - - - - - - Investment property 7,656
Intangible assets 132,246 - - - - - - Intangible assets 132,246
Property, plant and
equipment 43,951 - - - - - -
Property, plant and
equipment 43,951
Deferred tax assets 5,477 - - - - - - Deferred tax assets 5,477
Total assets 10,052,026 - - - - - - Total assets 10,052,026
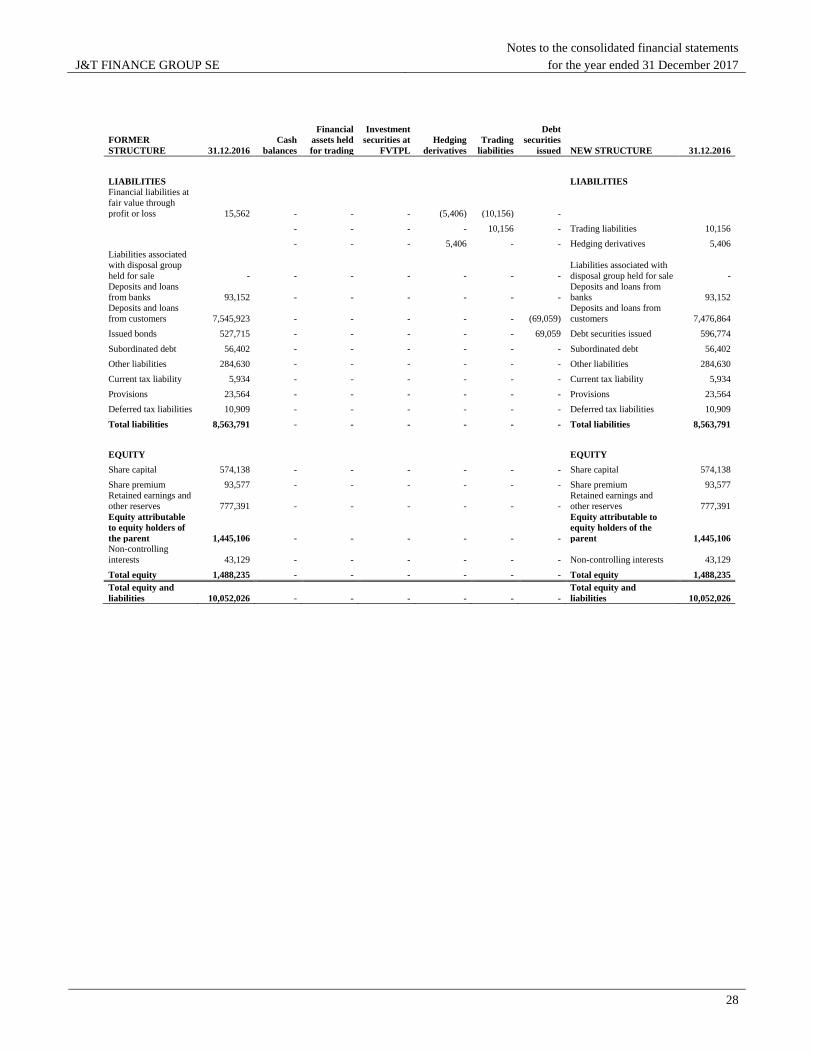
J&T FINANCE GROUP SE
Notes to the consolidated financial statements
for the year ended 31 December 2017
28
FORMER
STRUCTURE 31.12.2016
Cash
balances
Financial
assets held
for trading
Investment
securities at
FVTPL
Hedging
derivatives
Trading
liabilities
Debt
securities
issued NEW STRUCTURE 31.12.2016
LIABILITIES
LIABILITIES
Financial liabilities at
fair value through
profit or loss 15,562 - - - (5,406) (10,156) -
- - - - 10,156 - Trading liabilities 10,156
- - - 5,406 - - Hedging derivatives 5,406
Liabilities associated
with disposal group
held for sale - - - - - - -
Liabilities associated with
disposal group held for sale -
Deposits and loans
from banks 93,152 - - - - - -
Deposits and loans from
banks 93,152
Deposits and loans
from customers 7,545,923 - - - - - (69,059)
Deposits and loans from
customers 7,476,864
Issued bonds 527,715 - - - - - 69,059 Debt securities issued 596,774
Subordinated debt 56,402 - - - - - - Subordinated debt 56,402
Other liabilities 284,630 - - - - - - Other liabilities 284,630
Current tax liability 5,934 - - - - - - Current tax liability 5,934
Provisions 23,564 - - - - - - Provisions 23,564
Deferred tax liabilities 10,909 - - - - - - Deferred tax liabilities 10,909
Total liabilities 8,563,791 - - - - - - Total liabilities 8,563,791
EQUITY
EQUITY
Share capital 574,138 - - - - - - Share capital 574,138
Share premium 93,577 - - - - - - Share premium 93,577
Retained earnings and
other reserves 777,391 - - - - - -
Retained earnings and
other reserves 777,391
Equity attributable
to equity holders of
the parent 1,445,106 - - - - - -
Equity attributable to
equity holders of the
parent 1,445,106
Non-controlling
interests 43,129 - - - - - - Non-controlling interests 43,129
Total equity 1,488,235 - - - - - - Total equity 1,488,235
Total equity and
liabilities 10,052,026 - - - - - -
Total equity and
liabilities 10,052,026

J&T FINANCE GROUP SE
Notes to the consolidated financial statements
for the year ended 31 December 2017
29
4. Critical accounting estimates and assumptions
The preparation of financial statements in accordance with International Financial Reporting Standards requires the use of
certain critical accounting estimates and assumptions. It also requires management to exercise judgement in the process of
applying the Company’s accounting policies. The resulting accounting estimates will, by definition, seldom equal the related
actual results. The estimates and assumptions that have a significant risk of causing a material adjustment to the carrying
amount of assets and liabilities within the next financial year are discussed below. The estimates and assumptions are
reviewed on an ongoing basis. Revisions to accounting estimates are recognised in the period in which the estimate is revised
if the revision affects only that period, or in the period of the revision and future periods if the revision affects both current
and future periods.
4.1. Financial instruments
When measuring the fair value of an asset or a liability, the Group uses market observable data as far as possible. Fair values
are categorized into different levels in a fair value hierarchy based on the inputs used in the valuation techniques as follows:
Level 1: quoted prices (unadjusted) in active markets for identical assets or liabilities
Level 2: inputs other than quoted prices included in Level 1 that are observable for the asset or liability, either
directly (i.e. as prices of similar instruments) or indirectly (i.e. derived from such prices)
Level 3: inputs for the asset or liability that are not based on observable market data (unobservable inputs)
If the market for a financial instrument is not active, fair value is estimated by using valuation techniques. In applying
valuation techniques, management uses estimates and assumptions that are consistent with available information about
estimates and assumptions that market participants would use in setting a price for the financial instrument.
Level 2 fair values are based on market values, but adjusted mainly by credit risk taking into account the credit risk of the
Group and counterparty when appropriate.
If fair values had been higher or lower by 10% than quoted prices, the net carrying amount of financial instruments on Level
1 and Level 2, would have been EUR 114,398 thousand higher or lower than as disclosed as at 31 December 2017 (2016:
EUR 135,956 thousand).
The Group recognizes transfers between levels of the fair value hierarchy at the end of the reporting period during which the
change has occurred.
In the vast majority of cases, the fair value of Level 3 investments was estimated using comparative valuation methods and
discounted cash flow (“DCF”) models. The discount rates were based on the specificities of the industries and countries in
which the investments operate and ranged from 2.00% to 14.13% as at 31 December 2017 (2016: from 5.08% to 9.72%). The
key assumptions used in the valuations were the expected cash flows and the discount rates used.
For more information, refer to the following notes:
- Note 14. Financial assets for trading
- Note 15. Hedging derivatives
- Note 16. Investment securities measured at fair value through profit or loss
- Note 17. Investment securities available for sale
- Note 26. Investment property
4.2. Business combinations and purchase price allocations
In a business combination (see also Note 5.1. Acquisition and establishment of subsidiaries, the acquiree’s identifiable assets,
liabilities and contingent liabilities are recognised and measured at their fair values at the acquisition date. Allocation of the
total purchase price among the net assets acquired for financial statement reporting purposes is performed with the support of
professional advisors.
J&T FINANCE GROUP SE
Notes to the consolidated financial statements
for the year ended 31 December 2017
30
The valuation analysis is based on historical and prospective information available as at the date of the business combination.
Any prospective information that may impact the fair value of the acquired assets is based on management’s expectations of
the competitive and economic environments that will prevail in the future.
The results of the valuation analyses are used as well for determining the amortisation and depreciation periods of the values
allocated to specific intangible and tangible fixed assets.
There were several business combinations throughout the year 2017.
On 15 February 2017 the Group bought a 100% share in Health Care Financing, a.s. through its subsidiary J&T BANKA, a.s
(on 8 August 2017 Health Care Financing, a.s. changed its name to J&T Leasingová společnost, a.s). The purpose of this
transactions is further increase of the Group’s leasing activities.
On 11 August 2017 J&T FINANCE GROUP SE acquired a 80% share in the French winery Chateau Teyssier (Société
civile) and its distribution network through the purchase of a 100% share in Outsider LLC and an 80% share in Saxonwold
Ltd. Subsequently, J&T FINANCE GROUP SE established J&T Wine Holding SE on 26 August 2017 and acquired a 100%
share in the Czech winery KOLBY a.s. Such investments into wine production and distribution sites in major geoprahical
regions represent new investment opportunities for the Group. The Group recognized goodwill in the amount of EUR 3,606
thousand in connection with this acquisition.
On 4 October 2017 J&T Bank, a.o. purchased the Russian bank AKB "Khovanskiy" a.o. at a discount from its original
shareholders with the aim to optimize and expand its business activities. The transaction resulted into a recognition of a Gain
on bargain purchase of EUR 3,197 thousand in the financial statements of the Group.
On 21 December 2017 and 14 December 2017 the Group gained control over the NOVA Hotels otevřený podílový fond
REDSIDE investiční společnost, a.s. and Compact Property Fund, investiční fond s proměnným základním kapitálem, a.s.,
respectively (see also Note 4.4. Determination of control over investment funds). The transaction did not lead to recognition
of goodwill as the identifiable assets were already measured at fair value before control was gained.
There were no acquisitions of subsidiaries nor associates in 2016.
4.3. Goodwill and impairment testing
The Group conducts impairment testing of goodwill arisen in a business combination during the current period and
impairment testing of goodwill already recognised in prior years annually (see also Note 5.1. Acquisitions and establishment
of subsidiaries and Note 27. Intangible assets). The Group also conducts impairment testing of other intangible assets with
indefinite useful lives and of cash-generating units (CGUs) where a trigger for impairment testing is identified. As at the
acquisition date, goodwill acquired is allocated to each of the cash-generating units expected to benefit from the
combination’s synergies. Impairment is determined by assessing the recoverable amount of the cash-generating unit to which
goodwill relates, on the basis of a value in use that reflects estimated future discounted cash flows or on the basis of fair
value less costs to sell.
Fair value measurements for impairment testing purposes were categorized as a Level 3 measurement based on the inputs
used in the valuation technique. In the majority of cases the Group estimated the recoverable amounts of goodwill and the
cash generating units based on value in use. Value in use was derived from management forecasts of future cash flows
updated since the date of acquisition. The discount rates applied to the cash flow projections are calculated as the weighted
average cost of capital (“WACC”) of each CGU.
Poštová banka, a.s.
Upon acquisition of Poštová banka, a.s. and its subsidiaries (Poštová banka Group) goodwill in amount of EUR
20,033 thousand was recognized. The recoverable amount of the Poštová banka Group cash generating unit, with a carrying
amount of EUR 709,089 thousand (share controlled by the Group) as at 31 December 2017 and of EUR 670,504 thousand as
at 31 December 2016, was determined on the basis of value in use and the full amount of goodwill recognized upon
acquisition was allocated to the Poštová banka Group cash generating unit. The cash flows were derived from the Poštová
banka Group’s long term business plan, the key assumptions being forecast of net interest income and loans provided to
customers, and these were applied over a specific five-year forecast period. The growth rate used to extrapolate cash flows

J&T FINANCE GROUP SE
Notes to the consolidated financial statements
for the year ended 31 December 2017
31
beyond this period was 2.0%-2.2% (2016: 2.2%). Expected future cash flows were discounted using a WACC of 6.51%-
6.71% (2016: 6.69%).
There was no impairment loss identified as a result of this impairment test. Should net interest income decrease by 10%, the
value in use would decrease and an impairment of EUR 128,560 thousand would have to be recognized (2016: EUR 116,330
thousand).
Wine activities
The acquisition of the French winery Chateau Teyssier (Societe civile) and its distribution network through the purchase of a
100% share in Outsider LLC and an 80% share in Saxonwold Ltd resulted into recognition of goodwill in the amount of
EUR 3,606 thousand. The goodwill relates to the cash generating unit represented by OUTSIDER LIMITED, Chateau
Teyssier (Société civile), CT Domaines, SAXONWOLD LIMITED and World’s End2. As at 31 December 2017 the
recoverable amount of this cash generating unit exceeds its carrying amount of EUR 34,300 thousand (share controlled by
the Group). There was no impairment loss identified as a result of the impairment test.
4.4. Determination of control over investment funds
Management applies its judgement to determine whether the control indicators set out in Note 3 (a) indicate that the Group
controls an investment fund. The Group acts as fund manager to a number of investment funds. Determining whether the
Group controls such an investment fund usually focuses on the assessment of the aggregate economic interests of the Group
in the fund (comprising any carried interests and expected management fees) and the investors’ rights to remove the fund
manager. As a result, the Group has concluded that it acts as agent for the investors in all cases, except for J&T REALITY
otevřený podílový fond and as described below (please refer to section 46. Group entities for detailed overview of the scope
of consolidation).
After the change in the statute of NOVA Hotels otevřený podílový fond REDSIDE investiční společnost, a.s. in 2017,
which newly gave the investors the right to participate in shareholder meetings and to pass a resolution with a majority of
75% the voting rights, J&T FINANCE GROUP SE gained control over the fund. Furthermore, in 2017 J&T FINANCE
GROUP SE bought the founders’ shares of Compact Property Fund, investiční fond s proměnným základním kapitálem,
a.s. with attached voting rights, thus the Group gained control over the fund.
2 The Czech winery KOLBY a.s. is not part of this cash generating unit.
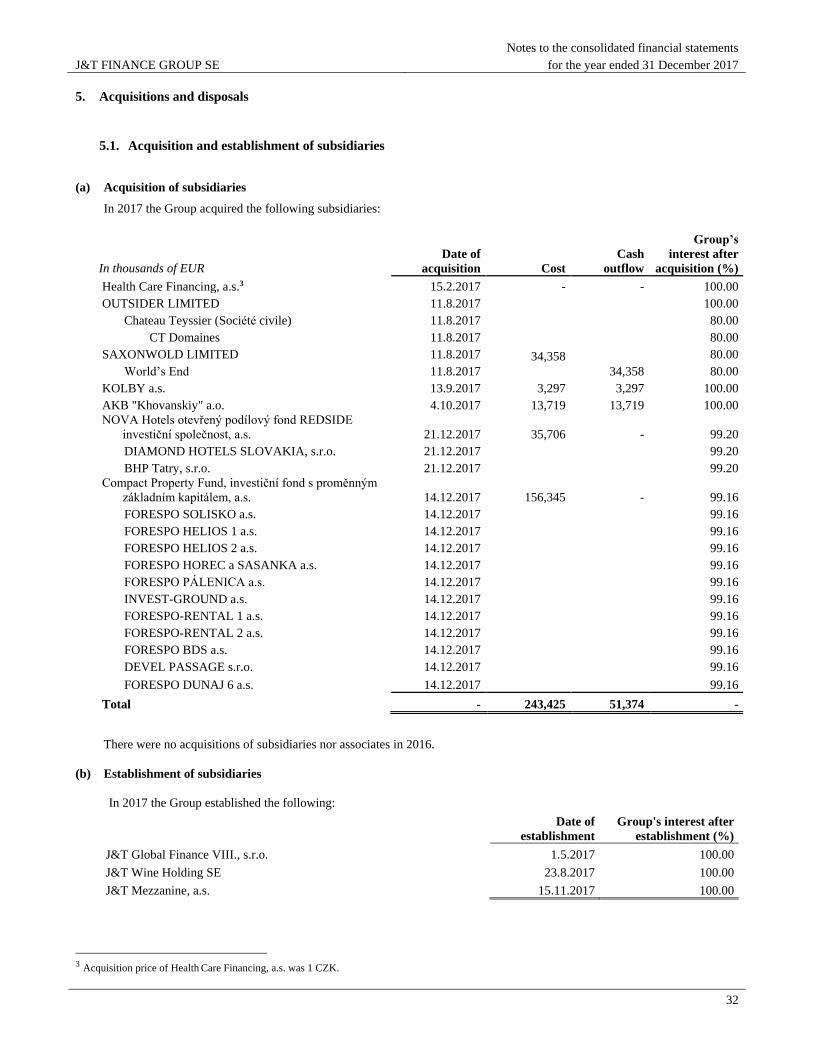
J&T FINANCE GROUP SE
Notes to the consolidated financial statements
for the year ended 31 December 2017
32
5. Acquisitions and disposals
5.1. Acquisition and establishment of subsidiaries
(a) Acquisition of subsidiaries
In 2017 the Group acquired the following subsidiaries:
There were no acquisitions of subsidiaries nor associates in 2016.
(b) Establishment of subsidiaries
In 2017 the Group established the following:
Date of
establishment
Group's interest after
establishment (%)
J&T Global Finance VIII., s.r.o. 1.5.2017 100.00
J&T Wine Holding SE 23.8.2017 100.00
J&T Mezzanine, a.s. 15.11.2017 100.00
3 Acquisition price of Health Care Financing, a.s. was 1 CZK.
In thousands of EUR
Date of
acquisition Cost
Cash
outflow
Group’s
interest after
acquisition (%)
Health Care Financing, a.s.3 15.2.2017 - - 100.00
OUTSIDER LIMITED 11.8.2017
34,358
34,358
100.00
Chateau Teyssier (Société civile) 11.8.2017 80.00
CT Domaines 11.8.2017 80.00
SAXONWOLD LIMITED 11.8.2017 80.00
World’s End 11.8.2017 80.00
KOLBY a.s. 13.9.2017 3,297 3,297 100.00
AKB "Khovanskiy" a.o. 4.10.2017 13,719 13,719 100.00
NOVA Hotels otevřený podílový fond REDSIDE
investiční společnost, a.s. 21.12.2017 35,706 - 99.20
DIAMOND HOTELS SLOVAKIA, s.r.o. 21.12.2017
99.20
BHP Tatry, s.r.o. 21.12.2017
99.20
Compact Property Fund, investiční fond s proměnným
základním kapitálem, a.s. 14.12.2017 156,345 - 99.16
FORESPO SOLISKO a.s. 14.12.2017
99.16
FORESPO HELIOS 1 a.s. 14.12.2017
99.16
FORESPO HELIOS 2 a.s. 14.12.2017
99.16
FORESPO HOREC a SASANKA a.s. 14.12.2017
99.16
FORESPO PÁLENICA a.s. 14.12.2017
99.16
INVEST-GROUND a.s. 14.12.2017
99.16
FORESPO-RENTAL 1 a.s. 14.12.2017
99.16
FORESPO-RENTAL 2 a.s. 14.12.2017
99.16
FORESPO BDS a.s. 14.12.2017
99.16
DEVEL PASSAGE s.r.o. 14.12.2017
99.16
FORESPO DUNAJ 6 a.s. 14.12.2017
99.16
Total - 243,425 51,374 -
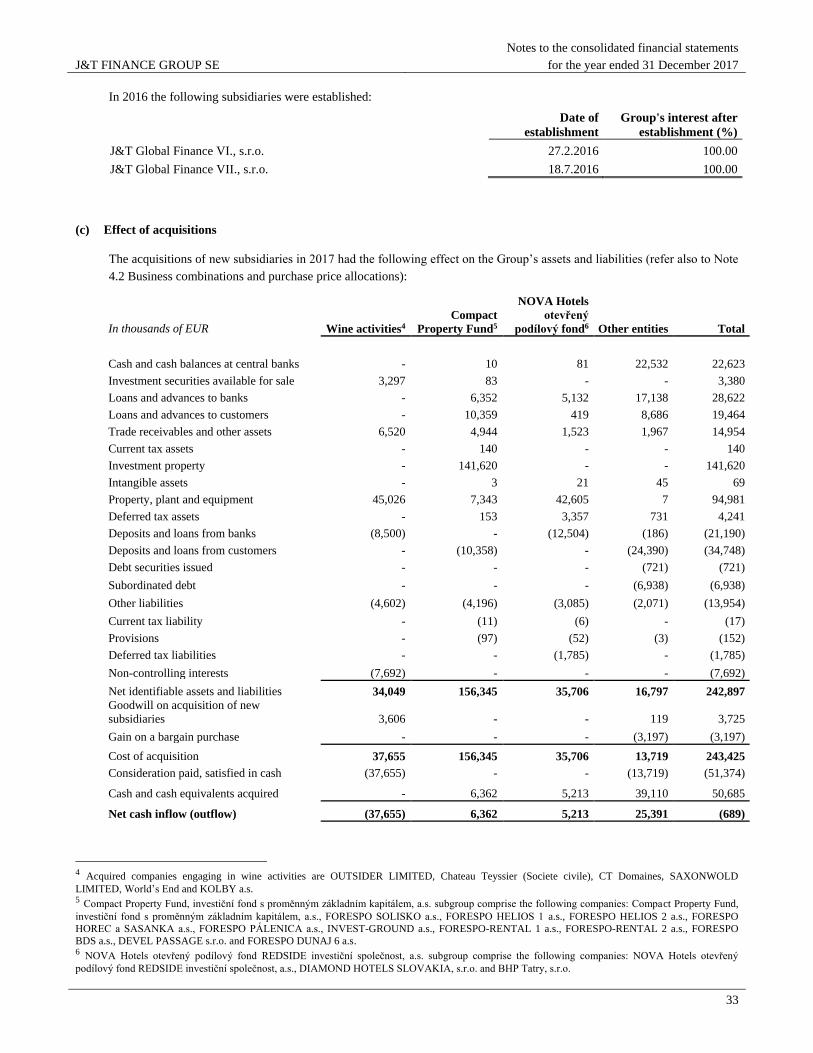
J&T FINANCE GROUP SE
Notes to the consolidated financial statements
for the year ended 31 December 2017
33
In 2016 the following subsidiaries were established:
Date of
establishment
Group's interest after
establishment (%)
J&T Global Finance VI., s.r.o. 27.2.2016 100.00
J&T Global Finance VII., s.r.o. 18.7.2016 100.00
(c) Effect of acquisitions
The acquisitions of new subsidiaries in 2017 had the following effect on the Group’s assets and liabilities (refer also to Note
4.2 Business combinations and purchase price allocations):
In thousands of EUR Wine activities4
Compact
Property Fund5
NOVA Hotels
otevřený
podílový fond6 Other entities Total
Cash and cash balances at central banks - 10 81 22,532 22,623
Investment securities available for sale 3,297 83 - - 3,380
Loans and advances to banks - 6,352 5,132 17,138 28,622
Loans and advances to customers - 10,359 419 8,686 19,464
Trade receivables and other assets 6,520 4,944 1,523 1,967 14,954
Current tax assets - 140 - - 140
Investment property - 141,620 - - 141,620
Intangible assets - 3 21 45 69
Property, plant and equipment 45,026 7,343 42,605 7 94,981
Deferred tax assets - 153 3,357 731 4,241
Deposits and loans from banks (8,500) - (12,504) (186) (21,190)
Deposits and loans from customers - (10,358) - (24,390) (34,748)
Debt securities issued - - - (721) (721)
Subordinated debt - - - (6,938) (6,938)
Other liabilities (4,602) (4,196) (3,085) (2,071) (13,954)
Current tax liability - (11) (6) - (17)
Provisions - (97) (52) (3) (152)
Deferred tax liabilities - - (1,785) - (1,785)
Non-controlling interests (7,692) - - - (7,692)
Net identifiable assets and liabilities 34,049 156,345 35,706 16,797 242,897
Goodwill on acquisition of new
subsidiaries 3,606 - - 119 3,725
Gain on a bargain purchase - - - (3,197) (3,197)
Cost of acquisition 37,655 156,345 35,706 13,719 243,425
Consideration paid, satisfied in cash (37,655) - - (13,719) (51,374)
Cash and cash equivalents acquired - 6,362 5,213 39,110 50,685
Net cash inflow (outflow) (37,655) 6,362 5,213 25,391 (689)
4 Acquired companies engaging in wine activities are OUTSIDER LIMITED, Chateau Teyssier (Societe civile), CT Domaines, SAXONWOLD
LIMITED, World’s End and KOLBY a.s. 5 Compact Property Fund, investiční fond s proměnným základním kapitálem, a.s. subgroup comprise the following companies: Compact Property Fund,
investiční fond s proměnným základním kapitálem, a.s., FORESPO SOLISKO a.s., FORESPO HELIOS 1 a.s., FORESPO HELIOS 2 a.s., FORESPO
HOREC a SASANKA a.s., FORESPO PÁLENICA a.s., INVEST-GROUND a.s., FORESPO-RENTAL 1 a.s., FORESPO-RENTAL 2 a.s., FORESPO
BDS a.s., DEVEL PASSAGE s.r.o. and FORESPO DUNAJ 6 a.s. 6 NOVA Hotels otevřený podílový fond REDSIDE investiční společnost, a.s. subgroup comprise the following companies: NOVA Hotels otevřený
podílový fond REDSIDE investiční společnost, a.s., DIAMOND HOTELS SLOVAKIA, s.r.o. and BHP Tatry, s.r.o.
J&T FINANCE GROUP SE
Notes to the consolidated financial statements
for the year ended 31 December 2017
34
In thousands of EUR Wine activities4
Compact
Property Fund5
NOVA Hotels
otevřený
podílový fond6 Other entities Total
Profit (loss) since acquisition date (59) - - (19) (78)
Profit (loss) of the acquired entity for all of
2017 (13) (7,406) 956 762 (5,701)
Revenues of the acquired entity for all of
2017 - (7,328) (13) 3,051 (4,290)
5.2. Disposals
(a) Disposals of subsidiaries
The following disposals occurred in 2017 and in 2016:
In thousands of EUR
Date of
disposal
Other
assets
disposed of
Cash
inflow
Gain (loss) on
disposal/liquidation
31 December 2017
PB IT, a.s. v likvidácii 1.1.2017 183 - -
Total 183 - -
31 December 2016
J&T Global Finance I., B.V. 1.1.2016 17 17 13
J&T Global Finance II., B.V. 1.1.2016 18 18 (5)
J&T Cafe, s.r.o. 1.1.2016 4 4 (1)
ART FOND - Stredoeurópský fond súčasného umenia, a.s. 24.2.2016 281 281 11
ABS Property Limited 31.5.2016 2,173 2,173 459
Total 2,493 2,493 477
On 1 January 2017 PB IT, a.s. v likvidácii entered into liquidation, which was completed in February 2018 by selling of the
remaining assets of this company.
J&T FINANCE GROUP SE
Notes to the consolidated financial statements
for the year ended 31 December 2017
35
(b) Effect of disposals
The disposals of subsidiaries had the following effect on the Group’s assets and liabilities:
Effect of disposals in 2017
Effect of disposals in 2016
In thousands of EUR
ABS Property
Limited Other Total effect
Cash and cash balances at central banks 16 346 362
Financial assets available for sale - 103 103
Trade receivables and other assets 571 3 574
Current tax assets - 3 3
Intangible assets - 2 2
Property, plant and equipment 5,469 316 5,785
Deferred tax assets 948 - 948
Deposits and loans from banks (2,281) - (2,281)
Deposits and loans from customers (2,666) - (2,666)
Other liabilities (73) (10) (83)
Non-controlling interests - (423) (423)
Net assets and liabilities 1,984 340 2,324
Receivables sold in related transaction - 2 2
Cumulative income and expense included in other comprehensive income
reclassified to profit or loss (270) (40) (310)
Sales price 2,173 320 2,493
Gain on disposal 459 18 477
Consideration received, satisfied in cash 2,173 320 2,493
Cash disposed of (16) (346) (362)
Net cash inflow (outflow) 2,157 (26) 2,131
In thousands of EUR PB IT, a.s. v likvidácii
Cash and cash balances at central banks 123
Current tax assets 77
Other liabilities (5)
Non-controlling interests (12)
Net assets and liabilities 183
Receivables sold in related transaction -
Sales price -
Other values acquired 183
Gain on disposal -
Consideration received, satisfied in cash -
Cash disposed of (123)
Net cash inflow (outflow) (123)
J&T FINANCE GROUP SE
Notes to the consolidated financial statements
for the year ended 31 December 2017
36
6. Net interest income
In thousands of EUR 2017 2016
Interest income
Loans and advances to banks and customers 344,189 347,803
Bonds and other fixed income securities 36,598 43,084
Repo transactions 6,636 8,295
Bills of exchange 2,301 11,680
Receivables from central banks 4,430 1,056
Other 10,900 11,760
Total interest income 405,054 423,678
Interest expense
Deposits and loans from banks and customers (68,123) (108,195)
Bonds and other securities with fixed interest rate (22,517) (24,429)
Bills of exchange (1,001) (1,189)
Hedging derivatives (1,122) (893)
Repo transactions (741) (48)
Other (2,593) (6,353)
Total interest expense (96,097) (141,107)
Total net interest income 308,957 282,571
The interest income from loans classified as impaired and accrued in 2017 was EUR 17,851 thousand (2016: EUR 18,541
thousand).
Interest income from financial assets that are not at fair value through profit or loss in 2017 was EUR 399,614 thousand
(2016: EUR 416,833 thousand). Interest expense from financial liabilities that are not at fair value through profit or loss in
2017 was EUR 96,097 thousand (2016: EUR 141,107 thousand).
Interest expense from hedging derivatives includes accrued interest from interest rate derivatives used to hedge interest rate
risk.
Other interest income of EUR 10,900 thousand includes a negative interest on Deposits and loans from banks of EUR 2,150
thousand (2016: EUR 73 thousand). Refer to Note 29. Deposits and loans from banks.
J&T FINANCE GROUP SE
Notes to the consolidated financial statements
for the year ended 31 December 2017
37
7. Net fee and commission income
In thousands of EUR 2017 2016
Fee and commission income
Fees on administration and payment transactions 32,390 33,957
Fees on assets under management 28,592 22,434
Fees on bond issue 12,016 9,862
Fees on financial instrument operations 11,758 12,445
Fees on custody, administration and depositing of valuables 4,611 3,162
Fees on promises and guarantees 3,847 4,502
Intermediation fees 1,297 1,417
Other fees and commission income 20,926 21,129
Total fee and commission income 115,437 108,908
Fee and commission expense
Intermediation fees (11,407) (11,398)
Fees on payment transactions (7,604) (9,350)
Fees on financial instrument operations (7,809) (5,953)
Other fees and commission expenses (8,002) (6,362)
Total fee and commission expense (34,822) (33,063)
Total net fee and commission income 80,615 75,845
Other fees and commission income and expenses include a large number of sundry items that are not significant on an
individual basis.
8. Net dealing profit
In thousands of EUR 2017 2016
Realised and unrealised gains (losses) on financial instruments at fair value (4,363) 49,171
Realised and unrealised gains (losses) from receivables 19,220 (11,054)
Dividend income 5,426 10,965
Exchange rate gain (losses) 58,357 (20,608)
Total net dealing profit 78,640 28,474
The main losses on financial instruments in 2017 were generated from derivatives trading (EUR 19,338 thousand),
predominantely from currency derivatives. These were partially compensated by gains from realization of revaluation reserve
from Compact Property Fund, investiční fond s proměnným základním kapitálem, a.s. in the amount of EUR 5,866 thousand7
and sale of NOVA GREEN ENERGY O.P.F. in amount of EUR 2,326 thousand.
The majority of gains on financial instruments in 2016 were generated from derivatives trading (EUR 14,888 thousand) and
from sale of financial instruments of Energochemica in the amount of EUR 5,651 thousand, J&T Investments Pools in the
amount of EUR 6,981 thousand and VISA Europe in the amount of EUR 3,148 thousand.
Realised and unrealised gains (losses) on financial instruments at fair value include gains and losses from hedging.
The losses on the hedged items attributable to the hedged risks amount to EUR (11,468) thousand (2016: EUR (3,723)
thousand). The gains on the hedging instruments amount to EUR 11,596 thousand (2016: EUR 3,685 thousand).
7 When control over the entity previously classified as available for sale instrument is gained, the financial instrument is derecognized and instead the
underlying net assets of the entity are fully consolidated from this moment on.
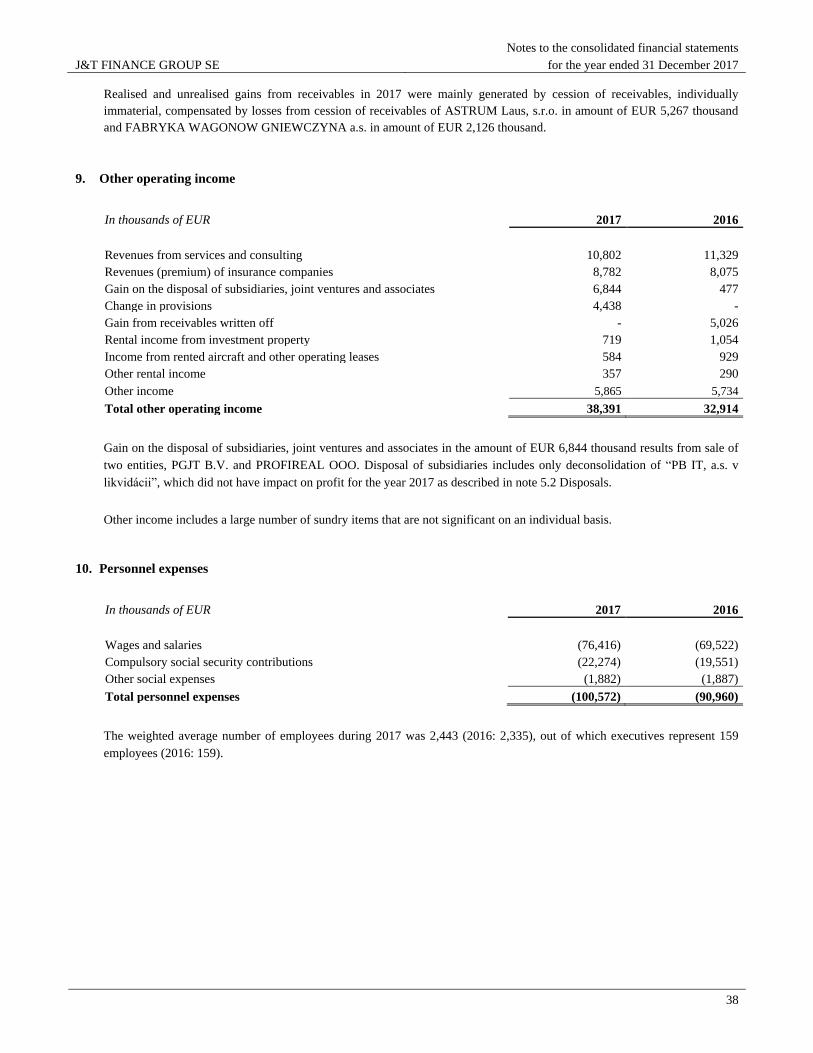
J&T FINANCE GROUP SE
Notes to the consolidated financial statements
for the year ended 31 December 2017
38
Realised and unrealised gains from receivables in 2017 were mainly generated by cession of receivables, individually
immaterial, compensated by losses from cession of receivables of ASTRUM Laus, s.r.o. in amount of EUR 5,267 thousand
and FABRYKA WAGONOW GNIEWCZYNA a.s. in amount of EUR 2,126 thousand.
9. Other operating income
In thousands of EUR 2017 2016
Revenues from services and consulting 10,802 11,329
Revenues (premium) of insurance companies 8,782 8,075
Gain on the disposal of subsidiaries, joint ventures and associates 6,844 477
Change in provisions 4,438 -
Gain from receivables written off - 5,026
Rental income from investment property 719 1,054
Income from rented aircraft and other operating leases 584 929
Other rental income 357 290
Other income 5,865 5,734
Total other operating income 38,391 32,914
Gain on the disposal of subsidiaries, joint ventures and associates in the amount of EUR 6,844 thousand results from sale of
two entities, PGJT B.V. and PROFIREAL OOO. Disposal of subsidiaries includes only deconsolidation of “PB IT, a.s. v
likvidácii”, which did not have impact on profit for the year 2017 as described in note 5.2 Disposals.
Other income includes a large number of sundry items that are not significant on an individual basis.
10. Personnel expenses
In thousands of EUR 2017 2016
Wages and salaries (76,416) (69,522)
Compulsory social security contributions (22,274) (19,551)
Other social expenses (1,882) (1,887)
Total personnel expenses (100,572) (90,960)
The weighted average number of employees during 2017 was 2,443 (2016: 2,335), out of which executives represent 159
employees (2016: 159).
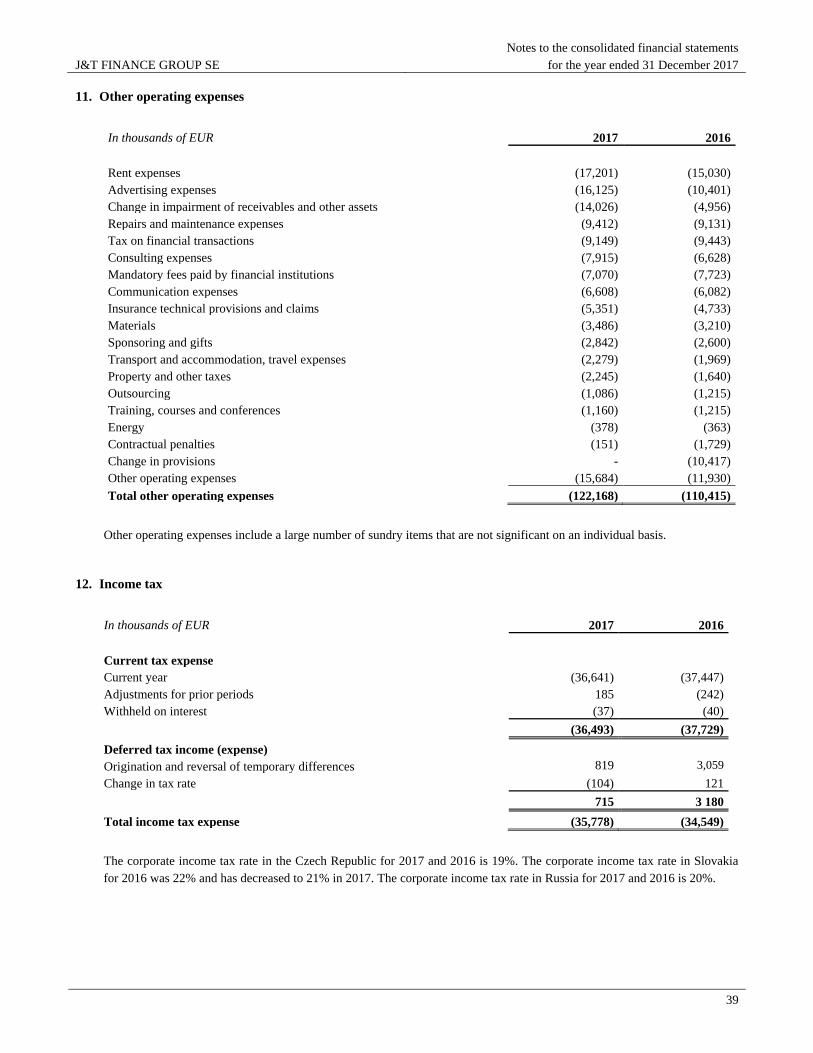
J&T FINANCE GROUP SE
Notes to the consolidated financial statements
for the year ended 31 December 2017
39
11. Other operating expenses
In thousands of EUR 2017 2016
Rent expenses (17,201) (15,030)
Advertising expenses (16,125) (10,401)
Change in impairment of receivables and other assets (14,026) (4,956)
Repairs and maintenance expenses (9,412) (9,131)
Tax on financial transactions (9,149) (9,443)
Consulting expenses (7,915) (6,628)
Mandatory fees paid by financial institutions (7,070) (7,723)
Communication expenses (6,608) (6,082)
Insurance technical provisions and claims (5,351) (4,733)
Materials (3,486) (3,210)
Sponsoring and gifts (2,842) (2,600)
Transport and accommodation, travel expenses (2,279) (1,969)
Property and other taxes (2,245) (1,640)
Outsourcing (1,086) (1,215)
Training, courses and conferences (1,160) (1,215)
Energy (378) (363)
Contractual penalties (151) (1,729)
Change in provisions - (10,417)
Other operating expenses (15,684) (11,930)
Total other operating expenses (122,168) (110,415)
Other operating expenses include a large number of sundry items that are not significant on an individual basis.
12. Income tax
In thousands of EUR 2017 2016
Current tax expense
Current year (36,641) (37,447)
Adjustments for prior periods 185 (242)
Withheld on interest (37) (40)
(36,493) (37,729)
Deferred tax income (expense)
Origination and reversal of temporary differences 819 3,059
Change in tax rate (104) 121
715 3 180
Total income tax expense (35,778) (34,549)
The corporate income tax rate in the Czech Republic for 2017 and 2016 is 19%. The corporate income tax rate in Slovakia
for 2016 was 22% and has decreased to 21% in 2017. The corporate income tax rate in Russia for 2017 and 2016 is 20%.

J&T FINANCE GROUP SE
Notes to the consolidated financial statements
for the year ended 31 December 2017
40
(i) Reconciliation of the effective tax rate
In thousands of EUR 2017
2016
% %
Profit before tax 173,288
96,378
Income tax at 19% (2016: 19%) (19.0) (32,925)
(19.0) (18,321)
Effect of tax rates in foreign jurisdictions (2.0) (1,935)
(2.2) (2,163)
Non-deductible expenses (15.3) (14,758)
(26.1) (25,176)
Non-taxable income 14.6 14,054
13.4 12,954
Tax withheld on interest (0.0) (37)
(0.0) (40)
Recognition of previously unrecognised tax losses 0.2 212
0.8 779
Current year tax losses for which no deferred tax asset was
recognised (0.5) (482)
(2.5) (2,402)
Change in temporary differences for which no deferred tax asset
was recorded (0.0) -
(0.0) (8)
Deffered tax – current period adjustment for DT recognized in
prior period (0.0) 12 (0.1) (60)
Tax charges over provided in prior years 0.2 185 (0.3) (242)
Change in tax rate (0.1) (104)
0.1 121
Total income tax expense (20.6) (35,778) (35.8) (34,549)
(ii) Income tax recognized in other comprehensive income
In thousands of EUR 2017
2016
Before tax
Tax
benefit Net of tax
Before
tax
Tax
expense Net of tax
Foreign exchange translation differences 16,190 - 16,190
22,910 - 22,910
Change in fair value of financial assets
available for sale 2,616 (103) 2,513 (9,668) 1,096 (8,572)
Share of other comprehensive income of
equity accounted investees 30 - 30 130 - 130
Total 18,836 (103) 18,733 13,372 1,096 14,468
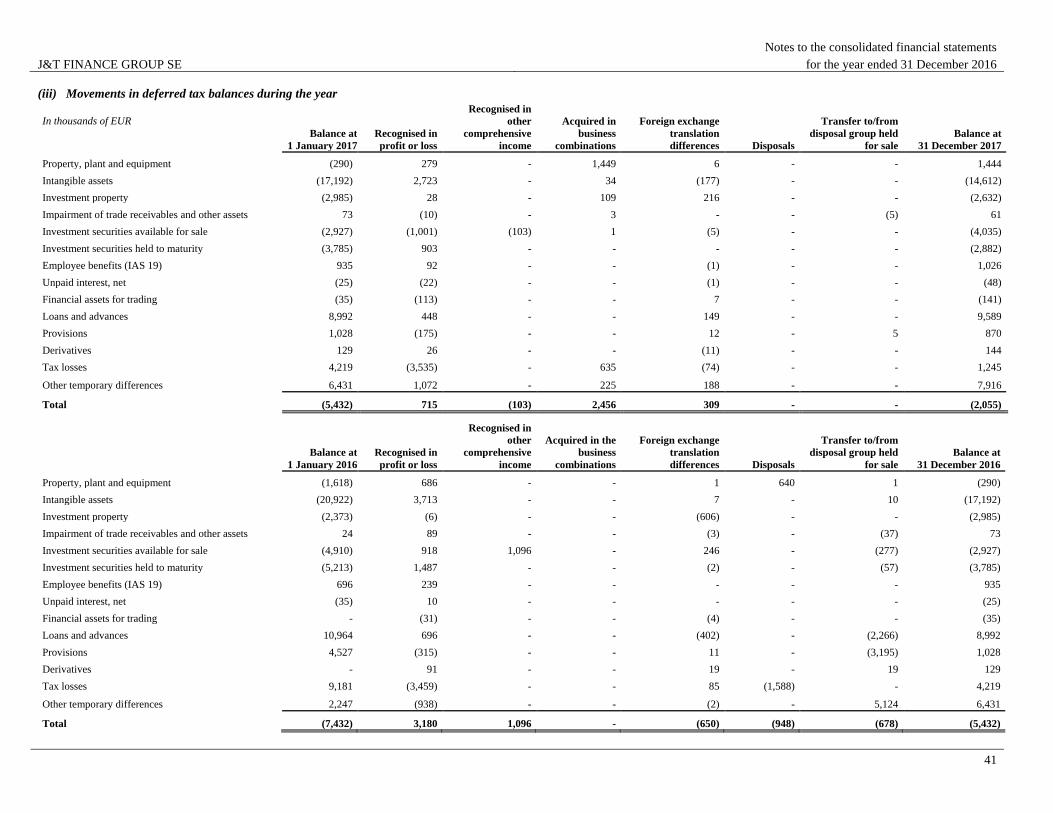
J&T FINANCE GROUP SE
Notes to the consolidated financial statements
for the year ended 31 December 2016
41
(iii) Movements in deferred tax balances during the year
In thousands of EUR
Balance at
1 January 2017
Recognised in
profit or loss
Recognised in
other
comprehensive
income
Acquired in
business
combinations
Foreign exchange
translation
differences Disposals
Transfer to/from
disposal group held
for sale
Balance at
31 December 2017
Property, plant and equipment (290) 279 - 1,449 6 - - 1,444
Intangible assets (17,192) 2,723 - 34 (177) - - (14,612)
Investment property (2,985) 28 - 109 216 - - (2,632)
Impairment of trade receivables and other assets 73 (10) - 3 - - (5) 61
Investment securities available for sale (2,927) (1,001) (103) 1 (5) - - (4,035)
Investment securities held to maturity (3,785) 903 - - - - - (2,882)
Employee benefits (IAS 19) 935 92 - - (1) - - 1,026
Unpaid interest, net (25) (22) - - (1) - - (48)
Financial assets for trading (35) (113) - - 7 - - (141)
Loans and advances 8,992 448 - - 149 - - 9,589
Provisions 1,028 (175) - - 12 - 5 870
Derivatives 129 26 - - (11) - - 144
Tax losses 4,219 (3,535) - 635 (74) - - 1,245
Other temporary differences 6,431 1,072 - 225 188 - - 7,916
Total (5,432) 715 (103) 2,456 309 - - (2,055)
Balance at
1 January 2016
Recognised in
profit or loss
Recognised in
other
comprehensive
income
Acquired in the
business
combinations
Foreign exchange
translation
differences Disposals
Transfer to/from
disposal group held
for sale
Balance at
31 December 2016
Property, plant and equipment (1,618) 686 - - 1 640 1 (290)
Intangible assets (20,922) 3,713 - - 7 - 10 (17,192)
Investment property (2,373) (6) - - (606) - - (2,985)
Impairment of trade receivables and other assets 24 89 - - (3) - (37) 73
Investment securities available for sale (4,910) 918 1,096 - 246 - (277) (2,927)
Investment securities held to maturity (5,213) 1,487 - - (2) - (57) (3,785)
Employee benefits (IAS 19) 696 239 - - - - - 935
Unpaid interest, net (35) 10 - - - - - (25)
Financial assets for trading - (31) - - (4) - - (35)
Loans and advances 10,964 696 - - (402) - (2,266) 8,992
Provisions 4,527 (315) - - 11 - (3,195) 1,028
Derivatives - 91 - - 19 - 19 129
Tax losses 9,181 (3,459) - - 85 (1,588) - 4,219
Other temporary differences 2,247 (938) - - (2) - 5,124 6,431
Total (7,432) 3,180 1,096 - (650) (948) (678) (5,432)
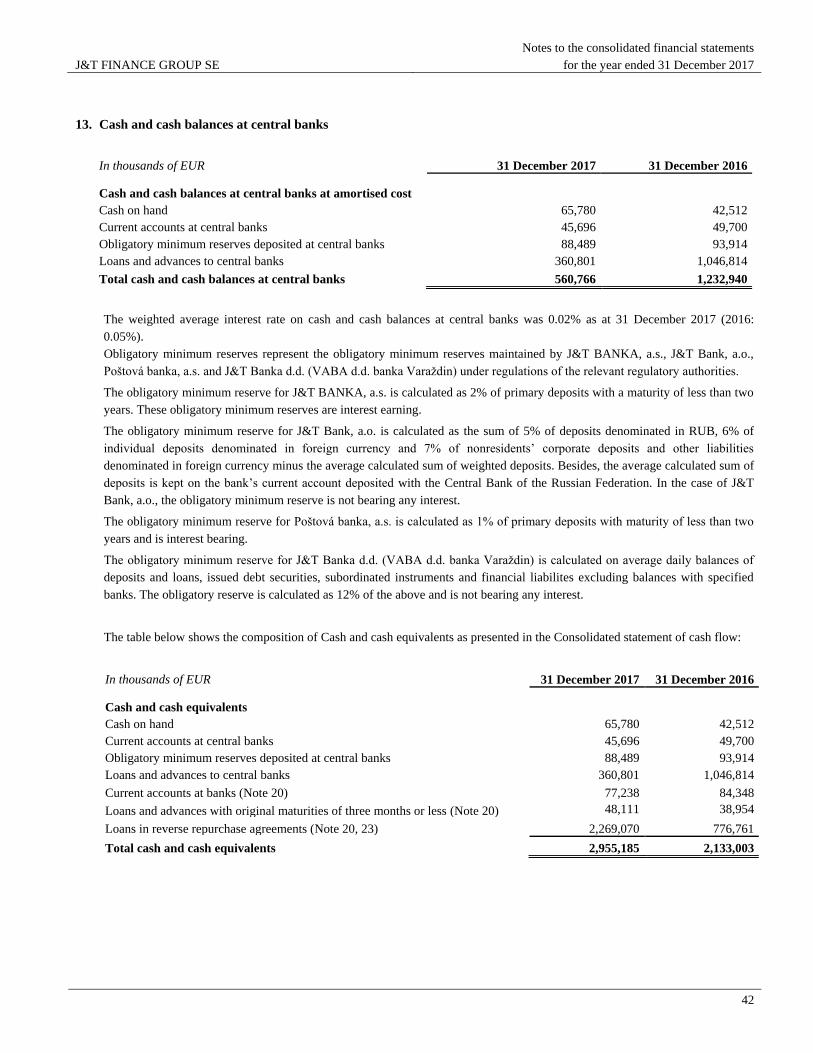
J&T FINANCE GROUP SE
Notes to the consolidated financial statements
for the year ended 31 December 2017
42
13. Cash and cash balances at central banks
In thousands of EUR 31 December 2017 31 December 2016
Cash and cash balances at central banks at amortised cost
Cash on hand 65,780 42,512
Current accounts at central banks 45,696 49,700
Obligatory minimum reserves deposited at central banks 88,489 93,914
Loans and advances to central banks 360,801 1,046,814
Total cash and cash balances at central banks 560,766 1,232,940
The weighted average interest rate on cash and cash balances at central banks was 0.02% as at 31 December 2017 (2016:
0.05%).
Obligatory minimum reserves represent the obligatory minimum reserves maintained by J&T BANKA, a.s., J&T Bank, a.o.,
Poštová banka, a.s. and J&T Banka d.d. (VABA d.d. banka Varaždin) under regulations of the relevant regulatory authorities.
The obligatory minimum reserve for J&T BANKA, a.s. is calculated as 2% of primary deposits with a maturity of less than two
years. These obligatory minimum reserves are interest earning.
The obligatory minimum reserve for J&T Bank, a.o. is calculated as the sum of 5% of deposits denominated in RUB, 6% of
individual deposits denominated in foreign currency and 7% of nonresidents’ corporate deposits and other liabilities
denominated in foreign currency minus the average calculated sum of weighted deposits. Besides, the average calculated sum of
deposits is kept on the bank’s current account deposited with the Central Bank of the Russian Federation. In the case of J&T
Bank, a.o., the obligatory minimum reserve is not bearing any interest.
The obligatory minimum reserve for Poštová banka, a.s. is calculated as 1% of primary deposits with maturity of less than two
years and is interest bearing.
The obligatory minimum reserve for J&T Banka d.d. (VABA d.d. banka Varaždin) is calculated on average daily balances of
deposits and loans, issued debt securities, subordinated instruments and financial liabilites excluding balances with specified
banks. The obligatory reserve is calculated as 12% of the above and is not bearing any interest.
The table below shows the composition of Cash and cash equivalents as presented in the Consolidated statement of cash flow:
In thousands of EUR 31 December 2017 31 December 2016
Cash and cash equivalents
Cash on hand 65,780 42,512
Current accounts at central banks 45,696 49,700
Obligatory minimum reserves deposited at central banks 88,489 93,914
Loans and advances to central banks 360,801 1,046,814
Current accounts at banks (Note 20) 77,238 84,348
Loans and advances with original maturities of three months or less (Note 20) 48,111 38,954
Loans in reverse repurchase agreements (Note 20, 23) 2,269,070 776,761
Total cash and cash equivalents 2,955,185 2,133,003
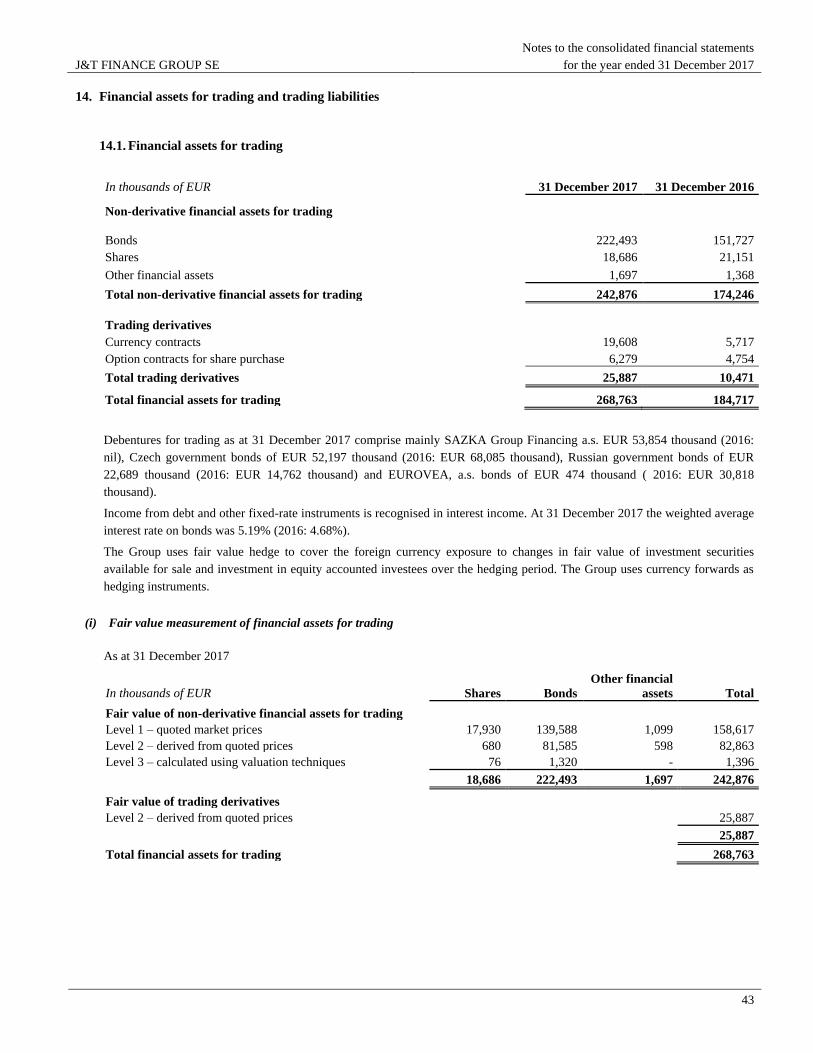
J&T FINANCE GROUP SE
Notes to the consolidated financial statements
for the year ended 31 December 2017
43
14. Financial assets for trading and trading liabilities
14.1. Financial assets for trading
In thousands of EUR 31 December 2017 31 December 2016
Non-derivative financial assets for trading
Bonds 222,493 151,727
Shares 18,686 21,151
Other financial assets 1,697 1,368
Total non-derivative financial assets for trading 242,876 174,246
Trading derivatives
Currency contracts 19,608 5,717
Option contracts for share purchase 6,279 4,754
Total trading derivatives 25,887 10,471
Total financial assets for trading 268,763 184,717
Debentures for trading as at 31 December 2017 comprise mainly SAZKA Group Financing a.s. EUR 53,854 thousand (2016:
nil), Czech government bonds of EUR 52,197 thousand (2016: EUR 68,085 thousand), Russian government bonds of EUR
22,689 thousand (2016: EUR 14,762 thousand) and EUROVEA, a.s. bonds of EUR 474 thousand ( 2016: EUR 30,818
thousand).
Income from debt and other fixed-rate instruments is recognised in interest income. At 31 December 2017 the weighted average
interest rate on bonds was 5.19% (2016: 4.68%).
The Group uses fair value hedge to cover the foreign currency exposure to changes in fair value of investment securities
available for sale and investment in equity accounted investees over the hedging period. The Group uses currency forwards as
hedging instruments.
(i) Fair value measurement of financial assets for trading
As at 31 December 2017
In thousands of EUR Shares Bonds
Other financial
assets Total
Fair value of non-derivative financial assets for trading
Level 1 – quoted market prices 17,930 139,588 1,099 158,617
Level 2 – derived from quoted prices 680 81,585 598 82,863
Level 3 – calculated using valuation techniques 76 1,320 - 1,396
18,686 222,493 1,697 242,876
Fair value of trading derivatives
Level 2 – derived from quoted prices 25,887
25,887
Total financial assets for trading 268,763
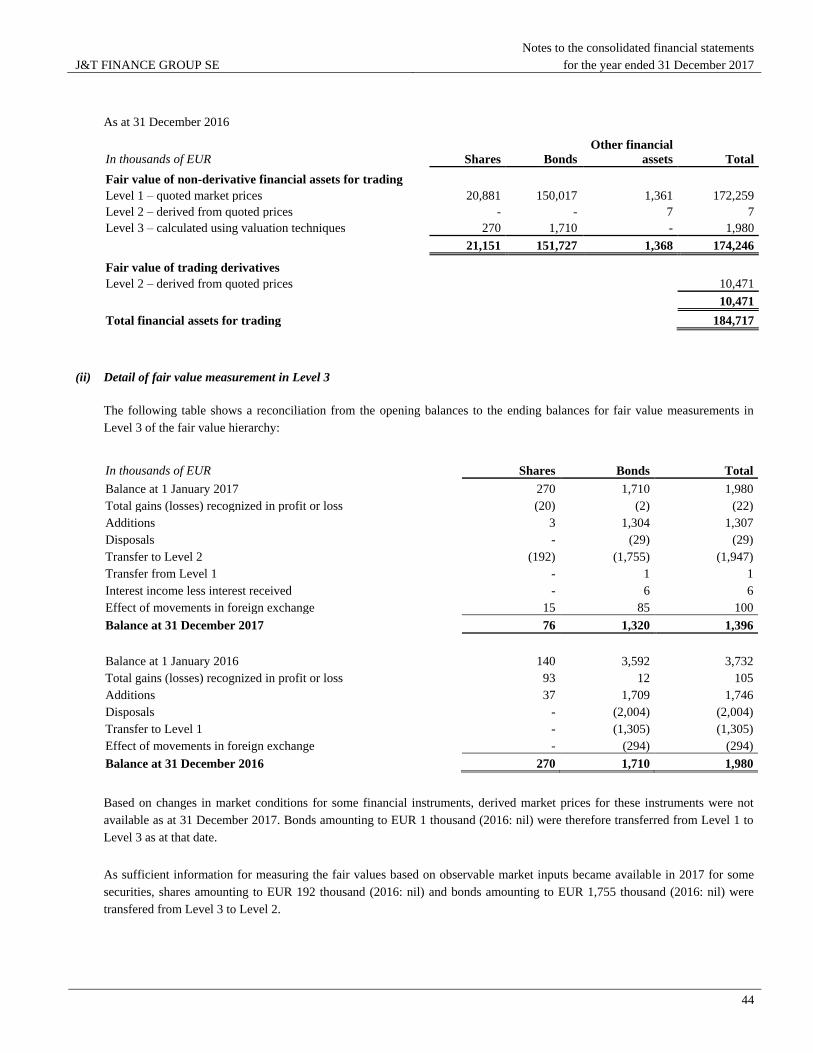
J&T FINANCE GROUP SE
Notes to the consolidated financial statements
for the year ended 31 December 2017
44
As at 31 December 2016
In thousands of EUR Shares Bonds
Other financial
assets Total
Fair value of non-derivative financial assets for trading
Level 1 – quoted market prices 20,881 150,017 1,361 172,259
Level 2 – derived from quoted prices - - 7 7
Level 3 – calculated using valuation techniques 270 1,710 - 1,980
21,151 151,727 1,368 174,246
Fair value of trading derivatives
Level 2 – derived from quoted prices
10,471
10,471
Total financial assets for trading
184,717
(ii) Detail of fair value measurement in Level 3
The following table shows a reconciliation from the opening balances to the ending balances for fair value measurements in
Level 3 of the fair value hierarchy:
In thousands of EUR Shares Bonds Total
Balance at 1 January 2017 270 1,710 1,980
Total gains (losses) recognized in profit or loss (20) (2) (22)
Additions 3 1,304 1,307
Disposals - (29) (29)
Transfer to Level 2 (192) (1,755) (1,947)
Transfer from Level 1 - 1 1
Interest income less interest received - 6 6
Effect of movements in foreign exchange 15 85 100
Balance at 31 December 2017 76 1,320 1,396
Balance at 1 January 2016 140 3,592 3,732
Total gains (losses) recognized in profit or loss 93 12 105
Additions 37 1,709 1,746
Disposals - (2,004) (2,004)
Transfer to Level 1 - (1,305) (1,305)
Effect of movements in foreign exchange - (294) (294)
Balance at 31 December 2016 270 1,710 1,980
Based on changes in market conditions for some financial instruments, derived market prices for these instruments were not
available as at 31 December 2017. Bonds amounting to EUR 1 thousand (2016: nil) were therefore transferred from Level 1 to
Level 3 as at that date.
As sufficient information for measuring the fair values based on observable market inputs became available in 2017 for some
securities, shares amounting to EUR 192 thousand (2016: nil) and bonds amounting to EUR 1,755 thousand (2016: nil) were
transfered from Level 3 to Level 2.
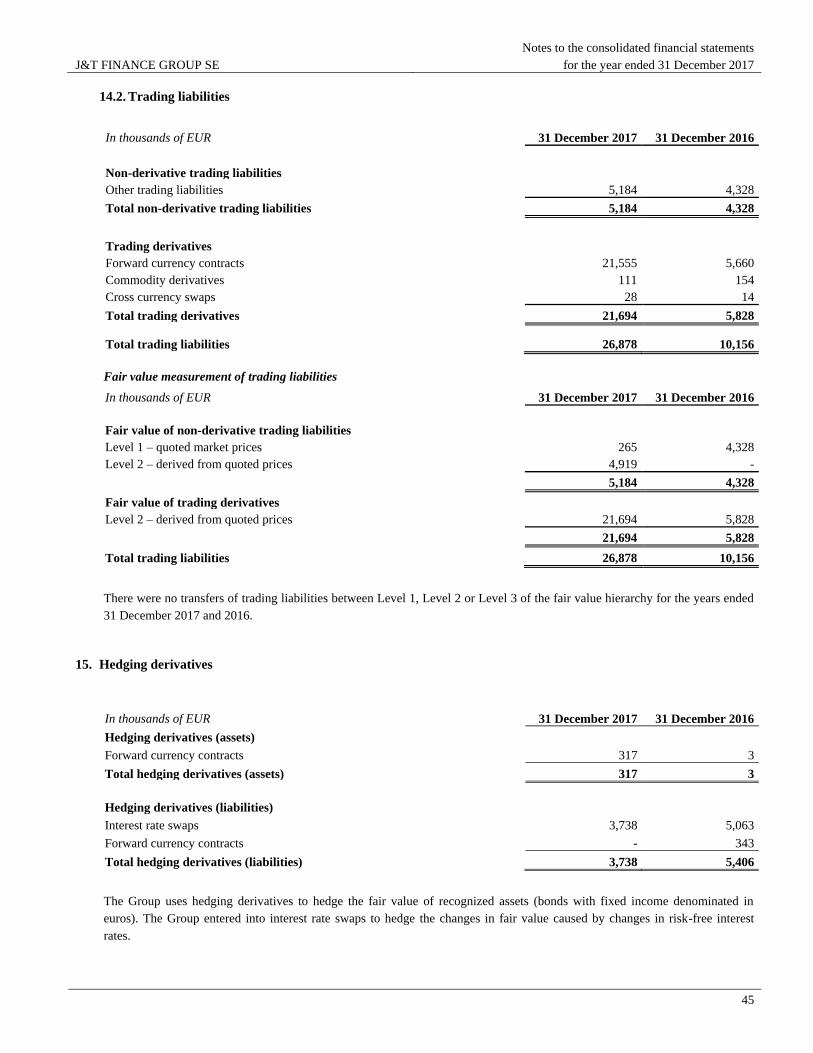
J&T FINANCE GROUP SE
Notes to the consolidated financial statements
for the year ended 31 December 2017
45
14.2. Trading liabilities
In thousands of EUR 31 December 2017 31 December 2016
Non-derivative trading liabilities
Other trading liabilities 5,184 4,328
Total non-derivative trading liabilities 5,184 4,328
Trading derivatives
Forward currency contracts 21,555 5,660
Commodity derivatives 111 154
Cross currency swaps 28 14
Total trading derivatives 21,694 5,828
Total trading liabilities 26,878 10,156
Fair value measurement of trading liabilities
In thousands of EUR 31 December 2017 31 December 2016
Fair value of non-derivative trading liabilities
Level 1 – quoted market prices 265 4,328
Level 2 – derived from quoted prices 4,919 -
5,184 4,328
Fair value of trading derivatives
Level 2 – derived from quoted prices 21,694 5,828
21,694 5,828
Total trading liabilities 26,878 10,156
There were no transfers of trading liabilities between Level 1, Level 2 or Level 3 of the fair value hierarchy for the years ended
31 December 2017 and 2016.
15. Hedging derivatives
In thousands of EUR 31 December 2017 31 December 2016
Hedging derivatives (assets)
Forward currency contracts 317 3
Total hedging derivatives (assets) 317 3
Hedging derivatives (liabilities)
Interest rate swaps 3,738 5,063
Forward currency contracts - 343
Total hedging derivatives (liabilities) 3,738 5,406
The Group uses hedging derivatives to hedge the fair value of recognized assets (bonds with fixed income denominated in
euros). The Group entered into interest rate swaps to hedge the changes in fair value caused by changes in risk-free interest
rates.
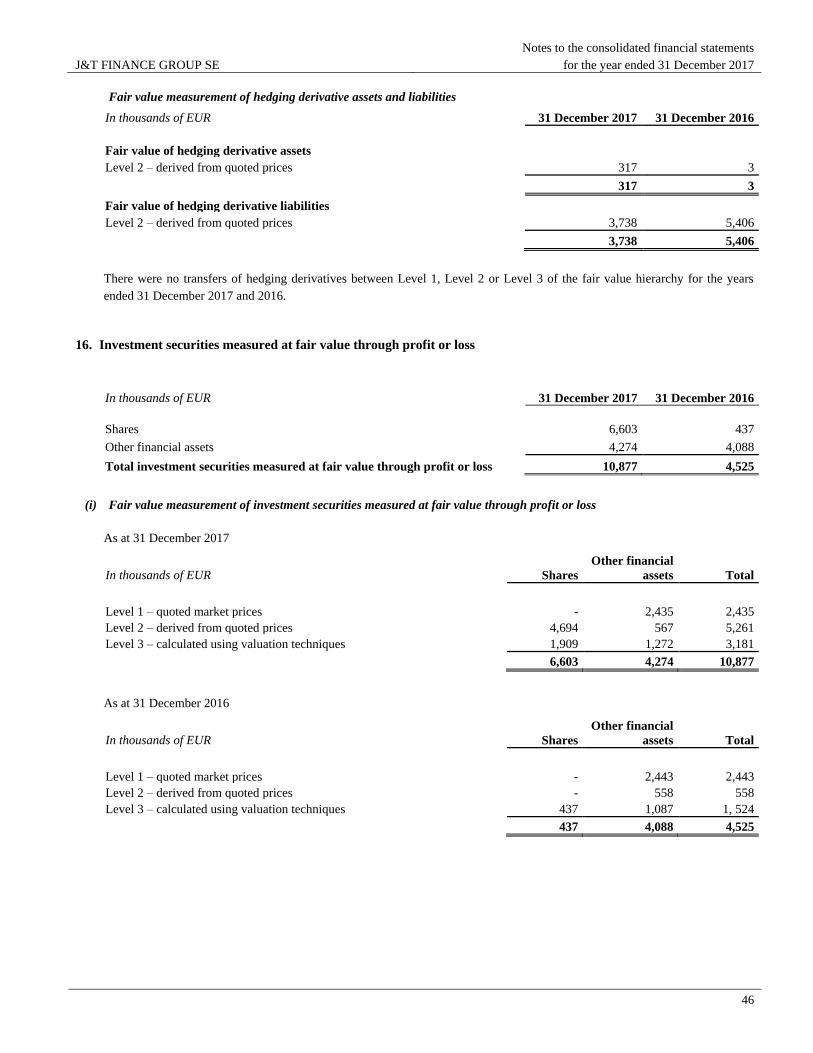
J&T FINANCE GROUP SE
Notes to the consolidated financial statements
for the year ended 31 December 2017
46
Fair value measurement of hedging derivative assets and liabilities
In thousands of EUR 31 December 2017 31 December 2016
Fair value of hedging derivative assets
Level 2 – derived from quoted prices 317 3
317 3
Fair value of hedging derivative liabilities
Level 2 – derived from quoted prices 3,738 5,406
3,738 5,406
There were no transfers of hedging derivatives between Level 1, Level 2 or Level 3 of the fair value hierarchy for the years
ended 31 December 2017 and 2016.
16. Investment securities measured at fair value through profit or loss
In thousands of EUR 31 December 2017 31 December 2016
Shares 6,603 437
Other financial assets 4,274 4,088
Total investment securities measured at fair value through profit or loss 10,877 4,525
(i) Fair value measurement of investment securities measured at fair value through profit or loss
As at 31 December 2017
In thousands of EUR Shares
Other financial
assets Total
Level 1 – quoted market prices - 2,435 2,435
Level 2 – derived from quoted prices 4,694 567 5,261
Level 3 – calculated using valuation techniques 1,909 1,272 3,181
6,603 4,274 10,877
As at 31 December 2016
In thousands of EUR Shares
Other financial
assets Total
Level 1 – quoted market prices - 2,443 2,443
Level 2 – derived from quoted prices - 558 558
Level 3 – calculated using valuation techniques 437 1,087 1, 524
437 4,088 4,525
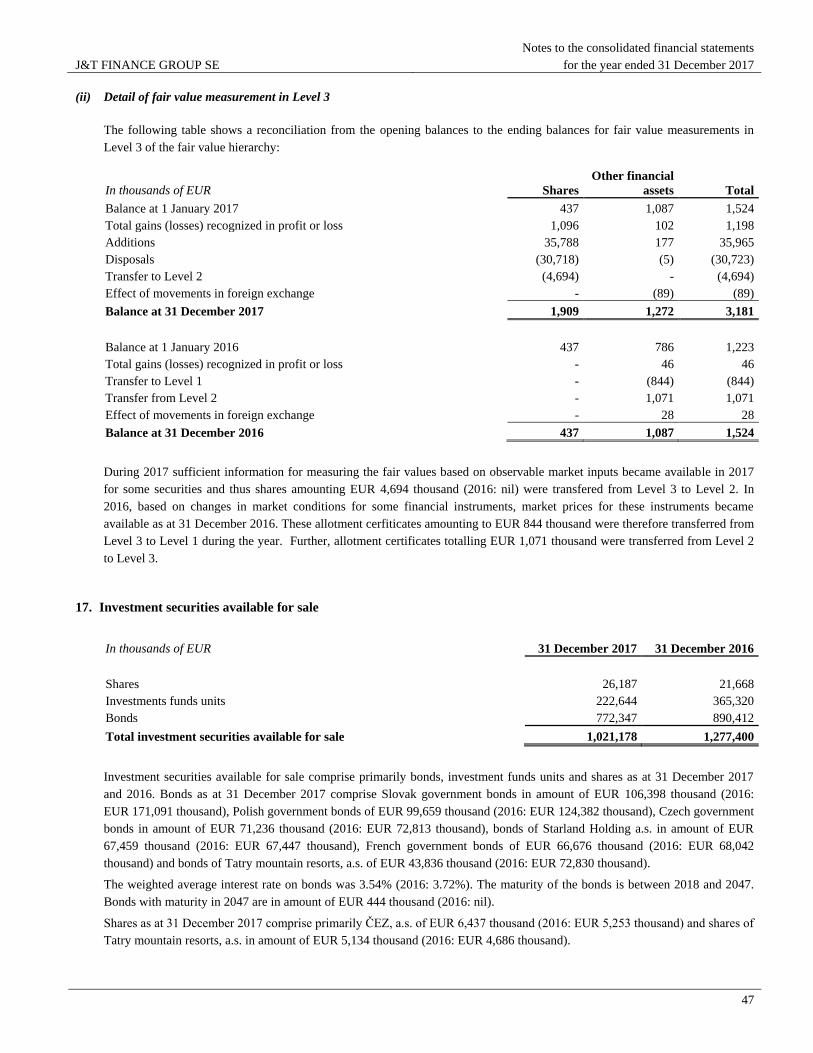
J&T FINANCE GROUP SE
Notes to the consolidated financial statements
for the year ended 31 December 2017
47
(ii) Detail of fair value measurement in Level 3
The following table shows a reconciliation from the opening balances to the ending balances for fair value measurements in
Level 3 of the fair value hierarchy:
In thousands of EUR Shares
Other financial
assets Total
Balance at 1 January 2017 437 1,087 1,524
Total gains (losses) recognized in profit or loss 1,096 102 1,198
Additions 35,788 177 35,965
Disposals (30,718) (5) (30,723)
Transfer to Level 2 (4,694) - (4,694)
Effect of movements in foreign exchange - (89) (89)
Balance at 31 December 2017 1,909 1,272 3,181
Balance at 1 January 2016 437 786 1,223
Total gains (losses) recognized in profit or loss - 46 46
Transfer to Level 1 - (844) (844)
Transfer from Level 2 - 1,071 1,071
Effect of movements in foreign exchange - 28 28
Balance at 31 December 2016 437 1,087 1,524
During 2017 sufficient information for measuring the fair values based on observable market inputs became available in 2017
for some securities and thus shares amounting EUR 4,694 thousand (2016: nil) were transfered from Level 3 to Level 2. In
2016, based on changes in market conditions for some financial instruments, market prices for these instruments became
available as at 31 December 2016. These allotment cerfiticates amounting to EUR 844 thousand were therefore transferred from
Level 3 to Level 1 during the year. Further, allotment certificates totalling EUR 1,071 thousand were transferred from Level 2
to Level 3.
17. Investment securities available for sale
In thousands of EUR 31 December 2017 31 December 2016
Shares 26,187 21,668
Investments funds units 222,644 365,320
Bonds 772,347 890,412
Total investment securities available for sale 1,021,178 1,277,400
Investment securities available for sale comprise primarily bonds, investment funds units and shares as at 31 December 2017
and 2016. Bonds as at 31 December 2017 comprise Slovak government bonds in amount of EUR 106,398 thousand (2016:
EUR 171,091 thousand), Polish government bonds of EUR 99,659 thousand (2016: EUR 124,382 thousand), Czech government
bonds in amount of EUR 71,236 thousand (2016: EUR 72,813 thousand), bonds of Starland Holding a.s. in amount of EUR
67,459 thousand (2016: EUR 67,447 thousand), French government bonds of EUR 66,676 thousand (2016: EUR 68,042
thousand) and bonds of Tatry mountain resorts, a.s. of EUR 43,836 thousand (2016: EUR 72,830 thousand).
The weighted average interest rate on bonds was 3.54% (2016: 3.72%). The maturity of the bonds is between 2018 and 2047.
Bonds with maturity in 2047 are in amount of EUR 444 thousand (2016: nil).
Shares as at 31 December 2017 comprise primarily ČEZ, a.s. of EUR 6,437 thousand (2016: EUR 5,253 thousand) and shares of
Tatry mountain resorts, a.s. in amount of EUR 5,134 thousand (2016: EUR 4,686 thousand).
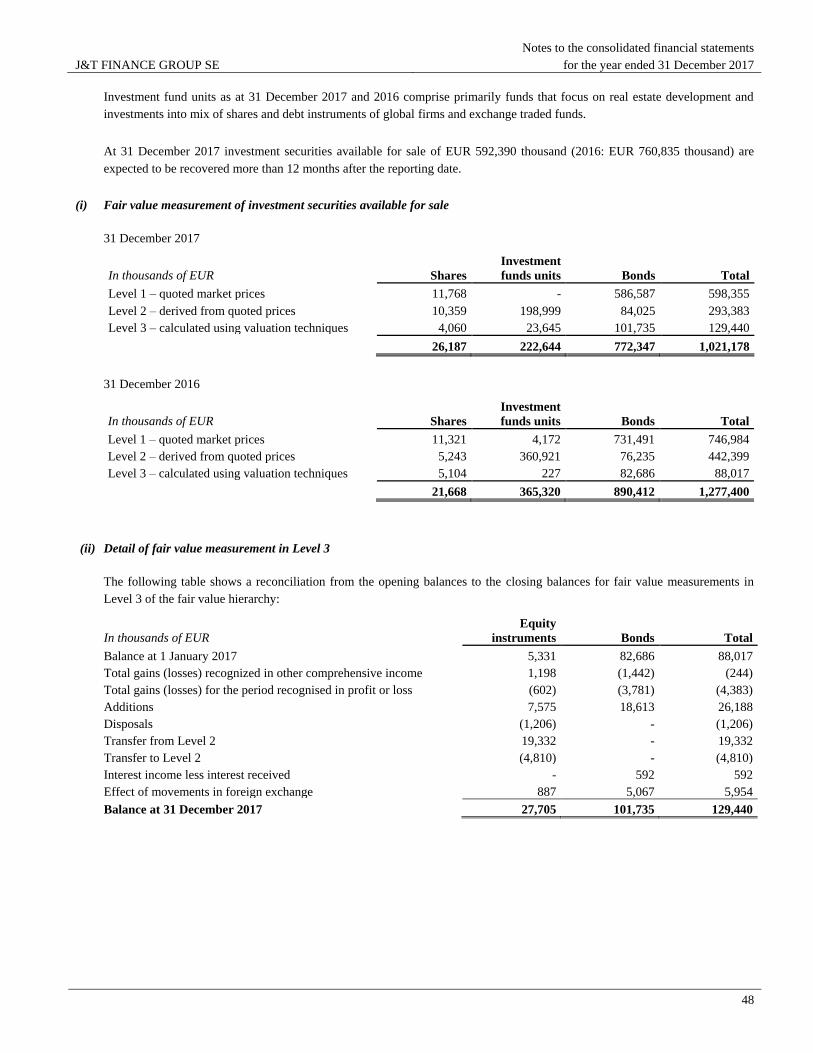
J&T FINANCE GROUP SE
Notes to the consolidated financial statements
for the year ended 31 December 2017
48
Investment fund units as at 31 December 2017 and 2016 comprise primarily funds that focus on real estate development and
investments into mix of shares and debt instruments of global firms and exchange traded funds.
At 31 December 2017 investment securities available for sale of EUR 592,390 thousand (2016: EUR 760,835 thousand) are
expected to be recovered more than 12 months after the reporting date.
(i) Fair value measurement of investment securities available for sale
31 December 2017
In thousands of EUR Shares
Investment
funds units Bonds Total
Level 1 – quoted market prices 11,768 - 586,587 598,355
Level 2 – derived from quoted prices 10,359 198,999 84,025 293,383
Level 3 – calculated using valuation techniques 4,060 23,645 101,735 129,440
26,187 222,644 772,347 1,021,178
31 December 2016
In thousands of EUR Shares
Investment
funds units Bonds Total
Level 1 – quoted market prices 11,321 4,172 731,491 746,984
Level 2 – derived from quoted prices 5,243 360,921 76,235 442,399
Level 3 – calculated using valuation techniques 5,104 227 82,686 88,017
21,668 365,320 890,412 1,277,400
(ii) Detail of fair value measurement in Level 3
The following table shows a reconciliation from the opening balances to the closing balances for fair value measurements in
Level 3 of the fair value hierarchy:
In thousands of EUR
Equity
instruments Bonds Total
Balance at 1 January 2017 5,331 82,686 88,017
Total gains (losses) recognized in other comprehensive income 1,198 (1,442) (244)
Total gains (losses) for the period recognised in profit or loss (602) (3,781) (4,383)
Additions 7,575 18,613 26,188
Disposals (1,206) - (1,206)
Transfer from Level 2 19,332 - 19,332
Transfer to Level 2 (4,810) - (4,810)
Interest income less interest received - 592 592
Effect of movements in foreign exchange 887 5,067 5,954
Balance at 31 December 2017 27,705 101,735 129,440
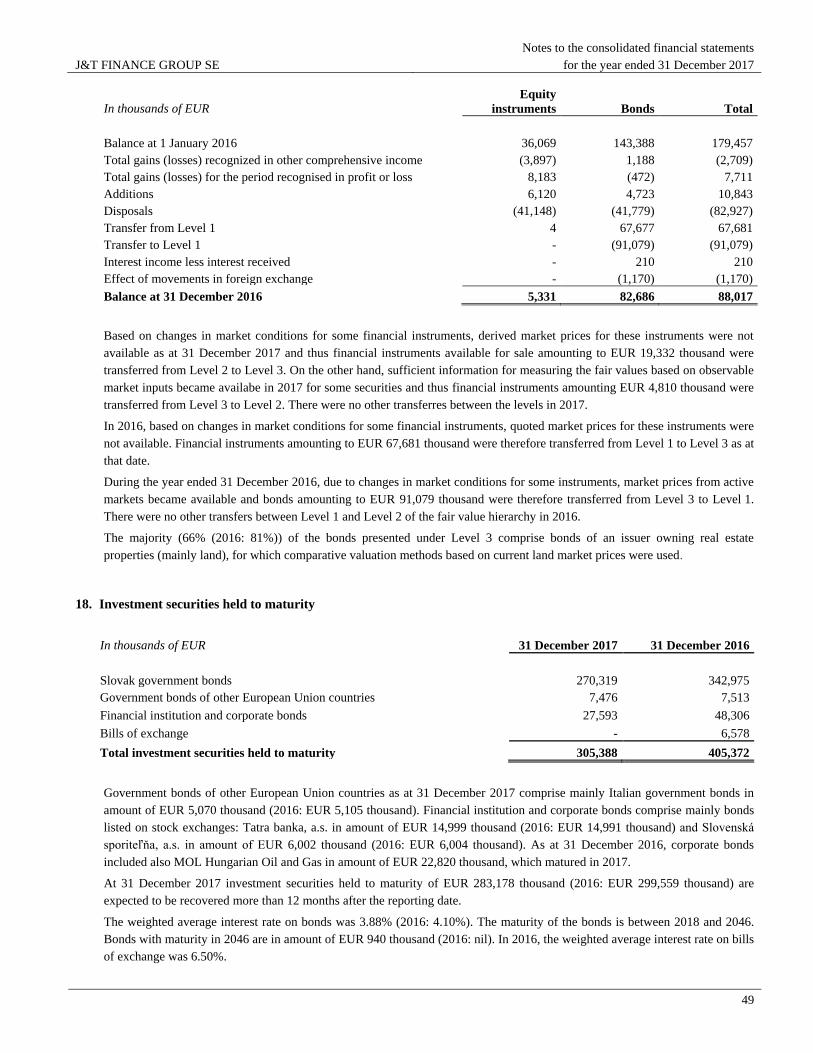
J&T FINANCE GROUP SE
Notes to the consolidated financial statements
for the year ended 31 December 2017
49
In thousands of EUR
Equity
instruments Bonds Total
Balance at 1 January 2016 36,069 143,388 179,457
Total gains (losses) recognized in other comprehensive income (3,897) 1,188 (2,709)
Total gains (losses) for the period recognised in profit or loss 8,183 (472) 7,711
Additions 6,120 4,723 10,843
Disposals (41,148) (41,779) (82,927)
Transfer from Level 1 4 67,677 67,681
Transfer to Level 1 - (91,079) (91,079)
Interest income less interest received - 210 210
Effect of movements in foreign exchange - (1,170) (1,170)
Balance at 31 December 2016 5,331 82,686 88,017
Based on changes in market conditions for some financial instruments, derived market prices for these instruments were not
available as at 31 December 2017 and thus financial instruments available for sale amounting to EUR 19,332 thousand were
transferred from Level 2 to Level 3. On the other hand, sufficient information for measuring the fair values based on observable
market inputs became availabe in 2017 for some securities and thus financial instruments amounting EUR 4,810 thousand were
transferred from Level 3 to Level 2. There were no other transferres between the levels in 2017.
In 2016, based on changes in market conditions for some financial instruments, quoted market prices for these instruments were
not available. Financial instruments amounting to EUR 67,681 thousand were therefore transferred from Level 1 to Level 3 as at
that date.
During the year ended 31 December 2016, due to changes in market conditions for some instruments, market prices from active
markets became available and bonds amounting to EUR 91,079 thousand were therefore transferred from Level 3 to Level 1.
There were no other transfers between Level 1 and Level 2 of the fair value hierarchy in 2016.
The majority (66% (2016: 81%)) of the bonds presented under Level 3 comprise bonds of an issuer owning real estate
properties (mainly land), for which comparative valuation methods based on current land market prices were used.
18. Investment securities held to maturity
In thousands of EUR 31 December 2017 31 December 2016
Slovak government bonds 270,319 342,975
Government bonds of other European Union countries 7,476 7,513
Financial institution and corporate bonds 27,593 48,306
Bills of exchange - 6,578
Total investment securities held to maturity 305,388 405,372
Government bonds of other European Union countries as at 31 December 2017 comprise mainly Italian government bonds in
amount of EUR 5,070 thousand (2016: EUR 5,105 thousand). Financial institution and corporate bonds comprise mainly bonds
listed on stock exchanges: Tatra banka, a.s. in amount of EUR 14,999 thousand (2016: EUR 14,991 thousand) and Slovenská
sporiteľňa, a.s. in amount of EUR 6,002 thousand (2016: EUR 6,004 thousand). As at 31 December 2016, corporate bonds
included also MOL Hungarian Oil and Gas in amount of EUR 22,820 thousand, which matured in 2017.
At 31 December 2017 investment securities held to maturity of EUR 283,178 thousand (2016: EUR 299,559 thousand) are
expected to be recovered more than 12 months after the reporting date.
The weighted average interest rate on bonds was 3.88% (2016: 4.10%). The maturity of the bonds is between 2018 and 2046.
Bonds with maturity in 2046 are in amount of EUR 940 thousand (2016: nil). In 2016, the weighted average interest rate on bills
of exchange was 6.50%.
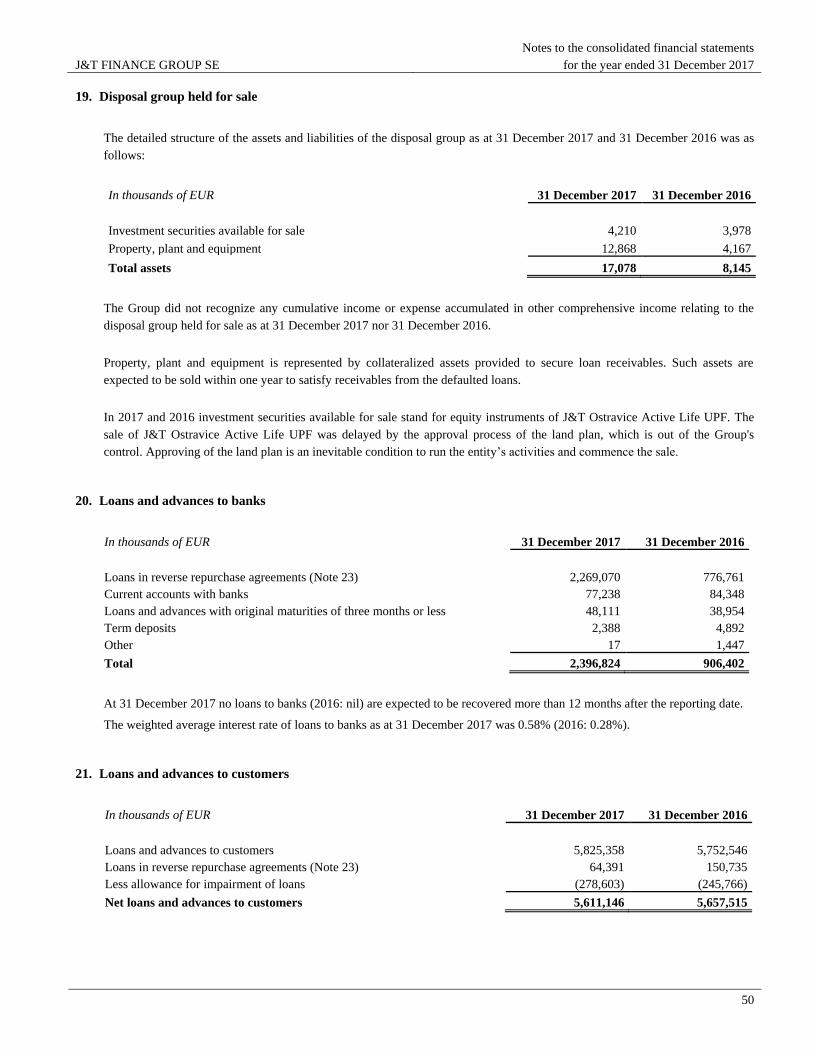
J&T FINANCE GROUP SE
Notes to the consolidated financial statements
for the year ended 31 December 2017
50
19. Disposal group held for sale
The detailed structure of the assets and liabilities of the disposal group as at 31 December 2017 and 31 December 2016 was as
follows:
In thousands of EUR 31 December 2017 31 December 2016
Investment securities available for sale 4,210 3,978
Property, plant and equipment 12,868 4,167
Total assets 17,078 8,145
The Group did not recognize any cumulative income or expense accumulated in other comprehensive income relating to the
disposal group held for sale as at 31 December 2017 nor 31 December 2016.
Property, plant and equipment is represented by collateralized assets provided to secure loan receivables. Such assets are
expected to be sold within one year to satisfy receivables from the defaulted loans.
In 2017 and 2016 investment securities available for sale stand for equity instruments of J&T Ostravice Active Life UPF. The
sale of J&T Ostravice Active Life UPF was delayed by the approval process of the land plan, which is out of the Group's
control. Approving of the land plan is an inevitable condition to run the entity’s activities and commence the sale.
20. Loans and advances to banks
In thousands of EUR 31 December 2017 31 December 2016
Loans in reverse repurchase agreements (Note 23) 2,269,070 776,761
Current accounts with banks 77,238 84,348
Loans and advances with original maturities of three months or less 48,111 38,954
Term deposits 2,388 4,892
Other 17 1,447
Total 2,396,824 906,402
At 31 December 2017 no loans to banks (2016: nil) are expected to be recovered more than 12 months after the reporting date.
The weighted average interest rate of loans to banks as at 31 December 2017 was 0.58% (2016: 0.28%).
21. Loans and advances to customers
In thousands of EUR 31 December 2017 31 December 2016
Loans and advances to customers 5,825,358 5,752,546
Loans in reverse repurchase agreements (Note 23) 64,391 150,735
Less allowance for impairment of loans (278,603) (245,766)
Net loans and advances to customers 5,611,146 5,657,515
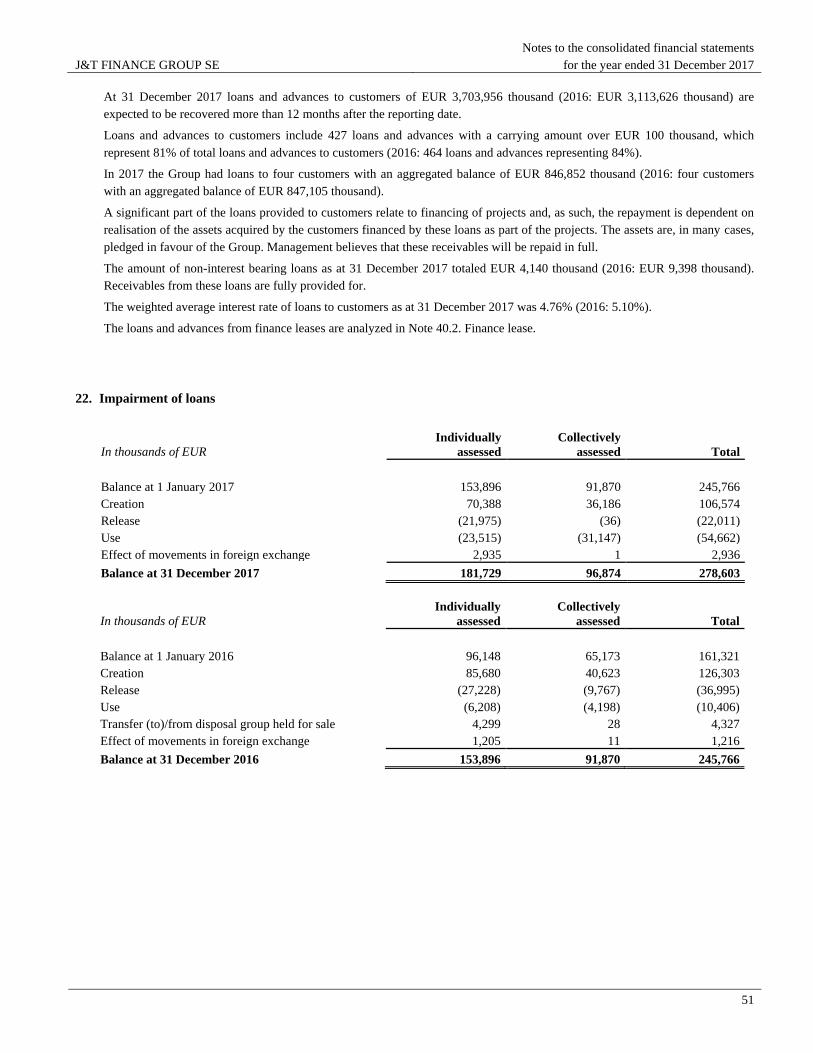
J&T FINANCE GROUP SE
Notes to the consolidated financial statements
for the year ended 31 December 2017
51
At 31 December 2017 loans and advances to customers of EUR 3,703,956 thousand (2016: EUR 3,113,626 thousand) are
expected to be recovered more than 12 months after the reporting date.
Loans and advances to customers include 427 loans and advances with a carrying amount over EUR 100 thousand, which
represent 81% of total loans and advances to customers (2016: 464 loans and advances representing 84%).
In 2017 the Group had loans to four customers with an aggregated balance of EUR 846,852 thousand (2016: four customers
with an aggregated balance of EUR 847,105 thousand).
A significant part of the loans provided to customers relate to financing of projects and, as such, the repayment is dependent on
realisation of the assets acquired by the customers financed by these loans as part of the projects. The assets are, in many cases,
pledged in favour of the Group. Management believes that these receivables will be repaid in full.
The amount of non-interest bearing loans as at 31 December 2017 totaled EUR 4,140 thousand (2016: EUR 9,398 thousand).
Receivables from these loans are fully provided for.
The weighted average interest rate of loans to customers as at 31 December 2017 was 4.76% (2016: 5.10%).
The loans and advances from finance leases are analyzed in Note 40.2. Finance lease.
22. Impairment of loans
In thousands of EUR
Individually
assessed
Collectively
assessed Total
Balance at 1 January 2017 153,896 91,870 245,766
Creation 70,388 36,186 106,574
Release (21,975) (36) (22,011)
Use (23,515) (31,147) (54,662)
Effect of movements in foreign exchange 2,935 1 2,936
Balance at 31 December 2017 181,729 96,874 278,603
In thousands of EUR
Individually
assessed
Collectively
assessed Total
Balance at 1 January 2016 96,148 65,173 161,321
Creation 85,680 40,623 126,303
Release (27,228) (9,767) (36,995)
Use (6,208) (4,198) (10,406)
Transfer (to)/from disposal group held for sale 4,299 28 4,327
Effect of movements in foreign exchange 1,205 11 1,216
Balance at 31 December 2016 153,896 91,870 245,766
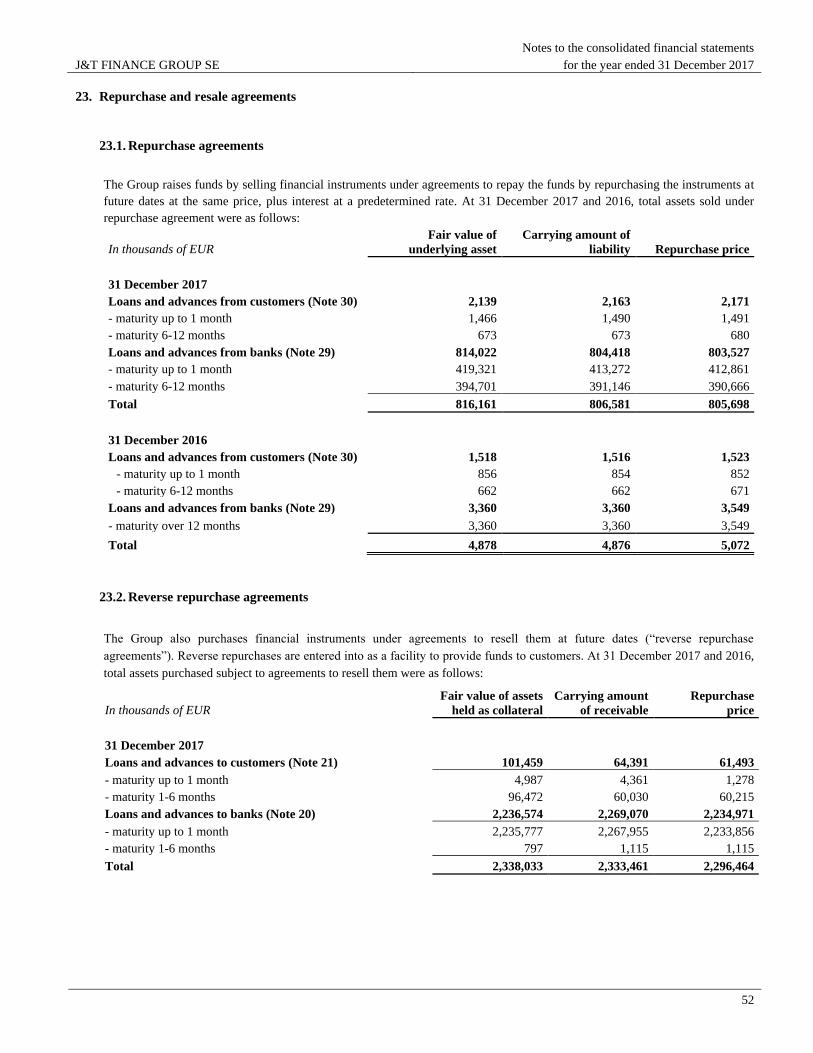
J&T FINANCE GROUP SE
Notes to the consolidated financial statements
for the year ended 31 December 2017
52
23. Repurchase and resale agreements
23.1. Repurchase agreements
The Group raises funds by selling financial instruments under agreements to repay the funds by repurchasing the instruments at
future dates at the same price, plus interest at a predetermined rate. At 31 December 2017 and 2016, total assets sold under
repurchase agreement were as follows:
In thousands of EUR
Fair value of
underlying asset
Carrying amount of
liability Repurchase price
31 December 2017
Loans and advances from customers (Note 30) 2,139 2,163 2,171
- maturity up to 1 month 1,466 1,490 1,491
- maturity 6-12 months 673 673 680
Loans and advances from banks (Note 29) 814,022 804,418 803,527
- maturity up to 1 month 419,321 413,272 412,861
- maturity 6-12 months 394,701 391,146 390,666
Total 816,161 806,581 805,698
31 December 2016
Loans and advances from customers (Note 30) 1,518 1,516 1,523
- maturity up to 1 month 856 854 852
- maturity 6-12 months 662 662 671
Loans and advances from banks (Note 29) 3,360 3,360 3,549
- maturity over 12 months 3,360 3,360 3,549
Total 4,878 4,876 5,072
23.2. Reverse repurchase agreements
The Group also purchases financial instruments under agreements to resell them at future dates (“reverse repurchase
agreements”). Reverse repurchases are entered into as a facility to provide funds to customers. At 31 December 2017 and 2016,
total assets purchased subject to agreements to resell them were as follows:
In thousands of EUR
Fair value of assets
held as collateral
Carrying amount
of receivable
Repurchase
price
31 December 2017
Loans and advances to customers (Note 21) 101,459 64,391 61,493
- maturity up to 1 month 4,987 4,361 1,278
- maturity 1-6 months 96,472 60,030 60,215
Loans and advances to banks (Note 20) 2,236,574 2,269,070 2,234,971
- maturity up to 1 month 2,235,777 2,267,955 2,233,856
- maturity 1-6 months 797 1,115 1,115
Total 2,338,033 2,333,461 2,296,464
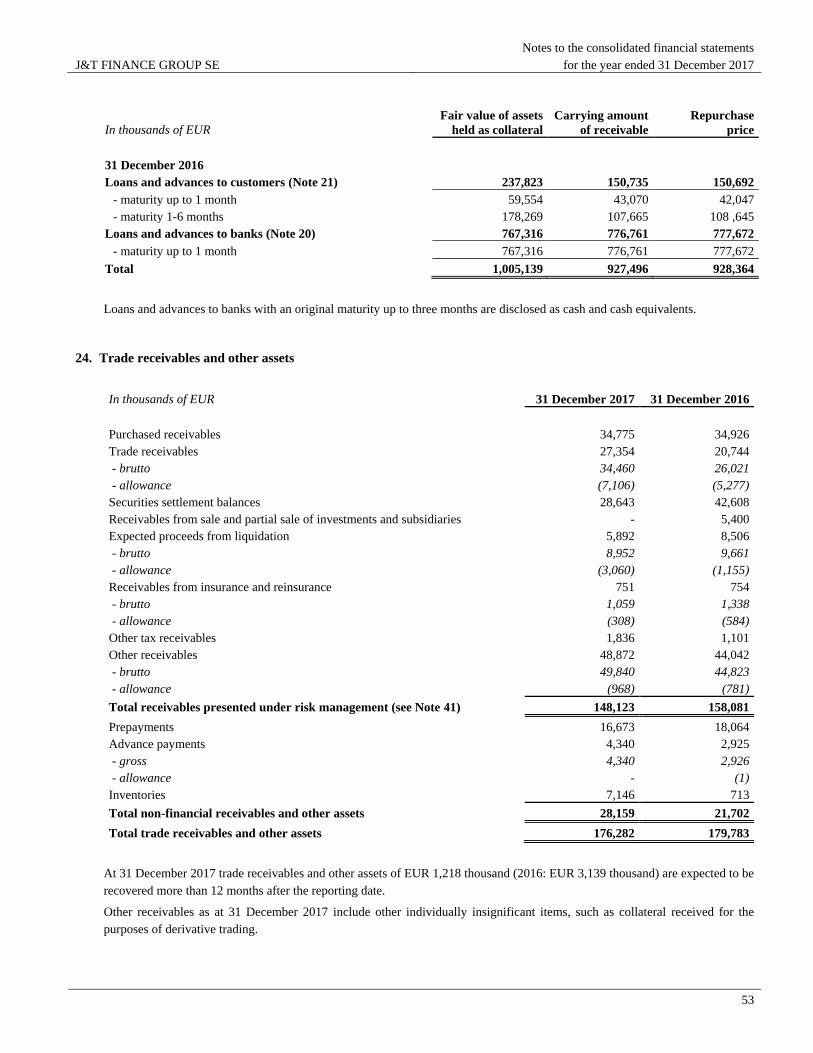
J&T FINANCE GROUP SE
Notes to the consolidated financial statements
for the year ended 31 December 2017
53
In thousands of EUR
Fair value of assets
held as collateral
Carrying amount
of receivable
Repurchase
price
31 December 2016
Loans and advances to customers (Note 21) 237,823 150,735 150,692
- maturity up to 1 month 59,554 43,070 42,047
- maturity 1-6 months 178,269 107,665 108 ,645
Loans and advances to banks (Note 20) 767,316 776,761 777,672
- maturity up to 1 month 767,316 776,761 777,672
Total 1,005,139 927,496 928,364
Loans and advances to banks with an original maturity up to three months are disclosed as cash and cash equivalents.
24. Trade receivables and other assets
In thousands of EUR 31 December 2017 31 December 2016
Purchased receivables 34,775 34,926
Trade receivables 27,354 20,744
- brutto 34,460 26,021
- allowance (7,106) (5,277)
Securities settlement balances 28,643 42,608
Receivables from sale and partial sale of investments and subsidiaries - 5,400
Expected proceeds from liquidation 5,892 8,506
- brutto 8,952 9,661
- allowance (3,060) (1,155)
Receivables from insurance and reinsurance 751 754
- brutto 1,059 1,338
- allowance (308) (584)
Other tax receivables 1,836 1,101
Other receivables 48,872 44,042
- brutto 49,840 44,823
- allowance (968) (781)
Total receivables presented under risk management (see Note 41) 148,123 158,081
Prepayments 16,673 18,064
Advance payments 4,340 2,925
- gross 4,340 2,926
- allowance - (1)
Inventories 7,146 713
Total non-financial receivables and other assets 28,159 21,702
Total trade receivables and other assets 176,282 179,783
At 31 December 2017 trade receivables and other assets of EUR 1,218 thousand (2016: EUR 3,139 thousand) are expected to be
recovered more than 12 months after the reporting date.
Other receivables as at 31 December 2017 include other individually insignificant items, such as collateral received for the
purposes of derivative trading.
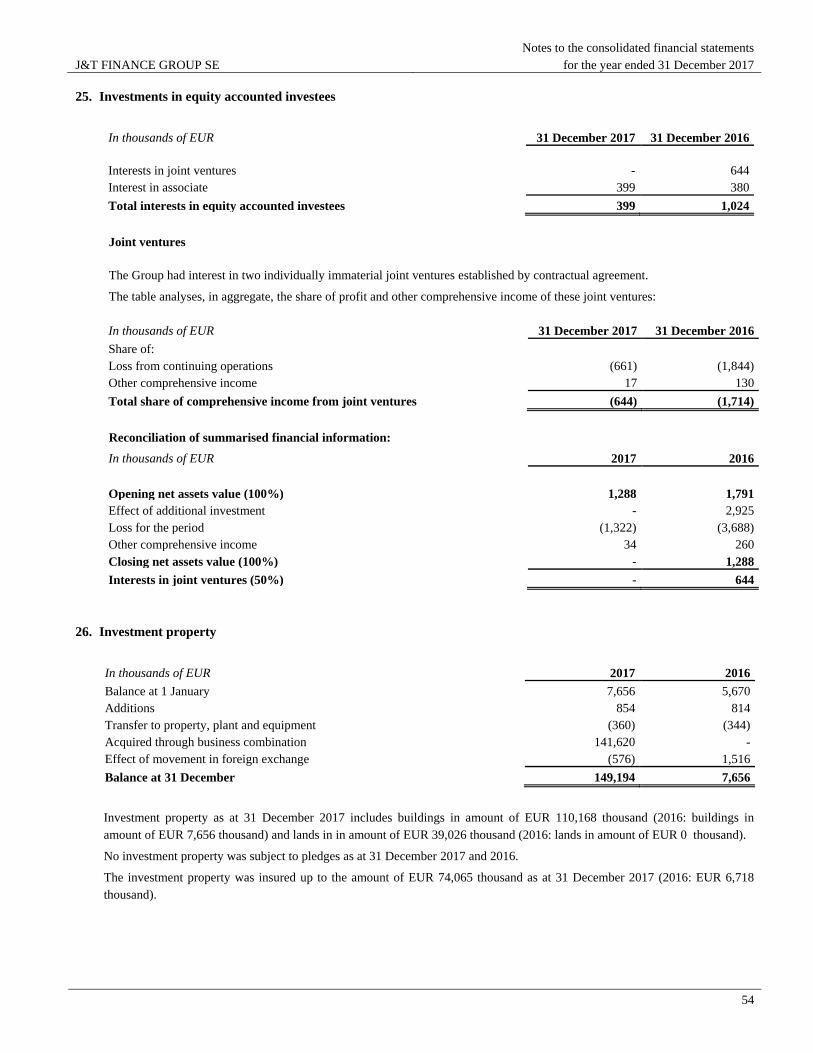
J&T FINANCE GROUP SE
Notes to the consolidated financial statements
for the year ended 31 December 2017
54
25. Investments in equity accounted investees
In thousands of EUR 31 December 2017 31 December 2016
Interests in joint ventures - 644
Interest in associate 399 380
Total interests in equity accounted investees 399 1,024
Joint ventures
The Group had interest in two individually immaterial joint ventures established by contractual agreement.
The table analyses, in aggregate, the share of profit and other comprehensive income of these joint ventures:
In thousands of EUR 31 December 2017 31 December 2016
Share of:
Loss from continuing operations (661) (1,844)
Other comprehensive income 17 130
Total share of comprehensive income from joint ventures (644) (1,714)
Reconciliation of summarised financial information:
In thousands of EUR 2017 2016
Opening net assets value (100%) 1,288 1,791
Effect of additional investment - 2,925
Loss for the period (1,322) (3,688)
Other comprehensive income 34 260
Closing net assets value (100%) - 1,288
Interests in joint ventures (50%) - 644
26. Investment property
In thousands of EUR 2017 2016
Balance at 1 January 7,656 5,670
Additions 854 814
Transfer to property, plant and equipment (360) (344)
Acquired through business combination 141,620 -
Effect of movement in foreign exchange (576) 1,516
Balance at 31 December 149,194 7,656
Investment property as at 31 December 2017 includes buildings in amount of EUR 110,168 thousand (2016: buildings in
amount of EUR 7,656 thousand) and lands in in amount of EUR 39,026 thousand (2016: lands in amount of EUR 0 thousand).
No investment property was subject to pledges as at 31 December 2017 and 2016.
The investment property was insured up to the amount of EUR 74,065 thousand as at 31 December 2017 (2016: EUR 6,718
thousand).
J&T FINANCE GROUP SE
Notes to the consolidated financial statements
for the year ended 31 December 2017
55
27. Intangible assets
In thousands of EUR Goodwill
Contracts
and brand
Customer
relation-
ships
Software and
other intangible
assets Total
Cost
Balance at 1 January 2016 41,757 89,318 84,937 55,794 271,806
Additions - - - 11,874 11,874
Transfers (to)/from disposal group held for sale 2,389 - - 181 2,570
Disposals - - - (2,716) (2,716)
Disposals of subsidiaries (9,028) - - - (9,028)
Effect of movements in foreign exchange 2,314 - 1,470 327 4,111
Balance at 31 December 2016 37,432 89,318 86,407 65,460 278,617
Balance at 1 January 2017 37,432 89,318 86,407 65,460 278,617
Additions - - - 16,498 16,498
Acquisitions through business combinations 3,725 - - 69 3,794
Transfers from tangible assets - - - 15 15
Disposals - - - (4,776) (4,776)
Effect of movements in foreign exchange (301) - (5,319) 1,321 (4,299)
Balance at 31 December 2017 40,856 89,318 81,088 78,587 289,849
Amortization and impairment losses
Balance at 1 January 2016 (20,311) (16,541) (62,024) (27,566) (126,442)
Amortization charge for the year - (6,616) (5,981) (8,335) (20,932)
Impairment - - (1,521) - (1,521)
Transfers to/(from) disposal group held for sale (2,389) - - (148) (2,537)
Disposals - - - 103 103
Disposals of subsidiaries 9,028 - - - 9,028
Effect of movements in foreign exchange (2,292) (1) (1,469) (308) (4,070)
Balance at 31 December 2016 (15,964) (23,158) (70,995) (36,254) (146,371)
Balance at 1 January 2017 (15,964) (23,158) (70,995) (36,254) (146,371)
Amortization charge for the year - (6,616) (5,640) (8,869) (21,125)
Impairment (5) - (806) - (811)
Disposals - - - 2,901 2,901
Effect of movements in foreign exchange 369 - 5,332 (933) 4,768
Balance at 31 December 2017 (15,600) (29,774) (72,109) (43,155) (160,638)
Carrying amount
At 1 January 2016 21,446 72,777 22,913 28,228 145,364
At 31 December 2016 21,468 66,160 15,412 29,206 132,246
At 1 January 2017 21,468 66,160 15,412 29,206 132,246
At 31 December 2017 25,256 59,544 8,979 35,432 129,211
J&T FINANCE GROUP SE
Notes to the consolidated financial statements
for the year ended 31 December 2017
56
Assets under development and borrowing costs
As at 31 December 2017 the cost of intangible assets under development (included in Other intangible assets) was EUR 1,495
thousand (2016: EUR 771 thousand).
There were no capitalised borrowing costs related to the acquisition of property, plant and equipment during the year (2016:
nil).
28. Property, plant and equipment
In thousands of EUR
Land and
buildings
Aircraft and
related flight
equipment
Fixtures,
fittings and
equipment Total
Cost
Balance at 1 January 2016 39,268 11,356 29,679 80,303
Additions 1,603 - 4,963 6,566
Transfers from investment property 344 - - 344
Transfers (to)/from disposal group held for sale (4,672) - 314 (4,358)
Disposals (1,196) - (2,469) (3,665)
Disposals of subsidiaries - (11,356) (316) (11,672)
Effect of movements in foreign exchange 2,918 - 245 3,163
Balance at 31 December 2016 38,265 - 32,416 70,681
Balance at 1 January 2017 38,265 - 32,416 70,681
Additions 2,917 - 6,123 9,040
Acquisitions through business combinations 94,011 - 970 94,981
Transfers from investment property 360 - - 360
Transfer (to)/from disposal group held for sale - - (15) (15)
Disposals (1,687) - (2,885) (4,572)
Effect of movements in foreign exchange (967) - 190 (777)
Balance at 31 December 2017 132,899 - 36,799 169,698
Depreciation and impairment losses
Balance at 1 January 2016 (4,325) (5,479) (16,235) (26,039)
Depreciation charge for the year (2,293) (125) (5,013) (7,431)
Impairment (732) (283) - (1,015)
Transfers to/(from) disposal group held for sale - - (124) (124)
Disposals 6 - 2,391 2,397
Disposals of subsidiaries - 5,887 - 5,887
Effect of movements in foreign exchange (205) - (200) (405)
Balance at 31 December 2016 (7,549) - (19,181) (26,730)
Balance at 1 January 2017 (7,549) - (19,181) (26,730)
Depreciation charge for the year (2,292) - (4,846) (7,138)
Impairment (21) - 552 531
Transfers to/(from) disposal group held for sale - - 34 34
Disposals 1,111 - 2,336 3,447
Effect of movements in foreign exchange 76 - (673) (597)
Balance at 31 December 2017 (8,675) - (21,778) (30,453)
J&T FINANCE GROUP SE
Notes to the consolidated financial statements
for the year ended 31 December 2017
57
Carrying amount
Land and
buildings
Aircraft and
related flight
equipment
Fixtures,
fittings and
equipment
Total
At 1 January 2016 34,943 5,877 13,444 54,264
At 31 December 2016 30,716 - 13,235 43,951
At 1 January 2017 30,716 13,235 43,951
At 31 December 2017 124,224 - 15,021 139,245
As at 31 December 2017 the Group's property, plant and equipment in the amount of EUR 41,973 thousand is subject to pledges
(2016: EUR 0 thousand).
As at 31 December 2017 the Group's property, plant and equipment was insured up to the amount of EUR 142,525 thousand
(2016: EUR 97,544 thousand).
Assets under construction and borrowing costs
As at 31 December 2017 the cost of property, plant and equipment under construction (included in Fixtures, fittings and
equipment) was EUR 824 thousand (2016: EUR 869 thousand).
There were no capitalised borrowing costs related to the acquisition of property, plant and equipment during the year 2017 and
2016.
Idle assets
As at 31 December 2017 and 2016 the Group had no material idle assets.
29. Deposits and loans from banks
In thousands of EUR 31 December 2017 31 December 2016
Term deposits from banks 22,585 21,915
Received loans from repurchase agreements 804,418 3,360
Other received loans 107,516 67,877
Total deposits and loans from banks 934,519 93,152
As at 31 December 2017 deposits and loans from banks of EUR 35,199 thousand (2016: EUR 6,208 thousand) are expected to
be settled more than 12 months after the reporting date.
The weighted average interest rate of standard deposits and loans from banks as at 31 December 2017 was 2.61% (2016:
2.31%). The Group also concluded a loan of EUR 782,256 thousand with negative interest rate of 1.95% in 2017.
For more information about repurchase agreements see Note 23. Repurchase and resale agreements.

J&T FINANCE GROUP SE
Notes to the consolidated financial statements
for the year ended 31 December 2017
58
30. Deposits and loans from customers
In thousands of EUR 31 December 2017 31 December 2016
Deposits and loans from customers
Term and escrow deposits 4,250,108 4,917,650
Deposits payable on demand 2,906,094 2,538,431
Received loans from repurchase agreements 2,163 1,516
Other received loans 29,313 19,267
Total 7,187,678 7,476,864
As at 31 December 2017 deposits and loans from customers of EUR 646,423 thousand (2016: EUR 1,241,273 thousand) are
expected to be settled more than 12 months after the reporting date.
The weighted average interest rate of deposits and loans from customers as at 31 December 2017 was 0.68% (2016: 1.17%).
For more information about repurchase agreements see Note 23. Repurchase and resale agreements.
31. Debt securities issued
In thousands of EUR
Original
currency
Interest
rate
Maturity
date
31 December
2017
31 December
2016
Bonds listed on Bratislava Stock Exchange EUR 6.00% 21.6.2016 26 41
Bonds listed on Prague Stock Exchange CZK 5.20% 15.9.2017 - 196,556
Bonds listed on Bratislava Stock Exchange EUR 5.25% 12.12.2018 147,423 145,495
Bonds listed on Bratislava Stock Exchange EUR 3.80% 29.10.2019 73,534 75,982
Bonds listed on Prague Stock Exchange CZK 3.00% 25.11.2019 116,606 109,641
Bonds listed on Prague Stock Exchange CZK 4.00% 18.7.2022 126,698 -
Total issued bonds 464,287 527,715
Issued bills of exchange and loan notes 79,638 69,059
Total other debt securities issued 79,638 596,774
Total debt securities issued 543,925 596,774
In June 2013 the Group issued 100,000 pieces of bonds with a nominal value of EUR 1,000 per piece. The bonds were listed
and traded on the Bratislava Stock Exchange. These bonds were repaid in June 2016, the remaining amount of EUR 26
thousand comprises unclaimed amount of bonds.
In September 2014 the Group issued 1,481 pieces of bonds with a nominal value of CZK 3,000 thousand per piece, that were
traded on the Prague Stock Exchange. These bonds were fully repaid in September 2017. In December 2014 another 150,000
pieces of bonds with a nominal value of EUR 1,000 per piece that are traded on the Bratislava Stock Exchange.
In April 2016 the Group issued another 100,000 pieces of bonds with a nominal value of EUR 1,000 per piece that are traded on
the Bratislava Stock Exchange and in November 2016 another 1,000 pieces of bonds with a nominal value of CZK 3,000
thousand per piece, that are traded on the Prague Stock Exchange.
In July 2017 the Group issued another 1,080 pieces of bonds with a nominal value of CZK 3,000,000 per piece that are traded
on the Prague Stock Exchange.
The interest from all issues is paid regularly twice a year.
The Group has not had any defaults of principal or interest or other breaches with respect to its debt securities during the years
ended 31 December 2017 and 2016.
The total carrying amount of the bonds issued does not include the amount of the bonds held by companies within the Group.
J&T FINANCE GROUP SE
Notes to the consolidated financial statements
for the year ended 31 December 2017
59
At 31 December 2017 issued bills of exchange and loan notes of EUR 47,050 thousand (2016: EUR 47,050 thousand) are
expected to be settled more than 12 months after the reporting date.
Reconciliation of movements of liabilities to cash flows arising from financing activities
In thousands of EUR Liablities Equity
Finance
lease
liabilities8
Debt
securities
issued
Subordi-
nated debt
Retained
earnings
and other
reserves
Non-
controlling
interests Total
Balance as at 1 January 2017 58 596,774 56,402 777,391 43,129 1,473,754
Changes from financing cash flows
-
Distribution from share capital to shareholders - - - - - -
Proceeds from issued debt securities - 161,241 - - - 161,241
Payments for buy-back - (229,459) - - - (229,459)
Acquisition of non-controlling interests - - - (370) 22,370 22,000
Disposal of non-controlling interests - - - 1,910 (3,146) (1,236)
Subordinated debt issued - - 3 - - 3
Subordinated debt paid - - (76) - - (76)
Payments for finance lease (27) - - - - (27)
Bonus payments from issued other capital
instruments - - - (25,143) - (25,143)
Dividends paid - - - - (553) (553)
Total changes from financing cash flows (27) (68,218) (73) (23,603) 18,671 (73,250)
The effect of changes in foreign exchange
rates - 15,529 1,505 - - 17,034
Other changes
Liablitiy-related
Interest expense - 24,200 2,827 - - 27,027
Interest paid - (24,360) (2,694) - - (27,054)
Total liability-related other changes - (160) 133 - - (27)
Total equity-related other changes - - - 153,895 11,422 165,317
Balance at 31 December 2017 31 543,925 57,967 907,683 73,222 1,582,828
8 Finance lease liabilities are included under Deposits and loans from customers in the financial statements and thus do not constitute a separate financial
statements caption.
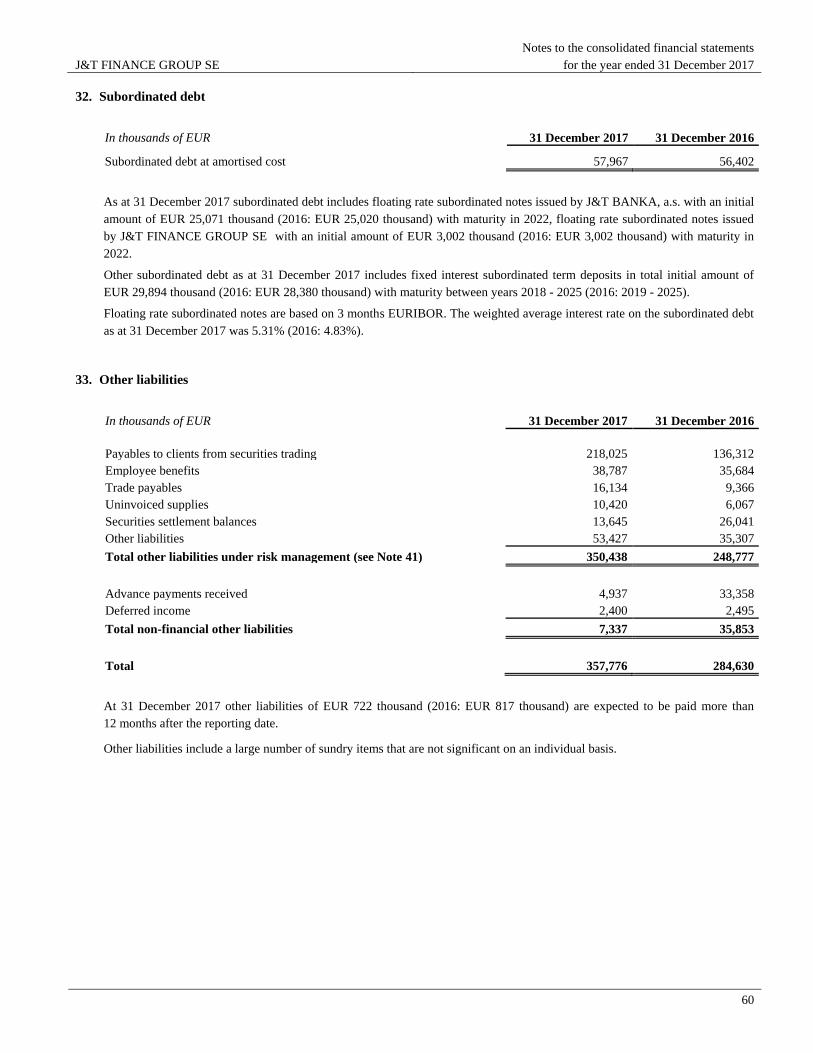
J&T FINANCE GROUP SE
Notes to the consolidated financial statements
for the year ended 31 December 2017
60
32. Subordinated debt
In thousands of EUR 31 December 2017 31 December 2016
Subordinated debt at amortised cost 57,967 56,402
As at 31 December 2017 subordinated debt includes floating rate subordinated notes issued by J&T BANKA, a.s. with an initial
amount of EUR 25,071 thousand (2016: EUR 25,020 thousand) with maturity in 2022, floating rate subordinated notes issued
by J&T FINANCE GROUP SE with an initial amount of EUR 3,002 thousand (2016: EUR 3,002 thousand) with maturity in
2022.
Other subordinated debt as at 31 December 2017 includes fixed interest subordinated term deposits in total initial amount of
EUR 29,894 thousand (2016: EUR 28,380 thousand) with maturity between years 2018 - 2025 (2016: 2019 - 2025).
Floating rate subordinated notes are based on 3 months EURIBOR. The weighted average interest rate on the subordinated debt
as at 31 December 2017 was 5.31% (2016: 4.83%).
33. Other liabilities
In thousands of EUR 31 December 2017 31 December 2016
Payables to clients from securities trading 218,025 136,312
Employee benefits 38,787 35,684
Trade payables 16,134 9,366
Uninvoiced supplies 10,420 6,067
Securities settlement balances 13,645 26,041
Other liabilities 53,427 35,307
Total other liabilities under risk management (see Note 41) 350,438 248,777
Advance payments received 4,937 33,358
Deferred income 2,400 2,495
Total non-financial other liabilities 7,337 35,853
Total 357,776 284,630
At 31 December 2017 other liabilities of EUR 722 thousand (2016: EUR 817 thousand) are expected to be paid more than
12 months after the reporting date.
Other liabilities include a large number of sundry items that are not significant on an individual basis.
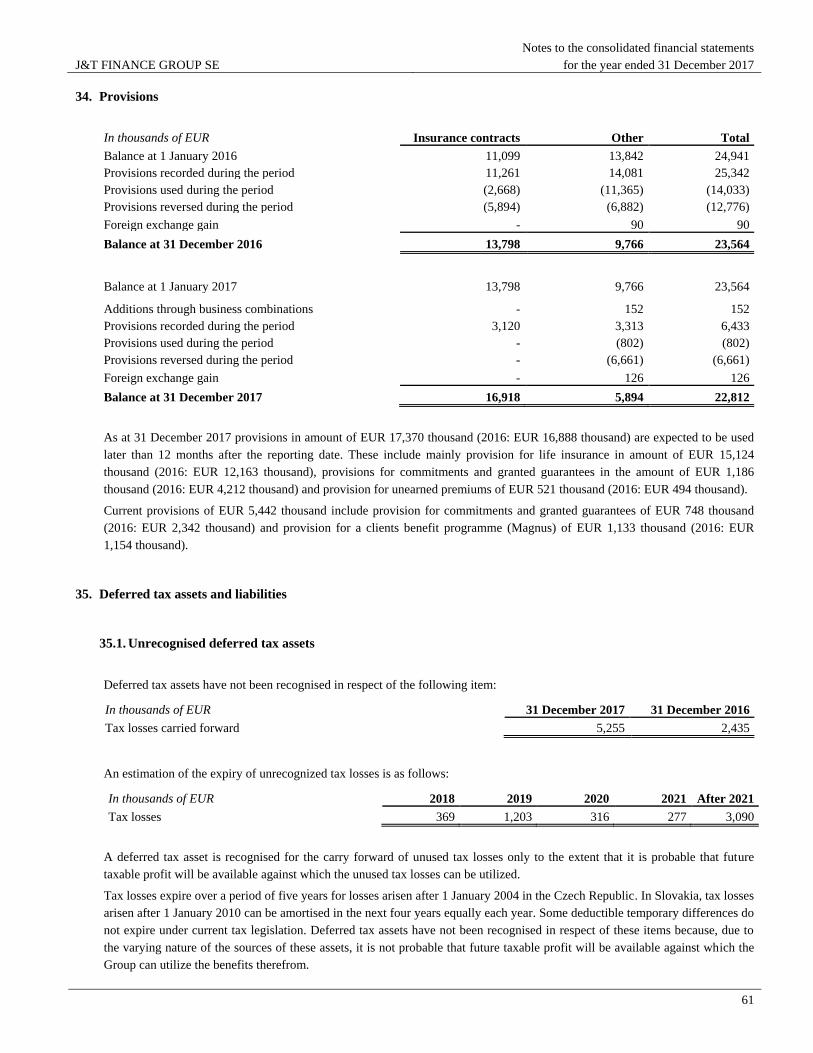
J&T FINANCE GROUP SE
Notes to the consolidated financial statements
for the year ended 31 December 2017
61
34. Provisions
In thousands of EUR Insurance contracts Other Total
Balance at 1 January 2016 11,099 13,842 24,941
Provisions recorded during the period 11,261 14,081 25,342
Provisions used during the period (2,668) (11,365) (14,033)
Provisions reversed during the period (5,894) (6,882) (12,776)
Foreign exchange gain - 90 90
Balance at 31 December 2016 13,798 9,766 23,564
Balance at 1 January 2017 13,798 9,766 23,564
Additions through business combinations - 152 152
Provisions recorded during the period 3,120 3,313 6,433
Provisions used during the period - (802) (802)
Provisions reversed during the period - (6,661) (6,661)
Foreign exchange gain - 126 126
Balance at 31 December 2017 16,918 5,894 22,812
As at 31 December 2017 provisions in amount of EUR 17,370 thousand (2016: EUR 16,888 thousand) are expected to be used
later than 12 months after the reporting date. These include mainly provision for life insurance in amount of EUR 15,124
thousand (2016: EUR 12,163 thousand), provisions for commitments and granted guarantees in the amount of EUR 1,186
thousand (2016: EUR 4,212 thousand) and provision for unearned premiums of EUR 521 thousand (2016: EUR 494 thousand).
Current provisions of EUR 5,442 thousand include provision for commitments and granted guarantees of EUR 748 thousand
(2016: EUR 2,342 thousand) and provision for a clients benefit programme (Magnus) of EUR 1,133 thousand (2016: EUR
1,154 thousand).
35. Deferred tax assets and liabilities
35.1. Unrecognised deferred tax assets
Deferred tax assets have not been recognised in respect of the following item:
In thousands of EUR 31 December 2017 31 December 2016
Tax losses carried forward 5,255 2,435
An estimation of the expiry of unrecognized tax losses is as follows:
In thousands of EUR 2018 2019 2020 2021 After 2021
Tax losses 369 1,203 316 277 3,090
A deferred tax asset is recognised for the carry forward of unused tax losses only to the extent that it is probable that future
taxable profit will be available against which the unused tax losses can be utilized.
Tax losses expire over a period of five years for losses arisen after 1 January 2004 in the Czech Republic. In Slovakia, tax losses
arisen after 1 January 2010 can be amortised in the next four years equally each year. Some deductible temporary differences do
not expire under current tax legislation. Deferred tax assets have not been recognised in respect of these items because, due to
the varying nature of the sources of these assets, it is not probable that future taxable profit will be available against which the
Group can utilize the benefits therefrom.
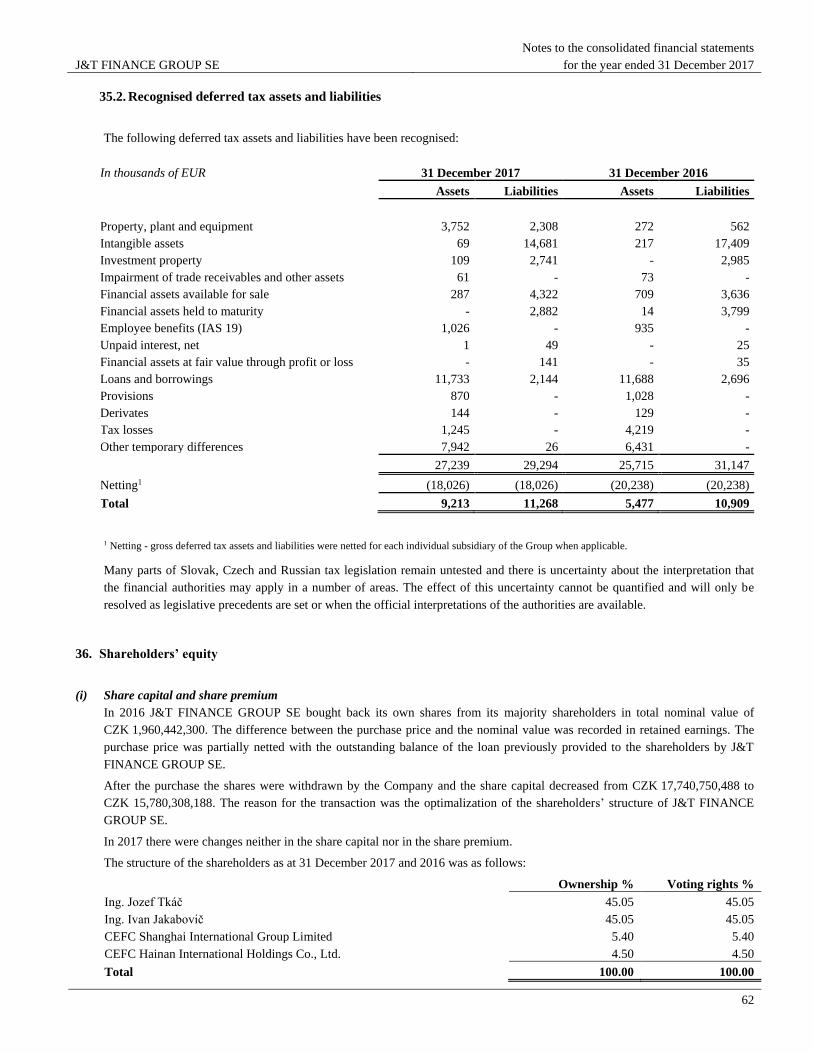
J&T FINANCE GROUP SE
Notes to the consolidated financial statements
for the year ended 31 December 2017
62
35.2. Recognised deferred tax assets and liabilities
The following deferred tax assets and liabilities have been recognised:
In thousands of EUR 31 December 2017 31 December 2016
Assets Liabilities Assets Liabilities
Property, plant and equipment 3,752 2,308 272 562
Intangible assets 69 14,681 217 17,409
Investment property 109 2,741 - 2,985
Impairment of trade receivables and other assets 61 - 73 -
Financial assets available for sale 287 4,322 709 3,636
Financial assets held to maturity - 2,882 14 3,799
Employee benefits (IAS 19) 1,026 - 935 -
Unpaid interest, net 1 49 - 25
Financial assets at fair value through profit or loss - 141 - 35
Loans and borrowings 11,733 2,144 11,688 2,696
Provisions 870 - 1,028 -
Derivates 144 - 129 -
Tax losses 1,245 - 4,219 -
Other temporary differences 7,942 26 6,431 -
27,239 29,294 25,715 31,147
Netting1 (18,026) (18,026) (20,238) (20,238)
Total 9,213 11,268 5,477 10,909
1 Netting - gross deferred tax assets and liabilities were netted for each individual subsidiary of the Group when applicable.
Many parts of Slovak, Czech and Russian tax legislation remain untested and there is uncertainty about the interpretation that
the financial authorities may apply in a number of areas. The effect of this uncertainty cannot be quantified and will only be
resolved as legislative precedents are set or when the official interpretations of the authorities are available.
36. Shareholders’ equity
(i) Share capital and share premium
In 2016 J&T FINANCE GROUP SE bought back its own shares from its majority shareholders in total nominal value of
CZK 1,960,442,300. The difference between the purchase price and the nominal value was recorded in retained earnings. The
purchase price was partially netted with the outstanding balance of the loan previously provided to the shareholders by J&T
FINANCE GROUP SE.
After the purchase the shares were withdrawn by the Company and the share capital decreased from CZK 17,740,750,488 to
CZK 15,780,308,188. The reason for the transaction was the optimalization of the shareholders’ structure of J&T FINANCE
GROUP SE.
In 2017 there were changes neither in the share capital nor in the share premium.
The structure of the shareholders as at 31 December 2017 and 2016 was as follows:
Ownership % Voting rights %
Ing. Jozef Tkáč 45.05 45.05
Ing. Ivan Jakabovič 45.05 45.05
CEFC Shanghai International Group Limited 5.40 5.40
CEFC Hainan International Holdings Co., Ltd. 4.50 4.50
Total 100.00 100.00
J&T FINANCE GROUP SE
Notes to the consolidated financial statements
for the year ended 31 December 2017
63
The authorized, issued and fully paid share capital of J&T FINANCE GROUP SE as at 31 December 2017 consists of 10
ordinary shares with a par value of CZK 200 thousand, 13,778,752 ordinary shares with a par value of CZK 1 thousand and
1,999,556,188 ordinary shares with a par value of CZK 1. The shareholders are entitled to receive dividends and to one vote per
share at meetings of the Company’s shareholders.
(ii) Non-distributable reserves
Non-distributable reserves include the legal reserve fund of the Parent Company and post-acquisition increases in subsidiaries’
legal reserves. The legal reserve fund can only be used to cover losses of the Company and it may not be distributed as a
dividend. The calculation of the legal reserve is based on local statutory regulations.
Since 1 January 2014, the creation of a legal reserve fund in the Czech Republic is not required.
In Slovakia creation of a legal reserve fund is required at a minimum of 10% of net profit (annually) and up to a minimum of
20% of the registered share capital (cumulative balance).
In Russia creation of a legal reserve fund is required at a minimum of 5% of net profit (annually) up to a minimum of 5% of the
registered share capital.
In Croatia creation of a legal reserve fund is required at a minimum of 5% of net profit (annually) and up to a minimum of 5%
of the registered share capital.
(iii) Translation reserve
The translation reserve comprises all foreign exchange differences arising from the translation of the financial statements of
foreign operations that are not integral to the operations of the Parent Company. In 2017 the main driver of the changes in the
translation reserve was the appreciation of CZK.
(iv) Other reserves and funds
Other reserves comprise changes in the fair value of investment securities available for sale.
In 2016 J&T BANKA, a.s. sold to its investors subordinated unsecured certificates with nominal value of EUR 5 thousand and
CZK 100 thousand and no maturity date in the amount of EUR 20,595 thousand. These instruments were disclosed as Other
capital instruments in the condensed consolidated statement of changes in equity. These certificates bear a 9% or 10% annual
yield, subject of approval, distributed quarterly from retained earnings, and are listed on the Prague Stock Exchange.
The issuance of this instrument, which combines characteristics of equity and debt instruments, was approved by the Czech
National Bank (“CNB”). CNB stipulated that these instruments are equity instruments in line with IFRS and that they comply
with the regulatory requirements to be recognised as additional capital AT1, part of regulatory capital tier 1 (see also Note 41.5.
Capital management).
In 2016 J&T FINANCE GROUP SE also issued and sold subordinated unsecured certificates with nominal value of EUR 100
thousand and no maturity date in the amount of EUR 200,000 thousand. The whole emission was purchased by CEFC Hainan
International Holdings CO., Ltd. These certificates bear a 9% (first 2 years) and 5% (subsequently) annual yield, subject of
approval, distributed semi-annually from retained earnings. Following the approval by the Czech National Bank (CNB) on 21
April 2016, these instruments also comply with the requirements to be recognized as additional capital AT1.
In 2014, the Board of Directors of J&T BANKA, a.s. approved a new special purpose capital fund (Perpetuity fund), covering
distribution of yield generated by the certificates described above. In 2016, another Perpetuity fund for distribution of yield
from similar certificates was created by J&T FINANCE GROUP SE as well. Both funds are part of retained earnings and
distribution of income from the funds complies with the prospectus of the capital instruments. The total amount of yield paid in
2017 was EUR 25,143 thousand (2016: EUR 16,754 thousand) and is presented as distribution of retained earnings in the
consolidated statement of changes in equity.
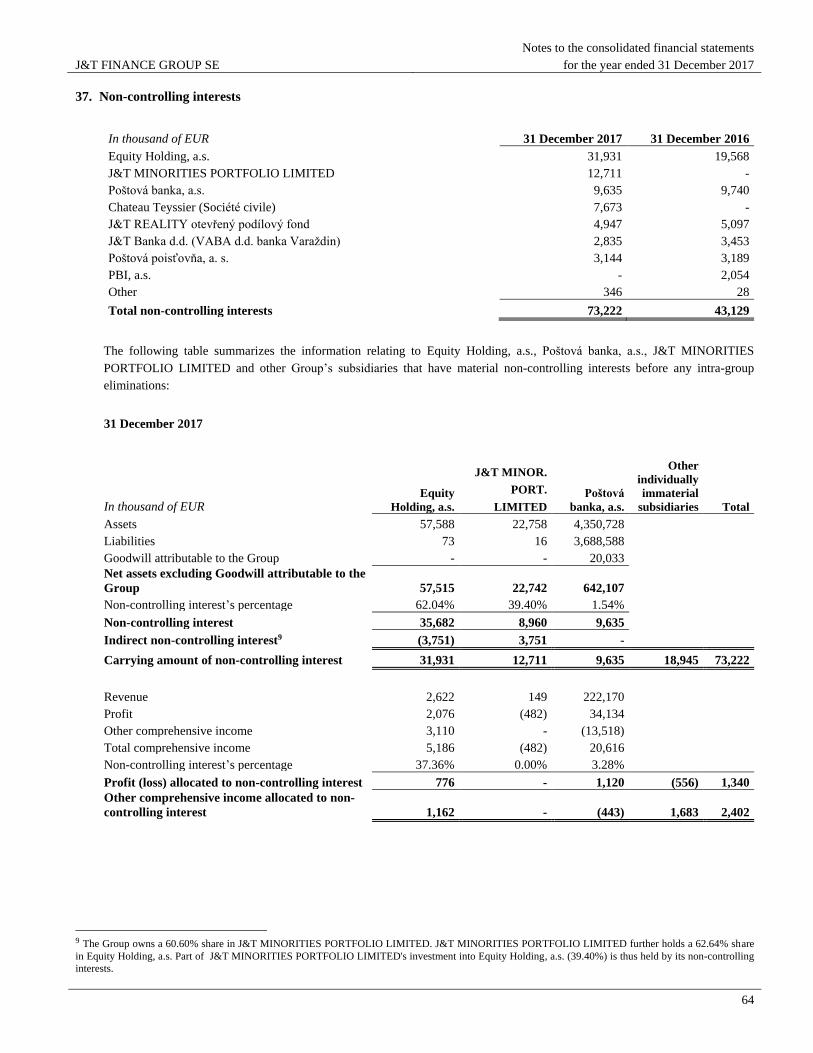
J&T FINANCE GROUP SE
Notes to the consolidated financial statements
for the year ended 31 December 2017
64
37. Non-controlling interests
In thousand of EUR 31 December 2017 31 December 2016
Equity Holding, a.s. 31,931 19,568
J&T MINORITIES PORTFOLIO LIMITED 12,711 -
Poštová banka, a.s. 9,635 9,740
Chateau Teyssier (Société civile) 7,673 -
J&T REALITY otevřený podílový fond 4,947 5,097
J&T Banka d.d. (VABA d.d. banka Varaždin) 2,835 3,453
Poštová poisťovňa, a. s. 3,144 3,189
PBI, a.s. - 2,054
Other 346 28
Total non-controlling interests 73,222 43,129
The following table summarizes the information relating to Equity Holding, a.s., Poštová banka, a.s., J&T MINORITIES
PORTFOLIO LIMITED and other Group’s subsidiaries that have material non-controlling interests before any intra-group
eliminations:
31 December 2017
In thousand of EUR Equity
Holding, a.s.
J&T MINOR.
PORT.
LIMITED
Poštová
banka, a.s.
Other
individually
immaterial
subsidiaries Total
Assets 57,588 22,758 4,350,728
Liabilities 73 16 3,688,588
Goodwill attributable to the Group - - 20,033
Net assets excluding Goodwill attributable to the
Group 57,515 22,742 642,107
Non-controlling interest’s percentage 62.04% 39.40% 1.54%
Non-controlling interest 35,682 8,960 9,635
Indirect non-controlling interest9 (3,751) 3,751 -
Carrying amount of non-controlling interest 31,931 12,711 9,635 18,945 73,222
Revenue 2,622 149 222,170
Profit 2,076 (482) 34,134
Other comprehensive income 3,110 - (13,518)
Total comprehensive income 5,186 (482) 20,616
Non-controlling interest’s percentage 37.36% 0.00% 3.28%
Profit (loss) allocated to non-controlling interest 776 - 1,120 (556) 1,340
Other comprehensive income allocated to non-
controlling interest 1,162 - (443) 1,683 2,402
9 The Group owns a 60.60% share in J&T MINORITIES PORTFOLIO LIMITED. J&T MINORITIES PORTFOLIO LIMITED further holds a 62.64% share
in Equity Holding, a.s. Part of J&T MINORITIES PORTFOLIO LIMITED's investment into Equity Holding, a.s. (39.40%) is thus held by its non-controlling
interests.
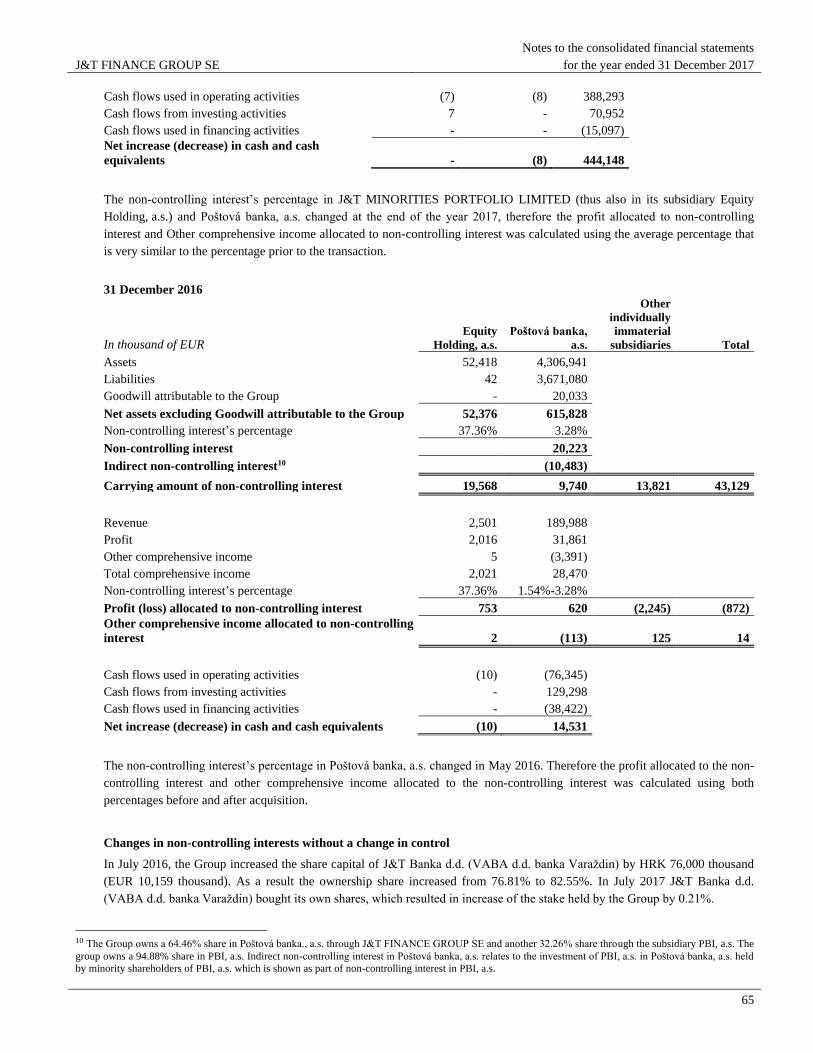
J&T FINANCE GROUP SE
Notes to the consolidated financial statements
for the year ended 31 December 2017
65
Cash flows used in operating activities (7) (8) 388,293
Cash flows from investing activities 7 - 70,952
Cash flows used in financing activities - - (15,097)
Net increase (decrease) in cash and cash
equivalents - (8) 444,148
The non-controlling interest’s percentage in J&T MINORITIES PORTFOLIO LIMITED (thus also in its subsidiary Equity
Holding, a.s.) and Poštová banka, a.s. changed at the end of the year 2017, therefore the profit allocated to non-controlling
interest and Other comprehensive income allocated to non-controlling interest was calculated using the average percentage that
is very similar to the percentage prior to the transaction.
31 December 2016
In thousand of EUR Equity
Holding, a.s.
Poštová banka,
a.s.
Other
individually
immaterial
subsidiaries Total
Assets 52,418 4,306,941
Liabilities 42 3,671,080
Goodwill attributable to the Group - 20,033
Net assets excluding Goodwill attributable to the Group 52,376 615,828
Non-controlling interest’s percentage 37.36% 3.28%
Non-controlling interest 20,223
Indirect non-controlling interest10 (10,483)
Carrying amount of non-controlling interest 19,568 9,740 13,821 43,129
Revenue 2,501 189,988
Profit 2,016 31,861
Other comprehensive income 5 (3,391)
Total comprehensive income 2,021 28,470
Non-controlling interest’s percentage 37.36% 1.54%-3.28%
Profit (loss) allocated to non-controlling interest 753 620 (2,245) (872)
Other comprehensive income allocated to non-controlling
interest 2 (113) 125 14
Cash flows used in operating activities (10) (76,345)
Cash flows from investing activities - 129,298
Cash flows used in financing activities - (38,422)
Net increase (decrease) in cash and cash equivalents (10) 14,531
The non-controlling interest’s percentage in Poštová banka, a.s. changed in May 2016. Therefore the profit allocated to the non-
controlling interest and other comprehensive income allocated to the non-controlling interest was calculated using both
percentages before and after acquisition.
Changes in non-controlling interests without a change in control
In July 2016, the Group increased the share capital of J&T Banka d.d. (VABA d.d. banka Varaždin) by HRK 76,000 thousand
(EUR 10,159 thousand). As a result the ownership share increased from 76.81% to 82.55%. In July 2017 J&T Banka d.d.
(VABA d.d. banka Varaždin) bought its own shares, which resulted in increase of the stake held by the Group by 0.21%.
10 The Group owns a 64.46% share in Poštová banka., a.s. through J&T FINANCE GROUP SE and another 32.26% share through the subsidiary PBI, a.s. The
group owns a 94.88% share in PBI, a.s. Indirect non-controlling interest in Poštová banka, a.s. relates to the investment of PBI, a.s. in Poštová banka, a.s. held
by minority shareholders of PBI, a.s. which is shown as part of non-controlling interest in PBI, a.s.
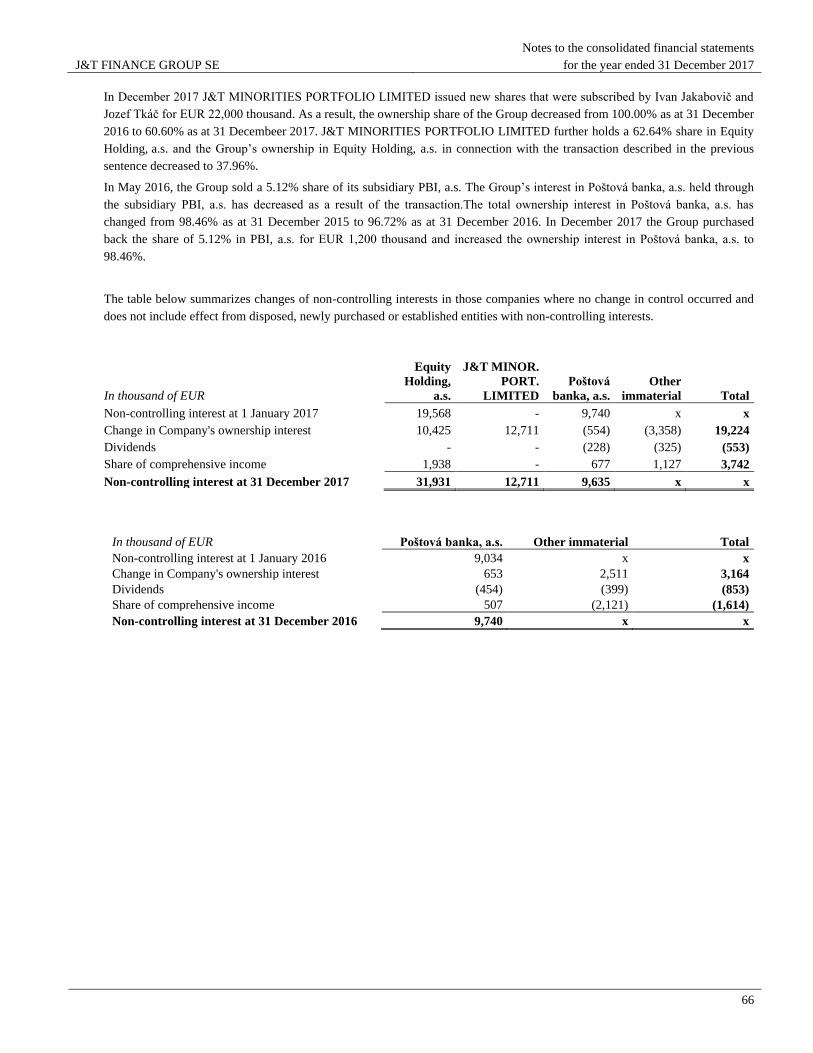
J&T FINANCE GROUP SE
Notes to the consolidated financial statements
for the year ended 31 December 2017
66
In December 2017 J&T MINORITIES PORTFOLIO LIMITED issued new shares that were subscribed by Ivan Jakabovič and
Jozef Tkáč for EUR 22,000 thousand. As a result, the ownership share of the Group decreased from 100.00% as at 31 December
2016 to 60.60% as at 31 Decembeer 2017. J&T MINORITIES PORTFOLIO LIMITED further holds a 62.64% share in Equity
Holding, a.s. and the Group’s ownership in Equity Holding, a.s. in connection with the transaction described in the previous
sentence decreased to 37.96%.
In May 2016, the Group sold a 5.12% share of its subsidiary PBI, a.s. The Group’s interest in Poštová banka, a.s. held through
the subsidiary PBI, a.s. has decreased as a result of the transaction.The total ownership interest in Poštová banka, a.s. has
changed from 98.46% as at 31 December 2015 to 96.72% as at 31 December 2016. In December 2017 the Group purchased
back the share of 5.12% in PBI, a.s. for EUR 1,200 thousand and increased the ownership interest in Poštová banka, a.s. to
98.46%.
The table below summarizes changes of non-controlling interests in those companies where no change in control occurred and
does not include effect from disposed, newly purchased or established entities with non-controlling interests.
In thousand of EUR
Equity
Holding,
a.s.
J&T MINOR.
PORT.
LIMITED
Poštová
banka, a.s.
Other
immaterial Total
Non-controlling interest at 1 January 2017 19,568 - 9,740 x x
Change in Company's ownership interest 10,425 12,711 (554) (3,358) 19,224
Dividends - - (228) (325) (553)
Share of comprehensive income 1,938 - 677 1,127 3,742
Non-controlling interest at 31 December 2017 31,931 12,711 9,635 x x
In thousand of EUR Poštová banka, a.s. Other immaterial Total
Non-controlling interest at 1 January 2016 9,034 x x
Change in Company's ownership interest 653 2,511 3,164
Dividends (454) (399) (853)
Share of comprehensive income 507 (2,121) (1,614)
Non-controlling interest at 31 December 2016 9,740 x x
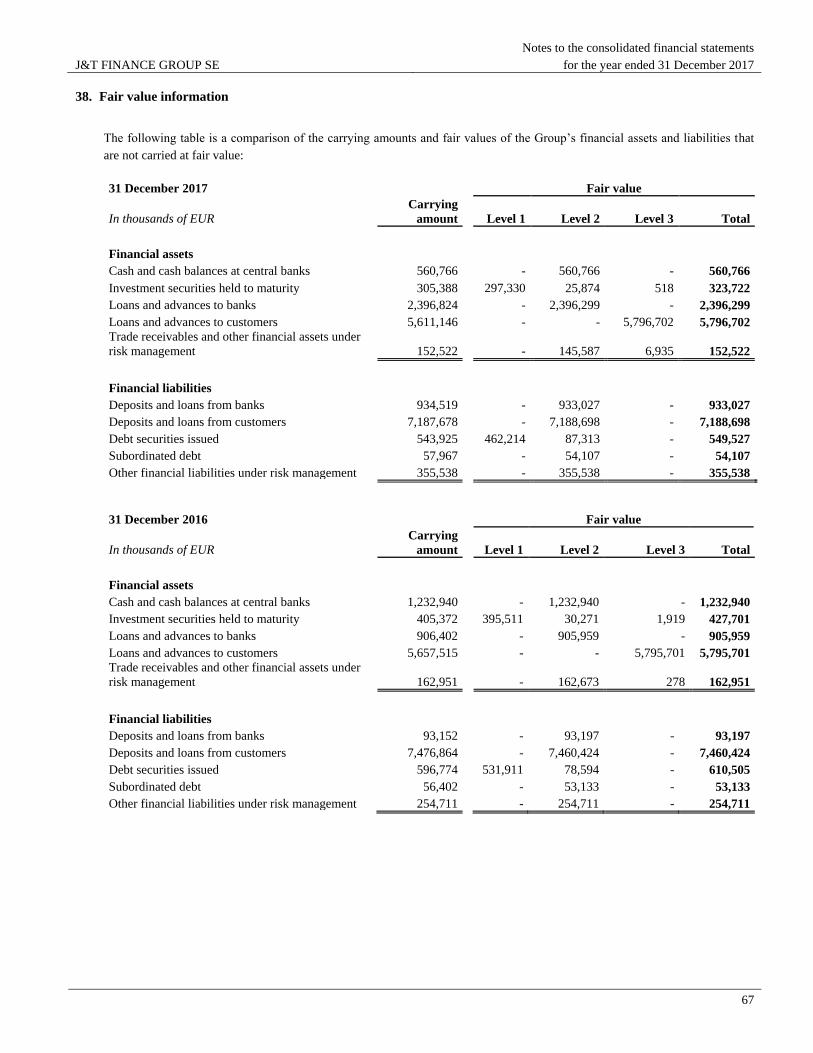
J&T FINANCE GROUP SE
Notes to the consolidated financial statements
for the year ended 31 December 2017
67
38. Fair value information
The following table is a comparison of the carrying amounts and fair values of the Group’s financial assets and liabilities that
are not carried at fair value:
31 December 2017
Fair value
In thousands of EUR
Carrying
amount
Level 1 Level 2 Level 3 Total
Financial assets
Cash and cash balances at central banks 560,766 - 560,766 - 560,766
Investment securities held to maturity 305,388 297,330 25,874 518 323,722
Loans and advances to banks 2,396,824 - 2,396,299 - 2,396,299
Loans and advances to customers 5,611,146 - - 5,796,702 5,796,702
Trade receivables and other financial assets under
risk management 152,522 - 145,587 6,935 152,522
Financial liabilities
Deposits and loans from banks 934,519 - 933,027 - 933,027
Deposits and loans from customers 7,187,678 - 7,188,698 - 7,188,698
Debt securities issued 543,925 462,214 87,313 - 549,527
Subordinated debt 57,967 - 54,107 - 54,107
Other financial liabilities under risk management 355,538 - 355,538 - 355,538
31 December 2016
Fair value
In thousands of EUR
Carrying
amount
Level 1 Level 2 Level 3 Total
Financial assets
Cash and cash balances at central banks 1,232,940
- 1,232,940 - 1,232,940
Investment securities held to maturity 405,372
395,511 30,271 1,919 427,701
Loans and advances to banks 906,402
- 905,959 - 905,959
Loans and advances to customers 5,657,515
- - 5,795,701 5,795,701
Trade receivables and other financial assets under
risk management 162,951
- 162,673 278 162,951
Financial liabilities
Deposits and loans from banks 93,152
- 93,197 - 93,197
Deposits and loans from customers 7,476,864
- 7,460,424 - 7,460,424
Debt securities issued 596,774
531,911 78,594 - 610,505
Subordinated debt 56,402
- 53,133 - 53,133
Other financial liabilities under risk management 254,711
- 254,711 - 254,711

J&T FINANCE GROUP SE
Notes to the consolidated financial statements
for the year ended 31 December 2017
68
39. Financial commitments and contingencies
In thousands of EUR 31 December 2017 31 December 2016
Accepted and endorsed bills of exchange 2,115 2,116
Granted guarantees 177,306 268,503
Pledged assets 205,756 192,745
Loan commitments 561,565 589,206
Total financial commitments and contingencies 946,742 1,052,570
The carrying value of pledged assets that are used as collateral for loan financing is EUR 205,756 thousand (2016: EUR
192,745 thousand). Granted guarantees mostly represent various guarantees issued in relation to loans, bills of exchange issued
by other parties, lease contracts and other liabilities of third parties in amount of EUR 177,306 thousand (2016: EUR 268,503
thousand). These guarantees are disclosed in the table above at the amount of the possible obligation in the future. The
maximum amount payable for guarantees given by the Group as at 31 December 2017 is EUR 284,327 thousand (2016: EUR
373,550 thousand). Loan commitments relate to loan facilities granted by the banks of the Group.
40. Leases
40.1. Operating lease
(a) Leases as lessee
Non-cancellable operating lease rentals are payable as follows:
In thousands of EUR 31 December 2017 31 December 2016
Less than one year 5,629 8,286
Between one and five years 15,825 18,705
More than five years 2,798 2,196
Total 24,252 29,187
The Group leases a number of cars and administration space under operating leases. The administration space leases typically
run for an initial period of five to fifteen years, with an option to renew after that date. During the year ended 31 December
2017, EUR 14,258 thousand was recognized as an expense in the income statement in respect of operating leases (2016: EUR
12,911 thousand).
(b) Leases as lessor
The Group leases out its property under operating leases. Non-cancellable operating lease rentals are receivable as follows:
In thousands of EUR 31 December 2017 31 December 2016
Less than one year 535 784
Between one and five years 318 296
Total 853 1,080
During the year ended 31 December 2017, EUR 1,660 thousand was recognized as rental income (2016: EUR 2,273 thousand).
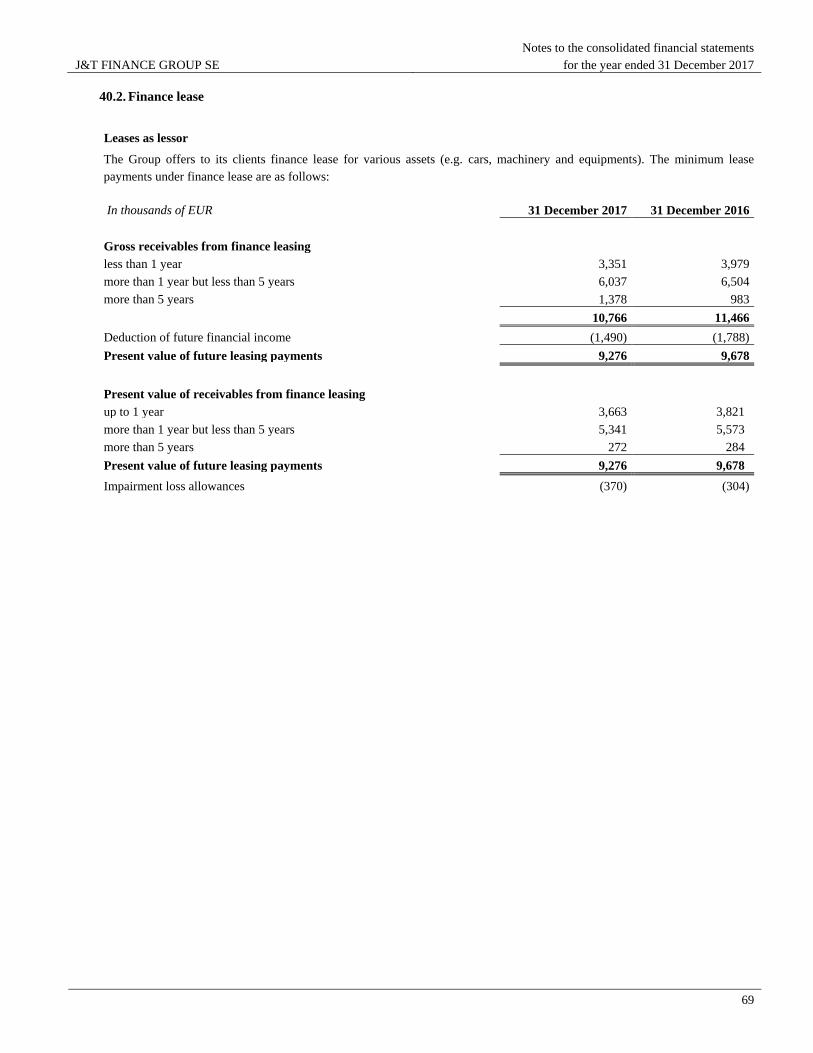
J&T FINANCE GROUP SE
Notes to the consolidated financial statements
for the year ended 31 December 2017
69
40.2. Finance lease
Leases as lessor
The Group offers to its clients finance lease for various assets (e.g. cars, machinery and equipments). The minimum lease
payments under finance lease are as follows:
In thousands of EUR 31 December 2017 31 December 2016
Gross receivables from finance leasing
less than 1 year 3,351 3,979
more than 1 year but less than 5 years 6,037 6,504
more than 5 years 1,378 983
10,766 11,466
Deduction of future financial income (1,490) (1,788)
Present value of future leasing payments 9,276 9,678
Present value of receivables from finance leasing
up to 1 year 3,663 3,821
more than 1 year but less than 5 years 5,341 5,573
more than 5 years 272 284
Present value of future leasing payments 9,276 9,678
Impairment loss allowances (370) (304)
J&T FINANCE GROUP SE
Notes to the consolidated financial statements
for the year ended 31 December 2017
70
41. Risk management policies and disclosures
The Group has exposure to the following risks:
credit risk
liquidity risk
market risk
operational risks
This note presents information about the Group’s exposure to each of the above risks, the Group’s objectives, policies and
processes for measuring and managing risk, and the Group’s management of capital.
For the purpose of this note, current tax assets are presented within trade receivables and other financial assets under risk
management and current tax liability is presented within other financial liabilities under risk management.
41.1. Credit risk
The Group’s primary exposure to credit risk arises through its loans and advances provided. The maximum amount of credit
exposure is represented by the respective carrying amounts in the statement of financial position. In addition, the Group is
exposed to off-balance sheet credit risk through commitments to extend credit and financial guarantees (refer to Note
39. Financial commitments and contingencies). Most loans and advances are to corporates (companies from the non-financial
sector, retail and various manufacturing companies). Further loans and advances are to banks and other financial institutions.
The carrying amount of loans and advances and the off-balance sheet amounts represent the maximum accounting loss that
would be recognised on these items at the statement of financial position date if counterparties failed to perform completely as
contracted and any collateral or security proved to be of no value. The Group’s policy is to require suitable collateral to be
provided by customers prior to the disbursement of loans by the Group.
The assessment of credit risk in respect of a counter-party or an issued debt is based on the Group’s internal rating system,
covering both external credit assessments by the S&P, Moody’s or Fitch rating agencies, and the Group’s internal scoring
system.
The scoring system of the Group has seven degrees. It is based on a standardised point evaluation of relevant criteria, which
describe the financial position of a contractual party and its ability to fulfil its credit obligations – in both cases including the
expected development, quality and adequacy of the collateral, as well as proposed conditions for effecting the transaction.
The internal rating is determined using the credit scale of S&P.
Credit risk in the banking entities of the Group is managed based on credit analysis and the Internal Rating Based (IRB)
methodology.
The Group monitors concentrations of credit risk by sector and by geographic location.
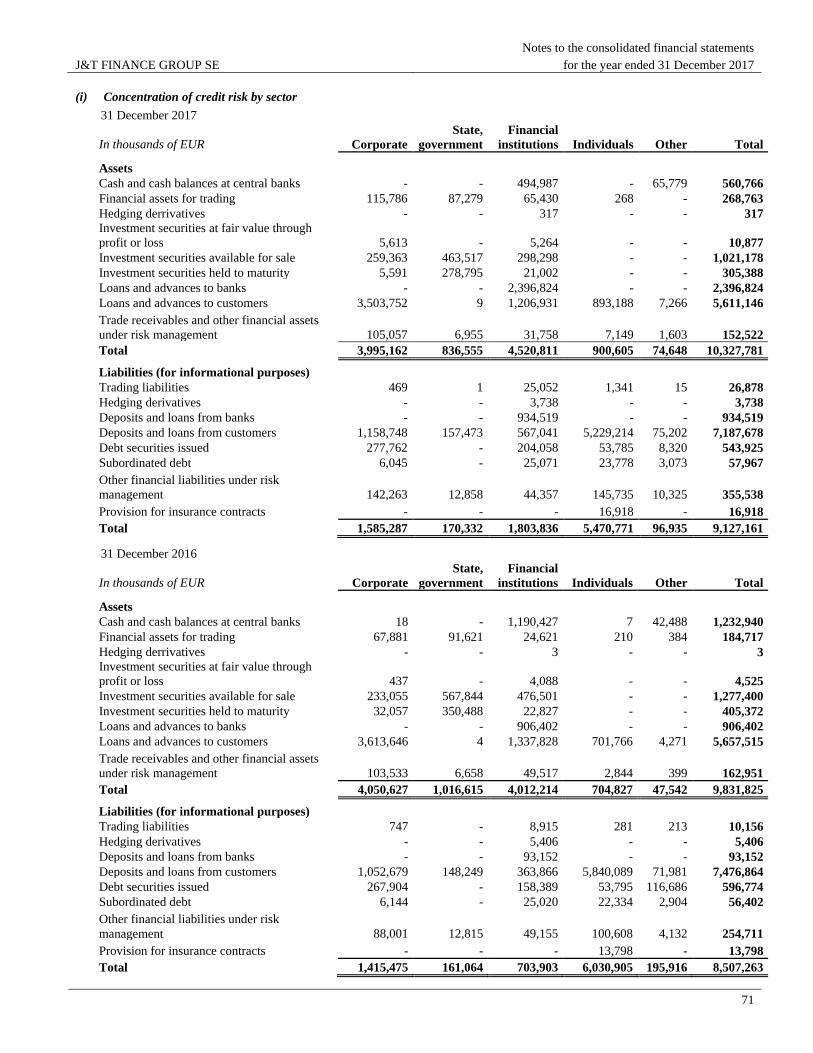
J&T FINANCE GROUP SE
Notes to the consolidated financial statements
for the year ended 31 December 2017
71
(i) Concentration of credit risk by sector
31 December 2017
In thousands of EUR Corporate
State,
government
Financial
institutions Individuals Other Total
Assets
Cash and cash balances at central banks - - 494,987 - 65,779 560,766
Financial assets for trading 115,786 87,279 65,430 268 - 268,763
Hedging derrivatives - - 317 - - 317
Investment securities at fair value through
profit or loss 5,613 - 5,264 - - 10,877
Investment securities available for sale 259,363 463,517 298,298 - - 1,021,178
Investment securities held to maturity 5,591 278,795 21,002 - - 305,388
Loans and advances to banks - - 2,396,824 - - 2,396,824
Loans and advances to customers 3,503,752 9 1,206,931 893,188 7,266 5,611,146
Trade receivables and other financial assets
under risk management 105,057 6,955 31,758 7,149 1,603 152,522
Total 3,995,162 836,555 4,520,811 900,605 74,648 10,327,781
Liabilities (for informational purposes)
Trading liabilities 469 1 25,052 1,341 15 26,878
Hedging derivatives - - 3,738 - - 3,738
Deposits and loans from banks - - 934,519 - - 934,519
Deposits and loans from customers 1,158,748 157,473 567,041 5,229,214 75,202 7,187,678
Debt securities issued 277,762 - 204,058 53,785 8,320 543,925
Subordinated debt 6,045 - 25,071 23,778 3,073 57,967
Other financial liabilities under risk
management 142,263 12,858 44,357 145,735 10,325 355,538
Provision for insurance contracts - - - 16,918 - 16,918
Total 1,585,287 170,332 1,803,836 5,470,771 96,935 9,127,161
31 December 2016
In thousands of EUR Corporate
State,
government
Financial
institutions Individuals Other Total
Assets
Cash and cash balances at central banks 18 - 1,190,427 7 42,488 1,232,940
Financial assets for trading 67,881 91,621 24,621 210 384 184,717
Hedging derrivatives - - 3 - - 3
Investment securities at fair value through
profit or loss 437 - 4,088 - - 4,525
Investment securities available for sale 233,055 567,844 476,501 - - 1,277,400
Investment securities held to maturity 32,057 350,488 22,827 - - 405,372
Loans and advances to banks - - 906,402 - - 906,402
Loans and advances to customers 3,613,646 4 1,337,828 701,766 4,271 5,657,515
Trade receivables and other financial assets
under risk management 103,533 6,658 49,517 2,844 399 162,951
Total 4,050,627 1,016,615 4,012,214 704,827 47,542 9,831,825
Liabilities (for informational purposes)
Trading liabilities 747 - 8,915 281 213 10,156
Hedging derivatives - - 5,406 - - 5,406
Deposits and loans from banks - - 93,152 - - 93,152
Deposits and loans from customers 1,052,679 148,249 363,866 5,840,089 71,981 7,476,864
Debt securities issued 267,904 - 158,389 53,795 116,686 596,774
Subordinated debt 6,144 - 25,020 22,334 2,904 56,402
Other financial liabilities under risk
management 88,001 12,815 49,155 100,608 4,132 254,711
Provision for insurance contracts - - - 13,798 - 13,798
Total 1,415,475 161,064 703,903 6,030,905 195,916 8,507,263
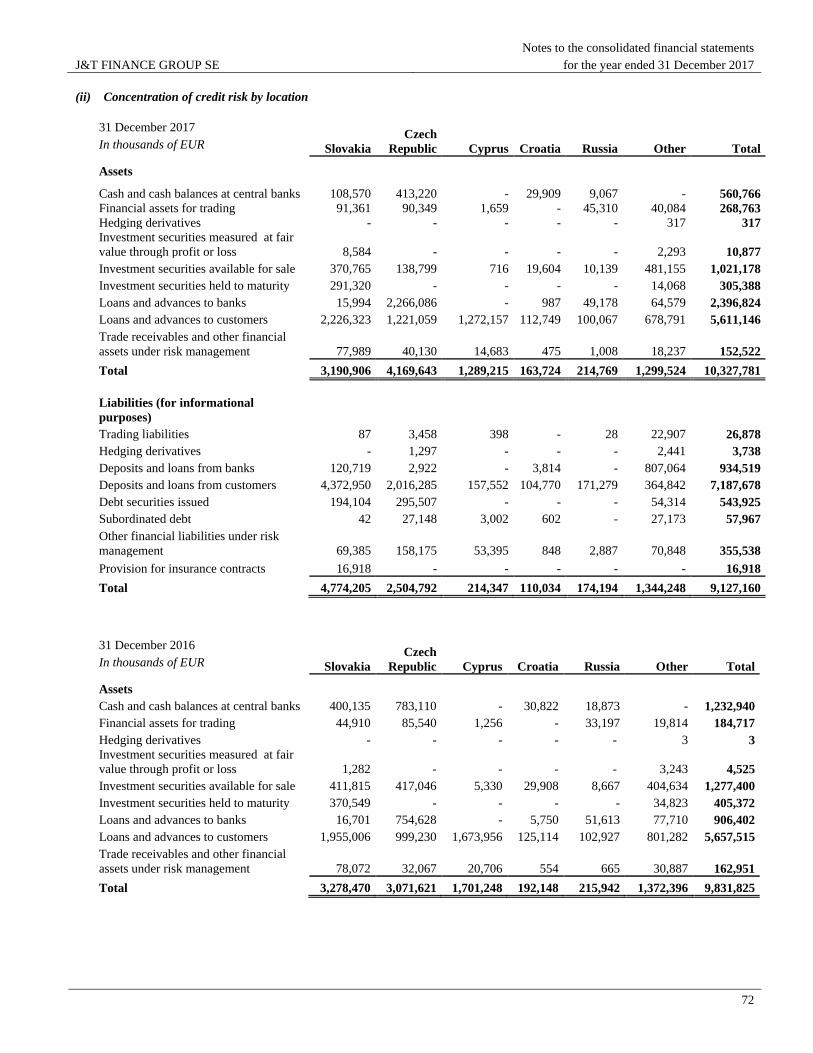
J&T FINANCE GROUP SE
Notes to the consolidated financial statements
for the year ended 31 December 2017
72
(ii) Concentration of credit risk by location
31 December 2017
In thousands of EUR Slovakia
Czech
Republic Cyprus Croatia Russia Other Total
Assets
Cash and cash balances at central banks 108,570 413,220 - 29,909 9,067 - 560,766
Financial assets for trading 91,361 90,349 1,659 - 45,310 40,084 268,763
Hedging derivatives - - - - - 317 317
Investment securities measured at fair
value through profit or loss 8,584 - - - - 2,293 10,877
Investment securities available for sale 370,765 138,799 716 19,604 10,139 481,155 1,021,178
Investment securities held to maturity 291,320 - - - - 14,068 305,388
Loans and advances to banks 15,994 2,266,086 - 987 49,178 64,579 2,396,824
Loans and advances to customers 2,226,323 1,221,059 1,272,157 112,749 100,067 678,791 5,611,146
Trade receivables and other financial
assets under risk management 77,989 40,130 14,683 475 1,008 18,237 152,522
Total 3,190,906 4,169,643 1,289,215 163,724 214,769 1,299,524 10,327,781
Liabilities (for informational
purposes)
Trading liabilities 87 3,458 398 - 28 22,907 26,878
Hedging derivatives - 1,297 - - - 2,441 3,738
Deposits and loans from banks 120,719 2,922 - 3,814 - 807,064 934,519
Deposits and loans from customers 4,372,950 2,016,285 157,552 104,770 171,279 364,842 7,187,678
Debt securities issued 194,104 295,507 - - - 54,314 543,925
Subordinated debt 42 27,148 3,002 602 - 27,173 57,967
Other financial liabilities under risk
management 69,385 158,175 53,395 848 2,887 70,848 355,538
Provision for insurance contracts 16,918 - - - - - 16,918
Total 4,774,205 2,504,792 214,347 110,034 174,194 1,344,248 9,127,160
31 December 2016
In thousands of EUR Slovakia
Czech
Republic Cyprus Croatia Russia Other Total
Assets
Cash and cash balances at central banks 400,135 783,110 - 30,822 18,873 - 1,232,940
Financial assets for trading 44,910 85,540 1,256 - 33,197 19,814 184,717
Hedging derivatives - - - - - 3 3
Investment securities measured at fair
value through profit or loss 1,282 - - - - 3,243 4,525
Investment securities available for sale 411,815 417,046 5,330 29,908 8,667 404,634 1,277,400
Investment securities held to maturity 370,549 - - - - 34,823 405,372
Loans and advances to banks 16,701 754,628 - 5,750 51,613 77,710 906,402
Loans and advances to customers 1,955,006 999,230 1,673,956 125,114 102,927 801,282 5,657,515
Trade receivables and other financial
assets under risk management 78,072 32,067 20,706 554 665 30,887 162,951
Total 3,278,470 3,071,621 1,701,248 192,148 215,942 1,372,396 9,831,825
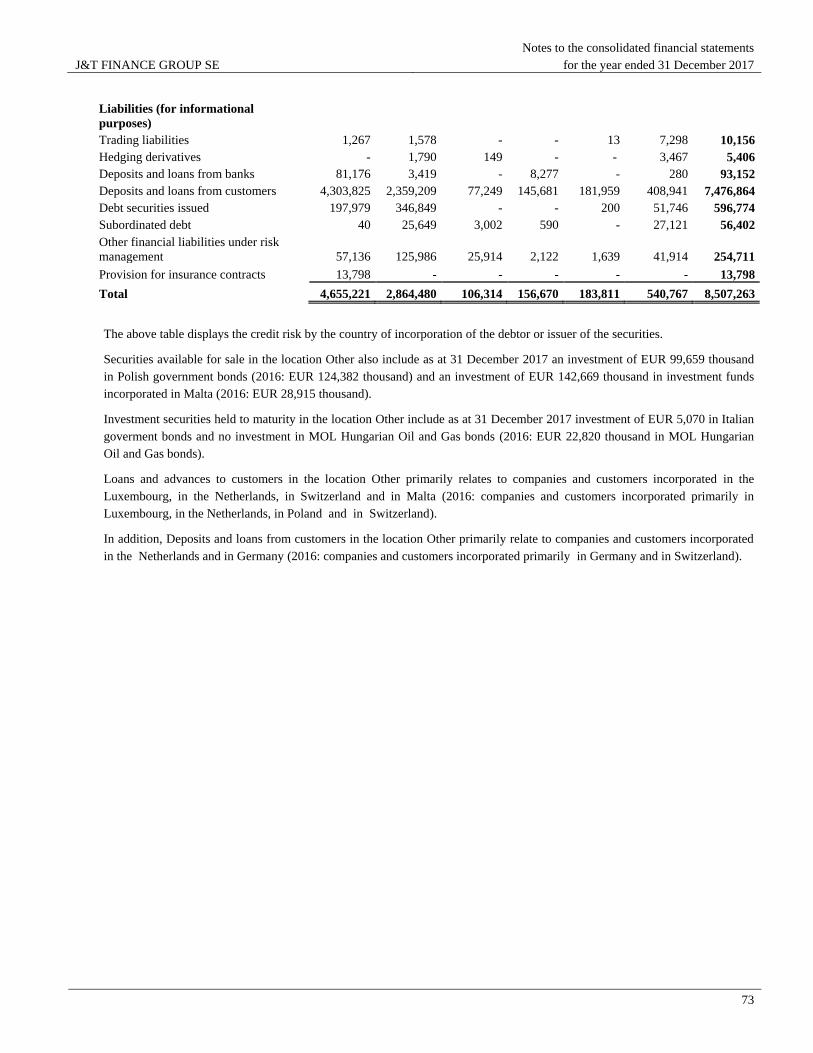
J&T FINANCE GROUP SE
Notes to the consolidated financial statements
for the year ended 31 December 2017
73
Liabilities (for informational
purposes)
Trading liabilities 1,267 1,578 - - 13 7,298 10,156
Hedging derivatives - 1,790 149 - - 3,467 5,406
Deposits and loans from banks 81,176 3,419 - 8,277 - 280 93,152
Deposits and loans from customers 4,303,825 2,359,209 77,249 145,681 181,959 408,941 7,476,864
Debt securities issued 197,979 346,849 - - 200 51,746 596,774
Subordinated debt 40 25,649 3,002 590 - 27,121 56,402
Other financial liabilities under risk
management 57,136 125,986 25,914 2,122 1,639 41,914 254,711
Provision for insurance contracts 13,798 - - - - - 13,798
Total 4,655,221 2,864,480 106,314 156,670 183,811 540,767 8,507,263
The above table displays the credit risk by the country of incorporation of the debtor or issuer of the securities.
Securities available for sale in the location Other also include as at 31 December 2017 an investment of EUR 99,659 thousand
in Polish government bonds (2016: EUR 124,382 thousand) and an investment of EUR 142,669 thousand in investment funds
incorporated in Malta (2016: EUR 28,915 thousand).
Investment securities held to maturity in the location Other include as at 31 December 2017 investment of EUR 5,070 in Italian
goverment bonds and no investment in MOL Hungarian Oil and Gas bonds (2016: EUR 22,820 thousand in MOL Hungarian
Oil and Gas bonds).
Loans and advances to customers in the location Other primarily relates to companies and customers incorporated in the
Luxembourg, in the Netherlands, in Switzerland and in Malta (2016: companies and customers incorporated primarily in
Luxembourg, in the Netherlands, in Poland and in Switzerland).
In addition, Deposits and loans from customers in the location Other primarily relate to companies and customers incorporated
in the Netherlands and in Germany (2016: companies and customers incorporated primarily in Germany and in Switzerland).
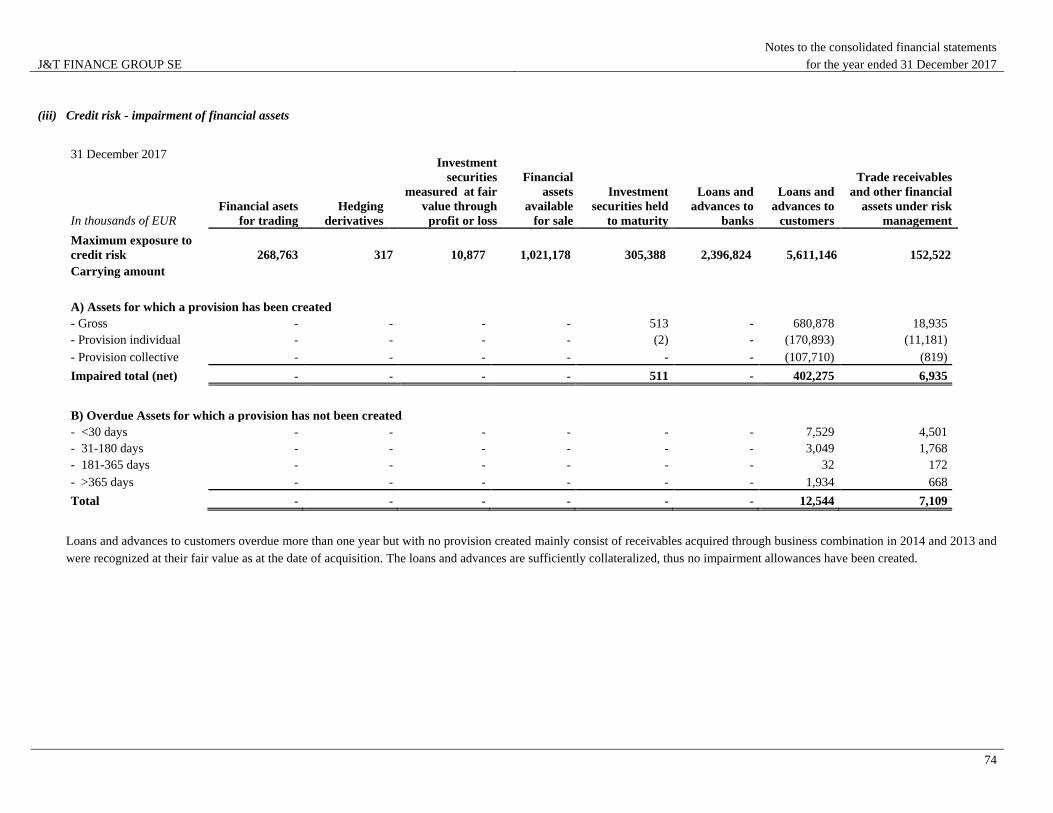
J&T FINANCE GROUP SE
Notes to the consolidated financial statements
for the year ended 31 December 2017
74
(iii) Credit risk - impairment of financial assets
31 December 2017
In thousands of EUR
Financial asets
for trading
Hedging
derivatives
Investment
securities
measured at fair
value through
profit or loss
Financial
assets
available
for sale
Investment
securities held
to maturity
Loans and
advances to
banks
Loans and
advances to
customers
Trade receivables
and other financial
assets under risk
management
Maximum exposure to
credit risk 268,763 317 10,877 1,021,178 305,388 2,396,824 5,611,146 152,522
Carrying amount
A) Assets for which a provision has been created
- Gross - - - - 513 - 680,878 18,935
- Provision individual - - - - (2) - (170,893) (11,181)
- Provision collective - - - - - - (107,710) (819)
Impaired total (net) - - - - 511 - 402,275 6,935
B) Overdue Assets for which a provision has not been created
- <30 days - - - - - - 7,529 4,501
- 31-180 days - - - - - - 3,049 1,768
- 181-365 days - - - - - - 32 172
- >365 days - - - - - - 1,934 668
Total - - - - - - 12,544 7,109
Loans and advances to customers overdue more than one year but with no provision created mainly consist of receivables acquired through business combination in 2014 and 2013 and
were recognized at their fair value as at the date of acquisition. The loans and advances are sufficiently collateralized, thus no impairment allowances have been created.
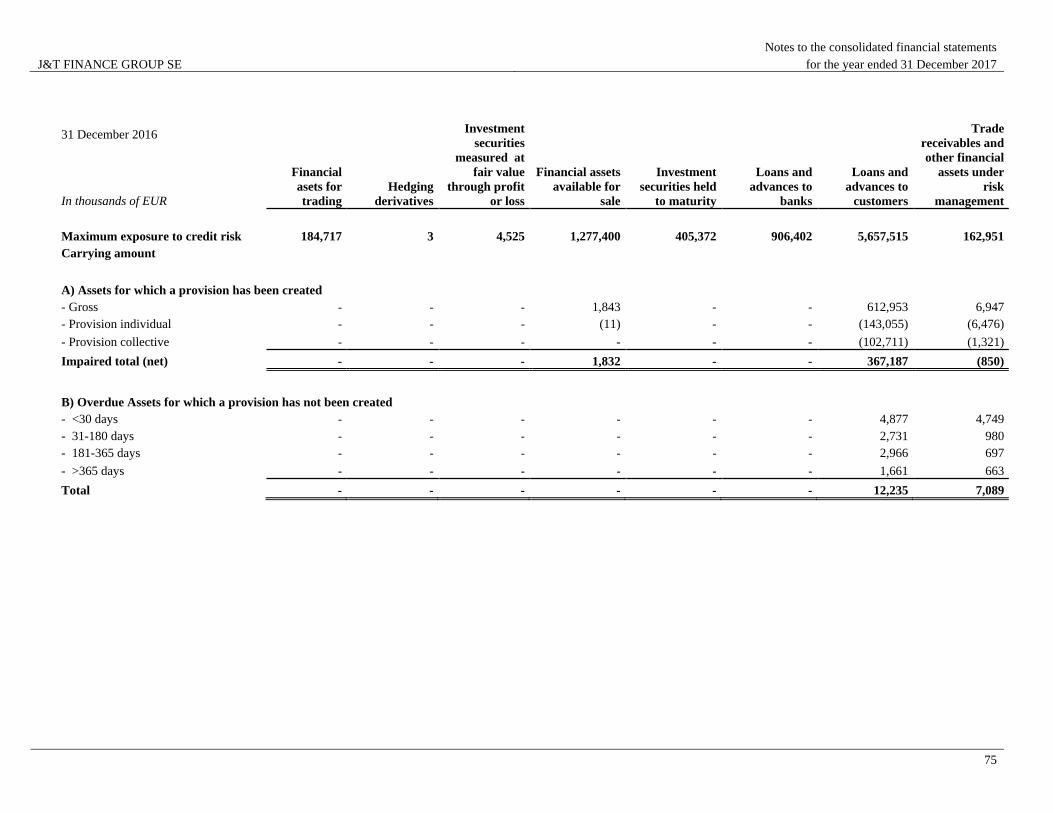
J&T FINANCE GROUP SE
Notes to the consolidated financial statements
for the year ended 31 December 2017
75
31 December 2016
In thousands of EUR
Financial
asets for
trading
Hedging
derivatives
Investment
securities
measured at
fair value
through profit
or loss
Financial assets
available for
sale
Investment
securities held
to maturity
Loans and
advances to
banks
Loans and
advances to
customers
Trade
receivables and
other financial
assets under
risk
management
Maximum exposure to credit risk 184,717 3 4,525 1,277,400 405,372 906,402 5,657,515 162,951
Carrying amount
A) Assets for which a provision has been created
- Gross - - - 1,843 - - 612,953 6,947
- Provision individual - - - (11) - - (143,055) (6,476)
- Provision collective - - - - - - (102,711) (1,321)
Impaired total (net) - - - 1,832 - - 367,187 (850)
B) Overdue Assets for which a provision has not been created
- <30 days - - - - - - 4,877 4,749
- 31-180 days - - - - - - 2,731 980
- 181-365 days - - - - - - 2,966 697
- >365 days - - - - - - 1,661 663
Total - - - - - - 12,235 7,089
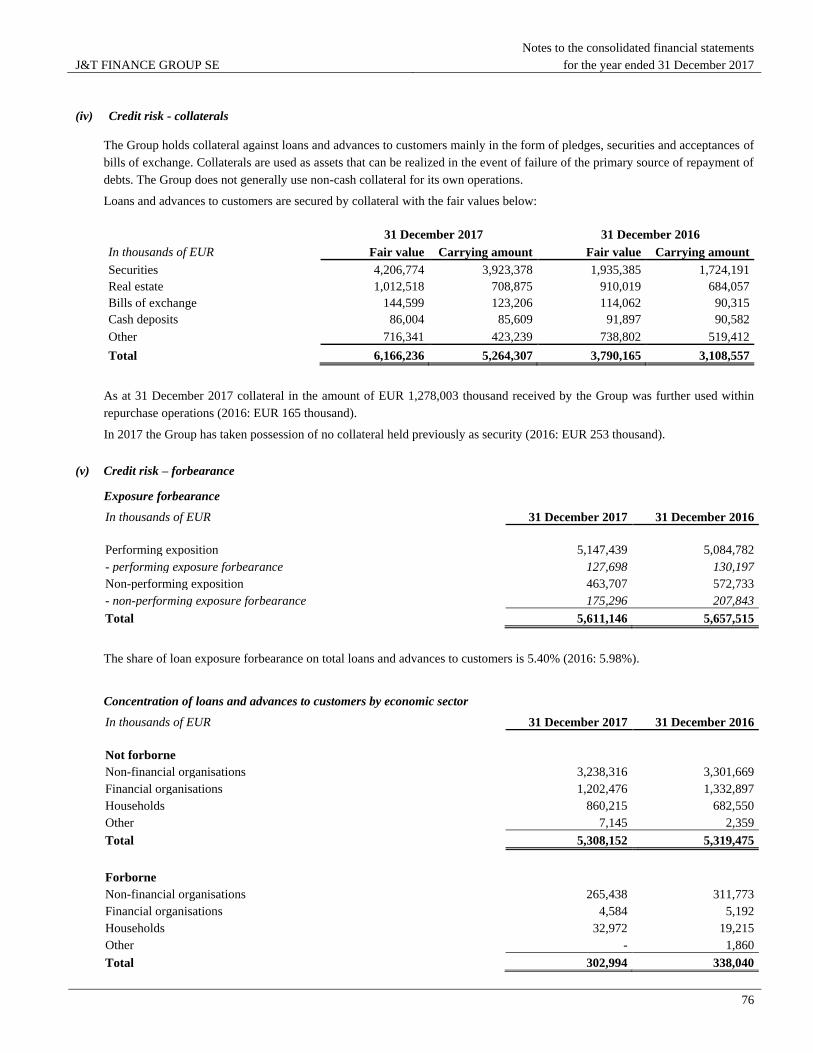
J&T FINANCE GROUP SE
Notes to the consolidated financial statements
for the year ended 31 December 2017
76
(iv) Credit risk - collaterals
The Group holds collateral against loans and advances to customers mainly in the form of pledges, securities and acceptances of
bills of exchange. Collaterals are used as assets that can be realized in the event of failure of the primary source of repayment of
debts. The Group does not generally use non-cash collateral for its own operations.
Loans and advances to customers are secured by collateral with the fair values below:
31 December 2017 31 December 2016
In thousands of EUR Fair value Carrying amount Fair value Carrying amount
Securities 4,206,774 3,923,378 1,935,385 1,724,191
Real estate 1,012,518 708,875 910,019 684,057
Bills of exchange 144,599 123,206 114,062 90,315
Cash deposits 86,004 85,609 91,897 90,582
Other 716,341 423,239 738,802 519,412
Total 6,166,236 5,264,307 3,790,165 3,108,557
As at 31 December 2017 collateral in the amount of EUR 1,278,003 thousand received by the Group was further used within
repurchase operations (2016: EUR 165 thousand).
In 2017 the Group has taken possession of no collateral held previously as security (2016: EUR 253 thousand).
(v) Credit risk – forbearance
Exposure forbearance
In thousands of EUR 31 December 2017 31 December 2016
Performing exposition 5,147,439 5,084,782
- performing exposure forbearance 127,698 130,197
Non-performing exposition 463,707 572,733
- non-performing exposure forbearance 175,296 207,843
Total 5,611,146 5,657,515
The share of loan exposure forbearance on total loans and advances to customers is 5.40% (2016: 5.98%).
Concentration of loans and advances to customers by economic sector
In thousands of EUR 31 December 2017 31 December 2016
Not forborne
Non-financial organisations 3,238,316 3,301,669
Financial organisations 1,202,476 1,332,897
Households 860,215 682,550
Other 7,145 2,359
Total 5,308,152 5,319,475
Forborne
Non-financial organisations 265,438 311,773
Financial organisations 4,584 5,192
Households 32,972 19,215
Other - 1,860
Total 302,994 338,040
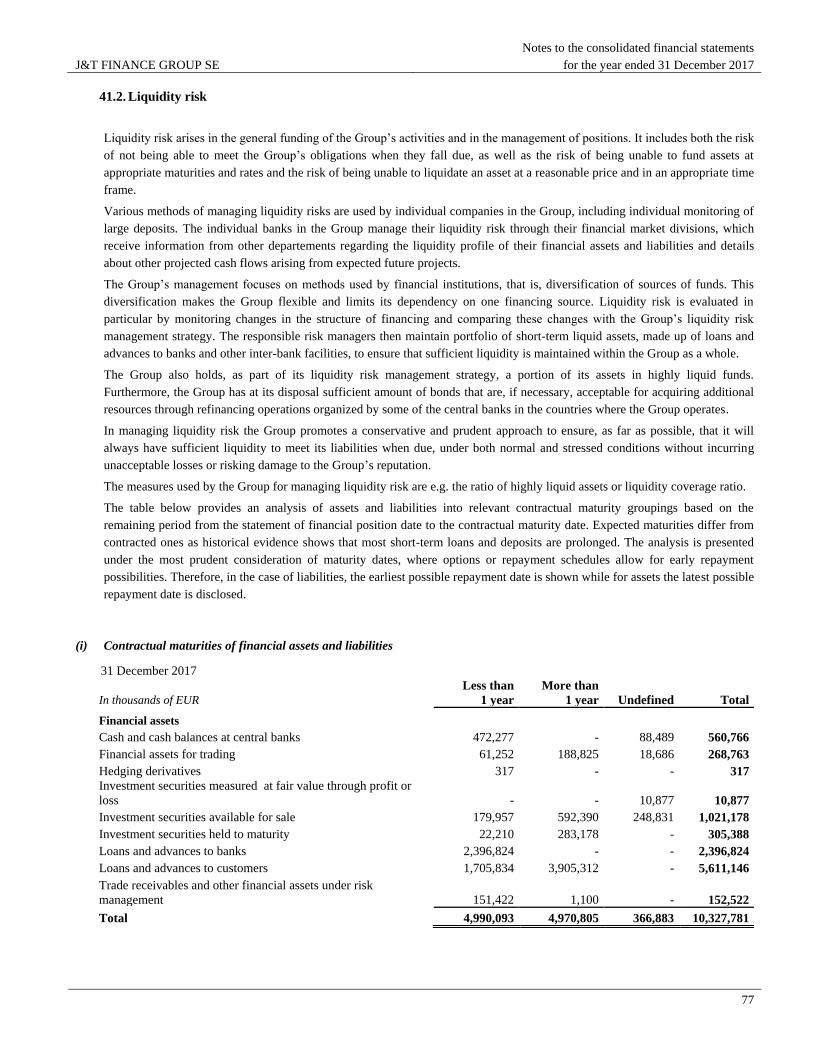
J&T FINANCE GROUP SE
Notes to the consolidated financial statements
for the year ended 31 December 2017
77
41.2. Liquidity risk
Liquidity risk arises in the general funding of the Group’s activities and in the management of positions. It includes both the risk
of not being able to meet the Group’s obligations when they fall due, as well as the risk of being unable to fund assets at
appropriate maturities and rates and the risk of being unable to liquidate an asset at a reasonable price and in an appropriate time
frame.
Various methods of managing liquidity risks are used by individual companies in the Group, including individual monitoring of
large deposits. The individual banks in the Group manage their liquidity risk through their financial market divisions, which
receive information from other departements regarding the liquidity profile of their financial assets and liabilities and details
about other projected cash flows arising from expected future projects.
The Group’s management focuses on methods used by financial institutions, that is, diversification of sources of funds. This
diversification makes the Group flexible and limits its dependency on one financing source. Liquidity risk is evaluated in
particular by monitoring changes in the structure of financing and comparing these changes with the Group’s liquidity risk
management strategy. The responsible risk managers then maintain portfolio of short-term liquid assets, made up of loans and
advances to banks and other inter-bank facilities, to ensure that sufficient liquidity is maintained within the Group as a whole.
The Group also holds, as part of its liquidity risk management strategy, a portion of its assets in highly liquid funds.
Furthermore, the Group has at its disposal sufficient amount of bonds that are, if necessary, acceptable for acquiring additional
resources through refinancing operations organized by some of the central banks in the countries where the Group operates.
In managing liquidity risk the Group promotes a conservative and prudent approach to ensure, as far as possible, that it will
always have sufficient liquidity to meet its liabilities when due, under both normal and stressed conditions without incurring
unacceptable losses or risking damage to the Group’s reputation.
The measures used by the Group for managing liquidity risk are e.g. the ratio of highly liquid assets or liquidity coverage ratio.
The table below provides an analysis of assets and liabilities into relevant contractual maturity groupings based on the
remaining period from the statement of financial position date to the contractual maturity date. Expected maturities differ from
contracted ones as historical evidence shows that most short-term loans and deposits are prolonged. The analysis is presented
under the most prudent consideration of maturity dates, where options or repayment schedules allow for early repayment
possibilities. Therefore, in the case of liabilities, the earliest possible repayment date is shown while for assets the latest possible
repayment date is disclosed.
(i) Contractual maturities of financial assets and liabilities
31 December 2017
In thousands of EUR
Less than
1 year
More than
1 year Undefined Total
Financial assets
Cash and cash balances at central banks 472,277 - 88,489 560,766
Financial assets for trading 61,252 188,825 18,686 268,763
Hedging derivatives 317 - - 317
Investment securities measured at fair value through profit or
loss - - 10,877 10,877
Investment securities available for sale 179,957 592,390 248,831 1,021,178
Investment securities held to maturity 22,210 283,178 - 305,388
Loans and advances to banks 2,396,824 - - 2,396,824
Loans and advances to customers 1,705,834 3,905,312 - 5,611,146
Trade receivables and other financial assets under risk
management 151,422 1,100 - 152,522
Total 4,990,093 4,970,805 366,883 10,327,781
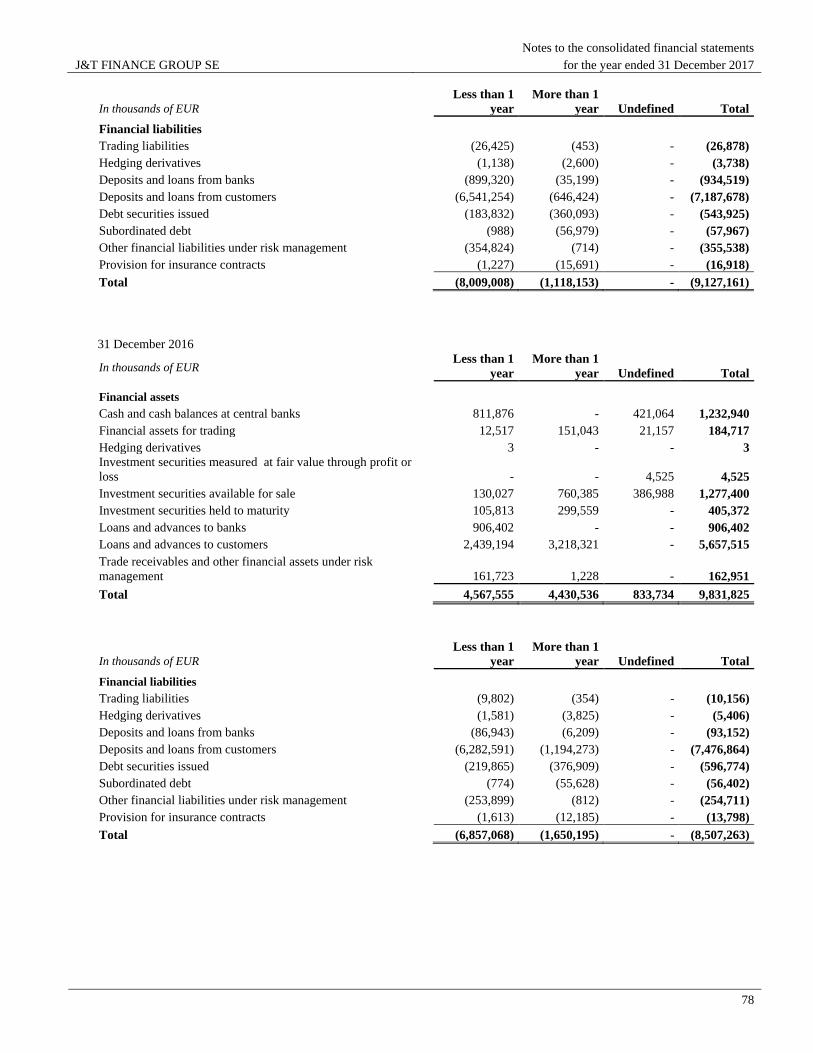
J&T FINANCE GROUP SE
Notes to the consolidated financial statements
for the year ended 31 December 2017
78
In thousands of EUR
Less than 1
year
More than 1
year Undefined Total
Financial liabilities
Trading liabilities (26,425) (453) - (26,878)
Hedging derivatives (1,138) (2,600) - (3,738)
Deposits and loans from banks (899,320) (35,199) - (934,519)
Deposits and loans from customers (6,541,254) (646,424) - (7,187,678)
Debt securities issued (183,832) (360,093) - (543,925)
Subordinated debt (988) (56,979) - (57,967)
Other financial liabilities under risk management (354,824) (714) - (355,538)
Provision for insurance contracts (1,227) (15,691) - (16,918)
Total (8,009,008) (1,118,153) - (9,127,161)
31 December 2016
In thousands of EUR Less than 1
year
More than 1
year
Undefined
Total
Financial assets
Cash and cash balances at central banks 811,876 - 421,064 1,232,940
Financial assets for trading 12,517 151,043 21,157 184,717
Hedging derivatives 3 - - 3
Investment securities measured at fair value through profit or
loss - - 4,525 4,525
Investment securities available for sale 130,027 760,385 386,988 1,277,400
Investment securities held to maturity 105,813 299,559 - 405,372
Loans and advances to banks 906,402 - - 906,402
Loans and advances to customers 2,439,194 3,218,321 - 5,657,515
Trade receivables and other financial assets under risk
management 161,723 1,228 - 162,951
Total 4,567,555 4,430,536 833,734 9,831,825
In thousands of EUR
Less than 1
year
More than 1
year Undefined Total
Financial liabilities
Trading liabilities (9,802) (354) - (10,156)
Hedging derivatives (1,581) (3,825) - (5,406)
Deposits and loans from banks (86,943) (6,209) - (93,152)
Deposits and loans from customers (6,282,591) (1,194,273) - (7,476,864)
Debt securities issued (219,865) (376,909) - (596,774)
Subordinated debt (774) (55,628) - (56,402)
Other financial liabilities under risk management (253,899) (812) - (254,711)
Provision for insurance contracts (1,613) (12,185) - (13,798)
Total (6,857,068) (1,650,195) - (8,507,263)
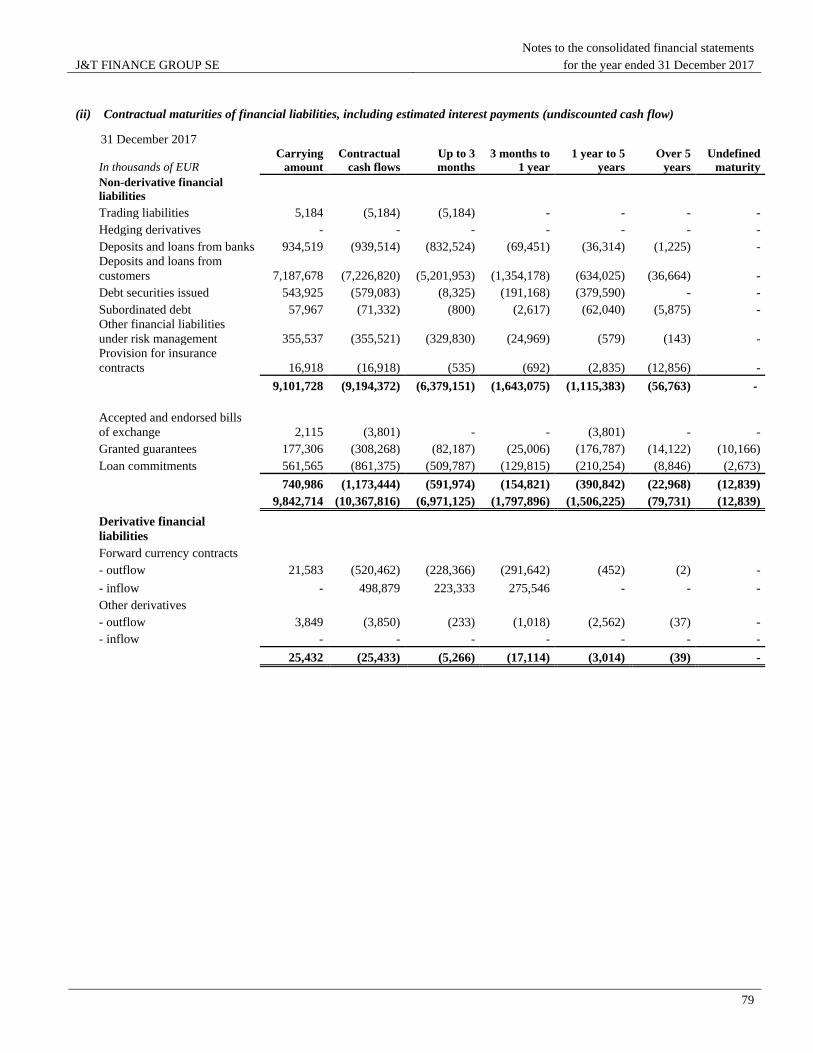
J&T FINANCE GROUP SE
Notes to the consolidated financial statements
for the year ended 31 December 2017
79
(ii) Contractual maturities of financial liabilities, including estimated interest payments (undiscounted cash flow)
31 December 2017
In thousands of EUR Carrying
amount
Contractual
cash flows
Up to 3
months
3 months to
1 year
1 year to 5
years
Over 5
years
Undefined
maturity
Non-derivative financial
liabilities
Trading liabilities 5,184 (5,184) (5,184) - - - -
Hedging derivatives - - - - - - -
Deposits and loans from banks 934,519 (939,514) (832,524) (69,451) (36,314) (1,225) -
Deposits and loans from
customers 7,187,678 (7,226,820) (5,201,953) (1,354,178) (634,025) (36,664) -
Debt securities issued 543,925 (579,083) (8,325) (191,168) (379,590) - -
Subordinated debt 57,967 (71,332) (800) (2,617) (62,040) (5,875) -
Other financial liabilities
under risk management 355,537 (355,521) (329,830) (24,969) (579) (143) -
Provision for insurance
contracts 16,918 (16,918) (535) (692) (2,835) (12,856) -
9,101,728 (9,194,372) (6,379,151) (1,643,075) (1,115,383) (56,763) -
Accepted and endorsed bills
of exchange 2,115 (3,801) - - (3,801) - -
Granted guarantees 177,306 (308,268) (82,187) (25,006) (176,787) (14,122) (10,166)
Loan commitments 561,565 (861,375) (509,787) (129,815) (210,254) (8,846) (2,673)
740,986 (1,173,444) (591,974) (154,821) (390,842) (22,968) (12,839)
9,842,714 (10,367,816) (6,971,125) (1,797,896) (1,506,225) (79,731) (12,839)
Derivative financial
liabilities
Forward currency contracts
- outflow 21,583 (520,462) (228,366) (291,642) (452) (2) -
- inflow - 498,879 223,333 275,546 - - -
Other derivatives
- outflow 3,849 (3,850) (233) (1,018) (2,562) (37) -
- inflow - - - - - - -
25,432 (25,433) (5,266) (17,114) (3,014) (39) -
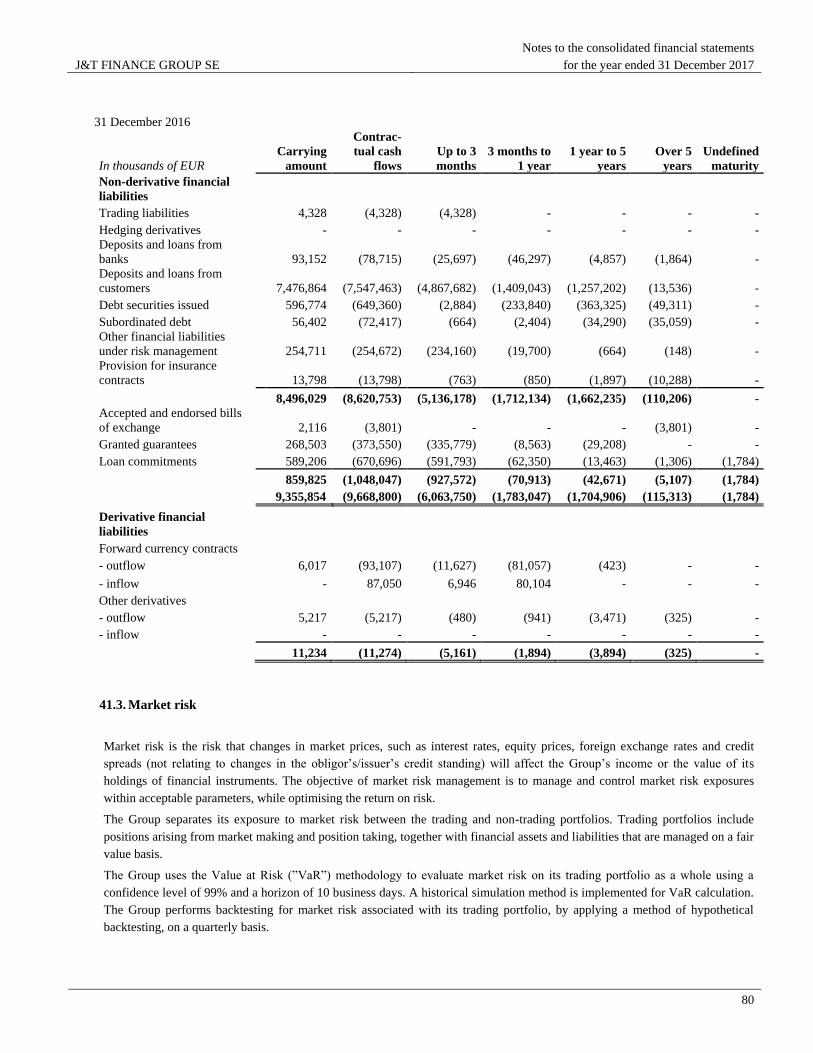
J&T FINANCE GROUP SE
Notes to the consolidated financial statements
for the year ended 31 December 2017
80
31 December 2016
In thousands of EUR
Carrying
amount
Contrac-
tual cash
flows
Up to 3
months
3 months to
1 year
1 year to 5
years
Over 5
years
Undefined
maturity
Non-derivative financial
liabilities
Trading liabilities 4,328 (4,328) (4,328) - - - -
Hedging derivatives - - - - - - -
Deposits and loans from
banks 93,152 (78,715) (25,697) (46,297) (4,857) (1,864) -
Deposits and loans from
customers 7,476,864 (7,547,463) (4,867,682) (1,409,043) (1,257,202) (13,536) -
Debt securities issued 596,774 (649,360) (2,884) (233,840) (363,325) (49,311) -
Subordinated debt 56,402 (72,417) (664) (2,404) (34,290) (35,059) -
Other financial liabilities
under risk management 254,711 (254,672) (234,160) (19,700) (664) (148) -
Provision for insurance
contracts 13,798 (13,798) (763) (850) (1,897) (10,288) -
8,496,029 (8,620,753) (5,136,178) (1,712,134) (1,662,235) (110,206) -
Accepted and endorsed bills
of exchange 2,116 (3,801) - - - (3,801) -
Granted guarantees 268,503 (373,550) (335,779) (8,563) (29,208) - -
Loan commitments 589,206 (670,696) (591,793) (62,350) (13,463) (1,306) (1,784)
859,825 (1,048,047) (927,572) (70,913) (42,671) (5,107) (1,784)
9,355,854 (9,668,800) (6,063,750) (1,783,047) (1,704,906) (115,313) (1,784)
Derivative financial
liabilities
Forward currency contracts
- outflow 6,017 (93,107) (11,627) (81,057) (423) - -
- inflow - 87,050 6,946 80,104 - - -
Other derivatives
- outflow 5,217 (5,217) (480) (941) (3,471) (325) -
- inflow - - - - - - -
11,234 (11,274) (5,161) (1,894) (3,894) (325) -
41.3. Market risk
Market risk is the risk that changes in market prices, such as interest rates, equity prices, foreign exchange rates and credit
spreads (not relating to changes in the obligor’s/issuer’s credit standing) will affect the Group’s income or the value of its
holdings of financial instruments. The objective of market risk management is to manage and control market risk exposures
within acceptable parameters, while optimising the return on risk.
The Group separates its exposure to market risk between the trading and non-trading portfolios. Trading portfolios include
positions arising from market making and position taking, together with financial assets and liabilities that are managed on a fair
value basis.
The Group uses the Value at Risk (”VaR”) methodology to evaluate market risk on its trading portfolio as a whole using a
confidence level of 99% and a horizon of 10 business days. A historical simulation method is implemented for VaR calculation.
The Group performs backtesting for market risk associated with its trading portfolio, by applying a method of hypothetical
backtesting, on a quarterly basis.
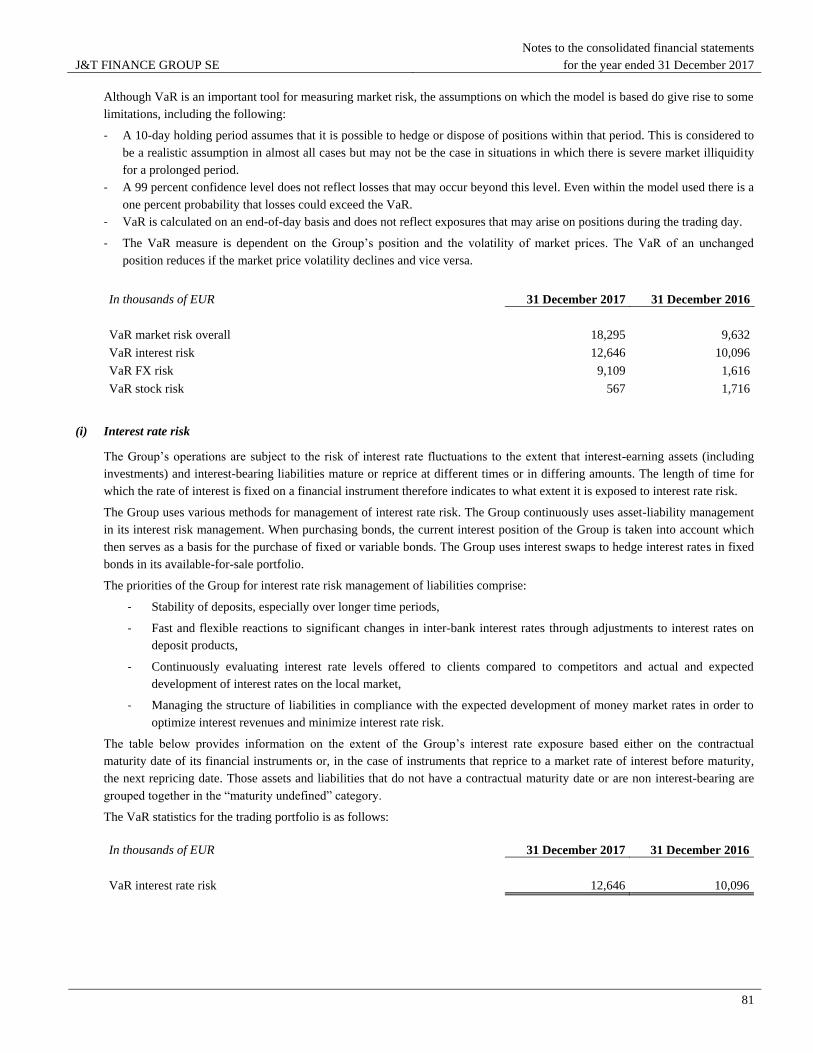
J&T FINANCE GROUP SE
Notes to the consolidated financial statements
for the year ended 31 December 2017
81
Although VaR is an important tool for measuring market risk, the assumptions on which the model is based do give rise to some
limitations, including the following:
- A 10-day holding period assumes that it is possible to hedge or dispose of positions within that period. This is considered to
be a realistic assumption in almost all cases but may not be the case in situations in which there is severe market illiquidity
for a prolonged period.
- A 99 percent confidence level does not reflect losses that may occur beyond this level. Even within the model used there is a
one percent probability that losses could exceed the VaR.
- VaR is calculated on an end-of-day basis and does not reflect exposures that may arise on positions during the trading day.
- The VaR measure is dependent on the Group’s position and the volatility of market prices. The VaR of an unchanged
position reduces if the market price volatility declines and vice versa.
In thousands of EUR 31 December 2017 31 December 2016
VaR market risk overall 18,295 9,632
VaR interest risk 12,646 10,096
VaR FX risk 9,109 1,616
VaR stock risk 567 1,716
(i) Interest rate risk
The Group’s operations are subject to the risk of interest rate fluctuations to the extent that interest-earning assets (including
investments) and interest-bearing liabilities mature or reprice at different times or in differing amounts. The length of time for
which the rate of interest is fixed on a financial instrument therefore indicates to what extent it is exposed to interest rate risk.
The Group uses various methods for management of interest rate risk. The Group continuously uses asset-liability management
in its interest risk management. When purchasing bonds, the current interest position of the Group is taken into account which
then serves as a basis for the purchase of fixed or variable bonds. The Group uses interest swaps to hedge interest rates in fixed
bonds in its available-for-sale portfolio.
The priorities of the Group for interest rate risk management of liabilities comprise:
- Stability of deposits, especially over longer time periods,
- Fast and flexible reactions to significant changes in inter-bank interest rates through adjustments to interest rates on
deposit products,
- Continuously evaluating interest rate levels offered to clients compared to competitors and actual and expected
development of interest rates on the local market,
- Managing the structure of liabilities in compliance with the expected development of money market rates in order to
optimize interest revenues and minimize interest rate risk.
The table below provides information on the extent of the Group’s interest rate exposure based either on the contractual
maturity date of its financial instruments or, in the case of instruments that reprice to a market rate of interest before maturity,
the next repricing date. Those assets and liabilities that do not have a contractual maturity date or are non interest-bearing are
grouped together in the “maturity undefined” category.
The VaR statistics for the trading portfolio is as follows:
In thousands of EUR 31 December 2017 31 December 2016
VaR interest rate risk 12,646 10,096
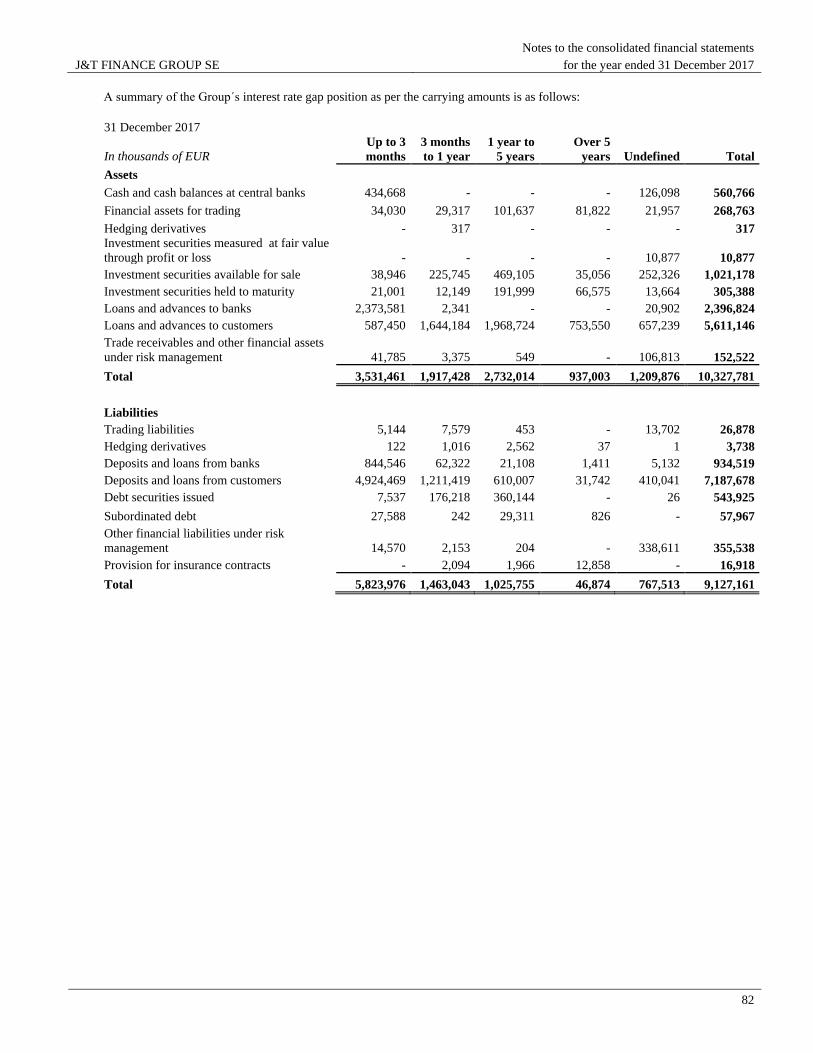
J&T FINANCE GROUP SE
Notes to the consolidated financial statements
for the year ended 31 December 2017
82
A summary of the Group´s interest rate gap position as per the carrying amounts is as follows:
31 December 2017
In thousands of EUR
Up to 3
months
3 months
to 1 year
1 year to
5 years
Over 5
years Undefined Total
Assets
Cash and cash balances at central banks 434,668 - - - 126,098 560,766
Financial assets for trading 34,030 29,317 101,637 81,822 21,957 268,763
Hedging derivatives - 317 - - - 317
Investment securities measured at fair value
through profit or loss - - - - 10,877 10,877
Investment securities available for sale 38,946 225,745 469,105 35,056 252,326 1,021,178
Investment securities held to maturity 21,001 12,149 191,999 66,575 13,664 305,388
Loans and advances to banks 2,373,581 2,341 - - 20,902 2,396,824
Loans and advances to customers 587,450 1,644,184 1,968,724 753,550 657,239 5,611,146
Trade receivables and other financial assets
under risk management 41,785 3,375 549 - 106,813 152,522
Total 3,531,461 1,917,428 2,732,014 937,003 1,209,876 10,327,781
Liabilities
Trading liabilities 5,144 7,579 453 - 13,702 26,878
Hedging derivatives 122 1,016 2,562 37 1 3,738
Deposits and loans from banks 844,546 62,322 21,108 1,411 5,132 934,519
Deposits and loans from customers 4,924,469 1,211,419 610,007 31,742 410,041 7,187,678
Debt securities issued 7,537 176,218 360,144 - 26 543,925
Subordinated debt 27,588 242 29,311 826 - 57,967
Other financial liabilities under risk
management 14,570 2,153 204 - 338,611 355,538
Provision for insurance contracts - 2,094 1,966 12,858 - 16,918
Total 5,823,976 1,463,043 1,025,755 46,874 767,513 9,127,161

J&T FINANCE GROUP SE
Notes to the consolidated financial statements
for the year ended 31 December 2017
83
31 December 2016
In thousands of EUR
Up to 3
months
3 months
to 1 year
1 year to
5 years
Over 5
years Undefined Total
Assets
Cash and cash balances at central banks 1,148,289 - - - 84,651 1,232,940
Financial assets for trading 161,593 - - - 23,124 184,717
Hedging derivatives 3 - - - - 3
Investment securities measured at fair value
through profit or loss - - - - 4,525 4,525
Investment securities available for sale 113,674 96,757 525,687 154,294 386,988 1,277,400
Investment securities held to maturity 54,824 76,932 192,279 63,245 18,092 405,372
Loans and advances to banks 898,511 2,377 - - 5,514 906,402
Loans and advances to customers 1,059,059 2,827,640 1,005,100 232,608 533,108 5,657,515
Trade receivables and other financial assets
under risk management 36,843 859 - - 125,249 162,951
3,472,796 3,004,565 1,723,066 450,147 1,181,251 9,831,825
Liabilities
Trading liabilities 5,043 1,125 69 - 3,919 10,156
Hedging derivatives 310 5 29 - 5,062 5,406
Deposits and loans from banks 45,929 40,391 4,669 1,652 511 93,152
Deposits and loans from customers 4,549,428 1,385,002 1,214,486 10,352 317,596 7,476,864
Debt securities issued 3,259 216,648 329,867 - 47,000 596,774
Subordinated debt 27,488 229 25,116 3,569 - 56,402
Other financial liabilities under risk
management 9,437 495 93 - 244,686 254,711
Provision for insurance contracts 1,033 1,006 1,470 9,878 411 13,798
4,641,927 1,644,901 1,575,799 25,451 619,185 8,507,263
An analysis of the Group’s sensitivity to an increase or decrease in market interest rates on the non-trading portfolio, assuming
no asymmetrical movement in yield curves and a constant financial position, is as follows:
In thousands of EUR Impact on Profit or Loss
Impact on Other Comprehensive
Income
31 December 2017 31 December 2016
31 December 2017 31 December 2016
decrease in interest rates by 100 bp 55,721 8,656
12,218 18,981
increase in interest rates by 100 bp (55,721) (8,656)
(12,218) (18,981)
Total impact on Equity
31 December 2017 31 December 2016
decrease in interest rates by 100 bp
67,939 27,637
increase in interest rates by 100 bp
(67,939) (27,637)
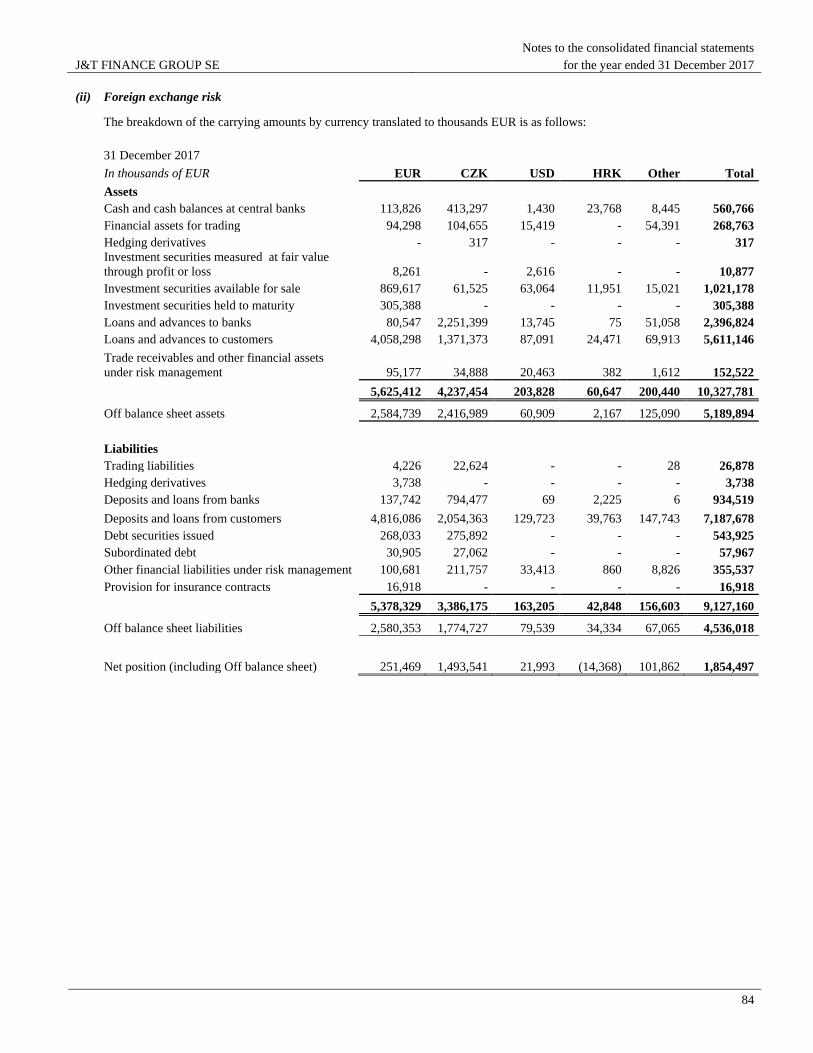
J&T FINANCE GROUP SE
Notes to the consolidated financial statements
for the year ended 31 December 2017
84
(ii) Foreign exchange risk
The breakdown of the carrying amounts by currency translated to thousands EUR is as follows:
31 December 2017
In thousands of EUR EUR CZK USD HRK Other Total
Assets
Cash and cash balances at central banks 113,826 413,297 1,430 23,768 8,445 560,766
Financial assets for trading 94,298 104,655 15,419 - 54,391 268,763
Hedging derivatives - 317 - - - 317
Investment securities measured at fair value
through profit or loss 8,261 - 2,616 - - 10,877
Investment securities available for sale 869,617 61,525 63,064 11,951 15,021 1,021,178
Investment securities held to maturity 305,388 - - - - 305,388
Loans and advances to banks 80,547 2,251,399 13,745 75 51,058 2,396,824
Loans and advances to customers 4,058,298 1,371,373 87,091 24,471 69,913 5,611,146
Trade receivables and other financial assets
under risk management 95,177 34,888 20,463 382 1,612 152,522
5,625,412 4,237,454 203,828 60,647 200,440 10,327,781
Off balance sheet assets 2,584,739 2,416,989 60,909 2,167 125,090 5,189,894
Liabilities
Trading liabilities 4,226 22,624 - - 28 26,878
Hedging derivatives 3,738 - - - - 3,738
Deposits and loans from banks 137,742 794,477 69 2,225 6 934,519
Deposits and loans from customers 4,816,086 2,054,363 129,723 39,763 147,743 7,187,678
Debt securities issued 268,033 275,892 - - - 543,925
Subordinated debt 30,905 27,062 - - - 57,967
Other financial liabilities under risk management 100,681 211,757 33,413 860 8,826 355,537
Provision for insurance contracts 16,918 - - - - 16,918
5,378,329 3,386,175 163,205 42,848 156,603 9,127,160
Off balance sheet liabilities 2,580,353 1,774,727 79,539 34,334 67,065 4,536,018
Net position (including Off balance sheet) 251,469 1,493,541 21,993 (14,368) 101,862 1,854,497
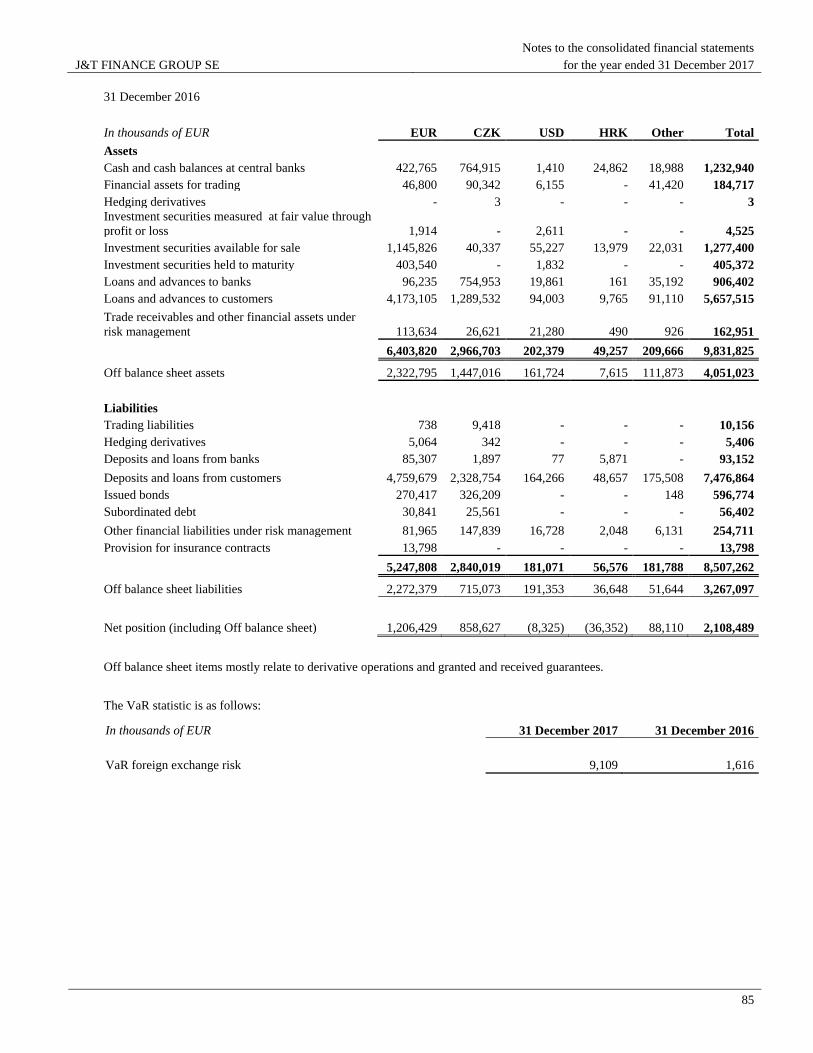
J&T FINANCE GROUP SE
Notes to the consolidated financial statements
for the year ended 31 December 2017
85
31 December 2016
In thousands of EUR EUR CZK USD HRK Other Total
Assets
Cash and cash balances at central banks 422,765 764,915 1,410 24,862 18,988 1,232,940
Financial assets for trading 46,800 90,342 6,155 - 41,420 184,717
Hedging derivatives - 3 - - - 3
Investment securities measured at fair value through
profit or loss 1,914 - 2,611 - - 4,525
Investment securities available for sale 1,145,826 40,337 55,227 13,979 22,031 1,277,400
Investment securities held to maturity 403,540 - 1,832 - - 405,372
Loans and advances to banks 96,235 754,953 19,861 161 35,192 906,402
Loans and advances to customers 4,173,105 1,289,532 94,003 9,765 91,110 5,657,515
Trade receivables and other financial assets under
risk management 113,634 26,621 21,280 490 926 162,951
6,403,820 2,966,703 202,379 49,257 209,666 9,831,825
Off balance sheet assets 2,322,795 1,447,016 161,724 7,615 111,873 4,051,023
Liabilities
Trading liabilities 738 9,418 - - - 10,156
Hedging derivatives 5,064 342 - - - 5,406
Deposits and loans from banks 85,307 1,897 77 5,871 - 93,152
Deposits and loans from customers 4,759,679 2,328,754 164,266 48,657 175,508 7,476,864
Issued bonds 270,417 326,209 - - 148 596,774
Subordinated debt 30,841 25,561 - - - 56,402
Other financial liabilities under risk management 81,965 147,839 16,728 2,048 6,131 254,711
Provision for insurance contracts 13,798 - - - - 13,798
5,247,808 2,840,019 181,071 56,576 181,788 8,507,262
Off balance sheet liabilities 2,272,379 715,073 191,353 36,648 51,644 3,267,097
Net position (including Off balance sheet) 1,206,429 858,627 (8,325) (36,352) 88,110 2,108,489
Off balance sheet items mostly relate to derivative operations and granted and received guarantees.
The VaR statistic is as follows:
In thousands of EUR 31 December 2017 31 December 2016
VaR foreign exchange risk 9,109 1,616
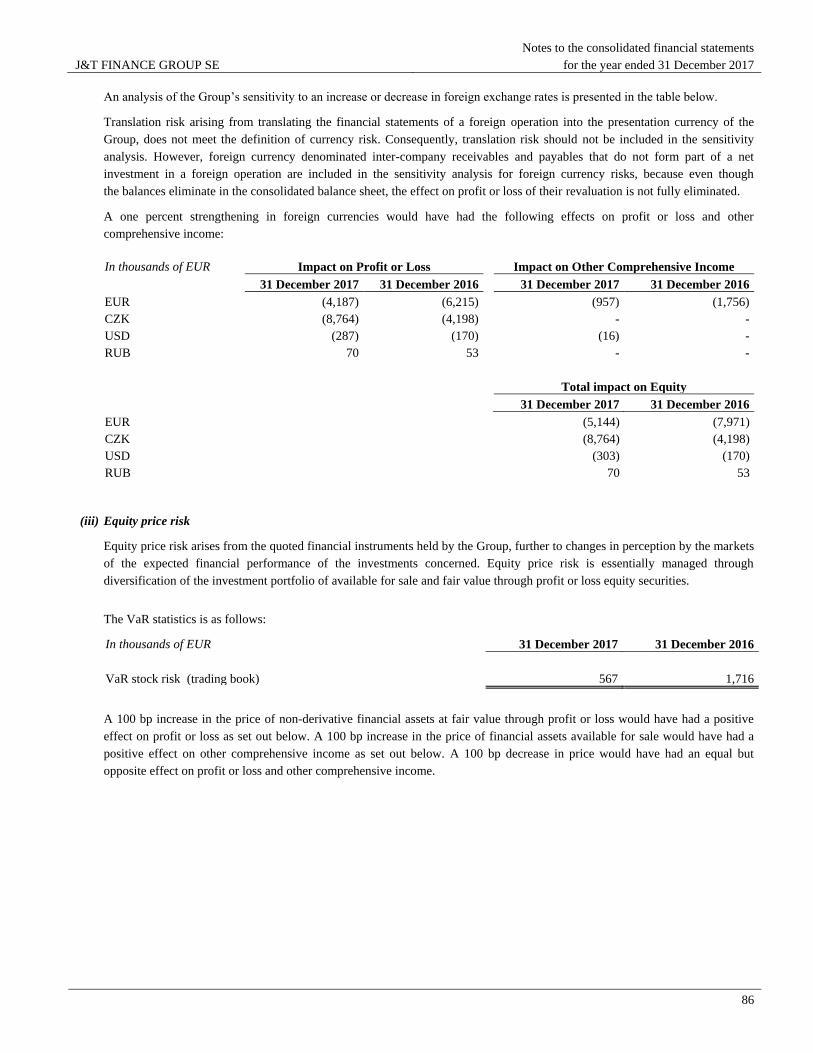
J&T FINANCE GROUP SE
Notes to the consolidated financial statements
for the year ended 31 December 2017
86
An analysis of the Group’s sensitivity to an increase or decrease in foreign exchange rates is presented in the table below.
Translation risk arising from translating the financial statements of a foreign operation into the presentation currency of the
Group, does not meet the definition of currency risk. Consequently, translation risk should not be included in the sensitivity
analysis. However, foreign currency denominated inter-company receivables and payables that do not form part of a net
investment in a foreign operation are included in the sensitivity analysis for foreign currency risks, because even though
the balances eliminate in the consolidated balance sheet, the effect on profit or loss of their revaluation is not fully eliminated.
A one percent strengthening in foreign currencies would have had the following effects on profit or loss and other
comprehensive income:
In thousands of EUR Impact on Profit or Loss
Impact on Other Comprehensive Income
31 December 2017 31 December 2016
31 December 2017 31 December 2016
EUR (4,187) (6,215) (957) (1,756)
CZK (8,764) (4,198)
- -
USD (287) (170) (16) -
RUB 70 53
- -
Total impact on Equity
31 December 2017 31 December 2016
EUR (5,144) (7,971)
CZK
(8,764) (4,198)
USD (303) (170)
RUB
70 53
(iii) Equity price risk
Equity price risk arises from the quoted financial instruments held by the Group, further to changes in perception by the markets
of the expected financial performance of the investments concerned. Equity price risk is essentially managed through
diversification of the investment portfolio of available for sale and fair value through profit or loss equity securities.
The VaR statistics is as follows:
In thousands of EUR 31 December 2017 31 December 2016
VaR stock risk (trading book) 567 1,716
A 100 bp increase in the price of non-derivative financial assets at fair value through profit or loss would have had a positive
effect on profit or loss as set out below. A 100 bp increase in the price of financial assets available for sale would have had a
positive effect on other comprehensive income as set out below. A 100 bp decrease in price would have had an equal but
opposite effect on profit or loss and other comprehensive income.
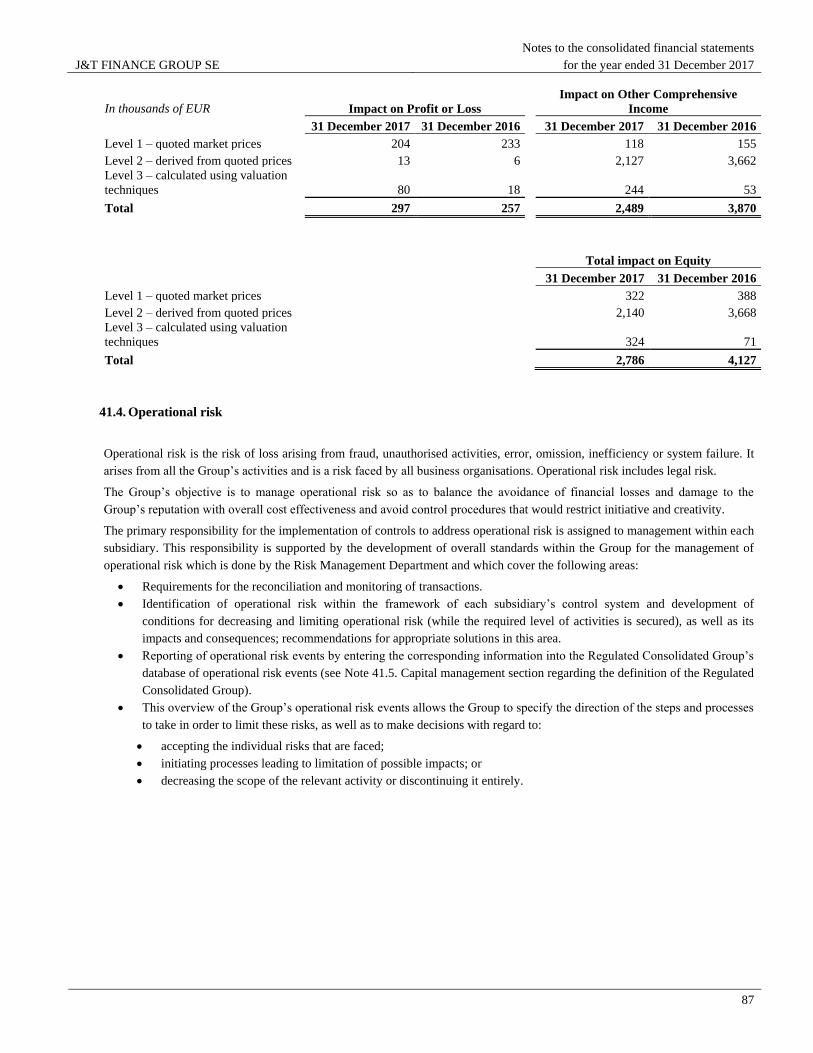
J&T FINANCE GROUP SE
Notes to the consolidated financial statements
for the year ended 31 December 2017
87
In thousands of EUR Impact on Profit or Loss
Impact on Other Comprehensive
Income
31 December 2017 31 December 2016
31 December 2017 31 December 2016
Level 1 – quoted market prices 204 233
118 155
Level 2 – derived from quoted prices 13 6
2,127 3,662
Level 3 – calculated using valuation
techniques 80 18
244 53
Total 297 257
2,489 3,870
Total impact on Equity
31 December 2017 31 December 2016
Level 1 – quoted market prices
322 388
Level 2 – derived from quoted prices
2,140 3,668
Level 3 – calculated using valuation
techniques
324 71
Total
2,786 4,127
41.4. Operational risk
Operational risk is the risk of loss arising from fraud, unauthorised activities, error, omission, inefficiency or system failure. It
arises from all the Group’s activities and is a risk faced by all business organisations. Operational risk includes legal risk.
The Group’s objective is to manage operational risk so as to balance the avoidance of financial losses and damage to the
Group’s reputation with overall cost effectiveness and avoid control procedures that would restrict initiative and creativity.
The primary responsibility for the implementation of controls to address operational risk is assigned to management within each
subsidiary. This responsibility is supported by the development of overall standards within the Group for the management of
operational risk which is done by the Risk Management Department and which cover the following areas:
Requirements for the reconciliation and monitoring of transactions.
Identification of operational risk within the framework of each subsidiary’s control system and development of
conditions for decreasing and limiting operational risk (while the required level of activities is secured), as well as its
impacts and consequences; recommendations for appropriate solutions in this area.
Reporting of operational risk events by entering the corresponding information into the Regulated Consolidated Group’s
database of operational risk events (see Note 41.5. Capital management section regarding the definition of the Regulated
Consolidated Group).
This overview of the Group’s operational risk events allows the Group to specify the direction of the steps and processes
to take in order to limit these risks, as well as to make decisions with regard to:
accepting the individual risks that are faced;
initiating processes leading to limitation of possible impacts; or
decreasing the scope of the relevant activity or discontinuing it entirely.
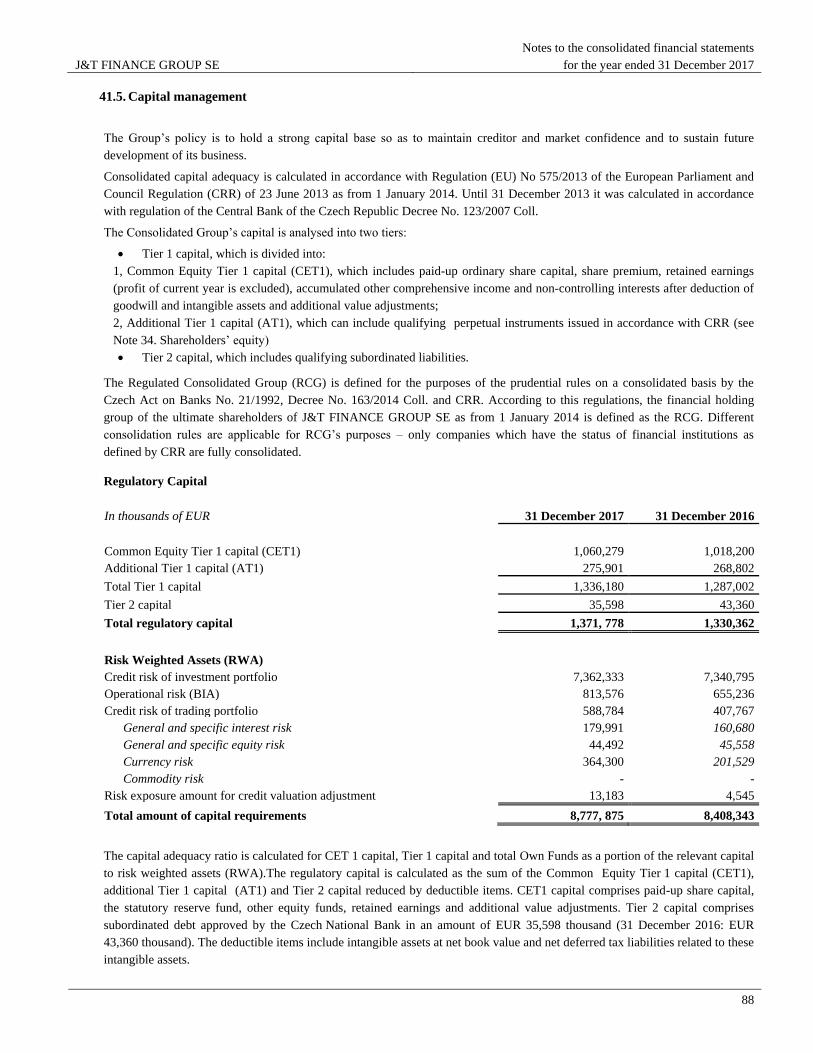
J&T FINANCE GROUP SE
Notes to the consolidated financial statements
for the year ended 31 December 2017
88
41.5. Capital management
The Group’s policy is to hold a strong capital base so as to maintain creditor and market confidence and to sustain future
development of its business.
Consolidated capital adequacy is calculated in accordance with Regulation (EU) No 575/2013 of the European Parliament and
Council Regulation (CRR) of 23 June 2013 as from 1 January 2014. Until 31 December 2013 it was calculated in accordance
with regulation of the Central Bank of the Czech Republic Decree No. 123/2007 Coll.
The Consolidated Group’s capital is analysed into two tiers:
Tier 1 capital, which is divided into:
1, Common Equity Tier 1 capital (CET1), which includes paid-up ordinary share capital, share premium, retained earnings
(profit of current year is excluded), accumulated other comprehensive income and non-controlling interests after deduction of
goodwill and intangible assets and additional value adjustments;
2, Additional Tier 1 capital (AT1), which can include qualifying perpetual instruments issued in accordance with CRR (see
Note 34. Shareholders’ equity)
Tier 2 capital, which includes qualifying subordinated liabilities.
The Regulated Consolidated Group (RCG) is defined for the purposes of the prudential rules on a consolidated basis by the
Czech Act on Banks No. 21/1992, Decree No. 163/2014 Coll. and CRR. According to this regulations, the financial holding
group of the ultimate shareholders of J&T FINANCE GROUP SE as from 1 January 2014 is defined as the RCG. Different
consolidation rules are applicable for RCG’s purposes – only companies which have the status of financial institutions as
defined by CRR are fully consolidated.
Regulatory Capital
In thousands of EUR 31 December 2017 31 December 2016
Common Equity Tier 1 capital (CET1) 1,060,279 1,018,200
Additional Tier 1 capital (AT1) 275,901 268,802
Total Tier 1 capital 1,336,180 1,287,002
Tier 2 capital 35,598 43,360
Total regulatory capital 1,371, 778 1,330,362
Risk Weighted Assets (RWA)
Credit risk of investment portfolio 7,362,333 7,340,795
Operational risk (BIA) 813,576 655,236
Credit risk of trading portfolio 588,784 407,767
General and specific interest risk 179,991 160,680
General and specific equity risk 44,492 45,558
Currency risk 364,300 201,529
Commodity risk - -
Risk exposure amount for credit valuation adjustment 13,183 4,545
Total amount of capital requirements 8,777, 875 8,408,343
The capital adequacy ratio is calculated for CET 1 capital, Tier 1 capital and total Own Funds as a portion of the relevant capital
to risk weighted assets (RWA).The regulatory capital is calculated as the sum of the Common Equity Tier 1 capital (CET1),
additional Tier 1 capital (AT1) and Tier 2 capital reduced by deductible items. CET1 capital comprises paid-up share capital,
the statutory reserve fund, other equity funds, retained earnings and additional value adjustments. Tier 2 capital comprises
subordinated debt approved by the Czech National Bank in an amount of EUR 35,598 thousand (31 December 2016: EUR
43,360 thousand). The deductible items include intangible assets at net book value and net deferred tax liabilities related to these
intangible assets.
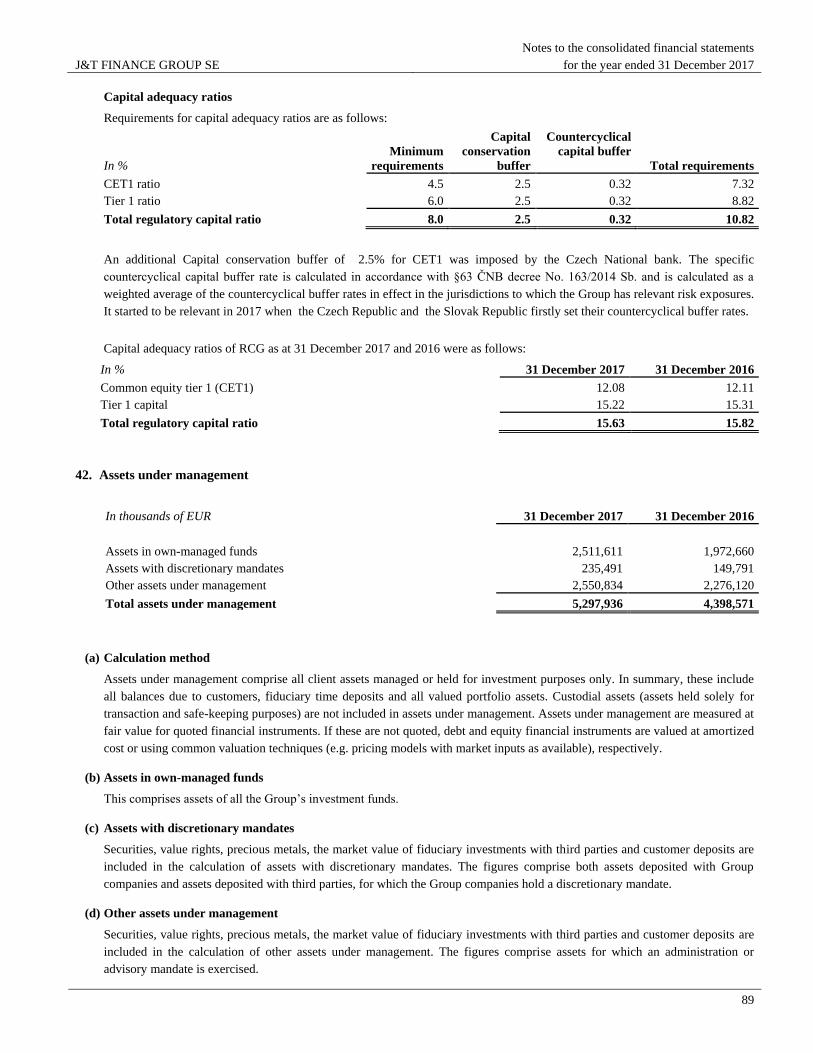
J&T FINANCE GROUP SE
Notes to the consolidated financial statements
for the year ended 31 December 2017
89
Capital adequacy ratios
Requirements for capital adequacy ratios are as follows:
In %
Minimum
requirements
Capital
conservation
buffer
Countercyclical
capital buffer
Total requirements
CET1 ratio 4.5 2.5 0.32 7.32
Tier 1 ratio 6.0 2.5 0.32 8.82
Total regulatory capital ratio 8.0 2.5 0.32 10.82
An additional Capital conservation buffer of 2.5% for CET1 was imposed by the Czech National bank. The specific
countercyclical capital buffer rate is calculated in accordance with §63 ČNB decree No. 163/2014 Sb. and is calculated as a
weighted average of the countercyclical buffer rates in effect in the jurisdictions to which the Group has relevant risk exposures.
It started to be relevant in 2017 when the Czech Republic and the Slovak Republic firstly set their countercyclical buffer rates.
Capital adequacy ratios of RCG as at 31 December 2017 and 2016 were as follows:
In % 31 December 2017 31 December 2016
Common equity tier 1 (CET1) 12.08 12.11
Tier 1 capital 15.22 15.31
Total regulatory capital ratio 15.63 15.82
42. Assets under management
In thousands of EUR 31 December 2017 31 December 2016
Assets in own-managed funds 2,511,611 1,972,660
Assets with discretionary mandates 235,491 149,791
Other assets under management 2,550,834 2,276,120
Total assets under management 5,297,936 4,398,571
(a) Calculation method
Assets under management comprise all client assets managed or held for investment purposes only. In summary, these include
all balances due to customers, fiduciary time deposits and all valued portfolio assets. Custodial assets (assets held solely for
transaction and safe-keeping purposes) are not included in assets under management. Assets under management are measured at
fair value for quoted financial instruments. If these are not quoted, debt and equity financial instruments are valued at amortized
cost or using common valuation techniques (e.g. pricing models with market inputs as available), respectively.
(b) Assets in own-managed funds
This comprises assets of all the Group’s investment funds.
(c) Assets with discretionary mandates
Securities, value rights, precious metals, the market value of fiduciary investments with third parties and customer deposits are
included in the calculation of assets with discretionary mandates. The figures comprise both assets deposited with Group
companies and assets deposited with third parties, for which the Group companies hold a discretionary mandate.
(d) Other assets under management
Securities, value rights, precious metals, the market value of fiduciary investments with third parties and customer deposits are
included in the calculation of other assets under management. The figures comprise assets for which an administration or
advisory mandate is exercised.
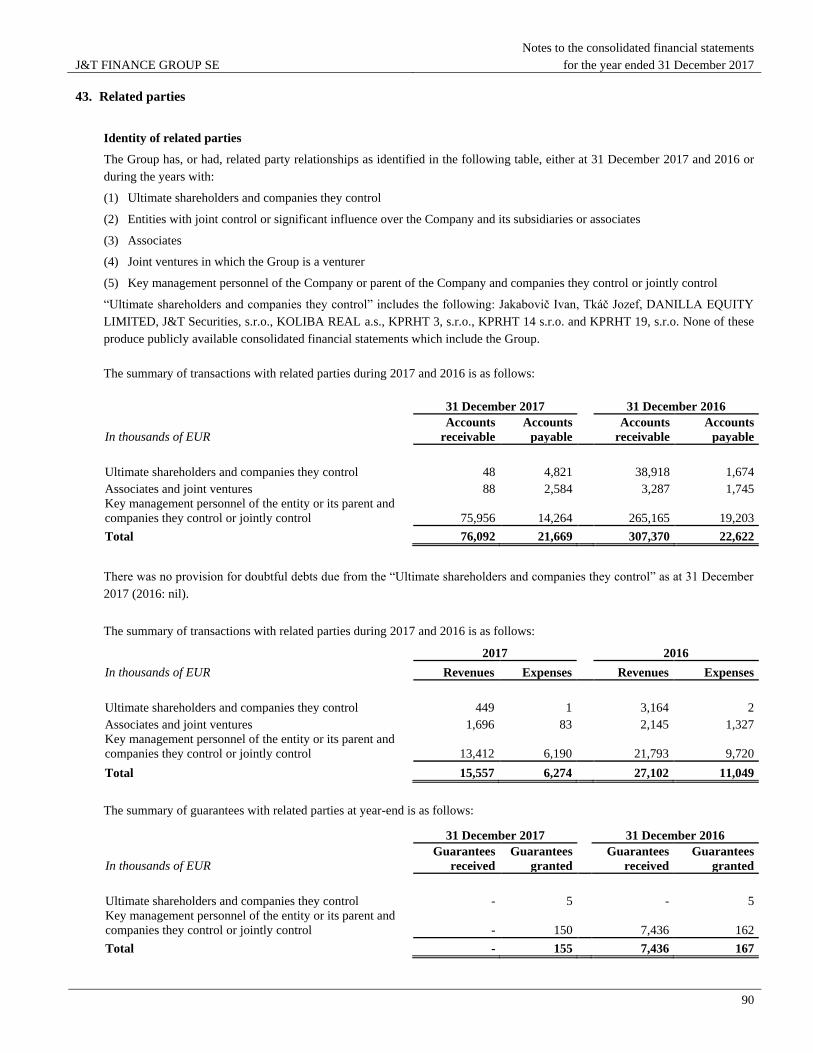
J&T FINANCE GROUP SE
Notes to the consolidated financial statements
for the year ended 31 December 2017
90
43. Related parties
Identity of related parties
The Group has, or had, related party relationships as identified in the following table, either at 31 December 2017 and 2016 or
during the years with:
(1) Ultimate shareholders and companies they control
(2) Entities with joint control or significant influence over the Company and its subsidiaries or associates
(3) Associates
(4) Joint ventures in which the Group is a venturer
(5) Key management personnel of the Company or parent of the Company and companies they control or jointly control
“Ultimate shareholders and companies they control” includes the following: Jakabovič Ivan, Tkáč Jozef, DANILLA EQUITY
LIMITED, J&T Securities, s.r.o., KOLIBA REAL a.s., KPRHT 3, s.r.o., KPRHT 14 s.r.o. and KPRHT 19, s.r.o. None of these
produce publicly available consolidated financial statements which include the Group.
The summary of transactions with related parties during 2017 and 2016 is as follows:
31 December 2017
31 December 2016
In thousands of EUR
Accounts
receivable
Accounts
payable
Accounts
receivable
Accounts
payable
Ultimate shareholders and companies they control
48 4,821
38,918 1,674
Associates and joint ventures
88 2,584
3,287 1,745
Key management personnel of the entity or its parent and
companies they control or jointly control
75,956 14,264 265,165 19,203
Total
76,092 21,669 307,370 22,622
There was no provision for doubtful debts due from the “Ultimate shareholders and companies they control” as at 31 December
2017 (2016: nil).
The summary of transactions with related parties during 2017 and 2016 is as follows:
2017
2016
In thousands of EUR
Revenues Expenses Revenues Expenses
Ultimate shareholders and companies they control
449 1
3,164 2
Associates and joint ventures
1,696 83
2,145 1,327
Key management personnel of the entity or its parent and
companies they control or jointly control
13,412 6,190 21,793 9,720
Total
15,557 6,274 27,102 11,049
The summary of guarantees with related parties at year-end is as follows:
31 December 2017
31 December 2016
In thousands of EUR
Guarantees
received
Guarantees
granted
Guarantees
received
Guarantees
granted
Ultimate shareholders and companies they control
- 5
- 5
Key management personnel of the entity or its parent and
companies they control or jointly control
- 150 7,436 162
Total
- 155 7,436 167
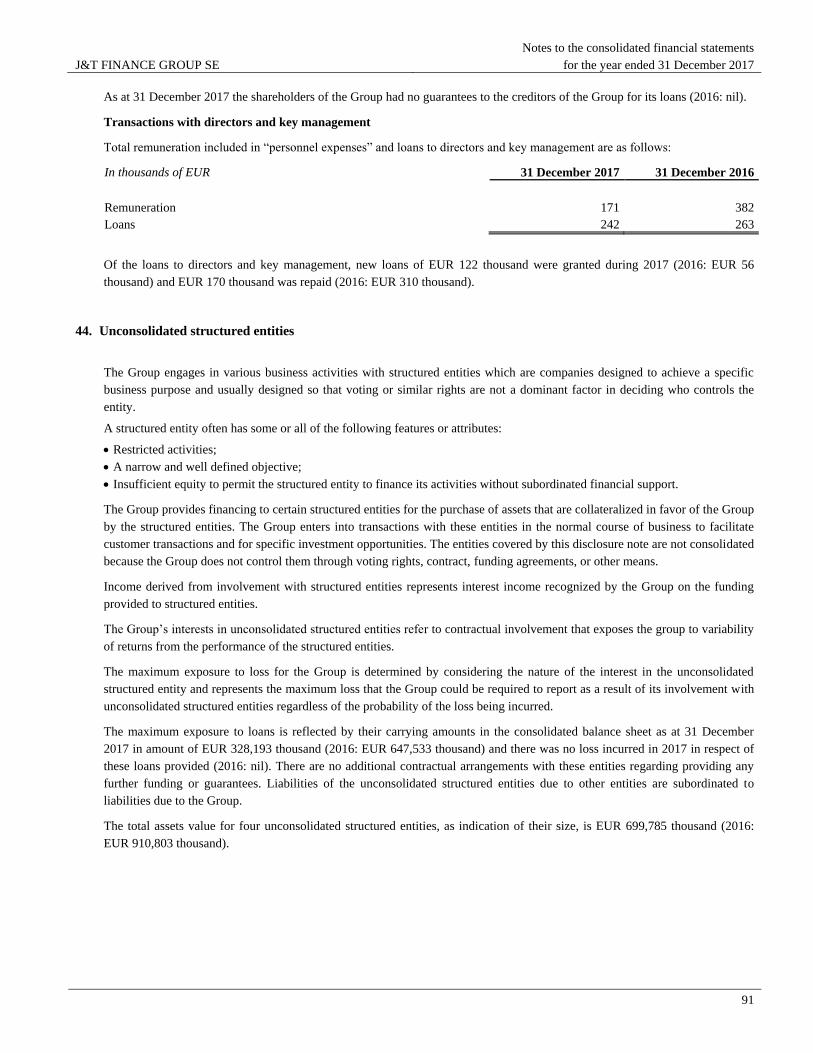
J&T FINANCE GROUP SE
Notes to the consolidated financial statements
for the year ended 31 December 2017
91
As at 31 December 2017 the shareholders of the Group had no guarantees to the creditors of the Group for its loans (2016: nil).
Transactions with directors and key management
Total remuneration included in “personnel expenses” and loans to directors and key management are as follows:
In thousands of EUR 31 December 2017 31 December 2016
Remuneration 171 382
Loans 242 263
Of the loans to directors and key management, new loans of EUR 122 thousand were granted during 2017 (2016: EUR 56
thousand) and EUR 170 thousand was repaid (2016: EUR 310 thousand).
44. Unconsolidated structured entities
The Group engages in various business activities with structured entities which are companies designed to achieve a specific
business purpose and usually designed so that voting or similar rights are not a dominant factor in deciding who controls the
entity.
A structured entity often has some or all of the following features or attributes:
Restricted activities;
A narrow and well defined objective;
Insufficient equity to permit the structured entity to finance its activities without subordinated financial support.
The Group provides financing to certain structured entities for the purchase of assets that are collateralized in favor of the Group
by the structured entities. The Group enters into transactions with these entities in the normal course of business to facilitate
customer transactions and for specific investment opportunities. The entities covered by this disclosure note are not consolidated
because the Group does not control them through voting rights, contract, funding agreements, or other means.
Income derived from involvement with structured entities represents interest income recognized by the Group on the funding
provided to structured entities.
The Group’s interests in unconsolidated structured entities refer to contractual involvement that exposes the group to variability
of returns from the performance of the structured entities.
The maximum exposure to loss for the Group is determined by considering the nature of the interest in the unconsolidated
structured entity and represents the maximum loss that the Group could be required to report as a result of its involvement with
unconsolidated structured entities regardless of the probability of the loss being incurred.
The maximum exposure to loans is reflected by their carrying amounts in the consolidated balance sheet as at 31 December
2017 in amount of EUR 328,193 thousand (2016: EUR 647,533 thousand) and there was no loss incurred in 2017 in respect of
these loans provided (2016: nil). There are no additional contractual arrangements with these entities regarding providing any
further funding or guarantees. Liabilities of the unconsolidated structured entities due to other entities are subordinated to
liabilities due to the Group.
The total assets value for four unconsolidated structured entities, as indication of their size, is EUR 699,785 thousand (2016:
EUR 910,803 thousand).

J&T FINANCE GROUP SE
Notes to the consolidated financial statements
for the year ended 31 December 2017
92
45. Subsequent events
On 27 March 2017, J&T FINANCE GROUP SE received a notice from the Antimonopoly Office of the Slovak Republic about
the commencement of administrative proceedings regarding a possible breach of antimonopoly law by an unannounced
transaction - the acquisition of a 40% stake in Panta Rhei, s.r.o. by Diversified Retail Company, a.s. According to the
preliminary considerations of the Antimonopoly Office, J&T FINANCE GROUP SE allegedly gained joint control over Panta
Rhei, s.r.o. by exercising rights on behalf of Diversified Retail Company, a.s. without notifying the transaction to the
Antimonopoly Office and exercised the rights and duties arising from such control without prior approval of the Antimonopoly
Office. J&T FINANCE GROUP SE denies that it acquired control over Panta Rhei, s.r.o. and disputes all the alleged breaches.
The proceedings had not been concluded at the time of issuance of the financial statements. The possible penalty can range from
EUR 700 thousand to EUR 7,000 thousand.
On February 27, 2018, the subsidiary AKB "Khovanskiy" a.o. merged with J&T Bank, a.o. and since that day ceased to exist as
a legal entity.
In March 2016 the shareholders of the Group entered into several agreements with CEFC, with the original aim of CEFC to
acquire a 50% share in the Group. The transaction was subject to regulatory approval both in China and countries where the
Group operates. In March 2018, the application for regulatory approval was withdrawn by CEFC and the purchase of additional
share in the Group was abandoned. In May 2018 Rainbow Wisdom Investment Limited, a member of the CITIC Group, took
over the shareholding of CEFC in JTFG. JTFG and CITIC Group will engage in negotiations about further and deeper
cooperation between both groups.
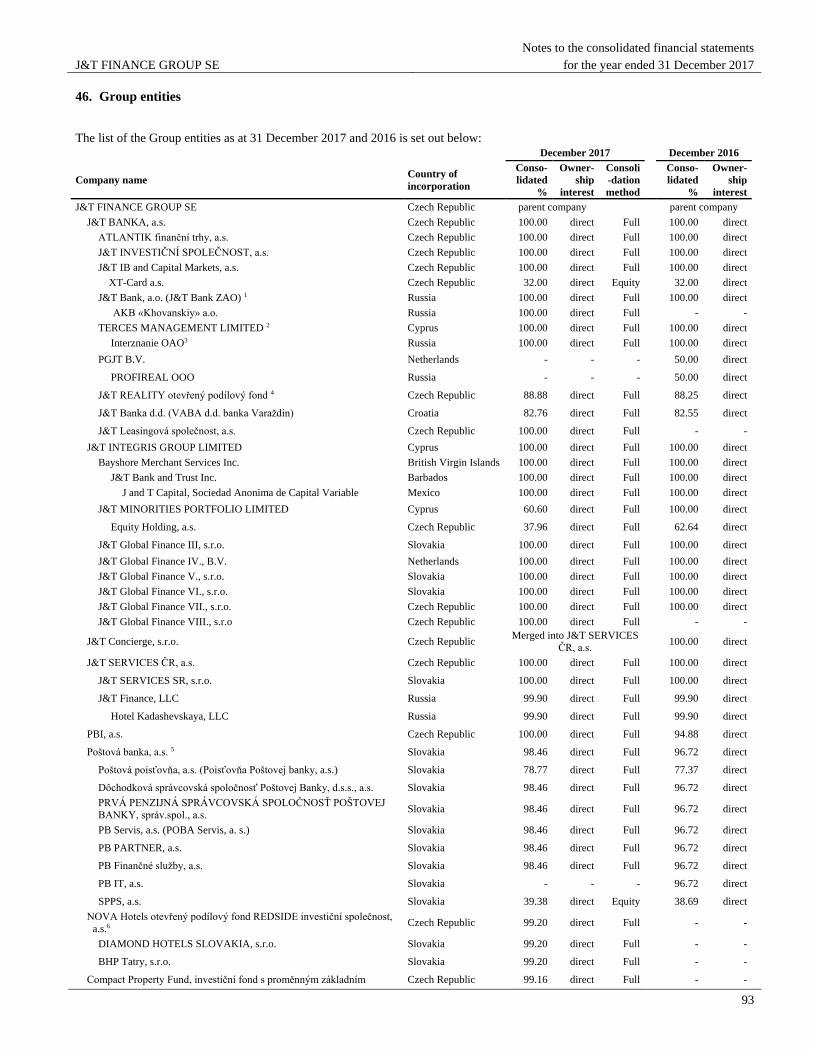
J&T FINANCE GROUP SE
Notes to the consolidated financial statements
for the year ended 31 December 2017
93
46. Group entities
The list of the Group entities as at 31 December 2017 and 2016 is set out below: December 2017 December 2016
Company name Country of
incorporation
Conso-
lidated
%
Owner-
ship
interest
Consoli
-dation
method
Conso-
lidated
%
Owner-
ship
interest
J&T FINANCE GROUP SE Czech Republic parent company parent company
J&T BANKA, a.s. Czech Republic 100.00 direct Full 100.00 direct
ATLANTIK finanční trhy, a.s. Czech Republic 100.00 direct Full 100.00 direct
J&T INVESTIČNÍ SPOLEČNOST, a.s. Czech Republic 100.00 direct Full 100.00 direct
J&T IB and Capital Markets, a.s. Czech Republic 100.00 direct Full 100.00 direct
XT-Card a.s. Czech Republic 32.00 direct Equity 32.00 direct
J&T Bank, a.o. (J&T Bank ZAO) 1 Russia 100.00 direct Full 100.00 direct
AKB «Khovanskiy» a.o. Russia 100.00 direct Full - -
TERCES MANAGEMENT LIMITED 2 Cyprus 100.00 direct Full 100.00 direct
Interznanie OAO3 Russia 100.00 direct Full 100.00 direct
PGJT B.V. Netherlands - - - 50.00 direct
PROFIREAL OOO Russia - - - 50.00 direct
J&T REALITY otevřený podílový fond 4 Czech Republic 88.88 direct Full 88.25 direct
J&T Banka d.d. (VABA d.d. banka Varaždin) Croatia 82.76 direct Full 82.55 direct
J&T Leasingová společnost, a.s. Czech Republic 100.00 direct Full - -
J&T INTEGRIS GROUP LIMITED Cyprus 100.00 direct Full 100.00 direct
Bayshore Merchant Services Inc. British Virgin Islands 100.00 direct Full 100.00 direct
J&T Bank and Trust Inc. Barbados 100.00 direct Full 100.00 direct
J and T Capital, Sociedad Anonima de Capital Variable Mexico 100.00 direct Full 100.00 direct
J&T MINORITIES PORTFOLIO LIMITED Cyprus 60.60 direct Full 100.00 direct
Equity Holding, a.s. Czech Republic 37.96 direct Full 62.64 direct
J&T Global Finance III, s.r.o. Slovakia 100.00 direct Full 100.00 direct
J&T Global Finance IV., B.V. Netherlands 100.00 direct Full 100.00 direct
J&T Global Finance V., s.r.o. Slovakia 100.00 direct Full 100.00 direct
J&T Global Finance VI., s.r.o. Slovakia 100.00 direct Full 100.00 direct
J&T Global Finance VII., s.r.o. Czech Republic 100.00 direct Full 100.00 direct
J&T Global Finance VIII., s.r.o Czech Republic 100.00 direct Full - -
J&T Concierge, s.r.o. Czech Republic Merged into J&T SERVICES
ČR, a.s. 100.00 direct
J&T SERVICES ČR, a.s. Czech Republic 100.00 direct Full 100.00 direct
J&T SERVICES SR, s.r.o. Slovakia 100.00 direct Full 100.00 direct
J&T Finance, LLC Russia 99.90 direct Full 99.90 direct
Hotel Kadashevskaya, LLC Russia 99.90 direct Full 99.90 direct
PBI, a.s. Czech Republic 100.00 direct Full 94.88 direct
Poštová banka, a.s. 5 Slovakia 98.46 direct Full 96.72 direct
Poštová poisťovňa, a.s. (Poisťovňa Poštovej banky, a.s.) Slovakia 78.77 direct Full 77.37 direct
Dôchodková správcovská spoločnosť Poštovej Banky, d.s.s., a.s. Slovakia 98.46 direct Full 96.72 direct
PRVÁ PENZIJNÁ SPRÁVCOVSKÁ SPOLOČNOSŤ POŠTOVEJ
BANKY, správ.spol., a.s. Slovakia 98.46 direct Full 96.72 direct
PB Servis, a.s. (POBA Servis, a. s.) Slovakia 98.46 direct Full 96.72 direct
PB PARTNER, a.s. Slovakia 98.46 direct Full 96.72 direct
PB Finančné služby, a.s. Slovakia 98.46 direct Full 96.72 direct
PB IT, a.s. Slovakia - - - 96.72 direct
SPPS, a.s. Slovakia 39.38 direct Equity 38.69 direct
NOVA Hotels otevřený podílový fond REDSIDE investiční společnost,
a.s.6 Czech Republic 99.20 direct Full - -
DIAMOND HOTELS SLOVAKIA, s.r.o. Slovakia 99.20 direct Full - -
BHP Tatry, s.r.o. Slovakia 99.20 direct Full - -
Compact Property Fund, investiční fond s proměnným základním Czech Republic 99.16 direct Full - -

J&T FINANCE GROUP SE
Notes to the consolidated financial statements
for the year ended 31 December 2017
94
kapitálem, a.s.7
FORESPO SOLISKO a.s. Slovakia 99.16 direct Full - -
FORESPO HELIOS 1 a.s. Slovakia 99.16 direct Full - -
FORESPO HELIOS 2 a.s. Slovakia 99.16 direct Full - -
FORESPO HOREC a SASANKA a.s. Slovakia 99.16 direct Full - -
FORESPO PÁLENICA a.s. Slovakia 99.16 direct Full - -
INVEST-GROUND a.s. Slovakia 99.16 direct Full - -
FORESPO-RENTAL 1 a.s. Slovakia 99.16 direct Full - -
FORESPO-RENTAL 2 a.s. Slovakia 99.16 direct Full - -
FORESPO BDS a.s. Czech Republic 99.16 direct Full - -
DEVEL PASSAGE s.r.o. Slovakia 99.16 direct Full - -
FORESPO DUNAJ 6 a.s. Slovakia 99.16 direct Full - -
J&T Wine Holding SE Czech Republic 100.00 direct Full - -
OUTSIDER LIMITED Cyprus 100.00 direct Full - -
Chateau Teyssier (Société civile) France 80.00 direct Full - -
CT Domaines France 80.00 direct Full - -
SAXONWOLD LIMITED Ireland 80.00 direct Full - -
World’s End U.S.A. 80.00 direct Full - -
KOLBY a.s. Czech Republic 100.00 direct Full - -
J&T Mezzanine, a.s. Czech Republic 100.00 direct Full - -
The structure above is listed by ownership of companies at the different levels within the Group.
1The Group owns a 99.945% share in J&T Bank, a.o. through the subsidiary J&T BANKA, a.s. and another 0.055% share through
J&T FINANCE GROUP SE. 2The Group owns a 99% share in TERCES MANAGEMENT LIMITED through the subsidiary J&T BANKA, a.s. and another 1%
share through the subsidiary J&T Finance, LLC. 3The Group owns a 50% share in Interznanie OAO through the subsidiary TERCES MANAGEMENT LIMITED and another 50%
share through the subsidiary J&T Bank, a.o. 4The Group owns a 53.08% share in J&T REALITY otevřený podílový fond through the subsidiary J&T BANKA, a.s. and another
35.80% share through the subsidiary Poštová banka, a.s. (2016: 53.08% and 35.17%). 5The Group owns a 64.46% share in Poštová banka., a.s. through J&T FINANCE GROUP SE and another 34% share through the
subsidiary PBI, a.s. (2016: 64.46% through J&T FINANCE GROUP SE and 32.26% through the subsidiary PBI, a.s.). 6The Group owns a 48.35% share in NOVA Hotels otevřený podílový fond REDSIDE investiční společnost, a.s. through J&T
BANKA, a.s. and effectively another 50.85% share through the subsidiary Poštová banka, a.s. 7The Group owns a 45.71% share in Compact Property Fund, investiční fond s proměnným základním kapitálem, a.s. through J&T
BANKA, a.s. and effectively another 53.45% share through the subsidiary Poštová banka, a.s.

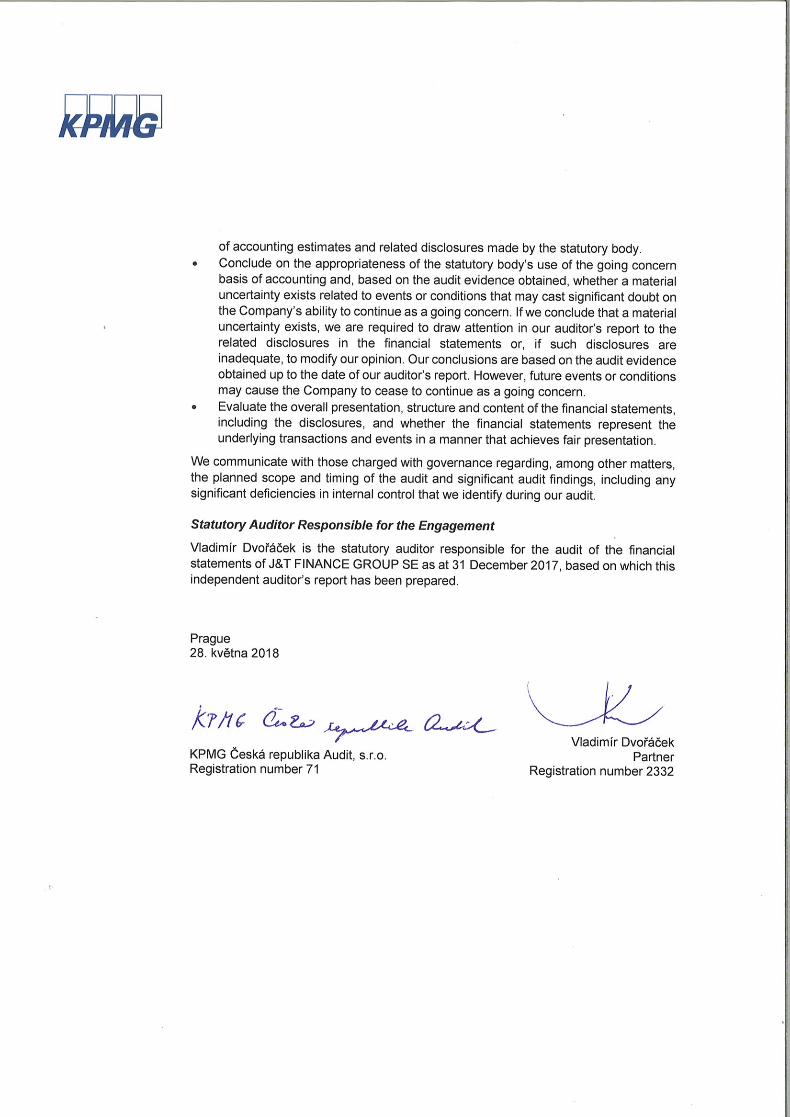
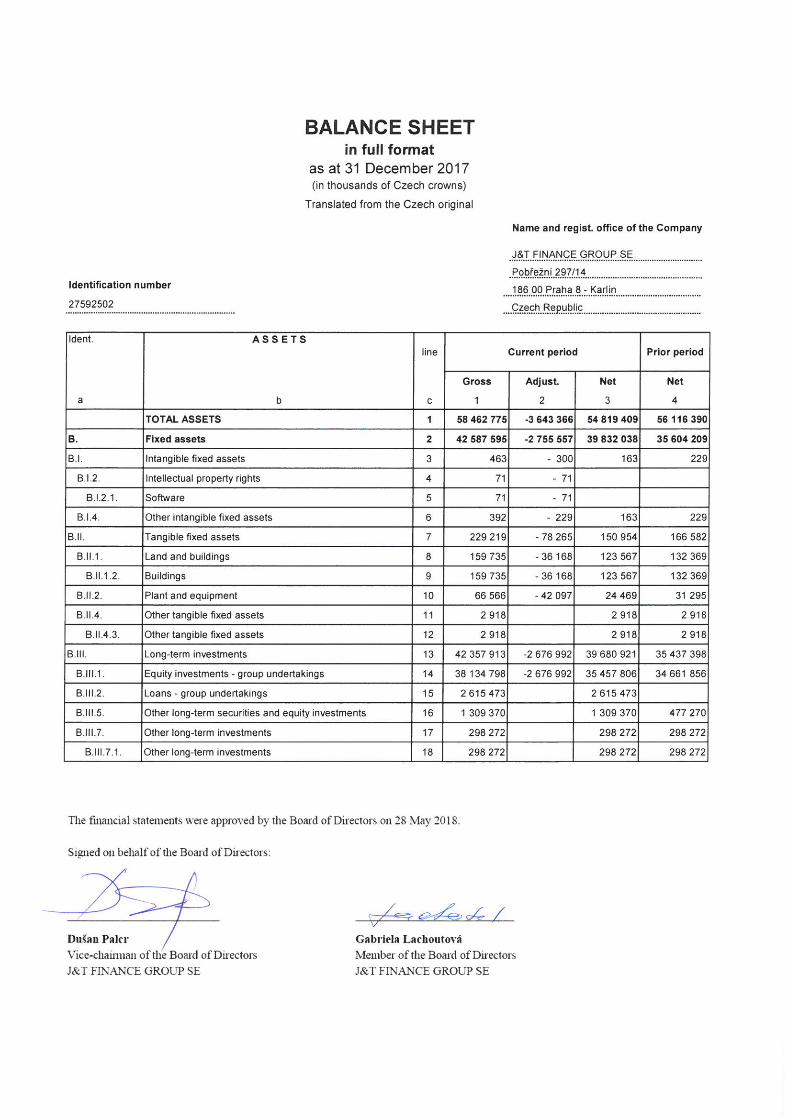
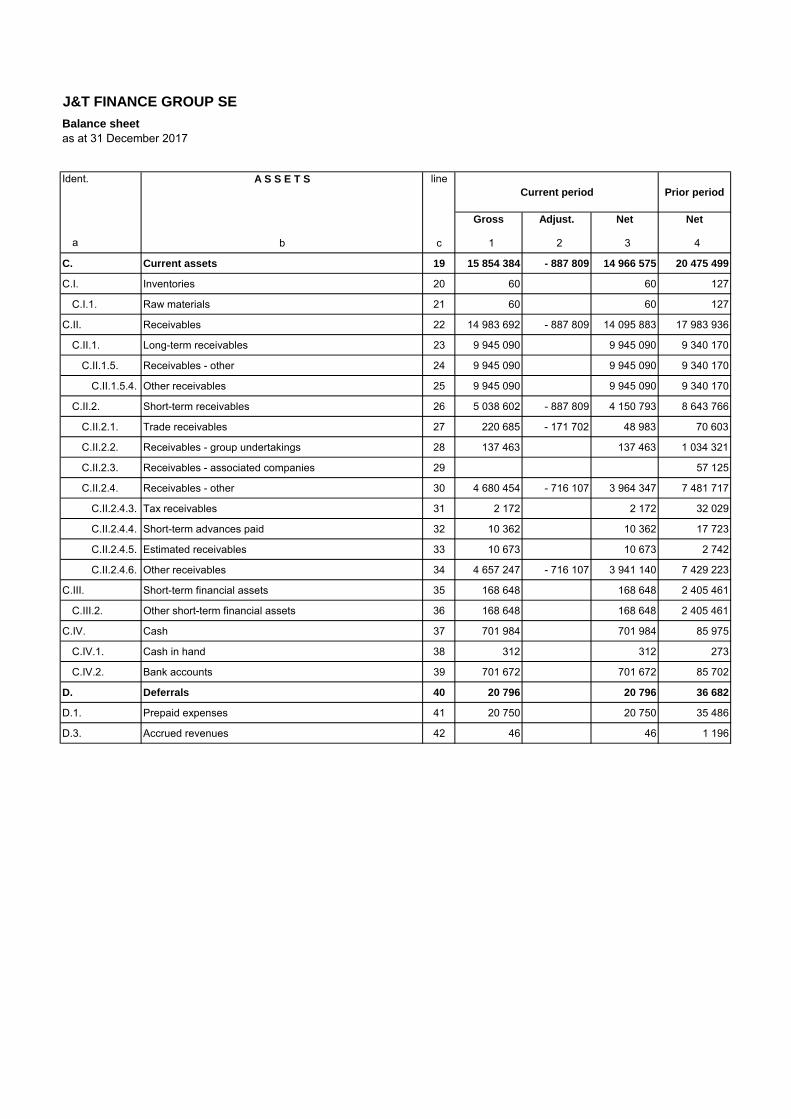
J&T FINANCE GROUP SE
Balance sheet
as at 31 December 2017
Ident. A S S E T S line
Current period Prior period
Gross Adjust. Net Net
b c 1 2 3 4
C. Current assets 19 15 854 384 - 887 809 14 966 575 20 475 499
C.I. Inventories 20 60 60 127
C.I.1. Raw materials 21 60 60 127
C.II. Receivables 22 14 983 692 - 887 809 14 095 883 17 983 936
C.II.1. Long-term receivables 23 9 945 090 9 945 090 9 340 170
C.II.1.5. Receivables - other 24 9 945 090 9 945 090 9 340 170
C.II.1.5.4. Other receivables 25 9 945 090 9 945 090 9 340 170
C.II.2. Short-term receivables 26 5 038 602 - 887 809 4 150 793 8 643 766
C.II.2.1. Trade receivables 27 220 685 - 171 702 48 983 70 603
C.II.2.2. Receivables - group undertakings 28 137 463 137 463 1 034 321
C.II.2.3. Receivables - associated companies 29 57 125
C.II.2.4. Receivables - other 30 4 680 454 - 716 107 3 964 347 7 481 717
C.II.2.4.3. Tax receivables 31 2 172 2 172 32 029
C.II.2.4.4. Short-term advances paid 32 10 362 10 362 17 723
C.II.2.4.5. Estimated receivables 33 10 673 10 673 2 742
C.II.2.4.6. Other receivables 34 4 657 247 - 716 107 3 941 140 7 429 223
C.III. Short-term financial assets 35 168 648 168 648 2 405 461
C.III.2. Other short-term financial assets 36 168 648 168 648 2 405 461
C.IV. Cash 37 701 984 701 984 85 975
C.IV.1. Cash in hand 38 312 312 273
C.IV.2. Bank accounts 39 701 672 701 672 85 702
D. Deferrals 40 20 796 20 796 36 682
D.1. Prepaid expenses 41 20 750 20 750 35 486
D.3. Accrued revenues 42 46 46 1 196
a
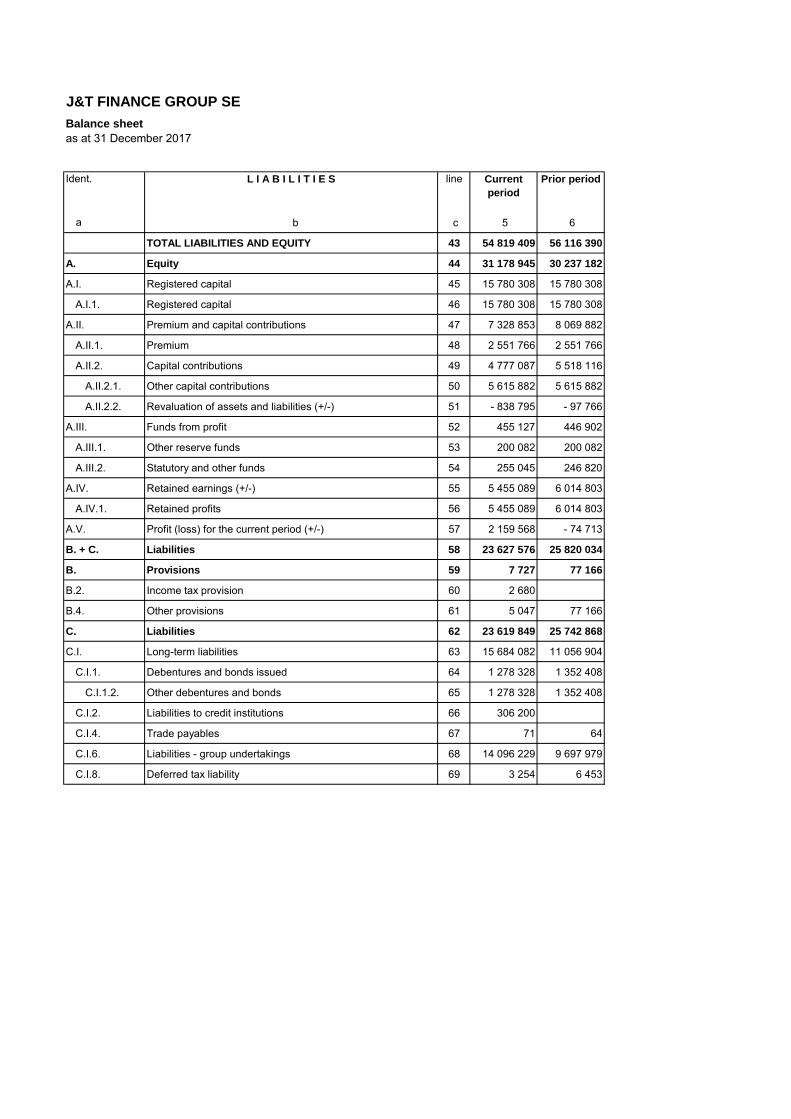
J&T FINANCE GROUP SE
Balance sheet
as at 31 December 2017
Ident. L I A B I L I T I E S line Current
period
Prior period
b c 5 6
TOTAL LIABILITIES AND EQUITY 43 54 819 409 56 116 390
A. Equity 44 31 178 945 30 237 182
A.I. Registered capital 45 15 780 308 15 780 308
A.I.1. Registered capital 46 15 780 308 15 780 308
A.II. Premium and capital contributions 47 7 328 853 8 069 882
A.II.1. Premium 48 2 551 766 2 551 766
A.II.2. Capital contributions 49 4 777 087 5 518 116
A.II.2.1. Other capital contributions 50 5 615 882 5 615 882
A.II.2.2. Revaluation of assets and liabilities (+/-) 51 - 838 795 - 97 766
A.III. Funds from profit 52 455 127 446 902
A.III.1. Other reserve funds 53 200 082 200 082
A.III.2. Statutory and other funds 54 255 045 246 820
A.IV. Retained earnings (+/-) 55 5 455 089 6 014 803
A.IV.1. Retained profits 56 5 455 089 6 014 803
A.V. Profit (loss) for the current period (+/-) 57 2 159 568 - 74 713
B. + C. Liabilities 58 23 627 576 25 820 034
B. Provisions 59 7 727 77 166
B.2. Income tax provision 60 2 680
B.4. Other provisions 61 5 047 77 166
C. Liabilities 62 23 619 849 25 742 868
C.I. Long-term liabilities 63 15 684 082 11 056 904
C.I.1. Debentures and bonds issued 64 1 278 328 1 352 408
C.I.1.2. Other debentures and bonds 65 1 278 328 1 352 408
C.I.2. Liabilities to credit institutions 66 306 200
C.I.4. Trade payables 67 71 64
C.I.6. Liabilities - group undertakings 68 14 096 229 9 697 979
C.I.8. Deferred tax liability 69 3 254 6 453
a
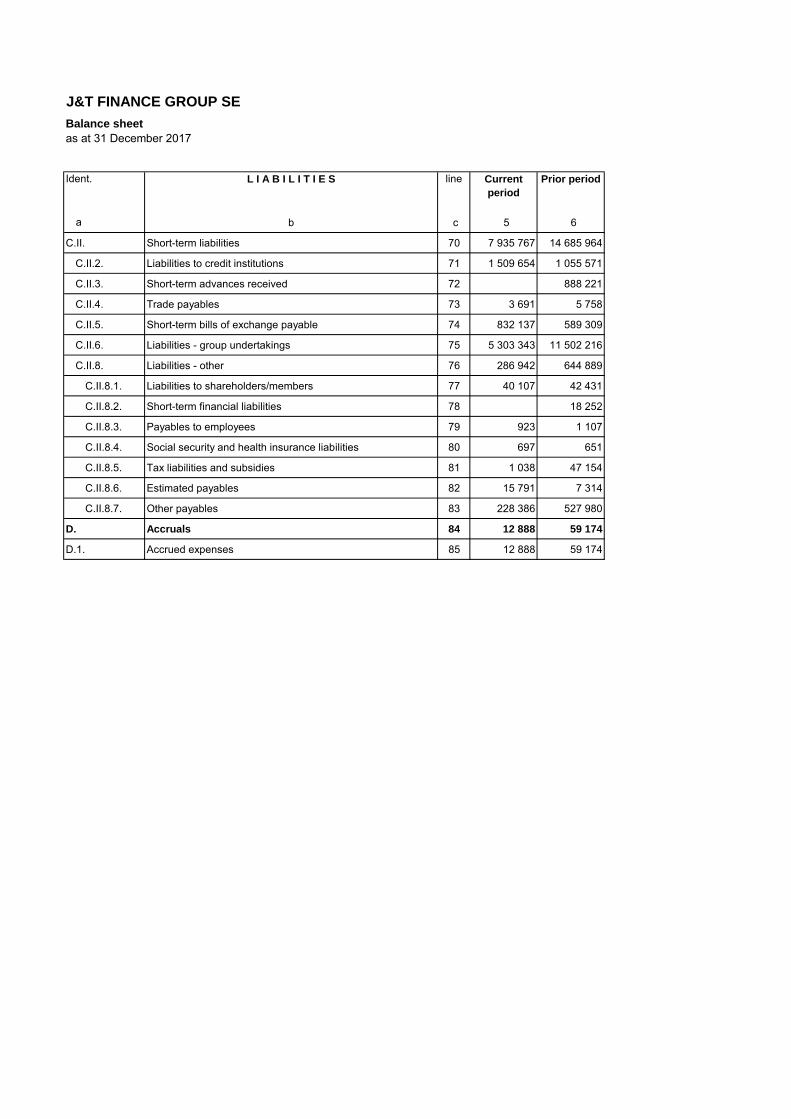
J&T FINANCE GROUP SE
Balance sheet
as at 31 December 2017
Ident. L I A B I L I T I E S line Current
period
Prior period
b c 5 6
C.II. Short-term liabilities 70 7 935 767 14 685 964
C.II.2. Liabilities to credit institutions 71 1 509 654 1 055 571
C.II.3. Short-term advances received 72 888 221
C.II.4. Trade payables 73 3 691 5 758
C.II.5. Short-term bills of exchange payable 74 832 137 589 309
C.II.6. Liabilities - group undertakings 75 5 303 343 11 502 216
C.II.8. Liabilities - other 76 286 942 644 889
C.II.8.1. Liabilities to shareholders/members 77 40 107 42 431
C.II.8.2. Short-term financial liabilities 78 18 252
C.II.8.3. Payables to employees 79 923 1 107
C.II.8.4. Social security and health insurance liabilities 80 697 651
C.II.8.5. Tax liabilities and subsidies 81 1 038 47 154
C.II.8.6. Estimated payables 82 15 791 7 314
C.II.8.7. Other payables 83 228 386 527 980
D. Accruals 84 12 888 59 174
D.1. Accrued expenses 85 12 888 59 174
a
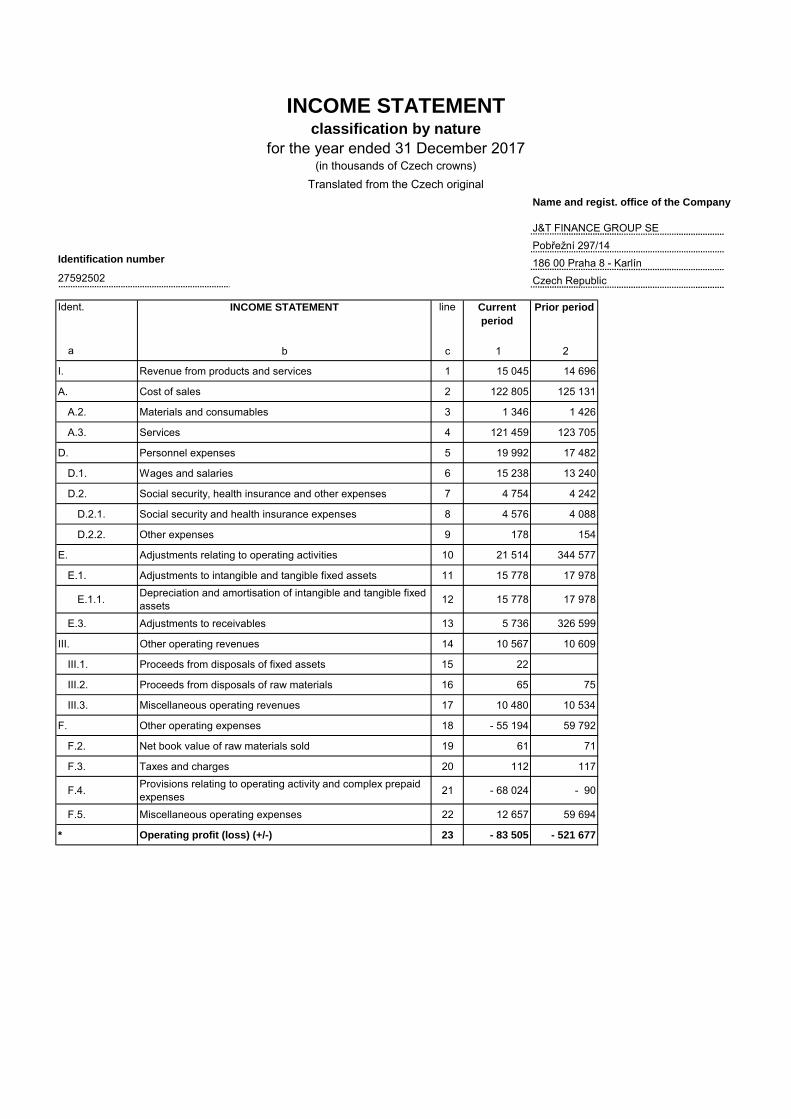
Name and regist. office of the Company
Identification number
Ident. INCOME STATEMENT line
b c 1 2
I. Revenue from products and services 1 15 045 14 696
A. Cost of sales 2 122 805 125 131
A.2. Materials and consumables 3 1 346 1 426
A.3. Services 4 121 459 123 705
D. Personnel expenses 5 19 992 17 482
D.1. Wages and salaries 6 15 238 13 240
D.2. Social security, health insurance and other expenses 7 4 754 4 242
D.2.1. Social security and health insurance expenses 8 4 576 4 088
D.2.2. Other expenses 9 178 154
E. Adjustments relating to operating activities 10 21 514 344 577
E.1. Adjustments to intangible and tangible fixed assets 11 15 778 17 978
E.1.1.Depreciation and amortisation of intangible and tangible fixed assets
12 15 778 17 978
E.3. Adjustments to receivables 13 5 736 326 599
III. Other operating revenues 14 10 567 10 609
III.1. Proceeds from disposals of fixed assets 15 22
III.2. Proceeds from disposals of raw materials 16 65 75
III.3. Miscellaneous operating revenues 17 10 480 10 534
F. Other operating expenses 18 - 55 194 59 792
F.2. Net book value of raw materials sold 19 61 71
F.3. Taxes and charges 20 112 117
F.4.Provisions relating to operating activity and complex prepaid expenses
21 - 68 024 - 90
F.5. Miscellaneous operating expenses 22 12 657 59 694
* Operating profit (loss) (+/-) 23 - 83 505 - 521 677
a
INCOME STATEMENTclassification by nature
for the year ended 31 December 2017(in thousands of Czech crowns)
J&T FINANCE GROUP SE
Pobřežní 297/14
186 00 Praha 8 - Karlín
27592502 Czech Republic
Current
period
Prior period
Translated from the Czech original

J&T FINANCE GROUP SEIncome statement - classification by nature
for the year ended 31 December 2017
Ident. INCOME STATEMENT line
b c 1 2
IV. Revenue from long-term investments - equity investments 24 2 643 804 1 022 812
IV.1. Revenue from equity investments - group undertakings 25 1 746 897 1 022 812
IV.2. Other revenue from equity investments 26 896 907
G. Cost of equity investments sold 27 896 735 54 754
V. Revenue from other long-term investments 28 6 473 291 937 967
V.1.Revenue from other long-term investments - group undertakings
29 2 419 071 30 465
V.2. Other revenue from other long-term investments 30 4 054 220 907 502
H. Expenses related to other long-term investments 31 6 471 822 899 777
VI. Interest revenue and similar revenue 32 833 698 754 207
VI.1. Interest revenue and similar revenue - group undertakings 33 77 236 138 033
VI.2. Other interest revenue and similar revenue 34 756 462 616 174
I. Adjustments and provisions relating to financial activity 35 - 234 930 8 912
J. Interest expense and similar expense 36 1 070 552 1 110 268
J.1. Interest expense and similar expense - group undertakings 37 897 705 879 809
J.2. Other interest expense and similar expense 38 172 847 230 459
VII. Other financial revenues 39 1 658 967 537 737
K. Other financial expenses 40 1 151 088 736 140
* Profit (loss) from financial operations 41 2 254 493 442 872
** Profit (loss) before tax (+/-) 42 2 170 988 - 78 805
L. Income tax 43 11 420 - 4 092
L.1. Current tax 44 14 619 136
L.2. Deferred tax (+/-) 45 - 3 199 - 4 228
** Profit (loss) after tax (+/-) 46 2 159 568 - 74 713
*** Profit (loss) for the accounting period (+/-) 47 2 159 568 - 74 713
*Net turnover for the accounting period = I. + II. + III. + IV. +
V. + VI. + VII.48 11 635 372 3 278 028
a
Current
period
Prior period

Name and regist. office of the Company
Identification number
Current
period
Prior period
P. Cash and cash equivalents, beginning of period 85 975 863 696
Net operating cash flow
Z. Operating profit (loss) before tax - 83 505 - 521 677
A.1. Non-cash transactions - 7 776 945 782
A.1.1. Depreciation and amortisation of fixed assets 15 778 17 978
A.1.2. Change in: - 66 383 335 421
A.1.2.2. provisions and adjustments relating to operating activity - 66 383 335 421
A.1.3. Profit(-) Loss(+) on sale of fixed assets - 22
A.1.4. Other non-cash transactions 42 851 592 383
A.* Net operating cash flow before taxation, financial items, - 91 281 424 105
changes in working capital and extraordinary items
A.2. Changes in working capital 5 122 291 -7 235 364
A.2.1. Change in receivables from operating activities, estimated receivables and deferrals 3 732 603 -4 786 325
A.2.2. Change in short-term liabilities from operating activities, estimated payables and accruals - 744 524 - 129 284
A.2.3. Change in inventories 67 75
A.2.4. Change in short-term financial assets, other than cash and cash equivalents 2 134 145 -2 319 830
A.** Net operating cash flow before taxation, 5 031 010 -6 811 259
financial balances, and extraordinary items
A.3. Interest paid excluding amounts capitalised -1 003 436 - 858 840
A.4. Interest received 1 018 256 290 249
A.5. Income tax paid on ordinary income and income tax relating to prior periods - 11 939 20 664
A.6. Other financial receipts and disbursement - 224 280 132 688
A.7. Dividends received 1 746 897 1 022 812
A.*** Net operating cash flow 6 556 508 -6 203 686
Investing activities
B.1. Acquisition of fixed assets -2 701 112 - 801 391
B.1.1. Acquisition of tangible fixed assets - 85 - 43
B.1.3. Acquisition of long-term investments -2 701 027 - 801 348
B.2. Proceeds from sales of fixed assets 1 022 194 421 598
B.2.1. Proceeds from sales of tangible and intangible fixed assets 22
B.2.2. Proceeds from sale of long-term investments 1 022 172 421 598
B.3. Advances and loans to related parties -2 600 953 4 276 683
B.*** Net cash flow from investing activities -4 279 871 3 896 890
Financing activities
C.1. Change in long-term resp. short-term liabilities from financing -1 183 853 -1 551 076
C.2. Increase and decrease in equity from cash transactions - 476 775 3 080 151
C.2.1. Subscription of shares and investments 3 446 558
C.2.2. Equity paid to shareholders - 119 587
C.2.5. Payments from funds created from net profit - 476 775 - 246 820
C.*** Net cash flow from financing activities -1 660 628 1 529 075
F. Net increase or decrease in cash balance 616 009 - 777 721
R. Cash and cash equivalents, end of period 701 984 85 975
27592502 Czech Republic
Translated from the Czech original
CASH FLOW STATEMENTfor the year ended 31 December 2017
(in thousands of Czech crowns)
J&T FINANCE GROUP SE
Pobřežní 297/14
186 00 Praha 8 - Karlín

Identification number 27592502
Registered
capital Premium
Other capital
contributions
Revaluation of
assets and
liabilities
Other reserve
funds
Statutory and
other funds Retained profits
Profit (loss) for the
current period Total
Balance as at 1.1.2017 15 780 308 2 551 766 5 615 882 -97 766 200 082 246 820 6 014 803 -74 713 30 237 182
Transfer of the prior year profit (loss) -- -- -- -- -- 485 000 -74 714 -- 410 286
Settlement of accumulated losses -- -- -- -- -- -- -- 74 713 74 713
Payment of perpetuity interests -- -- -- -- -- -476 775 -485 000 -- -961 775
Change in revaluation -- -- -- -1 179 029 -- -- -- -- -1 179 029
Change in fair value of hedging instruments
-- -- -- 438 000 -- -- -- -- 438 000
Profit (loss) for the current period -- -- -- -- -- -- -- 2 159 568 2 159 568
Balance as at 31.12.2017 15 780 308 2 551 766 5 615 882 -838 795 200 082 255 045 5 455 089 2 159 568 31 178 945
Registered
capital Premium
Other capital
contributions
Revaluation of
assets and
liabilities
Other reserve
funds
Statutory and
other funds Retained profits
Profit (loss) for the
current period Total
Balance as at 1.1.2016 17 740 750 2 551 766 208 882 -105 352 200 082 1 960 000 3 130 608 1 533 782 27 220 518
Transfer of the prior year profit (loss) -- -- -- -- -- 490 000 1 043 782 -1 533 782 --
Decrease in registered capital -1 960 442 -- -- -- -- -- -- -- -1 960 442
Transfer of financial assistance -- -- -- -- -- -1 960 000 1 840 413 -- -119 587
Payment of perpetuity -- -- 5 407 000 -- -- -- -- -- 5 407 000
Payment of perpetuity interests -- -- -- -- -- -243 180 -- -- -243 180
Change in revaluation -- -- -- 7 586 -- -- -- -- 7 586
Profit (loss) for the current period -- -- -- -- -- -- -- -74 713 -74 713
Balance as at 31.12.2016 15 780 308 2 551 766 5 615 882 -97 766 200 082 246 820 6 014 803 -74 713 30 237 182
186 00 Praha 8 - Karlín
Czech Republic
STATEMENT OF CHANGES IN EQUITYfor the year ended 31 December 2017
(in thousands of Czech crowns)
Translated from the Czech original
J&T FINANCE GROUP SE
Pobřežní 297/14
Name and regist. office of the
Company
J&T FINANCE GROUP SE Notes to financial statements (translated from the Czech original) Year ended 31 December 2017 (All amounts are shown in thousands of Czech crowns “TCZK”)
Page 1
1. Description and principal activities
Establishment and description of the Company
J&T FINANCE GROUP SE (“the Company”) was registered on 24 August 2006. The subject of the
company's business is production, trade and services not listed in appendices 1 to 3 of the Trade Act.
Ownership structure
The shareholders of the Company as at 31 December 2017 were:
Jozef Tkáč 45.05%
Ivan Jakabovič 45.05%
CEFC Hainan International Holdings Co, Ltd. 4.50%
CEFC Shanghai International Group Limited 5.40%
Registered office
J&T FINANCE GROUP SE
Pobřežní 297/14
186 00 Praha 8 - Karlín
Czech Republic
Identification number
275 92 502
Members of the board of directors and supervisory board as at 31 December 2017
Members of the board of directors Members of the supervisory board
Jozef Tkáč (Chairman) Marta Tkáčová (Chairman)
Patrik Tkáč Ivan Jakabovič senior
Ivan Jakabovič Jana Šuterová
Dušan Palcr
Gabriela Lachoutová
During the accounting period members of the board of directors and the supervisory board did not
change.
The Company prepares consolidated financial statements.
Changes in the Commercial Register
In 2017, the following change concerning the board of directors was made:
– on 30 October 2017 Ivan Jakabovič’s address was changed,
The above event was recorded in the Commercial Register at the respective date.
J&T FINANCE GROUP SE Notes to financial statements (translated from the Czech original) Year ended 31 December 2017 (All amounts are shown in thousands of Czech crowns “TCZK”)
Page 2
Administrative branch
J&T FINANCE GROUP SE, organizačná zložka (“administrative branch”) was established in Slovakia
based on the decision of the board of directors of J&T FINANCE, a.s. (legal predecessor of the
Company) dated 6 November 2013 and on 15 November 2013 it was recorded in the Commercial
Register maintained by the District Court in Bratislava I, section Po, insert 2332/B as an administrative
branch of a foreign entity.
Basic information about the branch:
Company name: J&T FINANCE GROUP SE, organizačná zložka
Place of business: Dvořákovo nábrežie 8, 811 02 Bratislava, Slovak Republic
Identification number: 47 251 735
The principal activities of the administrative branch are as follows:
- mediation of providing loans and borrowings from funds solely acquired without a public invitation
and without a public offer of property values
- lease of real estate without providing other than basic services associated with the lease
- mediation services in the field of trade, services and manufacture
- business, organisational and economic advisory
- advertising and marketing services
Head of the administrative branch:
Function
Name
Head of the administrative branch Beáta Ondušková
Bratislava, Miletičova 54, post code 821 09, Slovak Republic
As at 31 December 2017 the administrative branch had 10 employees (2016 – 10 employees).
2. General accounting principles, accounting policies and their changes and deviations
These financial statements have been prepared in compliance with Act No. 563/1991 Coll., on
Accounting, as amended, (“the Act on Accounting”) and Decree of the Czech Ministry of Finance
No. 500/2002 Coll., implementing certain provisions of the Act on Accounting, as amended, for
business entities using double-entry bookkeeping, (“the Decree”). Comparative information for the year
2016 is provided in accordance with the structure and designation of balance sheet and income
statement items specified by the Decree as amended for 2017.
J&T FINANCE GROUP SE Notes to financial statements (translated from the Czech original) Year ended 31 December 2017 (All amounts are shown in thousands of Czech crowns “TCZK”)
Page 3
The financial statements have been prepared on a going concern basis.
a) Tangible and intangible fixed assets
Tangible and intangible fixed assets are stated at acquisition cost. Tangible fixed assets costing up
to TCZK 40 and intangible fixed assets costing up to TCZK 60 are not recognised in the balance
sheet and are expensed in the year that they are acquired.
The cost of internally produced fixed assets includes direct materials, direct wages and overheads
directly related to the creation of the asset until it is put into use.
Tangible fixed assets acquired free of charge are measured at replacement cost and credited to
other capital contributions (in the case of non-depreciable assets)/accumulated depreciation (in the
case of depreciable assets). An asset’s replacement cost is the cost at which the asset would be
acquired at the time of its recognition. The replacement cost of the respective assets has been
determined based on an expert appraisal.
Land is not depreciated.
Assets are depreciated using the following methods over the following periods:
Assets Method Period
Buildings Straight-line 30 years
Machinery and equipment Straight-line 8 years
Motor vehicles Declining balance 4 years
Patents and other intangibles Straight-line 5 years
Software Declining balance 3 years
Revaluation differences from acquired assets Straight-line 15 years
In the income statement, depreciation is presented in “Depreciation and amortisation of intangible
and tangible fixed assets”.
Leasehold improvements are depreciated on a straight-line basis over the shorter of the lease term
and their estimated useful lives.
b) Long-term investments
Long-term investments comprise equity investments in subsidiaries and associated companies, debt
securities that the Company has the intent and ability to hold to maturity, and other long-term
securities for which the Company’s intent is not known upon acquisition. Long-term investments
also include long-term loans provided to group undertakings and associated companies and other
long-term loans granted.
Long-term investments are stated at cost, which includes expenses directly incurred in connection
with the acquisition, such as fees and commissions paid to brokers, advisors and stock exchanges.
Securities, except held-to-maturity securities and securities comprising equity investments in
subsidiaries and associated companies, are measured at fair value as at the balance sheet date.
Gains/losses arising from the change in fair value are not included in the net profit or loss for the
J&T FINANCE GROUP SE Notes to financial statements (translated from the Czech original) Year ended 31 December 2017 (All amounts are shown in thousands of Czech crowns “TCZK”)
Page 4
period until they are realised, and are recorded as changes in “Revaluation of assets and liabilities”
in equity.
Where the fair value cannot be reliably determined the investments are recognised at acquisition
cost, and if a particular investment has been impaired, impairment allowance is created.
As at the balance sheet date, investments are recognised at acquisition cost, and in case of
temporary decrease in net realisable value impairment allowances a created. Impairment
allowances are created at the end of the accounting period. Impairment allowances are created in
the currency in which the investment is recognized. Exchange rate differences to impairment
allowances are recognized in the income statement on the same account for which the impairment
of investments is recognized.
Foreign exchange differences arising from translation of long-term securities and ownership
interests on the balance sheet date are part of the revaluation of these assets and liabilities presented
in equity section “Revaluation of assets and liabilities”.
The value of debt securities as at the balance sheet date also includes the proportionate part of
interest revenue that is recognised in the income statement. Where the value of held-to-maturity
debt securities has been impaired all.
c) Short-term securities and ownership interests
On acquisition, securities held for trading and held-to-maturity debt securities due within one year
are recorded at acquisition cost.
As at the balance sheet date short-term securities held for trading are measured at fair value. Any
change in valuation in the accounting period is recorded in revenues (expenses) from revaluation of
securities and derivatives. Where fair value cannot be reliably determined, short-term securities
held for trading are recognised at cost. Impairment allowances are created in case of temporary
decrease in the value of these assets.
The value of debt securities as at the balance sheet date also includes the proportionate part of
interest revenue that is recognised in the income statement. Impairment allowances are created in
case of temporary decrease in the value of these assets.
d) Inventories
Raw materials are stated at cost, which includes the purchase price of the materials and related
customs duties and in-transit storage and freight costs incurred in delivering the materials to the
manufacturing facility. Cost is determined using the first-in, first-out method.
Goods for resale are stated at cost, which includes the purchase price of the goods and related
customs duties and in-transit storage and freight costs incurred in delivering the goods to the
warehouse. Cost is determined using the first-in, first-out method.
J&T FINANCE GROUP SE Notes to financial statements (translated from the Czech original) Year ended 31 December 2017 (All amounts are shown in thousands of Czech crowns “TCZK”)
Page 5
e) Creation of allowances and provisions
Receivables
The Company creates allowances for doubtful receivables based on an analysis of the credit status
of customers and the ageing structure of receivables. In the income statement, the creation and
release of impairment allowances is presented in “Adjustments to receivables”.
Investments
Impairment allowances for investments are created when the carrying amount temporarily exceeds
the net realisable value of an investment, represented by the value of equity or a qualified estimate.
Provisions
As at the balance sheet date, a provision for untaken holidays is established based on an analysis of
untaken holidays in the accounting period and average payroll expenses, including social security
and health insurance expenses per employee.
An income tax provision is established as the financial statements are prepared before the tax
liability is determined. In the subsequent accounting period, the Company releases or uses this
provision and records the actual tax liability determined.
In the balance sheet, the income tax provision is reduced by income tax prepayments, and the net
receivable (if any) is recorded in tax receivables.
Other provisions are established for warranties. These provisions are established based on an
analysis of the Company’s management where provisions are established for risk guarantees.
f) Foreign currency translation
The Company applies the Czech National Bank official rate to foreign currency transactions.
During the year foreign exchange gains and losses are only recognised when realised at the time of
settlement.
As at the balance sheet date, foreign currency monetary assets and liabilities are translated at the
prevailing Czech National Bank official rates. Unrealised foreign exchange gains and losses are
recognised in profit or loss.
g) Derivatives
A derivative is a financial instrument that meets all of the following conditions.
- Its fair value changes in response to the change in a specified interest rate, price of a
security, commodity price, foreign exchange rate, price index, credit rating or credit
index, or other variable (“the underlying asset”).
- It requires a small or no initial net investment compared with other types of contract
based on a similar response to changes in market factors.
- It is settled at a future date, with the period from the trade date to the settlement date
exceeding that of a spot transaction.
J&T FINANCE GROUP SE Notes to financial statements (translated from the Czech original) Year ended 31 December 2017 (All amounts are shown in thousands of Czech crowns “TCZK”)
Page 6
Derivatives are recognised in the balance sheet at fair value. Positive fair values of derivatives are
recognised in assets under “Other receivables”. Negative fair values of derivatives are recognised
in liabilities under “Other payables”. The fair value of financial derivatives is the present value of
expected cash flows from these transactions.
Trading derivatives
Derivatives held for trading are recognised in the balance sheet at fair value. Gains/losses from
changes in fair value are recorded in the income statement under “Other financial revenues”/“Other
financial expenses”.
Hedging derivatives
The Company uses hedging derivatives (currency forwards, currency swaps) to mitigate foreign
exchange risks relating to the holding of foreign currency investment. Hedging derivatives are
recognised in the balance sheet at fair value. The method of recognising changes in fair value
depends on the model of hedge accounting applied.
Hedge accounting
In accordance with accounting legislation, the Company applies hedge accounting to recognise the
effect of currency risk hedging.
The Company applies hedge accounting if:
the hedge is in line with the Company’s risk management strategy,
the hedge relationship is formally documented at the inception of the hedge,
the hedge relationship is expected to be effective throughout its duration,
the effectiveness of the hedge relationship can be objectively measured,
the hedge relationship is effective throughout the accounting period, i.e. changes in the fair
value or cash flows of the hedging instruments attributable to the hedged risk are within a
range of 80–125% of the changes in the fair value or cash flows of the hedged instruments
attributable to the hedged risk, and
for cash flow hedges, a forecast transaction is highly probable and presents an exposure to
variations in cash flows that could affect profit or loss.
The Company applies net investment hedge accounting model. When the Company hedges
currency risk from foreign currency investments in subsidiaries and associates, the effective portion
of the hedge (i.e. the change in the fair value of the hedging instrument attributable to the hedged
risk) is recognised in equity under “Revaluation of assets and liabilities”. The ineffective portion is
recognised in profit or loss.
Embedded derivatives
In some instances, a derivative may be part of a compound financial instrument, which includes
both the host instrument and the derivative (embedded derivative) that influences the cash flow or
otherwise modifies the characteristics of the host instrument. Pursuant to Section 52 (7) of Decree
No. 500/2002 Coll., the Company does not account for embedded derivatives.
J&T FINANCE GROUP SE Notes to financial statements (translated from the Czech original) Year ended 31 December 2017 (All amounts are shown in thousands of Czech crowns “TCZK”)
Page 7
h) Leased assets
Lease payments are expensed on a straight-line basis over the lease term. Where an asset is
purchased at the end of the lease, it is recorded at its purchase price.
i) Recognition of revenues and expenses
Revenues and expenses are recognised on an accrual basis, i.e. in the period to which they relate in
terms of substance and timing.
j) Income tax
Income tax for the period comprises current tax and the change in deferred tax.
Current tax comprises an estimate of tax payable calculated based on the taxable income, using the
tax rate valid as at the first day of the accounting period, and any adjustments to taxes payable for
previous periods.
Deferred tax is based on all temporary differences between the carrying and tax value of assets and
liabilities, and other temporary differences (tax losses carried forward, if any), multiplied by the tax
rate expected to be valid for the period in which the tax asset/liability is utilised.
A deferred tax asset is recognised only if it is probable that it will be utilised in future accounting
periods.
k) Classification of liabilities and receivables
The Company classifies as short-term any part of long-term liabilities, receivables, received bank
loans and received and granted overdrafts that is due within one year of the balance sheet date.
l) Consolidation
The Company is the parent entity that prepares consolidated financial statements in accordance
with Section 22aa of Act No. 563/1991 Coll., On Accounting. The consolidated financial
statements will be published in accordance with Sections 22a (2c) and 21a of Act No. 563/1991
Coll., on Accounting.
The Company prepares consolidated financial statements in accordance with International
Accounting Standards (IFRS), as adopted by the European Union.
m) Accounting of the organisational unit
The accounting of the organisational unit is kept in EUR and separately in Slovakia. The turnover
on all accounts is recalculated once a month at the daily exchange rate of the Czech National Bank.
Assets and liabilities in EUR are translated at the balance sheet date using the exchange rate
announced by the CNB. Any exchange differences arising from the translation of the balance sheet
and the income statement at the balance sheet date are recognized in the income statement.
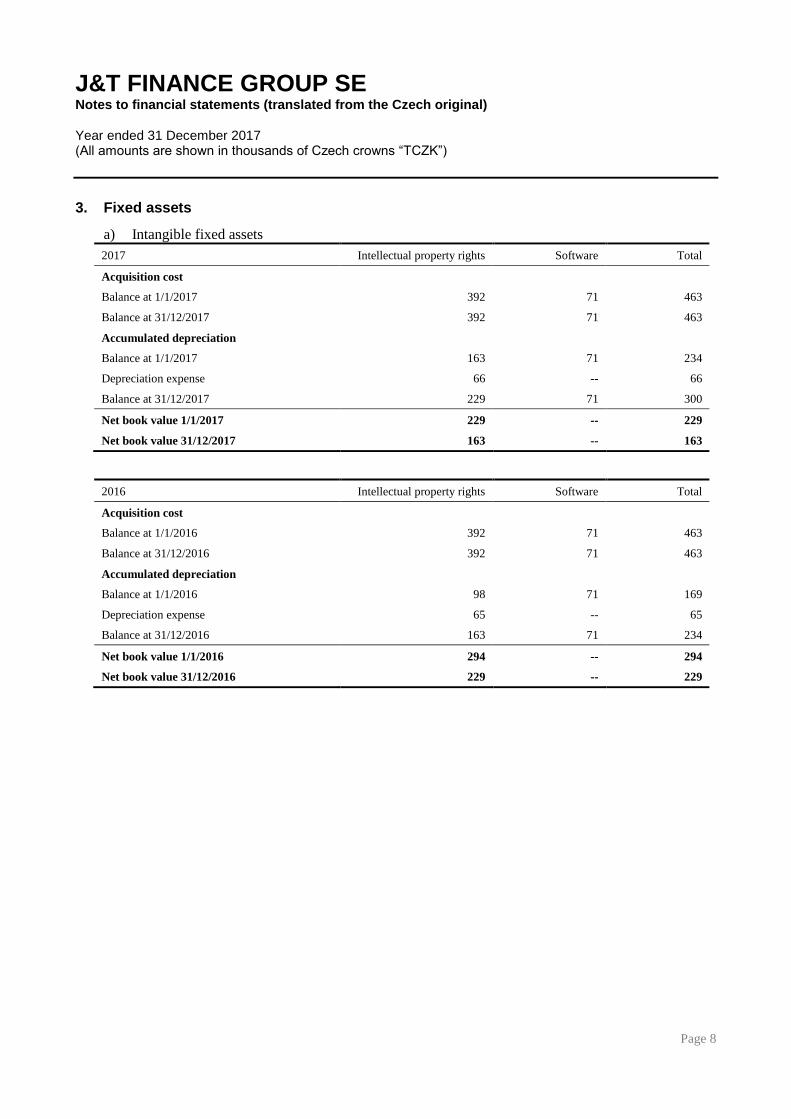
J&T FINANCE GROUP SE Notes to financial statements (translated from the Czech original) Year ended 31 December 2017 (All amounts are shown in thousands of Czech crowns “TCZK”)
Page 8
3. Fixed assets
a) Intangible fixed assets
2017 Intellectual property rights Software Total
Acquisition cost
Balance at 1/1/2017 392 71 463
Balance at 31/12/2017 392 71 463
Accumulated depreciation
Balance at 1/1/2017 163 71 234
Depreciation expense 66 -- 66
Balance at 31/12/2017 229 71 300
Net book value 1/1/2017 229 -- 229
Net book value 31/12/2017 163 -- 163
2016 Intellectual property rights Software Total
Acquisition cost
Balance at 1/1/2016 392 71 463
Balance at 31/12/2016 392 71 463
Accumulated depreciation
Balance at 1/1/2016 98 71 169
Depreciation expense 65 -- 65
Balance at 31/12/2016 163 71 234
Net book value 1/1/2016 294 -- 294
Net book value 31/12/2016 229 -- 229
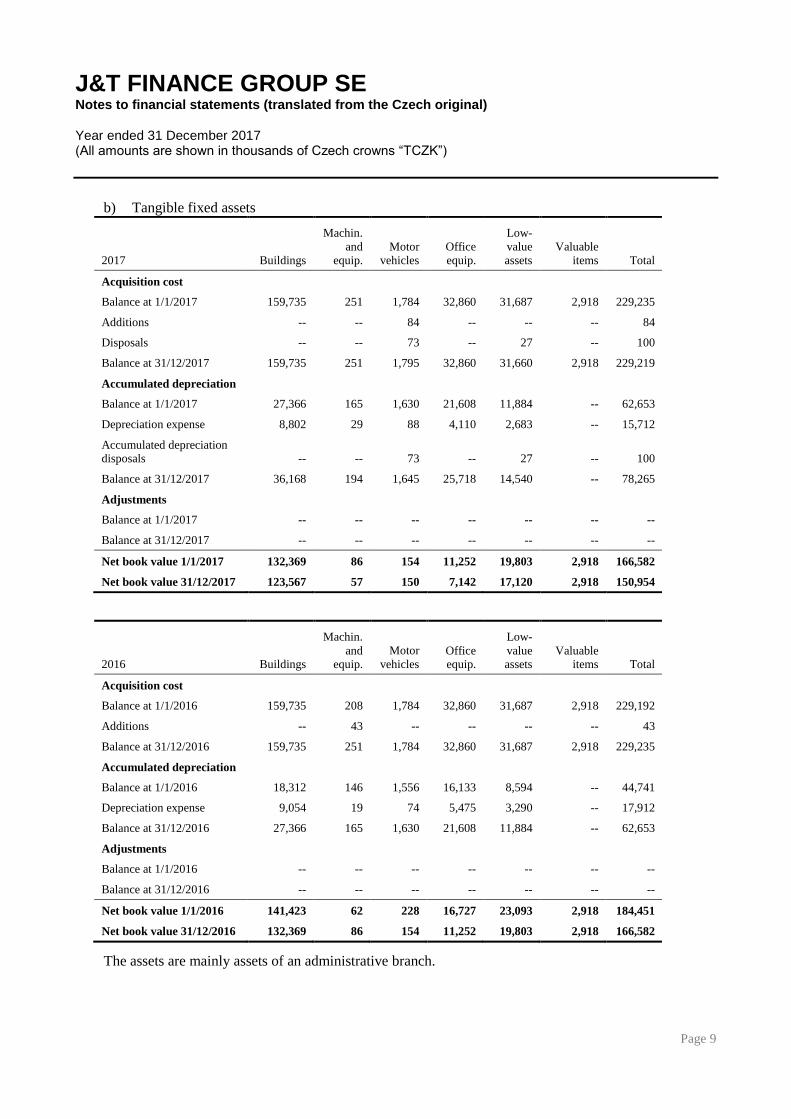
J&T FINANCE GROUP SE Notes to financial statements (translated from the Czech original) Year ended 31 December 2017 (All amounts are shown in thousands of Czech crowns “TCZK”)
Page 9
b) Tangible fixed assets
2017 Buildings
Machin.
and
equip.
Motor
vehicles
Office
equip.
Low-
value
assets
Valuable
items Total
Acquisition cost
Balance at 1/1/2017 159,735 251 1,784 32,860 31,687 2,918 229,235
Additions -- -- 84 -- -- -- 84
Disposals -- -- 73 -- 27 -- 100
Balance at 31/12/2017 159,735 251 1,795 32,860 31,660 2,918 229,219
Accumulated depreciation
Balance at 1/1/2017 27,366 165 1,630 21,608 11,884 -- 62,653
Depreciation expense 8,802 29 88 4,110 2,683 -- 15,712
Accumulated depreciation disposals -- -- 73 -- 27 -- 100
Balance at 31/12/2017 36,168 194 1,645 25,718 14,540 -- 78,265
Adjustments
Balance at 1/1/2017 -- -- -- -- -- -- --
Balance at 31/12/2017 -- -- -- -- -- -- --
Net book value 1/1/2017 132,369 86 154 11,252 19,803 2,918 166,582
Net book value 31/12/2017 123,567 57 150 7,142 17,120 2,918 150,954
2016 Buildings
Machin.
and equip.
Motor
vehicles Office equip.
Low-
value assets
Valuable items Total
Acquisition cost
Balance at 1/1/2016 159,735 208 1,784 32,860 31,687 2,918 229,192
Additions -- 43 -- -- -- -- 43
Balance at 31/12/2016 159,735 251 1,784 32,860 31,687 2,918 229,235
Accumulated depreciation
Balance at 1/1/2016 18,312 146 1,556 16,133 8,594 -- 44,741
Depreciation expense 9,054 19 74 5,475 3,290 -- 17,912
Balance at 31/12/2016 27,366 165 1,630 21,608 11,884 -- 62,653
Adjustments
Balance at 1/1/2016 -- -- -- -- -- -- --
Balance at 31/12/2016 -- -- -- -- -- -- --
Net book value 1/1/2016 141,423 62 228 16,727 23,093 2,918 184,451
Net book value 31/12/2016 132,369 86 154 11,252 19,803 2,918 166,582
The assets are mainly assets of an administrative branch.
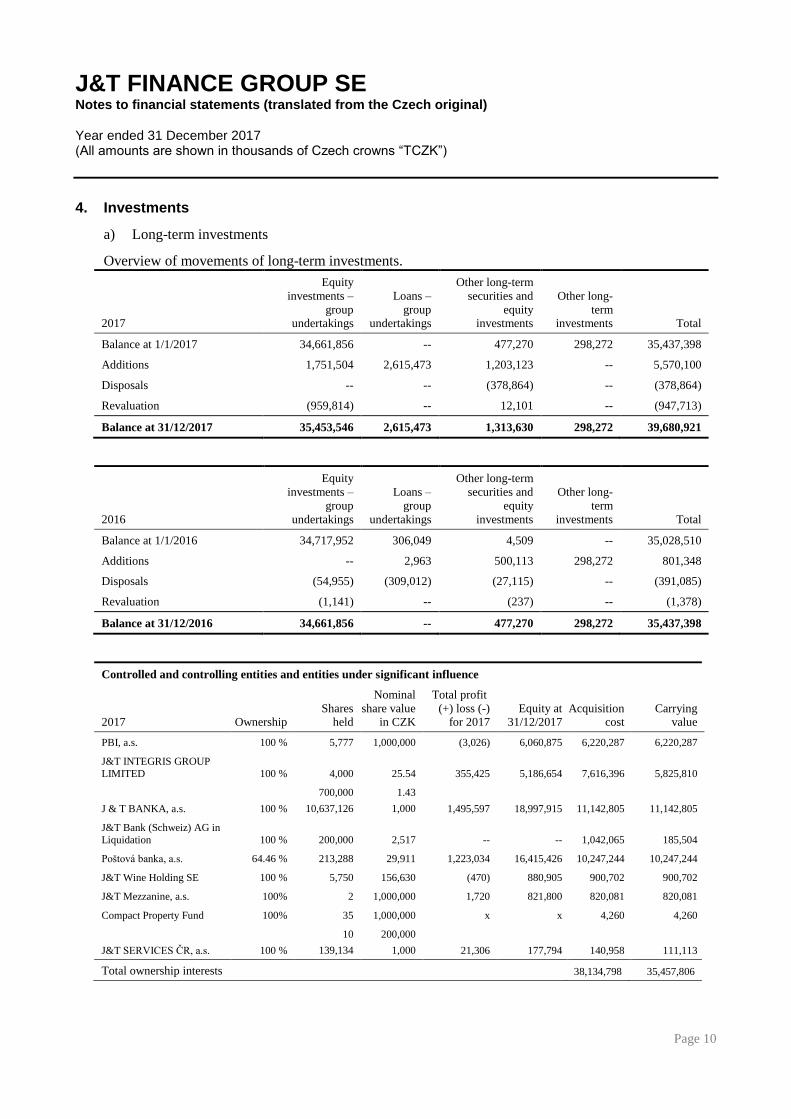
J&T FINANCE GROUP SE Notes to financial statements (translated from the Czech original) Year ended 31 December 2017 (All amounts are shown in thousands of Czech crowns “TCZK”)
Page 10
4. Investments
a) Long-term investments
Overview of movements of long-term investments.
2017
Equity
investments –
group undertakings
Loans –
group undertakings
Other long-term
securities and
equity investments
Other long-
term investments Total
Balance at 1/1/2017 34,661,856 -- 477,270 298,272 35,437,398
Additions 1,751,504 2,615,473 1,203,123 -- 5,570,100
Disposals -- -- (378,864) -- (378,864)
Revaluation (959,814) -- 12,101 -- (947,713)
Balance at 31/12/2017 35,453,546 2,615,473 1,313,630 298,272 39,680,921
2016
Equity
investments –
group
undertakings
Loans –
group
undertakings
Other long-term
securities and
equity
investments
Other long-
term
investments Total
Balance at 1/1/2016 34,717,952 306,049 4,509 -- 35,028,510
Additions -- 2,963 500,113 298,272 801,348
Disposals (54,955) (309,012) (27,115) -- (391,085)
Revaluation (1,141) -- (237) -- (1,378)
Balance at 31/12/2016 34,661,856 -- 477,270 298,272 35,437,398
Controlled and controlling entities and entities under significant influence
2017 Ownership Shares
held
Nominal
share value in CZK
Total profit
(+) loss (-) for 2017
Equity at 31/12/2017
Acquisition cost
Carrying value
PBI, a.s. 100 % 5,777 1,000,000 (3,026) 6,060,875 6,220,287 6,220,287
J&T INTEGRIS GROUP
LIMITED 100 % 4,000 25.54 355,425 5,186,654 7,616,396 5,825,810
J & T BANKA, a.s. 100 %
700,000
10,637,126
1.43
1,000 1,495,597 18,997,915 11,142,805 11,142,805
J&T Bank (Schweiz) AG in
Liquidation 100 % 200,000 2,517 -- -- 1,042,065 185,504
Poštová banka, a.s. 64.46 % 213,288 29,911 1,223,034 16,415,426 10,247,244 10,247,244
J&T Wine Holding SE 100 % 5,750 156,630 (470) 880,905 900,702 900,702
J&T Mezzanine, a.s. 100% 2 1,000,000 1,720 821,800 820,081 820,081
Compact Property Fund 100% 35 1,000,000 x x 4,260 4,260
J&T SERVICES ČR, a.s. 100 %
10
139,134
200,000
1,000 21,306 177,794 140,958 111,113
Total ownership interests 38,134,798 35,457,806
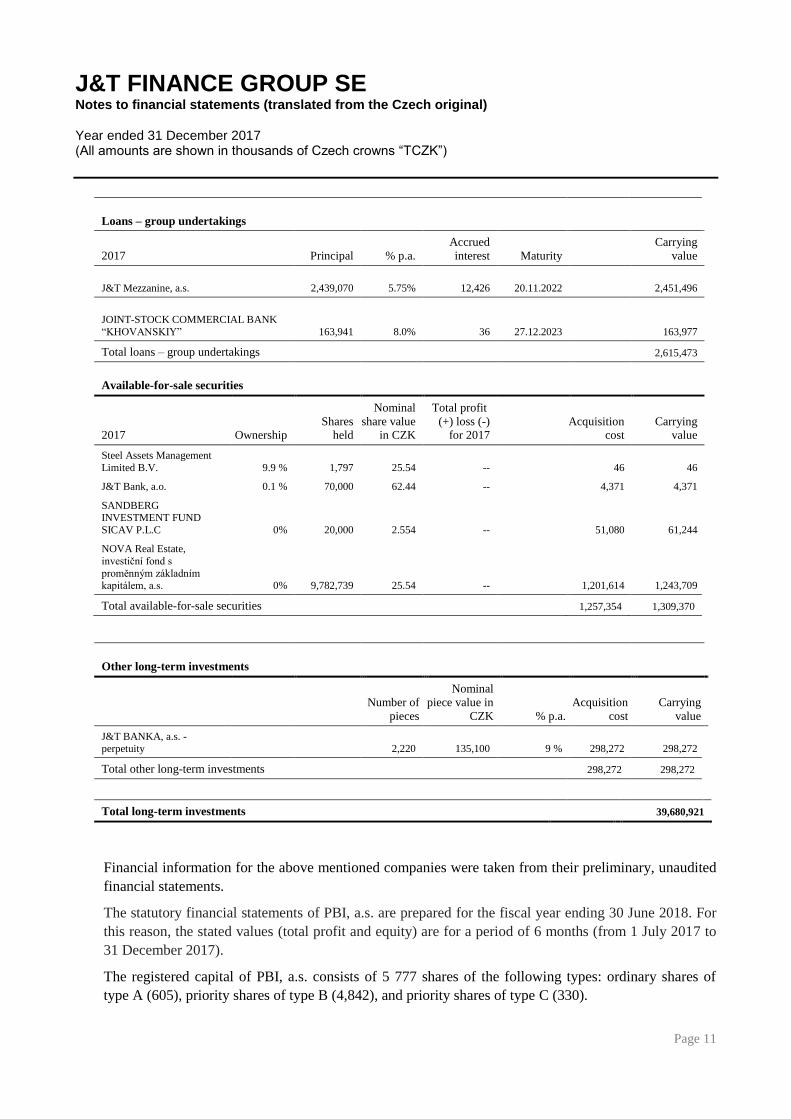
J&T FINANCE GROUP SE Notes to financial statements (translated from the Czech original) Year ended 31 December 2017 (All amounts are shown in thousands of Czech crowns “TCZK”)
Page 11
Loans – group undertakings
2017 Principal % p.a.
Accrued
interest Maturity
Carrying
value
J&T Mezzanine, a.s. 2,439,070 5.75% 12,426 20.11.2022 2,451,496
JOINT-STOCK COMMERCIAL BANK
“KHOVANSKIY” 163,941 8.0% 36 27.12.2023 163,977
Total loans – group undertakings 2,615,473
Available-for-sale securities
2017 Ownership Shares
held
Nominal
share value in CZK
Total profit
(+) loss (-) for 2017
Acquisition cost
Carrying value
Steel Assets Management
Limited B.V. 9.9 % 1,797 25.54 -- 46 46
J&T Bank, a.o. 0.1 % 70,000 62.44 -- 4,371 4,371
SANDBERG INVESTMENT FUND
SICAV P.L.C 0% 20,000 2.554 -- 51,080 61,244
NOVA Real Estate,
investiční fond s
proměnným základním kapitálem, a.s. 0% 9,782,739 25.54 -- 1,201,614 1,243,709
Total available-for-sale securities 1,257,354 1,309,370
Other long-term investments
Number of
pieces
Nominal
piece value in
CZK % p.a.
Acquisition
cost
Carrying
value
J&T BANKA, a.s. - perpetuity 2,220 135,100 9 % 298,272 298,272
Total other long-term investments 298,272 298,272
Total long-term investments 39,680,921
Financial information for the above mentioned companies were taken from their preliminary, unaudited
financial statements.
The statutory financial statements of PBI, a.s. are prepared for the fiscal year ending 30 June 2018. For
this reason, the stated values (total profit and equity) are for a period of 6 months (from 1 July 2017 to
31 December 2017).
The registered capital of PBI, a.s. consists of 5 777 shares of the following types: ordinary shares of
type A (605), priority shares of type B (4,842), and priority shares of type C (330).
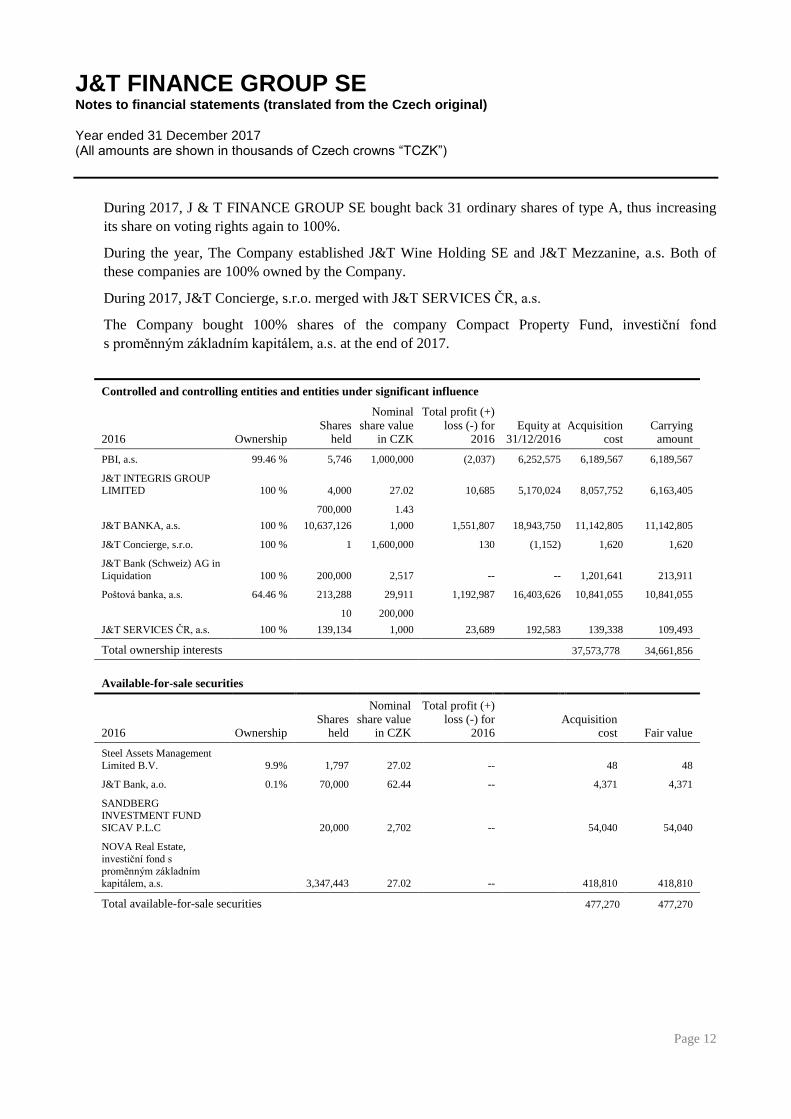
J&T FINANCE GROUP SE Notes to financial statements (translated from the Czech original) Year ended 31 December 2017 (All amounts are shown in thousands of Czech crowns “TCZK”)
Page 12
During 2017, J & T FINANCE GROUP SE bought back 31 ordinary shares of type A, thus increasing
its share on voting rights again to 100%.
During the year, The Company established J&T Wine Holding SE and J&T Mezzanine, a.s. Both of
these companies are 100% owned by the Company.
During 2017, J&T Concierge, s.r.o. merged with J&T SERVICES ČR, a.s.
The Company bought 100% shares of the company Compact Property Fund, investiční fond
s proměnným základním kapitálem, a.s. at the end of 2017.
Controlled and controlling entities and entities under significant influence
2016 Ownership Shares
held
Nominal
share value in CZK
Total profit (+)
loss (-) for 2016
Equity at 31/12/2016
Acquisition cost
Carrying amount
PBI, a.s. 99.46 % 5,746 1,000,000 (2,037) 6,252,575 6,189,567 6,189,567
J&T INTEGRIS GROUP LIMITED 100 % 4,000 27.02 10,685 5,170,024 8,057,752 6,163,405
J&T BANKA, a.s. 100 %
700,000
10,637,126
1.43
1,000 1,551,807 18,943,750 11,142,805 11,142,805
J&T Concierge, s.r.o. 100 % 1 1,600,000 130 (1,152) 1,620 1,620
J&T Bank (Schweiz) AG in
Liquidation 100 % 200,000 2,517 -- -- 1,201,641 213,911
Poštová banka, a.s. 64.46 % 213,288 29,911 1,192,987 16,403,626 10,841,055 10,841,055
J&T SERVICES ČR, a.s. 100 %
10
139,134
200,000
1,000 23,689 192,583 139,338 109,493
Total ownership interests 37,573,778 34,661,856
Available-for-sale securities
2016 Ownership Shares
held
Nominal
share value in CZK
Total profit (+)
loss (-) for 2016
Acquisition cost Fair value
Steel Assets Management
Limited B.V. 9.9% 1,797 27.02 -- 48 48
J&T Bank, a.o. 0.1% 70,000 62.44 -- 4,371 4,371
SANDBERG INVESTMENT FUND
SICAV P.L.C 20,000 2,702 -- 54,040 54,040
NOVA Real Estate,
investiční fond s
proměnným základním
kapitálem, a.s. 3,347,443 27.02 -- 418,810 418,810
Total available-for-sale securities 477,270 477,270
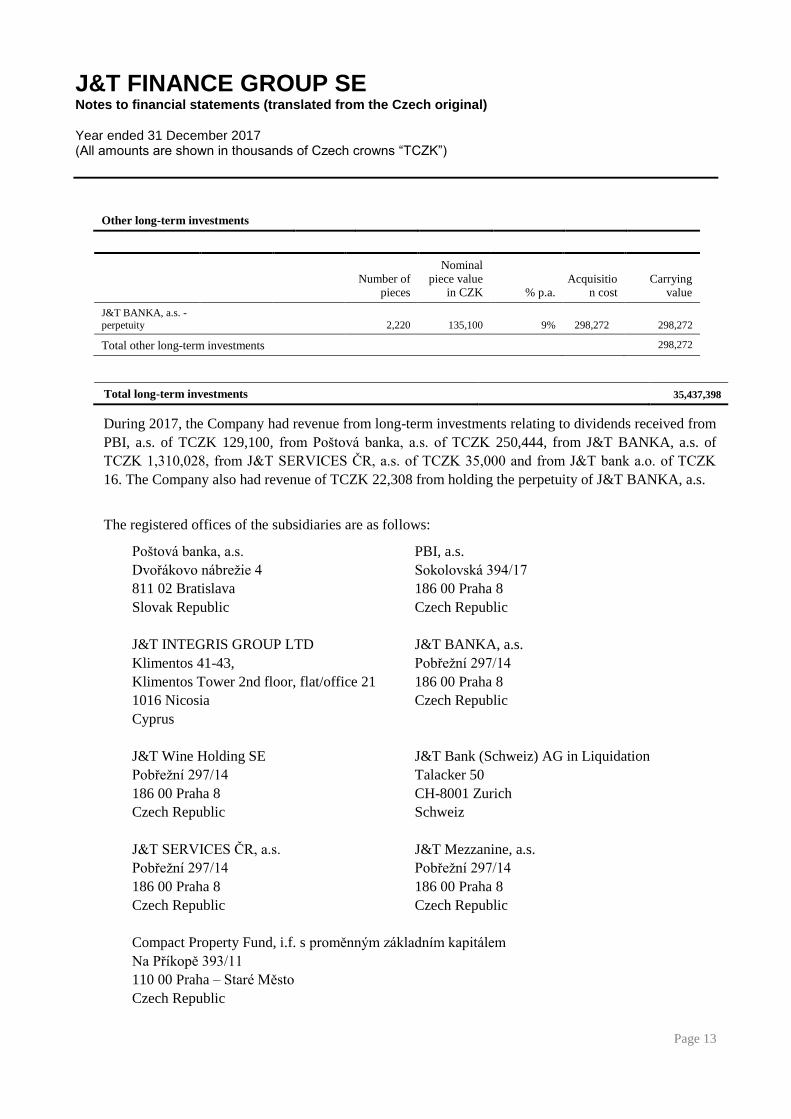
J&T FINANCE GROUP SE Notes to financial statements (translated from the Czech original) Year ended 31 December 2017 (All amounts are shown in thousands of Czech crowns “TCZK”)
Page 13
Other long-term investments
Number of
pieces
Nominal
piece value in CZK % p.a.
Acquisition cost
Carrying value
J&T BANKA, a.s. -
perpetuity 2,220 135,100 9% 298,272 298,272
Total other long-term investments 298,272
Total long-term investments 35,437,398
During 2017, the Company had revenue from long-term investments relating to dividends received from
PBI, a.s. of TCZK 129,100, from Poštová banka, a.s. of TCZK 250,444, from J&T BANKA, a.s. of
TCZK 1,310,028, from J&T SERVICES ČR, a.s. of TCZK 35,000 and from J&T bank a.o. of TCZK
16. The Company also had revenue of TCZK 22,308 from holding the perpetuity of J&T BANKA, a.s.
The registered offices of the subsidiaries are as follows:
Poštová banka, a.s. PBI, a.s.
Dvořákovo nábrežie 4 Sokolovská 394/17
811 02 Bratislava 186 00 Praha 8
Slovak Republic Czech Republic
J&T INTEGRIS GROUP LTD J&T BANKA, a.s.
Klimentos 41-43, Pobřežní 297/14
Klimentos Tower 2nd floor, flat/office 21 186 00 Praha 8
1016 Nicosia Czech Republic
Cyprus
J&T Wine Holding SE J&T Bank (Schweiz) AG in Liquidation
Pobřežní 297/14 Talacker 50
186 00 Praha 8 CH-8001 Zurich
Czech Republic Schweiz
J&T SERVICES ČR, a.s. J&T Mezzanine, a.s.
Pobřežní 297/14 Pobřežní 297/14
186 00 Praha 8 186 00 Praha 8
Czech Republic Czech Republic
Compact Property Fund, i.f. s proměnným základním kapitálem
Na Příkopě 393/11
110 00 Praha – Staré Město
Czech Republic
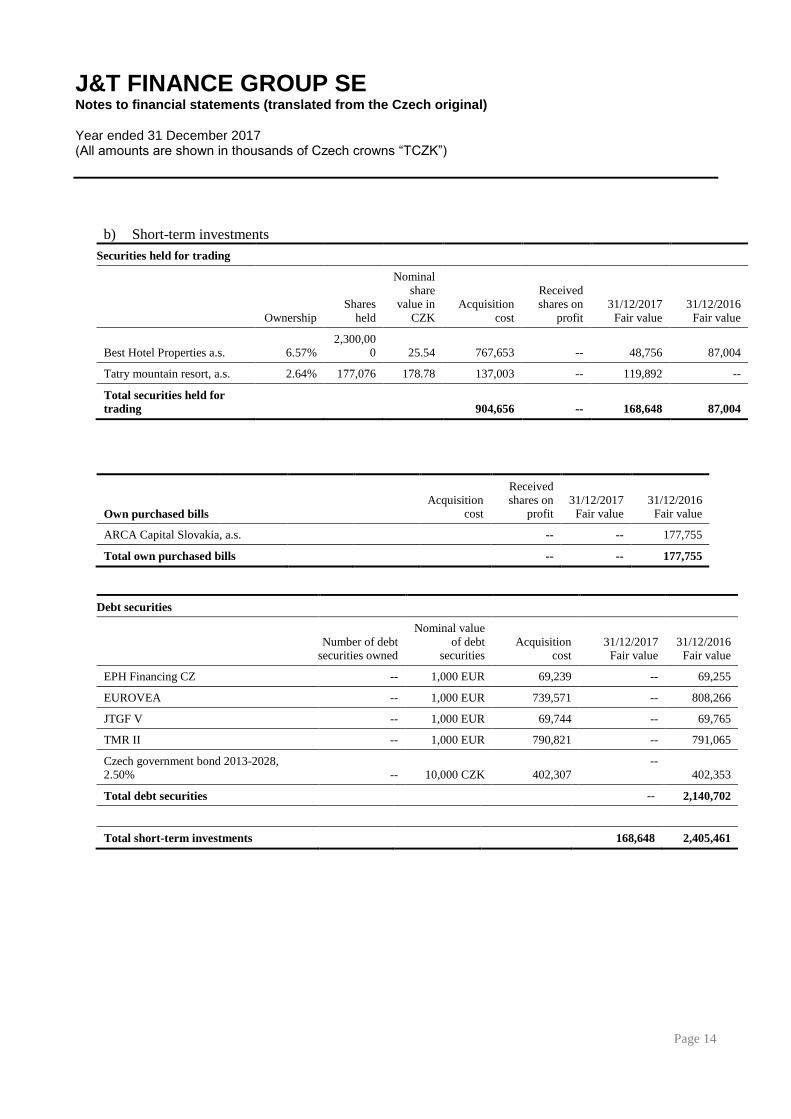
J&T FINANCE GROUP SE Notes to financial statements (translated from the Czech original) Year ended 31 December 2017 (All amounts are shown in thousands of Czech crowns “TCZK”)
Page 14
b) Short-term investments
Securities held for trading
Ownership
Shares
held
Nominal
share
value in
CZK
Acquisition
cost
Received
shares on
profit
31/12/2017
Fair value
31/12/2016
Fair value
Best Hotel Properties a.s. 6.57% 2,300,00
0 25.54 767,653 -- 48,756 87,004
Tatry mountain resort, a.s. 2.64% 177,076 178.78 137,003 -- 119,892 --
Total securities held for
trading 904,656 -- 168,648 87,004
Own purchased bills Acquisition
cost
Received
shares on profit
31/12/2017 Fair value
31/12/2016 Fair value
ARCA Capital Slovakia, a.s. -- -- 177,755
Total own purchased bills -- -- 177,755
Debt securities
Number of debt securities owned
Nominal value
of debt securities
Acquisition cost
31/12/2017 Fair value
31/12/2016 Fair value
EPH Financing CZ -- 1,000 EUR 69,239 -- 69,255
EUROVEA -- 1,000 EUR 739,571 -- 808,266
JTGF V -- 1,000 EUR 69,744 -- 69,765
TMR II -- 1,000 EUR 790,821 -- 791,065
Czech government bond 2013-2028, 2.50% -- 10,000 CZK 402,307
--
402,353
Total debt securities -- 2,140,702
Total short-term investments 168,648 2,405,461
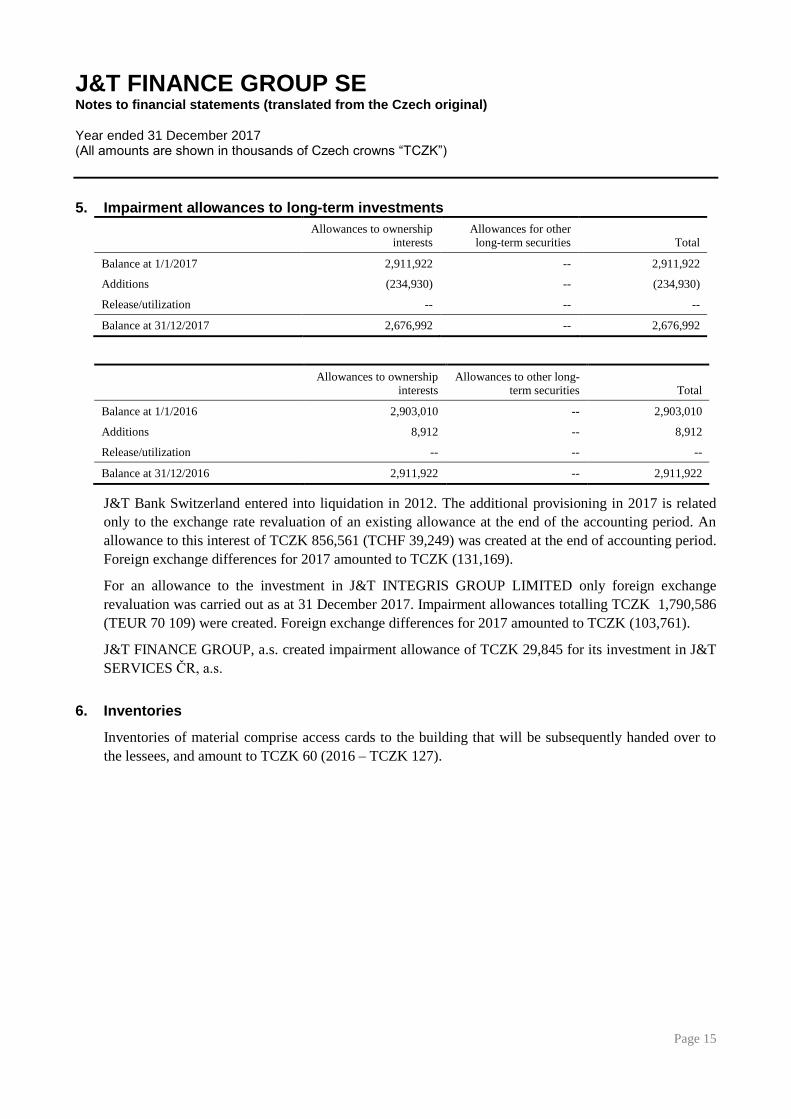
J&T FINANCE GROUP SE Notes to financial statements (translated from the Czech original) Year ended 31 December 2017 (All amounts are shown in thousands of Czech crowns “TCZK”)
Page 15
5. Impairment allowances to long-term investments
Allowances to ownership
interests Allowances for other long-term securities Total
Balance at 1/1/2017 2,911,922 -- 2,911,922
Additions (234,930) -- (234,930)
Release/utilization -- -- --
Balance at 31/12/2017 2,676,992 -- 2,676,992
Allowances to ownership
interests Allowances to other long-
term securities Total
Balance at 1/1/2016 2,903,010 -- 2,903,010
Additions 8,912 -- 8,912
Release/utilization -- -- --
Balance at 31/12/2016 2,911,922 -- 2,911,922
J&T Bank Switzerland entered into liquidation in 2012. The additional provisioning in 2017 is related
only to the exchange rate revaluation of an existing allowance at the end of the accounting period. An
allowance to this interest of TCZK 856,561 (TCHF 39,249) was created at the end of accounting period.
Foreign exchange differences for 2017 amounted to TCZK (131,169).
For an allowance to the investment in J&T INTEGRIS GROUP LIMITED only foreign exchange
revaluation was carried out as at 31 December 2017. Impairment allowances totalling TCZK 1,790,586
(TEUR 70 109) were created. Foreign exchange differences for 2017 amounted to TCZK (103,761).
J&T FINANCE GROUP, a.s. created impairment allowance of TCZK 29,845 for its investment in J&T
SERVICES ČR, a.s.
6. Inventories
Inventories of material comprise access cards to the building that will be subsequently handed over to
the lessees, and amount to TCZK 60 (2016 – TCZK 127).
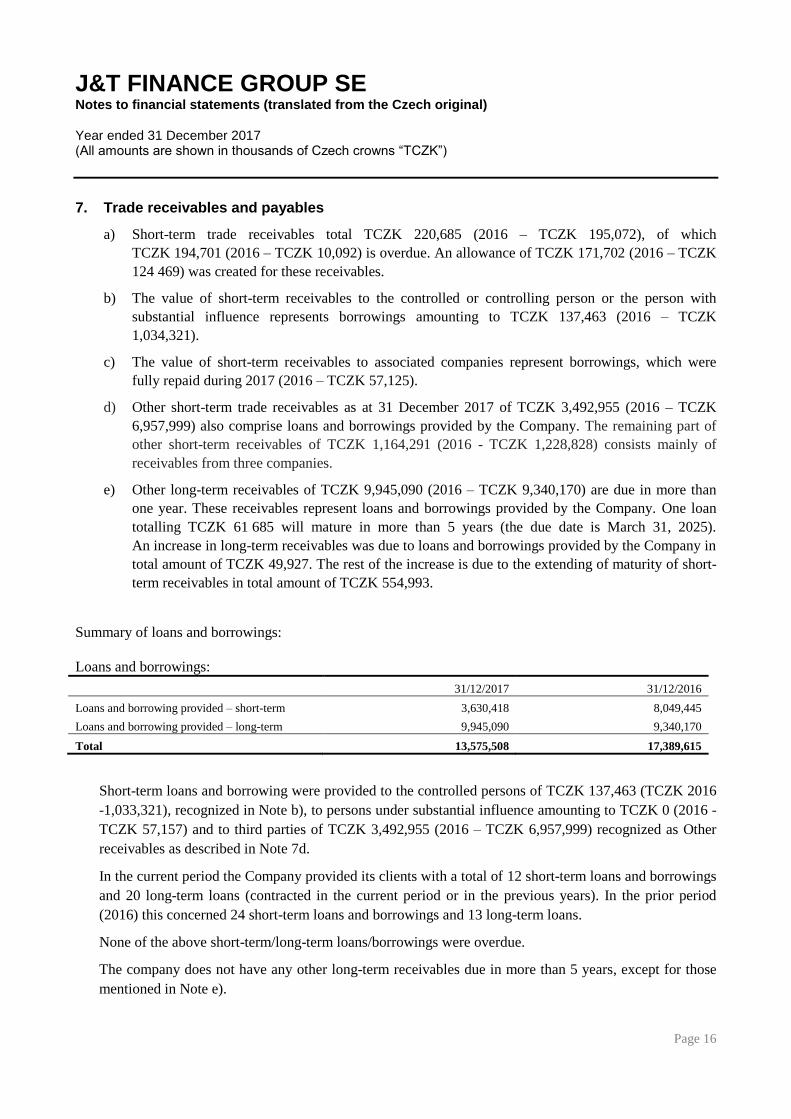
J&T FINANCE GROUP SE Notes to financial statements (translated from the Czech original) Year ended 31 December 2017 (All amounts are shown in thousands of Czech crowns “TCZK”)
Page 16
7. Trade receivables and payables
a) Short-term trade receivables total TCZK 220,685 (2016 – TCZK 195,072), of which
TCZK 194,701 (2016 – TCZK 10,092) is overdue. An allowance of TCZK 171,702 (2016 – TCZK
124 469) was created for these receivables.
b) The value of short-term receivables to the controlled or controlling person or the person with
substantial influence represents borrowings amounting to TCZK 137,463 (2016 – TCZK
1,034,321).
c) The value of short-term receivables to associated companies represent borrowings, which were
fully repaid during 2017 (2016 – TCZK 57,125).
d) Other short-term trade receivables as at 31 December 2017 of TCZK 3,492,955 (2016 – TCZK
6,957,999) also comprise loans and borrowings provided by the Company. The remaining part of
other short-term receivables of TCZK 1,164,291 (2016 - TCZK 1,228,828) consists mainly of
receivables from three companies.
e) Other long-term receivables of TCZK 9,945,090 (2016 – TCZK 9,340,170) are due in more than
one year. These receivables represent loans and borrowings provided by the Company. One loan
totalling TCZK 61 685 will mature in more than 5 years (the due date is March 31, 2025).
An increase in long-term receivables was due to loans and borrowings provided by the Company in
total amount of TCZK 49,927. The rest of the increase is due to the extending of maturity of short-
term receivables in total amount of TCZK 554,993.
Summary of loans and borrowings:
Loans and borrowings:
31/12/2017 31/12/2016
Loans and borrowing provided – short-term 3,630,418 8,049,445
Loans and borrowing provided – long-term 9,945,090 9,340,170
Total 13,575,508 17,389,615
Short-term loans and borrowing were provided to the controlled persons of TCZK 137,463 (TCZK 2016
-1,033,321), recognized in Note b), to persons under substantial influence amounting to TCZK 0 (2016 -
TCZK 57,157) and to third parties of TCZK 3,492,955 (2016 – TCZK 6,957,999) recognized as Other
receivables as described in Note 7d.
In the current period the Company provided its clients with a total of 12 short-term loans and borrowings
and 20 long-term loans (contracted in the current period or in the previous years). In the prior period
(2016) this concerned 24 short-term loans and borrowings and 13 long-term loans.
None of the above short-term/long-term loans/borrowings were overdue.
The company does not have any other long-term receivables due in more than 5 years, except for those
mentioned in Note e).
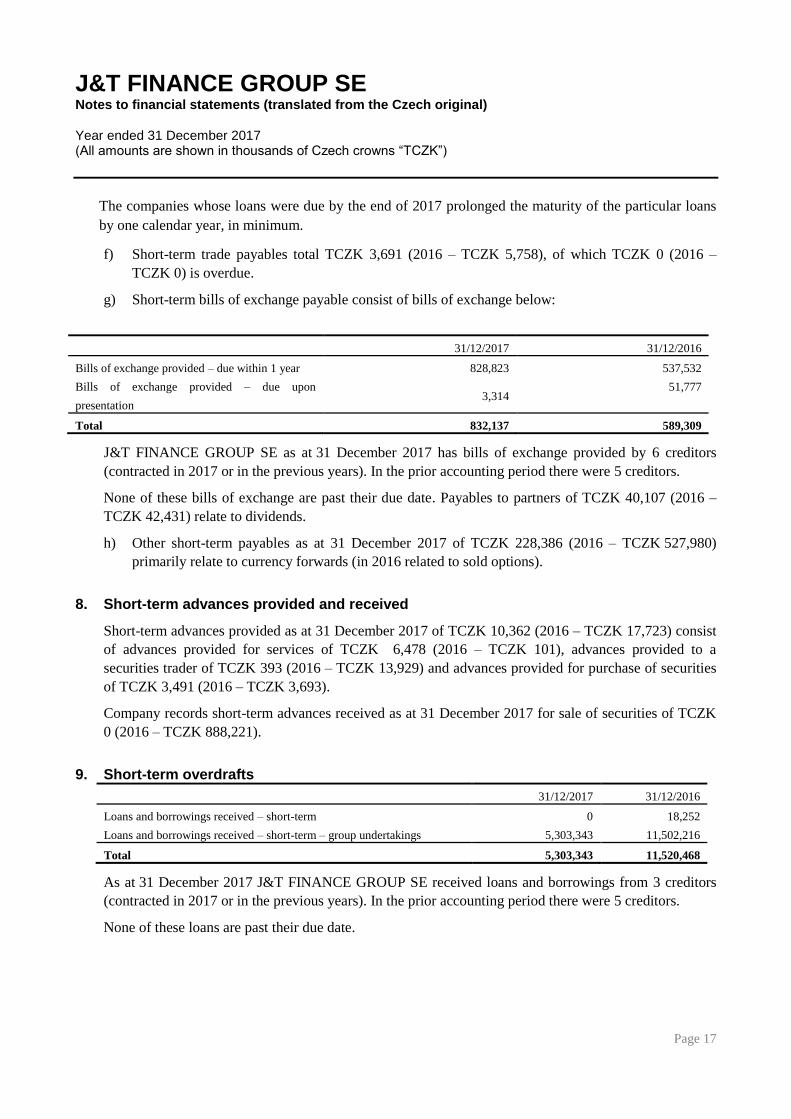
J&T FINANCE GROUP SE Notes to financial statements (translated from the Czech original) Year ended 31 December 2017 (All amounts are shown in thousands of Czech crowns “TCZK”)
Page 17
The companies whose loans were due by the end of 2017 prolonged the maturity of the particular loans
by one calendar year, in minimum.
f) Short-term trade payables total TCZK 3,691 (2016 – TCZK 5,758), of which TCZK 0 (2016 –
TCZK 0) is overdue.
g) Short-term bills of exchange payable consist of bills of exchange below:
31/12/2017 31/12/2016
Bills of exchange provided – due within 1 year 828,823 537,532
Bills of exchange provided – due upon
presentation 3,314
51,777
Total 832,137 589,309
J&T FINANCE GROUP SE as at 31 December 2017 has bills of exchange provided by 6 creditors
(contracted in 2017 or in the previous years). In the prior accounting period there were 5 creditors.
None of these bills of exchange are past their due date. Payables to partners of TCZK 40,107 (2016 –
TCZK 42,431) relate to dividends.
h) Other short-term payables as at 31 December 2017 of TCZK 228,386 (2016 – TCZK 527,980)
primarily relate to currency forwards (in 2016 related to sold options).
8. Short-term advances provided and received
Short-term advances provided as at 31 December 2017 of TCZK 10,362 (2016 – TCZK 17,723) consist
of advances provided for services of TCZK 6,478 (2016 – TCZK 101), advances provided to a
securities trader of TCZK 393 (2016 – TCZK 13,929) and advances provided for purchase of securities
of TCZK 3,491 (2016 – TCZK 3,693).
Company records short-term advances received as at 31 December 2017 for sale of securities of TCZK
0 (2016 – TCZK 888,221).
9. Short-term overdrafts
31/12/2017 31/12/2016
Loans and borrowings received – short-term 0 18,252
Loans and borrowings received – short-term – group undertakings 5,303,343 11,502,216
Total 5,303,343 11,520,468
As at 31 December 2017 J&T FINANCE GROUP SE received loans and borrowings from 3 creditors
(contracted in 2017 or in the previous years). In the prior accounting period there were 5 creditors.
None of these loans are past their due date.

J&T FINANCE GROUP SE Notes to financial statements (translated from the Czech original) Year ended 31 December 2017 (All amounts are shown in thousands of Czech crowns “TCZK”)
Page 18
10. Long-term overdrafts and bonds
Broken down according to maturity: 31/12/2017 31/12/2016
1 – 2 years 10,859,791 4,030,088
2 - 5 years 4,514,766 5,667,890
More than 5 years 0 1,352,409
Total 15,374,557 11,050,387
As at 31 December 2017 J&T FINANCE GROUP SE records long-term loans and borrowings received
due within 1 – 2 years from 4 creditors (contracted in 2017 or in the previous years); in the prior
accounting period it was 1 creditor. Loans and borrowings due within 2 – 5 years were from 4 creditors;
in the prior accounting period it were 2 creditors. Loans and borrowings due in more than 5 years were
from none of creditors; in the prior accounting period there were 3 creditors; these liabilities represented
in 2017 issued bonds and long-term loans and in 2016 issued bonds.
The paragraph Long-term overdrafts and bonds relates to the balance sheet line 111 Other debentures
and bonds and 116 Liabilities – group undertakings.
As at 31 December 2017, the Company recognizes also a long-term loan to a credit institution. This loan
is described in Note 17.
None of these loans are past their due date.
Other long-term payables consist of retention of TCZK 71 (2016 – TCZK 64).
11. Prepaid expenses
Prepaid expenses of TCZK 20,751 (2016 – TCZK 35,486) are primarily related to fees related to bonds
issuance of TCZK 200,568 (2016 – TCZK 35,098) and prepaid expenses of the administrative branch
for property insurance and rent of TCZK 683 (2016 – TCZK 375).
In 2017 prepaid expenses of TCZK 12,888 (2016 – TCZK 59,174) consist solely of accrued expenses
related to reimbursement of expenses for usual services (2016 – TCZK 14,048). In 2016 prepaid
expenses further consisted of expenses related to re-invoiced fees related to issue of bonds by a related
company – TCZK 45,126.
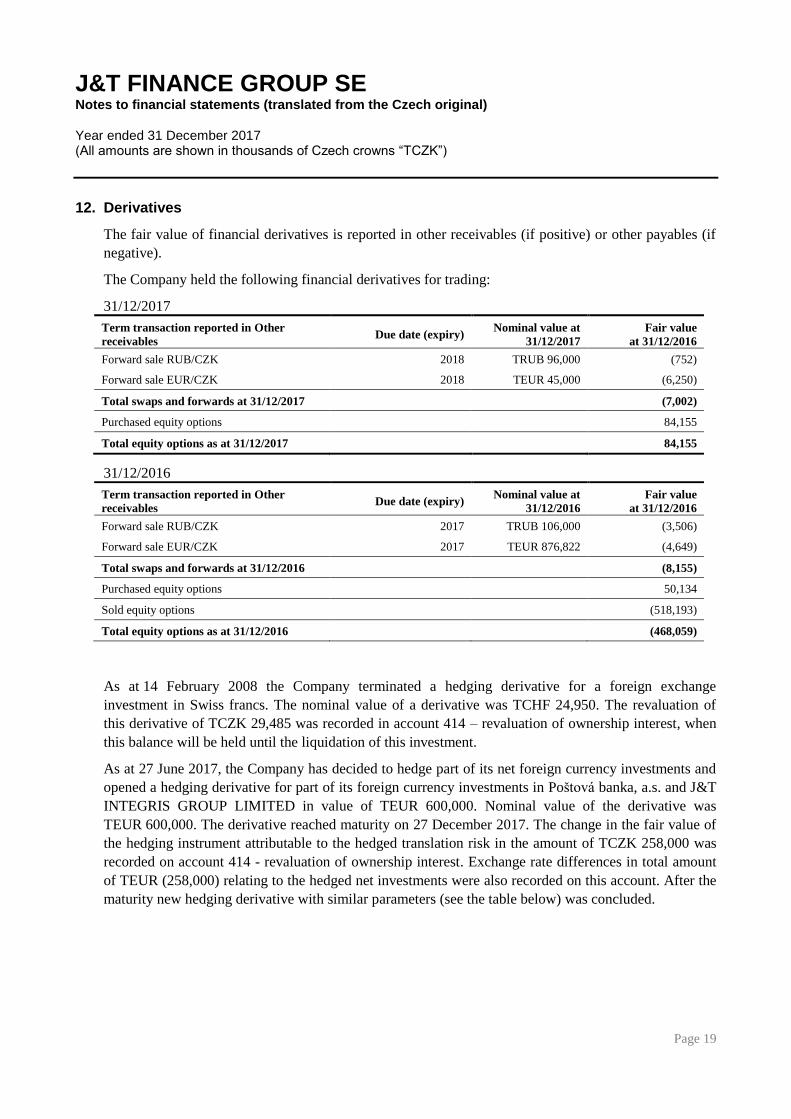
J&T FINANCE GROUP SE Notes to financial statements (translated from the Czech original) Year ended 31 December 2017 (All amounts are shown in thousands of Czech crowns “TCZK”)
Page 19
12. Derivatives
The fair value of financial derivatives is reported in other receivables (if positive) or other payables (if
negative).
The Company held the following financial derivatives for trading:
31/12/2017
Term transaction reported in Other
receivables Due date (expiry)
Nominal value at
31/12/2017
Fair value
at 31/12/2016
Forward sale RUB/CZK 2018 TRUB 96,000 (752)
Forward sale EUR/CZK 2018 TEUR 45,000 (6,250)
Total swaps and forwards at 31/12/2017 (7,002)
Purchased equity options 84,155
Total equity options as at 31/12/2017 84,155
31/12/2016
Term transaction reported in Other
receivables Due date (expiry)
Nominal value at
31/12/2016
Fair value
at 31/12/2016
Forward sale RUB/CZK 2017 TRUB 106,000 (3,506)
Forward sale EUR/CZK 2017 TEUR 876,822 (4,649)
Total swaps and forwards at 31/12/2016 (8,155)
Purchased equity options 50,134
Sold equity options (518,193)
Total equity options as at 31/12/2016 (468,059)
As at 14 February 2008 the Company terminated a hedging derivative for a foreign exchange
investment in Swiss francs. The nominal value of a derivative was TCHF 24,950. The revaluation of
this derivative of TCZK 29,485 was recorded in account 414 – revaluation of ownership interest, when
this balance will be held until the liquidation of this investment.
As at 27 June 2017, the Company has decided to hedge part of its net foreign currency investments and
opened a hedging derivative for part of its foreign currency investments in Poštová banka, a.s. and J&T
INTEGRIS GROUP LIMITED in value of TEUR 600,000. Nominal value of the derivative was
TEUR 600,000. The derivative reached maturity on 27 December 2017. The change in the fair value of
the hedging instrument attributable to the hedged translation risk in the amount of TCZK 258,000 was
recorded on account 414 - revaluation of ownership interest. Exchange rate differences in total amount
of TEUR (258,000) relating to the hedged net investments were also recorded on this account. After the
maturity new hedging derivative with similar parameters (see the table below) was concluded.
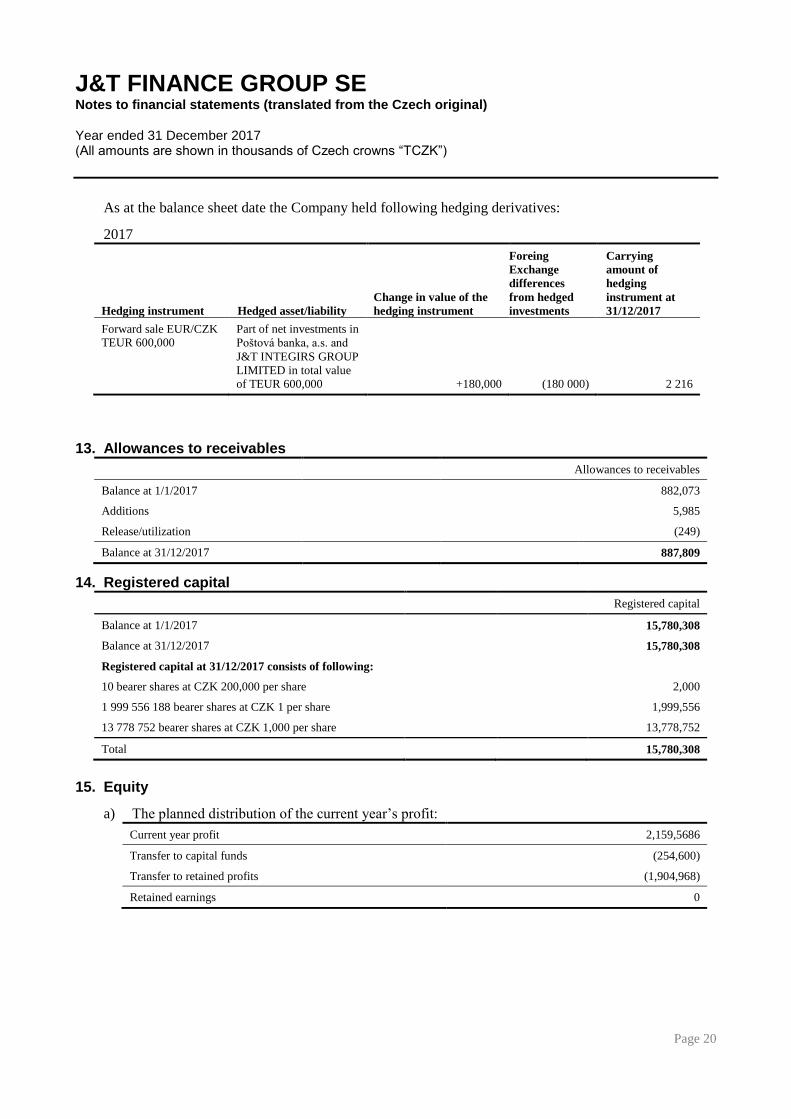
J&T FINANCE GROUP SE Notes to financial statements (translated from the Czech original) Year ended 31 December 2017 (All amounts are shown in thousands of Czech crowns “TCZK”)
Page 20
As at the balance sheet date the Company held following hedging derivatives:
2017
Hedging instrument Hedged asset/liability
Change in value of the
hedging instrument
Foreing
Exchange
differences
from hedged
investments
Carrying
amount of
hedging
instrument at
31/12/2017
Forward sale EUR/CZK TEUR 600,000
Part of net investments in
Poštová banka, a.s. and
J&T INTEGIRS GROUP
LIMITED in total value
of TEUR 600,000 +180,000 (180 000) 2 216
13. Allowances to receivables
Allowances to receivables
Balance at 1/1/2017 882,073
Additions 5,985
Release/utilization (249)
Balance at 31/12/2017 887,809
14. Registered capital
Registered capital
Balance at 1/1/2017 15,780,308
Balance at 31/12/2017 15,780,308
Registered capital at 31/12/2017 consists of following:
10 bearer shares at CZK 200,000 per share 2,000
1 999 556 188 bearer shares at CZK 1 per share 1,999,556
13 778 752 bearer shares at CZK 1,000 per share 13,778,752
Total 15,780,308
15. Equity
a) The planned distribution of the current year’s profit:
Current year profit 2,159,5686
Transfer to capital funds (254,600)
Transfer to retained profits (1,904,968)
Retained earnings 0
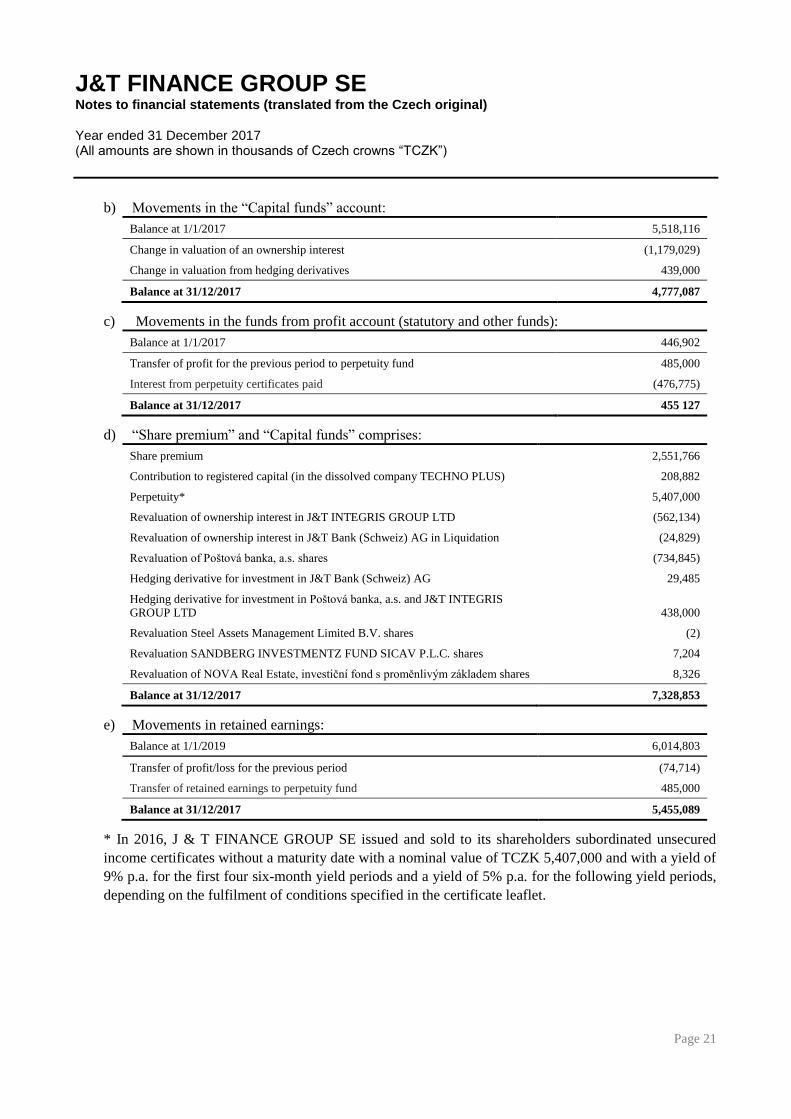
J&T FINANCE GROUP SE Notes to financial statements (translated from the Czech original) Year ended 31 December 2017 (All amounts are shown in thousands of Czech crowns “TCZK”)
Page 21
b) Movements in the “Capital funds” account:
Balance at 1/1/2017 5,518,116
Change in valuation of an ownership interest (1,179,029)
Change in valuation from hedging derivatives 439,000
Balance at 31/12/2017 4,777,087
c) Movements in the funds from profit account (statutory and other funds):
Balance at 1/1/2017 446,902
Transfer of profit for the previous period to perpetuity fund 485,000
Interest from perpetuity certificates paid (476,775)
Balance at 31/12/2017 455 127
d) “Share premium” and “Capital funds” comprises:
Share premium 2,551,766
Contribution to registered capital (in the dissolved company TECHNO PLUS) 208,882
Perpetuity* 5,407,000
Revaluation of ownership interest in J&T INTEGRIS GROUP LTD (562,134)
Revaluation of ownership interest in J&T Bank (Schweiz) AG in Liquidation (24,829)
Revaluation of Poštová banka, a.s. shares (734,845)
Hedging derivative for investment in J&T Bank (Schweiz) AG 29,485
Hedging derivative for investment in Poštová banka, a.s. and J&T INTEGRIS GROUP LTD 438,000
Revaluation Steel Assets Management Limited B.V. shares (2)
Revaluation SANDBERG INVESTMENTZ FUND SICAV P.L.C. shares 7,204
Revaluation of NOVA Real Estate, investiční fond s proměnlivým základem shares 8,326
Balance at 31/12/2017 7,328,853
e) Movements in retained earnings:
Balance at 1/1/2019 6,014,803
Transfer of profit/loss for the previous period (74,714)
Transfer of retained earnings to perpetuity fund 485,000
Balance at 31/12/2017 5,455,089
* In 2016, J & T FINANCE GROUP SE issued and sold to its shareholders subordinated unsecured
income certificates without a maturity date with a nominal value of TCZK 5,407,000 and with a yield of
9% p.a. for the first four six-month yield periods and a yield of 5% p.a. for the following yield periods,
depending on the fulfilment of conditions specified in the certificate leaflet.
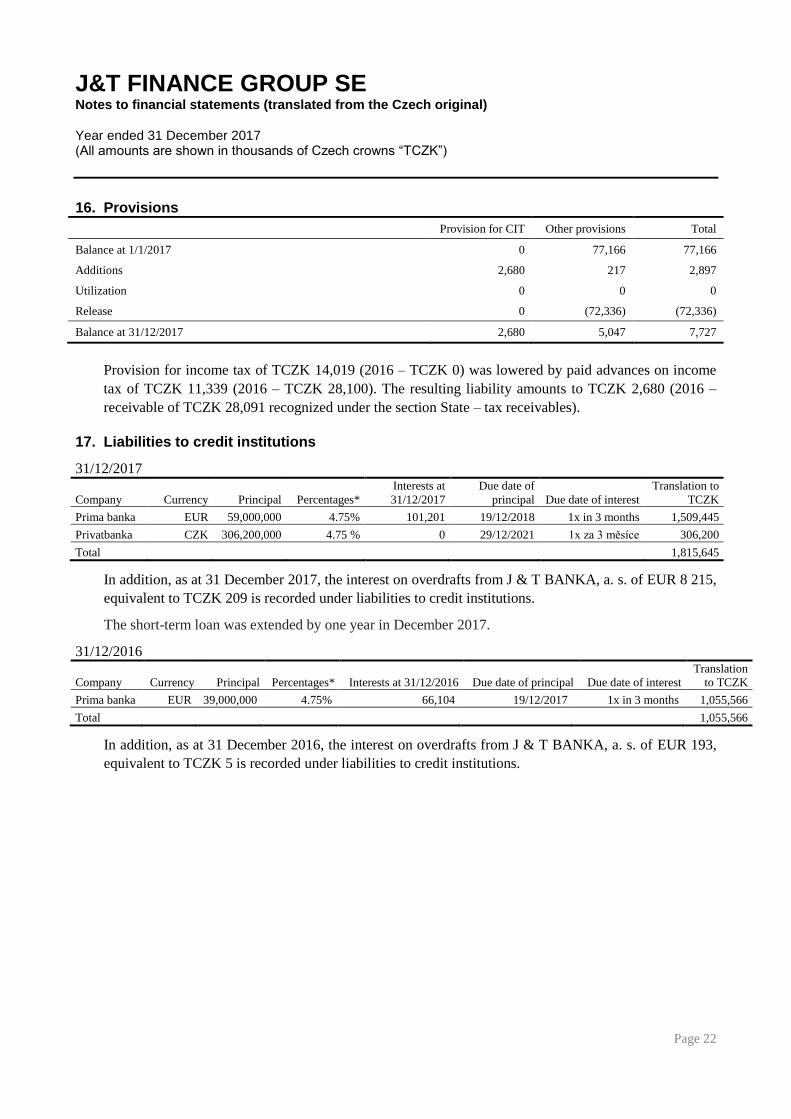
J&T FINANCE GROUP SE Notes to financial statements (translated from the Czech original) Year ended 31 December 2017 (All amounts are shown in thousands of Czech crowns “TCZK”)
Page 22
16. Provisions
Provision for CIT Other provisions Total
Balance at 1/1/2017 0 77,166 77,166
Additions 2,680 217 2,897
Utilization 0 0 0
Release 0 (72,336) (72,336)
Balance at 31/12/2017 2,680 5,047 7,727
Provision for income tax of TCZK 14,019 (2016 – TCZK 0) was lowered by paid advances on income
tax of TCZK 11,339 (2016 – TCZK 28,100). The resulting liability amounts to TCZK 2,680 (2016 –
receivable of TCZK 28,091 recognized under the section State – tax receivables).
17. Liabilities to credit institutions
31/12/2017
Company Currency Principal Percentages*
Interests at
31/12/2017
Due date of
principal Due date of interest
Translation to
TCZK
Prima banka EUR 59,000,000 4.75% 101,201 19/12/2018 1x in 3 months 1,509,445
Privatbanka CZK 306,200,000 4.75 % 0 29/12/2021 1x za 3 měsíce 306,200
Total 1,815,645
In addition, as at 31 December 2017, the interest on overdrafts from J & T BANKA, a. s. of EUR 8 215,
equivalent to TCZK 209 is recorded under liabilities to credit institutions.
The short-term loan was extended by one year in December 2017.
31/12/2016
Company Currency Principal Percentages* Interests at 31/12/2016 Due date of principal Due date of interest
Translation
to TCZK
Prima banka EUR 39,000,000 4.75% 66,104 19/12/2017 1x in 3 months 1,055,566
Total 1,055,566
In addition, as at 31 December 2016, the interest on overdrafts from J & T BANKA, a. s. of EUR 193,
equivalent to TCZK 5 is recorded under liabilities to credit institutions.
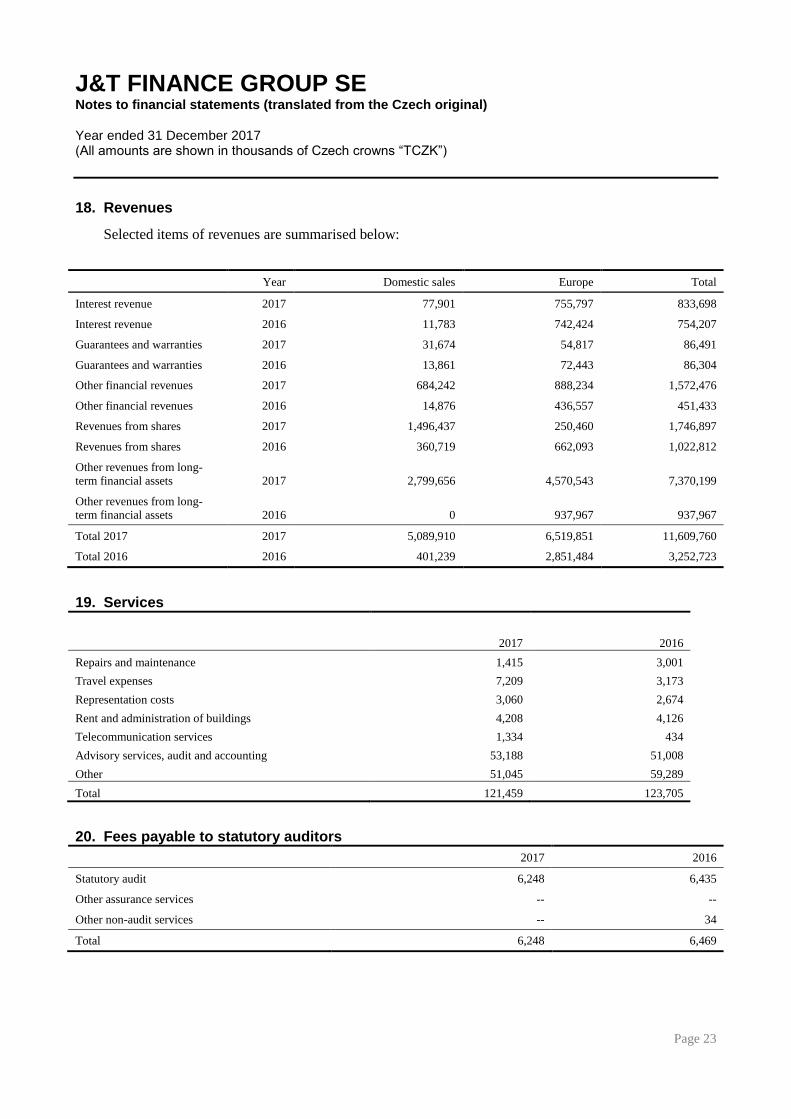
J&T FINANCE GROUP SE Notes to financial statements (translated from the Czech original) Year ended 31 December 2017 (All amounts are shown in thousands of Czech crowns “TCZK”)
Page 23
18. Revenues
Selected items of revenues are summarised below:
Year Domestic sales Europe Total
Interest revenue 2017 77,901 755,797 833,698
Interest revenue 2016 11,783 742,424 754,207
Guarantees and warranties 2017 31,674 54,817 86,491
Guarantees and warranties 2016 13,861 72,443 86,304
Other financial revenues 2017 684,242 888,234 1,572,476
Other financial revenues 2016 14,876 436,557 451,433
Revenues from shares 2017 1,496,437 250,460 1,746,897
Revenues from shares 2016 360,719 662,093 1,022,812
Other revenues from long-term financial assets 2017 2,799,656 4,570,543 7,370,199
Other revenues from long-term financial assets 2016 0 937,967 937,967
Total 2017 2017 5,089,910 6,519,851 11,609,760
Total 2016 2016 401,239 2,851,484 3,252,723
19. Services
2017 2016
Repairs and maintenance 1,415 3,001
Travel expenses 7,209 3,173
Representation costs 3,060 2,674
Rent and administration of buildings 4,208 4,126
Telecommunication services 1,334 434
Advisory services, audit and accounting 53,188 51,008
Other 51,045 59,289
Total 121,459 123,705
20. Fees payable to statutory auditors
2017 2016
Statutory audit 6,248 6,435
Other assurance services -- --
Other non-audit services -- 34
Total 6,248 6,469
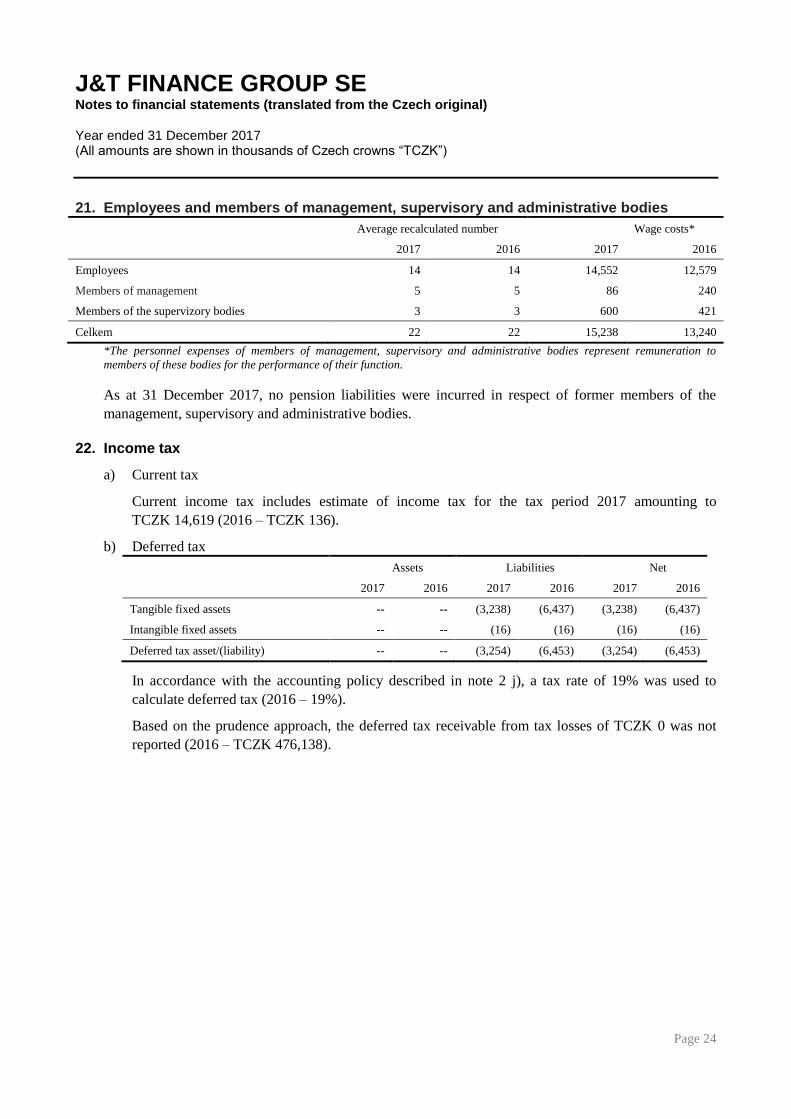
J&T FINANCE GROUP SE Notes to financial statements (translated from the Czech original) Year ended 31 December 2017 (All amounts are shown in thousands of Czech crowns “TCZK”)
Page 24
21. Employees and members of management, supervisory and administrative bodies
Average recalculated number Wage costs*
2017 2016 2017 2016
Employees 14 14 14,552 12,579
Members of management 5 5 86 240
Members of the supervizory bodies 3 3 600 421
Celkem 22 22 15,238 13,240
*The personnel expenses of members of management, supervisory and administrative bodies represent remuneration to
members of these bodies for the performance of their function.
As at 31 December 2017, no pension liabilities were incurred in respect of former members of the
management, supervisory and administrative bodies.
22. Income tax
a) Current tax
Current income tax includes estimate of income tax for the tax period 2017 amounting to
TCZK 14,619 (2016 – TCZK 136).
b) Deferred tax
Assets Liabilities Net
2017 2016 2017 2016 2017 2016
Tangible fixed assets -- -- (3,238) (6,437) (3,238) (6,437)
Intangible fixed assets -- -- (16) (16) (16) (16)
Deferred tax asset/(liability) -- -- (3,254) (6,453) (3,254) (6,453)
In accordance with the accounting policy described in note 2 j), a tax rate of 19% was used to
calculate deferred tax (2016 – 19%).
Based on the prudence approach, the deferred tax receivable from tax losses of TCZK 0 was not
reported (2016 – TCZK 476,138).
J&T FINANCE GROUP SE Notes to financial statements (translated from the Czech original) Year ended 31 December 2017 (All amounts are shown in thousands of Czech crowns “TCZK”)
Page 25
23. Related parties
a) Transactions with related parties
Volume of mutual transactions Receivables/Payables at 31
December
2017 2016 2017 2016
Sale of goods and services
Other companies in the group 683,696 74,928 51,657 73,342
Purchase of goods and
services
Other companies in the group 57,134 51,587 27,855 66,532
Loans granted
Shareholders of the Company -- 52,302 -- --
Other companies in the group 66,766 749,387 2,779,770 1,465,339
Loans received
Shareholders of the Company -- -- 40,107 42,432
Other companies in the group 897,782, 1,164,690 19,399,572 21,200,199
Loans received are included in the long-term and short-term payables and are described in notes 9
and 10. Loans granted are described in notes 2 and 7.
The Company purchases materials, utilises services and sells products to related parties as part of
its regular business activities. All material transactions with related parties were carried out based
on the arm’s length principle.
In the course of 2017, the Company realized dividend income of TCZK 1,746,987 as stated in
note 4.
b) In 2017 and 2016, members of management, supervisory and administrative bodies received no
advances, loans, guarantees granted nor any other benefits and did not own any shares in the
Company.
24. Leased property
Operating leases
The Company leases three cars under operating leases. The related expenses for 2017 amount to
TCZK 1,245 (2016 – TCZK 1,221).
J&T FINANCE GROUP SE Notes to financial statements (translated from the Czech original) Year ended 31 December 2017 (All amounts are shown in thousands of Czech crowns “TCZK”)
Page 26
25. Receivables and payables not recognized in the balance sheet
a) The Company has receivables of TCZK 2,354,165 (2016 – TCZK 2,326,337) and payables from
equity options of TCZK 2,348,115 (2016 – TCZK 2,317,989).
b) The Company provides guarantees for loans totalling TCZK 15,091,295 (2016 – TCZK
19,193,163).
c) The Company received pledges to provided loans totalling TCZK 1,966,607 (2016 – TCZK
233,099).
d) The Company received the credit facilities and various guarantees of TCZK 3,638,502 (2016 –
TCZK 4,839,701).
e) The Company received bills of exchange pledges for the loans received totalling TCZK 1,815,645
(2016 – TCZK 1,104,129).
f) As at 31 December 2017 the Company had currency forwards, receivables of TCZK 16,525,980
(2016 – TCZK 23,743,227) and payables of TCZK 16,508,599 (2016 – TCZK 23,749,553)
recorded off-balance sheet.
26. Cash flow statement
For preparation of the cash flow statement, cash and cash equivalents are defined to include cash on
hand, cash in transit, cash on bank accounts, and other financial assets whose value can be reliably
determined and can be easily converted to cash. The outstanding balance of cash and cash equivalents is
as follows:
31/12/2017 31/12/2016
Cash in hand 312 273
Cash in current accounts 701,672 85,702
Cash and cash equivalents 701,984 85,975
Cash flows from operating, investing or financing activities are reported in the cash flow statement
uncompensated.
J&T FINANCE GROUP SE Notes to financial statements (translated from the Czech original) Year ended 31 December 2017 (All amounts are shown in thousands of Czech crowns “TCZK”)
Page 27
27. Material subsequent event
On 27 March 2017, J&T FINANCE GROUP SE received a notice from the Antimonopoly Office of the
Slovak Republic about the commencement of administrative proceedings regarding a possible breach of
antimonopoly law by an unannounced transaction - the acquisition of a 40% stake in Panta Rhei, s.r.o.
by Diversified Retail Company, a.s. According to the preliminary considerations of the Antimonopoly
Office, J&T FINANCE GROUP SE allegedly gained joint control over Panta Rhei, s.r.o. by exercising
rights on behalf of Diversified Retail Company, a.s. without notifying the transaction to the
Antimonopoly Office and exercised the rights and duties arising from such control without prior
approval of the Antimonopoly Office. J&T FINANCE GROUP SE denies that it acquired control over
Panta Rhei, s.r.o. and disputes all the alleged breaches. The proceedings had not been concluded at the
time of issuance of the financial statements. The possible penalty can range from EUR 700 thousand to
EUR 7,000 thousand.
In March 2016 the shareholders of the Group entered into several agreements with CEFC, with the
original aim of CEFC to acquire a 50% share in the Group. The transaction was subject to regulatory
approval both in China and countries where the Group operates. In March 2018, the application for
regulatory approval was withdrawn by CEFC and the purchase of additional share in the Group was
abandoned. In May 2018 Rainbow Wisdom Investment Limited, a member of the CITIC Group, took
over the shareholding of CEFC in JTFG. JTFG and CITIC Group will engage in negotiations about
further and deeper cooperation between both groups.
At the balance sheet date, no other significant subsequent events affecting the financial statements as at
31 December 2017 were known to management.
TEXT PART OF THE ANNUAL REPORT
Description of the Company
Company name: J&T FINANCE GROUP SE
Registered office: Praha 8, Pobřežní 297/14, post code 186 00, Czech Republic
Identification number: 275 92 502
Legal form: european society
Registered in: the Commercial Register maintained by the Metropolitan Court in
Prague, section H, insert 1317
Principal business activities: manufacturing, trade and services not listed in appendices 1 to 3 of the
Trades Licensing Act
Principal activities: the acquisition and holding interests in legal entities.
Board of Directors of the Company as at 31 December 2017:
Chairman of the Board of Directors: Jozef Tkáč Vice-chairman of the Board of Directors: Patrik Tkáč Vice-chairman of the Board of Directors: Ivan Jakabovič Vice-chairman of the Board of Directors: Dušan Palcr Member of the Board of Directors: Gabriela Lachoutová
Supervisory Board of the Company as at 31 December 2017:
Chairman of the Supervisory Board: Marta Tkáčová Member of the Supervisory Board: Ivan Jakabovič Member of the Supervisory Board: Jana Šuterová
Information about the activities of the Company:
The nature of the Company's business activities has not changed compared to the previous accounting period. The Company administers its assets and enlarges its volume.
Financial results of the Company:
The Company has a long history as a strong and stable institution. As at 31 December 2017, the Company recorded assets of CZK 54.8 billion, equity of CZK 31.2 billion and the registered capital of CZK 15.8 billion. In the accounting period, the Company achieved profit of CZK 2.2 billion.
The balance of Company's assets and its financial position is disclosed in the financial statements as at 31 December 2017, which are attached as an independent appendix to the annual report. Detailed information on the balance of Company's assets is included in the financial section of the Company's annual report.
Information about expected economic development in 2018
In 2018, the Company will continue to focus all its activities on the administration of own assets by means of ownership shares in subsidiaries, provision of guarantees; and the fulfilment of obligation arising thereof.
Information about the administrative branches of the Company:
Company has an administrative branch which was established in Slovakia. It was recorded in the Commercial Register under name J&T FINANCE GROUP SE, organizačná zložka, ID: 47 251 735, registered office Dvořákovo nábrežie 8, 811 02 Bratislava, Slovak republic.

REPORT ON RELATIONS
between the controlling entity and the controlled entity, and between the controlled entity and
other entities controlled by the same controlling entity for the reporting period 2017 of J&T
FINANCE GROUP SE
prepared in accordance with Section 82 of Act No. 90/2012 Coll., on Commercial Companies and
Cooperatives (the Act on Business Corporations)
This report has been prepared by the Board of Directors of J&T FINANCE GROUP SE, with its
registered office at Pobřežní 297/14, P.C. 186 00 Praha 8, ID: 275 92 502, registered in the
Commercial Register maintained by the Metropolitan Court in Prague, section H, insert 1317 („the
Company“), based on data available. The period covered by the report: from 1 January 2017 to 31
December 2017 (hereinafter referred to as the “2017 accounting period”).
I.
The structure of relations between the controlling entities and the controlled entity, and
between the controlled entity and entities controlled by the same controlling entity, the role of
the controlled entity in the structure, and manner and means of control.
1.1
The Board of Directors of the Company is aware that during the period from 1 January 2017
to 31 December 2017, the Company was directly controlled by the following persons:
Ivan Jakabovič,
Date of birth: 8 October 1972, residing at 41 Avenue HECTOR OTTO, 98000 MONACO-VILLE,
Principality of Monaco, who, along with Jozef Tkáč (see below), controls J&T FINANCE GROUP
SE (hereinafter „Ivan Jakabovič“ or also „Controlling entity“)
In addition, Ivan Jakabovič owns shares in the following companies:
- J & T Securities, s.r.o.
ID: 31 366 431, with its registered office at Bratislava, Dvořákovo nábrežie 8, P.C. 811
02 Bratislava, Slovak Republic
- J&T MINORITIES PORTFOLIO LIMITED
ID: HE 260754, with its registered office at Kyriakou Matsi, NIKIS CENTER, 3rd
Floor, office 301, P. C. 2012 Nicosia, Cyprus,
Ivan Jakabovič has 19.7% share in this company
(since 28 December 2017)
Jozef Tkáč,
Date of birth: 16 June 1950, residing at Bratislava, Júlová 10941/32, P.C. 831 01 Bratislava, Slovak
Republic, who, along with Ivan Jakabovič (see above), controls J&T FINANCE GROUP SE
(hereinafter „Jozef Tkáč“ or also „Controlling entity“)
In addition, Jozef Tkáč owns shares in the following company:
- J&T MINORITIES PORTFOLIO LIMITED
ID: HE 260754, with its registered office at Kyriakou Matsi, NIKIS CENTER, 3rd
Floor, office 301, P. C. 2012 Nicosia, Cyprus,
Jozef Tkáč has 19.7% share in this company
(since 28 December 2017)

1.2
The Board of Directors of the Company is aware that during the accounting period 2017 the
Company was part of the following structure:
J&T FINANCE GROUP SE controls below mentioned entities:
J & T INTEGRIS GROUP LIMITED
ID: HE 207436, with its registered office at 11 Kyriakou Matsi, NIKIS CENTER, 3rd Floor,
Office 301 P.C. 1082, Nicosia, Cyprus
In addition, this company controls:
- Bayshore Merchant Services Inc.
o ID: 01005740, with its registered office at TMF Place, Road Town, Tortola, British
Virgin Islands
In addition, this company controls:
o J&T Bank & Trust Inc.
ID: 00011908, with its registered office at Lauriston House, Lower Collymore
Rock, St. Michael, Barbados
o J and T Capital, Sociedad Anonima de Capital Variable
ID: 155559102, with its registered office at Explanada 905-A, Lomas de
Chapultepec, 11000, Ciudad de Mexico, Mexico
- J&T MINORITIES PORTFOLIO LIMITED
ID: HE 260754, with its registered office at registered office at Kyriakou Matsi, NIKIS
CENTER, 3rd Floor, Office 301, P. C. 1082 Nicosia, Cyprus, J & T INTEGRIS GROUP
LIMITED has 60.60% share in this company
In addition, this company controls:
o Equity Holding, a.s.
ID: 100 05 005, with its registered office at Pobřežní 297/14, Karlín, 186 00
Praha 8, Czech Republic
J & T MINORITIES PORTFOLIO LIMITED has 62.64% share in this
company
- J&T Global Finance III, s.r.o.
ID: 47 101 181, with its registered office at Dvořákovo nábrežie 8, 811 02 Bratislava,
Slovak Republic
- J&T Global Finance IV., B.V. in liquidation
ID: 60411740, with its registered office at La Fontainestraat 7, 1902CW, Castricum,
Kingdom of the Netherlands
- J&T Global Finance V., s.r.o.
ID: 47 916 036, with its registered office at Dvořákovo nábrežie 8, 811 02 Bratislava,
Slovak Republic
- J&T Global Finance VI., s.r.o.
ID: 50 195 131, with its registered office at Dvořákovo nábrežie 8, 811 02 Bratislava,
Slovak Republic
- J&T Global Finance VII., s.r.o.
ID: 052 43 441, with its registered office at Pobřežní 297/14, Karlín, 186 00 Praha 8, Czech
republic

- J&T Global Finance VIII., s.r.o.
ID: 060 62 831, with its registered office at Pobřežní 297/14, Karlín, 186 00 Praha 8, Czech
republic
(since 1 May 2017)
J&T SERVICES ČR, a.s.
ID: 281 68 305, with its registered office at Pobřežní 297/14, Karlín, 186 00 Praha 8, Czech
Republic
In addition, this company controls:
- J&T SERVICES SR, s.r.o.
ID: 46 293 329, with its registered office at Dvořákovo nábrežie 8, 811 02 Bratislava,
Slovak Republic
- J & T FINANCE, LLC
ID: 1067746577326, with its registered office at Kadashevskaya embankment, 26, Moscow,
Russian Federation
In addition, this company controls:
o Hotel Kadasevskaya, LLC
ID: 1087746708642, with its registered office at Kadashevskaya Nabereznaya
26, 115035 Moscow, Russian Federation
J&T Bank Switzerland Ltd. in liquidation
ID: CH02030069721, with its registered office at Talacker 50, 12th floor, P.C. 8001, Zürich,
Swiss Confederation
J&T Mezzanine, a.s.
ID: 066 05 991, with its registered office at Pobřežní 297/14, Karlín, 186 00 Praha 8, Czech
Republic
(since 15 November 2017)
J&T Wine Holding SE
ID: 063 77 149, with its registered office at Pobřežní 297/14, Karlín, 186 00 Praha 8, Czech
Republic
(since 15 November 2017)
In addition, this company controls:
- KOLBY, a.s.
ID: 255 12 919, with its registered office at Česká 51, 691 26 Pouzdřany, Czech
Republic
(since 12 September 2017)
- SAXONWOLD LIMITED
ID: 508611, with its registered office Cam Lodge, Kilquaide, The Russian Village, Co.
Wicklow, A63 FK24, Ireland
J&T Wine Holding SE has 80% share in this company
(since 14 September 2017)
In addition, this company controls:
o WORLD END LLC
ID: 200807010154, with its registered office 5 Financial Plaza, 116, Cnr
Trancas & Big Ranch Road, Nap, California, 94558, United States of America
- OUTSIDER LIMITED
ID: HE 372202, with its registered office at Klimentos, 41-43, KLIMENTOS TOWER,
2nd floor, Office 21, P.C. 1061, Nicosia, Cyprus
(since 14 September 2017)
In addition, this company controls:
o SOCIETE CIVILE D'EXPLOITATION AGRICOLE DU CHATEAU
TEYSSIER
ID: 316 809 391, with its registered office Château Teyssier, Vignonet, 33330,
Saint Emilion, France
o CT Domaines SARL
ID: 507 402 386, with its registered office Château Teyssier, Vignonet, 33330,
Saint Emilion, France
J & T BANKA, a.s.
ID: 471 15 378, with its registered office at Pobřežní 297/14, 186 00 Praha 8, Czech Republic
In addition, this company controls:
- J&T Bank, a.o. (J&T Bank ZAO)
ID: 1027739121651, with its registered office at Kadashevskaya Embankment 26, Moscow,
Russian Federation In addition, this company controls:
o Interznanie OAO
ID: 1037700110414, with its registered office at Kadashevskaya Embankment 26,
115035 Moscow, Russian Federation, J&T Bank, a.o. has 50% share in this
company
o AKB “Khovanskiy”a.o.
ID: 1025000002411, with its registered office Pushkino, 141207 Pushkinskiy,
Pushkinskiy proezd 7, Russian Federation,
(since 4 October 2017)
- ATLANTIK finanční trhy, a.s.
ID: 262 18 062, with its registered office at Pobřežní 297/14, 186 00 Praha 8, Czech
Republic
- J&T banka d.d. (VABA d.d. banka Varaždin)
ID: 0675539, with its registered office at Aleja kralja Zvonimira 1, 42000, Varaždin,
Republic of Croatia
- J&T IB and Capital Markets, a.s.
ID: 247 66 259, with its registered office at Pobřežní 297/14, 186 00 Praha 8, Czech
Republic
In addition, this company controls:
o Skytoll CZ, s.r.o.
ID: 033 44 584, with its registered office at Pobřežní 297/14, 186 00 Praha 8,
Czech Republic
In addition, this company owns share in:
o XT-card a.s.
ID: 274 08 256, with its registered office at Seifertova 327/85, 130 00 Praha 3,
Czech Republic
J&T IB and Capital Markets, a.s. has 32% share in this company
o Smart software s.r.o.
ID: 252 92 498, with its registered office at Závodu míru 435/40, Stará role, 360
17 Karlovy Vary, Czech Republic,
J&T IB and Capital Markets, a.s. has 5% share in this company
- J&T INVESTIČNÍ SPOLEČNOST, a.s.
ID: 476 72 684, with its registered office at Pobřežní 297/14, 186 00 Praha 8, Czech
Republic
- J&T Leasingová společnost, a.s. (Health Care Financing, a.s.)
ID: 284 27 980, with its registered office Pobřežní 297/14, 186 00 Praha 8, Česká republika
(since 22 February 2017)
- TERCES MANAGEMENT LIMITED
ID: HE 201003, with its registered office at Akropoleos 59-61, SAVVIDES CENTER, 1st
Floor, Office 102, P.C. 2012, Nicosia, Cyprus
In addition, this company controls:
o Interznanie OAO
ID: 1037700110414, with its registered office at Kadashevskaya Embankment
26, 113035 Moscow, Russian Federation
PBI, a.s.
ID: 036 33 527, with its registered office at Sokolovská 394/17, Karlín, 186 00 Praha 8, Czech
Republic
In addition, this company controls:
- Poštová Banka, a.s.
ID: 31 340 890, with its registered office at Dvořákovo nábrežie 4, 811 02 Bratislava,
Slovak Republic, PBI, a.s. has 34% share in this company
Poštová Banka, a.s.
ID: 31 340 890, with its registered office at Dvořákovo nábrežie 4, 811 02 Bratislava, Slovak
Republic
J&T FINANCE GROUP SE has 64.46% share in this company
In addition, this company controls:
- Poštová poisťovna, a.s. (Poisťovňa Poštovej banky, a. s.)
ID: 31 405 410, with its registered office at Dvořákovo nábrežie 4, 811 02 Bratislava,
Slovak Republic
- Dôchodková správcovská spoločnosť Poštovej banky, d.s.s., a. s.
ID: 35 904 305, with its registered office at Dvořákovo nábrežie 4, 811 02 Bratislava,
Slovak Republic
- PRVÁ PENZIJNÁ SPRÁVCOVSKÁ SPOLOČNOSŤ POŠTOVEJ BANKY, správ.
spol., a. s.
ID: 31 621 317, with its registered office at Dvořákovo nábrežie 4, 811 02 Bratislava,
Slovak Republic
- PB Servis, a. s.
ID: 47 234 571, with its registered office at Karloveská 34, 841 04 Bratislava, Slovak
Republic
- PB PARTNER, a. s.
ID: 36 864 013, with its registered office at Dvořákovo nábrežie 4, 811 02 Bratislava,
Slovak Republic
- PB Finančné služby, a. s.
ID: 35 817 453, with its registered office at Hattalova 12, 831 03 Bratislava, Slovak
Republic
- PB IT, a. s. in liquidation
ID: 47 621 320, with its registered office at Dvořákovo nábrežie 4, 811 02 Bratislava,
Slovak Republic
(since 1 January 2017 in liquidation)
- SPPS, a. s.
ID: 46 552 723, with its registered office at Nám. SNP 35, 811 01 Bratislava, Slovak
Republic, Poštová Banka, a.s. has 40% share in this company.
Compact Property Fund, investiční fond s proměnným základním kapitálem, a.s.
ID: 034 51 488, with its registered office Na příkopě 393/11, Staré Město, 110 00 Prague 1,
Czech Republic,
(since 14 December 2017).
The Company owns 100% founders’ shares of the investment fund. The Company owns
45.71% allotment certificates indirectly through the company J & T BANKA, a.s. and further
54.29% allotment certificates through the company Poštová banka, a.s.
In addition, this company controls:
- FORESPO SOLISKO a. s.
ID: 47 232 935, with its registered office Karloveská 34, 841 04 Bratislava, Slovak
Republic
- FORESPO HELIOS 1 a. s.
ID: 47 234 032, with its registered office Karloveská 34, 841 04 Bratislava, Slovak
Republic
- FORESPO HELIOS 2 a. s.
ID: 47 234 024, with its registered office Karloveská 34, 841 04 Bratislava, Slovak
Republic
- FORESPO HOREC A SASANKA a. s.
ID: 47 232 994, with its registered office Karloveská 34, 841 04 Bratislava, Slovak
Republic
- FORESPO PÁLENICA a. s.
ID: 47 232 978, with its registered office Karloveská 34, 841 04 Bratislava, Slovak
Republic
- INVEST-GROUND a. s.
ID: 36 858 137, with its registered office Karloveská 34, 841 04 Bratislava, Slovak
Republic
- FORESPO - RENTAL 1 a.s.
ID: 36 782 653, with its registered office Karloveská 34, 841 04 Bratislava, Slovak
Republic
- FORESPO - RENTAL 2 a. s.
ID: 36 781 487, with its registered office Karloveská 34, 841 04 Bratislava, Slovak
Republic
- FORESPO BDS a.s.
ID: 272 09 938, with its registered office Janáčkovo nábřeží 478/39, Smíchov, 150 00
Prague 5, Czech Republic
- Devel Passage s. r. o.
ID: 43 853 765, with its registered office Karloveská 34, 841 04 Bratislava, Slovak
Republic
- FORESPO DUNAJ 6 a. s.
ID: 47 235 608, with its registered office Karloveská 34, 841 04 Bratislava, Slovak
Republic
NOVA Hotels otevřený podílový fond REDSIDE investiční společnost, a.s.
ID: 242 44 601, with its registered office V Celnici 1031/4, Staré Město, 110 00 Prague 1,
Czech Republic,
(since 31 December 2017).
The Company owns 48.35% allotment certificates indirectly through the company J & T
BANKA, a.s. and further 51.65% allotment certificates through the company Poštová banka,
a.s.
In addition, this company controls:
- DIAMOND HOTELS SLOVAKIA, s.r.o.
ID: 35 838 833, with its registered office Hodžovo nám.2, 816 25 Bratislava, Slovak
Republic
- BHP Tatry s. r. o.
ID: 45 948 879, with its registered office Dvořákovo nábrežie 6, 811 02 Bratislava,
Slovak Republic
J&T REALITY otevřený podílový fond, J&T INVESTIČNÍ SPOLEČNOST, a.s.
ID: 476 72 684, with its registered office Pobřežní 297/14, 186 00 Prague 8, Czech Republic.
The Company owns 53.08% allotment certificates indirectly through the company J & T
BANKA, a.s. and further 36.36% allotment certificates through the company Poštová banka,
a.s.
1.3
The Board of Directors of the Company is aware that during the accounting period the
Company was controlled by the same entities as the following other controlled entities, which,
however, were no longer related parties as at 31 December 2017.
DANILLA EQUITY LIMITED
ID: HE 297027, with its registered office Akropoleos, 59-61 SAVVIDES CENTER, 1st Floor,
Office 102, P.C. 2012, Nicosia, Cyprus
(till 28 April 2017)
J&T Concierge, s.r.o.
ID: 281 89 825, with its registered office at Pobřežní 297/14, 186 00 Praha 8, Czech Republic
(dissolved by merger with J&T SERVICES ČR, a.s. as at 1 July 2017)
PGJT B.V.
ID: 57522006, with its registered office at Martinus Nijhofflaan 2, 2624 Delft, Kingdom of the
Netherlands, J & T BANKA, a.s. has 50% share in this company
(till 3 July 2017)
PROFIREAL OOO
ID: 17003675, with its registered office at Office 501, 4 Grivtsova Pereulok, 190000 Saint-
Petersburg, Russian Federation
(till 3 July 2017)
Together with the Company, the above mentioned parties are in this report further referred to as
„related parties“.
1.4
The role of the Company
The Company acts as a holding company with shares in other legal entities.
1.5
Manner and means of control
The controlling entities control the Company by holding Company's shares of 90.1 % of the voting
rights. Therefore, the exercise of the voting rights is the principal means of control. In the
accounting period from 1 January 2017 to 31 December 2017, no particular contracts between the
controlling entities and the Company in respect of manner and means of control.
II.
Summary of acts made in the accounting period of 2015 which were made at the instigation or
in the interest of the controlling entity or the entities controlled by the controlling entity if
these acts concerned assets the value of which exceeds 10% of the controlled entity’s equity
identified from the last financial statements.
In the accounting period, the Company performed no acts at the instigation or in the interest of the
controlling entity or the entities controlled by the controlling entity in respect of assets the value of
which exceeds 10% of Company's equity.
III.
Summary of contracts entered into between the controlled entity and the controlling entity or
between controlled entities.
In the accounting period 2017, the following contracts were entered into between the Company and
the controlling entity or between the entities controlled by the same controlling entities:
Contracts between the Company and Jozef Tkáč:
Performance contract
Scope: chairman of the Board of Directors
Contracts between the Company and Ivan Jakabovič:
Performance contract
Scope: vice chairman of the Board of Directors
Contracts between the Company and J & T BANKA, a.s.:
Guarantee Agreement
Scope: performance of guarantees of a certain minimum value of the client's portfolio yield
Contract on the provision of warranty
Scope: providing warranty to selected bank's clients
Contract on sharing the liability
Scope: sharing the potential liability arising from a Purchase agreement with the original
assignees of the subordinated debt
Contract on the business lease of movable property
Scope: inventory lease

Contract on the lease of movable property and financial settlement
Scope: inventory lease in the building at Dvořákovo nábrežie 8, Bratislava
Contract on cooperation in the provision of J&T Family and Friends banking services and
participation in the Magnus loyalty programme
Scope: provision of J&T Family and Friends and Magnus loyalty system programme
Contract on financial settlement
Scope: settlement of receivables and liabilities resulting from value added tax as they are
members of one VAT group
Contract on mediation
Scope: concluding contracts with potential clients
Cost allocation contract
Scope: cost distribution in relation to the entry of the strategic investor
Contract on the lease of movable property and financial settlement
Scope: inventory lease in the building River Park, Bratislava
Agreement on cost distribution
Scope: distribution of cost of consolidation package audit
Contract on the provision of services
Scope: provision of services related to debt securities
Framework agreement on trading on the financial market
Scope: negotiation of currency derivative transactions
Agreement on deposit of securities
Scope: ensuring deposit of securities
Contract on the provision of services
Scope: maintenance of current account in accordance with bank's Terms and Conditions
Contract on the provision of services:
Scope: issue of debit cards in accordance with bank's Terms and Conditions
Contract on the lease of a safe deposit boxes
Scope: lease of a safe deposit box in accordance with bank's Terms and Conditions
Contract on the provision of services
Scope: fixed term transactions with currency instruments in accordance with bank's Terms
and Conditions
Contract on the provision of Internet banking services
Scope: provision of Internet banking services
Contract with the administrator and Special arrangement to the contract with the
administrator
Scope: the perpetuity issue
Contract on subordination
Scope: subordination of relations with a related party
Overdraft contract
Scope: lending Company's funds
Contract on Sharing Promotion Costs
Scope: sharing the costs of promoting the J&T financial group within the FED CUP 2017
Contracts between the Company and J&T SERVICES ČR, a.s.:
Contract of mandate on the provision of expert tax assistance and advisory
Scope: tax advisory services

Contract on personal data processing
Scope: personal data processing in HR and payroll
Contract on the provision of professional assistance
Scope: personnel and payroll administration
Contract on the provision of services (outsourcing)
Scope: preparation of consolidated financial statements under IFRS for selected consolidated
entities
Contract on the provision of services - OLAS
Scope: provision of logistics services
Contract on the lease of non-residential premises
Scope: lease of non-residential premises
Contract on the provision of services
Scope: provision of services - KIS application
Contract on the provision of professional assistance
Scope: bookkeeping
Contract on the provision of administration assistance
Scope: administration
Contract on the lease of movable assets
Scope: lease of movable assets
Contract on the lease of motor vehicle
Scope: lease of a vehicle
Contract on the provision of services Legal Managements
Scope: Legal Management services
Contract on the lease of motor vehicle
Scope: lease of a vehicle
Contracts between the Company and J&T SERVICES SR, s.r.o.:
Contract of mandate on the provision of professional assistance and agency contract
Scope: provision of all acts necessary to ensure Company's existence
Contract on the lease of movable assets and financial settlement
Scope: office space
Contracts between the Company and Equity Holding, a.s.:
Loan agreement
Scope: lending Company's funds
Contracts between the Company and DANILLA EQUITY LIMITED:
Contract on the claim assignments
Scope: assignment of a related party claims
Loan agreement
Scope: lending Company's funds to a related party
Contracts between the Company and J&T MINORITIES PORTFOLIO LIMITED:
Loan agreement
Scope: lending funds to a related party
Contracts between the Company and J&T INTEGRIS GROUP LIMITED:
Contract on debt assignment
Scope: lending Company's funds
Contracts between the Company and J&T Global Finance V., s.r.o.:
Loan agreement
Scope: lending Company's funds
Contract on provision of guarantee
Scope: provision of guarantee to a related party
Contracts between the Company and J&T Global Finance VI., s.r.o.:
Loan agreement
Scope: lending Company's funds
Contract on provision of guarantee
Scope: provision of guarantee to a related party
Contracts between the Company and J&T Global Finance VII., s.r.o.:
Loan agreement
Scope: lending Company's funds
Contract on provision of guarantee
Scope: provision of guarantee to a related party
Contracts between the Company and J&T Global Finance VIII., s.r.o.:
Loan agreement
Scope: lending Company's funds
Contract on provision of guarantee
Scope: provision of guarantee to a related party
Contracts between the Company and J&T Mezzanine, a.s.:
Loan agreement
Scope: lending Company's funds
Contracts between the Company and J&T Wine Holding SE:
Loan agreement
Scope: lending Company's funds
Contracts between the Company and Poštová Banka, a.s.:
Overdraft contract
Scope: lending Company's funds

Report of the Board of Directors of J&T FINANCE GROUP SE on business activities of
the Company and the balance of its assets for the period from 1 January 2017 to 31
December 2017
This report has been prepared by the Board of Directors of J&T FINANCE GROUP SE, with its
registered office at Pobřežní 297/14, 186 00 Praha 8, ID: 275 92 502, registered in the Commercial
Register maintained by the Metropolitan Court in Prague, section H, insert 1317 („the Company“), in
accordance with Section 436 of Act No. 90/2012 Coll., on Commercial Companies and Cooperatives
(„The Act on Business Corporation”)
I.
The composition of Company's statutory bodies in the period from 1 January 2017 to 31
December 2017 was as follows:
Board of Directors of the Company:
Chairman of the Board of Directors: Jozef Tkáč
Vice-chairman of the Board of Directors: Patrik Tkáč
Vice-chairman of the Board of Directors: Ivan Jakabovič
Vice-chairman of the Board of Directors: Dušan Palcr
Member of the Board of Directors: Gabriela Lachoutová
Supervisory Board of the Company:
Chairman of the Supervisory Board: Marta Tkáčová
Member of the Supervisory Board: Ivan Jakabovič
Member of the Supervisory Board: Jana Šuterová
II.
Business activities of the Company and the balance of its assets
The nature of the Company's business activities has not changed compared to the previous accounting
period. The Company administers its assets and enlarges its volume.
During the period from 1 January 2017 to 31 December 2017, the Company continued to hold and
administer own assets, consisting of
100% share in the companies:
J & T BANKA, a.s.,
ID: 471 15 378, with its registered office at Pobřežní 297/14, 186 00 Praha 8, Czech Republic,
registered in the Commercial Register maintained by the Metropolitan Court in Prague, section B,
insert 1731,
J&T Bank Switzerland Ltd. in liquidation,
ID: CH02030069721, with its registered office at Talacker 50, 12th Floor, P.C. 8001 Zürich,
Swiss Confederation,
J&T Concierge, s.r.o.,
ID: 281 89 825, with its registered office at Pobřežní 297/14, 186 00 Praha 8, Czech Republic
registered in the Commercial Register maintained by the Metropolitan Court in Prague, section C,
insert 131691, (the company was dissolved by merger with J&T SERVICES ČR, a.s. as at 30
June 2017)
J & T INTEGRIS GROUP LIMITED,
ID: HE 207436, with its registered office at Kyriakou Matsi 11, NIKIS CENTER, 3rd Floor, office
301, Nicosia, Cyprus,
J&T Mezzanine, a.s.
ID: 066 05 991, with its registered office at Pobřežní 297/14, 186 00 Praha 8, Czech Republic,
registered in the Commercial Register maintained by the Metropolitan Court in Prague, section B,
insert 23005, (the company was established on 15 November 2017)
J&T SERVICES ČR, a.s.,
ID: 281 68 305, with its registered office at Pobřežní 297/14, 186 00 Praha 8, Czech Republic,
registered in the Commercial Register maintained by the Metropolitan Court in Prague, section B,
insert 12445,
J&T Wineholding SE,
ID: 063 77 149, with its registered office at Pobřežní 297/14, 186 00 Praha 8, Czech Republic,
registered in the Commercial Register maintained by the Metropolitan Court in Prague, section H,
insert 2007, (the company was established on 26 August 2017)
PBI, a.s.
ID: 036 33 527, with its registered office at Pobřežní 297/14, 186 00 Praha 8, Czech Republic,
registered in the Commercial Register maintained by the Metropolitan Court in Prague, section B,
insert 20280, (100% share in the company was acquired on 11 December 2017)
Compact Property Fund, investiční fond s proměnným základním kapitálem, a.s.
ID: 034 51 488, with its registered office at Na příkopě 393/11, Staré Město, 110 00 Praha 1,
Czech Republic, registered in the Commercial Register maintained by the Metropolitan Court in
Prague, section B, insert 20065, (100% share in the company was acquired on 31 December
2017)
64.46% share in the company:
Poštová banka, a.s.,
ID: 31 340 890, with its registered office at Dvořákovo nábrežie 4, 811 02 Bratislava, Slovak
Republic, registered in the Commercial Register maintained by the District Court in Bratislava I,
section Sa, insert 501/B.
The Company has a long history as a strong and stable institution. As at 31 December 2017, the
Company recorded assets of CZK 54.8 billion, equity of CZK 31.2 billion and the registered capital of
CZK 15.8 billion. In the accounting period, the Company achieved profit of CZK 2.2 billion.
The balance of Company's assets and its financial position is disclosed in the financial statements as at
31 December 2017, which are attached as an independent appendix to the annual report. Detailed
information on the balance of Company's assets is included in the financial section of the Company's
annual report.
III.
Major decisions of Company's bodies
As at 1 January 2016, the Group held share capital amounting to CZK 17,740,750,488. The
Company’s shareholders were Jozef Tkáč with a 45.57% share, Ivan Jakabovič with a 45.47% share,
CEFC Shanghai International Group Limited with a 4.75% share and the CEFC Hainan International
Holdings Co. Ltd with a 4.07% share.