Embed Size (px)
Citation preview

Global Forest Resources Assessment 2015Country Report Jamaica
Rome, 2014
Jamaica

FAO, at the request of its member countries, regularly monitors the world´s forests and theirmanagement and uses through the Global Forest Resources Assessment (FRA). This country reportis prepared as a contribution to the FAO publication, the Global Forest Resources Assessment 2015(FRA 2015).The content and the structure are in accordance with the recommendations and guidelines given byFAO in the document Guide for country reporting for FRA 2015 (http://www.fao.org/3/a-au190e.pdf).These reports were submitted to FAO as official government documents.
The content and the views expressed in this report are the responsibility of the entity submitting thereport to FAO. FAO may not be held responsible for the use which may be made of the informationcontained in this report.
FRA 2015 – Country Report, Jamaica
3
TABLE OF CONTENTSReport preparation and contact persons...............................................................................................................................41. What is the area of forest and other wooded land and how has it changed over time? ................................................. 52. What is the area of natural and planted forest and how has it changed over time? ..................................................... 153. What are the stocks and growth rates of the forests and how have they changed? .....................................................214. What is the status of forest production and how has it changed over time? .................................................................565. How much forest area is managed for protection of soil and water and ecosystem services? ..................................... 696. How much forest area is protected and designated for the conservation of biodiversity and how has it changed overtime? ................................................................................................................................................................................... 747. What is the area of forest affected by woody invasive species? .................................................................................. 778. How much forest area is damaged each year? ............................................................................................................ 809. What is the forest area with reduced canopy cover? ....................................................................................................8610. What forest policy and regulatory framework exists to support implementation of sustainable forest managementSFM? .................................................................................................................................................................................. 8711. Is there a national platform that promotes stakeholder participation in forest policy development? ............................ 8912. What is the forest area intended to be in permanent forest land use and how has it changed over time? .................. 9013. How does your country measure and report progress towards SFM at the national level? ........................................ 9314. What is the area of forest under a forest management plan and how is this monitored? ........................................... 9615. How are stakeholders involved in the management decision making for publicly owned forests? .............................. 9816. What is the area of forest under an independently verified forest certification scheme? ...........................................10017. How much money do governments collect from and spend on forests? ...................................................................10218. Who owns and manages the forests and how has this changed? ............................................................................10419. How many people are directly employed in forestry? ............................................................................................... 11220. What is the contribution of forestry to Gross Domestic Product (GDP)? ...................................................................11521. What is forest area likely to be in the future ............................................................................................................. 116

FRA 2015 – Country Report, Jamaica
4
Report preparation and contact personsContact personsThe present report was prepared by the following person(s)
Name (FAMILYNAME, first name) Institution/address Email Tables
Upton Edwards Forestry Department, 173Constant Spring Road,Kingston 8, Jamaica
[email protected] 1-21
Donna Lowe Forestry Department 173Constant Spring Road Kingston8 Jamaica West Indies
[email protected] 1-21
N/A N/A N/A N/A
N/A N/A N/A N/A
Introductory TextPlace an introductory text on the content of this report
This report was prepared for the FAO -FRA 2015 by the Forestry Department of Jamaica. Time series dataused cover the period 1989 to 1998 using LANDSAT TM images. External data were also provided by theFRA team.
Desk Study?
Check "yes" if this survey is a Desk Study, "no" otherwise
Desk Study? no
FRA 2015 – Country Report, Jamaica
5
1. What is the area of forest and other wooded land and how has it changed over time?Documents for this question:
• Guide for country reporting FRA 2015• FRA 2015 Terms and Definitions
1.1 Categories and definitions
Category Definition
Forest Land spanning more than 0.5 hectares with trees higher than 5 meters and a canopy cover of more than10 percent or trees able to reach these thresholds in situ. It does not include land that is predominantlyunder agricultural or urban land use.
Other wooded land Land not classified as "Forest" spanning more than 0.5 hectares with trees higher than 5 meters anda canopy cover of 5-10 percent or trees able to reach these thresholds ; or with a combined coverof shrubs bushes and trees above 10 percent. It does not include land that is predominantly underagricultural or urban land use.
Other land All land that is not classified as "Forest" or "Other wooded land".
...of which with tree cover(sub-category)
Land considered as "Other land", that is predominantly agricultural or urban lands use and has patchesof tree cover that span more than 0.5 hectares with a canopy cover of more than 10 percent of trees ableto reach a height of 5 meters at maturity. It includes bothe forest and non-forest tree species.
Inland water bodies Inland water bodies generally include major rivers, lakes and water reservoirs.
Forest expansion Expansion of forest on land that, until then, was not defined as forest.
...of which afforestation(sub-category)
Establishment of forest through planting and/or deliberate seeding on land that, until then, was notdefined as forest.
...of which naturalexpansion of forest (sub-category)
Expansion of forests through natural succession on land that, until then, was under another land use(e.g. forest succession on land previously used for agriculture).
Deforestation The conversion of forest to other land use or the longterm reduction of the tree canopy cover below theminimum 10 percent threshold.
...of which humaninduced (sub-category)
Human induced conversion of forest to other land use or the permanent reduction of the tree canopycover below the minimum 10 percent threshold.
Reforestation Natural regeneration or re-establishment of forest through planting and/or deliberate seeding on landalready in forest land use.
...of which artificialreforestation (sub-category)
Re-establishment of forest through planting and/or deliberate seeding on land already in forest land use.
1.2 National data1.2.1 Data sources
References to sourcesof information Variables Years Additional comments

FRA 2015 – Country Report, Jamaica
6
1 Evelyn O. B and CamirandR., 2003. Forestry cover anddeforestation in Jamaica:an analysis of forest coverand estimates over time.Jamaica. InternationalForestry Review, 5(4), 2003,pp. 354-363 (Table 6)
Forest cover, forest typeclassification, land use/coverchange
1989 and 1998 Analysis of forest coverchange over period 1989to 1998 using LANDSATTM images, aerial photosand field checks. Online atwww.forestry.gov.jm
2 Annual Reports (ForestryDepartment)
N/A N/A N/A
3 N/A N/A N/A N/A
4 N/A N/A N/A N/A
1.2.2 Classification and definitions
National class Definition
Bamboo Bambusa vulgaris (bamboo brakes) on the lower shale hills(disturbed forest)
Mangrove Edaphic forest (areas with brackish water) composed of treeswith stilt roots or pneumatopores, species indicators such asRhizophora mangle (red mangrove)
Closed broadleaf Closed primary forest with broadleaf trees at least 5 m tall andcrown interlocking, with minimal human disturbance
Disturbed broadleaf Disturbed broadleaf forest with trees at least 5 m tall and species-indicators of disturbance such as Ceropia peltata (trumpet tree)
Short open dry Open scrub, shrub, bush or brushland with trees or shrubs1-5 m tall and crowns not in contact, in drier parts of Jamaicawith species-indicators such as Prosopis juliflora (cashaw) orStenocereus hystrix (columnar cactus)
Swamp Edaphic forest (soil waterlogging) with a single tree storey withspecies-indicators such as Symphonia globulifera (hog plum) andRoystonea princeps (royal palm)
Tall open dry Open natural woodland or forest with trees at least 5 m tall andcrown not in contact, in drier parts of Jamaica with species-indicators such as Bursera simaruba (red birch)
Bamboo and fields 50% bamboo; >25% fields" /> >50% bamboo; >25% fields
Bamboo and Disturbed broadleaf forest 50% bamboo; > 25% Disturbed broadleaf forest" /> >50%bamboo; > 25% Disturbed broadleaf forest
Bauxite extraction and Disturbed broadleaf forest 50% bauxite extraction; >25% Disturbed broadleaf forest" />>50% bauxite extraction; >25% Disturbed broadleaf forest
Fields and Disturbed broadleaf forest 50% fields; >25% Disturbed broadleaf forest" /> >50% fields;>25% Disturbed broadleaf forest
Fields or Disturbed broadleaf forest and Pine plantation 50% fields or Disturbed broadleaf forest; >25% Pine plantation" /> >50% fields or Disturbed broadleaf forest; >25% Pineplantation

FRA 2015 – Country Report, Jamaica
7
Disturbed broadleaf forest and fields 50% Disturbed broadleaf forest; >25% fields" /> >50%Disturbed broadleaf forest; >25% fields
Buildings and other infrastructure Buildings and other constructed features such as airstrips,quarries, etc.
Bauxite extraction Surface mining/bauxite
Bare rock Bare sand/rock
Fields Herbaceous crops, fallow, cultivated grass/legumes
Herbaceous wetlands Edaphic vegetation (soil waterlogging) with herbaceous plants
Plantations Tree crops, shrub crops like sugar cane, bananas, citrus andcoconuts
Water bodies Lakes, rivers
Small islands Mostly sand/limestone, unvegetated small islands (cays)
Water bodies Lakes, rivers
Small islands Mostly sand/limestone, unvegetated small islands (cays)
1.2.3 Original data
Land use/cover change in Jamaica (1989-1998)
National classes 1989
‘000 ha
1998
‘000 ha
Forests land use
Bamboo 2.8 3.0
Mangrove 9.8 9.7
Closed broadleaf 88.7 88.2
Disturbed broadleaf 177.2 174.8
Short open dry 12.1 12.1
Swamp 2.4 2.2
Tall open dry 42.1 42.0
FRA 2015 – Country Report, Jamaica
8
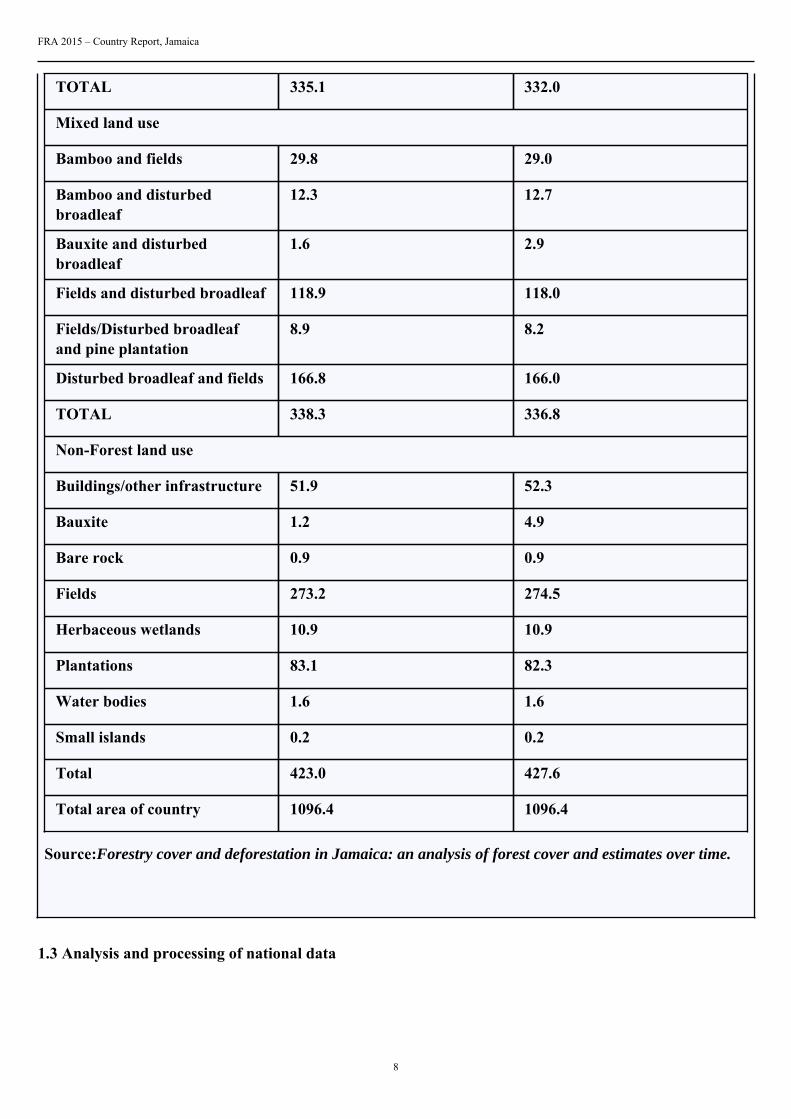
TOTAL 335.1 332.0
Mixed land use
Bamboo and fields 29.8 29.0
Bamboo and disturbedbroadleaf
12.3 12.7
Bauxite and disturbedbroadleaf
1.6 2.9
Fields and disturbed broadleaf 118.9 118.0
Fields/Disturbed broadleafand pine plantation
8.9 8.2
Disturbed broadleaf and fields 166.8 166.0
TOTAL 338.3 336.8
Non-Forest land use
Buildings/other infrastructure 51.9 52.3
Bauxite 1.2 4.9
Bare rock 0.9 0.9
Fields 273.2 274.5
Herbaceous wetlands 10.9 10.9
Plantations 83.1 82.3
Water bodies 1.6 1.6
Small islands 0.2 0.2
Total 423.0 427.6
Total area of country 1096.4 1096.4
Source:Forestry cover and deforestation in Jamaica: an analysis of forest cover and estimates over time.
1.3 Analysis and processing of national data

FRA 2015 – Country Report, Jamaica
9
1.3.1 Adjustment
Source Total land area (1000 hectares)
National data 1096.4
FAOSTAT 1099
Calibration factor = (1099/1096) = 1.002371397
1.3.2 Estimation and forecasting
Nationalclasses
1989
‘000 ha a
1998
‘000 ha b
1990¹
‘000 ha c
2000¹
‘000 ha d
2005¹
‘000 ha e
2010¹
‘000 ha f
Forests land use
Bamboo 2.8 3.0 2.8 3.0 3.1 3.3
Mangrove 9.8 9.7 9.8 9.7 9.6 9.6
Closedbroadleaf
88.7 88.2 88.9 88.3 88.0 87.7
Disturbedbroadleaf
177.2 174.8 177.3 174.7 173.3 172.0
Short opendry
12.1 12.1 12.1 12.1 12.1 12.1
Swamp 2.4 2.2 2.4 2.2 2.0 1.9
Tall opendry
42.1 42.0 42.2 42.1 42.0 42.0
Total 335.1 332.0 335.5 332.1 330.1 328.6
Mixed land use
Bambooand fields
29.8 29.0 29.8 28.9 28.4 28.0

FRA 2015 – Country Report, Jamaica
10
Bambooanddisturbedbroadleaf
12.3 12.7 12.4 12.8 13.0 13.3
Bauxite anddisturbedbroadleaf
1.6 2.9 1.7 3.2 3.9 4.6
Fields anddisturbedbroadleaf
118.9 118.0 119.1 118.0 117.5 117.1
Fields/Disturbedbroadleafand pineplantation
8.9 8.2 8.9 8.2 8.2 7.3
Disturbedbroadleafand fields
166.8 166.0 167.1 166.2 165.7 165.3
Total 338.3 336.8 339.0 337.3 336.7 335.6
Non-Forest Land Use
Non-Forestland use
407.0 411.6 408.5 413.6 416.2 418.7
Water 16.0 16.0 16.0 16.0 16.0 16.0
Total 423.0 427.6 424.5 429.6 432.2 434.8
GrandTotal
1096.4 1096.4 1099.0 1099.0 1099.0 1099.0
The class fields/disturbed broadleaf and pine plantation comprises pine and hardwood plantations
ha a = original data for year 1989
ha b = original data for year 1998
ha c = ha a + (ha b -ha a )/9 * calibration factor
ha d = (ha b + (ha b -ha a )/9 * 2) * calibration factor
ha e = (ha b + (ha b -ha a )/9 * 7) * calibration factor
ha f = (ha b + (ha b -ha a )/9 * 12) * calibration factor
FRA 2015 – Country Report, Jamaica
11
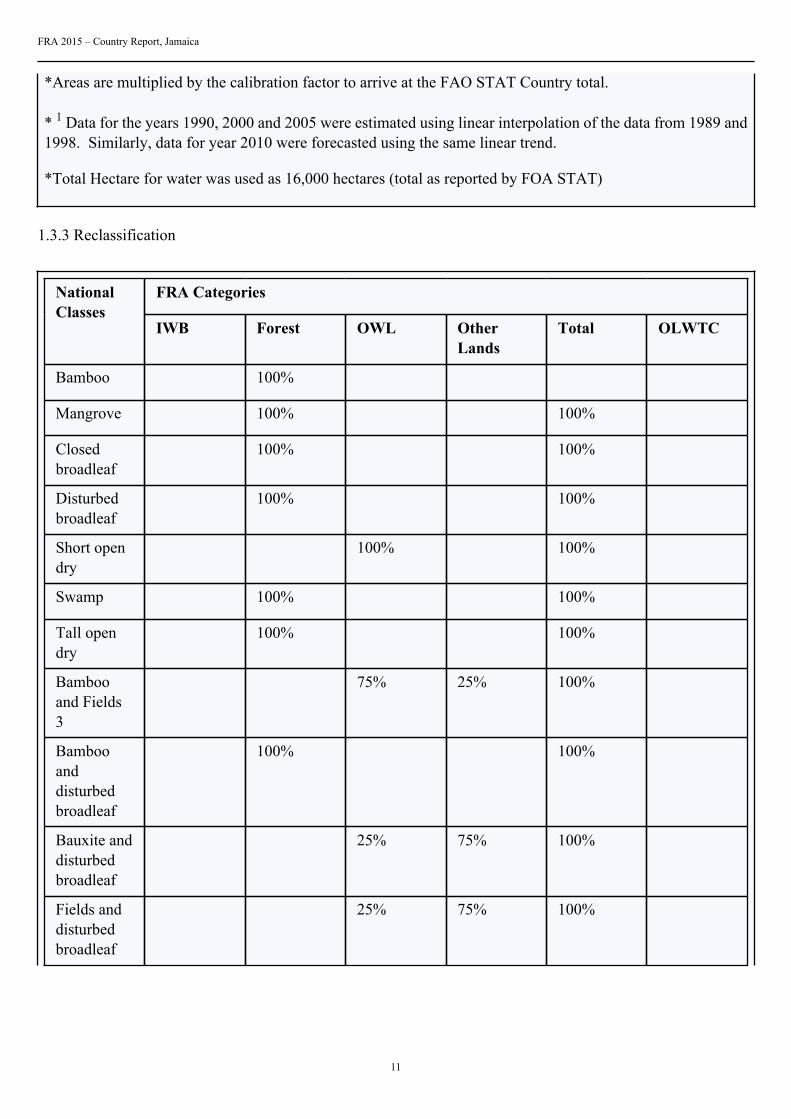
*Areas are multiplied by the calibration factor to arrive at the FAO STAT Country total.
* 1 Data for the years 1990, 2000 and 2005 were estimated using linear interpolation of the data from 1989 and1998. Similarly, data for year 2010 were forecasted using the same linear trend.
*Total Hectare for water was used as 16,000 hectares (total as reported by FOA STAT)
1.3.3 Reclassification
FRA CategoriesNationalClasses
IWB Forest OWL OtherLands
Total OLWTC
Bamboo 100%
Mangrove 100% 100%
Closedbroadleaf
100% 100%
Disturbedbroadleaf
100% 100%
Short opendry
100% 100%
Swamp 100% 100%
Tall opendry
100% 100%
Bambooand Fields3
75% 25% 100%
Bambooanddisturbedbroadleaf
100% 100%
Bauxite anddisturbedbroadleaf
25% 75% 100%
Fields anddisturbedbroadleaf
25% 75% 100%
FRA 2015 – Country Report, Jamaica
12
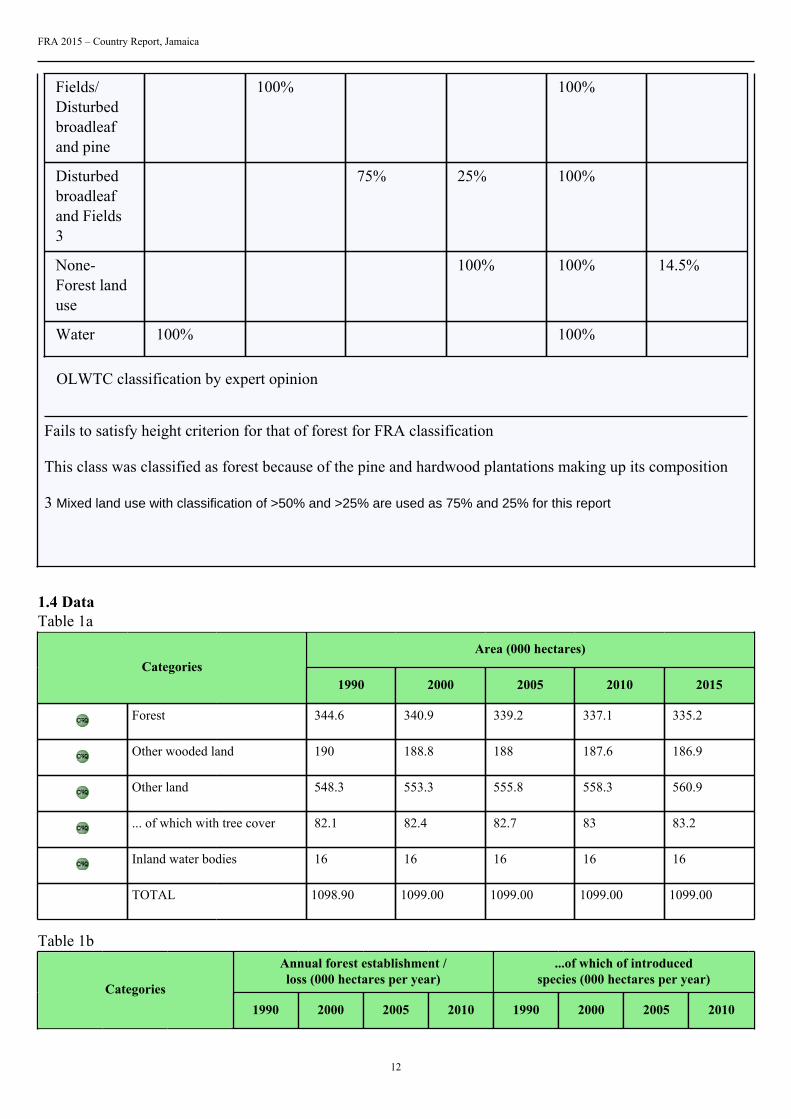
Fields/Disturbedbroadleafand pine
100% 100%
Disturbedbroadleafand Fields3
75% 25% 100%
None-Forest landuse
100% 100% 14.5%
Water 100% 100%
OLWTC classification by expert opinion
Fails to satisfy height criterion for that of forest for FRA classification
This class was classified as forest because of the pine and hardwood plantations making up its composition
3 Mixed land use with classification of >50% and >25% are used as 75% and 25% for this report
1.4 DataTable 1a
Area (000 hectares)Categories
1990 2000 2005 2010 2015
Forest 344.6 340.9 339.2 337.1 335.2
Other wooded land 190 188.8 188 187.6 186.9
Other land 548.3 553.3 555.8 558.3 560.9
... of which with tree cover 82.1 82.4 82.7 83 83.2
Inland water bodies 16 16 16 16 16
TOTAL 1098.90 1099.00 1099.00 1099.00 1099.00
Table 1bAnnual forest establishment /loss (000 hectares per year)
...of which of introducedspecies (000 hectares per year)
Categories1990 2000 2005 2010 1990 2000 2005 2010

FRA 2015 – Country Report, Jamaica
13
Forest expansion 0.239 0.327 0.269 0.318 0.178 0.267 0.207 0.256
... of which afforestation 0.178 0.265 0.207 0.256 0.178 0.267 0.207 0.256
... of which naturalexpansion of forest
0.062 0.062 0.062 0.062 0 0 0 0
Deforestation 0.437 0.437 0.437 0.437 0.083 0.083 0.083 0.083
... of which human induced 0.437 0.437 0.437 0.437 0.083 0.083 0.083 0.083
Reforestation 0.08 0.07 0.06 0.06 0.08 0.07 0.06 0.06
... of which artificial 0.08 0.07 0.06 0.06 0.08 0.07 0.06 0.06
Tiers
Category Tier for status Tier for reported trend
Forest Tier 2 Tier 2
Other wooded land Tier 2 Tier 2
Forest expansion Tier 2 Tier 2
Deforestation Tier 2 Tier 2
Reforestation Tier 2 Tier 2
Tier criteria
Category Tier for status Tier for reported trend
• Forest• Other wooded land• Afforestation• Reforestation• Natural expansion of forest• Deforestation
Tier 3 : Data sources: Either recent(less than 10 years ago) National ForestInventory or remote sensing, with groundtruthing, or programme for repeatedcompatible NFIs Tier 2 : Data sources:Full cover mapping / remote sensing orold NFI (more than 10 years ago) Tier 1 :Other
Tier 3 : Estimate based on repeatedcompatible tiers 3 (tier for status) Tier 2 :Estimate based on repeated compatible tier2 or combination tier 3 and 2 or 1 (tier forstatus) Tier 1 : Other
1.5 Comments
Category Comments related todata definitions etc Comments on the reported trends
Forest Fields/Disturbed broadleaf and pine isclassified as forest because of the pineand hardwood plantations making up itscomposition
Using the 1989 and the 1998 land-usedate, the areas for the reported years arethen extrapolated.

FRA 2015 – Country Report, Jamaica
14
Other wooded land The mixed areas are placed in otherwooded lands instead of forest becauseit is not sure that these areas fit the 10%crown cover criterion. In the past theseareas were classified as other woodedlands because they did not fit the 1967FAO's forest definition of "more than 20%crown cover". Because the analysis wasdone using Landsat TM a more detailedanalysis would have to be done, possiblyusing aerial photographs, in order toextract the areas that fit the 2001/2005definition of more than 10% crowncover. Short open dry type fails to satisfyheight criterion for that of forest for FRAclassification
N/A
Other land N/A N/A
Other land with tree cover This category include plantations such asbanana, citrus, coconut etc
N/A
Inland water bodies FAOSTAT figure of 16 000 ha is used forthe report although discrepancy exists withthe inventory figure of 1 600 ha for inlandwater bodies
N/A
Forest expansion Data taken from various reports at theForestry Department (annual, regional andzonal) showing plantation establishmenton areas previously not classified as forestalong with areas showing land use changefrom non forest to forest through naturalmeans
N/A
Deforestation Established through reference source #1.Mainly man made activities for farming,housing, mining and infrastructureestablishments
N/A
Reforestation Areas previously planted and harvestedare replanted. This area is minimal inacreage
N/A
Other general comments to the table
The disturbed areas were considered as other wooded land. If these areas were considered as forest, the area of forest on the islandmay show an increase when in fact there is no increase. This may put us back into the confused situation Jamaica was in the 1990swhen FAO reported a significant decrease in forest. As it is now, there is clarification and consistency between the reports overthe years, facilitating comparison and analysis. There is a discrepancy between the area of water reported by FAO STAT and thatreported by the Statistical Institute of Jamaica (STATIN). FAOSTAT is reporting 16, 000 ha while the official figure by STATINis 1,600 ha. The area reported by FAOSTAT. is used for this exercise. Efforts will be made to correct the discrepancy between datasource and FAOSTAT
FRA 2015 – Country Report, Jamaica
15
2. What is the area of natural and planted forest and how has it changed over time?Documents for this question:
• Guide for country reporting FRA 2015• FRA 2015 Terms and Definitions
2.1 Categories and definitions
Term Definition
Naturally regeneratedforest
Forest predominantly composed of trees established through natural regeneration.
Naturalized introducedspecies
Other naturally regenerated forest where the tree species are predominantly non-native and do not needhuman help to reproduce/maintain populations over time.
Introduced species A species, subspecies or lower taxon occurring outside its natural range (past or present) and dispersalpotential (i.e. outside the range it occupies naturally or could occupy without direct or indirectintroduction or care by humans).
Category Definition
Primary forest Naturally regenerated forest of native species where there are no clearly visible indications of humanactivities and the ecological processes are not significantly disturbed.
Other naturallyregenerated forest
Naturally regenerated forest where there are clearly visible indications of human activities.
...of which of introducedspecies (sub-category)
Other naturally regenerated forest where the trees are predominantly of introduced species.
...of which naturalized(sub-sub category)
Other naturally regenerated forest where the trees are predominantly of naturalized introduced species.
Planted forest Forest predominantly composed of trees established through planting and/or deliberate seeding.
...of which of introducedspecies (sub-category)
Planted forest where the planted/seeded trees are predominantly of introduced species.
Mangroves Area of forest and other wooded land with mangrove vegetation.
...of which planted (sub-category)
Mangroves predominantly composed of trees established through planting.
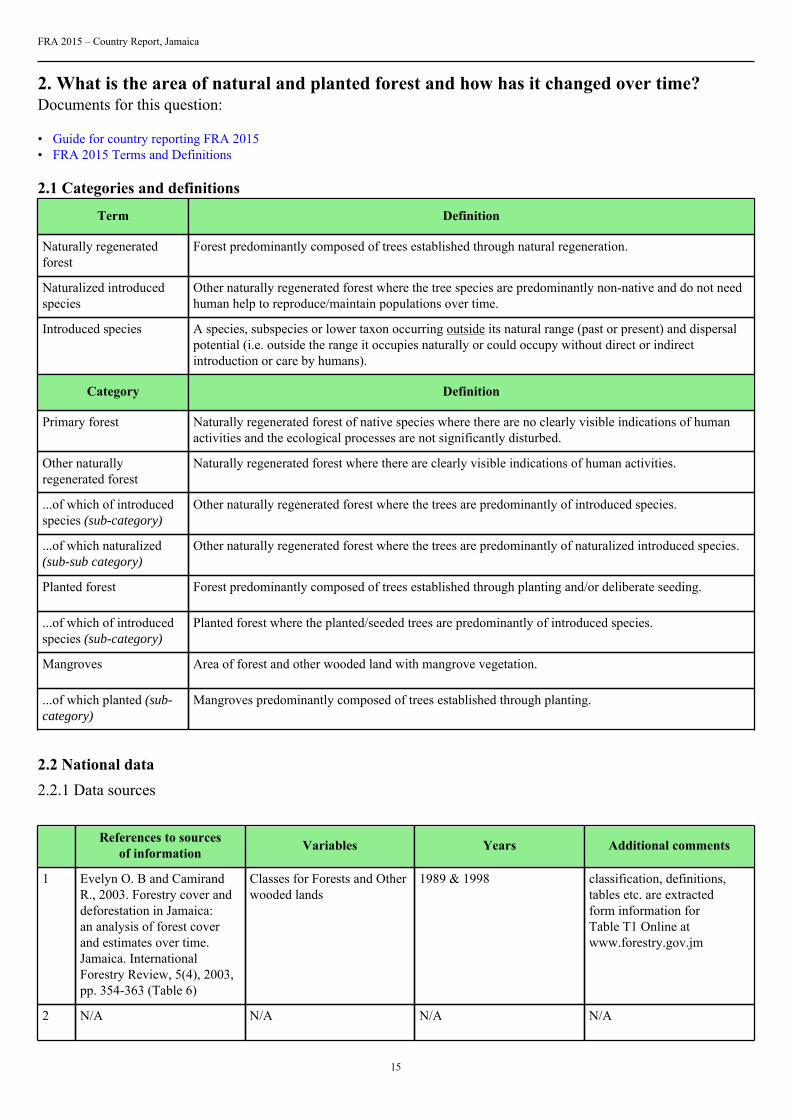
2.2 National data2.2.1 Data sources
References to sourcesof information Variables Years Additional comments
1 Evelyn O. B and CamirandR., 2003. Forestry cover anddeforestation in Jamaica:an analysis of forest coverand estimates over time.Jamaica. InternationalForestry Review, 5(4), 2003,pp. 354-363 (Table 6)
Classes for Forests and Otherwooded lands
1989 & 1998 classification, definitions,tables etc. are extractedform information forTable T1 Online atwww.forestry.gov.jm
2 N/A N/A N/A N/A

FRA 2015 – Country Report, Jamaica
16
3 N/A N/A N/A N/A
4 N/A N/A N/A N/A
2.2.2 Classification and definitions
National class Definition
Mangrove Edaphic forest (areas with brackish water) composed of treeswith stilt roots or pneumatopores, species indicators such asRhizophora mangle (red mangrove)
Closed broadleaf Closed primary forest with broadleaf trees at least 5 m tall andcrown interlocking, with minimal human disturbance
Disturbed broadleaf Disturbed braodleaf foresr with trees at least 5 m tall andspecies-indicators of disturbance such as Ceropia peltata(trumpet tree)
Swamp Edaphic forest (soil waterlogging) with a single tree storey withspecies-indicators such as Symphonia globulifera (hog plum) andRoystonea princeps (royal palm)
Tall open dry Open natural woodland or forest with trees at least 5 m tall andcrown not in contact, in drier parts of Jamaica with species-indicators such as Bursera simaruba (red birch)
Caribbean pine plantation Forest plantation with Pinus caribaea
Other species plantation Forest plantation with other species such as Hibiscus elatus (bluemahoe), Swietenia macrophylia (Honduras mahogany), Tectonagrandis (teak), Eucalyptus saligna, Cedrela odorata (cedar), etc
2.2.3 Original data
Land use/cover change in Jamaica (1989-1998)
National classes 1989
‘000 ha
1998
‘000 ha
Forests land use
Bamboo 2.8 3.0
Mangrove 9.8 9.7
Closed broadleaf 88.7 88.2
Disturbed broadleaf 177.2 174.8
Short open dry 12.1 12.1

FRA 2015 – Country Report, Jamaica
17
Swamp 2.4 2.2
Tall open dry 42.1 42.0
TOTAL 335.1 332.0
Mixed land use
Bamboo and fields 29.8 29.0
Bamboo and disturbed broadleaf 12.3 12.7
Bauxite and disturbed broadleaf 1.6 2.9
Fields and disturbed broadleaf 118.9 118.0
Fields/Disturbed broadleaf andpine plantation
8.9 8.2
Disturbed broadleaf and fields 166.8 166.0
TOTAL 338.3 336.8
2.3 Analysis and processing of national data2.3.1 Adjustment
Same as Question1
2.3.2 Estimation and forecasting
Not necessary
2.3.3 Reclassification
1.1.1

FRA 2015 – Country Report, Jamaica
18
FRA 2010 classesNationalclasses
1990
‘000ha
2000
‘000ha
2005
‘000ha
2010
‘000ha
Primary Other
naturallyregenerated
Other
naturallyregenerated,Introduced
Planted Planted,Introduced
Mangrove Bamboo
Forests land use
Bamboo 2.8 3.1 3.2 3.3 100% 100% 100%
Mangrove 9.8 9.7 9.6 9.6 100% 100%
Closedbroadleaf
88.9 88.3 88.0 87.7 100%
Disturbedbroadleaf
177.4 174.7 173.3 172.0 100%
Swamp 2.4 2.2 2.0 1.9 100%
Tallopendry
42.2 42.1 42.0 42.0 100%
Fields/Disturbedbroadleafandpineplantation
8.8 8.1 7.7 7.3 100% 98.8%
Bambooanddisturbedbroadleaf
12.4 12.8 13.0 13.3 100% 75% 75%
Total 344.6 340.9 339.0 337.1
Source: Extracted from 1.3.2 Estimation and forecasting and 1.3.3 Reclassification into FRA 2010 classes
The class fields/disturbed broadleaf and pine plantation comprises pine and hardwood plantations
2.4 DataTable 2a
Forest area (000 hectares)Categories
1990 2000 2005 2010 2015
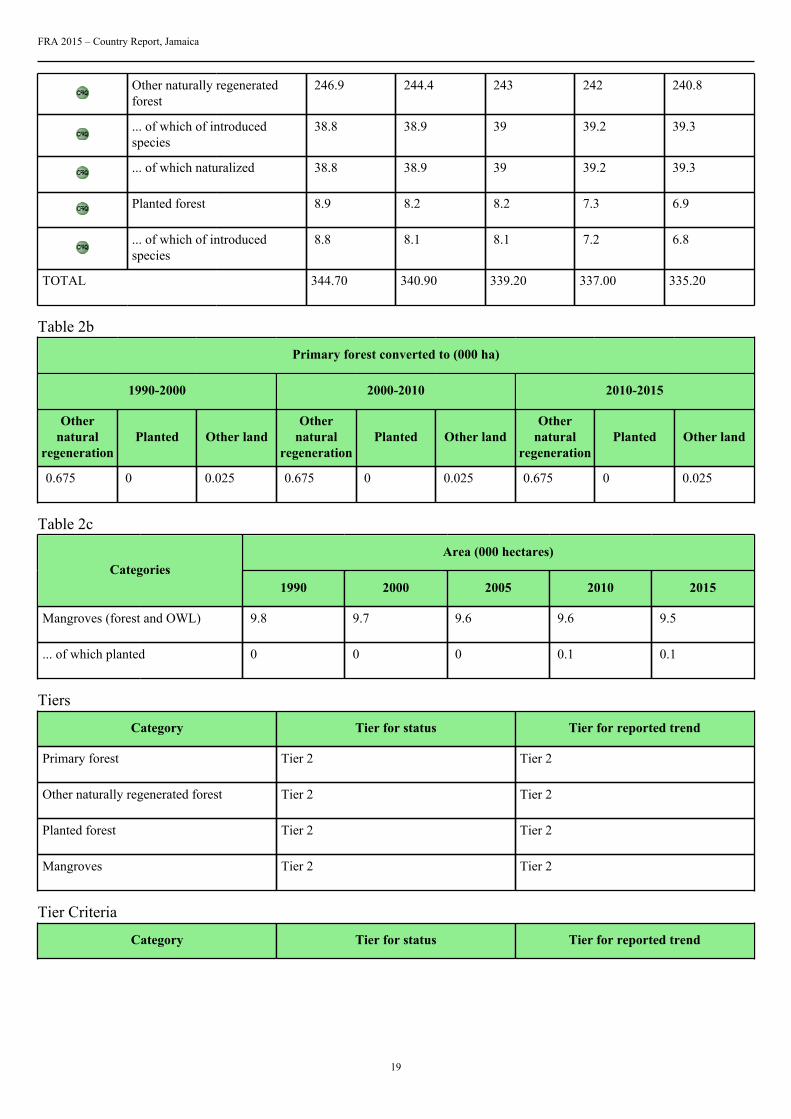
Primary forest 88.9 88.3 88 87.7 87.5
FRA 2015 – Country Report, Jamaica
19
Other naturally regeneratedforest
246.9 244.4 243 242 240.8
... of which of introducedspecies
38.8 38.9 39 39.2 39.3
... of which naturalized 38.8 38.9 39 39.2 39.3
Planted forest 8.9 8.2 8.2 7.3 6.9
... of which of introducedspecies
8.8 8.1 8.1 7.2 6.8
TOTAL 344.70 340.90 339.20 337.00 335.20
Table 2b
Primary forest converted to (000 ha)
1990-2000 2000-2010 2010-2015
Othernatural
regenerationPlanted Other land
Othernatural
regenerationPlanted Other land
Othernatural
regenerationPlanted Other land
0.675 0 0.025 0.675 0 0.025 0.675 0 0.025
Table 2c
Area (000 hectares)Categories
1990 2000 2005 2010 2015
Mangroves (forest and OWL) 9.8 9.7 9.6 9.6 9.5
... of which planted 0 0 0 0.1 0.1
Tiers
Category Tier for status Tier for reported trend
Primary forest Tier 2 Tier 2
Other naturally regenerated forest Tier 2 Tier 2
Planted forest Tier 2 Tier 2
Mangroves Tier 2 Tier 2
Tier Criteria
Category Tier for status Tier for reported trend

FRA 2015 – Country Report, Jamaica
20
Primary forest/Other naturally regeneratedforest/Planted forest
Tier 3 : Data sources: Recent (less than10 years) National Forest Inventory orremote sensing with ground truthing ordata provided by official agencies orprogramme for repeated compatible NFIsTier 2 : Data sources: Full cover mapping/remote sensing or old NFI (more than 10years) Tier 1 : Other
Tier 3 : Estimate based on repeatedcompatible tiers 3 (tier for status) Tier 2 :Estimate based on repeated compatible tier2 or combination tier 3 and 2 or 1 (tier forstatus) Tier 1 : Other
2.5 Comments
Category Comments related todata definitions etc Comments on reported trend
Primary forest All of closed broadleaf forests. N/A
Other naturally regenerating forest This classification related to all ourforests except Planted (Plantation) forestsand Closed broadleaf forest which isclassified as Primary forest.
N/A
Planted forest Only our plantations (Pine forest andhardwood plantations) are considered asPlanted forests
N/A
Mangroves As stated in the report, detailedassessments of mangroves are notavailable and figures as stated in table1 will be used for mangrove forestclassification. Other mangrove figures willbe arrived at using expert knowledge.
Although other mangrove data areavailable the accuracy of the data is notknown and as such these figures will notbe used until further analysts are done toclarify data accuracy. Planted mangrovesare as a result of funded project to replacemangroves damage by natural and man-made activities
Other general comments to the table
N/A

FRA 2015 – Country Report, Jamaica
21
3. What are the stocks and growth rates of the forests and how have they changed?Documents for this question:
• Guide for country reporting FRA 2015• FRA 2015 Terms and Definitions
3.1 Categories and definitions
Category Definition
Growing stock Volume over bark of all living trees with a minimum diameter of 10 cm at breast height (or abovebuttress if these are higher). Includes the stem from ground level up to a top diameter of 0 cm,excluding branches.
Net Annual Increment(NAI)
Average annual volume of gross increment over the given reference period less that of natural losses onall trees, measured to minimum diameters as defined for "Growing stock".
Above-ground biomass All living biomass above the soil including stem stump branches bark seeds and foliage.
Below-ground biomass All biomass of live roots. Fine roots of less than 2 mm diameter are excluded because these often cannotbe distinguished empirically from soil organic matter or litter.
Dead wood All non-living woody biomass not contained in the litter either standing lying on the ground or in thesoil. Dead wood includes wood lying on the surface dead roots and stumps larger than or equal to 10 cmin diameter or any other diameter used by the country.
Carbon in above-groundbiomass
Carbon in all living biomass above the soil including stem stump branches bark seeds and foliage.
Carbon in below-groundbiomass
Carbon in all biomass of live roots. Fine roots of less than 2 mm diameter are excluded because theseoften cannot be distinguished empirically from soil organic matter or litter.
Carbon in dead wood Carbon in all non-living woody biomass not contained in the litter, either standing, lying on the ground,or in the soil. Dead wood includes wood lying on the surface, dead roots and stumps larger than or equalto 10 cm in diameter or any other diameter used by the country.
Carbon in litter Carbon in all non-living biomass with a diameter less than the minimum diameter for dead wood (e.g.10 cm ) lying dead in various states of decomposition above the mineral or organic soil.
Soil carbon Organic carbon in mineral and organic soils (including peat) to a soil depth of 30 cm.
3.2 National data3.2.1 Data sources
References to sourcesof information Variables Years Additional comments
1 Camirand R. and EvelynO.B., 2003. ForestryDepartment-Trees forTomorrow Project. 2004.National Forest InventoryReport 2003, Main Reportand Appendices 1 to V
Area and Volume, biomass 2003 N/A

FRA 2015 – Country Report, Jamaica
22
2 Davis, C., Evelyn, O.B.,Simpson, L.A. and Smith,I.T., 2008. Jamaica’sGreenhouse Gas EmissionsInventory, 2000 – 2005, FinalReport
Biomass Stock, carbon 2000-2005 Tables 4-9 and 4-13
3 FAO. Guidelines forCountries reporting to FRA2010
Default tables N/A Appendix 5, Tables 5.52,5.9ix and 5.10x
4 N/A N/A N/A N/A
3.2.2 Classification and definitions
National class Definition
Bamboo Bambusa vulgaris (bamboo brakes) on the lower shale hills(disturbed forest)
Mangrove Edaphic forest (areas with brackish water) composed of treeswith stilt roots or pneumatopores, species indicators such asRhizophora mangle (red mangrove)
Closed broadleaf Closed primary forest with broadleaf trees at least 5 m tall andcrown interlocking, with minimal human disturbance
Disturbed broadleaf Disturbed broadleaf forest with trees at least 5 m tall and species-indicators of disturbance such as Ceropia peltata (trumpet tree)
Short open dry Open scrub, shrub, bush or brushland with trees or shrubs1-5 m tall and crowns not in contact, in drier parts of Jamaicawith species-indicators such as Prosopis juliflora (cashaw) orStenocereus hystrix (columnar cactus)
Swamp Edaphic forest (soil waterlogging) with a single tree storey withspecies-indicators such as Symphonia globulifera (hog plum) andRoystonea princeps (royal palm)
Tall open dry Open natural woodland or forest with trees at least 5 m tall andcrown not in contact, in drier parts of Jamaica with species-indicators such as Bursera simaruba (red birch)
Bamboo and fields 50% bamboo; >25% fields" /> >50% bamboo; >25% fields
Bamboo and Disturbed broadleaf forest 50% bamboo; > 25% Disturbed broadleaf forest" /> >50%bamboo; > 25% Disturbed broadleaf forest
Bauxite extraction and Disturbed broadleaf forest 50% bauxite extraction; >25% Disturbed broadleaf forest" />>50% bauxite extraction; >25% Disturbed broadleaf forest
Fields and Disturbed broadleaf forest 50% fields; >25% Disturbed broadleaf forest" /> >50% fields;>25% Disturbed broadleaf forest
Fields or Disturbed broadleaf forest and Pine plantation 50% fields or Disturbed broadleaf forest; >25% Pine plantation" /> >50% fields or Disturbed broadleaf forest; >25% Pineplantation
Disturbed broadleaf forest and fields 50% Disturbed broadleaf forest; >25% fields" /> >50%Disturbed broadleaf forest; >25% fields

FRA 2015 – Country Report, Jamaica
23
3.2.3 Original data
Total Volume by forest types
Name Area
( ha)
Volume
(‘000 m 3 )
Closed Broadleaf 88230.5 17088.5
Disturbed Broadleaf 174724.6 28909.9
Tall Open Dry 41998.5 1585.9
Short Open Dry 12104 275.9
Riparian/Swamp 2247 407.3
Mangrove 9730.8 765.1
Caribbean Pine Plantations 4287 512.0
Other Species Plantation 3900 576.5
Forest total 337222.4 50121.1
Disturbed Broadleaf Forest &Non-Forest Land Use
165953.8 15534.9
Non-Forest Land Use &Disturbed Broadleaf Forest
165639.8 10996.8
Mixed Total 331593.6 26531.7
Total 668816.0 76652.8
Source: National Forest Inventory Report 2003, Main Report and Appendices 1 to V (Table 25; extract)
Total Volume and aboveground living biomass by forest types
National class Ha (1998) Volume (m3/ha) Total Volume(000 m3)
Total AboveGround Biomass('000 t)
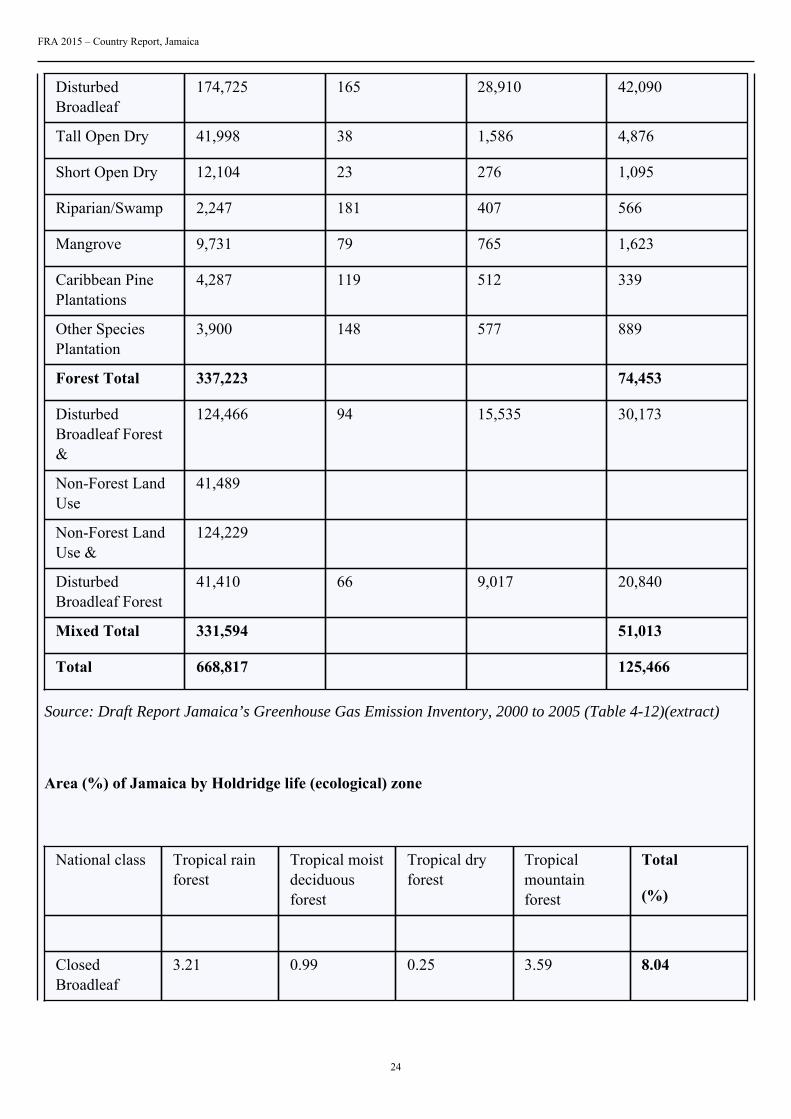
Closed Broadleaf 88,231 194 17,089 22,974
FRA 2015 – Country Report, Jamaica
24
DisturbedBroadleaf
174,725 165 28,910 42,090
Tall Open Dry 41,998 38 1,586 4,876
Short Open Dry 12,104 23 276 1,095
Riparian/Swamp 2,247 181 407 566
Mangrove 9,731 79 765 1,623
Caribbean PinePlantations
4,287 119 512 339
Other SpeciesPlantation
3,900 148 577 889
Forest Total 337,223 74,453
DisturbedBroadleaf Forest&
124,466 94 15,535 30,173
Non-Forest LandUse
41,489
Non-Forest LandUse &
124,229
DisturbedBroadleaf Forest
41,410 66 9,017 20,840
Mixed Total 331,594 51,013
Total 668,817 125,466
Source: Draft Report Jamaica’s Greenhouse Gas Emission Inventory, 2000 to 2005 (Table 4-12)(extract)
Area (%) of Jamaica by Holdridge life (ecological) zone
National class Tropical rainforest
Tropical moistdeciduousforest
Tropical dryforest
Tropicalmountainforest
Total
(%)
ClosedBroadleaf
3.21 0.99 0.25 3.59 8.04
FRA 2015 – Country Report, Jamaica
25
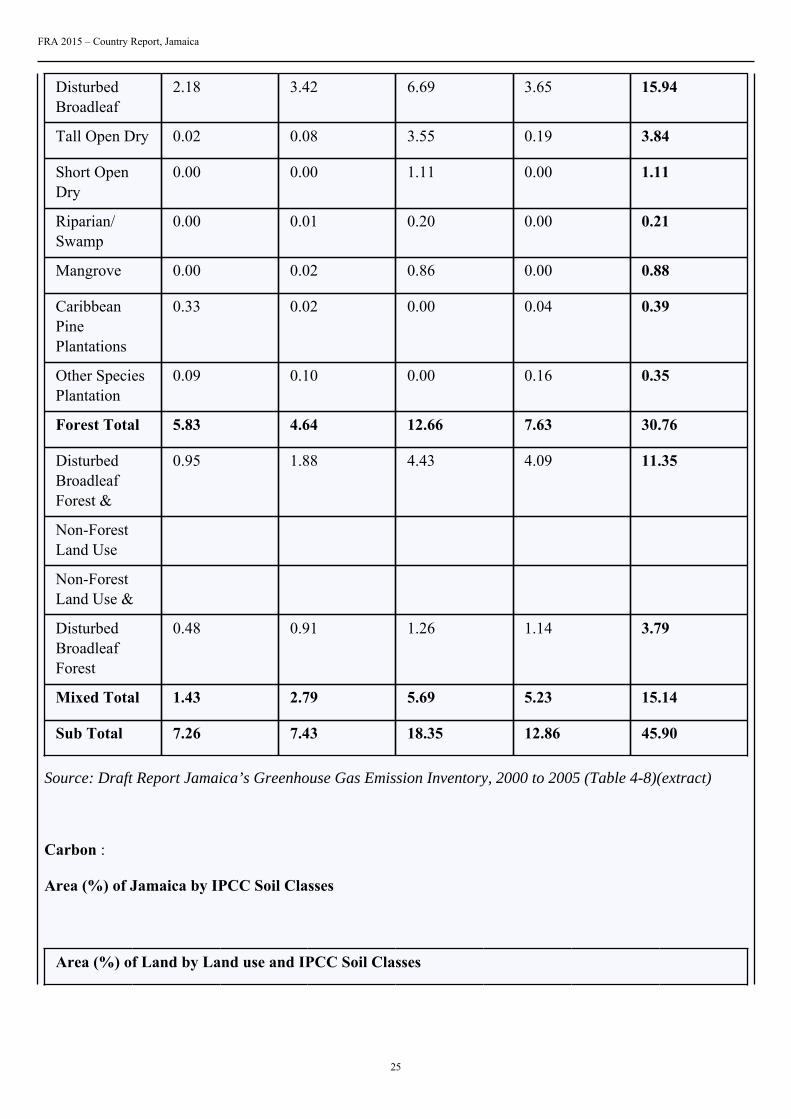
DisturbedBroadleaf
2.18 3.42 6.69 3.65 15.94
Tall Open Dry 0.02 0.08 3.55 0.19 3.84
Short OpenDry
0.00 0.00 1.11 0.00 1.11
Riparian/Swamp
0.00 0.01 0.20 0.00 0.21
Mangrove 0.00 0.02 0.86 0.00 0.88
CaribbeanPinePlantations
0.33 0.02 0.00 0.04 0.39
Other SpeciesPlantation
0.09 0.10 0.00 0.16 0.35
Forest Total 5.83 4.64 12.66 7.63 30.76
DisturbedBroadleafForest &
0.95 1.88 4.43 4.09 11.35
Non-ForestLand Use
Non-ForestLand Use &
DisturbedBroadleafForest
0.48 0.91 1.26 1.14 3.79
Mixed Total 1.43 2.79 5.69 5.23 15.14
Sub Total 7.26 7.43 18.35 12.86 45.90
Source: Draft Report Jamaica’s Greenhouse Gas Emission Inventory, 2000 to 2005 (Table 4-8)(extract)
Carbon :
Area (%) of Jamaica by IPCC Soil Classes
Area (%) of Land by Land use and IPCC Soil Classes

FRA 2015 – Country Report, Jamaica
26
Nationalclass
GHG InventoryClasses
HighActivityClay
Low
Activity
Clay
Sandy
Soils
WetlandSoil
GrandTotal
Forest Land Use
Closedbroadleaf
Forest Land 7.82 0.22 0.00 0.00 8.04
Disturbedbroadleaf
Forest Land 14.92 0.93 0.00 0.00 15.94
Tall opendry
Forest Land 3.72 0.12 0.00 0.00 3.84
Shortopen dry
Forest Land 1.03 0.09 0.00 0.00 1.11
Swamp Forest Land 0.05 0.14 0.01 0.00 0.2
Mangrove Forest Land 0.88 0.00 0.01 0.00 0.89
Pineplantation
Forest Land 0.28 0.11 0.00 0.00 0.39
Otherspeciesplantation
Forest Land 0.27 0.09 0.00 0.00 0.36
Sub Total 28.96 1.71 0.02 0.00 30.76
Mixed
DisturbedBroadleaf
75% Forest Land 10.27 1.06 0.01 0.02 11.35
Non-ForestLand
25% Other Land 3.42 0.35 0.00 0.01 3.78
OtherLand
7.3 0.68 0.00 0.00 7.98Non-ForestLand use&
75%
Grassland 2.3 0.21 0.00 0.00 2.52
DisturbedBroadleafForest
25% Forest Land 4.21 0.39 0.00 0.00 4.41
Sub Total 27.51 2.70 0.01 0.02 30.24
Source: Draft Report Jamaica’s Greenhouse Gas Emission Inventory, 2000 to 2005 (Table 4-13), extract

FRA 2015 – Country Report, Jamaica
27
Example of area calculations by GHG Inventory class subcategories
Area (ha) of Jamaica by land use class andHoldridge life (ecological) zone
GHG Inventory Classes sub-categories
Nationalclass
GHG InventoryClasses
GrandTotal
Tropicalrain forest
Tropicalmoistdeciduousforest
Tropicaldry forest
Tropicalmountainsystems
Forest Land Use
Closedbroadleaf
Forest Land 88123 35183 10851 2740 39348
Disturbedbroadleaf
Forest Land 174131 23815 37361 73083 39873
Tall opendry
Forest Land 41968 219 874 38799 2077
Shortopen dry
Forest Land 12058 0 0 12058 0
Swamp Forest Land 2222 0 106 2117 0
Mangrove Forest Land 9717 0 221 9497 0
Pineplantation
Forest Land 4138 3502 212 0 424
Otherspeciesplantation
Forest Land 3900 1003 1114 0 1783
Sub Total 336258 63721 50739 138293 83505
Mixed
DisturbedBroadleaf
75% Forest Land 124261 10423 20601 48506 44731
Non-ForestLand
25% Other Land 41439 3476 6870 16176 14917

FRA 2015 – Country Report, Jamaica
28
OtherLand
94483 12060 22621 31432 28370Non-ForestLand use&
75%
Grassland 29997 3829 7182 9979 9007
DisturbedBroadleafForest
25% Forest Land 41361 5280 9903 13760 12419
Sub Total 331541 35068 67176 119853 109444
Source: Draft Report Jamaica’s Greenhouse Gas Emission Inventory, 2000 to 2005 (Table 4-9), extract
Default reference (under native vegetation) soil organic C stocks (SOC ref ) for mineral soils (tonnes C ha -1
in 0-30 cm depth)
Climate
region
High ActivityClay
Low ActivityClay
Sandy Soils Wetland Soil
Tropical, dry 38.00 35 31
Tropical, moist 65.00 47 39
Tropical, wet 44.00 60 66
Tropical, montane 88.00 63 34
86
Source: Table 5.10 x of Guidelines for Countries reporting to FRA 2010 (extract)
3.3 Analysis and processing of national data3.3.1 Adjustment
Not needed
3.3.2 Estimation and forecasting

FRA 2015 – Country Report, Jamaica
29
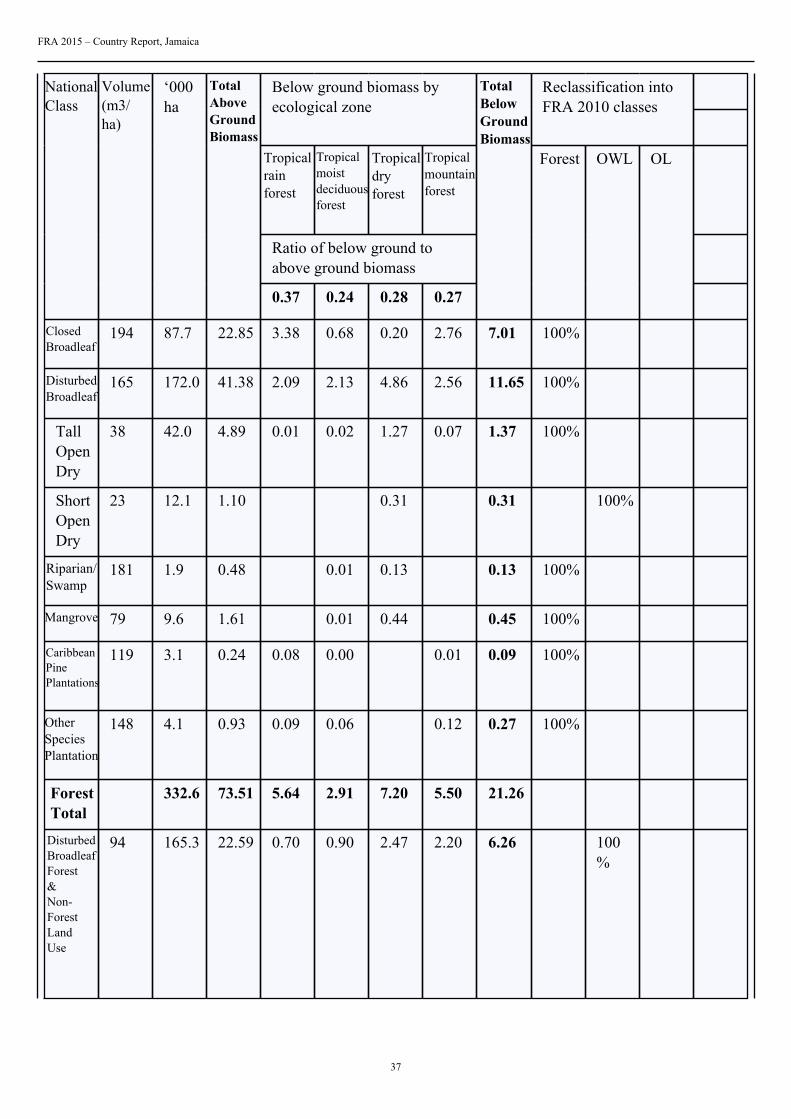
Below ground biomass byecological zone
Reclassification intoFRA 2015 classes
Tropicalrainforest
Tropicalmoistdeciduousforest
Tropicaldryforest
Tropicalmountainforest
Ratio of below ground toabove ground biomass
NationalClass
Volume(m3/ha)
‘000ha
TotalAboveGroundBiomass
0.37 0.24 0.28 0.27
TotalBelowGroundBiomass
Forest OWL OL
ClosedBroadleaf
194 87.5 22.80 3.37 0.67 0.20 2.75 7.0 100%
DisturbedBroadleaf
165 170.7 41.06 2.08 2.11 4.83 2.54 11.6 100%
TallOpenDry
38 41.9 4.88 0.01 0.02 1.26 0.07 1.4 100%
ShortOpenDry
23 12.1 1.10 0.31 0.3 100%
Riparian/Swamp
181 1.8 0.45 0.01 0.12 0.1 100%
Mangrove 79 9.5 1.59 0.01 0.43 0.4 100%
CaribbeanPinePlantations
119 2.6 0.21 0.06 0.00 0.00 0.1 100%
OtherSpeciesPlantation
148 4.2 0.96 0.09 0.07 0.12 0.3 100%
ForestTotal
330.3 73.05 5.61 2.89 7.15 5.48 21.13
FRA 2015 – Country Report, Jamaica
30
DisturbedBroadleafForest&Non-ForestLandUse
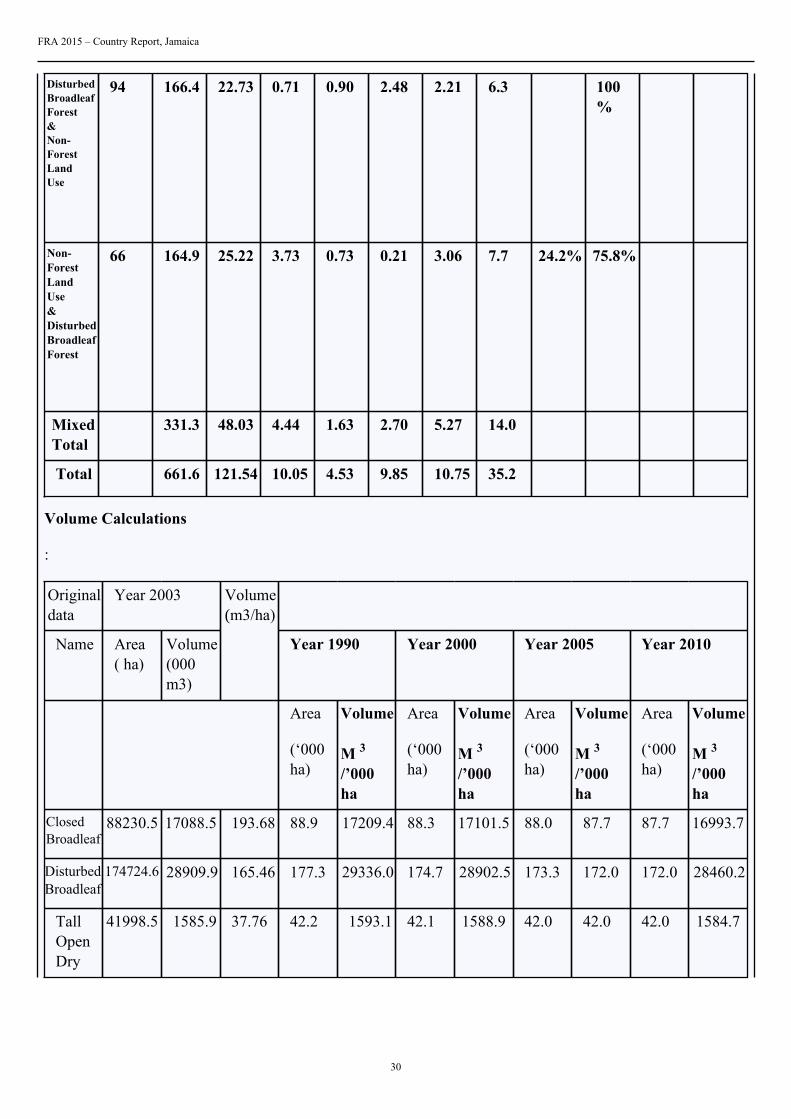
94 166.4 22.73 0.71 0.90 2.48 2.21 6.3 100%
Non-ForestLandUse&DisturbedBroadleafForest
66 164.9 25.22 3.73 0.73 0.21 3.06 7.7 24.2% 75.8%
MixedTotal
331.3 48.03 4.44 1.63 2.70 5.27 14.0
Total 661.6 121.54 10.05 4.53 9.85 10.75 35.2
Volume Calculations
:
Originaldata
Year 2003
Name Area( ha)
Volume(000m3)
Volume(m3/ha)
Year 1990 Year 2000 Year 2005 Year 2010
Area
(‘000ha)
Volume
M 3
/’000ha
Area
(‘000ha)
Volume
M 3
/’000ha
Area
(‘000ha)
Volume
M 3
/’000ha
Area
(‘000ha)
Volume
M 3
/’000ha
ClosedBroadleaf
88230.5 17088.5 193.68 88.9 17209.4 88.3 17101.5 88.0 87.7 87.7 16993.7
DisturbedBroadleaf
174724.6 28909.9 165.46 177.3 29336.0 174.7 28902.5 173.3 172.0 172.0 28460.2
TallOpenDry
41998.5 1585.9 37.76 42.2 1593.1 42.1 1588.9 42.0 42.0 42.0 1584.7
FRA 2015 – Country Report, Jamaica
31
ShortOpenDry
12104 275.9 22.79 12.1 276.5 12.1 276.5 12.1 12.1 12.1 276.5
Riparian/Swamp
2247 407.3 181.26 2.4 432.0 2.2 391.7 2.0 1.9 1.9 351.3
Mangrove 9730.8 765.1 78.63 9.8 771.5 9.7 762.7 9.6 9.6 9.6 754.0
CaribbeanPinePlantations
4287 512.0 119.43 5.0 597.2 4.3 513.6 4.3 3.1 3.1 372.0
OtherSpeciesPlantation
3900 576.5 147.82 3.9 576.5 3.9 576.5 3.9 4.1 4.1 611.8
ForestTotal
337222.4 50121.1 148.63 341.6 50792.1 337.3 50113.8 335.2 49788.0 332.6 49404.1
DisturbedBroadleafForest&Non-ForestLandUse
165953.8 15534.9 93.61 167.1 15642.8 166.2 15559.4 165.7 15511.1 165.3 15476.0
Non-ForestLandUse&DisturbedBroadleafForest
165639.8 10996.8 66.39 165.8 11008.4 165.9 11015.1 165.9 11015.4 166.3 11038.0
MixedTotal
331593.6 26531.7 332.9 26651.2 332.1 26574.5 331.6 26526.6 331.6 26514.0
Total 668816.0 76652.8 674.5 77443.3 669.4 76688.3 666.8 76314.6 664.2 75918.1
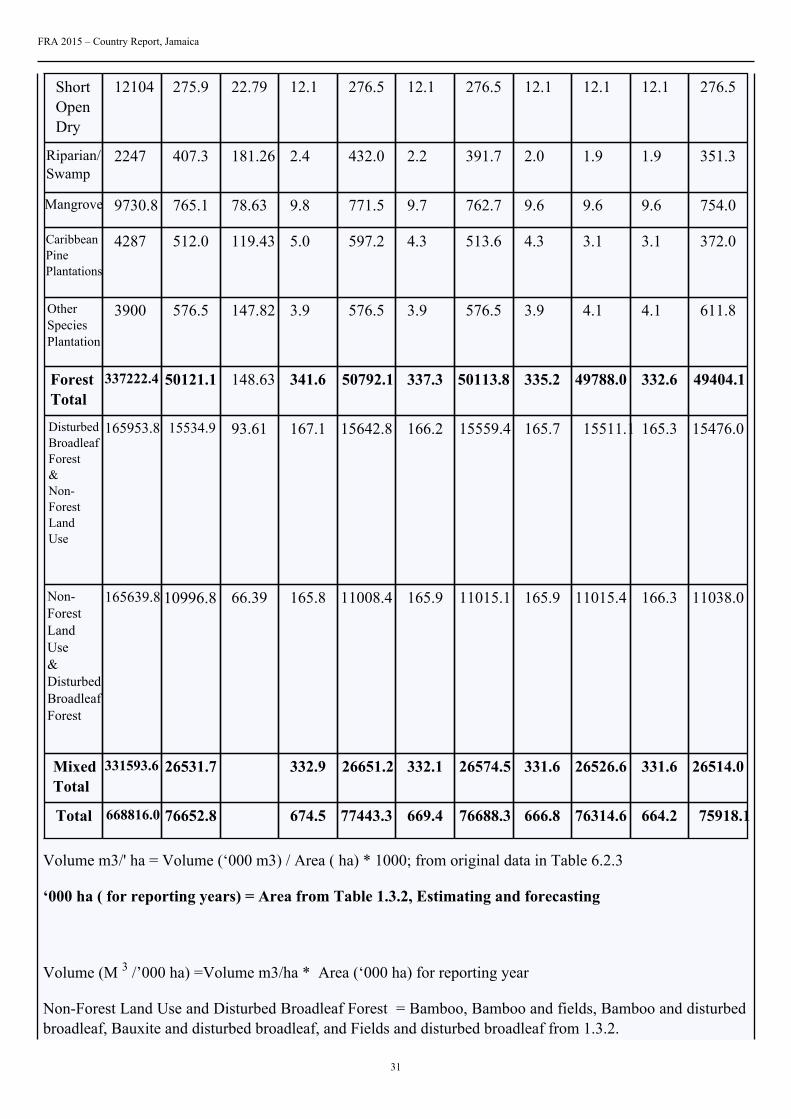
Volume m3/' ha = Volume (‘000 m3) / Area ( ha) * 1000; from original data in Table 6.2.3
‘000 ha ( for reporting years) = Area from Table 1.3.2, Estimating and forecasting
Volume (M 3 /’000 ha) =Volume m3/ha * Area (‘000 ha) for reporting year
Non-Forest Land Use and Disturbed Broadleaf Forest = Bamboo, Bamboo and fields, Bamboo and disturbedbroadleaf, Bauxite and disturbed broadleaf, and Fields and disturbed broadleaf from 1.3.2.
FRA 2015 – Country Report, Jamaica
32
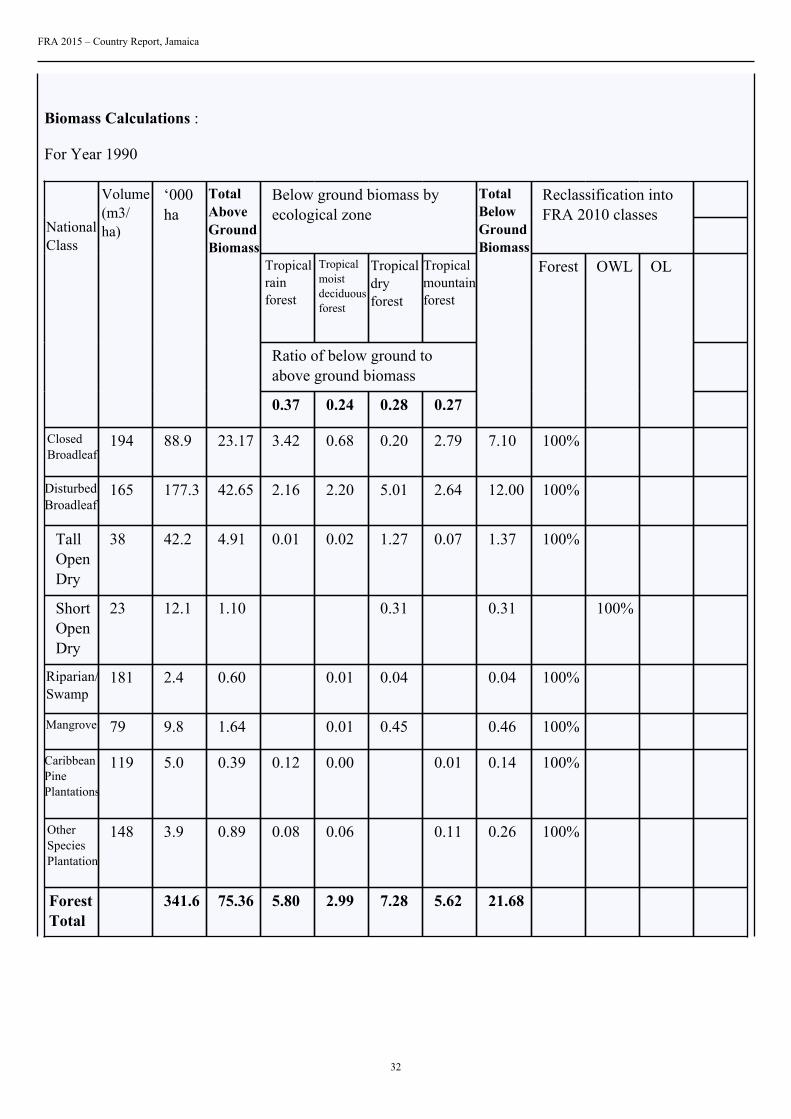
Biomass Calculations :
For Year 1990
Below ground biomass byecological zone
Reclassification intoFRA 2010 classes
Tropicalrainforest
Tropicalmoistdeciduousforest
Tropicaldryforest
Tropicalmountainforest
Ratio of below ground toabove ground biomass
NationalClass
Volume(m3/ha)
‘000ha
TotalAboveGroundBiomass
0.37 0.24 0.28 0.27
TotalBelowGroundBiomass
Forest OWL OL
ClosedBroadleaf
194 88.9 23.17 3.42 0.68 0.20 2.79 7.10 100%
DisturbedBroadleaf
165 177.3 42.65 2.16 2.20 5.01 2.64 12.00 100%
TallOpenDry
38 42.2 4.91 0.01 0.02 1.27 0.07 1.37 100%
ShortOpenDry
23 12.1 1.10 0.31 0.31 100%
Riparian/Swamp
181 2.4 0.60 0.01 0.04 0.04 100%
Mangrove 79 9.8 1.64 0.01 0.45 0.46 100%
CaribbeanPinePlantations
119 5.0 0.39 0.12 0.00 0.01 0.14 100%
OtherSpeciesPlantation
148 3.9 0.89 0.08 0.06 0.11 0.26 100%
ForestTotal
341.6 75.36 5.80 2.99 7.28 5.62 21.68
FRA 2015 – Country Report, Jamaica
33
DisturbedBroadleafForest&Non-ForestLandUse
94 167.1 22.83 0.71 0.91 2.50 2.22 6.33 100%
Non-ForestLandUse&DisturbedBroadleafForest
66 165.8 25.36 3.75 0.73 0.21 3.08 7.78 22.4% 77.6%
MixedTotal
332.9 48.20 4.46 1.64 2.71 5.30 14.11
Total 674.5 123.56 10.26 4.63 9.99 10.92 35.79
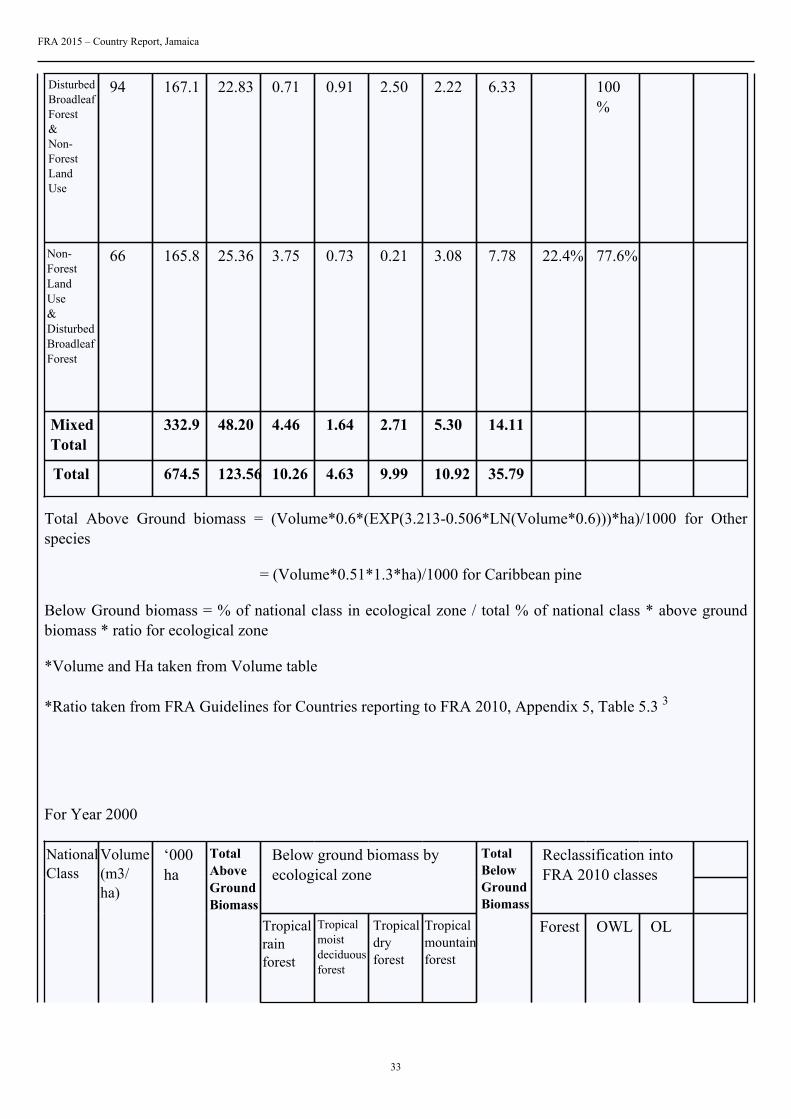
Total Above Ground biomass = (Volume*0.6*(EXP(3.213-0.506*LN(Volume*0.6)))*ha)/1000 for Otherspecies
= (Volume*0.51*1.3*ha)/1000 for Caribbean pine
Below Ground biomass = % of national class in ecological zone / total % of national class * above groundbiomass * ratio for ecological zone
*Volume and Ha taken from Volume table
*Ratio taken from FRA Guidelines for Countries reporting to FRA 2010, Appendix 5, Table 5.3 3
For Year 2000
Below ground biomass byecological zone
Reclassification intoFRA 2010 classes
NationalClass
Volume(m3/ha)
‘000ha
TotalAboveGroundBiomass
Tropicalrainforest
Tropicalmoistdeciduousforest
Tropicaldryforest
Tropicalmountainforest
TotalBelowGroundBiomass
Forest OWL OL

FRA 2015 – Country Report, Jamaica
34
Ratio of below ground toabove ground biomass
0.37 0.24 0.28 0.27
ClosedBroadleaf
194 88.3 23.01 3.40 0.68 0.20 2.77 7.05 100%
DisturbedBroadleaf
165 174.7 42.03 2.13 2.16 4.94 2.60 11.83 100%
TallOpenDry
38 42.1 4.90 0.01 0.02 1.27 0.07 1.37 100%
ShortOpenDry
23 12.1 1.10 0.31 0.31 100%
Riparian/Swamp
181 2.2 0.55 0.01 0.15 0.15 100%
Mangrove 79 9.7 1.62 0.01 0.44 0.45 100%
CaribbeanPinePlantations
119 4.3 0.34 0.11 0.00 0.01 0.12 100%
OtherSpeciesPlantation
148 3.9 0.89 0.08 0.06 0.11 0.26 100%
ForestTotal
337.3 74.44 5.73 2.95 7.31 5.56 21.54
DisturbedBroadleafForest&Non-ForestLandUse
94 166.2 22.71 0.70 0.90 2.48 2.21 6.30 100%
Non-ForestLandUse&DisturbedBroadleafForest
66 165.9 25.38 3.76 0.73 0.21 3.08 7.78 23.3% 76.7%

FRA 2015 – Country Report, Jamaica
35
MixedTotal
332.1 48.09 4.46 1.63 2.70 5.29 14.08
Total 669.4 122.53 10.19 4.58 10.00 10.85 35.62
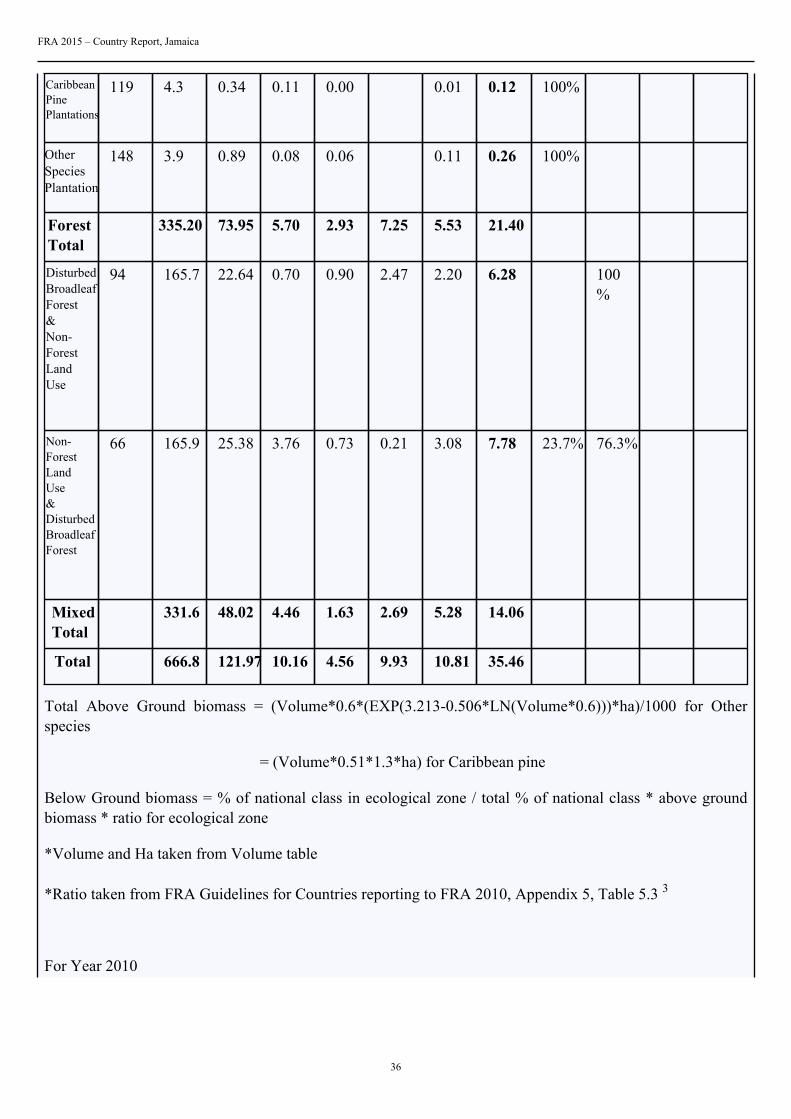
Total Above Ground biomass = (Volume*0.6*(EXP(3.213-0.506*LN(Volume*0.6)))*ha)/1000 for Otherspecies
= (Volume*0.51*1.3*ha) for Caribbean pine
Below Ground biomass = % of national class in ecological zone / total % of national class * above groundbiomass * ratio for ecological zone
*Volume and Ha taken from Volume table
*Ratio taken from FRA Guidelines for Countries reporting to FRA 2010, Appendix 5, Table 5.3 3
For Year 2005
Below ground biomass byecological zone
Reclassification intoFRA 2010 classes
Tropicalrainforest
Tropicalmoistdeciduousforest
Tropicaldryforest
Tropicalmountainforest
Ratio of below ground toabove ground biomass
NationalClass
Volume(m3/ha)
‘000ha
TotalAboveGroundBiomass
0.37 0.24 0.28 0.27
TotalBelowGroundBiomass
Forest OWL OL
ClosedBroadleaf
194 88.0 22.93 3.39 0.68 0.20 2.76 7.03 100%
DisturbedBroadleaf
165 173.3 41.69 2.11 2.15 4.90 2.58 11.73 100%
TallOpenDry
38 42.00 4.89 0.01 0.02 1.27 0.07 1.37 100%
ShortOpenDry
23 12.1 1.10 0.31 0.31 100%
Riparian/Swamp
181 2.0 0.50 0.01 0.13 0.14 100%
Mangrove 79 9.6 1.61 0.01 0.44 0.45 100%
FRA 2015 – Country Report, Jamaica
36
CaribbeanPinePlantations
119 4.3 0.34 0.11 0.00 0.01 0.12 100%
OtherSpeciesPlantation
148 3.9 0.89 0.08 0.06 0.11 0.26 100%
ForestTotal
335.20 73.95 5.70 2.93 7.25 5.53 21.40
DisturbedBroadleafForest&Non-ForestLandUse
94 165.7 22.64 0.70 0.90 2.47 2.20 6.28 100%
Non-ForestLandUse&DisturbedBroadleafForest
66 165.9 25.38 3.76 0.73 0.21 3.08 7.78 23.7% 76.3%
MixedTotal
331.6 48.02 4.46 1.63 2.69 5.28 14.06
Total 666.8 121.97 10.16 4.56 9.93 10.81 35.46
Total Above Ground biomass = (Volume*0.6*(EXP(3.213-0.506*LN(Volume*0.6)))*ha)/1000 for Otherspecies
= (Volume*0.51*1.3*ha) for Caribbean pine
Below Ground biomass = % of national class in ecological zone / total % of national class * above groundbiomass * ratio for ecological zone
*Volume and Ha taken from Volume table
*Ratio taken from FRA Guidelines for Countries reporting to FRA 2010, Appendix 5, Table 5.3 3
For Year 2010
FRA 2015 – Country Report, Jamaica
37
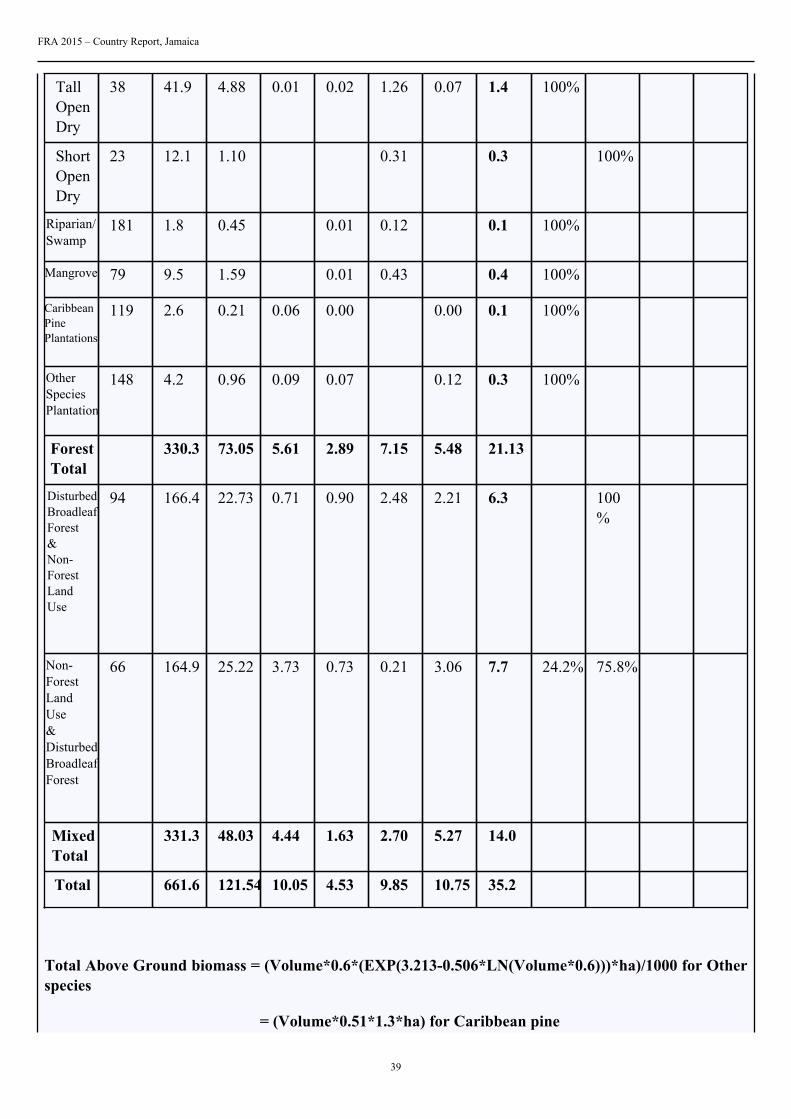
Below ground biomass byecological zone
Reclassification intoFRA 2010 classes
Tropicalrainforest
Tropicalmoistdeciduousforest
Tropicaldryforest
Tropicalmountainforest
Ratio of below ground toabove ground biomass
NationalClass
Volume(m3/ha)
‘000ha
TotalAboveGroundBiomass
0.37 0.24 0.28 0.27
TotalBelowGroundBiomass
Forest OWL OL
ClosedBroadleaf
194 87.7 22.85 3.38 0.68 0.20 2.76 7.01 100%
DisturbedBroadleaf
165 172.0 41.38 2.09 2.13 4.86 2.56 11.65 100%
TallOpenDry
38 42.0 4.89 0.01 0.02 1.27 0.07 1.37 100%
ShortOpenDry
23 12.1 1.10 0.31 0.31 100%
Riparian/Swamp
181 1.9 0.48 0.01 0.13 0.13 100%
Mangrove 79 9.6 1.61 0.01 0.44 0.45 100%
CaribbeanPinePlantations
119 3.1 0.24 0.08 0.00 0.01 0.09 100%
OtherSpeciesPlantation
148 4.1 0.93 0.09 0.06 0.12 0.27 100%
ForestTotal
332.6 73.51 5.64 2.91 7.20 5.50 21.26
DisturbedBroadleafForest&Non-ForestLandUse
94 165.3 22.59 0.70 0.90 2.47 2.20 6.26 100%

FRA 2015 – Country Report, Jamaica
38
Non-ForestLandUse&DisturbedBroadleafForest
66 166.3 25.44 3.77 0.73 0.21 3.09 7.80 24.2% 75.8%
MixedTotal
331.6 48.03 4.47 1.63 2.68 5.29 14.07
Total 664.2 121.51 10.11 4.54 9.88 10.79 35.33
Total Above Ground biomass = (Volume*0.6*(EXP(3.213-0.506*LN(Volume*0.6)))*ha)/1000 for Otherspecies
= (Volume*0.51*1.3*ha) for Caribbean pine
Below Ground biomass = % of national class in ecological zone / total % of national class * above groundbiomass * ratio for ecological zone
*Volume and Ha taken from Volume table
*Ratio taken from FRA Guidelines for Countries reporting to FRA 2010, Appendix 5, Table 5.3 3
For year 2015
Below ground biomass byecological zone
Reclassification intoFRA 2015 classes
Tropicalrainforest
Tropicalmoistdeciduousforest
Tropicaldryforest
Tropicalmountainforest
Ratio of below ground toabove ground biomass
NationalClass
Volume(m3/ha)
‘000ha
TotalAboveGroundBiomass
0.37 0.24 0.28 0.27
TotalBelowGroundBiomass
Forest OWL OL
ClosedBroadleaf
194 87.5 22.80 3.37 0.67 0.20 2.75 7.0 100%
DisturbedBroadleaf
165 170.7 41.06 2.08 2.11 4.83 2.54 11.6 100%
FRA 2015 – Country Report, Jamaica
39
TallOpenDry
38 41.9 4.88 0.01 0.02 1.26 0.07 1.4 100%
ShortOpenDry
23 12.1 1.10 0.31 0.3 100%
Riparian/Swamp
181 1.8 0.45 0.01 0.12 0.1 100%
Mangrove 79 9.5 1.59 0.01 0.43 0.4 100%
CaribbeanPinePlantations
119 2.6 0.21 0.06 0.00 0.00 0.1 100%
OtherSpeciesPlantation
148 4.2 0.96 0.09 0.07 0.12 0.3 100%
ForestTotal
330.3 73.05 5.61 2.89 7.15 5.48 21.13
DisturbedBroadleafForest&Non-ForestLandUse
94 166.4 22.73 0.71 0.90 2.48 2.21 6.3 100%
Non-ForestLandUse&DisturbedBroadleafForest
66 164.9 25.22 3.73 0.73 0.21 3.06 7.7 24.2% 75.8%
MixedTotal
331.3 48.03 4.44 1.63 2.70 5.27 14.0
Total 661.6 121.54 10.05 4.53 9.85 10.75 35.2
Total Above Ground biomass = (Volume*0.6*(EXP(3.213-0.506*LN(Volume*0.6)))*ha)/1000 for Otherspecies
= (Volume*0.51*1.3*ha) for Caribbean pine

FRA 2015 – Country Report, Jamaica
40
Below Ground biomass = % of national class in ecological zone / total % of national class * above groundbiomass * ratio for ecological zone
* Volume and Ha taken from Table 3.3.2a (Volume calculations), Estimating and forecasting
* Ratio taken from FRA Guide for Countries reporting for FRA 2015, Appendix 5, Table 5.3 3
Carbon Calculation:
Carbon stock calculation for above and below ground
Biomass (million metric tonnes oven-dry weight)
Carbon stock (Million tonnes)
Forest
FRA2010category
1990 2000 2005 2010 IPCCDefaultValue
1990 2000 2005 2010
Living biomass
Above-groundbiomass
79.94 79.26 78.87 78.54 0.47 37.57 37.25 37.07 36.92
Below-groundbiomass
23.11 23.05 22.94 22.84 0.47 10.86 10.83 10.78 10.74
Sub-total: Carbon in living biomass 48.44 48.08 47.85 47.65
Other wooded land
Living biomass
Above-groundbiomass
43.62 43.28 43.11 42.97 0.47 20.50 20.34 20.26 20.20
Below-groundbiomass
12.68 12.58 12.53 12.49 0.47 5.96 5.91 5.89 5.87
Sub-total: Carbon in living biomass 26.46 26.25 26.15 26.06
Carbon stock (for specific year) = Biomass total (for corresponding year)* IPCC Default Value
Biomass totals results from reclassification of biomass tables for repoprting years
FRA 2015 – Country Report, Jamaica
41
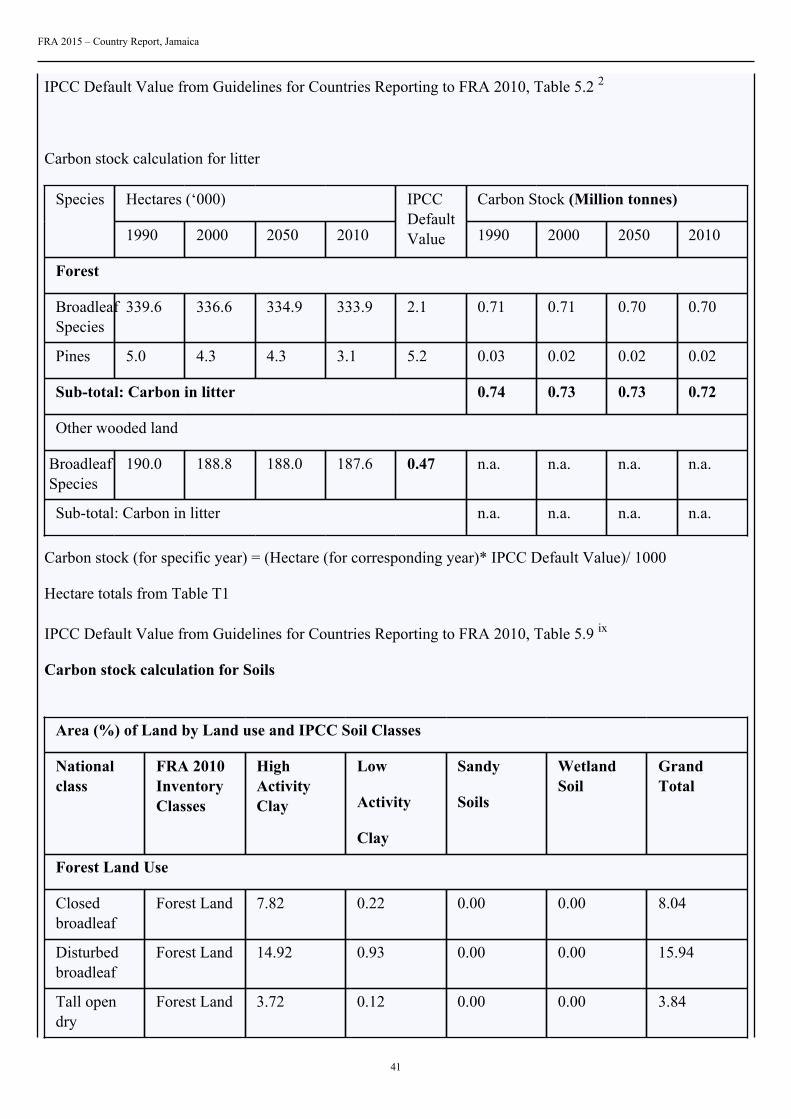
IPCC Default Value from Guidelines for Countries Reporting to FRA 2010, Table 5.2 2
Carbon stock calculation for litter
Hectares (‘000) Carbon Stock (Million tonnes)Species
1990 2000 2050 2010
IPCCDefaultValue 1990 2000 2050 2010
Forest
BroadleafSpecies
339.6 336.6 334.9 333.9 2.1 0.71 0.71 0.70 0.70
Pines 5.0 4.3 4.3 3.1 5.2 0.03 0.02 0.02 0.02
Sub-total: Carbon in litter 0.74 0.73 0.73 0.72
Other wooded land
BroadleafSpecies
190.0 188.8 188.0 187.6 0.47 n.a. n.a. n.a. n.a.
Sub-total: Carbon in litter n.a. n.a. n.a. n.a.
Carbon stock (for specific year) = (Hectare (for corresponding year)* IPCC Default Value)/ 1000
Hectare totals from Table T1
IPCC Default Value from Guidelines for Countries Reporting to FRA 2010, Table 5.9 ix
Carbon stock calculation for Soils
Area (%) of Land by Land use and IPCC Soil Classes
Nationalclass
FRA 2010InventoryClasses
HighActivityClay
Low
Activity
Clay
Sandy
Soils
WetlandSoil
GrandTotal
Forest Land Use
Closedbroadleaf
Forest Land 7.82 0.22 0.00 0.00 8.04
Disturbedbroadleaf
Forest Land 14.92 0.93 0.00 0.00 15.94
Tall opendry
Forest Land 3.72 0.12 0.00 0.00 3.84
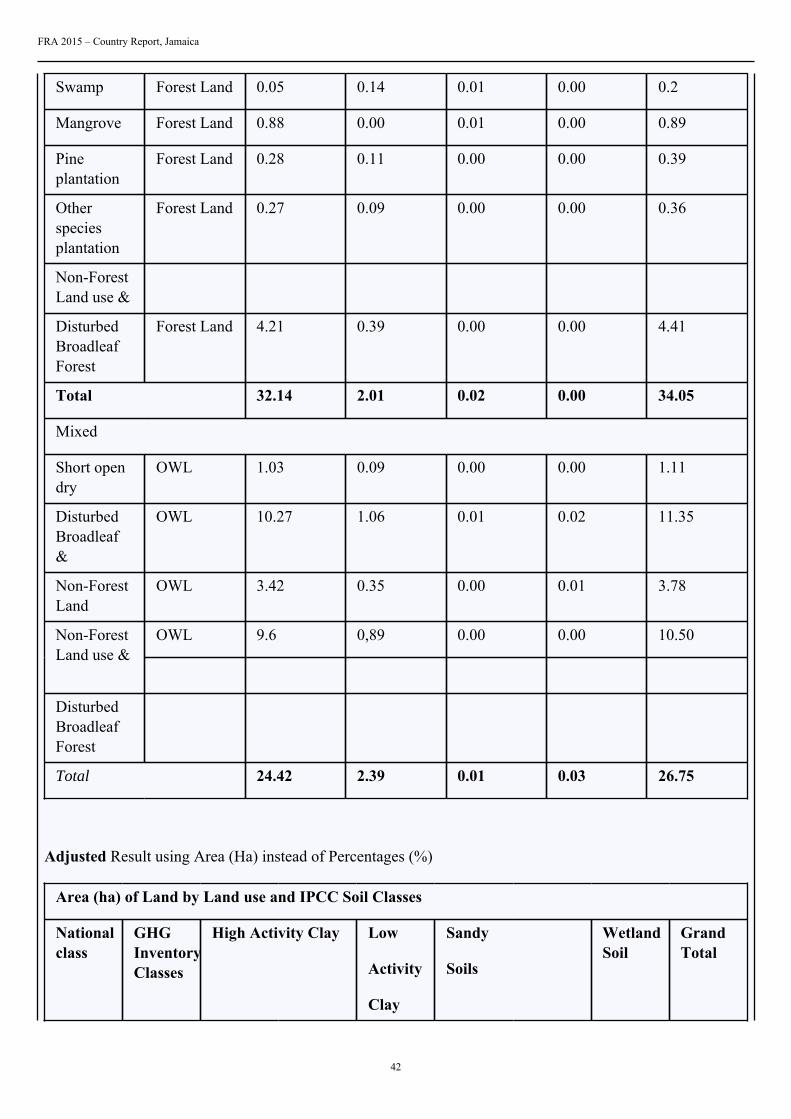
FRA 2015 – Country Report, Jamaica
42
Swamp Forest Land 0.05 0.14 0.01 0.00 0.2
Mangrove Forest Land 0.88 0.00 0.01 0.00 0.89
Pineplantation
Forest Land 0.28 0.11 0.00 0.00 0.39
Otherspeciesplantation
Forest Land 0.27 0.09 0.00 0.00 0.36
Non-ForestLand use &
DisturbedBroadleafForest
Forest Land 4.21 0.39 0.00 0.00 4.41
Total 32.14 2.01 0.02 0.00 34.05
Mixed
Short opendry
OWL 1.03 0.09 0.00 0.00 1.11
DisturbedBroadleaf&
OWL 10.27 1.06 0.01 0.02 11.35
Non-ForestLand
OWL 3.42 0.35 0.00 0.01 3.78
OWL 9.6 0,89 0.00 0.00 10.50Non-ForestLand use &
DisturbedBroadleafForest
Total 24.42 2.39 0.01 0.03 26.75
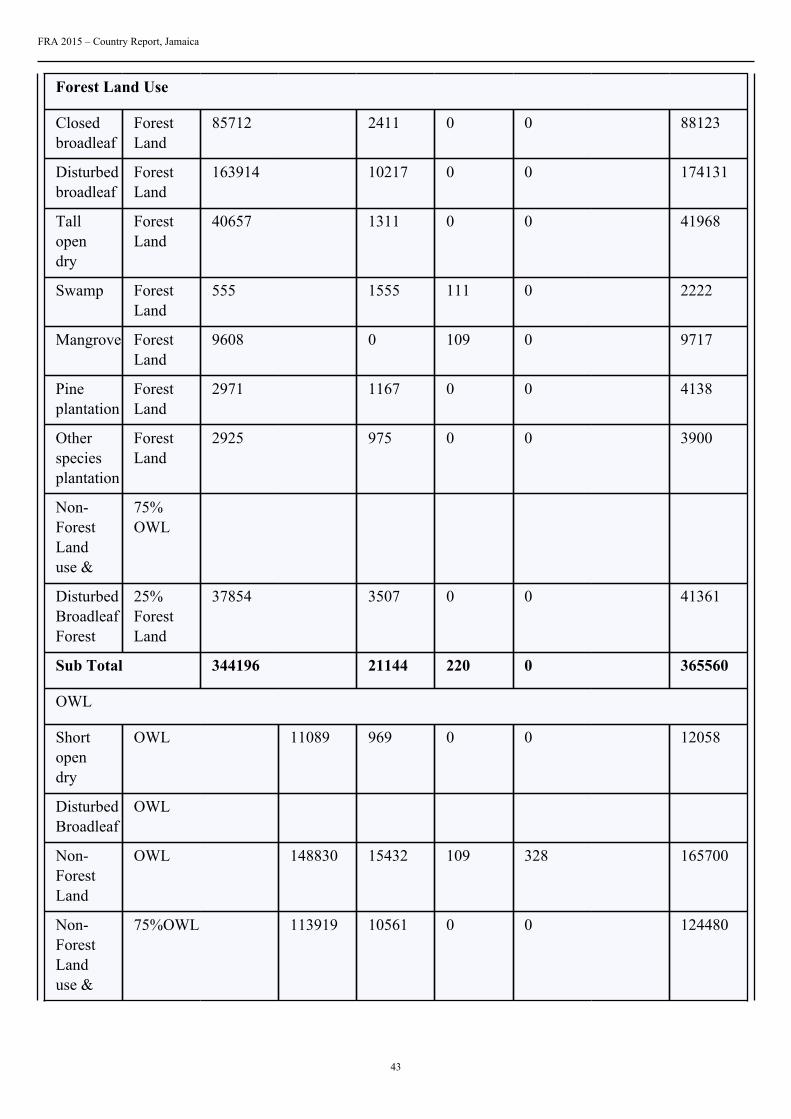
Adjusted Result using Area (Ha) instead of Percentages (%)
Area (ha) of Land by Land use and IPCC Soil Classes
Nationalclass
GHGInventoryClasses
High Activity Clay Low
Activity
Clay
Sandy
Soils
WetlandSoil
GrandTotal
FRA 2015 – Country Report, Jamaica
43
Forest Land Use
Closedbroadleaf
ForestLand
85712 2411 0 0 88123
Disturbedbroadleaf
ForestLand
163914 10217 0 0 174131
Tallopendry
ForestLand
40657 1311 0 0 41968
Swamp ForestLand
555 1555 111 0 2222
Mangrove ForestLand
9608 0 109 0 9717
Pineplantation
ForestLand
2971 1167 0 0 4138
Otherspeciesplantation
ForestLand
2925 975 0 0 3900
Non-ForestLanduse &
75%OWL
DisturbedBroadleafForest
25%ForestLand
37854 3507 0 0 41361
Sub Total 344196 21144 220 0 365560
OWL
Shortopendry
OWL 11089 969 0 0 12058
DisturbedBroadleaf
OWL
Non-ForestLand
OWL 148830 15432 109 328 165700
Non-ForestLanduse &
75%OWL 113919 10561 0 0 124480

FRA 2015 – Country Report, Jamaica
44
DisturbedBroadleafForest
25% Forest Land
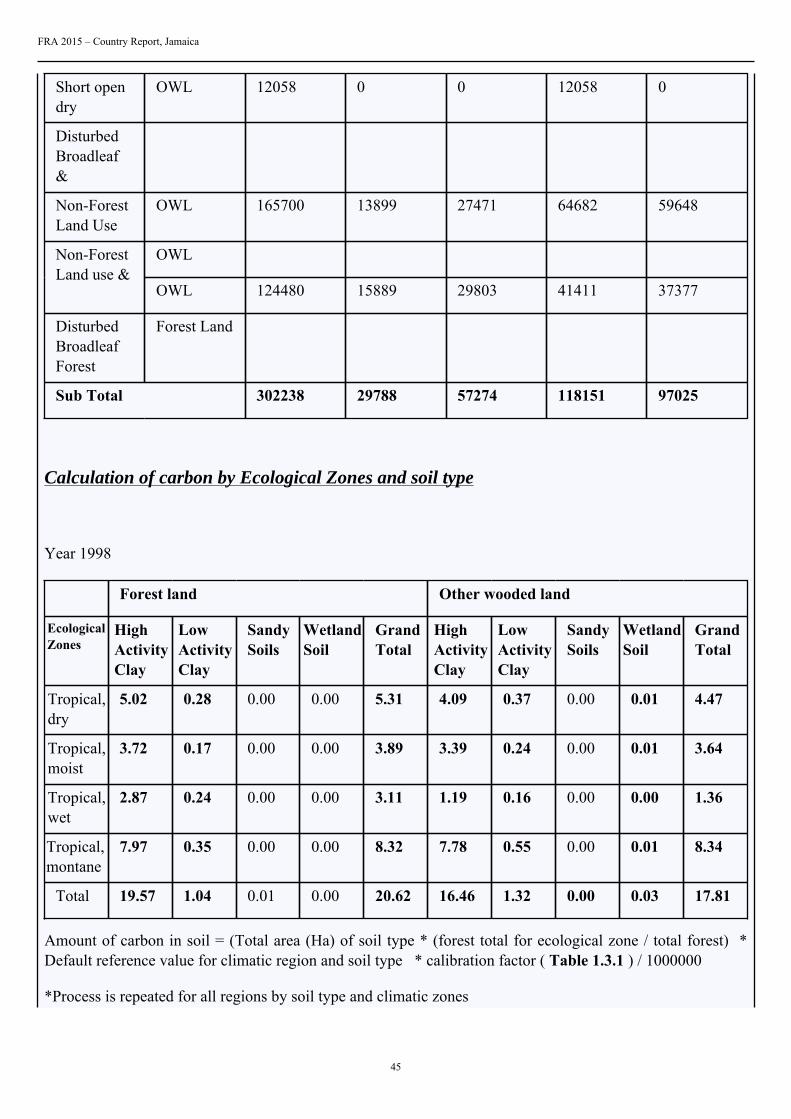
Sub Total 274838 26962 109 328 302238
Reclassification of forest class into ecological zones
Area (ha) of Jamaica by Holdridge life(ecological) zone
Inventory Classes sub-categories
Nationalclass
FRA 2010InventoryClasses
Total area(ha)
Tropicalrain forest
Tropicalmoistdeciduousforest
Tropicaldry forest
Tropicalmountainsystems
Forest Land Use
Closedbroadleaf
Forest Land 88123 35183 10851 2740 39348
Disturbedbroadleaf
Forest Land 174131 23815 37361 73083 39873
Tall opendry
Forest Land 41968 219 874 38799 2077
Swamp Forest Land 2222 0 106 2117 0
Mangrove Forest Land 9717 0 221 9497 0
Pineplantation
Forest Land 4138 3502 212 0 424
Otherspeciesplantation
Forest Land 3900 1003 1114 0 1783
Non-ForestLand use &
OWL
DisturbedBroadleafForest
Forest Land 41361 5280 9903 13760 12419
Sub Total 365560 69002 60642 139996 95924
Mixed
FRA 2015 – Country Report, Jamaica
45
Short opendry
OWL 12058 0 0 12058 0
DisturbedBroadleaf&
Non-ForestLand Use
OWL 165700 13899 27471 64682 59648
OWL Non-ForestLand use &
OWL 124480 15889 29803 41411 37377
DisturbedBroadleafForest
Forest Land
Sub Total 302238 29788 57274 118151 97025
Calculation of carbon by Ecological Zones and soil type
Year 1998
Forest land Other wooded land
EcologicalZones
HighActivityClay
LowActivityClay
SandySoils
WetlandSoil
GrandTotal
HighActivityClay
LowActivityClay
SandySoils
WetlandSoil
GrandTotal
Tropical,dry
5.02 0.28 0.00 0.00 5.31 4.09 0.37 0.00 0.01 4.47
Tropical,moist
3.72 0.17 0.00 0.00 3.89 3.39 0.24 0.00 0.01 3.64
Tropical,wet
2.87 0.24 0.00 0.00 3.11 1.19 0.16 0.00 0.00 1.36
Tropical,montane
7.97 0.35 0.00 0.00 8.32 7.78 0.55 0.00 0.01 8.34
Total 19.57 1.04 0.01 0.00 20.62 16.46 1.32 0.00 0.03 17.81
Amount of carbon in soil = (Total area (Ha) of soil type * (forest total for ecological zone / total forest) *Default reference value for climatic region and soil type * calibration factor ( Table 1.3.1 ) / 1000000
*Process is repeated for all regions by soil type and climatic zones
FRA 2015 – Country Report, Jamaica
46
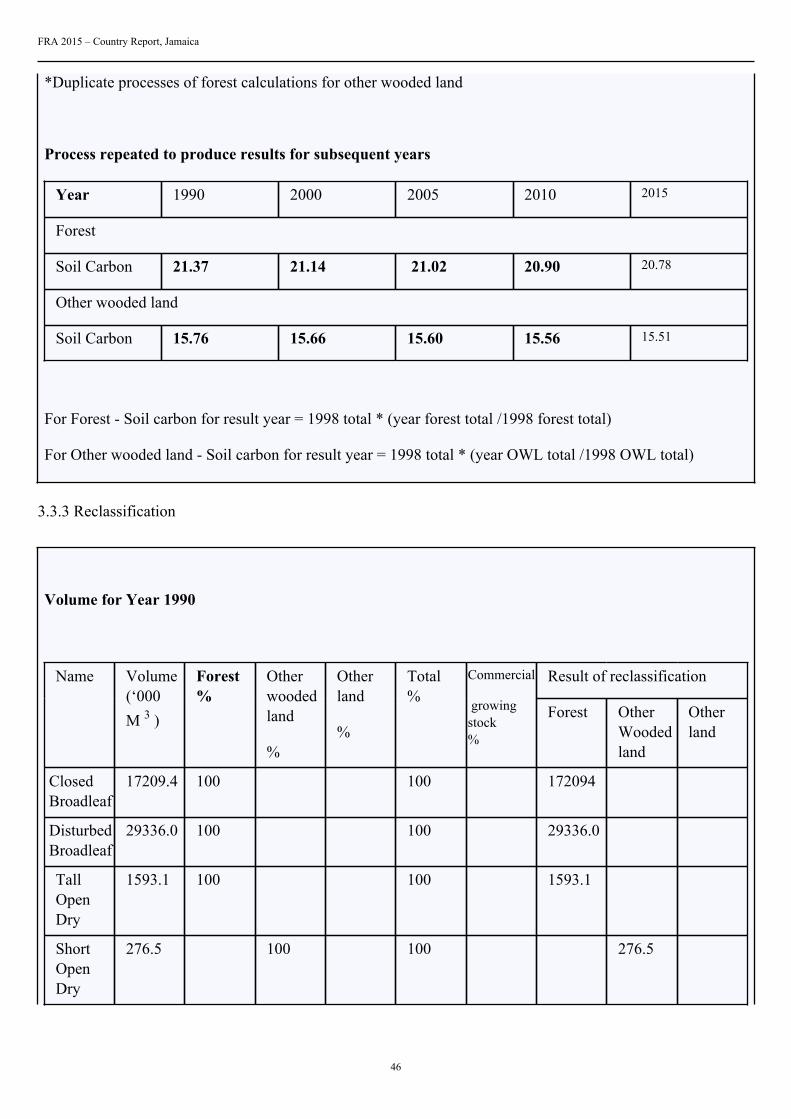
*Duplicate processes of forest calculations for other wooded land
Process repeated to produce results for subsequent years
Year 1990 2000 2005 2010 2015
Forest
Soil Carbon 21.37 21.14 21.02 20.90 20.78
Other wooded land
Soil Carbon 15.76 15.66 15.60 15.56 15.51
For Forest - Soil carbon for result year = 1998 total * (year forest total /1998 forest total)
For Other wooded land - Soil carbon for result year = 1998 total * (year OWL total /1998 OWL total)
3.3.3 Reclassification
Volume for Year 1990
Result of reclassificationName Volume(‘000M 3 )
Forest%
Otherwoodedland
%
Otherland
%
Total%
Commercial
growingstock%
Forest OtherWoodedland
Otherland
ClosedBroadleaf
17209.4 100 100 172094
DisturbedBroadleaf
29336.0 100 100 29336.0
TallOpenDry
1593.1 100 100 1593.1
ShortOpenDry
276.5 100 100 276.5

FRA 2015 – Country Report, Jamaica
47
Riparian/Swamp
432.0 100 100 432.0
Mangrove 771.5 100 100 771.5
CaribbeanPinePlantations
597.2 100 100 100 597.2
OtherSpeciesPlantation
576.5 100 100 100 576.5
DisturbedBroadleafForest&Non-ForestLandUse
15642.8 100 100 15642.8
Non-ForestLandUse &DisturbedBroadleafForest*
11008.4 22.4 77.6 100 2465.9 8542.5
Total 52981.5 24461.8
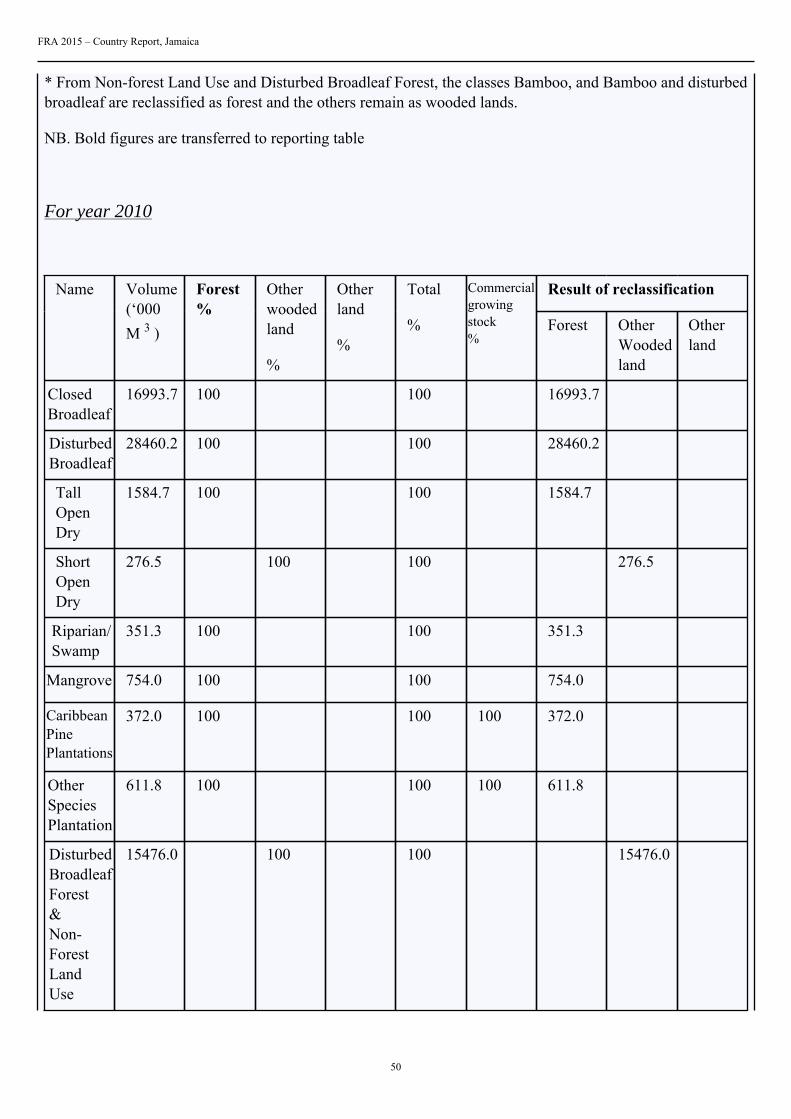
* From Non-forest Land Use and Disturbed Broadleaf Forest, the classes Bamboo, and Bamboo and disturbedbroadleaf are reclassified as forest and the others remain as wooded lands.
NB. Bold figures are transferred to reporting table
For year 2000
Result of reclassificationName Volume(’000M 3 )
Forest%
Otherwoodedland
%
Otherland
%
Total
%
Commercialgrowingstock%
Forest OtherWoodedland
Otherland
ClosedBroadleaf
17101.5 100 100 17101.5

FRA 2015 – Country Report, Jamaica
48
DisturbedBroadleaf
28902.5 100 100 28902.5
TallOpenDry
1588.9 100 100 1588.9
ShortOpenDry
276.5 100 100 276.5
Riparian/Swamp
391.7 100 100 391.7
Mangrove 762.7 100 100 762.7
CaribbeanPinePlantations
513.6 100 100 100 513.6
OtherSpeciesPlantation
576.5 100 100 100 576.5
DisturbedBroadleafForest&Non-ForestLandUse
15559.4 100 100 15559.4
Non-ForestLandUse &DisturbedBroadleafForest*
2566.5 23.3 76.7 100 2566.5 8448.6
Total 52403.9 24284.4
* From Non-forest Land Use and Disturbed Broadleaf Forest, the classes Bamboo, and Bamboo and disturbedbroadleaf are reclassified as forest and the others remain as wooded lands.
NB. Bold figures are transferred to reporting table
For year 2005

FRA 2015 – Country Report, Jamaica
49
Result of reclassificationName Volume(‘000M 3 )
Forest%
Otherwoodedland
%
Otherland
%
Total
%
Commercialgrowingstock%
Forest OtherWoodedland
Otherland
ClosedBroadleaf
17043.9 100 100 17043.9
DisturbedBroadleaf
28674.2 100 100 28674.2
TallOpenDry
1586.8 100 100 1586.8
ShortOpenDry
275.8 100 100 275.8
Riparian/Swamp
0.4 100 100 0.4
Mangrove 754.8 100 100 754.8
CaribbeanPinePlantations
513.6 100 100 100 513.6
OtherSpeciesPlantation
576.5 100 100 100 576.5
DisturbedBroadleafForest&Non-ForestLandUse
15511.1 100 100 15511.1
Non-ForestLandUse &DisturbedBroadleafForest*
11015.4 23.7 76.3 100 2610.7 8404.8
Total 51760.7 24191.7
FRA 2015 – Country Report, Jamaica
50
* From Non-forest Land Use and Disturbed Broadleaf Forest, the classes Bamboo, and Bamboo and disturbedbroadleaf are reclassified as forest and the others remain as wooded lands.
NB. Bold figures are transferred to reporting table
For year 2010
Result of reclassificationName Volume(‘000M 3 )
Forest%
Otherwoodedland
%
Otherland
%
Total
%
Commercialgrowingstock%
Forest OtherWoodedland
Otherland
ClosedBroadleaf
16993.7 100 100 16993.7
DisturbedBroadleaf
28460.2 100 100 28460.2
TallOpenDry
1584.7 100 100 1584.7
ShortOpenDry
276.5 100 100 276.5
Riparian/Swamp
351.3 100 100 351.3
Mangrove 754.0 100 100 754.0
CaribbeanPinePlantations
372.0 100 100 100 372.0
OtherSpeciesPlantation
611.8 100 100 100 611.8
DisturbedBroadleafForest&Non-ForestLandUse
15476.0 100 100 15476.0
FRA 2015 – Country Report, Jamaica
51
Non-ForestLandUse &DisturbedBroadleafForest*
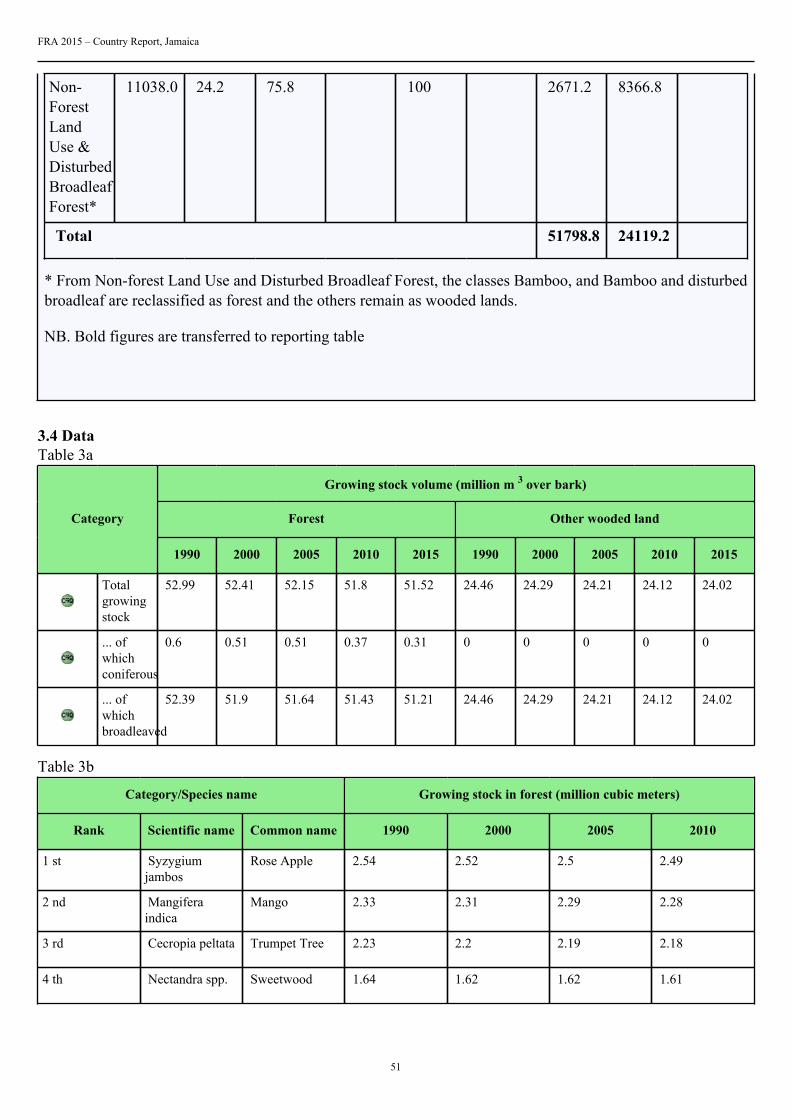
11038.0 24.2 75.8 100 2671.2 8366.8
Total 51798.8 24119.2
* From Non-forest Land Use and Disturbed Broadleaf Forest, the classes Bamboo, and Bamboo and disturbedbroadleaf are reclassified as forest and the others remain as wooded lands.
NB. Bold figures are transferred to reporting table
3.4 DataTable 3a
Growing stock volume (million m 3 over bark)
Forest Other wooded landCategory
1990 2000 2005 2010 2015 1990 2000 2005 2010 2015
Totalgrowingstock
52.99 52.41 52.15 51.8 51.52 24.46 24.29 24.21 24.12 24.02
... ofwhichconiferous
0.6 0.51 0.51 0.37 0.31 0 0 0 0 0
... ofwhichbroadleaved
52.39 51.9 51.64 51.43 51.21 24.46 24.29 24.21 24.12 24.02
Table 3b
Category/Species name Growing stock in forest (million cubic meters)
Rank Scientific name Common name 1990 2000 2005 2010
1 st Syzygiumjambos
Rose Apple 2.54 2.52 2.5 2.49
2 nd Mangiferaindica
Mango 2.33 2.31 2.29 2.28
3 rd Cecropia peltata Trumpet Tree 2.23 2.2 2.19 2.18
4 th Nectandra spp. Sweetwood 1.64 1.62 1.62 1.61

FRA 2015 – Country Report, Jamaica
52
5 th Brosimumalicastrum
Breadnut 1.48 1.47 1.46 1.45
6 th Calophyllumcalaba
Santa Maria 1.22 1.21 1.2 1.19
7 th Hibiscus elatus Blue Mahoe 1.22 1.21 1.2 1.19
8 th Lauraceae spp. Sweetwoods 1.17 1.15 1.15 1.14
9 th Sideroxylonspp.
Bullets 1.17 1.15 1.15 1.14
10 th Cedrela odorata Cedar 1.11 1.1 1.1 1.09
Remaining 36.88 36.48 36.3 36.05
TOTAL 52.99 52.42 52.16 51.81
THE PRE-FILLED VALUES FOR GROWING STOCK REFER TO THE FOLLOWINGTHRESHOLD VALUES (SEE TABLE BELOW)
Item Value Complementary information
Minimum diameter (cm) at breast heightof trees included in growing stock (X)
10 cm All species
Minimum diameter (cm) at the top end ofstem for calculation of growing stock (Y)
7 cm 7cm for Pinus species and crown point forother species
Minimum diameter (cm) of branchesincluded in growing stock (W)
7 cm N/A
Volume refers to above ground (AG) orabove stump (AS)
AG N/A
PLEASE NOTE THAT THE DEFINITION OF GROWING STOCK HAS CHANGED AND SHOULDBE REPORTED AS GROWING STOCK DBH 10 CM INCLUDING THE STEM FROM GROUNDLEVEL UP TO A DIAMETER OF 0 CM, EXCLUDING BRANCHES.
Table 3c
Net annual increment (m 3 per hectare and year)
ForestCategory
1990 2000 2005 2010 2015
Net annualincrement
N/A N/A N/A N/A N/A
... of whichconiferous
N/A N/A N/A N/A N/A
... of whichbroadleaved
N/A N/A N/A N/A N/A
Table 3d

FRA 2015 – Country Report, Jamaica
53
Biomass (million metric tonnes oven-dry weight)
Forest Other wooded landCategory
1990 2000 2005 2010 2015 1990 2000 2005 2010 2015
Abovegroundbiomass
79.94 79.26 78.87 78.54 78.21 43.62 43.28 43.11 42.97 42.8
Belowgroundbiomass
23.07 23 22.89 22.81 22.74 12.68 12.58 12.53 12.49 12.43
Deadwood
N/A N/A N/A N/A N/A N/A N/A N/A N/A N/A
TOTAL 103.01 102.26 101.76 101.35 100.95 56.30 55.86 55.64 55.46 55.23
Table 3e
Carbon (Million metric tonnes)
Forest Other wooded landCategory
1990 2000 2005 2010 2015 1990 2000 2005 2010 2015
Carbonin abovegroundbiomass
37.57 37.25 37.07 36.93 36.76 20.5 20.34 20.26 20.2 20.12
Carbonin belowgroundbiomass
10.84 10.81 10.76 10.72 10.69 5.96 5.91 5.89 5.87 5.84
SubtotalLivingbiomass
48.41 48.06 47.83 47.65 47.45 26.46 26.25 26.15 26.07 35.96
Carbonin deadwood
N/A N/A N/A N/A N/A N/A N/A N/A N/A N/A
Carbonin litter
0.74 0.73 0.72 0.72 0.71 N/A N/A N/A N/A N/A
SubtotalDeadwoodand litter
0.74 0.73 0.72 0.72 0.71 N/A N/A N/A N/A N/A
Soilcarbon
21.37 21.14 21.02 20.9 20.78 15.76 15.66 15.6 15.56 15.51
TOTAL 70.52 69.93 69.57 69.27 68.94 42.22 41.91 41.75 41.63 41.47
Tiers
Variable/category Tier for status Tier for trend

FRA 2015 – Country Report, Jamaica
54
Total growing stock Tier 2 Tier 2
Net annual increment N/A N/A
Above ground biomass Tier 2 Tier 2
Below ground biomass Tier 2 Tier 2
Dead wood N/A N/A
Carbon in above-ground biomass Tier 1 Tier 1
Carbon in below ground biomass Tier 1 Tier 1
Carbon in dead wood and litter Tier 1 Tier 1
Soil carbon Tier 1 Tier 1
Tier criteria
Category Tier for status Tier for reported trend
Total growing stock Tier 3: Data sources Recent 10 yearsNational Forest Inventory or remotesensing with ground truthing orprogramme for repeated compatible NFI10 years Domestic volume functions Tier2: Data sources/registers and statisticsmodelling or old NFI 10 years or partialfield inventory Tier 1: Other data sources
Tier 3: Estimate based on repeatedcompatible tiers 3 (tier for status)Domestic growth functions Tier 2:Estimate based on repeated compatible tier2 or combination tier 3 and 2 or 1 tier forstatus Tier 1: Other
Net annual increment Tier 3: Scientifically tested nationalvolume and growth functions Tier 2:Selection of volume and growth functionsas relevant as possible Tier 1: Other
Tier 3: Confirmation/adjustment offunctions used through scientific workTier 2: Review work done to seekalternative functions Tier: 1 Other
Biomass Tier 3: Country-specific national or sub-national biomass conversion expansionfactors applied or other domestic orotherwise nationally relevant biomassstudies Tier 2: Application of countryspecific national or sub-national biomassconversion factors from other countrywith similar climatic conditions and foresttypes Tier 1: International/regional defaultbiomass expansion factors applied
Tier 3 : Estimate based on repeatedcompatible tiers 3 (tier for status) Tier 2 :Estimate based on repeated compatible tier2 or combination tier 3 and 2 or 1 (tier forstatus) Tier 1 : Other
• Carbon in above ground biomass• Carbon in below ground biomass• Carbon in dead wood and litter• Soil carbon
Tier 3: Country-specific national or sub-national biomass conversion expansionfactors applied Tier 2: Applicationof country specific national or sub-national biomass conversion factorsform from other country with similarclimatic conditions and forest types Tier1: International/regional default biomassexpansion factors applied
Tier 3 : Estimate based on repeatedcompatible tiers 3 (tier for status) Tier 2 :Estimate based on repeated compatible tier2 or combination tier 3 and 2 or 1 (tier forstatus) Tier 1 : Other

FRA 2015 – Country Report, Jamaica
55
3.5 Comments on growing stock biomass and carbon
Category Comments related todata definitions etc Comments on the reported trend
Total growing stock N/A Growing stock for OWL include shortopen dry areas which are classified asforest areas nationally, These areas arereclassified from forest to OWL becausethey do not satisfy FAO's height criterionfor forest class. OWL also include areaswhich are not classified nationally asforest but may fit FAO's criteria for forestclassification but have been used as OWLfor this report.
Growing stock of broadleaved coniferous N/A N/A
Growing stock composition N/A N/A
Net annual increment The latest calculations to determine NAIwas done outside the reporting years andcould not be used for this report
No available relevant data
Above-ground biomass Tables were reclassified to match thereclassification percentages used forgrowing stock data. Because of a changein reclassification the figures for biomasshave been changed.
N/A
Below-ground biomass N/A N/A
Dead wood N/A N/A
Carbon in above-ground biomass N/A N/A
Carbon in below-ground biomass N/A N/A
Carbon in dead wood N/A N/A
Carbon in litter N/A N/A
Soil carbon N/A N/A
Other general comments to the table
Tables were reclassified to match the reclassification percentages used in Growing stock data. Because of a change inreclassification the figures for Biomass which were reported earlier have been altered. Other tables have also shown alterations incalculations.
FRA 2015 – Country Report, Jamaica
56
4. What is the status of forest production and how has it changed over time?Documents for this question:
• Guide for country reporting FRA 2015• FRA 2015 Terms and Definitions
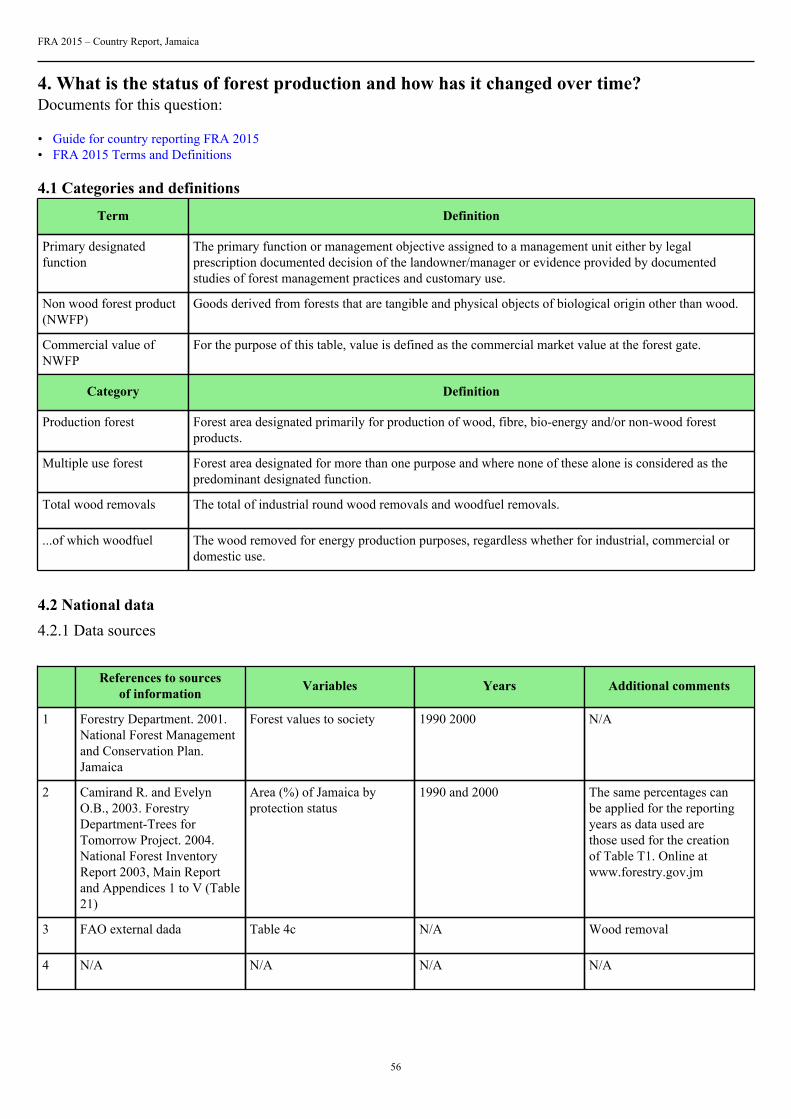
4.1 Categories and definitions
Term Definition
Primary designatedfunction
The primary function or management objective assigned to a management unit either by legalprescription documented decision of the landowner/manager or evidence provided by documentedstudies of forest management practices and customary use.
Non wood forest product(NWFP)
Goods derived from forests that are tangible and physical objects of biological origin other than wood.
Commercial value ofNWFP
For the purpose of this table, value is defined as the commercial market value at the forest gate.
Category Definition
Production forest Forest area designated primarily for production of wood, fibre, bio-energy and/or non-wood forestproducts.
Multiple use forest Forest area designated for more than one purpose and where none of these alone is considered as thepredominant designated function.
Total wood removals The total of industrial round wood removals and woodfuel removals.
...of which woodfuel The wood removed for energy production purposes, regardless whether for industrial, commercial ordomestic use.
4.2 National data4.2.1 Data sources
References to sourcesof information Variables Years Additional comments
1 Forestry Department. 2001.National Forest Managementand Conservation Plan.Jamaica
Forest values to society 1990 2000 N/A
2 Camirand R. and EvelynO.B., 2003. ForestryDepartment-Trees forTomorrow Project. 2004.National Forest InventoryReport 2003, Main Reportand Appendices 1 to V (Table21)
Area (%) of Jamaica byprotection status
1990 and 2000 The same percentages canbe applied for the reportingyears as data used arethose used for the creationof Table T1. Online atwww.forestry.gov.jm
3 FAO external dada Table 4c N/A Wood removal
4 N/A N/A N/A N/A
FRA 2015 – Country Report, Jamaica
57
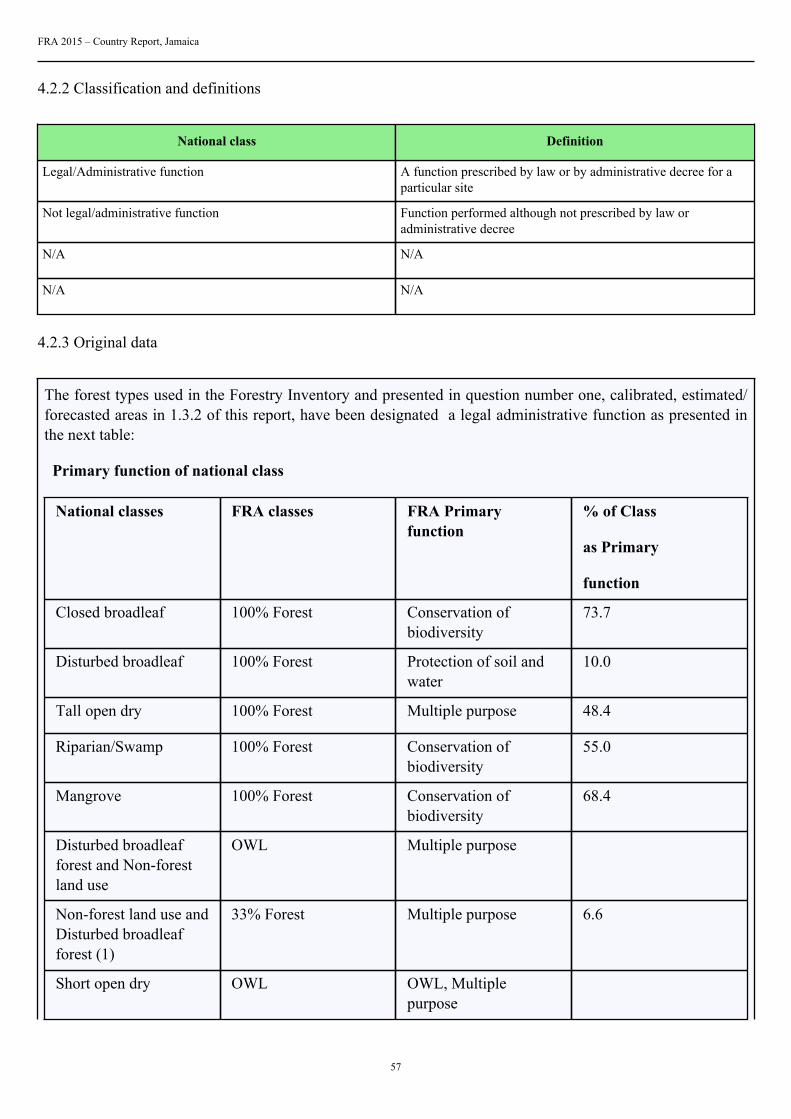
4.2.2 Classification and definitions
National class Definition
Legal/Administrative function A function prescribed by law or by administrative decree for aparticular site
Not legal/administrative function Function performed although not prescribed by law oradministrative decree
N/A N/A
N/A N/A
4.2.3 Original data
The forest types used in the Forestry Inventory and presented in question number one, calibrated, estimated/forecasted areas in 1.3.2 of this report, have been designated a legal administrative function as presented inthe next table:
Primary function of national class
National classes FRA classes FRA Primaryfunction
% of Class
as Primary
function
Closed broadleaf 100% Forest Conservation ofbiodiversity
73.7
Disturbed broadleaf 100% Forest Protection of soil andwater
10.0
Tall open dry 100% Forest Multiple purpose 48.4
Riparian/Swamp 100% Forest Conservation ofbiodiversity
55.0
Mangrove 100% Forest Conservation ofbiodiversity
68.4
Disturbed broadleafforest and Non-forestland use
OWL Multiple purpose
Non-forest land use andDisturbed broadleafforest (1)
33% Forest Multiple purpose 6.6
Short open dry OWL OWL, Multiplepurpose
FRA 2015 – Country Report, Jamaica
58
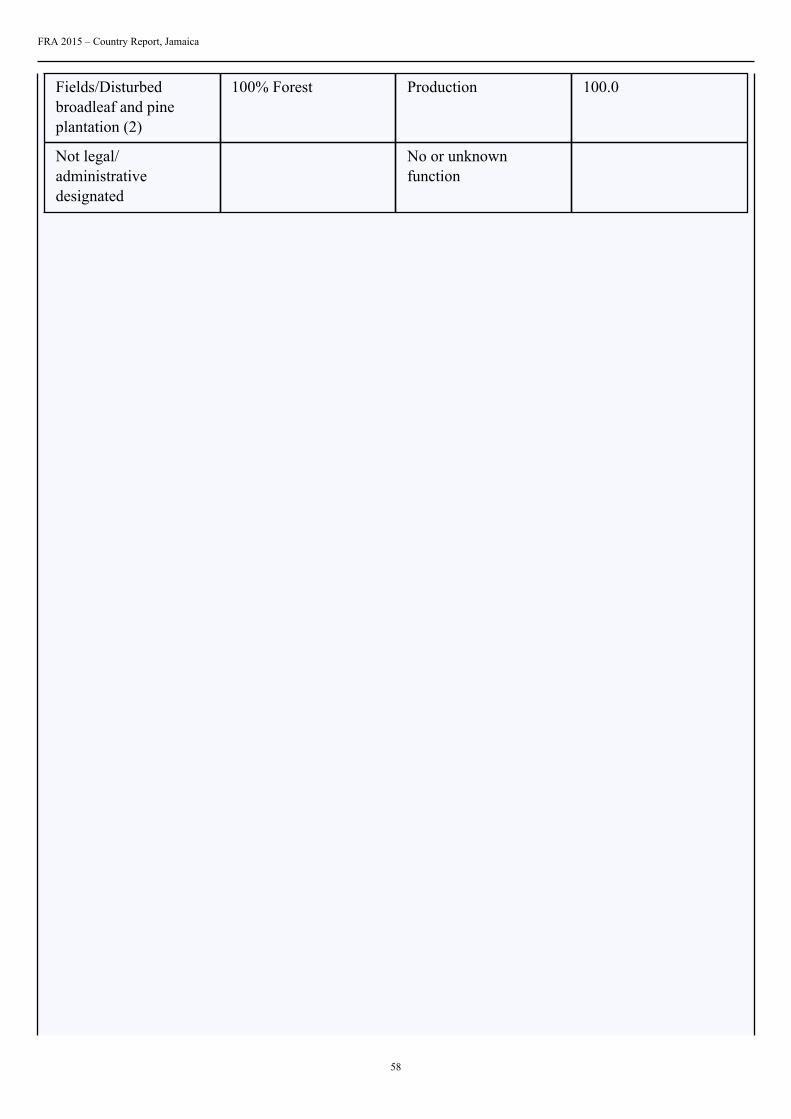
Fields/Disturbedbroadleaf and pineplantation (2)
100% Forest Production 100.0
Not legal/administrativedesignated
No or unknownfunction

FRA 2015 – Country Report, Jamaica
59
Note: Fields/Disturbed broadleaf and pine plantation consists of Carib pine plantation and Other speciesplantation
This gives the results of primary function as presented below for specific years.
4.3 Analysis and processing of national data4.3.1 Adjustment
Not needed
4.3.2 Estimation and forecasting
Total forest area used is the one reported in table number 1. The areas serving for functions are basedclassifications and on expert opinion.
Primary Function - for year 1990 (000 hectares)

FRA 2015 – Country Report, Jamaica
60
PrimaryFunction
Legal/Administrative Designated Function
Sub-Class Production Protectionof soil andwater
Conservationofbiodiversity
Socialservices
Multiplepurposes
No orunknownfunction
Closedbroadleaf
65.5 23.4
Disturbedbroadleaf
17.7 159.6
Tall opendry
20.4 21.8
Riparian/Swamp
1.3 1.1
Mangrove 6.7 3.1
Caribbeanpineplantation
5.0 0.0
Otherspeciesplantation
3.9 0.0
*Non-forest landuse anddisturbedbroadleafforest
1.00 14.2
TotalForestFunction
8.9 18.7 73.5 0.0 20.4 223.1
* The area of Non-forest land use and disturbed broadleaf forest classified as forest consists of Bamboo, andBamboo and disturbed broadleaf from Table T1 (estimation and forecasting)
Figures in bold are transferred to reporting table T3 for corresponding year
Primary Function - for year 2000
PrimaryFunction
Legal/Administrative Designated Function
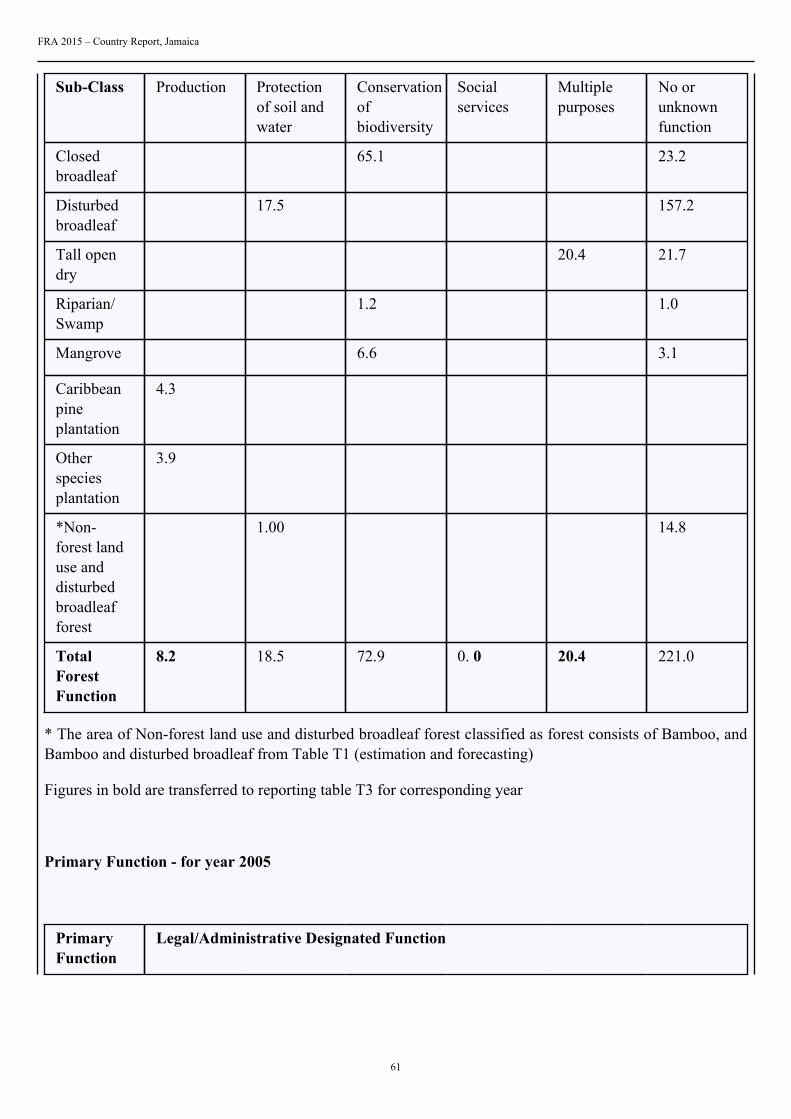
FRA 2015 – Country Report, Jamaica
61
Sub-Class Production Protectionof soil andwater
Conservationofbiodiversity
Socialservices
Multiplepurposes
No orunknownfunction
Closedbroadleaf
65.1 23.2
Disturbedbroadleaf
17.5 157.2
Tall opendry
20.4 21.7
Riparian/Swamp
1.2 1.0
Mangrove 6.6 3.1
Caribbeanpineplantation
4.3
Otherspeciesplantation
3.9
*Non-forest landuse anddisturbedbroadleafforest
1.00 14.8
TotalForestFunction
8.2 18.5 72.9 0. 0 20.4 221.0
* The area of Non-forest land use and disturbed broadleaf forest classified as forest consists of Bamboo, andBamboo and disturbed broadleaf from Table T1 (estimation and forecasting)
Figures in bold are transferred to reporting table T3 for corresponding year
Primary Function - for year 2005
PrimaryFunction
Legal/Administrative Designated Function

FRA 2015 – Country Report, Jamaica
62
Sub-Class Production Protectionof soil andwater
Conservationofbiodiversity
Socialservices
Multiplepurposes
No orunknownfunction
Closedbroadleaf
64.9 23.1
Disturbedbroadleaf
17.3 156
Tall opendry
20.3 21.7
Riparian/Swamp
1.1 0.9
Mangrove 6.6 3.0
Caribbeanpineplantation
4.3
Otherspeciesplantation
3.9
*Non-forest landuse anddisturbedbroadleafforest
1.1 15.0
TotalForestFunction
8.2 18.4 72.5 0.0 20.3 223.0
* The area of Non-forest land use and disturbed broadleaf forest classified as forest consists of Bamboo, andBamboo and disturbed broadleaf from Table T1 (estimation and forecasting)
Figures in bold are transferred to reporting table T3 for corresponding year
Primary Function - for year 2010
PrimaryFunction
Legal/Administrative Designated Function

FRA 2015 – Country Report, Jamaica
63
Sub-Class Production Protectionof soil andwater
Conservationofbiodiversity
Socialservices
Multiplepurposes
No orunknownfunction
Closedbroadleaf
64.7 23.1
Disturbedbroadleaf
17.2 154.8
Tall opendry
20.3 21.7
Riparian/Swamp
1.1 0.9
Mangrove 6.6 3.0
Caribbeanpineplantation
3.1
Otherspeciesplantation
4.1
*Non-forest landuse anddisturbedbroadleafforest
1.1 15.5
TotalForestFunction
7.3 18.3 72.3 0.0 20.3 218.9
* The area of Non-forest land use and disturbed broadleaf forest classified as forest consists of Bamboo, andBamboo and disturbed broadleaf from Table T1 (estimation and forecasting)
Figures in bold are transferred to reporting table T3 for corresponding year
Primary function for year 2015
PrimaryFunction
Legal/Administrative Designated Function
Sub-Class Production Protectionof soil andwater
Conservationofbiodiversity
Socialservices
Multiplepurposes
No orunknownfunction
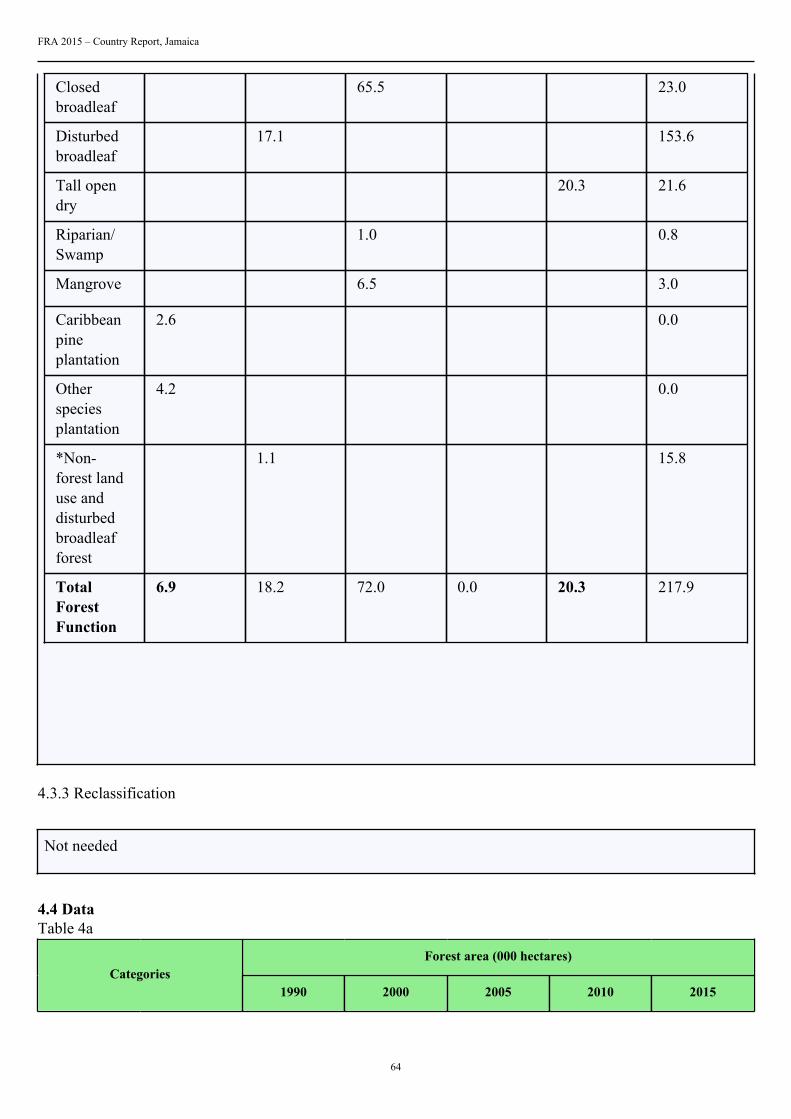
FRA 2015 – Country Report, Jamaica
64
Closedbroadleaf
65.5 23.0
Disturbedbroadleaf
17.1 153.6
Tall opendry
20.3 21.6
Riparian/Swamp
1.0 0.8
Mangrove 6.5 3.0
Caribbeanpineplantation
2.6 0.0
Otherspeciesplantation
4.2 0.0
*Non-forest landuse anddisturbedbroadleafforest
1.1 15.8
TotalForestFunction
6.9 18.2 72.0 0.0 20.3 217.9
4.3.3 Reclassification
Not needed
4.4 DataTable 4a
Forest area (000 hectares)Categories
1990 2000 2005 2010 2015

FRA 2015 – Country Report, Jamaica
65
Production forest 8.9 8.2 8.2 7.3 6.9
Multiple useforest
20.4 20.4 20.3 20.3 20.3
Table 4b
Rank Name of product Key species
Commercial valueof NWFP removals
2010 (value 1000local currency)
NWFP category
1 st N/A. N/A N/A N/A
2 nd N/A N/A N/A N/A
3 rd N/A N/A N/A N/A
4 th N/A N/A N/A N/A
5 th N/A N/A N/A N/A
6 th N/A N/A N/A N/A
7 th N/A N/A N/A N/A
8 th N/A N/A N/A N/A
9 th N/A N/A N/A N/A
10 th N/A N/A N/A N/A
TOTAL .00
2010
Name of local currency Jamaican dollar
Category
Plant products / raw material
1 Food
2 Fodder
3 Raw material for medicine and aromatic products
4 Raw material for colorants and dyes
5 Raw material for utensils handicrafts construction
6 Ornamental plants

FRA 2015 – Country Report, Jamaica
66
7 Exudates
8 Other plant products
Animal products / raw material
9 Living animals
10 Hides skins and trophies
11 Wild honey and beewax
12 Wild meat
13 Raw material for medicine
14 Raw material for colorants
15 Other edible animal products
16 Other non-edible animal products
Table 4c Pre-filled data from FAOSTAT
FRA 2015 category (1000 m 3 u.b.)Year
Total wood removals ...of which woodfuel
1990 1055 853
1991 917 750
1992 695.5 500
1993 630.4 450
1994 675 400
1995 577.1 300
1996 770.01 491.81
1997 803.52 524.22
1998 828.59 547.29
1999 855.82 572.42
2000 882.11 598.71
2001 874.83 591.43
2002 867.63 584.23

FRA 2015 – Country Report, Jamaica
67
2003 860.52 577.12
2004 853.5 570.1
2005 842.16 563.16
2006 838.49 559.49
2007 833.8 555.8
2008 830.2 552.2
2009 826.63 548.63
2010 700.05 545.05
2011 693.02 541.02
Tiers
Category Tier for status Tier for reported trend
Production forest Tier 2 Tier 2
Multiple use forest Tier 1 Tier 1
Tier Criteria
Category Tier for status Tier for reported trend
Production forest Multiple use forest Tier 3: Updated including fieldverifications national forest mapsincluding functions Tier 2: Forest mapsolder than 6 years including forestfunctions Tier 1: Other
Tier 3 : Estimate based on repeatedcompatible tiers 3 (tier for status) Tier 2 :Estimate based on repeated compatible tier2 or combination tier 3 and 2 or 1 (tier forstatus) Tier 1 : Other
4.5 Comments
Category Comments related todata definitions etc Comments on the reported trend
Production forest All our plantation forest are used asproduction forest
N/A
Multiple use forest Multiple purpose area is assumed to serveall four functions
N/A
Total wood removals The reported figures are roundwoodremovals given as external data extractedfrom FAOSTATS
N/A
Commercial value of NWFP Data not available N/A
Other general comments to the table

FRA 2015 – Country Report, Jamaica
68
Plant material collected from the forest is used for a variety of purposes. The principal source of materials for making hats, bags,table-mats, etc., is Jippi jappa (Carludovica palmata). Bamboo (Banbusa vulgaris) and thatch (Thrinax parviflora) are used mostoften for temporary construction. Strips from the Rose Apple (Eugenia jambos) are used to make baskets and hampers. Wicker iswidely used in furniture making. The bark from the bastard cabbage tree (Andira inermisis) used to make rope to bundle agriculturalproduce and for lashing poles together in temporary construction. Fern (Cyathea sp.)root is collected for the horticultural sectorfor use as a growing medium, particularly in orchid production. Mahogany (Swietenia mahogani) bark is still collected for use as adye. Bamboo is used for craft purposes and Christmas trees (Cupressus lusitanica),) are sold commercially at Christmas time. Manyother trees and forest plants are used medicinally: for example, Chainy root (Similax balbisiana) is used in the making of restorativetonics, chewsticks (Gouania lupuloides) are collected for cleaning teeth, nettle is steeped to make a drink rich in mineral salts andvitamins, and the extract of bitterwood (Picramnia antidesma) bark is used as a liver tonic, for fevers and for eliminating roundworm. How much of these materials are removed from the forest is not known nor is there current information with respect to theirrelative social and economic importance. A survey (with quantity data) of the utilisation of minor forest products would providevaluable information for use in assessing forest management options.

FRA 2015 – Country Report, Jamaica
69
5. How much forest area is managed for protection of soil and water and ecosystemservices?Documents for this question:
• Guide for country reporting FRA 2015• FRA 2015 Terms and Definitions
5.1 Categories and definitions
Category Definition
Protection of soil andwater
Forest area designated or managed for protection of soil and water
...of which productionof clean water (sub-category)
Forest area primarily designated or managed for water production, where most human uses are excludedor heavily modified to protect water quality.
...of which coastalstabilization (sub-category)
Forest area primarily designated or managed for coastal stabilization.
...of which desertificationcontrol (sub-category)
Forest area primarily designated or managed for desertification control.
...of which avalanchecontrol (sub-category)
Forest area primarily designated or managed to prevent the development or impact of avalanches onhuman life assets or infrastructure.
...of which erosion, floodprotection or reducingflood risk (sub-category)
Forest area primarily designated or managed for protecting communities or assets from the impacts oferosion riparian floods and landslides or for providing flood plain services.
...of which other (sub-category)
Forest area primarily designated or managed for other protective functions.
Ecosystem services,cultural or spiritual values
Forest area primarily designated or managed for selected ecosystem services or cultural or spiritualvalues.
...of which publicrecreation (sub-category)
Forest area designated or managed for public recreation.
...of which carbon storageor sequestration (sub-category)
Forest area designated or managed for carbon storage or sequestration.
...of which spiritual orcultural services (sub-category)
Forest area designated or managed for spiritual or cultural services.
...of which other (sub-category)
Forest area designated or managed for other ecosystem services.
5.2 National data5.2.1 Data sources
References to sourcesof information Variables Years Additional comments
1 Forestry Department. 2001.National Forest Managementand Conservation Plan.Jamaica
Strategy 6: Forest Protection N/A N/A

FRA 2015 – Country Report, Jamaica
70
2 N/A N/A N/A N/A
3 N/A N/A N/A N/A
4 N/A N/A N/A N/A
5.2.2 Classification and definitions
National class Definition
N/A N/A
N/A N/A
N/A N/A
N/A N/A
5.2.3 Original data
5.3 Analysis and processing of national data5.3.1 Adjustment
Not necessary
5.3.2 Estimation and forecasting
Not necessary
5.3.3 Reclassification
Not necessary
5.4 DataTable 5a
Forest area (1000 hectares)Categories
1990 2000 2005 2010 2015
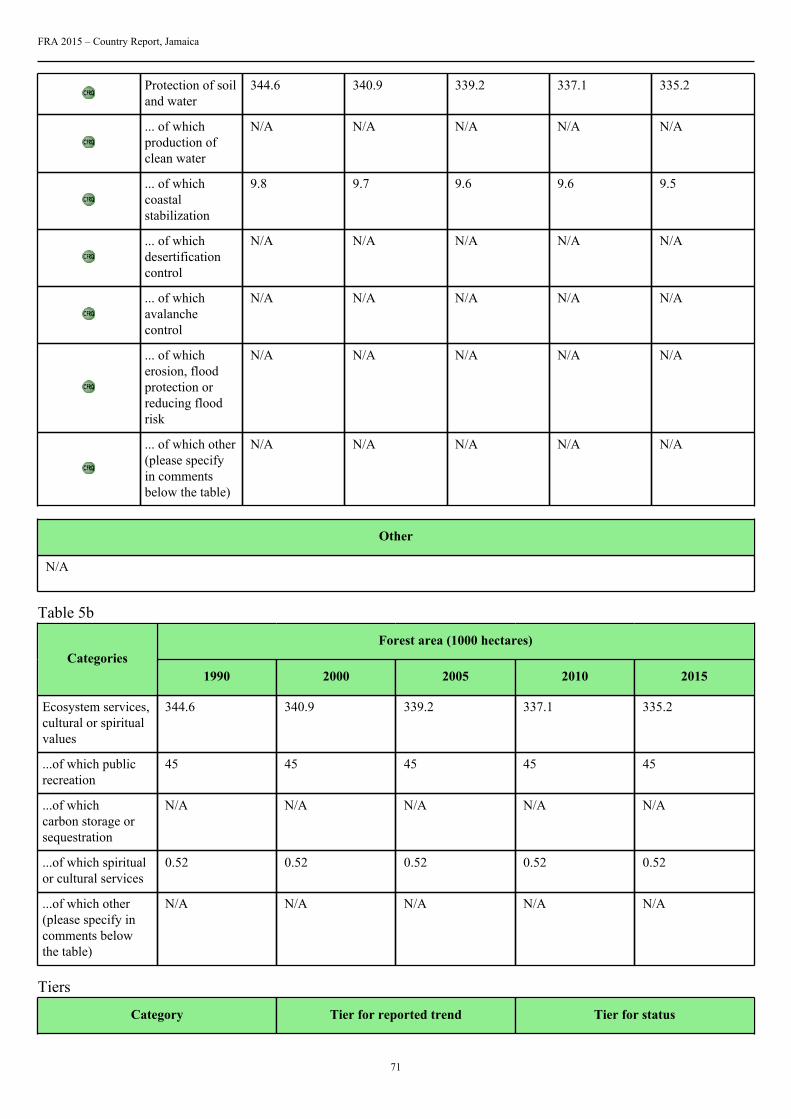
FRA 2015 – Country Report, Jamaica
71
Protection of soiland water
344.6 340.9 339.2 337.1 335.2
... of whichproduction ofclean water
N/A N/A N/A N/A N/A
... of whichcoastalstabilization
9.8 9.7 9.6 9.6 9.5
... of whichdesertificationcontrol
N/A N/A N/A N/A N/A
... of whichavalanchecontrol
N/A N/A N/A N/A N/A
... of whicherosion, floodprotection orreducing floodrisk
N/A N/A N/A N/A N/A
... of which other(please specifyin commentsbelow the table)
N/A N/A N/A N/A N/A
Other
N/A
Table 5b
Forest area (1000 hectares)Categories
1990 2000 2005 2010 2015
Ecosystem services,cultural or spiritualvalues
344.6 340.9 339.2 337.1 335.2
...of which publicrecreation
45 45 45 45 45
...of whichcarbon storage orsequestration
N/A N/A N/A N/A N/A
...of which spiritualor cultural services
0.52 0.52 0.52 0.52 0.52
...of which other(please specify incomments belowthe table)
N/A N/A N/A N/A N/A
Tiers
Category Tier for reported trend Tier for status

FRA 2015 – Country Report, Jamaica
72
Protection of soil and water Tier 2 Tier 2
Ecosystem services, cultural or spiritualvalues
Tier 2 Tier 2
Tier criteria
Category Tier for status Tier for reported trend
Protection of soil and water Tier 3: High reliability data derived eitherfrom high intensity sample survey or dataobtained from national or state agenciesresponsible for regulations or legislationrelating to soil and water protection. Tier2: Approaches based on low intensityor incomplete sample-based surveys orstudies that provide data for specific areasthat is extrapolated through statisticalanalysis to national level estimates. Tier 1:Other
Tier 3 : Estimate based on repeatedcompatible tiers 3 (tier for status) Tier 2 :Estimate based on repeated compatible tier2 or combination tier 3 and 2 or 1 (tier forstatus) Tier 1 : Other
• Cultural or spiritual values• Public recreation• Spiritual or cultural services• Other
Tier 3: High reliability data derivedeither from high intensity sample surveyor data obtained from national or stateagencies responsible for regulations. Tier2: Approaches based on low intensityor incomplete sample-based surveys orstudies that provide data for specific areasthat is extrapolated through statisticalanalysis to national level estimates. Tier 1:Other
Tier 3 : Estimate based on repeatedcompatible tiers 3 (tier for status) Tier 2 :Estimate based on repeated compatible tier2 or combination tier 3 and 2 or 1 (tier forstatus) Tier 1 : Other
5.5 Comments
Category Comments related todata definitions etc Comments on the reported trend
Protection of soil and water All the forest are used for this purpose N/A
Production of clean water An estimated 70% of forest total N/A
Coastal stabilization All the mangrove forest are used for thispurpose
N/A
Desertification control Not applicable Not applicable
Avalanche control Not applicable Not applicable
Erosion, flood protection or reducing floodrisk
All our forest plays a critical roll in thisfunction
N/A
Other protective functions No data available N/A
Ecosystem services, cultural or spiritualvalues
Total forest area is use for ecosystemservices
N/A

FRA 2015 – Country Report, Jamaica
73
Public recreation The Blue and John Crow MountainsNational Park, sections of forest reservesand other sections of the forest soon to bedeclared Forest Management Areas areused periodically for public recreation
N/A
Carbon storage or sequestration No data available N/A
Spiritual or cultural services Forest in possession of the JamaicanMaroons are used for this purpose. Actualacreage is unknown at this time andacreage reported is an expert opinion.
N/A
Other ecosystem services N/A N/A
Other general comments to the table
N/A

FRA 2015 – Country Report, Jamaica
74
6. How much forest area is protected and designated for the conservation of biodiversityand how has it changed over time?Documents for this question:
• Guide for country reporting FRA 2015• FRA 2015 Terms and Definitions
6.1 Categories and definitions
Category Definition
Conservation ofbiodiversity
Forest area designated primarily for conservation of biological diversity. Includes but is not limited toareas designated for biodiversity conservation within the protected areas.
Forest area withinprotected areas
Forest area within formally established protected areas independently of the purpose for which theprotected areas were established.
6.2 National data6.2.1 Data sources
References to sourcesof information Variables Years Additional comments
1 Forestry Department. 2001.National Forest Managementand Conservation Plan.Jamaica
Forest values to society 1990 2000 N/A
2 Camirand R. and EvelynO.B., 2003. ForestryDepartment-Trees forTomorrow Project. 2004.National Forest InventoryReport 2003, Main Reportand Appendices 1 to V (Table21)
Area (%) of Jamaica byprotection status
1990 and 2000 The same percentages canbe applied for the reportingyears as data used arethose used for the creationof Table T1. Online atwww.forestry.gov.jm
3 N/A N/A N/A N/A
4 N/A N/A N/A N/A
6.2.2 Classification and definitions
National class Definition
Legal/Administrative function A function prescribed by law or by administrative decree for aparticular site
Not legal/administrative function Function performed although not prescribed by law oradministrative decree
N/A N/A
N/A N/A

FRA 2015 – Country Report, Jamaica
75
6.2.3 Original data
See 4.2.3
6.3 Analysis and processing of national data6.3.1 Adjustment
Not needed
6.3.2 Estimation and forecasting
See 4.3.2
6.3.3 Reclassification
6.4 DataTable 6
Forest area (000 hectares)Categories
1990 2000 2005 2010 2015
Conservation ofbiodiversity
73.2 72.7 72.3 72.3 72
Forest areawithin protectedareas
120.6 119.3 118.7 118.6 118.6
Tiers
Category Tier for status Tier for reported trend
Conservation of biodiversity Tier 3 Tier 2
Forest area within protected areas Tier 2 Tier 2
Tier criteria
Category Tier for status Tier for reported trend

FRA 2015 – Country Report, Jamaica
76
• Conservation of biodiversity• Forests within protected areas
Tier 3: Data obtained from national orstate agencies responsible for conservationand protected area or legislation relatingto area protection. Tier 2: Studies thatprovide data for specific areas that isextrapolated through statistical analysis tonational level estimates Tier 1 Other
Tier 3 : Estimate based on repeatedcompatible tiers 3 (tier for status) Tier 2 :Estimate based on repeated compatible tier2 or combination tier 3 and 2 or 1 (tier forstatus) Tier 1 : Other
6.5 Comments
Category Comments related todata definitions etc Comments on the reported trend
Conservation of biodiversity The majority of the Closed broadleaf,Mangrove and Riparian forests serves thispurpose
Similar percentages of the forest types arereported on for the reporting years
Forest area within protected areas Protected areas consists of ForestReserves, Forest Management Areas,National Parks and other protected areas
The forests cover within the protectedareas have seen less reduction due to bettermanagement practices, effective policingand effectiveness of the forest policies andregulations
Other general comments to the table
N/A

FRA 2015 – Country Report, Jamaica
77
7. What is the area of forest affected by woody invasive species?Documents for this question:
• Guide for country reporting FRA 2015• FRA 2015 Terms and Definitions
7.1 Categories and definitions
Category Definition
Invasive species Species that are non-native to a particular ecosystem and whose introduction and spread cause, or arelikely to cause, socio-cultural, economic or environmental harm or harm to human health.
7.2 National data7.2.1 Data sources
References to sourcesof information Variables Years Additional comments
1 FRA 2010, Table 10c Area affected by woodyinvasive species
2005 N/A
2 N/A N/A N/A N/A
3 N/A N/A N/A N/A
4 N/A N/A N/A N/A
7.2.2 Classification and definitions
National class Definition
N/A N/A
N/A N/A
N/A N/A
N/A N/A
7.2.3 Original data
FRA 2010, Table 10c
7.3 Analysis and processing of national data
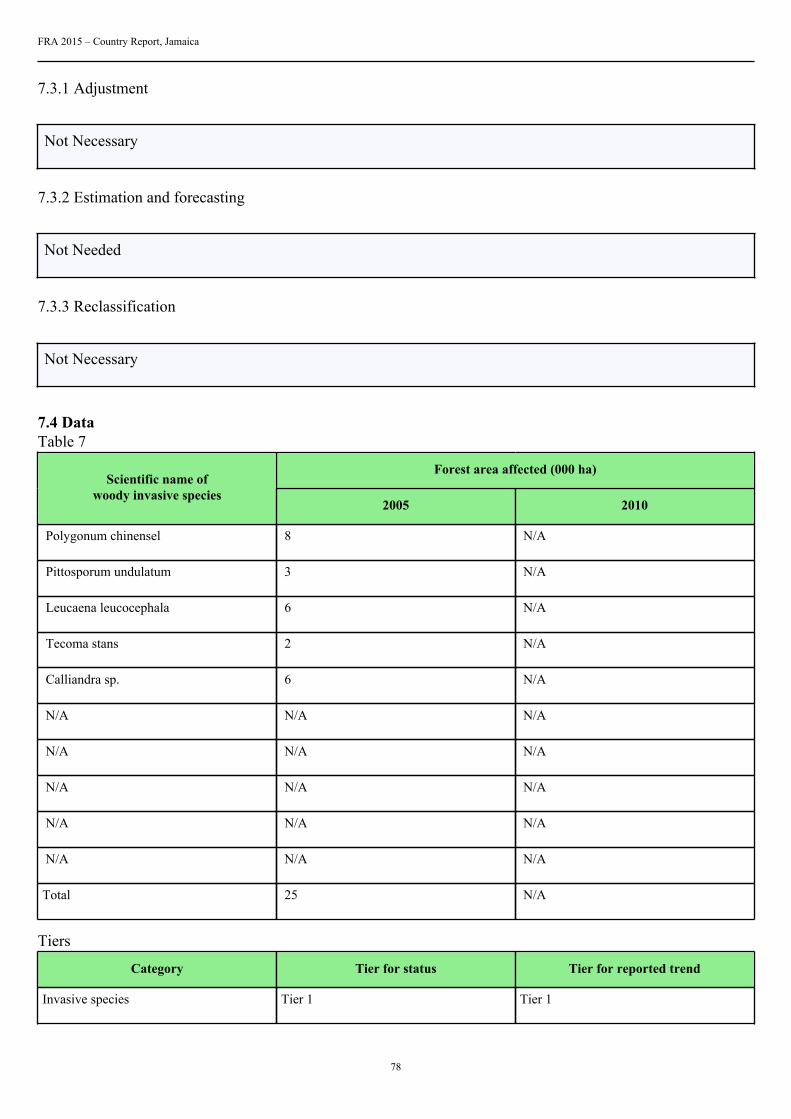
FRA 2015 – Country Report, Jamaica
78
7.3.1 Adjustment
Not Necessary
7.3.2 Estimation and forecasting
Not Needed
7.3.3 Reclassification
Not Necessary
7.4 DataTable 7
Forest area affected (000 ha)Scientific name of
woody invasive species2005 2010
Polygonum chinensel 8 N/A
Pittosporum undulatum 3 N/A
Leucaena leucocephala 6 N/A
Tecoma stans 2 N/A
Calliandra sp. 6 N/A
N/A N/A N/A
N/A N/A N/A
N/A N/A N/A
N/A N/A N/A
N/A N/A N/A
Total 25 N/A
Tiers
Category Tier for status Tier for reported trend
Invasive species Tier 1 Tier 1

FRA 2015 – Country Report, Jamaica
79
Tier Criteria
Category Tier for status Tier for reported trend
Invasive species Tier 3: Systematic assessment in forestinventory or other survey (e.g. byconservation department) within the last5 years) Tier 2: Systematic assessment inforest inventory or other survey (e.g. byconservation department conducted morethan 5 years ago) Tier 1: Other
Tier 3 : Estimate based on repeatedcompatible tiers 3 (tier for status) Tier 2 :Estimate based on repeated compatible tier2 or combination tier 3 and 2 or 1 (tier forstatus) Tier 1 : Other
7.5 Comments
Category Comments related todata definitions etc Comments on the reported trend
Invasive species Areas of invasive species overlaps whichaccounts for the total arrived at.
The total forest area affected by woodyinvasive species is unknown as noeffective area assessment has been donefor invasive species. The total forest areaaffected by woody invasive species for2005 was an estimated expert opinionand the total s not necessary the sumof the values above, as these may beoverlapping.
Other general comments to the table
Although the presence of various invasive species is detected, determination of actual acreages of species have not been done andan estimate of the acreage will not be attempted at this time although eradication of these invasive species have been attempted

FRA 2015 – Country Report, Jamaica
80
8. How much forest area is damaged each year?Documents for this question:
• Guide for country reporting FRA 2015• FRA 2015 Terms and Definitions
8.1 Categories and definitions
Category Definition
Number of fires Number of fires per year
Burned area Area burned per year
Outbreaks of insects A detectable reduction in forest health caused by a sudden increase in numbers of harmful insects.
Outbreaks of diseases A detectable reduction in forest health caused by a sudden increase in numbers of harmful pathogens,such as bacteria, fungi, phytoplasma or virus.
Severe weather events Damage caused severe weather events, such as snow, storm, drought, etc.
8.2 National data8.2.1 Data sources
References to sourcesof information Variables Years Additional comments
1 Forestry Department,Regional Reports
Hurricane damage reports 2004 Estimates of damage done toplantations by hurricane Ivanin September 2004
2 Jamaica Fire Brigade Number of fires 2008-2012 Number of fires recordedannuanny
3 All-Island Jamaica sugarCane Farmer's Association
Sugar cane area harvested 2003-2012 Sugar cane area burnt forharvesting
4 N/A N/A N/A N/A
8.2.2 Classification and definitions
National class Definition
N/A N/A
N/A N/A
N/A N/A
N/A N/A

FRA 2015 – Country Report, Jamaica
81
8.2.3 Original data
8.2.3a Hurricane damage
Year Damage '000 ha
1988 6.10
2004 0.78
8.2.3b Area affected by fire
FRA2010category
2003 2004 2005 2006 2007 2008 2009 2010 2011 2012
000hectares
000numberoffires
000hectares
000numberoffires
000hectares
000numberoffires
000hectares
000numberoffires
000hectares
000numberoffires
000hectares
000numberoffires
000hectares
000numberoffires
000hectares
000numberoffires
000hectares
000numberoffires
000hectares
000numberoffires
Forestareaaffectedbyfire
0.3 0.0 0.0 0.0 0.0 0.0 0.0 0.0 0.0 0.0
BushFire(JFBdata)Uncontrolled
6.6 9.8 6.2 7.1 7.5
Farm(JFBdata)Uncontrolled
0.3 0.4 0.3 0.3 0.3
Totaluncontrolledfire
0.0 0.0 0.0 0.0 0.3 0.0 0.0 0.0 0.0 0.0 0.0 6.9 0.0 10.2 0.0 6.5 0.0 7.4 0.0 7.9
Totalsugarareareaped
30.6 30.6 27.6 30.0 30.8 29.9 6.9 26.3 10.2 27.6 6.5 27.9 7.4 7.9
Totalsugarareaburnt
29.1 29.1 26.2 28.5 29.3 28.4 25.0 26.2 26.5

FRA 2015 – Country Report, Jamaica
82
Totallandareaburnt
29.1 0.0 29.1 0.0 26.5 0.0 28.5 0.0 29.3 0.0 28.4 6.9 25.0 10.2 26.2 6.5 26.5 7.4 0.0 7.9
8.3 Analysis and processing of national data8.3.1 Adjustment
8.3.1a Hurricane damage
Year Damage '000 ha
1988 6.12
2004 0.78
8.2.3a * calibration factor (1.002737226)
8.3.1b Area affected by fire
FRA2010category
2003 2004 2005 2006 2007 2008 2009 2010 2011 2012
000hectares
000numberoffires
000hectares
000numberoffires
000hectares
000numberoffires
000hectares
000numberoffires
000hectares
000numberoffires
000hectares
000numberoffires
000hectares
000numberoffires
000hectares
000numberoffires
000hectares
000numberoffires
000hectares
000numberoffires
Forestareaaffectedbyfire
0.3 0.0 0.0 0.0 0.0 0.0 0.0 0.0 0.0 0.0
BushFire(JFBdata)Uncontrolled
6.6 9.8 6.2 7.1 7.5
Farm(JFBdata)Uncontrolled
0.3 0.4 0.3 0.3 0.3
Totaluncontrolledfire
0.0 0.0 0.0 0.0 0.3 0.0 0.0 0.0 0.0 0.0 0.0 6.9 0.0 10.2 0.0 6.5 0.0 7.4 0.0 7.9
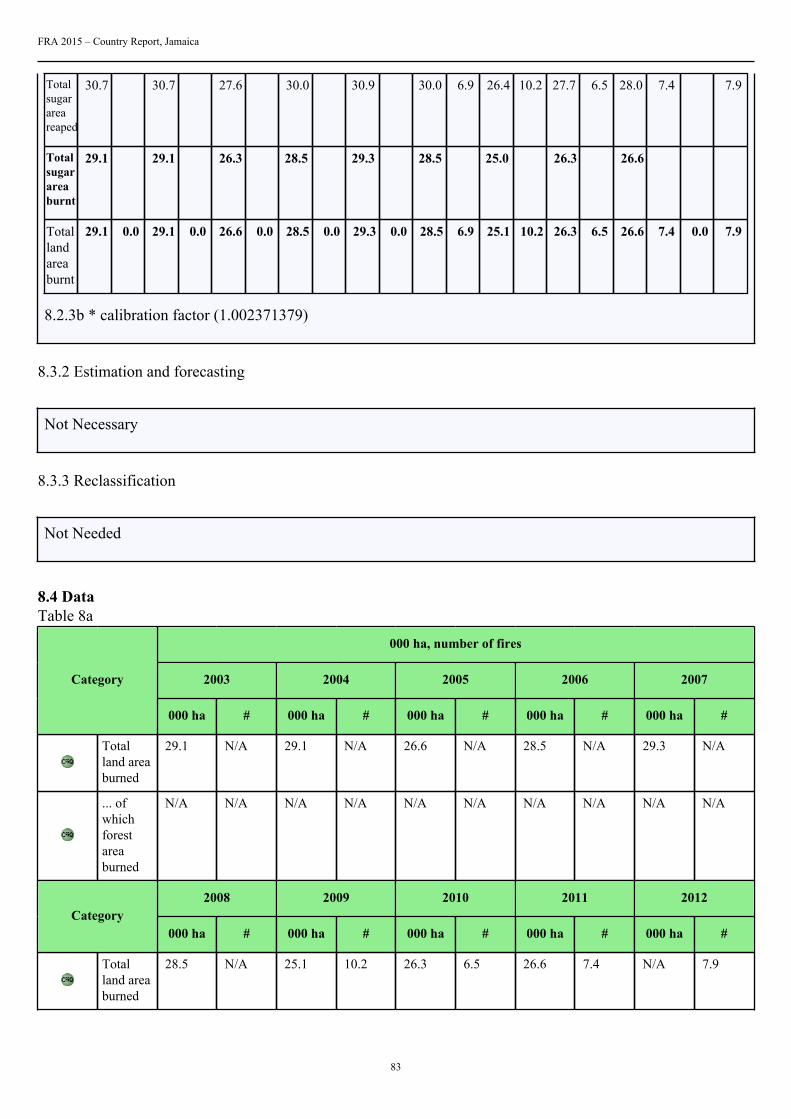
FRA 2015 – Country Report, Jamaica
83
Totalsugarareareaped
30.7 30.7 27.6 30.0 30.9 30.0 6.9 26.4 10.2 27.7 6.5 28.0 7.4 7.9
Totalsugarareaburnt
29.1 29.1 26.3 28.5 29.3 28.5 25.0 26.3 26.6
Totallandareaburnt
29.1 0.0 29.1 0.0 26.6 0.0 28.5 0.0 29.3 0.0 28.5 6.9 25.1 10.2 26.3 6.5 26.6 7.4 0.0 7.9
8.2.3b * calibration factor (1.002371379)
8.3.2 Estimation and forecasting
Not Necessary
8.3.3 Reclassification
Not Needed
8.4 DataTable 8a
000 ha, number of fires
2003 2004 2005 2006 2007Category
000 ha # 000 ha # 000 ha # 000 ha # 000 ha #
Totalland areaburned
29.1 N/A 29.1 N/A 26.6 N/A 28.5 N/A 29.3 N/A
... ofwhichforestareaburned
N/A N/A N/A N/A N/A N/A N/A N/A N/A N/A
2008 2009 2010 2011 2012Category
000 ha # 000 ha # 000 ha # 000 ha # 000 ha #
Totalland areaburned
28.5 N/A 25.1 10.2 26.3 6.5 26.6 7.4 N/A 7.9

FRA 2015 – Country Report, Jamaica
84
... ofwhichforestareaburned
N/A N/A N/A N/A N/A N/A N/A N/A N/A N/A
Table 8b
Outbreak category Description/name Year(s) of latest outbreak Area damaged (000 hectares)
Severe weather event Hurricane Gilbert 1988 6.12
Severe weather event Hurricane Ivan 2004 0.78
N/A N/A N/A N/A
N/A N/A N/A N/A
N/A N/A N/A N/A
N/A N/A N/A N/A
N/A N/A N/A N/A
N/A N/A N/A N/A
N/A N/A N/A N/A
N/A N/A N/A N/A
Outbreak category
1 Insects
2 Diseases
3 Severe weather events
Tiers
Category Tier for status Tier for trend
Area affected by fire Tier 3 Tier 1
• Insects• Diseases• Severe weather events
Tier 3 Tier 3
Tier criteria
Category Tier for status Tier for reported trend
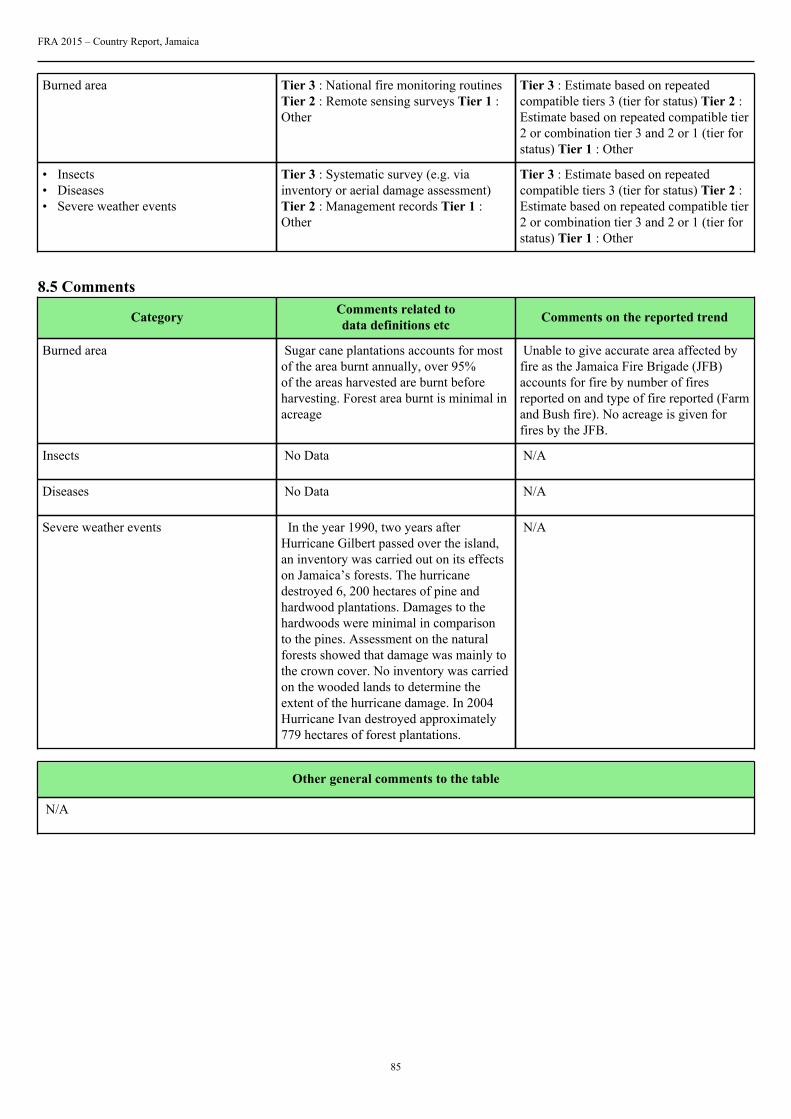
FRA 2015 – Country Report, Jamaica
85
Burned area Tier 3 : National fire monitoring routinesTier 2 : Remote sensing surveys Tier 1 :Other
Tier 3 : Estimate based on repeatedcompatible tiers 3 (tier for status) Tier 2 :Estimate based on repeated compatible tier2 or combination tier 3 and 2 or 1 (tier forstatus) Tier 1 : Other
• Insects• Diseases• Severe weather events
Tier 3 : Systematic survey (e.g. viainventory or aerial damage assessment)Tier 2 : Management records Tier 1 :Other
Tier 3 : Estimate based on repeatedcompatible tiers 3 (tier for status) Tier 2 :Estimate based on repeated compatible tier2 or combination tier 3 and 2 or 1 (tier forstatus) Tier 1 : Other
8.5 Comments
Category Comments related todata definitions etc Comments on the reported trend
Burned area Sugar cane plantations accounts for mostof the area burnt annually, over 95%of the areas harvested are burnt beforeharvesting. Forest area burnt is minimal inacreage
Unable to give accurate area affected byfire as the Jamaica Fire Brigade (JFB)accounts for fire by number of firesreported on and type of fire reported (Farmand Bush fire). No acreage is given forfires by the JFB.
Insects No Data N/A
Diseases No Data N/A
Severe weather events In the year 1990, two years afterHurricane Gilbert passed over the island,an inventory was carried out on its effectson Jamaica’s forests. The hurricanedestroyed 6, 200 hectares of pine andhardwood plantations. Damages to thehardwoods were minimal in comparisonto the pines. Assessment on the naturalforests showed that damage was mainly tothe crown cover. No inventory was carriedon the wooded lands to determine theextent of the hurricane damage. In 2004Hurricane Ivan destroyed approximately779 hectares of forest plantations.
N/A
Other general comments to the table
N/A
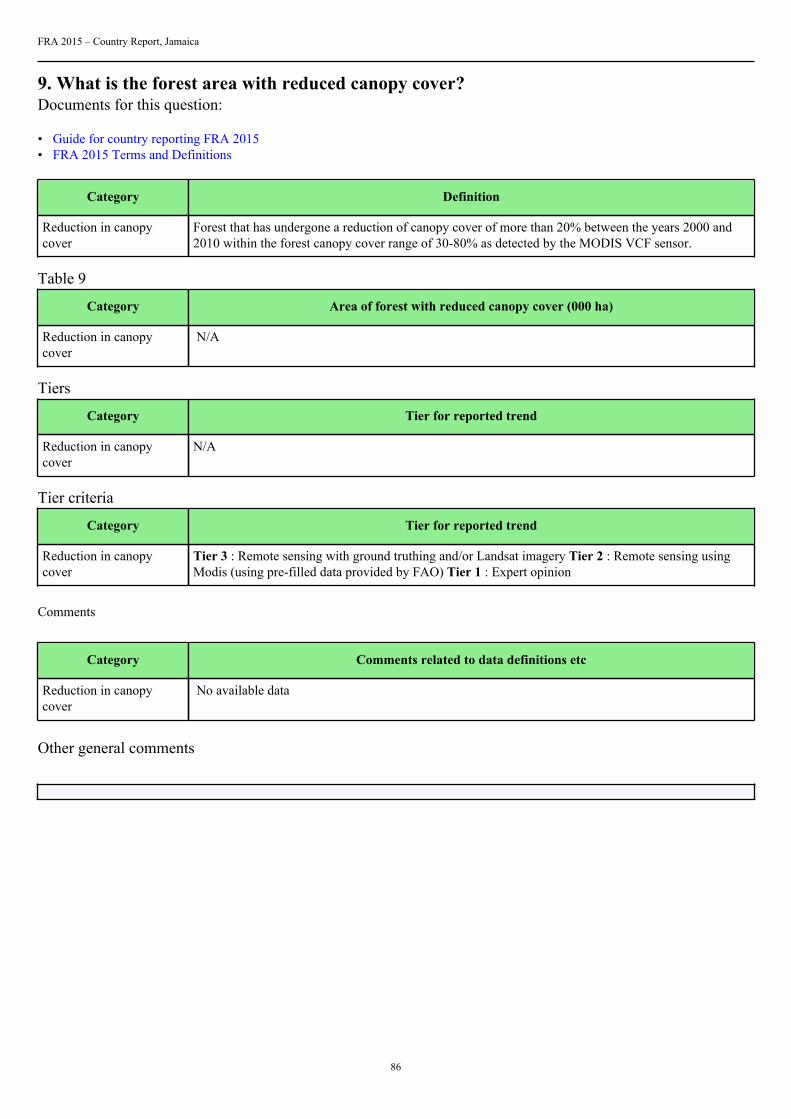
FRA 2015 – Country Report, Jamaica
86
9. What is the forest area with reduced canopy cover?Documents for this question:
• Guide for country reporting FRA 2015• FRA 2015 Terms and Definitions
Category Definition
Reduction in canopycover
Forest that has undergone a reduction of canopy cover of more than 20% between the years 2000 and2010 within the forest canopy cover range of 30-80% as detected by the MODIS VCF sensor.
Table 9
Category Area of forest with reduced canopy cover (000 ha)
Reduction in canopycover
N/A
Tiers
Category Tier for reported trend
Reduction in canopycover
N/A
Tier criteria
Category Tier for reported trend
Reduction in canopycover
Tier 3 : Remote sensing with ground truthing and/or Landsat imagery Tier 2 : Remote sensing usingModis (using pre-filled data provided by FAO) Tier 1 : Expert opinion
Comments
Category Comments related to data definitions etc
Reduction in canopycover
No available data
Other general comments

FRA 2015 – Country Report, Jamaica
87
10. What forest policy and regulatory framework exists to support implementation ofsustainable forest management SFM?Documents for this question:
• Guide for country reporting FRA 2015• FRA 2015 Terms and Definitions
10.1 Categories and definitions
Category Definition
Policies supportingsustainable forestmanagement
Policies or strategies that explicitly encourage sustainable forest management.
Legislation andregulations supportingsustainable forestmanagement
Legislation and regulations that govern and guide sustainable forest management, operations and use.
10.2 National data10.2.1 Data sources
References to sourcesof information Variables Years Additional comments
1 The Forest Act, 1996 N/A N/A N/A
2 Forest Regulations, 2001 N/A N/A N/A
3 Forest Policy, 2001 N/A N/A N/A
4 N/A N/A N/A N/A
10.2.2 Classification and definitions
National class Definition
N/A N/A
N/A N/A
N/A N/A
N/A N/A
10.2.3 Original data
See Data source (10.2.1)
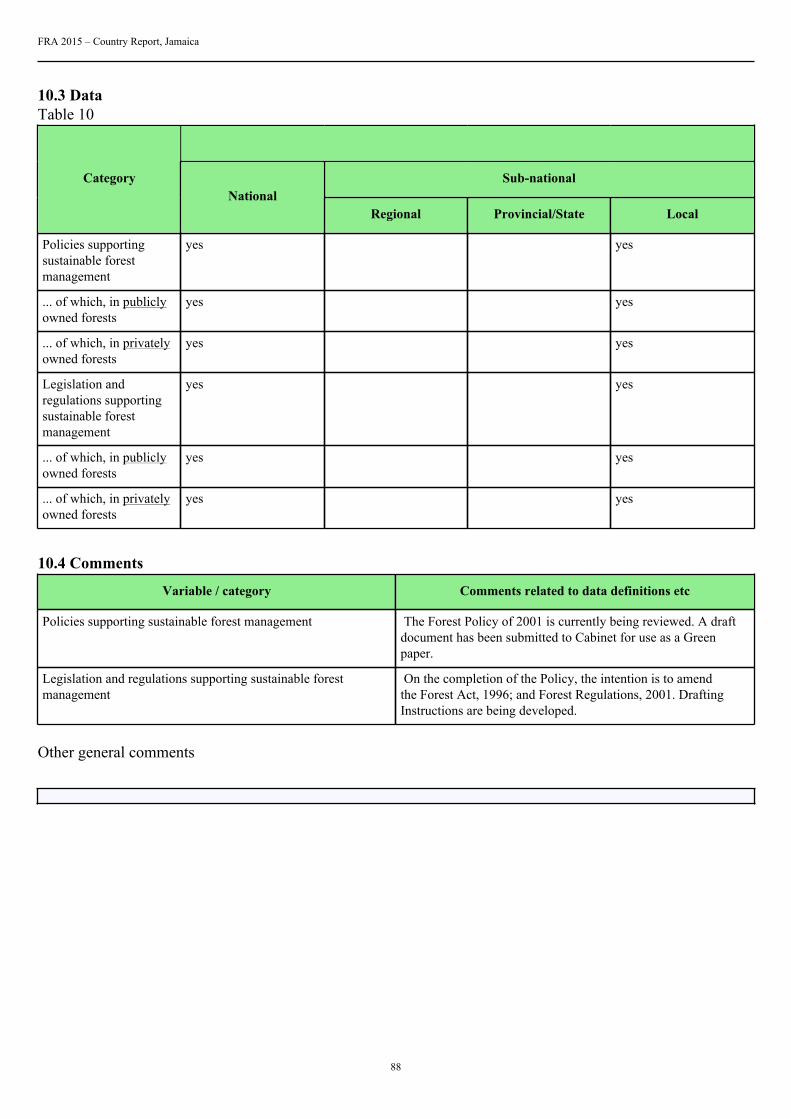
FRA 2015 – Country Report, Jamaica
88
10.3 DataTable 10
Sub-nationalCategoryNational
Regional Provincial/State Local
Policies supportingsustainable forestmanagement
yes yes
... of which, in publiclyowned forests
yes yes
... of which, in privatelyowned forests
yes yes
Legislation andregulations supportingsustainable forestmanagement
yes yes
... of which, in publiclyowned forests
yes yes
... of which, in privatelyowned forests
yes yes
10.4 Comments
Variable / category Comments related to data definitions etc
Policies supporting sustainable forest management The Forest Policy of 2001 is currently being reviewed. A draftdocument has been submitted to Cabinet for use as a Greenpaper.
Legislation and regulations supporting sustainable forestmanagement
On the completion of the Policy, the intention is to amendthe Forest Act, 1996; and Forest Regulations, 2001. DraftingInstructions are being developed.
Other general comments
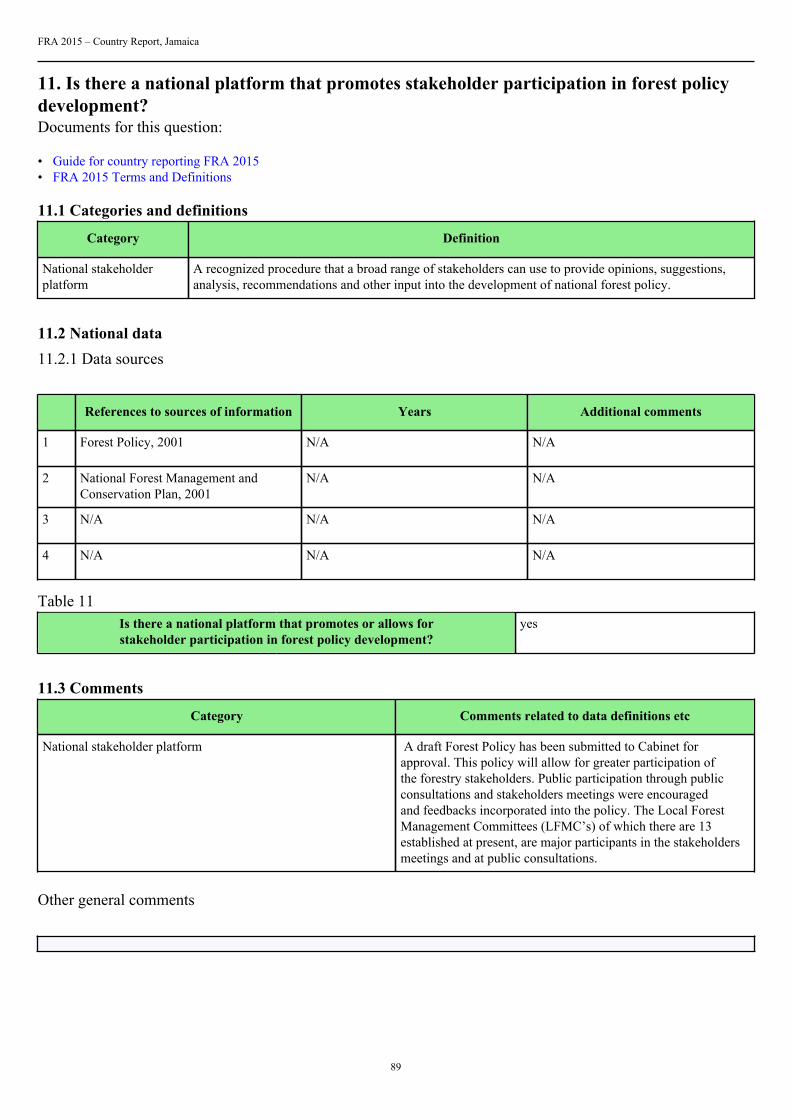
FRA 2015 – Country Report, Jamaica
89
11. Is there a national platform that promotes stakeholder participation in forest policydevelopment?Documents for this question:
• Guide for country reporting FRA 2015• FRA 2015 Terms and Definitions
11.1 Categories and definitions
Category Definition
National stakeholderplatform
A recognized procedure that a broad range of stakeholders can use to provide opinions, suggestions,analysis, recommendations and other input into the development of national forest policy.
11.2 National data11.2.1 Data sources
References to sources of information Years Additional comments
1 Forest Policy, 2001 N/A N/A
2 National Forest Management andConservation Plan, 2001
N/A N/A
3 N/A N/A N/A
4 N/A N/A N/A
Table 11Is there a national platform that promotes or allows forstakeholder participation in forest policy development?
yes
11.3 Comments
Category Comments related to data definitions etc
National stakeholder platform A draft Forest Policy has been submitted to Cabinet forapproval. This policy will allow for greater participation ofthe forestry stakeholders. Public participation through publicconsultations and stakeholders meetings were encouragedand feedbacks incorporated into the policy. The Local ForestManagement Committees (LFMC’s) of which there are 13established at present, are major participants in the stakeholdersmeetings and at public consultations.
Other general comments
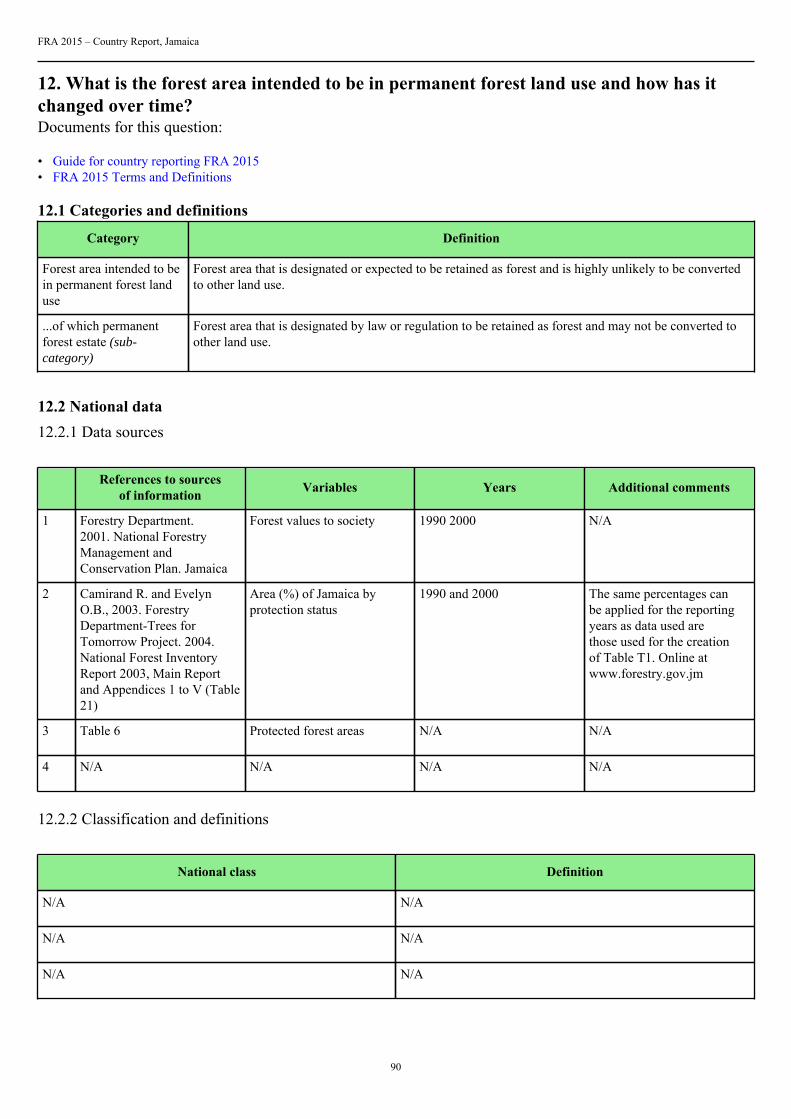
FRA 2015 – Country Report, Jamaica
90
12. What is the forest area intended to be in permanent forest land use and how has itchanged over time?Documents for this question:
• Guide for country reporting FRA 2015• FRA 2015 Terms and Definitions
12.1 Categories and definitions
Category Definition
Forest area intended to bein permanent forest landuse
Forest area that is designated or expected to be retained as forest and is highly unlikely to be convertedto other land use.
...of which permanentforest estate (sub-category)
Forest area that is designated by law or regulation to be retained as forest and may not be converted toother land use.
12.2 National data12.2.1 Data sources
References to sourcesof information Variables Years Additional comments
1 Forestry Department.2001. National ForestryManagement andConservation Plan. Jamaica
Forest values to society 1990 2000 N/A
2 Camirand R. and EvelynO.B., 2003. ForestryDepartment-Trees forTomorrow Project. 2004.National Forest InventoryReport 2003, Main Reportand Appendices 1 to V (Table21)
Area (%) of Jamaica byprotection status
1990 and 2000 The same percentages canbe applied for the reportingyears as data used arethose used for the creationof Table T1. Online atwww.forestry.gov.jm
3 Table 6 Protected forest areas N/A N/A
4 N/A N/A N/A N/A
12.2.2 Classification and definitions
National class Definition
N/A N/A
N/A N/A
N/A N/A

FRA 2015 – Country Report, Jamaica
91
N/A N/A
12.2.3 Original data
The areas used for Protection of soil and water and Conservation of biodiversity is considered as permanentforest estate (see 4.2.3 and 4.3.2)
Table 6: Forest area within protected areas
12.3 Analysis and processing of national data12.3.1 Adjustment
Not necessary
12.3.2 Estimation and forecasting
Not necessary
12.3.3 Reclassification
12.4 DataTable 12
Categories Forest area 2010 (000 ha)
Forest area intended to be in permanentforest land use
118.6
... of which permanent forest estate 88
Tiers
Category Tier for status
Forest area intended to be in permanent forest land use Tier 3
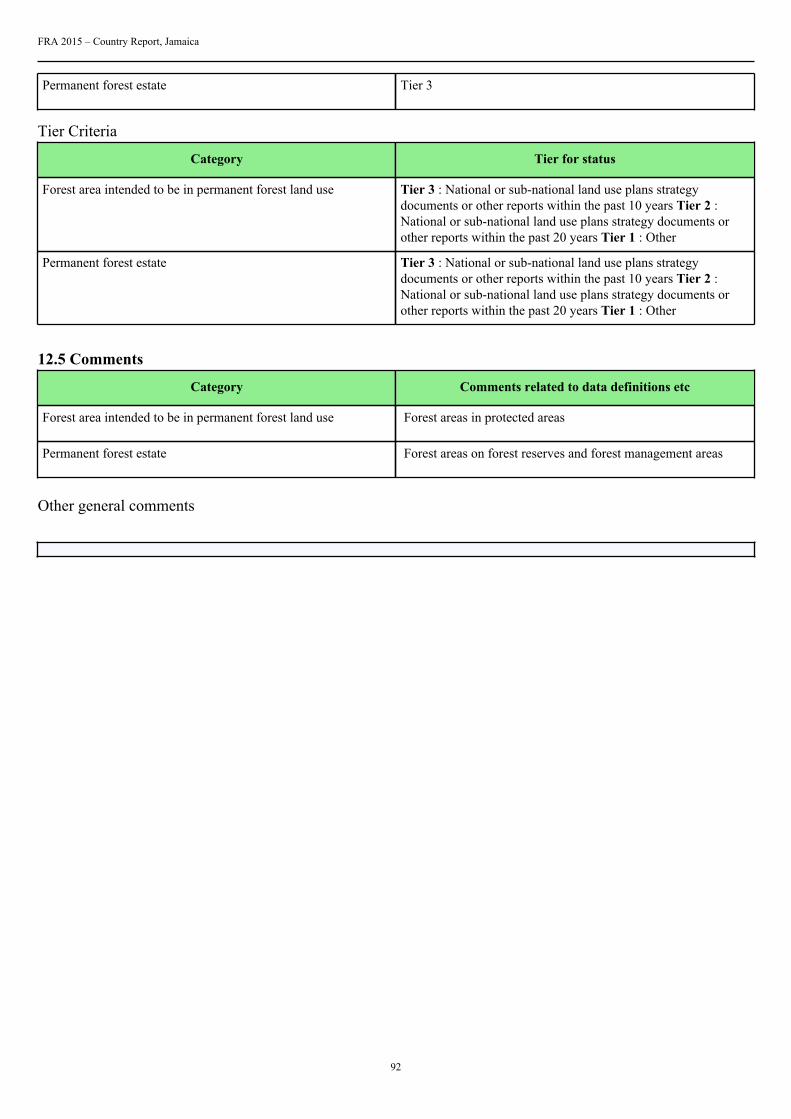
FRA 2015 – Country Report, Jamaica
92
Permanent forest estate Tier 3
Tier Criteria
Category Tier for status
Forest area intended to be in permanent forest land use Tier 3 : National or sub-national land use plans strategydocuments or other reports within the past 10 years Tier 2 :National or sub-national land use plans strategy documents orother reports within the past 20 years Tier 1 : Other
Permanent forest estate Tier 3 : National or sub-national land use plans strategydocuments or other reports within the past 10 years Tier 2 :National or sub-national land use plans strategy documents orother reports within the past 20 years Tier 1 : Other
12.5 Comments
Category Comments related to data definitions etc
Forest area intended to be in permanent forest land use Forest areas in protected areas
Permanent forest estate Forest areas on forest reserves and forest management areas
Other general comments

FRA 2015 – Country Report, Jamaica
93
13. How does your country measure and report progress towards SFM at the nationallevel?Documents for this question:
• Guide for country reporting FRA 2015• FRA 2015 Terms and Definitions
13.1 Categories and definitions
Category Definition
Forest area monitoredunder a national forestmonitoring framework
Forest area monitored by a national monitoring framework or systems that provide measurement basedperiodic monitoring of forest extent and quality.
Forest reporting atnational scale
National reporting of forest extent and characteristics that includes some measure of progress towardsustainable forest management.
13.2 National data13.2.1 Data sources
References to sourcesof information Variables Years Additional comments
1 Forestry Department's annualreports
N/A 2011-2012 Reports are generated at theclose of each financial year;report compared againststated the Department’s andNational targets.
2 Department's submission tothe State of the EnvironmentReport
N/A 2012 This is compiled annually –(Calendar Year)
3 N/A N/A N/A N/A
4 N/A N/A N/A N/A
13.2.2 Classification and definitions
National class Definition
N/A N/A
N/A N/A
N/A N/A
N/A N/A
13.3 DataTable 13a
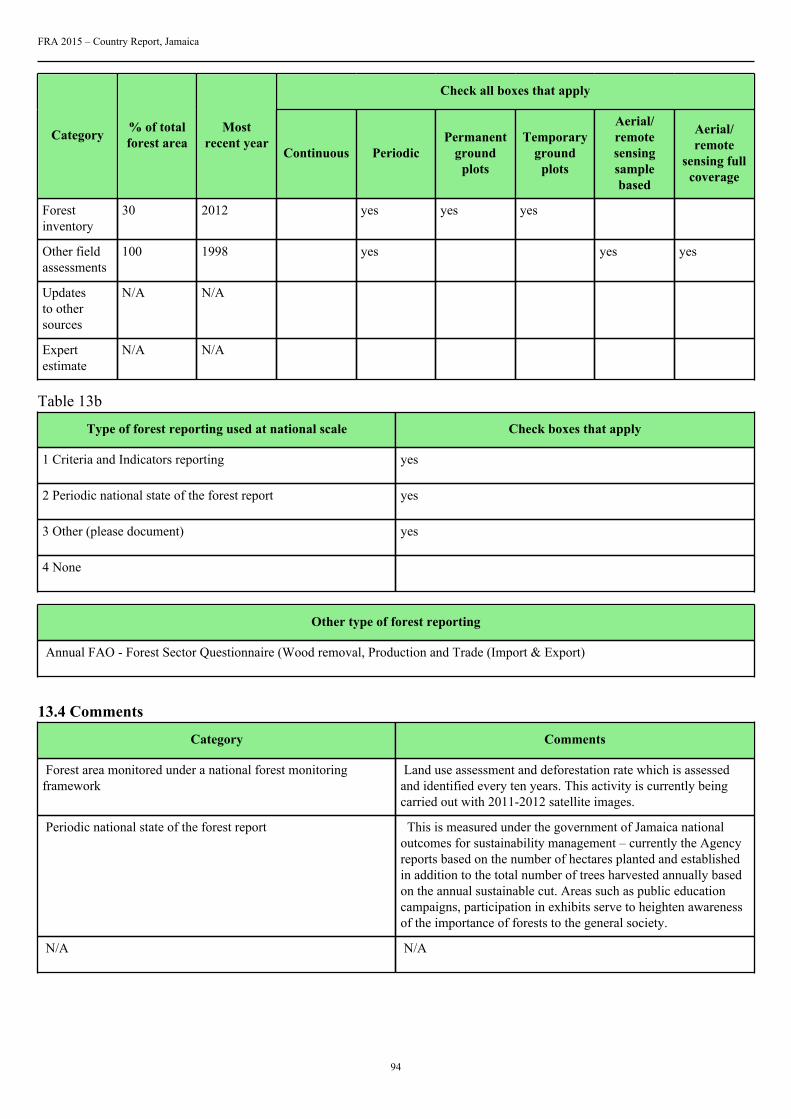
FRA 2015 – Country Report, Jamaica
94
Check all boxes that apply
Category % of totalforest area
Mostrecent year
Continuous PeriodicPermanent
groundplots
Temporaryground
plots
Aerial/remotesensingsamplebased
Aerial/remote
sensing fullcoverage
Forestinventory
30 2012 yes yes yes
Other fieldassessments
100 1998 yes yes yes
Updatesto othersources
N/A N/A
Expertestimate
N/A N/A
Table 13b
Type of forest reporting used at national scale Check boxes that apply
1 Criteria and Indicators reporting yes
2 Periodic national state of the forest report yes
3 Other (please document) yes
4 None
Other type of forest reporting
Annual FAO - Forest Sector Questionnaire (Wood removal, Production and Trade (Import & Export)
13.4 Comments
Category Comments
Forest area monitored under a national forest monitoringframework
Land use assessment and deforestation rate which is assessedand identified every ten years. This activity is currently beingcarried out with 2011-2012 satellite images.
Periodic national state of the forest report This is measured under the government of Jamaica nationaloutcomes for sustainability management – currently the Agencyreports based on the number of hectares planted and establishedin addition to the total number of trees harvested annually basedon the annual sustainable cut. Areas such as public educationcampaigns, participation in exhibits serve to heighten awarenessof the importance of forests to the general society.
N/A N/A

FRA 2015 – Country Report, Jamaica
95
Other general comments

FRA 2015 – Country Report, Jamaica
96
14. What is the area of forest under a forest management plan and how is this monitored?Documents for this question:
• Guide for country reporting FRA 2015• FRA 2015 Terms and Definitions
14.1 Categories and definitions
Category Definition
Forest area withmanagement plan
Forest area that has a long-term documented management plan, aiming at defined management goalswhich is periodically revised
...of which for production(sub-category)
Forest management plan mainly focused on production
...of which forconservation (sub-category)
Forest management plan mainly focused on conservation
Monitoring of forestmanagement plans
Government monitoring of forest management plan implementation conducted through field visits oraudits of forest management plan performance
14.2 National data14.2.1 Data sources
References to sourcesof information Variables Years Additional comments
1 Local Forest ManagementPlans and The Blue and JohnCrow Mountain NationalPark Management Plan,Jamaica
N/A 2011-2016 N/A
2 N/A N/A N/A N/A
3 N/A N/A N/A N/A
4 N/A N/A N/A N/A
14.3 DataTable 14a
Forest plan type Forest area 2010 (000 ha)
Forest area with management plan 70.39
... of which for production 7.66
... of which for conservation 62.76
Table 14b
Indicate which (if any) of the following are required in forest management plans in your country

FRA 2015 – Country Report, Jamaica
97
1 Soil and water management yes
2 High conservation value forest delineation yes
3 Social considerations community involvement yes
Table 14c
Percent of area under forest management plan that is monitored annually 0.2206
Tiers
Category Tier for status
Forest area with management plan Tier 3
Percent of area under forest management plan that is monitoredannually
Tier 3
Tier criteria
Category Tier for status
Forest area with management plan Tier 3 : Reports that describe national records 5 years old or lessthat contain long-term forest monitoring plans Tier 2 : Industryor other records indicating the presence of a long-term forestmanagement plan Tier 1 : Other
Percent of area under forest management plan that is monitoredannually
Tier 3 : Government documentation of monitoring extent Tier 2: Reports from forest managers or other documental sources Tier1 : Other
14.4 Comments
Category Comments
Forest area with management plan Five years management plans have been approved for severalforest reserves and forest management area along with the Blueand John Crow Mountains National Park. These forest reservesare public reserves with the exception of the Croydon ForestReserve and the Tulloch Forest Management Area which areprivately owned. Monitoring are ongoing and reporting areforthcoming.
N/A N/A
N/A N/A
Other general comments

FRA 2015 – Country Report, Jamaica
98
15. How are stakeholders involved in the management decision making for publiclyowned forests?Documents for this question:
• Guide for country reporting FRA 2015• FRA 2015 Terms and Definitions
15.1 Categories and definitions
Category Definition
Stakeholder involvement Stakeholder involvement is defined as significant inputs into at least one aspect of forest management atthe operational scale
Table 15
Please indicate the type of stakeholder involvement in forest management decision making required in your country
1. Planning phase yes
2. Operations phase yes
3. Review of operations yes
Tiers
Category Tier for status
Type of stakeholder inputs Tier 3
Tier criteria
Category Tier for status
Type of stakeholder inputs Tier 3 : Government (national or sub-national) documentation ofstakeholder inputs Tier 2 : Government (national or subnational)requirement but stakeholder inputs not documented Tier 1 :Other
15.2 Comments
Category Comments
Type of stakeholder inputs Stakeholders, including Local Forest Management Committees(LFMC’s) who are directly and indirectly affected by themanagement of the forest are consulted for input into theplan as well as its implementation. Inputs however are notalways documented as some take the form of open discussions.Comments from within the government sector may bedocumented as requested from the Forestry Department.
N/A N/A
N/A N/A

FRA 2015 – Country Report, Jamaica
99
Other general comments

FRA 2015 – Country Report, Jamaica
100
16. What is the area of forest under an independently verified forest certification scheme?Documents for this question:
• Guide for country reporting FRA 2015• FRA 2015 Terms and Definitions
16.1 Categories and definitions
Category Definition
FSC certification Forest area certified under the Forest Stewardship Council certification scheme
PEFC certification Forest area certified under the Programme for the Endorsement of Forest Certification scheme
Other international forestmanagement certification
Forest area certified under an international forest management certification scheme with publishedstandards and is independently verified by a third-party, excluding FSC and PEFC certification.
Certified forest areausing a domestic forestmanagement certificationscheme
Area certified under a forest management certification scheme with published standards that arenationally recognized and independently verified by a thirdparty
16.2 DataTable 16a
Forest area (000 ha)International forest
management certification2000 2001 2002 2003 2004 2005 2006
FSC 0 0 0 0 0 0 0
PEFC 0 0 0 0 0 0 0
Other 0 0 0 0 0 0 0
2007 2008 2009 2010 2011 2012
FSC 0 0 0 0 0 0
PEFC 0 0 0 0 0 0
Other 0 0 0 0 0 0
Table 16b
Forest area (000 ha)Domestic forest
management certification2000 2001 2002 2003 2004 2005 2006
N/A 0 0 0 0 0 0 0
N/A 0 0 0 0 0 0 0
N/A 0 0 0 0 0 0 0

FRA 2015 – Country Report, Jamaica
101
2007 2008 2009 2010 2011 2012
0 0 0 0 0 0
0 0 0 0 0 0
0 0 0 0 0 0
Tier criteria
Category Tier for status
International forest management certification Tier 3: International forest management scheme recordsmaintained by the certifying organization for the reporting yearTier 2: International forest management scheme records reportedby the certifying organization for a period 2 years prior to thereporting year Tier: 1 Other
Domestic forest management certification Tier 3: National registry reports for domestic forest managementcertification maintained by the certifying organization for thereporting year Tier 2: Domestic forest management schemerecords reported by the certifying organization for a period 2years prior to the reporting year Tier: 1 Other
Tiers
Category Tier for status
International forest management certification N/A
Domestic forest management certification N/A
16.3 Comments
Category Comments related to data definitions etc
Certified forest area using an international forest managementcertification scheme
Not applicable
Domestic forest management certification Not applicable
Other general comments
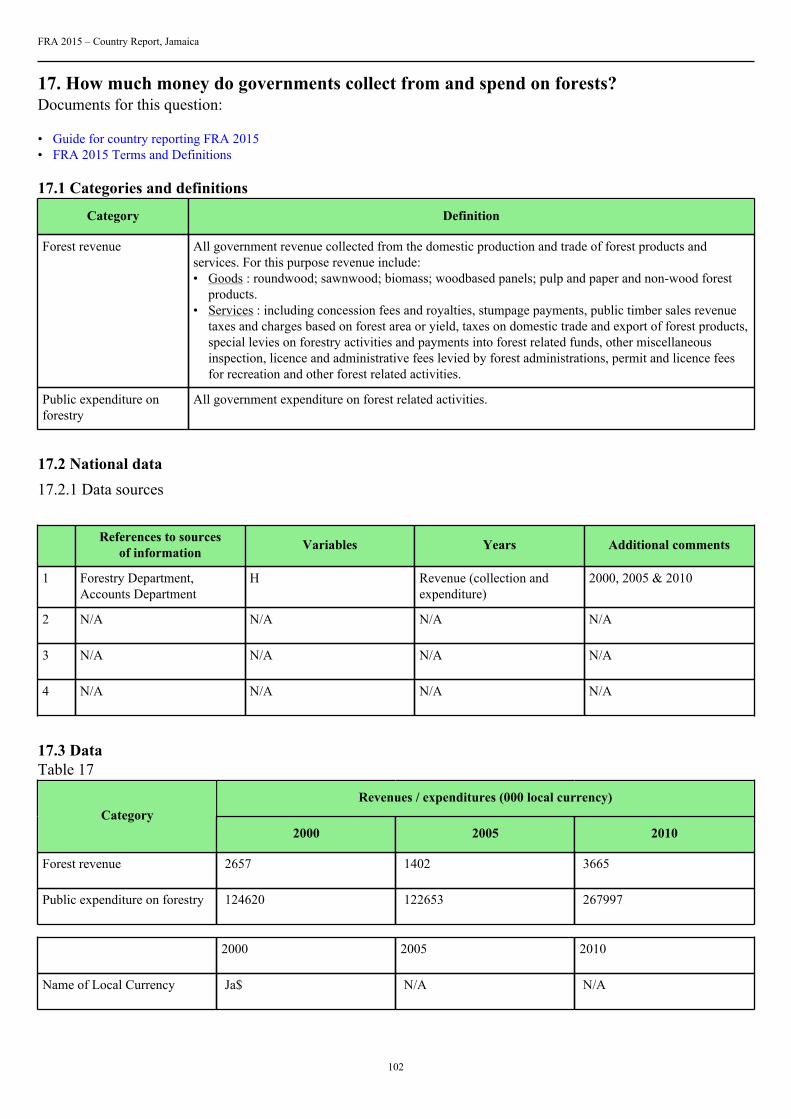
FRA 2015 – Country Report, Jamaica
102
17. How much money do governments collect from and spend on forests?Documents for this question:
• Guide for country reporting FRA 2015• FRA 2015 Terms and Definitions
17.1 Categories and definitions
Category Definition
Forest revenue All government revenue collected from the domestic production and trade of forest products andservices. For this purpose revenue include:• Goods : roundwood; sawnwood; biomass; woodbased panels; pulp and paper and non-wood forest
products.• Services : including concession fees and royalties, stumpage payments, public timber sales revenue
taxes and charges based on forest area or yield, taxes on domestic trade and export of forest products,special levies on forestry activities and payments into forest related funds, other miscellaneousinspection, licence and administrative fees levied by forest administrations, permit and licence feesfor recreation and other forest related activities.
Public expenditure onforestry
All government expenditure on forest related activities.
17.2 National data17.2.1 Data sources
References to sourcesof information Variables Years Additional comments
1 Forestry Department,Accounts Department
H Revenue (collection andexpenditure)
2000, 2005 & 2010
2 N/A N/A N/A N/A
3 N/A N/A N/A N/A
4 N/A N/A N/A N/A
17.3 DataTable 17
Revenues / expenditures (000 local currency)Category
2000 2005 2010
Forest revenue 2657 1402 3665
Public expenditure on forestry 124620 122653 267997
2000 2005 2010
Name of Local Currency Ja$ N/A N/A
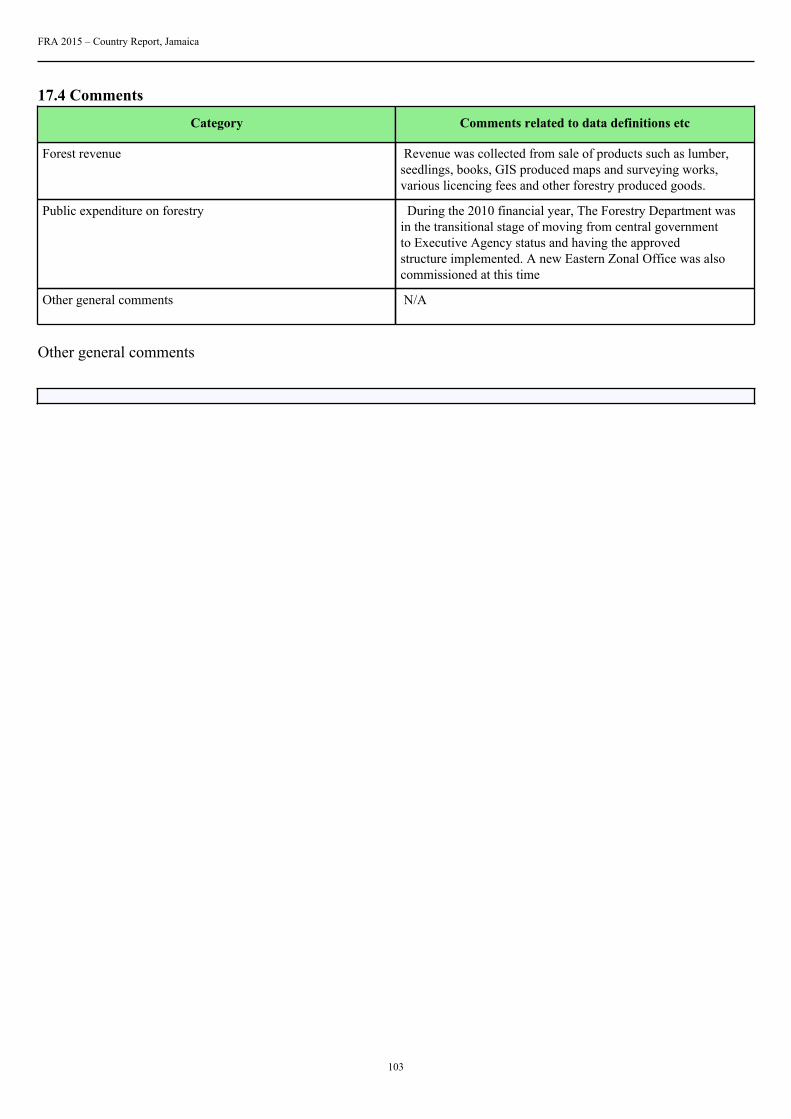
FRA 2015 – Country Report, Jamaica
103
17.4 Comments
Category Comments related to data definitions etc
Forest revenue Revenue was collected from sale of products such as lumber,seedlings, books, GIS produced maps and surveying works,various licencing fees and other forestry produced goods.
Public expenditure on forestry During the 2010 financial year, The Forestry Department wasin the transitional stage of moving from central governmentto Executive Agency status and having the approvedstructure implemented. A new Eastern Zonal Office was alsocommissioned at this time
Other general comments N/A
Other general comments

FRA 2015 – Country Report, Jamaica
104
18. Who owns and manages the forests and how has this changed?Documents for this question:
• Guide for country reporting FRA 2015• FRA 2015 Terms and Definitions
18.1 Categories and definitions
Category Definition
Public ownership Forest owned by the State or administrative units of the public administration or by institutions orcorporations owned by the public administration.
...of which owned by thestate at national scale(sub-category)
Forest owned by the State at the national scale or administrative units of the public administration or byinstitutions or corporations owned by the public administration.
...of which owned by thestate at the sub-nationalgovernment scale (sub-category)
Forest owned by the State at the sub-national government scale or administrative units of the publicadministration or by institutions or corporations owned by the public administration.
Private ownership Forest owned by individuals, families, communities, private cooperatives corporations and otherbusiness entities, private, religious and educational institutions, pension or investment funds, NGOs,nature conservation associations and other private institutions.
...of which individuals(sub-category)
Forest owned by individuals and families.
...of which privatebusiness entities andinstitutions (sub-category)
Forest owned by private corporations cooperatives companies and other business entities as well asprivate nonprofit organizations such as NGOs nature conservation associations, and private religiousand educational institutions etc.
...of which local tribal andindigenous communities(sub-category)
Forest owned by a group of individuals belonging to the same community residing within or in thevicinity of a forest area or forest owned by communities of indigenous or tribal people The communitymembers are coowners that share exclusive rights and duties and benefits contribute to the communitydevelopment.
Unknown ownership Forest area where ownership is unknown includes areas where ownership is unclear or disputed.
Categories related tomanagement rights
of public forestsDefinition
Public Administration The Public Administration (or institutions or corporations owned by the Public Administration) retainsmanagement rights and responsibilities within the limits specified by the legislation.
Individuals households Forest management rights and responsibilities are transferred from the Public Administration toindividuals or households through long-term leases or management agreements.
Private companies Forest management rights and responsibilities are transferred from the Public Administration tocorporations, other business entities private cooperatives, private nonprofit institutions and associations,etc., through long-term leases or management agreements.
Communities Forest management rights and responsibilities are transferred from the Public Administration to localcommunities (including indigenous and tribal communities) through long-term leases or managementagreements.
Other form ofmanagement rights
Forests for which the transfer of management rights does not belong to any of the categories mentionedabove.
18.2 National data
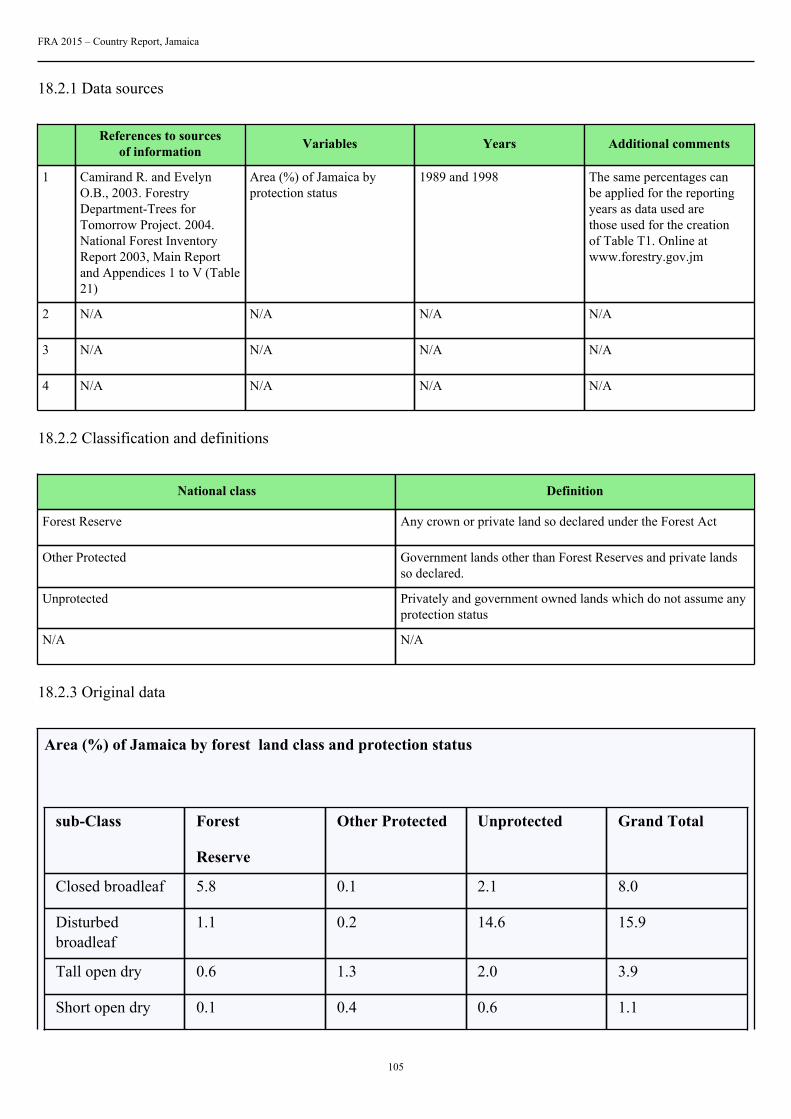
FRA 2015 – Country Report, Jamaica
105
18.2.1 Data sources
References to sourcesof information Variables Years Additional comments
1 Camirand R. and EvelynO.B., 2003. ForestryDepartment-Trees forTomorrow Project. 2004.National Forest InventoryReport 2003, Main Reportand Appendices 1 to V (Table21)
Area (%) of Jamaica byprotection status
1989 and 1998 The same percentages canbe applied for the reportingyears as data used arethose used for the creationof Table T1. Online atwww.forestry.gov.jm
2 N/A N/A N/A N/A
3 N/A N/A N/A N/A
4 N/A N/A N/A N/A
18.2.2 Classification and definitions
National class Definition
Forest Reserve Any crown or private land so declared under the Forest Act
Other Protected Government lands other than Forest Reserves and private landsso declared.
Unprotected Privately and government owned lands which do not assume anyprotection status
N/A N/A
18.2.3 Original data
Area (%) of Jamaica by forest land class and protection status
sub-Class Forest
Reserve
Other Protected Unprotected Grand Total
Closed broadleaf 5.8 0.1 2.1 8.0
Disturbedbroadleaf
1.1 0.2 14.6 15.9
Tall open dry 0.6 1.3 2.0 3.9
Short open dry 0.1 0.4 0.6 1.1

FRA 2015 – Country Report, Jamaica
106
Riparian/Swamp 0.0 0.1 0.1 0.2
Mangrove 0.1 0.5 0.3 0.9
Caribbean pineplantation *
0.3 0.0 0.1 0.4
Other speciesplantation *
0.3 0.0 0.1 0.4
Forest total 8.3 2.6 19.9 30.8
Disturbedbroadleaf forestand
Non-forest landuse **
0.7 0.3 14.1 15.1
Non-forest landuse and
disturbedbroadleaf forest***
0.8 0.4 13.9 15.1
Mixed total 1.5 0.7 28.0 30.2
Grand forest andMixed Total
9.8 3.3 47.9 61.0
Source: National Forest Inventory Report 2003, Main Report and Appendices 1 to V
* Caribbean pine plantation and Other species plantation = Fields/disturbed broadleaf and pine plantation fromTable T1
** Disturbed broadleaf forest and Non-forest land use = Disturbed broadleaf forest and fields from Table T1
*** Non-forest land use and disturbed broadleaf forest = bamboo, bamboo and fields, bamboo and disturbed broadleaf, bauxite and disturbed broadleaf, and fields and disturbed broadleaf from Table T1
18.3 Analysis and processing of national data18.3.1 Adjustment
Source Total land area (1000 hectares)

FRA 2015 – Country Report, Jamaica
107
National data 1096.4
FAOSTAT 1099
Calibration factor = (1099/1096) = 1.002371397
18.3.2 Estimation and forecasting
Forest Reserve ha = Forest Reserve % * 1099.0 (country total area)
Other Protected ha = Other Protected % * 1099.0 (country total area)
Unprotected ha = Unprotected % * 1099.0 (country total area)
Table 2.3.2
National class Forest Reserve
‘000 ha
Other Protected
‘000 ha
Unprotected
‘000 ha
Tota l
‘000 ha
Closed broadleaf 63.7 1.1 23.1 8.0
Disturbedbroadleaf
12.1 2.2 160.5 15.9
Tall open dry 6.6 14.3 22.0 3.9
Swamp 0.0 1.1 1.1 0.2
Mangrove 1.1 5.5 3.3 0.9
Caribbean pineplantations
3.3 0.0 1.1 0.4
Other speciesplantation
3.3 0.0 1.1 0.4
Total forest 90.1 24.2 212.2 326.5
Disturbed broadlead and Nonforest land use
7.7 3.3 155.0 166.0
Non forest landuse and disturbedbroadleaf
8.8 4.4 152.8 166.0

FRA 2015 – Country Report, Jamaica
108
Short open dry 1.1 4.4 6.6 12.1
17.6 12.1 3.4.4 344.1
Reclassification on forest and other wooded land was done. See details in section 2.4.
Percentages for Forest reserve, Other protected and Unprotected were estimated as follow:
FRA Classes %
Forest reserve
%
Other protected
%
Unprotected
Forest 27.6 7.4 65.0
These percentages were applied to the total forest area for the years 1990, 2000 and 2005 presented in questionnumber 1, the results for forests are presented below:
Forest 1990 2000 2005
Forest Reserve 95.1 94.1 93.6
Other protected 25.6 25.2 25.1
Unprotected 224.0 221.6 220.5
Total 344.7 340.9 339.2
18.3.3 Reclassification
Sub-Class Forest
Closed broadleaf 100%
Disturbed broadleaf 100%

FRA 2015 – Country Report, Jamaica
109
Tall open dry 100%
Swamp 100%
Mangrove 100%
Caribbean pine plantations 100%
Other species plantation 100%
Disturbed broad lead and Non forest land use
Non forest land use and disturbed broadleaf* 9%
Short open dry
* Non-forest land use and disturbed broadleaf forest = bamboo, bamboo and fields, bamboo and disturbedbroadleaf, bauxite and disturbed broadleaf, and fields and disturbed broadleaf from Table T1, the bamboo areais considered forest.
National class FRA 2015 class
Forest Reserve Public ownwership
Other Protected Unknown ownership
Unprotected Private ownership
18.4 DataTable 18a
Forest area (1000 hectares)Categories
1990 2000 2005 2010
Public ownership 95.1 94.1 93.6 93
... of which ownedby the state atnational scale
95 94 93.5 92.9
... of which ownedby the state atthe sub-nationalgovernment scale
0.1 0.1 0.1 0.1

FRA 2015 – Country Report, Jamaica
110
Private ownership 224 221.6 220.5 219.1
... of which ownedby individuals
N/A N/A N/A 120
... of which ownedby private businessentities andinstitutions
N/A N/A N/A 98.5
... of which ownedby local, tribaland indigenouscommunities
0.5 0.5 0.5 0.5
Unknownownership
25.6 25.2 25.1 24.9
TOTAL 344.70 340.90 339.20 337.00
Tiers
Category Tier for status Tier for reported trend
Public ownership Tier 2 Tier 2
Private ownership Tier 2 Tier 2
Unknown ownership Tier 2 Tier 2
Tier criteria
Category Tier for status Tier for reported trend
Ownership Tier 3: National forestry statistics registersof land titles or maps on land ownershipor all forest area under one ownershipcategory that is five years old or less. Tier2:National forestry statistics registers ofland titles or maps on land ownership orquestionnaires that are more than fiveyears old. Tier 1: Other
Tier 3 : Estimate based on repeatedcompatible tiers 3 (tier for status) Tier 2 :Estimate based on repeated compatible tier2 or combination tier 3 and 2 or 1 (tier forstatus) Tier 1 : Other
Table 18b - Holder of management rights of public forests
Forest area (000 hectares)Categories
1990 2000 2005 2010
Public Administration 95.1 94.1 93.6 93
Individuals 0 0 0 0
Private companies 0 0 0 0
Communities 0 0 0 0
Other 0 0 0 0

FRA 2015 – Country Report, Jamaica
111
TOTAL 95.10 94.10 93.60 93.00
Category Tier for reported trend Tier for status
Public Administration Tier 2 Tier 2
Individuals Tier 1 Tier 2
Private companies Tier 1 Tier 2
Communities Tier 1 Tier 2
Other Tier 1 Tier 2
18.5 Comments
Category Comments related todata definitions etc Comments on the reported trend
Public ownership Calculated as a percentage of nationalclasses. Sub categories are given as anexpert opinion
N/A
Private ownership Calculated as a percentage of nationalclasses. Sub categories are given as anexpert opinion
Estimates for the sub-category were onlydone for 2010 as this was assisted by thenational cadastral index
Unknown ownership For this report, the category "Otherownership" may include both private andpublic lands.
N/A
Management rights Local Forest Management Committeeshave been given management rights forsome forest areas, but these assignmentshave taken place outside of the reportingyears, (since 2013) .
N/A
Other general comments to the table
N/A
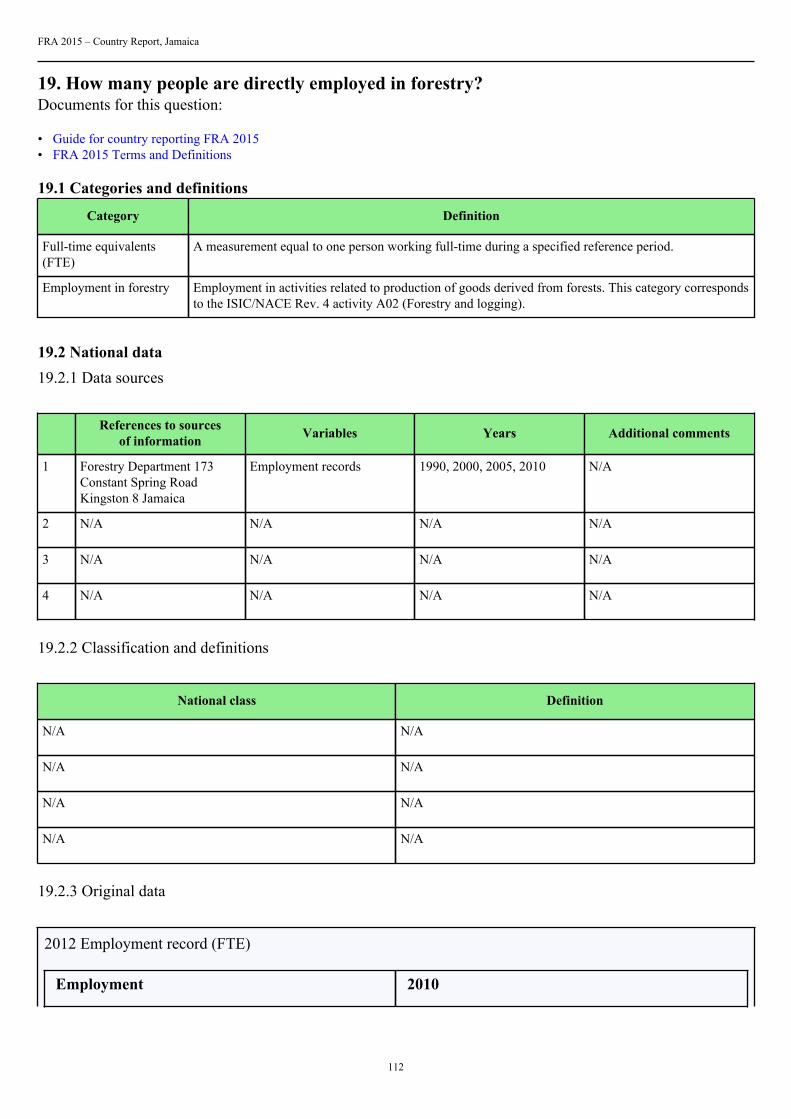
FRA 2015 – Country Report, Jamaica
112
19. How many people are directly employed in forestry?Documents for this question:
• Guide for country reporting FRA 2015• FRA 2015 Terms and Definitions
19.1 Categories and definitions
Category Definition
Full-time equivalents(FTE)
A measurement equal to one person working full-time during a specified reference period.
Employment in forestry Employment in activities related to production of goods derived from forests. This category correspondsto the ISIC/NACE Rev. 4 activity A02 (Forestry and logging).
19.2 National data19.2.1 Data sources
References to sourcesof information Variables Years Additional comments
1 Forestry Department 173Constant Spring RoadKingston 8 Jamaica
Employment records 1990, 2000, 2005, 2010 N/A
2 N/A N/A N/A N/A
3 N/A N/A N/A N/A
4 N/A N/A N/A N/A
19.2.2 Classification and definitions
National class Definition
N/A N/A
N/A N/A
N/A N/A
N/A N/A
19.2.3 Original data
2012 Employment record (FTE)
Employment 2010

FRA 2015 – Country Report, Jamaica
113
Forestry Department's operations
New planting 120
Plantation maintenance 50
Nursery operations 30
FD staff 217
Sub-Total 417
Other operations
Logging operations 10
Other 15
Sub-Total 25
Total 442
19.3 DataTable 19
Employment (000 years FTE)Category
1990 2000 2005 2010
Employment inforestry
3.63 1.13 1.13 0.442
... of which female N/A N/A N/A 0.15
19.4 Comments
Category Comments related todata definitions etc Comments on the reported trend
Employment in forestry FD staff and Nursery operations areactual figures obtained from the ForestryDepartment’s HR Department andnursery operations personnel. Plantingand maintenance figures are estimatedbased on the amount of area planted andmaintained for the reporting year 2010.The figures reported for the previous yearswere actual persons worked and not FTE.Figures for other operations (loggingand Other) are estimates. Other includepersons involve in NWFP, firewood andother wood removal.
Figures for 1990, 2000 and 2005 arereported as actual persons worked and notFTE. An attempt to determine the FTE forthese years will not be attempted at thistime.
FRA 2015 – Country Report, Jamaica
114
Other general comments to the table
N/A
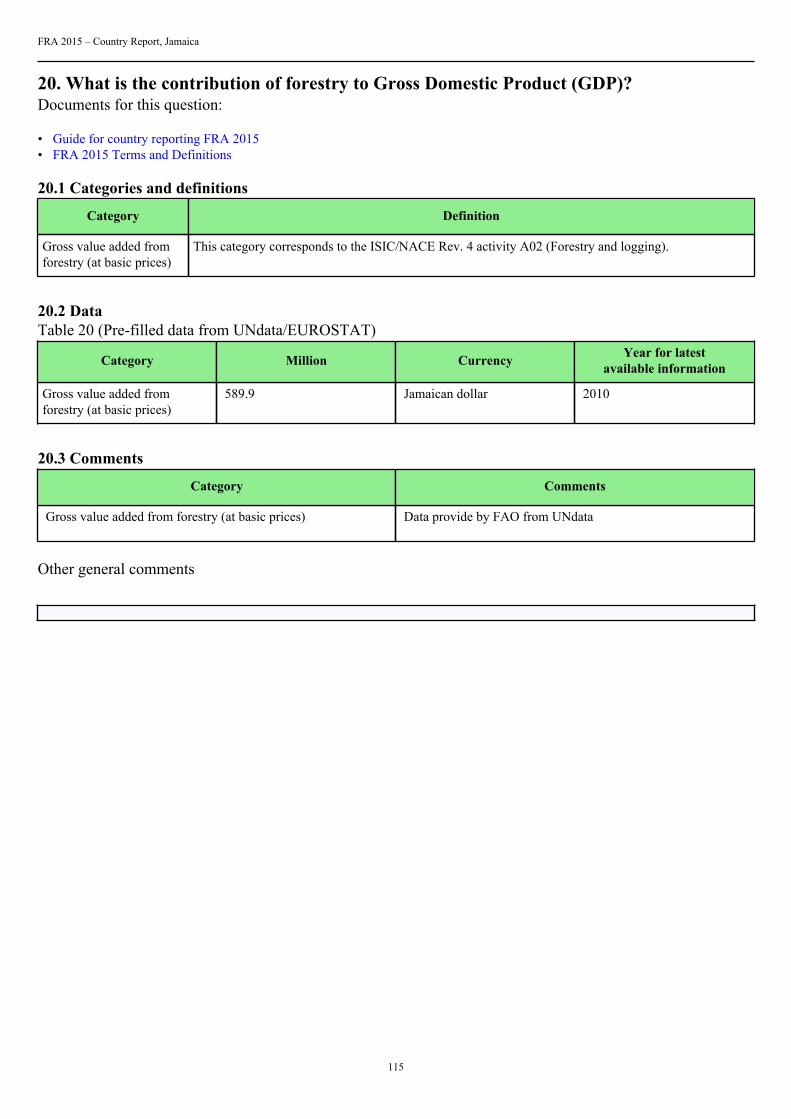
FRA 2015 – Country Report, Jamaica
115
20. What is the contribution of forestry to Gross Domestic Product (GDP)?Documents for this question:
• Guide for country reporting FRA 2015• FRA 2015 Terms and Definitions
20.1 Categories and definitions
Category Definition
Gross value added fromforestry (at basic prices)
This category corresponds to the ISIC/NACE Rev. 4 activity A02 (Forestry and logging).
20.2 DataTable 20 (Pre-filled data from UNdata/EUROSTAT)
Category Million Currency Year for latestavailable information
Gross value added fromforestry (at basic prices)
589.9 Jamaican dollar 2010
20.3 Comments
Category Comments
Gross value added from forestry (at basic prices) Data provide by FAO from UNdata
Other general comments
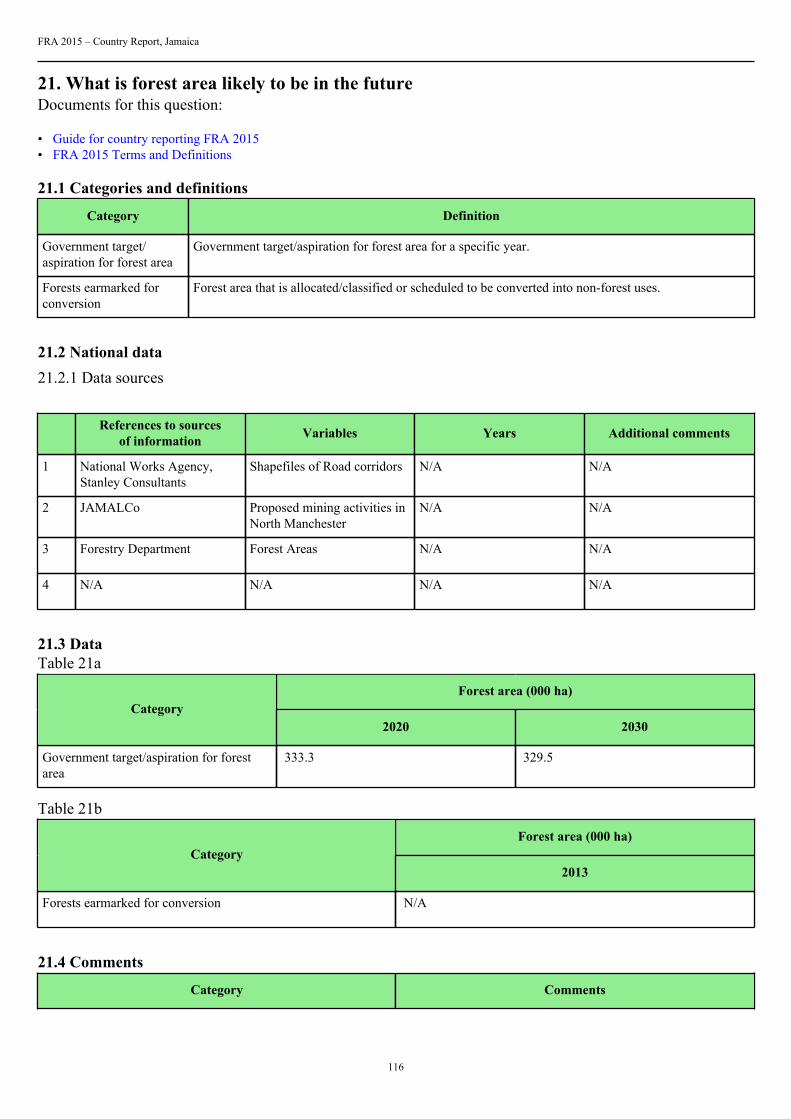
FRA 2015 – Country Report, Jamaica
116
21. What is forest area likely to be in the futureDocuments for this question:
• Guide for country reporting FRA 2015• FRA 2015 Terms and Definitions
21.1 Categories and definitions
Category Definition
Government target/aspiration for forest area
Government target/aspiration for forest area for a specific year.
Forests earmarked forconversion
Forest area that is allocated/classified or scheduled to be converted into non-forest uses.
21.2 National data21.2.1 Data sources
References to sourcesof information Variables Years Additional comments
1 National Works Agency,Stanley Consultants
Shapefiles of Road corridors N/A N/A
2 JAMALCo Proposed mining activities inNorth Manchester
N/A N/A
3 Forestry Department Forest Areas N/A N/A
4 N/A N/A N/A N/A
21.3 DataTable 21a
Forest area (000 ha)Category
2020 2030
Government target/aspiration for forestarea
333.3 329.5
Table 21b
Forest area (000 ha)Category
2013
Forests earmarked for conversion N/A
21.4 Comments
Category Comments
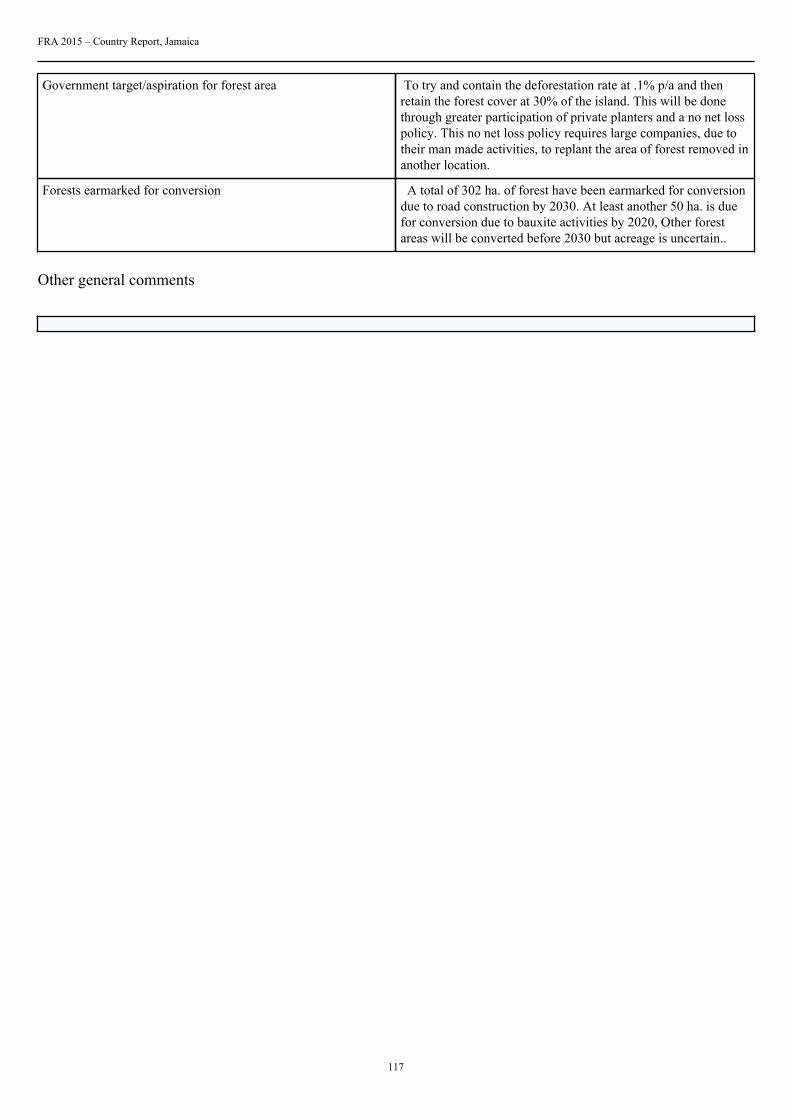
FRA 2015 – Country Report, Jamaica
117
Government target/aspiration for forest area To try and contain the deforestation rate at .1% p/a and thenretain the forest cover at 30% of the island. This will be donethrough greater participation of private planters and a no net losspolicy. This no net loss policy requires large companies, due totheir man made activities, to replant the area of forest removed inanother location.
Forests earmarked for conversion A total of 302 ha. of forest have been earmarked for conversiondue to road construction by 2030. At least another 50 ha. is duefor conversion due to bauxite activities by 2020, Other forestareas will be converted before 2030 but acreage is uncertain..
Other general comments