Embed Size (px)
Citation preview

Page 59 of 178
! Jajarkot" Nepal CholeraOutbreak
Jajarkot is one of 75 districts in Nepal, located in the mid-
western region of Nepal 600 miles from Kathmandu.
Jajarkot is in the ‘hilly’ region of Nepal, south of the
Himalayas and north of the plains areas (Figure 2). The
district covers 2,230 square kilometers. Jajarkot includes
30 Village Development Committees (VDCs), each
consisting of nine wards. Jajarkot’s 2001 population was
134,868 people, and the projected 2011 current population is 151,551. Jajarkot district headquarters is accessible via
a Nepali government plane that lands at an airstrip in Rukum (the neighboring district to the east), followed by a 3-4
hour trek. The individual VDCs are accessible via 1-4 day treks from headquarters. No motorized transport is
available, and loads are carried by porter.
Figure 2: Nepal district map (http://en.wikipedia.org/wiki/Jajarkot_District)
!#$ Description of emergency
The Epidemiology and Control Division of the Ministry of Public Health categorizes Jajarkot as one of 26 ‘high risk’
outbreak prone districts, expecting 1-3 diarrheal disease outbreaks per year based on previous years experience
(MPH, 2009). On May 4, 2009, a cholera death was reported in Jajarkot District. Subsequently, five specimen
samples from infected persons were tested by the WHO, and three grew Vibrio cholera, confirming the advent of an
epidemic (WHO, Undated). Some in the popular culture blamed the outbreak on poor-quality ‘decayed’ World Food
Program (WFP) Food (Nepalnews.com, 2009).
In July 2009, a research team assessed the attack rate and case fatality rate in the outbreak. The team collected data
from the District Hospital and one clinic, and found 12,500 cases and 128 deaths (Bhandari, 2009). Based on the
projected Jajarkot population of 151,551, the attack rate was calculated to be 8.2% and case fatality rate to be 1%.
Five of thirteen (38.5%) specimen samples tested positive for Vibrio cholera 01 biotype El Tor, serotype Ogawa. These
results were released in October 2009 and were not available at the time of our field visit in August 2009.
With UNICEF district staff assistance, we were able to review Jajarkot Headquarters District Hospital records to obtain
the most accurate cholera case data possible on August 7, 2009. The hospital’s records, collected from all VDCs in
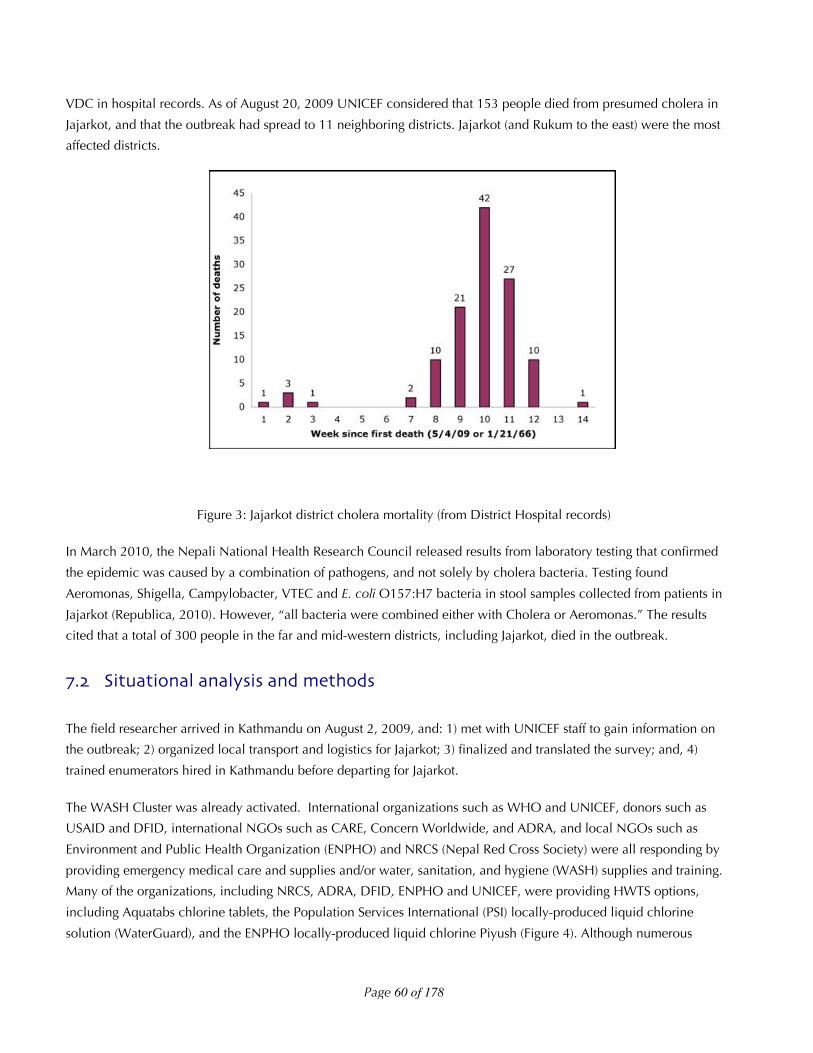
Jajarkot, documented that in the fourteen weeks since the first death, 133 deaths had occurred. These deaths were
listed by VDC, and date of death was included for 118 (88.7%) records. A mortality epi-curve was developed based
on the 118 records with date of death, showing that the outbreak appeared to have peaked by the time of the field
team arrival to Jajarkot (Figure 3). The last death in the curve occurred August 3, 2009. Cases were not recorded by
Jajarkot
Kathmandu
Page 60 of 178
VDC in hospital records. As of August 20, 2009 UNICEF considered that 153 people died from presumed cholera in
Jajarkot, and that the outbreak had spread to 11 neighboring districts. Jajarkot (and Rukum to the east) were the most
affected districts.
Figure 3: Jajarkot district cholera mortality (from District Hospital records)
In March 2010, the Nepali National Health Research Council released results from laboratory testing that confirmed
the epidemic was caused by a combination of pathogens, and not solely by cholera bacteria. Testing found
Aeromonas, Shigella, Campylobacter, VTEC and E. coli O157:H7 bacteria in stool samples collected from patients in
Jajarkot (Republica, 2010). However, “all bacteria were combined either with Cholera or Aeromonas.” The results
cited that a total of 300 people in the far and mid-western districts, including Jajarkot, died in the outbreak.
!"# Situational analysis and methods
The field researcher arrived in Kathmandu on August 2, 2009, and: 1) met with UNICEF staff to gain information on
the outbreak; 2) organized local transport and logistics for Jajarkot; 3) finalized and translated the survey; and, 4)
trained enumerators hired in Kathmandu before departing for Jajarkot.
The WASH Cluster was already activated. International organizations such as WHO and UNICEF, donors such as
USAID and DFID, international NGOs such as CARE, Concern Worldwide, and ADRA, and local NGOs such as
Environment and Public Health Organization (ENPHO) and NRCS (Nepal Red Cross Society) were all responding by
providing emergency medical care and supplies and/or water, sanitation, and hygiene (WASH) supplies and training.
Many of the organizations, including NRCS, ADRA, DFID, ENPHO and UNICEF, were providing HWTS options,
including Aquatabs chlorine tablets, the Population Services International (PSI) locally-produced liquid chlorine
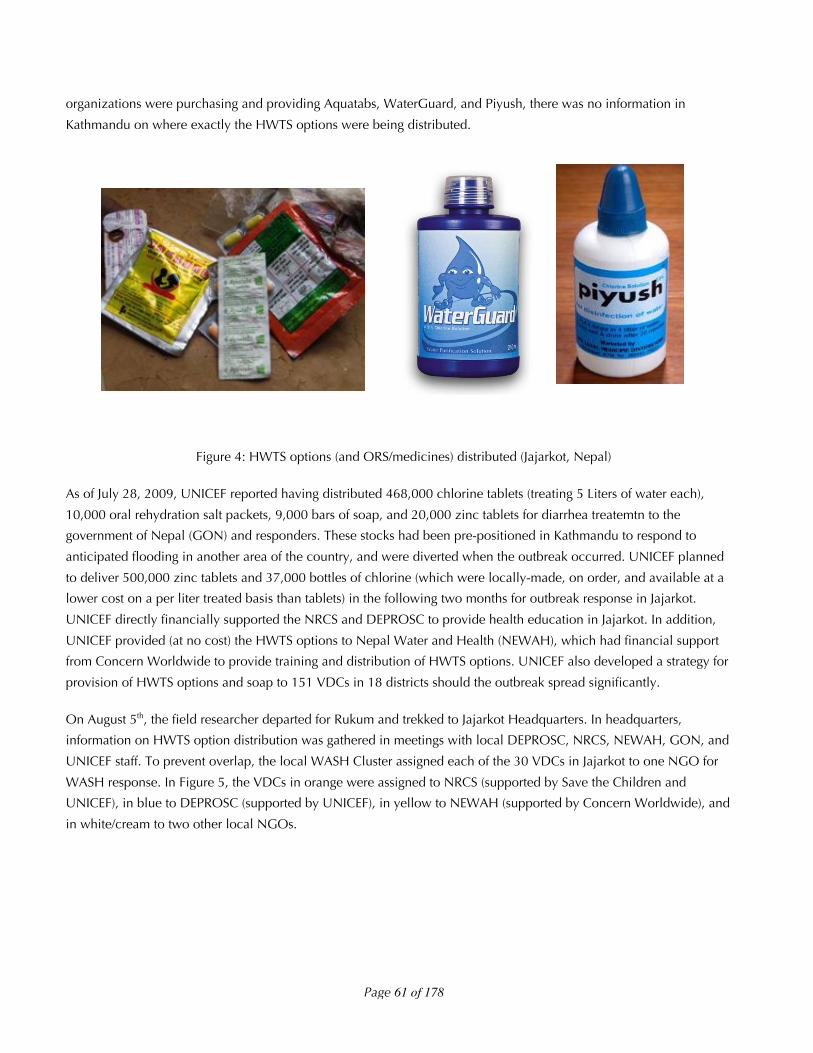
solution (WaterGuard), and the ENPHO locally-produced liquid chlorine Piyush (Figure 4). Although numerous
Page 61 of 178
organizations were purchasing and providing Aquatabs, WaterGuard, and Piyush, there was no information in
Kathmandu on where exactly the HWTS options were being distributed.
Figure 4: HWTS options (and ORS/medicines) distributed (Jajarkot, Nepal)
As of July 28, 2009, UNICEF reported having distributed 468,000 chlorine tablets (treating 5 Liters of water each),
10,000 oral rehydration salt packets, 9,000 bars of soap, and 20,000 zinc tablets for diarrhea treatemtn to the
government of Nepal (GON) and responders. These stocks had been pre-positioned in Kathmandu to respond to
anticipated flooding in another area of the country, and were diverted when the outbreak occurred. UNICEF planned
to deliver 500,000 zinc tablets and 37,000 bottles of chlorine (which were locally-made, on order, and available at a
lower cost on a per liter treated basis than tablets) in the following two months for outbreak response in Jajarkot.
UNICEF directly financially supported the NRCS and DEPROSC to provide health education in Jajarkot. In addition,
UNICEF provided (at no cost) the HWTS options to Nepal Water and Health (NEWAH), which had financial support
from Concern Worldwide to provide training and distribution of HWTS options. UNICEF also developed a strategy for
provision of HWTS options and soap to 151 VDCs in 18 districts should the outbreak spread significantly.
On August 5th, the field researcher departed for Rukum and trekked to Jajarkot Headquarters. In headquarters,
information on HWTS option distribution was gathered in meetings with local DEPROSC, NRCS, NEWAH, GON, and
UNICEF staff. To prevent overlap, the local WASH Cluster assigned each of the 30 VDCs in Jajarkot to one NGO for
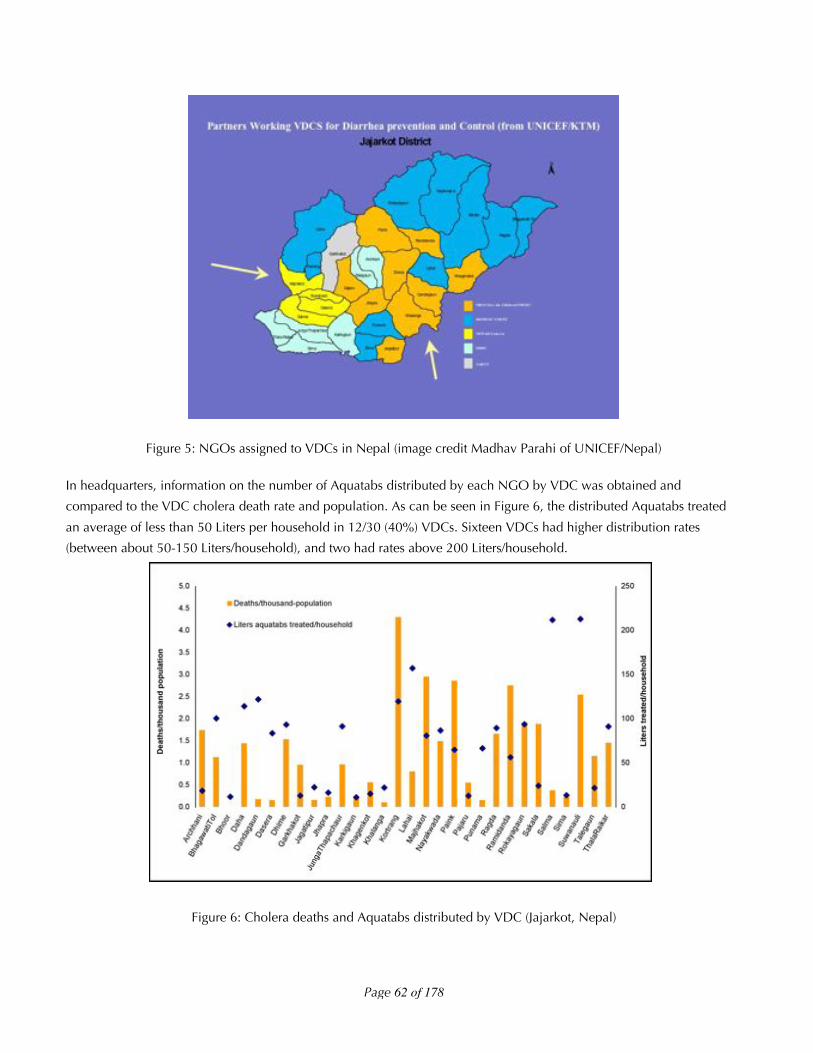
WASH response. In Figure 5, the VDCs in orange were assigned to NRCS (supported by Save the Children and
UNICEF), in blue to DEPROSC (supported by UNICEF), in yellow to NEWAH (supported by Concern Worldwide), and
in white/cream to two other local NGOs.
Page 62 of 178
Figure 5: NGOs assigned to VDCs in Nepal (image credit Madhav Parahi of UNICEF/Nepal)
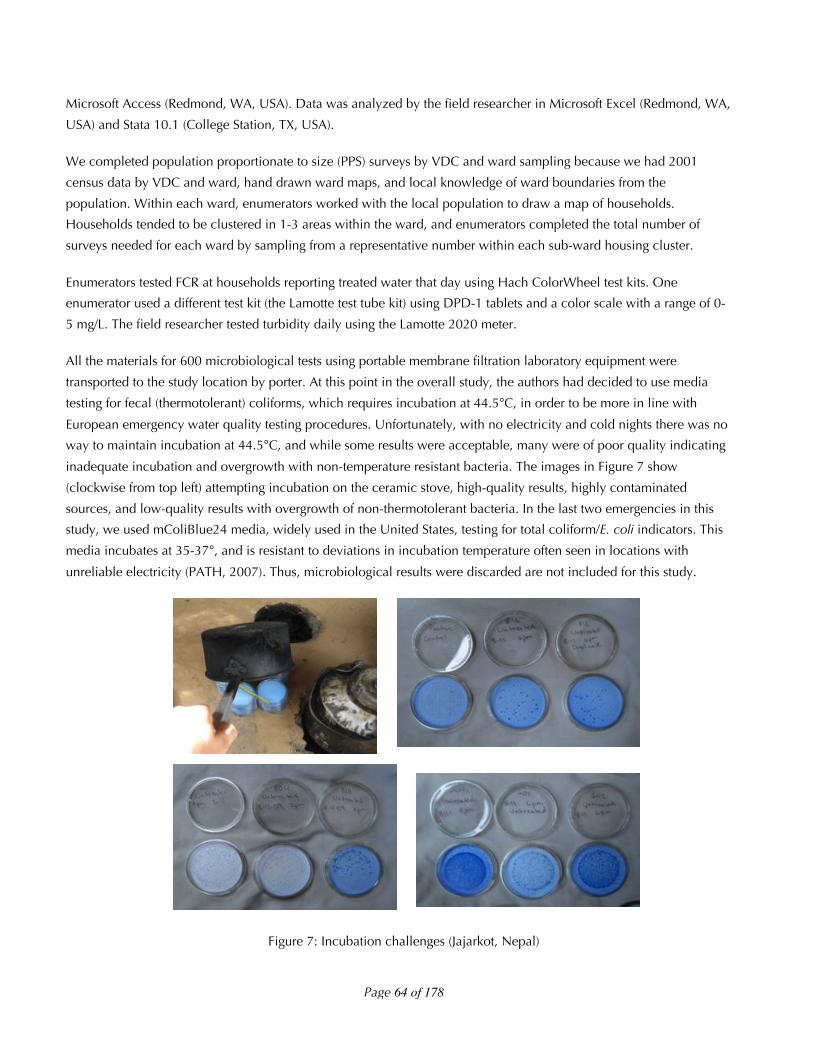
In headquarters, information on the number of Aquatabs distributed by each NGO by VDC was obtained and
compared to the VDC cholera death rate and population. As can be seen in Figure 6, the distributed Aquatabs treated
an average of less than 50 Liters per household in 12/30 (40%) VDCs. Sixteen VDCs had higher distribution rates
(between about 50-150 Liters/household), and two had rates above 200 Liters/household.
Figure 6: Cholera deaths and Aquatabs distributed by VDC (Jajarkot, Nepal)

Page 63 of 178
The reason for the large difference by VDC in Liters treated per household was that many NGOs targeted Aquatabs
distributions to a single area in a single day, or through health clinics. Only one NGO, NEWAH, targeted complete
coverage of the population with HWTS. This was due to working in four highly cholera-affected districts (Majhakot,
Dasera, Suwanauli, and Salma) and because NEWAH obtained separate funding from Concern Worldwide,
specifically stating as a grant objective “distribution of Water purification materials like water guard Piyush and Aqua
tab and ORS in house hold level for effected people especially poor and dalit HH”[sic] for one month with locally
based staff at the VDC level (NEWAH, 2009).
We chose to work with NEWAH for this study, evaluating the responses in Suwanauli and Majhakot. These two VDCs
had some of the highest cholera death rates and highest levels of HWTS distribution with Aquatabs. In addition,
Suwanauli and Majhakot were accessible, with only a 2-day trek to the location and known facilities (in the NEWAH
offices) where we could live and work. We chose these study location before obtaining data on WaterGuard and
Piyush distributions, which were not available in Headquarters.
It must be noted that results presented in this report are not representative for the entire HWTS response in the Jajarkot
cholera outbreak – they are only representative for the NEWAH response. The HWTS distribution in other VDCs was
likely of such low volume of treated water per household that there was not significant benefit. Programs in the future
should consider providing sufficient HWTS options per household in a large-scale outbreak, which is what UNICEF
was planning should the outbreak have expanded.
!"#"$ Spatial analysis
Spatial analysis was not conducted in this response, as the region was so remote that: 1) no maps except the VDC
borders (as shown in Figure 5) were available; 2) Google Earth does not have any coverage in this area; and, 3) there
was no satellite service for GPS meters or cell phones to collect GPS points. We did obtain and use hand drawn maps
of the ward locations in each VDC upon arrival from local NEWAH staff. However, these were sketch drawings and
not sufficient for spatial analysis.
!"#"# Methods used in investigation
In this investigation we: 1) conducted four qualitative interviews with national and local level WASH responders; 2)
conducted a household survey in Suwanauli (101 households) and Majhakot (299 households); 3) conducted water
quality testing; and, 4) collected cost data from NEWAH staff at the VDC level and in Kathmandu.
!"#"#"$ Household survey and water quality testing
PSI recommended Blitz Media in Kathmandu for survey translation, enumerators, and data entry. Five enumerators
were trained on August 3, 2009. The enumerators translated the survey, and Blitz Media typed the survey in Nepali
and back-translated. The survey consisted of a maximum of 87 questions (all products received), including 28
questions on respondent and household characteristics, effect of the emergency, assets, diarrhea prevalence, and
water knowledge and source before and after the emergency; 10-12 questions on each HWTS option received; and,
summary questions on current water supply/water testing. If a household received no HWTS options, 30 questions
were asked. Surveys took approximately 20 minutes to administer and Blitz Media entered the survey data into
Page 64 of 178
Microsoft Access (Redmond, WA, USA). Data was analyzed by the field researcher in Microsoft Excel (Redmond, WA,
USA) and Stata 10.1 (College Station, TX, USA).
We completed population proportionate to size (PPS) surveys by VDC and ward sampling because we had 2001
census data by VDC and ward, hand drawn ward maps, and local knowledge of ward boundaries from the
population. Within each ward, enumerators worked with the local population to draw a map of households.
Households tended to be clustered in 1-3 areas within the ward, and enumerators completed the total number of
surveys needed for each ward by sampling from a representative number within each sub-ward housing cluster.
Enumerators tested FCR at households reporting treated water that day using Hach ColorWheel test kits. One
enumerator used a different test kit (the Lamotte test tube kit) using DPD-1 tablets and a color scale with a range of 0-
5 mg/L. The field researcher tested turbidity daily using the Lamotte 2020 meter.
All the materials for 600 microbiological tests using portable membrane filtration laboratory equipment were
transported to the study location by porter. At this point in the overall study, the authors had decided to use media
testing for fecal (thermotolerant) coliforms, which requires incubation at 44.5°C, in order to be more in line with
European emergency water quality testing procedures. Unfortunately, with no electricity and cold nights there was no
way to maintain incubation at 44.5°C, and while some results were acceptable, many were of poor quality indicating
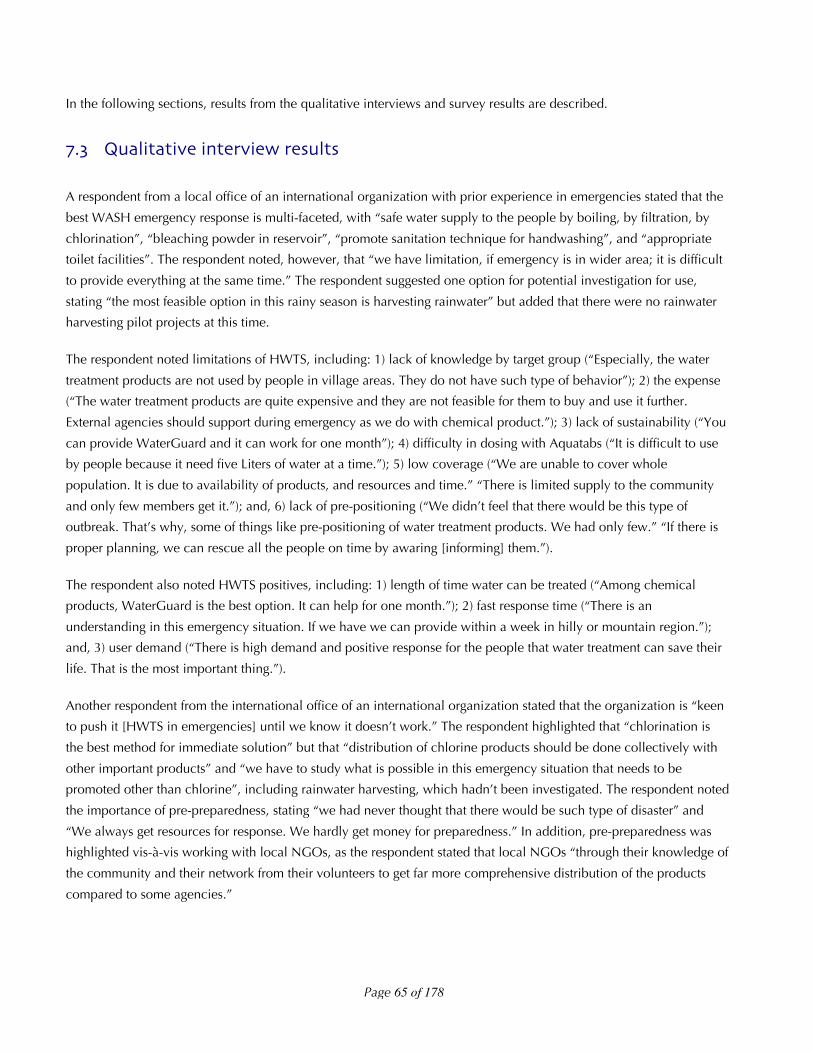
inadequate incubation and overgrowth with non-temperature resistant bacteria. The images in Figure 7 show
(clockwise from top left) attempting incubation on the ceramic stove, high-quality results, highly contaminated
sources, and low-quality results with overgrowth of non-thermotolerant bacteria. In the last two emergencies in this
study, we used mColiBlue24 media, widely used in the United States, testing for total coliform/E. coli indicators. This
media incubates at 35-37°, and is resistant to deviations in incubation temperature often seen in locations with
unreliable electricity (PATH, 2007). Thus, microbiological results were discarded are not included for this study.
Figure 7: Incubation challenges (Jajarkot, Nepal)
Page 65 of 178
In the following sections, results from the qualitative interviews and survey results are described.
!"# Qualitative interview results
A respondent from a local office of an international organization with prior experience in emergencies stated that the
best WASH emergency response is multi-faceted, with “safe water supply to the people by boiling, by filtration, by
chlorination”, “bleaching powder in reservoir”, “promote sanitation technique for handwashing”, and “appropriate
toilet facilities”. The respondent noted, however, that “we have limitation, if emergency is in wider area; it is difficult
to provide everything at the same time.” The respondent suggested one option for potential investigation for use,
stating “the most feasible option in this rainy season is harvesting rainwater” but added that there were no rainwater
harvesting pilot projects at this time.
The respondent noted limitations of HWTS, including: 1) lack of knowledge by target group (“Especially, the water
treatment products are not used by people in village areas. They do not have such type of behavior”); 2) the expense
(“The water treatment products are quite expensive and they are not feasible for them to buy and use it further.
External agencies should support during emergency as we do with chemical product.”); 3) lack of sustainability (“You
can provide WaterGuard and it can work for one month”); 4) difficulty in dosing with Aquatabs (“It is difficult to use
by people because it need five Liters of water at a time.”); 5) low coverage (“We are unable to cover whole
population. It is due to availability of products, and resources and time.” “There is limited supply to the community
and only few members get it.”); and, 6) lack of pre-positioning (“We didn’t feel that there would be this type of
outbreak. That’s why, some of things like pre-positioning of water treatment products. We had only few.” “If there is
proper planning, we can rescue all the people on time by awaring [informing] them.”).
The respondent also noted HWTS positives, including: 1) length of time water can be treated (“Among chemical
products, WaterGuard is the best option. It can help for one month.”); 2) fast response time (“There is an
understanding in this emergency situation. If we have we can provide within a week in hilly or mountain region.”);
and, 3) user demand (“There is high demand and positive response for the people that water treatment can save their
life. That is the most important thing.”).
Another respondent from the international office of an international organization stated that the organization is “keen
to push it [HWTS in emergencies] until we know it doesn’t work.” The respondent highlighted that “chlorination is
the best method for immediate solution” but that “distribution of chlorine products should be done collectively with
other important products” and “we have to study what is possible in this emergency situation that needs to be
promoted other than chlorine”, including rainwater harvesting, which hadn’t been investigated. The respondent noted
the importance of pre-preparedness, stating “we had never thought that there would be such type of disaster” and
“We always get resources for response. We hardly get money for preparedness.” In addition, pre-preparedness was
highlighted vis-à-vis working with local NGOs, as the respondent stated that local NGOs “through their knowledge of
the community and their network from their volunteers to get far more comprehensive distribution of the products
compared to some agencies.”

Page 66 of 178
A respondent for a large local NGO with no prior experience in emergencies noted the “hardest work is to make
people understand and change their behavior,” and the easiest behavior change mechanism is “to teach door-to-
door”. This organization received products in Jajarkot from Kathmandu within 10 days. About the chlorination
options specifically, the respondent observed “of course, we have not other options to supply for community people.”
While, “the aware people are using boiled water … [which] is not tasty to drink”, the respondent highlighted
limitations of the Aquatabs (“There is confusion to the community people. They think that these are the medicine.”
and “We found that community has no proper measurement of water pot.”) and of WaterGuard (“WaterGuard is bitter
and smell of Piyush is better than WaterGuard”). The respondent felt that “Affected person is using water treatment
materials carefully. Who do not have affected, they generally do not care.”
Overall, the respondent stated “For sustainable, we have some points. Water source should be improved, household
sanitation should be improved, and latrines should be building, in the community. These things are much necessary
for the epidemic for long term.”
A respondent from a local NGO with prior experience promoting handwashing and HWTS in diarrheal disease
emergencies, that also received chlorination products in this emergency, spoke eloquently about the balance between
WASH and HWTS options in the development and emergency context. The respondent stated, “first of all, we have to
supply pure water at any cost. It is the government responsibility to provide but in hilly regions it is not possible.” The
respondent continued by noting that in the emergency period “most of the NGOs and INGOs are supporting from
household level seriously” to the extent that “I think nobody is promoting non HWTS watsan” in the emergency.
In discussing the various HWTS options in the development context, the respondent mentioned “The only one option
is boiled water. They can give certain amount of chlorine tablet, water bottles, and filters but the best one is boiled
water.” The reason for this was that “Most of the people are poor, so, they cannot afford to buy filter, they cannot buy
chlorination water and also they need more bottles. Without bottles, they cannot SODIS [solar disinfection], so, the
most feasible option is boiled water because they can get fire wood, oven, and pot. There is not much cost to boil.”
However, despite feeling like boiling was the only feasible options, they also felt “I think filter is the most sustainable
option”, but limited by the fact the population “can’t buy it.” It was mentioned the population would accept filters
because “people do not prefer chlorinated water and boiled water because its taste will be turned.” Overall, however,
it was felt “in normal situation, we have to promote boiled water.”
For HWTS in the emergency context the respondent stated “If such type of emergency happens, they [the donors] will
use water purification methods.” There was perceived pressure to use chlorination options as “NGOs, government,
and donor agencies are providing only chlorinated water. Nobody is supplying filter.” “We have talked about filter
many times. … They said they couldn’t supply it. They can only support chlorination.” Limitations of chlorination
options were noted, including: 1) the difficulty of supplying the options (“Even in this emergency situation, we cannot
easily supply Piyush and WaterGuard.”); 2) the limited effectiveness over time (“This chlorination tablets, other
preventive measure can work for three months - this problem will again arise in future.”); and, 3) a preference for non
market based solutions (“Such market linked option should be minimized.” and “Without cost, nobody provides, can
you believe?”). Despite this, benefits of chlorination were also noted, including the ease of use and distribution, with
the statement “most easiest method is chlorination, even its cost is high. For the quickest time, chlorination is the
easiest and has quick response.” It was noted the NGO was “getting in one week” the chlorine from Kathmandu.
Page 67 of 178
Overall, the respondent argued for a coordinated WASH developing strategy, stating: “In this emergency situation,
most of the houses are using chlorination, either by tablets, Piyush, WaterGuard. They do not have any other options.
Everybody wanted to be alive. … But it is not the final solution. It is temporary. … If you like to promote sustainable
development, you need to support to build toilet construction, to use pipelined water, and to use soap. Rather they
are supplying them chlorination tab.”
Collectively, the four qualitative interviews reflect the following points:
• The importance of a coordinated WASH sustainable long-term developing intervention including water
supply, sanitation, and hygiene to prevent future outbreaks.
• The role of HWTS chlorination options in providing easy-to-use, fast to distribute short-term emergency
response.
• The drawbacks of chlorination options, including taste, dosing for a specific container size, and thinking
tablets are medicine.
• The drawbacks of boiling in terms of taste.
• The lack of investigation of non-HWTS options that might be of utility in the emergency (rainwater
harvesting).
• The difficulty of changing behavior in hilly environments.
• The limitations of a donor-driven supply chain.
• The importance of preparedness (both on the donor and local NGO level) to reach the entire affected
population.
• The high demand for the products as they were perceived by the population as a life-saving intervention.
!"# Survey results
Survey results are presented in Table 7 for the survey population as a whole, and stratified by VDC. The Majhakot and
Suwanauli survey populations were not identical across all characteristics, and differences were quantified in
dichotomous variables using the chi-squared test (p-values of <0.05 indicate a statistical significant difference
between survey populations). The denominator for total percentages are noted in the row variable description.
Denominators for the VDC column percentages are not presented.
Overall, one-quarter of the total Suwanauli and Majhakot populations were surveyed, with 400 surveys completed by
five enumerators in all nine wards in each VDC. About half the survey respondents were women. This number must
be understood by the cultural fact that enumerators were more likely to be able to interview respondents of their same
gender (p=0.026). In addition, in many cases with male enumerators, the male head of household (HOH) was the
‘official’ respondent, but the female HOH was also involved in answering survey questions. It was not possible to hire
all female enumerators due to the rural and physically challenging nature of the survey environment.
The average respondent age was just over 34. If the respondent was female, 21.1% had attended any school. The
average school attendance was 6.1 years for those women who had attended, and 1.3 for the total female respondent
(FR) population.

Page 68 of 178
There was no measurable internal displacement, as 99.3% of families were in the same house as before the
emergency. The majority of households owned their own land (83.3%), and all but one respondent owned their own
home. Overall, 99.5% of families had water available within 30 minutes of their home, with 10.5% having water
access at their home. About two-thirds of the survey population covered their household stored water. Adult women
were responsible for collecting water in 78.3% of households, followed by adult men (8.0%), boys (7.5%) and girls
(6.3%).
There was a statistically significant difference in reported cholera attack rate, with an attack rate of 3.5% in
Suwanauli, compared to 1.8% in Majhakot. Both rates are much less than the 8.2% attack rate reported by Bhandari
in their investigations.
Overall 97% of the population received at least one HWTS option from NEWAH, although the products distributed in
each VDC varied. More people in Suwanauli received Aquatabs and/or Piyush, and more households in Majhakot
received WaterGuard. This was not a deliberate distinction, but simply how NEWAH delivered products received
from UNICEF at different times, with Aquatabs arriving first, followed by additional Aquatabs and the liquid chlorine
solutions of Piyush and WaterGuard.

Page 69 of 178
Table 7: Survey results by VDC (Jajarkot, Nepal)
Suwanauli Majhakot Total p-value
Total population (households) 409 1156 1565
Surveyed households 101 299 400
% of households surveyed 24.7 25.9 25.6
Wards surveyed 9 9 18
Number (%) female respondents (n=400) 54 (53.5) 150 (50.2) 204 (51.0) 0.566
Respondent age in years (min-max) (n=400) 33.3 (11-70) 34.8 (12-80) 34.4 (11-80)
Number (%) female respondents (FR) attend school (n=204) 10 (18.5) 33 (22.0) 43 (21.1) 0.591
If FR school, average (min-max) years school (n=43) 6.6 (1-12) 5.8 (1-11) 6.1 (1-12)
All FR average (min-max) years school (n=204) 1.2 (0-12) 1.3 (0-11) 1.3 (0-12)
Number (%) live is same place as before emergency (n=400) 99 (98.0) 298 (99.7) 397 (99.3)
Number (%) own their land (n=400) 85 (84.2) 248 (82.9) 333 (83.3) 0.777
Average (min-max) amount of land owned (ropani) (n=333) 3.1 (1-16) 2.5 (1-20) 2.6 (1-20)
Number (%) own their own home 101 (100) 298 (99.7) 399 (99.8) 0.561
Number (%) families reporting cholera (n=400) 12 (11.9) 24 (8.0) 36 (9.0) 0.242
Number (%) cases cholera reported (n=2384 people) 23 (3.6) 31 (1.8) 54 (2.3) <0.001
Reported cholera attack rate (per 1000 people) 36 18 23
Number (%) with water available at household (n=400) 8 (7.9) 34 (11.4) 42 (10.5) 0.328
Number (%) with water available within 30 minutes (n=400) 91 (90.1) 267 (89.3) 358 (89.5) 0.820
Number (%) with covered stored water (n=400) 65 (64.4) 190 (63.5) 255 (63.8) 0.883
Number (%) received Aquatabs (n=400) 95 (94.1) 218 (72.9) 313 (78.3) <0.001
Number (%) received WaterGuard (n=400) 0 (0) 53 (17.7) 53 (13.3) <0.001
Number (%) received Piyush (n=400) 67 (66.3) 107 (35.8) 174 (43.5) <0.001
Number (%) received at least one product (n=400) 99 (98.0) 289 (96.7) 388 (97.0) 0.487

Page 70 of 178
The 400 surveyed households included a total population of 2,384 people (average=5.96 people/household, min=1,
max=18), including 504 children under 5 (average=1.26 children/household, min=0, max=4) (Table 8). The only
statistically significant difference between VDCs in the reported diarrhea rates was that there was less reported
diarrhea in all children under 5 reported in Suwanauli.
Table 8: Survey population and reported diarrhea in last 24 hours (Jajarkot, Nepal)
Suwanauli Majhakot Total p-value
Total population (by household) 6.3 (2-18) 5.8 (1-14) 6.0 (1-18)
Under 5 population (by household) 1.3 (0-4) 1.2 (0-4) 1.3 (0-4)
% females 5 and over with diarrhea 5.4 7.0 6.5 0.432
% males 5 and over with diarrhea 7.6 4.7 5.5 0.099
% 5 and over with diarrhea 6.5 5.8 6.0 0.594
% under 5 females with diarrhea 1.5 7.3 5.6 0.095
% under 5 males with diarrhea 1.5 6.3 5.1 0.129
% under 5 with diarrhea 1.5 6.8 5.4 0.025
Survey respondents were asked about their water source three times: 1) what source they used before the emergency;
2) if there was a change in source after the emergency, what source they used now; and, 3) in the last part of survey,
where the actual stored household water collected today came from. In this emergency, as can be seen in Table 9 and
Figure 8, there was little difference between reported before emergency, reported after emergency, and actual at-
survey water sources in households. Although there was a slight trend toward increased reported and actual use of
improved sources after the emergency, these results were not statistically significant (p=0.414 and 0.595 for
Suwanauli and Majhakot, respectively).
Respondents in Majhakot reported a significantly higher use of improved sources (p<0.001). This difference is
attributed to the fact NEWAH has been working on water supply projects developing piped networks and improved
springs in Majhakot for years, and only began working in Suwanauli during this HWTS emergency response project.
Table 9: Reported water sources before emergency, after emergency, and at time of visit (Jajarkot, Nepal)
Suwanauli (n=101) Majhakot (n=299)
Before After At visit Before After At visit
Tubewell (number (%)) 2 (2.0) 4 (1.3)
Surface water (number (%)) 12 (11.9) 11 (10.9) 10 (9.9) 4 (1.3) 4 (1.3) 3 (1.0)
Spring box (number (%)) 26 (25.7) 30 (29.7) 30 (29.7) 112 (37.5) 116 (38.8) 110 (36.8)
Unimproved spring (number (%)) 54 (53.5) 52 (51.5) 50 (49.5) 111 (37.1) 107 (35.8) 108 (36.1)
Piped water (number (%)) 9 (8.9) 8 (7.9) 9 (8.9) 72 (24.1) 72 (24.1) 74 (24.8)
% Improved (number (%)) 35 (34.7) 39 (38.6) 41 (40.6) 184 (61.5) 195 (65.2) 188 (62.9)
% Unimproved (number (%)) 66 (65.3) 62 (61.4) 60 (59.4) 115 (31.5) 104 (34.8) 111 (37.1)

Page 71 of 178
Figure 8: Before emergency reported water sources in Majhakot and Suwanauli (Jajarkot, Nepal)
Respondents were asked if they felt their water was safe to drink. The results varied by water source (Table 10), with
96.5% of households using 220 improved sources after the emergency considering their water safe as compared to
69.2% of households using 94 unimproved sources (p<0.001).
Table 10: Percent of respondents who perceive their water source as safe (Jajarkot, Nepal)
Surface Spring box Unimproved
spring
Piped
water
All
Perceived safe (number (%)) 6 (40.0) 142 (97.3) 104 (65.4) 76 (95.0) 328 (82.0)
Perceived unsafe (number (%)) 8 (53.3) 3 (2.1) 44 (27.7) 1 (1.3) 56 (14.0)
Don’t know (number (%)) 1 (6.7) 1 (0.7) 11 (6.9) 3 (3.8) 16 (4.0)
The majority of respondents who perceived their water as safe did so because the “water looks clean” (Table 11).
Respondents were more likely in Majhakot than Suwanauli to state water did not have germs as opposed to water
looks clean as the reason (p=0.031). This could be because of increased education from NEWAH programs.
Table 11: Reasons respondents perceive water as safe (multiple answers possible) (Jajarkot, Nepal)
Suwanauli Majhakot All
Water looks clean (number (%)) 69 (94.5) 204 (80.0) 273 (83.2)
Water without germs (number (%)) 2 (2.7) 26 (10.2) 28 (8.5)
Don’t know (number (%)) 2 (2.7) 25 (9.8) 27 (8.2)
Totals (number (%)) 73 (100) 255 (100) 328 (100)

Page 72 of 178
Similarly, the majority of respondents who perceived their water as unsafe did so because the “water looks dirty”
(Table 12). Respondents were more likely in Majhakot to state water did have germs as opposed to water looks dirty
as the reason than in Suwanauli, although this result was not significant, potentially due to low sample size.
Table 12: Reasons respondents perceive water as unsafe (multiple answers possible) (Jajarkot, Nepal)
Suwanauli Majhakot All
Water looks dirty (number (%)) 13 (46.4) 17 (60.7) 30 (53.6)
Germs in water (number (%)) 12 (42.9) 6 (21.4) 18 (32.1)
Causes diarrhea (number (%)) 1 (3.6) 2 (7.1) 3 (5.4)
Don’t know (number (%)) 2 (7.1) 3 (10.7) 5 (8.9)
Totals (number (%)) 28 (100) 28 (100) 56 (100)
Respondents were asked what their largest health problems were since the advent of the cholera outbreak, and all
self-reported answers were recorded (no answers were prompted). A total of 604 responses (1.51/household) were
received (Table 13). The three largest self-identified health problems were: 1) hospital too far away (26.4% of
respondents); 2) water problems; and, 3) garbage. A total of 16.4% of respondents self-identified diarrhea as a
problem.
Figure 9: Percent of respondents listing health problems after the emergency (Jajarkot, Nepal)

Page 73 of 178
There was low prior knowledge of HWTS in this survey population, with 94.8% of respondents stating they did not
know of any option to treat their water before the emergency. Of those who did self-report an option (this question
was not prompted), boiling and solar disinfection (SODIS) were the most common answers. No statistically significant
differences were seen between the two VDCs. Overall, only 5.2% of respondents self-reported knowing a HWTS
option before the emergency.
Table 13: HWTS options known before emergency (multiple answers possible) (Jajarkot, Nepal)
Suwanauli Majhakot Total p-value
Boiling (number (%)) 4 (4.0) 13 (4.3) 17 (4.3) 0.867
SODIS (number (%)) 2 (2.0) 13 (4.3) 15 (3.8) 0.279
WaterGuard (number (%)) 1 (1.0) 3 (1.0) 4 (1.0) 0.991
Tablet (number (%)) 1 (1.0) 1 (0.3) 2 (0.5) 0.419
Piyush (number (%)) 1 (1.0) 1 (0.3) 2 (0.5) 0.419
Filter (number (%)) 0 (0) 1 (0.3) 1 (0.3) 0.561
None (number (%)) 96 (95.1) 283 (94.7) 379 (94.8) 0.876
!"# Coverage
UNICEF estimated that a total of 18 districts, including 151 VDCs and over 140,000 affected households (826,000
people), were affected by the cholera outbreak in mid-western Nepal. Jajarkot was the most heavily affected district,
with over half of the cholera deaths reported. The projected current population within the 30 VDCs in Jajarkot is
25,428 households (151,551 people). For the purposes of coverage, we will limit our discussion to Jajarkot District in
this report, as we collected no on-the-ground information from Rukum or other districts.
Overall, 330,630 tablets treating 5 Liters each (1,663,150 Liters) were reported at the VDC level to have been
distributed for 24,147 households. This is equivalent to 68.9 Liters/household (3.4 tablets), or using a value of 20
Liters of high-quality water needed per household per day, to 3.4 days of safe drinking water. However, 1) HWTS
distribution varied within Jajarkot, with NGOs receiving HWTS options from UNICEF and distributing them with
different implementation strategies; and, 2) Aquatabs are distributed in a minimum number of 10 tablet strips, which
means while the “average” might be 3.4 tablets, in reality households would have received 0, 10, 20, and so on
tablets. Only NEWAH targeted population-based distribution for what they considered the time horizon of the
outbreak – two months. Other NGOs completed targeted distribution in health clinics or one geographical region. As
presented in Figure 6, the distributed Aquatabs treated an average of less than 50 Liters/household in 12 of 30 (40%)
VDCs in Jajarkot, between 50-150 Liters/household in sixteen (53.3%) VDCs, and above 200 Liters/household in two
(6.7%) VDCs. Thus, on a population basis, the coverage of HWTS in all the VDCs in Jajarkot was insignificant except
in the NEWAH targeted areas.
Overall, 97% of the affected population in the NEWAH VDCs of Suwanauli and Majhakot received at least one
HWTS option, indicating almost complete coverage by this metric within these VDCs (Table 14). Aquatabs, Piyush,
and WaterGuard were distributed in these VDCs, and at the VDC level we were able to obtain additional data on

Page 74 of 178
Piyush and WaterGuard distribution not available at the District level. There was not deliberate product selection
done in the distribution – NEWAH simply distributed whichever option UNICEF had provided at the time.
Table 14: Percent of respondents who received each HWTS option (Jajarkot, Nepal)
Suwanauli Majhakot Total p-value
Number (%) received Aquatabs (n=400) 95 (94.1) 218 (72.9) 313 (78.3) <0.001
Number (%) received WaterGuard (n=400) 0 (0) 53 (17.7) 53 (13.3) <0.001
Number (%) received Piyush (n=400) 67 (66.3) 110 (36.8) 177 (44.3) <0.001
Number (%) received at least one product (n=400) 99 (98.0) 289 (96.7) 388 (97.0) 0.487
In addition, families could and did receive products more than once, at group trainings, household distributions, or by
walking to the NEWAH office and requesting more products. Thus, respondents received a variety of combinations of
chlorine based HWTS options (Table 15).
Table 15: Product combinations received by respondents (Jajarkot, Nepal)
Suwanauli
(n=101)
Majhakot
(n=299)
Total
(n=400)
No product 2 (2.0) 10 (3.3) 12 (3.0)
Aquatabs only 32 (31.7) 128 (42.8) 160 (40.0)
Piyush only 4 (4.0) 27 (9.0) 31 (7.8)
WaterGuard only 0 (0.0) 44 (14.7) 44 (11.0)
Aquatabs and Piyush 63 (62.4) 81 (27.1) 144 (36.0)
Aquatabs and WaterGuard 0 (0) 7 (2.3) 7 (1.8)
Piyush and WaterGuard 0 (0) 0 (0) 0 (0)
Aquatabs and Piyush and WaterGuard 0 (0) 2 (0.7) 2 (0.5)
Due to this ongoing distribution, it was not possible to calculate a Liters treated per household by HWTS option in
these two VDCs, as households could not state how much product they had received over the numerous distributions.
However, of the 388 households that received at least one product, 344 (88.7% of recipients, 86% of households
surveyed) had product on the day of the unannounced survey visit in their home, which indicates that NEWAH was
very close to meeting their target of providing HWTS to all households for 2 months of time.
We did collect self-reported HWTS option recipient data. A total of 313/400 (78.3%) survey respondents received an
average of 24 Aquatabs (range 10-220) (Table 16). Twenty-four tablets is enough to treat 120 Liters of water, which
provides six days of treated water to a household using 20 Liters of high-quality water per day. Overall, 17.7% of the
surveyed population received one bottle of WaterGuard, with one household receiving two bottles (Table 18). One
bottle is enough to treat 1,200 Liters of water, or provide 60 days of treated water to a household. The 177 recipients
of Piyush reported receiving an average of 1.1 bottles per household (range 1-3) (Table 20). As one bottle treats 400
Liters, this is enough to treat 440 Liters, or provide 22 days of treated water for a family using 20 Liters of high quality
water per day. This data is likely an underreport of distribution as respondents may have indicated the amount of

Page 75 of 178
product received only the last time they received the product, not the cumulative product received. However, the
average number of days of treatment reported by the survey population was 36.3, range 0-30 days. This also provides
an indication that NEWAH is meeting their target.
As can be seen, the coverage data in Nepal is complicated by the size of the emergency, the different distribution
strategies of NGOs, and rolling distribution of HWTS options. What can be stated from this coverage data is that
rolling distribution targeting all households in highly affected areas can lead to high coverage with distribution of
HWTS options and presence of HWTS options in the household at the time of the unannounced survey visit.
!"# Correct use
Three products – Aquatabs, Piyush, and WaterGuard – were distributed in Nepal and are discussed in the following
sections.
!"#"$ Aquatabs
UNICEF provided 33 mg Aquatabs, meant for treating 5 Liters of water at a dosage of 4 mg/L. Users were instructed to
add one tablet to 5 Liters and wait 30 minutes before drinking. All 211 respondents who could show us the Aquatabs
they received had the 33 mg tablet (Table 16). A total of 313/400 (78.3%) survey respondents received an average of
24 Aquatabs (range 10-220). Twenty-four tablets is enough to treat 120 Liters of water, which provides six days of
treated water to a household using 20 Liters of high-quality water per day.
The large majority of people received group trainings (94.6%) on how to use the tablets, with a minority (3.9%)
receiving household trainings. Five respondents (1.6%) reported receiving no training. On average, 84.7% of
respondents knew to add the tablet to 5 Liters of water, with ranges of 1-20 Liters reported. Overall, 58.8% of
respondents knew to wait 30 minutes before drinking, with time ranges reported between 1-120 minutes. A large
number of respondents (67, 21.4%) reported a 60 minute wait time before drinking, indicating they may have been
taught that number in the trainings. Fully correct use knowledge (1 tablet, 5 Liters, 30 minutes) was 53.0% of
Aquatabs recipients, although that number increases to 78.6% if incorrect but adequate treatment (such as waiting
longer than 30 minutes and/or treating less volume of water with one Aquatab) is included.
Over 70% of respondents reported ever using Aquatabs, and 54.8% reported they are still currently using the
Aquatabs. Less than half of overall respondents stated they use a 5 Liter container for water treatment with Aquatabs.
Only 9.9% of respondents reported having current household water treated with Aquatabs, indicating that despite
reporting current use, many did not have water available at the household level. This could be because many
households stated they only made treated water for mealtimes, and drank the water only then. Another 16.3% of
Aquatabs respondents reported having current household water treated with either Piyush or WaterGuard. Of the 31
respondents who reported current stored household water treated with Aquatabs, 27 (87.1%) had FCR greater than or
equal to 0.2 mg/L, and 16 (51.6%) had FCR between 0.2-2.0 mg/L.
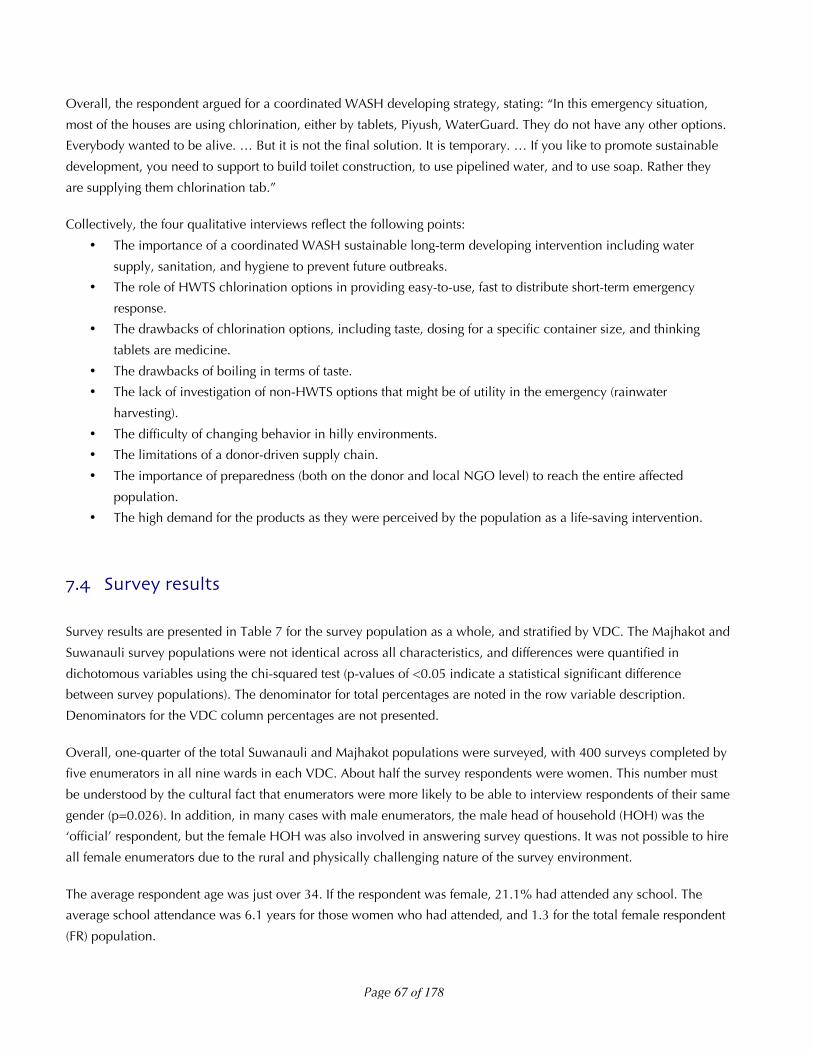
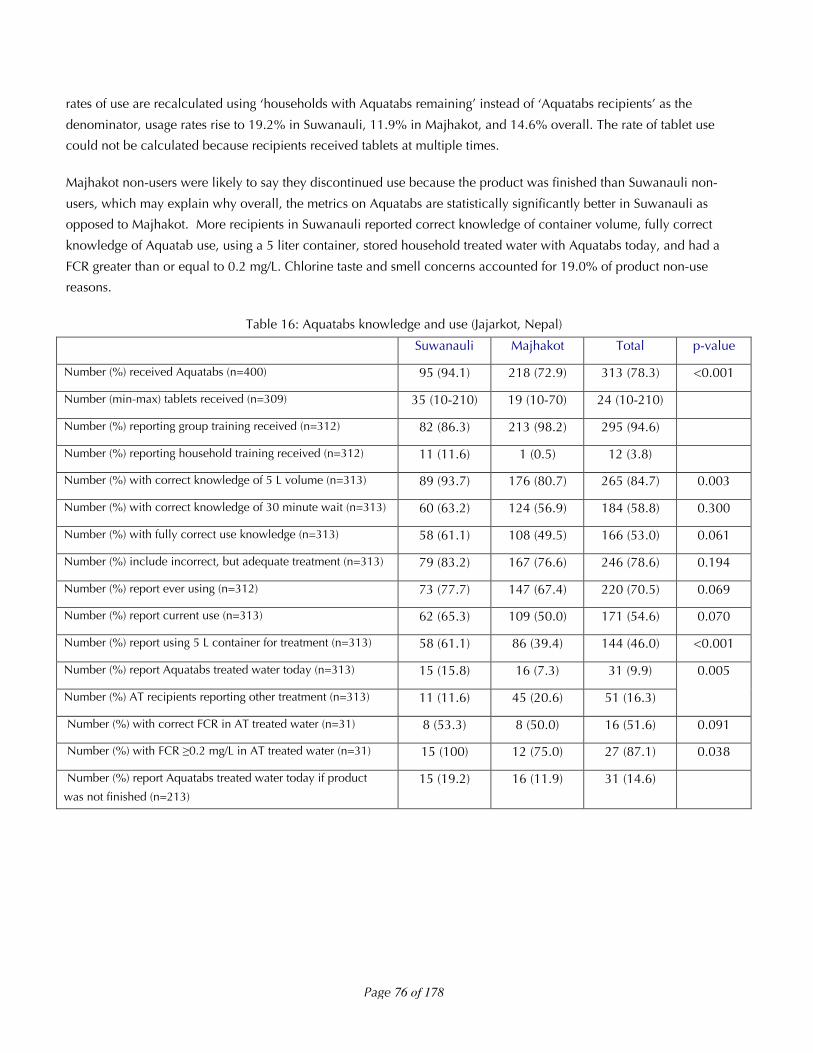
The main reason detailed for Aquatabs use was that it prevents disease, and the main reason for non-use was that the
product was finished (Table 17). Overall, 100 (31.2%) respondents reported they had finished the Aquatabs. If the
Page 76 of 178
rates of use are recalculated using ‘households with Aquatabs remaining’ instead of ‘Aquatabs recipients’ as the
denominator, usage rates rise to 19.2% in Suwanauli, 11.9% in Majhakot, and 14.6% overall. The rate of tablet use
could not be calculated because recipients received tablets at multiple times.
Majhakot non-users were likely to say they discontinued use because the product was finished than Suwanauli non-
users, which may explain why overall, the metrics on Aquatabs are statistically significantly better in Suwanauli as
opposed to Majhakot. More recipients in Suwanauli reported correct knowledge of container volume, fully correct
knowledge of Aquatab use, using a 5 liter container, stored household treated water with Aquatabs today, and had a
FCR greater than or equal to 0.2 mg/L. Chlorine taste and smell concerns accounted for 19.0% of product non-use
reasons.
Table 16: Aquatabs knowledge and use (Jajarkot, Nepal)
Suwanauli Majhakot Total p-value
Number (%) received Aquatabs (n=400) 95 (94.1) 218 (72.9) 313 (78.3) <0.001
Number (min-max) tablets received (n=309) 35 (10-210) 19 (10-70) 24 (10-210)
Number (%) reporting group training received (n=312) 82 (86.3) 213 (98.2) 295 (94.6)
Number (%) reporting household training received (n=312) 11 (11.6) 1 (0.5) 12 (3.8)
Number (%) with correct knowledge of 5 L volume (n=313) 89 (93.7) 176 (80.7) 265 (84.7) 0.003
Number (%) with correct knowledge of 30 minute wait (n=313) 60 (63.2) 124 (56.9) 184 (58.8) 0.300
Number (%) with fully correct use knowledge (n=313) 58 (61.1) 108 (49.5) 166 (53.0) 0.061
Number (%) include incorrect, but adequate treatment (n=313) 79 (83.2) 167 (76.6) 246 (78.6) 0.194
Number (%) report ever using (n=312) 73 (77.7) 147 (67.4) 220 (70.5) 0.069
Number (%) report current use (n=313) 62 (65.3) 109 (50.0) 171 (54.6) 0.070
Number (%) report using 5 L container for treatment (n=313) 58 (61.1) 86 (39.4) 144 (46.0) <0.001
Number (%) report Aquatabs treated water today (n=313) 15 (15.8) 16 (7.3) 31 (9.9)
Number (%) AT recipients reporting other treatment (n=313) 11 (11.6) 45 (20.6) 51 (16.3)
0.005
Number (%) with correct FCR in AT treated water (n=31) 8 (53.3) 8 (50.0) 16 (51.6) 0.091
Number (%) with FCR !0.2 mg/L in AT treated water (n=31) 15 (100) 12 (75.0) 27 (87.1) 0.038
Number (%) report Aquatabs treated water today if product
was not finished (n=213)
15 (19.2) 16 (11.9) 31 (14.6)
Page 77 of 178
Table 17: Reasons for use and non-use of Aquatabs (Jajarkot, Nepal)
Suwanauli Majhakot Total p-value
Use because (n=171)
Cleans water (number (%)) 15 (24.2) 8 (7.3) 23 (13.5)
Prevents disease (number (%)) 47 (75.8) 101 (92.7) 148 (86.5)
0.209
Do not use because (n=137)
Product finished (number (%)) 17 (56.7) 83 (77.6) 100 (73.0)
Do not like taste or smell (number (%)) 9 (30.0) 17 (15.9) 26 (19.0)
0.048
Hard to use (number (%)) 2 (6.7) 0 (0) 2 (1.5)
Using Piyush or WaterGuard (number (%)) 2 (6.7) 7 (6.5) 9 (6.6)
!"#"$ WaterGuard
The correct usage of WaterGuard is to fill the cap to the first line for a small gagri or bucket (5-10 Liters) and to the
second line for a large gagri or bucket (15-20 Liters), add that amount of chlorine to the container, wait 30 minutes,
and drink. This dosage (for a 10 or 20 liter container) is 1.4 mg/L. WaterGuard is labeled in Nepali. It was only
distributed in Majhakot, so data for Suwanauli are not included herein.
Overall, 17.7% of the surveyed population received one bottle of WaterGuard, with one household receiving two
bottles (Table 18). One bottle is enough to treat 1,200 Liters of water, or provide 60 days of treated water to a
household. All recipients received group training, and none received household training. The majority of respondents
(78.8%) knew the correct wait time of 30 minutes before drinking the water, and nine of the 11 (81.8%) that did not
report 30 minutes reported 60 minutes, indicating their might have been an error in the training and that adequate, if
incorrect, water treatment was occurring. Two respondents did not know how long to wait. Fully correct treatment use
could not be calculated as enumerators reported the answers to “how much WaterGuard do you add” differently, with
some reporting lines and some milliliters. The data could not be disaggregated in cleaning. The majority of respondents
indicated they had ever used (96.2%) and were currently using (94.1%) WaterGuard. The average container size used
was reported at 11.1 Liters, with a large range from 2-25 Liters. Almost half of WaterGuard recipients reported current
household stored water treated with WaterGuard, 24% of whom had FCR in the range of 0.2-2.0mg/L and 56% with
FCR above 0.2 mg/L. The main reason for WaterGuard use was that it “prevents disease” (95.8%) and the main reason
for disuse (a small sample of 3 respondents) was taste and smell (Table 19).

Page 78 of 178
Table 18: WaterGuard knowledge and use (Jajarkot, Nepal)
Majhakot
Number (%) received WaterGuard (n=299) 53 (17.7)
Number (%) received 1 bottle (n=53) 52 (98.1)
Number (%) reporting group training received (n=53) 53 (100)
Number (%) reporting household training received (n=53) 0 (0)
Number (%) with correct knowledge of 30 minute wait (n=52) 41 (78.8)
Number (%) with fully correct use knowledge (n=53) ---
Number (%) report ever using (n=52) 50 (96.2)
Number (%) report current use (n=51) 48 (94.1)
Average (min-max) container size (L) used for treatment (n=51) 11.1 (2-25, stdev 6.5)
Number (%) report WG treated water today (n=53) 25 (47.2)
Number (%) WG recipients reporting other treated today (n=53) 1 (1.9)
Number (%) with correct FCR in WG treated water (n=25) 6 (24.0)
Number (%) with FCR !0.2 mg/L in WG treated water (n=25) 14 (56.0)
Number (%) report WG treated water today if product was not finished (n=52) 25 (48.1)
Table 19: Reasons for use and non-use of WaterGuard (Jajarkot, Nepal)
Majhakot
Use because (n=48):
Cleans water (number (%)) 2 (4.2)
Prevents disease (number (%)) 46 (95.8)
Do not use because (n=5):
Product finished (number (%)) 1 (20)
Do not like taste or smell (number (%)) 3 (60)
Hard to use (number (%)) 1 (20)

Page 79 of 178
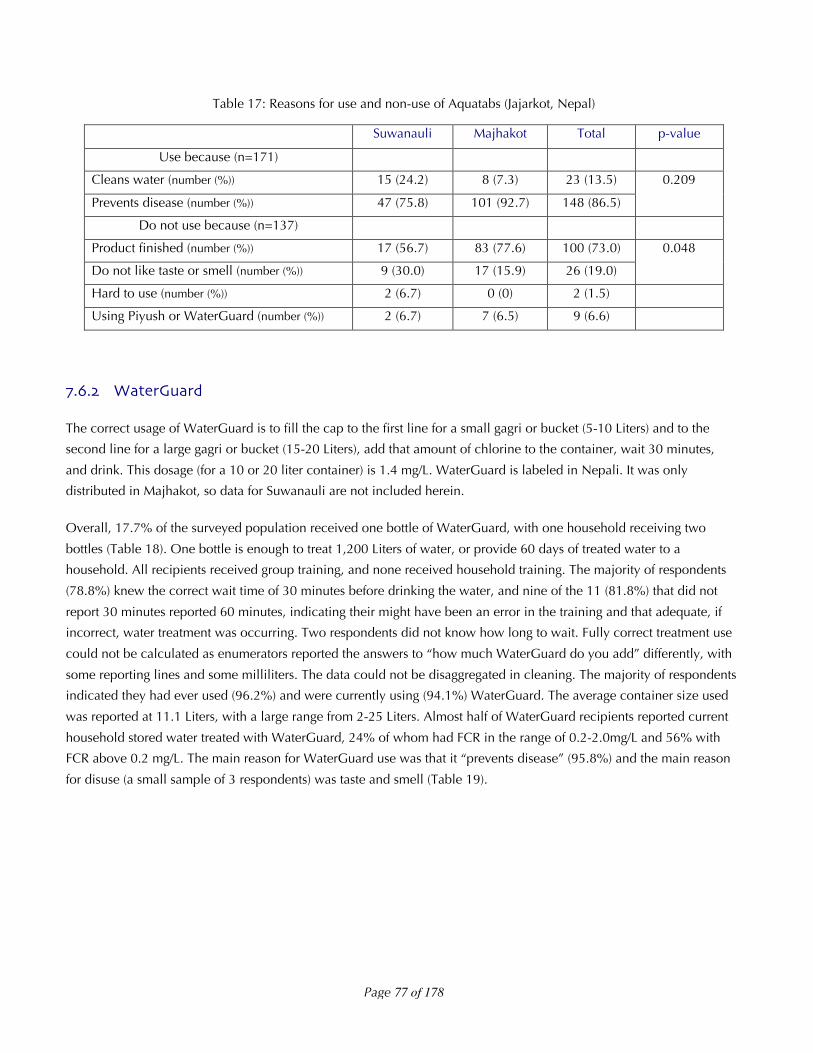
!"#"$ Piyush
The correct usage of Piyush is to open the container, poke a hole in the plastic, and add three drops of Piyush per liter
treated, wait 30 minutes, and drink. The 177 recipients of Piyush reported receiving an average of 1.1 bottles per
household (range 1-3) (Table 20). As one bottle treats 400 Liters, this is enough to treat 440 Liters, or provide 22 days
of treated water for a family using 20 Liters of high quality water per day. A total of 98.9% of respondents reported
receiving group training, 0.5% receiving household training, and 1 household reporting receiving no training. Upon
examination, enumerators felt 90.7% of holes made by respondents in the plastic were adequate to dispense drops.
Over sixty percent of respondents knew the 3 drops/liter dosing, and just under 60% knew to wait 30 minutes before
drinking. Fully correct Piyush use knowledge was 44.9%, although if incorrect but adequate treatment was included,
that percentage increased to 52.8%. Overall, 74.7% of respondents reported ever using the Piyush, and 67.8%
reported still using the product currently.
About one-third (36.2%) of Piyush respondents reported current household stored water treated with Piyush, 41.5%
which had FCR in the range of 0.2-2.0 mg/L and 50.8% with FCR above 0.2 mg/L. The main reason Piyush use was it
prevents disease (85.8%) and the main reason for disuse is that the households were using WaterGuard or Aquatabs
instead (60.7%). If the rates of use are recalculated using ‘households with Piyush remaining’ instead of ‘Piyush
respondents’ as the denominator, usage rates rise to 20.3% in Suwanauli, 47.6% in Majhakot, and 37.3% overall.
Overall, the metrics on Piyush are statistically significantly better in Majhakot as opposed to Suwanauli, as more
respondents in Majhakot reported ever using, current use, and having treated water at the time of the unannounced
visit.
Two people who did not report receiving Piyush reported using it on the day of the unannounced survey visit, and
this explains the discrepancy between the denominators in “respondents of Piyush reporting use today” and “survey
respondents reporting Piyush use” of 63 and 65 households.
Page 80 of 178
Table 20: Piyush knowledge and use (Jajarkot, Nepal)
Suwanauli Majhakot Total p-value
Number (%) received Piyush (n=400) 67 (66.3) 110 (36.8) 177 (44.3) <0.001
Number (min-max) bottles received (n=176) 1.2 (1-3) 1.1 (1-3) 1.1 (1-3)
Number (%) reporting group training received (n=176) 67 (100) 107 (98.2) 174 (98.9)
Number (%) reported household training received (n=176) 0 (0) 1 (0.9) 1 (0.6)
Number (%) with correct knowledge of 3 drops/liter dosing (n=177) 45 (67.2) 61 (55.5) 107 (60.5) 0.081
Number (%) with correct knowledge of 30 minute wait (n=176) 44 (65.7) 60 (55.1) 104 (59.1) 0.164
Number (%) with fully correct use knowledge (n=176) 36 (53.7) 43 (39.4) 79 (44.9) 0.064
Number (%) including incorrect, but adequate treatment (n=176) 40 (59.7) 53 (48.6) 92 (52.8) 0.153
Number (%) recipients reporting ever using (n=174) 44 (65.7) 86 (80.4) 130 (74.7) 0.030
Number (%) recipients reporting current use (n=174) 40 (59.7) 80 (72.7) 120 (67.8)
Number (%) reporting Piyush treated water today (n=177) 13 (19.4) 50 (45.5) 63 (35.6)
Number (%) Piyush respondents reporting other treatment (n=177) 9 (13.4) 5 (4.5) 14 (7.9)
0.001
Number (%) with correct FCR in Piyush treated water (n=65) 6 (46.2) 21 (40.4) 27 (41.5) 0.101
Number (%) FCR !0.2 mg/L in Piyush treated water (n=65) 9 (69.2) 24 (46.2) 33 (50.1) 0.137
Number (%) reporting Piyush treated water today if Piyush had
not finished (n=169)
13 (20.3) 50 (47.6) 63 (37.3)
Table 21: Reasons for use and non-use of Piyush (Jajarkot, Nepal)
Suwanauli Majhakot Total
Use because (n=120)
Cleans water (number (%)) 8 (20.0) 9 (11.3) 17 (14.2)
Prevents disease (number (%)) 32 (80.0) 71 (88.8) 103 (85.8)
Do not use because (n=56)
Product finished (number (%)) 3 (11.1) 5 (17.2) 8 (14.3)
Do not like taste or smell (number (%)) 3 (11.1) 6 (20.7) 9 (16.1)
Hard to use (number (%)) 1 (3.7) 4 (13.8) 5 (8.9)
Using Aquatabs or WaterGuard (number (%)) 20 (74.1) 14 (48.3) 34 (60.7)

Page 81 of 178
!"#"$ Comparative analysis
Summary statistics from the previous analysis are documented in Table 22 for comparison. As can be seen, people
reported fully correct and incorrect but adequate treatment knowledge at a higher rate for Aquatabs than Piyush.
Respondents were more likely to report use of WaterGuard or Piyush today compared to Aquatabs, however, this
number must be understand in light of the 100 respondents who reported running out of Aquatabs, also can be seen
in the percent of respondents who reported other treated water if they received Aquatabs. A correct FCR of between
0.2-2.0 mg/L was reported most often in Aquatabs, followed by Piyush and WaterGuard. Any FCR was reported more
often in households reporting Aquatabs use as well.
The main reason for use of HWTS options was because it “prevents disease.” The main reasons for disuse were that
the product was finished in the case of Aquatabs and that the households were using another product in the case of
Piyush. Taste and smell concerns accounted for 38/190 reasons for disuse (20%), and were more often noted for
Aquatabs, which dosed the highest (5 mg/L as opposed to 1.4 mg/L for WaterGuard and 0.75 mg/L for Piyush).
Table 22: Summary analysis of knowledge and use of HWTS options (Jajarkot, Nepal)
Aquatabs WaterGuard Piyush p-value
Number (%) received product (n= survey population) 313 (78.3) 53 (17.7) 177 (44.3)
Number (%) received group training (n=received) 295 (94.6) 53 (100) 174 (98.9)
Number (%) received household training (n=received) 12 (3.8) 0 (0) 1 (0.6)
Number (%) report knowing fully correct treatment (n=received) 166 (53.0) -- 79 (44.9) 0.032
Number (%) report incorrect, but adequate treatment
(n=received)
246 (78.6) -- 92 (52.8) <0.001
Number (%) report treated water in household today
(n=received)
31 (9.9) 25 (47.2) 63 (35.6) <0.0011
Number (%) report treated water with other HWTS (n=received) 51 (16.3) 1 (1.9) 14 (7.9)
Number (%) with correct FCR (n=report treatment with option) 16 (51.6) 6 (24.0) 27 (41.5) 0.1701
Number (%) with FCR!0.2 mg/L (n=report treatment with option) 27 (87.1) 14 (56.0) 33 (50.8) 0.0021
Number (%) reason use is cleans water (n=# reporting using) 23 (13.5) 2 (4.1) 17 (14.2)
Number (%) reason use is prevents disease (n=# reporting using) 148 (86.5) 46 (95.8) 103 (85.8)
Number (%) reason disuse is finished (n=# reporting nonuse) 100 (73.0) 1 (20) 8 (14.3)
Number (%) reason disuse is taste/smell (n=# reporting nonuse) 26 (19.0) 3 (60.0) 9 (16.1)
Number (%) reason disuse is using other (n=# reporting nonuse) 9 (6.6) 34 (60.7)
1 p-value calculated by summing the WaterGuard/Piyush results and comparing to Aquatabs

Page 82 of 178
If respondents received more than one HWTS option, we asked which they preferred. The only option pair with
sample size sufficient for analysis on this question was Aquatabs and Piyush (received by 144 respondents) (see Table
15). Of the 143 respondents who received Aquatabs and Piyush and responded to this question, 95 (66.4%) preferred
Piyush, 45 (31.5%) preferred Aquatabs, and 3 (2.1%) had no preference. The reason for the preference was that
Piyush tasted better (which is consistent with the lower Piyush chlorine dose of 0.75 mg/L compared to Aquatabs at
5.0 mg/L), although respondents found the Aquatabs easier to use.
Table 23: Reasons for Aquatabs or Piyush preference (Jajarkot, Nepal)
Aquatabs
(n=49)
Piyush
(n=97)
p-value
Tastes better 16 (32.7) 66 (68.0)
Easier to use 27 (55.1) 31 (32.0)
<0.001
Have used before 6 (12.2)
These results show that there is not one clear answer as to which is the most appropriate chlorine option in this
emergency – Aquatabs was easier to know how to use correctly and maintained a better FCR, but people objected to
the taste more and the cost of providing Aquatabs was higher and so less were provided and people ran out.
Respondents reported actually using WaterGuard and then Piyush at the highest rates, but this is confounded by the
100 households who ran out of Aquatabs. If all 100 households who reported running out of Aquatabs are added into
the “use Aquatabs today” number (raising that value to 131 of the 313 respondents) the rate of use of Aquatabs rises
to 41.9%, equivalent to the rate of use of WaterGuard and Piyush.
Overall, however, it is quite clear that in a survey population that had very low knowledge of chlorine based options
before the emergency (2% reported knowing any chlorine option), a high rate of distribution (97% for at least one
product), adequate knowledge (52.8-78.6%), and reported use (9.9-47.2) confirmed by adequate FCR (50.8-87.1 of
reported users) is possible in a matter of one month. Overall 121/400 (30.3%) of targeted households reported
household water treatment (including 31 Aquatabs, 25 WaterGuard, and 63 Piyush receivers and the two households
reporting Piyush use who did not report receiving Piyush). Of the 121 who reported treated water, 74 (27 Aquatabs
users, 14 WaterGuard users, and 33 Piyush users) had FCR above 0.2 mg/L. Thus, 61.2% (74/121) of those reporting
treatment had adequate FCR, and 18.5% (74/400) of the surveyed population had adequate FCR in their drinking
water due to the HWTS distribution at the time of the unannounced survey visit. Given the demand from the survey
population for a product to reduce the cholera disease risk in this environment, it appears the population will use
whichever product is provided, regardless of taste concerns or dosage.
Page 83 of 178
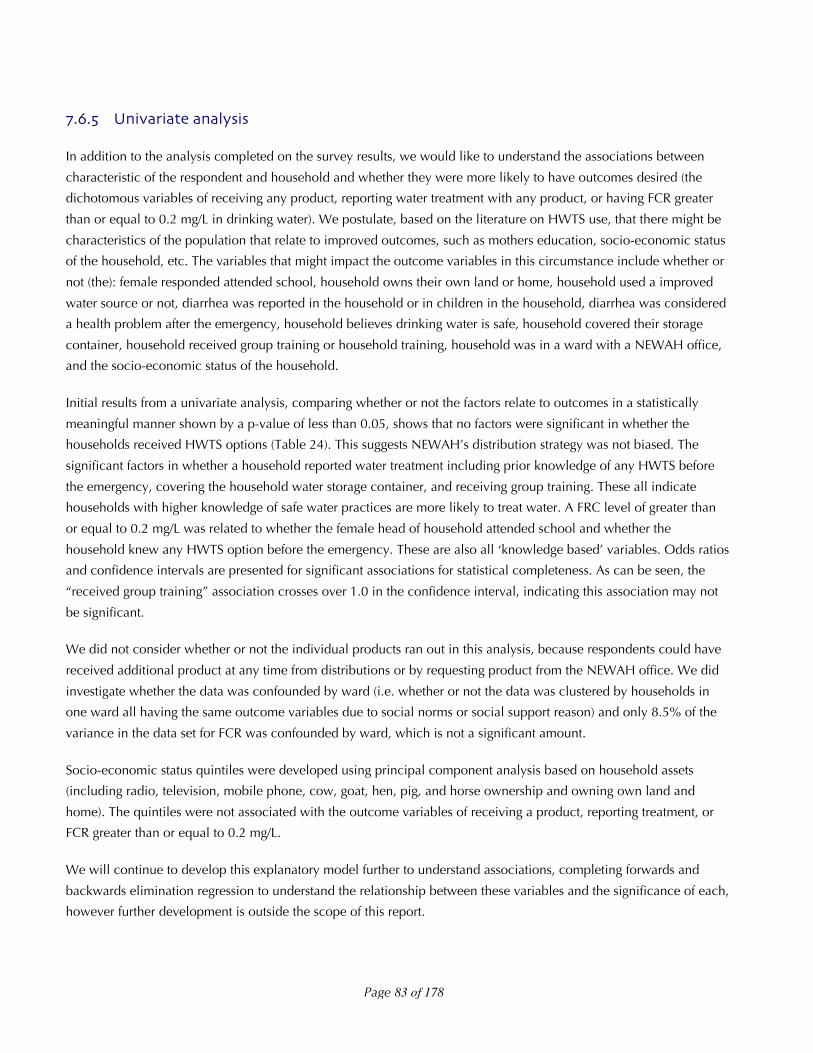
!"#"$ Univariate analysis
In addition to the analysis completed on the survey results, we would like to understand the associations between
characteristic of the respondent and household and whether they were more likely to have outcomes desired (the
dichotomous variables of receiving any product, reporting water treatment with any product, or having FCR greater
than or equal to 0.2 mg/L in drinking water). We postulate, based on the literature on HWTS use, that there might be
characteristics of the population that relate to improved outcomes, such as mothers education, socio-economic status
of the household, etc. The variables that might impact the outcome variables in this circumstance include whether or
not (the): female responded attended school, household owns their own land or home, household used a improved
water source or not, diarrhea was reported in the household or in children in the household, diarrhea was considered
a health problem after the emergency, household believes drinking water is safe, household covered their storage
container, household received group training or household training, household was in a ward with a NEWAH office,
and the socio-economic status of the household.
Initial results from a univariate analysis, comparing whether or not the factors relate to outcomes in a statistically
meaningful manner shown by a p-value of less than 0.05, shows that no factors were significant in whether the
households received HWTS options (Table 24). This suggests NEWAH’s distribution strategy was not biased. The
significant factors in whether a household reported water treatment including prior knowledge of any HWTS before
the emergency, covering the household water storage container, and receiving group training. These all indicate
households with higher knowledge of safe water practices are more likely to treat water. A FRC level of greater than
or equal to 0.2 mg/L was related to whether the female head of household attended school and whether the
household knew any HWTS option before the emergency. These are also all ‘knowledge based’ variables. Odds ratios
and confidence intervals are presented for significant associations for statistical completeness. As can be seen, the
“received group training” association crosses over 1.0 in the confidence interval, indicating this association may not
be significant.
We did not consider whether or not the individual products ran out in this analysis, because respondents could have
received additional product at any time from distributions or by requesting product from the NEWAH office. We did
investigate whether the data was confounded by ward (i.e. whether or not the data was clustered by households in
one ward all having the same outcome variables due to social norms or social support reason) and only 8.5% of the
variance in the data set for FCR was confounded by ward, which is not a significant amount.
Socio-economic status quintiles were developed using principal component analysis based on household assets
(including radio, television, mobile phone, cow, goat, hen, pig, and horse ownership and owning own land and
home). The quintiles were not associated with the outcome variables of receiving a product, reporting treatment, or
FCR greater than or equal to 0.2 mg/L.
We will continue to develop this explanatory model further to understand associations, completing forwards and
backwards elimination regression to understand the relationship between these variables and the significance of each,
however further development is outside the scope of this report.

Page 84 of 178
Table 24: Univariate analysis results (Jajarkot, Nepal)
Postulated potential factors related to outcomes
Received
product
Reported treated FCR !0.2 mg/L
Female respondent attended school 0.545 0.059 0.041OR: 2.41 95% CI: 1.0-5.8
Family owns land 0.119 0.509 0.892
Own home 0.860 0.510 0.634
Use improved source 0.208 0.139 0.539
Knew any option before emergency 0.628 0.001OR: 4.08 95% CI: 1.6-10.3
<0.001OR: 4.47 95% CI: 1.8-11.1
Diarrhea reported in household 0.993 0.426 0.580
Diarrhea reported in children in household 0.060 0.980 0.860
Cholera reported in household 0.269 0.140 0.232
Diarrhea health problem after emergency 0.438 0.426 0.370
Believe drinking water is safe 0.377 0.825 0.574
Covered household drinking water 0.831 <0.001OR: 7.46 95% CI: 3.8-14.5
0.545
Received household training -- 0.060 0.247
Received group training -- 0.043OR: 4.10 95% CI: 0.9-18.1
0.111
Lived in ward with NEWAH office 0.061 0.999 0.787
Socio-economic status quintiles (5x2) 0.642 0.705 0.816
Page 85 of 178
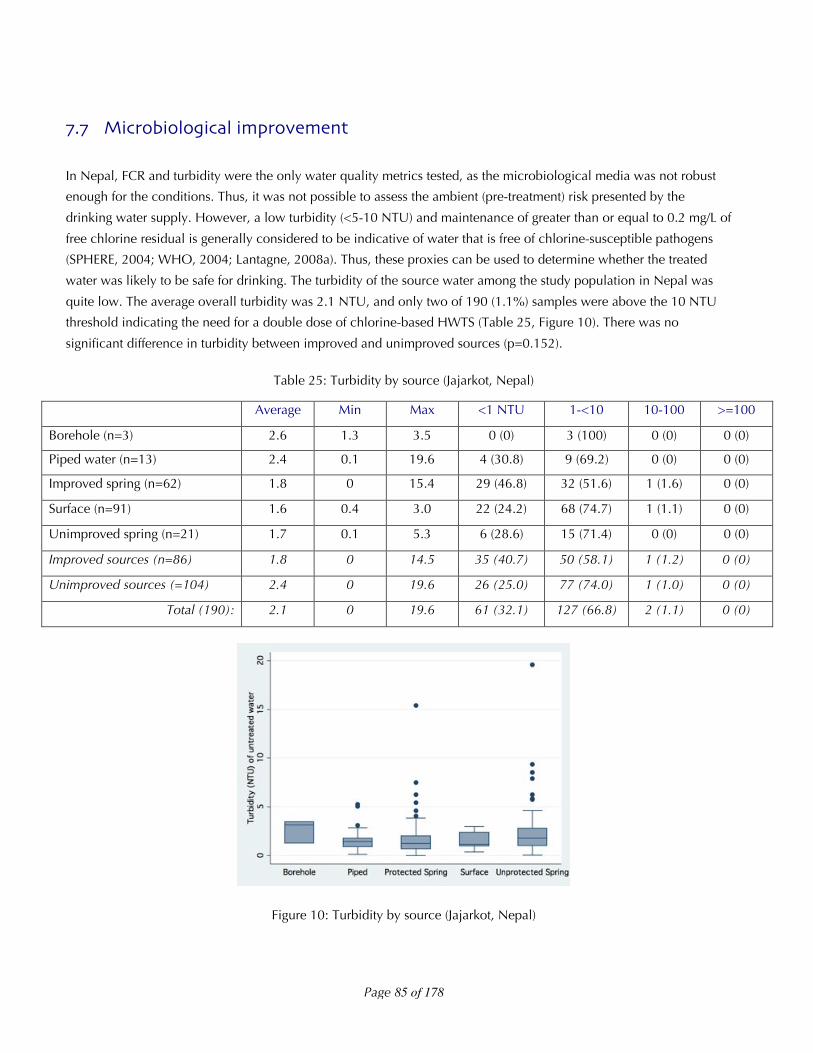
!"! Microbiological improvement
In Nepal, FCR and turbidity were the only water quality metrics tested, as the microbiological media was not robust
enough for the conditions. Thus, it was not possible to assess the ambient (pre-treatment) risk presented by the
drinking water supply. However, a low turbidity (<5-10 NTU) and maintenance of greater than or equal to 0.2 mg/L of
free chlorine residual is generally considered to be indicative of water that is free of chlorine-susceptible pathogens
(SPHERE, 2004; WHO, 2004; Lantagne, 2008a). Thus, these proxies can be used to determine whether the treated
water was likely to be safe for drinking. The turbidity of the source water among the study population in Nepal was
quite low. The average overall turbidity was 2.1 NTU, and only two of 190 (1.1%) samples were above the 10 NTU
threshold indicating the need for a double dose of chlorine-based HWTS (Table 25, Figure 10). There was no
significant difference in turbidity between improved and unimproved sources (p=0.152).
Table 25: Turbidity by source (Jajarkot, Nepal)
Average Min Max <1 NTU 1-<10 10-100 >=100
Borehole (n=3) 2.6 1.3 3.5 0 (0) 3 (100) 0 (0) 0 (0)
Piped water (n=13) 2.4 0.1 19.6 4 (30.8) 9 (69.2) 0 (0) 0 (0)
Improved spring (n=62) 1.8 0 15.4 29 (46.8) 32 (51.6) 1 (1.6) 0 (0)
Surface (n=91) 1.6 0.4 3.0 22 (24.2) 68 (74.7) 1 (1.1) 0 (0)
Unimproved spring (n=21) 1.7 0.1 5.3 6 (28.6) 15 (71.4) 0 (0) 0 (0)
Improved sources (n=86) 1.8 0 14.5 35 (40.7) 50 (58.1) 1 (1.2) 0 (0)
Unimproved sources (=104) 2.4 0 19.6 26 (25.0) 77 (74.0) 1 (1.0) 0 (0)
Total (190): 2.1 0 19.6 61 (32.1) 127 (66.8) 2 (1.1) 0 (0)
Figure 10: Turbidity by source (Jajarkot, Nepal)

Page 86 of 178
FCR was maintained at a higher rate by users of Aquatabs and WaterGuard compared to Piyush. This can be
expected, as the dosage of Aquatabs in this context was 5 mg/L, the dosage of Piyush was 0.75 mg/L, and the dosage
of WaterGuard was 1.4 mg/L. The FCR results should be understood in light of the following realities: 1) some families
that reported treated water could have been misleading, and not actually have treated their water; and, 2) many
families used a variety of storage containers for their water treatment (as detailed in the next section on sub-optimal
use) and dosage could have been incorrect (Figure 11, Table 26). Overall, 40.1% of treated waters were with the
acceptable range for HWTS, 20.7% were high, but adequate, and 38.8% were below 0.2 mg/L, indicating that the
water is no longer safe from recontamination.
In summary, only 1.1% of water sources were inappropriate for a single-dose of chlorine-based water treatment, and
no water sources were inappropriate for a double-dose or higher of chlorine-based water treatment. However, 38.8%
of reportedly treated household samples did not have enough FCR to protect against recontamination.
Table 26: FCR by HWTS option (Jajarkot, Nepal)
Average Min Max <0.2 mg/L 0.2-2.0 mg/L >2.0 mg/L
Aquatabs (n=31) 1.8 0 5 4 (12.9) 16 (51.6) 11 (35.5)
Piyush (n=65) 0.5 0 3.5 32 (49.2) 27 (41.5) 6 (9.2)
WaterGuard (n=25) 1.4 0 5 11 (44.0) 6 (24.0) 8 (32.1)
Total (101): 1.0 0 5 47 (38.8) 49 (40.1) 25 (20.7)
Figure 11: FCR by HWTS option (Jajarkot, Nepal)

Page 87 of 178
!"# Resistance to sub$optimal use
One theme worth noting in the Nepal data about sub-optimal use was the necessity of having a storage container
appropriate for the dosing of the chlorine option, including 5-10 or 15-20 Liters for WaterGuard and 5 Liters for
Aquatabs. We asked respondents that reported they had ever used the HWTS option what container they used the
option with, and as can be seen a large range of container sizes was reported (Figure 12).
Figure 12: Storage containers reported ever used with HWTS options (Jajarkot, Nepal)
We also asked respondents who reported current water treatment today the container size they used with the option
they treated the water with today. As can be seen there is less of a range, with WaterGuard use almost exclusively at
higher volume containers (12 Liters and above), Aquatab use predominantly in containers that were multiples of five
Liters (5, 10, 15, and 20), and Piyush use (3 drops/Liter) throughout all container sizes (Figure 13).
Figure 13: Storage containers used in families reporting treatment today (Jajarkot, Nepal)
Page 88 of 178
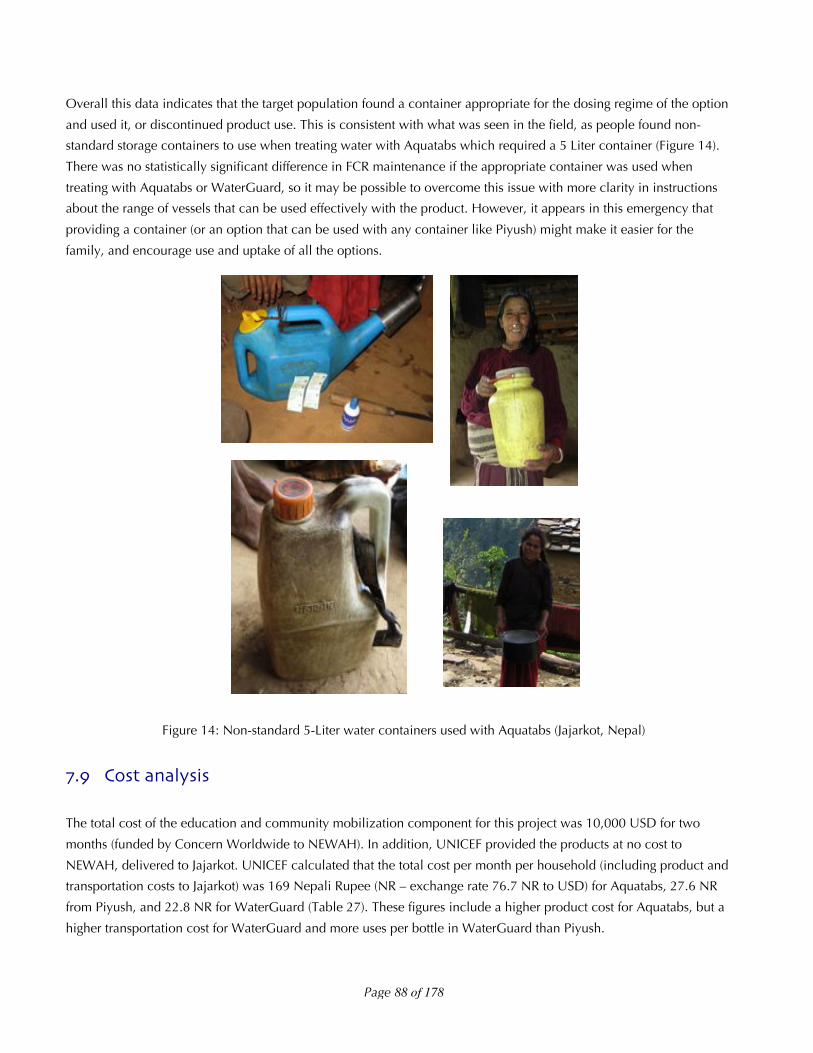
Overall this data indicates that the target population found a container appropriate for the dosing regime of the option
and used it, or discontinued product use. This is consistent with what was seen in the field, as people found non-
standard storage containers to use when treating water with Aquatabs which required a 5 Liter container (Figure 14).
There was no statistically significant difference in FCR maintenance if the appropriate container was used when
treating with Aquatabs or WaterGuard, so it may be possible to overcome this issue with more clarity in instructions
about the range of vessels that can be used effectively with the product. However, it appears in this emergency that
providing a container (or an option that can be used with any container like Piyush) might make it easier for the
family, and encourage use and uptake of all the options.
Figure 14: Non-standard 5-Liter water containers used with Aquatabs (Jajarkot, Nepal)
!"# Cost analysis
The total cost of the education and community mobilization component for this project was 10,000 USD for two
months (funded by Concern Worldwide to NEWAH). In addition, UNICEF provided the products at no cost to
NEWAH, delivered to Jajarkot. UNICEF calculated that the total cost per month per household (including product and
transportation costs to Jajarkot) was 169 Nepali Rupee (NR – exchange rate 76.7 NR to USD) for Aquatabs, 27.6 NR
from Piyush, and 22.8 NR for WaterGuard (Table 27). These figures include a higher product cost for Aquatabs, but a
higher transportation cost for WaterGuard and more uses per bottle in WaterGuard than Piyush.

Page 89 of 178
Table 27: Costs of HWTS options delivered (adapted from UNICEF/Nepal) (Jajarkot, Nepal)
Aquatabs Piyush WaterGuard
Cost (NR) 1.4 NR 12 NR 17 NR
Liters treated (NR) 5 400 1200
Cost/Liter treated (NR) 0.28 NR 0.03 NR 0.014 NR
Product needed month/HH (20 Liters/day) 120 1.5 0.5
Cost/HH for 1 month 168 NR 18 NR 8.5 NR
Weight of product (grams) 5 g/50 tabs 65 g/bottle 7.3 kg/25b
Weight 1 month/HH product (grams) 12 g 97.5 g 146 g
Transport (Kathmandu-Nepalganj) (10/kg) 0.12 NR 0.98 NR 1.46 NR
Transport (Nepalganj-VDC) (76/kg) 0.91 NR 7.4 NR 11.1 NR
Transport (VDC-Ward) (12/kg) 0.14 NR 1.2 NR 1.8 NR
Transport Cost per month 1.2 NR 9.6 NR 144 NR
Total Cost 169 NR 27.6 NR 22.9 NR
While the product cost numbers appear small, to scale this project up to the entire affected area of 151 VDCs, instead
of 2, becomes potentially cost-prohibitive. Assuming 10,000 USD for two VDCs for two months (2,500
USD/VDC/month) for education, and 140,000 affected households using WaterGuard (the cheapest option) at 22.8
NR/month, the cost of a full project to provide two months of HWTS and education to the entire affected population
would be: 755,000 USD for education (151 VDCs * 2,500 USD/VDC/months * 2 months) plus 83,598 USD (22.9
NR/month *140,000 affected households * 2 months = 6.384 million Nepali Rupees at 76.7 exchange rate). That total
nearly 1 million US dollars (838,598 USD) for a short-term 2 month intervention project.
To compare these numbers to development projects completed by NEWAH in the same region, from 2007-2009
NEWAH received 370,000 USD to complete 12 projects to supply safe drinking water supplies and sanitation to areas
in Majhakot (personal communication from NEWAH). As was seen in this data set, there were more improved water
supplies in Majhakot than in Suwanauli, so this project has been of success. One water system for 60 households
generally costs 33,000 USD. Thus, the cost of this HWTS treatment project cost NEWAH about 1/3rd of a water system
– or the equivalent of providing an improved water sources to 20 families.